
1 R:11 G:35 B:65 R:1 G:52 B:75 R:0 G:87 B:122 R:0 G:126 B:92 R:0 G:152 B:99 R:34 G:208 B:129 R:167 G:169 B:180 R:208 G:209 B:219 R:73 G:82 B:82 R:91 G:103 B:113 EARNINGS PRESENTATION 3Q 2025 October 30, 2025
2 R:11 G:35 B:65 R:1 G:52 B:75 R:0 G:87 B:122 R:0 G:126 B:92 R:0 G:152 B:99 R:34 G:208 B:129 R:167 G:169 B:180 R:208 G:209 B:219 R:73 G:82 B:82 R:91 G:103 B:113 This presentation may contain forward-looking statements within the meaning of the federal securities laws, including statements relating to (i) our strategy, outlook and growth prospects, (ii) our operational and financial targets and (iii) general economic trends and trends in our industry and markets. Forward-looking statements relate to expectations, beliefs, projections, future plans and strategies, anticipated events or trends and similar expressions concerning matters that are not historical facts. In some cases, you can identify forward-looking statements by the use of forward-looking terminology such as “may,” “will,” “should,” “expects,” “intends,” “plans,” “anticipates,” “believes,” “estimates,” “predicts,” or “potential” or the negative of these words and phrases or similar words or phrases which are predictions of or indicate future events or trends and which do not relate solely to historical matters. You can also identify forward-looking statements by discussions of strategy, plans or intentions. Forward-looking statements involve known and unknown risks, uncertainties, assumptions and contingencies, many of which are beyond the Company’s control, and may cause the Company’s actual results to differ significantly from those expressed in any forward-looking statement. Factors that might cause such a difference include, without limitation, difficult market and political conditions, including those resulting from inflation, high interest rates, a general economic slowdown or a recession; our ability to raise capital from investors for our Company, our funds and the companies that we manage; the performance of our funds and investments relative to our expectations and the highly variable nature of our revenues, earnings and cash flow; our exposure to risks inherent in the ownership and operation of infrastructure and digital infrastructure assets, including our reliance on third-party suppliers to provide power, network connectivity and certain other services to our managed companies; our exposure to business risks in Europe, Asia, Latin America and other foreign markets; our ability to increase assets under management and expand our existing and new investment strategies while maintaining consistent standards and controls; our ability to appropriately manage conflicts of interest; our ability to expand into new investment strategies, geographic markets and businesses, including through acquisitions in the infrastructure and investment management industries; the impact of climate change and regulatory or societal efforts associated with environmental, social and governance matters; our ability to maintain effective information and cybersecurity policies, procedures and capabilities and the impact of any cybersecurity incident affecting our systems or network or the system and network of any of our managed companies or service providers; the ability of our portfolio companies to attract and retain key customers and to provide reliable services without disruption; any litigation and contractual claims against us and our affiliates, including potential settlement and litigation of such claims; our ability to obtain and maintain financing arrangements, including securitizations, on favorable or comparable terms or at all; the general volatility of the securities markets in which we participate; the market value of our assets and effects of hedging instruments on our assets; the impact of legislative, regulatory and competitive changes, including those related to privacy and data protection and new Securities and Exchange Commission (“SEC”) rules governing investment advisers; whether we will be able to utilize existing tax attributes to offset taxable income to the extent contemplated; our ability to maintain our exemption from registration as an investment company under the Investment Company Act of 1940, as amended; changes in our board of directors or management team, and availability of qualified personnel; our ability to make or maintain distributions to our stockholders; our understanding of and ability to successfully navigate the competitive landscape in which we and our managed companies operate; and other risks and uncertainties, including those detailed in the Company’s Annual Report on Form 10-K for the fiscal year ended December 31, 2024 under the heading “Risk Factors,” as such factors may be updated from time to time in the Company’s subsequent periodic filings with the SEC. All forward-looking statements reflect the Company’s good faith beliefs, assumptions and expectations, but they are not guarantees of future performance. Additional information about these and other factors can be found in the Company’s reports filed from time to time with the SEC. While the Company believes that the portfolio companies of its funds or investment vehicles will offer services to support companies engaged in artificial intelligence development and related products ("AI Technologies"), AI Technologies and their current and potential future applications, as well as the legal and regulatory frameworks within which they operate, continue to rapidly evolve, and it is impossible to predict the full extent of current or future technology needs and the risks related thereto. The risk exists that portfolio companies' current technology infrastructure, systems, or products may become obsolete or less competitive due to the emergence of new technologies, innovations, or industry standards. The Company cautions investors not to unduly rely on any forward-looking statements. The forward-looking statements speak only as of the date of this presentation. The Company is under no duty to update any of these forward-looking statements after the date of this presentation, nor to conform prior statements to actual results or revised expectations, and the Company does not intend to do so. This presentation is for informational purposes only and does not constitute an offer to sell or a solicitation of an offer to buy any securities of the Company or any investment vehicle managed or advised thereby. This information is not intended to be indicative of future results. Actual performance of the Company may vary materially. The appendices herein contain important information that is material to an understanding of this presentation, including information regarding certain non-GAAP financial measures, and you should read this presentation only with and in context of the appendices. CAUTIONARY STATEMENT REGARDING FORWARD-LOOKING STATEMENTS
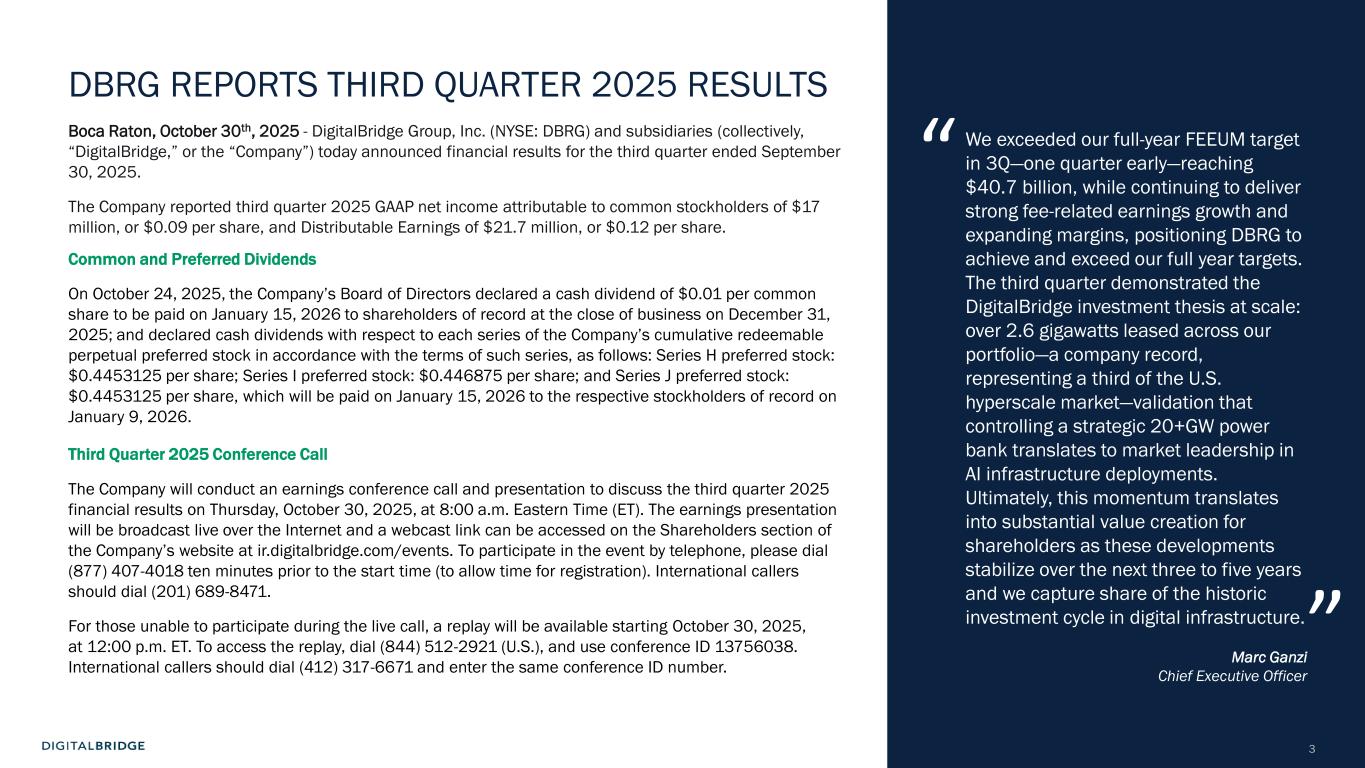
3 R:11 G:35 B:65 R:1 G:52 B:75 R:0 G:87 B:122 R:0 G:126 B:92 R:0 G:152 B:99 R:34 G:208 B:129 R:167 G:169 B:180 R:208 G:209 B:219 R:73 G:82 B:82 R:91 G:103 B:113 DBRG REPORTS THIRD QUARTER 2025 RESULTS Boca Raton, October 30th, 2025 - DigitalBridge Group, Inc. (NYSE: DBRG) and subsidiaries (collectively, “DigitalBridge,” or the “Company”) today announced financial results for the third quarter ended September 30, 2025. The Company reported third quarter 2025 GAAP net income attributable to common stockholders of $17 million, or $0.09 per share, and Distributable Earnings of $21.7 million, or $0.12 per share. Common and Preferred Dividends On October 24, 2025, the Company’s Board of Directors declared a cash dividend of $0.01 per common share to be paid on January 15, 2026 to shareholders of record at the close of business on December 31, 2025; and declared cash dividends with respect to each series of the Company’s cumulative redeemable perpetual preferred stock in accordance with the terms of such series, as follows: Series H preferred stock: $0.4453125 per share; Series I preferred stock: $0.446875 per share; and Series J preferred stock: $0.4453125 per share, which will be paid on January 15, 2026 to the respective stockholders of record on January 9, 2026. Third Quarter 2025 Conference Call The Company will conduct an earnings conference call and presentation to discuss the third quarter 2025 financial results on Thursday, October 30, 2025, at 8:00 a.m. Eastern Time (ET). The earnings presentation will be broadcast live over the Internet and a webcast link can be accessed on the Shareholders section of the Company’s website at ir.digitalbridge.com/events. To participate in the event by telephone, please dial (877) 407-4018 ten minutes prior to the start time (to allow time for registration). International callers should dial (201) 689-8471. For those unable to participate during the live call, a replay will be available starting October 30, 2025, at 12:00 p.m. ET. To access the replay, dial (844) 512-2921 (U.S.), and use conference ID 13756038. International callers should dial (412) 317-6671 and enter the same conference ID number. We exceeded our full-year FEEUM target in 3Q—one quarter early—reaching $40.7 billion, while continuing to deliver strong fee-related earnings growth and expanding margins, positioning DBRG to achieve and exceed our full year targets. The third quarter demonstrated the DigitalBridge investment thesis at scale: over 2.6 gigawatts leased across our portfolio—a company record, representing a third of the U.S. hyperscale market—validation that controlling a strategic 20+GW power bank translates to market leadership in AI infrastructure deployments. Ultimately, this momentum translates into substantial value creation for shareholders as these developments stabilize over the next three to five years and we capture share of the historic investment cycle in digital infrastructure. Marc Ganzi Chief Executive Officer “ ”
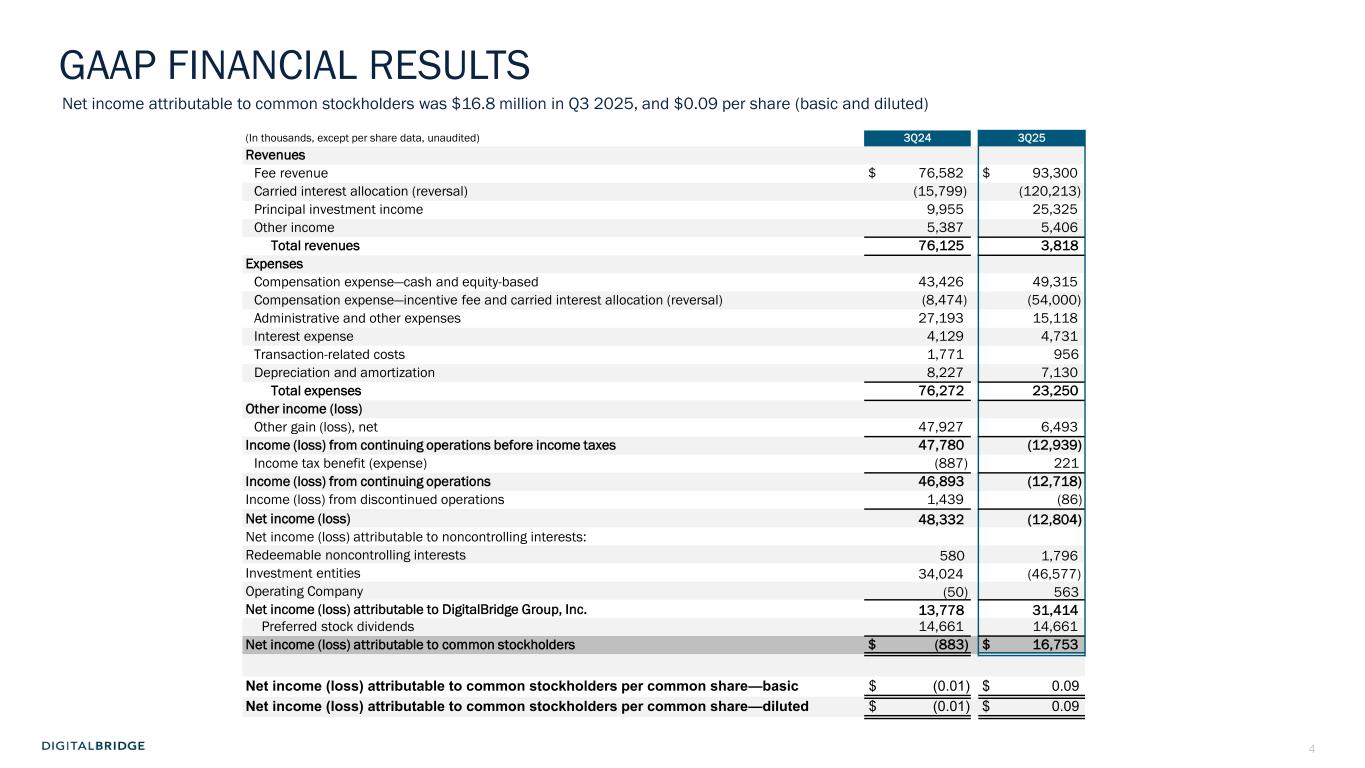
4 R:11 G:35 B:65 R:1 G:52 B:75 R:0 G:87 B:122 R:0 G:126 B:92 R:0 G:152 B:99 R:34 G:208 B:129 R:167 G:169 B:180 R:208 G:209 B:219 R:73 G:82 B:82 R:91 G:103 B:113 (In thousands, except per share data, unaudited) 3Q24 3Q25 Revenues Fee revenue $ 76,582 $ 93,300 Carried interest allocation (reversal) (15,799) (120,213) Principal investment income 9,955 25,325 Other income 5,387 5,406 Total revenues 76,125 3,818 Expenses Compensation expense—cash and equity-based 43,426 49,315 Compensation expense—incentive fee and carried interest allocation (reversal) (8,474) (54,000) Administrative and other expenses 27,193 15,118 Interest expense 4,129 4,731 Transaction-related costs 1,771 956 Depreciation and amortization 8,227 7,130 Total expenses 76,272 23,250 Other income (loss) Other gain (loss), net 47,927 6,493 Income (loss) from continuing operations before income taxes 47,780 (12,939) Income tax benefit (expense) (887) 221 Income (loss) from continuing operations 46,893 (12,718) Income (loss) from discontinued operations 1,439 (86) Net income (loss) 48,332 (12,804) Net income (loss) attributable to noncontrolling interests: Redeemable noncontrolling interests 580 1,796 Investment entities 34,024 (46,577) Operating Company (50) 563 Net income (loss) attributable to DigitalBridge Group, Inc. 13,778 31,414 Preferred stock dividends 14,661 14,661 Net income (loss) attributable to common stockholders $ (883) $ 16,753 Net income (loss) attributable to common stockholders per common share—basic $ (0.01) $ 0.09 Net income (loss) attributable to common stockholders per common share—diluted $ (0.01) $ 0.09 GAAP FINANCIAL RESULTS Net income attributable to common stockholders was $16.8 million in Q3 2025, and $0.09 per share (basic and diluted)

5 R:11 G:35 B:65 R:1 G:52 B:75 R:0 G:87 B:122 R:0 G:126 B:92 R:0 G:152 B:99 R:34 G:208 B:129 R:167 G:169 B:180 R:208 G:209 B:219 R:73 G:82 B:82 R:91 G:103 B:113 AGENDA BUSINESS UPDATES E C T IO N 1 FINANCIAL RESULTSS E C T IO N 2 3 EXECUTING THE DIGITAL PLAYBOOKS E C T IO N

6 R:11 G:35 B:65 R:1 G:52 B:75 R:0 G:87 B:122 R:0 G:126 B:92 R:0 G:152 B:99 R:34 G:208 B:129 R:167 G:169 B:180 R:208 G:209 B:219 R:73 G:82 B:82 R:91 G:103 B:113 1 BUSINESS UPDATE
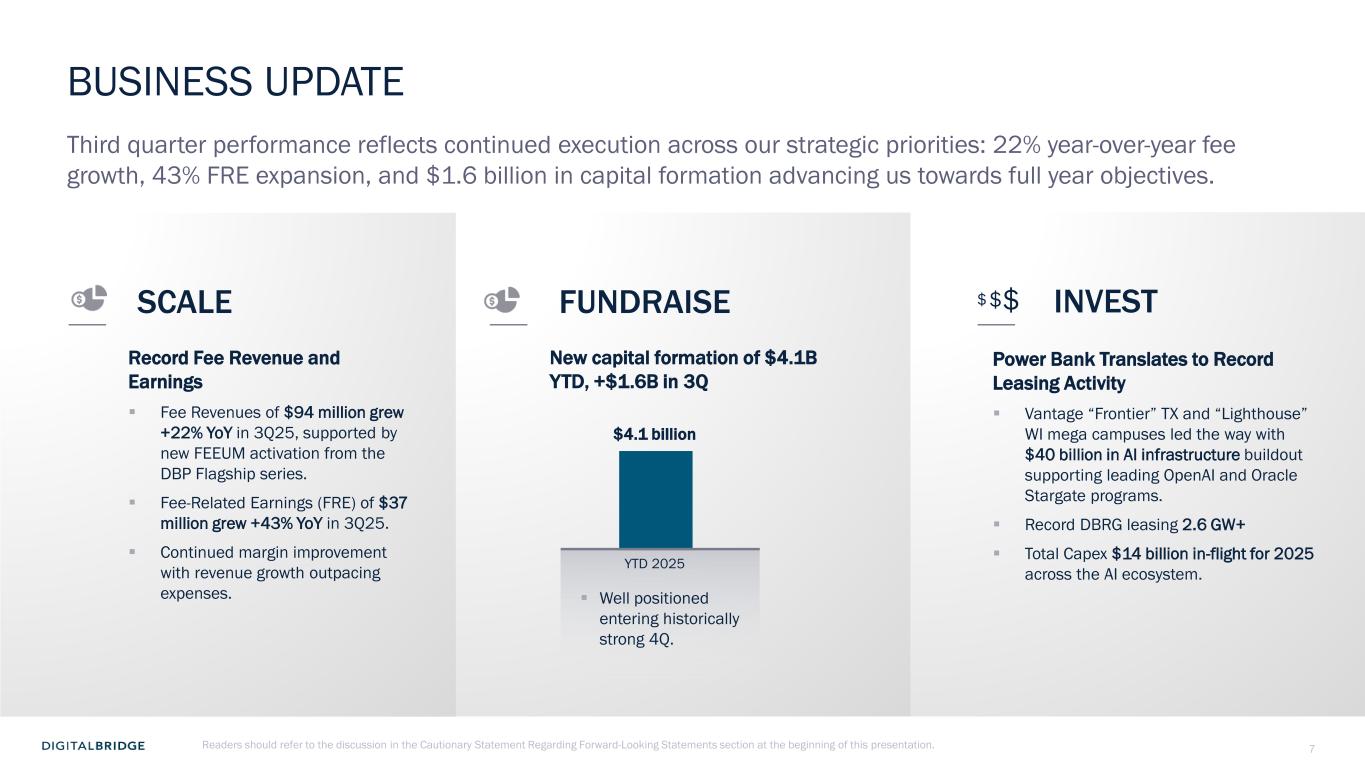
7 R:11 G:35 B:65 R:1 G:52 B:75 R:0 G:87 B:122 R:0 G:126 B:92 R:0 G:152 B:99 R:34 G:208 B:129 R:167 G:169 B:180 R:208 G:209 B:219 R:73 G:82 B:82 R:91 G:103 B:113 BUSINESS UPDATE Power Bank Translates to Record Leasing Activity ▪ Vantage “Frontier” TX and “Lighthouse” WI mega campuses led the way with $40 billion in AI infrastructure buildout supporting leading OpenAI and Oracle Stargate programs. ▪ Record DBRG leasing 2.6 GW+ ▪ Total Capex $14 billion in-flight for 2025 across the AI ecosystem. Record Fee Revenue and Earnings ▪ Fee Revenues of $94 million grew +22% YoY in 3Q25, supported by new FEEUM activation from the DBP Flagship series. ▪ Fee-Related Earnings (FRE) of $37 million grew +43% YoY in 3Q25. ▪ Continued margin improvement with revenue growth outpacing expenses. $$$ Third quarter performance reflects continued execution across our strategic priorities: 22% year-over-year fee growth, 43% FRE expansion, and $1.6 billion in capital formation advancing us towards full year objectives. New capital formation of $4.1B YTD, +$1.6B in 3Q INVESTSCALE FUNDRAISE $4.1 billion YTD 2025 ▪ Well positioned entering historically strong 4Q. Readers should refer to the discussion in the Cautionary Statement Regarding Forward-Looking Statements section at the beginning of this presentation.
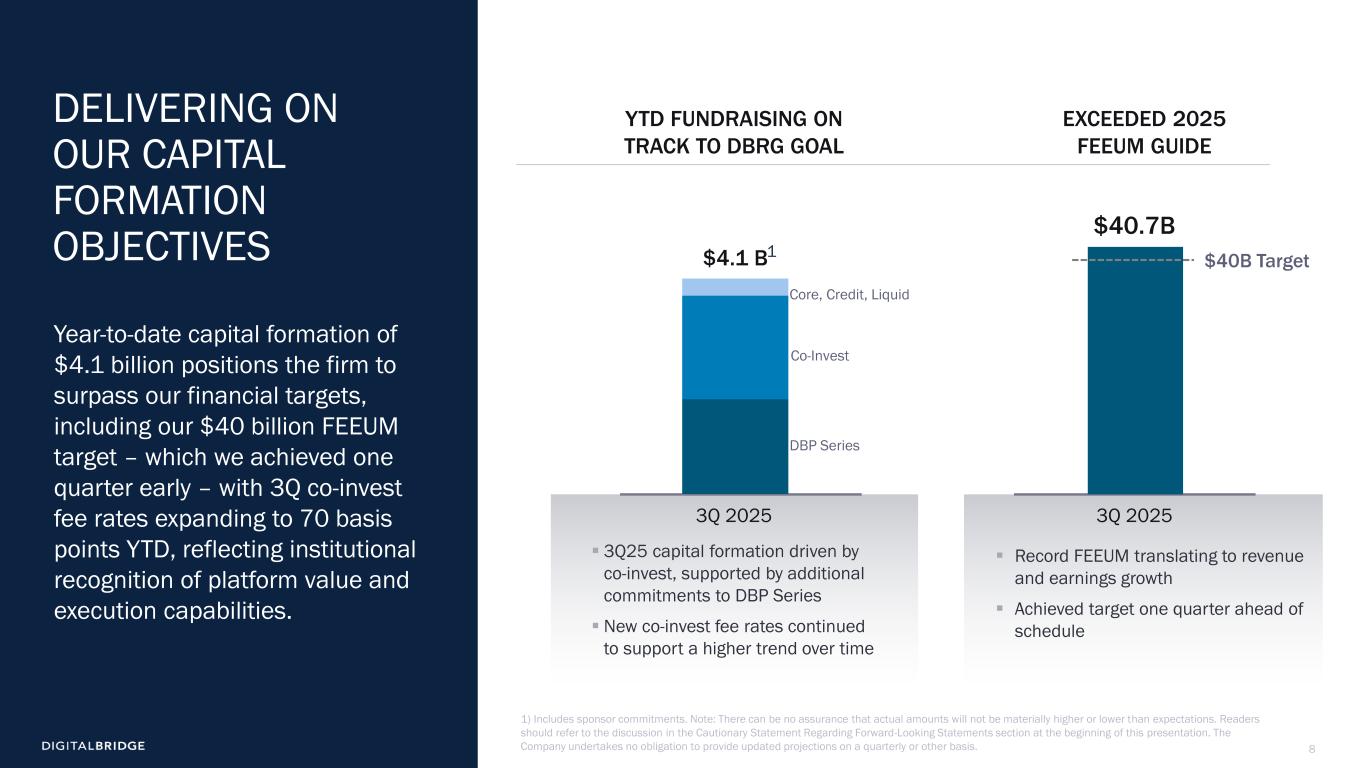
8 R:11 G:35 B:65 R:1 G:52 B:75 R:0 G:87 B:122 R:0 G:126 B:92 R:0 G:152 B:99 R:34 G:208 B:129 R:167 G:169 B:180 R:208 G:209 B:219 R:73 G:82 B:82 R:91 G:103 B:113 Year-to-date capital formation of $4.1 billion positions the firm to surpass our financial targets, including our $40 billion FEEUM target – which we achieved one quarter early – with 3Q co-invest fee rates expanding to 70 basis points YTD, reflecting institutional recognition of platform value and execution capabilities. DELIVERING ON OUR CAPITAL FORMATION OBJECTIVES $40B Target $40.7B 3Q 2025 DBP Series Co-Invest Core, Credit, Liquid 3Q 2025 $4.1 B ▪ 3Q25 capital formation driven by co-invest, supported by additional commitments to DBP Series ▪ New co-invest fee rates continued to support a higher trend over time ▪ Record FEEUM translating to revenue and earnings growth ▪ Achieved target one quarter ahead of schedule 1) Includes sponsor commitments. Note: There can be no assurance that actual amounts will not be materially higher or lower than expectations. Readers should refer to the discussion in the Cautionary Statement Regarding Forward-Looking Statements section at the beginning of this presentation. The Company undertakes no obligation to provide updated projections on a quarterly or other basis. YTD FUNDRAISING ON TRACK TO DBRG GOAL EXCEEDED 2025 FEEUM GUIDE 1
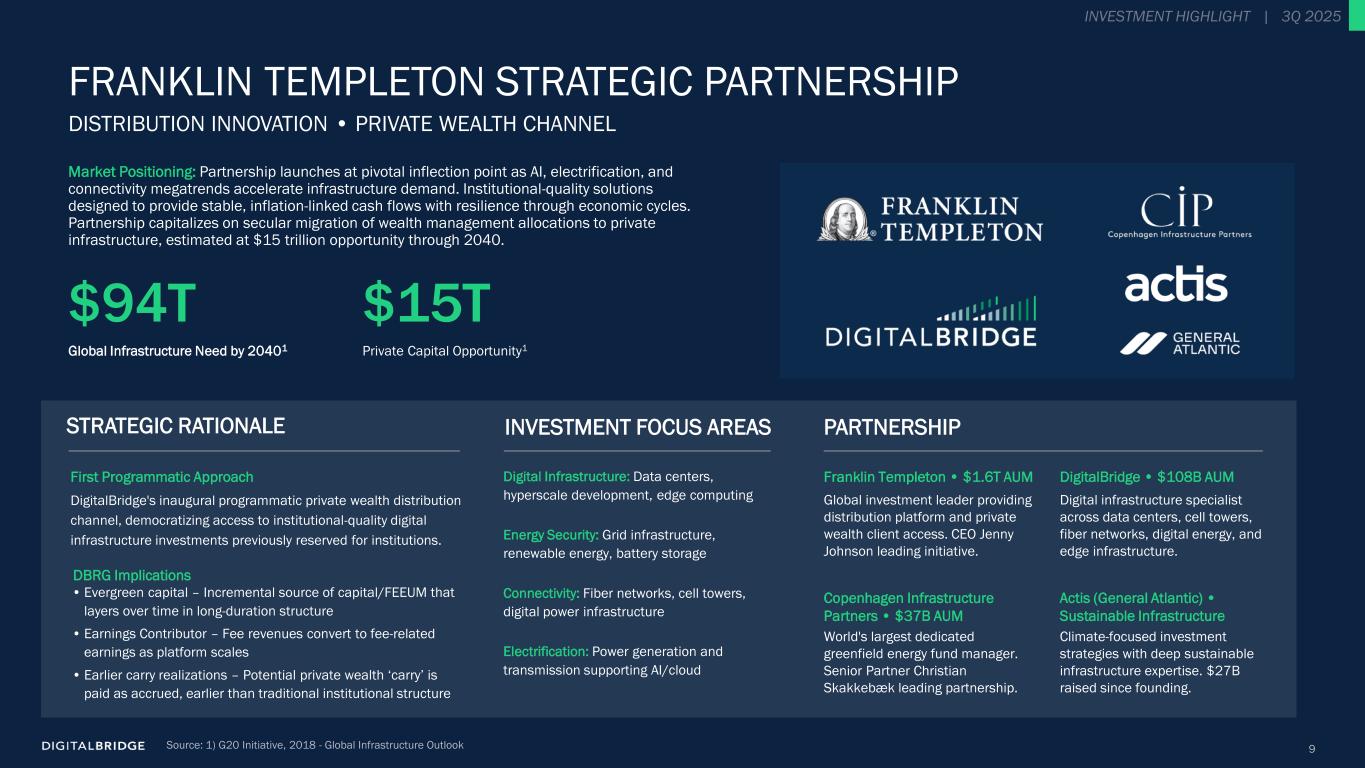
9 R:11 G:35 B:65 R:1 G:52 B:75 R:0 G:87 B:122 R:0 G:126 B:92 R:0 G:152 B:99 R:34 G:208 B:129 R:167 G:169 B:180 R:208 G:209 B:219 R:73 G:82 B:82 R:91 G:103 B:113 PARTNERSHIPINVESTMENT FOCUS AREAS $94T Global Infrastructure Need by 20401 Private Capital Opportunity1 STRATEGIC RATIONALE First Programmatic Approach DigitalBridge's inaugural programmatic private wealth distribution channel, democratizing access to institutional-quality digital infrastructure investments previously reserved for institutions. DBRG Implications • Evergreen capital – Incremental source of capital/FEEUM that layers over time in long-duration structure • Earnings Contributor – Fee revenues convert to fee-related earnings as platform scales • Earlier carry realizations – Potential private wealth ‘carry’ is paid as accrued, earlier than traditional institutional structure Franklin Templeton • $1.6T AUM Global investment leader providing distribution platform and private wealth client access. CEO Jenny Johnson leading initiative. DigitalBridge • $108B AUM Digital infrastructure specialist across data centers, cell towers, fiber networks, digital energy, and edge infrastructure. Copenhagen Infrastructure Partners • $37B AUM World's largest dedicated greenfield energy fund manager. Senior Partner Christian Skakkebæk leading partnership. Actis (General Atlantic) • Sustainable Infrastructure Climate-focused investment strategies with deep sustainable infrastructure expertise. $27B raised since founding. Digital Infrastructure: Data centers, hyperscale development, edge computing Energy Security: Grid infrastructure, renewable energy, battery storage Connectivity: Fiber networks, cell towers, digital power infrastructure Electrification: Power generation and transmission supporting AI/cloud Market Positioning: Partnership launches at pivotal inflection point as AI, electrification, and connectivity megatrends accelerate infrastructure demand. Institutional-quality solutions designed to provide stable, inflation-linked cash flows with resilience through economic cycles. Partnership capitalizes on secular migration of wealth management allocations to private infrastructure, estimated at $15 trillion opportunity through 2040. FRANKLIN TEMPLETON STRATEGIC PARTNERSHIP DISTRIBUTION INNOVATION • PRIVATE WEALTH CHANNEL INVESTMENT HIGHLIGHT | 3Q 2025 $15T Source: 1) G20 Initiative, 2018 - Global Infrastructure Outlook
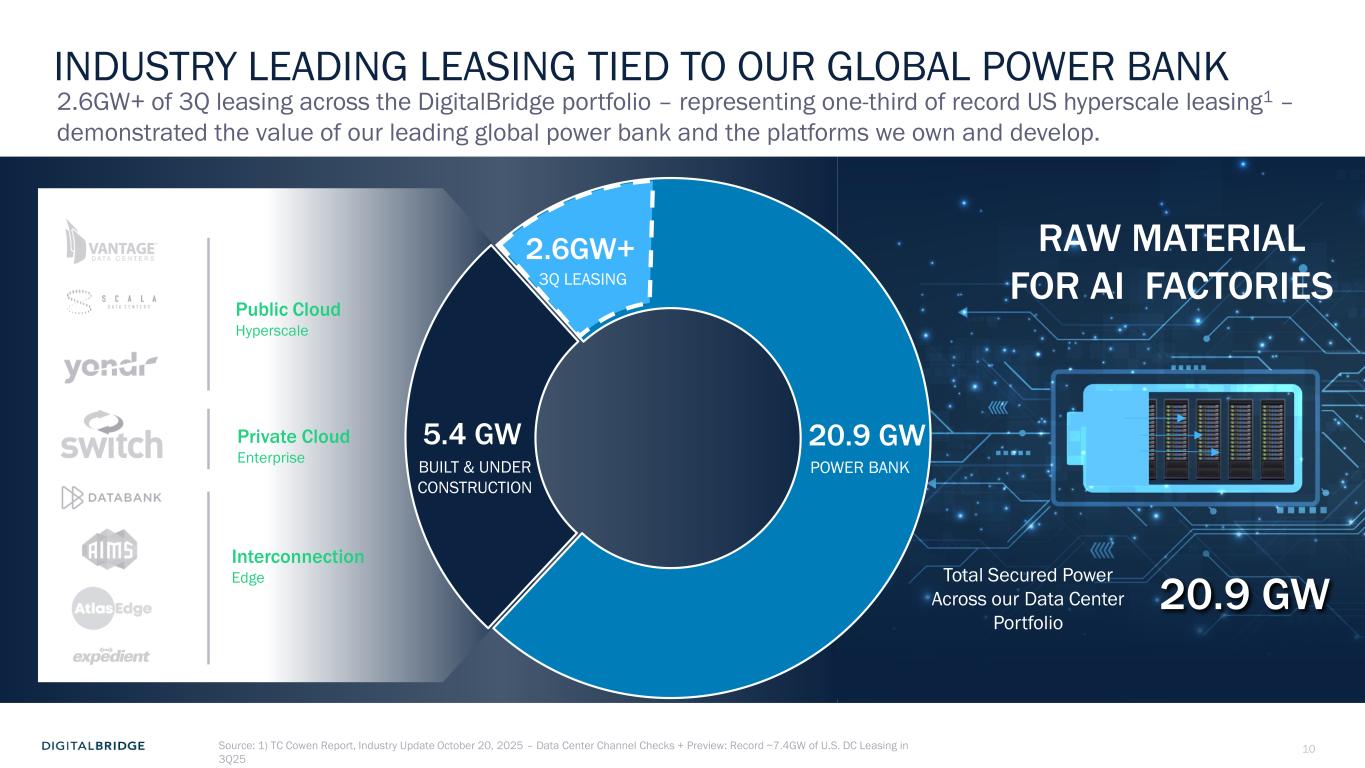
10 R:11 G:35 B:65 R:1 G:52 B:75 R:0 G:87 B:122 R:0 G:126 B:92 R:0 G:152 B:99 R:34 G:208 B:129 R:167 G:169 B:180 R:208 G:209 B:219 R:73 G:82 B:82 R:91 G:103 B:113 20.9 GW 5.4 GW BUILT & UNDER CONSTRUCTION 20.9 GW POWER BANK Total Secured Power Across our Data Center Portfolio RAW MATERIAL FOR AI FACTORIES Public Cloud Hyperscale Private Cloud Enterprise Interconnection Edge INDUSTRY LEADING LEASING TIED TO OUR GLOBAL POWER BANK 2.6GW+ of 3Q leasing across the DigitalBridge portfolio – representing one-third of record US hyperscale leasing1 – demonstrated the value of our leading global power bank and the platforms we own and develop. 2.6GW+ 3Q LEASING Source: 1) TC Cowen Report, Industry Update October 20, 2025 – Data Center Channel Checks + Preview: Record ~7.4GW of U.S. DC Leasing in 3Q25
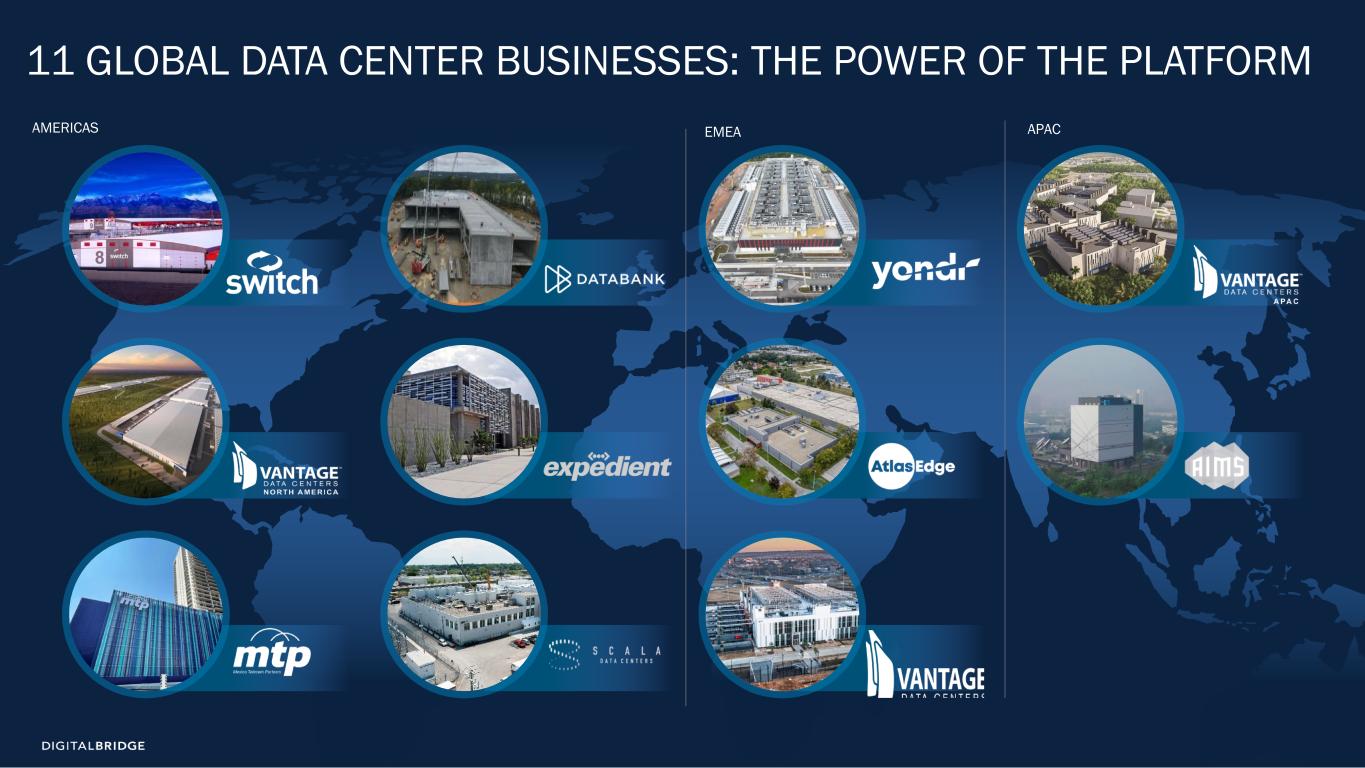
11 R:11 G:35 B:65 R:1 G:52 B:75 R:0 G:87 B:122 R:0 G:126 B:92 R:0 G:152 B:99 R:34 G:208 B:129 R:167 G:169 B:180 R:208 G:209 B:219 R:73 G:82 B:82 R:91 G:103 B:113 11 GLOBAL DATA CENTER BUSINESSES: THE POWER OF THE PLATFORM AMERICAS EMEA APAC

12 R:11 G:35 B:65 R:1 G:52 B:75 R:0 G:87 B:122 R:0 G:126 B:92 R:0 G:152 B:99 R:34 G:208 B:129 R:167 G:169 B:180 R:208 G:209 B:219 R:73 G:82 B:82 R:91 G:103 B:113 2 FINANCIAL UPDATE
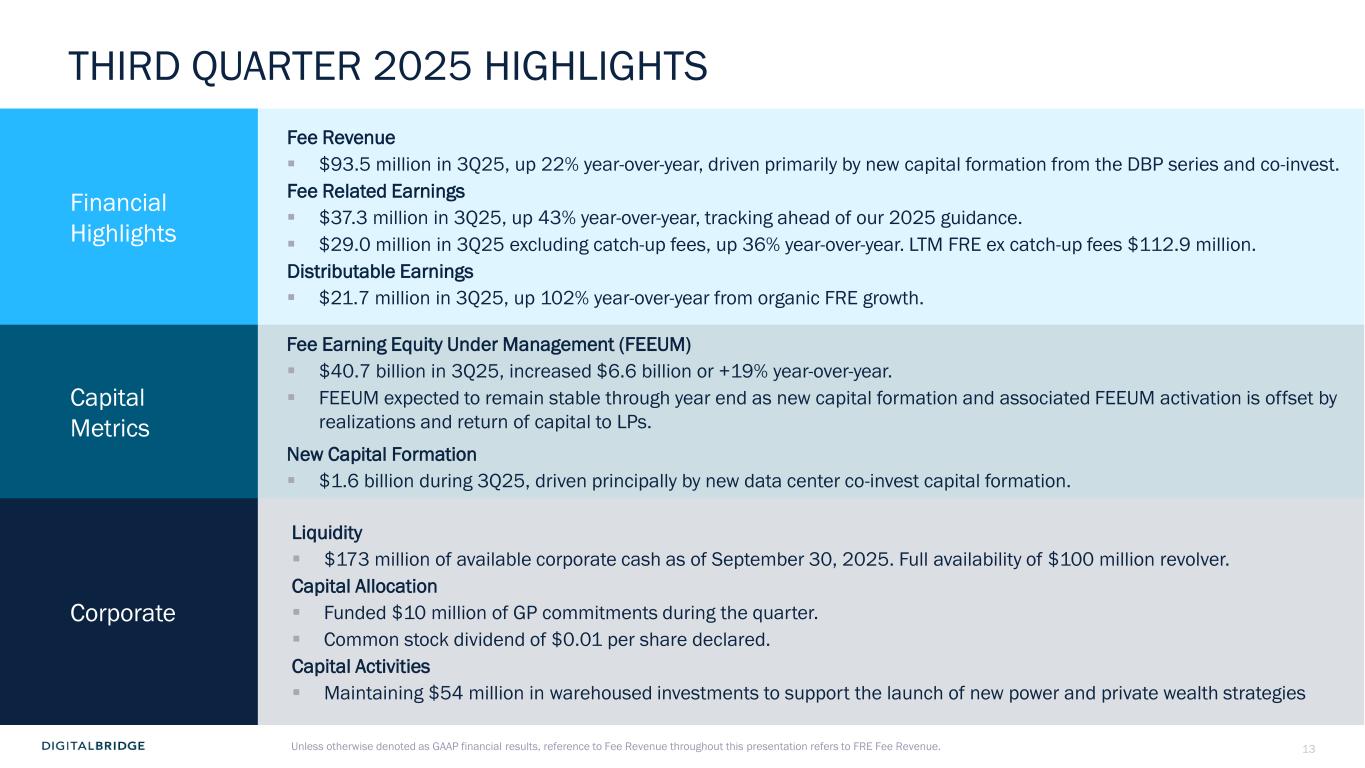
13 R:11 G:35 B:65 R:1 G:52 B:75 R:0 G:87 B:122 R:0 G:126 B:92 R:0 G:152 B:99 R:34 G:208 B:129 R:167 G:169 B:180 R:208 G:209 B:219 R:73 G:82 B:82 R:91 G:103 B:113 THIRD QUARTER 2025 HIGHLIGHTS Financial Highlights Fee Revenue ▪ $93.5 million in 3Q25, up 22% year-over-year, driven primarily by new capital formation from the DBP series and co-invest. Fee Related Earnings ▪ $37.3 million in 3Q25, up 43% year-over-year, tracking ahead of our 2025 guidance. ▪ $29.0 million in 3Q25 excluding catch-up fees, up 36% year-over-year. LTM FRE ex catch-up fees $112.9 million. Distributable Earnings ▪ $21.7 million in 3Q25, up 102% year-over-year from organic FRE growth. Capital Metrics Fee Earning Equity Under Management (FEEUM) ▪ $40.7 billion in 3Q25, increased $6.6 billion or +19% year-over-year. ▪ FEEUM expected to remain stable through year end as new capital formation and associated FEEUM activation is offset by realizations and return of capital to LPs. New Capital Formation ▪ $1.6 billion during 3Q25, driven principally by new data center co-invest capital formation. Corporate Liquidity ▪ $173 million of available corporate cash as of September 30, 2025. Full availability of $100 million revolver. Capital Allocation ▪ Funded $10 million of GP commitments during the quarter. ▪ Common stock dividend of $0.01 per share declared. Capital Activities ▪ Maintaining $54 million in warehoused investments to support the launch of new power and private wealth strategies Unless otherwise denoted as GAAP financial results, reference to Fee Revenue throughout this presentation refers to FRE Fee Revenue.
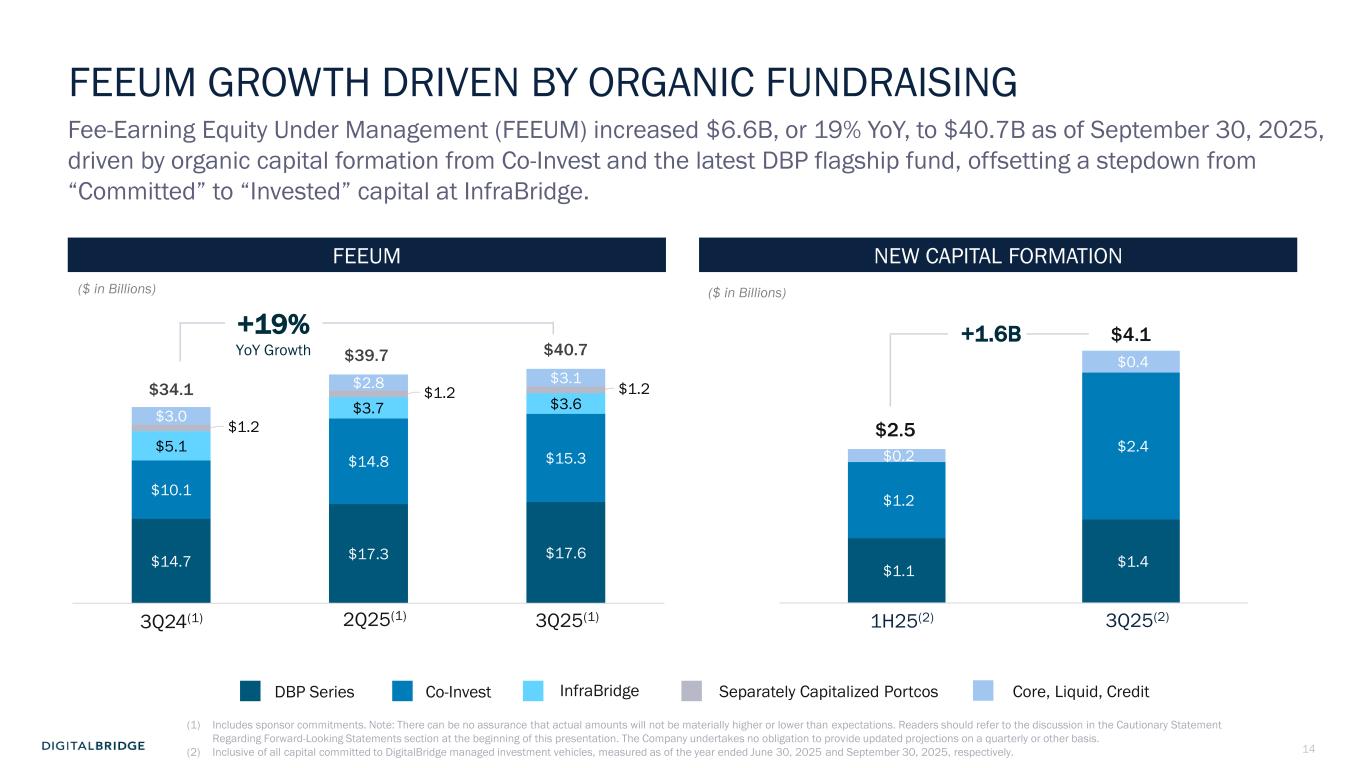
14 R:11 G:35 B:65 R:1 G:52 B:75 R:0 G:87 B:122 R:0 G:126 B:92 R:0 G:152 B:99 R:34 G:208 B:129 R:167 G:169 B:180 R:208 G:209 B:219 R:73 G:82 B:82 R:91 G:103 B:113 $1.1 $1.4 $1.2 $2.4 $0.2 $0.4 FEEUM GROWTH DRIVEN BY ORGANIC FUNDRAISING Fee-Earning Equity Under Management (FEEUM) increased $6.6B, or 19% YoY, to $40.7B as of September 30, 2025, driven by organic capital formation from Co-Invest and the latest DBP flagship fund, offsetting a stepdown from “Committed” to “Invested” capital at InfraBridge. DBP Series Separately Capitalized PortcosCo-Invest NEW CAPITAL FORMATIONFEEUM InfraBridge Core, Liquid, Credit +19% YoY Growth ($ in Billions) ($ in Billions) (1) Includes sponsor commitments. Note: There can be no assurance that actual amounts will not be materially higher or lower than expectations. Readers should refer to the discussion in the Cautionary Statement Regarding Forward-Looking Statements section at the beginning of this presentation. The Company undertakes no obligation to provide updated projections on a quarterly or other basis. (2) Inclusive of all capital committed to DigitalBridge managed investment vehicles, measured as of the year ended June 30, 2025 and September 30, 2025, respectively. 3Q25(2) $4.1 1H25(2) $2.5 +1.6B 2Q25(1) 3Q25(1)3Q24(1) $14.7 $17.3 $17.6 $10.1 $14.8 $15.3 $5.1 $3.7 $3.6 $1.2 $1.2 $1.2 $3.0 $2.8 $3.1 $34.1 $39.7 $40.7 NEW CAPITAL FORMATIONFEEUM +19% YoY Growth ($ in Billions) ($ in Billions) 3Q25(1) $4.1 1H25(1) $2.5 +1.6B 2Q25 3Q253Q24
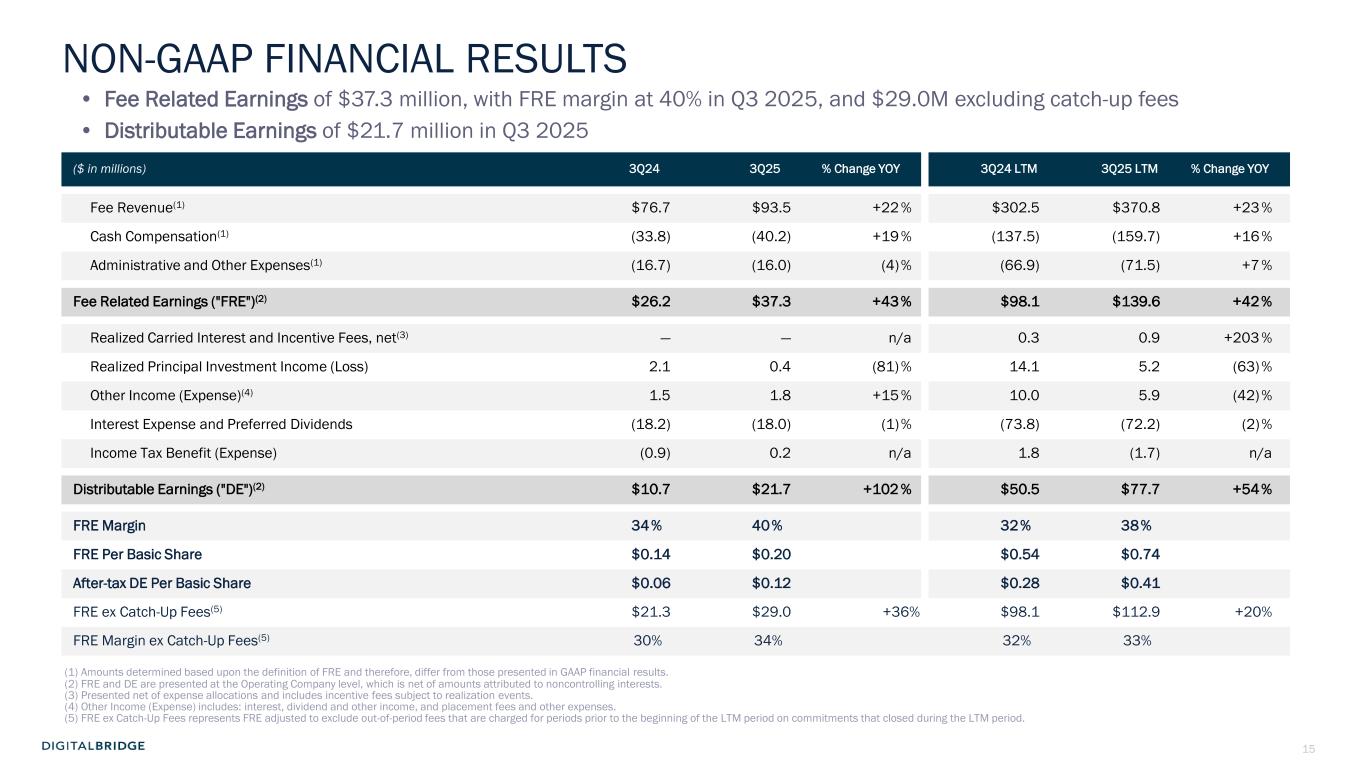
15 R:11 G:35 B:65 R:1 G:52 B:75 R:0 G:87 B:122 R:0 G:126 B:92 R:0 G:152 B:99 R:34 G:208 B:129 R:167 G:169 B:180 R:208 G:209 B:219 R:73 G:82 B:82 R:91 G:103 B:113 NON-GAAP FINANCIAL RESULTS • Fee Related Earnings of $37.3 million, with FRE margin at 40% in Q3 2025, and $29.0M excluding catch-up fees • Distributable Earnings of $21.7 million in Q3 2025 ($ in millions) 3Q24 3Q25 % Change YOY 3Q24 LTM 3Q25 LTM % Change YOY Fee Revenue(1) $76.7 $93.5 +22 % $302.5 $370.8 +23 % Cash Compensation(1) (33.8) (40.2) +19 % (137.5) (159.7) +16 % Administrative and Other Expenses(1) (16.7) (16.0) (4)% (66.9) (71.5) +7 % Fee Related Earnings ("FRE")(2) $26.2 $37.3 +43% $98.1 $139.6 +42% Realized Carried Interest and Incentive Fees, net(3) — — n/a 0.3 0.9 +203 % Realized Principal Investment Income (Loss) 2.1 0.4 (81) % 14.1 5.2 (63) % Other Income (Expense)(4) 1.5 1.8 +15 % 10.0 5.9 (42) % Interest Expense and Preferred Dividends (18.2) (18.0) (1)% (73.8) (72.2) (2)% Income Tax Benefit (Expense) (0.9) 0.2 n/a 1.8 (1.7) n/a Distributable Earnings ("DE")(2) $10.7 $21.7 +102 % $50.5 $77.7 +54% FRE Margin 34% 40% 32% 38% FRE Per Basic Share $0.14 $0.20 $0.54 $0.74 After-tax DE Per Basic Share $0.06 $0.12 $0.28 $0.41 FRE ex Catch-Up Fees(5) $21.3 $29.0 +36% $98.1 $112.9 +20% FRE Margin ex Catch-Up Fees(5) 30% 34% 32% 33% (1) Amounts determined based upon the definition of FRE and therefore, differ from those presented in GAAP financial results. (2) FRE and DE are presented at the Operating Company level, which is net of amounts attributed to noncontrolling interests. (3) Presented net of expense allocations and includes incentive fees subject to realization events. (4) Other Income (Expense) includes: interest, dividend and other income, and placement fees and other expenses. (5) FRE ex Catch-Up Fees represents FRE adjusted to exclude out-of-period fees that are charged for periods prior to the beginning of the LTM period on commitments that closed during the LTM period.
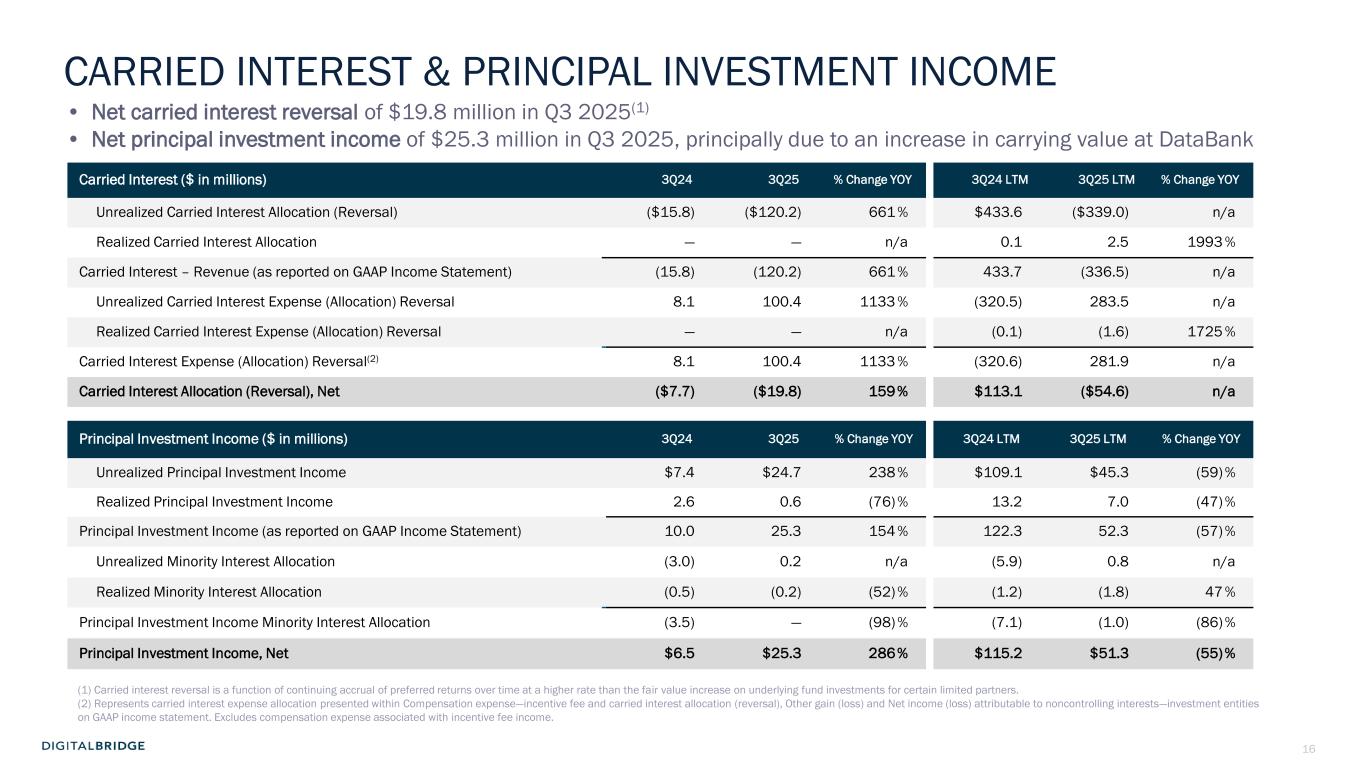
16 R:11 G:35 B:65 R:1 G:52 B:75 R:0 G:87 B:122 R:0 G:126 B:92 R:0 G:152 B:99 R:34 G:208 B:129 R:167 G:169 B:180 R:208 G:209 B:219 R:73 G:82 B:82 R:91 G:103 B:113 Carried Interest ($ in millions) 3Q24 3Q25 % Change YOY 3Q24 LTM 3Q25 LTM % Change YOY Unrealized Carried Interest Allocation (Reversal) ($15.8) ($120.2) 661 % $433.6 ($339.0) n/a Realized Carried Interest Allocation — — n/a 0.1 2.5 1993 % Carried Interest – Revenue (as reported on GAAP Income Statement) (15.8) (120.2) 661 % 433.7 (336.5) n/a Unrealized Carried Interest Expense (Allocation) Reversal 8.1 100.4 1133 % (320.5) 283.5 n/a Realized Carried Interest Expense (Allocation) Reversal — — n/a (0.1) (1.6) 1725 % Carried Interest Expense (Allocation) Reversal(2) 8.1 100.4 1133 % (320.6) 281.9 n/a Carried Interest Allocation (Reversal), Net ($7.7) ($19.8) 159% $113.1 ($54.6) n/a Principal Investment Income ($ in millions) 3Q24 3Q25 % Change YOY 3Q24 LTM 3Q25 LTM % Change YOY Unrealized Principal Investment Income $7.4 $24.7 238 % $109.1 $45.3 (59) % Realized Principal Investment Income 2.6 0.6 (76) % 13.2 7.0 (47) % Principal Investment Income (as reported on GAAP Income Statement) 10.0 25.3 154 % 122.3 52.3 (57) % Unrealized Minority Interest Allocation (3.0) 0.2 n/a (5.9) 0.8 n/a Realized Minority Interest Allocation (0.5) (0.2) (52) % (1.2) (1.8) 47 % Principal Investment Income Minority Interest Allocation (3.5) — (98) % (7.1) (1.0) (86) % Principal Investment Income, Net $6.5 $25.3 286% $115.2 $51.3 (55)% (1) Carried interest reversal is a function of continuing accrual of preferred returns over time at a higher rate than the fair value increase on underlying fund investments for certain limited partners. (2) Represents carried interest expense allocation presented within Compensation expense—incentive fee and carried interest allocation (reversal), Other gain (loss) and Net income (loss) attributable to noncontrolling interests—investment entities on GAAP income statement. Excludes compensation expense associated with incentive fee income. • Net carried interest reversal of $19.8 million in Q3 2025(1) • Net principal investment income of $25.3 million in Q3 2025, principally due to an increase in carrying value at DataBank CARRIED INTEREST & PRINCIPAL INVESTMENT INCOME
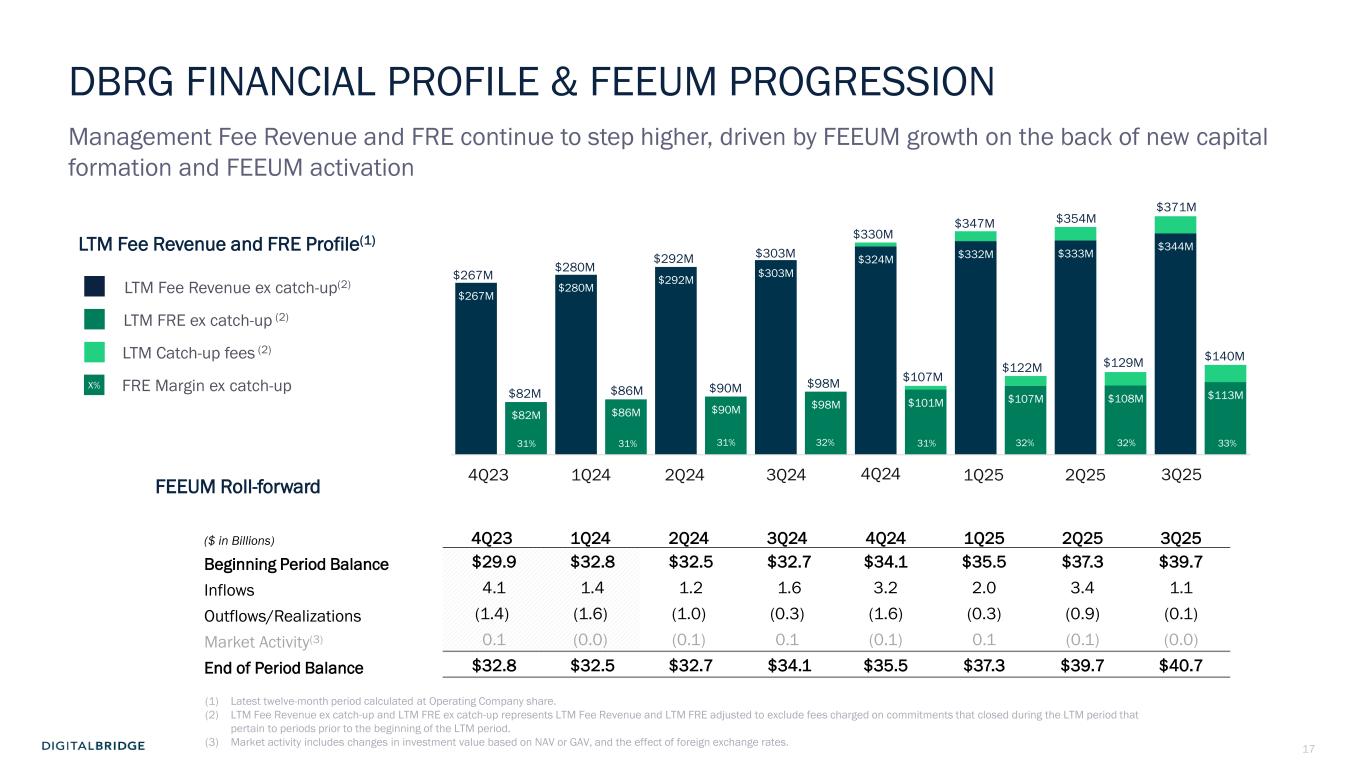
17 R:11 G:35 B:65 R:1 G:52 B:75 R:0 G:87 B:122 R:0 G:126 B:92 R:0 G:152 B:99 R:34 G:208 B:129 R:167 G:169 B:180 R:208 G:209 B:219 R:73 G:82 B:82 R:91 G:103 B:113 LTM Fee Revenue ex catch-up(2) LTM FRE ex catch-up (2) LTM Fee Revenue and FRE Profile(1) $267M $82M $280M $86M $292M $90M $303M $98M $324M $101M $332M $107M $333M $108M $344M $113M 3Q252Q251Q254Q243Q242Q241Q244Q23 LTM Catch-up fees (2) $140M $371M $267M $280M $292M $303M $330M $347M $354M $122M $107M $98M$90M$86M$82M $129M FRE Margin ex catch-up 33% X% 31% 31% 32% 31%31% 32% 32% DBRG FINANCIAL PROFILE & FEEUM PROGRESSION Management Fee Revenue and FRE continue to step higher, driven by FEEUM growth on the back of new capital formation and FEEUM activation ($ in Billions) 4Q23 1Q24 2Q24 3Q24 4Q24 1Q25 2Q25 3Q25 Beginning Period Balance $29.9 $32.8 $32.5 $32.7 $34.1 $35.5 $37.3 $39.7 Inflows 4.1 1.4 1.2 1.6 3.2 2.0 3.4 1.1 Outflows/Realizations (1.4) (1.6) (1.0) (0.3) (1.6) (0.3) (0.9) (0.1) Market Activity(3) 0.1 (0.0) (0.1) 0.1 (0.1) 0.1 (0.1) (0.0) End of Period Balance $32.8 $32.5 $32.7 $34.1 $35.5 $37.3 $39.7 $40.7 FEEUM Roll-forward (1) Latest twelve-month period calculated at Operating Company share. (2) LTM Fee Revenue ex catch-up and LTM FRE ex catch-up represents LTM Fee Revenue and LTM FRE adjusted to exclude fees charged on commitments that closed during the LTM period that pertain to periods prior to the beginning of the LTM period. (3) Market activity includes changes in investment value based on NAV or GAV, and the effect of foreign exchange rates.
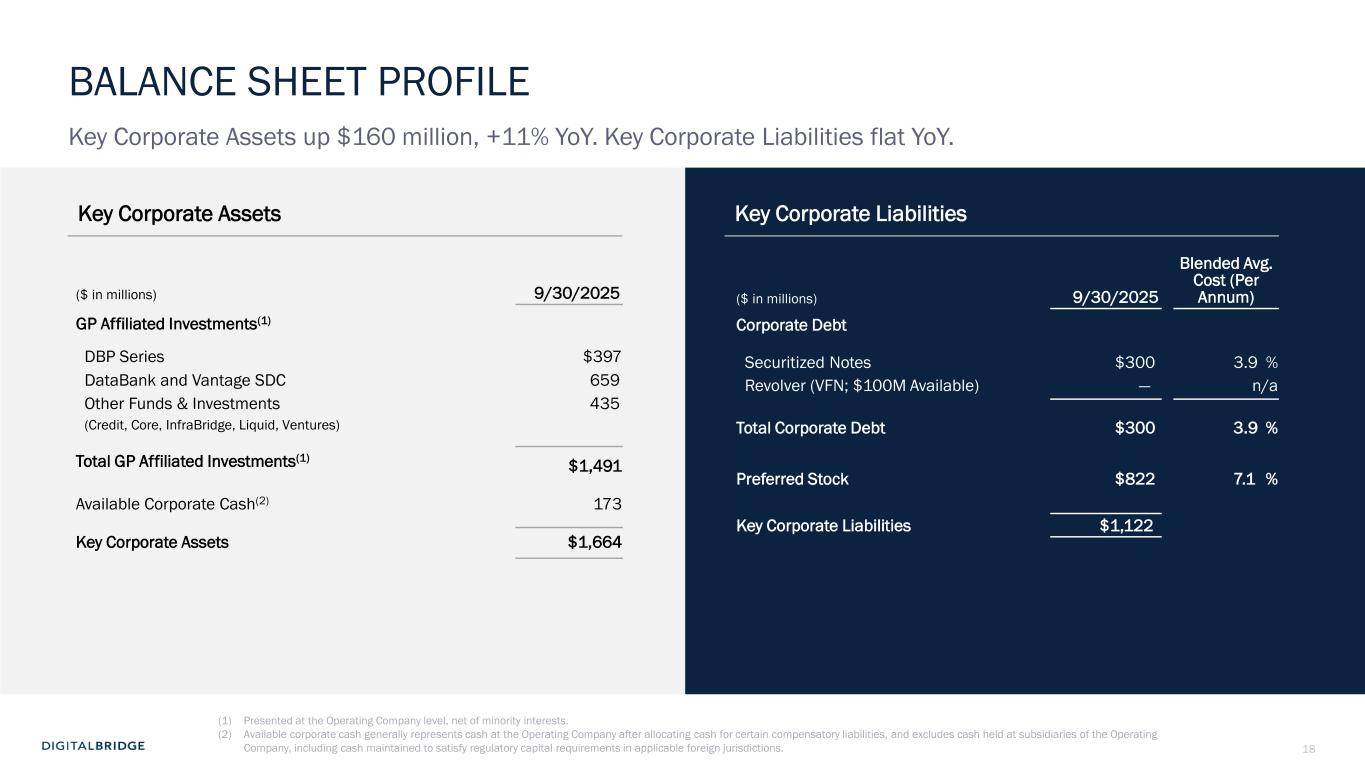
18 R:11 G:35 B:65 R:1 G:52 B:75 R:0 G:87 B:122 R:0 G:126 B:92 R:0 G:152 B:99 R:34 G:208 B:129 R:167 G:169 B:180 R:208 G:209 B:219 R:73 G:82 B:82 R:91 G:103 B:113 Key Corporate Assets Key Corporate Liabilities ($ in millions) 9/30/2025 GP Affiliated Investments(1) DBP Series $397 DataBank and Vantage SDC 659 Other Funds & Investments 435 (Credit, Core, InfraBridge, Liquid, Ventures) Total GP Affiliated Investments(1) $1,491 Available Corporate Cash(2) 173 Key Corporate Assets $1,664 ($ in millions) 9/30/2025 Blended Avg. Cost (Per Annum) Corporate Debt Securitized Notes $300 3.9 % Revolver (VFN; $100M Available) — n/a Total Corporate Debt $300 3.9 % Preferred Stock $822 7.1 % Key Corporate Liabilities $1,122 (1) Presented at the Operating Company level, net of minority interests. (2) Available corporate cash generally represents cash at the Operating Company after allocating cash for certain compensatory liabilities, and excludes cash held at subsidiaries of the Operating Company, including cash maintained to satisfy regulatory capital requirements in applicable foreign jurisdictions. BALANCE SHEET PROFILE Key Corporate Assets up $160 million, +11% YoY. Key Corporate Liabilities flat YoY.

19 R:11 G:35 B:65 R:1 G:52 B:75 R:0 G:87 B:122 R:0 G:126 B:92 R:0 G:152 B:99 R:34 G:208 B:129 R:167 G:169 B:180 R:208 G:209 B:219 R:73 G:82 B:82 R:91 G:103 B:113 3 EXECUTING THE DIGITAL PLAYBOOK
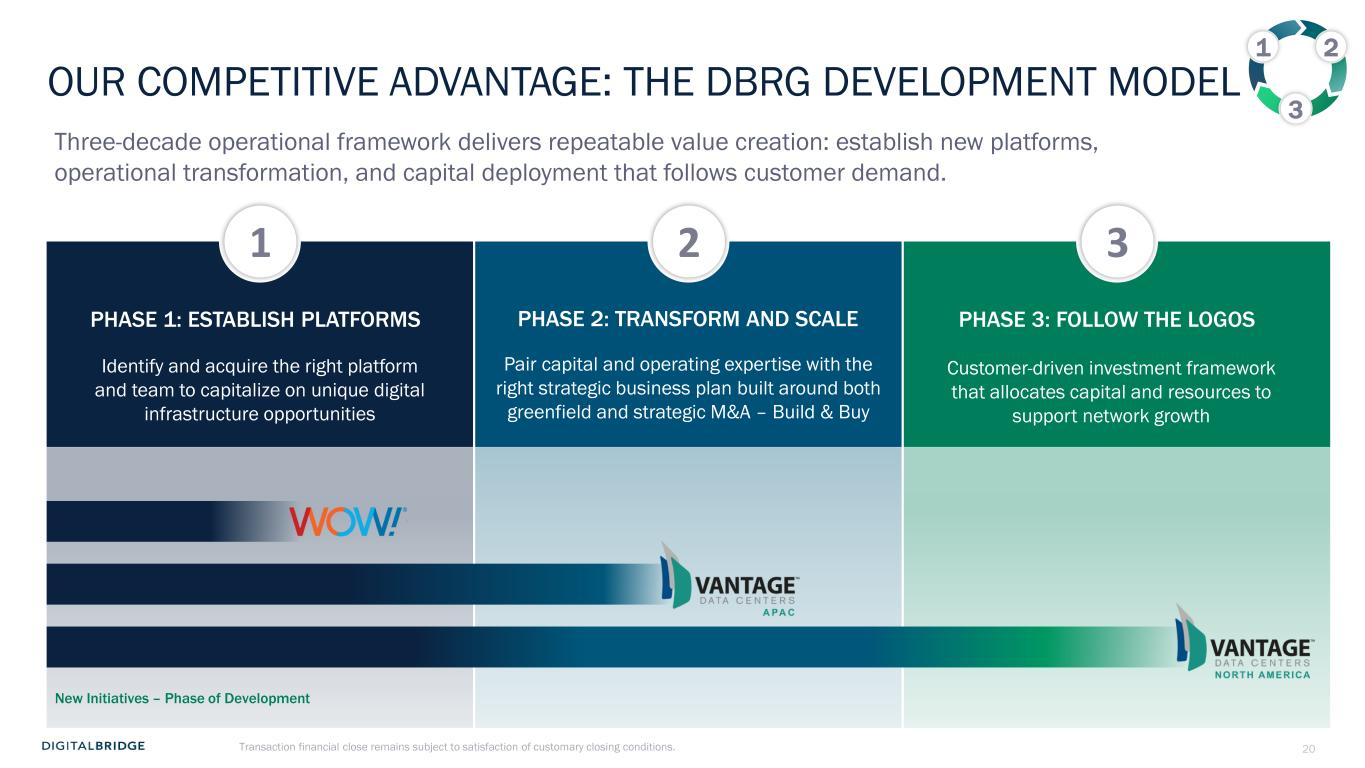
20 R:11 G:35 B:65 R:1 G:52 B:75 R:0 G:87 B:122 R:0 G:126 B:92 R:0 G:152 B:99 R:34 G:208 B:129 R:167 G:169 B:180 R:208 G:209 B:219 R:73 G:82 B:82 R:91 G:103 B:113 Pair capital and operating expertise with the right strategic business plan built around both greenfield and strategic M&A – Build & Buy Customer-driven investment framework that allocates capital and resources to support network growth PHASE 1: ESTABLISH PLATFORMS PHASE 2: TRANSFORM AND SCALE PHASE 3: FOLLOW THE LOGOS Identify and acquire the right platform and team to capitalize on unique digital infrastructure opportunities OUR COMPETITIVE ADVANTAGE: THE DBRG DEVELOPMENT MODEL Three-decade operational framework delivers repeatable value creation: establish new platforms, operational transformation, and capital deployment that follows customer demand. 1 2 3 1 2 3 New Initiatives – Phase of Development Transaction financial close remains subject to satisfaction of customary closing conditions.
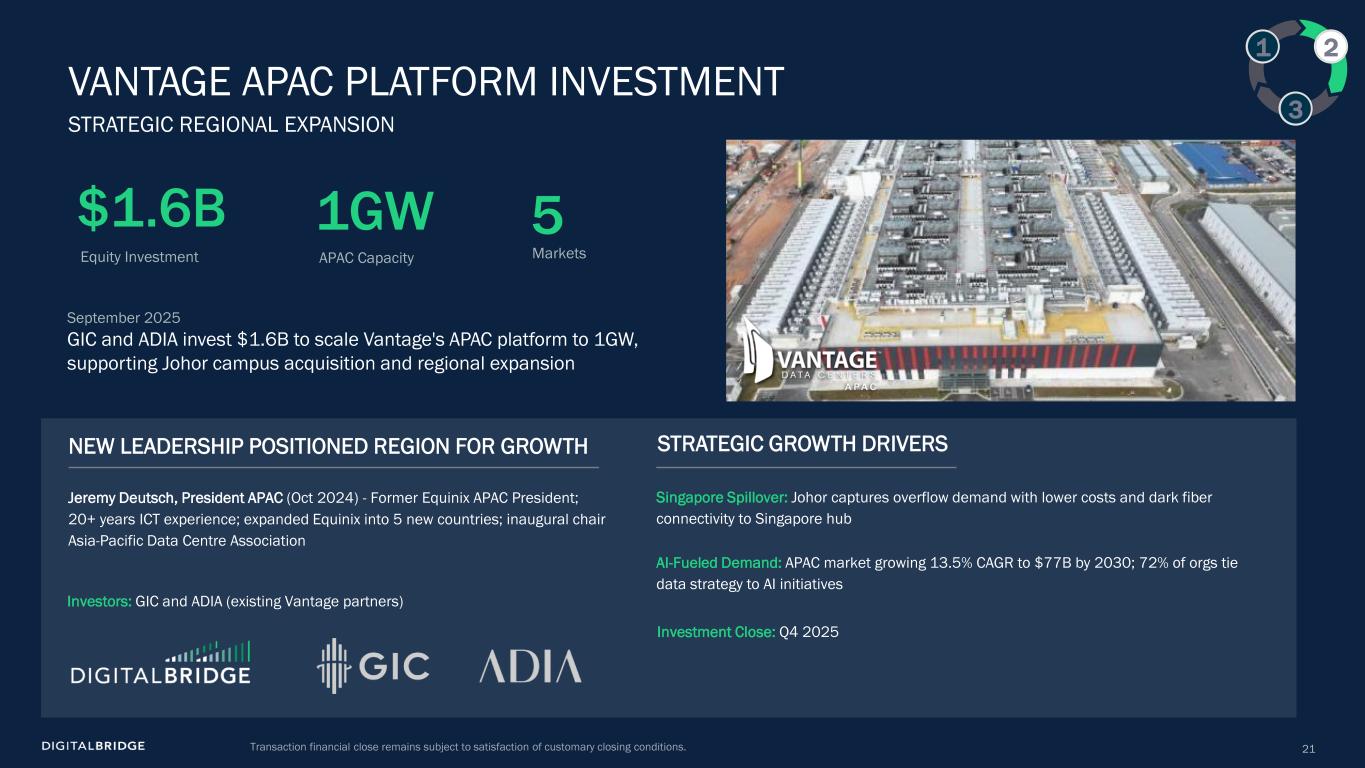
21 R:11 G:35 B:65 R:1 G:52 B:75 R:0 G:87 B:122 R:0 G:126 B:92 R:0 G:152 B:99 R:34 G:208 B:129 R:167 G:169 B:180 R:208 G:209 B:219 R:73 G:82 B:82 R:91 G:103 B:113 $1.6B Equity Investment 1GW APAC Capacity 5 Markets Singapore Spillover: Johor captures overflow demand with lower costs and dark fiber connectivity to Singapore hub AI-Fueled Demand: APAC market growing 13.5% CAGR to $77B by 2030; 72% of orgs tie data strategy to AI initiatives NEW LEADERSHIP POSITIONED REGION FOR GROWTH Jeremy Deutsch, President APAC (Oct 2024) - Former Equinix APAC President; 20+ years ICT experience; expanded Equinix into 5 new countries; inaugural chair Asia-Pacific Data Centre Association Investment Close: Q4 2025 Investors: GIC and ADIA (existing Vantage partners) VANTAGE APAC PLATFORM INVESTMENT STRATEGIC REGIONAL EXPANSION STRATEGIC GROWTH DRIVERS 1 2 3 September 2025 GIC and ADIA invest $1.6B to scale Vantage's APAC platform to 1GW, supporting Johor campus acquisition and regional expansion Transaction financial close remains subject to satisfaction of customary closing conditions.
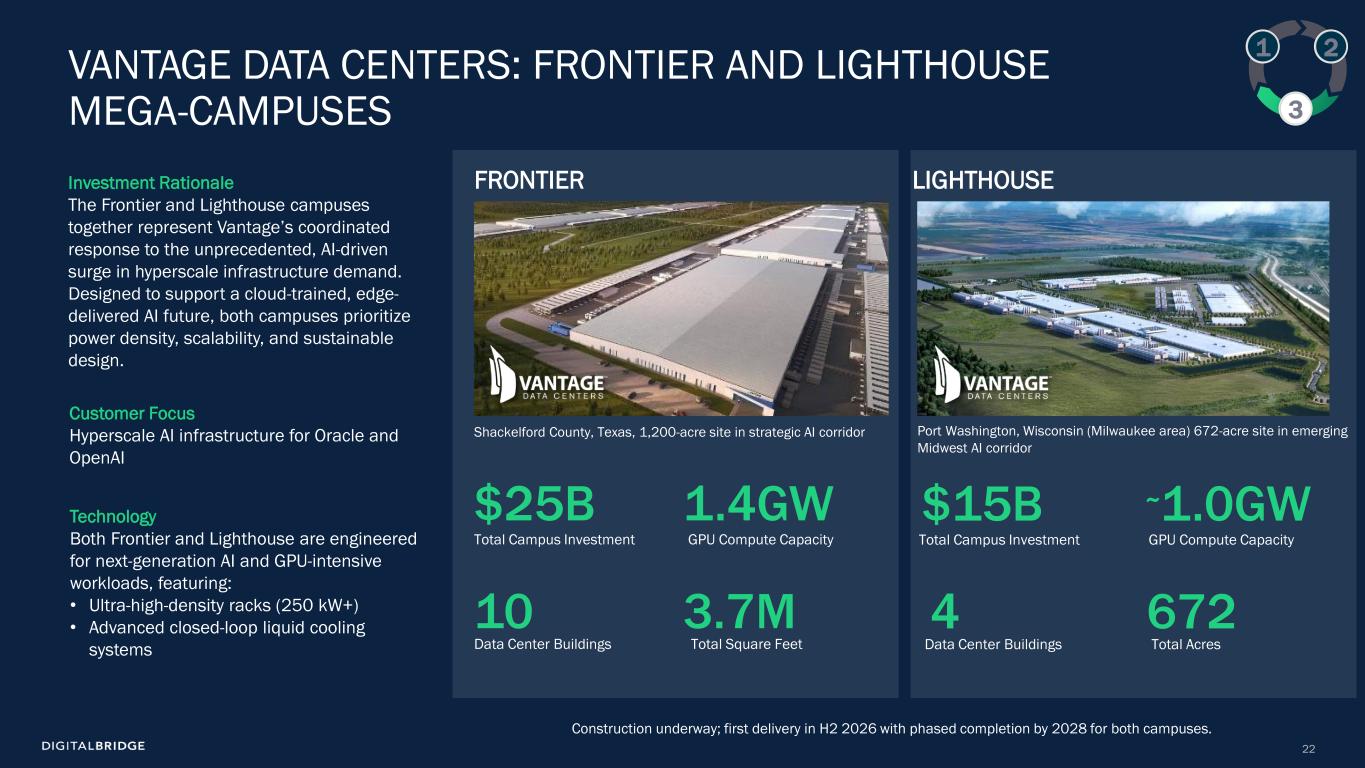
22 R:11 G:35 B:65 R:1 G:52 B:75 R:0 G:87 B:122 R:0 G:126 B:92 R:0 G:152 B:99 R:34 G:208 B:129 R:167 G:169 B:180 R:208 G:209 B:219 R:73 G:82 B:82 R:91 G:103 B:113 Investment Rationale The Frontier and Lighthouse campuses together represent Vantage’s coordinated response to the unprecedented, AI-driven surge in hyperscale infrastructure demand. Designed to support a cloud-trained, edge- delivered AI future, both campuses prioritize power density, scalability, and sustainable design. VANTAGE DATA CENTERS: FRONTIER AND LIGHTHOUSE MEGA-CAMPUSES Technology Both Frontier and Lighthouse are engineered for next-generation AI and GPU-intensive workloads, featuring: • Ultra-high-density racks (250 kW+) • Advanced closed-loop liquid cooling systems 1 2 3 Customer Focus Hyperscale AI infrastructure for Oracle and OpenAI $25B Total Campus Investment 1.4GW GPU Compute Capacity 10 Data Center Buildings 3.7M Total Square Feet $15B Total Campus Investment ~1.0GW GPU Compute Capacity 4 Data Center Buildings 672 Total Acres Shackelford County, Texas, 1,200-acre site in strategic AI corridor Port Washington, Wisconsin (Milwaukee area) 672-acre site in emerging Midwest AI corridor FRONTIER LIGHTHOUSE . Through DigitalBridge’s and Silver Lake’s strategic backing, Vantage is expanding its platform to deliver over 2 GW+ of zero-emission capacity across key regions — including the upper Midwest — positioning the company to meet accelerating hyperscale and enterprise AI workloads with unmatched scale, speed, and efficiency. Construction underway; first delivery in H2 2026 with phased completion by 2028 for both campuses.
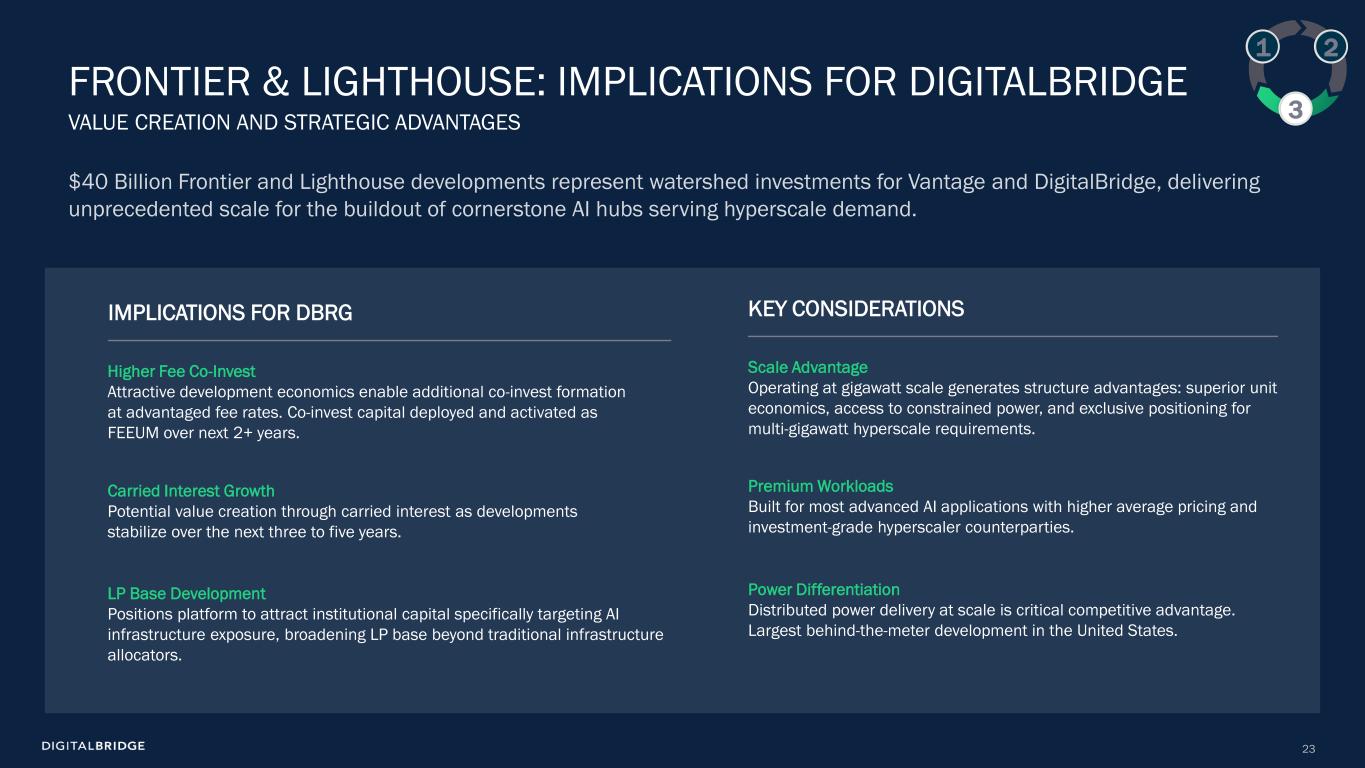
23 R:11 G:35 B:65 R:1 G:52 B:75 R:0 G:87 B:122 R:0 G:126 B:92 R:0 G:152 B:99 R:34 G:208 B:129 R:167 G:169 B:180 R:208 G:209 B:219 R:73 G:82 B:82 R:91 G:103 B:113 IMPLICATIONS FOR DBRG Higher Fee Co-Invest Attractive development economics enable additional co-invest formation at advantaged fee rates. Co-invest capital deployed and activated as FEEUM over next 2+ years. Carried Interest Growth Potential value creation through carried interest as developments stabilize over the next three to five years. LP Base Development Positions platform to attract institutional capital specifically targeting AI infrastructure exposure, broadening LP base beyond traditional infrastructure allocators. KEY CONSIDERATIONS Scale Advantage Operating at gigawatt scale generates structure advantages: superior unit economics, access to constrained power, and exclusive positioning for multi-gigawatt hyperscale requirements. Premium Workloads Built for most advanced AI applications with higher average pricing and investment-grade hyperscaler counterparties. Power Differentiation Distributed power delivery at scale is critical competitive advantage. Largest behind-the-meter development in the United States. $40 Billion Frontier and Lighthouse developments represent watershed investments for Vantage and DigitalBridge, delivering unprecedented scale for the buildout of cornerstone AI hubs serving hyperscale demand. FRONTIER & LIGHTHOUSE: IMPLICATIONS FOR DIGITALBRIDGE VALUE CREATION AND STRATEGIC ADVANTAGES 1 2 3
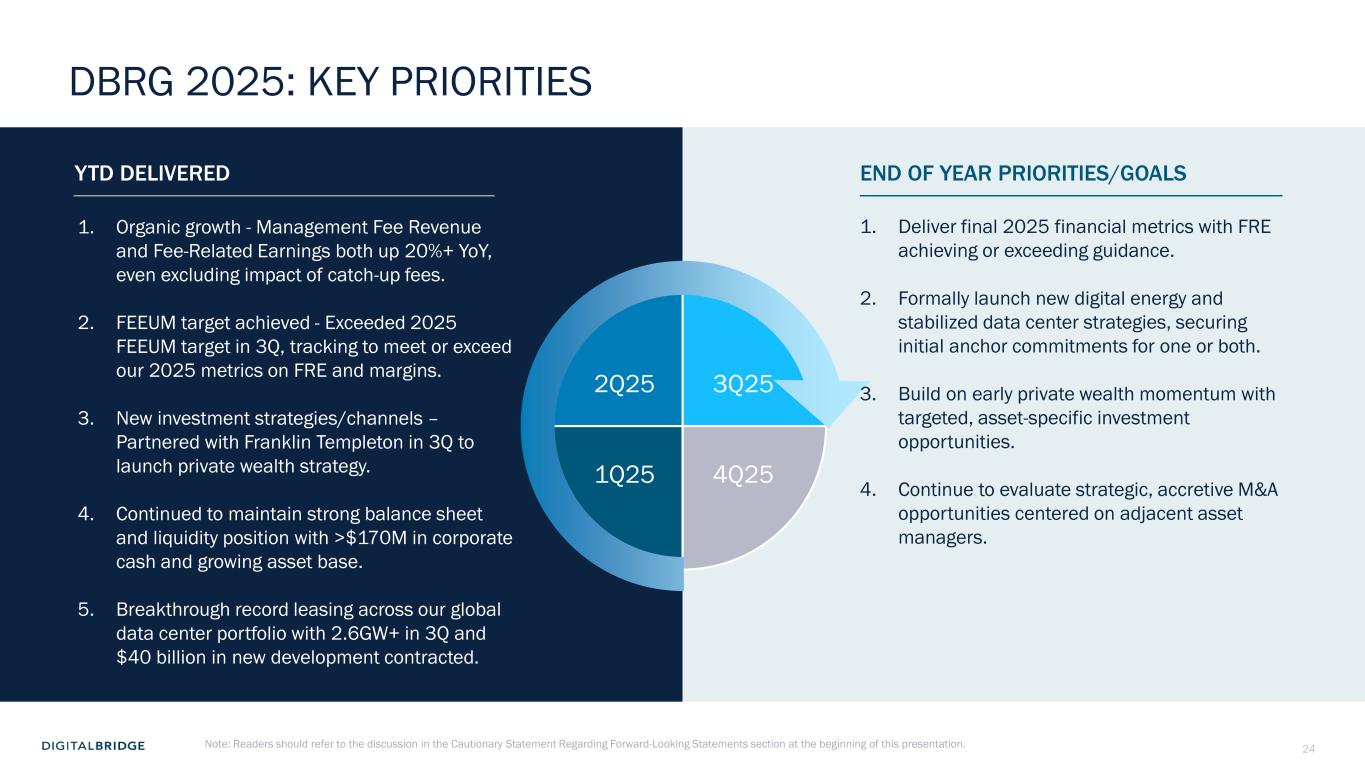
24 R:11 G:35 B:65 R:1 G:52 B:75 R:0 G:87 B:122 R:0 G:126 B:92 R:0 G:152 B:99 R:34 G:208 B:129 R:167 G:169 B:180 R:208 G:209 B:219 R:73 G:82 B:82 R:91 G:103 B:113 YTD DELIVERED END OF YEAR PRIORITIES/GOALS DBRG 2025: KEY PRIORITIES 1. Organic growth - Management Fee Revenue and Fee-Related Earnings both up 20%+ YoY, even excluding impact of catch-up fees. 2. FEEUM target achieved - Exceeded 2025 FEEUM target in 3Q, tracking to meet or exceed our 2025 metrics on FRE and margins. 3. New investment strategies/channels – Partnered with Franklin Templeton in 3Q to launch private wealth strategy. 4. Continued to maintain strong balance sheet and liquidity position with >$170M in corporate cash and growing asset base. 5. Breakthrough record leasing across our global data center portfolio with 2.6GW+ in 3Q and $40 billion in new development contracted. Note: Readers should refer to the discussion in the Cautionary Statement Regarding Forward-Looking Statements section at the beginning of this presentation. 1Q25 2Q25 4Q25 3Q25 1. Deliver final 2025 financial metrics with FRE achieving or exceeding guidance. 2. Formally launch new digital energy and stabilized data center strategies, securing initial anchor commitments for one or both. 3. Build on early private wealth momentum with targeted, asset-specific investment opportunities. 4. Continue to evaluate strategic, accretive M&A opportunities centered on adjacent asset managers.

25 R:11 G:35 B:65 R:1 G:52 B:75 R:0 G:87 B:122 R:0 G:126 B:92 R:0 G:152 B:99 R:34 G:208 B:129 R:167 G:169 B:180 R:208 G:209 B:219 R:73 G:82 B:82 R:91 G:103 B:113 4 Q&A SESSION

26 R:11 G:35 B:65 R:1 G:52 B:75 R:0 G:87 B:122 R:0 G:126 B:92 R:0 G:152 B:99 R:34 G:208 B:129 R:167 G:169 B:180 R:208 G:209 B:219 R:73 G:82 B:82 R:91 G:103 B:113 5 SUPPLEMENTAL FINANCIAL DATA
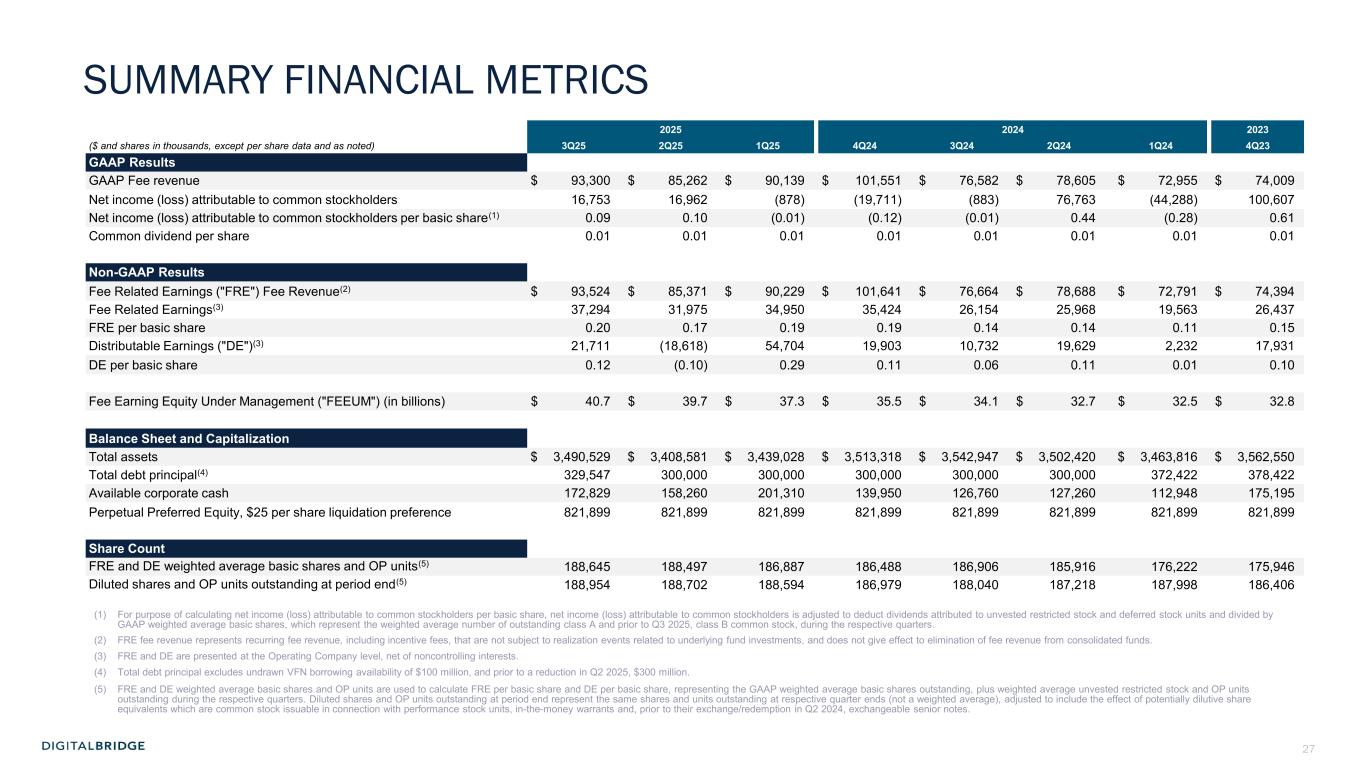
27 R:11 G:35 B:65 R:1 G:52 B:75 R:0 G:87 B:122 R:0 G:126 B:92 R:0 G:152 B:99 R:34 G:208 B:129 R:167 G:169 B:180 R:208 G:209 B:219 R:73 G:82 B:82 R:91 G:103 B:113 SUMMARY FINANCIAL METRICS 2025 2024 2023 ($ and shares in thousands, except per share data and as noted) 3Q25 2Q25 1Q25 4Q24 3Q24 2Q24 1Q24 4Q23 GAAP Results GAAP Fee revenue $ 93,300 $ 85,262 $ 90,139 $ 101,551 $ 76,582 $ 78,605 $ 72,955 $ 74,009 Net income (loss) attributable to common stockholders 16,753 16,962 (878) (19,711) (883) 76,763 (44,288) 100,607 Net income (loss) attributable to common stockholders per basic share(1) 0.09 0.10 (0.01) (0.12) (0.01) 0.44 (0.28) 0.61 Common dividend per share 0.01 0.01 0.01 0.01 0.01 0.01 0.01 0.01 Non-GAAP Results Fee Related Earnings ("FRE") Fee Revenue(2) $ 93,524 $ 85,371 $ 90,229 $ 101,641 $ 76,664 $ 78,688 $ 72,791 $ 74,394 Fee Related Earnings(3) 37,294 31,975 34,950 35,424 26,154 25,968 19,563 26,437 FRE per basic share 0.20 0.17 0.19 0.19 0.14 0.14 0.11 0.15 Distributable Earnings ("DE")(3) 21,711 (18,618) 54,704 19,903 10,732 19,629 2,232 17,931 DE per basic share 0.12 (0.10) 0.29 0.11 0.06 0.11 0.01 0.10 Fee Earning Equity Under Management ("FEEUM") (in billions) $ 40.7 $ 39.7 $ 37.3 $ 35.5 $ 34.1 $ 32.7 $ 32.5 $ 32.8 Balance Sheet and Capitalization Total assets $ 3,490,529 $ 3,408,581 $ 3,439,028 $ 3,513,318 $ 3,542,947 $ 3,502,420 $ 3,463,816 $ 3,562,550 Total debt principal(4) 329,547 300,000 300,000 300,000 300,000 300,000 372,422 378,422 Available corporate cash 172,829 158,260 201,310 139,950 126,760 127,260 112,948 175,195 Perpetual Preferred Equity, $25 per share liquidation preference 821,899 821,899 821,899 821,899 821,899 821,899 821,899 821,899 Share Count FRE and DE weighted average basic shares and OP units(5) 188,645 188,497 186,887 186,488 186,906 185,916 176,222 175,946 Diluted shares and OP units outstanding at period end(5) 188,954 188,702 188,594 186,979 188,040 187,218 187,998 186,406 (1) For purpose of calculating net income (loss) attributable to common stockholders per basic share, net income (loss) attributable to common stockholders is adjusted to deduct dividends attributed to unvested restricted stock and deferred stock units and divided by GAAP weighted average basic shares, which represent the weighted average number of outstanding class A and prior to Q3 2025, class B common stock, during the respective quarters. (2) FRE fee revenue represents recurring fee revenue, including incentive fees, that are not subject to realization events related to underlying fund investments, and does not give effect to elimination of fee revenue from consolidated funds. (3) FRE and DE are presented at the Operating Company level, net of noncontrolling interests. (4) Total debt principal excludes undrawn VFN borrowing availability of $100 million, and prior to a reduction in Q2 2025, $300 million. (5) FRE and DE weighted average basic shares and OP units are used to calculate FRE per basic share and DE per basic share, representing the GAAP weighted average basic shares outstanding, plus weighted average unvested restricted stock and OP units outstanding during the respective quarters. Diluted shares and OP units outstanding at period end represent the same shares and units outstanding at respective quarter ends (not a weighted average), adjusted to include the effect of potentially dilutive share equivalents which are common stock issuable in connection with performance stock units, in-the-money warrants and, prior to their exchange/redemption in Q2 2024, exchangeable senior notes.
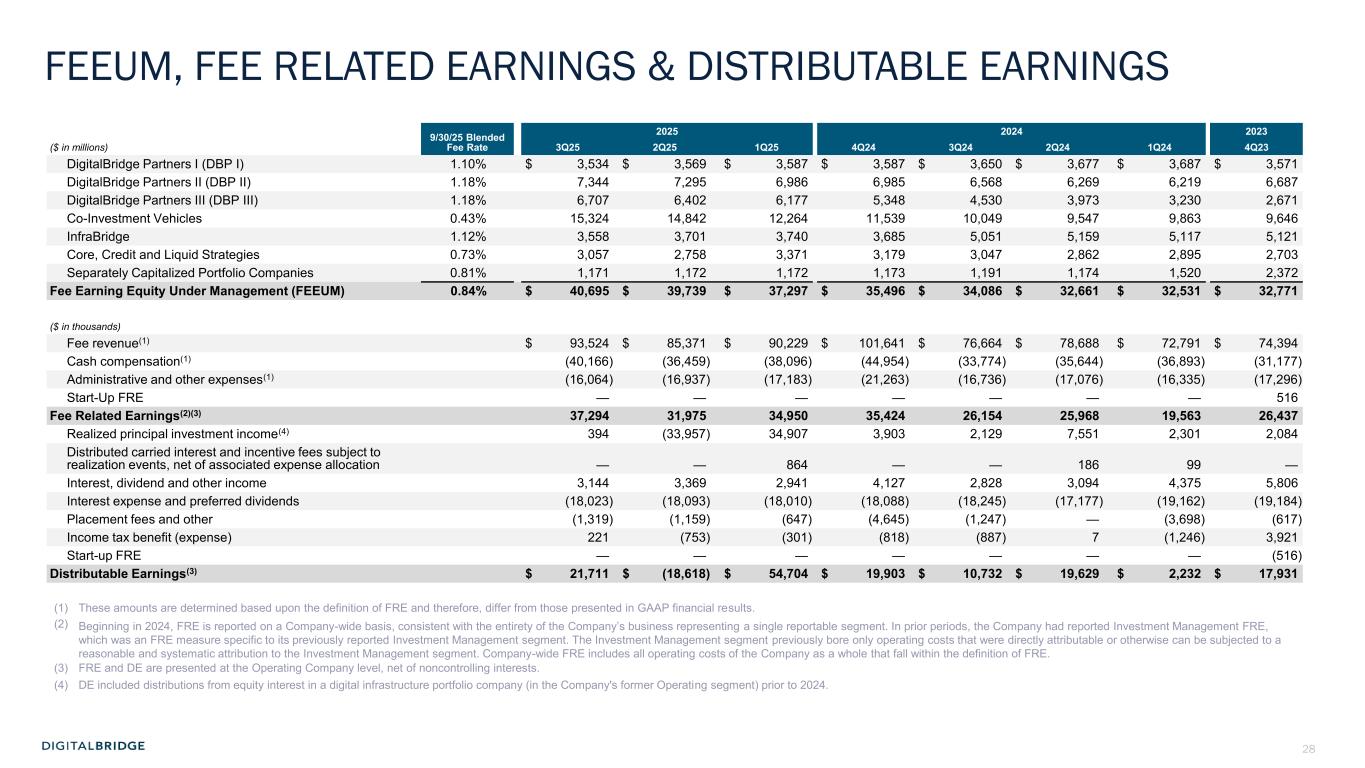
28 R:11 G:35 B:65 R:1 G:52 B:75 R:0 G:87 B:122 R:0 G:126 B:92 R:0 G:152 B:99 R:34 G:208 B:129 R:167 G:169 B:180 R:208 G:209 B:219 R:73 G:82 B:82 R:91 G:103 B:113 FEEUM, FEE RELATED EARNINGS & DISTRIBUTABLE EARNINGS 9/30/25 Blended Fee Rate 2025 2024 2023 ($ in millions) 3Q25 2Q25 1Q25 4Q24 3Q24 2Q24 1Q24 4Q23 DigitalBridge Partners I (DBP I) 1.10% $ 3,534 $ 3,569 $ 3,587 $ 3,587 $ 3,650 $ 3,677 $ 3,687 $ 3,571 DigitalBridge Partners II (DBP II) 1.18% 7,344 7,295 6,986 6,985 6,568 6,269 6,219 6,687 DigitalBridge Partners III (DBP III) 1.18% 6,707 6,402 6,177 5,348 4,530 3,973 3,230 2,671 Co-Investment Vehicles 0.43% 15,324 14,842 12,264 11,539 10,049 9,547 9,863 9,646 InfraBridge 1.12% 3,558 3,701 3,740 3,685 5,051 5,159 5,117 5,121 Core, Credit and Liquid Strategies 0.73% 3,057 2,758 3,371 3,179 3,047 2,862 2,895 2,703 Separately Capitalized Portfolio Companies 0.81% 1,171 1,172 1,172 1,173 1,191 1,174 1,520 2,372 Fee Earning Equity Under Management (FEEUM) 0.84% $ 40,695 $ 39,739 $ 37,297 $ 35,496 $ 34,086 $ 32,661 $ 32,531 $ 32,771 ($ in thousands) Fee revenue(1) $ 93,524 $ 85,371 $ 90,229 $ 101,641 $ 76,664 $ 78,688 $ 72,791 $ 74,394 Cash compensation(1) (40,166) (36,459) (38,096) (44,954) (33,774) (35,644) (36,893) (31,177) Administrative and other expenses(1) (16,064) (16,937) (17,183) (21,263) (16,736) (17,076) (16,335) (17,296) Start-Up FRE — — — — — — — 516 Fee Related Earnings(2)(3) 37,294 31,975 34,950 35,424 26,154 25,968 19,563 26,437 Realized principal investment income(4) 394 (33,957) 34,907 3,903 2,129 7,551 2,301 2,084 Distributed carried interest and incentive fees subject to realization events, net of associated expense allocation — — 864 — — 186 99 — Interest, dividend and other income 3,144 3,369 2,941 4,127 2,828 3,094 4,375 5,806 Interest expense and preferred dividends (18,023) (18,093) (18,010) (18,088) (18,245) (17,177) (19,162) (19,184) Placement fees and other (1,319) (1,159) (647) (4,645) (1,247) — (3,698) (617) Income tax benefit (expense) 221 (753) (301) (818) (887) 7 (1,246) 3,921 Start-up FRE — — — — — — — (516) Distributable Earnings(3) $ 21,711 $ (18,618) $ 54,704 $ 19,903 $ 10,732 $ 19,629 $ 2,232 $ 17,931 (1) These amounts are determined based upon the definition of FRE and therefore, differ from those presented in GAAP financial results. (2) Beginning in 2024, FRE is reported on a Company-wide basis, consistent with the entirety of the Company’s business representing a single reportable segment. In prior periods, the Company had reported Investment Management FRE, which was an FRE measure specific to its previously reported Investment Management segment. The Investment Management segment previously bore only operating costs that were directly attributable or otherwise can be subjected to a reasonable and systematic attribution to the Investment Management segment. Company-wide FRE includes all operating costs of the Company as a whole that fall within the definition of FRE. (3) FRE and DE are presented at the Operating Company level, net of noncontrolling interests. (4) DE included distributions from equity interest in a digital infrastructure portfolio company (in the Company's former Operating segment) prior to 2024.
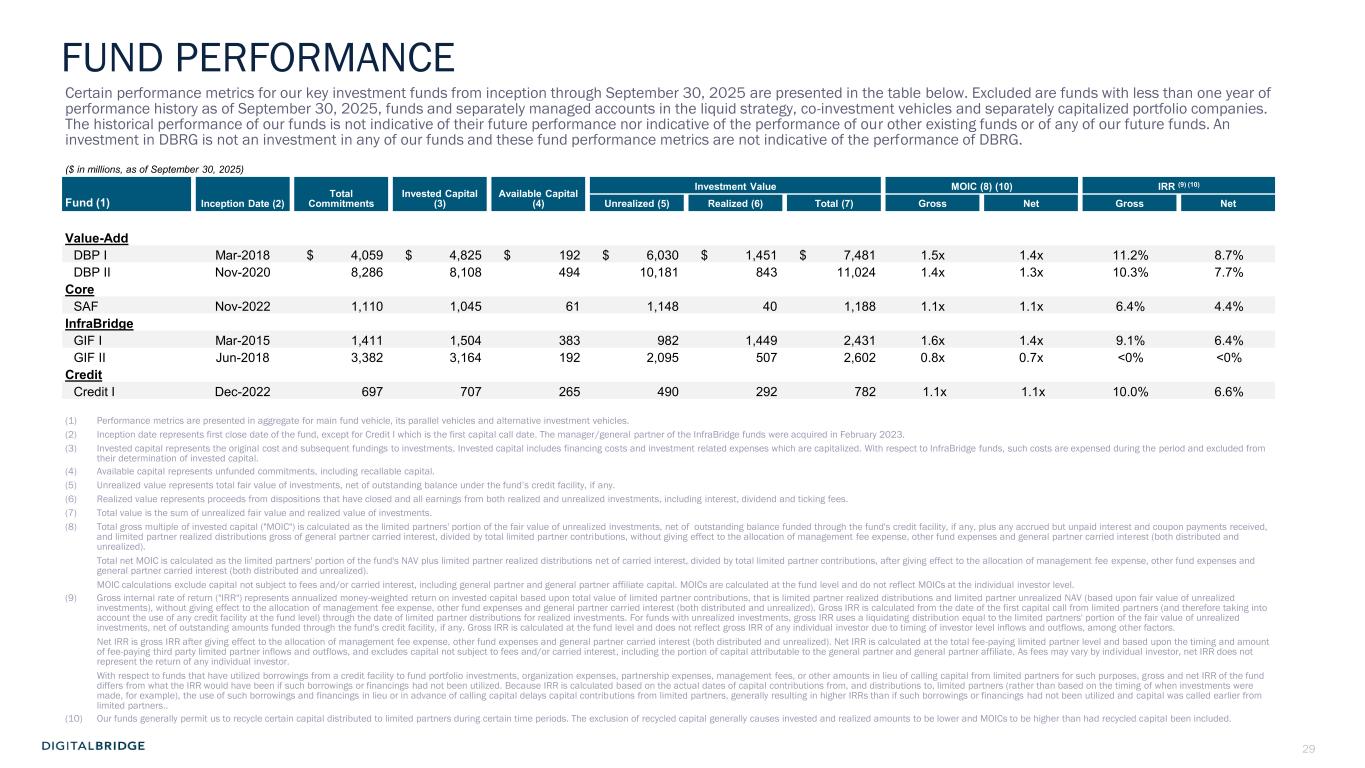
29 R:11 G:35 B:65 R:1 G:52 B:75 R:0 G:87 B:122 R:0 G:126 B:92 R:0 G:152 B:99 R:34 G:208 B:129 R:167 G:169 B:180 R:208 G:209 B:219 R:73 G:82 B:82 R:91 G:103 B:113 Certain performance metrics for our key investment funds from inception through September 30, 2025 are presented in the table below. Excluded are funds with less than one year of performance history as of September 30, 2025, funds and separately managed accounts in the liquid strategy, co-investment vehicles and separately capitalized portfolio companies. The historical performance of our funds is not indicative of their future performance nor indicative of the performance of our other existing funds or of any of our future funds. An investment in DBRG is not an investment in any of our funds and these fund performance metrics are not indicative of the performance of DBRG. ($ in millions, as of September 30, 2025) Inception Date (2) Total Commitments Invested Capital (3) Available Capital (4) Investment Value MOIC (8) (10) IRR (9) (10) Fund (1) Unrealized (5) Realized (6) Total (7) Gross Net Gross Net Value-Add DBP I Mar-2018 $ 4,059 $ 4,825 $ 192 $ 6,030 $ 1,451 $ 7,481 1.5x 1.4x 11.2% 8.7% DBP II Nov-2020 8,286 8,108 494 10,181 843 11,024 1.4x 1.3x 10.3% 7.7% Core SAF Nov-2022 1,110 1,045 61 1,148 40 1,188 1.1x 1.1x 6.4% 4.4% InfraBridge GIF I Mar-2015 1,411 1,504 383 982 1,449 2,431 1.6x 1.4x 9.1% 6.4% GIF II Jun-2018 3,382 3,164 192 2,095 507 2,602 0.8x 0.7x <0% <0% Credit Credit I Dec-2022 697 707 265 490 292 782 1.1x 1.1x 10.0% 6.6% (1) Performance metrics are presented in aggregate for main fund vehicle, its parallel vehicles and alternative investment vehicles. (2) Inception date represents first close date of the fund, except for Credit I which is the first capital call date. The manager/general partner of the InfraBridge funds were acquired in February 2023. (3) Invested capital represents the original cost and subsequent fundings to investments. Invested capital includes financing costs and investment related expenses which are capitalized. With respect to InfraBridge funds, such costs are expensed during the period and excluded from their determination of invested capital. (4) Available capital represents unfunded commitments, including recallable capital. (5) Unrealized value represents total fair value of investments, net of outstanding balance under the fund’s credit facility, if any. (6) Realized value represents proceeds from dispositions that have closed and all earnings from both realized and unrealized investments, including interest, dividend and ticking fees. (7) Total value is the sum of unrealized fair value and realized value of investments. (8) Total gross multiple of invested capital ("MOIC") is calculated as the limited partners' portion of the fair value of unrealized investments, net of outstanding balance funded through the fund's credit facility, if any, plus any accrued but unpaid interest and coupon payments received, and limited partner realized distributions gross of general partner carried interest, divided by total limited partner contributions, without giving effect to the allocation of management fee expense, other fund expenses and general partner carried interest (both distributed and unrealized). Total net MOIC is calculated as the limited partners' portion of the fund's NAV plus limited partner realized distributions net of carried interest, divided by total limited partner contributions, after giving effect to the allocation of management fee expense, other fund expenses and general partner carried interest (both distributed and unrealized). MOIC calculations exclude capital not subject to fees and/or carried interest, including general partner and general partner affiliate capital. MOICs are calculated at the fund level and do not reflect MOICs at the individual investor level. (9) Gross internal rate of return ("IRR") represents annualized money-weighted return on invested capital based upon total value of limited partner contributions, that is limited partner realized distributions and limited partner unrealized NAV (based upon fair value of unrealized investments), without giving effect to the allocation of management fee expense, other fund expenses and general partner carried interest (both distributed and unrealized). Gross IRR is calculated from the date of the first capital call from limited partners (and therefore taking into account the use of any credit facility at the fund level) through the date of limited partner distributions for realized investments. For funds with unrealized investments, gross IRR uses a liquidating distribution equal to the limited partners' portion of the fair value of unrealized investments, net of outstanding amounts funded through the fund's credit facility, if any. Gross IRR is calculated at the fund level and does not reflect gross IRR of any individual investor due to timing of investor level inflows and outflows, among other factors. Net IRR is gross IRR after giving effect to the allocation of management fee expense, other fund expenses and general partner carried interest (both distributed and unrealized). Net IRR is calculated at the total fee-paying limited partner level and based upon the timing and amount of fee-paying third party limited partner inflows and outflows, and excludes capital not subject to fees and/or carried interest, including the portion of capital attributable to the general partner and general partner affiliate. As fees may vary by individual investor, net IRR does not represent the return of any individual investor. With respect to funds that have utilized borrowings from a credit facility to fund portfolio investments, organization expenses, partnership expenses, management fees, or other amounts in lieu of calling capital from limited partners for such purposes, gross and net IRR of the fund differs from what the IRR would have been if such borrowings or financings had not been utilized. Because IRR is calculated based on the actual dates of capital contributions from, and distributions to, limited partners (rather than based on the timing of when investments were made, for example), the use of such borrowings and financings in lieu or in advance of calling capital delays capital contributions from limited partners, generally resulting in higher IRRs than if such borrowings or financings had not been utilized and capital was called earlier from limited partners.. (10) Our funds generally permit us to recycle certain capital distributed to limited partners during certain time periods. The exclusion of recycled capital generally causes invested and realized amounts to be lower and MOICs to be higher than had recycled capital been included. FUND PERFORMANCE
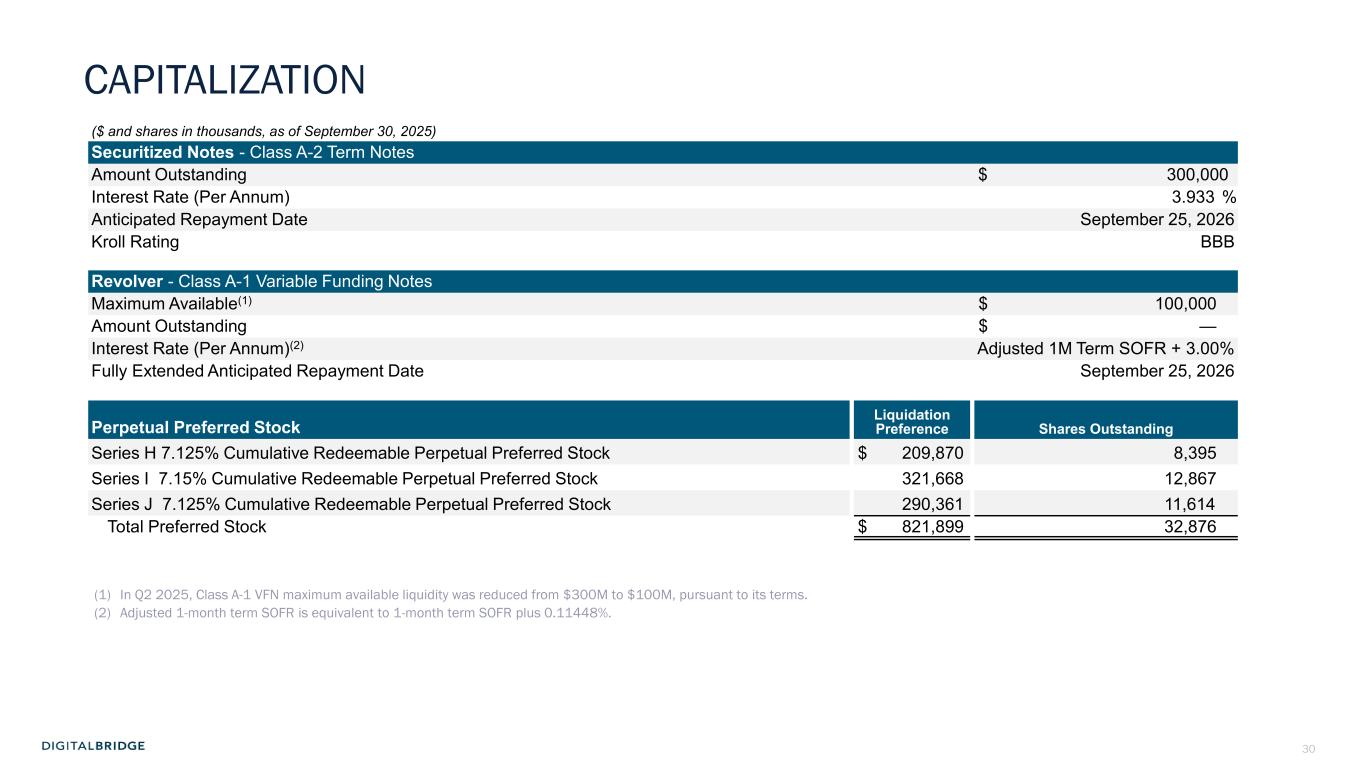
30 R:11 G:35 B:65 R:1 G:52 B:75 R:0 G:87 B:122 R:0 G:126 B:92 R:0 G:152 B:99 R:34 G:208 B:129 R:167 G:169 B:180 R:208 G:209 B:219 R:73 G:82 B:82 R:91 G:103 B:113 ($ and shares in thousands, as of September 30, 2025) Securitized Notes - Class A-2 Term Notes Amount Outstanding $ 300,000 Interest Rate (Per Annum) 3.933 % Anticipated Repayment Date September 25, 2026 Kroll Rating BBB Revolver - Class A-1 Variable Funding Notes Maximum Available(1) $ 100,000 Amount Outstanding $ — Interest Rate (Per Annum)(2) Adjusted 1M Term SOFR + 3.00% Fully Extended Anticipated Repayment Date September 25, 2026 Liquidation Preference Shares OutstandingPerpetual Preferred Stock Series H 7.125% Cumulative Redeemable Perpetual Preferred Stock $ 209,870 8,395 Series I 7.15% Cumulative Redeemable Perpetual Preferred Stock 321,668 12,867 Series J 7.125% Cumulative Redeemable Perpetual Preferred Stock 290,361 11,614 Total Preferred Stock $ 821,899 32,876 (1) In Q2 2025, Class A-1 VFN maximum available liquidity was reduced from $300M to $100M, pursuant to its terms. (2) Adjusted 1-month term SOFR is equivalent to 1-month term SOFR plus 0.11448%. CAPITALIZATION
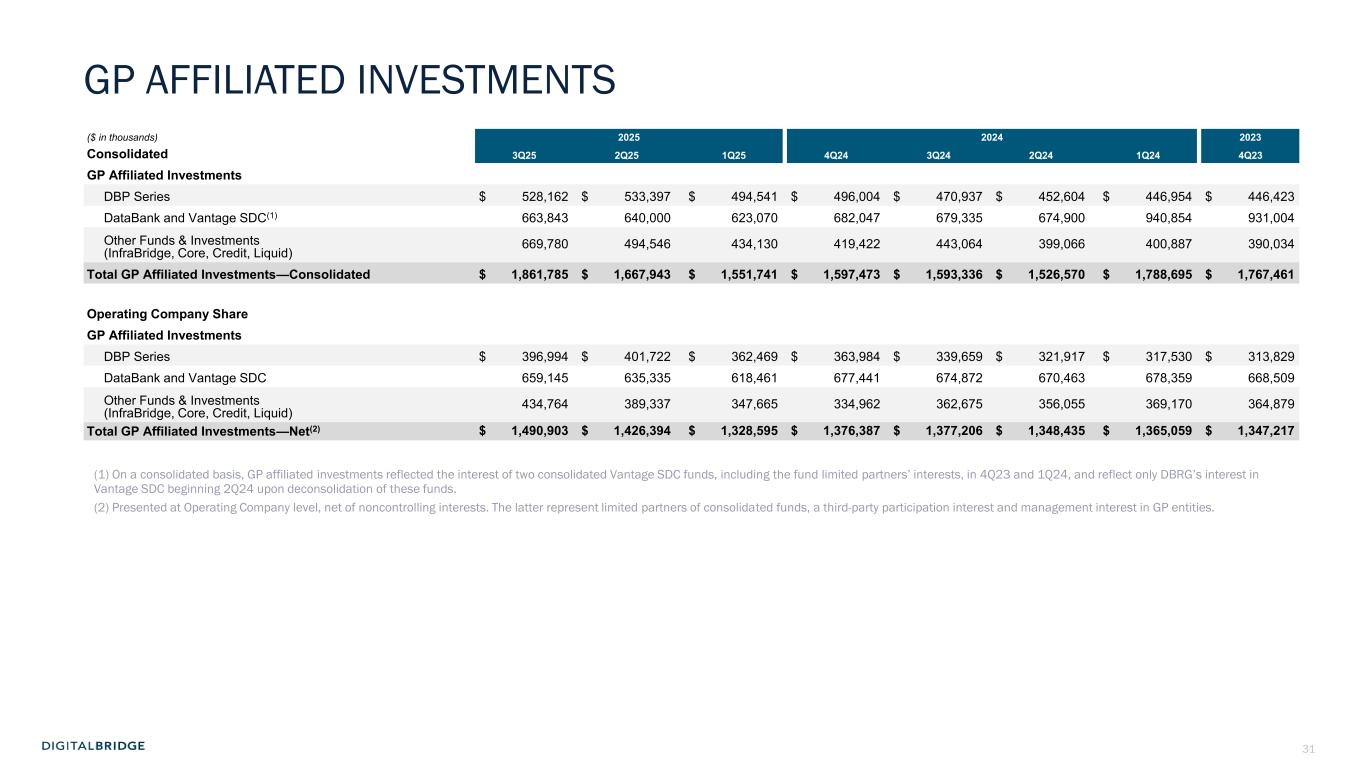
31 R:11 G:35 B:65 R:1 G:52 B:75 R:0 G:87 B:122 R:0 G:126 B:92 R:0 G:152 B:99 R:34 G:208 B:129 R:167 G:169 B:180 R:208 G:209 B:219 R:73 G:82 B:82 R:91 G:103 B:113 ($ in thousands) 2025 2024 2023 Consolidated 3Q25 2Q25 1Q25 4Q24 3Q24 2Q24 1Q24 4Q23 GP Affiliated Investments DBP Series $ 528,162 $ 533,397 $ 494,541 $ 496,004 $ 470,937 $ 452,604 $ 446,954 $ 446,423 DataBank and Vantage SDC(1) 663,843 640,000 623,070 682,047 679,335 674,900 940,854 931,004 Other Funds & Investments (InfraBridge, Core, Credit, Liquid) 669,780 494,546 434,130 419,422 443,064 399,066 400,887 390,034 Total GP Affiliated Investments—Consolidated $ 1,861,785 $ 1,667,943 $ 1,551,741 $ 1,597,473 $ 1,593,336 $ 1,526,570 $ 1,788,695 $ 1,767,461 Operating Company Share GP Affiliated Investments DBP Series $ 396,994 $ 401,722 $ 362,469 $ 363,984 $ 339,659 $ 321,917 $ 317,530 $ 313,829 DataBank and Vantage SDC 659,145 635,335 618,461 677,441 674,872 670,463 678,359 668,509 Other Funds & Investments (InfraBridge, Core, Credit, Liquid) 434,764 389,337 347,665 334,962 362,675 356,055 369,170 364,879 Total GP Affiliated Investments—Net(2) $ 1,490,903 $ 1,426,394 $ 1,328,595 $ 1,376,387 $ 1,377,206 $ 1,348,435 $ 1,365,059 $ 1,347,217 GP AFFILIATED INVESTMENTS (1) On a consolidated basis, GP affiliated investments reflected the interest of two consolidated Vantage SDC funds, including the fund limited partners’ interests, in 4Q23 and 1Q24, and reflect only DBRG’s interest in Vantage SDC beginning 2Q24 upon deconsolidation of these funds. (2) Presented at Operating Company level, net of noncontrolling interests. The latter represent limited partners of consolidated funds, a third-party participation interest and management interest in GP entities.
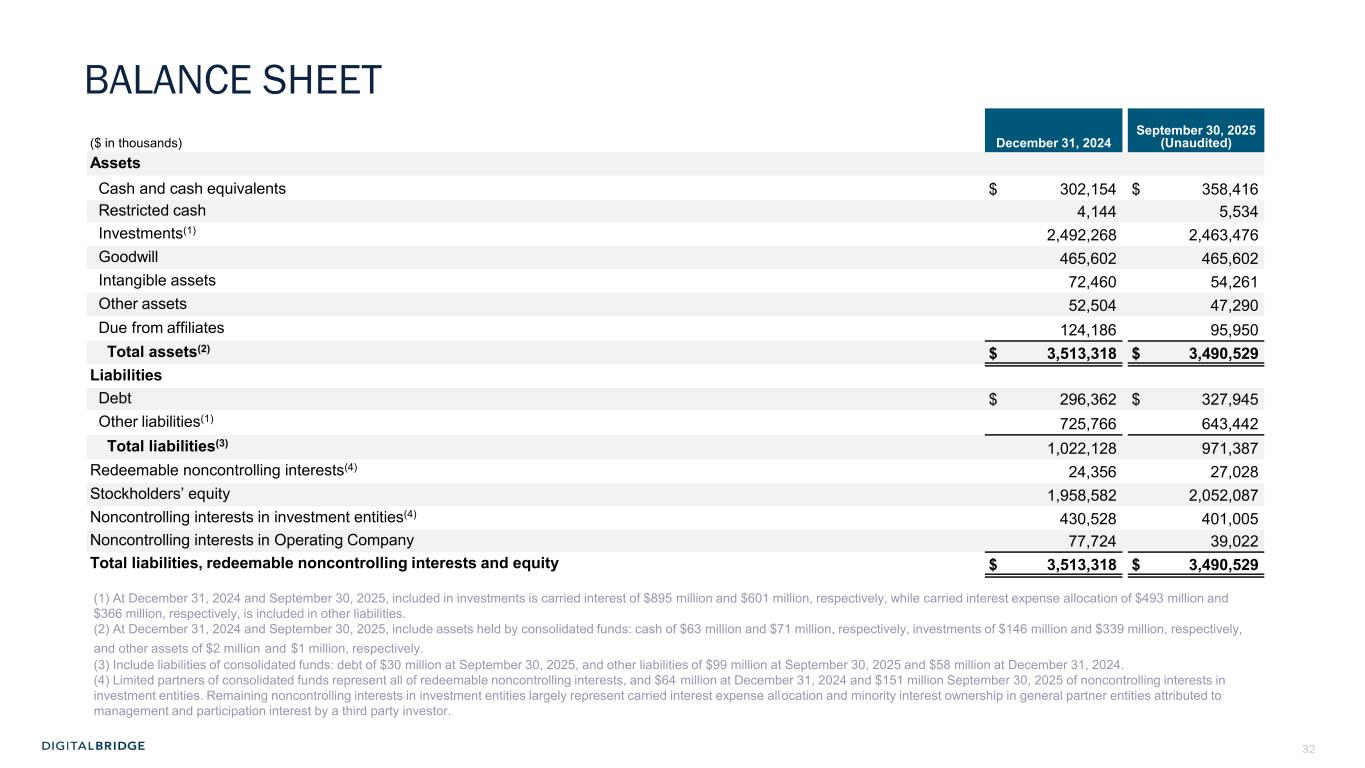
32 R:11 G:35 B:65 R:1 G:52 B:75 R:0 G:87 B:122 R:0 G:126 B:92 R:0 G:152 B:99 R:34 G:208 B:129 R:167 G:169 B:180 R:208 G:209 B:219 R:73 G:82 B:82 R:91 G:103 B:113 ($ in thousands) December 31, 2024 September 30, 2025 (Unaudited) Assets Cash and cash equivalents $ 302,154 $ 358,416 Restricted cash 4,144 5,534 Investments(1) 2,492,268 2,463,476 Goodwill 465,602 465,602 Intangible assets 72,460 54,261 Other assets 52,504 47,290 Due from affiliates 124,186 95,950 Total assets(2) $ 3,513,318 $ 3,490,529 Liabilities Debt $ 296,362 $ 327,945 Other liabilities(1) 725,766 643,442 Total liabilities(3) 1,022,128 971,387 Redeemable noncontrolling interests(4) 24,356 27,028 Stockholders’ equity 1,958,582 2,052,087 Noncontrolling interests in investment entities(4) 430,528 401,005 Noncontrolling interests in Operating Company 77,724 39,022 Total liabilities, redeemable noncontrolling interests and equity $ 3,513,318 $ 3,490,529 (1) At December 31, 2024 and September 30, 2025, included in investments is carried interest of $895 million and $601 million, respectively, while carried interest expense allocation of $493 million and $366 million, respectively, is included in other liabilities. (2) At December 31, 2024 and September 30, 2025, include assets held by consolidated funds: cash of $63 million and $71 million, respectively, investments of $146 million and $339 million, respectively, and other assets of $2 million and $1 million, respectively. (3) Include liabilities of consolidated funds: debt of $30 million at September 30, 2025, and other liabilities of $99 million at September 30, 2025 and $58 million at December 31, 2024. (4) Limited partners of consolidated funds represent all of redeemable noncontrolling interests, and $64 million at December 31, 2024 and $151 million September 30, 2025 of noncontrolling interests in investment entities. Remaining noncontrolling interests in investment entities largely represent carried interest expense allocation and minority interest ownership in general partner entities attributed to management and participation interest by a third party investor. BALANCE SHEET
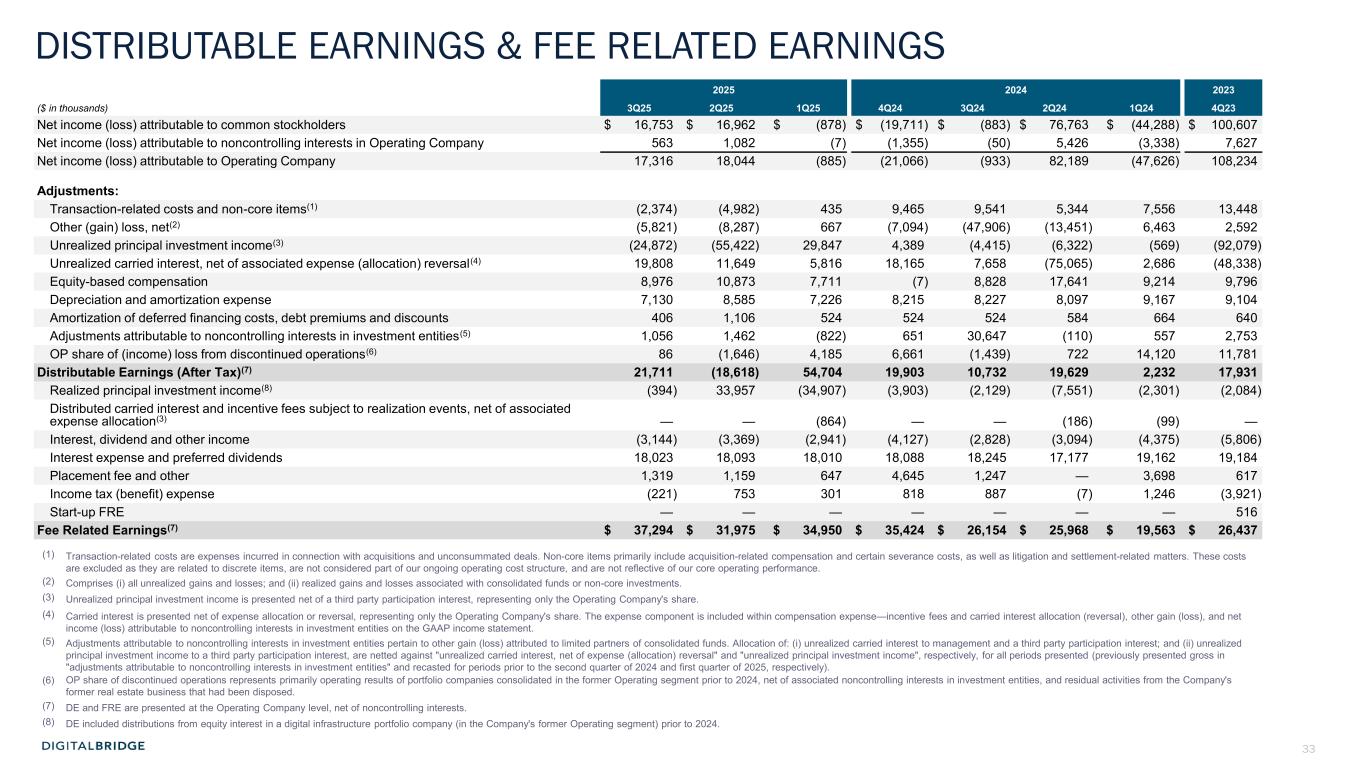
33 R:11 G:35 B:65 R:1 G:52 B:75 R:0 G:87 B:122 R:0 G:126 B:92 R:0 G:152 B:99 R:34 G:208 B:129 R:167 G:169 B:180 R:208 G:209 B:219 R:73 G:82 B:82 R:91 G:103 B:113 2025 2024 2023 ($ in thousands) 3Q25 2Q25 1Q25 4Q24 3Q24 2Q24 1Q24 4Q23 Net income (loss) attributable to common stockholders $ 16,753 $ 16,962 $ (878) $ (19,711) $ (883) $ 76,763 $ (44,288) $ 100,607 Net income (loss) attributable to noncontrolling interests in Operating Company 563 1,082 (7) (1,355) (50) 5,426 (3,338) 7,627 Net income (loss) attributable to Operating Company 17,316 18,044 (885) (21,066) (933) 82,189 (47,626) 108,234 Adjustments: Transaction-related costs and non-core items(1) (2,374) (4,982) 435 9,465 9,541 5,344 7,556 13,448 Other (gain) loss, net(2) (5,821) (8,287) 667 (7,094) (47,906) (13,451) 6,463 2,592 Unrealized principal investment income(3) (24,872) (55,422) 29,847 4,389 (4,415) (6,322) (569) (92,079) Unrealized carried interest, net of associated expense (allocation) reversal(4) 19,808 11,649 5,816 18,165 7,658 (75,065) 2,686 (48,338) Equity-based compensation 8,976 10,873 7,711 (7) 8,828 17,641 9,214 9,796 Depreciation and amortization expense 7,130 8,585 7,226 8,215 8,227 8,097 9,167 9,104 Amortization of deferred financing costs, debt premiums and discounts 406 1,106 524 524 524 584 664 640 Adjustments attributable to noncontrolling interests in investment entities(5) 1,056 1,462 (822) 651 30,647 (110) 557 2,753 OP share of (income) loss from discontinued operations(6) 86 (1,646) 4,185 6,661 (1,439) 722 14,120 11,781 Distributable Earnings (After Tax)(7) 21,711 (18,618) 54,704 19,903 10,732 19,629 2,232 17,931 Realized principal investment income(8) (394) 33,957 (34,907) (3,903) (2,129) (7,551) (2,301) (2,084) Distributed carried interest and incentive fees subject to realization events, net of associated expense allocation(3) — — (864) — — (186) (99) — Interest, dividend and other income (3,144) (3,369) (2,941) (4,127) (2,828) (3,094) (4,375) (5,806) Interest expense and preferred dividends 18,023 18,093 18,010 18,088 18,245 17,177 19,162 19,184 Placement fee and other 1,319 1,159 647 4,645 1,247 — 3,698 617 Income tax (benefit) expense (221) 753 301 818 887 (7) 1,246 (3,921) Start-up FRE — — — — — — — 516 Fee Related Earnings(7) $ 37,294 $ 31,975 $ 34,950 $ 35,424 $ 26,154 $ 25,968 $ 19,563 $ 26,437 (1) Transaction-related costs are expenses incurred in connection with acquisitions and unconsummated deals. Non-core items primarily include acquisition-related compensation and certain severance costs, as well as litigation and settlement-related matters. These costs are excluded as they are related to discrete items, are not considered part of our ongoing operating cost structure, and are not reflective of our core operating performance. (2) Comprises (i) all unrealized gains and losses; and (ii) realized gains and losses associated with consolidated funds or non-core investments. (3) Unrealized principal investment income is presented net of a third party participation interest, representing only the Operating Company's share. (4) Carried interest is presented net of expense allocation or reversal, representing only the Operating Company's share. The expense component is included within compensation expense—incentive fees and carried interest allocation (reversal), other gain (loss), and net income (loss) attributable to noncontrolling interests in investment entities on the GAAP income statement. (5) Adjustments attributable to noncontrolling interests in investment entities pertain to other gain (loss) attributed to limited partners of consolidated funds. Allocation of: (i) unrealized carried interest to management and a third party participation interest; and (ii) unrealized principal investment income to a third party participation interest, are netted against "unrealized carried interest, net of expense (allocation) reversal" and "unrealized principal investment income", respectively, for all periods presented (previously presented gross in "adjustments attributable to noncontrolling interests in investment entities" and recasted for periods prior to the second quarter of 2024 and first quarter of 2025, respectively). (6) OP share of discontinued operations represents primarily operating results of portfolio companies consolidated in the former Operating segment prior to 2024, net of associated noncontrolling interests in investment entities, and residual activities from the Company's former real estate business that had been disposed. (7) DE and FRE are presented at the Operating Company level, net of noncontrolling interests. (8) DE included distributions from equity interest in a digital infrastructure portfolio company (in the Company's former Operating segment) prior to 2024. DISTRIBUTABLE EARNINGS & FEE RELATED EARNINGS
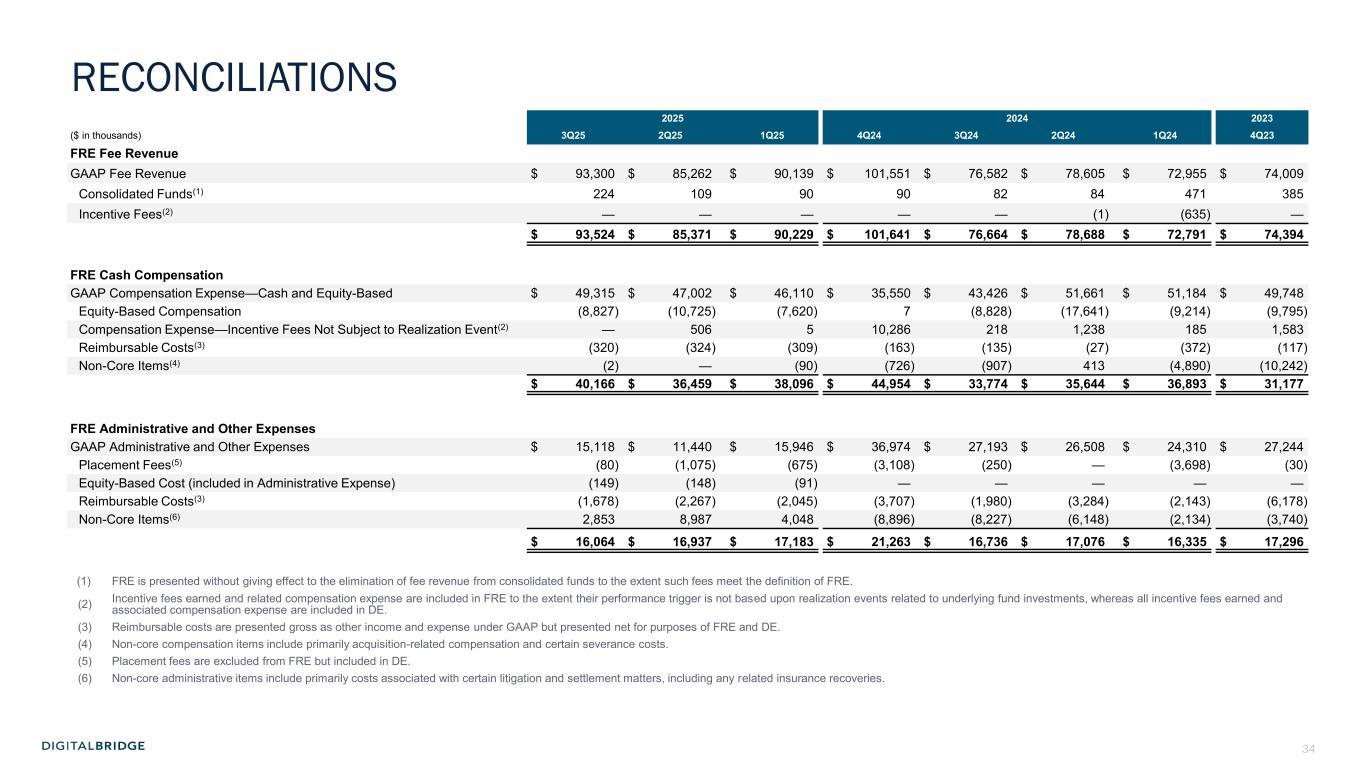
34 R:11 G:35 B:65 R:1 G:52 B:75 R:0 G:87 B:122 R:0 G:126 B:92 R:0 G:152 B:99 R:34 G:208 B:129 R:167 G:169 B:180 R:208 G:209 B:219 R:73 G:82 B:82 R:91 G:103 B:113 2025 2024 2023 ($ in thousands) 3Q25 2Q25 1Q25 4Q24 3Q24 2Q24 1Q24 4Q23 FRE Fee Revenue GAAP Fee Revenue $ 93,300 $ 85,262 $ 90,139 $ 101,551 $ 76,582 $ 78,605 $ 72,955 $ 74,009 Consolidated Funds(1) 224 109 90 90 82 84 471 385 Incentive Fees(2) — — — — — (1) (635) — $ 93,524 $ 85,371 $ 90,229 $ 101,641 $ 76,664 $ 78,688 $ 72,791 $ 74,394 FRE Cash Compensation GAAP Compensation Expense—Cash and Equity-Based $ 49,315 $ 47,002 $ 46,110 $ 35,550 $ 43,426 $ 51,661 $ 51,184 $ 49,748 Equity-Based Compensation (8,827) (10,725) (7,620) 7 (8,828) (17,641) (9,214) (9,795) Compensation Expense—Incentive Fees Not Subject to Realization Event(2) — 506 5 10,286 218 1,238 185 1,583 Reimbursable Costs(3) (320) (324) (309) (163) (135) (27) (372) (117) Non-Core Items(4) (2) — (90) (726) (907) 413 (4,890) (10,242) $ 40,166 $ 36,459 $ 38,096 $ 44,954 $ 33,774 $ 35,644 $ 36,893 $ 31,177 FRE Administrative and Other Expenses GAAP Administrative and Other Expenses $ 15,118 $ 11,440 $ 15,946 $ 36,974 $ 27,193 $ 26,508 $ 24,310 $ 27,244 Placement Fees(5) (80) (1,075) (675) (3,108) (250) — (3,698) (30) Equity-Based Cost (included in Administrative Expense) (149) (148) (91) — — — — — Reimbursable Costs(3) (1,678) (2,267) (2,045) (3,707) (1,980) (3,284) (2,143) (6,178) Non-Core Items(6) 2,853 8,987 4,048 (8,896) (8,227) (6,148) (2,134) (3,740) $ 16,064 $ 16,937 $ 17,183 $ 21,263 $ 16,736 $ 17,076 $ 16,335 $ 17,296 (1) FRE is presented without giving effect to the elimination of fee revenue from consolidated funds to the extent such fees meet the definition of FRE. (2) Incentive fees earned and related compensation expense are included in FRE to the extent their performance trigger is not based upon realization events related to underlying fund investments, whereas all incentive fees earned and associated compensation expense are included in DE. (3) Reimbursable costs are presented gross as other income and expense under GAAP but presented net for purposes of FRE and DE. (4) Non-core compensation items include primarily acquisition-related compensation and certain severance costs. (5) Placement fees are excluded from FRE but included in DE. (6) Non-core administrative items include primarily costs associated with certain litigation and settlement matters, including any related insurance recoveries. RECONCILIATIONS
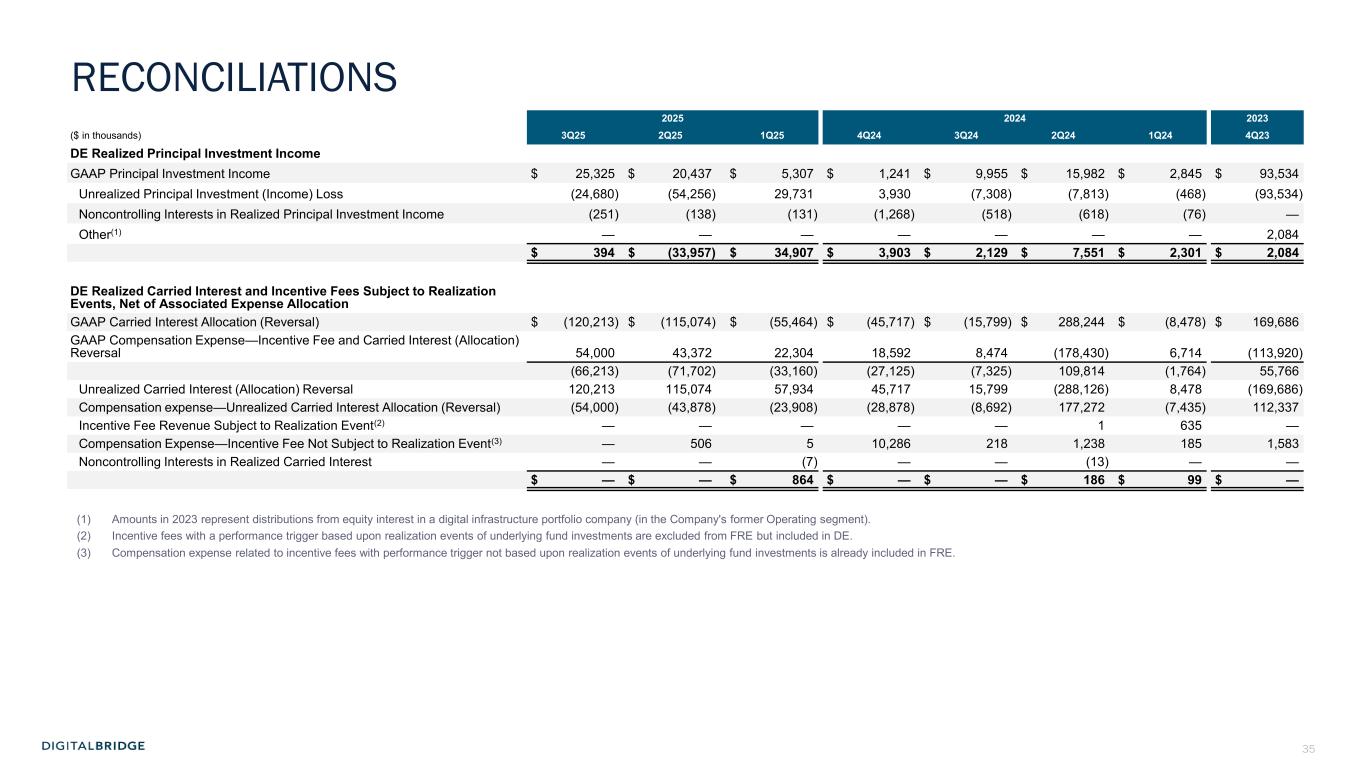
35 R:11 G:35 B:65 R:1 G:52 B:75 R:0 G:87 B:122 R:0 G:126 B:92 R:0 G:152 B:99 R:34 G:208 B:129 R:167 G:169 B:180 R:208 G:209 B:219 R:73 G:82 B:82 R:91 G:103 B:113 2025 2024 2023 ($ in thousands) 3Q25 2Q25 1Q25 4Q24 3Q24 2Q24 1Q24 4Q23 DE Realized Principal Investment Income GAAP Principal Investment Income $ 25,325 $ 20,437 $ 5,307 $ 1,241 $ 9,955 $ 15,982 $ 2,845 $ 93,534 Unrealized Principal Investment (Income) Loss (24,680) (54,256) 29,731 3,930 (7,308) (7,813) (468) (93,534) Noncontrolling Interests in Realized Principal Investment Income (251) (138) (131) (1,268) (518) (618) (76) — Other(1) — — — — — — — 2,084 $ 394 $ (33,957) $ 34,907 $ 3,903 $ 2,129 $ 7,551 $ 2,301 $ 2,084 DE Realized Carried Interest and Incentive Fees Subject to Realization Events, Net of Associated Expense Allocation GAAP Carried Interest Allocation (Reversal) $ (120,213) $ (115,074) $ (55,464) $ (45,717) $ (15,799) $ 288,244 $ (8,478) $ 169,686 GAAP Compensation Expense—Incentive Fee and Carried Interest (Allocation) Reversal 54,000 43,372 22,304 18,592 8,474 (178,430) 6,714 (113,920) (66,213) (71,702) (33,160) (27,125) (7,325) 109,814 (1,764) 55,766 Unrealized Carried Interest (Allocation) Reversal 120,213 115,074 57,934 45,717 15,799 (288,126) 8,478 (169,686) Compensation expense—Unrealized Carried Interest Allocation (Reversal) (54,000) (43,878) (23,908) (28,878) (8,692) 177,272 (7,435) 112,337 Incentive Fee Revenue Subject to Realization Event(2) — — — — — 1 635 — Compensation Expense—Incentive Fee Not Subject to Realization Event(3) — 506 5 10,286 218 1,238 185 1,583 Noncontrolling Interests in Realized Carried Interest — — (7) — — (13) — — $ — $ — $ 864 $ — $ — $ 186 $ 99 $ — (1) Amounts in 2023 represent distributions from equity interest in a digital infrastructure portfolio company (in the Company's former Operating segment). (2) Incentive fees with a performance trigger based upon realization events of underlying fund investments are excluded from FRE but included in DE. (3) Compensation expense related to incentive fees with performance trigger not based upon realization events of underlying fund investments is already included in FRE. RECONCILIATIONS
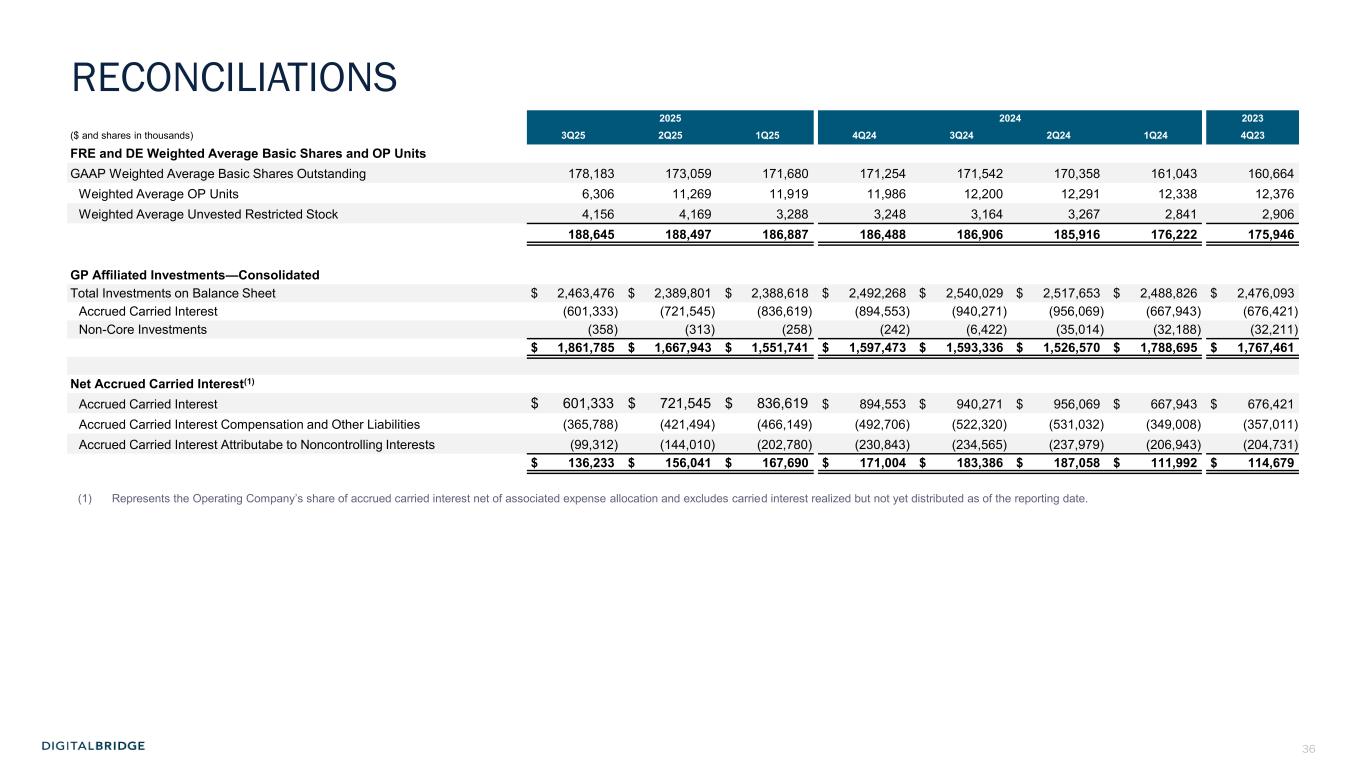
36 R:11 G:35 B:65 R:1 G:52 B:75 R:0 G:87 B:122 R:0 G:126 B:92 R:0 G:152 B:99 R:34 G:208 B:129 R:167 G:169 B:180 R:208 G:209 B:219 R:73 G:82 B:82 R:91 G:103 B:113 2025 2024 2023 ($ and shares in thousands) 3Q25 2Q25 1Q25 4Q24 3Q24 2Q24 1Q24 4Q23 FRE and DE Weighted Average Basic Shares and OP Units GAAP Weighted Average Basic Shares Outstanding 178,183 173,059 171,680 171,254 171,542 170,358 161,043 160,664 Weighted Average OP Units 6,306 11,269 11,919 11,986 12,200 12,291 12,338 12,376 Weighted Average Unvested Restricted Stock 4,156 4,169 3,288 3,248 3,164 3,267 2,841 2,906 188,645 188,497 186,887 186,488 186,906 185,916 176,222 175,946 GP Affiliated Investments—Consolidated Total Investments on Balance Sheet $ 2,463,476 $ 2,389,801 $ 2,388,618 $ 2,492,268 $ 2,540,029 $ 2,517,653 $ 2,488,826 $ 2,476,093 Accrued Carried Interest (601,333) (721,545) (836,619) (894,553) (940,271) (956,069) (667,943) (676,421) Non-Core Investments (358) (313) (258) (242) (6,422) (35,014) (32,188) (32,211) $ 1,861,785 $ 1,667,943 $ 1,551,741 $ 1,597,473 $ 1,593,336 $ 1,526,570 $ 1,788,695 $ 1,767,461 Net Accrued Carried Interest(1) Accrued Carried Interest $ 601,333 $ 721,545 $ 836,619 $ 894,553 $ 940,271 $ 956,069 $ 667,943 $ 676,421 Accrued Carried Interest Compensation and Other Liabilities (365,788) (421,494) (466,149) (492,706) (522,320) (531,032) (349,008) (357,011) Accrued Carried Interest Attributabe to Noncontrolling Interests (99,312) (144,010) (202,780) (230,843) (234,565) (237,979) (206,943) (204,731) $ 136,233 $ 156,041 $ 167,690 $ 171,004 $ 183,386 $ 187,058 $ 111,992 $ 114,679 (1) Represents the Operating Company’s share of accrued carried interest net of associated expense allocation and excludes carried interest realized but not yet distributed as of the reporting date. RECONCILIATIONS

37 R:11 G:35 B:65 R:1 G:52 B:75 R:0 G:87 B:122 R:0 G:126 B:92 R:0 G:152 B:99 R:34 G:208 B:129 R:167 G:169 B:180 R:208 G:209 B:219 R:73 G:82 B:82 R:91 G:103 B:113 6 APPENDIX
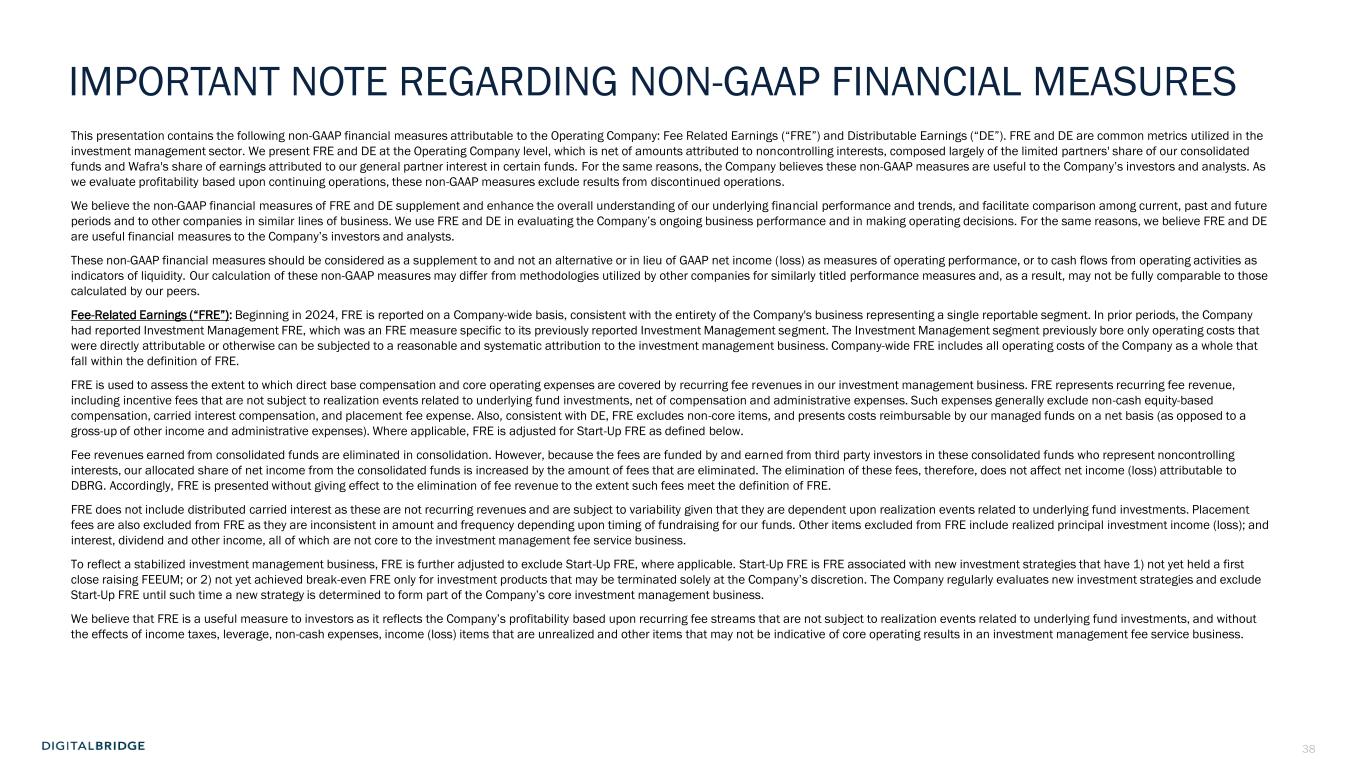
38 R:11 G:35 B:65 R:1 G:52 B:75 R:0 G:87 B:122 R:0 G:126 B:92 R:0 G:152 B:99 R:34 G:208 B:129 R:167 G:169 B:180 R:208 G:209 B:219 R:73 G:82 B:82 R:91 G:103 B:113 This presentation contains the following non-GAAP financial measures attributable to the Operating Company: Fee Related Earnings (“FRE”) and Distributable Earnings (“DE”). FRE and DE are common metrics utilized in the investment management sector. We present FRE and DE at the Operating Company level, which is net of amounts attributed to noncontrolling interests, composed largely of the limited partners' share of our consolidated funds and Wafra's share of earnings attributed to our general partner interest in certain funds. For the same reasons, the Company believes these non-GAAP measures are useful to the Company’s investors and analysts. As we evaluate profitability based upon continuing operations, these non-GAAP measures exclude results from discontinued operations. We believe the non-GAAP financial measures of FRE and DE supplement and enhance the overall understanding of our underlying financial performance and trends, and facilitate comparison among current, past and future periods and to other companies in similar lines of business. We use FRE and DE in evaluating the Company’s ongoing business performance and in making operating decisions. For the same reasons, we believe FRE and DE are useful financial measures to the Company’s investors and analysts. These non-GAAP financial measures should be considered as a supplement to and not an alternative or in lieu of GAAP net income (loss) as measures of operating performance, or to cash flows from operating activities as indicators of liquidity. Our calculation of these non-GAAP measures may differ from methodologies utilized by other companies for similarly titled performance measures and, as a result, may not be fully comparable to those calculated by our peers. Fee-Related Earnings (“FRE”): Beginning in 2024, FRE is reported on a Company-wide basis, consistent with the entirety of the Company's business representing a single reportable segment. In prior periods, the Company had reported Investment Management FRE, which was an FRE measure specific to its previously reported Investment Management segment. The Investment Management segment previously bore only operating costs that were directly attributable or otherwise can be subjected to a reasonable and systematic attribution to the investment management business. Company-wide FRE includes all operating costs of the Company as a whole that fall within the definition of FRE. FRE is used to assess the extent to which direct base compensation and core operating expenses are covered by recurring fee revenues in our investment management business. FRE represents recurring fee revenue, including incentive fees that are not subject to realization events related to underlying fund investments, net of compensation and administrative expenses. Such expenses generally exclude non-cash equity-based compensation, carried interest compensation, and placement fee expense. Also, consistent with DE, FRE excludes non-core items, and presents costs reimbursable by our managed funds on a net basis (as opposed to a gross-up of other income and administrative expenses). Where applicable, FRE is adjusted for Start-Up FRE as defined below. Fee revenues earned from consolidated funds are eliminated in consolidation. However, because the fees are funded by and earned from third party investors in these consolidated funds who represent noncontrolling interests, our allocated share of net income from the consolidated funds is increased by the amount of fees that are eliminated. The elimination of these fees, therefore, does not affect net income (loss) attributable to DBRG. Accordingly, FRE is presented without giving effect to the elimination of fee revenue to the extent such fees meet the definition of FRE. FRE does not include distributed carried interest as these are not recurring revenues and are subject to variability given that they are dependent upon realization events related to underlying fund investments. Placement fees are also excluded from FRE as they are inconsistent in amount and frequency depending upon timing of fundraising for our funds. Other items excluded from FRE include realized principal investment income (loss); and interest, dividend and other income, all of which are not core to the investment management fee service business. To reflect a stabilized investment management business, FRE is further adjusted to exclude Start-Up FRE, where applicable. Start-Up FRE is FRE associated with new investment strategies that have 1) not yet held a first close raising FEEUM; or 2) not yet achieved break-even FRE only for investment products that may be terminated solely at the Company’s discretion. The Company regularly evaluates new investment strategies and exclude Start-Up FRE until such time a new strategy is determined to form part of the Company’s core investment management business. We believe that FRE is a useful measure to investors as it reflects the Company’s profitability based upon recurring fee streams that are not subject to realization events related to underlying fund investments, and without the effects of income taxes, leverage, non-cash expenses, income (loss) items that are unrealized and other items that may not be indicative of core operating results in an investment management fee service business. IMPORTANT NOTE REGARDING NON-GAAP FINANCIAL MEASURES
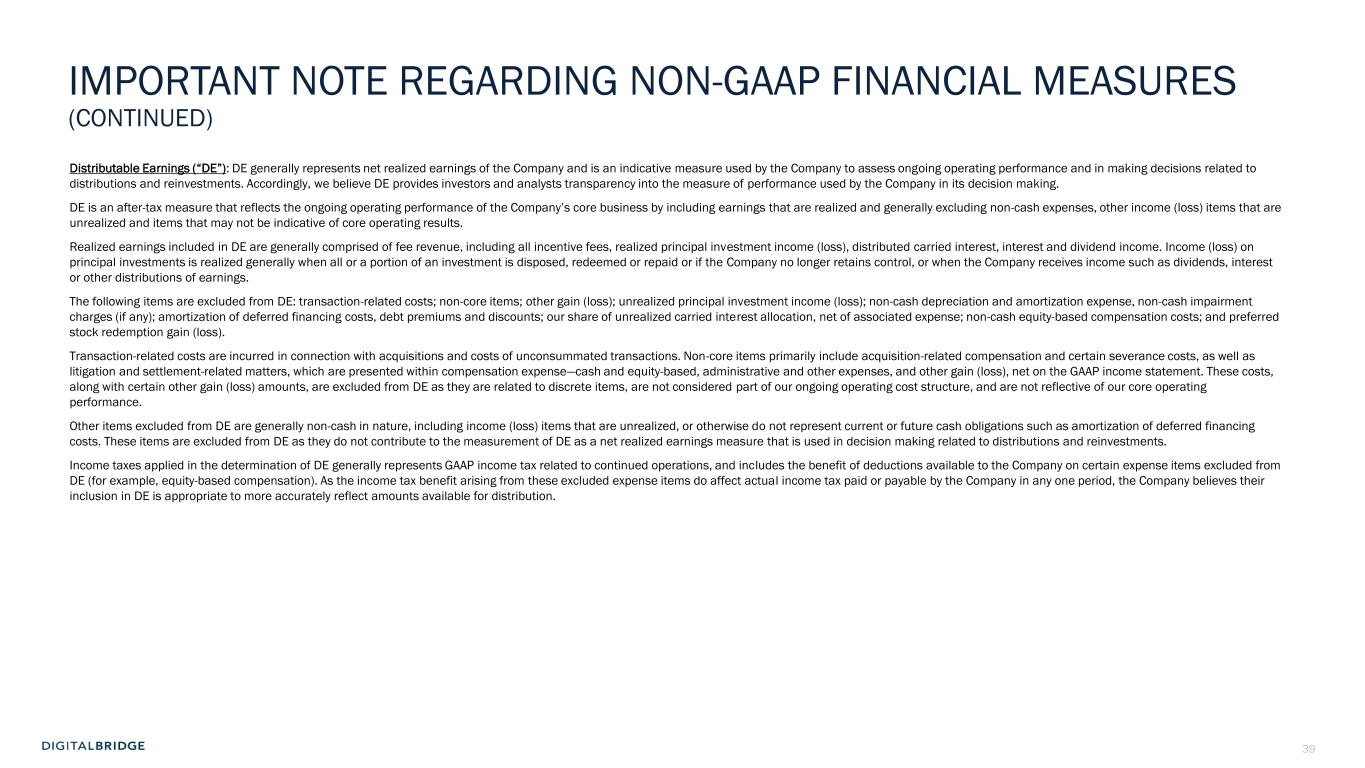
39 R:11 G:35 B:65 R:1 G:52 B:75 R:0 G:87 B:122 R:0 G:126 B:92 R:0 G:152 B:99 R:34 G:208 B:129 R:167 G:169 B:180 R:208 G:209 B:219 R:73 G:82 B:82 R:91 G:103 B:113 Distributable Earnings (“DE”): DE generally represents net realized earnings of the Company and is an indicative measure used by the Company to assess ongoing operating performance and in making decisions related to distributions and reinvestments. Accordingly, we believe DE provides investors and analysts transparency into the measure of performance used by the Company in its decision making. DE is an after-tax measure that reflects the ongoing operating performance of the Company’s core business by including earnings that are realized and generally excluding non-cash expenses, other income (loss) items that are unrealized and items that may not be indicative of core operating results. Realized earnings included in DE are generally comprised of fee revenue, including all incentive fees, realized principal investment income (loss), distributed carried interest, interest and dividend income. Income (loss) on principal investments is realized generally when all or a portion of an investment is disposed, redeemed or repaid or if the Company no longer retains control, or when the Company receives income such as dividends, interest or other distributions of earnings. The following items are excluded from DE: transaction-related costs; non-core items; other gain (loss); unrealized principal investment income (loss); non-cash depreciation and amortization expense, non-cash impairment charges (if any); amortization of deferred financing costs, debt premiums and discounts; our share of unrealized carried interest allocation, net of associated expense; non-cash equity-based compensation costs; and preferred stock redemption gain (loss). Transaction-related costs are incurred in connection with acquisitions and costs of unconsummated transactions. Non-core items primarily include acquisition-related compensation and certain severance costs, as well as litigation and settlement-related matters, which are presented within compensation expense—cash and equity-based, administrative and other expenses, and other gain (loss), net on the GAAP income statement. These costs, along with certain other gain (loss) amounts, are excluded from DE as they are related to discrete items, are not considered part of our ongoing operating cost structure, and are not reflective of our core operating performance. Other items excluded from DE are generally non-cash in nature, including income (loss) items that are unrealized, or otherwise do not represent current or future cash obligations such as amortization of deferred financing costs. These items are excluded from DE as they do not contribute to the measurement of DE as a net realized earnings measure that is used in decision making related to distributions and reinvestments. Income taxes applied in the determination of DE generally represents GAAP income tax related to continued operations, and includes the benefit of deductions available to the Company on certain expense items excluded from DE (for example, equity-based compensation). As the income tax benefit arising from these excluded expense items do affect actual income tax paid or payable by the Company in any one period, the Company believes their inclusion in DE is appropriate to more accurately reflect amounts available for distribution. IMPORTANT NOTE REGARDING NON-GAAP FINANCIAL MEASURES (CONTINUED)
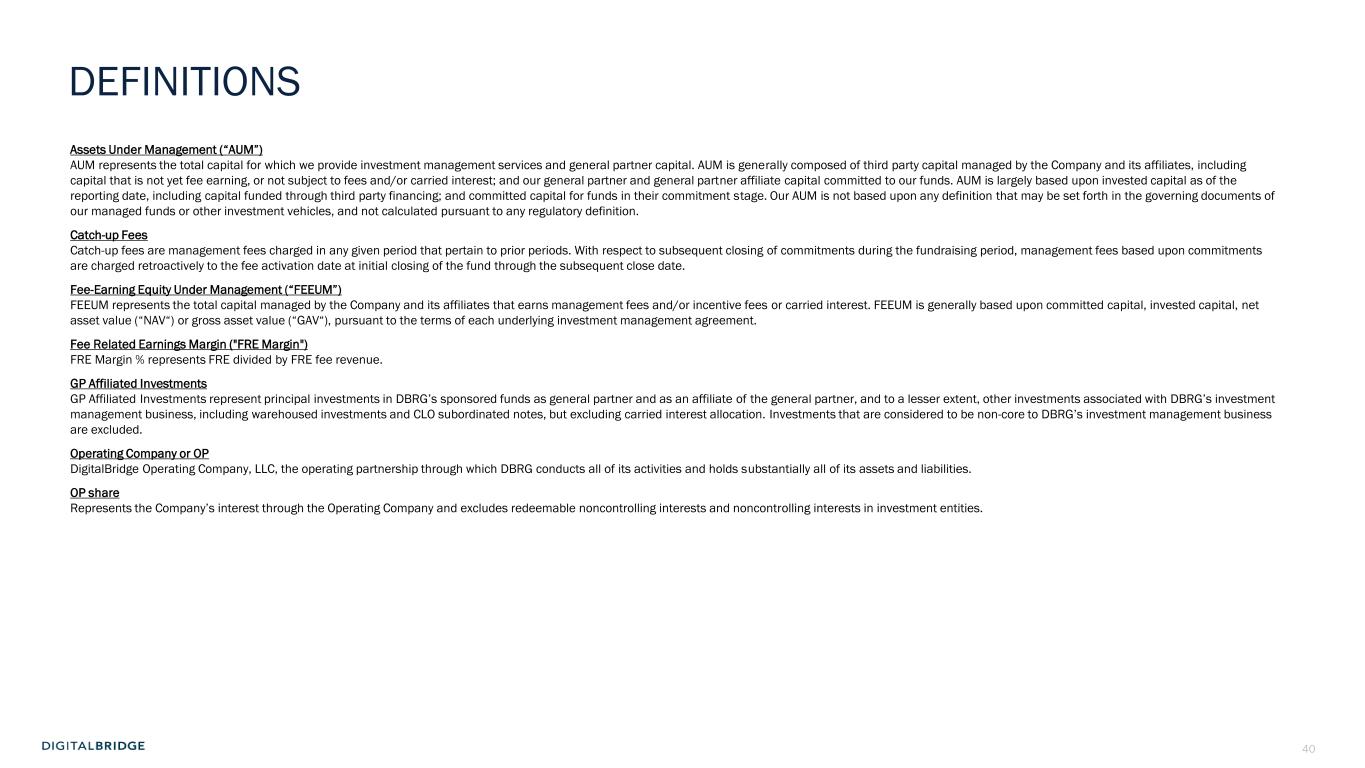
40 R:11 G:35 B:65 R:1 G:52 B:75 R:0 G:87 B:122 R:0 G:126 B:92 R:0 G:152 B:99 R:34 G:208 B:129 R:167 G:169 B:180 R:208 G:209 B:219 R:73 G:82 B:82 R:91 G:103 B:113 Assets Under Management (“AUM”) AUM represents the total capital for which we provide investment management services and general partner capital. AUM is generally composed of third party capital managed by the Company and its affiliates, including capital that is not yet fee earning, or not subject to fees and/or carried interest; and our general partner and general partner affiliate capital committed to our funds. AUM is largely based upon invested capital as of the reporting date, including capital funded through third party financing; and committed capital for funds in their commitment stage. Our AUM is not based upon any definition that may be set forth in the governing documents of our managed funds or other investment vehicles, and not calculated pursuant to any regulatory definition. Catch-up Fees Catch-up fees are management fees charged in any given period that pertain to prior periods. With respect to subsequent closing of commitments during the fundraising period, management fees based upon commitments are charged retroactively to the fee activation date at initial closing of the fund through the subsequent close date. Fee-Earning Equity Under Management (“FEEUM”) FEEUM represents the total capital managed by the Company and its affiliates that earns management fees and/or incentive fees or carried interest. FEEUM is generally based upon committed capital, invested capital, net asset value (“NAV“) or gross asset value (“GAV“), pursuant to the terms of each underlying investment management agreement. Fee Related Earnings Margin ("FRE Margin") FRE Margin % represents FRE divided by FRE fee revenue. GP Affiliated Investments GP Affiliated Investments represent principal investments in DBRG’s sponsored funds as general partner and as an affiliate of the general partner, and to a lesser extent, other investments associated with DBRG’s investment management business, including warehoused investments and CLO subordinated notes, but excluding carried interest allocation. Investments that are considered to be non-core to DBRG’s investment management business are excluded. Operating Company or OP DigitalBridge Operating Company, LLC, the operating partnership through which DBRG conducts all of its activities and holds substantially all of its assets and liabilities. OP share Represents the Company’s interest through the Operating Company and excludes redeemable noncontrolling interests and noncontrolling interests in investment entities. DEFINITIONS

41 R:11 G:35 B:65 R:1 G:52 B:75 R:0 G:87 B:122 R:0 G:126 B:92 R:0 G:152 B:99 R:34 G:208 B:129 R:167 G:169 B:180 R:208 G:209 B:219 R:73 G:82 B:82 R:91 G:103 B:113