
.2
1 INVESTOR PRESENTATION June 2023
DISCLAIMER Forward Looking Statements: The information in this presentation includes “forward - looking statements” within the meaning of Section 27A of the Securities Act of 1933, as amended (the “Securities Act”) and Section 21E of the Securities Exchange Act of 1934, as amended (the “Exchange Act”). All statements, other than statements of historical fact included in this presentation, regarding our strate gy, future operations, financial position, estimated revenue and losses, projected costs, prospects, plans and objectives of management are forward - looking statements. When used in this presentation, the words “could,” “believe,” “anticipate,” “intend,” “estimate,” “expect,” “project” and similar expressions are intended to identify forward - looking statements, although not all forward - looking statements contain such identifying words. These forward - looking statements are based on management’s current expectations and assumptions about future events and are based on currently available information as to the outcome and timing of future events. When considering forward - looking statements, you should keep in mind the risk factors and other cautionary statements described under, but not limited to, the headings Item 1A, “Risk Factors” and “ Cautionary Note Regarding Forward - Looking Statements” included in our Annual Report on Form 10 - K for the year ended December 31, 2022, our Quarterly Report on Form 10 - Q for the period ended March 31, 2023, our form of prospectus included as part of the Registration Statement on Form S - 1/A filed with the SEC on April 7, 2023 related to the Class B common stock, and in any of our subsequent filings with the SEC. Forward - looking statements may include statements about: • risks related to the impact of the novel coronavirus (“COVID - 19”) global pandemic, such as the scope and duration of the outbreak, the health and safety of our employees, government actions and restrictive measures implemented in response, delays and cancellations of customer sales, supply chain disruptions and other impacts to the business, or our ability to execute our business continuity plans; • anticipated production levels, costs, sales volumes and revenue; • timing and ability to complete major capital projects; • economic conditions in the metallurgical coal and steel industries generally, including any near - term or long - term downturn in these industries as a result of the COVID - 19 global pandemic and related actions; • expected costs to develop planned and future mining operations, including the costs to construct necessary processing, refuse disposal and transport facilities; • estimated quantities or quality of our metallurgical coal reserves; • our ability to obtain additional financing on favorable terms, if required, to complete the acquisition of additional metallurgical coal reserves as currently contemplated or to fund the operations and growth of our business; • maintenance, operating or other expenses or changes in the timing thereof; • the financial condition and liquidity of our customers; • competition in coal markets; • the price of metallurgical coal or thermal coal; • compliance with stringent domestic and foreign laws and regulations, including environmental, climate change and health and safety regulations, and permitting requirements, as well as changes in the regulatory environment, the adoption of new or revised laws, regulations and permitting requirements; • potential legal proceedings and regulatory inquiries against us; • the impact of weather and natural disasters on demand, production and transportation; • purchases by major customers and our ability to renew sales contracts; • credit and performance risks associated with customers, suppliers, contract miners, co - shippers and traders, banks and other financial counterparties; • geologic, equipment, permitting, site access and operational risks and new technologies related to mining; • transportation availability, performance and costs; • availability, timing of delivery and costs of key supplies, capital equipment or commodities such as diesel fuel, steel, explosives and tires; • timely review and approval of permits, permit renewals, extensions and amendments by regulatory authorities; • our ability to comply with certain debt covenants; • tax payments to be paid for the current fiscal year; • our expectations relating to dividend payments and our ability to make such payments; • the anticipated benefits and impacts of the Ramaco Coal, LLC (“Ramaco Coal”) and Maben acquisitions; • risks related to Russia’s invasion of Ukraine and the international community’s response; • risks related to weakened global economic conditions and inflation; and • other risks identified in this presentation that are not historical. We caution you that these forward - looking statements are subject to a number of risks, uncertainties and assumptions, which are difficult to predict and many of which are beyond our control, incident to the development, production, gathering and sal e of coal. Moreover, we operate in a very competitive and rapidly changing environment and additional risks may arise from time to time. It is not possible for our management to predict all of the risks associated with our business, including those desc rib ed under the heading “Risk Factors” included in Ramaco’s Annual Report on Form 10 - K, nor can we assess the impact of all factors on our business or the extent to which any factor, or combination of factors, may cause actual results to differ materially f rom those contained in any forward - looking statements we may make. Although we believe that our plans, intentions and expectations reflected in or suggested by the forward - looking statements we make in this presentation are reasonable, we can give no assurance that these plans, intentions or expectations will be achieved or occur, and actual results could differ materially and adversely from those anticipated or implied in the forward - looking statements. Given these risks and uncertainties, investors should not place undue reliance on forward - looking statements as a prediction of actual results. Forward Looking Statements, continued: All forward - looking statements, expressed or implied, included in this presentation are expressly qualified in their entirety by this cautionary statement. This cautionary statement should also be considered in connection with any subsequent written or oral forward - looking statements that we or persons acting on our behalf may issue. Except as otherwise required by applicable law, we disclaim any duty to update any forward - looking statements, all of which are expressly qualified by the statements in this section, to reflect events or circumstances after the date of this presentation. Additional Information About the Charter Amendment Proposal and Where to Find It: On April 26, 2023, Ramaco filed a definitive proxy statement (the “Proxy Statement”) with the SEC relating to the shareholder proposal to amend and restate Ramaco’s amended and restated certificate of incorporation, which, among other things, includes (1) the reclassification of Ramaco’s existing common stock as shares of Class A common stock, par value $0.01 per sh are (“Class A Common Stock”), (2) the creation of a separate class of common stock, the Class B common stock, par value $0.01 per share (“Class B Tracking Stock”), and (3) the provision to Ramaco’s board of directors of the option, in its sole discretion, to exchange all outstanding shares of the Class B Tracking Stock into shares of Class A Common Stock based on an exchange ratio determined by a 20 - day trailing volume - weighted average price for each class of stock (the “Charter Amendment Proposal”). Ramaco commenced mailing on or about May 5, 2023 of the Proxy Statement and other relevant documents to its shareholders as of April 21, 2023, the record date, for voting on the Charter Amendment Proposal. This presentation does not contain all t he information that should be considered concerning the Charter Amendment Proposal and is not intended to form the basis of any investment decision or any other decision in respect of the amendment and restatement of the Company’s amended and restated certificate of incorporation contemplated thereby. Ramaco’s shareholders and other interested persons are advised to read the Proxy Statemen and other documents filed in connection with the Charter Amendment Proposal, as these materials contain important information about the Company and the Charter Amendment Proposal. Ramaco’s shareholders are able to obtain copies of the Proxy Statement, and other documents filed with the SEC, free of charge at the SEC’s website at www.sec.gov, or by directing a request to: Attn: Secretary, 250 West Main Street, Suite 1900, Lexington, Kentucky 40507. Participants in the Solicitation: Ramaco and its directors and executive officers may be deemed participants in the solicitation of proxies from Ramaco’s shareholders with respect to the Charter Amendment Proposal. A list of the names of those directors and executive officers an d a description of their interests in Ramaco is contained in the definitive proxy statement that Ramaco filed with the SEC in connection with Ramaco’s Special Meeting of Shareholders to approve the Charter Amendment Proposal and is available free of charge at the SEC’s website at www.sec.gov, or by directing a request to Attn: Secretary, 250 West Main Street, Suite 1900 , Lexington, Kentucky 40507. No Offer or Solicitation: This presentation shall not constitute a solicitation of a proxy, consent or authorization with respect to any securities or in respect of the Charter Amendment Proposal. This presentation shall not constitute an offer to sell or the solicitation of an offer to buy or subscribe for any securities, nor shall there be any sale of securities in any jurisdictio n i n which such offer, solicitation or sale would be unlawful prior to registration or qualification under the securities laws of any such jurisdiction. No offering of securities shall be made except by means of a prospectus meeting the requirements of Section 10 of the Securities Act, or an exemption therefrom. 2
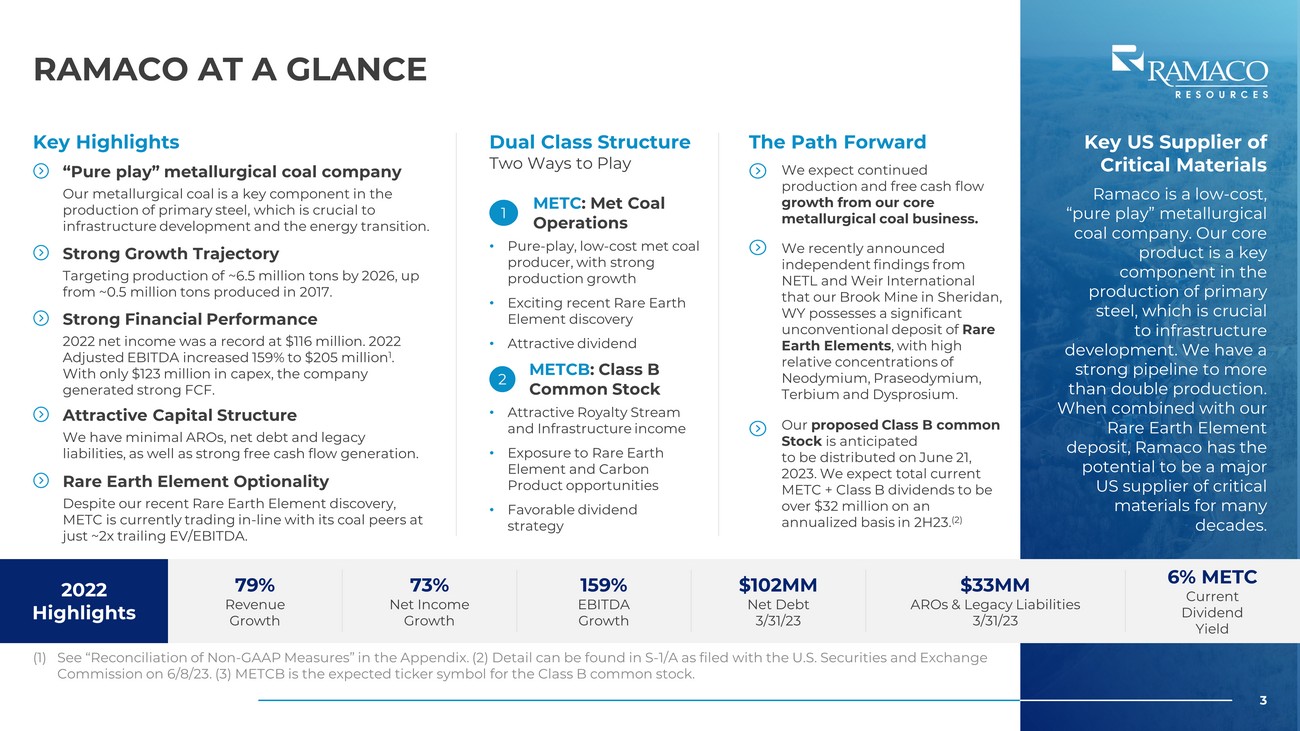
3 RAMACO AT A GLANCE (1) See “Reconciliation of Non - GAAP Measures” in the Appendix. (2) Detail can be found in S - 1/A as filed with the U.S. Securities an d Exchange Commission on 6/8/23. (3) METCB is the expected ticker symbol for the Class B common stock. Key US Supplier of Critical Materials Ramaco is a low - cost, “pure play” metallurgical coal company. Our core product is a key component in the production of primary steel, which is crucial to infrastructure development. We have a strong pipeline to more than double production. When combined with our Rare Earth Element deposit, Ramaco has the potential to be a major US supplier of critical materials for many decades. 3 2022 Highlights 79% Revenue Growth 73% Net Income Growth 159% EBITDA Growth $102MM Net Debt 3/31/23 $33MM AROs & Legacy Liabilities 3/31/23 6% METC Current Dividend Yield Key Highlights Dual Class Structure Two Ways to Play • Pure - play, low - cost met coal producer, with strong production growth • Exciting recent Rare Earth Element discovery • Attractive dividend 1 METC : Met Coal Operations • Attractive Royalty Stream and Infrastructure income • Exposure to Rare Earth Element and Carbon Product opportunities • Favorable dividend strategy 2 METCB : Class B Common Stock “Pure play” metallurgical coal company Our metallurgical coal is a key component in the production of primary steel, which is crucial to infrastructure development and the energy transition. Strong Growth Trajectory Targeting production of ~6.5 million tons by 2026, up from ~0.5 million tons produced in 2017. Strong Financial Performance 2022 net income was a record at $116 million. 2022 Adjusted EBITDA increased 159% to $205 million 1 . With only $123 million in capex, the company generated strong FCF. Attractive Capital Structure We have minimal AROs, net debt and legacy liabilities, as well as strong free cash flow generation. Rare Earth Element Optionality Despite our recent Rare Earth Element discovery, METC is currently trading in - line with its coal peers at just ~2x trailing EV/EBITDA. The Path Forward We expect continued production and free cash flow growth from our core metallurgical coal business. We recently announced independent findings from NETL and Weir International that our Brook Mine in Sheridan, WY possesses a significant unconventional deposit of Rare Earth Elements , with high relative concentrations of Neodymium, Praseodymium, Terbium and Dysprosium. Our proposed Class B common Stock is anticipated to be distributed on June 21, 2023. We expect total current METC + Class B dividends to be over $32 million on an annualized basis in 2H23. (2)
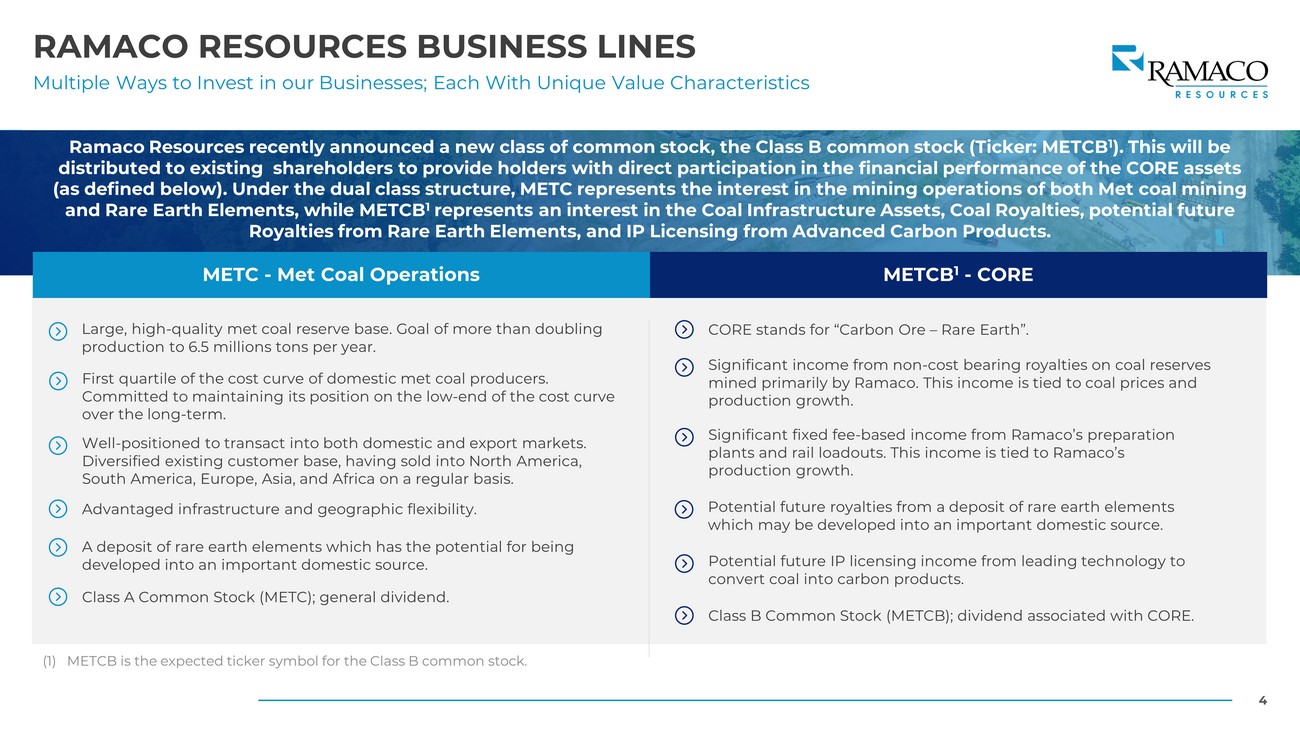
4 RAMACO RESOURCES BUSINESS LINES Multiple Ways to Invest in our Businesses; Each With Unique Value Characteristics METC - Met Coal Operations METCB 1 - CORE Large, high - quality met coal reserve base. Goal of more than doubling production to 6.5 millions tons per year. First quartile of the cost curve of domestic met coal producers. Committed to maintaining its position on the low - end of the cost curve over the long - term. Well - positioned to transact into both domestic and export markets. Diversified existing customer base, having sold into North America, South America, Europe, Asia, and Africa on a regular basis. Advantaged infrastructure and geographic flexibility. A deposit of rare earth elements which has the potential for being developed into an important domestic source. Significant income from non - cost bearing royalties on coal reserves mined primarily by Ramaco. This income is tied to coal prices and production growth. Significant fixed fee - based income from Ramaco’s preparation plants and rail loadouts. This income is tied to Ramaco’s production growth. Potential future royalties from a deposit of rare earth elements which may be developed into an important domestic source. Potential future IP licensing income from leading technology to convert coal into carbon products. Class B Common Stock (METCB); dividend associated with CORE. Ramaco Resources recently announced a new class of common stock, the Class B common stock (Ticker: METCB 1 ). This will be distributed to existing shareholders to provide holders with direct participation in the financial performance of the CORE a sse ts (as defined below). Under the dual class structure, METC represents the interest in the mining operations of both Met coal mi nin g and Rare Earth Elements, while METCB 1 represents an interest in the Coal Infrastructure Assets, Coal Royalties, potential future Royalties from Rare Earth Elements, and IP Licensing from Advanced Carbon Products. Class A Common Stock (METC); general dividend. CORE stands for “Carbon Ore – Rare Earth”. (1) METCB is the expected ticker symbol for the Class B common stock.
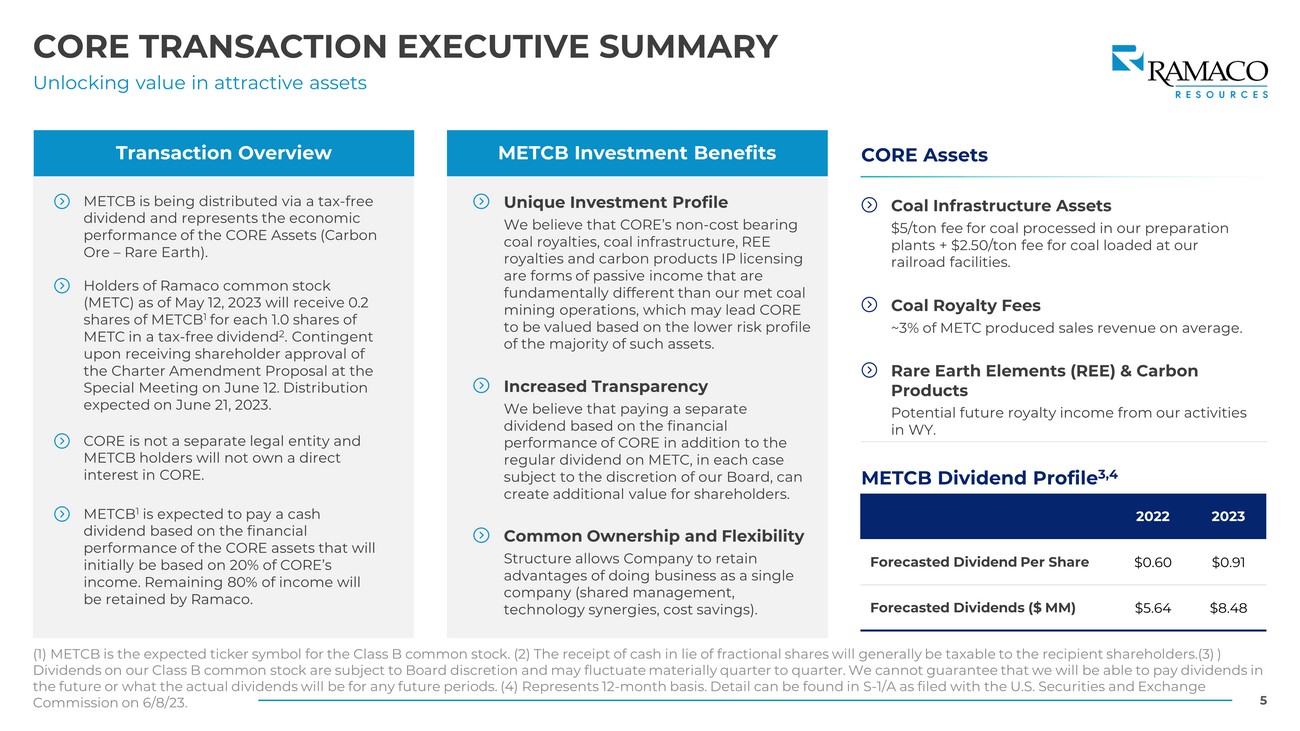
5 CORE TRANSACTION EXECUTIVE SUMMARY Unlocking value in attractive assets Transaction Overview METCB Investment Benefits METCB is being distributed via a tax - free dividend and represents the economic performance of the CORE Assets (Carbon Ore – Rare Earth). Holders of Ramaco common stock (METC) as of May 12, 2023 will receive 0.2 shares of METCB 1 for each 1.0 shares of METC in a tax - free dividend 2 . Contingent upon receiving shareholder approval of the Charter Amendment Proposal at the Special Meeting on June 12. Distribution expected on June 21, 2023. CORE is not a separate legal entity and METCB holders will not own a direct interest in CORE. METCB 1 is expected to pay a cash dividend based on the financial performance of the CORE assets that will initially be based on 20% of CORE’s income. Remaining 80% of income will be retained by Ramaco. METCB Dividend Profile 3,4 Unique Investment Profile We believe that CORE’s non - cost bearing coal royalties, coal infrastructure, REE royalties and carbon products IP licensing are forms of passive income that are fundamentally different than our met coal mining operations, which may lead CORE to be valued based on the lower risk profile of the majority of such assets. Increased Transparency We believe that paying a separate dividend based on the financial performance of CORE in addition to the regular dividend on METC, in each case subject to the discretion of our Board, can create additional value for shareholders. Common Ownership and Flexibility Structure allows Company to retain advantages of doing business as a single company (shared management, technology synergies, cost savings). CORE Assets Coal Infrastructure Assets $5/ton fee for coal processed in our preparation plants + $2.50/ton fee for coal loaded at our railroad facilities. Coal Royalty Fees ~3% of METC produced sales revenue on average. Rare Earth Elements (REE) & Carbon Products Potential future royalty income from our activities in WY. (1) METCB is the expected ticker symbol for the Class B common stock. (2) The receipt of cash in lie of fractional shares wil l g enerally be taxable to the recipient shareholders.(3) ) Dividends on our Class B common stock are subject to Board discretion and may fluctuate materially quarter to quarter. We can not guarantee that we will be able to pay dividends in the future or what the actual dividends will be for any future periods. (4) Represents 12 - month basis. Detail can be found in S - 1/A as filed with the U.S. Securities and Exchange Commission on 6/8/23. 2022 2023 Forecasted Dividend Per Share $0.60 $0.91 Forecasted Dividends ($ MM) $5.64 $8.48
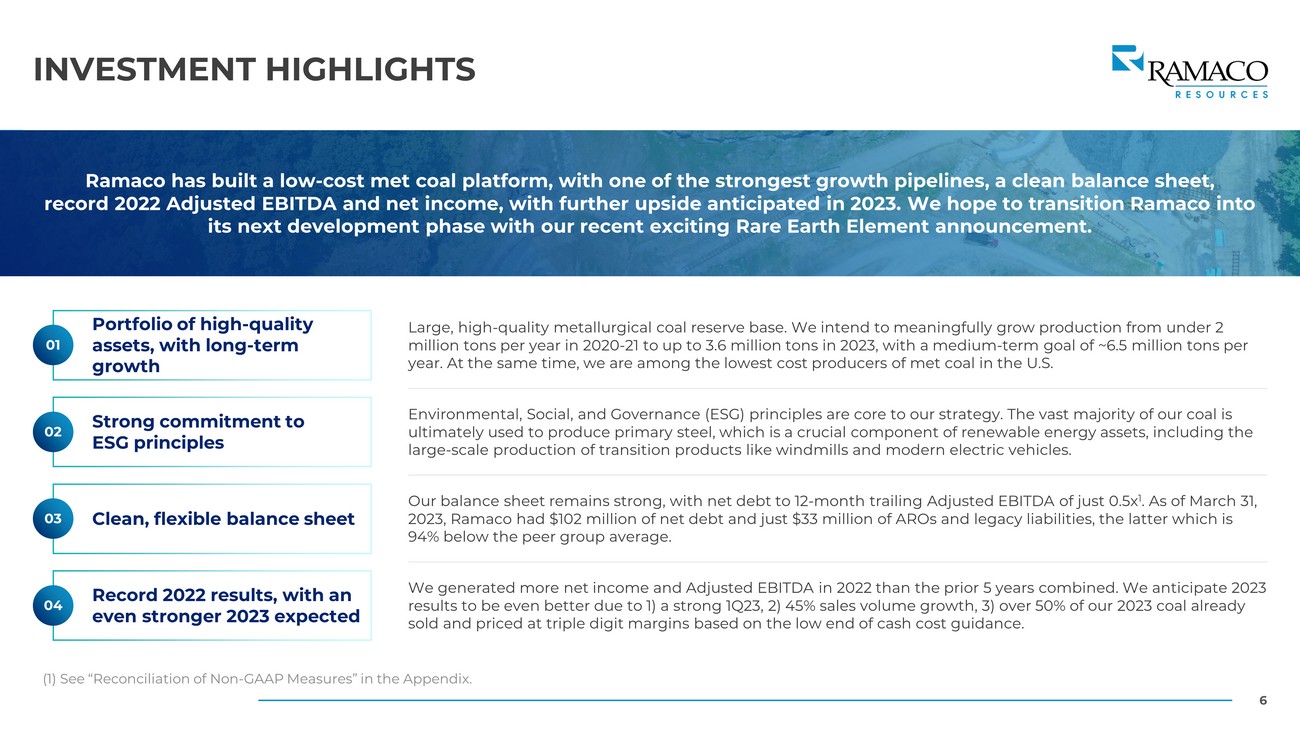
6 INVESTMENT HIGHLIGHTS Ramaco has built a low - cost met coal platform, with one of the strongest growth pipelines, a clean balance sheet, record 2022 Adjusted EBITDA and net income, with further upside anticipated in 2023. We hope to transition Ramaco into its next development phase with our recent exciting Rare Earth Element announcement. Portfolio of high - quality assets, with long - term growth Strong commitment to ESG principles Clean, flexible balance sheet Record 2022 results, with an even stronger 2023 expected 01 02 03 04 Large, high - quality metallurgical coal reserve base. We intend to meaningfully grow production from under 2 million tons per year in 2020 - 21 to up to 3.6 million tons in 2023, with a medium - term goal of ~6.5 million tons per year. At the same time, we are among the lowest cost producers of met coal in the U.S. Environmental, Social, and Governance (ESG) principles are core to our strategy. The vast majority of our coal is ultimately used to produce primary steel, which is a crucial component of renewable energy assets, including the large - scale production of transition products like windmills and modern electric vehicles. Our balance sheet remains strong, with net debt to 12 - month trailing Adjusted EBITDA of just 0.5x 1 . As of March 31, 2023, Ramaco had $102 million of net debt and just $33 million of AROs and legacy liabilities, the latter which is 94% below the peer group average. We generated more net income and Adjusted EBITDA in 2022 than the prior 5 years combined. We anticipate 2023 results to be even better due to 1) a strong 1Q23, 2) 45% sales volume growth, 3) over 50% of our 2023 coal already sold and priced at triple digit margins based on the low end of cash cost guidance. (1) See “Reconciliation of Non - GAAP Measures” in the Appendix.
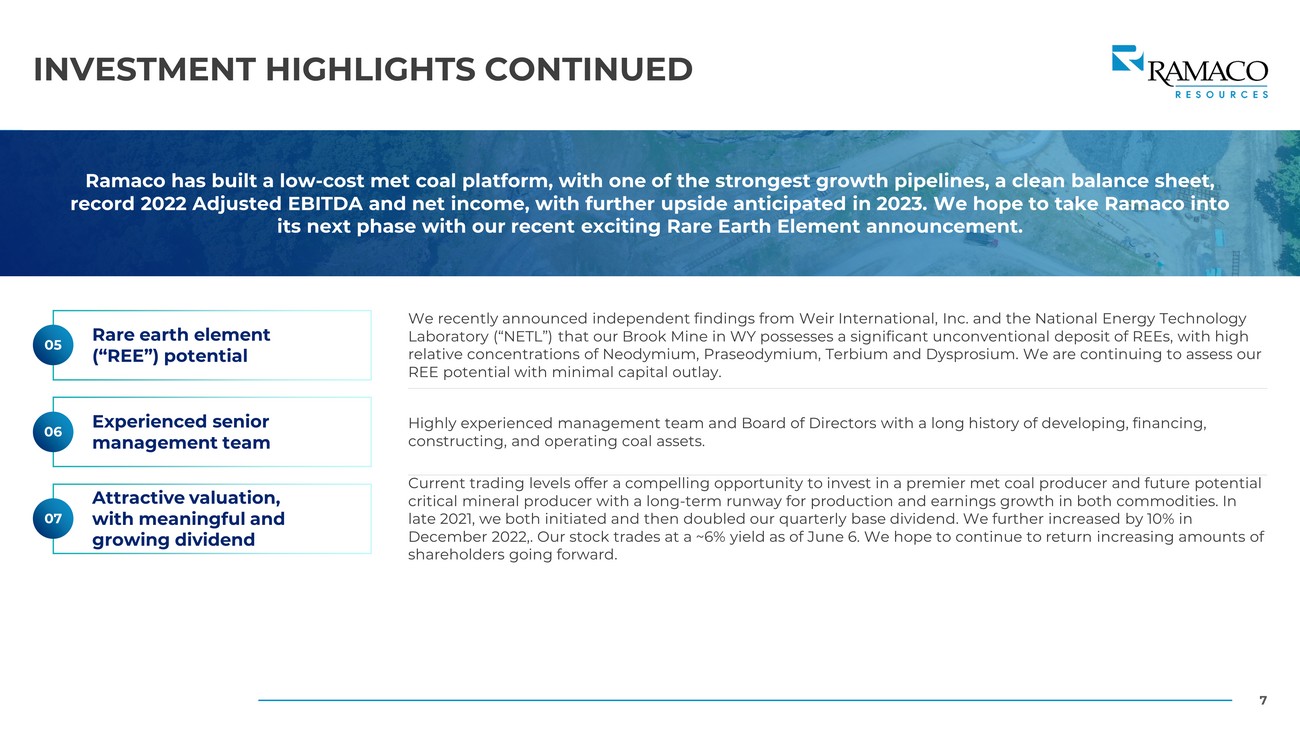
7 INVESTMENT HIGHLIGHTS CONTINUED Ramaco has built a low - cost met coal platform, with one of the strongest growth pipelines, a clean balance sheet, record 2022 Adjusted EBITDA and net income, with further upside anticipated in 2023. We hope to take Ramaco into its next phase with our recent exciting Rare Earth Element announcement. Rare earth element (“REE”) potential Experienced senior management team Attractive valuation, with meaningful and growing dividend 05 06 07 We recently announced independent findings from Weir International, Inc. and the National Energy Technology Laboratory (“NETL”) that our Brook Mine in WY possesses a significant unconventional deposit of REEs, with high relative concentrations of Neodymium, Praseodymium, Terbium and Dysprosium. We are continuing to assess our REE potential with minimal capital outlay. Highly experienced management team and Board of Directors with a long history of developing, financing, constructing, and operating coal assets. Current trading levels offer a compelling opportunity to invest in a premier met coal producer and future potential critical mineral producer with a long - term runway for production and earnings growth in both commodities. In late 2021, we both initiated and then doubled our quarterly base dividend. We further increased by 10% in December 2022,. Our stock trades at a ~6% yield as of June 6. We hope to continue to return increasing amounts of shareholders going forward.
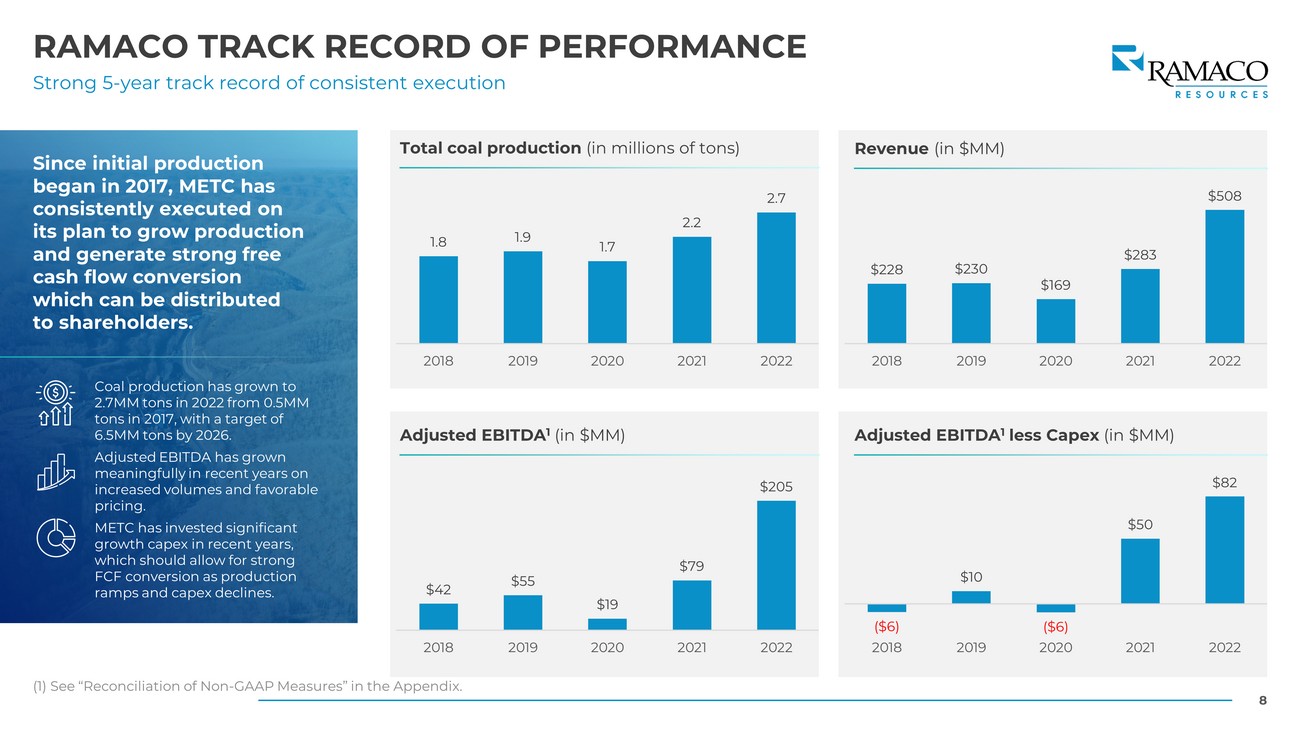
8 RAMACO TRACK RECORD OF PERFORMANCE Strong 5 - year track record of consistent execution (1) See “Reconciliation of Non - GAAP Measures” in the Appendix. Since initial production began in 2017, METC has consistently executed on its plan to grow production and generate strong free cash flow conversion which can be distributed to shareholders. Coal production has grown to 2.7MM tons in 2022 from 0.5MM tons in 2017, with a target of 6.5MM tons by 2026. Adjusted EBITDA has grown meaningfully in recent years on increased volumes and favorable pricing. METC has invested significant growth capex in recent years, which should allow for strong FCF conversion as production ramps and capex declines. Total coal production (in millions of tons) Revenue (in $MM) Adjusted EBITDA 1 (in $MM) Adjusted EBITDA 1 less Capex (in $MM) 1.8 1.9 1.7 2.2 2.7 2018 2019 2020 2021 2022 $228 $230 $169 $283 $508 2018 2019 2020 2021 2022 $42 $55 $19 $79 $205 2018 2019 2020 2021 2022 ($6) $10 ($6) $50 $82 2018 2019 2020 2021 2022
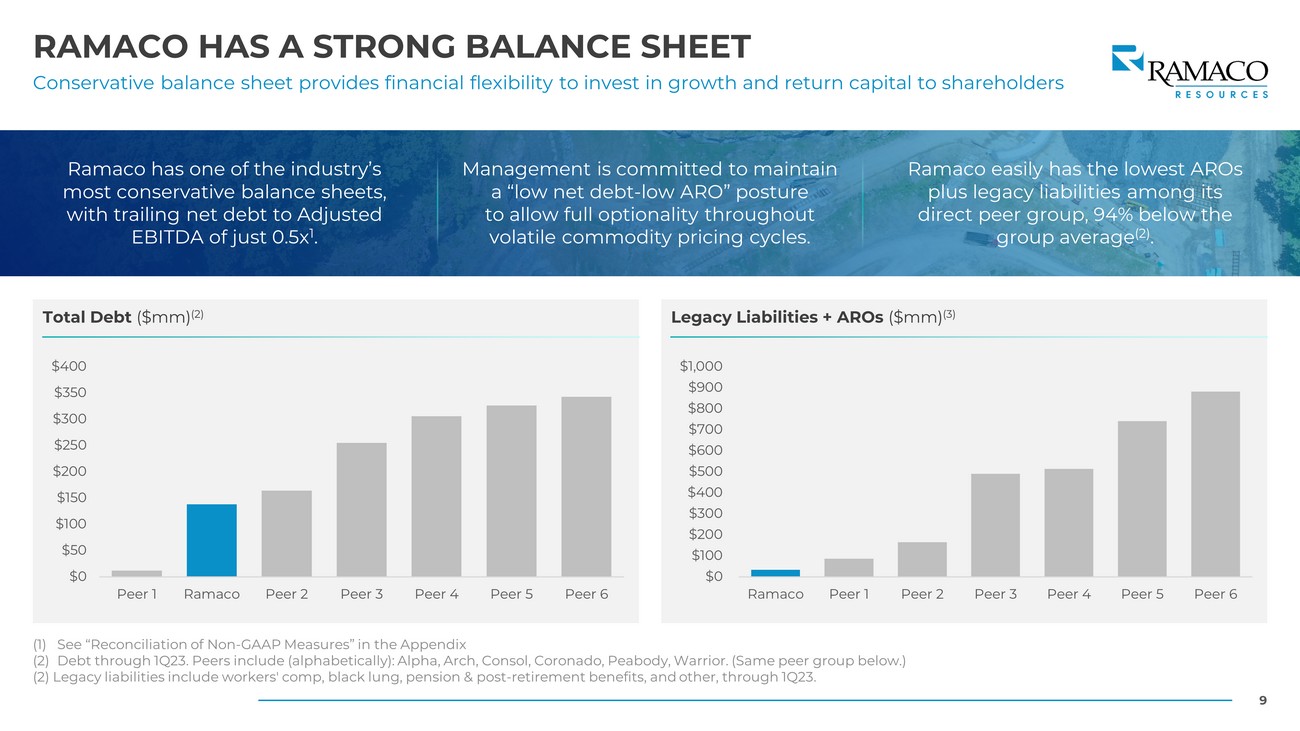
9 RAMACO HAS A STRONG BALANCE SHEET Conservative balance sheet provides financial flexibility to invest in growth and return capital to shareholders Total Debt ($mm) (2) Ramaco has one of the industry’s most conservative balance sheets, with trailing net debt to Adjusted EBITDA of just 0.5x 1 . Management is committed to maintain a “low net debt - low ARO” posture to allow full optionality throughout volatile commodity pricing cycles. Ramaco easily has the lowest AROs plus legacy liabilities among its direct peer group, 94% below the group average (2) . Legacy Liabilities + AROs ($mm) (3) (1) See “Reconciliation of Non - GAAP Measures” in the Appendix (2) Debt through 1Q23. Peers include (alphabetically): Alpha, Arch, Consol, Coronado, Peabody, Warrior. (Same peer group below.) (2) Legacy liabilities include workers' comp, black lung, pension & post - retirement benefits, and other, through 1Q23. $0 $50 $100 $150 $200 $250 $300 $350 $400 Peer 1 Ramaco Peer 2 Peer 3 Peer 4 Peer 5 Peer 6 $0 $100 $200 $300 $400 $500 $600 $700 $800 $900 $1,000 Ramaco Peer 1 Peer 2 Peer 3 Peer 4 Peer 5 Peer 6
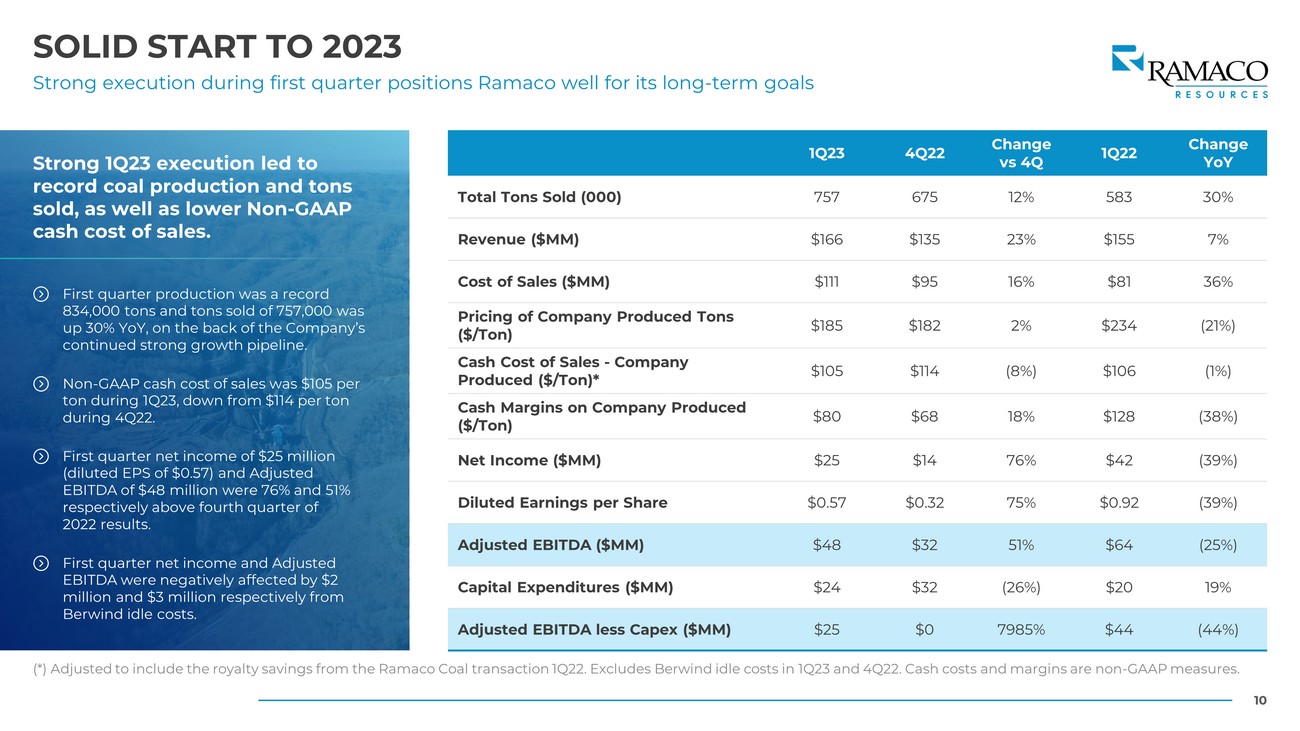
10 SOLID START TO 2023 Strong execution during first quarter positions Ramaco well for its long - term goals 1Q23 4Q22 Change vs 4Q 1Q22 Change YoY Total Tons Sold (000) 757 675 12% 583 30% Revenue ($MM) $166 $135 23% $155 7% Cost of Sales ($MM) $111 $95 16% $81 36% Pricing of Company Produced Tons ($/Ton) $185 $182 2% $234 (21%) Cash Cost of Sales - Company Produced ($/Ton)* $105 $114 (8%) $106 (1%) Cash Margins on Company Produced ($/Ton) $80 $68 18% $128 (38%) Net Income ($MM) $25 $14 76% $42 (39%) Diluted Earnings per Share $0.57 $0.32 75% $0.92 (39%) Adjusted EBITDA ($MM) $48 $32 51% $64 (25%) Capital Expenditures ($MM) $24 $32 (26%) $20 19% Adjusted EBITDA less Capex ($MM) $25 $0 7985% $44 (44%) (*) Adjusted to include the royalty savings from the Ramaco Coal transaction 1Q22. Excludes Berwind idle costs in 1Q23 and 4Q 22. Cash costs and margins are non - GAAP measures. Strong 1Q23 execution led to record coal production and tons sold, as well as lower Non - GAAP cash cost of sales. First quarter production was a record 834,000 tons and tons sold of 757,000 was up 30% YoY, on the back of the Company’s continued strong growth pipeline. Non - GAAP cash cost of sales was $105 per ton during 1Q23, down from $114 per ton during 4Q22. First quarter net income of $25 million (diluted EPS of $0.57) and Adjusted EBITDA of $48 million were 76% and 51% respectively above fourth quarter of 2022 results. First quarter net income and Adjusted EBITDA were negatively affected by $2 million and $3 million respectively from Berwind idle costs.
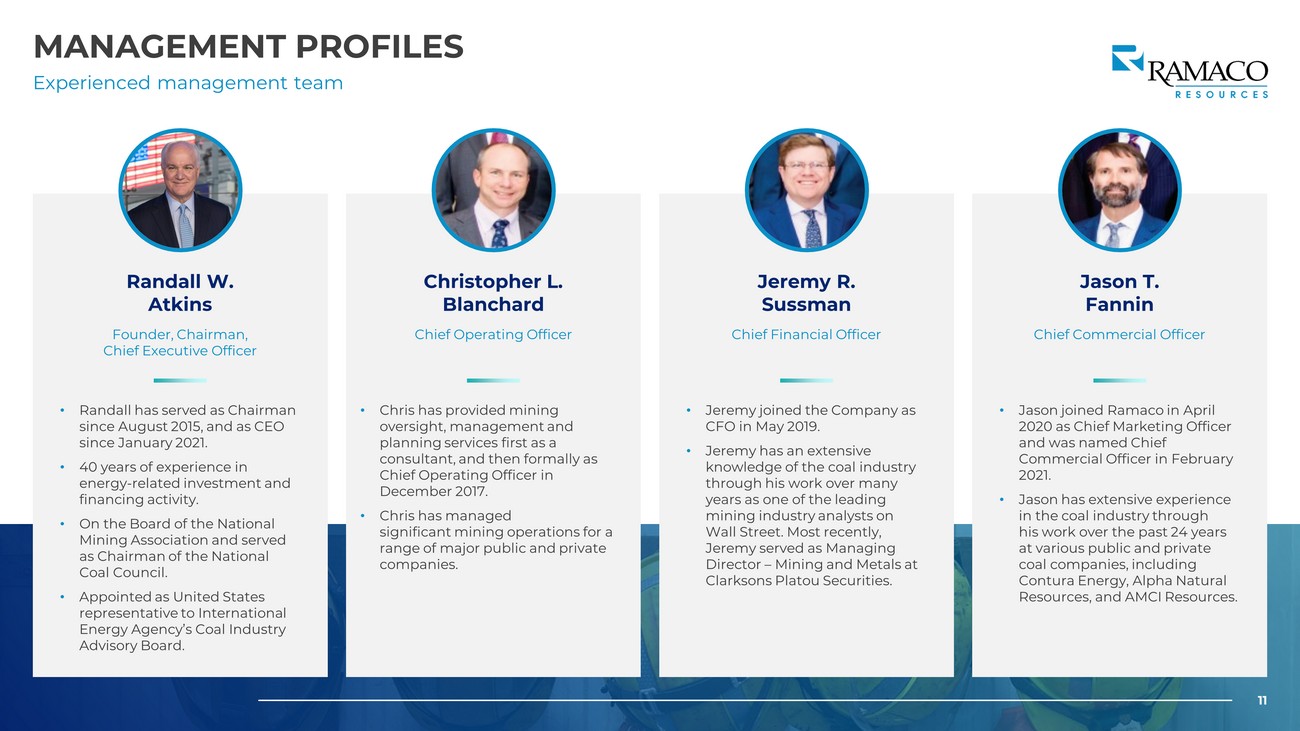
11 MANAGEMENT PROFILES Experienced management team 11 Randall W. Atkins Christopher L. Blanchard Jeremy R. Sussman Jason T. Fannin Founder, Chairman, Chief Executive Officer Chief Operating Officer Chief Financial Officer Chief Commercial Officer • Randall has served as Chairman since August 2015, and as CEO since January 2021. • 40 years of experience in energy - related investment and financing activity. • On the Board of the National Mining Association and served as Chairman of the National Coal Council. • Appointed as United States representative to International Energy Agency’s Coal Industry Advisory Board. • Chris has provided mining oversight, management and planning services first as a consultant, and then formally as Chief Operating Officer in December 2017. • Chris has managed significant mining operations for a range of major public and private companies. • Jeremy joined the Company as CFO in May 2019. • Jeremy has an extensive knowledge of the coal industry through his work over many years as one of the leading mining industry analysts on Wall Street. Most recently, Jeremy served as Managing Director – Mining and Metals at Clarksons Platou Securities. • Jason joined Ramaco in April 2020 as Chief Marketing Officer and was named Chief Commercial Officer in February 2021. • Jason has extensive experience in the coal industry through his work over the past 24 years at various public and private coal companies, including Contura Energy, Alpha Natural Resources, and AMCI Resources.
CORE ASSETS OVERVIEW
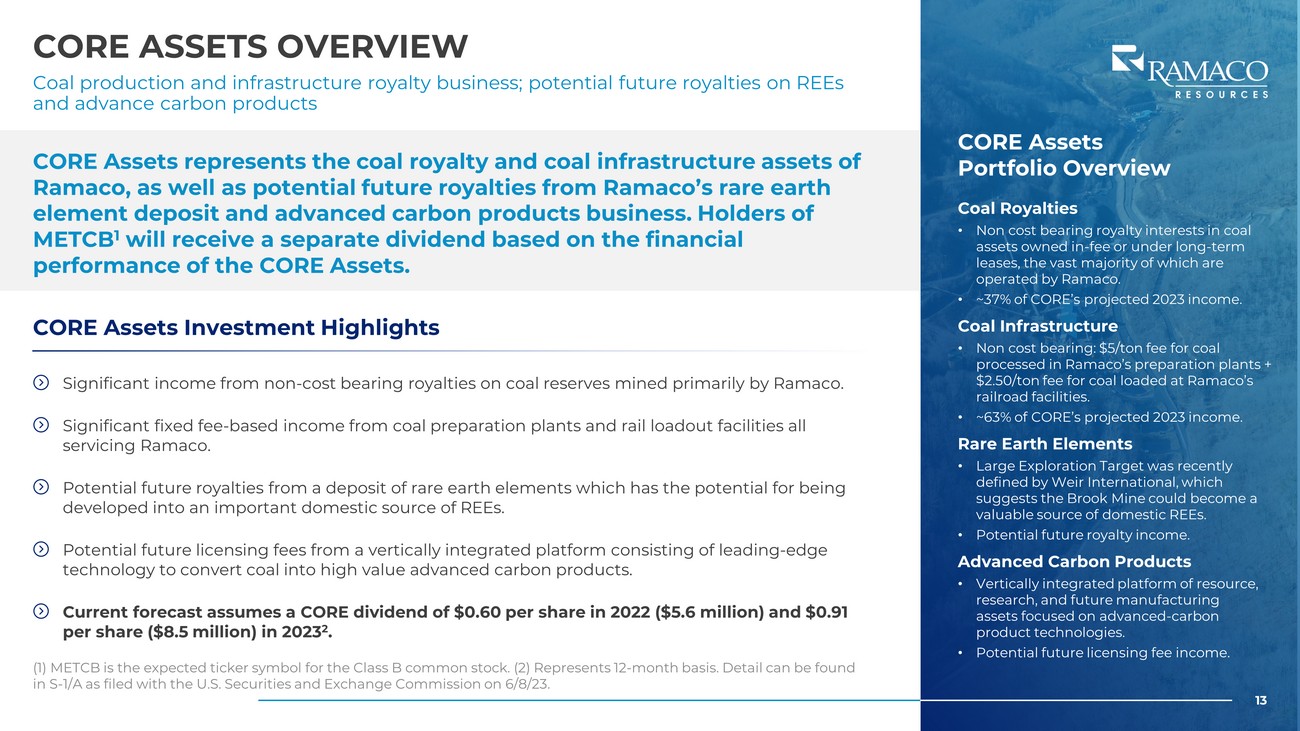
13 CORE ASSETS OVERVIEW Coal production and infrastructure royalty business; potential future royalties on REEs and advance carbon products (1) METCB is the expected ticker symbol for the Class B common stock. (2) Represents 12 - month basis. Detail can be found in S - 1/A as filed with the U.S. Securities and Exchange Commission on 6/8/23. CORE Assets represents the coal royalty and coal infrastructure assets of Ramaco, as well as potential future royalties from Ramaco’s rare earth element deposit and advanced carbon products business. Holders of METCB 1 will receive a separate dividend based on the financial performance of the CORE Assets. 13 Significant income from non - cost bearing royalties on coal reserves mined primarily by Ramaco. CORE Assets Investment Highlights Significant fixed fee - based income from coal preparation plants and rail loadout facilities all servicing Ramaco. Potential future royalties from a deposit of rare earth elements which has the potential for being developed into an important domestic source of REEs. Potential future licensing fees from a vertically integrated platform consisting of leading - edge technology to convert coal into high value advanced carbon products. Current forecast assumes a CORE dividend of $0.60 per share in 2022 ($5.6 million) and $0.91 per share ($8.5 million) in 2023 2 . CORE Assets Portfolio Overview Coal Royalties • Non cost bearing royalty interests in coal assets owned in - fee or under long - term leases, the vast majority of which are operated by Ramaco. • ~37% of CORE’s projected 2023 income. Coal Infrastructure • Non cost bearing: $5/ton fee for coal processed in Ramaco’s preparation plants + $2.50/ton fee for coal loaded at Ramaco’s railroad facilities. • ~63% of CORE’s projected 2023 income. Rare Earth Elements • Large Exploration Target was recently defined by Weir International, which suggests the Brook Mine could become a valuable source of domestic REEs. • Potential future royalty income. Advanced Carbon Products • Vertically integrated platform of resource, research, and future manufacturing assets focused on advanced - carbon product technologies. • Potential future licensing fee income.
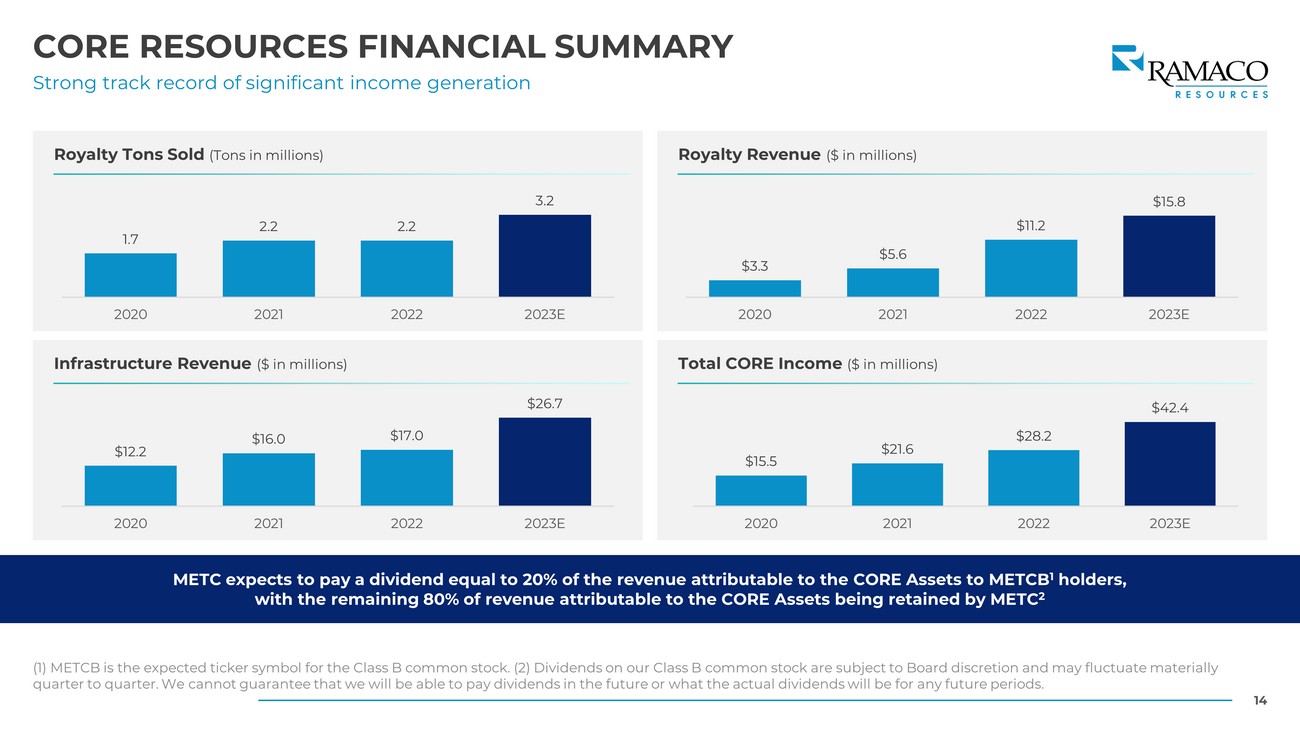
14 CORE RESOURCES FINANCIAL SUMMARY Strong track record of significant income generation METC expects to pay a dividend equal to 20% of the revenue attributable to the CORE Assets to METCB 1 holders, with the remaining 80% of revenue attributable to the CORE Assets being retained by METC 2 Total CORE Income ($ in millions) Infrastructure Revenue ($ in millions) Royalty Revenue ($ in millions) Royalty Tons Sold (Tons in millions) (1) METCB is the expected ticker symbol for the Class B common stock. (2) Dividends on our Class B common stock are subject t o B oard discretion and may fluctuate materially quarter to quarter. We cannot guarantee that we will be able to pay dividends in the future or what the actual dividends will be for any future periods. 1.7 2.2 2.2 3.2 2020 2021 2022 2023E $3.3 $5.6 $11.2 $15.8 2020 2021 2022 2023E $12.2 $16.0 $17.0 $26.7 2020 2021 2022 2023E $15.5 $21.6 $28.2 $42.4 2020 2021 2022 2023E
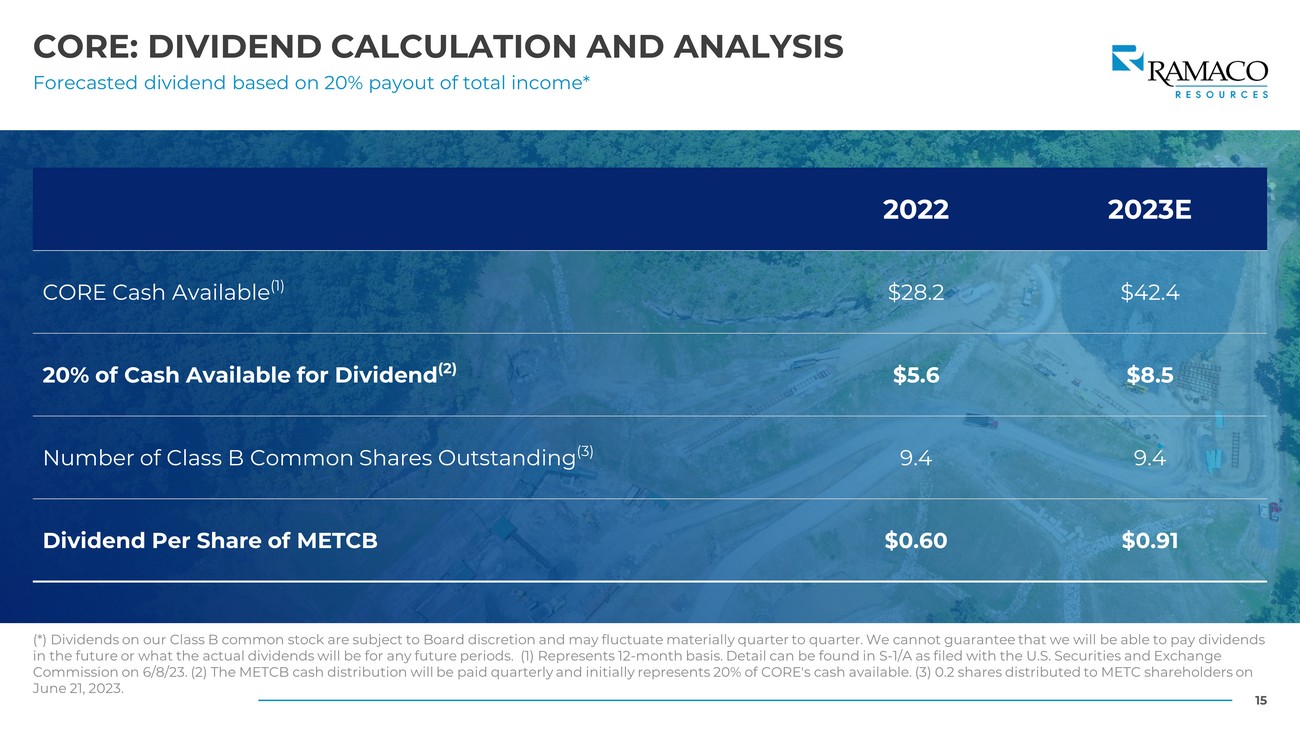
15 CORE: DIVIDEND CALCULATION AND ANALYSIS Forecasted dividend based on 20% payout of total income* (*) Dividends on our Class B common stock are subject to Board discretion and may fluctuate materially quarter to quarter. We ca nnot guarantee that we will be able to pay dividends in the future or what the actual dividends will be for any future periods. (1) Represents 12 - month basis. Detail can be found i n S - 1/A as filed with the U.S. Securities and Exchange Commission on 6/8/23. (2) The METCB cash distribution will be paid quarterly and initially represents 20% of CORE's cash avai lab le. (3) 0.2 shares distributed to METC shareholders on June 21, 2023. 2022 2023E CORE Cash Available (1) $28.2 $42.4 20% of Cash Available for Dividend (2) $5.6 $8.5 Number of Class B Common Shares Outstanding (3) 9.4 9.4 Dividend Per Share of METCB $0.60 $0.91
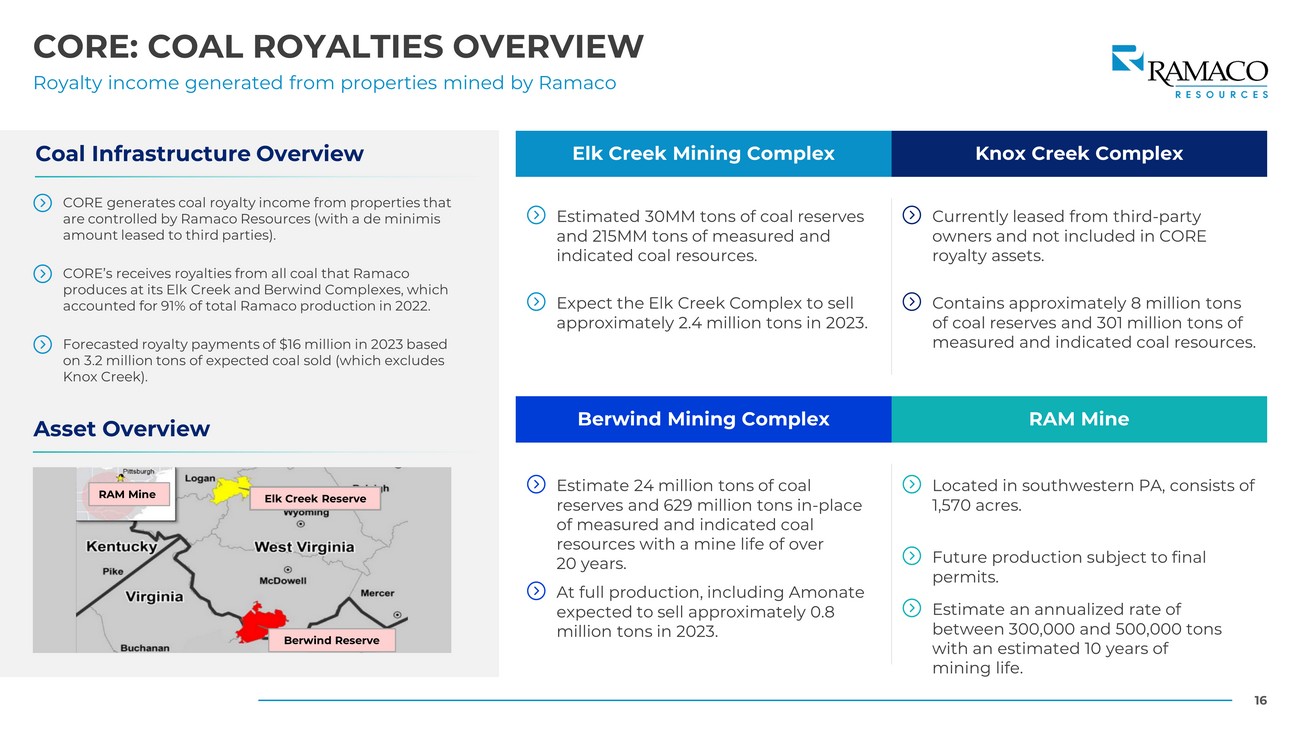
16 CORE: COAL ROYALTIES OVERVIEW Royalty income generated from properties mined by Ramaco CORE generates coal royalty income from properties that are controlled by Ramaco Resources (with a de minimis amount leased to third parties). Asset Overview Coal Infrastructure Overview RAM Mine Elk Creek Reserve Berwind Reserve CORE’s receives royalties from all coal that Ramaco produces at its Elk Creek and Berwind Complexes, which accounted for 91% of total Ramaco production in 2022. Forecasted royalty payments of $16 million in 2023 based on 3.2 million tons of expected coal sold (which excludes Knox Creek). Estimated 30MM tons of coal reserves and 215MM tons of measured and indicated coal resources. Elk Creek Mining Complex Knox Creek Complex Expect the Elk Creek Complex to sell approximately 2.4 million tons in 2023. Currently leased from third - party owners and not included in CORE royalty assets. Contains approximately 8 million tons of coal reserves and 301 million tons of measured and indicated coal resources. Estimate 24 million tons of coal reserves and 629 million tons in - place of measured and indicated coal resources with a mine life of over 20 years. Berwind Mining Complex RAM Mine Located in southwestern PA, consists of 1,570 acres. Future production subject to final permits. At full production, including Amonate expected to sell approximately 0.8 million tons in 2023. Estimate an annualized rate of between 300,000 and 500,000 tons with an estimated 10 years of mining life.
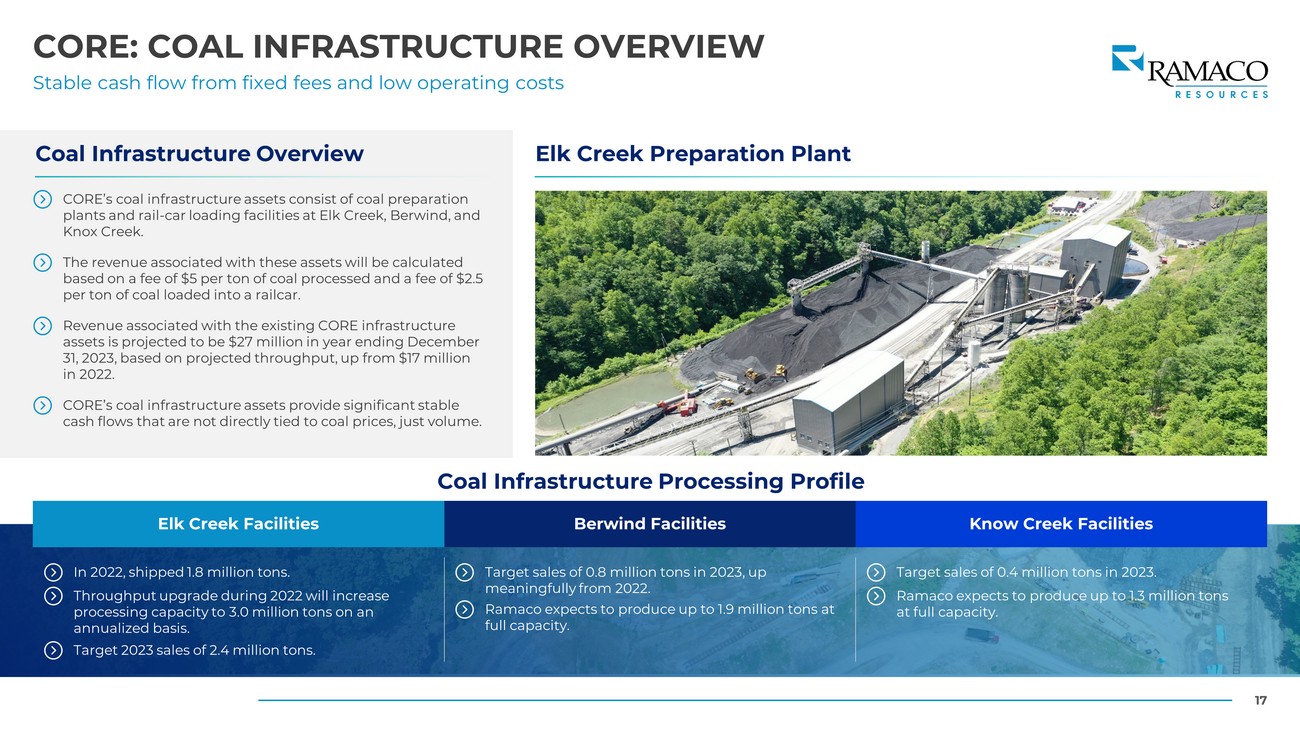
17 CORE: COAL INFRASTRUCTURE OVERVIEW Stable cash flow from fixed fees and low operating costs CORE’s coal infrastructure assets consist of coal preparation plants and rail - car loading facilities at Elk Creek, Berwind, and Knox Creek. Elk Creek Preparation Plant Coal Infrastructure Overview The revenue associated with these assets will be calculated based on a fee of $5 per ton of coal processed and a fee of $2.5 per ton of coal loaded into a railcar. Revenue associated with the existing CORE infrastructure assets is projected to be $27 million in year ending December 31, 2023, based on projected throughput, up from $17 million in 2022. CORE’s coal infrastructure assets provide significant stable cash flows that are not directly tied to coal prices, just volume. Coal Infrastructure Processing Profile Elk Creek Facilities Berwind Facilities Know Creek Facilities In 2022, shipped 1.8 million tons. Throughput upgrade during 2022 will increase processing capacity to 3.0 million tons on an annualized basis. Target 2023 sales of 2.4 million tons. Target sales of 0.8 million tons in 2023, up meaningfully from 2022. Ramaco expects to produce up to 1.9 million tons at full capacity. Target sales of 0.4 million tons in 2023. Ramaco expects to produce up to 1.3 million tons at full capacity.
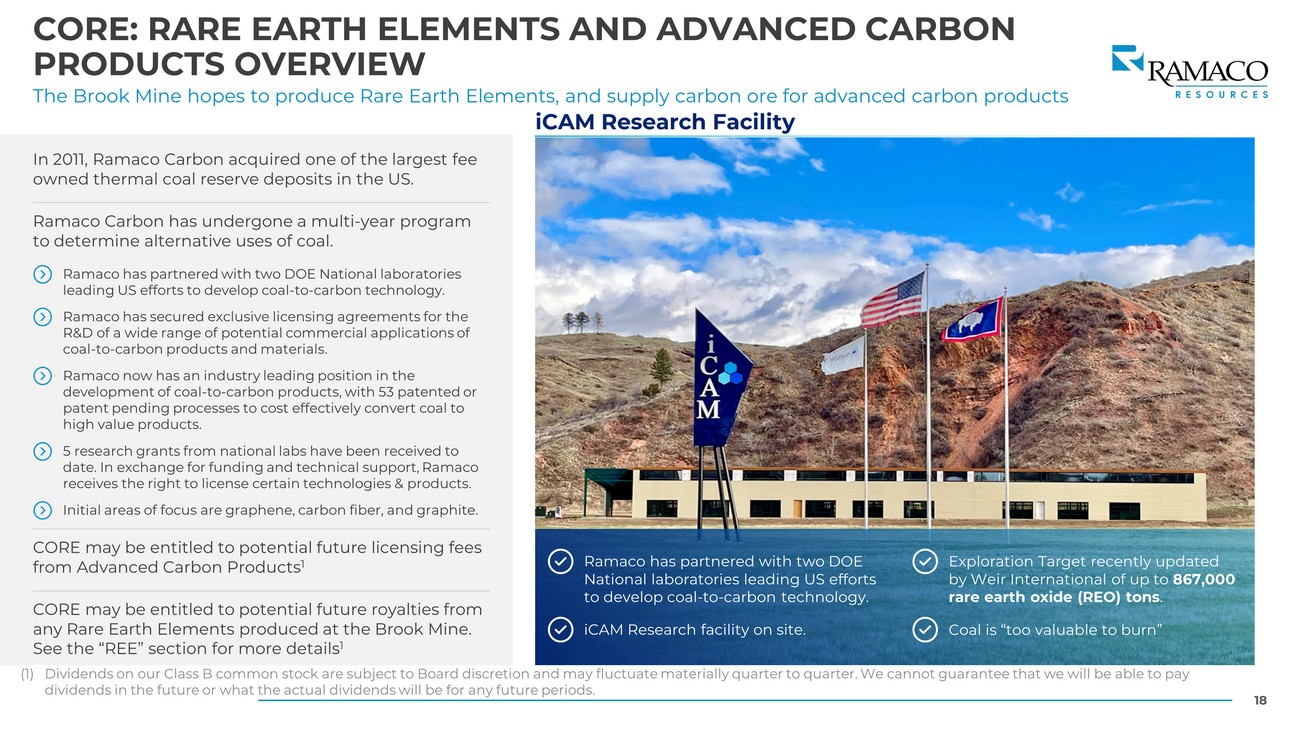
18 CORE: RARE EARTH ELEMENTS AND ADVANCED CARBON PRODUCTS OVERVIEW The Brook Mine hopes to produce Rare Earth Elements, and supply carbon ore for advanced carbon products In 2011, Ramaco Carbon acquired one of the largest fee owned thermal coal reserve deposits in the US. Ramaco Carbon has undergone a multi - year program to determine alternative uses of coal. Ramaco has partnered with two DOE National laboratories leading US efforts to develop coal - to - carbon technology. Ramaco has secured exclusive licensing agreements for the R&D of a wide range of potential commercial applications of coal - to - carbon products and materials. Ramaco now has an industry leading position in the development of coal - to - carbon products, with 53 patented or patent pending processes to cost effectively convert coal to high value products. 5 research grants from national labs have been received to date. In exchange for funding and technical support, Ramaco receives the right to license certain technologies & products. Initial areas of focus are graphene, carbon fiber, and graphite. CORE may be entitled to potential future licensing fees from Advanced Carbon Products 1 CORE may be entitled to potential future royalties from any Rare Earth Elements produced at the Brook Mine. See the “REE” section for more details 1 Ramaco has partnered with two DOE National laboratories leading US efforts to develop coal - to - carbon technology. Exploration Target recently updated by Weir International of up to 867,000 rare earth oxide (REO) tons . iCAM Research facility on site. iCAM Research Facility Coal is “too valuable to burn” (1) Dividends on our Class B common stock are subject to Board discretion and may fluctuate materially quarter to quarter. We can not guarantee that we will be able to pay dividends in the future or what the actual dividends will be for any future periods.
RARE EARTH ELEMENTS (“REE”) POTENTIAL
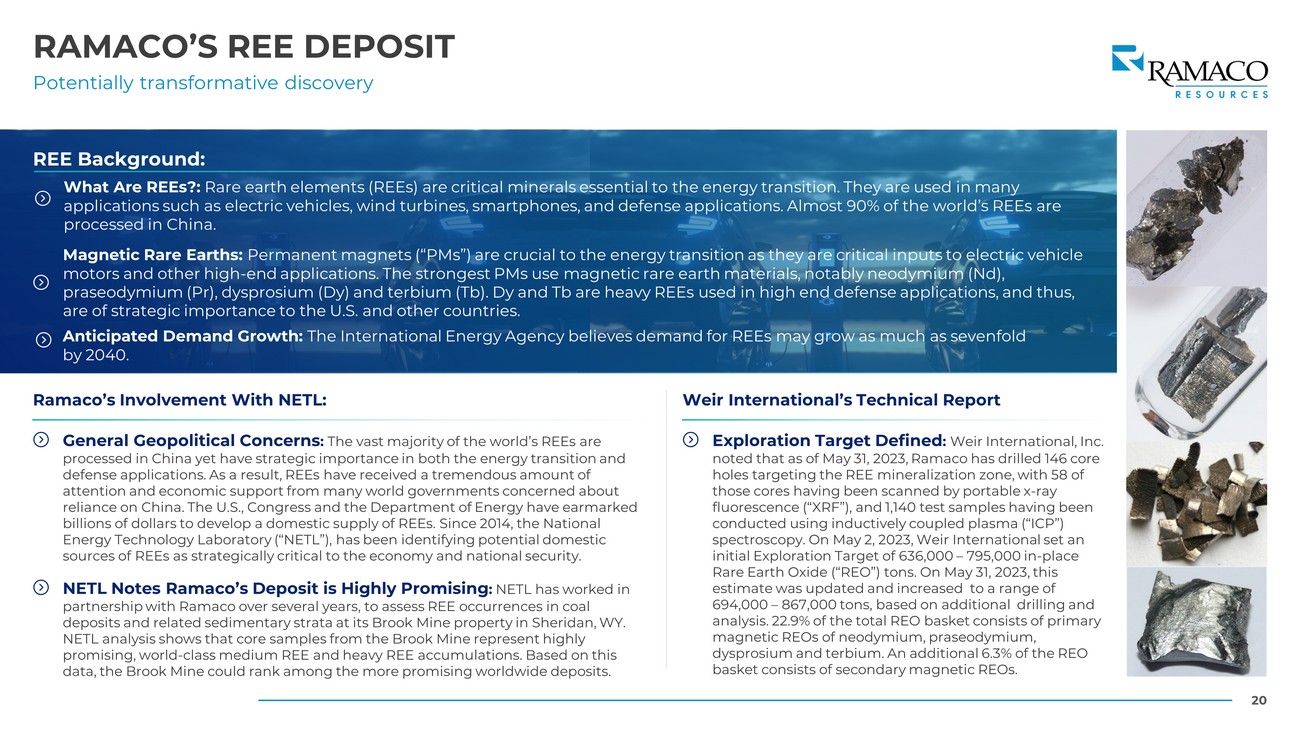
20 RAMACO’S REE DEPOSIT Potentially transformative discovery REE Background: What Are REEs?: Rare earth elements (REEs) are critical minerals essential to the energy transition. They are used in many applications such as electric vehicles, wind turbines, smartphones, and defense applications. Almost 90% of the world’s REEs are processed in China. Magnetic Rare Earths: Permanent magnets (“PMs”) are crucial to the energy transition as they are critical inputs to electric vehicle motors and other high - end applications. The strongest PMs use magnetic rare earth materials, notably neodymium (Nd), praseodymium (Pr), dysprosium (Dy) and terbium (Tb). Dy and Tb are heavy REEs used in high end defense applications, and thus , are of strategic importance to the U.S. and other countries. Anticipated Demand Growth: The International Energy Agency believes demand for REEs may grow as much as sevenfold by 2040. General Geopolitical Concerns : The vast majority of the world’s REEs are processed in China yet have strategic importance in both the energy transition and defense applications. As a result, REEs have received a tremendous amount of attention and economic support from many world governments concerned about reliance on China. The U.S., Congress and the Department of Energy have earmarked billions of dollars to develop a domestic supply of REEs. Since 2014, the National Energy Technology Laboratory (“NETL”), has been identifying potential domestic sources of REEs as strategically critical to the economy and national security. Ramaco’s Involvement With NETL: NETL Notes Ramaco’s Deposit is Highly Promising : NETL has worked in partnership with Ramaco over several years, to assess REE occurrences in coal deposits and related sedimentary strata at its Brook Mine property in Sheridan, WY. NETL analysis shows that core samples from the Brook Mine represent highly promising, world - class medium REE and heavy REE accumulations. Based on this data, the Brook Mine could rank among the more promising worldwide deposits. Exploration Target Defined : Weir International, Inc. noted that as of May 31, 2023, Ramaco has drilled 146 core holes targeting the REE mineralization zone, with 58 of those cores having been scanned by portable x - ray fluorescence (“XRF”), and 1,140 test samples having been conducted using inductively coupled plasma (“ICP”) spectroscopy. On May 2, 2023, Weir International set an initial Exploration Target of 636,000 – 795,000 in - place Rare Earth Oxide (“REO”) tons. On May 31, 2023, this estimate was updated and increased to a range of 694,000 – 867,000 tons, based on additional drilling and analysis. 22.9% of the total REO basket consists of primary magnetic REOs of neodymium, praseodymium, dysprosium and terbium. An additional 6.3% of the REO basket consists of secondary magnetic REOs. Weir International’s Technical Report
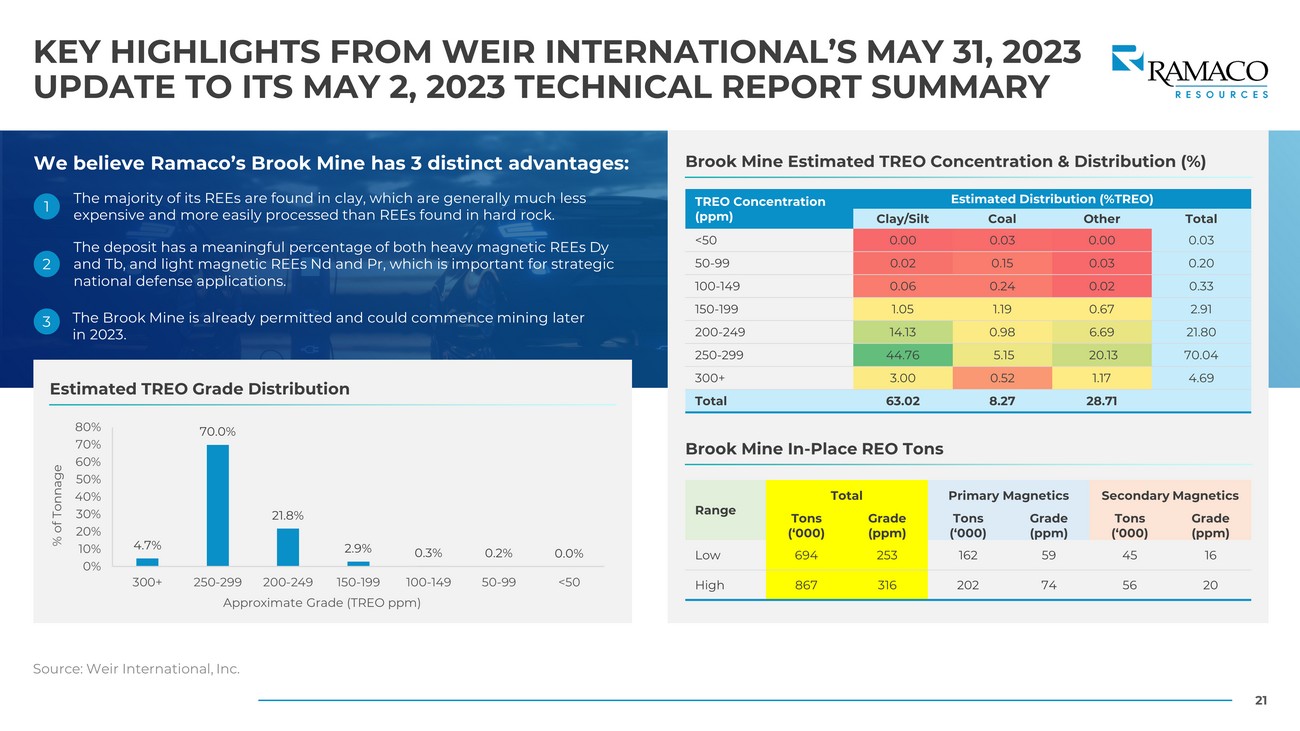
21 KEY HIGHLIGHTS FROM WEIR INTERNATIONAL’S MAY 31, 2023 UPDATE TO ITS MAY 2, 2023 TECHNICAL REPORT SUMMARY Source: Weir International, Inc. TREO Concentration (ppm) Estimated Distribution (%TREO) Clay/Silt Coal Other Total <50 0.00 0.03 0.00 0.03 50 - 99 0.02 0.15 0.03 0.20 100 - 149 0.06 0.24 0.02 0.33 150 - 199 1.05 1.19 0.67 2.91 200 - 249 14.13 0.98 6.69 21.80 250 - 299 44.76 5.15 20.13 70.04 300+ 3.00 0.52 1.17 4.69 Total 63.02 8.27 28.71 We believe Ramaco’s Brook Mine has 3 distinct advantages: 1 The majority of its REEs are found in clay, which are generally much less expensive and more easily processed than REEs found in hard rock. 2 The deposit has a meaningful percentage of both heavy magnetic REEs Dy and Tb, and light magnetic REEs Nd and Pr, which is important for strategic national defense applications. 3 The Brook Mine is already permitted and could commence mining later in 2023. Estimated TREO Grade Distribution 4.7% 70.0% 21.8% 2.9% 0.3% 0.2% 0.0% 0% 10% 20% 30% 40% 50% 60% 70% 80% 300+ 250-299 200-249 150-199 100-149 50-99 <50 % of Tonnage Approximate Grade (TREO ppm) Brook Mine Estimated TREO Concentration & Distribution (%) Brook Mine In - Place REO Tons Range Total Primary Magnetics Secondary Magnetics Tons (‘000) Grade (ppm) Tons (‘000) Grade (ppm) Tons (‘000) Grade (ppm) Low 694 253 162 59 45 16 High 867 316 202 74 56 20
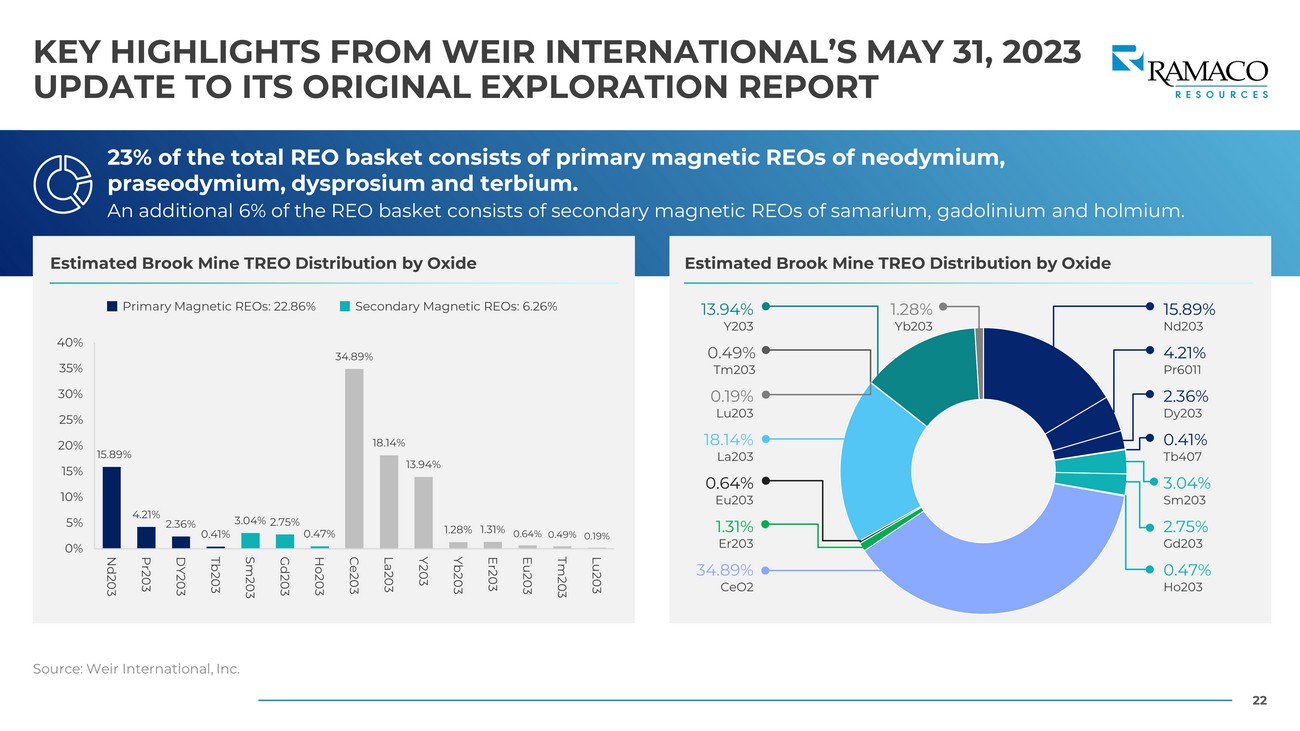
22 KEY HIGHLIGHTS FROM WEIR INTERNATIONAL’S MAY 31, 2023 UPDATE TO ITS ORIGINAL EXPLORATION REPORT Source: Weir International, Inc. Estimated Brook Mine TREO Distribution by Oxide Estimated Brook Mine TREO Distribution by Oxide 15.89% 4.21% 2.36% 0.41% 3.04% 2.75% 0.47% 34.89% 18.14% 13.94% 1.28% 1.31% 0.64% 0.49% 0.19% 0% 5% 10% 15% 20% 25% 30% 35% 40% Nd203 Pr203 DY203 Tb203 Sm203 Gd203 Ho203 Ce203 La203 Y203 Yb203 Er203 Eu203 Tm203 Lu203 Primary Magnetic REOs: 22.86% Secondary Magnetic REOs: 6.26% 23% of the total REO basket consists of primary magnetic REOs of neodymium, praseodymium, dysprosium and terbium. An additional 6% of the REO basket consists of secondary magnetic REOs of samarium, gadolinium and holmium. 15.89% Nd203 4.21% Pr6011 2.36% Dy203 0.41% Tb407 3.04% Sm203 2.75% Gd203 0.47% Ho203 0.49% Tm203 0.19% Lu203 18.14% La203 0.64% Eu203 1.31% Er203 34.89% CeO2 13.94% Y203 1.28% Yb203
MET COAL MINING OPERATIONS
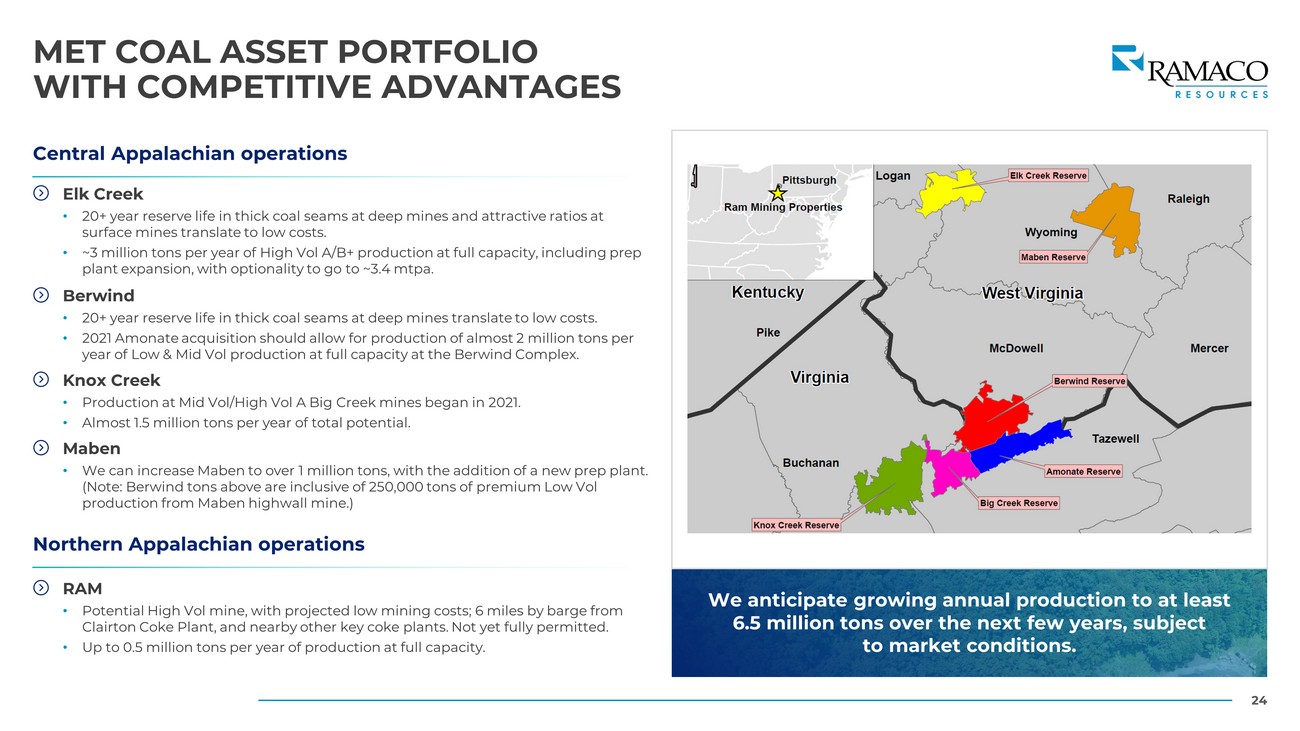
24 MET COAL ASSET PORTFOLIO WITH COMPETITIVE ADVANTAGES We anticipate growing annual production to at least 6.5 million tons over the next few years, subject to market conditions. Elk Creek • 20+ year reserve life in thick coal seams at deep mines and attractive ratios at surface mines translate to low costs. • ~3 million tons per year of High Vol A/B+ production at full capacity, including prep plant expansion, with optionality to go to ~3.4 mtpa. Central Appalachian operations Berwind • 20+ year reserve life in thick coal seams at deep mines translate to low costs. • 2021 Amonate acquisition should allow for production of almost 2 million tons per year of Low & Mid Vol production at full capacity at the Berwind Complex. Knox Creek • Production at Mid Vol/High Vol A Big Creek mines began in 2021. • Almost 1.5 million tons per year of total potential. Maben • We can increase Maben to over 1 million tons, with the addition of a new prep plant. (Note: Berwind tons above are inclusive of 250,000 tons of premium Low Vol production from Maben highwall mine.) RAM • Potential High Vol mine, with projected low mining costs; 6 miles by barge from Clairton Coke Plant, and nearby other key coke plants. Not yet fully permitted. • Up to 0.5 million tons per year of production at full capacity. Northern Appalachian operations
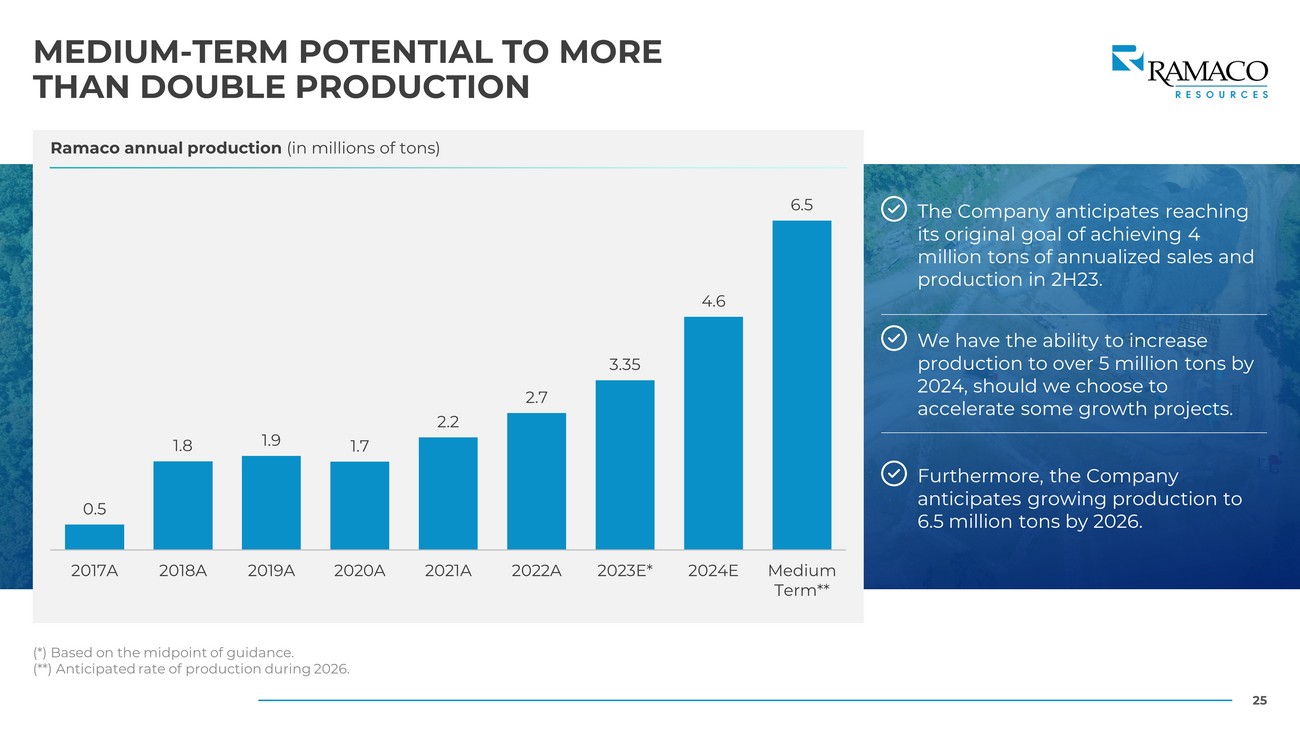
25 MEDIUM - TERM POTENTIAL TO MORE THAN DOUBLE PRODUCTION (*) Based on the midpoint of guidance. (**) Anticipated rate of production during 2026. Ramaco annual production (in millions of tons) 0.5 1.8 1.9 1.7 2.2 2.7 3.35 4.6 6.5 2017A 2018A 2019A 2020A 2021A 2022A 2023E* 2024E Medium Term** The Company anticipates reaching its original goal of achieving 4 million tons of annualized sales and production in 2H23. Furthermore, the Company anticipates growing production to 6.5 million tons by 2026. We have the ability to increase production to over 5 million tons by 2024, should we choose to accelerate some growth projects.

26 RUNWAY TO 6.5 MILLION TONS OF PRODUCTION (1): Some 2024 - 25 growth capital is subject to Board approval. Totals may not add due to rounding. We anticipate reaching 6.5 million tons of production by 2026, based on growth capital expenditures of $111 million from 2023 - 25. 2022 was our peak capex year, with over $90 million spent in growth capital alone last year. Elk Creek Complex Production 2023 Capex 2024 Capex 2025 Capex Total Capex Quality 2023E Production 2.3 HVA/B+ Plant Expansion + Crucible & Ram #3 Mines + 2nd 0.7 $18 $10 $28 HVA/B+ Additional Rail Loadout + Additional Mine Section 0.4 $15 $5 $20 HVA/B+ Target Elk Creek Production 1 3.4 $18 $25 $5 $48 HVA/B+ Berwind Complex Production 2023 Capex 2024 Capex 2025 Capex Total Capex Quality 2023E Production 0.7 LV/MV Ongoing Ramp At Berwind, Laurel Fork, Triad 1.0 $11 $18 $7 $36 LV/MV Triple S, Maben Highwall Mines 0.2 LV Target Berwind Production 1 1.9 $11 $18 $7 $36 LV/MV Knox Creek Complex Production 2023 Capex 2024 Capex 2025 Capex Total Capex Quality 2023E Production 0.4 MV/HVA Ongoing Ramp At Big Creek Jawbone 0.4 $4 $7 $11 MV/HVA Knox Creek Jawbone Mine 0.5 $9 $9 $18 HVA Target Knox Creek Production 1 1.3 $4 $16 $9 $29 MV/HVA Total by Complex Production 2023 Capex 2024 Capex 2025 Capex Total Capex Quality Elk Creek 3.4 $18 $25 $5 $48 HVA/B+ Berwind 1.9 $11 $18 $7 $36 LV/MV Knox Creek 1.3 $4 $16 $9 $29 MV/HVA Target Overall Production 1 6.5 $32 $58 $21 $111 Targeted Incremental Production (millions of tons) Growth Capital Expenditures ($MMs) $90 $32 $58 $21 2022 2023 2024 2025 6.5 3.35
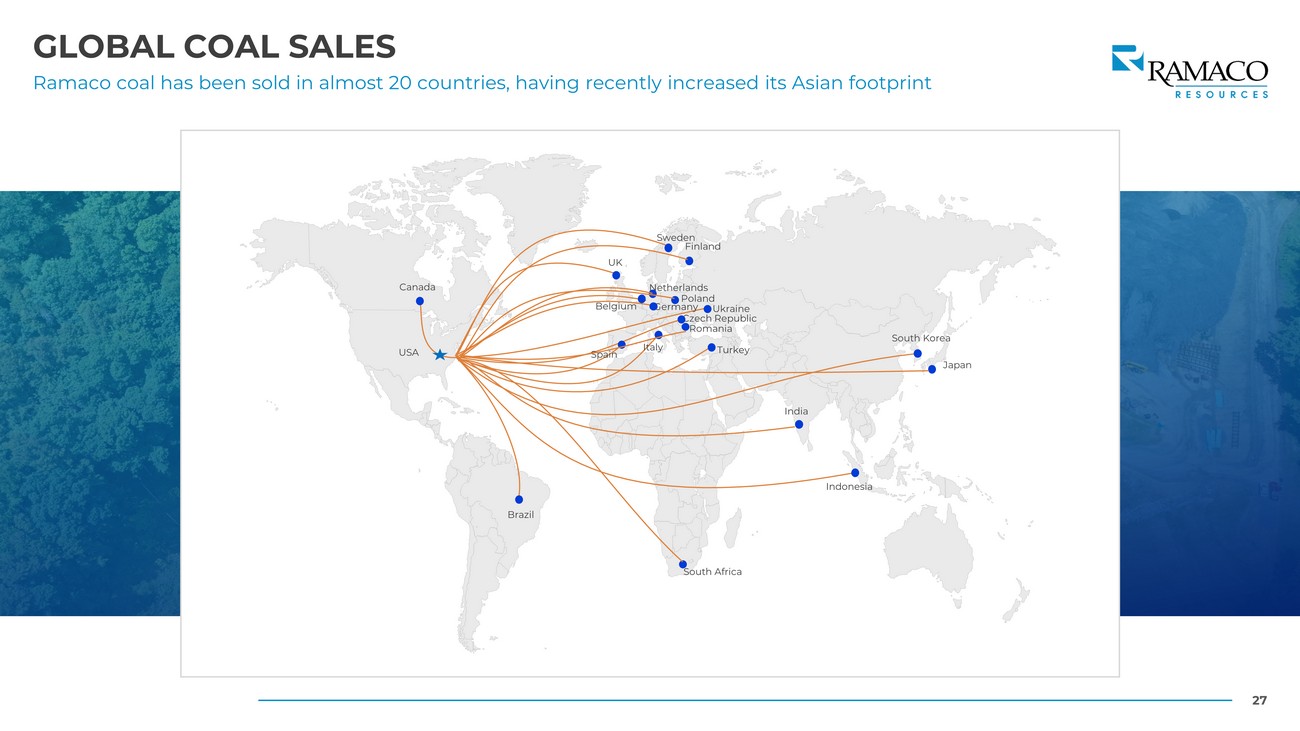
27 GLOBAL COAL SALES Ramaco coal has been sold in almost 20 countries, having recently increased its Asian footprint Brazil USA Canada UK South Korea Turkey Italy Ukraine Romania Belgium Spain South Africa Czech Republic Germany Poland Netherlands Sweden India Finland Japan Indonesia
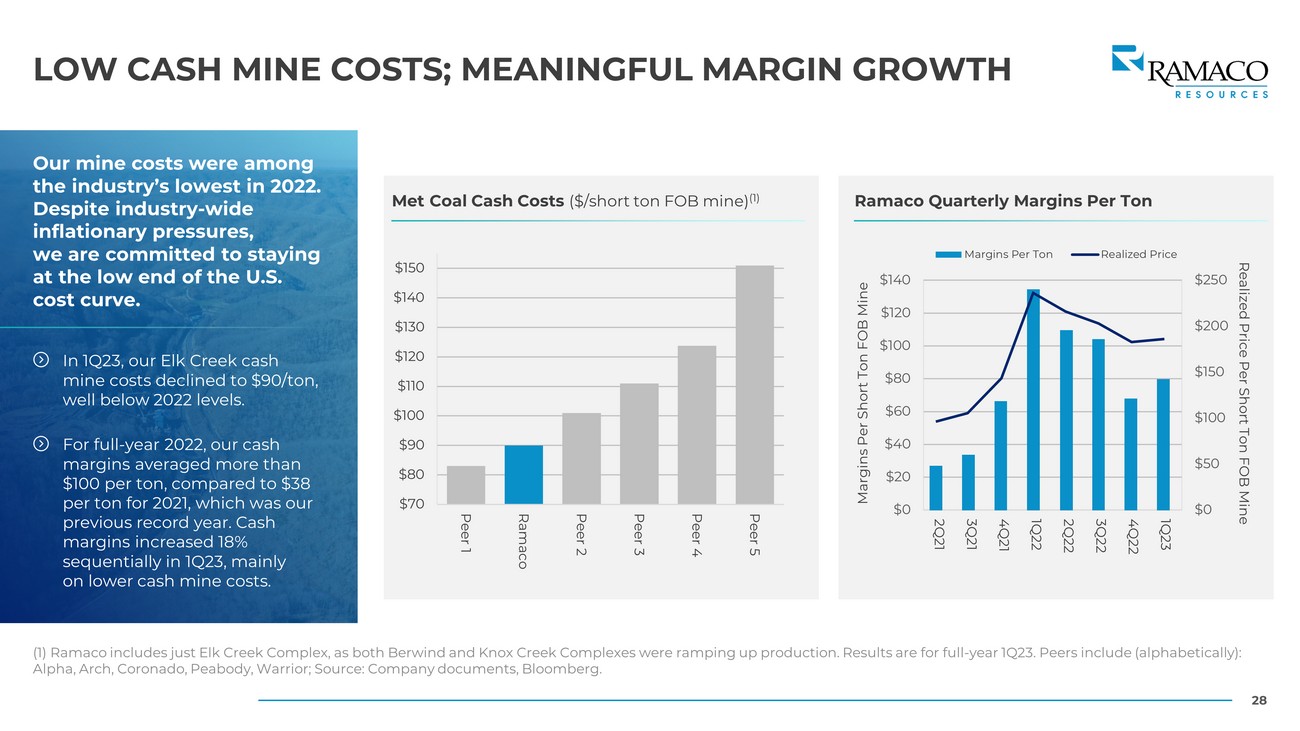
28 LOW CASH MINE COSTS; MEANINGFUL MARGIN GROWTH (1) Ramaco includes just Elk Creek Complex, as both Berwind and Knox Creek Complexes were ramping up production. Results are for full - year 1Q23. Peers include (alphabetically): Alpha, Arch, Coronado, Peabody, Warrior; Source: Company documents, Bloomberg. Our mine costs were among the industry’s lowest in 2022. Despite industry - wide inflationary pressures, we are committed to staying at the low end of the U.S. cost curve. Ramaco Quarterly Margins Per Ton In 1Q23, our Elk Creek cash mine costs declined to $90/ton, well below 2022 levels. For full - year 2022, our cash margins averaged more than $100 per ton, compared to $38 per ton for 2021, which was our previous record year. Cash margins increased 18% sequentially in 1Q23, mainly on lower cash mine costs. Met Coal Cash Costs ($/short ton FOB mine) (1) $70 $80 $90 $100 $110 $120 $130 $140 $150 Peer 1 Ramaco Peer 2 Peer 3 Peer 4 Peer 5 $0 $50 $100 $150 $200 $250 $0 $20 $40 $60 $80 $100 $120 $140 2Q21 3Q21 4Q21 1Q22 2Q22 3Q22 4Q22 1Q23 Margins Per Ton Realized Price Margins Per Short Ton FOB Mine Realized Price Per Short Ton FOB Mine
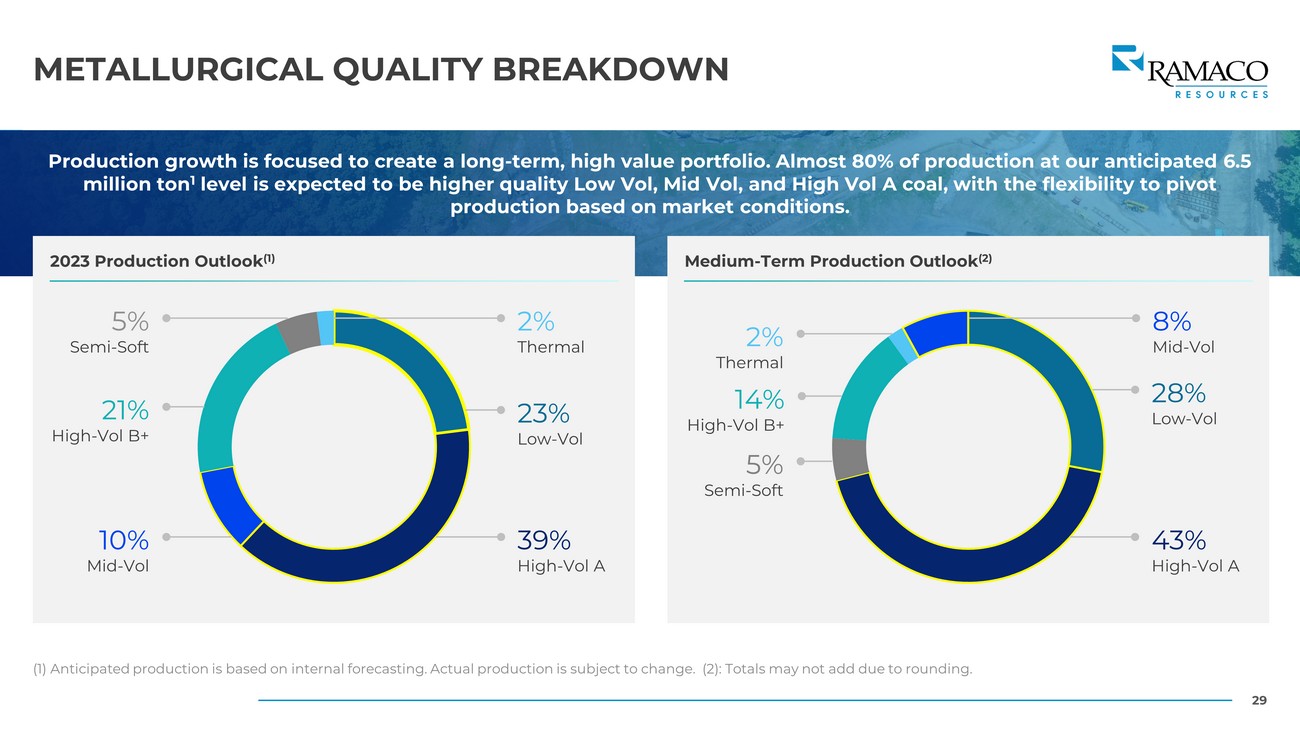
29 METALLURGICAL QUALITY BREAKDOWN (1) Anticipated production is based on internal forecasting. Actual production is subject to change. (2): Totals may not add du e to rounding. Production growth is focused to create a long - term, high value portfolio. Almost 80% of production at our anticipated 6.5 million ton 1 level is expected to be higher quality Low Vol, Mid Vol, and High Vol A coal, with the flexibility to pivot production based on market conditions. 2023 Production Outlook (1) Medium - Term Production Outlook (2) 23% Low - Vol 39% High - Vol A 10% Mid - Vol 21% High - Vol B+ 5% Semi - Soft 2% Thermal 28% Low - Vol 43% High - Vol A 5% Semi - Soft 14% High - Vol B+ 2% Thermal 8% Mid - Vol
MET COAL MARKET OVERVIEW
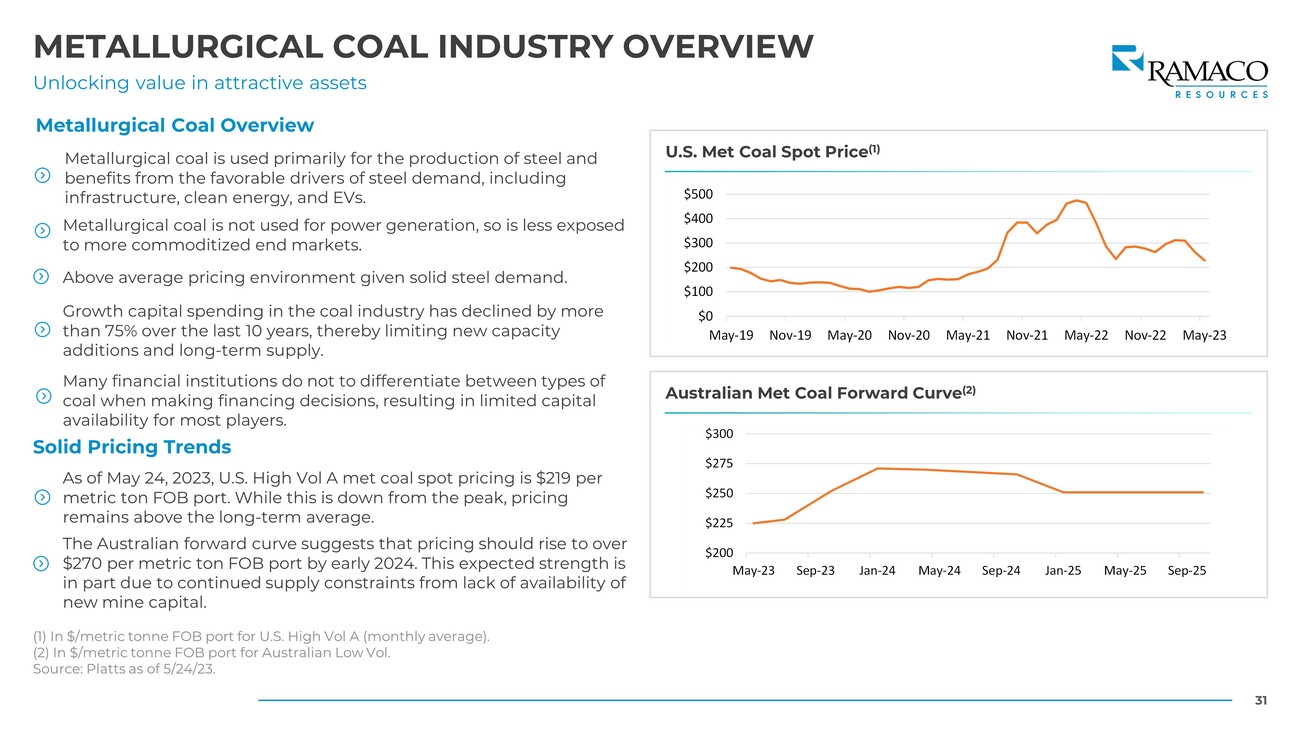
31 METALLURGICAL COAL INDUSTRY OVERVIEW Unlocking value in attractive assets (1) In $/metric tonne FOB port for U.S. High Vol A (monthly average). (2) In $/metric tonne FOB port for Australian Low Vol. Source: Platts as of 5/24/23. Metallurgical Coal Overview Metallurgical coal is used primarily for the production of steel and benefits from the favorable drivers of steel demand, including infrastructure, clean energy, and EVs. Metallurgical coal is not used for power generation, so is less exposed to more commoditized end markets. Above average pricing environment given solid steel demand. Growth capital spending in the coal industry has declined by more than 75% over the last 10 years, thereby limiting new capacity additions and long - term supply. Many financial institutions do not to differentiate between types of coal when making financing decisions, resulting in limited capital availability for most players. Solid Pricing Trends As of May 24, 2023, U.S. High Vol A met coal spot pricing is $219 per metric ton FOB port. While this is down from the peak, pricing remains above the long - term average. The Australian forward curve suggests that pricing should rise to over $270 per metric ton FOB port by early 2024. This expected strength is in part due to continued supply constraints from lack of availability of new mine capital. U.S. Met Coal Spot Price (1) Australian Met Coal Forward Curve (2) $200 $225 $250 $275 $300 May-23 Sep-23 Jan-24 May-24 Sep-24 Jan-25 May-25 Sep-25 $0 $100 $200 $300 $400 $500 May-19 Nov-19 May-20 Nov-20 May-21 Nov-21 May-22 Nov-22 May-23
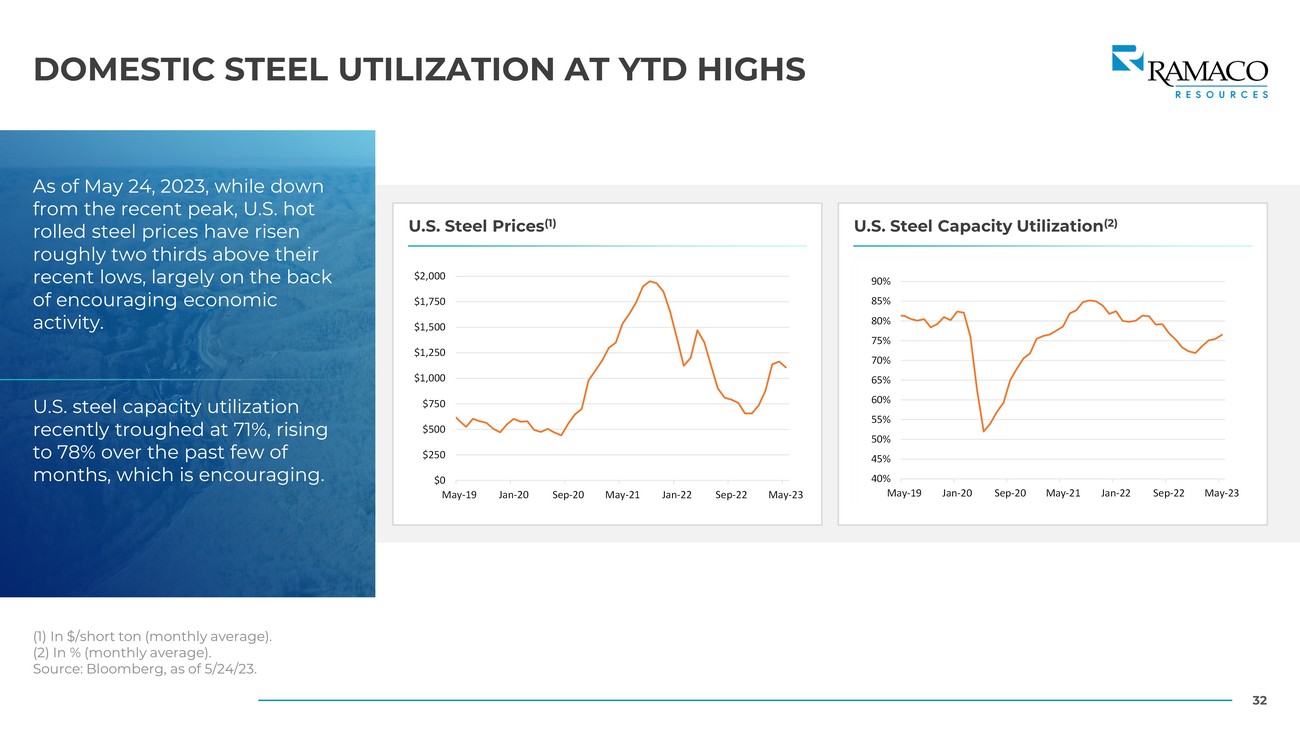
32 DOMESTIC STEEL UTILIZATION AT YTD HIGHS (1) In $/short ton (monthly average). (2) In % (monthly average). Source: Bloomberg, as of 5/24/23. U.S. Steel Prices (1) U.S. Steel Capacity Utilization (2) As of May 24, 2023, while down from the recent peak, U.S. hot rolled steel prices have risen roughly two thirds above their recent lows, largely on the back of encouraging economic activity. U.S. steel capacity utilization recently troughed at 71%, rising to 78% over the past few of months, which is encouraging. $0 $250 $500 $750 $1,000 $1,250 $1,500 $1,750 $2,000 May-19 Jan-20 Sep-20 May-21 Jan-22 Sep-22 May-23
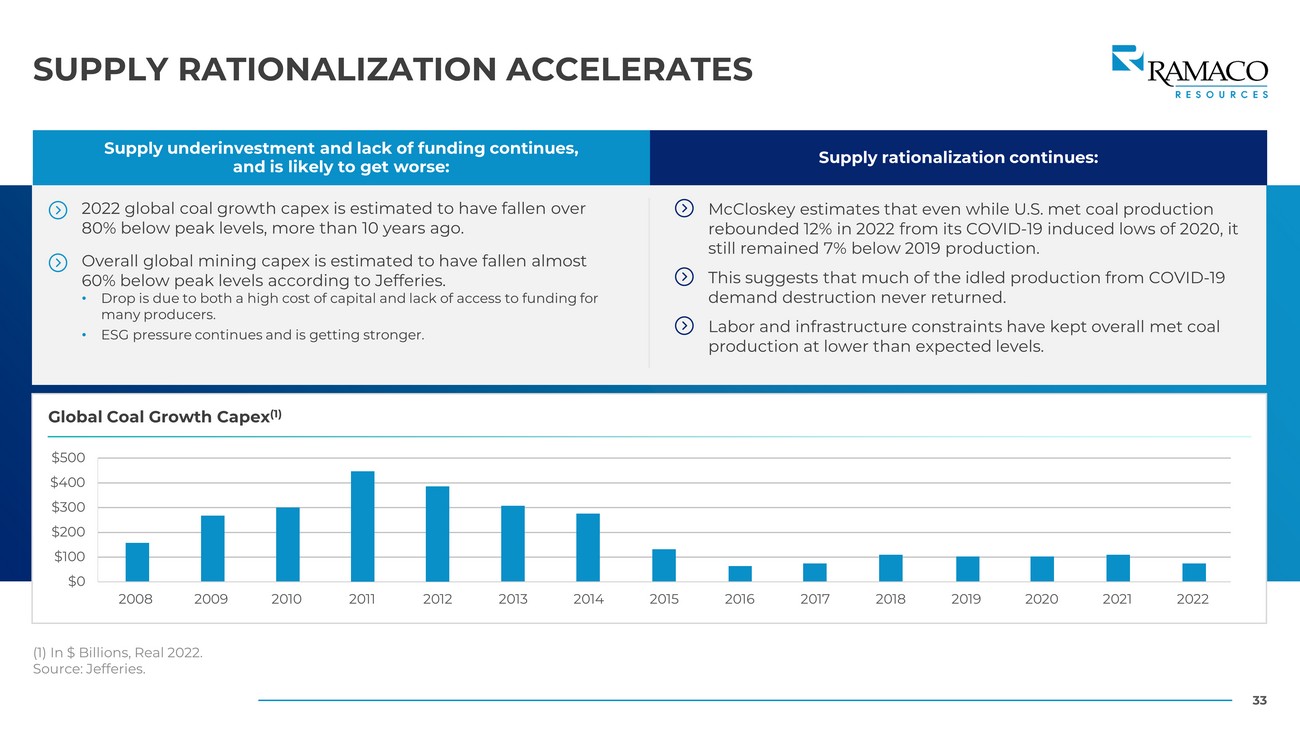
33 SUPPLY RATIONALIZATION ACCELERATES Supply underinvestment and lack of funding continues, and is likely to get worse: Supply rationalization continues: 2022 global coal growth capex is estimated to have fallen over 80% below peak levels, more than 10 years ago. Overall global mining capex is estimated to have fallen almost 60% below peak levels according to Jefferies. • Drop is due to both a high cost of capital and lack of access to funding for many producers. • ESG pressure continues and is getting stronger. McCloskey estimates that even while U.S. met coal production rebounded 12% in 2022 from its COVID - 19 induced lows of 2020, it still remained 7% below 2019 production. This suggests that much of the idled production from COVID - 19 demand destruction never returned. Labor and infrastructure constraints have kept overall met coal production at lower than expected levels. (1) In $ Billions, Real 2022. Source: Jefferies. Global Coal Growth Capex (1) $0 $100 $200 $300 $400 $500 2008 2009 2010 2011 2012 2013 2014 2015 2016 2017 2018 2019 2020 2021 2022

SAFETY AND ENVIRONMENTAL COMMITMENTS
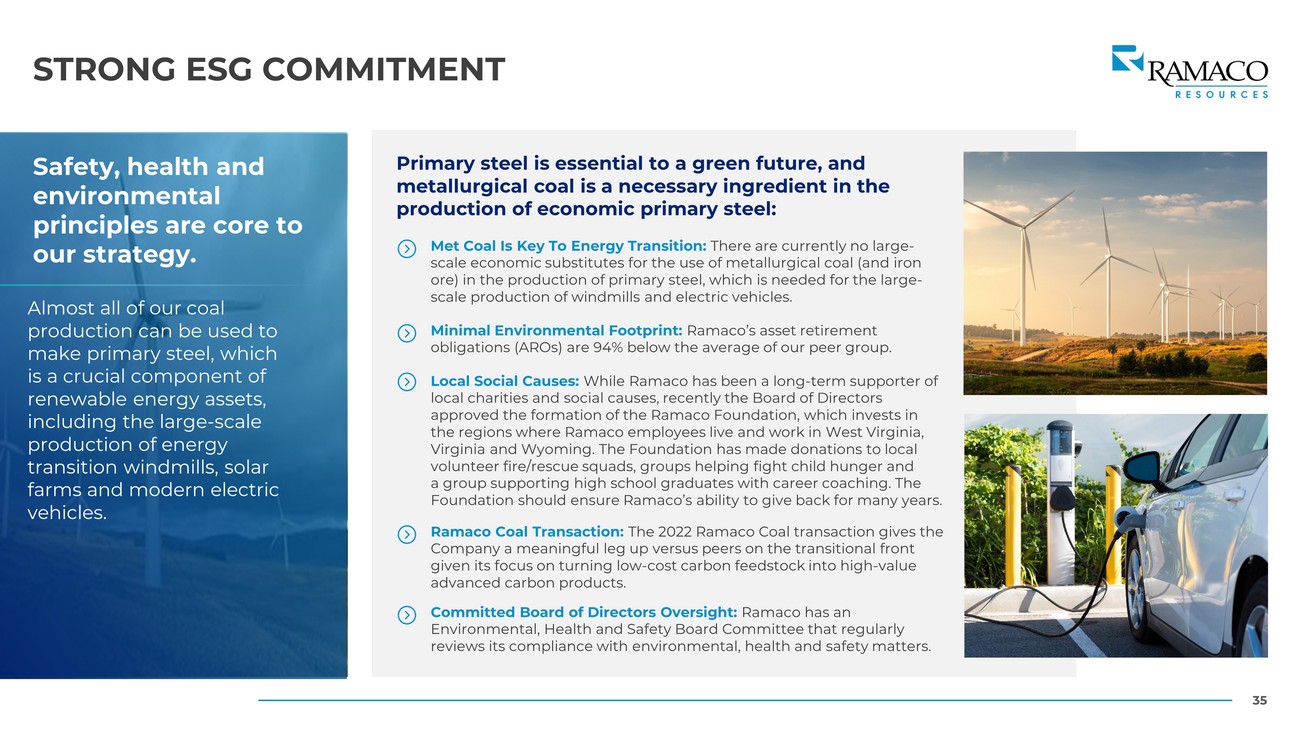
35 STRONG ESG COMMITMENT Safety, health and environmental principles are core to our strategy. Almost all of our coal production can be used to make primary steel, which is a crucial component of renewable energy assets, including the large - scale production of energy transition windmills, solar farms and modern electric vehicles. Primary steel is essential to a green future, and metallurgical coal is a necessary ingredient in the production of economic primary steel: Met Coal Is Key To Energy Transition: There are currently no large - scale economic substitutes for the use of metallurgical coal (and iron ore) in the production of primary steel, which is needed for the large - scale production of windmills and electric vehicles. Minimal Environmental Footprint: Ramaco’s asset retirement obligations (AROs) are 94% below the average of our peer group. Local Social Causes: While Ramaco has been a long - term supporter of local charities and social causes, recently the Board of Directors approved the formation of the Ramaco Foundation, which invests in the regions where Ramaco employees live and work in West Virginia, Virginia and Wyoming. The Foundation has made donations to local volunteer fire/rescue squads, groups helping fight child hunger and a group supporting high school graduates with career coaching. The Foundation should ensure Ramaco’s ability to give back for many years. Ramaco Coal Transaction: The 2022 Ramaco Coal transaction gives the Company a meaningful leg up versus peers on the transitional front given its focus on turning low - cost carbon feedstock into high - value advanced carbon products. Committed Board of Directors Oversight: Ramaco has an Environmental, Health and Safety Board Committee that regularly reviews its compliance with environmental, health and safety matters.
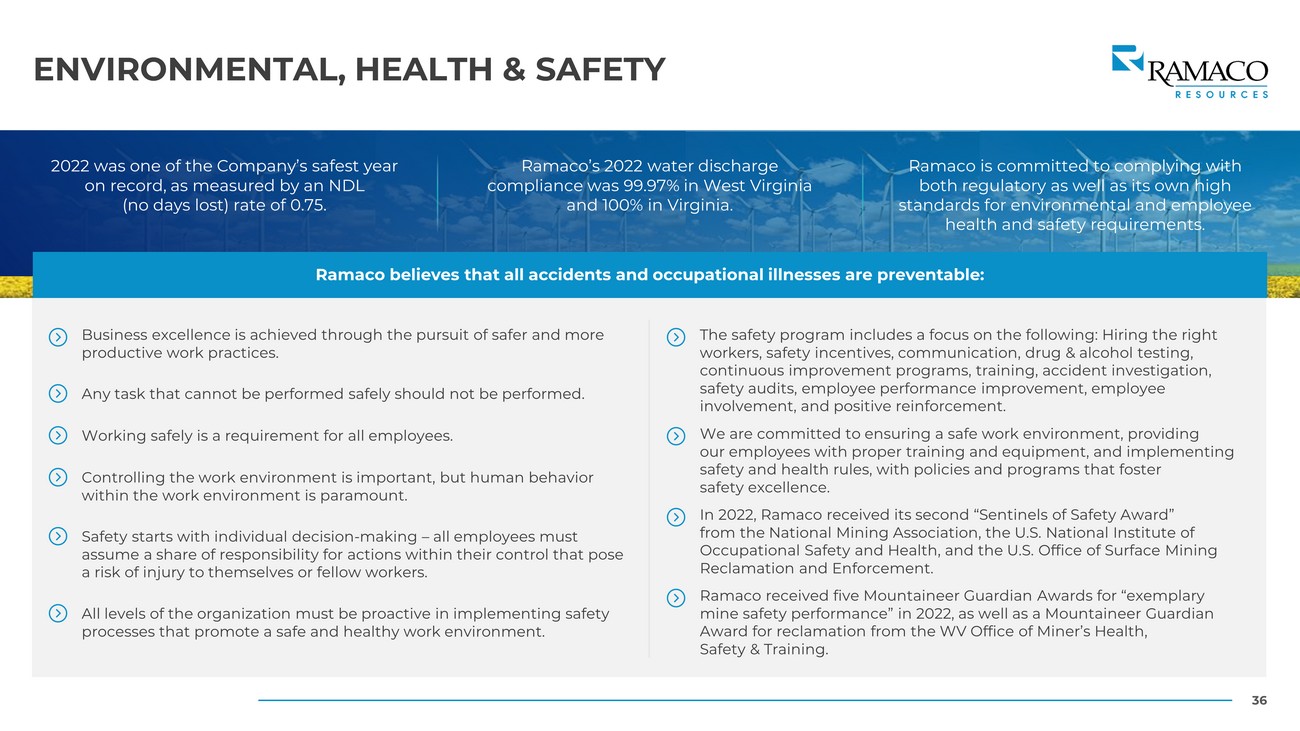
36 ENVIRONMENTAL, HEALTH & SAFETY 2022 was one of the Company’s safest year on record, as measured by an NDL (no days lost) rate of 0.75. Ramaco’s 2022 water discharge compliance was 99.97% in West Virginia and 100% in Virginia. Ramaco is committed to complying with both regulatory as well as its own high standards for environmental and employee health and safety requirements. Ramaco believes that all accidents and occupational illnesses are preventable: Business excellence is achieved through the pursuit of safer and more productive work practices. Any task that cannot be performed safely should not be performed. Working safely is a requirement for all employees. Controlling the work environment is important, but human behavior within the work environment is paramount. Safety starts with individual decision - making – all employees must assume a share of responsibility for actions within their control that pose a risk of injury to themselves or fellow workers. All levels of the organization must be proactive in implementing safety processes that promote a safe and healthy work environment. The safety program includes a focus on the following: Hiring the right workers, safety incentives, communication, drug & alcohol testing, continuous improvement programs, training, accident investigation, safety audits, employee performance improvement, employee involvement, and positive reinforcement. We are committed to ensuring a safe work environment, providing our employees with proper training and equipment, and implementing safety and health rules, with policies and programs that foster safety excellence. In 2022, Ramaco received its second “Sentinels of Safety Award” from the National Mining Association, the U.S. National Institute of Occupational Safety and Health, and the U.S. Office of Surface Mining Reclamation and Enforcement. Ramaco received five Mountaineer Guardian Awards for “exemplary mine safety performance” in 2022, as well as a Mountaineer Guardian Award for reclamation from the WV Office of Miner’s Health, Safety & Training.
APPENDIX
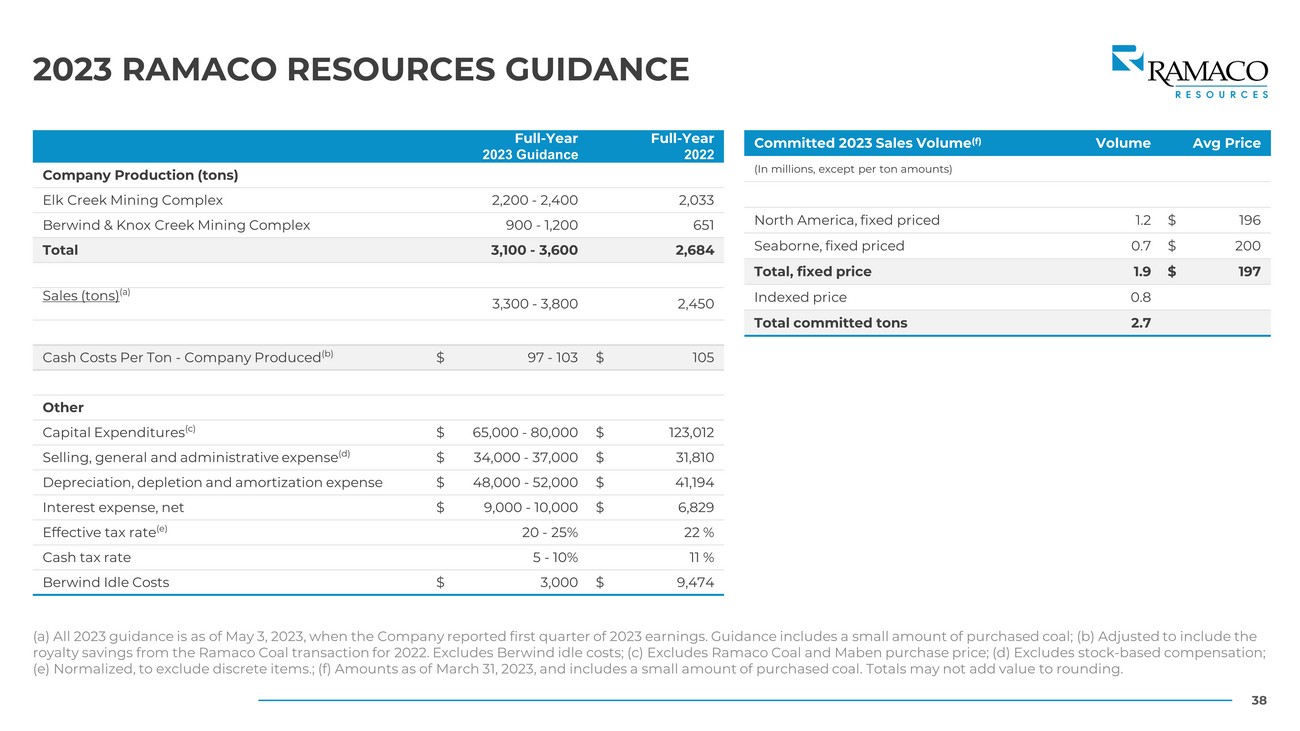
38 2023 RAMACO RESOURCES GUIDANCE (a) All 2023 guidance is as of May 3, 2023, when the Company reported first quarter of 2023 earnings. Guidance includes a sma ll amount of purchased coal; (b) Adjusted to include the royalty savings from the Ramaco Coal transaction for 2022. Excludes Berwind idle costs; (c) Excludes Ramaco Coal and Maben pu rch ase price; (d) Excludes stock - based compensation; (e) Normalized, to exclude discrete items.; (f) Amounts as of March 31, 2023, and includes a small amount of purchased coal. Tot als may not add value to rounding. Full - Year 2023 Guidance Full - Year 2022 Company Production (tons) Elk Creek Mining Complex 2,200 - 2,400 2,033 Berwind & Knox Creek Mining Complex 900 - 1,200 651 Total 3,100 - 3,600 2,684 Sales (tons) (a) 3,300 - 3,800 2,450 Cash Costs Per Ton - Company Produced (b) $ 97 - 103 $ 105 Other Capital Expenditures (c) $ 65,000 - 80,000 $ 123,012 Selling, general and administrative expense (d) $ 34,000 - 37,000 $ 31,810 Depreciation, depletion and amortization expense $ 48,000 - 52,000 $ 41,194 Interest expense, net $ 9,000 - 10,000 $ 6,829 Effective tax rate (e) 20 - 25% 22 % Cash tax rate 5 - 10% 11 % Berwind Idle Costs $ 3,000 $ 9,474 Committed 2023 Sales Volume (f) Volume Avg Price (In millions, except per ton amounts) North America, fixed priced 1.2 $ 196 Seaborne, fixed priced 0.7 $ 200 Total, fixed price 1.9 $ 197 Indexed price 0.8 Total committed tons 2.7
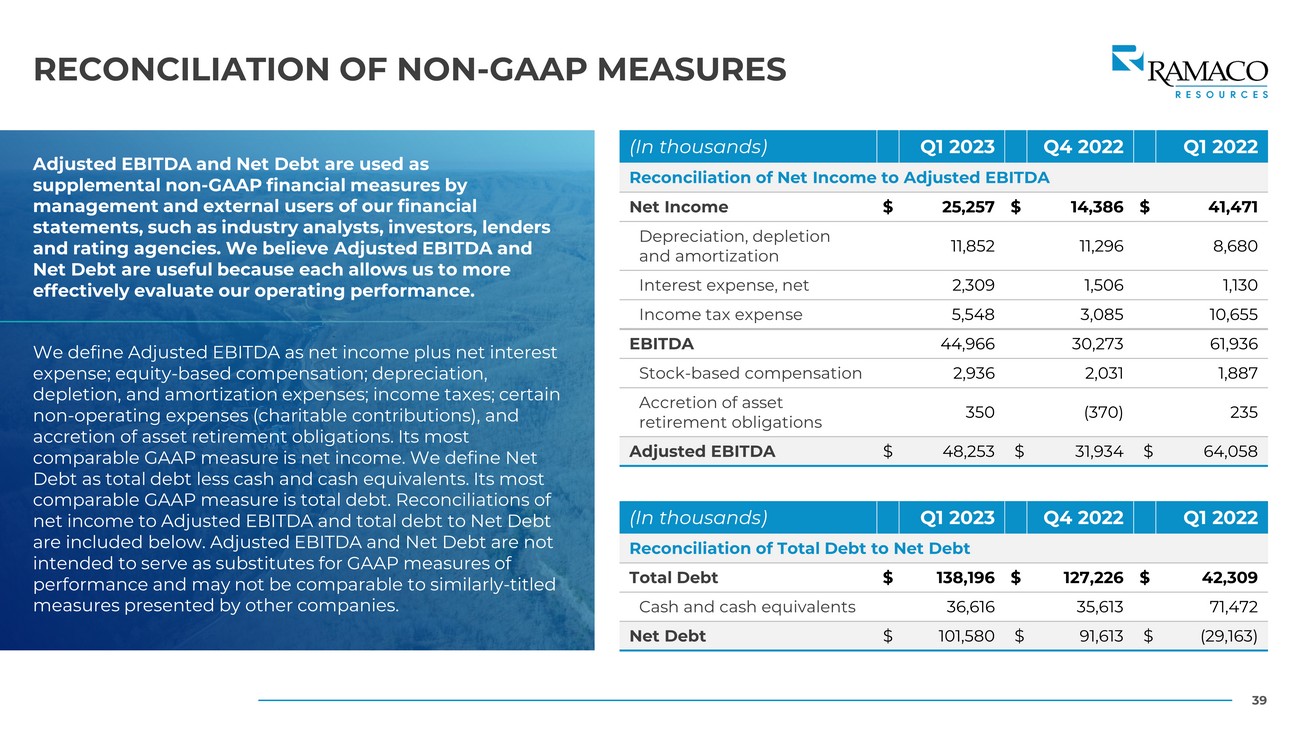
39 RECONCILIATION OF NON - GAAP MEASURES Adjusted EBITDA and Net Debt are used as supplemental non - GAAP financial measures by management and external users of our financial statements, such as industry analysts, investors, lenders and rating agencies. We believe Adjusted EBITDA and Net Debt are useful because each allows us to more effectively evaluate our operating performance. We define Adjusted EBITDA as net income plus net interest expense; equity - based compensation; depreciation, depletion, and amortization expenses; income taxes; certain non - operating expenses (charitable contributions), and accretion of asset retirement obligations. Its most comparable GAAP measure is net income. We define Net Debt as total debt less cash and cash equivalents. Its most comparable GAAP measure is total debt. Reconciliations of net income to Adjusted EBITDA and total debt to Net Debt are included below. Adjusted EBITDA and Net Debt are not intended to serve as substitutes for GAAP measures of performance and may not be comparable to similarly - titled measures presented by other companies. (In thousands) Q1 2023 Q4 2022 Q1 2022 Reconciliation of Net Income to Adjusted EBITDA Net Income $ 25,257 $ 14,386 $ 41,471 Depreciation, depletion and amortization 11,852 11,296 8,680 Interest expense, net 2,309 1,506 1,130 Income tax expense 5,548 3,085 10,655 EBITDA 44,966 30,273 61,936 Stock - based compensation 2,936 2,031 1,887 Accretion of asset retirement obligations 350 (370) 235 Adjusted EBITDA $ 48,253 $ 31,934 $ 64,058 (In thousands) Q1 2023 Q4 2022 Q1 2022 Reconciliation of Total Debt to Net Debt Total Debt $ 138,196 $ 127,226 $ 42,309 Cash and cash equivalents 36,616 35,613 71,472 Net Debt $ 101,580 $ 91,613 $ (29,163)
40 250 West Main Street, Suite 1900 Lexington, Kentucky 40507 Investor Relations: info@ramacometc.com 859 - 244 - 7455