
.2
Forum Edge AI: Inference Infrastructure Opportunity October 2026

Disclaimer 2 Unless the context otherwise provides, "we," "us," "our," the "Company," "Forum," "Forum Markets," and like terms refer to Forum Markets, Incorporated and its subsidiaries . Disclaimers and Other Important Information We have not authorized any other person to provide you with any information other than that contained in this presentation or in any other information prepared by or on behalf of us or to which we may have referred you . We take no responsibility for, and can provide no assurance as to the reliability of, any other information that others may give you . You should assume that, unless otherwise noted, the information appearing in this presentation is accurate only as of the date of this presentation . Our business, financial condition, results of operations and future prospects may have changed since those dates . This presentation contains statements that constitute forward - looking statements within the meaning of the Private Securities Litigation Reform Act of 1995 and other applicable securities laws . All statements other than statements of historical fact are forward - looking statements, including, but not limited to, statements regarding the Company's future financial position, business strategy, budgets, projected costs, and plans and objectives of management for future operations . These statements refer to many things, including future performance, and all other statements that are not historical facts, or that are intended to be forward looking statements, should be read as forward - looking statements . There are risks associated with the contemplated transactions, including regulatory and legal uncertainty, risks of loss associated with the industry, line of business, trade, customers, partners, custodians, and vendors of the Company, and other risks . Historical facts are presented without intent to persuade . These statements can be recognized by the use of words such as "believe," "expect," "anticipate," "potential," "create," "intend," "could," "should," "would," "may," "plan," "seek," "will," "look," "future," "assume," "continue," or the negative of such terms or other variations thereof, or words of similar substance or meaning . Such forward - looking statements are not guarantees of future performance and involve risks and uncertainties, and actual results may differ from those in the forward - looking statements as a result of various factors and assumptions, that could cause actual results to differ materially from those contained in any forward - looking statement and which are inherently subject to significant uncertainties and contingencies that are or may be difficult or impossible to predict and are or may be beyond our control . The Company and its affiliates, shareholders, controlling persons, directors, officers, employees, agents, advisors and representatives assume no obligation to and do not undertake to update such forward - looking statements to reflect future events or circumstances . All trademarks, service marks, and trade names of any party of their respective affiliates used herein are trademarks, service marks, or registered trade names of such party or its respective affiliate, respectively, as noted herein . Any other product, company names, or logos mentioned herein agree the trademark and/or intellectual property of their respective owners, and their use is not alone intended to, and does not alone imply, a relationship with any party, or an endorsement or sponsorship by or of any party . Solely for convenience, the trademarks, service marks and trade names referred to in this presentation may appear without the ®, TM or SM symbols, but such references are not intended to indicate, in any way, that any party of the applicable rights owner will not assert, to the fullest extent under applicable law, their rights or the right of the applicable owner or licensor to these trademarks, service marks and trade names . Actual results may vary greatly from any assumptions or models built in reliance on this presentation . Results may vary due to market conditions, unforeseen circumstances or changes, competition, and results are subject to a multitude of risks, uncertainties, and changes . Those include but are not limited to, market conditions, the regulatory landscape, and other risks of loss .
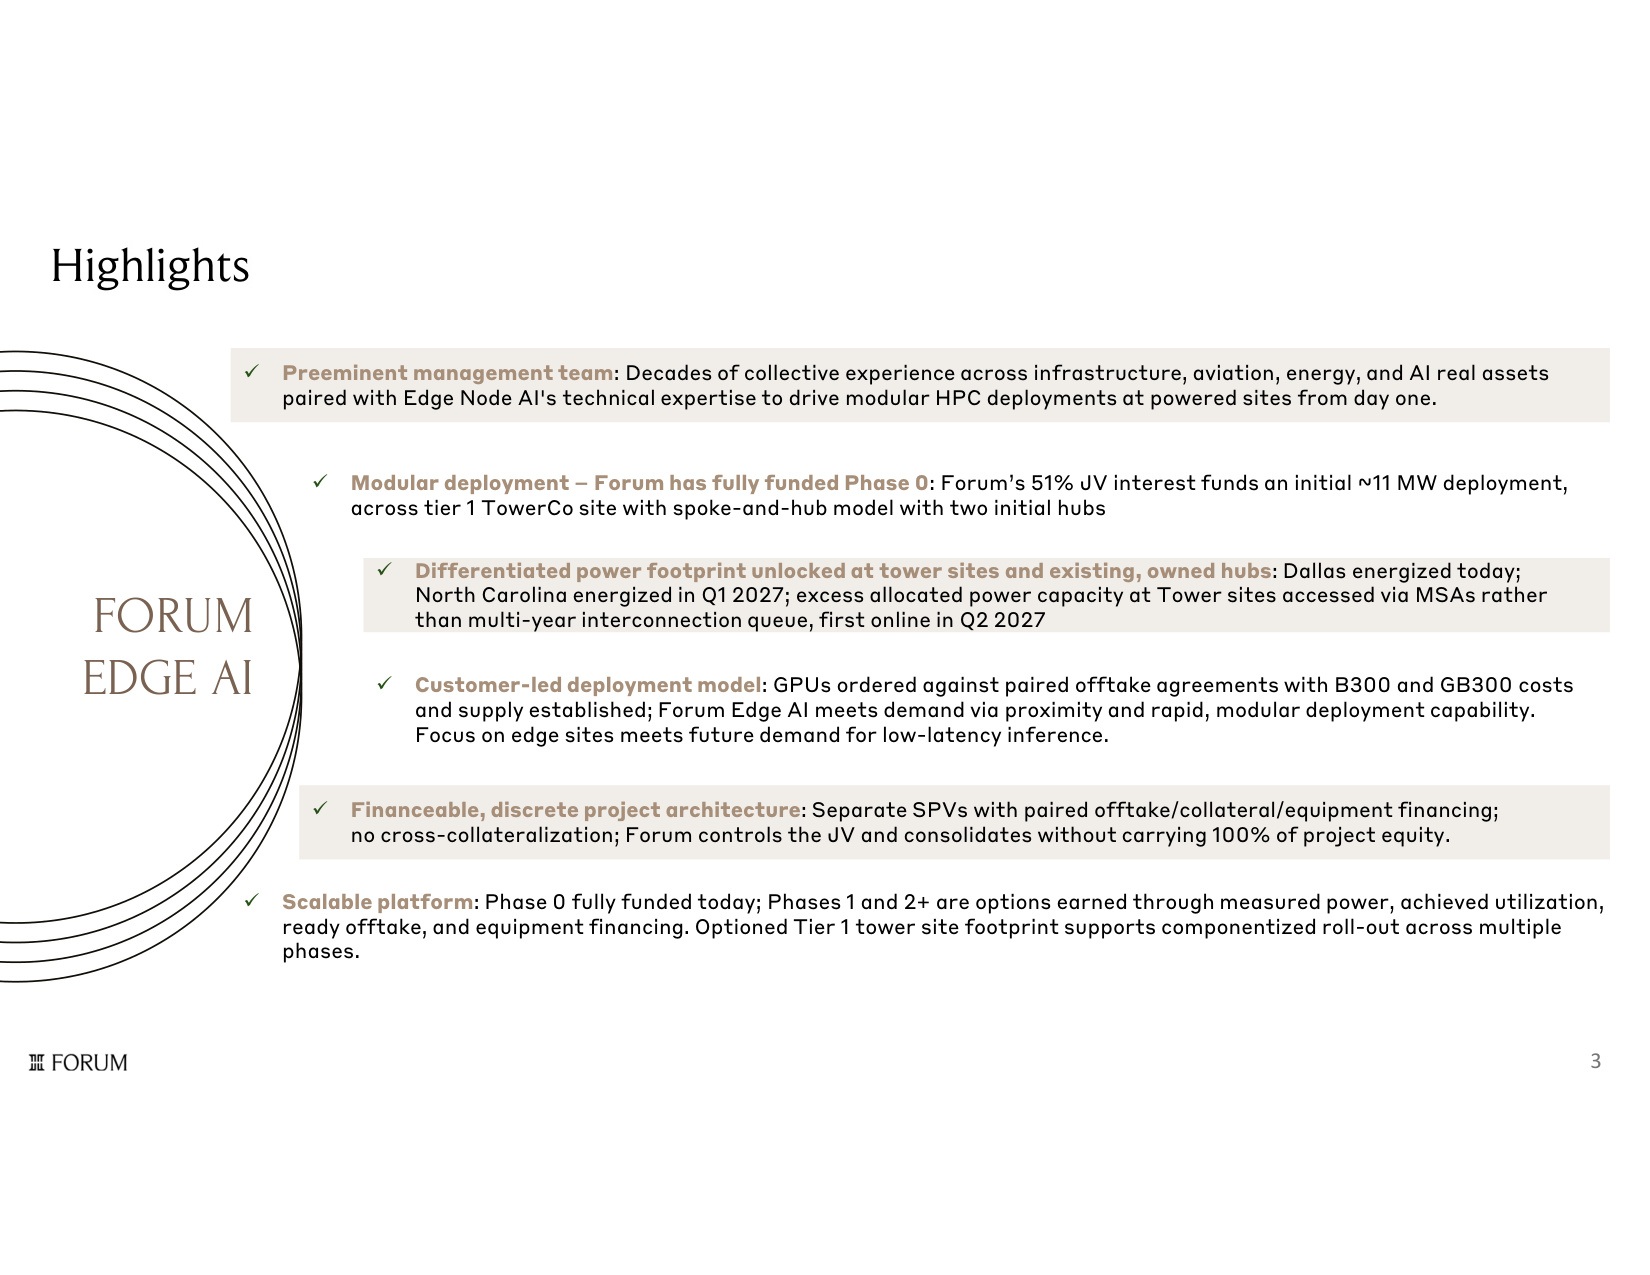
Investment Highlights 3 Preeminent management team: Decades of collective experience across infrastructure, aviation, energy, and AI real assets paired with Edge Node AI's technical expertise to drive modular HPC deployments at powered sites from day one. Modular deployment Forum has fully funded Phase 0: Forum's 51% JV interest funds an initial ~11 MW deployment, across tier 1 TowerCo site with spoke-and-hub model with two initial hubs Scalable platform: Phase 0 fully funded today; Phases 1 and 2+ are options earned through measured power, achieved utilization, ready offtake, and equipment financing. Optioned Tier 1 tower site footprint supports componentized roll-out across multiple phases. Differentiated power footprint unlocked at tower sites and existing, owned hubs: Dallas energized today; North Carolina energized in Q1 2027; excess allocated power capacity at Tower sites accessed via MSAs rather than multi-year interconnection queue, first online in Q2 2027 Customer-led deployment model: GPUs ordered against paired offtake agreements with B300 and GB300 costs and supply established; Forum Edge AI meets demand via proximity and rapid, modular deployment capability. Focus on edge sites meets future demand for low-latency inference. Financeable, discrete project architecture: Separate SPVs with paired offtake/collateral/equipment financing; no cross-collateralization; Forum controls the JV and consolidates without carrying 100% of project equity. FORUM EDGE AI
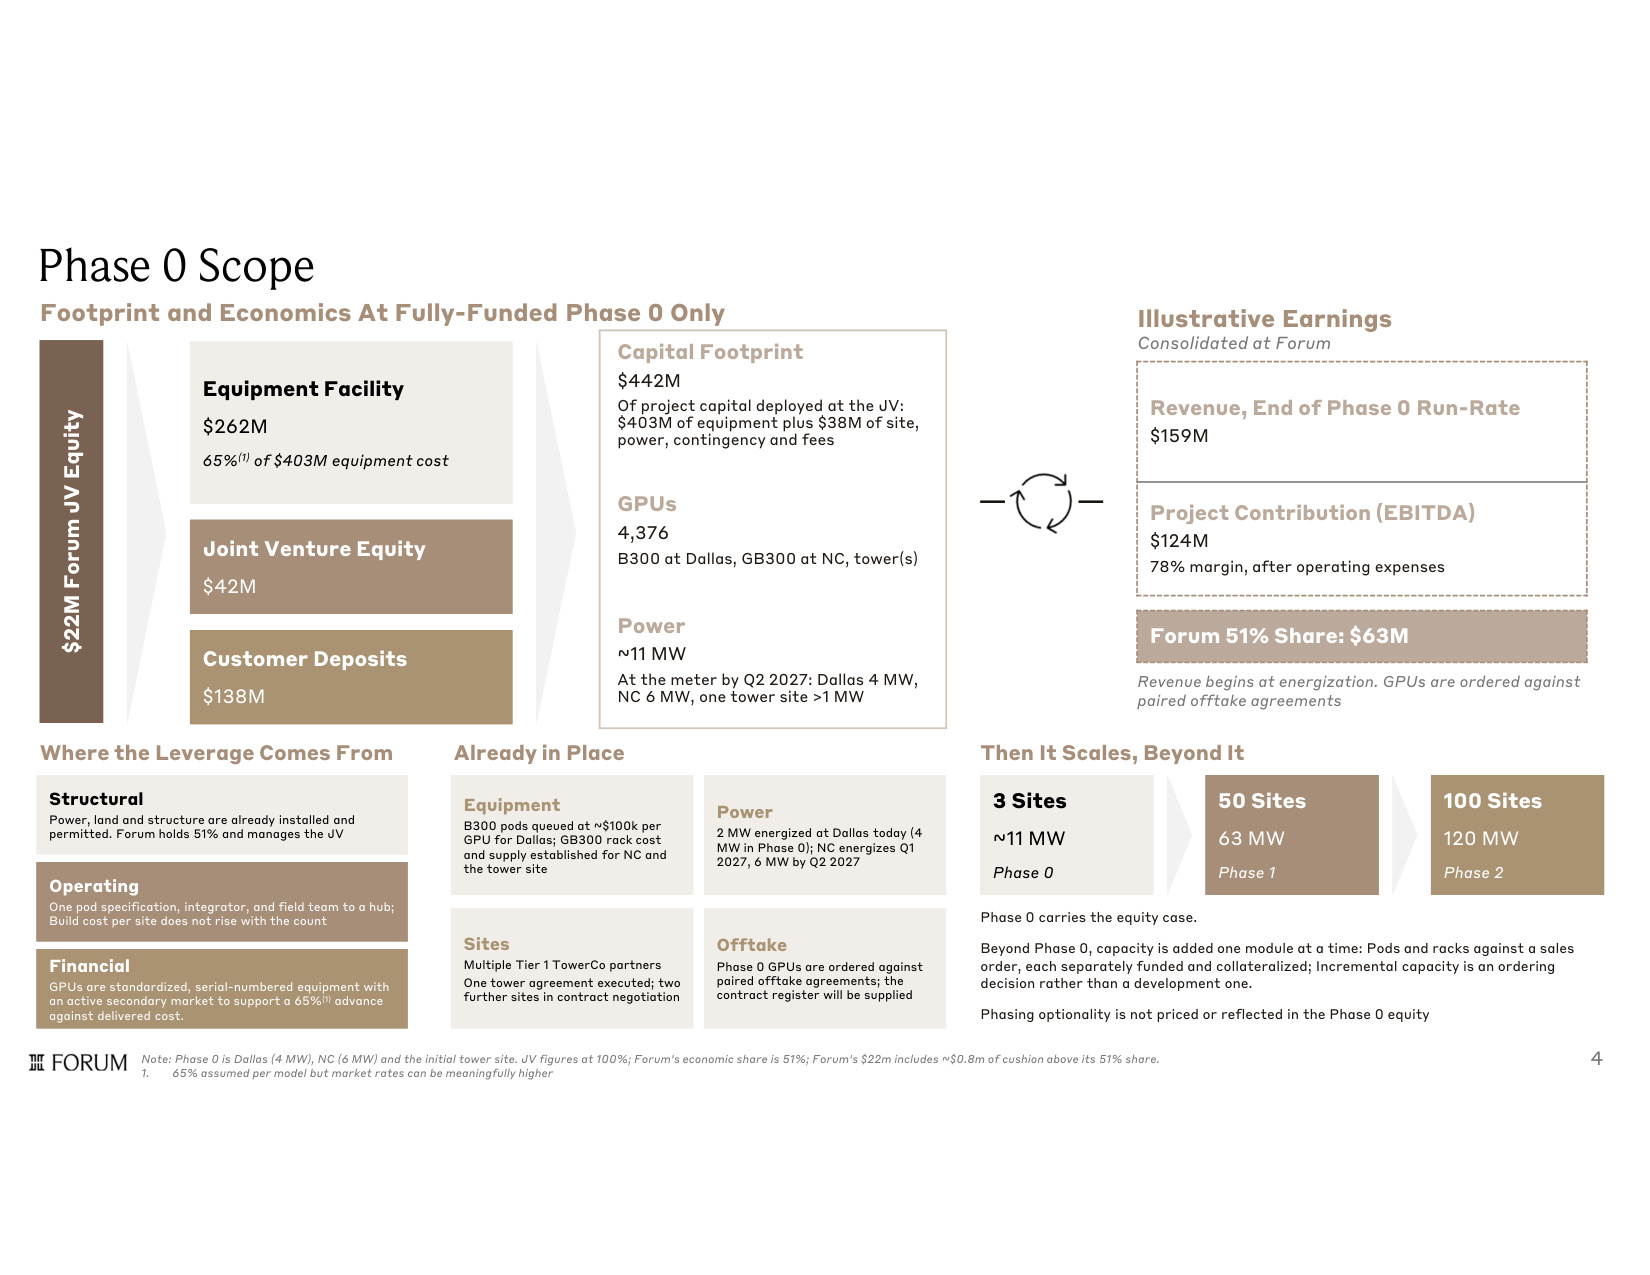
Where the Leverage Comes From Phase 0 Scope Footprint and Economics At Fully-Funded Phase 0 Only Illustrative Earnings Consolidated at Forum Revenue begins at energization. GPUs are ordered against paired offtake agreements Phase 0 carries the equity case. Beyond Phase 0, capacity is added one module at a time: Pods and racks against a sales order, each separately funded and collateralized; Incremental capacity is an ordering decision rather than a development one. Phasing optionality is not priced or reflected in the Phase 0 equity Equipment Facility $262M 65%(1) of $403M equipment cost Equipment Facility $262M 65%(1) of $403M equipment cost $22M Forum JV Equity $22M Forum JV Equity Joint Venture Equity $42M Joint Venture Equity $42M Customer Deposits $138M Customer Deposits $138M Capital Footprint $442M Of project capital deployed at the JV: $403M of equipment plus $38M of site, power, contingency and fees GPUs 4,376 B300 at Dallas, GB300 at NC, tower(s) Power ~11 MW At the meter by Q2 2027: Dallas 4 MW, NC 6 MW, one tower site >1 MW Revenue, End of Phase 0 Run-Rate $159M Project Contribution (EBITDA) $124M 78% margin, after operating expenses Forum 51% Share: $63M Already in Place Then It Scales, Beyond It Structural Power, land and structure are already installed and permitted. Forum holds 51% and manages the JV Structural Power, land and structure are already installed and permitted. Forum holds 51% and manages the JV Operating One pod specification, integrator, and field team to a hub; Build cost per site does not rise with the count Operating One pod specification, integrator, and field team to a hub; Build cost per site does not rise with the count Financial GPUs are standardized, serial-numbered equipment with an active secondary market to support a 65%(1) advance against delivered cost. Financial GPUs are standardized, serial-numbered equipment with an active secondary market to support a 65%(1) advance against delivered cost. Note: Phase 0 is Dallas (4 MW), NC (6 MW) and the initial tower site. JV figures at 100%; Forum's economic share is 51%; Forum's $22m includes ~$0.8m of cushion above its 51% share. 1. 65% assumed per model but market rates can be meaningfully higher Equipment B300 pods queued at ~$100k per GPU for Dallas; GB300 rack cost and supply established for NC and the tower site Equipment B300 pods queued at ~$100k per GPU for Dallas; GB300 rack cost and supply established for NC and the tower site Power 2 MW energized at Dallas today (4 MW in Phase 0); NC energizes Q1 2027, 6 MW by Q2 2027 Power 2 MW energized at Dallas today (4 MW in Phase 0); NC energizes Q1 2027, 6 MW by Q2 2027 Sites Multiple Tier 1 TowerCo partners One tower agreement executed; two further sites in contract negotiation Sites Multiple Tier 1 TowerCo partners One tower agreement executed; two further sites in contract negotiation Offtake Phase 0 GPUs are ordered against paired offtake agreements; the contract register will be supplied Offtake Phase 0 GPUs are ordered against paired offtake agreements; the contract register will be supplied 3 Sites ~11 MW Phase 0 3 Sites ~11 MW Phase 0 50 Sites 63 MW Phase 1 50 Sites 63 MW Phase 1 100 Sites 120 MW Phase 2 100 Sites 120 MW Phase 2 4

Forum Markets Leadership McAndrew Rudisill, Chairman and CEO • 25 years experience private and public equity & credit markets • Founder Pelagic Capital Advisors • Former Chief Investment Officer, Capital Vacations • Former Chief Investment Officer, Bridger Aerospace John Saunders, CFO • Senior finance executive across aerospace, defense & digital assets • Former CFO, then SVP Finance, Bridger Aerospace • Former CFO, Ascent Vision Technologies; 2020 sale to CACI Robert Spake, General Counsel • Capital markets, fintech & regulatory compliance background • Former Head of Litigation, Republic; CCO, Republic Capital • Previously Polsinelli and Weil Gotshal; Delaware Chancery clerk John Kristoff, SVP Corp Comm & IR • 30+ years in fintech marketing, communications & IR • Former Chief Marketing & Communications Officer, Diebold Nixdorf • Former VP, Investor Relations, EXL Service • Vice Chairman, Investment Banking, Lazard • Former CEO, Onex Credit • Former Senior Managing Director, Blackstone • Co-founder,NovaWulf Digital Management Jason New • Founder, Signum Growth Capital • Cofounder Evercore Equities • Former Managing Director, UBS • Former Managing Director, Guggenheim Partners Angela Dalton Executive Leadership • Former Head of US Business at Arrowgrass Capital Partners • Former Deputy CIO Weiss Advisors • Former PM, D.E. Shaw • Former M&A Banker Credit Suisse Michael Edwards • Founder and Partner, Verulam LLC, Metals Trading House • Non-executive Chairman, Cadence Minerals • Former Partner,Ospraie Management Andrew Suckling • President and CEO, Big Sky Industrials Inc. • Former CFO, Emerald Oil • Former VP Investment Banking, Canaccord Genuity Ryan Smith Board of Directors 5
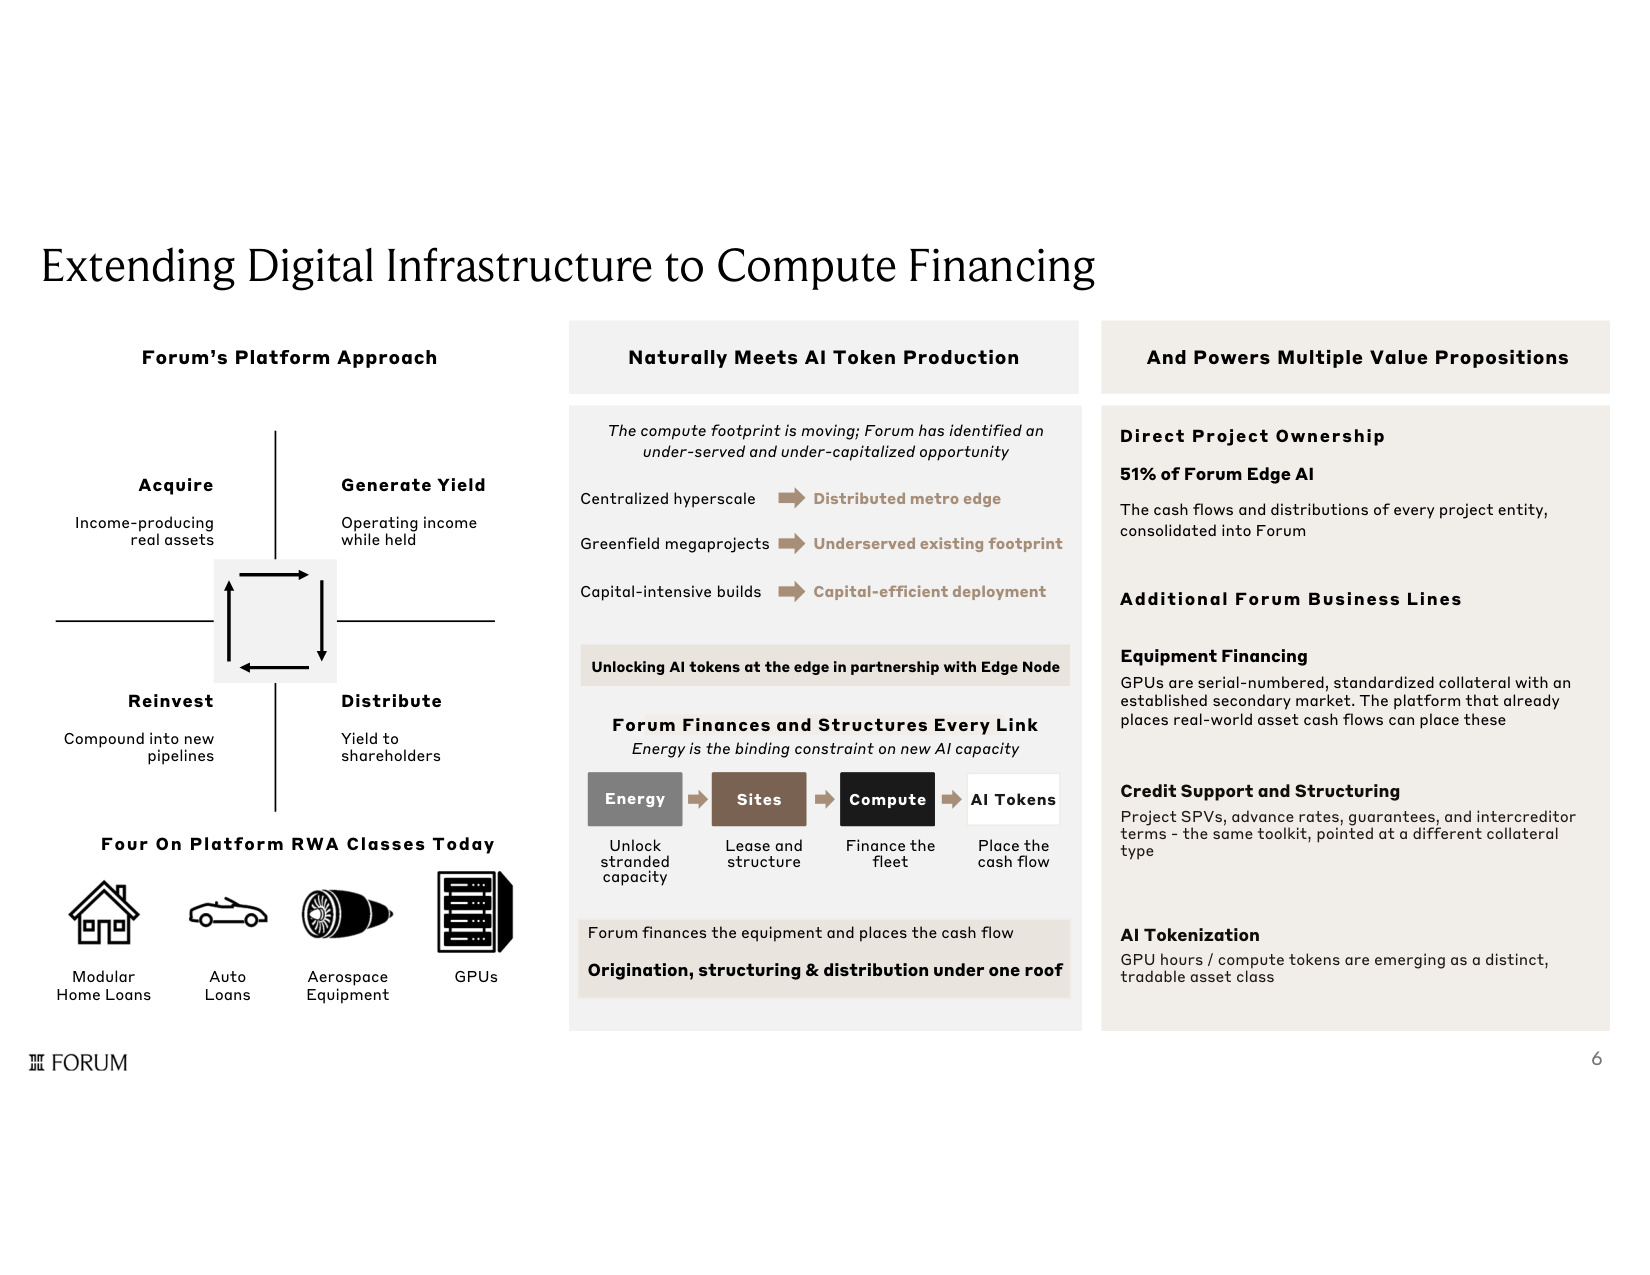
Extending Digital Infrastructure to Compute Financing Forum's Platform Approach Four On Platform RWA Classes Today Naturally Meets AI Token Production The compute footprint is moving; Forum has identified an under-served and under-capitalized opportunity Centralized hyperscale Distributed metro edge Greenfield megaprojects Underserved existing footprint Capital-intensive builds Capital-efficient deployment Forum Finances and Structures Every Link Energy is the binding constraint on new AI capacity Energy Unlock stranded capacity Sites Lease and structure Compute Finance the fleet AI Tokens Place the cash flow Forum finances the equipment and places the cash flow Origination, structuring & distribution under one roof And Powers Multiple Value Propositions Direct Project Ownership 51% of Forum Edge AI The cash flows and distributions of every project entity, consolidated into Forum Additional Forum Business Lines Aerospace Equipment Auto Loans GPUs Modular Home Loans Generate Yield Operating income while held Distribute Yield to shareholders Acquire Income-producing real assets Reinvest Compound into new pipelines Unlocking AI tokens at the edge in partnership with Edge Node Unlocking AI tokens at the edge in partnership with Edge Node Equipment Financing GPUs are serial-numbered, standardized collateral with an established secondary market. The platform that already places real-world asset cash flows can place these Credit Support and Structuring Project SPVs, advance rates, guarantees, and intercreditor terms - the same toolkit, pointed at a different collateral type AI Tokenization GPU hours / compute tokens are emerging as a distinct, tradable asset class 6
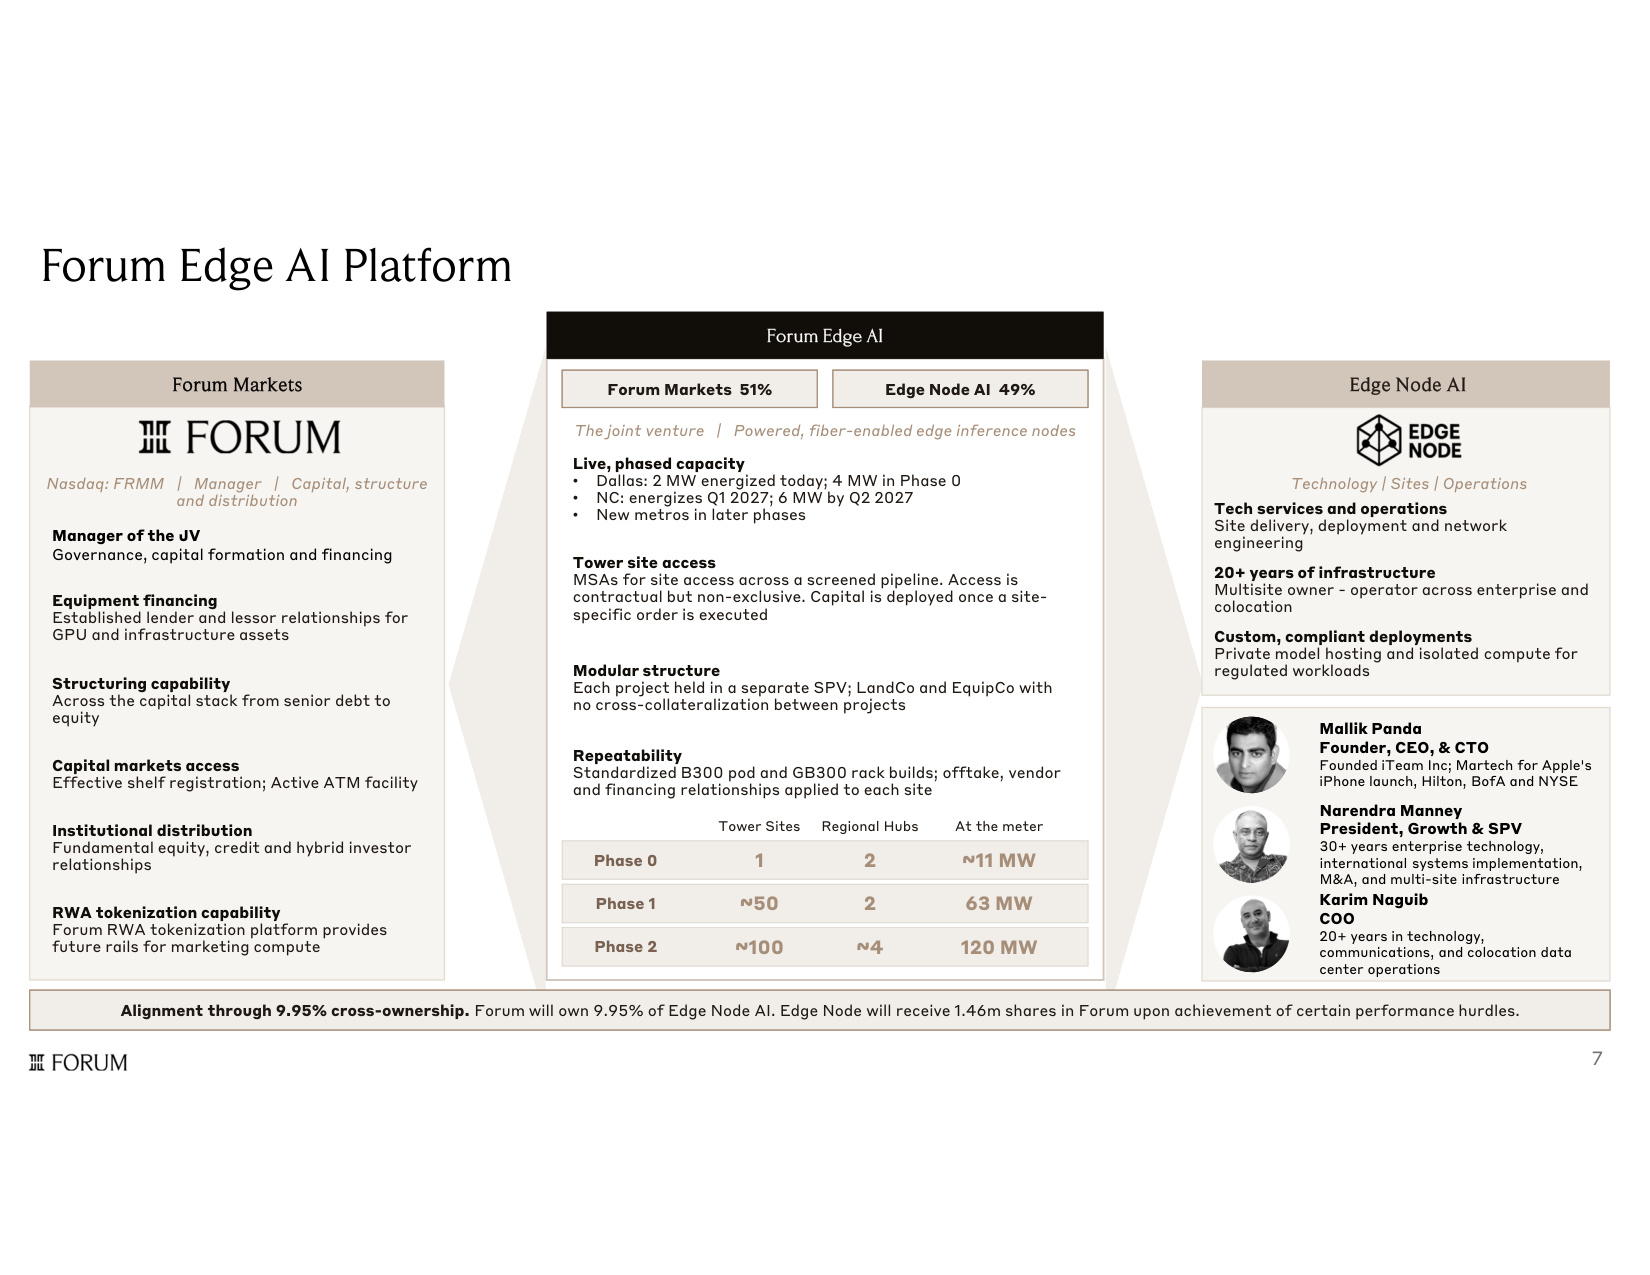
Forum Edge AI Platform Edge Node AI Technology | Sites | Operations Forum Markets Nasdaq: FRMM | Manager | Capital, structure and distribution Mallik Panda Founder, CEO, & CTO Founded iTeam Inc; Martech for Apple's iPhone launch, Hilton, BofA and NYSE Narendra Manney President, Growth & SPV 30+ years enterprise technology, international systems implementation, M&A, and multi-site infrastructure Karim Naguib COO 20+ years in technology, communications, and colocation data center operations Forum Edge AI Forum Markets 51% Edge Node AI 49% The joint venture | Powered, fiber-enabled edge inference nodes Phase 0 1 Tower Sites 2 Regional Hubs ~11 MW At the meter Phase 1 Phase 2 ~50 ~100 2 ~4 63 MW 120 MW Manager of the JV Governance, capital formation and financing Equipment financing Established lender and lessor relationships for GPU and infrastructure assets Structuring capability Across the capital stack from senior debt to equity Capital markets access Effective shelf registration; Active ATM facility Institutional distribution Fundamental equity, credit and hybrid investor relationships RWA tokenization capability Forum RWA tokenization platform provides future rails for marketing compute Live, phased capacity • Dallas: 2 MW energized today; 4 MW in Phase 0 • NC: energizes Q1 2027; 6 MW by Q2 2027 • New metros in later phases Tower site access MSAs for site access across a screened pipeline. Access is contractual but non-exclusive. Capital is deployed once a site- specific order is executed Modular structure Each project held in a separate SPV; LandCo and EquipCo with no cross-collateralization between projects Repeatability Standardized B300 pod and GB300 rack builds; offtake, vendor and financing relationships applied to each site Tech services and operations Site delivery, deployment and network engineering 20+ years of infrastructure Multisite owner - operator across enterprise and colocation Custom, compliant deployments Private model hosting and isolated compute for regulated workloads Alignment through 9.95% cross-ownership. Forum will own 9.95% of Edge Node AI. Edge Node will receive 1.46m shares in Forum upon achievement of certain performance hurdles. 7
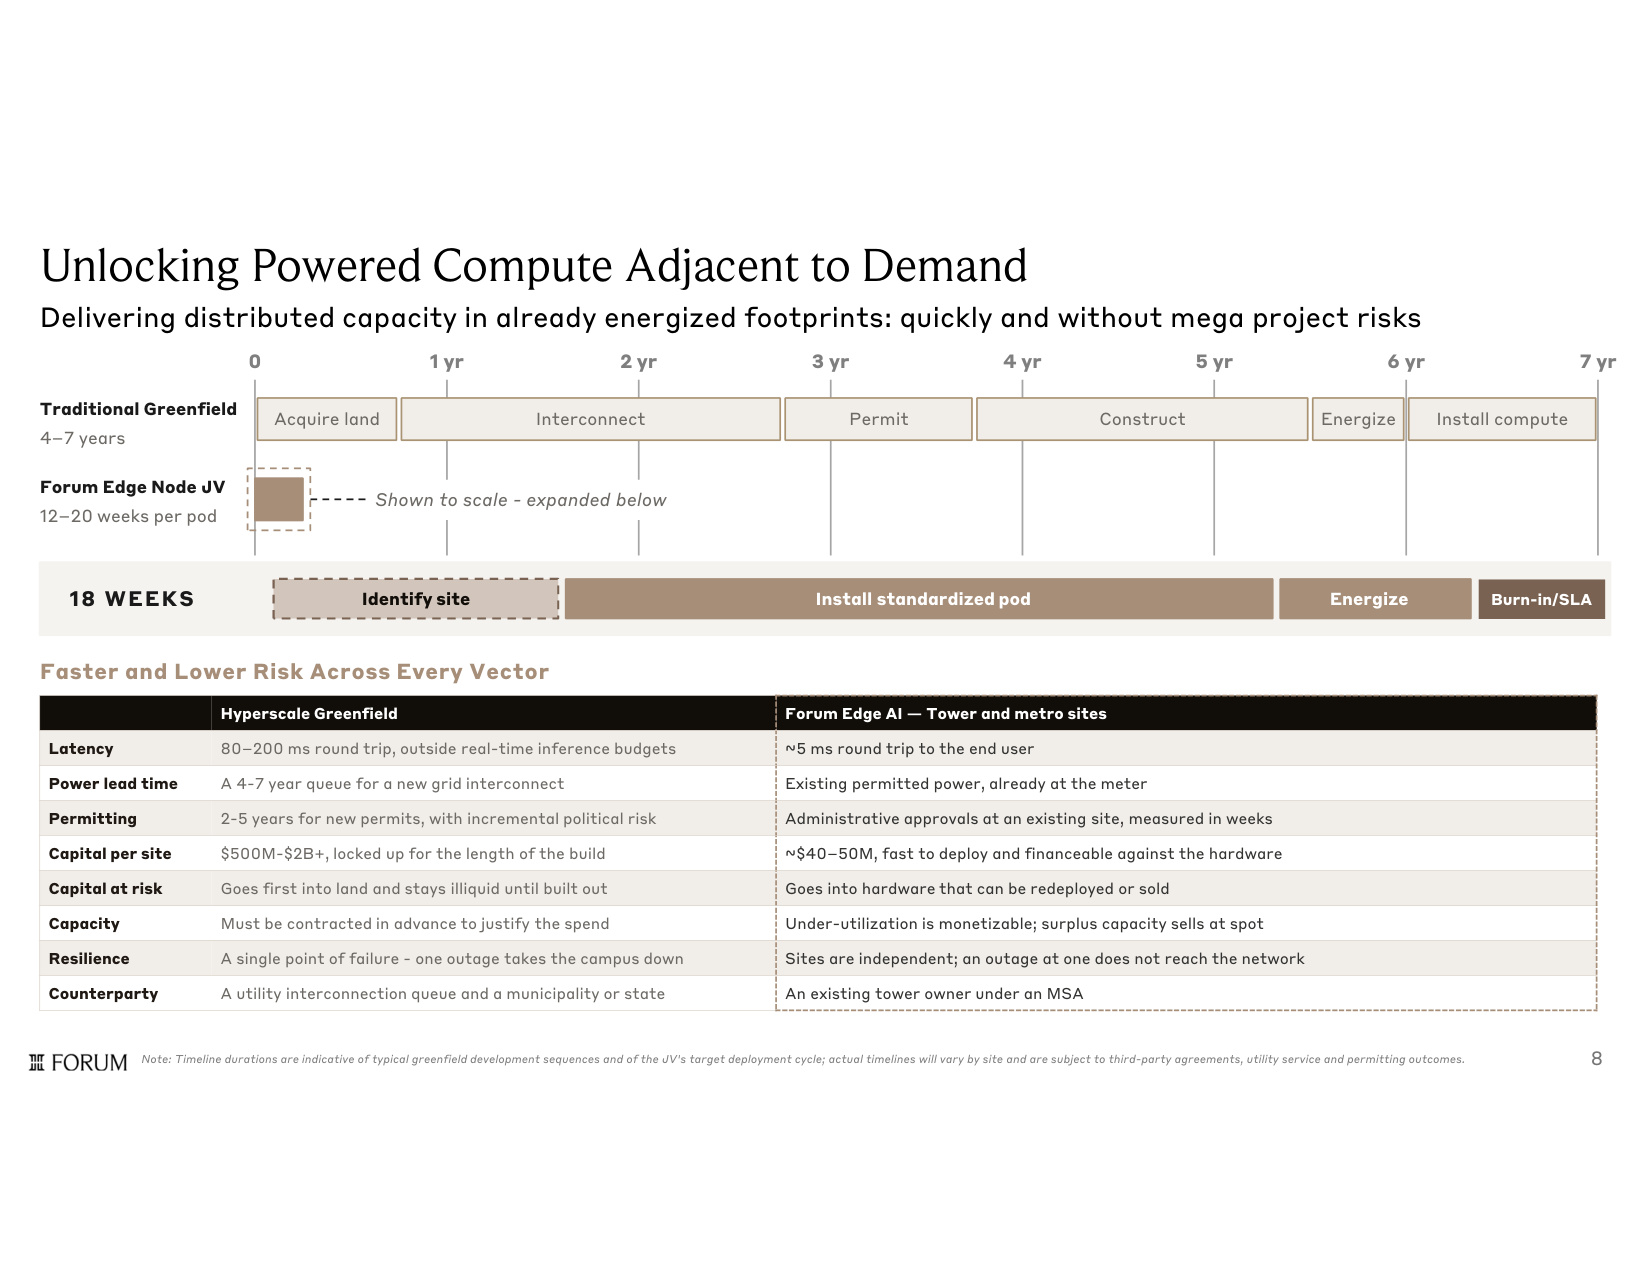
Unlocking Powered Compute Adjacent to Demand Delivering distributed capacity in already energized footprints: quickly and without mega project risks Traditional Greenfield 4 7 years Acquire land Interconnect Permit Construct Energize Install compute Forum Edge Node JV 12 20 weeks per pod 18 WEEKS Install standardized pod Energize 0 1 yr 2 yr 3 yr 4 yr 5 yr 6 yr 7 yr Shown to scale - expanded below Note: Timeline durations are indicative of typical greenfield development sequences and of the JV's target deployment cycle; actual timelines will vary by site and are subject to third-party agreements, utility service and permitting outcomes. Burn-in/SLA Identify site Faster and Lower Risk Across Every Vector Forum Edge AI — Tower and metro sites Hyperscale Greenfield ~5 ms round trip to the end user 80 200 ms round trip, outside real-time inference budgets Latency Existing permitted power, already at the meter A 4-7 year queue for a new grid interconnect Power lead time Administrative approvals at an existing site, measured in weeks 2-5 years for new permits, with incremental political risk Permitting ~$40 50M, fast to deploy and financeable against the hardware $500M-$2B+, locked up for the length of the build Capital per site Goes into hardware that can be redeployed or sold Goes first into land and stays illiquid until built out Capital at risk Under-utilization is monetizable; surplus capacity sells at spot Must be contracted in advance to justify the spend Capacity Sites are independent; an outage at one does not reach the network A single point of failure - one outage takes the campus down Resilience An existing tower owner under an MSA A utility interconnection queue and a municipality or state Counterparty 8
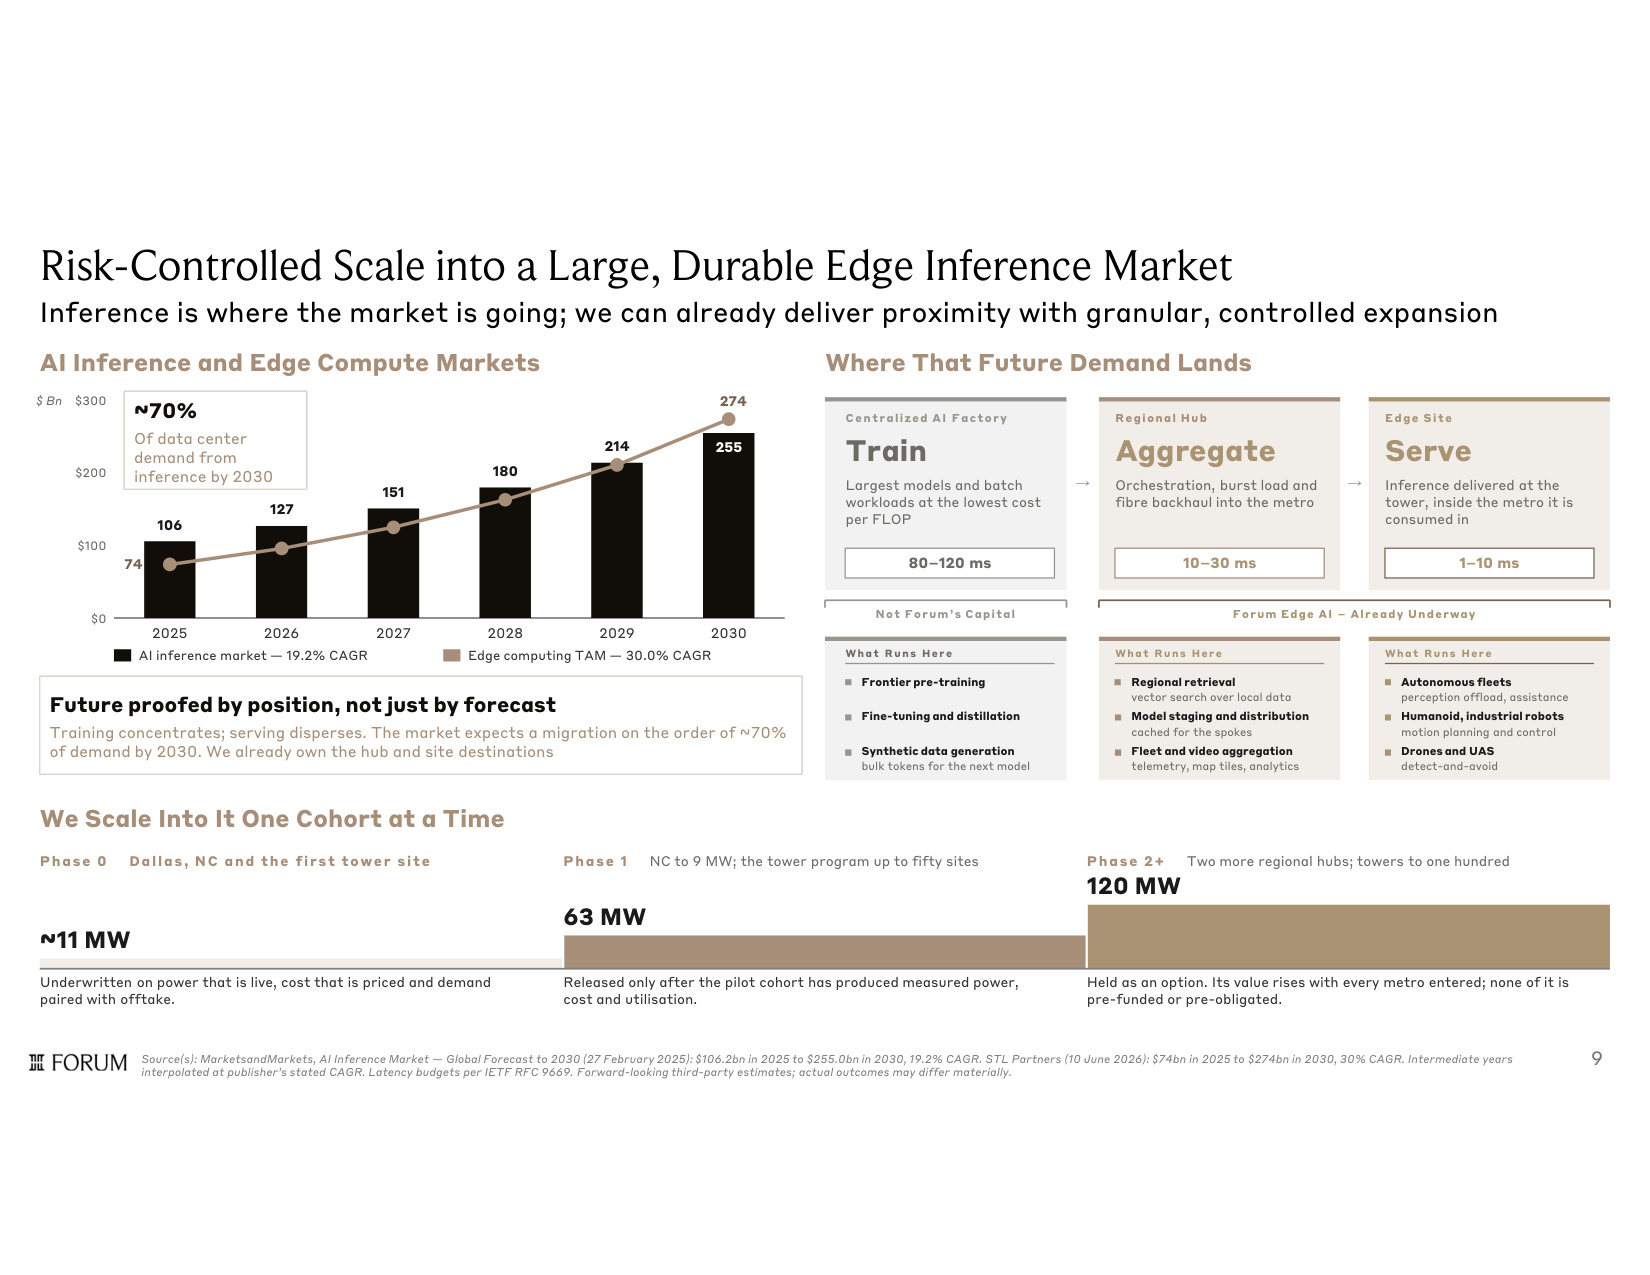
Risk-Controlled Scale into a Large, Durable Edge Inference Market Inference is where the market is going; we can already deliver proximity with granular, controlled expansion Source(s): MarketsandMarkets, AI Inference Market — Global Forecast to 2030 (27 February 2025): $106.2bn in 2025 to $255.0bn in 2030, 19.2% CAGR. STL Partners (10 June 2026): $74bn in 2025 to $274bn in 2030, 30% CAGR. Intermediate years interpolated at publisher's stated CAGR. Latency budgets per IETF RFC 9669. Forward-looking third-party estimates; actual outcomes may differ materially. $ Bn $0 $100 $200 $300 106 2025 127 2026 151 2027 180 2028 214 2029 255 2030 74 274 AI inference market — 19.2% CAGR Edge computing TAM — 30.0% CAGR Centralized AI Factory Train Largest models and batch workloads at the lowest cost per FLOP 80 120 ms → Regional Hub Aggregate Orchestration, burst load and fibre backhaul into the metro 10 30 ms → Edge Site Serve Inference delivered at the tower, inside the metro it is consumed in 1 10 ms Not Forum's Capital Forum Edge AI Already Underway Phase 0 Dallas, NC and the first tower site ~11 MW Underwritten on power that is live, cost that is priced and demand paired with offtake. Phase 1 NC to 9 MW; the tower program up to fifty sites 63 MW Released only after the pilot cohort has produced measured power, cost and utilisation. Phase 2+ Two more regional hubs; towers to one hundred 120 MW Held as an option. Its value rises with every metro entered; none of it is pre-funded or pre-obligated. Wha t R u ns Her e Frontier pre-training Fine-tuning and distillation Synthetic data generation bulk tokens for the next model Regional retrieval vector search over local data Model staging and distribution cached for the spokes Fleet and video aggregation telemetry, map tiles, analytics Autonomous fleets perception offload, assistance Humanoid, industrial robots motion planning and control Drones and UAS detect-and-avoid AI Inference and Edge Compute Markets Where That Future Demand Lands Future proofed by position, not just by forecast Training concentrates; serving disperses. The market expects a migration on the order of ~70% of demand by 2030. We already own the hub and site destinations ~70% Of data center demand from inference by 2030 We Scale Into It One Cohort at a Time Wha t R u ns Her e Wha t R u ns Her e 9
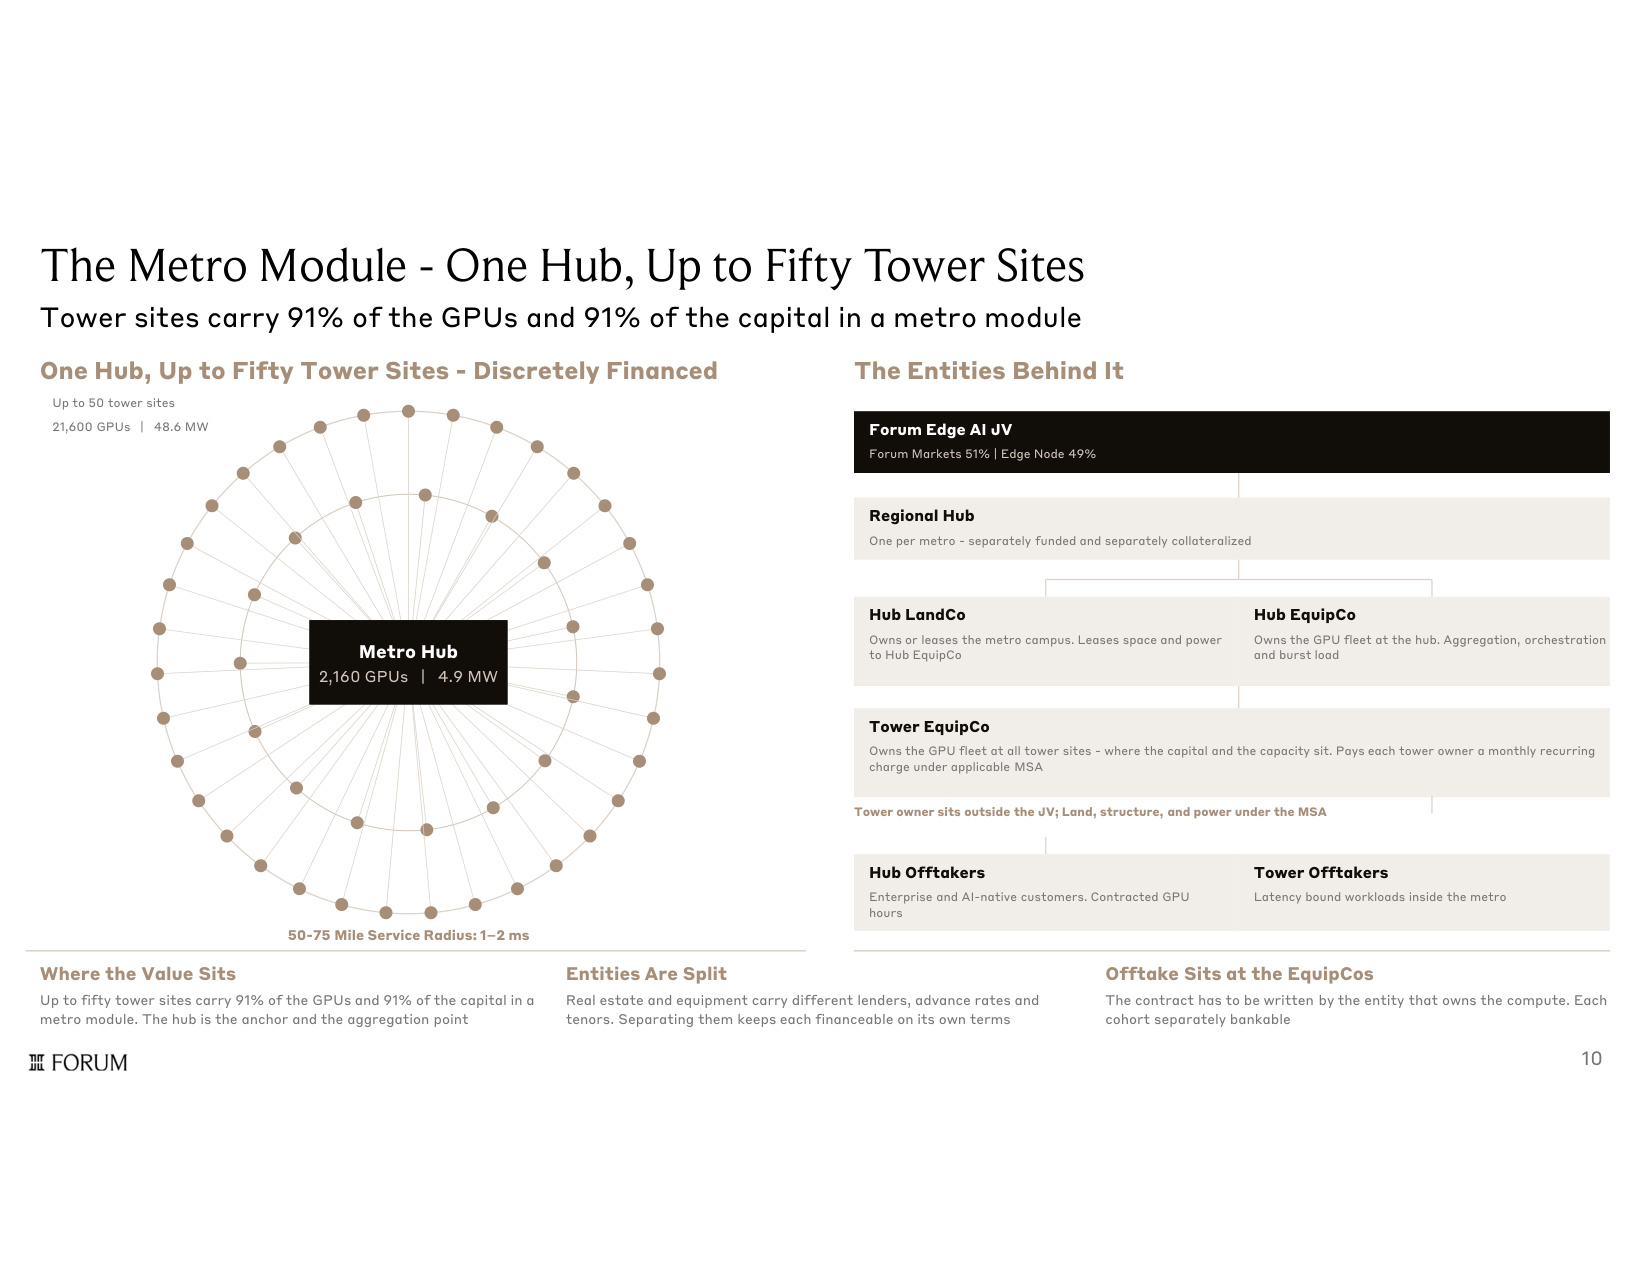
The Metro Module - One Hub, Up to Fifty Tower Sites Tower sites carry 91% of the GPUs and 91% of the capital in a metro module One Hub, Up to Fifty Tower Sites - Discretely Financed The Entities Behind It Metro Hub 2,160 GPUs | 4.9 MW 50-75 Mile Service Radius: 1 2 ms Up to 50 tower sites 21,600 GPUs | 48.6 MW Forum Edge AI JV Forum Markets 51% | Edge Node 49% Regional Hub One per metro - separately funded and separately collateralized Hub LandCo Owns or leases the metro campus. Leases space and power to Hub EquipCo Hub EquipCo Owns the GPU fleet at the hub. Aggregation, orchestration and burst load Tower EquipCo Owns the GPU fleet at all tower sites - where the capital and the capacity sit. Pays each tower owner a monthly recurring charge under applicable MSA Tower owner sits outside the JV; Land, structure, and power under the MSA Hub Offtakers Enterprise and AI-native customers. Contracted GPU hours Tower Offtakers Latency bound workloads inside the metro Where the Value Sits Up to fifty tower sites carry 91% of the GPUs and 91% of the capital in a metro module. The hub is the anchor and the aggregation point Entities Are Split Real estate and equipment carry different lenders, advance rates and tenors. Separating them keeps each financeable on its own terms Offtake Sits at the EquipCos The contract has to be written by the entity that owns the compute. Each cohort separately bankable 10
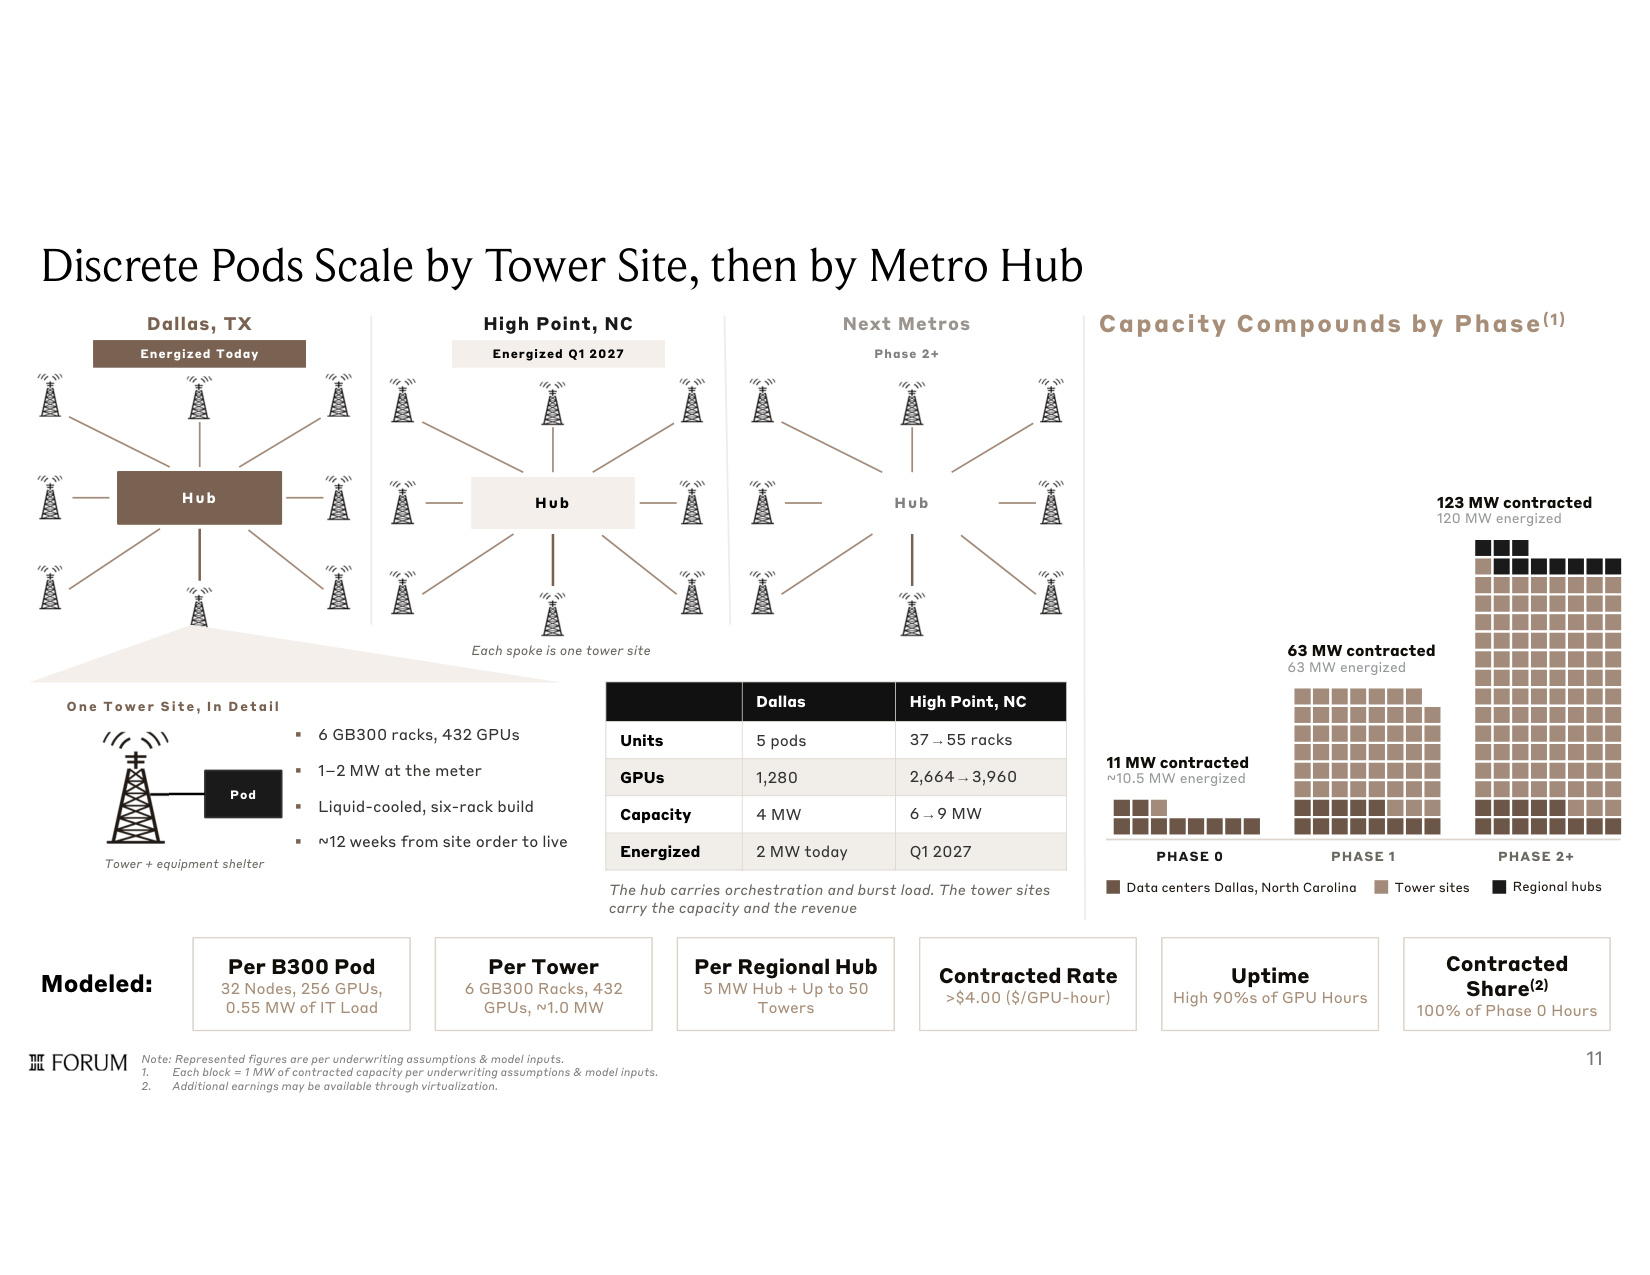
Note: Represented figures are per underwriting assumptions & model inputs. 1. Each block = 1 MW of contracted capacity per underwriting assumptions & model inputs. 2. Additional earnings may be available through virtualization. Discrete Pods Scale by Tower Site, then by Metro Hub Per B300 Pod 32 Nodes, 256 GPUs, 0.55 MW of IT Load Per Tower 6 GB300 Racks, 432 GPUs, ~1.0 MW Per Regional Hub 5 MW Hub + Up to 50 Towers Contracted Rate >$4.00 ($/GPU-hour) Uptime High 90%s of GPU Hours Contracted Share(2) 100% of Phase 0 Hours Dallas, TX Energized Today High Point, NC Energized Q1 2027 Next Metros Phase 2+ Each spoke is one tower site O n e T o w e r S i t e , I n D e t a il Pod Tower + equipment shelter 6 GB300 racks, 432 GPUs 1 2 MW at the meter Liquid-cooled, six-rack build ~12 weeks from site order to live High Point, NC Dallas 37 →55 racks 5 pods Units 2,664 →3,960 1,280 GPUs 6 →9 MW 4 MW Capacity Q1 2027 2 MW today Energized The hub carries orchestration and burst load. The tower sites carry the capacity and the revenue Capacity Compounds by Phase (1) PHASE 0 PHASE 1 PHASE 2+ 11 MW contracted ~10.5 MW energized 63 MW contracted 63 MW energized 123 MW contracted 120 MW energized Data centers Dallas, North Carolina Tower sites Regional hubs Hub Hub Hub Modeled: 11
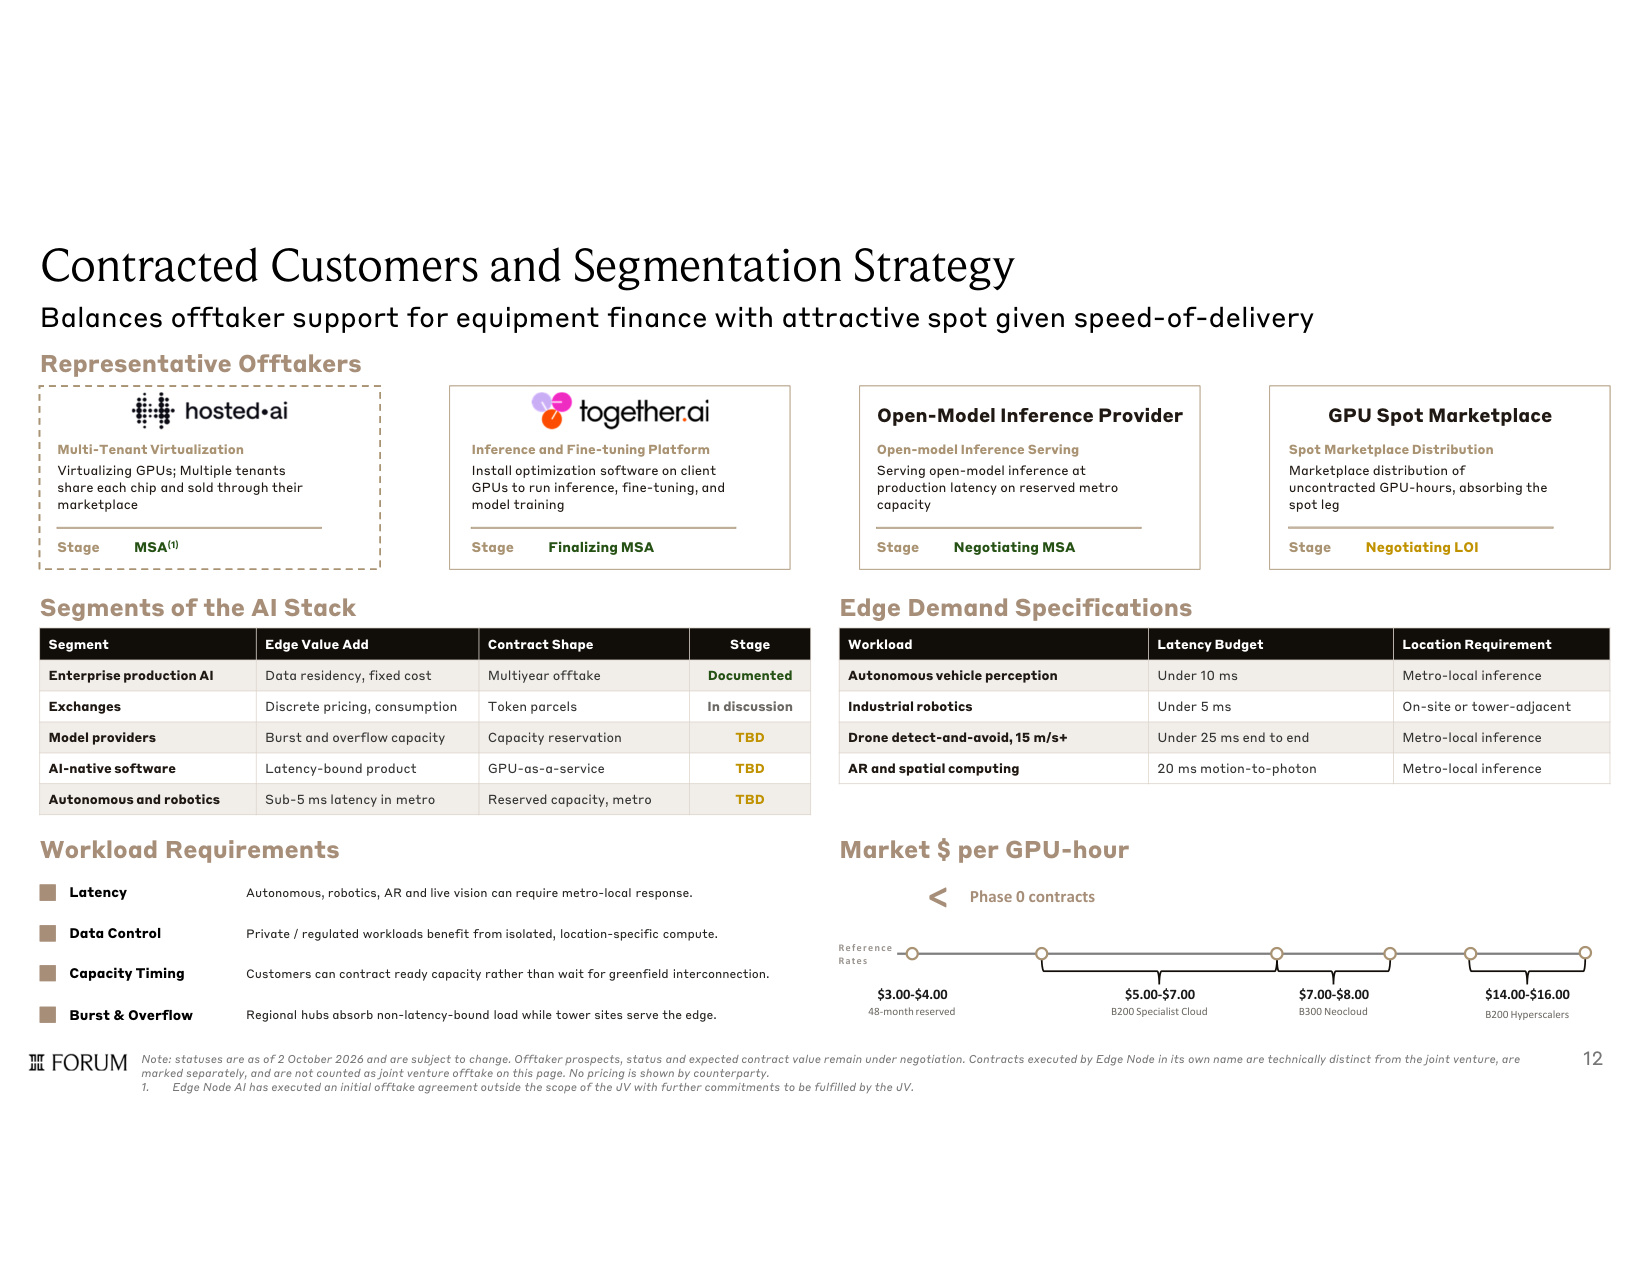
Contracted Customers and Segmentation Strategy Balances offtaker support for equipment finance with attractive spot given speed-of-delivery Representative Offtakers Multi-Tenant Virtualization Virtualizing GPUs; Multiple tenants share each chip and sold through their marketplace Stage MSA(1) Inference and Fine-tuning Platform Install optimization software on client GPUs to run inference, fine-tuning, and model training Stage Finalizing MSA Segments of the AI Stack Stage Contract Shape Edge Value Add Segment Documented Multiyear offtake Data residency, fixed cost Enterprise production AI In discussion Token parcels Discrete pricing, consumption Exchanges TBD Capacity reservation Burst and overflow capacity Model providers TBD GPU-as-a-service Latency-bound product AI-native software TBD Reserved capacity, metro Sub-5 ms latency in metro Autonomous and robotics Edge Demand Specifications Location Requirement Latency Budget Workload Metro-local inference Under 10 ms Autonomous vehicle perception On-site or tower-adjacent Under 5 ms Industrial robotics Metro-local inference Under 25 ms end to end Drone detect-and-avoid, 15 m/s+ Metro-local inference 20 ms motion-to-photon AR and spatial computing Note: statuses are as of 2 October 2026 and are subject to change. Offtaker prospects, status and expected contract value remain under negotiation. Contracts executed by Edge Node in its own name are technically distinct from the joint venture, are marked separately, and are not counted as joint venture offtake on this page. No pricing is shown by counterparty. 1. Edge Node AI has executed an initial offtake agreement outside the scope of the JV with further commitments to be fulfilled by the JV. $3.00-$4.00 $5.00-$7.00 $7.00-$8.00 B200 Hyperscalers < Phase 0 contracts Reference Rates 48-month reserved B200 Specialist Cloud B300 Neocloud $14.00-$16.00 Market $ per GPU-hour Workload Requirements Latency Data Control Capacity Timing Burst & Overflow Autonomous, robotics, AR and live vision can require metro-local response. Private / regulated workloads benefit from isolated, location-specific compute. Customers can contract ready capacity rather than wait for greenfield interconnection. Regional hubs absorb non-latency-bound load while tower sites serve the edge. Open-Model Inference Provider Open-model Inference Serving Serving open-model inference at production latency on reserved metro capacity Stage Negotiating MSA GPU Spot Marketplace Spot Marketplace Distribution Marketplace distribution of uncontracted GPU-hours, absorbing the spot leg Stage Negotiating LOI 12
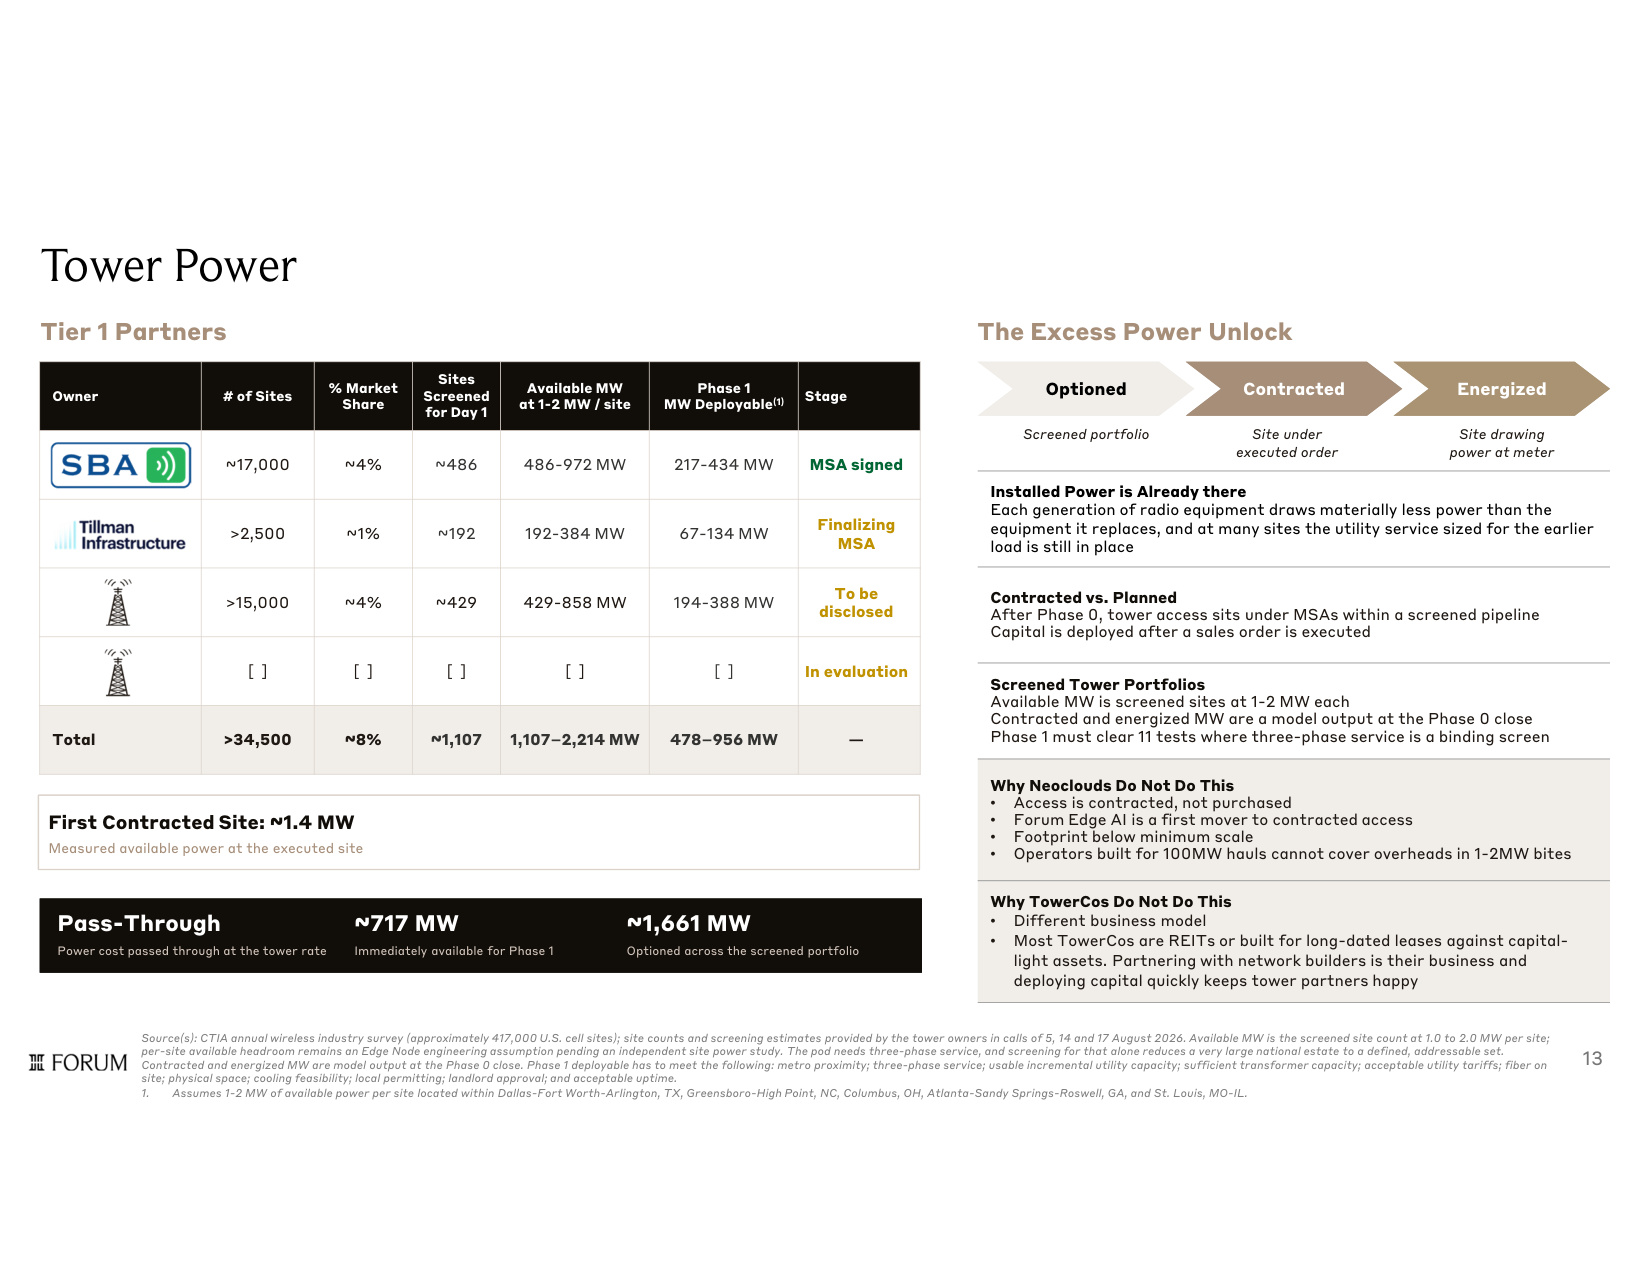
Tower Power Stage Phase 1 MW Deployable(1) Available MW at 1-2 MW / site Sites Screened for Day 1 % Market Share # of Sites Owner MSA signed 217-434 MW 486-972 MW ~486 ~4% ~17,000 Finalizing MSA 67-134 MW 192-384 MW ~192 ~1% >2,500 To be disclosed 194-388 MW 429-858 MW ~429 ~4% >15,000 In evaluation [ ] [ ] [ ] [ ] [ ] — 478 956 MW 1,107 2,214 MW ~1,107 ~8% >34,500 Total Tier 1 Partners The Excess Power Unlock Source(s): CTIA annual wireless industry survey (approximately 417,000 U.S. cell sites); site counts and screening estimates provided by the tower owners in calls of 5, 14 and 17 August 2026. Available MW is the screened site count at 1.0 to 2.0 MW per site; per-site available headroom remains an Edge Node engineering assumption pending an independent site power study. The pod needs three-phase service, and screening for that alone reduces a very large national estate to a defined, addressable set. Contracted and energized MW are model output at the Phase 0 close. Phase 1 deployable has to meet the following: metro proximity; three-phase service; usable incremental utility capacity; sufficient transformer capacity; acceptable utility tariffs; fiber on site; physical space; cooling feasibility; local permitting; landlord approval; and acceptable uptime. 1. Assumes 1-2 MW of available power per site located within Dallas-Fort Worth-Arlington, TX, Greensboro-High Point, NC, Columbus, OH, Atlanta-Sandy Springs-Roswell, GA, and St. Louis, MO-IL. Pass-Through Power cost passed through at the tower rate ~717 MW Immediately available for Phase 1 ~1,661 MW Optioned across the screened portfolio Installed Power is Already there Each generation of radio equipment draws materially less power than the equipment it replaces, and at many sites the utility service sized for the earlier load is still in place Contracted vs. Planned After Phase 0, tower access sits under MSAs within a screened pipeline Capital is deployed after a sales order is executed Screened Tower Portfolios Available MW is screened sites at 1-2 MW each Contracted and energized MW are a model output at the Phase 0 close Phase 1 must clear 11 tests where three-phase service is a binding screen Why Neoclouds Do Not Do This • Access is contracted, not purchased • Forum Edge AI is a first mover to contracted access • Footprint below minimum scale • Operators built for 100MW hauls cannot cover overheads in 1-2MW bites Why TowerCos Do Not Do This • Different business model • Most TowerCos are REITs or built for long-dated leases against capital- light assets. Partnering with network builders is their business and deploying capital quickly keeps tower partners happy Optioned Optioned Contracted Contracted Energized Energized Screened portfolio Site under executed order Site drawing power at meter First Contracted Site: ~1.4 MW Measured available power at the executed site 13
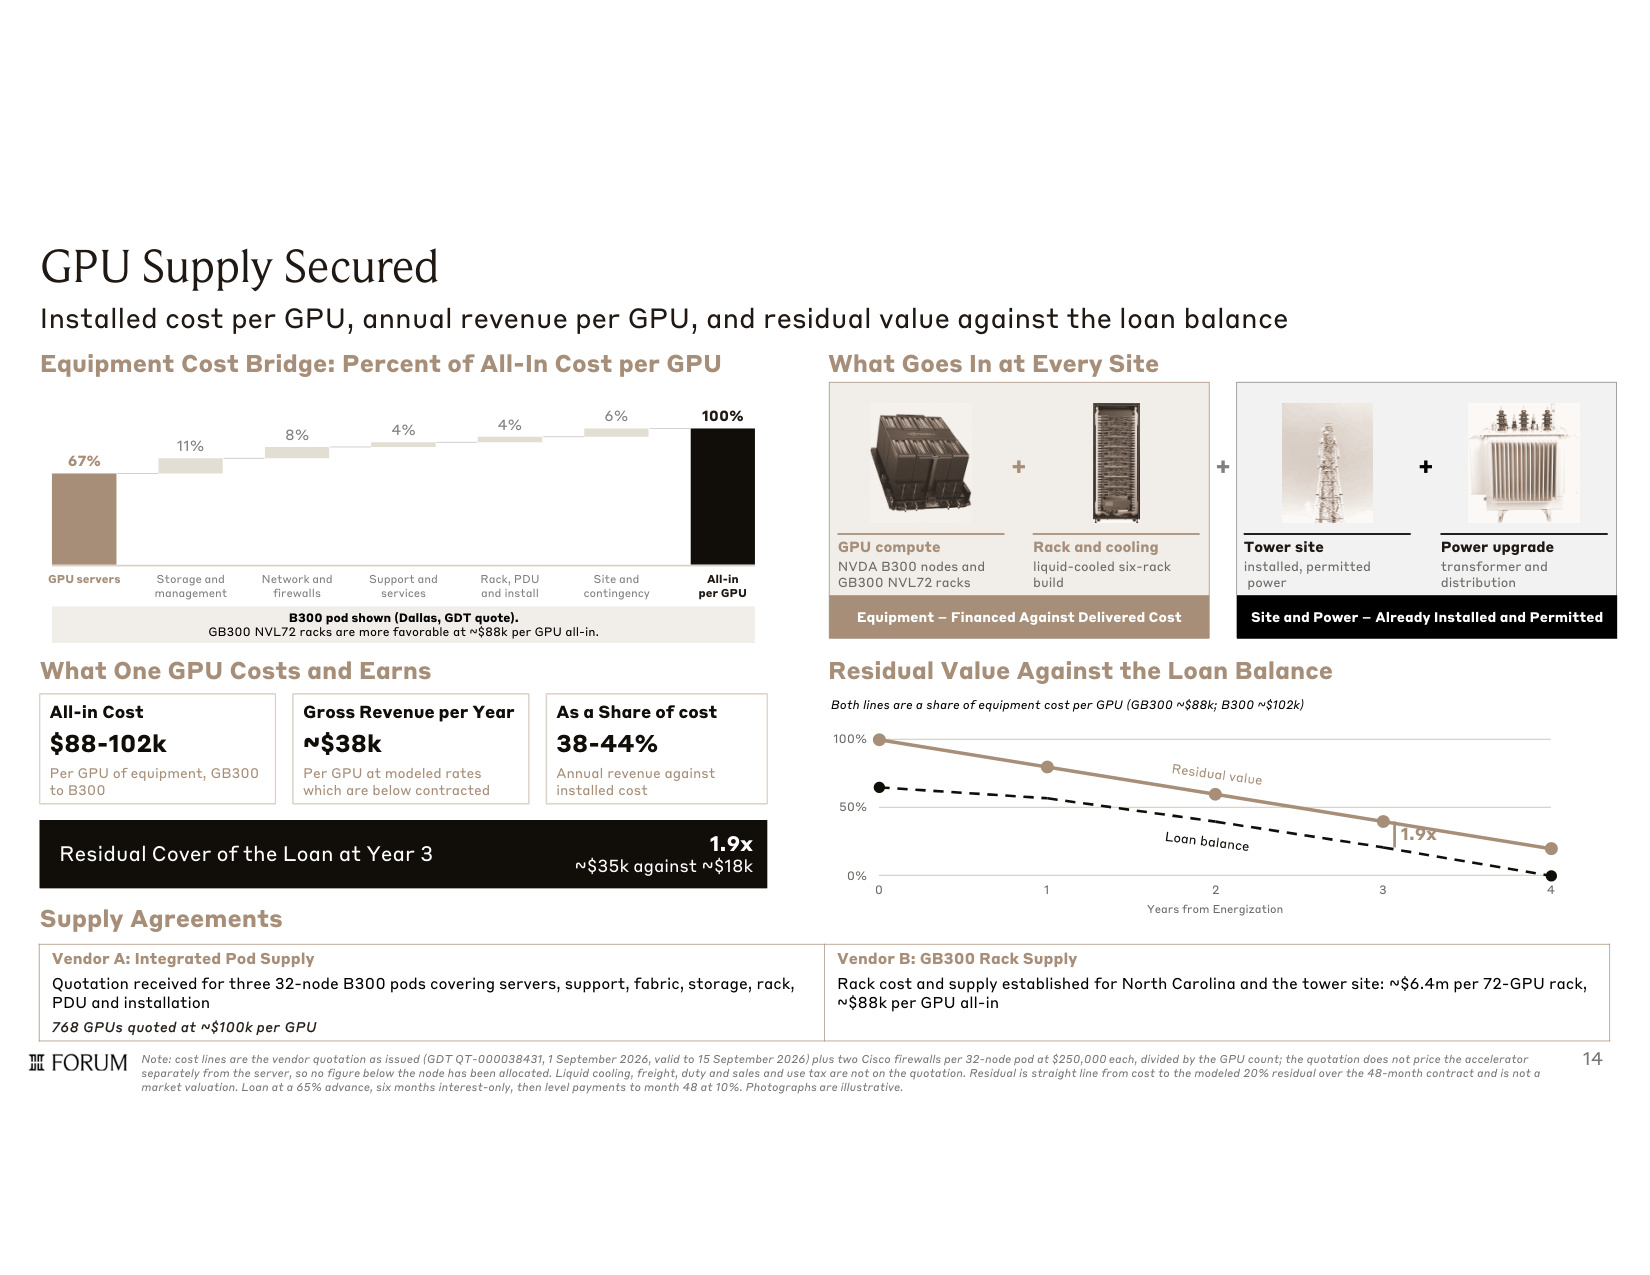
GPU Supply Secured Installed cost per GPU, annual revenue per GPU, and residual value against the loan balance Equipment Cost Bridge: Percent of All-In Cost per GPU 67% 11% 8% 4% 4% 6% 100% GPU servers Storage and management Network and firewalls Support and services Rack, PDU and install Site and contingency All-in per GPU B300 pod shown (Dallas, GDT quote). GB300 NVL72 racks are more favorable at ~$88k per GPU all-in. What Goes In at Every Site GPU compute NVDA B300 nodes and GB300 NVL72 racks + Rack and cooling liquid-cooled six-rack build + What One GPU Costs and Earns Residual Value Against the Loan Balance 100% 50% 0% 1.9x 0 1 2 3 4 Years from Energization Both lines are a share of equipment cost per GPU (GB300 ~$88k; B300 ~$102k) Note: cost lines are the vendor quotation as issued (GDT QT-000038431, 1 September 2026, valid to 15 September 2026) plus two Cisco firewalls per 32-node pod at $250,000 each, divided by the GPU count; the quotation does not price the accelerator separately from the server, so no figure below the node has been allocated. Liquid cooling, freight, duty and sales and use tax are not on the quotation. Residual is straight line from cost to the modeled 20% residual over the 48-month contract and is not a market valuation. Loan at a 65% advance, six months interest-only, then level payments to month 48 at 10%. Photographs are illustrative. Supply Agreements All-in Cost $88-102k Per GPU of equipment, GB300 to B300 Gross Revenue per Year ~$38k Per GPU at modeled rates which are below contracted As a Share of cost 38-44% Annual revenue against installed cost Residual Cover of the Loan at Year 3 1.9x ~$35k against ~$18k Equipment Financed Against Delivered Cost Tower site installed, permitted power + Power upgrade transformer and distribution Site and Power Already Installed and Permitted Vendor B: GB300 Rack Supply Rack cost and supply established for North Carolina and the tower site: ~$6.4m per 72-GPU rack, ~$88k per GPU all-in Vendor A: Integrated Pod Supply Quotation received for three 32-node B300 pods covering servers, support, fabric, storage, rack, PDU and installation 768 GPUs quoted at ~$100k per GPU 14
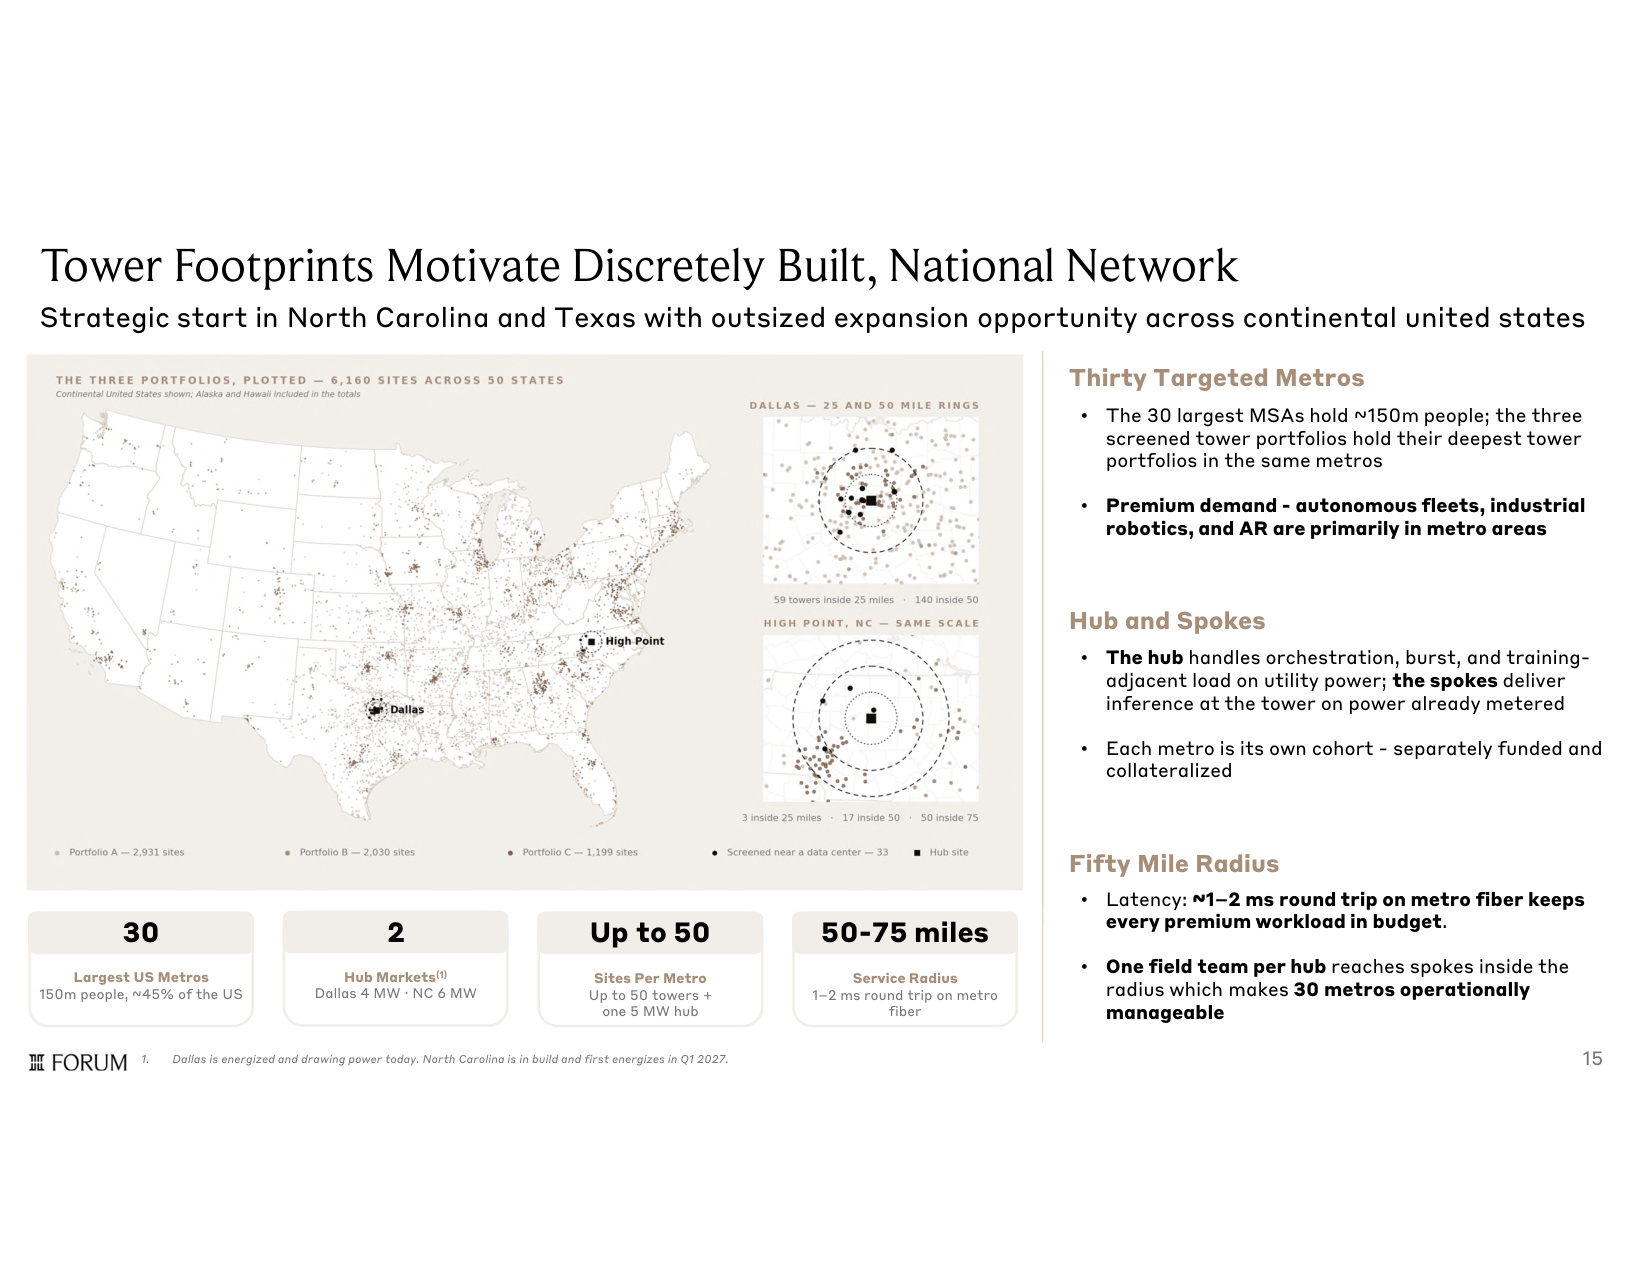
Tower Footprints Motivate Discretely Built, National Network Strategic start in North Carolina and Texas with outsized expansion opportunity across continental united states 30 Largest US Metros 150m people, ~45% of the US 2 Hub Markets(1) Dallas 4 MW · NC 6 MW Up to 50 Sites Per Metro Up to 50 towers + one 5 MW hub 50-75 miles Service Radius 1 2 ms round trip on metro fiber Hub and Spokes • The hub handles orchestration, burst, and training- adjacent load on utility power; the spokes deliver inference at the tower on power already metered • Each metro is its own cohort - separately funded and collateralized Fifty Mile Radius • Latency: ~1 2 ms round trip on metro fiber keeps every premium workload in budget. • One field team per hub reaches spokes inside the radius which makes 30 metros operationally manageable • The 30 largest MSAs hold ~150m people; the three screened tower portfolios hold their deepest tower portfolios in the same metros • Premium demand - autonomous fleets, industrial robotics, and AR are primarily in metro areas Thirty Targeted Metros 1. Dallas is energized and drawing power today. North Carolina is in build and first energizes in Q1 2027. 15
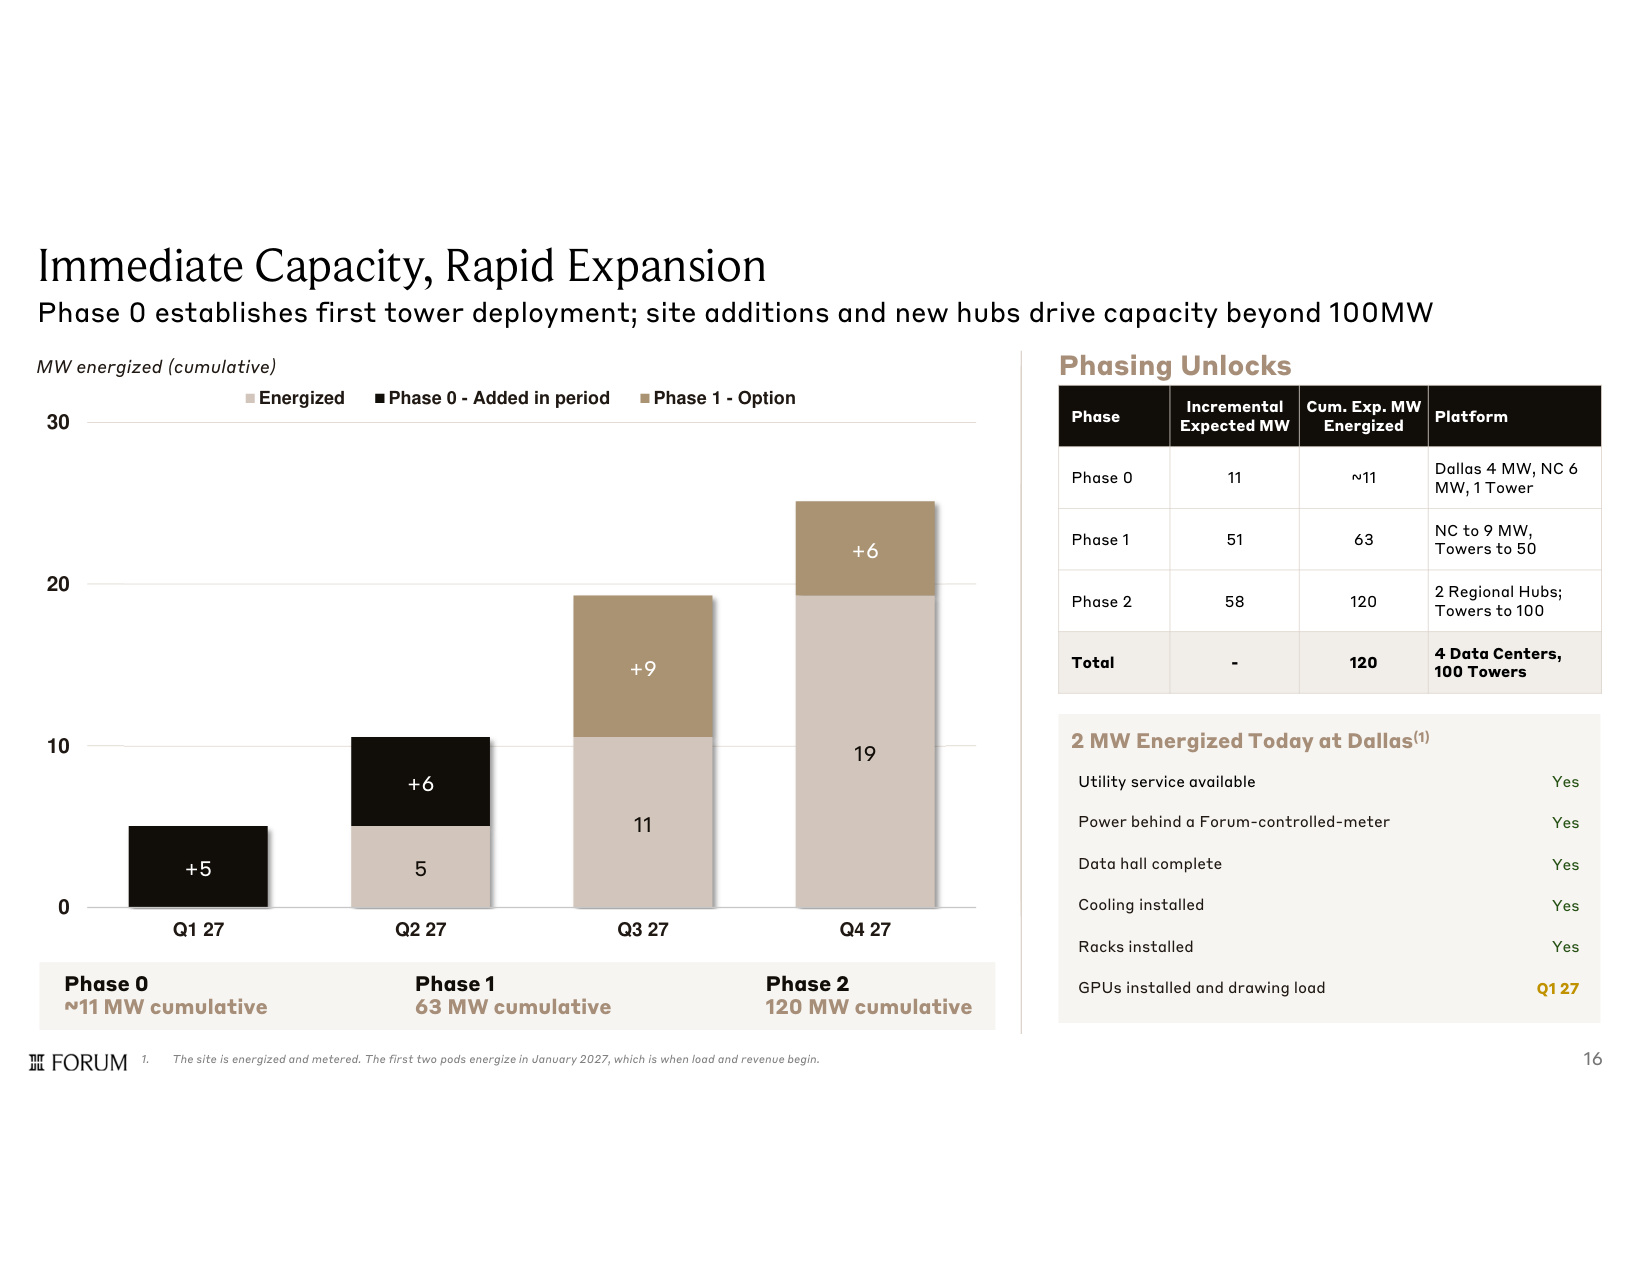
Platform Cum. Exp. MW Energized Incremental Expected MW Phase Dallas 4 MW, NC 6 MW, 1 Tower ~11 11 Phase 0 NC to 9 MW, Towers to 50 63 51 Phase 1 2 Regional Hubs; Towers to 100 120 58 Phase 2 4 Data Centers, 100 Towers 120 - Total Immediate Capacity, Rapid Expansion Phase 0 establishes first tower deployment; site additions and new hubs drive capacity beyond 100MW Phasing Unlocks MW energized (cumulative) Phase 0 ~11 MW cumulative Phase 1 63 MW cumulative Phase 2 120 MW cumulative 5 11 19 +5 +6 +9 +6 0 10 20 30 Q1 27 Q2 27 Q3 27 Q4 27 Energized Phase 0 - Added in period Phase 1 - Option 2 MW Energized Today at Dallas(1) 1. The site is energized and metered. The first two pods energize in January 2027, which is when load and revenue begin. Yes Utility service available Yes Power behind a Forum-controlled-meter Yes Data hall complete Yes Cooling installed Yes Racks installed Q1 27 GPUs installed and drawing load 16
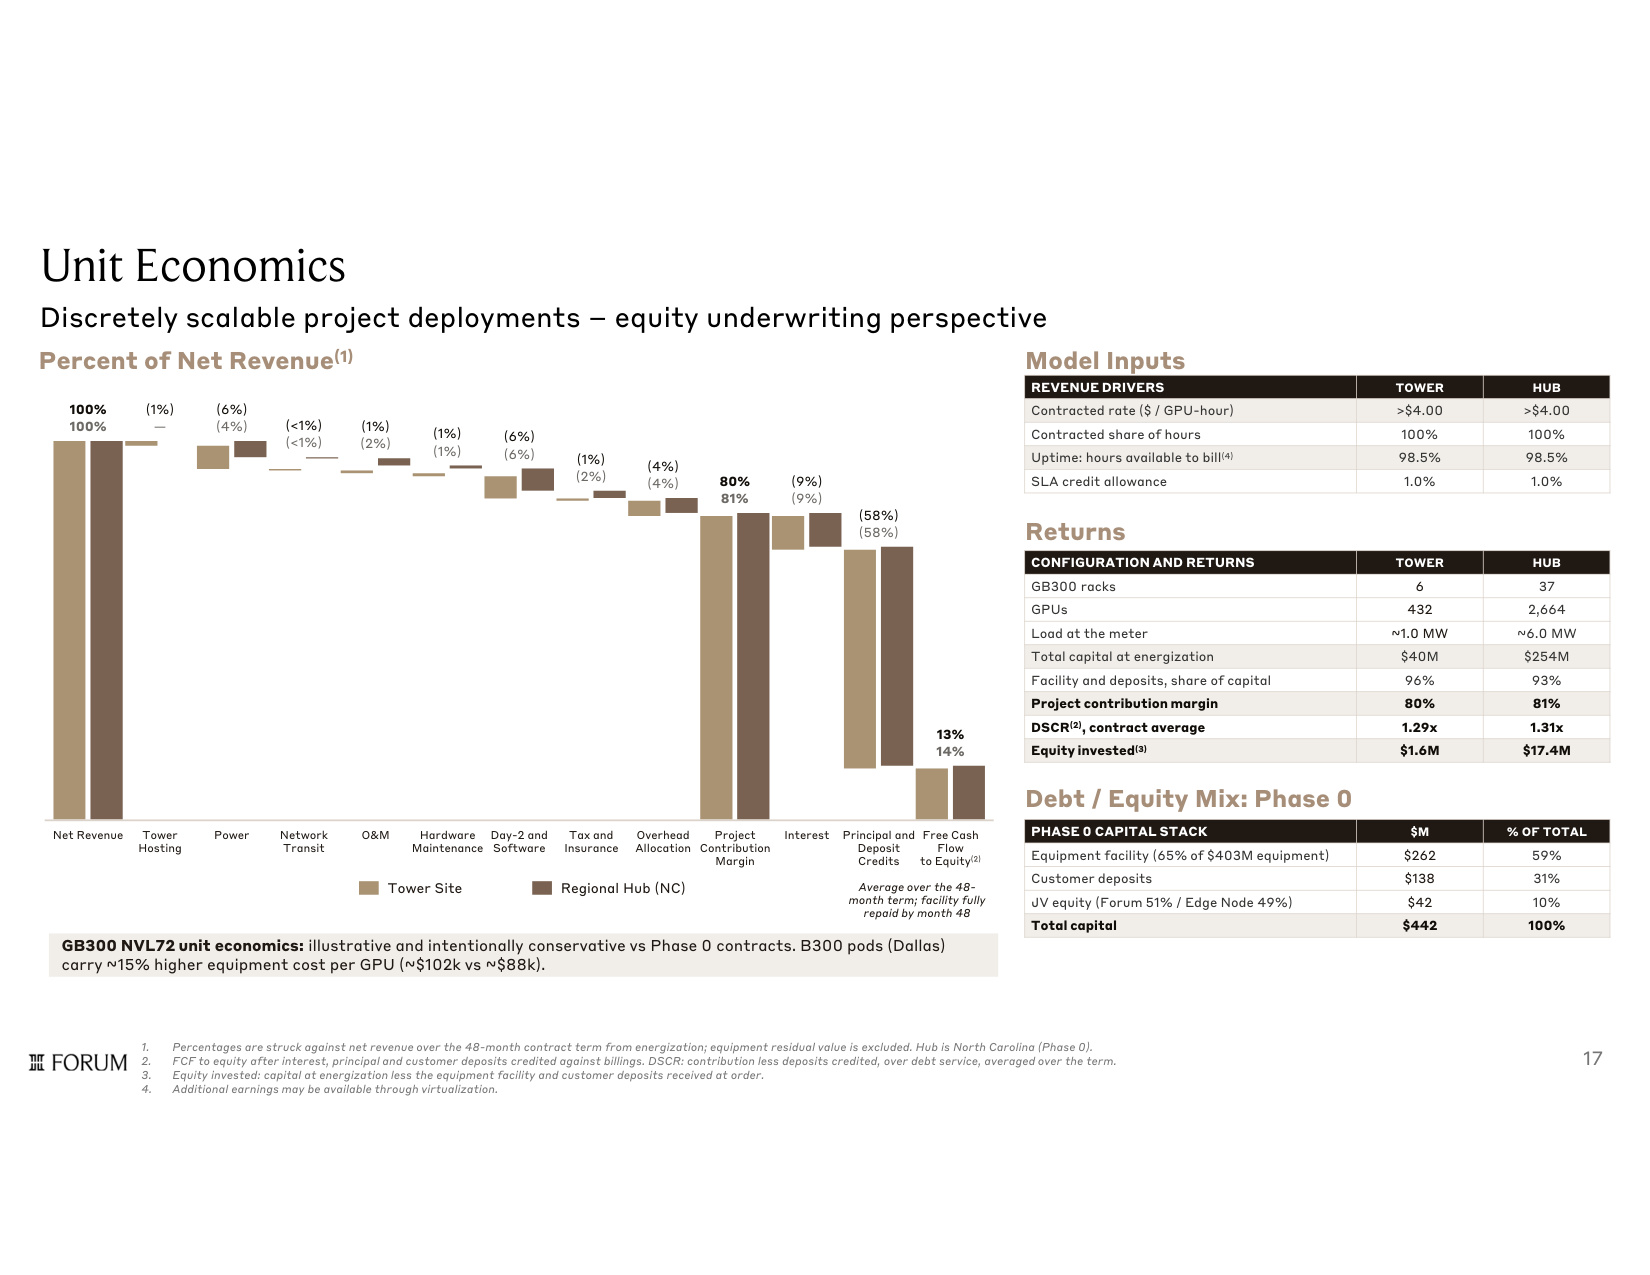
Unit Economics Discretely scalable project deployments equity underwriting perspective Percent of Net Revenue(1) Net Revenue Tower Hosting Power Network Transit O&M Hardware Maintenance Day-2 and Software Tax and Insurance Overhead Allocation Project Contribution Margin Interest Principal and Deposit Credits Average over the 48- month term; facility fully repaid by month 48 Free Cash Flow to Equity(2) Tower Site Regional Hub (NC) GB300 NVL72 unit economics: illustrative and intentionally conservative vs Phase 0 contracts. B300 pods (Dallas) carry ~15% higher equipment cost per GPU (~$102k vs ~$88k). Model Inputs HUB TOWER REVENUE DRIVERS >$4.00 >$4.00 Contracted rate ($ / GPU-hour) 100% 100% Contracted share of hours 98.5% 98.5% Uptime: hours available to bill(4) 1.0% 1.0% SLA credit allowance 1. Percentages are struck against net revenue over the 48-month contract term from energization; equipment residual value is excluded. Hub is North Carolina (Phase 0). 2. FCF to equity after interest, principal and customer deposits credited against billings. DSCR: contribution less deposits credited, over debt service, averaged over the term. 3. Equity invested: capital at energization less the equipment facility and customer deposits received at order. 4. Additional earnings may be available through virtualization. 100% 100% (1%) — (6%) (4%) (<1%) (<1%) (1%) (2%) (1%) (1%) (6%) (6%) (1%) (2%) (4%) (4%) 80% 81% (9%) (9%) (58%) (58%) 13% 14% HUB TOWER CONFIGURATION AND RETURNS 37 6 GB300 racks 2,664 432 GPUs ~6.0 MW ~1.0 MW Load at the meter $254M $40M Total capital at energization 93% 96% Facility and deposits, share of capital 81% 80% Project contribution margin 1.31x 1.29x DSCR(2), contract average $17.4M $1.6M Equity invested(3) Debt / Equity Mix: Phase 0 % OF TOTAL $M PHASE 0 CAPITAL STACK 59% $262 Equipment facility (65% of $403M equipment) 31% $138 Customer deposits 10% $42 JV equity (Forum 51% / Edge Node 49%) 100% $442 Total capital Returns 17
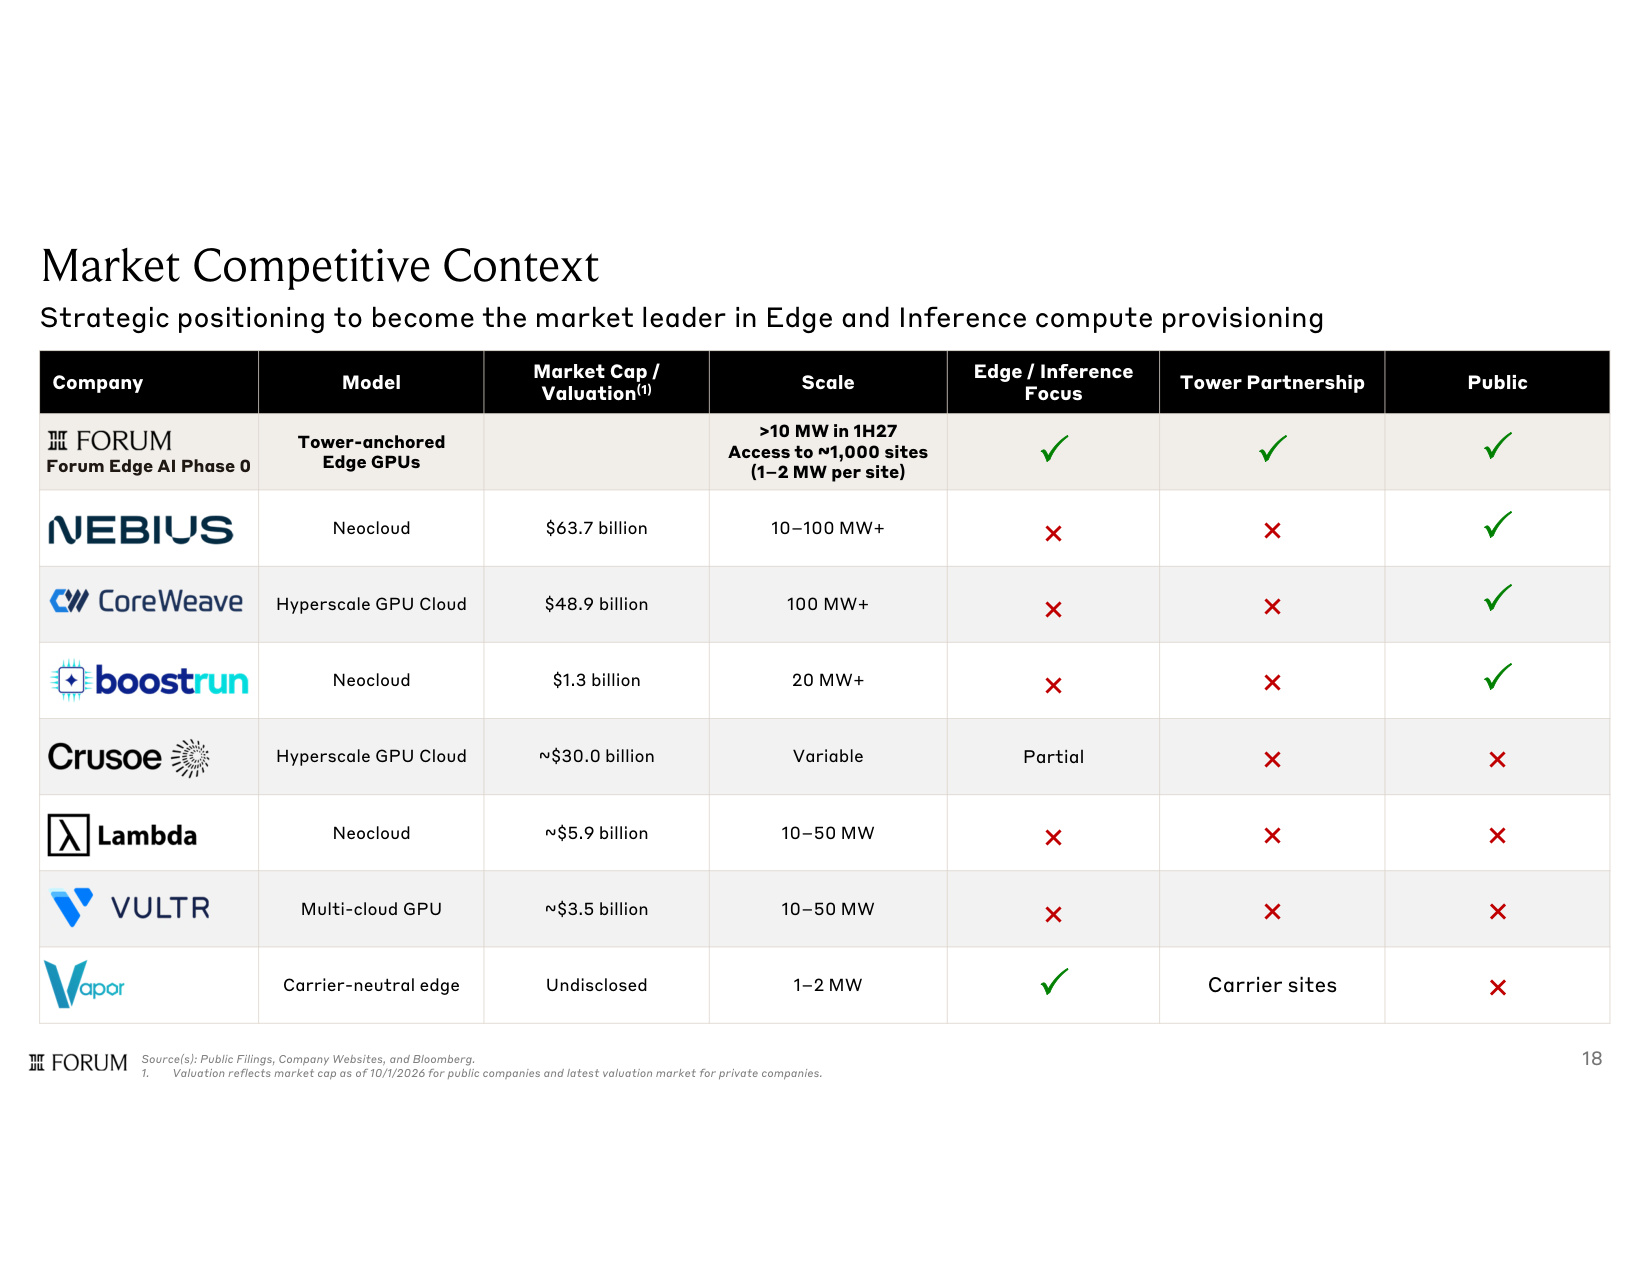
Market Competitive Context Public Tower Partnership Edge / Inference Focus Scale Market Cap / Valuation(1) Model Company >10 MW in 1H27 Access to ~1,000 sites (1 2 MW per site) Tower-anchored Edge GPUs × × 10 100 MW+ $63.7 billion Neocloud × × 100 MW+ $48.9 billion Hyperscale GPU Cloud × × 20 MW+ $1.3 billion Neocloud × × Partial Variable ~$30.0 billion Hyperscale GPU Cloud × × × 10 50 MW ~$5.9 billion Neocloud × × × 10 50 MW ~$3.5 billion Multi-cloud GPU × Carrier sites 1 2 MW Undisclosed Carrier-neutral edge Source(s): Public Filings, Company Websites, and Bloomberg. 1. Valuation reflects market cap as of 10/1/2026 for public companies and latest valuation market for private companies. Strategic positioning to become the market leader in Edge and Inference compute provisioning Forum Edge AI Phase 0 18