•Accelerated year-over-year growth in retail units and revenue
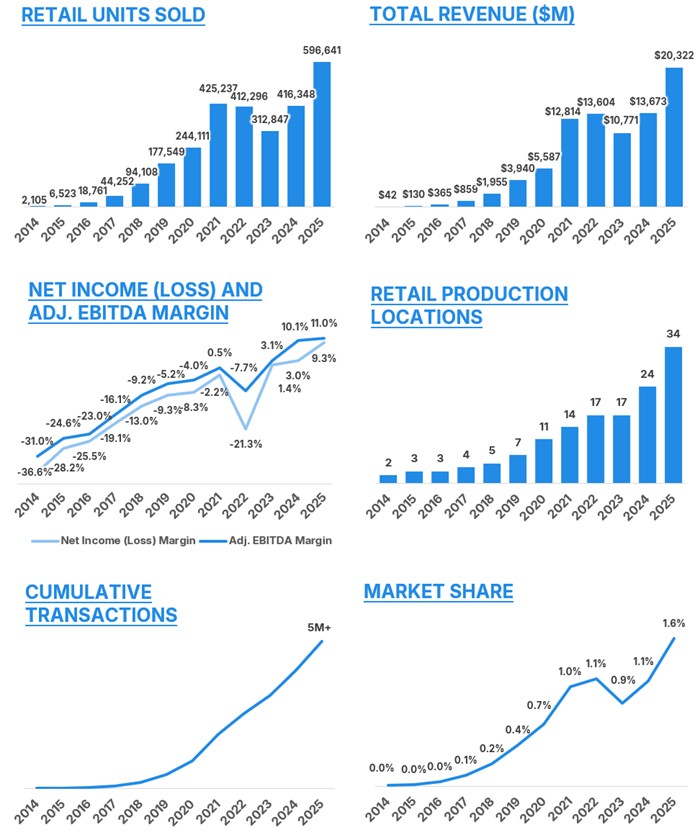
◦Grew retail units by 180,293 (43%) year-over-year, bringing used market share to ~1.6%
◦Revenue over $20 billion for the first time, up 49% year-over-year
◦Exceeded 5 million cumulative customer transactions
•Achieved record company-level profitability
◦Net income of $1.895 billion, Net income margin of 9.3%1
▪Net income included a net non-cash benefit of $621 million
◦GAAP Operating income of $1.881 billion, GAAP Operating margin of 9.3%
◦Adjusted EBITDA of $2.237 billion, Adjusted EBITDA margin of 11.0%
•Drove significant cost efficiencies while scaling
◦Operations expense per unit down $118 year-over-year
◦Overhead expense per unit down $355 year-over-year
•Joined the S&P 500 with 2025 revenue growth in the top 2% of S&P 500 companies
•Recognized by Forbes as one of the Best Large Employers for 2026
GIVING BACK TO CUSTOMERS TO DRIVE BETTER EXPERIENCES
•Expanded vehicle selection by 20,000 vehicles year-over-year
•Brought cars closer to more customers by growing inventory pools to 34 locations nationwide
◦Passed on lower shipping costs to customers in the form of $60 lower shipping fees on average year-over-year in Q4
◦Reduced frequency of customer delays by ~10% year-over-year
•Delivered cars to customers faster than ever before
◦Reduced average delivery times by 1 full day year-over-year
◦Share of retail sales with same day or next day deliveries more than doubled year-over-year
•Shared fundamental finance and cost of funds gains with customers through lower APRs
•Simplified and personalized the e-commerce experience
◦Over 30% of car buyers and 60% of car sellers now complete entire process without speaking to an Advocate until vehicle delivery or pick up
◦Average calls per sale down ~25% year-over-year in Q4
1 Net income in FY 2025 was positively impacted by ~$685 million associated with the release of our valuation allowance against our deferred tax assets and recording of the full tax receivable agreement liability. Additionally, Net income for FY 2025 was negatively impacted by ~$64 million associated with changes in the fair value of our warrants to acquire Root common stock.
2
Dear Shareholders,
2025 was another exceptional year full of exciting results and significant milestones.
We grew retail units by 43% and sold just shy of 600,000 cars. We crossed $20 billion in annual revenue. We crossed $1 billion in Net Income and $2 billion in Adjusted EBITDA. And we completed our 5 millionth customer transaction.
These are big numbers that are growing fast.
And they all come from the same root. 13 years and $10 billion invested ago, our team set a clear vision to achieve a big goal. And then we just kept marching.
We believed that by building a fundamentally different business we could deliver fundamentally different customer experiences and fundamentally different financial results.
Today, our progress validates that belief. We are the most profitable automotive retailer by a factor of two and the fastest growing by a long way.
Our success is driven by a simple principle: everything we do starts with the customer, and we work backward from there. We are built to deliver simpler, faster, more confidence-inspiring transactions that deliver greater value with greater selection.
Even with all of our progress, we still have the headroom of many early-stage startups. At a scale of ~600,000 sales per year, we represent just 1.6% of used car sales and 1% of overall U.S. car sales. Even our next milestone goal of selling 3 million cars annually represents only 7.5% of the used car market.
Meanwhile, the market around us looks very similar to the way it did on day one. At that point, the entire market was held by many thousands of traditional retailers, each delivering similar experiences with similar structural economics to one another. Along the way, several companies, including Carvana, sought to build a different kind of business model that would deliver different kinds of experiences and results. Our collective learnings demonstrate just how difficult it is to build a business like ours.
And today, we are, once again, competing almost exclusively with traditional retailers, only now, Carvana is operating at scale and our model’s competitive differentiation is proven and growing.
Our business gets better as it gets bigger – not just in the results it drives but in the customer experiences it delivers. 30% of our retail customers and 60% of customers selling us their car now choose to do so without talking to anyone at Carvana prior to delivery or pickup because our tools are simple and confidence inspiring. As we added more inventory pools, logistics routes, and network density in 2025, our average delivery time fell by a full day year-over-year and customers paid lower shipping fees. Our growth enabled us to expand customer selection by 20,000 cars compared to a year ago. And the fundamental gains we achieved in the last year also meant that we were able to pass more value on to our customers in the form of lower interest rates.
Compared to just one year ago, our customers are more likely to find the exact car they are looking for, they can have that car delivered faster, and they spend less money to get it.
We delivered all that value, grew rapidly, and improved our financial performance at the same time because of the positive feedback inherent in our business and we plan to get much bigger and much better from here.
We are the fastest growing and most profitable automotive retailer.
The path to selling 3 million cars per year at 13.5% Adjusted EBITDA margins by 2030 to 2035 is clear.
We still have the same team that got us here working with the same vision, the same enthusiasm, the same intensity, and the same ambition that we had at the beginning.
And we remain on a mission to change the way people buy and sell cars.
3
Summary of Q4 2025 and 2025 Results
Q4 2025 Financial Results: All financial comparisons stated below are versus Q4 2024, unless otherwise noted. Complete financial tables appear at the end of this letter.
•Retail units sold totaled 163,522, an increase of 43%
•Revenue totaled $5.603 billion, an increase of 58%
•Total Gross profit was $1.051 billion, an increase of 38%
•Total Gross profit per unit (“GPU”) was $6,427, a decrease of $244
•Non-GAAP Total GPU was $6,562, a decrease of $354
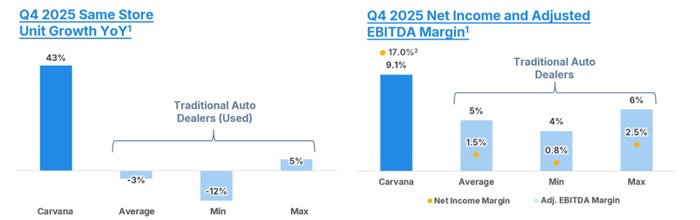
•Net income margin was 17.0%, an increase from 4.5%
◦Net income totaled $951 million2
•Adjusted EBITDA margin was 9.1%, a decrease from 10.1%
◦Adjusted EBITDA totaled $511 million
•GAAP Operating income was $424 million, an increase of $164 million
•Basic and diluted net earnings per Class A share were $6.05 and $4.22, respectively, based on 142 million and 226 million shares of Class A common stock outstanding, respectively
FY 2025 Financial Results: All financial comparisons stated below are versus FY 2024, unless otherwise noted. Complete financial tables appear at the end of this letter.
•Retail units sold totaled 596,641, an increase of 43%
•Revenue totaled $20.322 billion, an increase of 49%
•Total Gross profit was $4.192 billion, an increase of 46%
•Total GPU was $7,026, an increase of $118
•Non-GAAP Total GPU was $7,182, a decrease of $14
•Net income margin was 9.3%, an increase from 3.0%
◦Net income totaled $1.895 billion2
•Adjusted EBITDA margin was 11.0%, an increase from 10.1%
◦Adjusted EBITDA totaled $2.237 billion
•GAAP Operating income was $1.881 billion, an increase of $891 million
•Basic and diluted net earnings per Class A share were $10.22 and $8.45, respectively, based on 138 million and 224 million shares of Class A common stock outstanding, respectively
Outlook
In 2025, we focused on three key objectives: (i) significant growth in retail units and Adjusted EBITDA, (ii) fundamental gains in unit economics and customer experience, and (iii) developing foundational capabilities.
We made significant progress in all three areas in 2025, highlighted by record units, industry-leading margins, multi-year high customer NPS, and expanded integrated reconditioning and digital auction capabilities.
In 2026, we plan to maintain these priorities while placing additional weight on driving significant, profitable growth at scale.
Looking forward, we expect significant growth in both retail units sold and Adjusted EBITDA3 in full year 2026, including a sequential increase in both retail units sold and Adjusted EBITDA3 in Q1 2026, assuming the environment remains stable.
2 Net income in Q4 2025 and FY 2025 were positively impacted by ~$685 million each period associated with the release of our valuation allowance against our deferred tax assets and recording of the full tax receivable agreement liability. Additionally, Net income in Q4 2025 and FY 2025 were negatively impacted by ~$67 million and ~$64 million, respectively, associated with changes in the fair value of our warrants to acquire Root common stock.
3 In order to clearly demonstrate our progress and highlight the most meaningful drivers within our business, we continue to use forecasted Non-GAAP financial measures, including forecasted Adjusted EBITDA. We have not provided a quantitative reconciliation of forecasted GAAP measures to forecasted Non-GAAP measures within this communication because we are unable, without making unreasonable efforts, to forecast fair value changes or calculate one-time or restructuring expenses. These items could materially affect the computation of forward-looking Net Income (loss).
4
Fourth Quarter Results
Retail units sold reached a new company record of 163,522, driven by strong customer demand for our differentiated offering. We grew retail units 43% year-over-year, significantly outpacing our industry, which was approximately flat year-over-year.
In order to support such significant growth, we successfully scaled operations across the business but saw three primary drivers leading Retail GPU to be outside of the normal range of sequential seasonal changes we were expecting.
The first driver was the result of a favorable operational trend. Strong execution from our fulfillment team, combined with the expansion of new inventory pools, reduced our average outbound shipping distance as more customers purchased vehicles closer to them. This lower shipping distance flowed through to customers in the form of lower shipping fees, while also generating operations expense savings in SG&A.
The second was an opportunity for better execution. Reconditioning costs came in higher than our expectations, particularly in locations with the lowest management tenure. We see clear opportunities to make management of our large-scale production facilities simpler and more data-driven, much like we have done for associate and line lead workflows through our proprietary Carli software. We believe this can lower reconditioning costs over time as we scale. As a point of reference, if all production locations had per unit costs in line with the top quartile of locations, our total reconditioning cost per unit would have been ~$220 lower in Q4.
Finally, retail depreciation rates increased sequentially more than last year, leading to an additional impact on Retail GPU.
We expect to see elevated reconditioning costs again in Q1, but expect a sequential increase in Retail GPU in Q1.
Overall, our results in Q4 continued our industry leadership in both growth and profitability, marking another step toward our goal of becoming the largest and most profitable auto retailer and buying and selling millions of cars.
1 All data points are as of Q4 2025 or most recently reported fiscal quarter.
2 Net income margin in Q4 2025 was positively impacted by a net 11.0% benefit associated with the release of our valuation allowance against our deferred tax assets and recording of the full tax receivable agreement liability and changes in the fair value of our warrants to acquire Root common stock. Note that Carvana Net income margin is not to scale.
Progress On Our Path to 3 Million Units
In 2025, we set a goal to sell 3 million retail units annually at a 13.5% Adjusted EBITDA margin within the next 5 to 10 years (for clarity, we will now refer to this as 2030 to 2035). When we announced this goal, we estimated that we would need to grow at 20% to 40% annually to achieve our goal by 2030 or 2035. In 2025, we grew at 43% year-over-year. As a result, the annual growth rates required to achieve our goal are now 18% to 38%.
In 2025, we increased Adjusted EBITDA margin to 11%, up from 10.1% in 2024. We see a clear path to our target of 13.5% through: 1) fixed cost overhead leverage and 2) driving our company-wide advertising efficiency to mature market levels. We also see significant opportunities to keep improving unit economics, but as we achieve them, we expect to pass back many of these fundamental gains to customers, further differentiating our offering.
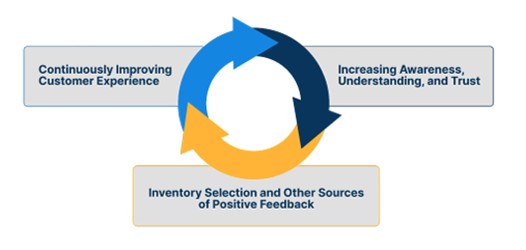
Our growth in 2025 was again driven by our three fundamental drivers: 1) continuously improving our customer offering, 2) increasing awareness, understanding, and trust, and 3) increasing inventory selection and other benefits of scale. In 2025, we made meaningful progress across each area. Below are a few examples.
5
1)We continue to improve our customer offering.
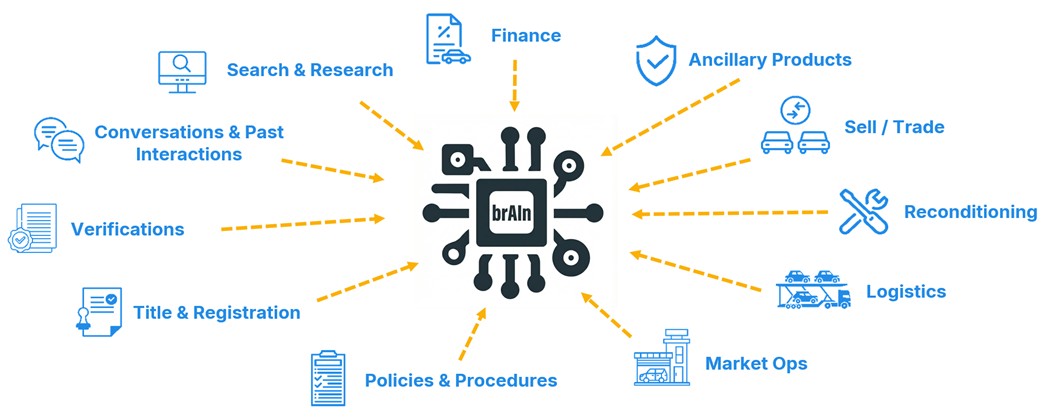
In 2025, we further integrated our technology and operations to deliver even better customer experiences. Below is an example of how we’re improving Customer Care with AI.
Our AI brain sits flexibly atop multiple leading-edge foundation models, while leveraging proprietary, real-time data from our home-built systems containing inventory information, finance terms, vehicle valuations, state, local, and Carvana-specific policies, labor optimization algorithms, and much more. Within Customer Care, it uses that deep context to serve up personalized responses that enable both AI agents and Advocates to deliver consistent, high-quality, personalized support.
Customer Care tools powered by our AI brain have driven meaningful customer experience gains: more than 30% of car buyers and 60% of car sellers now complete the entire process without interacting with a Customer Advocate until their delivery or pickup. This growing subset of customers is higher converting and has a higher reported Net Promoter Score.
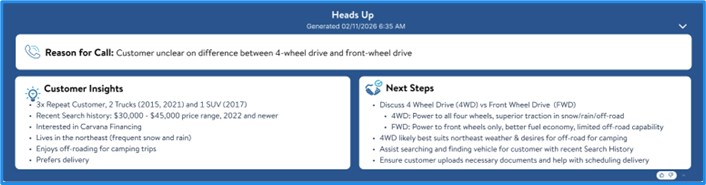
When customers do choose to interact with an Advocate, the same brain powers tools that help our team deliver efficient, personalized support. A new example is Heads Up, a proprietary tool that synthesizes the customer’s past and real-time actions in a simple interface to ensure Advocates are equipped with the most relevant and personalized information for each customer’s specific journey.
Heads Up enhances customer experiences and operational performance by driving consistency and accelerating Advocate proficiency. Looking forward, we will continue to refine and enhance our customer-facing technology to make buying from or selling to Carvana as intuitive and convenient as possible.
2)We continue to increase awareness, understanding and trust.
In 2025, we invested more in advertising and launched new campaigns to expand our reach and educate customers. After more than a decade of building what we believe is the best way to buy or sell a car, there are still many people who are not familiar with Carvana, underscoring our opportunity.
6
Beyond advertising, word of mouth is a powerful and compounding driver of growth. A recent third party survey indicates that ~70%4 of Carvana car buyers were influenced by a friend or family member’s recommendation. Among those influenced, just under half said this recommendation was the primary driver of their choice. That same survey showed that roughly three quarters of Carvana customers recommended us to two or more people, with 7% recommending Carvana to ten or more people5.
High-quality, efficiently-deployed advertising campaigns have always been essential to brand building, but this data also underscores the importance of delivering great experiences to more and more customers over time. With more than 5 million customer transactions to date and more customer touchpoints every day, we are just getting started.
3)We continue to build selection and leverage benefits of scale.
In 2025, we continued to unlock the power of our infrastructure, growing our total number of inventory pools from 24 to 34. With more than 75,000 vehicles available on our website at year-end, we offer our broadest selection ever, making it more likely that we have the exact vehicle a customer is looking for.
By growing inventory across geographies we also put more cars closer to more customers, shortening average delivery times by a full day year-over-year and increasing the share of customers with access to as-soon-as same-day delivery.
Each growth driver strengthens the others, creating a compounding cycle with scale. A great customer experience drives positive word of mouth, organic demand, and efficient acquisition, which supports broader selection, faster delivery, and lower per unit costs. The resulting gains can be passed back to further improve the customer experience, leading to further growth. These drivers fueled our growth in 2025, and we expect them to continue to fuel us as we march towards selling 3 million retail units and beyond.
4 “Carvana Consumer Survey Volume 13” conducted by Bespoke Market Intelligence October 2025. Electronic survey conducted over a large population (N = 10,000) to gather consumer feedback towards Carvana and competitive brands. Base: n=384 respondents who said that they purchased a car from Carvana, Question: “To what extent do a friend or family member’s recommendation of Carvana influence your decision to buy from Carvana?”
5 “Carvana Consumer Survey Volume 14” conducted by Bespoke Market Intelligence February 2026. Electronic survey conducted over a large population (N = 10,000) to gather consumer feedback towards Carvana and competitive brands. Base: n=647 respondents who said that they purchased a car from Carvana, Question: “Have you recommended the following to any people?”
7
Expanding Production Capacity
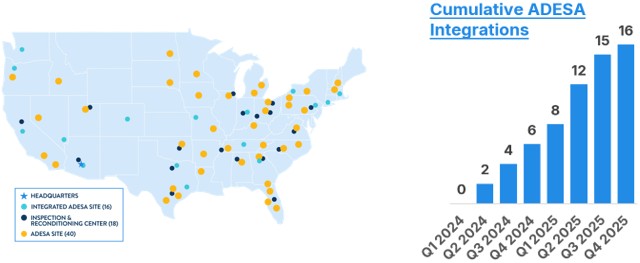
One of the key drivers of our growth to 3 million annual retail units sold is expanding production capacity. In 2025, we integrated 10 additional ADESA production locations, including one in Q4, bringing our total to 16 integrations since we began our rollout in Q2 2024.
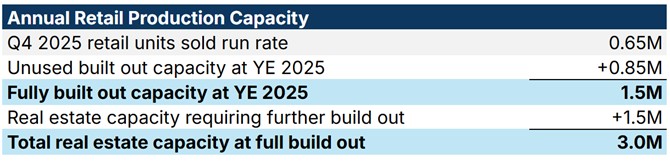
We now have fully built out annual capacity for approximately 1.5 million retail units, with real estate to support annual retail production of 3 million retail units.
We plan to execute four key production strategies over time to drive to 3 million units and beyond: 1) increasing staffing at existing facilities, 2) integrating retail production lines at more ADESA facilities, 3) building new lines at ADESA facilities, and 4) eventually, building new greenfield production locations, with the latter being less of a priority in the near term.
In 2026, we plan to continue integrating existing ADESA sites with a target of 6 to 8 new integrations, while also beginning full buildouts at select ADESA locations. We currently expect ADESA full buildouts to cost an average of $30 to $35 million per site and to unlock an average of ~40k units of annual production capacity per site. We plan to start construction on the first full buildout sites in Q2 2026 and to launch production capabilities in early 2027.
Looking forward we will continue investing in our infrastructure ahead of future growth. By building excess reconditioning capacity, we benefit from near-term operational flexibility while laying a clear foundation to support growth over the medium and long term.
8
Summary
2025 was another incredible year that can be summed up simply.
We rapidly grew units. We improved our offering. We passed value back to our customers in the form of lower interest rates, lower shipping fees, faster delivery, and broader selection. And while doing all that, we also improved our own financial performance.
That summary is basically the dream we started with. It’s something we’re extremely proud of.
But we are nowhere near satisfied.
The march continues,
Ernie Garcia, III, Chairman and CEO
Mark Jenkins, CFO
9
Appendix I:
GPU and SG&A Expense Detail
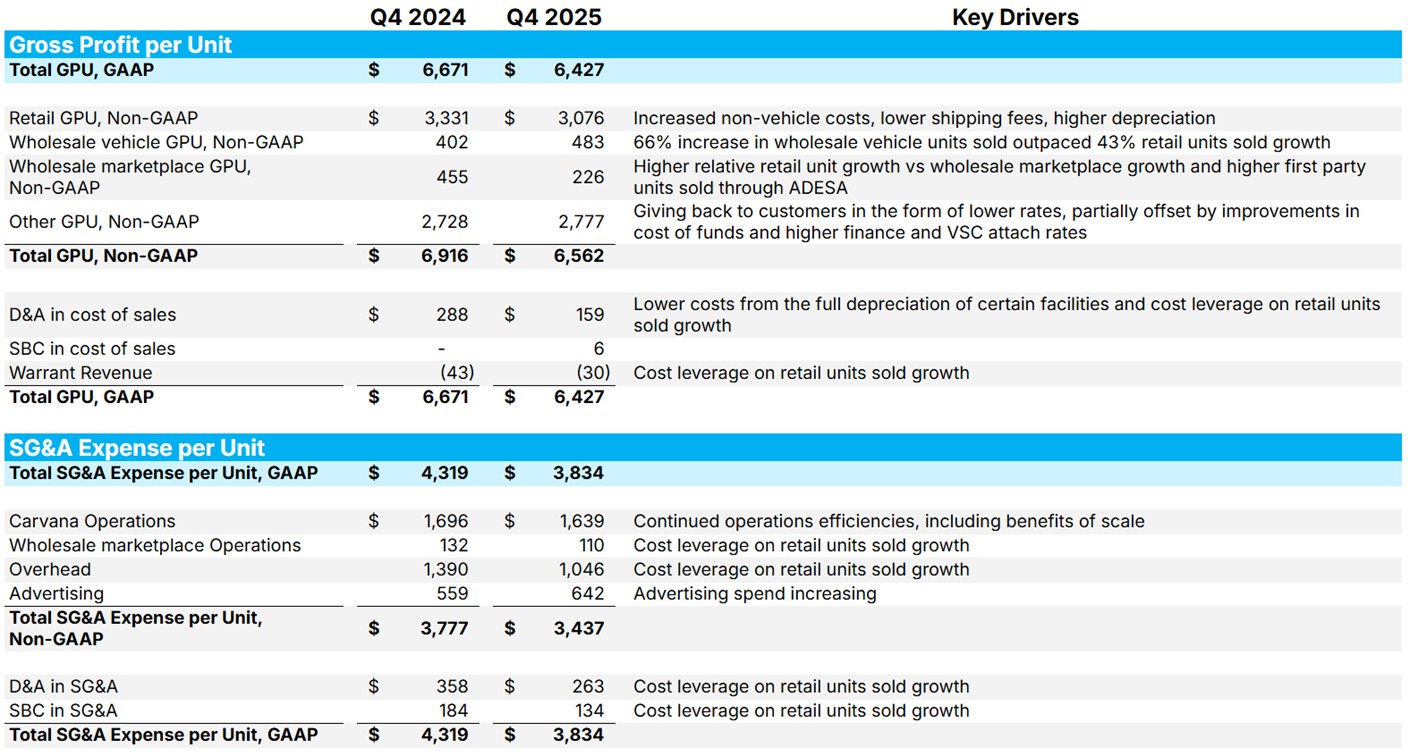
Year-over-year changes in components of Total GPU and Total SG&A Expense per Unit were driven by the factors outlined below.
10
Additional Details
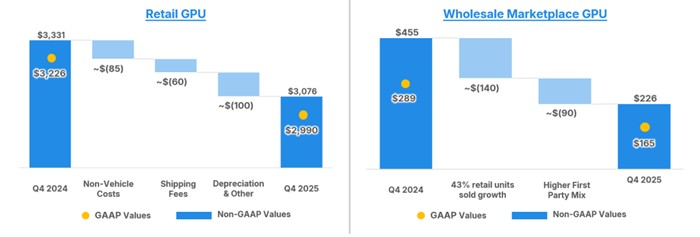
The year-over-year decrease in Retail GPU was primarily driven by higher non-vehicle costs, lower shipping fee revenue (resulting from more customers choosing cars closer to them, which benefits operations expenses), and higher industry-wide retail depreciation rates.
The year-over-year decrease in Wholesale Marketplace GPU was driven by two primary factors. First, growth in retail units sold significantly outpaced growth in wholesale marketplace units sold, leading to a mechanical per retail unit impact of ~$140 per retail unit sold. Second, as we expanded ADESA Clear nationwide, we shifted our wholesale marketplace unit mix into units sold by Carvana and away from units sold by third-parties. The majority of revenue and gross profit on marketplace units sold by Carvana is included in Wholesale Vehicle sales and gross profit, contributing to Wholesale Vehicle gross profit growth but leading to lower Wholesale Marketplace gross profit, other things being equal.
11
Conference Call Details
Carvana will host a conference call today, February 18, 2026, at 5:30 p.m. EST (2:30 p.m. PST) to discuss financial results. To participate in the live call, analysts and investors should dial (833) 255-2830 or (412) 902-6715. A live audio webcast of the conference call along with supplemental financial information will also be accessible on the company's website at investors.carvana.com. Following the webcast, an archived version will also be available on the Investor Relations section of the company’s website. A telephonic replay of the conference call will be available until Wednesday, February 25, 2026, by dialing (877) 669-9658 or (412) 317-0088 and entering passcode 3177941#.
Forward Looking Statements
This letter contains forward-looking statements within the meaning of the Private Securities Litigation Reform Act of 1995. These forward-looking statements reflect Carvana’s current expectations and projections with respect to, among other things, its financial condition, results of operations, plans, objectives, strategy, future performance, and business. These statements may be preceded by, followed by or include the words "aim," "anticipate," "believe," "estimate," "expect," "forecast," "intend," "likely," "outlook," "plan," "potential," "project," "projection," "seek," "can," "could," "may," "should," "would," "will," the negatives thereof and other words and terms of similar meaning.
Forward-looking statements include all statements that are not historical facts, including expectations regarding our operational and efficiency initiatives and gains; our strategy, expected gross profit per unit; forecasted results, including forecasted Adjusted EBITDA and forecasted retail units sold; potential infrastructure capacity utilization; efficiency gains and opportunities to improve our results, including opportunities to increase our margins and reduce our expenses, trends or expectations regarding inventory, expected customer patterns and demand; expectations on anticipated timing of increased production output; potential benefits from and expectations regarding new technology, including the use of artificial intelligence; anticipated benefits of integrations, including relating to ADESA; our long-term financial goals; fiscal year 2026 budget items; unexpected macroeconomic conditions, including geopolitical, trade, and regulatory uncertainty and commodity prices; and growth opportunities. Such forward-looking statements are subject to various risks and uncertainties.
Accordingly, there are or will be important factors that could cause actual outcomes or results to differ materially from those indicated in these statements. Among these factors are risks related to: the larger automotive ecosystem, including consumer demand, global supply chain challenges, and other macroeconomic issues (including with respect to the impact of tariffs on our business); our ability to utilize our available infrastructure capacity and realize the expected benefits therefrom, including increased margins and lower expenses; the benefits from our initiatives relating to ADESA; our ability to scale up our business; our ability to raise additional capital and our substantial indebtedness; our ability to effectively manage our rapid growth; our ability to maintain customer service quality and reputational integrity and enhance our brand; the seasonal and other fluctuations in our quarterly and annual operating results; our relationship with DriveTime and its affiliates; the highly competitive industry in which we participate, which among other consequences, could impact our long-term growth opportunities; the changes in prices of new and used vehicles; our ability to acquire and expeditiously sell desirable inventory; our ability to grow complementary product and service offerings; our use of artificial intelligence technology; and the other risks identified under the “Risk Factors” section in our Annual Report on Form 10-K for the fiscal year ended December 31, 2025.
There is no assurance that any forward-looking statements will materialize. You are cautioned not to place undue reliance on forward-looking statements, which reflect expectations only as of this date. Carvana does not undertake any obligation to publicly update or review any forward-looking statement, whether as a result of new information, future developments, or otherwise.
Use of Non-GAAP Financial Measures
As appropriate, we supplement our results of operations determined in accordance with U.S. generally accepted accounting principles (“GAAP”) with certain non-GAAP financial measurements that are used by management, and which we believe are useful to investors, as supplemental operational measurements to evaluate our financial performance. These measurements should not be considered in isolation or as a substitute for reported GAAP results because they may include or exclude certain items as compared to similar GAAP-based measurements, and such measurements may not be comparable to similarly-titled measurements reported by other companies. Rather, these measurements should be considered as an additional way of viewing aspects of our operations that provide a more complete understanding of our business. We strongly encourage investors to review our consolidated financial statements included in publicly filed reports in their entirety and not rely solely on any one, single financial measurement or communication.
Reconciliations of our non-GAAP measurements to their most directly comparable GAAP-based financial measurements are included at the end of this letter.
Investor Relations Contact Information: Mike McKeever, investors@carvana.com
12
CARVANA CO. AND SUBSIDIARIES
CONSOLIDATED BALANCE SHEETS
(In millions, except number of shares, which are reflected in thousands, and par values)
December 31,
2025
2024
ASSETS
Current assets:
Cash and cash equivalents
$
2,327
$
1,716
Restricted cash
102
44
Accounts receivable, net
245
303
Finance receivables held for sale, net
813
612
Vehicle inventory
2,408
1,608
Beneficial interests in securitizations
486
464
Other current assets, including $5 and $4, respectively, due from related parties
168
122
Total current assets
6,549
4,869
Property and equipment, net
2,814
2,773
Operating lease right-of-use assets, including $6 and $13, respectively, from leases with related parties
443
440
Intangible assets, net
47
34
Goodwill
10
—
Deferred tax assets
3,064
3
Other assets
274
365
Total assets
$
13,201
$
8,484
LIABILITIES & STOCKHOLDERS' EQUITY (DEFICIT)
Current liabilities:
Accounts payable and accrued liabilities, including $21 and $17, respectively, due to related parties
$
1,100
$
856
Short-term revolving facilities
58
67
Current portion of long-term debt
227
309
Other current liabilities, including $31 and $16, respectively, due to related parties
134
106
Total current liabilities
1,519
1,338
Long-term debt, excluding current portion
4,830
5,256
Operating lease liabilities, excluding current portion, including $5 and $10, respectively, from leases with related parties
406
414
Tax receivable agreement liability, including $1,721 and $48, respectively, due to related parties
2,228
65
Other liabilities
15
36
Total liabilities
8,998
7,109
Commitments and contingencies
Stockholders' equity:
Preferred stock, $0.01 par value - 50,000 shares authorized; none issued and outstanding as of each of December 31, 2025 and 2024
—
—
Class A common stock, $0.001 par value - 500,000 shares authorized, 142,230 and 133,271 shares issued and outstanding as of December 31, 2025 and 2024, respectively
—
—
Class B common stock, $0.001 par value - 125,000 shares authorized, 76,109 and 79,119 shares issued and outstanding as of December 31, 2025 and 2024, respectively
—
—
Additional paid-in capital
3,450
2,676
Accumulated deficit
(9)
(1,416)
Total stockholders' equity attributable to Carvana Co.
3,441
1,260
Non-controlling interests
762
115
Total stockholders' equity
4,203
1,375
Total liabilities & stockholders' equity
$
13,201
$
8,484
13
CARVANA CO. AND SUBSIDIARIES
CONSOLIDATED STATEMENTS OF OPERATIONS
(In millions, except number of shares, which are reflected in thousands, and per share amounts)
Three Months Ended December 31,
Years Ended December 31,
2025
2024
2025
2024
(unaudited)
Sales and operating revenues:
Retail vehicle sales, net
$
4,156
$
2,552
$
14,537
$
9,681
Wholesale sales and revenues, including $11, $7, $39, and $28, respectively, from related parties
988
678
4,052
2,841
Other sales and revenues, including $99, $59, $347, and $200, respectively, from related parties
459
317
1,733
1,151
Net sales and operating revenues
5,603
3,547
20,322
13,673
Cost of sales, including $4, $2, $14, and $9, respectively, to related parties
4,552
2,784
16,130
10,797
Gross profit
1,051
763
4,192
2,876
Selling, general and administrative expenses, including $8, $9, $32, and $31, respectively, to related parties
627
494
2,308
1,874
Other operating expense, net
—
9
3
12
Operating income
424
260
1,881
990
Interest expense, net
98
148
505
651
Loss on debt extinguishment
—
6
16
12
Other expense (income), net
2,158
(50)
2,250
(73)
Net (loss) income before income taxes
(1,832)
156
(890)
400
Income tax benefit
(2,783)
(3)
(2,785)
(4)
Net income
951
159
1,895
404
Net income attributable to non-controlling interests
94
80
488
194
Net income attributable to Carvana Co.
857
79
1,407
210
Net income attributable to Class A common stockholders
$
857
$
79
$
1,407
$
210
Net earnings per share of Class A common stock - basic
$
6.05
$
0.61
$
10.22
$
1.72
Net earnings per share of Class A common stock - diluted
$
4.22
$
0.56
$
8.45
$
1.59
Weighted-average shares of Class A common stock outstanding - basic
141,749
130,164
137,634
122,344
Weighted-average shares of Class A common stock outstanding - diluted
225,522
139,859
224,277
132,206
14
CARVANA CO. AND SUBSIDIARIES
CONSOLIDATED STATEMENTS OF CASH FLOWS
(In millions)
Years Ended December 31,
2025
2024
2023
Cash Flows from Operating Activities:
Net income
$
1,895
$
404
$
150
Adjustments to reconcile net income to net cash provided by operating activities:
Depreciation and amortization expense
275
305
352
Equity-based compensation expense
96
91
73
Deferred income taxes
(2,784)
2
(4)
Tax receivable agreement expense
2,200
67
14
Loss on disposal of property and equipment
3
12
8
Loss (Gain) on debt extinguishment
16
12
(878)
Payment-in-kind interest expense
182
458
184
Provision for bad debt and valuation allowance
15
27
38
Amortization of debt issuance costs
10
15
24
Unrealized loss (gain) on warrants to acquire common stock
64
(115)
(3)
Unrealized gain on beneficial interests in securitizations
(12)
(23)
(14)
Changes in finance receivable related assets:
Originations of finance receivables
(12,807)
(8,329)
(6,041)
Proceeds from sale of finance receivables, net
13,315
8,805
6,594
Gain on loan sales
(1,193)
(755)
(434)
Principal payments received on finance receivables held for sale
241
188
186
Other changes in assets and liabilities:
Vehicle inventory
(734)
(455)
711
Accounts receivable
49
(47)
(22)
Other assets
(4)
12
43
Accounts payable and accrued liabilities
235
260
(166)
Operating lease right-of-use assets
(3)
15
81
Operating lease liabilities
(2)
(10)
(71)
Other liabilities
(21)
(21)
(22)
Net cash provided by operating activities
1,036
918
803
Cash Flows from Investing Activities:
Purchases of property and equipment
(147)
(91)
(87)
Proceeds from disposal of property and equipment
2
11
72
Payments for acquisitions, net of cash acquired
(160)
—
(7)
Principal payments received on and proceeds from sale of beneficial interests
75
67
53
Net cash (used in) provided by investing activities
(230)
(13)
31
Cash Flows from Financing Activities:
Proceeds from short-term revolving facilities
4,018
3,096
6,709
Payments on short-term revolving facilities
(4,026)
(3,697)
(7,575)
Proceeds from issuance of long-term debt
175
191
132
Payments on long-term debt
(820)
(577)
(503)
Payments of debt issuance costs
(17)
(4)
(69)
Payments of tax made on behalf of non-controlling members
(4)
—
—
Net proceeds from issuance of Class A common stock and LLC Units
536
1,264
453
Tax receivable agreement payments
(17)
—
—
Proceeds from equity-based compensation plans
48
7
—
Tax withholdings related to restricted stock units
(30)
(19)
(15)
Net cash (used in) provided by financing activities
(137)
261
(868)
Net increase (decrease) in cash, cash equivalents, and restricted cash
669
1,166
(34)
Cash, cash equivalents, and restricted cash at beginning of period
1,760
594
628
Cash, cash equivalents, and restricted cash at end of period
$
2,429
$
1,760
$
594
15
CARVANA CO. AND SUBSIDIARIES
OUTSTANDING SHARES AND LLC UNITS
(In thousands)
The following table presents potentially dilutive securities, as of the end of the period, excluded from the computations of diluted net earnings per share of Class A common stock for the three months and years ended December 31, 2025 and 2024, respectively:
Three Months Ended December 31,
Years Ended December 31,
2025
2024
2025
2024
(unaudited)
Options (1)
—
97
—
365
Restricted Stock Units and Awards (1)
1
5
7
11
Class A Units (2)
—
79,402
—
83,509
Class B Units (2)
—
1,662
—
1,763
(1) Represents number of instruments outstanding at the end of the period that were evaluated under the treasury stock method for potentially dilutive effects and were determined to be anti-dilutive.
(2) Represents the weighted-average as-converted LLC units that were evaluated under the if-converted method for potentially dilutive effects and were determined to be anti-dilutive.
16
CARVANA CO. AND SUBSIDIARIES
RESULTS OF OPERATIONS
(Unaudited)
Three Months Ended December 31,
Years Ended December 31,
2025
2024
Change
2025
2024
Change
(dollars in millions, except per unit amounts)
(dollars in millions, except per unit amounts)
Net sales and operating revenues:
Retail vehicle sales, net
$
4,156
$
2,552
62.9
%
$
14,537
$
9,681
50.2
%
Wholesale sales and revenues (1)
988
678
45.7
%
4,052
2,841
42.6
%
Other sales and revenues (2)
459
317
44.8
%
1,733
1,151
50.6
%
Total net sales and operating revenues
$
5,603
$
3,547
58.0
%
$
20,322
$
13,673
48.6
%
Gross profit:
Retail vehicle gross profit
$
489
$
369
32.5
%
$
1,978
$
1,379
43.4
%
Wholesale gross profit (1)
103
77
33.8
%
481
346
39.0
%
Other gross profit (2)
459
317
44.8
%
1,733
1,151
50.6
%
Total gross profit
$
1,051
$
763
37.7
%
$
4,192
$
2,876
45.8
%
Unit sales information:
Retail vehicle unit sales
163,522
114,379
43.0
%
596,641
416,348
43.3
%
Wholesale vehicle unit sales
81,050
48,770
66.2
%
297,643
199,780
49.0
%
Per unit revenue:
Retail vehicles
$
25,416
$
22,312
13.9
%
$
24,365
$
23,252
4.8
%
Wholesale vehicles (3)
$
9,636
$
9,371
2.8
%
$
10,519
$
9,611
9.4
%
Per retail unit gross profit:
Retail vehicle gross profit
$
2,990
$
3,226
(7.3)
%
$
3,315
$
3,312
0.1
%
Wholesale gross profit
630
674
(6.5)
%
806
831
(3.0)
%
Other gross profit
2,807
2,771
1.3
%
2,905
2,765
5.1
%
Total gross profit
$
6,427
$
6,671
(3.7)
%
$
7,026
$
6,908
1.7
%
Per wholesale unit gross profit:
Wholesale vehicle gross profit (4)
$
938
$
902
4.0
%
$
1,015
$
996
1.9
%
Wholesale marketplace:
Wholesale marketplace units transacted
238,366
231,659
2.9
%
1,006,551
955,802
5.3
%
Wholesale marketplace revenues
$
207
$
221
(6.3)
%
$
921
$
921
—
%
Wholesale marketplace gross profit (5)
$
27
$
33
(18.2)
%
$
179
$
147
21.8
%
(1) Includes $11, $7, $39, and $28, respectively, of wholesale sales and revenues from related parties.
(2) Includes $99, $59, $347, and $200, respectively, of other sales and revenues from related parties.
(3) Excludes wholesale marketplace revenues and wholesale marketplace units transacted.
(4) Excludes wholesale marketplace gross profit and wholesale marketplace units transacted.
(5) Includes $10, $19, $51 and $86, respectively, of depreciation and amortization expense.
17
CARVANA CO. AND SUBSIDIARIES
COMPONENTS OF SG&A
(Unaudited)
Three Months Ended
Dec 31, 2024
Mar 31, 2025
Jun 30, 2025
Sep 30, 2025
Dec 31, 2025
(in millions)
Compensation and benefits (1)
$
184
$
199
$
201
$
209
$
221
Advertising
64
72
84
102
105
Market occupancy (2)
16
16
16
17
19
Logistics (3)
32
37
38
43
44
Other (4)
198
211
212
224
238
Total
$
494
$
535
$
551
$
595
$
627
(1) Compensation and benefits includes all payroll and related costs, including benefits, payroll taxes, and equity-based compensation, except those related to preparing vehicles for sale, which are included in cost of sales, and those related to the development of software products for internal use, which are capitalized to software and depreciated over the estimated useful lives of the related assets.
(2) Market occupancy costs includes occupancy costs of our vending machine and hubs. It excludes occupancy costs related to reconditioning vehicles which are included in cost of sales and the portion related to corporate occupancy which are included in other costs.
(3) Logistics includes fuel, maintenance and depreciation related to operating our own transportation fleet, and third-party transportation fees, except the portion related to inbound transportation, which is included in cost of sales.
(4) Other costs include all other selling, general and administrative expenses such as IT expenses, corporate occupancy, professional services and insurance, limited warranty, and title and registration.
18
CARVANA CO. AND SUBSIDIARIES
LIQUIDITY RESOURCES
(Unaudited)
We had the following committed liquidity resources, secured debt capacity, and other unpledged assets available as of December 31, 2025 and 2024:
December 31,
2025
2024
(in millions)
Cash and cash equivalents
$
2,327
$
1,716
Availability under short-term revolving facilities (1)
2,052
1,879
Committed liquidity resources available
$
4,379
$
3,595
Super senior debt capacity (2)
1,500
1,500
Pari passu senior debt capacity (2)
750
485
Unpledged beneficial interests in securitizations (3)
110
110
Total liquidity resources (4)
$
6,739
$
5,690
(1) Availability under short-term revolving facilities is the available amount we can borrow under the Floor Plan Facility and Finance Receivable Facilities based on the value of pledgeable vehicle inventory and finance receivables on our balance sheet on the period end date. Availability under short-term revolving facilities is distinct from the total commitment amount of these facilities because it represents the amount we are able to borrow as of period end, rather than committed future amounts that could be borrowed to finance future additional assets.
(2) Super senior debt capacity and pari passu senior debt capacity represents basket capacity to incur additional debt that could be senior or pari passu in lien priority as to the collateral securing the obligations under the Senior Secured Notes, subject to the terms and conditions set forth in the indentures governing the Senior Secured Notes. The availability of such additional sources depends on many factors and there can be no assurance that financing alternatives will be available to us in the future.
(3) Unpledged beneficial interests in securitizations includes retained beneficial interests in securitizations that have not been previously pledged or sold. We historically have financed the majority of our retained beneficial interests in securitizations and expect to continue to do so in the future.
(4) Our total liquidity potential is composed of cash and cash equivalents, availability under existing credit facilities, additional capacity under the indentures governing our Senior Secured Notes, which allow us to incur additional debt that can be senior or pari passu in lien priority as to the collateral securing the obligations under the Senior Secured Notes, and additional unpledged securities that can be financed using traditional asset-based financing sources.
19
CARVANA CO. AND SUBSIDIARIES
RECONCILIATION OF GAAP TO NON-GAAP FINANCIAL MEASURES
(Unaudited)
Adjusted EBITDA; Adjusted EBITDA margin; Gross profit, non-GAAP; Retail gross profit, non-GAAP; Wholesale gross profit, non-GAAP; Wholesale vehicle gross profit, non-GAAP; Wholesale marketplace gross profit, non-GAAP; Other gross profit, non-GAAP; Total gross profit per retail unit, non-GAAP; Retail gross profit per retail unit, non-GAAP; Wholesale gross profit per retail unit, non-GAAP; Wholesale vehicle gross profit per retail unit, non-GAAP; Wholesale marketplace gross profit per retail unit, non-GAAP; Other gross profit per retail unit, non-GAAP; SG&A expenses, non-GAAP; and Total SG&A expenses per retail unit, non-GAAP
The above measures are supplemental measures of operating performance that do not represent and should not be considered an alternative to net income (loss), gross profit, or SG&A expenses, as determined by GAAP.
Adjusted EBITDA is defined as net income (loss) plus (minus) income tax (benefit) provision, interest expense, net, other operating expense, net, other expense (income), net, depreciation and amortization expense in cost of sales and SG&A expenses, share-based compensation expense in cost of sales and SG&A expenses, goodwill impairment, and loss (gain) on debt extinguishment, minus revenue related to our Warrants. Adjusted EBITDA margin is Adjusted EBITDA as a percentage of total revenues.
Gross profit, non-GAAP, Retail gross profit, non-GAAP, Wholesale gross profit, non-GAAP, Wholesale vehicle gross profit, non-GAAP, Wholesale marketplace gross profit, non-GAAP, and Other gross profit, non-GAAP are defined as the respective GAAP gross profits plus depreciation and amortization expense in cost of sales, share-based compensation expense in cost of sales, and restructuring expense in cost of sales, minus revenue related to our Root Warrants. Total gross profit per retail unit, non-GAAP, Retail gross profit per retail unit, non-GAAP, Wholesale gross profit per retail unit, non-GAAP, Wholesale vehicle gross profit per retail unit, non-GAAP, Wholesale marketplace gross profit per retail unit, non-GAAP, and Other gross profit per retail unit, non-GAAP are the respective gross profits, non-GAAP divided by retail vehicle unit sales.
SG&A expenses, non-GAAP is defined as GAAP SG&A expenses minus depreciation and amortization expense in SG&A expenses, share-based compensation expense in SG&A expenses, and restructuring expense in SG&A expenses. Total SG&A expenses per retail unit, non-GAAP is SG&A expenses, non-GAAP divided by retail vehicle unit sales.
We use these non-GAAP measures to measure the operating performance of our business as a whole and relative to our total revenues and retail vehicle unit sales. We believe that these metrics are useful measures to us and to our investors because they exclude certain financial, capital structure, and non-cash items that we do not believe directly reflect our core operations and may not be indicative of our recurring operations, in part because they may vary widely across time and within our industry independent of the performance of our core operations. We believe that excluding these items enables us to more effectively evaluate our performance period-over-period and relative to our competitors. These non-GAAP measures may not be comparable to similarly titled measures provided by other companies due to potential differences in methods of calculations.
A reconciliation of Adjusted EBITDA to net income (loss), Gross profit, non-GAAP to gross profit, Retail gross profit, non-GAAP to retail gross profit, Wholesale gross profit, non-GAAP to wholesale gross profit, Wholesale vehicle gross profit, non-GAAP to wholesale vehicle gross profit, Wholesale marketplace gross profit, non-GAAP to wholesale marketplace gross profit, Other gross profit, non-GAAP to other gross profit, and SG&A expenses, non-GAAP to SG&A expenses, which are the most directly comparable GAAP measures, and calculations of Adjusted EBITDA margin, Total gross profit per retail unit, non-GAAP, Retail gross profit per retail unit, non-GAAP, Wholesale gross profit per retail unit, non-GAAP, Wholesale vehicle gross profit per retail unit, non-GAAP, Wholesale marketplace gross profit per retail unit, non-GAAP, Other gross profit per retail unit, non-GAAP, and Total SG&A expenses per retail unit, non-GAAP is as follows:
20
Three Months Ended December 31,
Years Ended December 31,
(dollars in millions)
2024
2025
2024
2025
Net income
$
159
$
951
$
404
$
1,895
Income tax benefit
(3)
(2,783)
(4)
(2,785)
Interest expense, net
148
98
651
505
Other expense (income), net
(50)
2,158
(73)
2,250
Loss on debt extinguishment
6
—
12
16
Operating income
$
260
$
424
$
990
$
1,881
Other operating expense, net
9
—
12
3
Depreciation and amortization expense in cost of sales
33
26
140
111
Depreciation and amortization expense in SG&A expenses
41
43
165
164
Share-based compensation expense in cost of sales
—
1
1
3
Share-based compensation expense in SG&A expenses
21
22
91
96
Warrant revenue
(5)
(5)
(21)
(21)
Adjusted EBITDA
$
359
$
511
$
1,378
$
2,237
Total revenues
$
3,547
$
5,603
$
13,673
$
20,322
Net income margin
4.5
%
17.0
%
3.0
%
9.3
%
Adjusted EBITDA margin
10.1
%
9.1
%
10.1
%
11.0
%
Gross profit
$
763
$
1,051
$
2,876
$
4,192
Depreciation and amortization expense in cost of sales
33
26
140
111
Share-based compensation expense in cost of sales
—
1
1
3
Warrant revenue
(5)
(5)
(21)
(21)
Gross profit, non-GAAP
$
791
$
1,073
$
2,996
$
4,285
Retail vehicle unit sales
114,379
163,522
416,348
596,641
Total gross profit per retail unit
$
6,671
$
6,427
$
6,908
$
7,026
Total gross profit per retail unit, non-GAAP
$
6,916
$
6,562
$
7,196
$
7,182
21
Three Months Ended December 31,
(dollars in millions, except per unit amounts)
2024
2025
Retail gross profit
$
369
$
489
Depreciation and amortization expense in cost of sales
12
13
Share-based compensation expense in cost of sales
—
1
Retail gross profit, non-GAAP
$
381
$
503
Retail vehicle unit sales
114,379
163,522
Retail gross profit per retail unit
$
3,226
$
2,990
Retail gross profit per retail unit, non-GAAP
$
3,331
$
3,076
Wholesale vehicle gross profit
$
44
$
76
Depreciation and amortization expense in cost of sales
2
3
Wholesale vehicle gross profit, non-GAAP
$
46
$
79
Retail vehicle unit sales
114,379
163,522
Wholesale vehicle gross profit per retail unit
$
385
$
465
Wholesale vehicle gross profit per retail unit, non-GAAP
$
402
$
483
Wholesale marketplace gross profit
$
33
$
27
Depreciation and amortization expense in cost of sales
19
10
Wholesale marketplace gross profit, non-GAAP
$
52
$
37
Retail vehicle unit sales
114,379
163,522
Wholesale marketplace gross profit per retail unit
$
289
$
165
Wholesale marketplace gross profit per retail unit, non-GAAP
$
455
$
226
Other gross profit
$
317
$
459
Warrant revenue
(5)
(5)
Other gross profit, non-GAAP
$
312
$
454
Retail vehicle unit sales
114,379
163,522
Other gross profit per retail unit
$
2,771
$
2,807
Other gross profit per retail unit, non-GAAP
$
2,728
$
2,777
22
Three Months Ended December 31,
(dollars in millions, except per unit amounts)
2024
2025
SG&A expenses
$
494
$
627
Depreciation and amortization expense in SG&A expenses
41
43
Share-based compensation expense in SG&A expenses
21
22
SG&A expenses, non-GAAP
$
432
$
562
Retail vehicle unit sales
114,379
163,522
Total SG&A expenses per retail unit
$
4,319
$
3,834
Total SG&A expenses per retail unit, non-GAAP
$
3,777
$
3,437
23
Years Ended December 31,
(dollars in millions, except per unit amounts)
2014
2015
2016
2017
2018
2019
2020
2021
2022
2023
Net income (loss)
$
(15)
$
(37)
$
(93)
$
(164)
$
(255)
$
(365)
$
(462)
$
(287)
$
(2,894)
$
150
Income tax provision
—
—
—
—
—
—
—
1
1
25
Interest expense, net
—
1
4
8
25
81
131
176
486
632
Other operating expense, net
—
—
—
1
1
3
10
9
14
8
Other (income) expense, net
—
—
—
—
—
1
(11)
(3)
56
(9)
Depreciation and amortization expense in cost of sales
—
—
—
—
—
—
10
24
114
169
Depreciation and amortization expense in SG&A expenses
2
3
4
11
24
41
74
105
200
183
Share-based compensation expense in cost of sales
—
—
—
—
4
5
1
—
16
—
Share-based compensation expense in SG&A expenses
—
1
1
6
21
30
25
39
69
73
Goodwill impairment
—
—
—
—
—
—
—
—
847
—
Warrant revenue
—
—
—
—
—
—
—
—
(7)
(21)
Gain on debt extinguishment
—
—
—
—
—
—
—
—
—
(878)
Restructuring (1)
—
—
—
—
—
—
—
—
57
7
Adjusted EBITDA
$
(13)
$
(32)
$
(84)
$
(138)
$
(180)
$
(204)
$
(222)
$
64
$
(1,041)
$
339
Total revenues
$
42
$
130
$
365
$
859
$
1,955
$
3,940
$
5,587
$
12,814
$
13,604
$
10,771
Net loss margin
(36.6)
%
(28.2)
%
(25.5)
%
(19.1)
%
(13.0)
%
(9.3)
%
(8.3)
%
(2.2)
%
(21.3)
%
1.4
%
Adjusted EBITDA margin
(31.0)
%
(24.6)
%
(23.0)
%
(16.1)
%
(9.2)
%
(5.2)
%
(4.0)
%
0.5
%
(7.7)
%
3.1
%
(1) Restructuring includes costs related to our May 2022 and November 2022 reductions in force, as well as lease termination and other restructuring expenses.