

2Q25 Results Presentation August 7, 2025
Forward-looking statements Some of the statements contained in this presentation may constitute forward-looking statements within the meaning of the federal securities laws. Forward-looking statements relate to expectations, projections, plans and strategies, positioning, anticipated events or trends, and similar expressions concerning matters that are not historical facts. In some cases, you can identify forward-looking statements by the use of forward-looking terminology such as "may," "will," "should," "expects," "intends," "plans," "anticipates," "believes," "estimates," "predicts," or "potential" or the negative of these words and phrases. You can also identify forward-looking statements by discussions of strategy, plans, or intentions. The forward-looking statements contained in this press release reflect our current views about future events and are subject to numerous known and unknown risks, uncertainties, assumptions, and changes in circumstances that may cause actual results to differ significantly from those expressed or contemplated in any forward-looking statement. While forward-looking statements reflect our good faith projections, assumptions, and expectations, they are not guarantees of future results. Furthermore, we disclaim any obligation to publicly update or revise any forward-looking statement to reflect changes in underlying assumptions or factors, new information, data or methods, future events, or other changes, except as required by applicable law. Factors that could cause our results to differ materially include, but are not limited to, (1) changes in federal government fiscal and monetary policies, (2) general economic and real estate market conditions, including the risk of recession, (3) regulatory and/or legislative changes, (4) our customers’ continued interest in loans and doing business with us, (5) market conditions and investor interest in our future securitizations, and (6) geopolitical conflicts. Additional information relating to these and other factors that could cause future results to differ materially from those expressed or contemplated in any forward-looking statements can be found in other cautionary statements we make in our current and periodic filings with the SEC. Such filings are available publicly on our Investor Relations web page at www.velfinance.com.
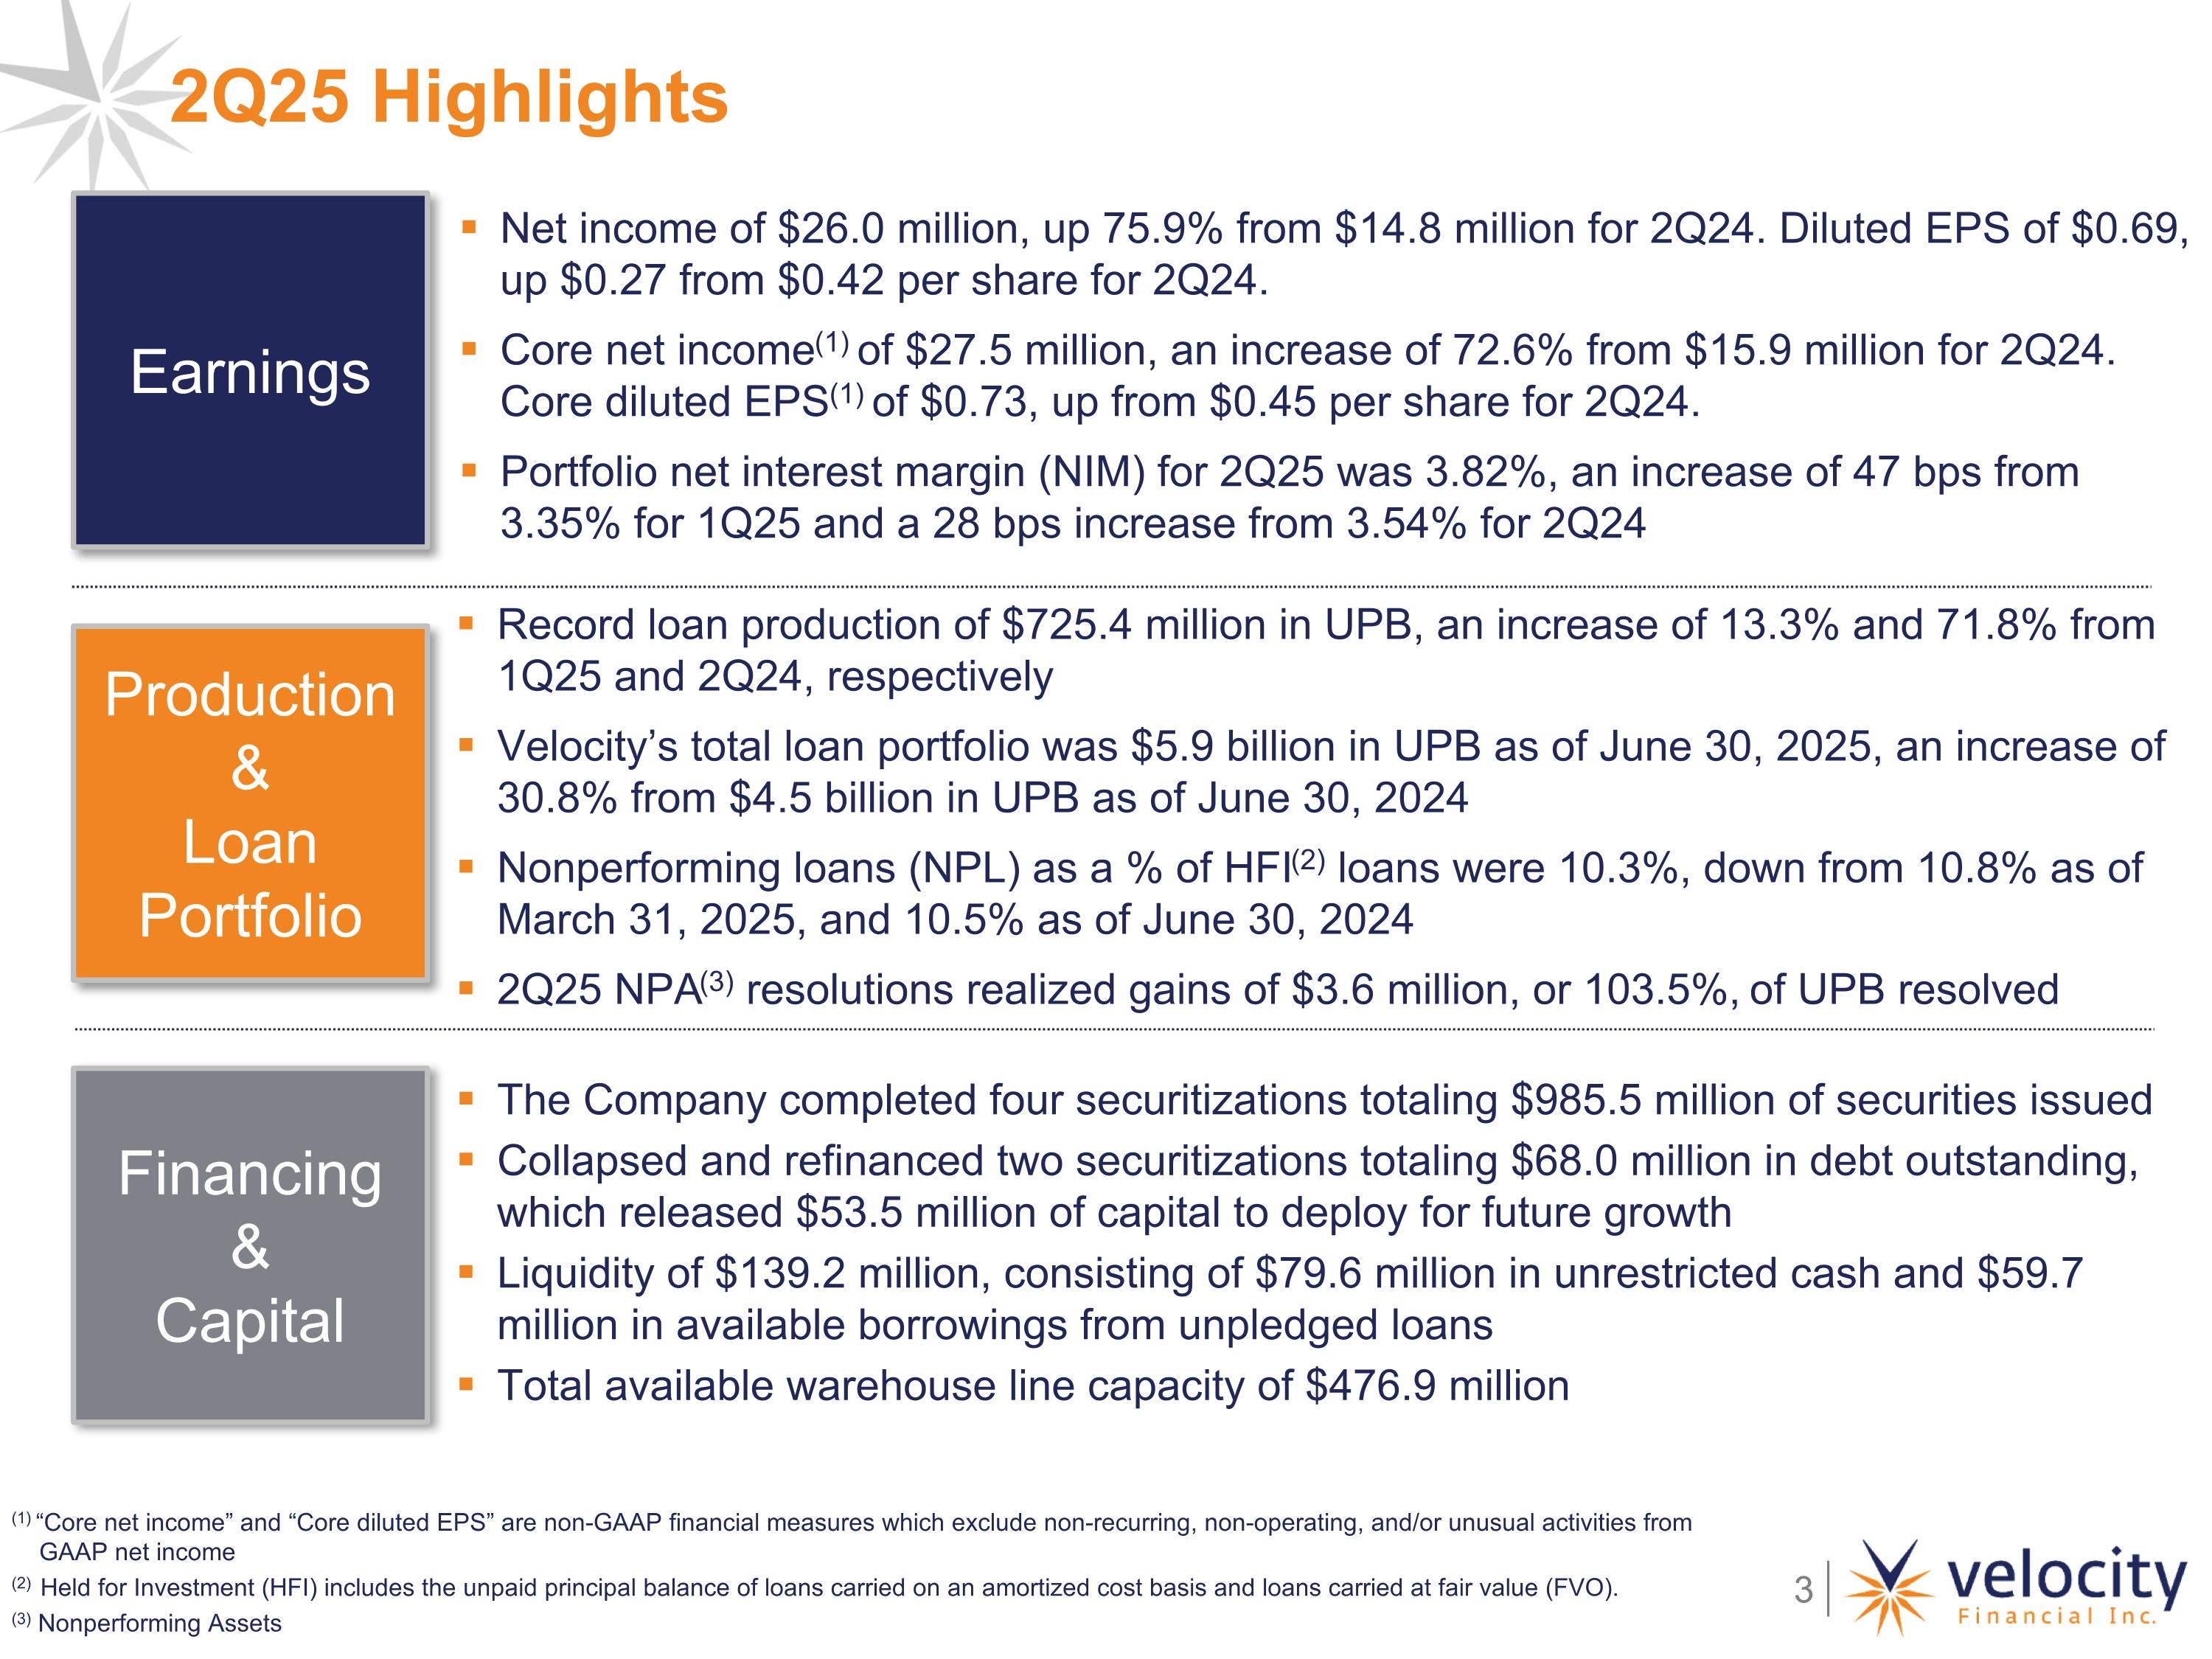
2Q25 Highlights Production& Loan Portfolio Earnings Financing & Capital Net income of $26.0 million, up 75.9% from $14.8 million for 2Q24. Diluted EPS of $0.69, up $0.27 from $0.42 per share for 2Q24. Core net income(1) of $27.5 million, an increase of 72.6% from $15.9 million for 2Q24. Core diluted EPS(1) of $0.73, up from $0.45 per share for 2Q24. Portfolio net interest margin (NIM) for 2Q25 was 3.82%, an increase of 47 bps from 3.35% for 1Q25 and a 28 bps increase from 3.54% for 2Q24 Record loan production of $725.4 million in UPB, an increase of 13.3% and 71.8% from 1Q25 and 2Q24, respectively Velocity’s total loan portfolio was $5.9 billion in UPB as of June 30, 2025, an increase of 30.8% from $4.5 billion in UPB as of June 30, 2024 Nonperforming loans (NPL) as a % of HFI(2) loans were 10.3%, down from 10.8% as of March 31, 2025, and 10.5% as of June 30, 2024 2Q25 NPA(3) resolutions realized gains of $3.6 million, or 103.5%, of UPB resolved The Company completed four securitizations totaling $985.5 million of securities issued Collapsed and refinanced two securitizations totaling $68.0 million in debt outstanding, which released $53.5 million of capital to deploy for future growth Liquidity of $139.2 million, consisting of $79.6 million in unrestricted cash and $59.7 million in available borrowings from unpledged loans Total available warehouse line capacity of $476.9 million (1) “Core net income” and “Core diluted EPS” are non-GAAP financial measures which exclude non-recurring, non-operating, and/or unusual activities from GAAP net income (2) Held for Investment (HFI) includes the unpaid principal balance of loans carried on an amortized cost basis and loans carried at fair value (FVO). (3) Nonperforming Assets
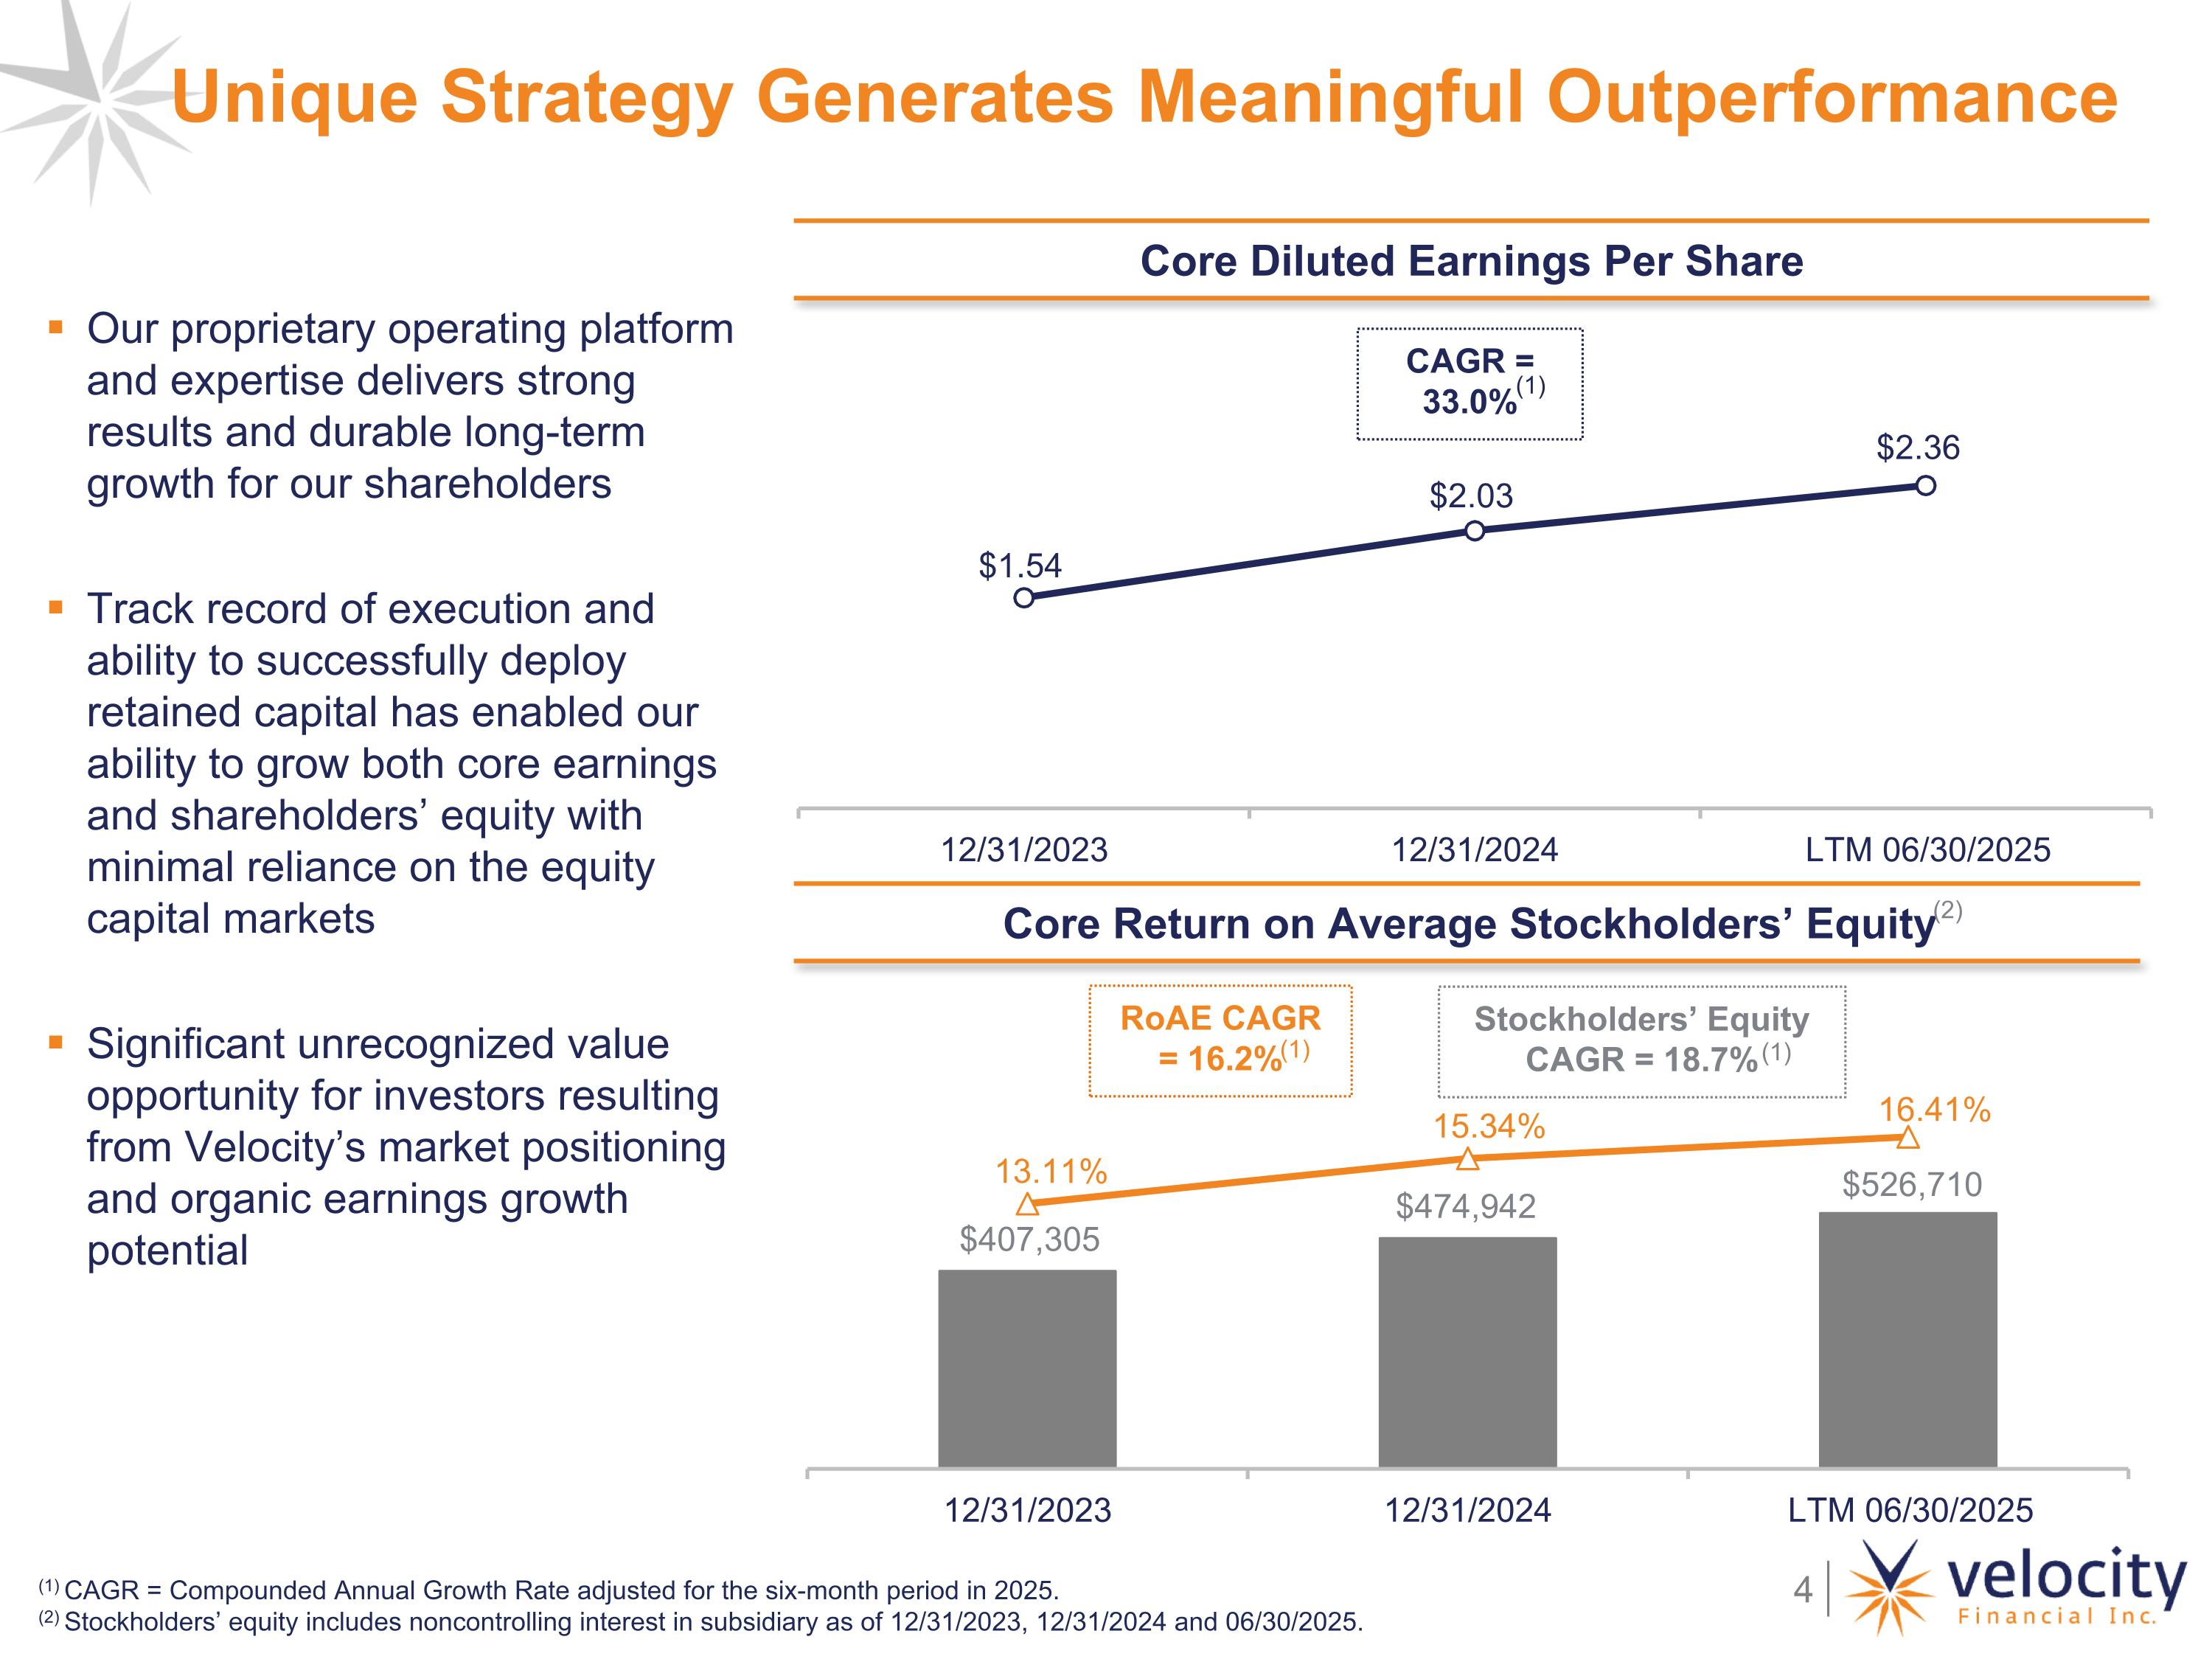
Unique Strategy Generates Meaningful Outperformance Our proprietary operating platform and expertise delivers strong results and durable long-term growth for our shareholders Track record of execution and ability to successfully deploy retained capital has enabled our ability to grow both core earnings and shareholders’ equity with minimal reliance on the equity capital markets Significant unrecognized value opportunity for investors resulting from Velocity’s market positioning and organic earnings growth potential (1) CAGR = Compounded Annual Growth Rate adjusted for the six-month period in 2025. (2) Stockholders’ equity includes noncontrolling interest in subsidiary as of 12/31/2023, 12/31/2024 and 06/30/2025. Core Diluted Earnings Per Share CAGR = 33.0% Core Return on Average Stockholders’ Equity RoAE CAGR = 16.2% (1) (1) Stockholders’ Equity CAGR = 18.7% (1) (2)
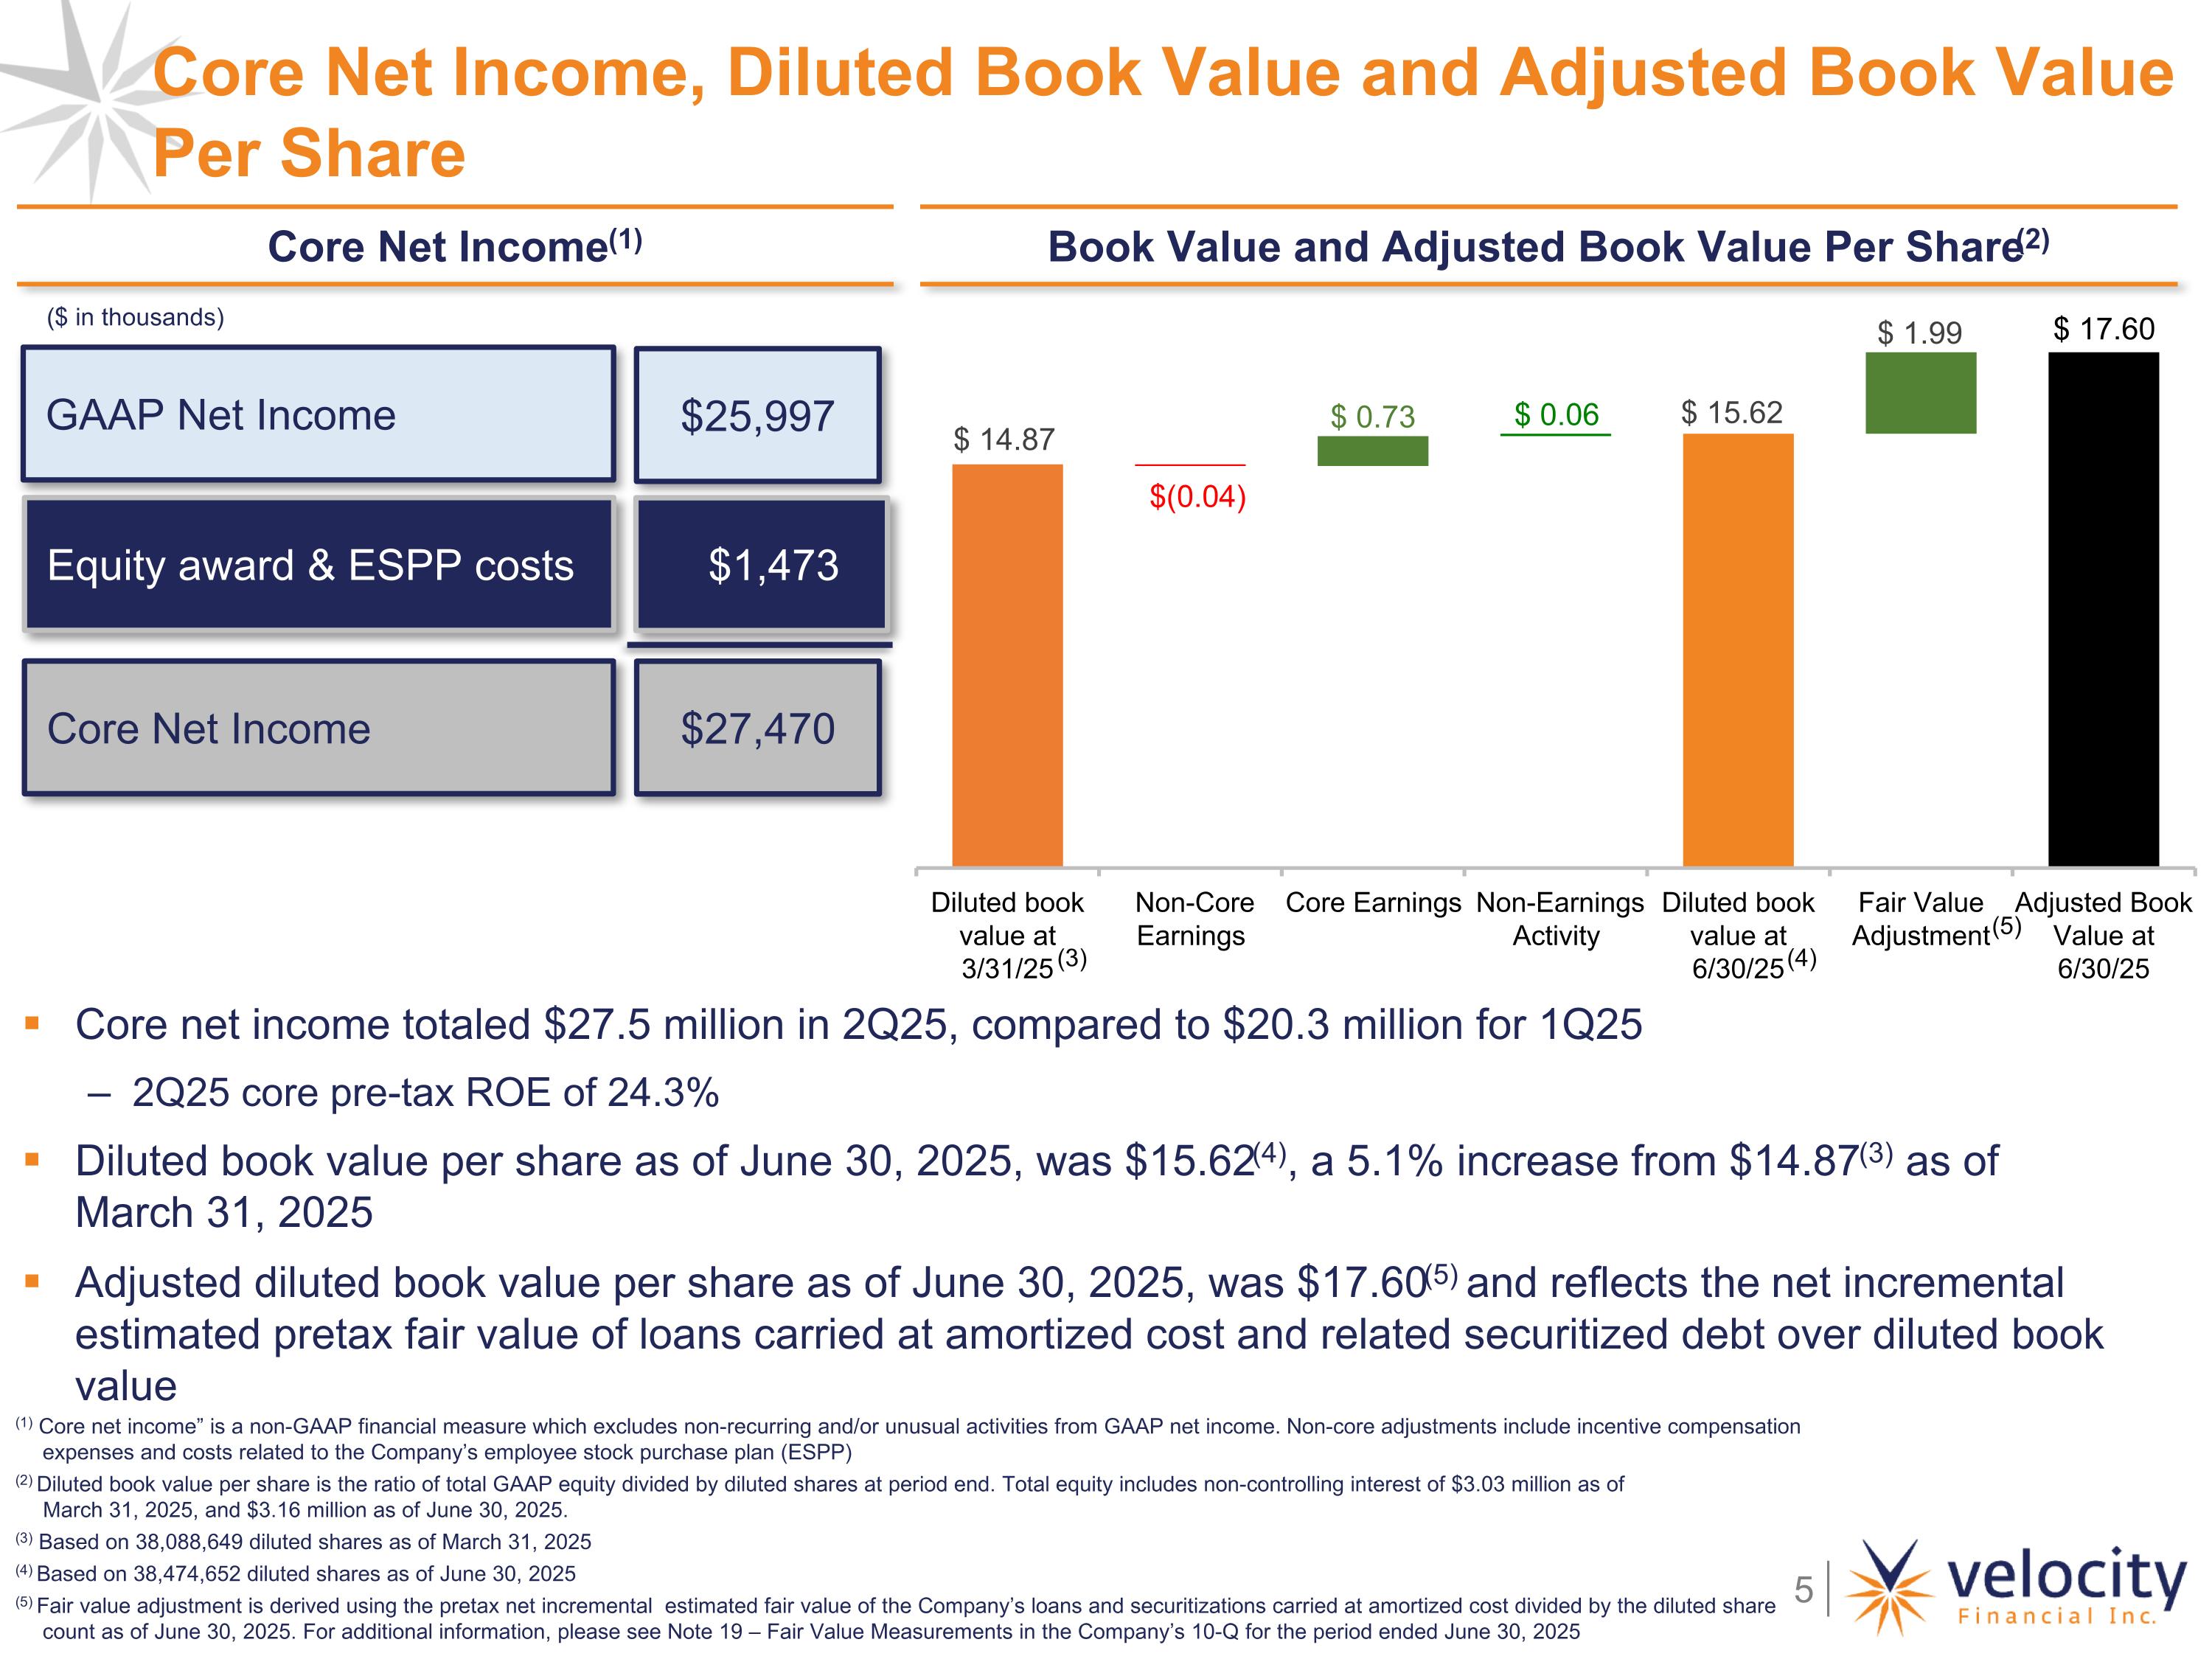
Book Value and Adjusted Book Value Per Share(2) Core net income totaled $27.5 million in 2Q25, compared to $20.3 million for 1Q25 2Q25 core pre-tax ROE of 24.3% Diluted book value per share as of June 30, 2025, was $15.62(4), a 5.1% increase from $14.87(3) as of March 31, 2025 Adjusted diluted book value per share as of June 30, 2025, was $17.60(5) and reflects the net incremental estimated pretax fair value of loans carried at amortized cost and related securitized debt over diluted book value Core Net Income, Diluted Book Value and Adjusted Book Value Per Share Core Net Income(1) Equity award & ESPP costs $1,473 (1) Core net income” is a non-GAAP financial measure which excludes non-recurring and/or unusual activities from GAAP net income. Non-core adjustments include incentive compensation expenses and costs related to the Company’s employee stock purchase plan (ESPP) (2) Diluted book value per share is the ratio of total GAAP equity divided by diluted shares at period end. Total equity includes non-controlling interest of $3.03 million as of March 31, 2025, and $3.16 million as of June 30, 2025. (3) Based on 38,088,649 diluted shares as of March 31, 2025 (4) Based on 38,474,652 diluted shares as of June 30, 2025 (5) Fair value adjustment is derived using the pretax net incremental estimated fair value of the Company’s loans and securitizations carried at amortized cost divided by the diluted share count as of June 30, 2025. For additional information, please see Note 19 – Fair Value Measurements in the Company’s 10-Q for the period ended June 30, 2025 (3) (4) Core Net Income $27,470 GAAP Net Income $25,997 $(0.04) ($ in thousands) (5)
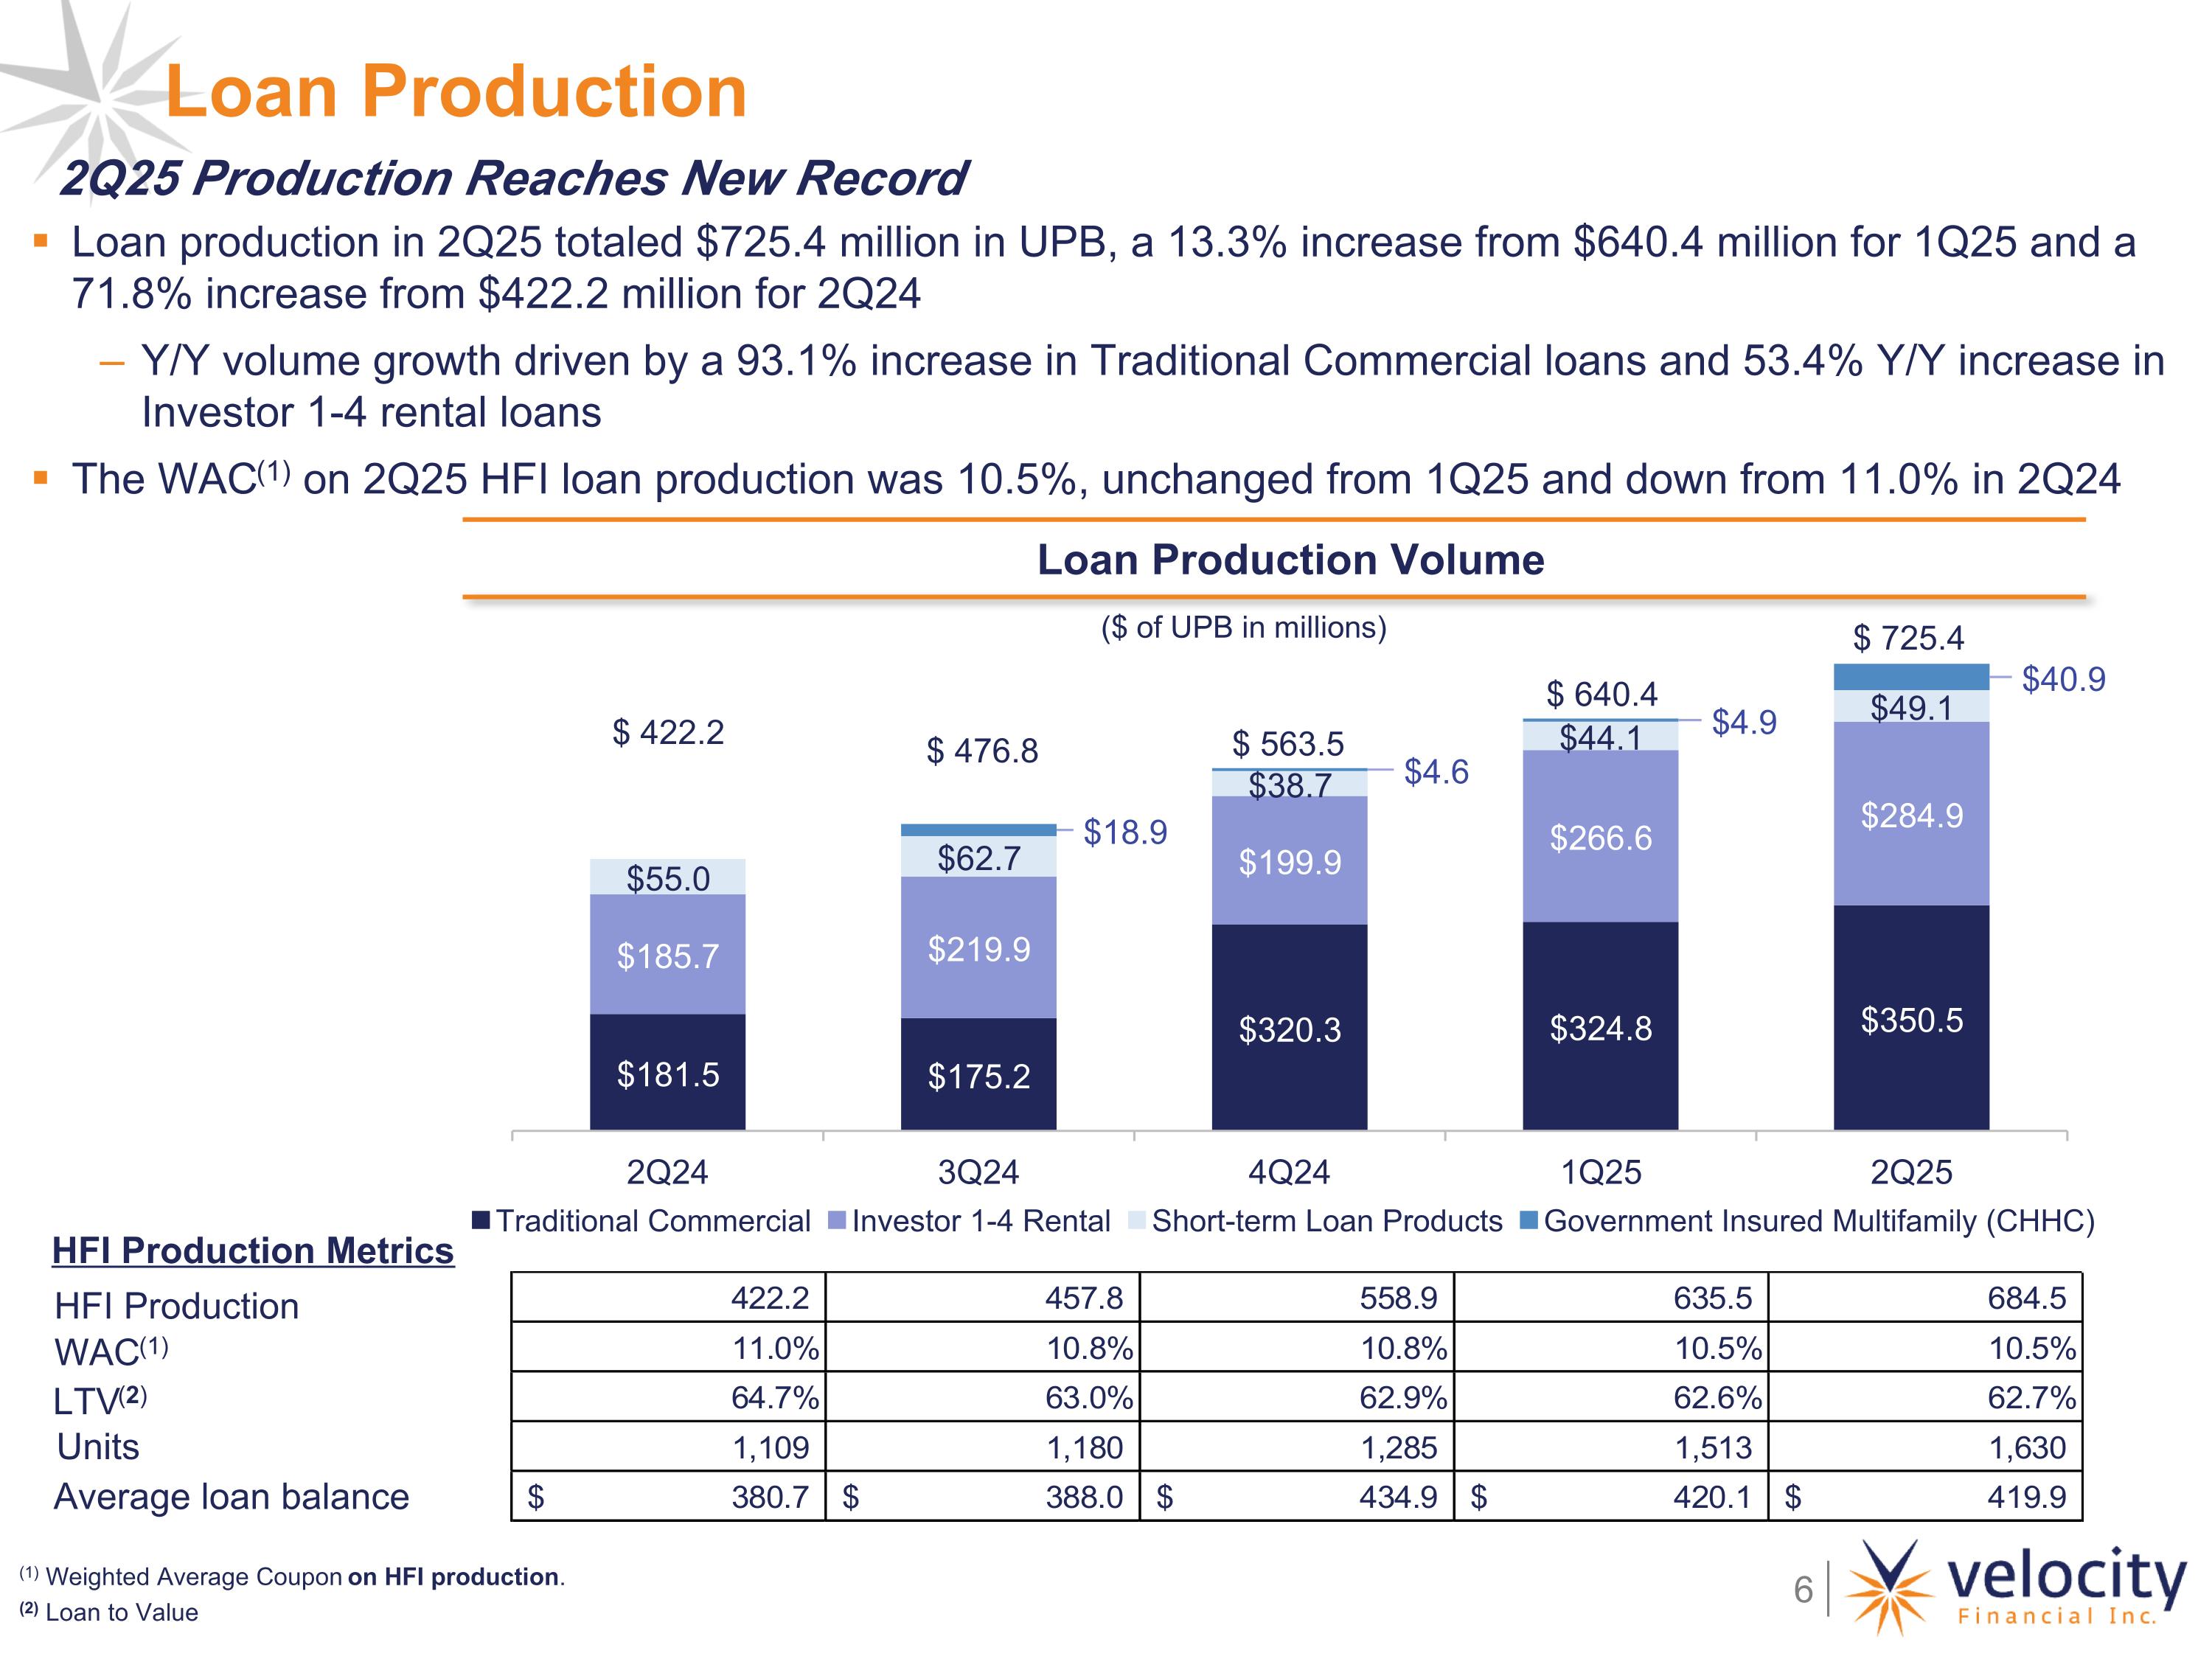
Loan Production Loan production in 2Q25 totaled $725.4 million in UPB, a 13.3% increase from $640.4 million for 1Q25 and a 71.8% increase from $422.2 million for 2Q24 Y/Y volume growth driven by a 93.1% increase in Traditional Commercial loans and 53.4% Y/Y increase in Investor 1-4 rental loans The WAC(1) on 2Q25 HFI loan production was 10.5%, unchanged from 1Q25 and down from 11.0% in 2Q24 Loan Production Volume ($ of UPB in millions) 2Q25 Production Reaches New Record Units Average loan balance (1) Weighted Average Coupon on HFI production. (2) Loan to Value WAC(1) LTV(2) HFI Production Metrics HFI Production
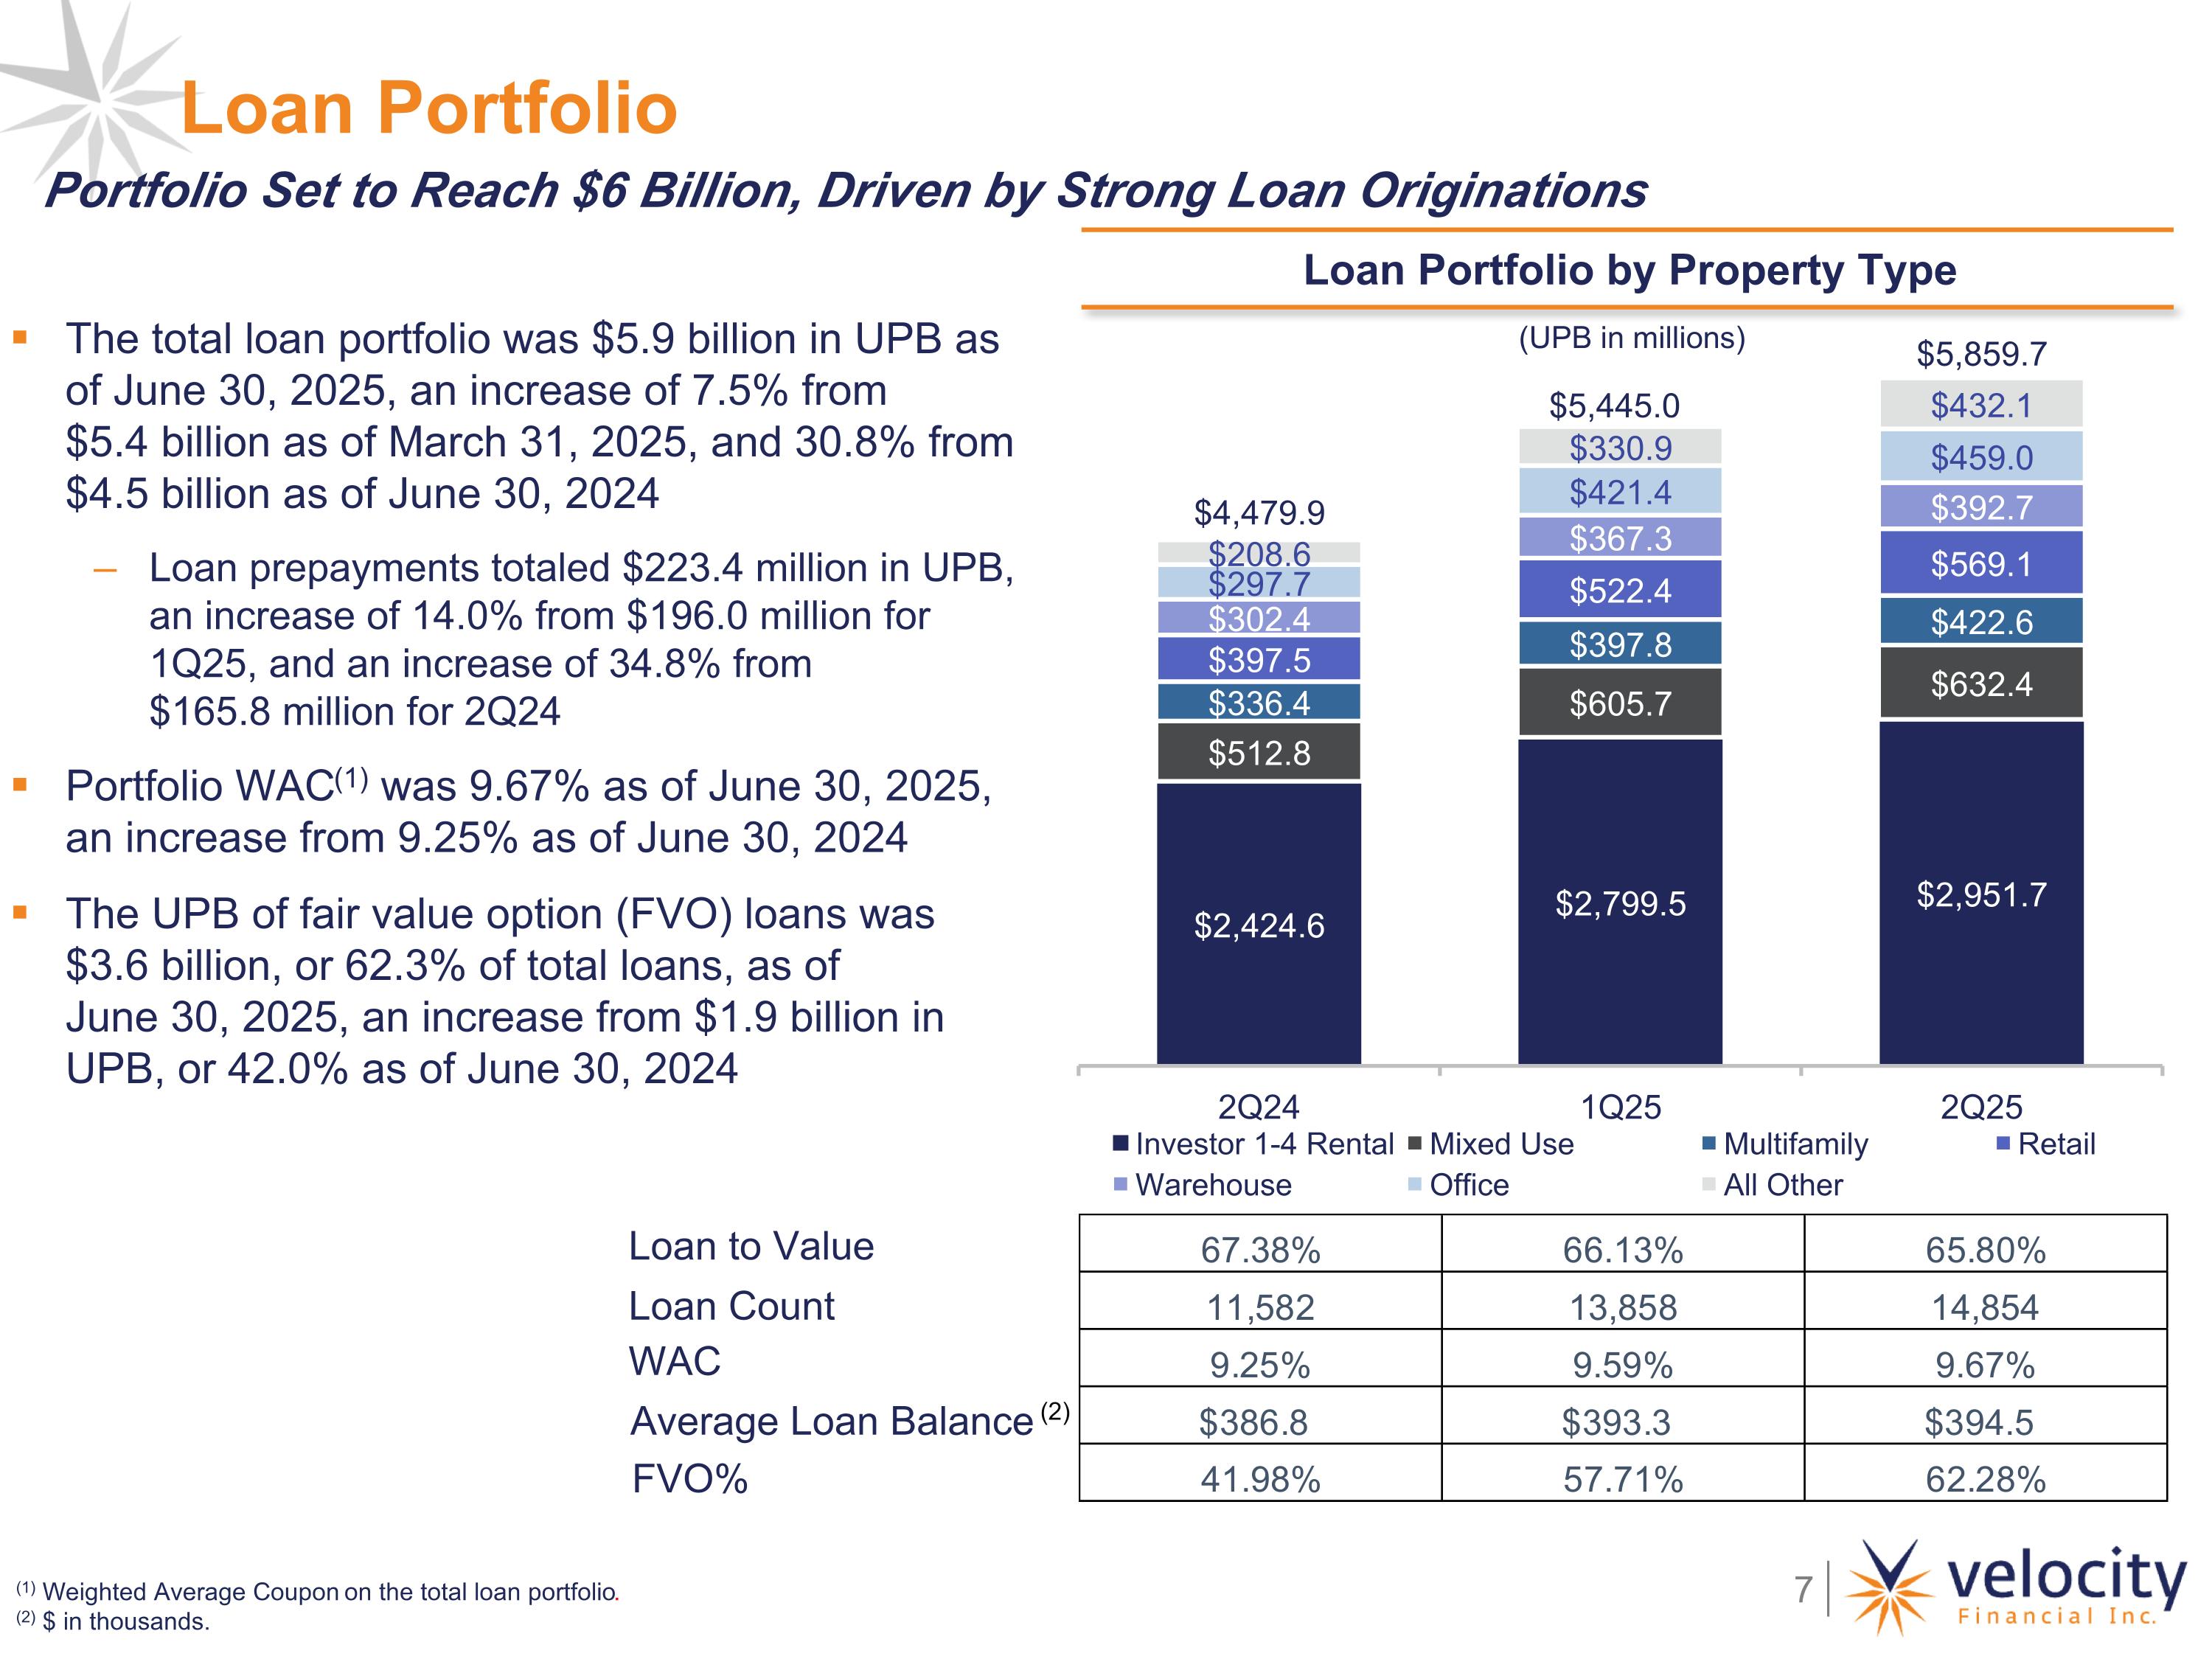
Loan Portfolio by Property Type The total loan portfolio was $5.9 billion in UPB as of June 30, 2025, an increase of 7.5% from $5.4 billion as of March 31, 2025, and 30.8% from $4.5 billion as of June 30, 2024 Loan prepayments totaled $223.4 million in UPB, an increase of 14.0% from $196.0 million for 1Q25, and an increase of 34.8% from $165.8 million for 2Q24 Portfolio WAC(1) was 9.67% as of June 30, 2025, an increase from 9.25% as of June 30, 2024 The UPB of fair value option (FVO) loans was $3.6 billion, or 62.3% of total loans, as of June 30, 2025, an increase from $1.9 billion in UPB, or 42.0% as of June 30, 2024 Loan Portfolio (UPB in millions) (1) Weighted Average Coupon on the total loan portfolio. (2) $ in thousands. Portfolio Set to Reach $6 Billion, Driven by Strong Loan Originations Loan to Value Loan Count WAC Average Loan Balance FVO% (2)
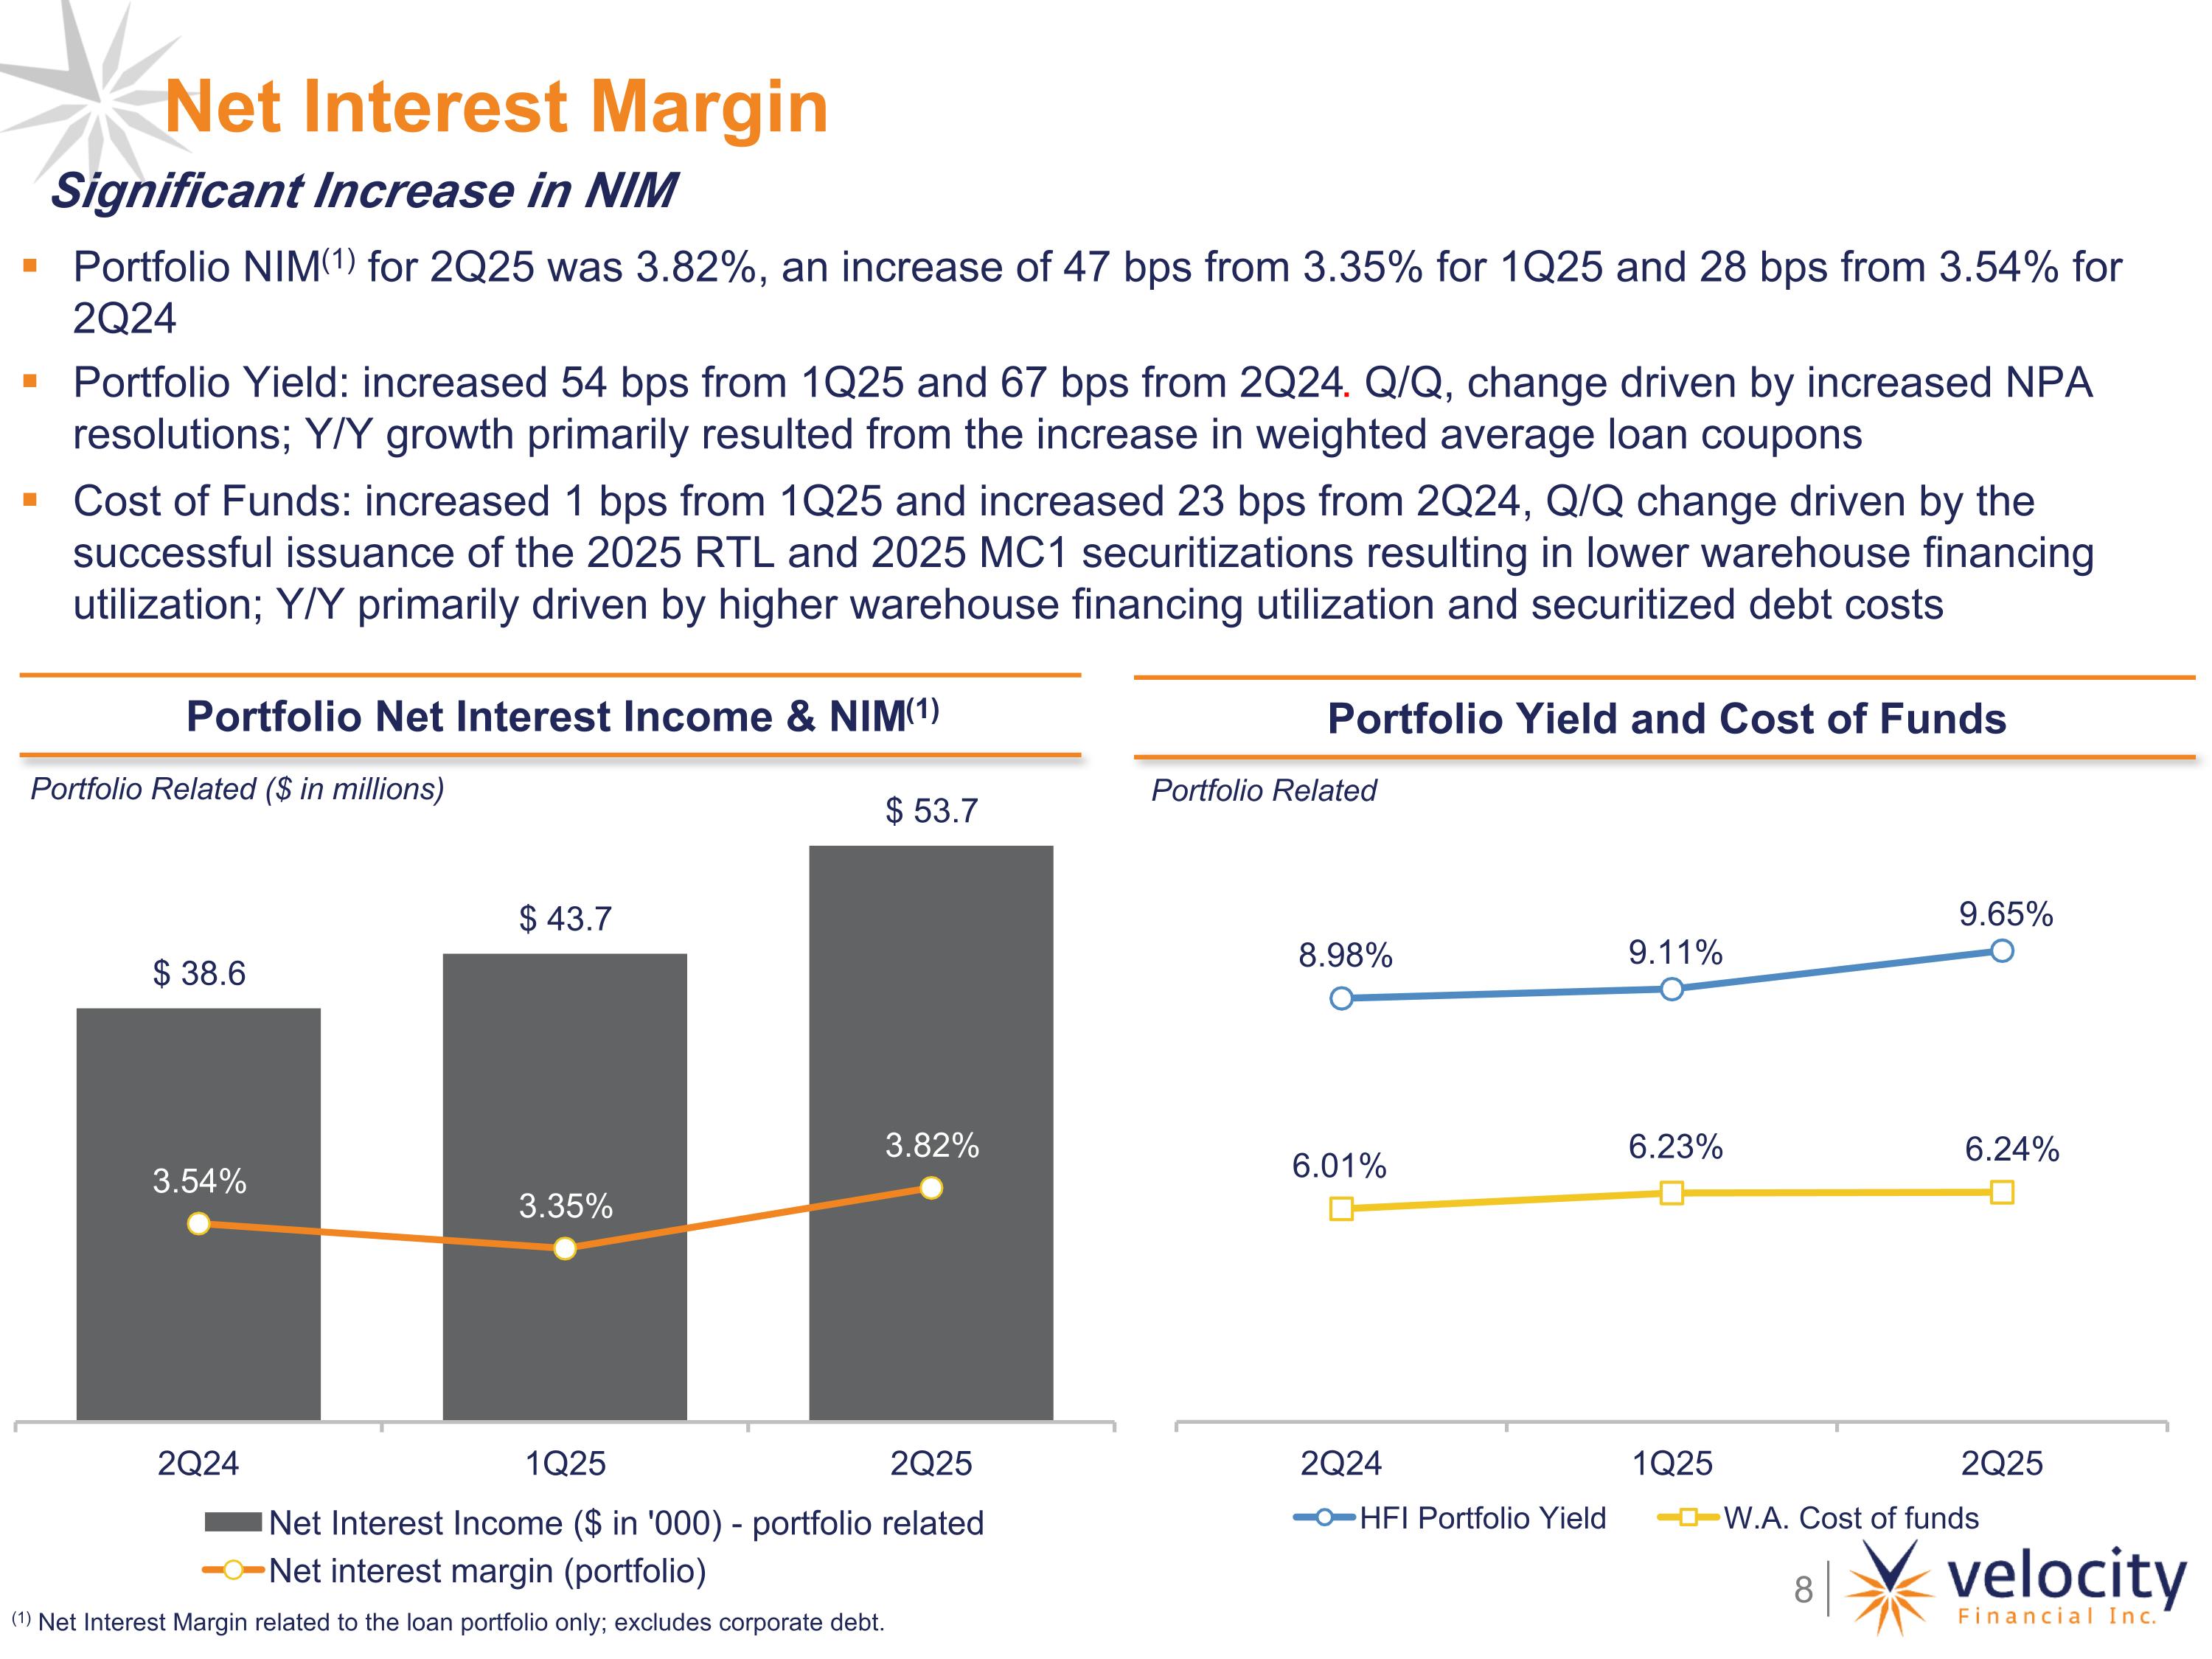
Portfolio Net Interest Income & NIM(1) Portfolio Yield and Cost of Funds Portfolio Related Portfolio NIM(1) for 2Q25 was 3.82%, an increase of 47 bps from 3.35% for 1Q25 and 28 bps from 3.54% for 2Q24 Portfolio Yield: increased 54 bps from 1Q25 and 67 bps from 2Q24. Q/Q, change driven by increased NPA resolutions; Y/Y growth primarily resulted from the increase in weighted average loan coupons Cost of Funds: increased 1 bps from 1Q25 and increased 23 bps from 2Q24, Q/Q change driven by the successful issuance of the 2025 RTL and 2025 MC1 securitizations resulting in lower warehouse financing utilization; Y/Y primarily driven by higher warehouse financing utilization and securitized debt costs Net Interest Margin (1) Net Interest Margin related to the loan portfolio only; excludes corporate debt. Portfolio Related ($ in millions) Significant Increase in NIM
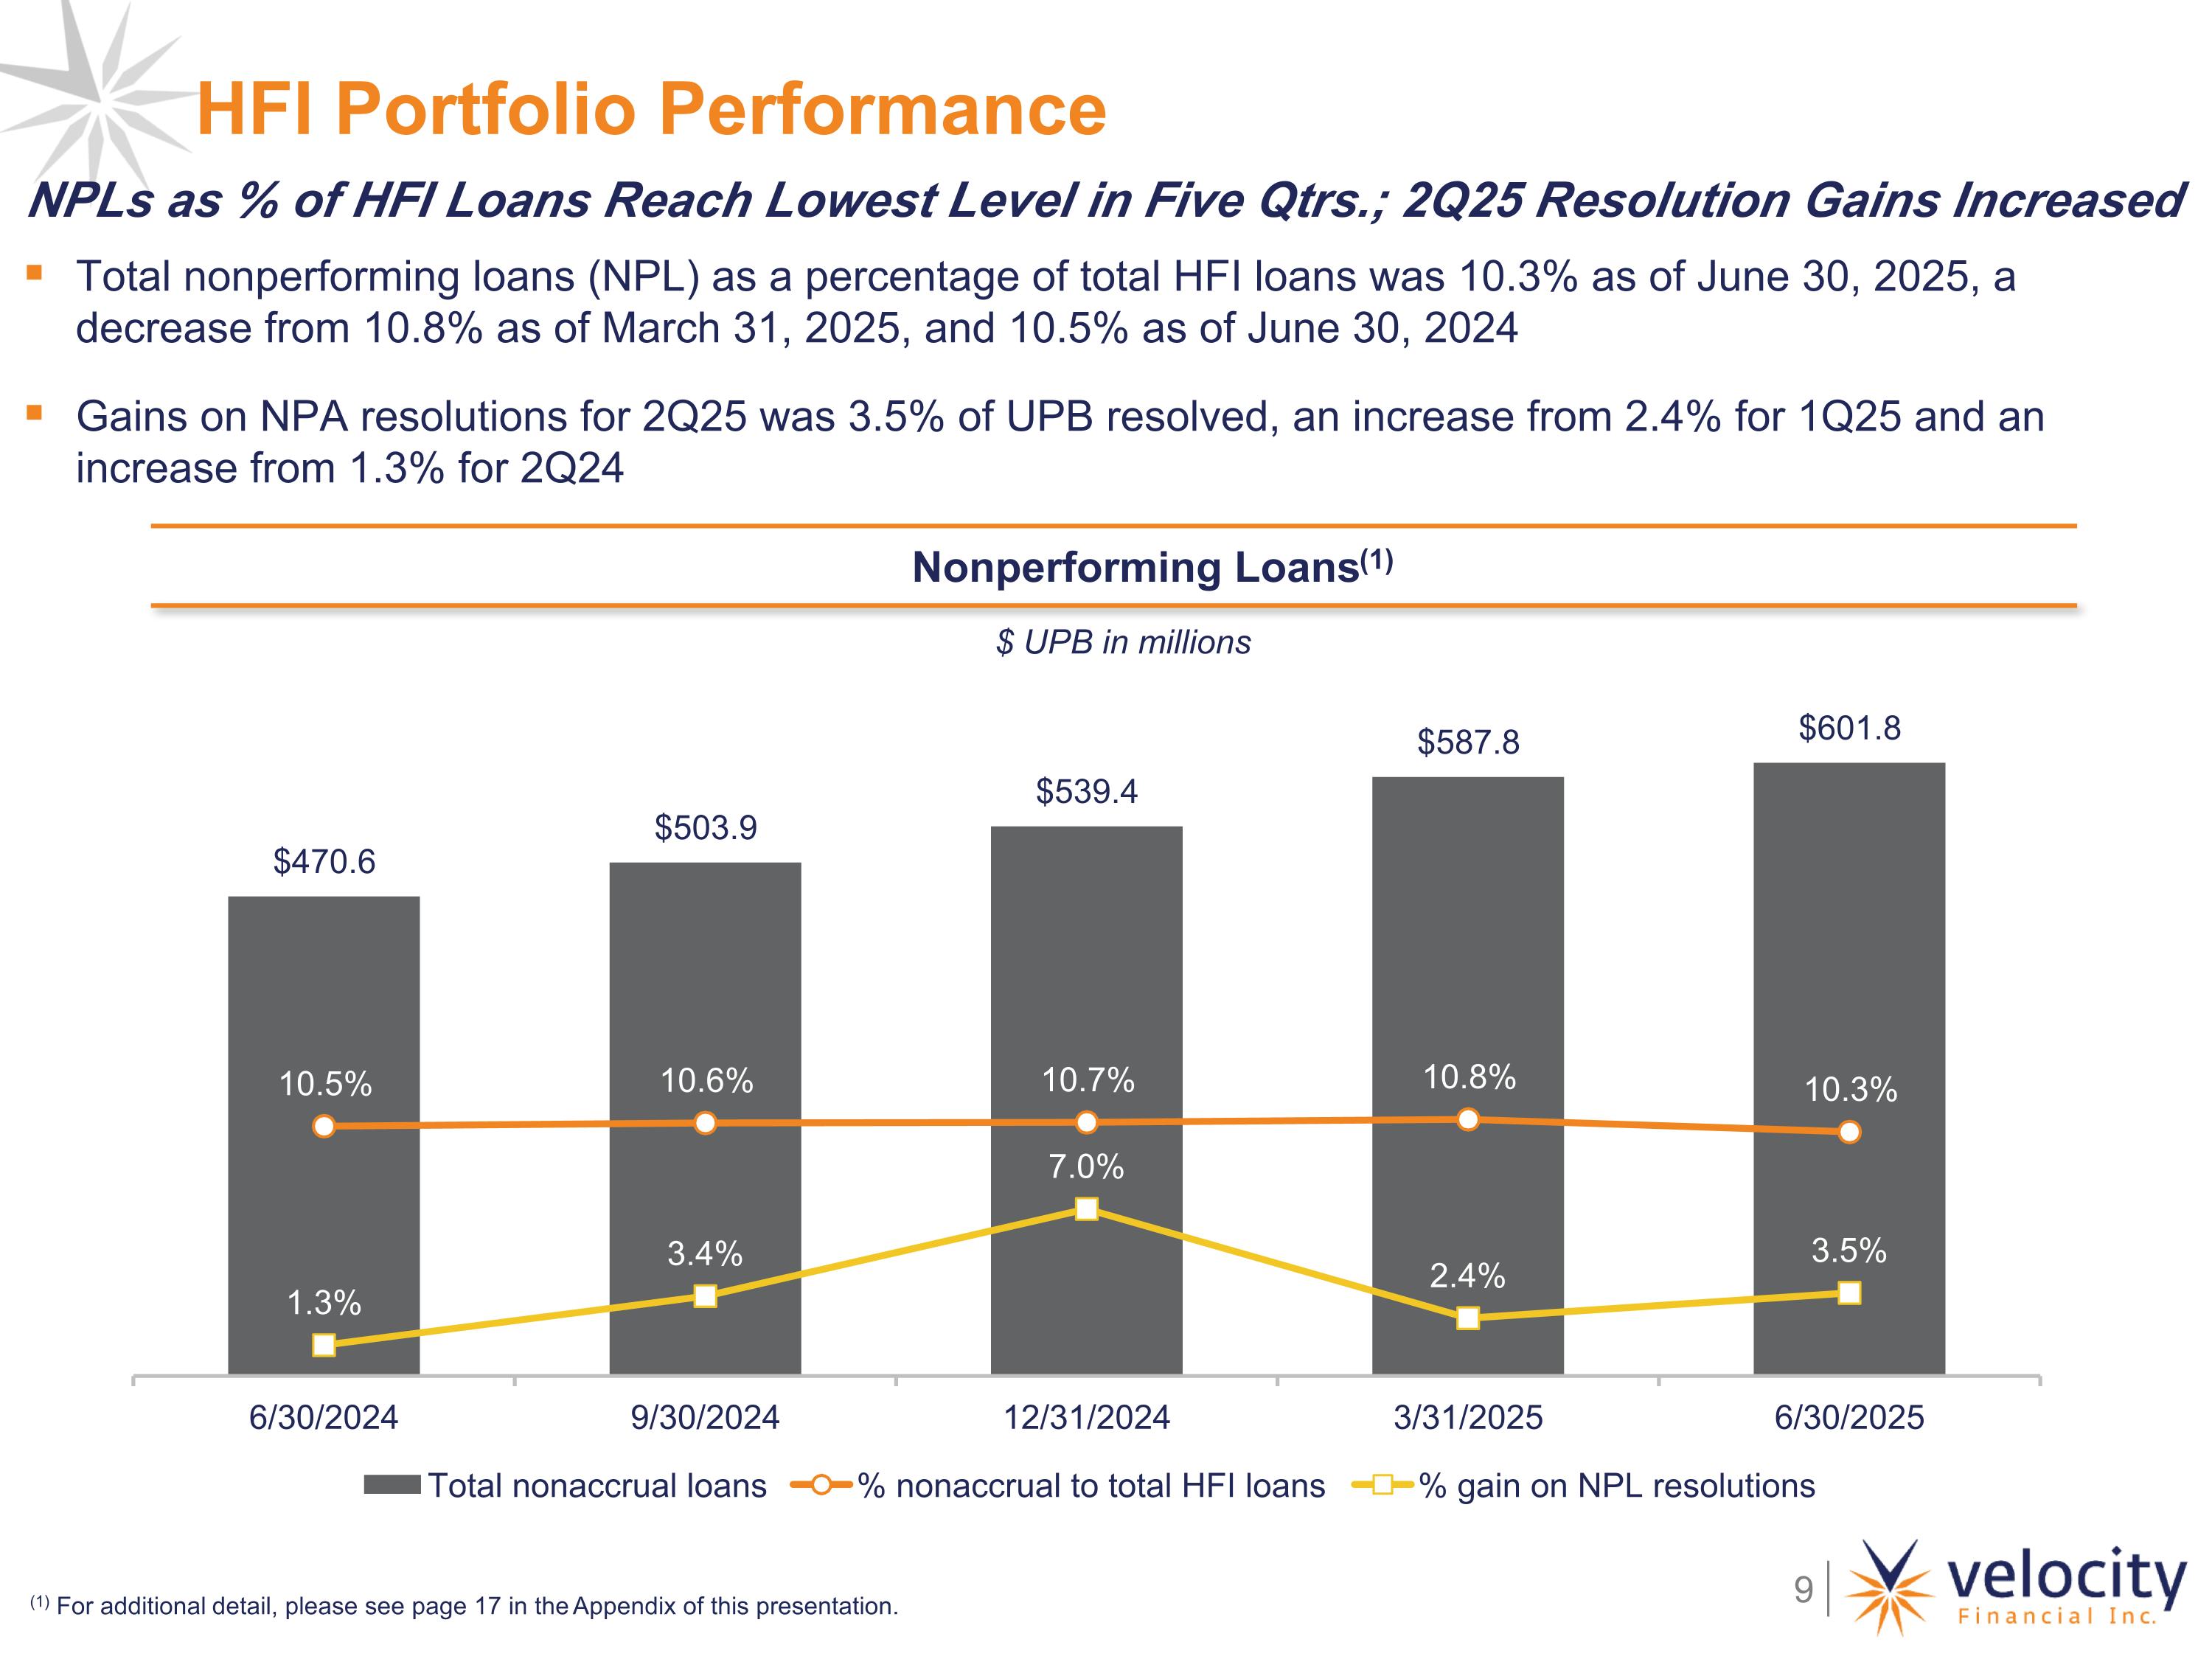
Nonperforming Loans(1) Total nonperforming loans (NPL) as a percentage of total HFI loans was 10.3% as of June 30, 2025, a decrease from 10.8% as of March 31, 2025, and 10.5% as of June 30, 2024 Gains on NPA resolutions for 2Q25 was 3.5% of UPB resolved, an increase from 2.4% for 1Q25 and an increase from 1.3% for 2Q24 $ UPB in millions HFI Portfolio Performance (1) For additional detail, please see page 17 in the Appendix of this presentation. NPLs as % of HFI Loans Reach Lowest Level in Five Qtrs.; 2Q25 Resolution Gains Increased
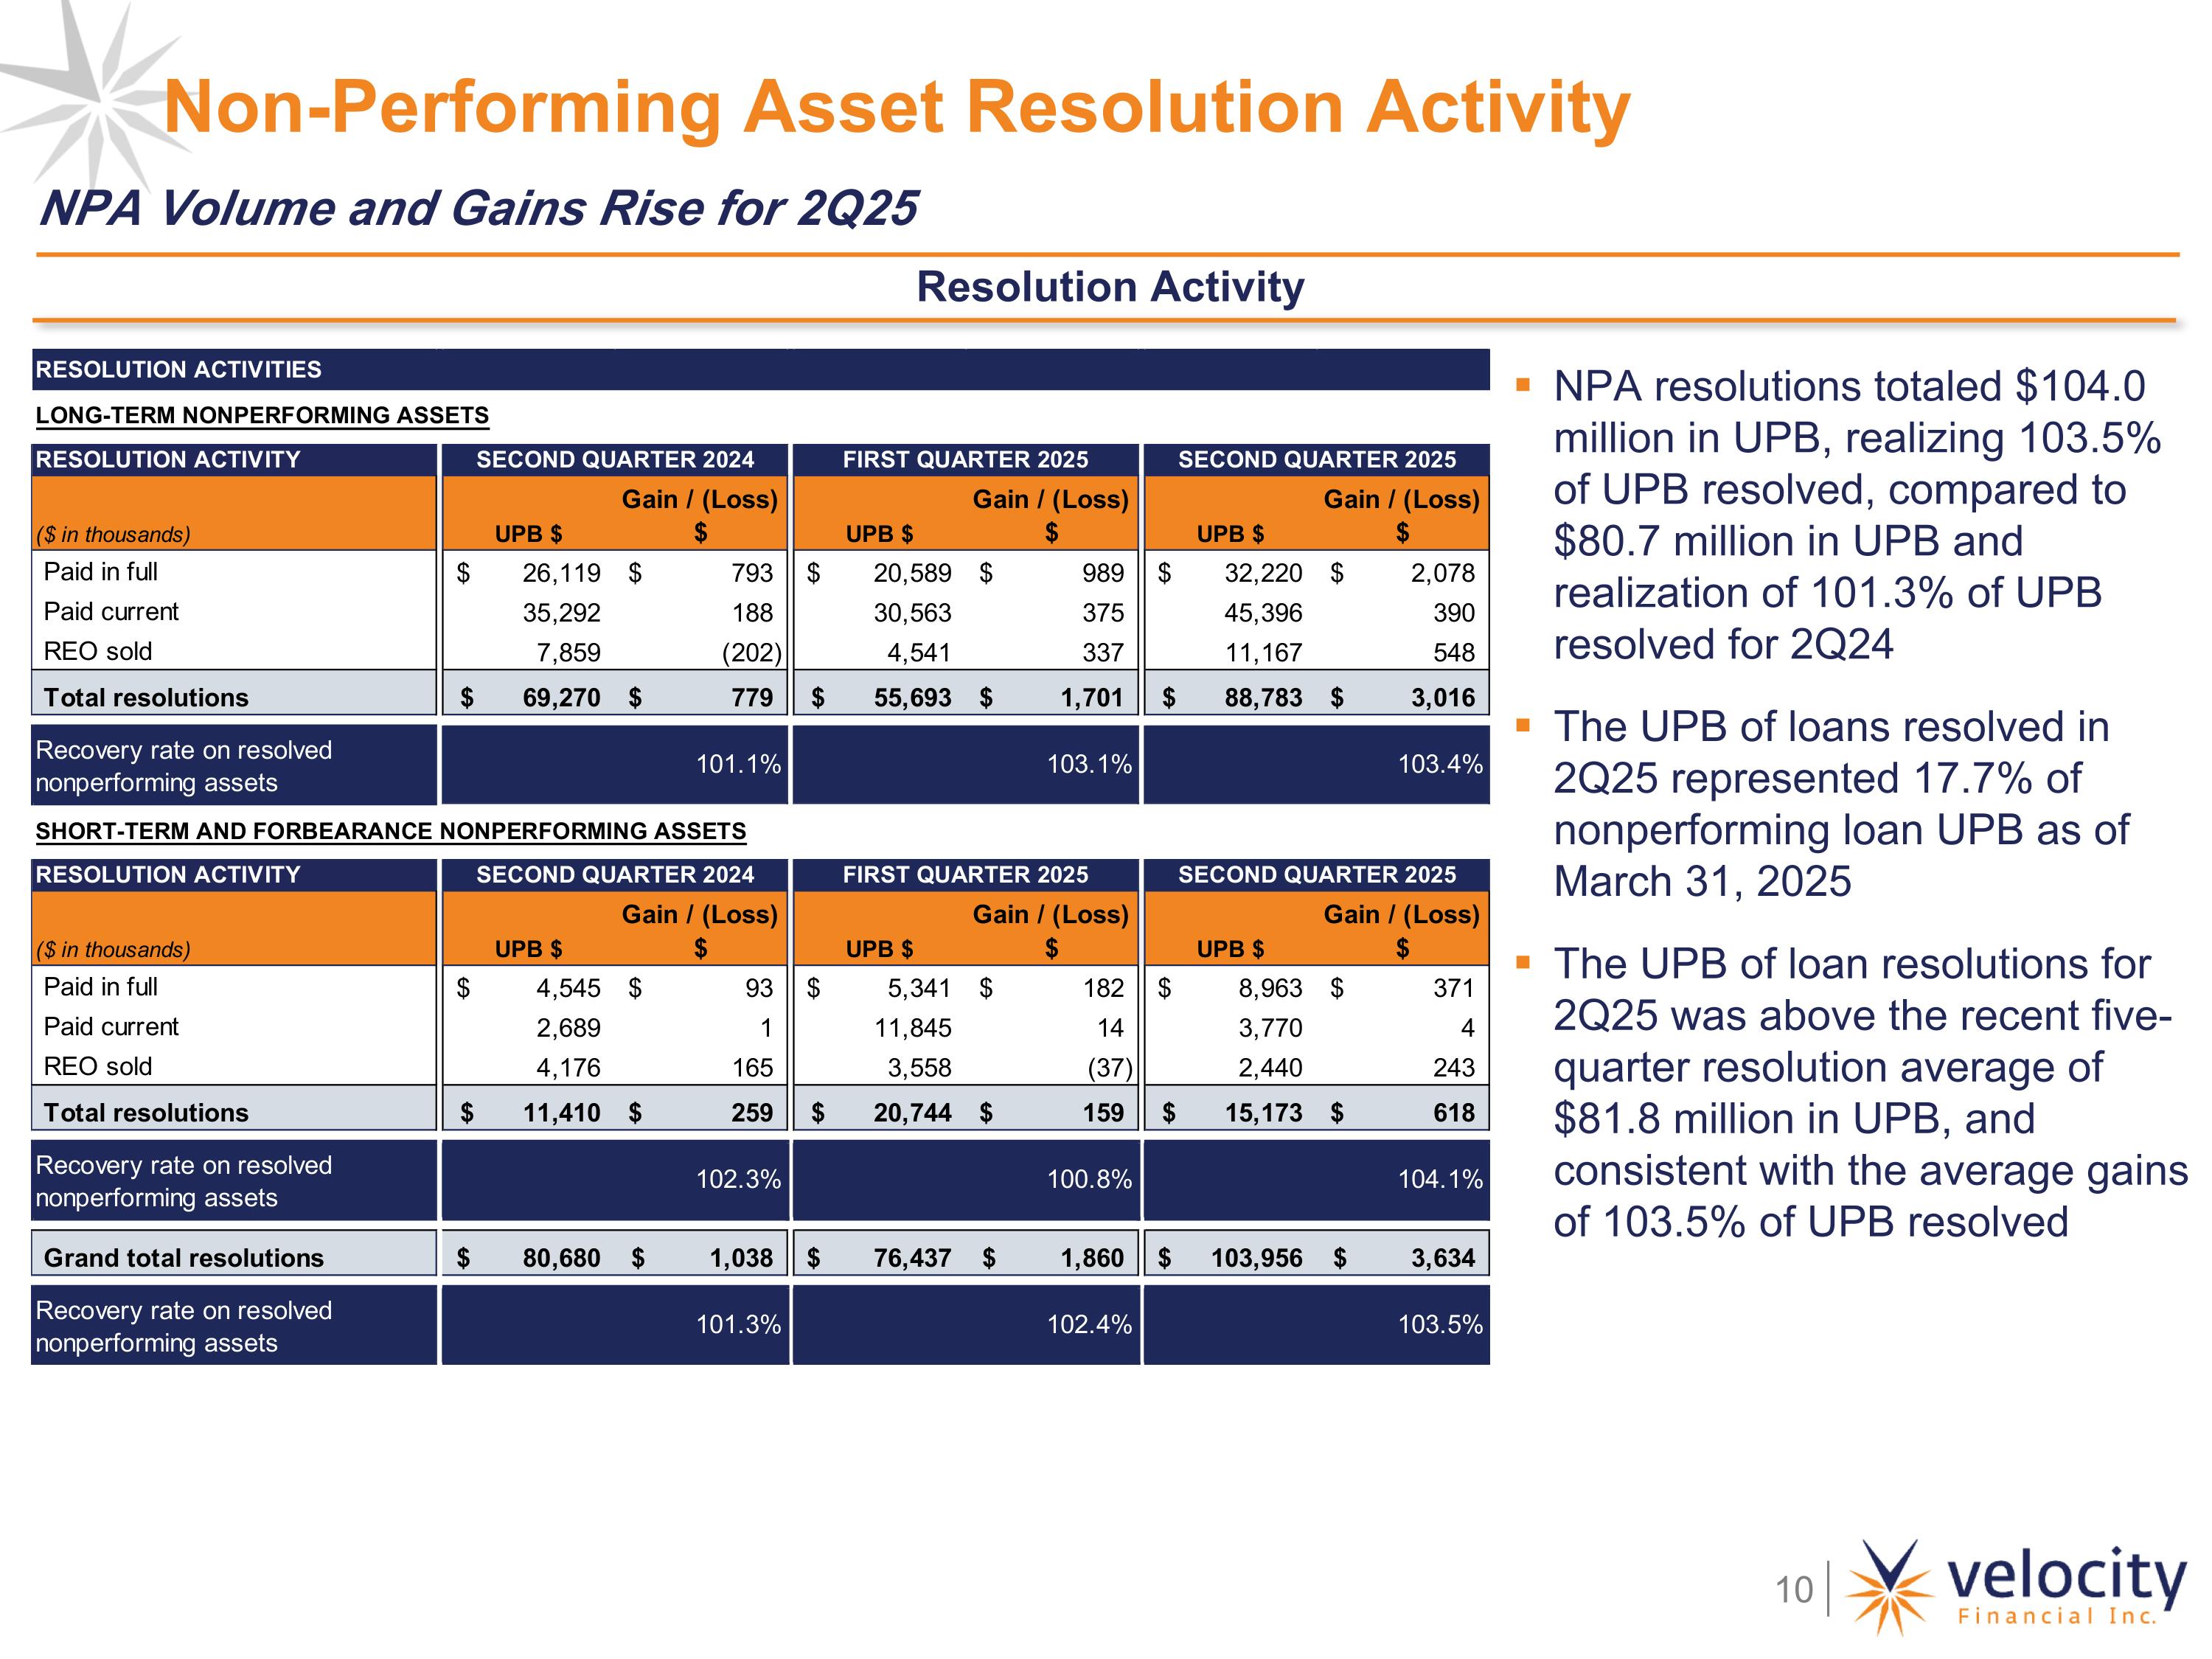
Non-Performing Asset Resolution Activity Resolution Activity NPA resolutions totaled $104.0 million in UPB, realizing 103.5% of UPB resolved, compared to $80.7 million in UPB and realization of 101.3% of UPB resolved for 2Q24 The UPB of loans resolved in 2Q25 represented 17.7% of nonperforming loan UPB as of March 31, 2025 The UPB of loan resolutions for 2Q25 was above the recent five-quarter resolution average of $81.8 million in UPB, and consistent with the average gains of 103.5% of UPB resolved NPA Volume and Gains Rise for 2Q25
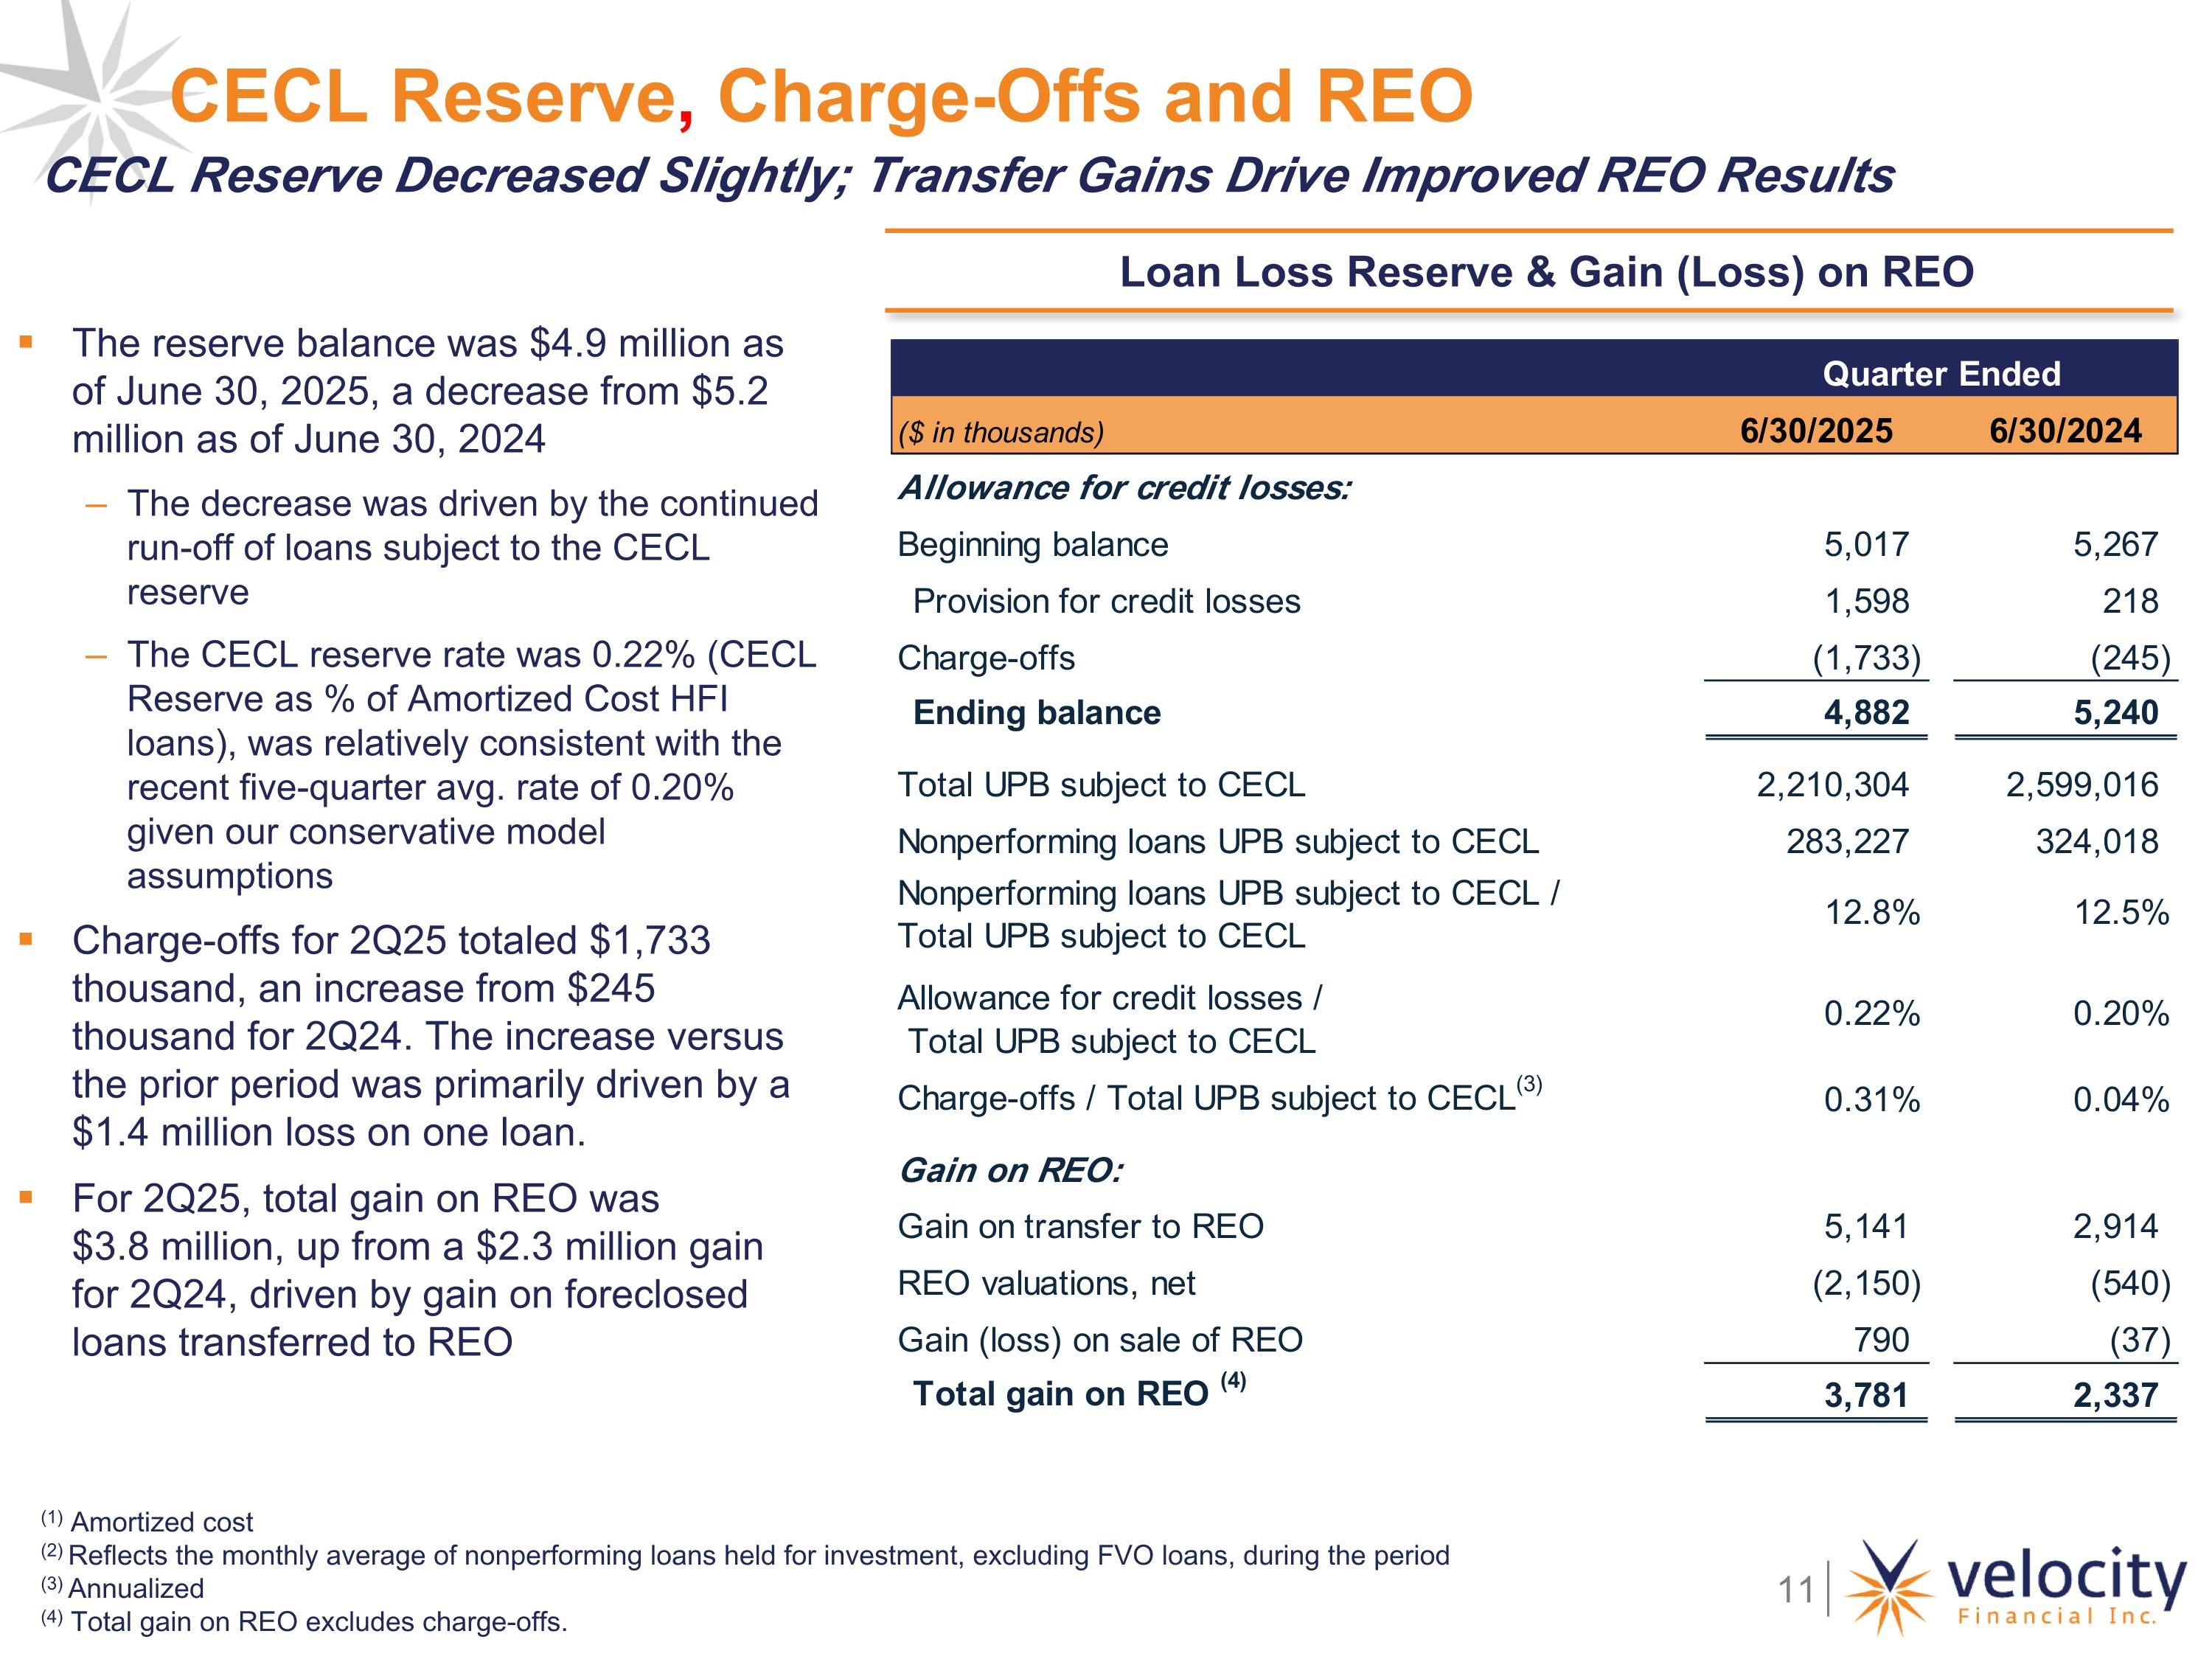
The reserve balance was $4.9 million as of June 30, 2025, a decrease from $5.2 million as of June 30, 2024 The decrease was driven by the continued run-off of loans subject to the CECL reserve The CECL reserve rate was 0.22% (CECL Reserve as % of Amortized Cost HFI loans), was relatively consistent with the recent five-quarter avg. rate of 0.20% given our conservative model assumptions Charge-offs for 2Q25 totaled $1,733 thousand, an increase from $245 thousand for 2Q24. The increase versus the prior period was primarily driven by a $1.4 million loss on one loan. For 2Q25, total gain on REO was $3.8 million, up from a $2.3 million gain for 2Q24, driven by gain on foreclosed loans transferred to REO CECL Reserve, Charge-Offs and REO CECL Reserve Decreased Slightly; Transfer Gains Drive Improved REO Results Loan Loss Reserve & Gain (Loss) on REO (1) Amortized cost (2) Reflects the monthly average of nonperforming loans held for investment, excluding FVO loans, during the period (3) Annualized (4) Total gain on REO excludes charge-offs.
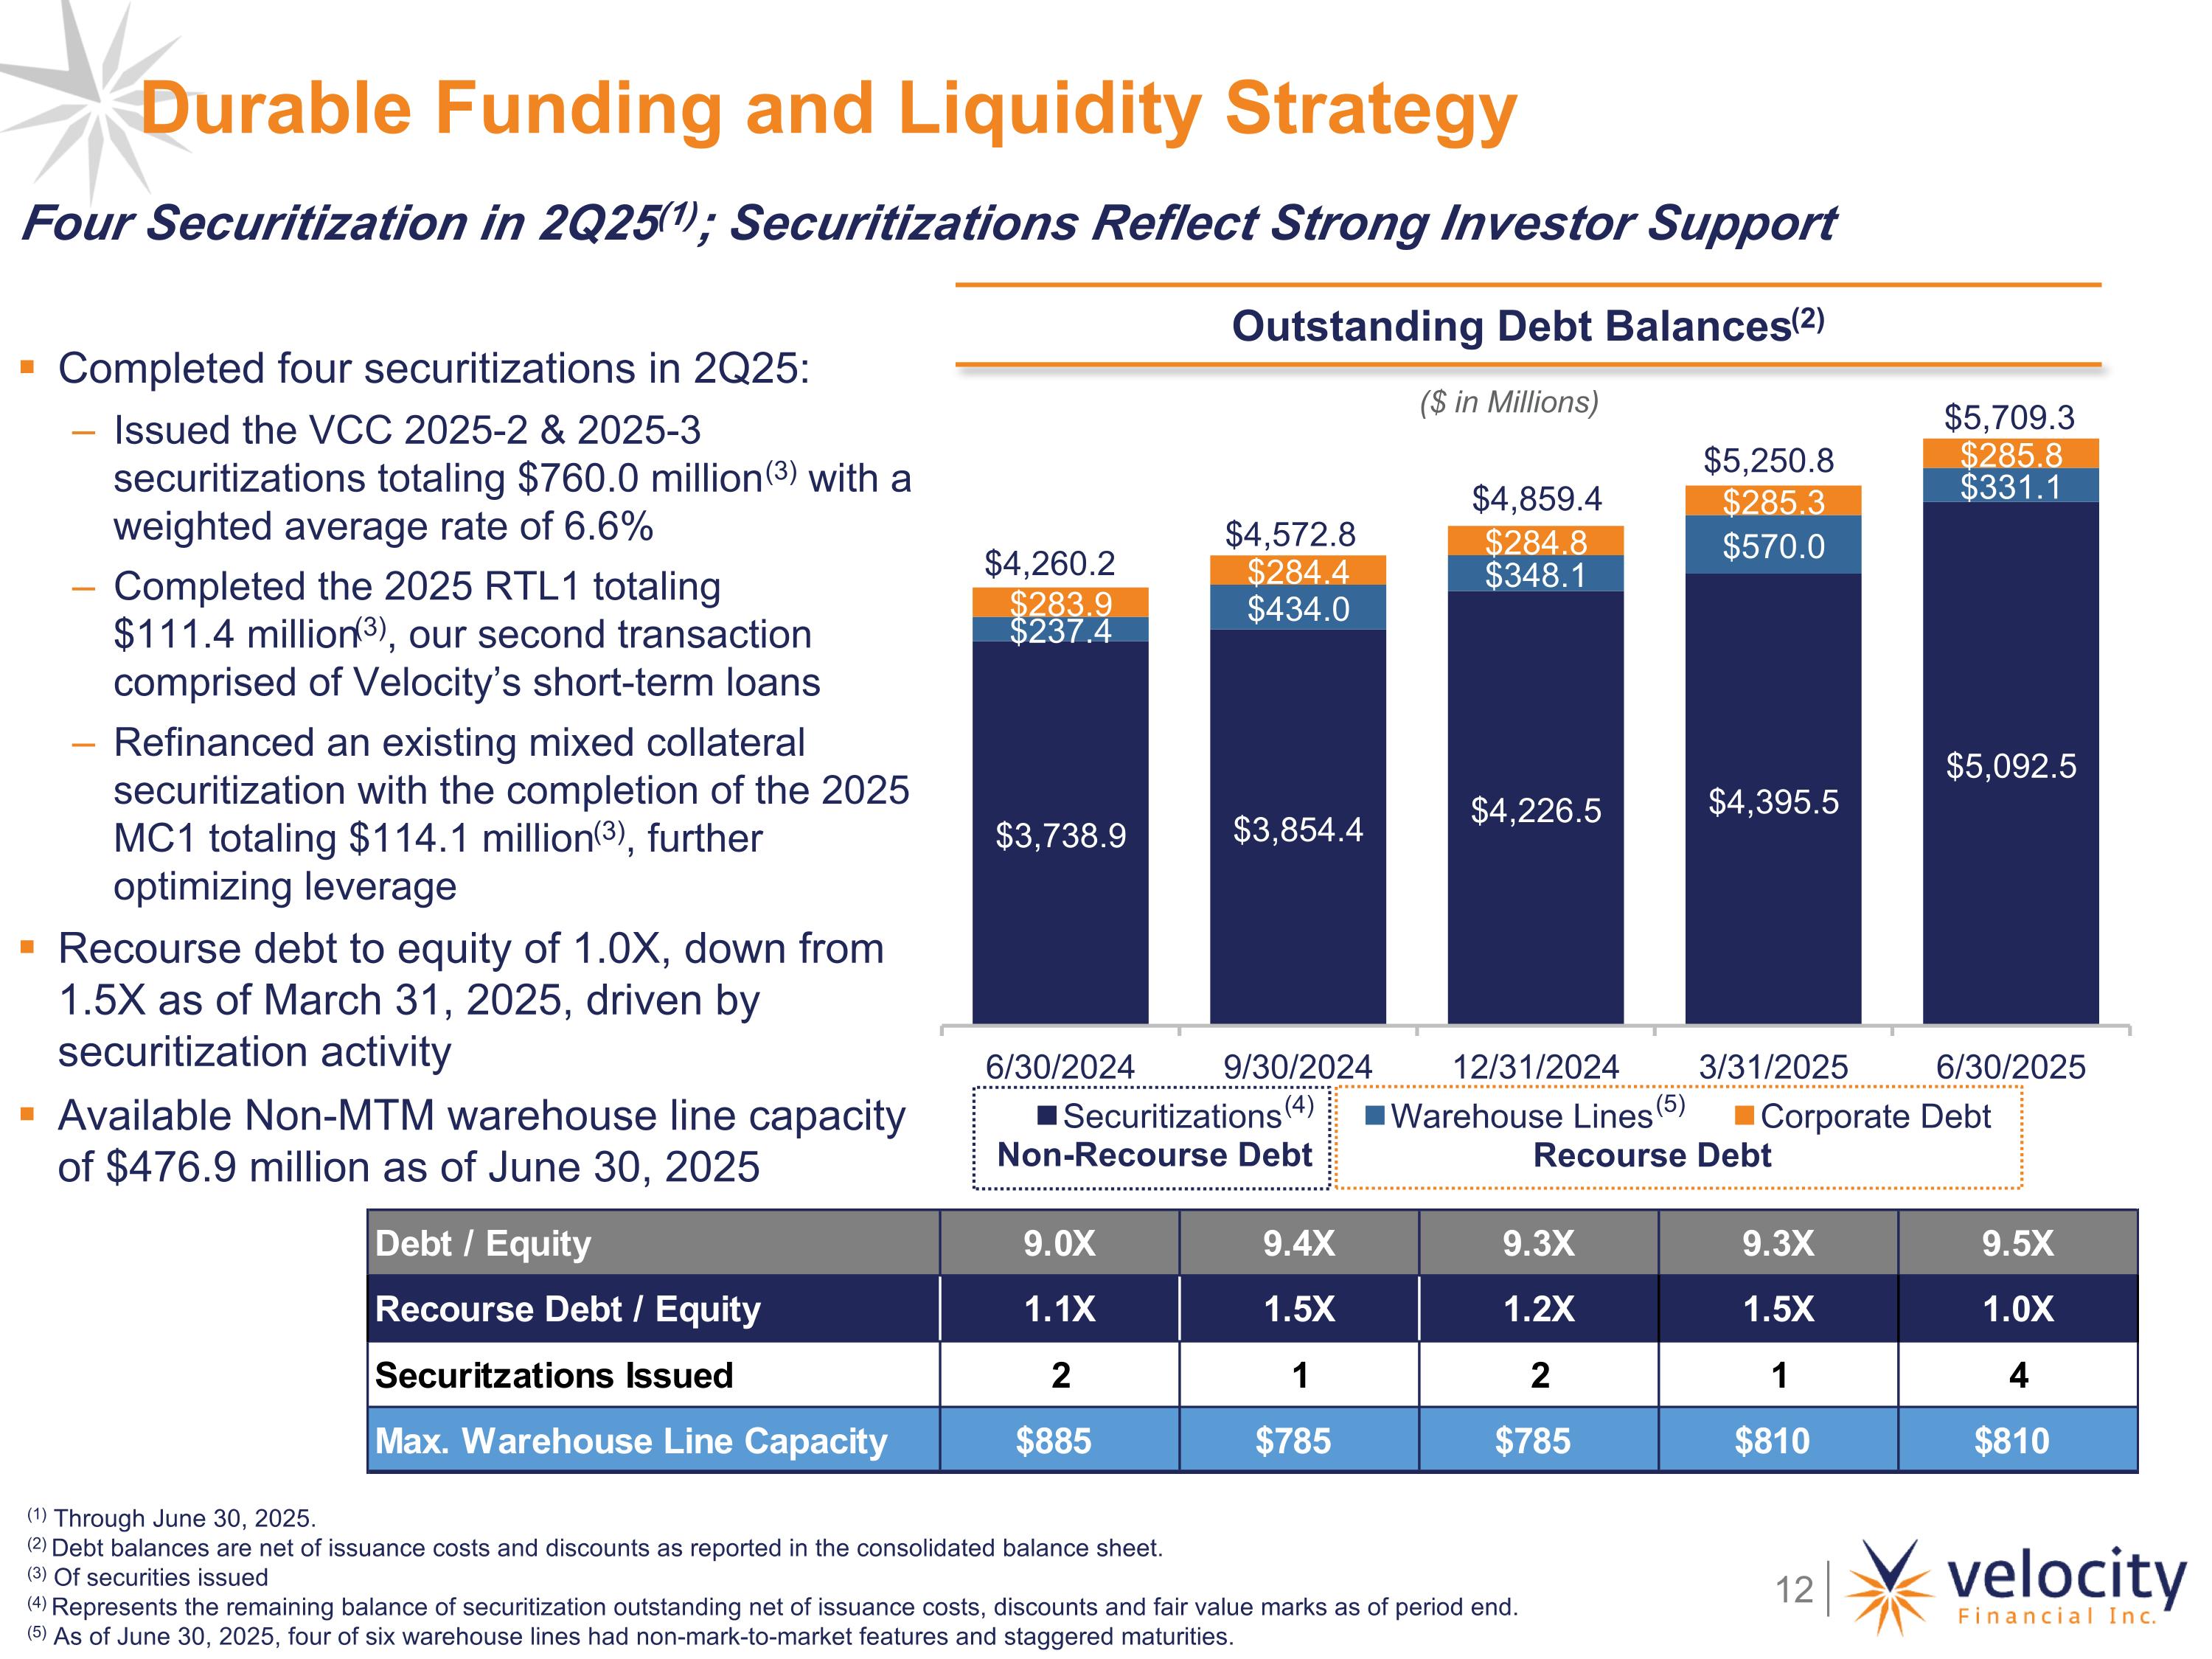
Durable Funding and Liquidity Strategy Four Securitization in 2Q25(1); Securitizations Reflect Strong Investor Support Outstanding Debt Balances(2) ($ in Millions) (1) Through June 30, 2025. (2) Debt balances are net of issuance costs and discounts as reported in the consolidated balance sheet. (3) Of securities issued (4) Represents the remaining balance of securitization outstanding net of issuance costs, discounts and fair value marks as of period end. (5) As of June 30, 2025, four of six warehouse lines had non-mark-to-market features and staggered maturities. Non-Recourse Debt Recourse Debt (4) Completed four securitizations in 2Q25: Issued the VCC 2025-2 & 2025-3 securitizations totaling $760.0 million(3) with a weighted average rate of 6.6% Completed the 2025 RTL1 totaling $111.4 million(3), our second transaction comprised of Velocity’s short-term loans Refinanced an existing mixed collateral securitization with the completion of the 2025 MC1 totaling $114.1 million(3), further optimizing leverage Recourse debt to equity of 1.0X, down from 1.5X as of March 31, 2025, driven by securitization activity Available Non-MTM warehouse line capacity of $476.9 million as of June 30, 2025 (5) (5)
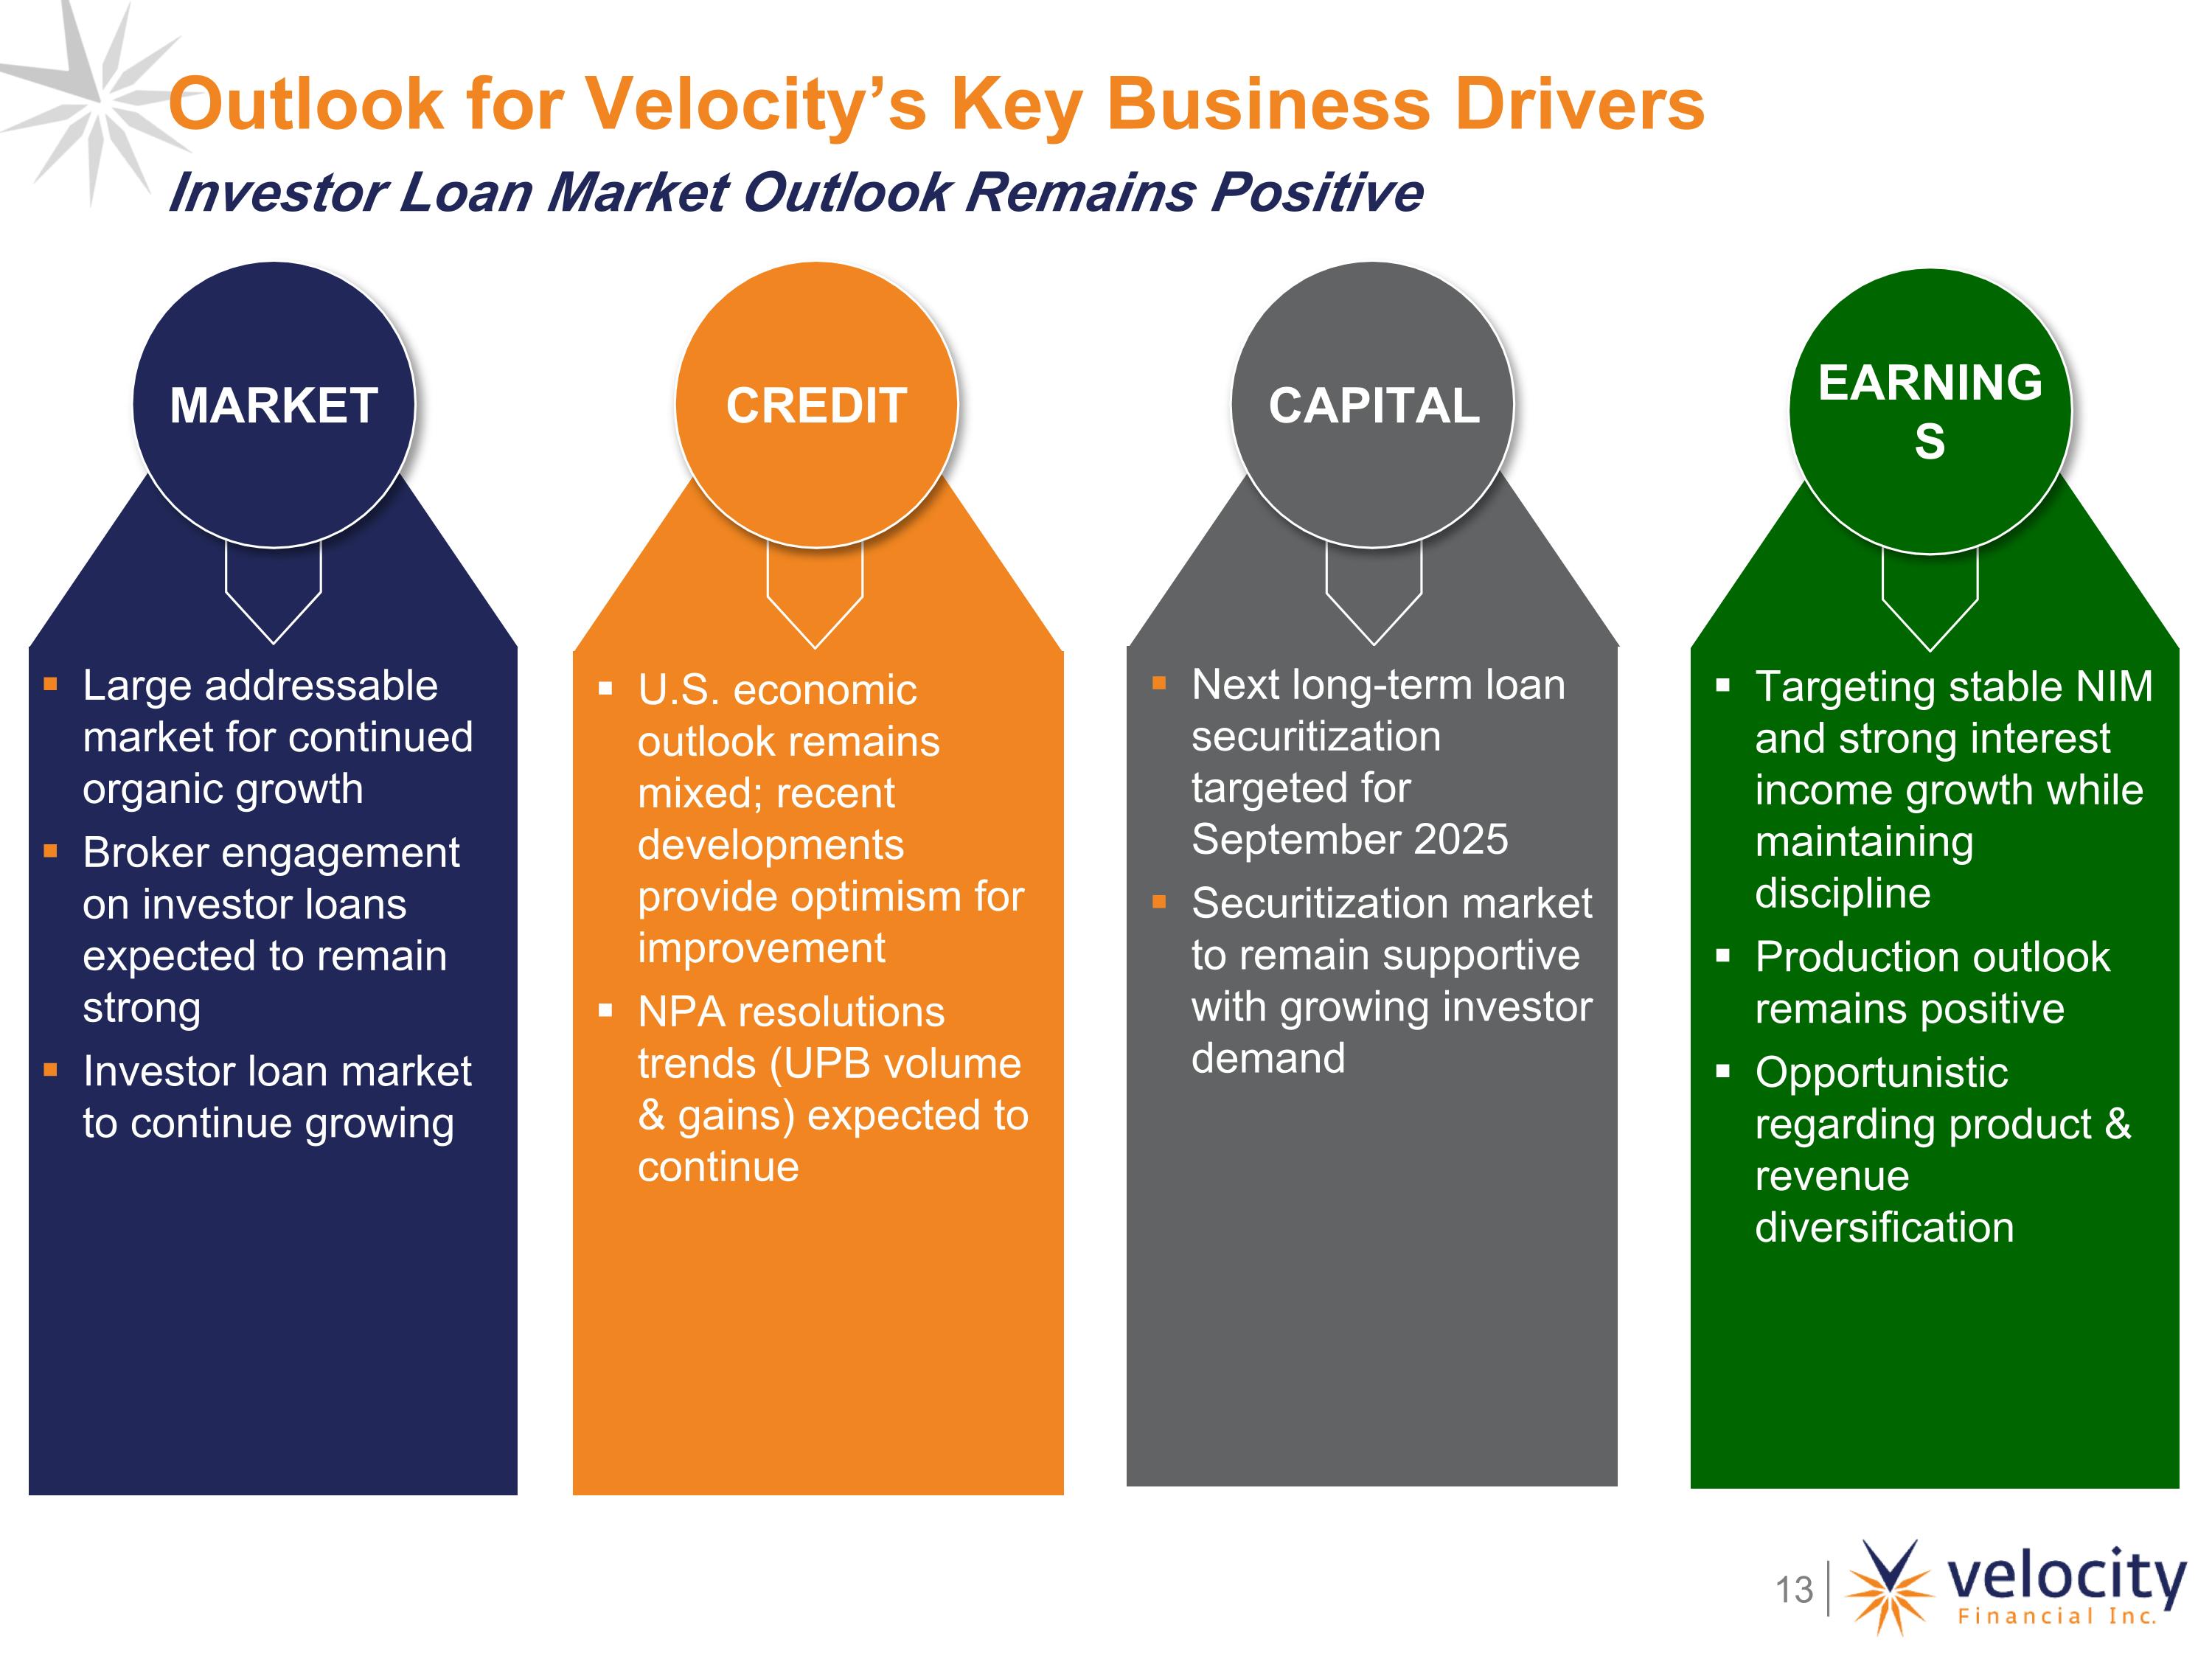
U.S. economic outlook remains mixed; recent developments provide optimism for improvement NPA resolutions trends (UPB volume & gains) expected to continue Large addressable market for continued organic growth Broker engagement on investor loans expected to remain strong Investor loan market to continue growing Outlook for Velocity’s Key Business Drivers MARKET CREDIT CAPITAL Next long-term loan securitization targeted for September 2025 Securitization market to remain supportive with growing investor demand Investor Loan Market Outlook Remains Positive Targeting stable NIM and strong interest income growth while maintaining discipline Production outlook remains positive Opportunistic regarding product & revenue diversification EARNINGS

Appendix
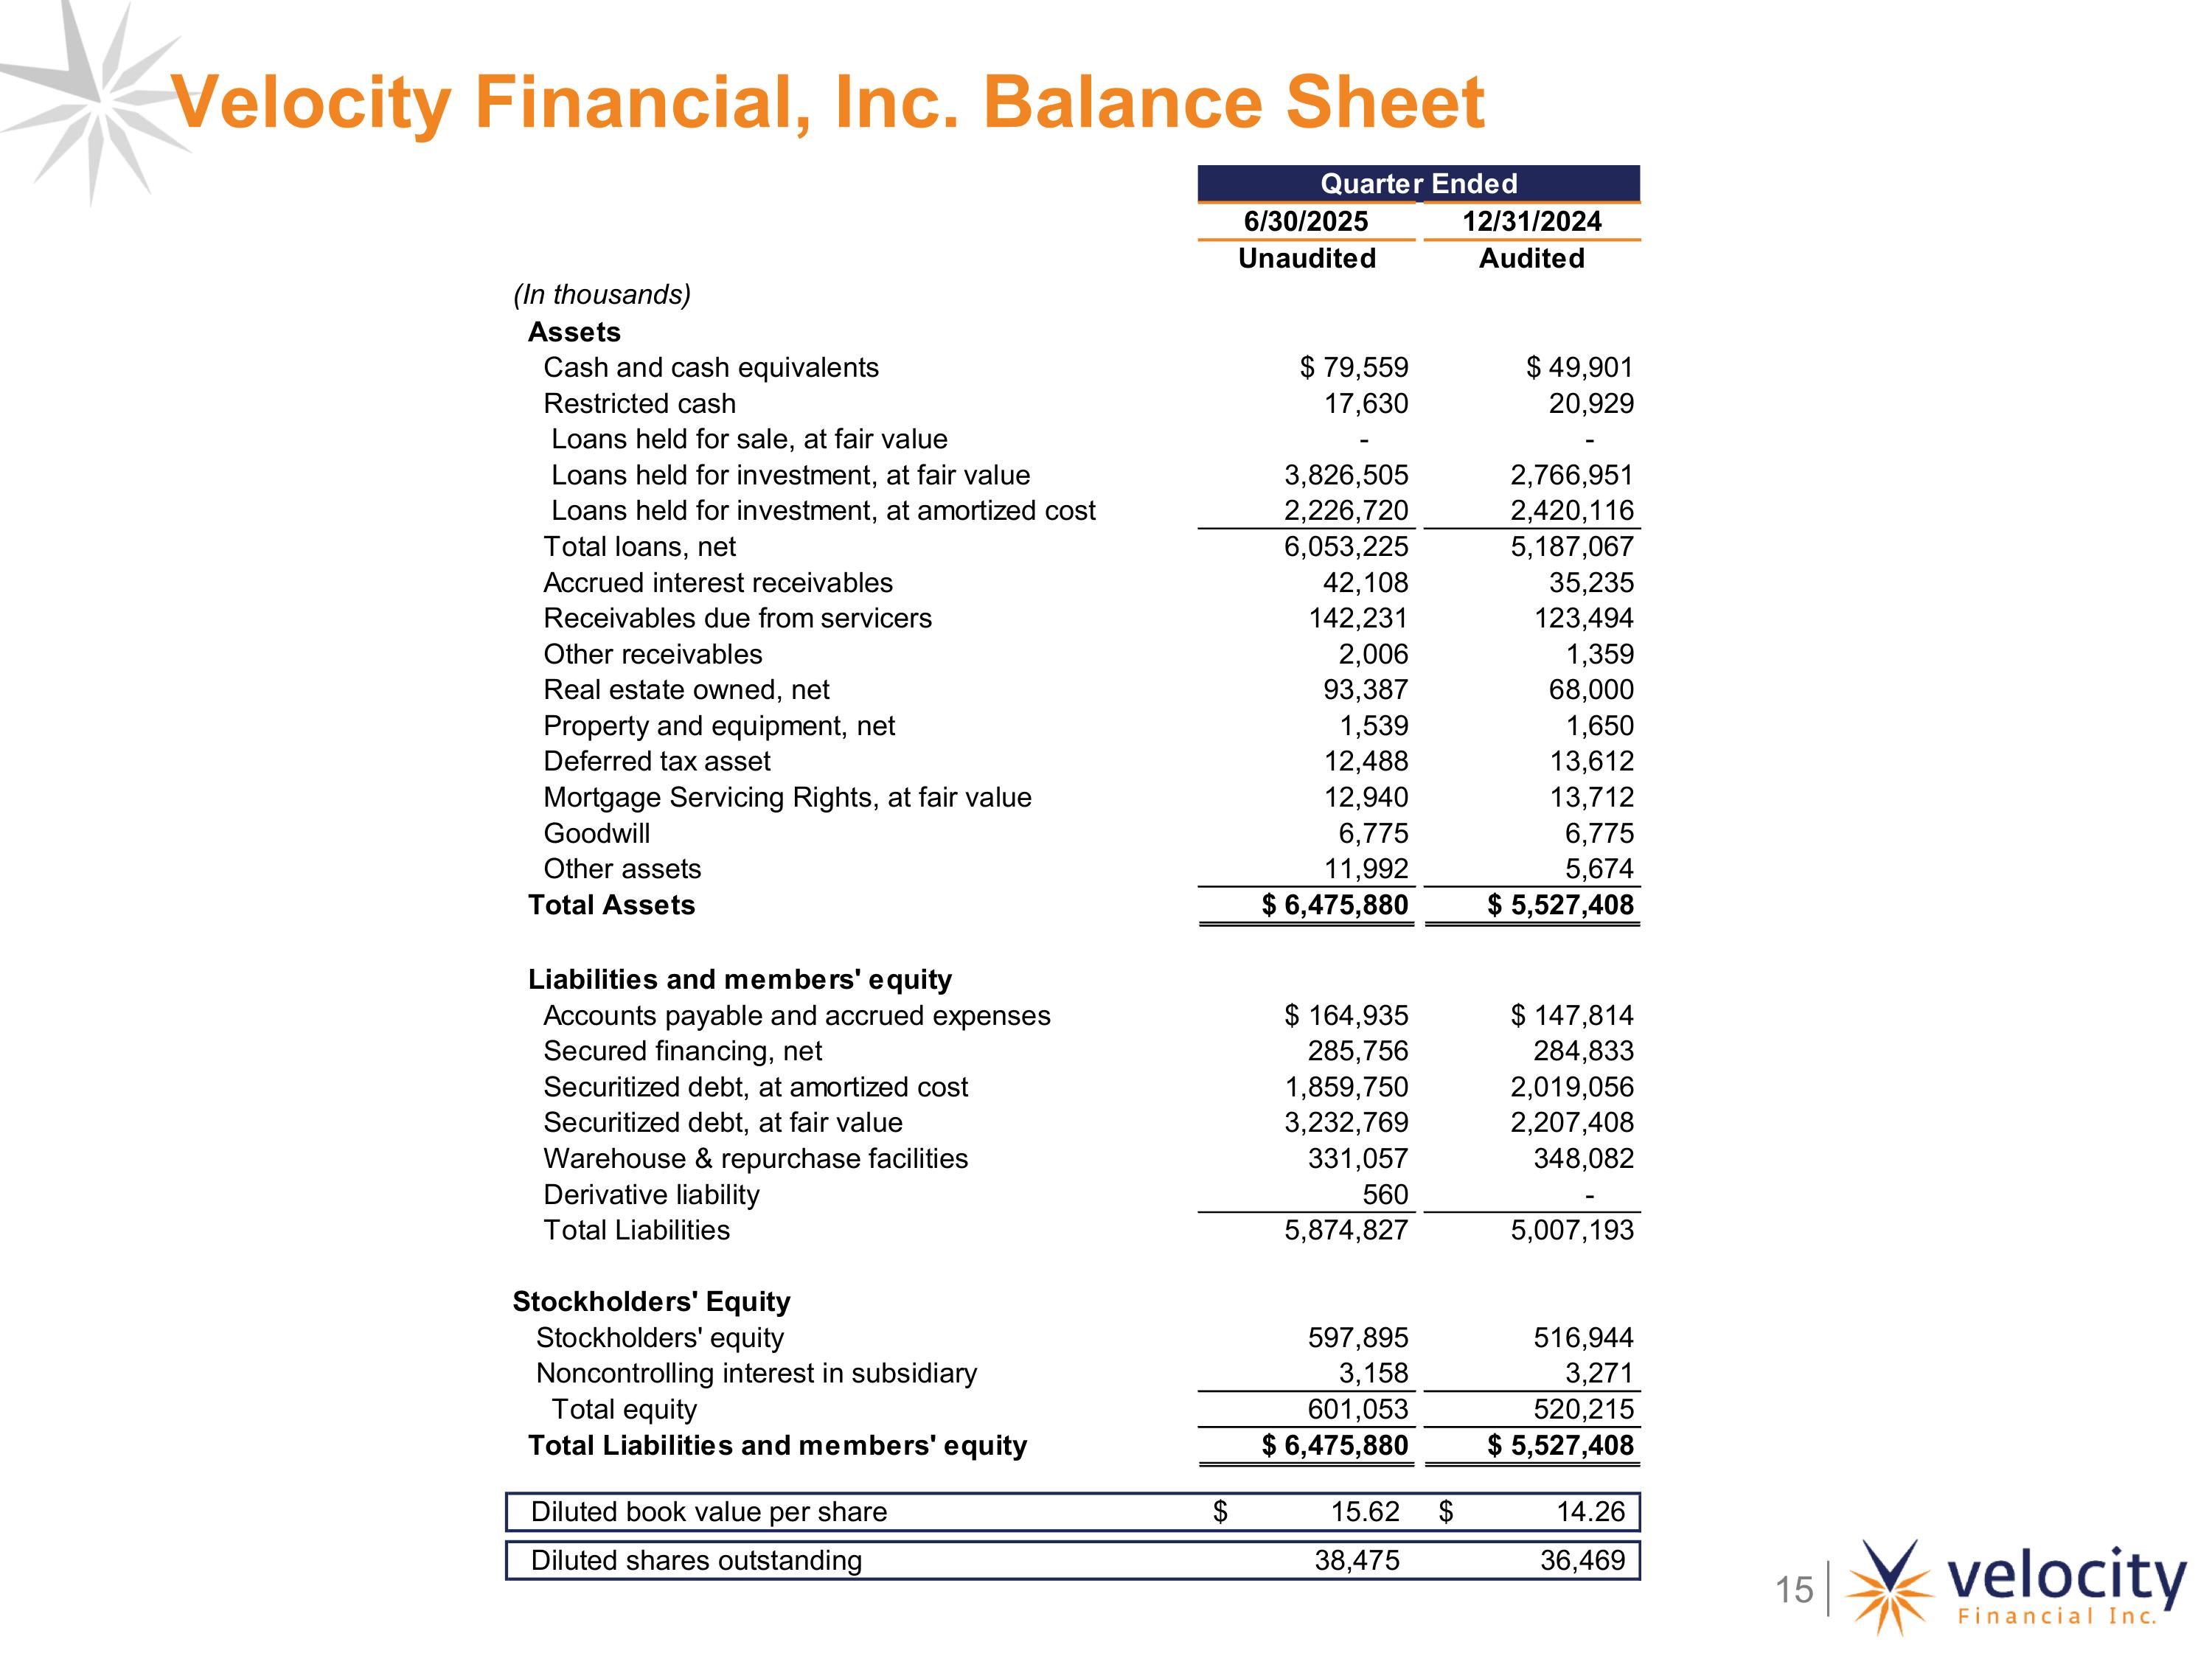
Velocity Financial, Inc. Balance Sheet

Velocity Financial, Inc. Income Statement (Quarters)
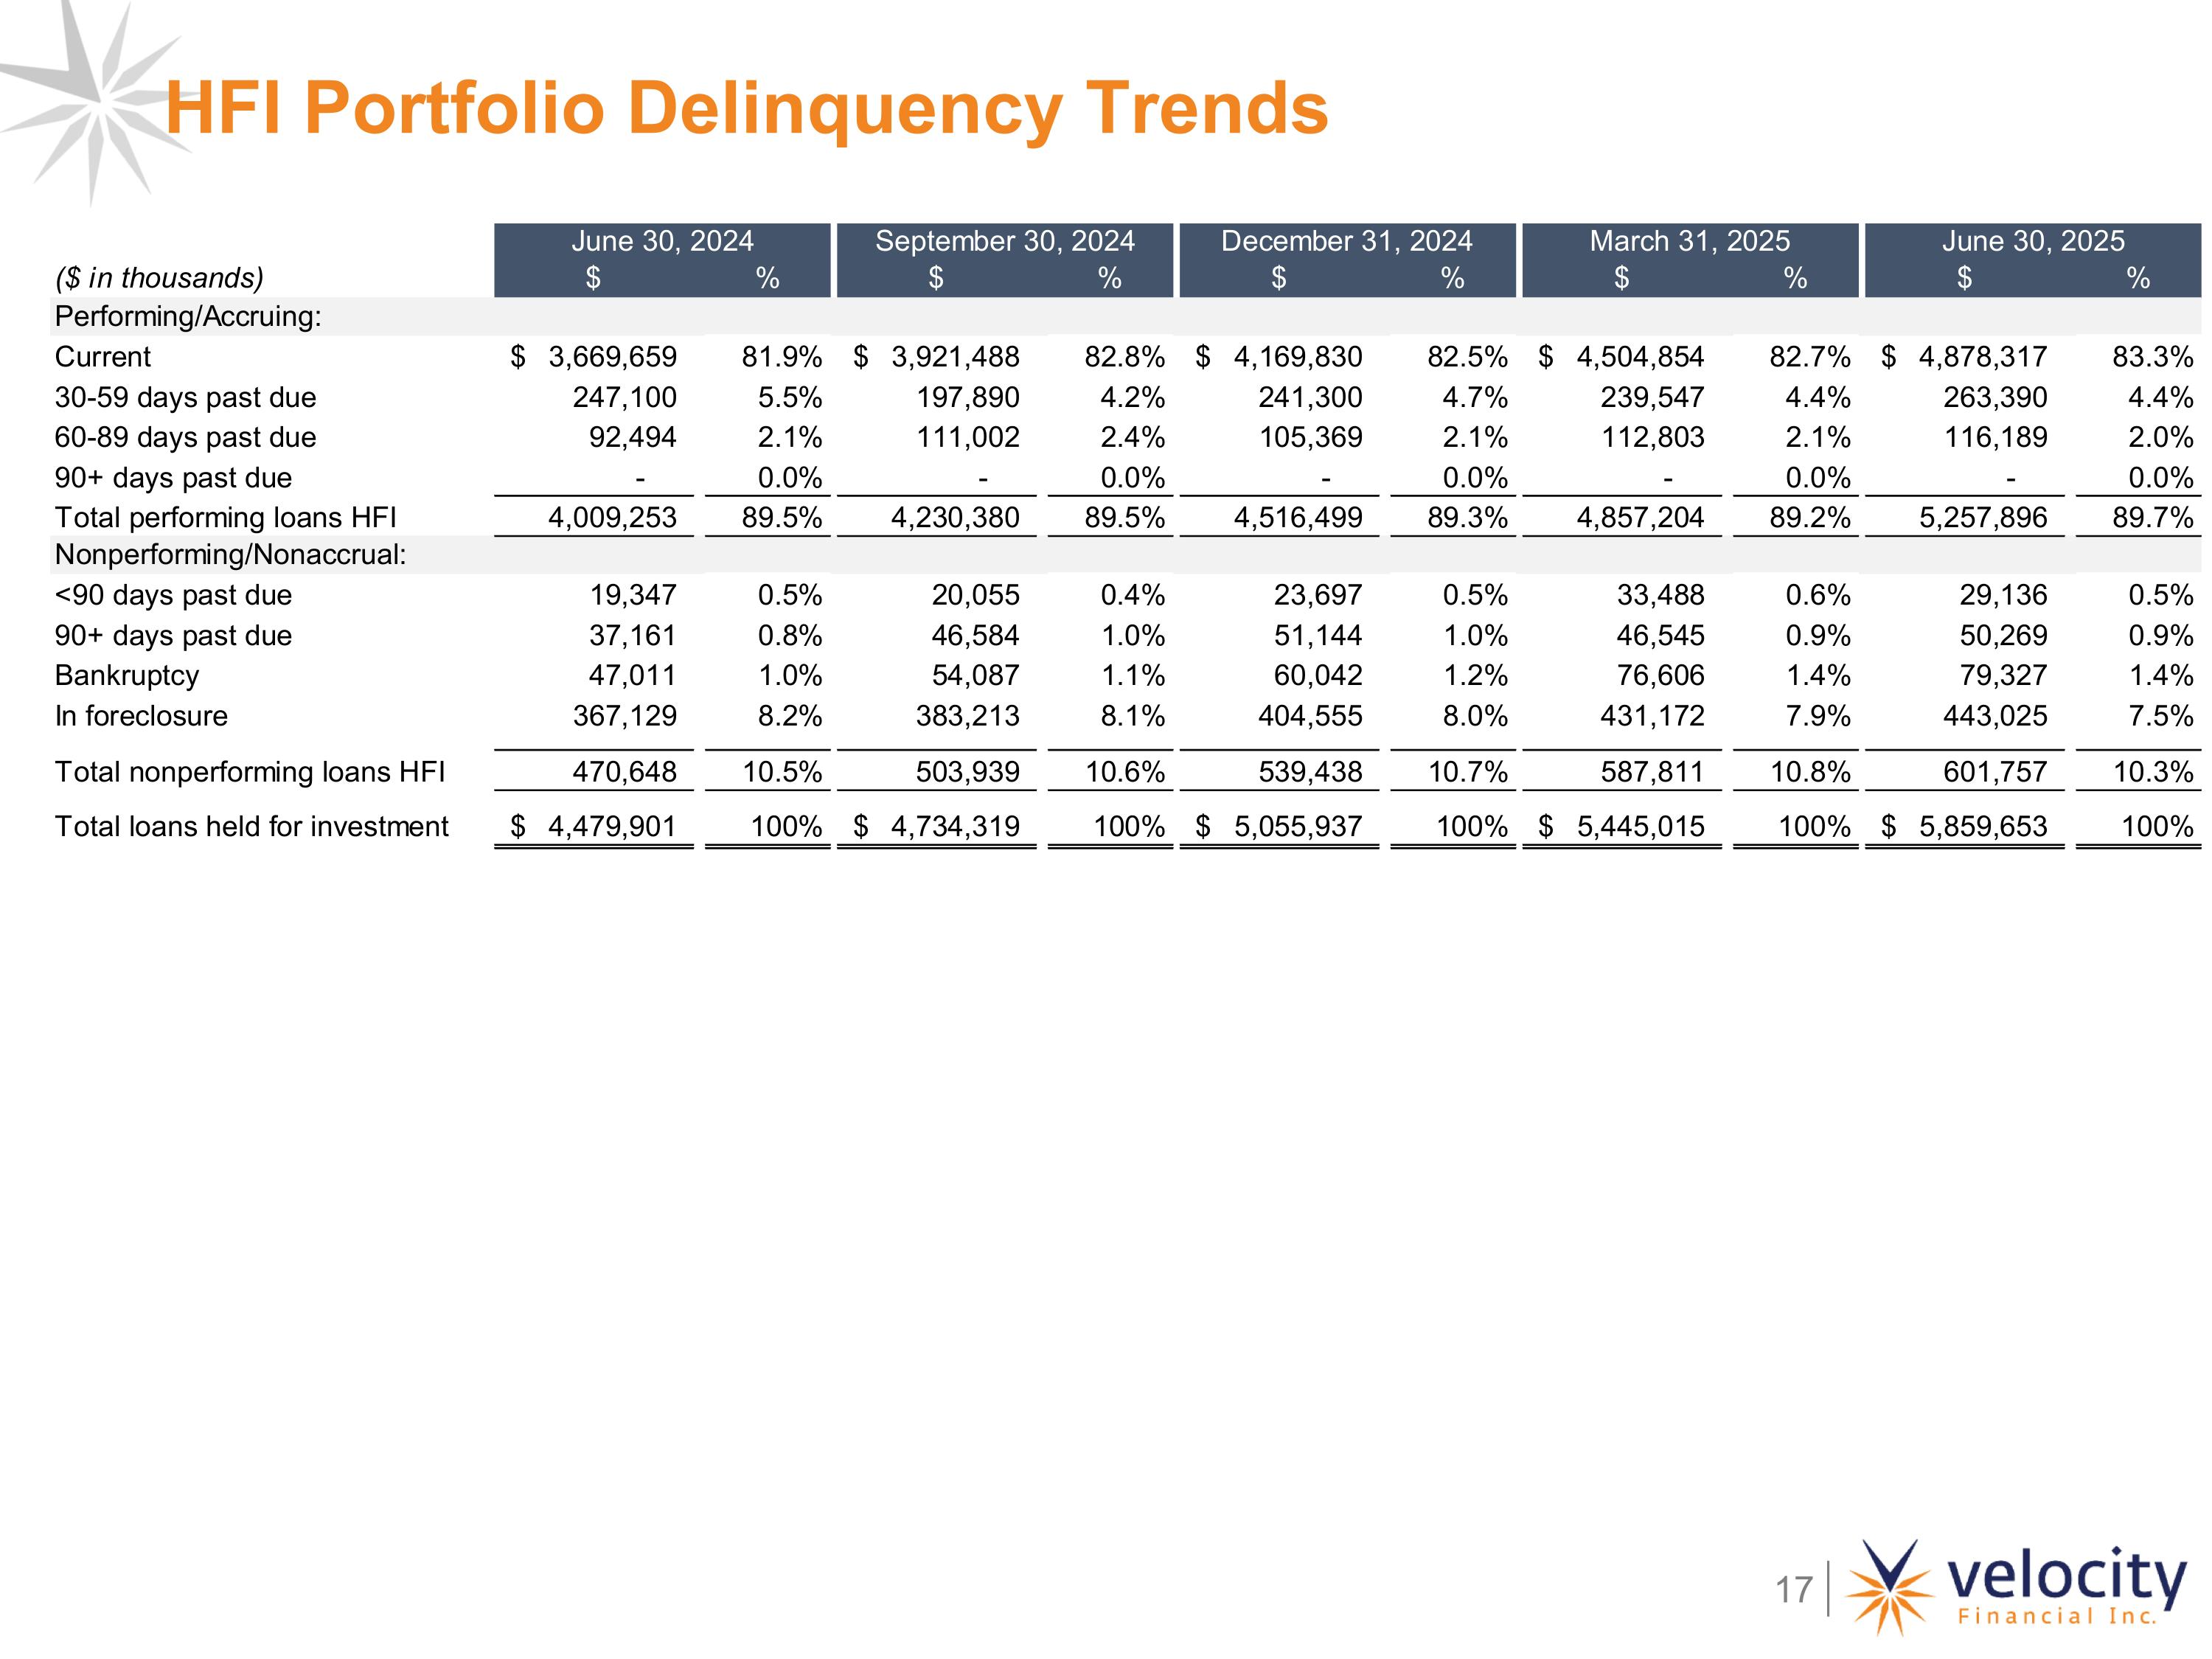
HFI Portfolio Delinquency Trends
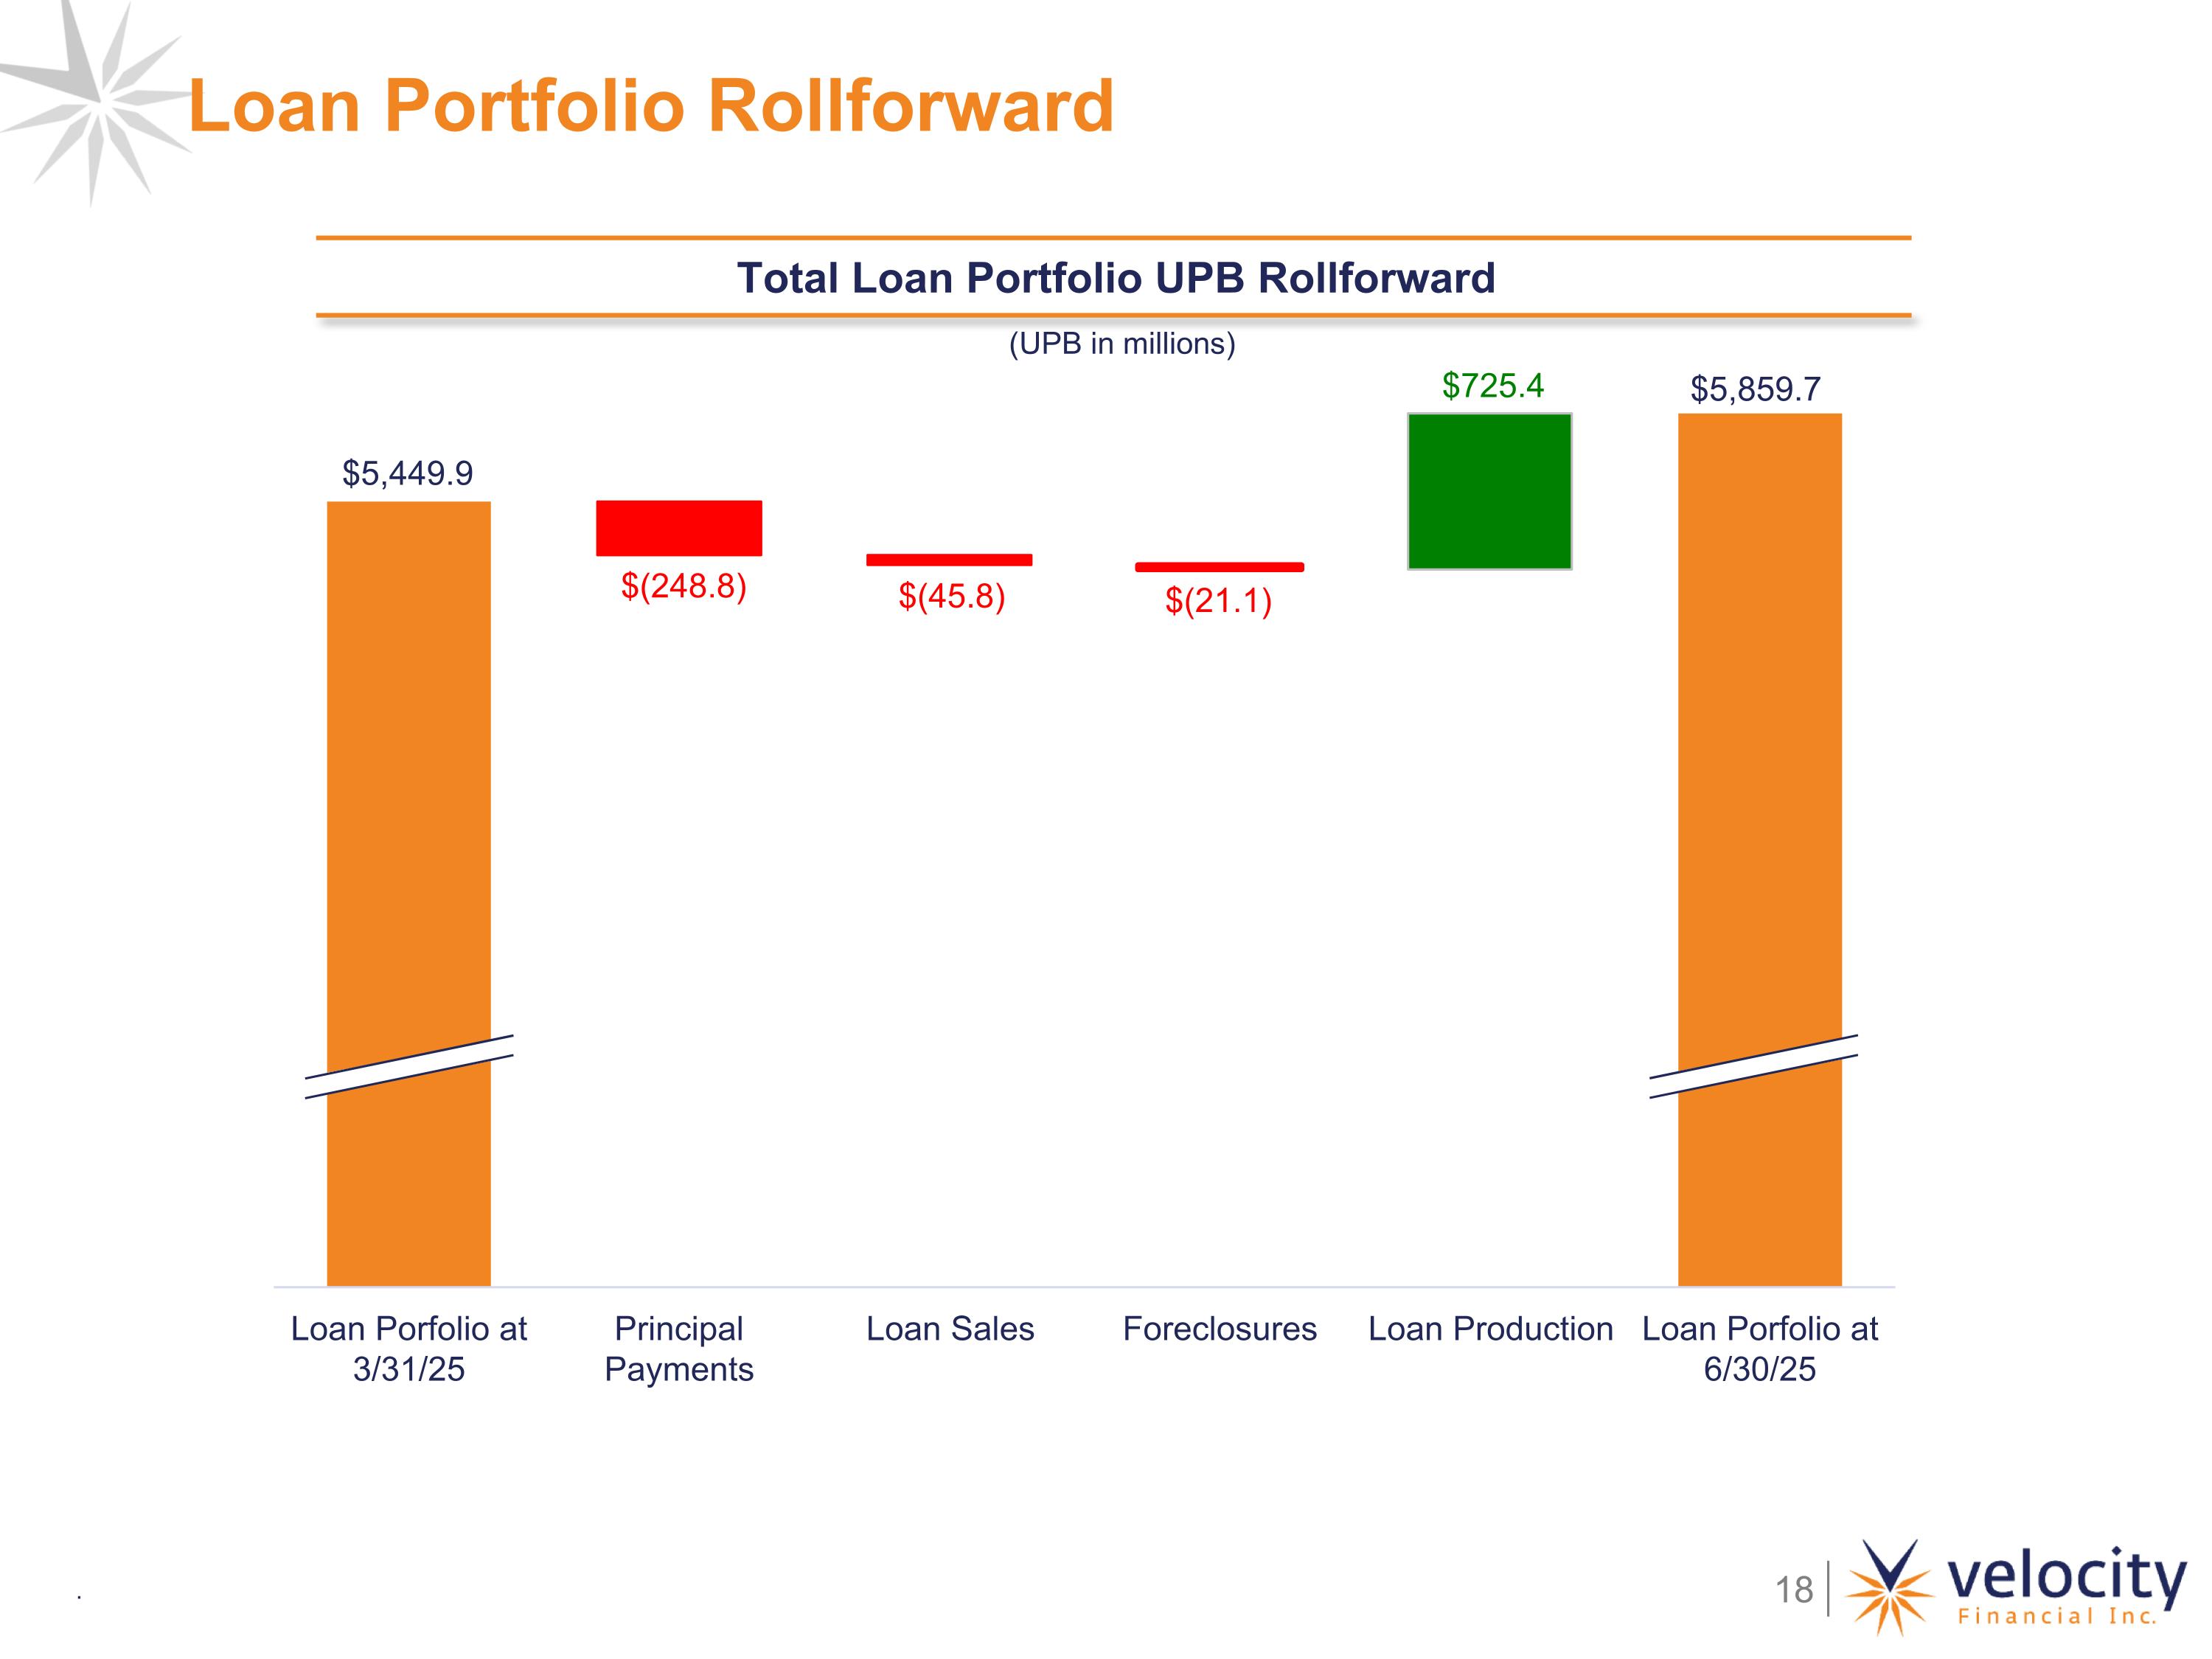
$(248.8) Loan Portfolio Rollforward Total Loan Portfolio UPB Rollforward (UPB in millions) . $(45.8) $(21.1)
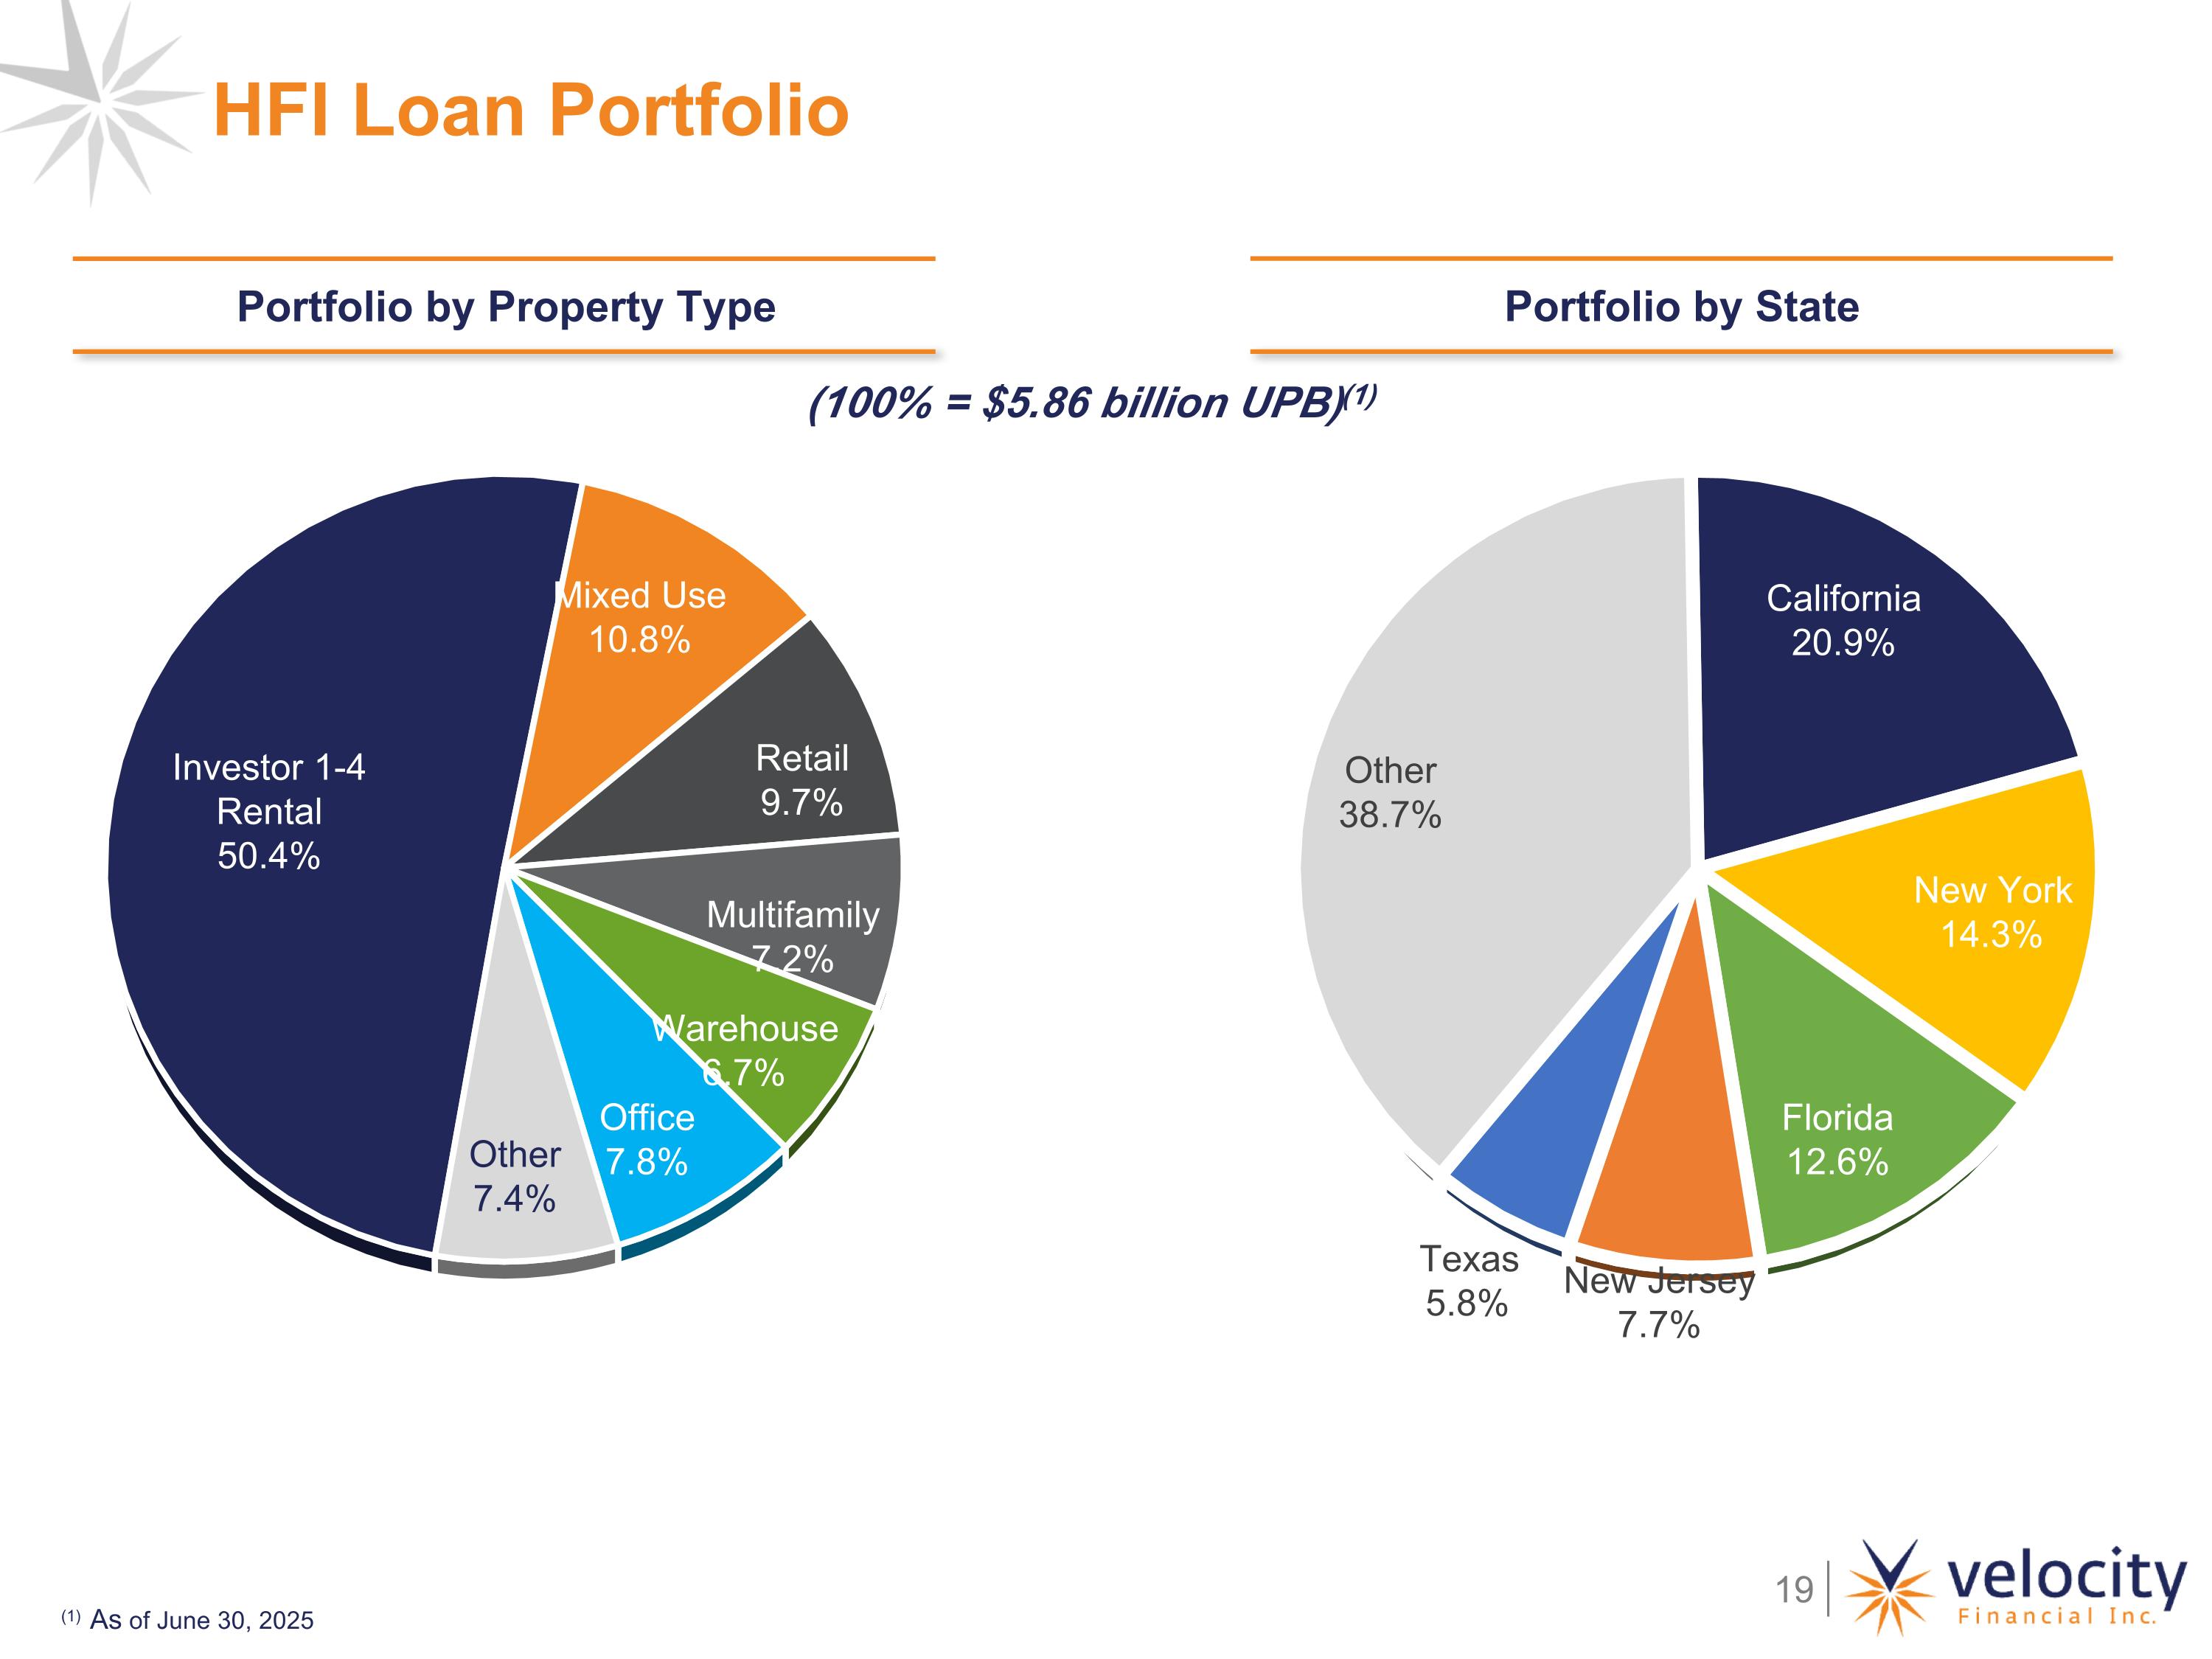
HFI Loan Portfolio Portfolio by Property Type (100% = $5.86 billion UPB)(1) (1) As of June 30, 2025 Portfolio by State
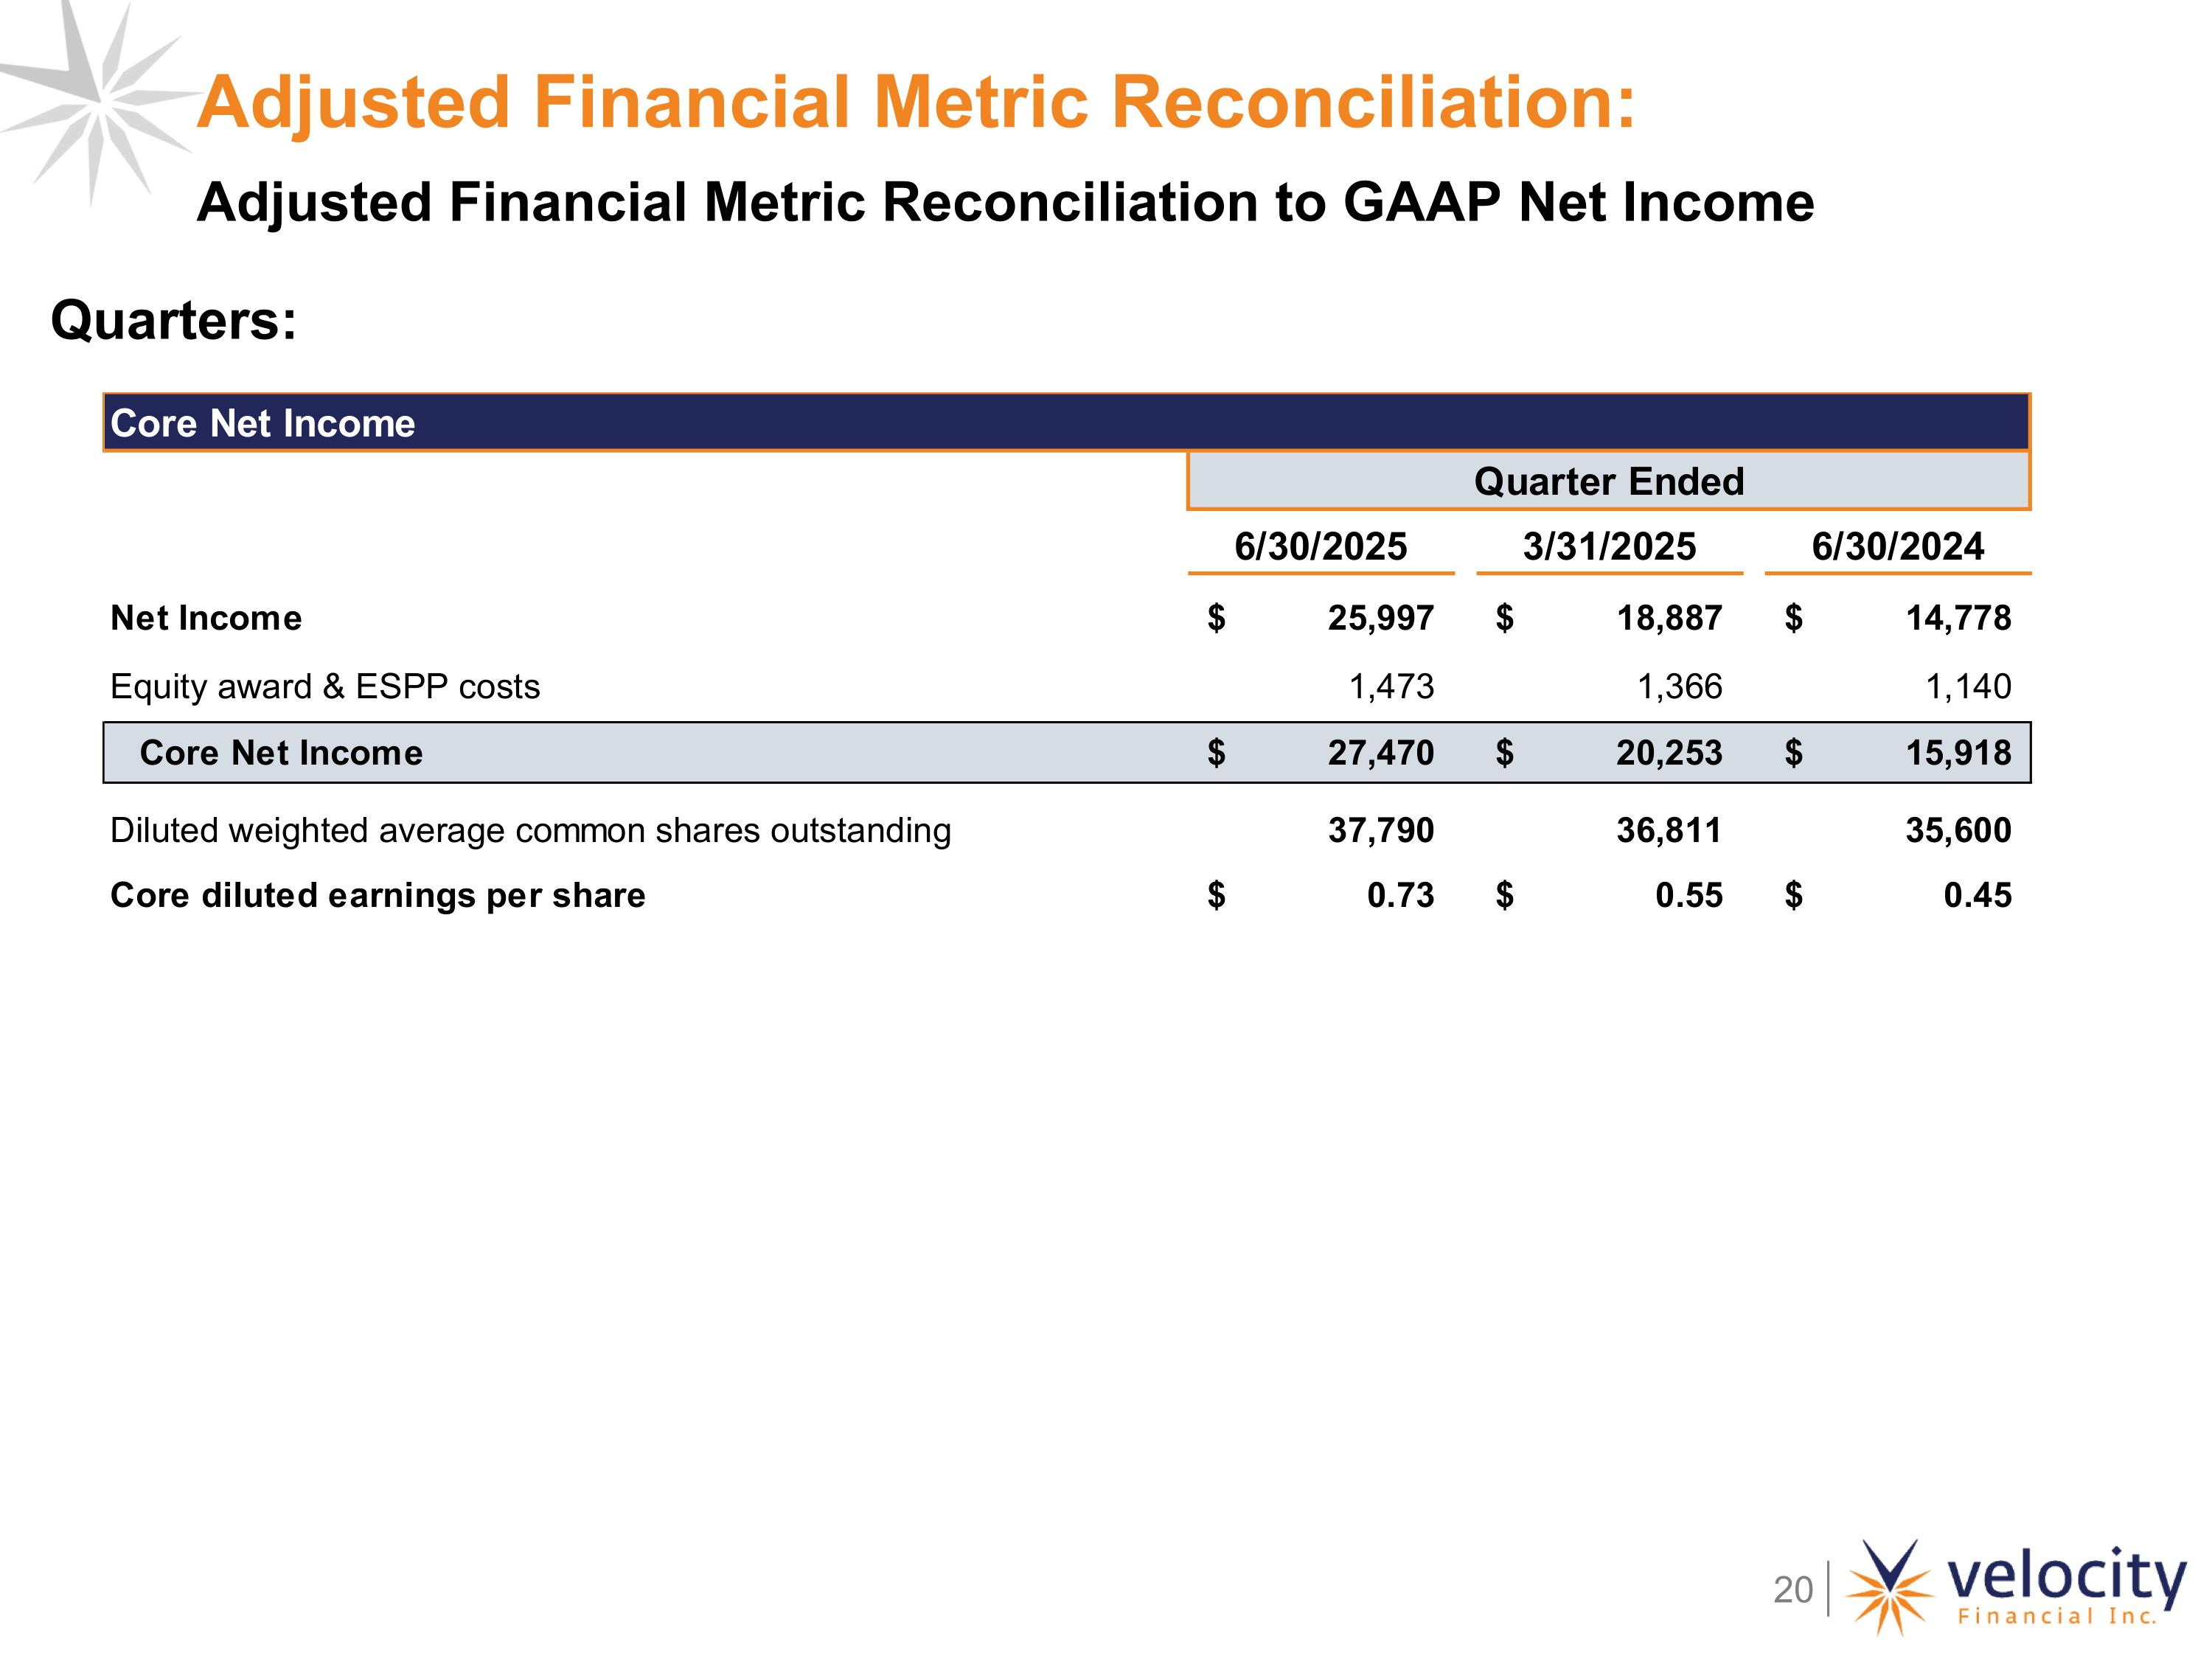
Adjusted Financial Metric Reconciliation: Adjusted Financial Metric Reconciliation to GAAP Net Income Quarters: