
Second Quar ter 2025 Earn ings Presentat ion August 12th, 2025
Disclaimer Forward-Looking Statements. This presentation contains forward-looking statements, within the meaning of the Private Securities Litigation Reform Act of 1995, which are subject to known and unknown risks, uncertainties and other important factors that may cause actual results to be materially different from the statements made herein. All statements other than statements of historical fact included in this presentation are forward-looking statements, including, but not limited to, the Company’s financial results, future financial position, expected growth of cash flows, business strategy, budgets, projected costs, projected capital expenditures, taxes, plans, objectives, potential synergies, industry trends and growth opportunities. Forward-looking statements discuss the Company’s current expectations and projections relating to its financial operations, plans, objectives, future performance and business. You can identify forward-looking statements by the fact that they do not relate strictly to historical or current facts. These statements may include words such as “aim,” “anticipate,” “believe,” “estimate,” “expect,” “forecast,” “future,” “intend,” “outlook,” “potential,” “project,” “projection,” “plan,” “seek,” “may,” “could,” “would,” “will,” “should,” “can,” “can have,” “likely,” the negatives thereof and other similar expressions. All forward- looking statements are expressly qualified in their entirety by these cautionary statements. These forward-looking statements are only predictions, not historical fact, and involve certain risks and uncertainties, as well as assumptions. While Hydrofarm believes that its assumptions are reasonable, it is very difficult to predict the impact of known factors, and, of course, it is impossible to anticipate all factors that could affect actual results. There are many risks and uncertainties that could cause actual results to differ materially from forward-looking statements made herein including, most prominently, the risks discussed under the heading “Risk Factors” in the Company’s latest annual report on Form 10-K and quarterly reports on Form 10-Q filed with the U.S. Securities and Exchange Commission (“SEC”). Such forward-looking statements are made only as of the date of this presentation. All of the Company’s SEC filings are available online at www.sec.gov. Hydrofarm undertakes no obligation to publicly update or revise any forward-looking statement because of new information, future events or otherwise, except as otherwise required by law. If we do update one or more forward- looking statements, no inference should be made that we will make additional updates with respect to those or other forward-looking statements. Projected Financial Information. This presentation also contains estimates and other statistical data made by independent parties and by us relating to market size and growth and other data about our industry. This data involves a number of assumptions and limitations, and you are cautioned not to give undue weight to such estimates. In addition, projections, assumptions, and estimates of our future performance and the future performance of the markets in which we operate are necessarily subject to a high degree of uncertainty and risk. Non-GAAP Financial Information. This presentation contains financial information determined by methods other than in accordance with accounting principles generally accepted in the United States of America (“GAAP”). Management uses these “non-GAAP” measures in its analysis of the Company’s performance. Management believes these non-GAAP financial measures allow for evaluating the Company’s ability to generate earnings and better comparability of period-to-period operating performance by excluding certain items that may vary substantially in frequency and magnitude from net loss. These disclosures should not be viewed as a substitute for operating results determined in accordance with GAAP, nor are they necessarily comparable to similarly titled non-GAAP performance measures that may be presented by other companies. A reconciliation of the non-GAAP measures used in this presentation to the most directly comparable GAAP measures is provided in the Appendix to this presentation, and in our related press release attached as an exhibit to our Current Report on Form 8-K filing available online at www.sec.gov. 2

Business Over v iew
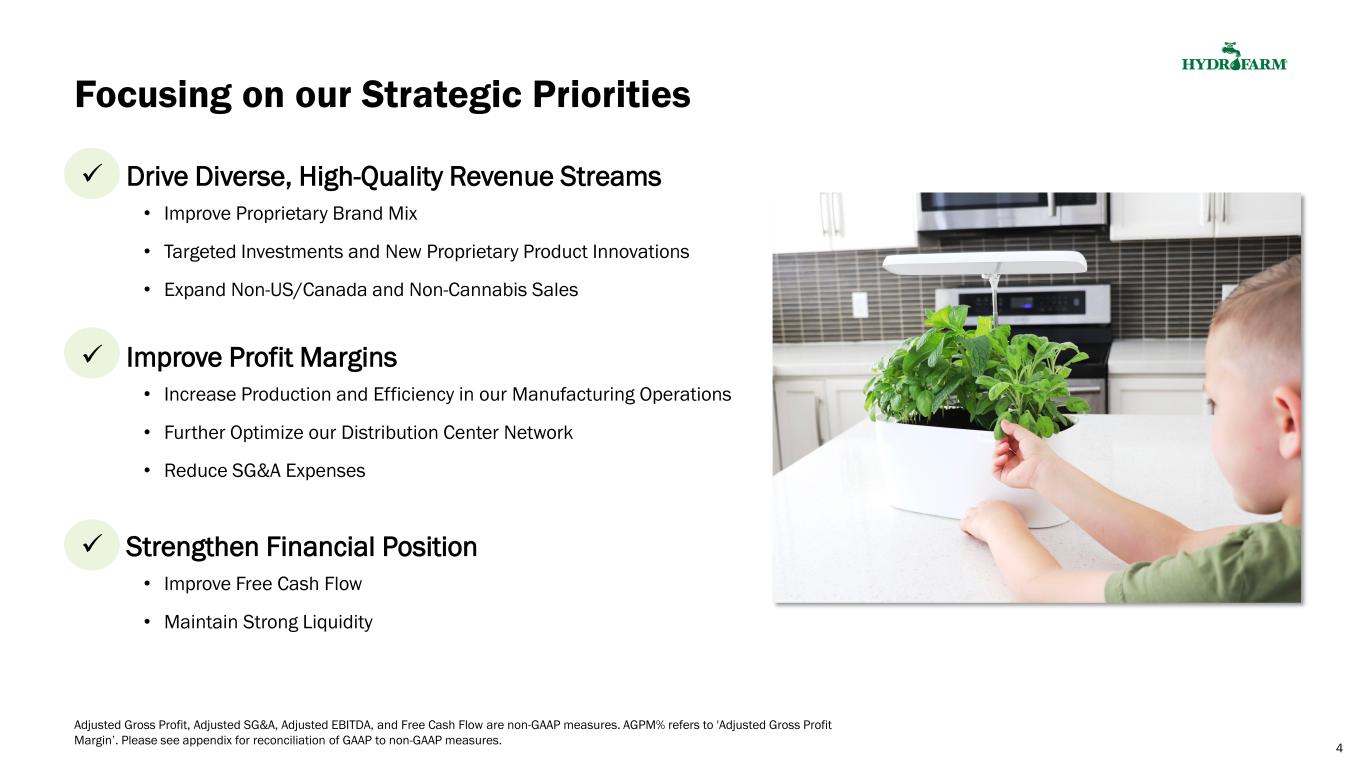
Drive Diverse, High-Quality Revenue Streams • Improve Proprietary Brand Mix • Targeted Investments and New Proprietary Product Innovations • Expand Non-US/Canada and Non-Cannabis Sales Improve Profit Margins • Increase Production and Efficiency in our Manufacturing Operations • Further Optimize our Distribution Center Network • Reduce SG&A Expenses Strengthen Financial Position • Improve Free Cash Flow • Maintain Strong Liquidity Focusing on our Strategic Priorities 4 Adjusted Gross Profit, Adjusted SG&A, Adjusted EBITDA, and Free Cash Flow are non-GAAP measures. AGPM% refers to 'Adjusted Gross Profit Margin’. Please see appendix for reconciliation of GAAP to non-GAAP measures.

Second Quarter 2025 Highlights New Restructuring Plan Initiated • Optimize our product portfolio, distribution center and manufacturing footprint • Eliminating underperforming brands to simplify our product portfolio and focus on higher-margin proprietary brands • Anticipate $3M+ estimated annual cost savings plus improvements in working capital Significant Reductions in Adjusted SG&A Expense • 12th consecutive quarter of year-over-year reductions • Additional savings expected in 2H 2025 related to new restructuring plan Meaningful Free Cash Flow Generation • Free Cash Flow $1.4 million in Q2’25 • Inventory reductions and working capital benefits Adjusted Gross Profit, Adjusted SG&A, Adjusted EBITDA, and Free Cash Flow are non-GAAP measures. AGPM% refers to 'Adjusted Gross Profit Margin’. Please see appendix for reconciliation of GAAP to non-GAAP measures. 5
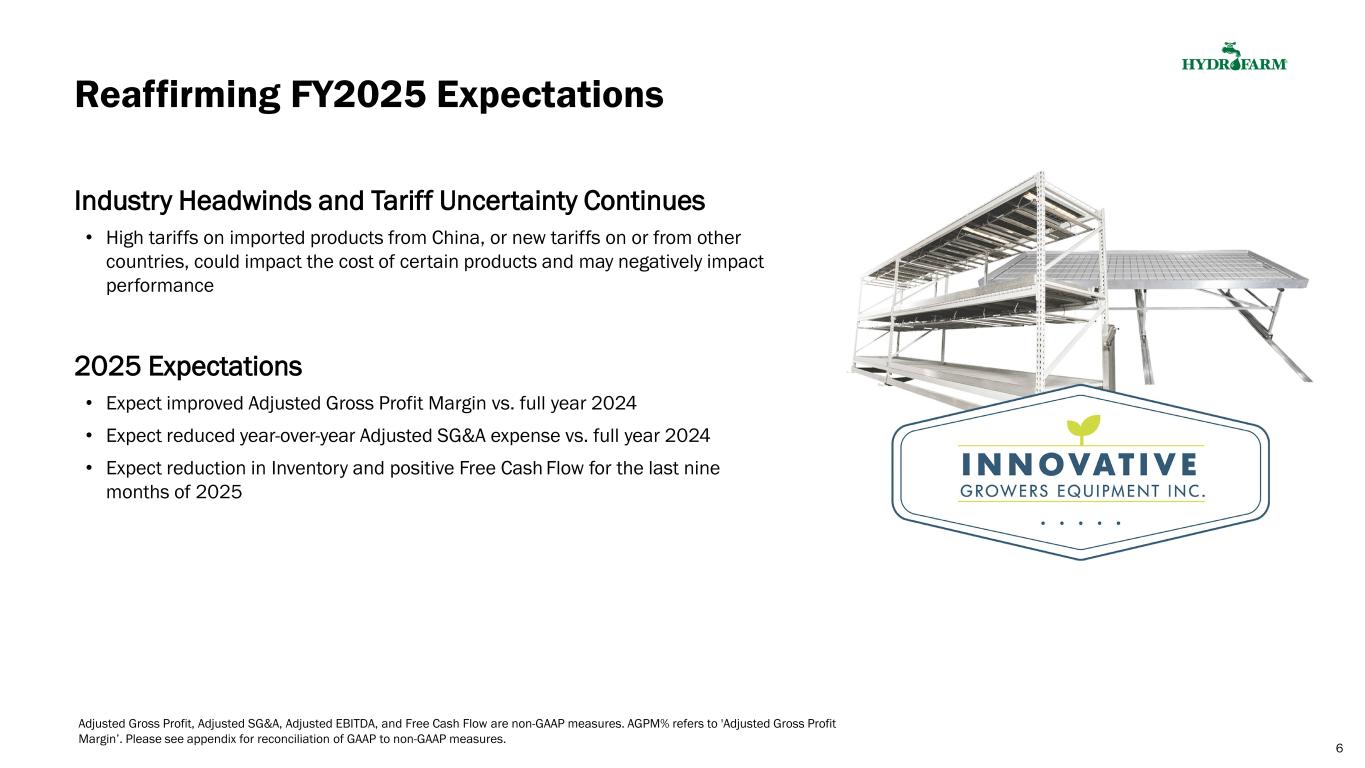
Reaffirming FY2025 Expectations Adjusted Gross Profit, Adjusted SG&A, Adjusted EBITDA, and Free Cash Flow are non-GAAP measures. AGPM% refers to 'Adjusted Gross Profit Margin’. Please see appendix for reconciliation of GAAP to non-GAAP measures. 6 Industry Headwinds and Tariff Uncertainty Continues • High tariffs on imported products from China, or new tariffs on or from other countries, could impact the cost of certain products and may negatively impact performance 2025 Expectations • Expect improved Adjusted Gross Profit Margin vs. full year 2024 • Expect reduced year-over-year Adjusted SG&A expense vs. full year 2024 • Expect reduction in Inventory and positive Free Cash Flow for the last nine months of 2025

F inanc ia l Over v iew
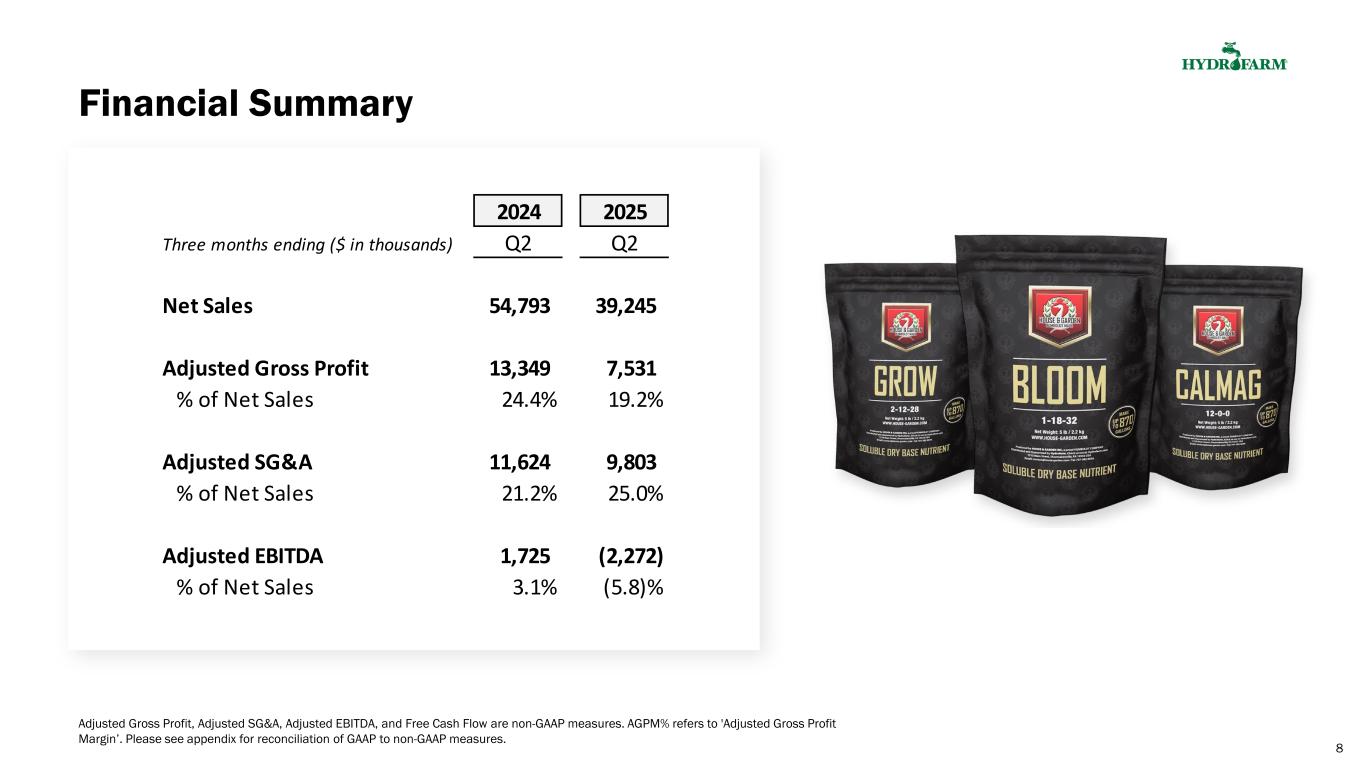
Financial Summary 8 Adjusted Gross Profit, Adjusted SG&A, Adjusted EBITDA, and Free Cash Flow are non-GAAP measures. AGPM% refers to 'Adjusted Gross Profit Margin’. Please see appendix for reconciliation of GAAP to non-GAAP measures. 2024 2025 Three months ending ($ in thousands) Q2 Q2 Net Sales 54,793 39,245 Adjusted Gross Profit 13,349 7,531 % of Net Sales 24.4% 19.2% Adjusted SG&A 11,624 9,803 % of Net Sales 21.2% 25.0% Adjusted EBITDA 1,725 (2,272) % of Net Sales 3.1% (5.8)%
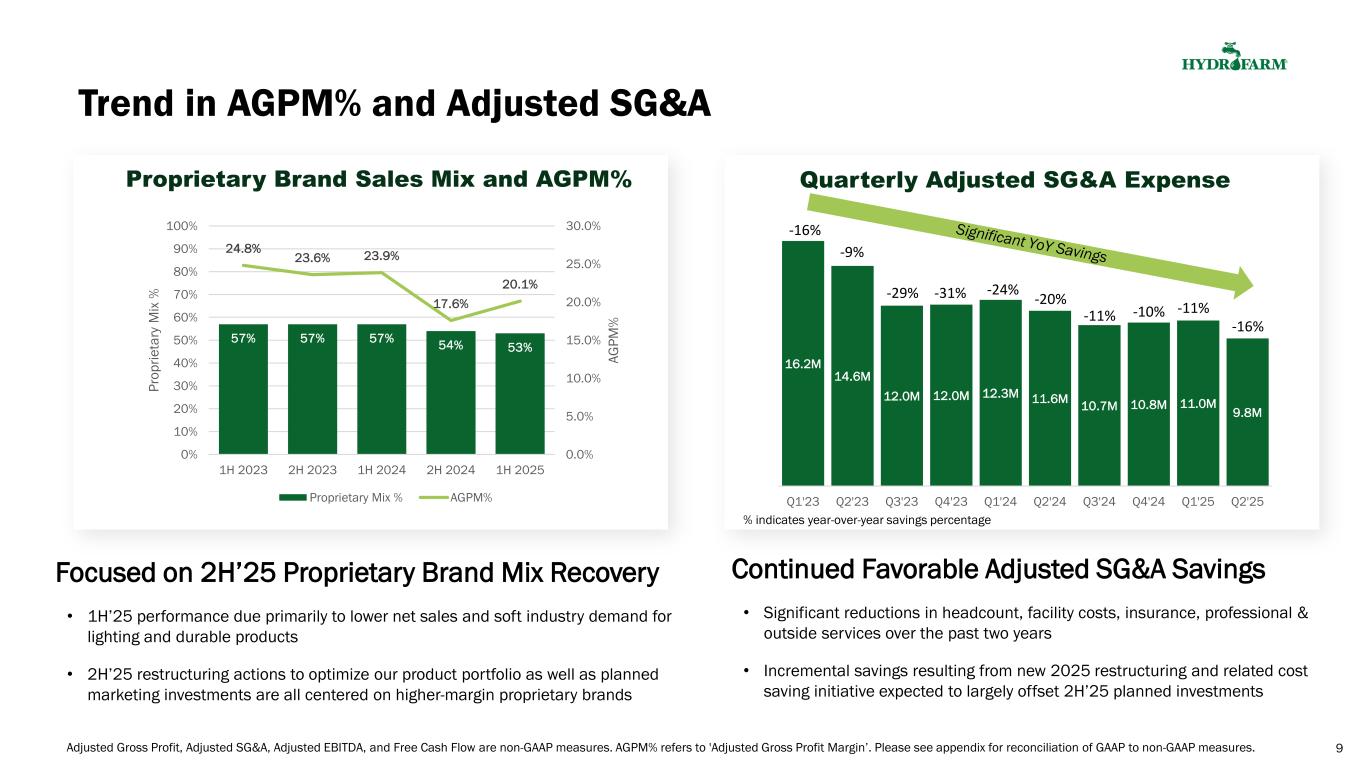
% indicates year-over-year savings percentage Quarterly Adjusted SG&A Expense Trend in AGPM% and Adjusted SG&A Focused on 2H’25 Proprietary Brand Mix Recovery • 1H’25 performance due primarily to lower net sales and soft industry demand for lighting and durable products • 2H’25 restructuring actions to optimize our product portfolio as well as planned marketing investments are all centered on higher-margin proprietary brands Continued Favorable Adjusted SG&A Savings • Significant reductions in headcount, facility costs, insurance, professional & outside services over the past two years • Incremental savings resulting from new 2025 restructuring and related cost saving initiative expected to largely offset 2H’25 planned investments 9 Proprietary Brand Sales Mix and AGPM% Adjusted Gross Profit, Adjusted SG&A, Adjusted EBITDA, and Free Cash Flow are non-GAAP measures. AGPM% refers to 'Adjusted Gross Profit Margin’. Please see appendix for reconciliation of GAAP to non-GAAP measures. 16.2M 14.6M 12.0M 12.0M 12.3M 11.6M 10.7M 10.8M 11.0M 9.8M Q1'23 Q2'23 Q3'23 Q4'23 Q1'24 Q2'24 Q3'24 Q4'24 Q1'25 Q2'25 -16% -9% -29% -31% -24% -20% -11% -10% -11% -16% 57% 57% 57% 54% 53% 24.8% 23.6% 23.9% 17.6% 20.1% 0.0% 5.0% 10.0% 15.0% 20.0% 25.0% 30.0% 0% 10% 20% 30% 40% 50% 60% 70% 80% 90% 100% 1H 2023 2H 2023 1H 2024 2H 2024 1H 2025 AG PM % Pr op rie ta ry M ix % Proprietary Mix % AGPM%

Cash and Liquidity ‘Liquidity’ is defined as Cash plus Available Borrowing Capacity on our Revolving Credit Facility. 'Total Debt' is defined as Term Loan debt principal outstanding plus finance leases and other debt. Net Debt, Liquidity and Free Cash Flow are non-GAAP measures. Please see appendix for reconciliation of GAAP to non-GAAP measures. Cash $11.0 Liquidity $20.0 Total Debt $122.6 Net Debt $111.6 Net Cash from Operations $1.7 Capital Expenditures $(0.3) Free Cash Flow $1.4 10 Balance Sheet Highlights as of June 30, 2025 Cash Flow Highlights 3 months ended June 30, 2025 USD millions USD millions
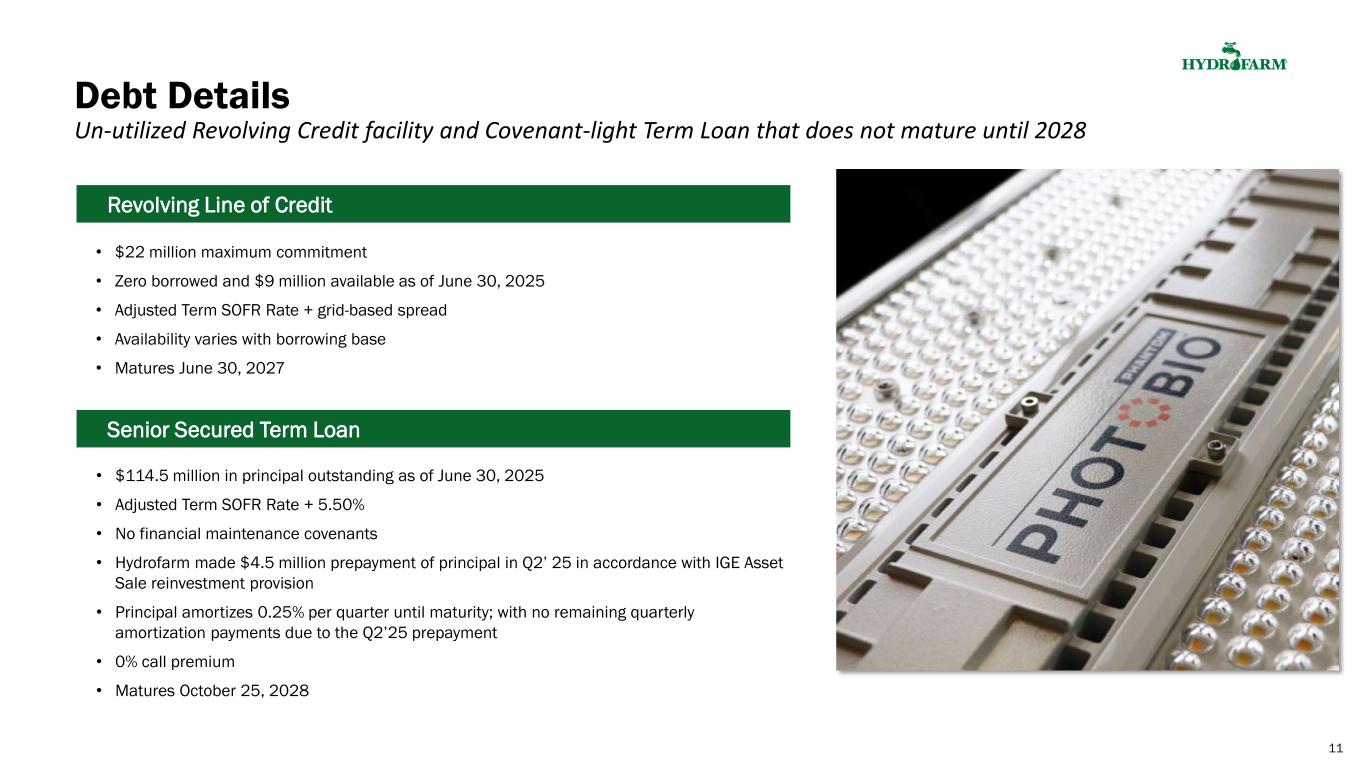
• $22 million maximum commitment • Zero borrowed and $9 million available as of June 30, 2025 • Adjusted Term SOFR Rate + grid-based spread • Availability varies with borrowing base • Matures June 30, 2027 • $114.5 million in principal outstanding as of June 30, 2025 • Adjusted Term SOFR Rate + 5.50% • No financial maintenance covenants • Hydrofarm made $4.5 million prepayment of principal in Q2’ 25 in accordance with IGE Asset Sale reinvestment provision • Principal amortizes 0.25% per quarter until maturity; with no remaining quarterly amortization payments due to the Q2’25 prepayment • 0% call premium • Matures October 25, 2028 11 Debt Details Un-utilized Revolving Credit facility and Covenant-light Term Loan that does not mature until 2028 Revolving Line of Credit Senior Secured Term Loan
Appendix
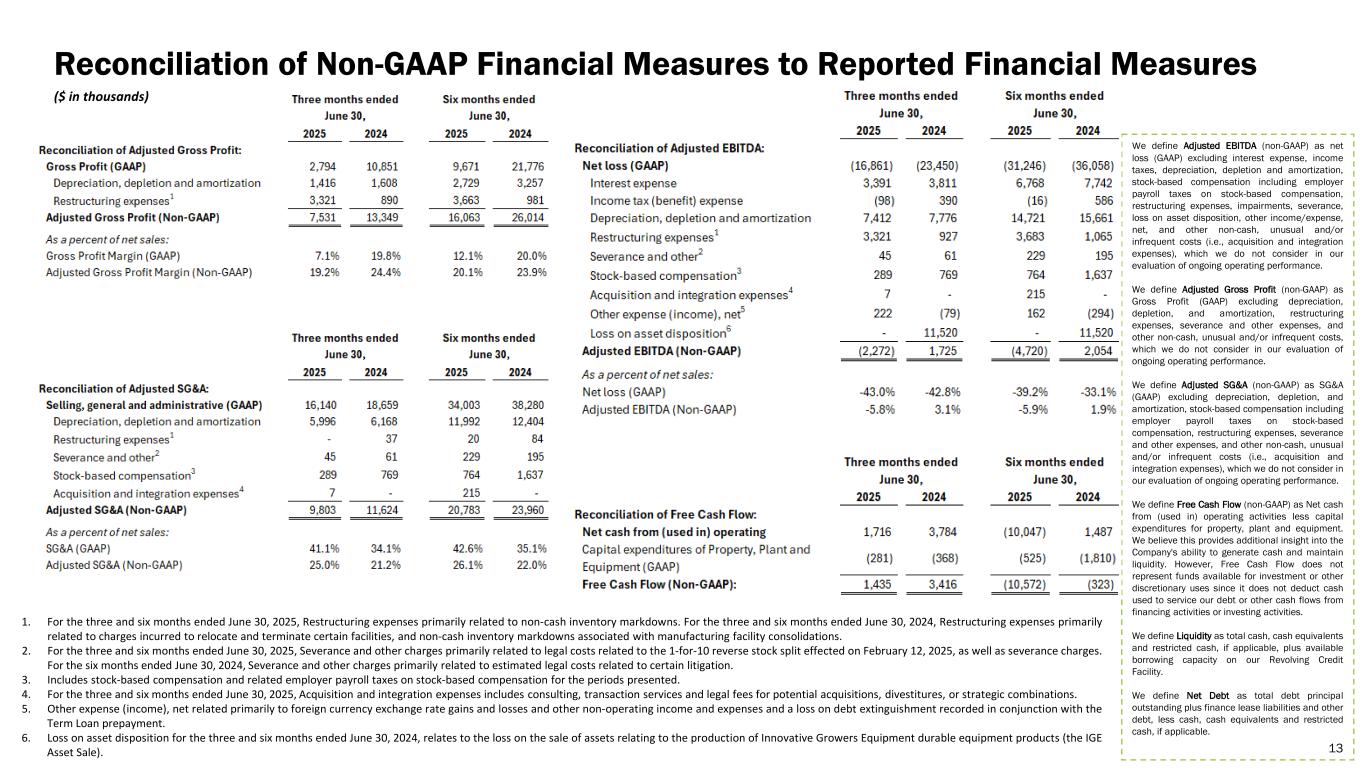
Reconciliation of Non-GAAP Financial Measures to Reported Financial Measures ($ in thousands) We define Adjusted EBITDA (non-GAAP) as net loss (GAAP) excluding interest expense, income taxes, depreciation, depletion and amortization, stock-based compensation including employer payroll taxes on stock-based compensation, restructuring expenses, impairments, severance, loss on asset disposition, other income/expense, net, and other non-cash, unusual and/or infrequent costs (i.e., acquisition and integration expenses), which we do not consider in our evaluation of ongoing operating performance. We define Adjusted Gross Profit (non-GAAP) as Gross Profit (GAAP) excluding depreciation, depletion, and amortization, restructuring expenses, severance and other expenses, and other non-cash, unusual and/or infrequent costs, which we do not consider in our evaluation of ongoing operating performance. We define Adjusted SG&A (non-GAAP) as SG&A (GAAP) excluding depreciation, depletion, and amortization, stock-based compensation including employer payroll taxes on stock-based compensation, restructuring expenses, severance and other expenses, and other non-cash, unusual and/or infrequent costs (i.e., acquisition and integration expenses), which we do not consider in our evaluation of ongoing operating performance. We define Free Cash Flow (non-GAAP) as Net cash from (used in) operating activities less capital expenditures for property, plant and equipment. We believe this provides additional insight into the Company's ability to generate cash and maintain liquidity. However, Free Cash Flow does not represent funds available for investment or other discretionary uses since it does not deduct cash used to service our debt or other cash flows from financing activities or investing activities. We define Liquidity as total cash, cash equivalents and restricted cash, if applicable, plus available borrowing capacity on our Revolving Credit Facility. We define Net Debt as total debt principal outstanding plus finance lease liabilities and other debt, less cash, cash equivalents and restricted cash, if applicable. 1. For the three and six months ended June 30, 2025, Restructuring expenses primarily related to non-cash inventory markdowns. For the three and six months ended June 30, 2024, Restructuring expenses primarily related to charges incurred to relocate and terminate certain facilities, and non-cash inventory markdowns associated with manufacturing facility consolidations. 2. For the three and six months ended June 30, 2025, Severance and other charges primarily related to legal costs related to the 1-for-10 reverse stock split effected on February 12, 2025, as well as severance charges. For the six months ended June 30, 2024, Severance and other charges primarily related to estimated legal costs related to certain litigation. 3. Includes stock-based compensation and related employer payroll taxes on stock-based compensation for the periods presented. 4. For the three and six months ended June 30, 2025, Acquisition and integration expenses includes consulting, transaction services and legal fees for potential acquisitions, divestitures, or strategic combinations. 5. Other expense (income), net related primarily to foreign currency exchange rate gains and losses and other non-operating income and expenses and a loss on debt extinguishment recorded in conjunction with the Term Loan prepayment. 6. Loss on asset disposition for the three and six months ended June 30, 2024, relates to the loss on the sale of assets relating to the production of Innovative Growers Equipment durable equipment products (the IGE Asset Sale). 13