Leading a new era of innovation in immunology 3Q 2026 Financial Results Call | October 22,2026
Forward Looking Statements This presentation has been prepared by argenx se (“argenx” or the “company”) for informational purposes only and not for any other purpose. Nothing contained in this presentation is, or should be construed as, a recommendation, promise or representation by the presenter or the company or any director, employee, agent, or adviser of the company. This presentation does not purport to be all-inclusive or to contain all of the information you may desire. Certain information contained in this presentation relates to or is based on studies, publications, surveys and other data obtained from third-party sources and the company’s own internal estimates and research. While argenx believes these third-party studies, publications, surveys and other data to be reliable as of the date of this presentation, it has not independently verified, and makes no representation as to the adequacy, fairness, accuracy or completeness of, any information obtained from third-party sources. In addition, no independent source has evaluated the reasonableness or accuracy of argenx’s internal estimates or research, and no reliance should be made on any information or statements made in this presentation relating to or based on such internal estimates and research. The contents of this presentation include statements that are, or may be deemed to be, “forward-looking statements.” These forward-looking statements generally can be identified by the use of forward-looking words, such as “believe”, “can”, “could”, “estimate”, “expect”, “future”, “goals”, “if approved”, “likely”, “may, “opportunity”, “potential”, “pursue”, “predict”, “should”, “target”, and other words and terms of similar meaning and expression, including in connection with any discussion of future operating or financial performance. By their nature, forward-looking statements involve risks and uncertainties and readers are cautioned that any such forward-looking statements are not guarantees of future performance. argenx’s actual results may differ materially from those predicted by the forward-looking statements as a result of various important factors, including but not limited to, the timing and results of argenx’s clinical trials; uncertainties associated with the development of novel drug therapies; preclinical and clinical trial and product development risks and setbacks; interpretation of argenx’s clinical trial data by regulatory authorities and argenx’s ability to obtain regulatory approval; argenx’s estimates of the number of patients who suffer from the diseases it is targeting; the risk that early stage clinical trials may not be predictive of results in later stage or large scale clinical trials; the occurrence of adverse safety events or participant dropouts; the acceptance of its products and product candidates by its patients as safe, effective, and cost-effective; argenx’s ability to build deep partnerships with patients and physicians; the impact of governmental laws and regulations, including tariffs, export controls, sanctions and other regulations on its business; the impact of healthcare regulations, including rules on reimbursement for argenx’s products; argenx’s estimates regarding expenses and operating margin; the acquisition of Forte Biosciences Inc., including argenx’s ability to integrate the acquired business and realize its anticipated benefits; competition in drug discovery, development and commercialization efforts; argenx’s growth strategy to develop and market additional products and product candidates including but not limited to, efgartigimod for new indications, empasiprubart, adimanebart, and FB102; its reliance on third-party suppliers, service providers and manufacturers; and instability and conflicts in the regions in which the company has suppliers or markets for its products. A further list and description of these and other risks, uncertainties, and factors that could cause actual results to differ materially from those referred to in the forward-looking statements can be found in argenx’s U.S. Securities and Exchange Commission (SEC) filings and reports, including in argenx’s most recent annual report on Form 20-F filed with the SEC as well as subsequent filings and reports filed by argenx with the SEC. Given these risks and uncertainties, the reader is advised not to place undue reliance on such forward-looking statements. These forward-looking statements speak only as of the date of publication of this presentation. argenx undertakes no obligation to publicly update or revise the information in this presentation, including any forward-looking statements, except as may be required by law. This presentation contains trademarks, trade names and service marks of other companies, which are the property of their respective owners. 2
Connecting science and patients to unlock infinite opportunity Science Patients 3
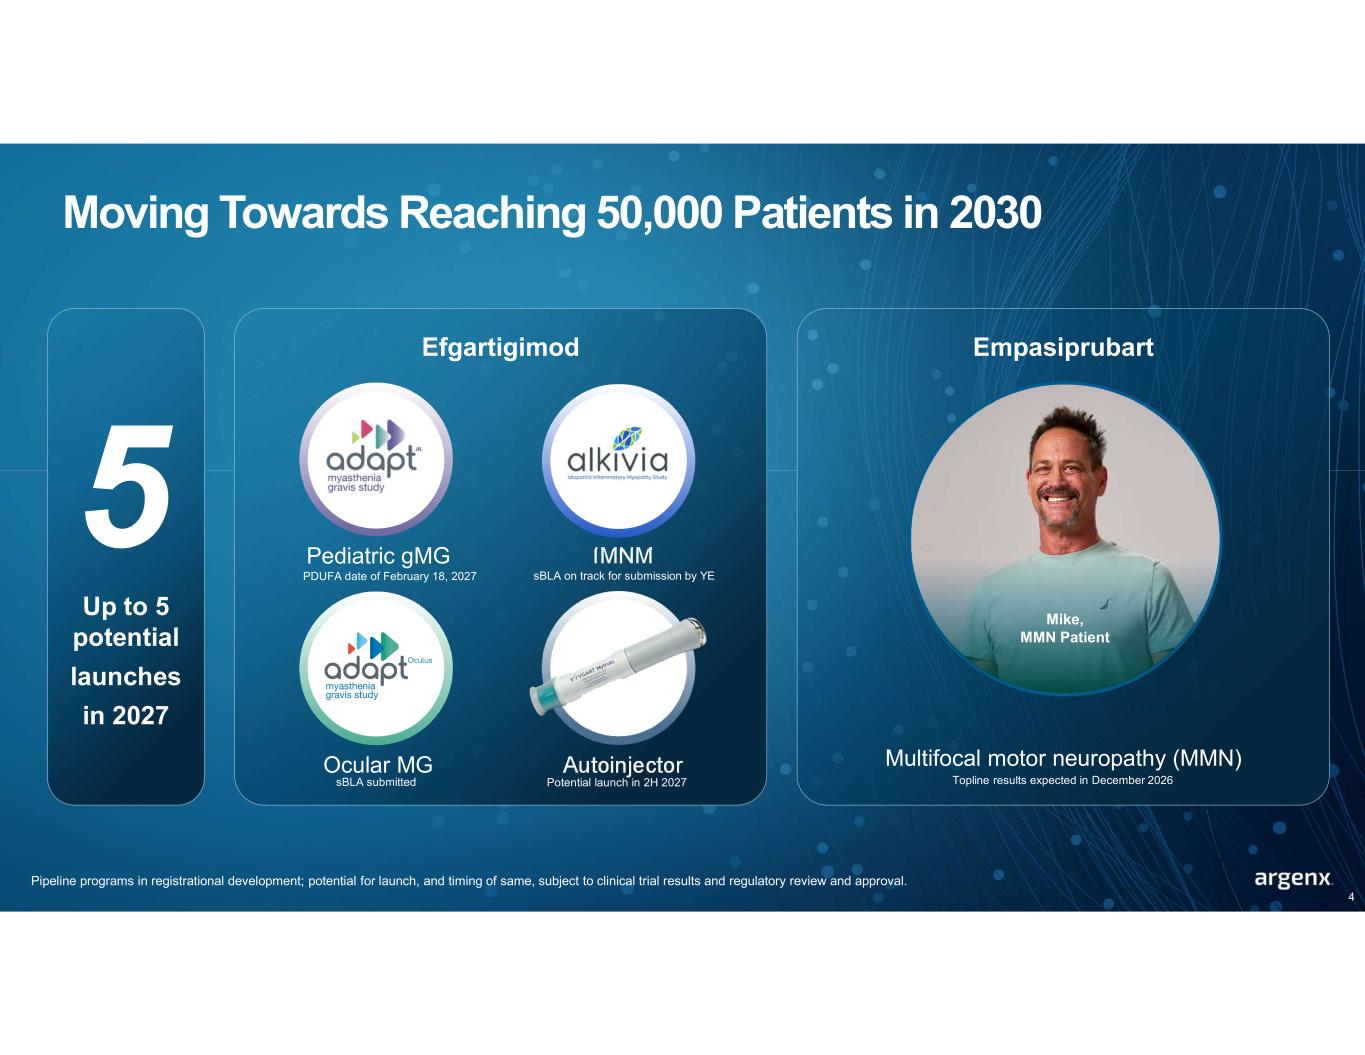
Moving Towards Reaching 50,000 Patients in 2030 Up to 5 potential launches in 2027 Pipeline programs in registrational development; potential for launch, and timing of same, subject to clinical trial results and regulatory review and approval. 4 Efgartigimod Pediatric gMG IMNM Ocular MG Autoinjector PDUFA date of February 18, 2027 sBLA on track for submission by YE sBLA submitted Potential launch in 2H 2027 Empasiprubart Multifocal motor neuropathy (MMN) Mike, MMN Patient Topline results expected in December 2026
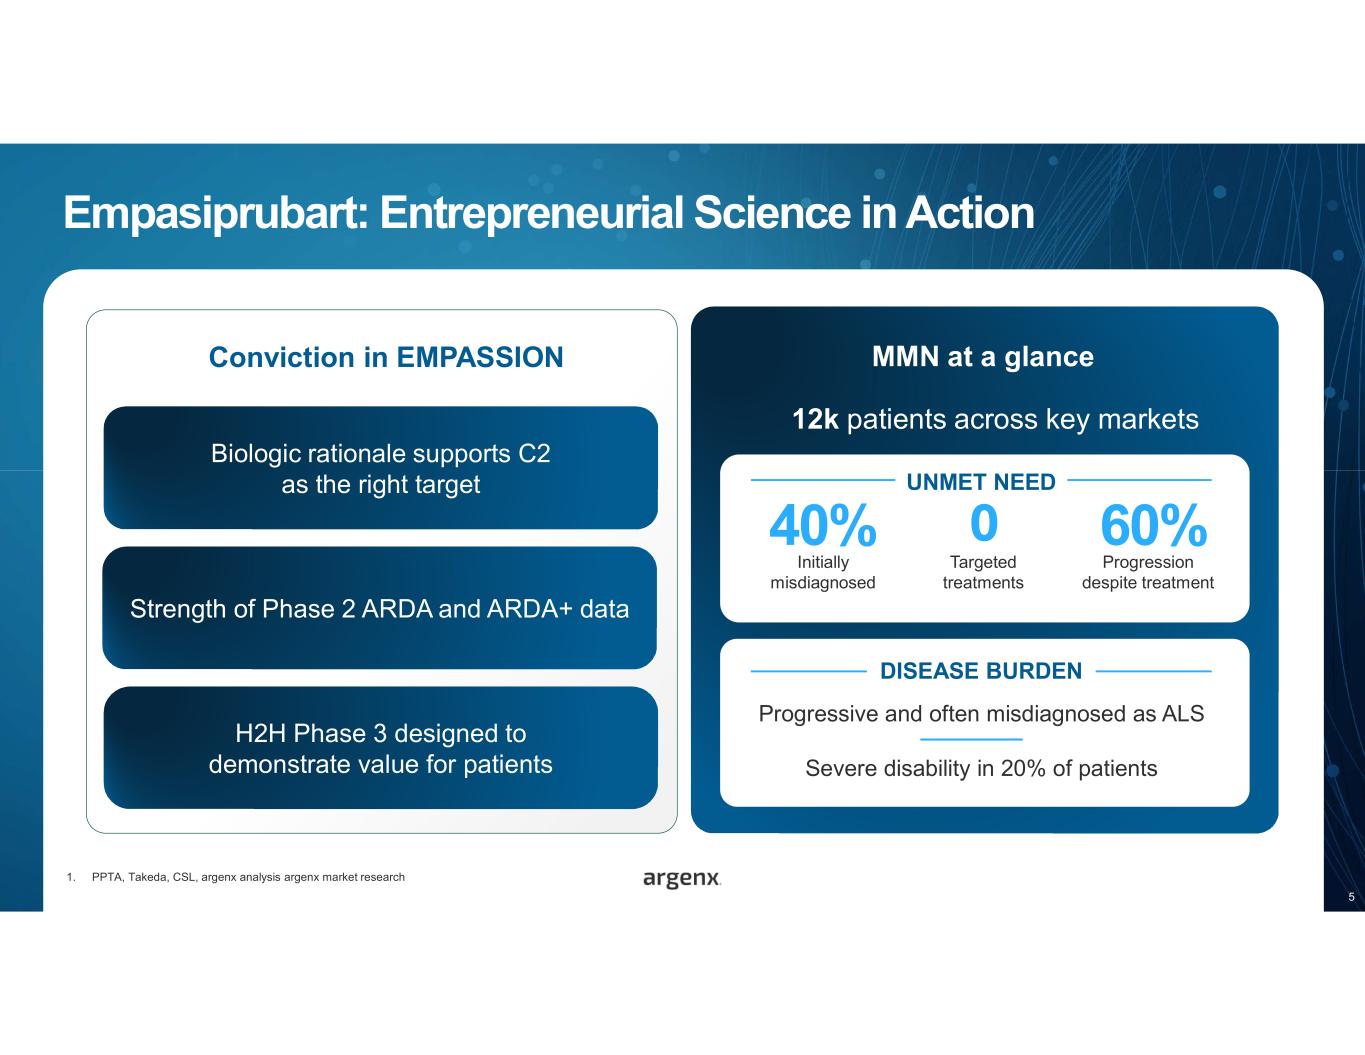
Empasiprubart: Entrepreneurial Science in Action 12k patients across key markets 1. PPTA, Takeda, CSL, argenx analysis argenx market research 60% Progression despite treatment 40% Initially misdiagnosed Targeted treatments 0 UNMET NEED Progressive and often misdiagnosed as ALS Severe disability in 20% of patients DISEASE BURDEN Conviction in EMPASSION Biologic rationale supports C2 as the right target Strength of Phase 2 ARDA and ARDA+ data MMN at a glance 5 H2H Phase 3 designed to demonstrate value for patients
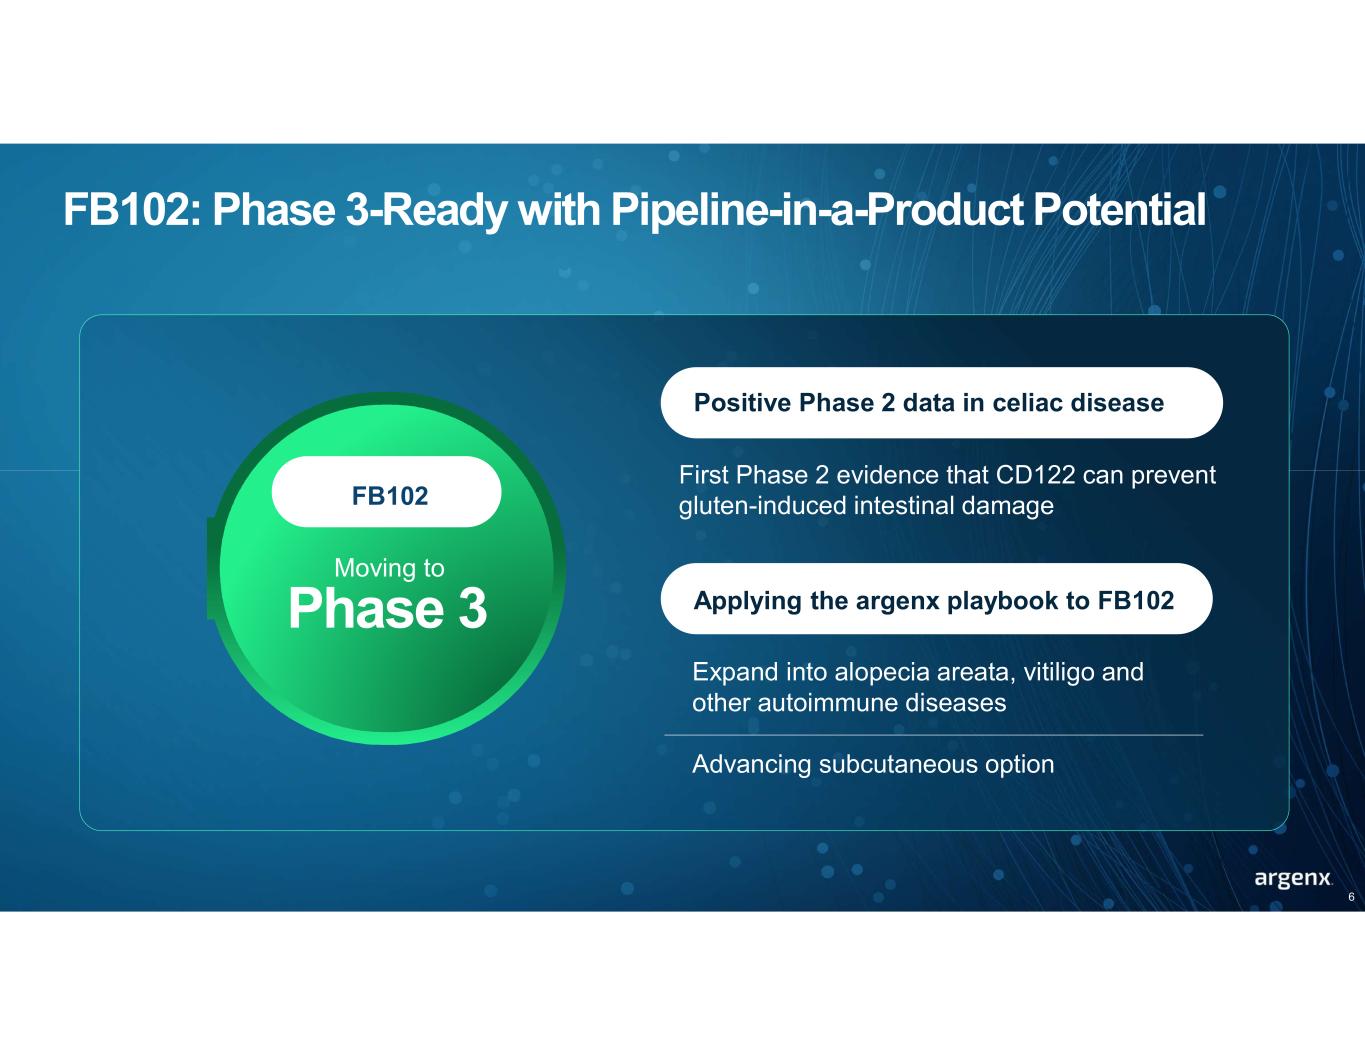
FB102: Phase 3-Ready with Pipeline-in-a-Product Potential Phase 3 Moving to 6 Expand into alopecia areata, vitiligo and other autoimmune diseases Advancing subcutaneous option Positive Phase 2 data in celiac disease Applying the argenx playbook to FB102 First Phase 2 evidence that CD122 can prevent gluten-induced intestinal damageFB102
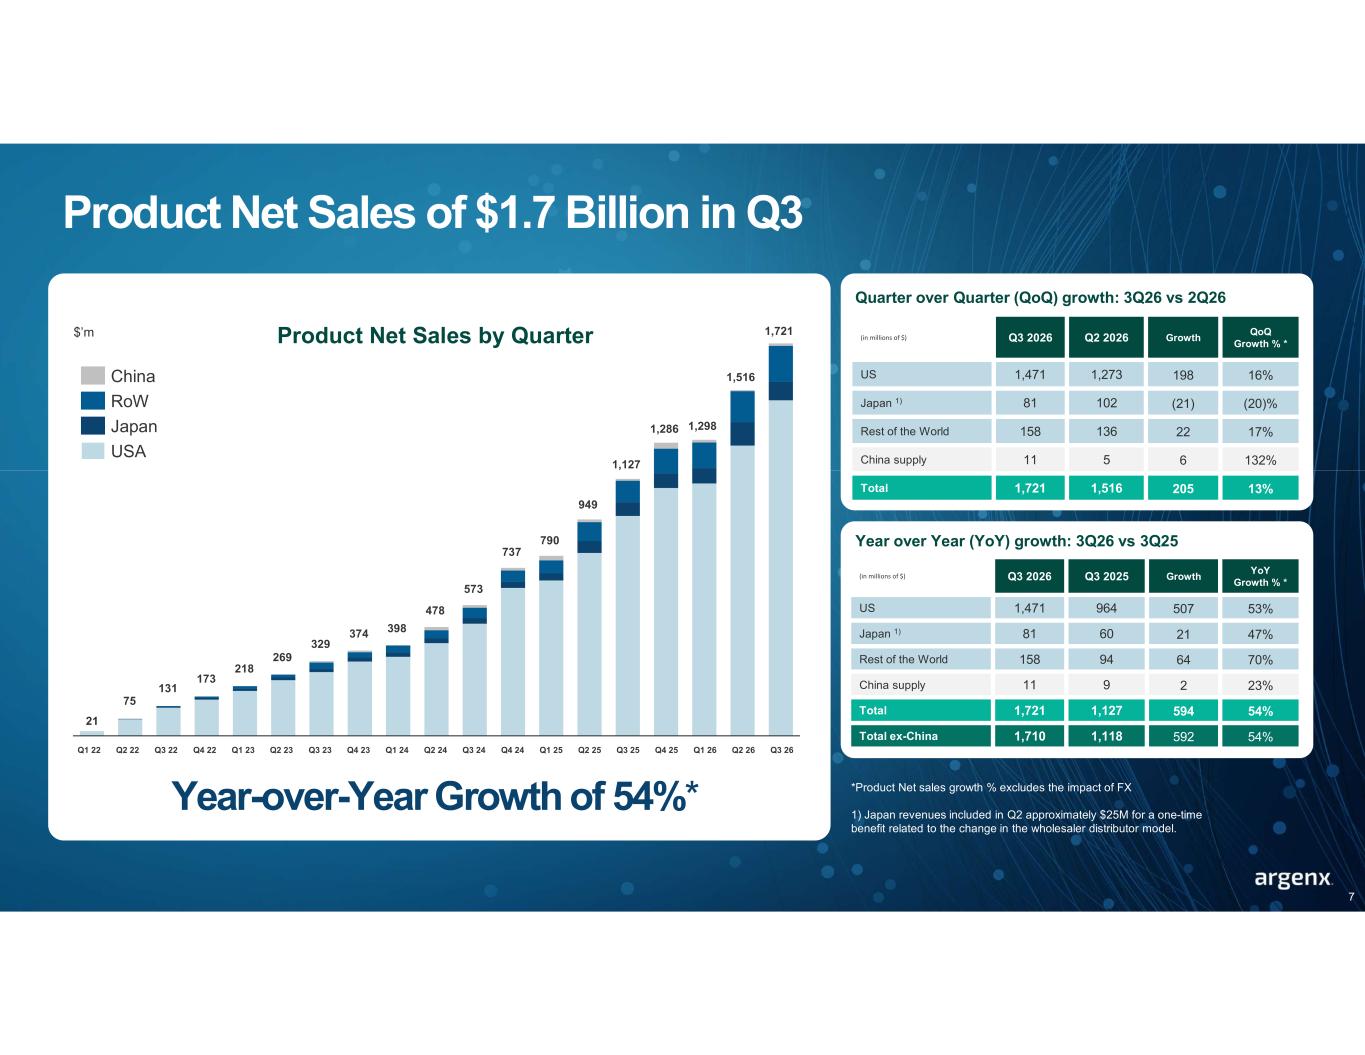
Year-over-Year Growth of 54%* Product Net Sales of $1.7 Billion in Q3 Year over Year (YoY) growth: 3Q26 vs 3Q25 YoY Growth % * GrowthQ3 2025Q3 2026(in millions of $) 53%5079641,471US 47%216081Japan 1) 70%6494158Rest of the World 23%2911China supply 54%5941,1271,721Total 54%5921,1181,710Total ex-China QoQ Growth % * GrowthQ2 2026Q3 2026(in millions of $) 16%1981,2731,471US (20)%(21)10281Japan 1) 17%22136158Rest of the World 132%6511China supply 13%2051,5161,721Total Quarter over Quarter (QoQ) growth: 3Q26 vs 2Q26 *Product Net sales growth % excludes the impact of FX 1) Japan revenues included in Q2 approximately $25M for a one-time benefit related to the change in the wholesaler distributor model. 21 Q2 22 Q3 22 Q4 22 Q1 23 Q2 23 Q3 23 Q4 23 Q1 24 Q2 24 Q3 24 Q4 24 Q1 25 Q2 25 Q3 25 Q4 25 Q1 26 Q2 26 Q3 26Q1 22 Product Net Sales by Quarter 131 173 218 269 329 374 398 478 573 737 790 949 1,127 1,286 1,298 1,516 1,721 75 $’m China RoW Japan USA 7
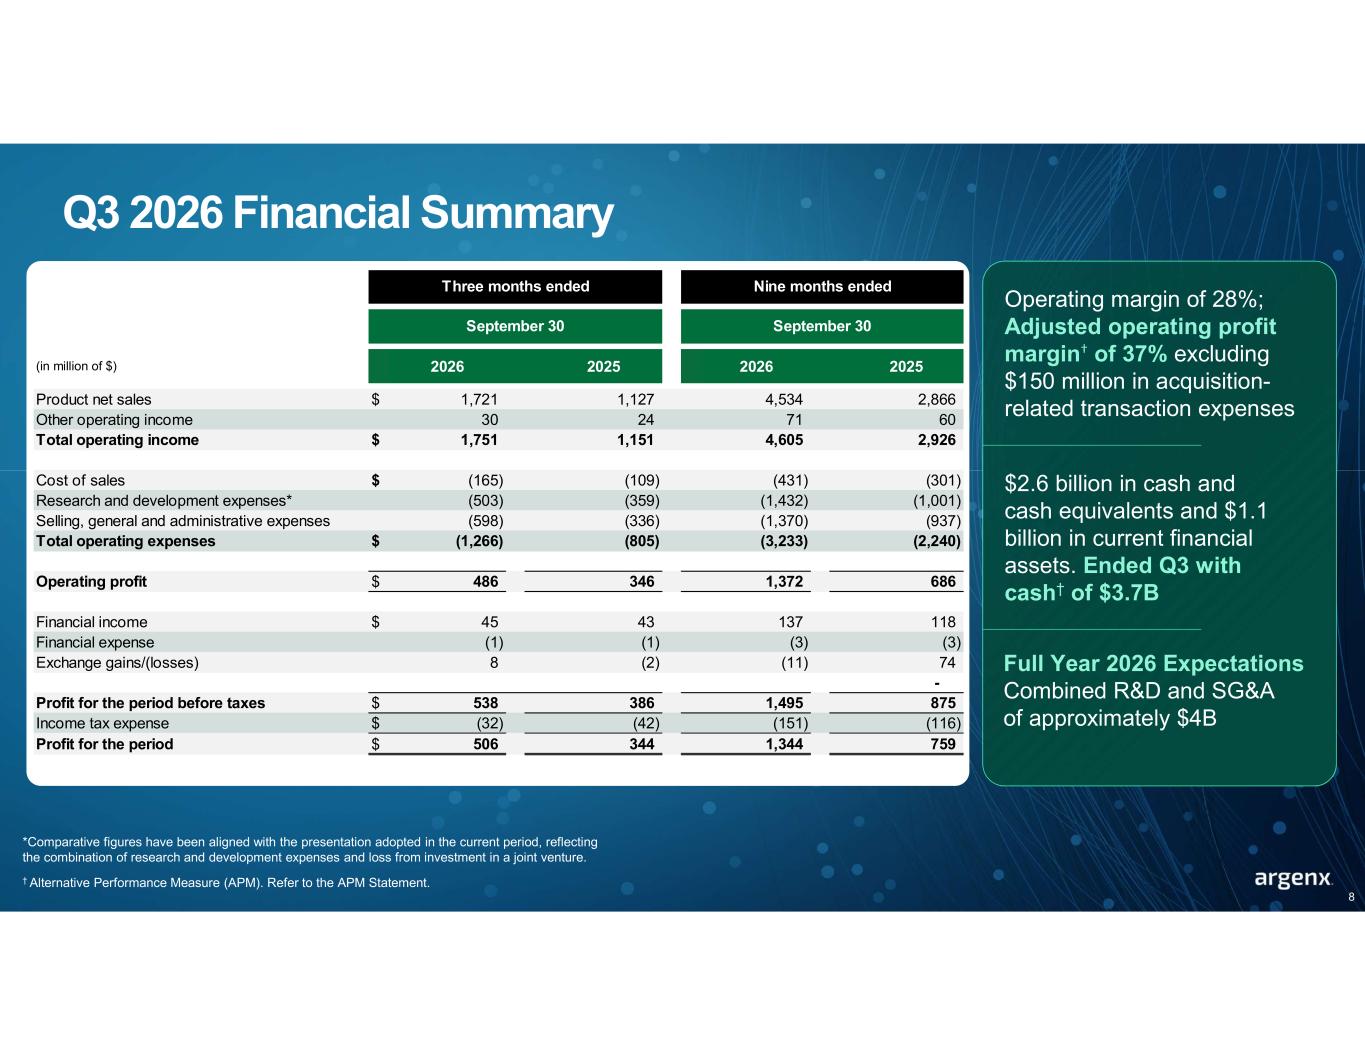
Q3 2026 Financial Summary *Comparative figures have been aligned with the presentation adopted in the current period, reflecting the combination of research and development expenses and loss from investment in a joint venture. † Alternative Performance Measure (APM). Refer to the APM Statement. (in million of $) 2026 2025 2026 2025 Product net sales $ 1,721 1,127 4,534 2,866 Other operating income 30 24 71 60 Total operating income $ 1,751 1,151 4,605 2,926 Cost of sales $ (165) (109) (431) (301) Research and development expenses* (503) (359) (1,432) (1,001) Selling, general and administrative expenses (598) (336) (1,370) (937) Total operating expenses $ (1,266) (805) (3,233) (2,240) Operating profit $ 486 346 1,372 686 Financial income $ 45 43 137 118 Financial expense (1) (1) (3) (3) Exchange gains/(losses) 8 (2) (11) 74 - Profit for the period before taxes $ 538 386 1,495 875 Income tax expense $ (32) (42) (151) (116) Profit for the period $ 506 344 1,344 759 Three months ended September 30 Nine months ended September 30 8 Operating margin of 28%; Adjusted operating profit margin† of 37% excluding $150 million in acquisition- related transaction expenses $2.6 billion in cash and cash equivalents and $1.1 billion in current financial assets. Ended Q3 with cash† of $3.7B Full Year 2026 Expectations Combined R&D and SG&A of approximately $4B
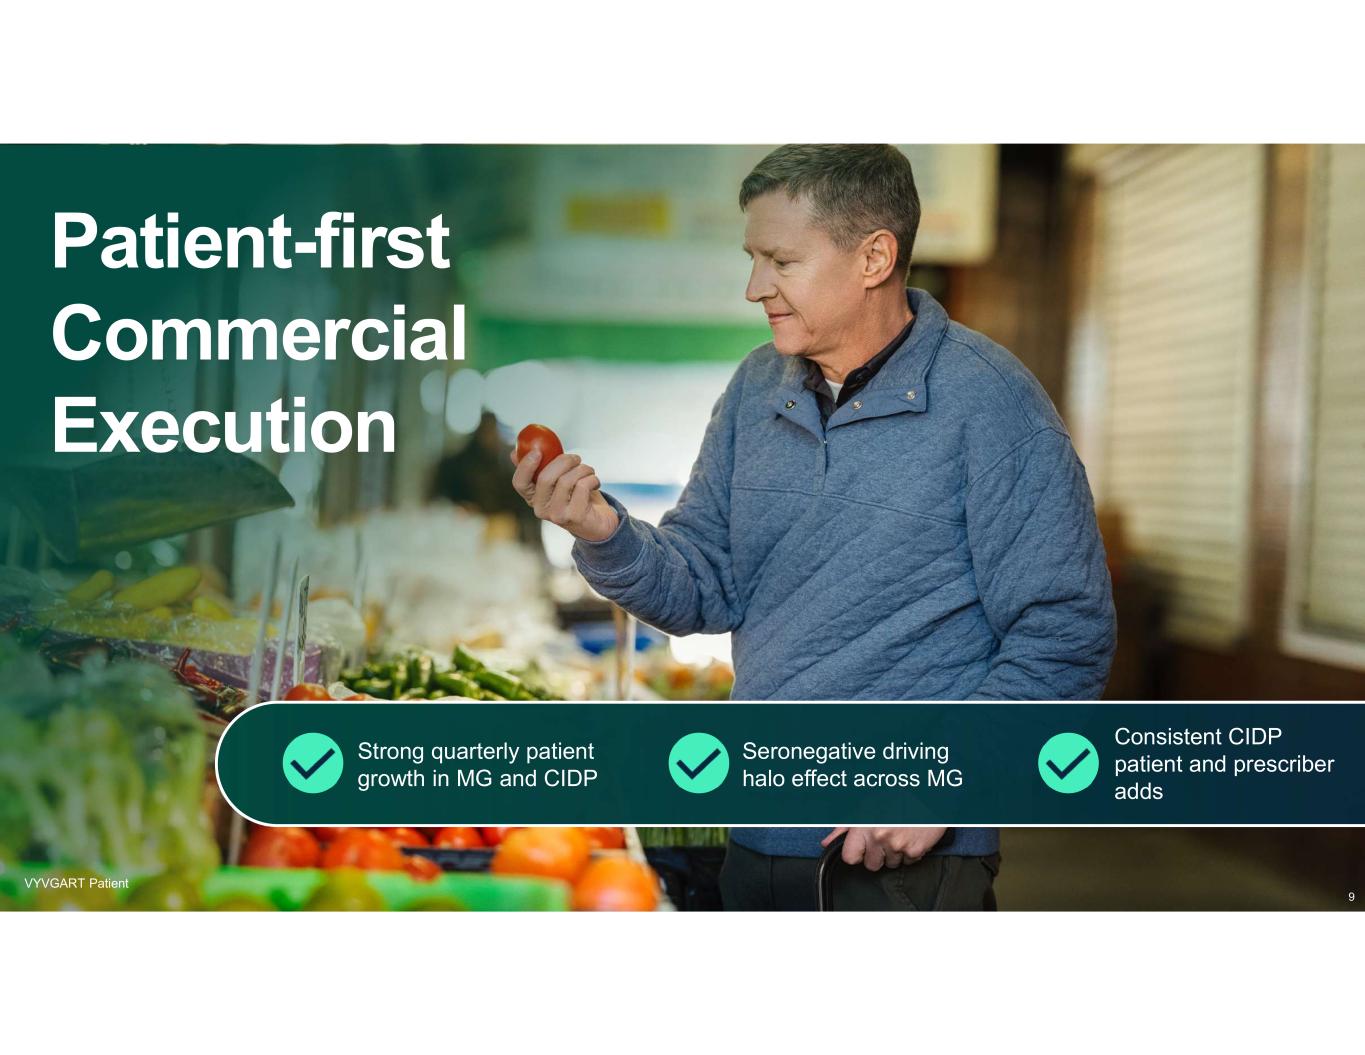
Patient-first Commercial Execution VYVGART Patient Strong quarterly patient growth in MG and CIDP Seronegative driving halo effect across MG Consistent CIDP patient and prescriber adds 9
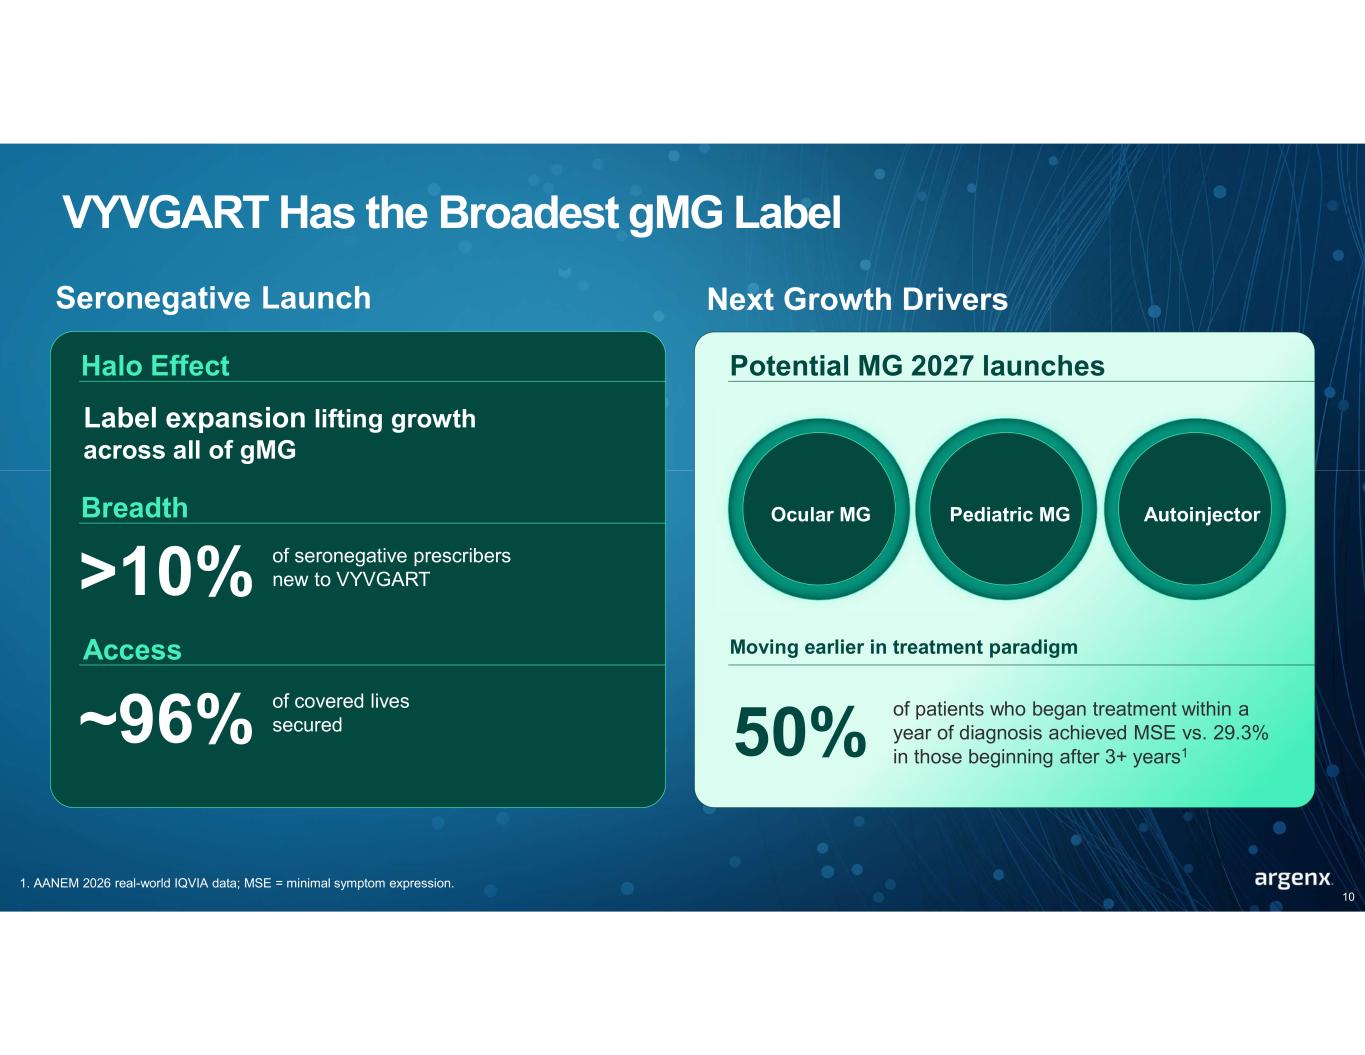
VYVGART Has the Broadest gMG Label 1. AANEM 2026 real-world IQVIA data; MSE = minimal symptom expression. Seronegative Launch Halo Effect Breadth >10% of seronegative prescribers new to VYVGART Access ~96% of covered lives secured Next Growth Drivers Potential MG 2027 launches Moving earlier in treatment paradigm 50% Ocular MG Pediatric MG Autoinjector 10 Label expansion lifting growth across all of gMG of patients who began treatment within a year of diagnosis achieved MSE vs. 29.3% in those beginning after 3+ years1
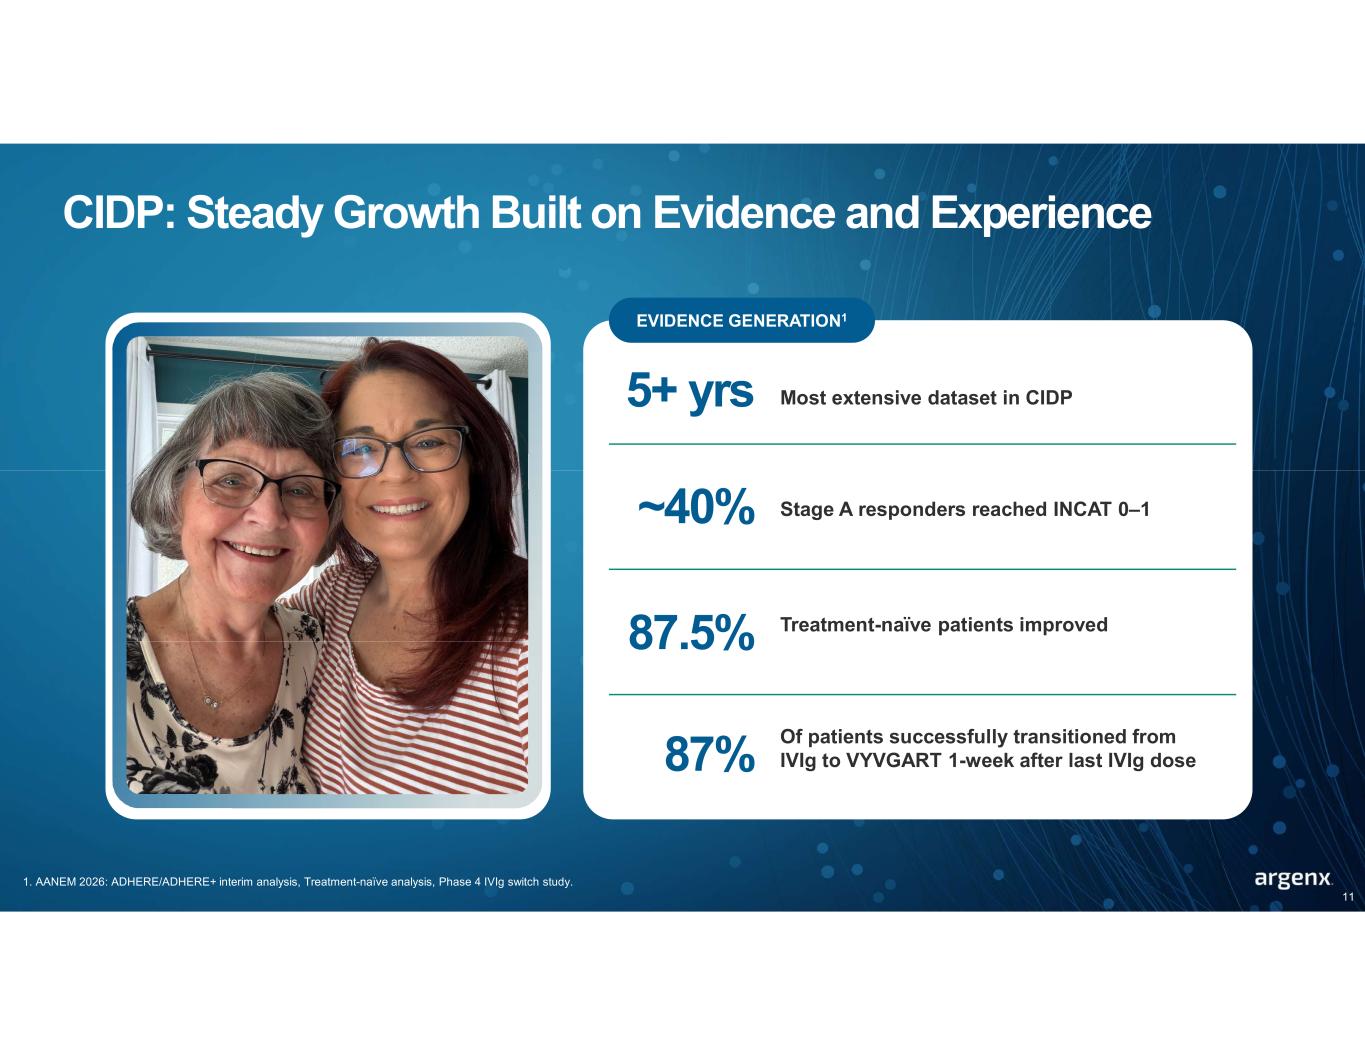
CIDP: Steady Growth Built on Evidence and Experience 1. AANEM 2026: ADHERE/ADHERE+ interim analysis, Treatment-naïve analysis, Phase 4 IVIg switch study. PHOTO: GAYLE Image to come from Cristian EVIDENCE GENERATION1 5+ yrs Most extensive dataset in CIDP ~40% Stage A responders reached INCAT 0–1 87.5% Treatment-naïve patients improved 11 87% Of patients successfully transitioned from IVIg to VYVGART 1-week after last IVIg dose
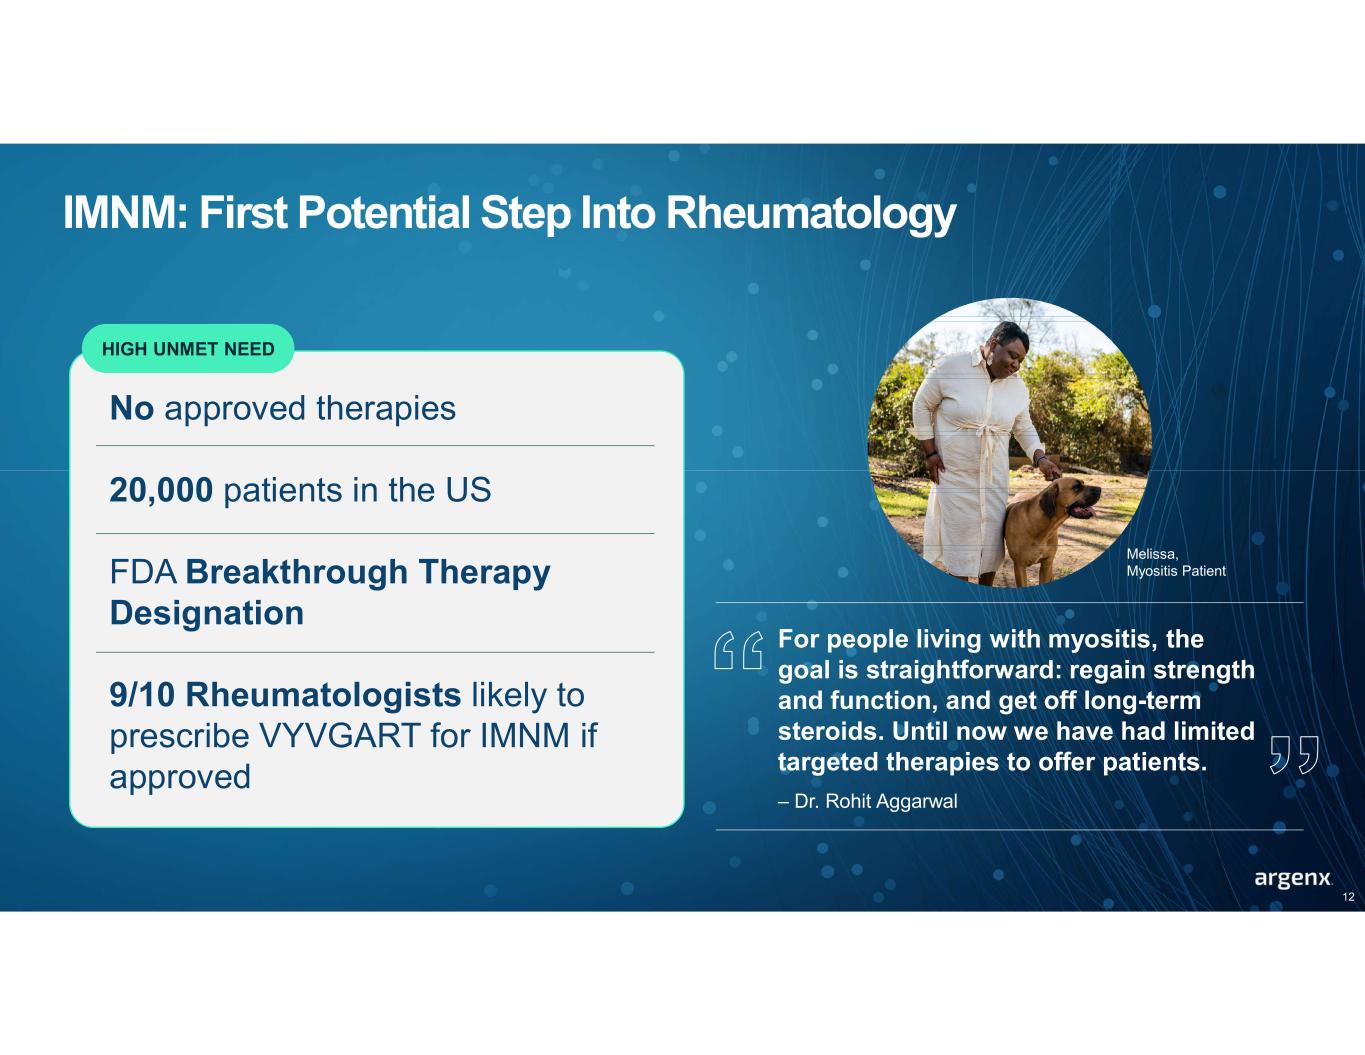
IMNM: First Potential Step Into Rheumatology HIGH UNMET NEED No approved therapies 20,000 patients in the US FDA Breakthrough Therapy Designation 9/10 Rheumatologists likely to prescribe VYVGART for IMNM if approved 12 For people living with myositis, the goal is straightforward: regain strength and function, and get off long-term steroids. Until now we have had limited targeted therapies to offer patients. – Dr. Rohit Aggarwal Melissa, Myositis Patient

We are on a Transforming the lives of patients with severe autoimmune disease through immunology innovation bold mission 13
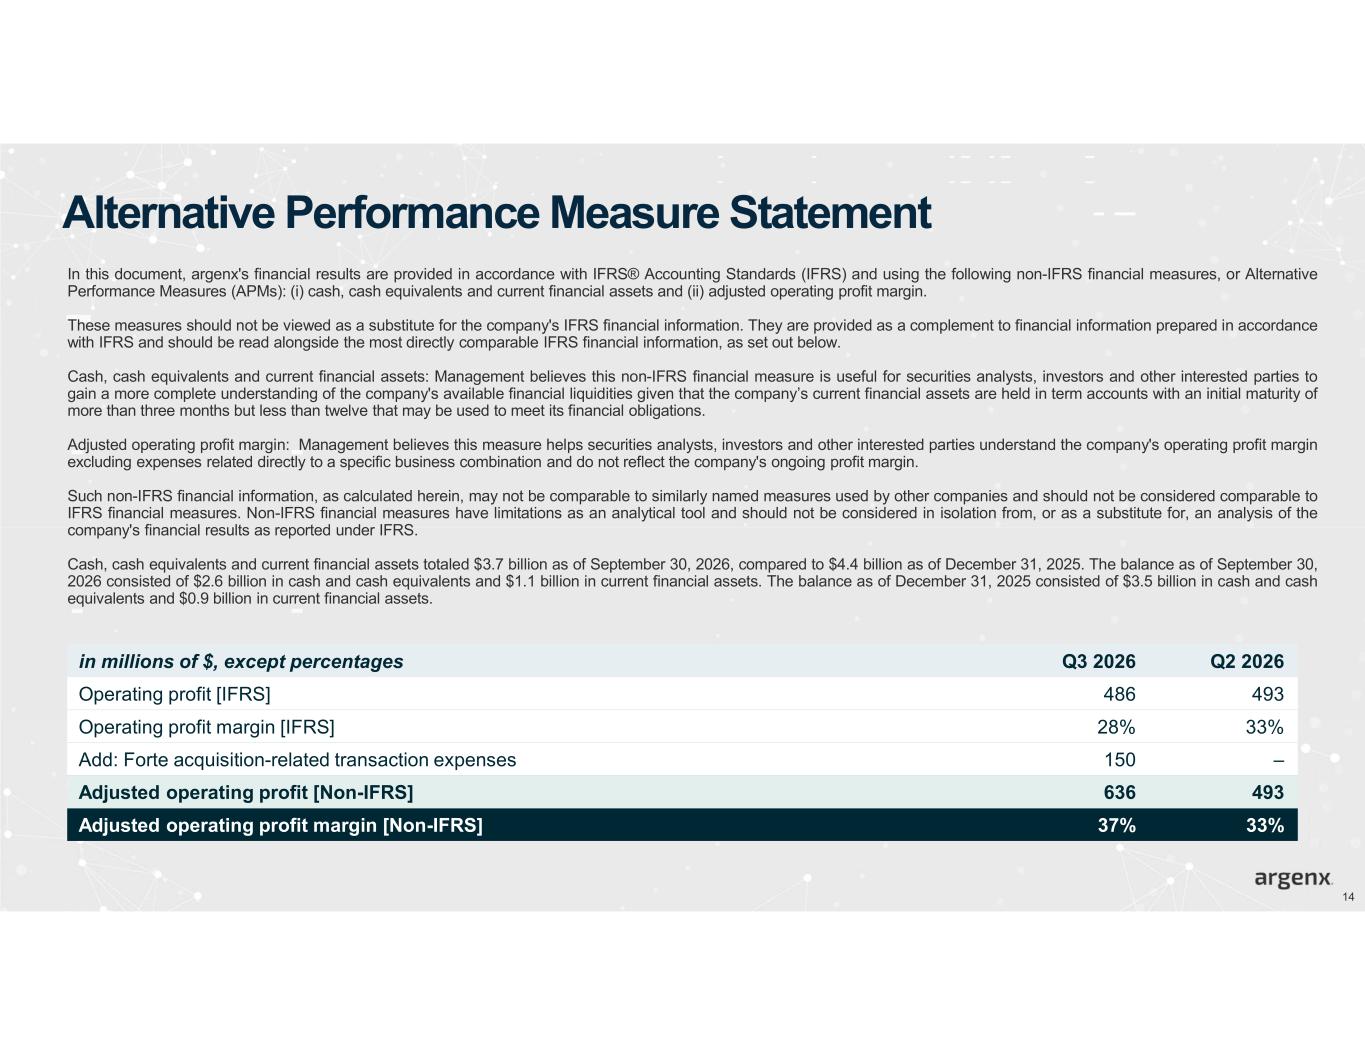
Alternative Performance Measure Statement In this document, argenx's financial results are provided in accordance with IFRS® Accounting Standards (IFRS) and using the following non-IFRS financial measures, or Alternative Performance Measures (APMs): (i) cash, cash equivalents and current financial assets and (ii) adjusted operating profit margin. These measures should not be viewed as a substitute for the company's IFRS financial information. They are provided as a complement to financial information prepared in accordance with IFRS and should be read alongside the most directly comparable IFRS financial information, as set out below. Cash, cash equivalents and current financial assets: Management believes this non-IFRS financial measure is useful for securities analysts, investors and other interested parties to gain a more complete understanding of the company's available financial liquidities given that the company’s current financial assets are held in term accounts with an initial maturity of more than three months but less than twelve that may be used to meet its financial obligations. Adjusted operating profit margin: Management believes this measure helps securities analysts, investors and other interested parties understand the company's operating profit margin excluding expenses related directly to a specific business combination and do not reflect the company's ongoing profit margin. Such non-IFRS financial information, as calculated herein, may not be comparable to similarly named measures used by other companies and should not be considered comparable to IFRS financial measures. Non-IFRS financial measures have limitations as an analytical tool and should not be considered in isolation from, or as a substitute for, an analysis of the company's financial results as reported under IFRS. Cash, cash equivalents and current financial assets totaled $3.7 billion as of September 30, 2026, compared to $4.4 billion as of December 31, 2025. The balance as of September 30, 2026 consisted of $2.6 billion in cash and cash equivalents and $1.1 billion in current financial assets. The balance as of December 31, 2025 consisted of $3.5 billion in cash and cash equivalents and $0.9 billion in current financial assets. 14 Q2 2026Q3 2026in millions of $, except percentages 493486Operating profit [IFRS] 33%28%Operating profit margin [IFRS] –150Add: Forte acquisition-related transaction expenses 493636Adjusted operating profit [Non-IFRS] 33%37%Adjusted operating profit margin [Non-IFRS]