.2
Magnolia Oil & Gas to Acquire WildFire Energy Highly Accretive Acquisition Creates Premier Eagle Ford & Austin Chalk Asset Position in South Texas July 20 , 2026 Christopher Stavros – Chairman, President & CEO Brian Corales – Senior Vice President & CFO Tom Fitter – Vice President, Investor Relations
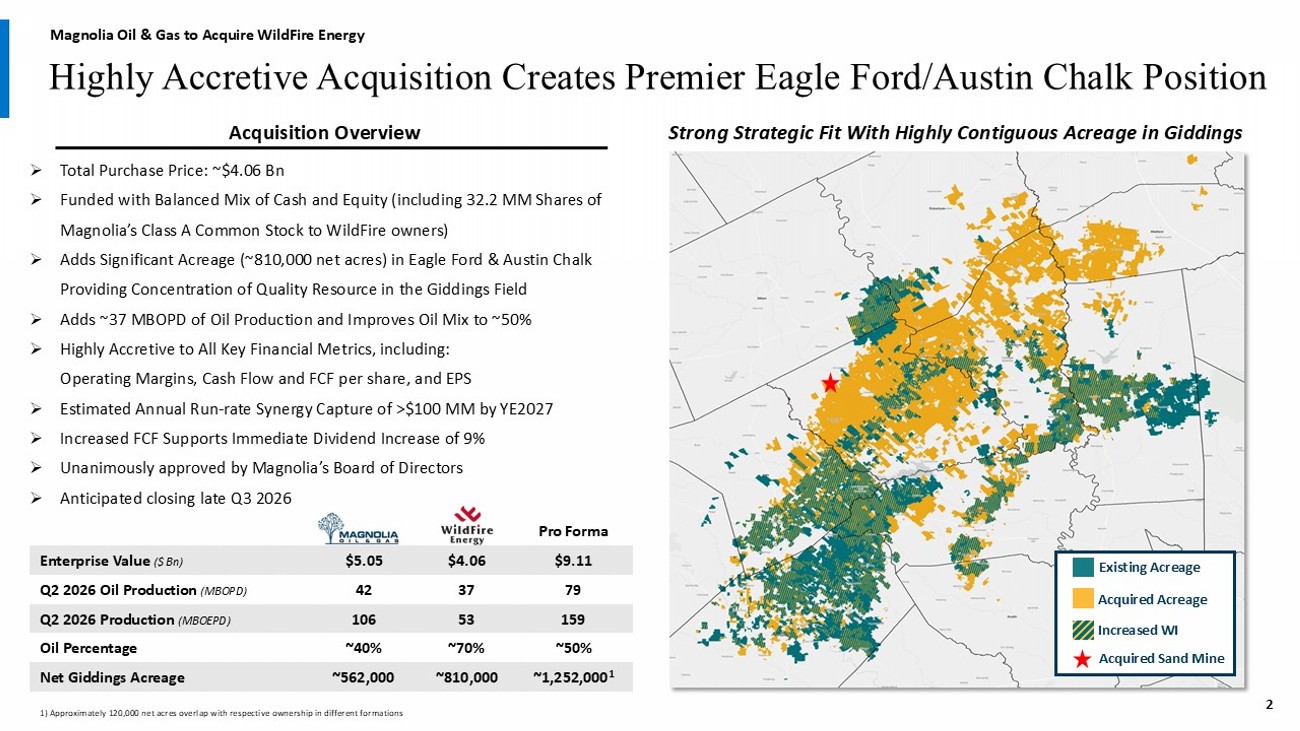
Pro Forma $9.11 $4.06 $5.05 Enterprise Value ($ Bn) 79 37 42 Q2 2026 Oil Production (MBOPD) 159 53 106 Q2 2026 Production (MBOEPD) ~50% ~70% ~40% Oil Percentage ~1,252,000 1 ~810,000 ~562,000 Net Giddings Acreage Highly Accretive Acquisition Creates Premier Eagle Ford/Austin Chalk Position 2 Acquisition Overview » Total Purchase Price: ~$4.06 Bn » Funded with Balanced Mix of Cash and Equity (including 32.2 MM Shares of Magnolia’s Class A Common Stock to WildFire owners) » Adds Significant Acreage (~810,000 net acres) in Eagle Ford & Austin Chalk Providing Concentration of Quality Resource in the Giddings Field » Adds ~37 MBOPD of Oil Production and Improves Oil Mix to ~50% » Highly Accretive to All Key Financial Metrics, including: Operating Margins, Cash Flow and FCF per share, and EPS » Estimated Annual Run - rate Synergy Capture of >$100 MM by YE2027 » Increased FCF Supports Immediate Dividend Increase of 9% » Unanimously approved by Magnolia’s Board of Directors » Anticipated closing late Q3 2026 1) Approximately 120,000 net acres overlap with respective ownership in different formations Magnolia Oil & Gas to Acquire WildFire Energy Strong Strategic Fit With Highly Contiguous Acreage in Giddings Existing Acreage Acquired Acreage Increased WI Acquired Sand Mine
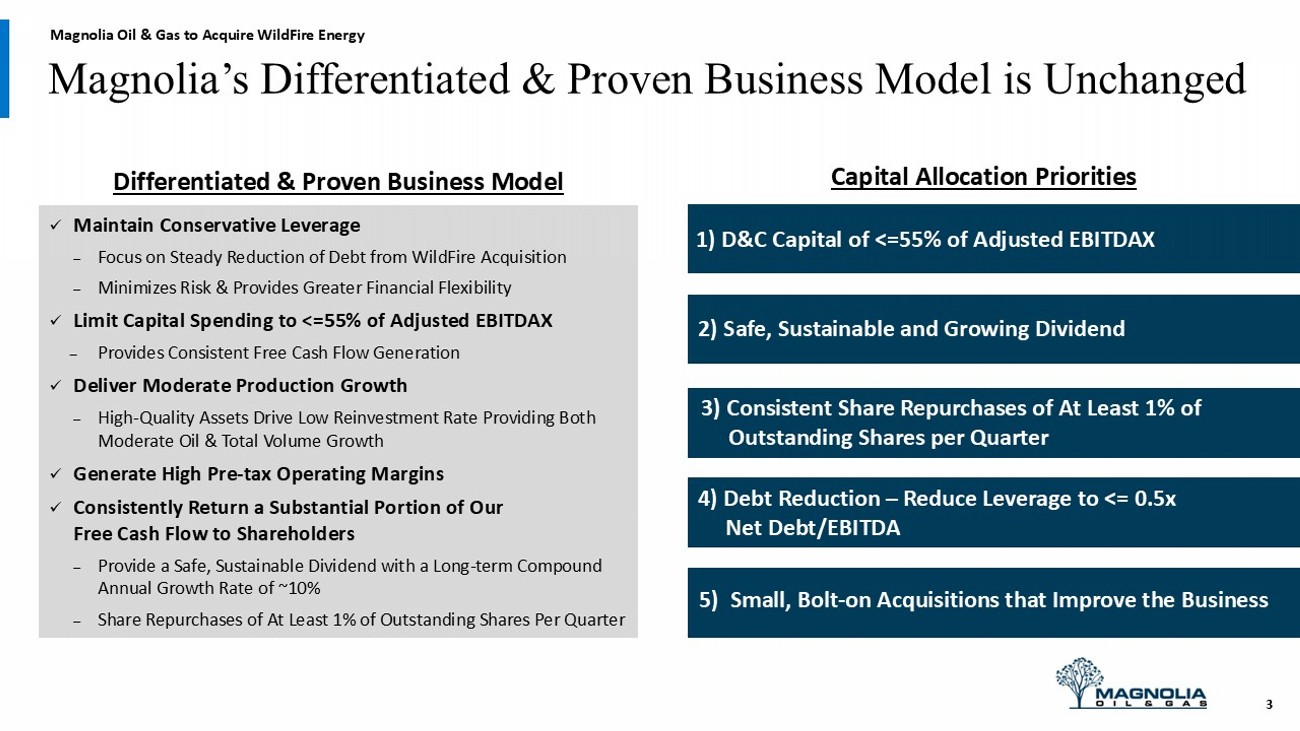
Magnolia’s Differentiated & Proven Business Model is Unchanged 3 Magnolia Oil & Gas to Acquire WildFire Energy x Maintain Conservative Leverage – Focus on Steady Reduction of Debt from WildFire Acquisition – Minimizes Risk & Provides Greater Financial Flexibility x Limit Capital Spending to <=55% of Adjusted EBITDAX ̶ Provides Consistent Free Cash Flow Generation x Deliver Moderate Production Growth – High - Quality Assets Drive Low Reinvestment Rate Providing Both Moderate Oil & Total Volume Growth x Generate High Pre - tax Operating Margins x Consistently Return a Substantial Portion of Our Free Cash Flow to Shareholders – Provide a Safe, Sustainable Dividend with a Long - term Compound Annual Growth Rate of ~10% – Share Repurchases of At Least 1% of Outstanding Shares Per Quarter Capital Allocation Priorities 1) D&C Capital of <=55% of Adjusted EBITDAX 2) Safe, Sustainable and Growing Dividend 3) Consistent Share Repurchases of At Least 1% of Outstanding Shares per Quarter 5) Small, Bolt - on Acquisitions that Improve the Business 4) Debt Reduction – Reduce Leverage to <= 0.5x Net Debt/EBITDA Differentiated & Proven Business Model
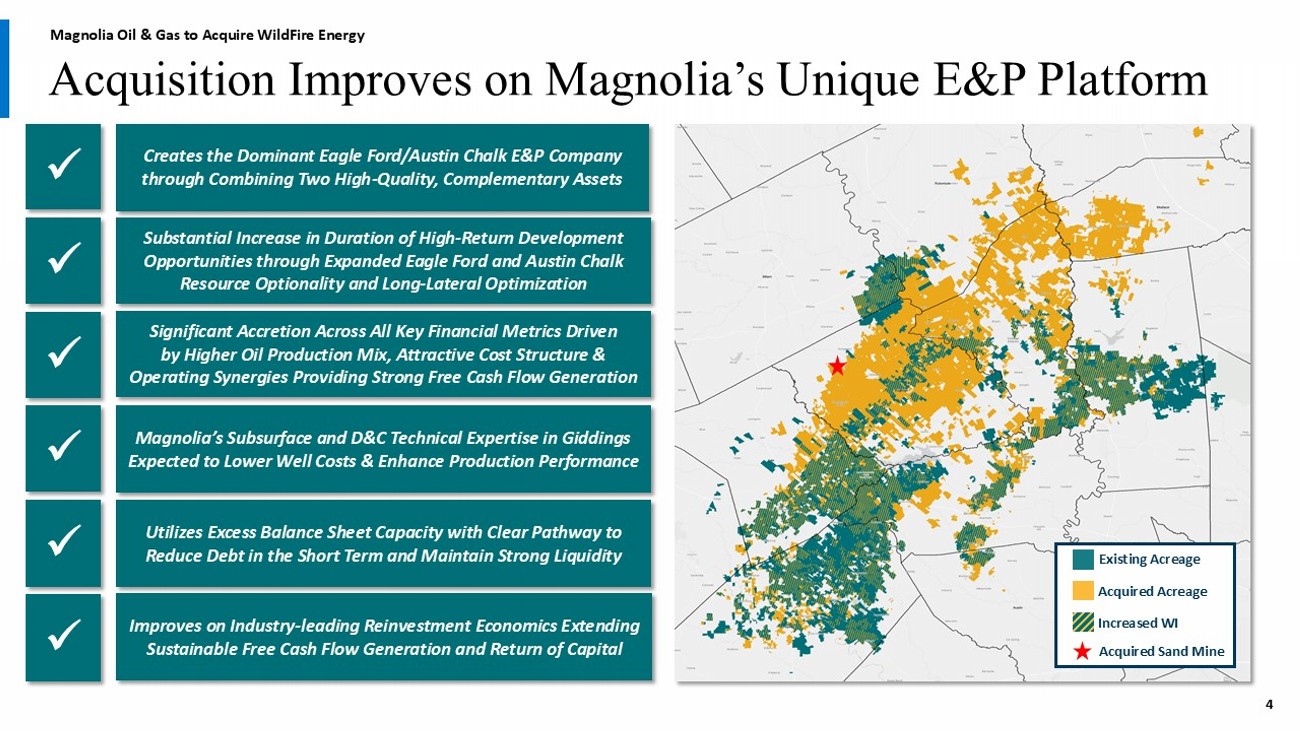
Acquisition Improves on Magnolia’s Unique E&P Platform Creates the Dominant Eagle Ford/Austin Chalk E&P Company through Combining Two High - Quality, Complementary Assets Substantial Increase in Duration of High - Return Development Opportunities through Expanded Eagle Ford and Austin Chalk Resource Optionality and Long - Lateral Optimization Magnolia’s Subsurface and D&C Technical Expertise in Giddings Expected to Lower Well Costs & Enhance Production Performance Utilizes Excess Balance Sheet Capacity with Clear Pathway to Reduce Debt in the Short Term and Maintain Strong Liquidity Significant Accretion Across All Key Financial Metrics Driven by Higher Oil Production Mix, Attractive Cost Structure & Operating Synergies Providing Strong Free Cash Flow Generation x x x x x 4 Improves on Industry - leading Reinvestment Economics Extending Sustainable Free Cash Flow Generation and Return of Capital x Magnolia Oil & Gas to Acquire WildFire Energy Existing Acreage Acquired Acreage Increased WI Acquired Sand Mine
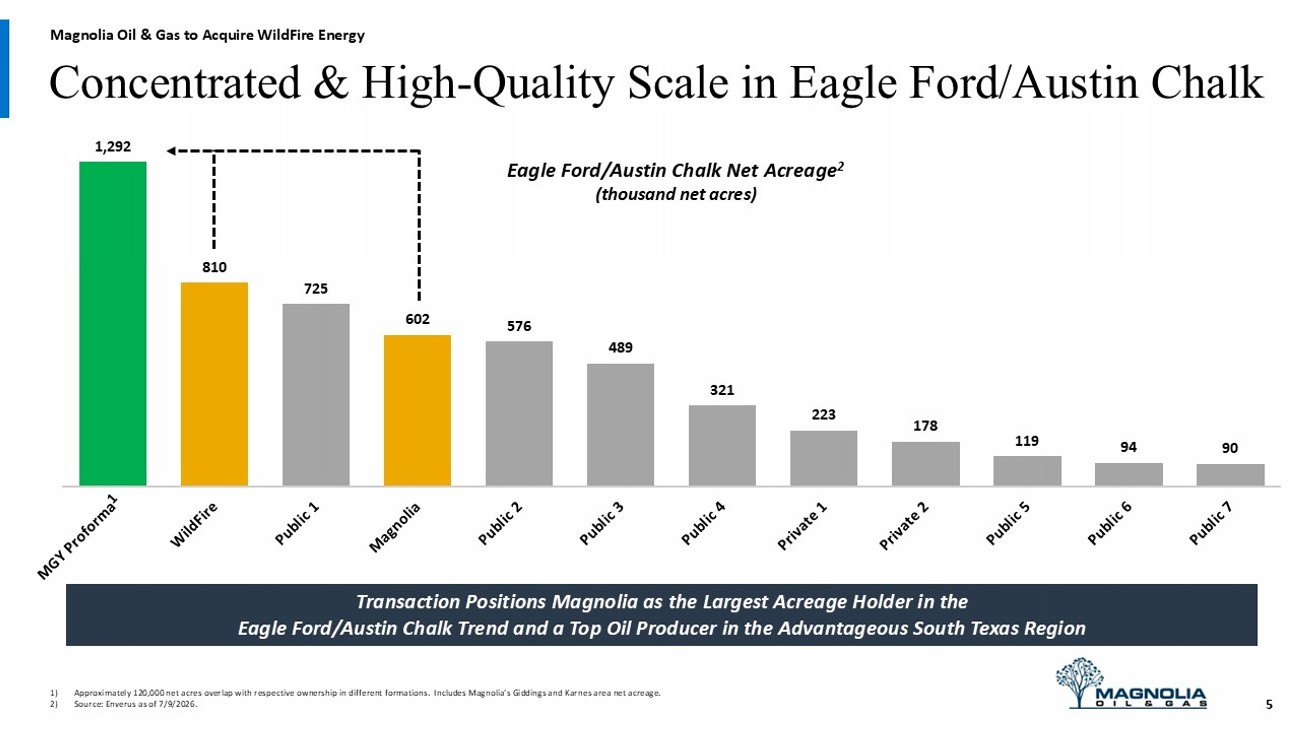
Concentrated & High - Quality Scale in Eagle Ford/Austin Chalk 1,292 810 725 602 576 489 321 223 178 119 94 90 Eagle Ford/Austin Chalk Net Acreage 2 (thousand net acres) Transaction Positions Magnolia as the Largest Acreage Holder in the Eagle Ford/Austin Chalk Trend and a Top Oil Producer in the Advantageous South Texas Region 1) Approximately 120,000 net acres overlap with respective ownership in different formations. Includes Magnolia’s Giddings and Kar nes area net acreage. 2) Source: Enverus as of 7/9/2026. 5 Magnolia Oil & Gas to Acquire WildFire Energy
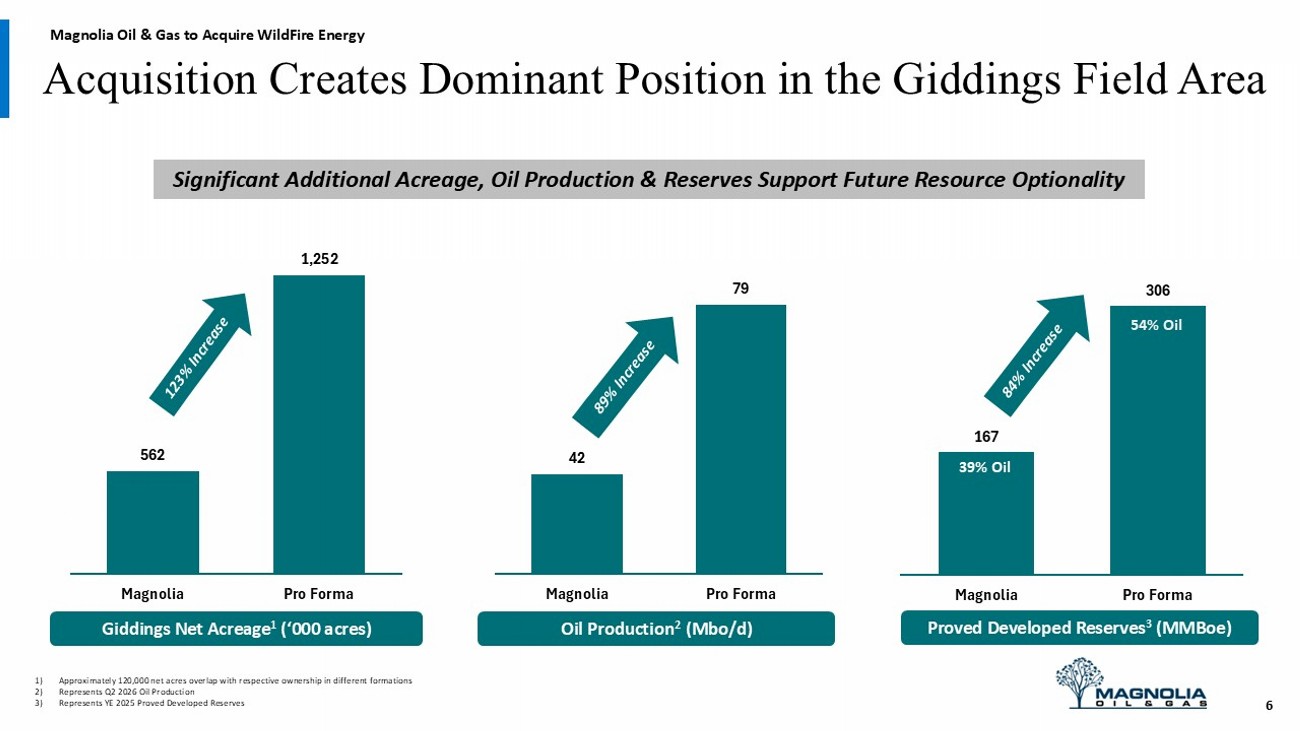
42 79 Magnolia Pro Forma 562 1,252 Magnolia Pro Forma 167 306 Magnolia Pro Forma Acquisition Creates Dominant Position in the Giddings Field Area 1) Approximately 120,000 net acres overlap with respective ownership in different formations 2) Represents Q2 2026 Oil Production 3) Represents YE 2025 Proved Developed Reserves Giddings Net Acreage 1 (‘000 acres) Proved Developed Reserves 3 ( MMBoe ) Oil Production 2 (Mbo/d) 39% Oil 54% Oil 6 Magnolia Oil & Gas to Acquire WildFire Energy Significant Additional Acreage, Oil Production & Reserves Support Future Resource Optionality
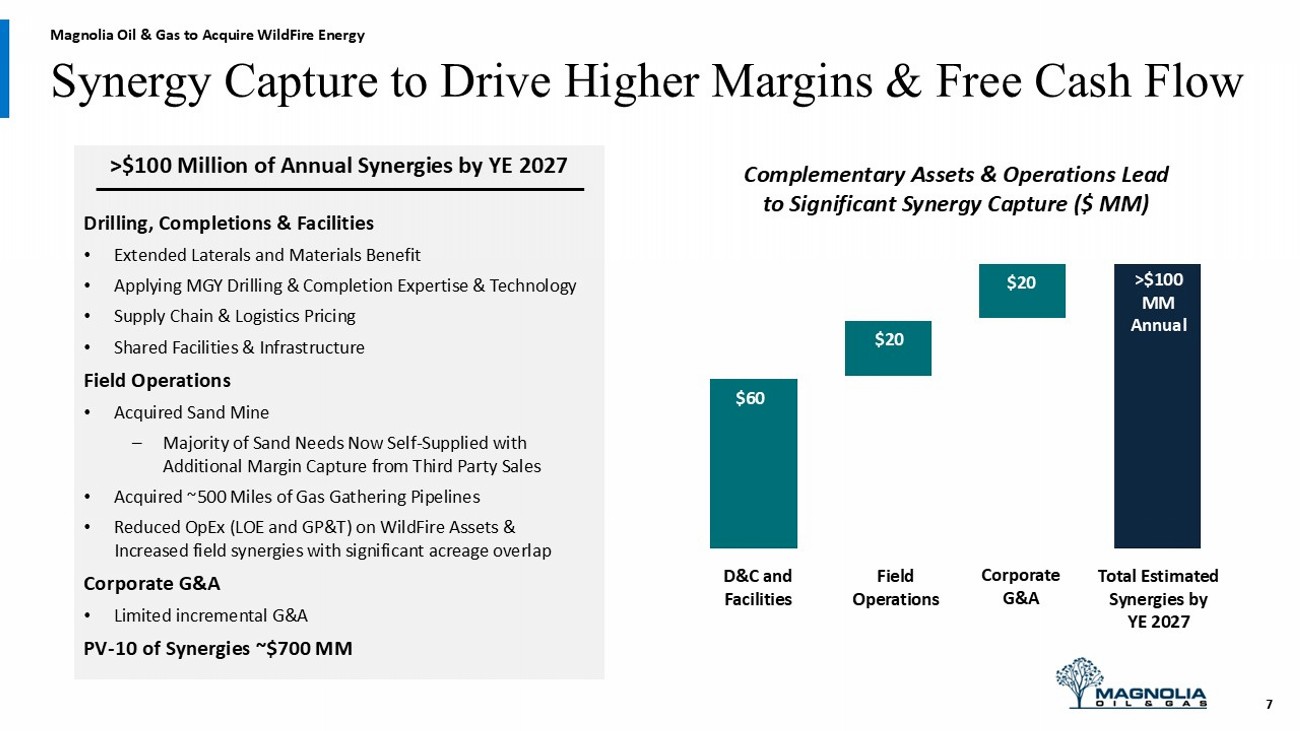
Synergy Capture to Drive Higher Margins & Free Cash Flow Complementary Assets & Operations Lead to Significant Synergy Capture ($ MM) D&C and Facilities Field Operations Corporate G&A Total Estimated Synergies by YE 2027 $60 $20 $20 >$100 MM Annual >$100 Million of Annual Synergies by YE 2027 Drilling, Completions & Facilities • Extended Laterals and Materials Benefit • Applying MGY Drilling & Completion Expertise & Technology • Supply Chain & Logistics Pricing • Shared Facilities & Infrastructure Field Operations • Acquired Sand Mine – Majority of Sand Needs Now Self - Supplied with Additional Margin Capture from Third Party Sales • Acquired ~500 Miles of Gas Gathering Pipelines • Reduced OpEx (LOE and GP&T) on WildFire Assets & Increased field synergies with significant acreage overlap Corporate G&A • Limited incremental G&A PV - 10 of Synergies ~$700 MM 7 Magnolia Oil & Gas to Acquire WildFire Energy
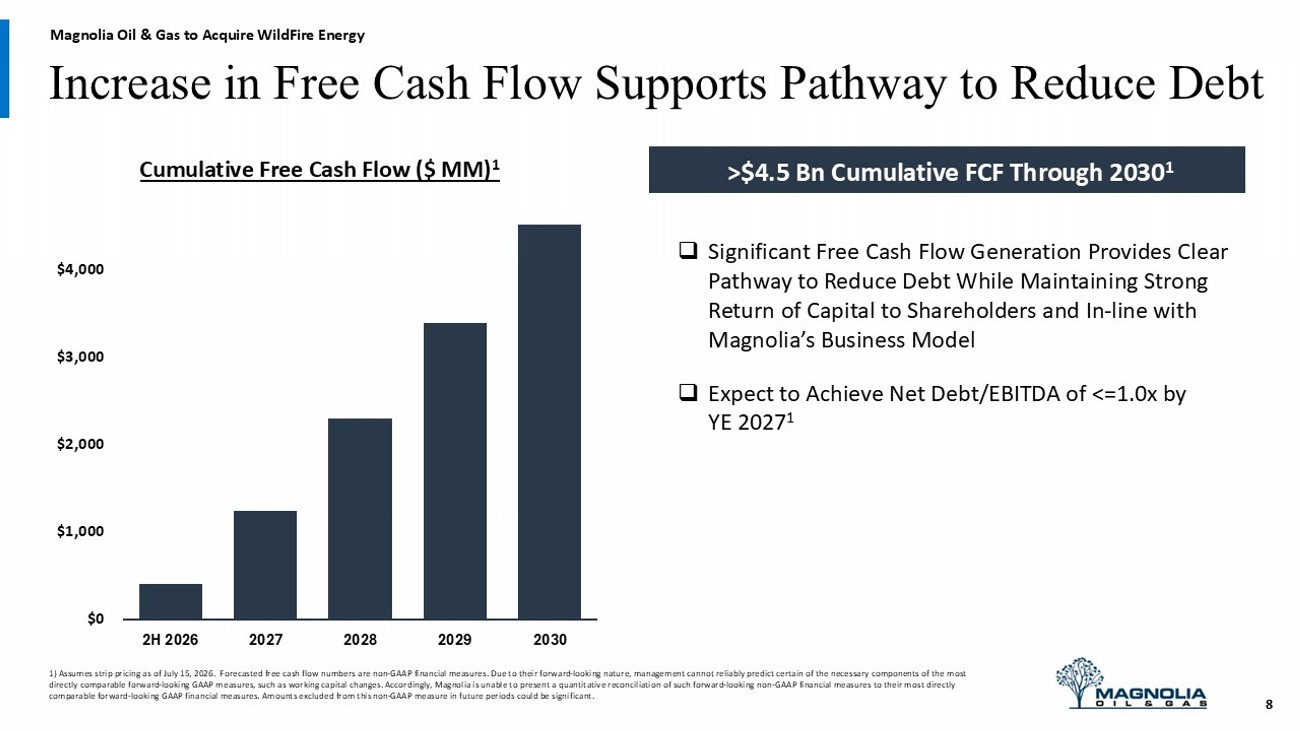
□ Significant Free Cash Flow Generation Provides Clear Pathway to Reduce Debt While Maintaining Strong Return of Capital to Shareholders and In - line with Magnolia’s Business Model □ Expect to Achieve Net Debt/EBITDA of <=1.0x by YE 2027 1 Increase in Free Cash Flow Supports Pathway to Reduce Debt Cumulative Free Cash Flow ($ MM) 1 1) Assumes strip pricing as of July 15, 2026. Forecasted free cash flow numbers are non - GAAP financial measures. Due to their f orward - looking nature, management cannot reliably predict certain of the necessary components of the most directly comparable forward - looking GAAP measures, such as working capital changes. Accordingly, Magnolia is unable to present a quantitative reconciliation of such forward - looking non - GAAP financial measures to their most directly comparable forward - looking GAAP financial measures. Amounts excluded from this non - GAAP measure in future periods could be signi ficant. $0 $1,000 $2,000 $3,000 $4,000 2H 2026 2027 2028 2029 2030 8 Magnolia Oil & Gas to Acquire WildFire Energy >$4.5 Bn Cumulative FCF Through 2030 1
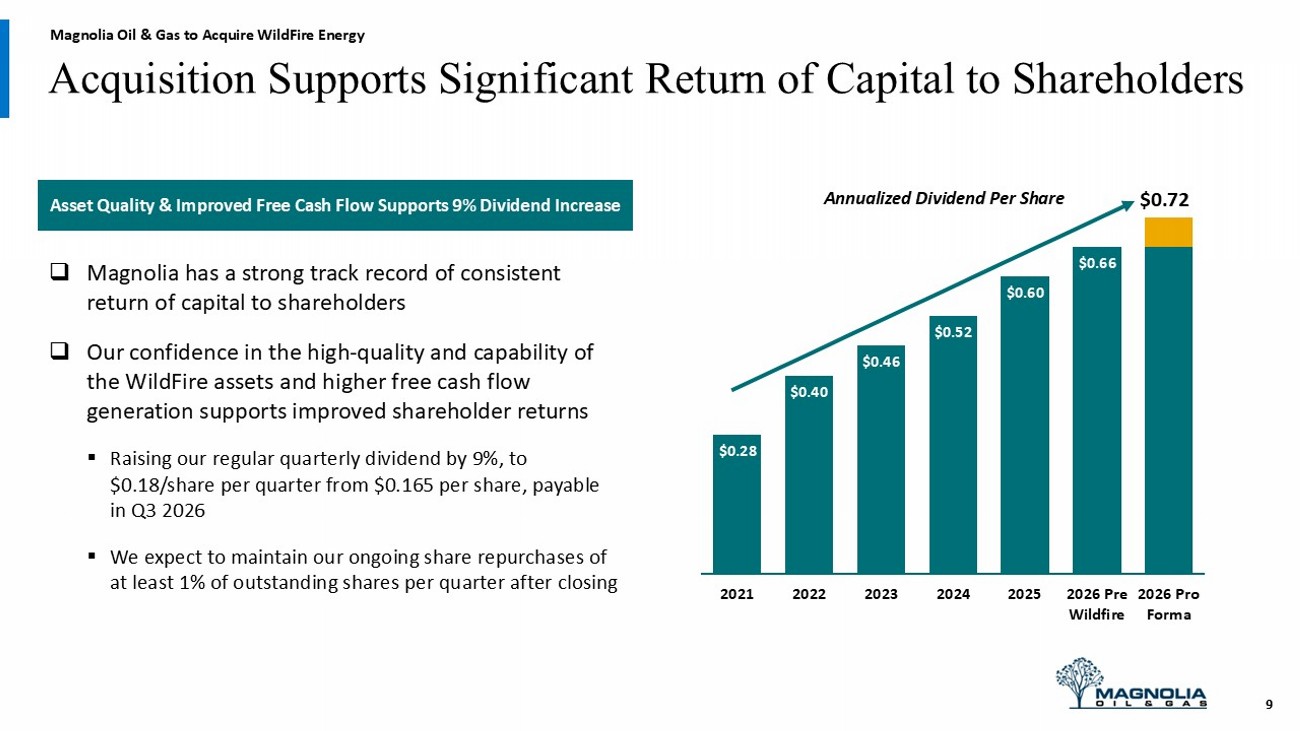
$0.28 $0.40 $0.46 $0.52 $0.60 $0.66 2021 2022 2023 2024 2025 2026 Pre Wildfire 2026 Pro Forma Asset Quality & Improved Free Cash Flow Supports 9% Dividend Increase $0.72 □ Magnolia has a strong track record of consistent return of capital to shareholders □ Our confidence in the high - quality and capability of the WildFire assets and higher free cash flow generation supports improved shareholder returns ▪ Raising our regular quarterly dividend by 9%, to $0.18/share per quarter from $0.165 per share, payable in Q3 2026 ▪ We expect to maintain our ongoing share repurchases of at least 1% of outstanding shares per quarter after closing 9 Acquisition Supports Significant Return of Capital to Shareholders Magnolia Oil & Gas to Acquire WildFire Energy Annualized Dividend Per Share
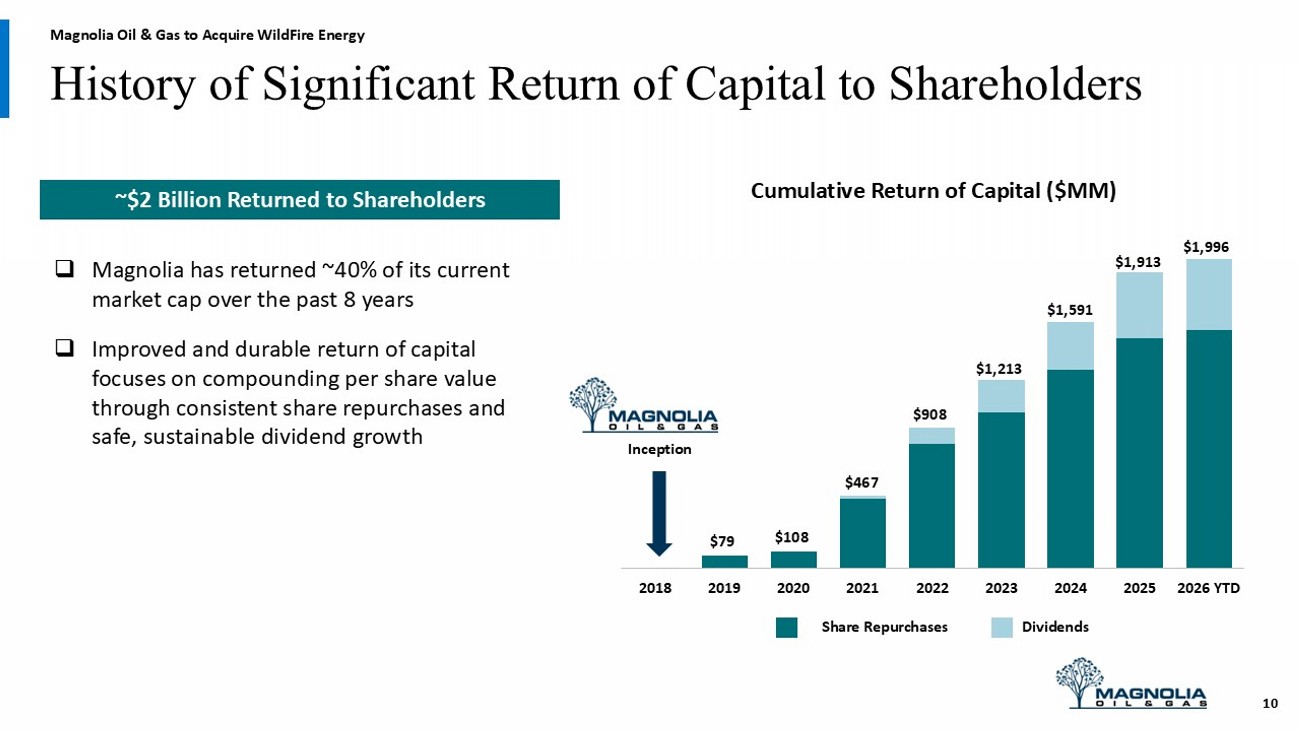
2018 2019 2020 2021 2022 2023 2024 2025 2026 YTD History of Significant Return of Capital to Shareholders □ Magnolia has returned ~40% of its current market cap over the past 8 years □ Improved and durable return of capital focuses on compounding per share value through consistent share repurchases and safe, sustainable dividend growth Inception Cumulative Return of Capital ($MM) $79 $108 $467 $908 $1,213 ~$2 Billion Returned to Shareholders Share Repurchases Dividends $1,591 $1,913 10 $1,996 Magnolia Oil & Gas to Acquire WildFire Energy
Disclaimer FORWARD LOOKING STATEMENTS The information in this presentation includes forward - looking statements within the meaning of Section 27A of the Securities Act of 1933, as amended, and Section 21E of the Securities Exchange Act of 1934, as amended. All statements, other than statement s of present or historical fact included in this presentation, regarding the consummation of the Acquisition and the transactions contempl ate d thereby, the expected synergies of the Acquisition, Magnolia’s share repurchase program, Magnolia’s strategy, future operat ion s, financial position, estimated revenues and losses, projected costs and capital expenditures, prospects, plans and objectives of managem ent are forward looking statements. When used in this presentation, the words could, should, will, may, believe, anticipate, inte nd , estimate, expect, project, the negative of such terms and other similar expressions are intended to identify forward - looking statements, a lthough not all forward - looking statements contain such identifying words. These forward - looking statements are based on managem ent’s current expectations and assumptions about future events. Except as otherwise required by applicable law, Magnolia disclaims any duty to update any forward - looking statements, all of which are expressly qualified by the statements in this section, to refle ct events or circumstances after the date of this presentation. Magnolia cautions you that these forward - looking statements are subject to al l of the risks and uncertainties, most of which are difficult to predict and many of which are beyond the control of Magnolia , i ncident to the development, production, gathering and sale of oil, natural gas and natural gas liquids. In addition, Magnolia cautions you t hat the forward looking statements contained in this presentation are subject to the following factors: ( i ) the expected timetable for completing the Acquisition, the results, effects and benefits of the Acquisition, future opportunities for Magnolia, other plans and expecta tio ns with respect to the Acquisition, and the anticipated impact of the Pending Acquisition on Magnolia’s results of operations , f inancial position, growth opportunities and competitive position; (ii) the market prices of oil, natural gas, natural gas liquids (“NGLs”), and oth er products or services; (iii) the supply and demand for oil, natural gas, NGLs, and other products or services, including im pac ts of actions taken by OPEC and other state - controlled oil companies; (iv) the outcome of any legal proceedings that may be instituted against Magnolia ; (v) Magnolia’s ability to realize the anticipated benefits of its acquisitions, which may be affected by, among other thing s, competition and the ability of Magnolia to grow and manage growth profitably; (vi) legislative, regulatory, or policy changes, including thos e f ollowing the change in presidential administrations; (vii) geopolitical and business conditions in key regions of the world; (vi ii) cybersecurity threats, including increased use of artificial intelligence technologies; and (ix) the possibility that Magnolia may be adver sel y affected by other economic, business, and/or competitive factors, including inflation. Should one or more of the risks or u nce rtainties described in this presentation occur, or should underlying assumptions prove incorrect, actual results and plans could differ materially f rom those expressed in any forward - looking statements. Additional information concerning these and other factors that may impact th e operations and projections discussed herein can be found in Magnolia’s filings with the SEC, including its Annual Report on Form 10 - K for t he fiscal year ended December 31, 2025. Magnolia’s SEC filings are available publicly on the SEC’s website at www.sec.gov. NON - GAAP FINANCIAL MEASURES This presentation includes non - GAAP financial measures, including adjusted net income, free cash flow, adjusted EBITDAX, adjuste d cash operating costs, adjusted cash operating margin and return on capital employed. Magnolia believes these metrics are us efu l because they allow Magnolia to more effectively evaluate its operating performance and compare the results of its operations from per iod to period and against its peers without regard to accounting methods or capital structure. Magnolia does not consider these n on - GAAP measures in isolation or as an alternative to similar financial measures determined in accordance with GAAP. The computations of these non - GAAP measures may not be comparable to other similarly titled measures of other companies. Adjusted net income and adjusted EBITDAX should not be considered an alternative to, or more meaningful than, net income as d ete rmined in accordance with GAAP. Certain items excluded from free cash flow, adjusted net income, adjusted EBITDAX, adjusted c ash operating costs, adjusted cash operating margin, adjusted operating margin and return on capital employed are significant com pon ents in understanding and assessing a company’s financial performance and should not be construed as an inference that its re sul ts will be unaffected by unusual or non - recurring terms. As performance measures, adjusted net income, adjusted EBITDAX, adjusted cash operating costs, adjusted cash operating margin an d return on capital employed may be useful to investors in facilitating comparisons to others in the Company’s industry becau se certain items can vary substantially in the oil and gas industry from company to company depending upon accounting methods, book valu e o f assets, and capital structure, among other factors. Management believes excluding these items facilitates investors and ana lys ts in evaluating and comparing the underlying operating and financial performance of our business from period to period by eliminat ing differences caused by the existence and timing of certain expense and income items that would not otherwise be apparent on a GA AP basis. As a liquidity measure, management believes free cash flow is useful for investors and widely accepted by those following the oi l and gas industry as financial indicators of a company’s ability to generate cash to internally fund drilling and completion ac tivities, fund acquisitions, and service debt. Our presentation of adjusted net income, adjusted EBITDAX, free cash flow, adjusted cash oper ati ng costs, adjusted cash operating margin and return on capital employed may not be comparable to similar measures of other co mpa nies in our industry. Reconciliations of non - GAAP measures included herein to the nearest corresponding GAAP measure are included in thi s presentation. INDUSTRY AND MARKET DATA This presentation has been prepared by Magnolia and includes market data and other statistical information from sources belie ved by Magnolia to be reliable, including independent industry publications, governmental publications or other published indepen de nt sources. Some data is also based on the good faith estimates of Magnolia, which are derived from its review of internal sourc es as well as the independent sources described above. Although Magnolia believes these sources are reliable, it has not indepen den tly verified the information and cannot guarantee its accuracy and completeness. 11 Magnolia Oil & Gas to Acquire WildFire Energy