Second Quarter 2026 Earnings Presentation August 5, 2026 Christopher Stavros – Chairman, President & CEO Brian Corales – Senior Vice President & CFO Tom Fitter – Vice President, Investor Relations
Disclaimer Second Quarter 2026 Earnings Presentation 2 FORWARD LOOKING STATEMENTS The information in this presentation includes forward-looking statements within the meaning of Section 27A of the Securities Act of 1933, as amended, and Section 21E of the Securities Exchange Act of 1934, as amended. All statements, other than statements of present or historical fact included in this presentation, regarding the consummation of the acquisition of WildFire and the transactions contemplated thereby (the “WildFire Acquisition”), the expected synergies of the WildFire Acquisition, Magnolia’s share repurchase program, Magnolia’s strategy, future operations, financial position, estimated revenues and losses, projected costs, prospects, plans and objectives of management are forward looking statements. When used in this presentation, the words could, should, will, may, believe, anticipate, intend, estimate, expect, project, the negative of such terms and other similar expressions are intended to identify forward-looking statements, although not all forward-looking statements contain such identifying words. These forward-looking statements are based on management’s current expectations and assumptions about future events. Except as otherwise required by applicable law, Magnolia disclaims any duty to update any forward-looking statements, all of which are expressly qualified by the statements in this section, to reflect events or circumstances after the date of this presentation. Magnolia cautions you that these forward-looking statements are subject to all of the risks and uncertainties, most of which are difficult to predict and many of which are beyond the control of Magnolia, incident to the development, production, gathering and sale of oil, natural gas and natural gas liquids. In addition, Magnolia cautions you that the forward looking statements contained in this presentation are subject to the following factors: (i) the expected timetable for completing the WildFire Acquisition, the results, effects and benefits of the WildFire Acquisition, future opportunities for Magnolia, other plans and expectations with respect to the WildFire Acquisition, and the anticipated impact of the WildFire Acquisition on Magnolia’s results of operations, financial position, growth opportunities and competitive position; (ii) the market prices of oil, natural gas, NGLs, and other products or services; (iii) the supply and demand for oil, natural gas, NGLs, and other products or services, including impacts of actions taken by OPEC and other state-controlled oil companies; (iv) the outcome of any legal proceedings that may be instituted against Magnolia; (v) Magnolia’s ability to realize the anticipated benefits of its acquisitions, which may be affected by, among other things, competition and the ability of Magnolia to grow and manage growth profitably; (vi) legislative, regulatory, or policy changes, including those following the change in presidential administrations; (vii) geopolitical and business conditions in key regions of the world; (viii) cybersecurity threats, including increased use of artificial intelligence technologies; and (ix) the possibility that Magnolia may be adversely affected by other economic, business, and/or competitive factors, including inflation. Should one or more of the risks or uncertainties described in this presentation occur, or should underlying assumptions prove incorrect, actual results and plans could differ materially from those expressed in any forward-looking statements. Additional information concerning these and other factors that may impact the operations and projections discussed herein can be found in Magnolia’s filings with the SEC, including its Annual Report on Form 10-K for the fiscal year ended December 31, 2025. Magnolia’s SEC filings are available publicly on the SEC’s website at www.sec.gov. NON-GAAP FINANCIAL MEASURES This presentation includes non-GAAP financial measures, including adjusted net income, free cash flow, adjusted EBITDAX, adjusted cash operating costs, adjusted cash operating margin, adjusted operating income margin and return on capital employed. Magnolia believes these metrics are useful because they allow Magnolia to more effectively evaluate its operating performance and compare the results of its operations from period to period and against its peers without regard to accounting methods or capital structure. Magnolia does not consider these non-GAAP measures in isolation or as an alternative to similar financial measures determined in accordance with GAAP. The computations of these non-GAAP measures may not be comparable to other similarly titled measures of other companies. Adjusted net income and adjusted EBITDAX should not be considered an alternative to, or more meaningful than, net income as determined in accordance with GAAP. Certain items excluded from free cash flow, adjusted net income, adjusted EBITDAX, adjusted cash operating costs, adjusted cash operating margin, adjusted operating income margin and return on capital employed are significant components in understanding and assessing a company’s financial performance and should not be construed as an inference that its results will be unaffected by unusual or non-recurring terms. As performance measures, adjusted net income, adjusted EBITDAX, adjusted cash operating costs, adjusted cash operating margin, adjusted operating income margin and return on capital employed may be useful to investors in facilitating comparisons to others in the Company’s industry because certain items can vary substantially in the oil and gas industry from company to company depending upon accounting methods, book value of assets, and capital structure, among other factors. Management believes excluding these items facilitates investors and analysts in evaluating and comparing the underlying operating and financial performance of our business from period to period by eliminating differences caused by the existence and timing of certain expense and income items that would not otherwise be apparent on a GAAP basis. As a liquidity measure, management believes free cash flow is useful for investors and widely accepted by those following the oil and gas industry as financial indicators of a company’s ability to generate cash to internally fund drilling and completion activities, fund acquisitions, and service debt. Our presentation of adjusted net income, adjusted EBITDAX, free cash flow, adjusted cash operating costs, adjusted cash operating margin, adjusted operating income margin and return on capital employed may not be comparable to similar measures of other companies in our industry. Reconciliations of non-GAAP measures included herein to the nearest corresponding GAAP measure are included in this presentation. INDUSTRY AND MARKET DATA This presentation has been prepared by Magnolia and includes market data and other statistical information from sources believed by Magnolia to be reliable, including independent industry publications, governmental publications or other published independent sources. Some data is also based on the good faith estimates of Magnolia, which are derived from its review of internal sources as well as the independent sources described above. Although Magnolia believes these sources are reliable, it has not independently verified the information and cannot guarantee its accuracy and completeness.
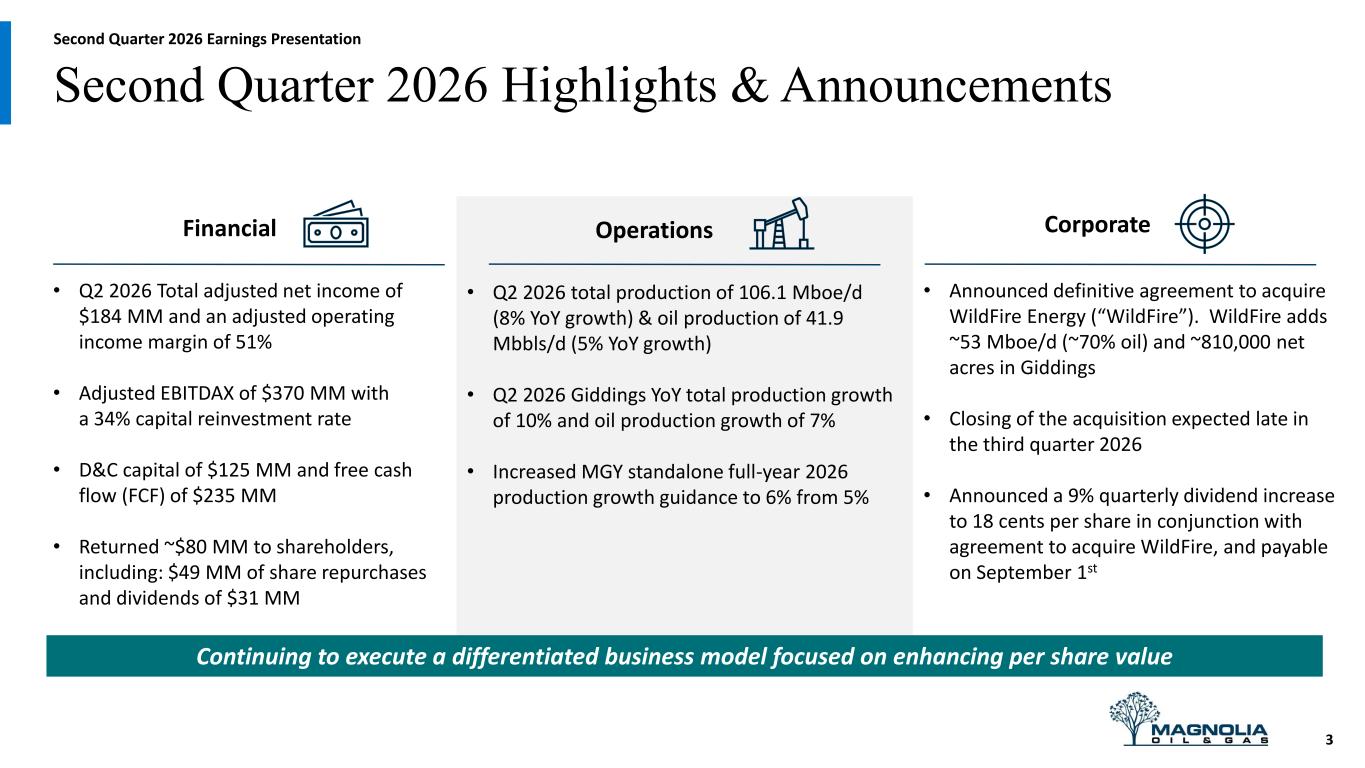
Second Quarter 2026 Highlights & Announcements OperationsFinancial Corporate • Q2 2026 Total adjusted net income of $184 MM and an adjusted operating income margin of 51% • Adjusted EBITDAX of $370 MM with a 34% capital reinvestment rate • D&C capital of $125 MM and free cash flow (FCF) of $235 MM • Returned ~$80 MM to shareholders, including: $49 MM of share repurchases and dividends of $31 MM • Announced definitive agreement to acquire WildFire Energy (“WildFire”). WildFire adds ~53 Mboe/d (~70% oil) and ~810,000 net acres in Giddings • Closing of the acquisition expected late in the third quarter 2026 • Announced a 9% quarterly dividend increase to 18 cents per share in conjunction with agreement to acquire WildFire, and payable on September 1st • Q2 2026 total production of 106.1 Mboe/d (8% YoY growth) & oil production of 41.9 Mbbls/d (5% YoY growth) • Q2 2026 Giddings YoY total production growth of 10% and oil production growth of 7% • Increased MGY standalone full-year 2026 production growth guidance to 6% from 5% Second Quarter 2026 Earnings Presentation 3 Continuing to execute a differentiated business model focused on enhancing per share value
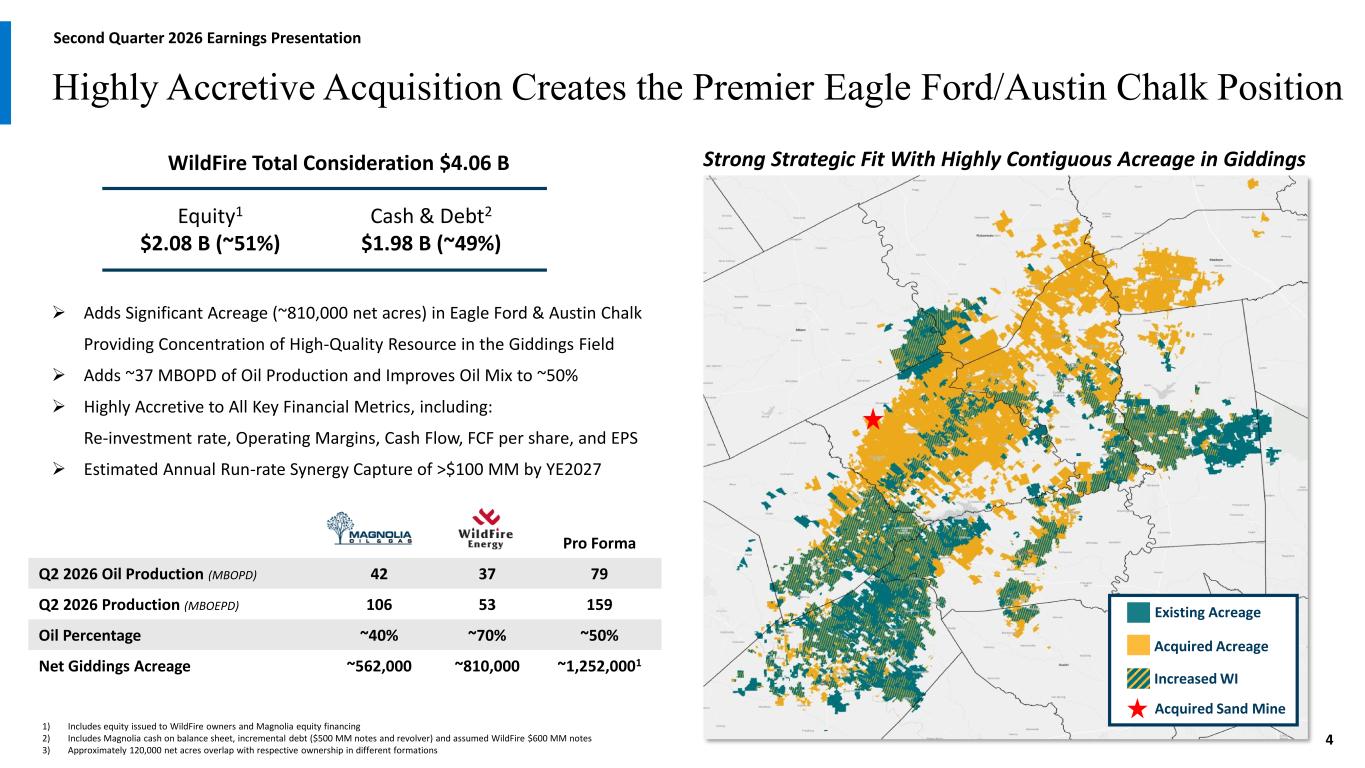
Pro Forma Q2 2026 Oil Production (MBOPD) 42 37 79 Q2 2026 Production (MBOEPD) 106 53 159 Oil Percentage ~40% ~70% ~50% Net Giddings Acreage ~562,000 ~810,000 ~1,252,0001 Highly Accretive Acquisition Creates the Premier Eagle Ford/Austin Chalk Position WildFire Total Consideration $4.06 B ➢ Adds Significant Acreage (~810,000 net acres) in Eagle Ford & Austin Chalk Providing Concentration of High-Quality Resource in the Giddings Field ➢ Adds ~37 MBOPD of Oil Production and Improves Oil Mix to ~50% ➢ Highly Accretive to All Key Financial Metrics, including: Re-investment rate, Operating Margins, Cash Flow, FCF per share, and EPS ➢ Estimated Annual Run-rate Synergy Capture of >$100 MM by YE2027 1) Includes equity issued to WildFire owners and Magnolia equity financing 2) Includes Magnolia cash on balance sheet, incremental debt ($500 MM notes and revolver) and assumed WildFire $600 MM notes 3) Approximately 120,000 net acres overlap with respective ownership in different formations Second Quarter 2026 Earnings Presentation Strong Strategic Fit With Highly Contiguous Acreage in Giddings Existing Acreage Acquired Acreage Increased WI Acquired Sand Mine Equity1 $2.08 B (~51%) Cash & Debt2 $1.98 B (~49%) 4
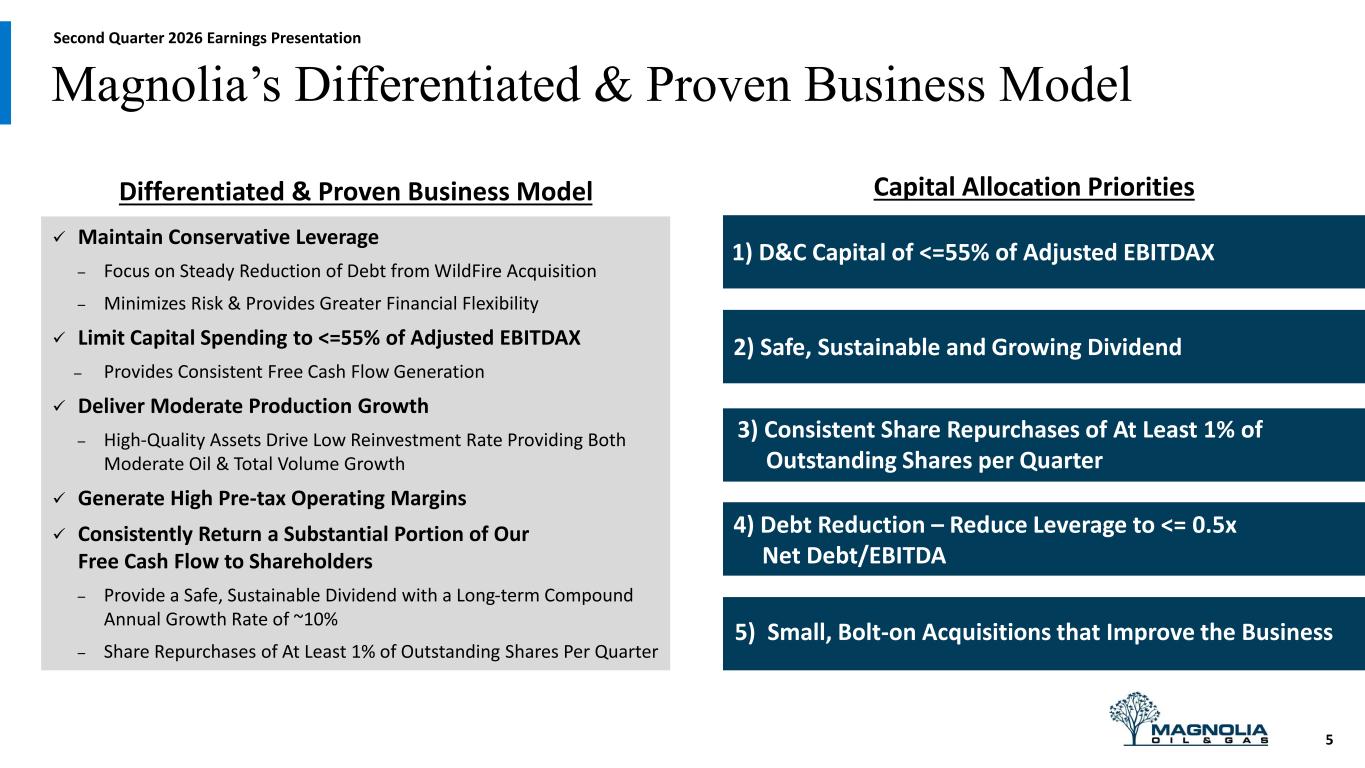
Magnolia’s Differentiated & Proven Business Model ✓ Maintain Conservative Leverage – Focus on Steady Reduction of Debt from WildFire Acquisition – Minimizes Risk & Provides Greater Financial Flexibility ✓ Limit Capital Spending to <=55% of Adjusted EBITDAX ̶ Provides Consistent Free Cash Flow Generation ✓ Deliver Moderate Production Growth – High-Quality Assets Drive Low Reinvestment Rate Providing Both Moderate Oil & Total Volume Growth ✓ Generate High Pre-tax Operating Margins ✓ Consistently Return a Substantial Portion of Our Free Cash Flow to Shareholders – Provide a Safe, Sustainable Dividend with a Long-term Compound Annual Growth Rate of ~10% – Share Repurchases of At Least 1% of Outstanding Shares Per Quarter Capital Allocation Priorities 1) D&C Capital of <=55% of Adjusted EBITDAX 2) Safe, Sustainable and Growing Dividend 3) Consistent Share Repurchases of At Least 1% of Outstanding Shares per Quarter 5) Small, Bolt-on Acquisitions that Improve the Business 4) Debt Reduction – Reduce Leverage to <= 0.5x Net Debt/EBITDA Differentiated & Proven Business Model 5 Second Quarter 2026 Earnings Presentation
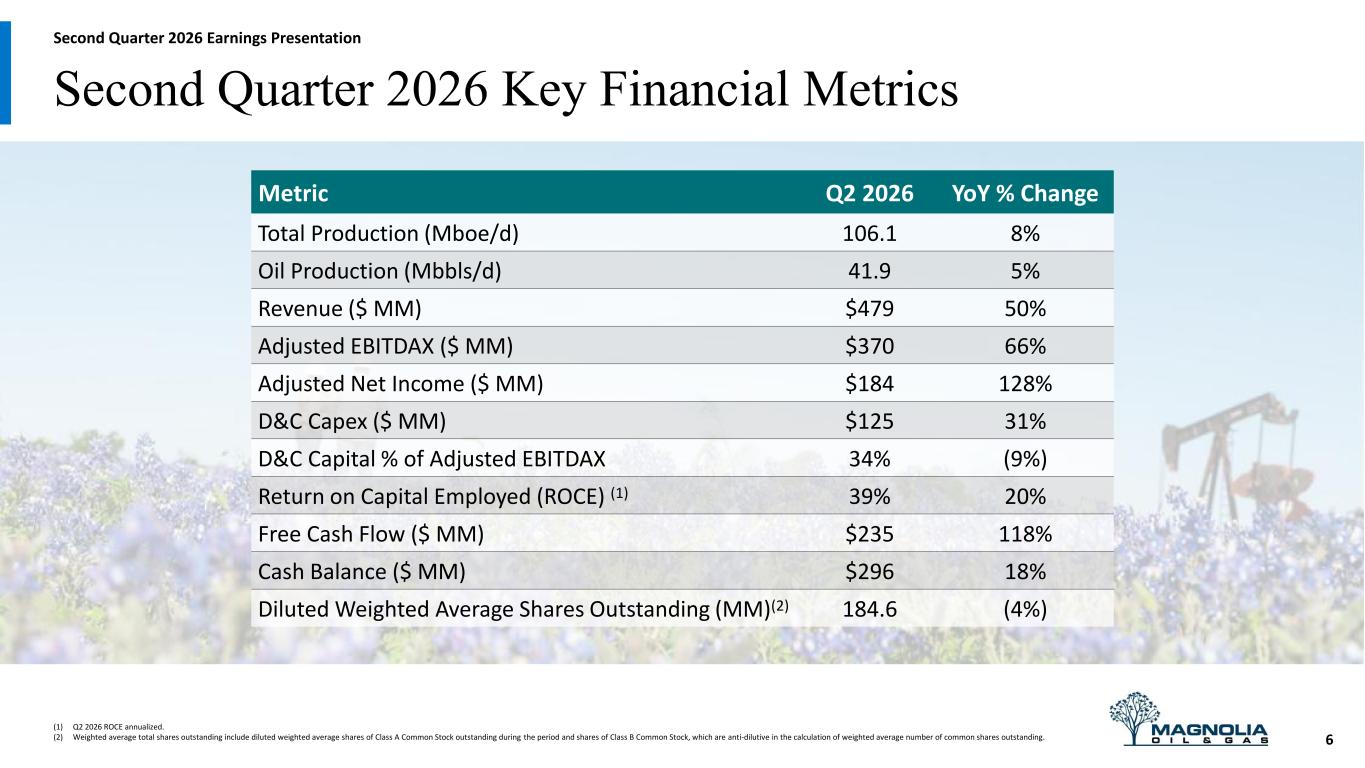
Second Quarter 2026 Key Financial Metrics (1) Q2 2026 ROCE annualized. (2) Weighted average total shares outstanding include diluted weighted average shares of Class A Common Stock outstanding during the period and shares of Class B Common Stock, which are anti-dilutive in the calculation of weighted average number of common shares outstanding. 6 Metric Q2 2026 YoY % Change Total Production (Mboe/d) 106.1 8% Oil Production (Mbbls/d) 41.9 5% Revenue ($ MM) $479 50% Adjusted EBITDAX ($ MM) $370 66% Adjusted Net Income ($ MM) $184 128% D&C Capex ($ MM) $125 31% D&C Capital % of Adjusted EBITDAX 34% (9%) Return on Capital Employed (ROCE) (1) 39% 20% Free Cash Flow ($ MM) $235 118% Cash Balance ($ MM) $296 18% Diluted Weighted Average Shares Outstanding (MM)(2) 184.6 (4%) Second Quarter 2026 Earnings Presentation
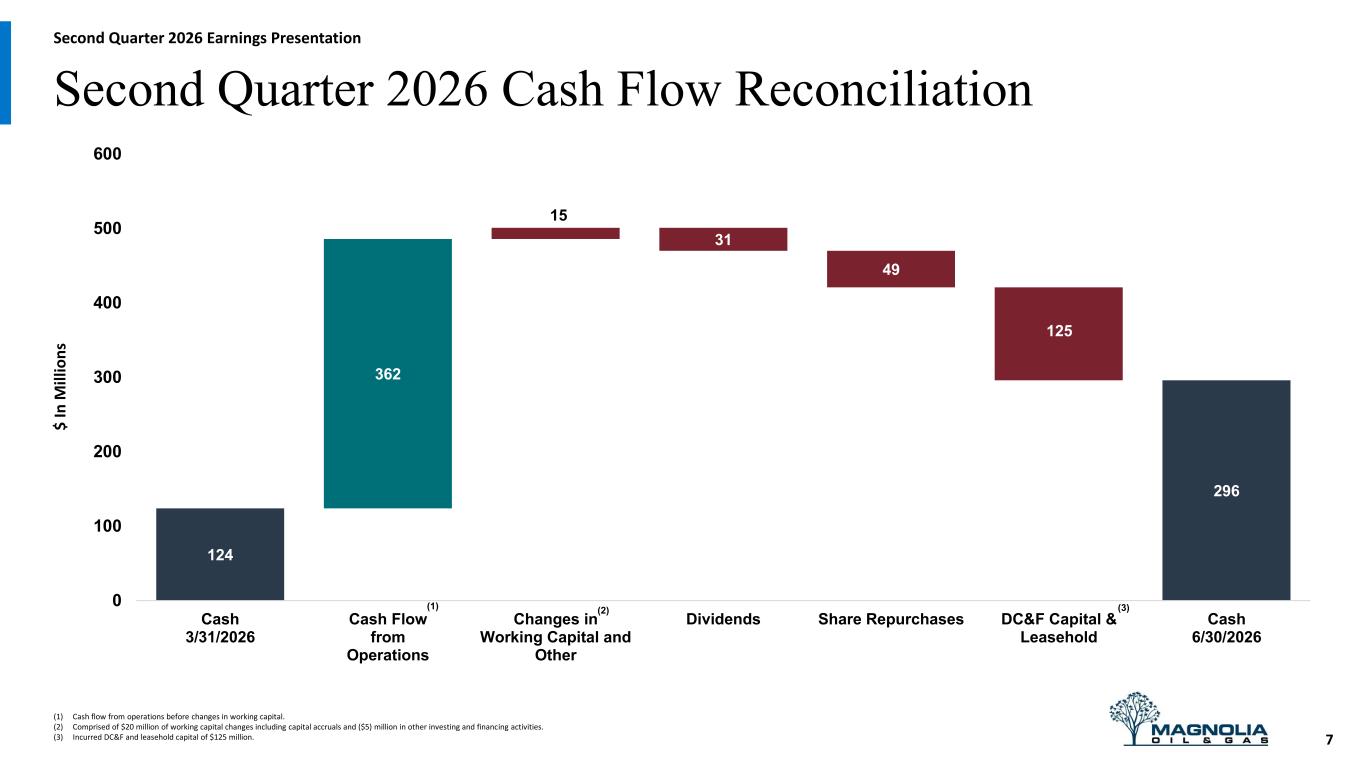
124 362 15 31 49 125 296 0 100 200 300 400 500 600 Cash 3/31/2026 Cash Flow from Operations Changes in Working Capital and Other Dividends Share Repurchases DC&F Capital & Leasehold Cash 6/30/2026 (1) (2) (3) Second Quarter 2026 Cash Flow Reconciliation (1) Cash flow from operations before changes in working capital. (2) Comprised of $20 million of working capital changes including capital accruals and ($5) million in other investing and financing activities. (3) Incurred DC&F and leasehold capital of $125 million. 7 $ I n M ill io n s Second Quarter 2026 Earnings Presentation
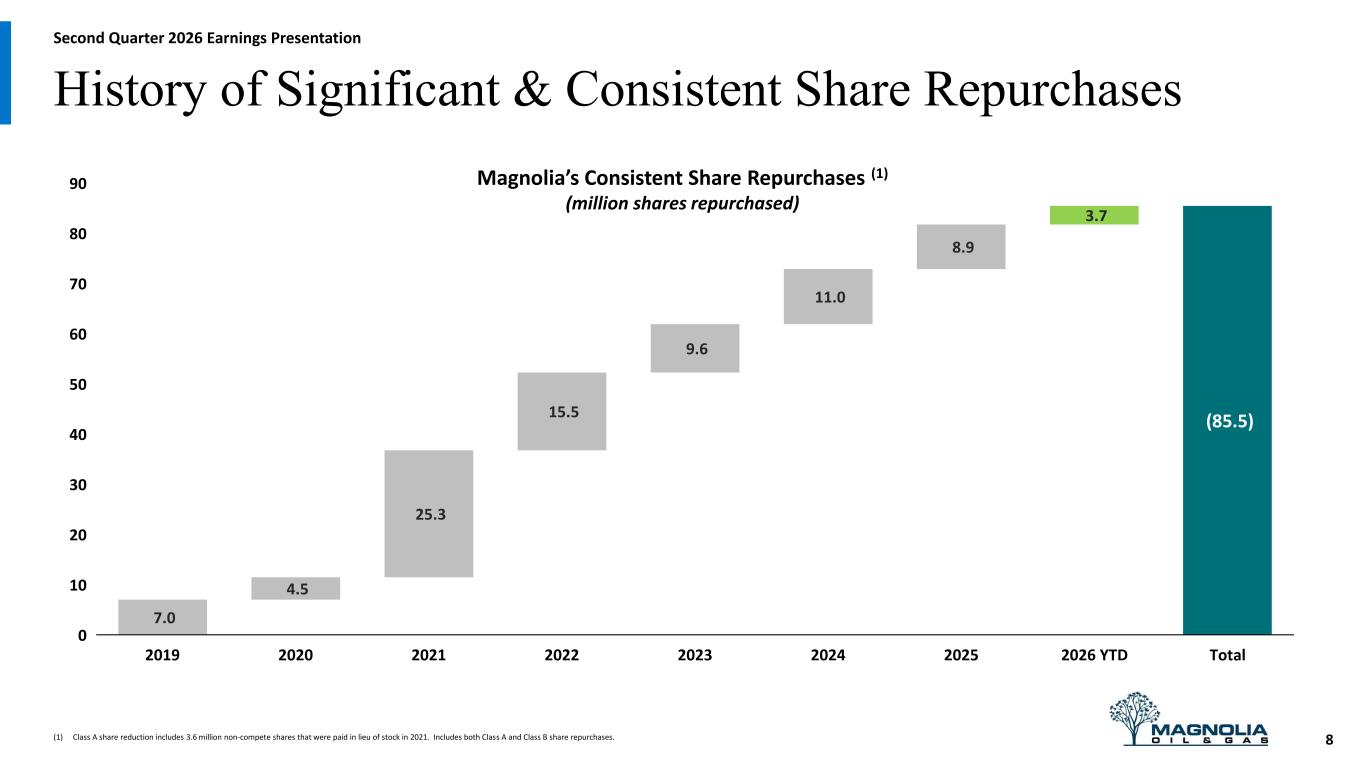
(1) Class A share reduction includes 3.6 million non-compete shares that were paid in lieu of stock in 2021. Includes both Class A and Class B share repurchases. History of Significant & Consistent Share Repurchases 7.0 4.5 25.3 15.5 9.6 11.0 8.9 3.7 (85.5) 2019 2020 2021 2022 2023 2024 2025 2026 YTD Total 0 10 20 30 40 50 60 70 80 90 8 Magnolia’s Consistent Share Repurchases (1) (million shares repurchased) Second Quarter 2026 Earnings Presentation
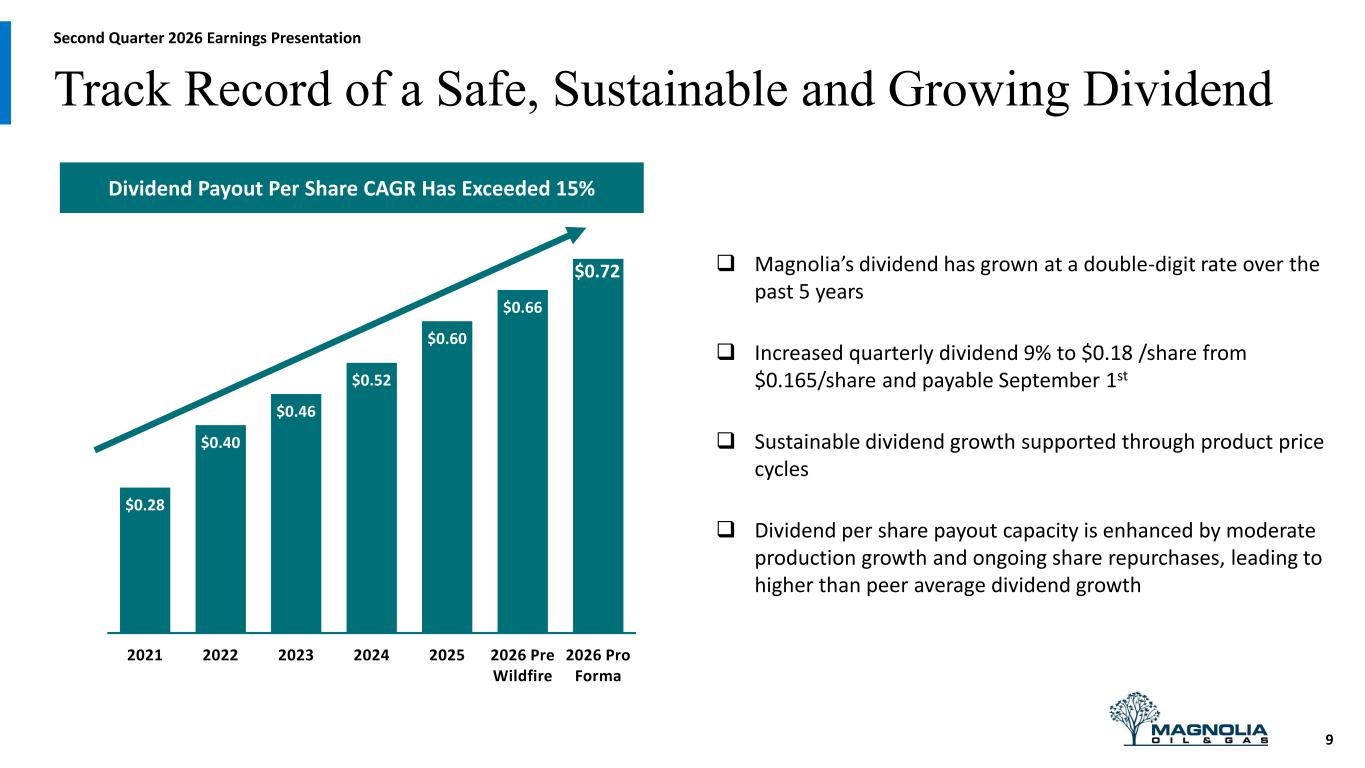
$0.28 $0.40 $0.46 $0.52 $0.60 $0.66 2021 2022 2023 2024 2025 2026 Pre Wildfire 2026 Pro Forma Track Record of a Safe, Sustainable and Growing Dividend ❑ Magnolia’s dividend has grown at a double-digit rate over the past 5 years ❑ Increased quarterly dividend 9% to $0.18 /share from $0.165/share and payable September 1st ❑ Sustainable dividend growth supported through product price cycles ❑ Dividend per share payout capacity is enhanced by moderate production growth and ongoing share repurchases, leading to higher than peer average dividend growth 9 Dividend Payout Per Share CAGR Has Exceeded 15% $0.72 Second Quarter 2026 Earnings Presentation
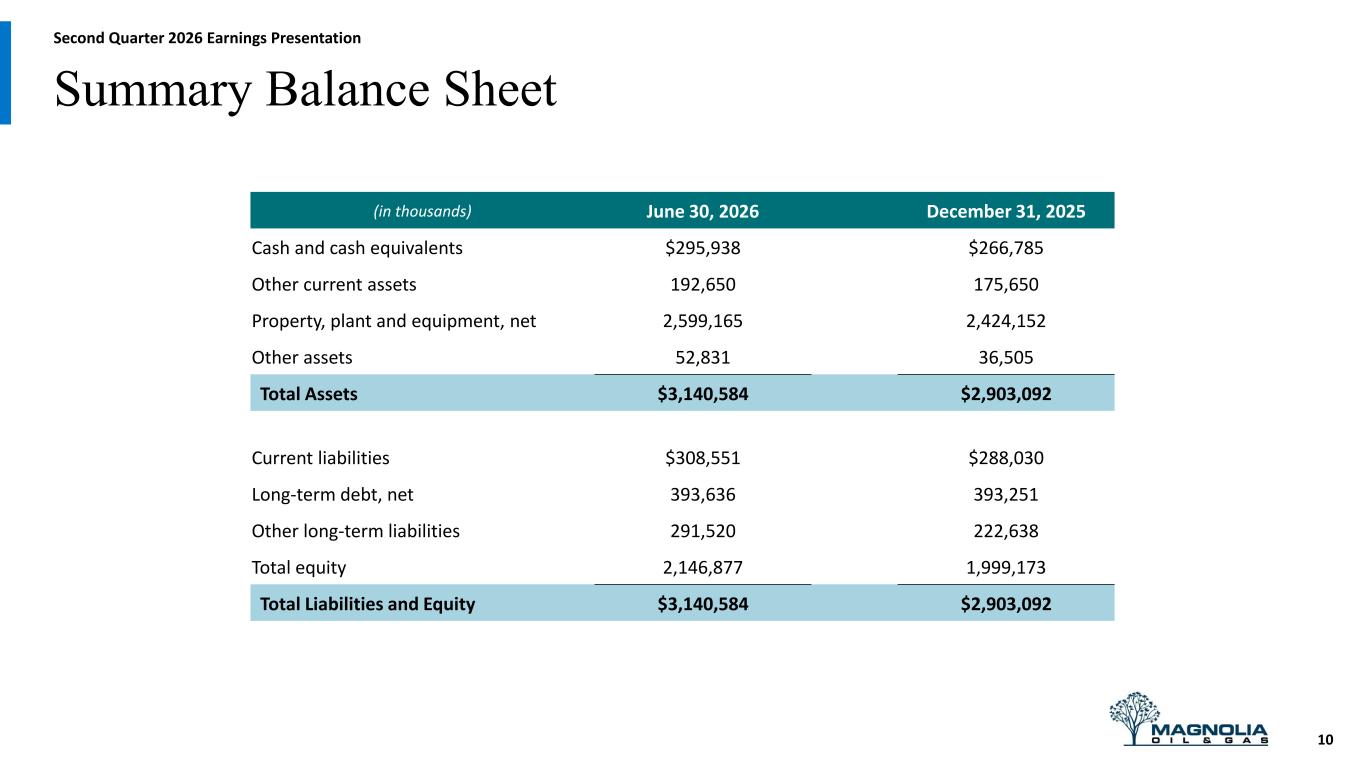
Summary Balance Sheet 10 (in thousands) June 30, 2026 December 31, 2025 Cash and cash equivalents $295,938 $266,785 Other current assets 192,650 175,650 Property, plant and equipment, net 2,599,165 2,424,152 Other assets 52,831 36,505 Total Assets $3,140,584 $2,903,092 Current liabilities $308,551 $288,030 Long-term debt, net 393,636 393,251 Other long-term liabilities 291,520 222,638 Total equity 2,146,877 1,999,173 Total Liabilities and Equity $3,140,584 $2,903,092 Second Quarter 2026 Earnings Presentation
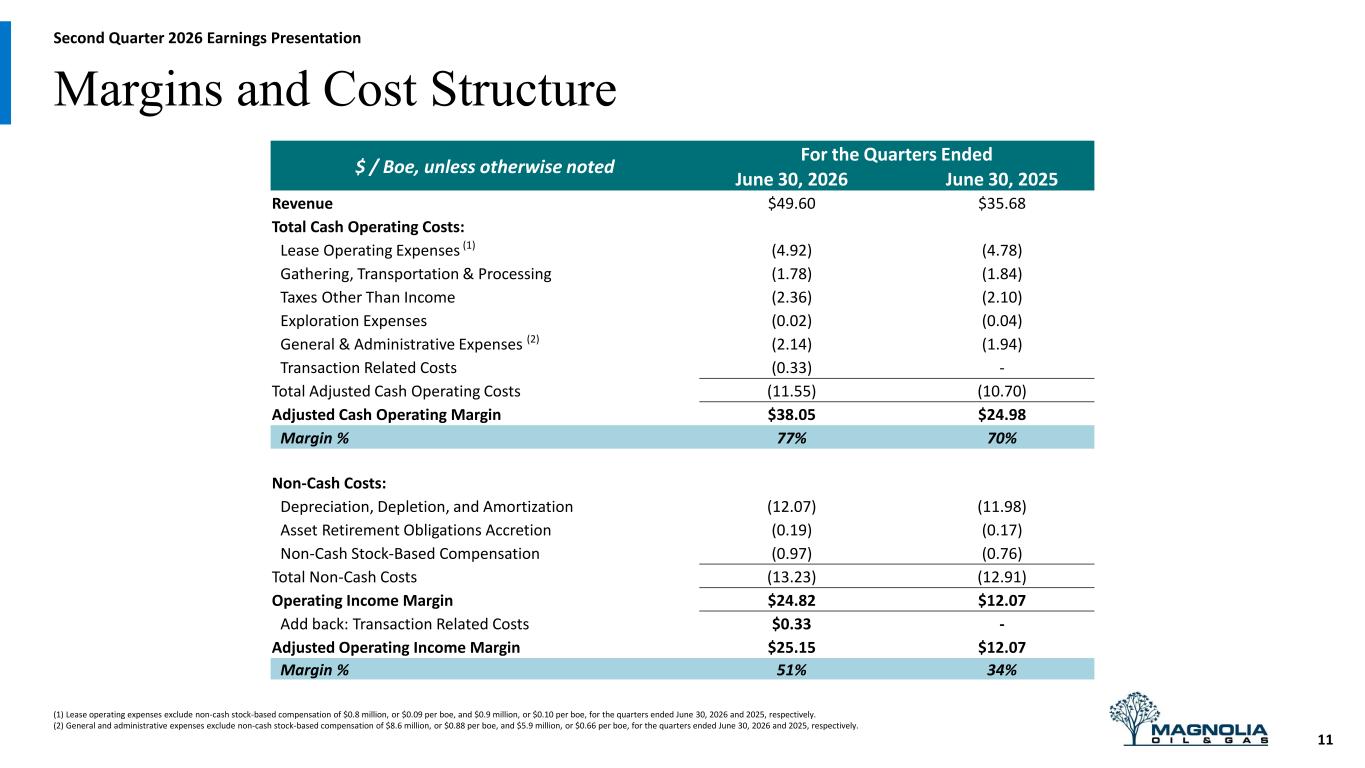
Margins and Cost Structure 11 $ / Boe, unless otherwise noted For the Quarters Ended June 30, 2026 June 30, 2025 Revenue $49.60 $35.68 Total Cash Operating Costs: Lease Operating Expenses (1) (4.92) (4.78) Gathering, Transportation & Processing (1.78) (1.84) Taxes Other Than Income (2.36) (2.10) Exploration Expenses (0.02) (0.04) General & Administrative Expenses (2) (2.14) (1.94) Transaction Related Costs (0.33) - Total Adjusted Cash Operating Costs (11.55) (10.70) Adjusted Cash Operating Margin $38.05 $24.98 Margin % 77% 70% Non-Cash Costs: Depreciation, Depletion, and Amortization (12.07) (11.98) Asset Retirement Obligations Accretion (0.19) (0.17) Non-Cash Stock-Based Compensation (0.97) (0.76) Total Non-Cash Costs (13.23) (12.91) Operating Income Margin $24.82 $12.07 Add back: Transaction Related Costs $0.33 - Adjusted Operating Income Margin $25.15 $12.07 Margin % 51% 34% (1) Lease operating expenses exclude non-cash stock-based compensation of $0.8 million, or $0.09 per boe, and $0.9 million, or $0.10 per boe, for the quarters ended June 30, 2026 and 2025, respectively. (2) General and administrative expenses exclude non-cash stock-based compensation of $8.6 million, or $0.88 per boe, and $5.9 million, or $0.66 per boe, for the quarters ended June 30, 2026 and 2025, respectively. Second Quarter 2026 Earnings Presentation
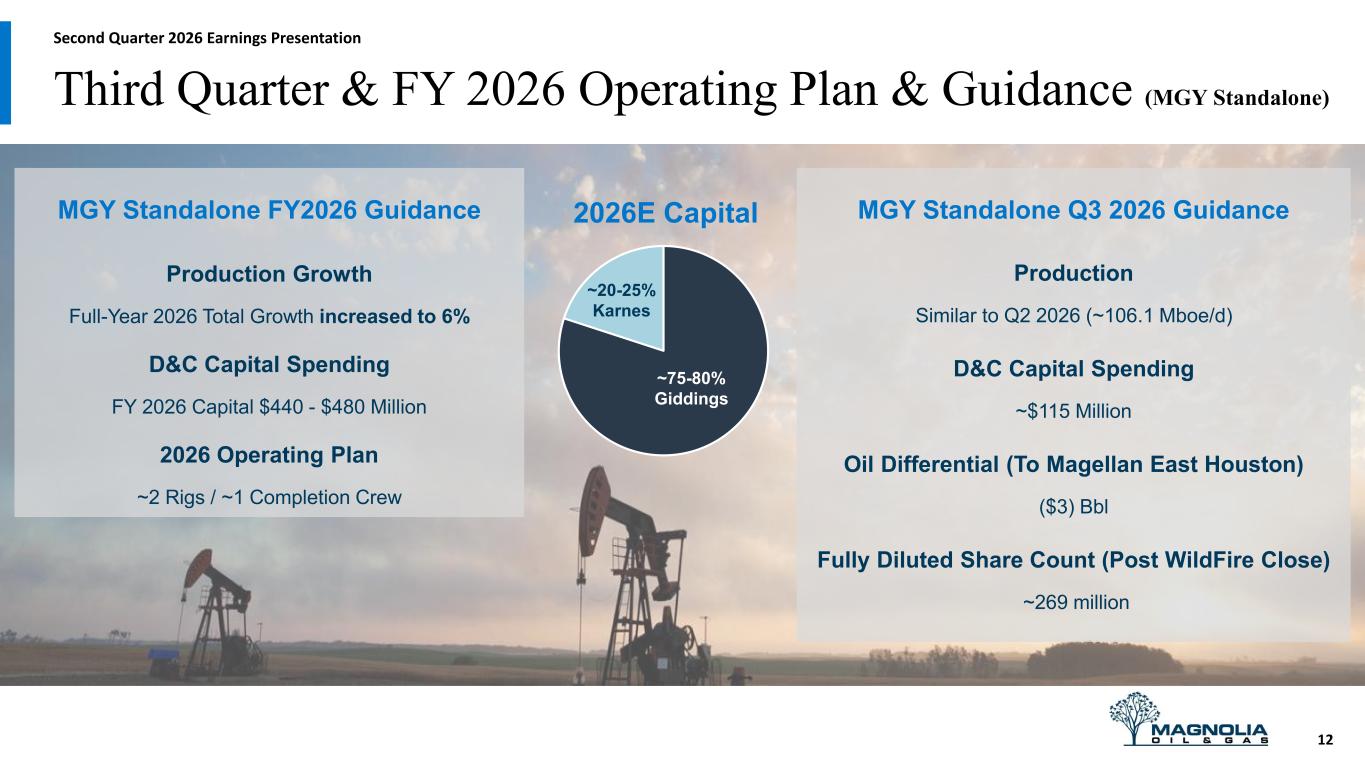
Third Quarter & FY 2026 Operating Plan & Guidance (MGY Standalone) MGY Standalone FY2026 Guidance Production Growth Full-Year 2026 Total Growth increased to 6% D&C Capital Spending FY 2026 Capital $440 - $480 Million 2026 Operating Plan ~2 Rigs / ~1 Completion Crew 2026E Capital ~20-25% Karnes ~75-80% Giddings MGY Standalone Q3 2026 Guidance Production Similar to Q2 2026 (~106.1 Mboe/d) D&C Capital Spending ~$115 Million Oil Differential (To Magellan East Houston) ($3) Bbl Fully Diluted Share Count (Post WildFire Close) ~269 million 12 Second Quarter 2026 Earnings Presentation
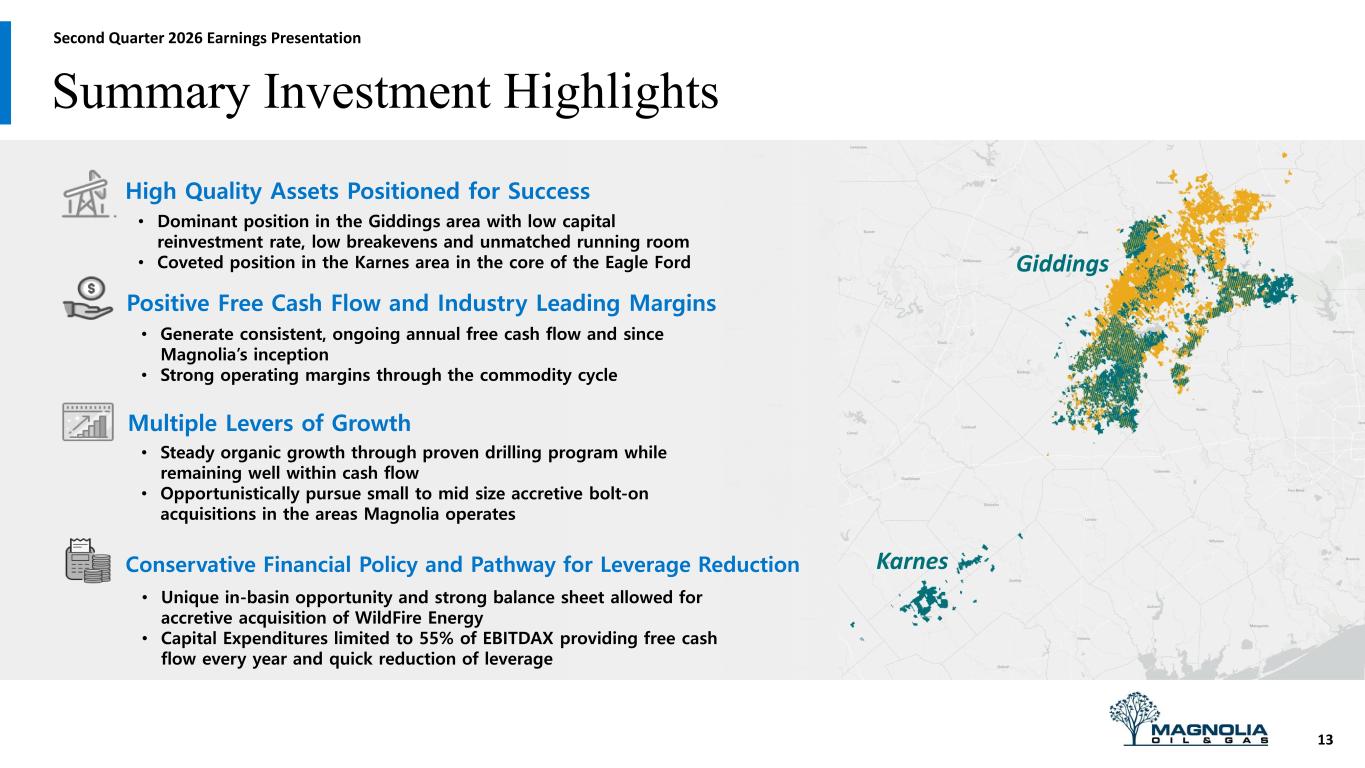
Summary Investment Highlights 13 Giddings Karnes High Quality Assets Positioned for Success • Dominant position in the Giddings area with low capital reinvestment rate, low breakevens and unmatched running room • Coveted position in the Karnes area in the core of the Eagle Ford • Generate consistent, ongoing annual free cash flow and since Magnolia’s inception • Strong operating margins through the commodity cycle Positive Free Cash Flow and Industry Leading Margins Multiple Levers of Growth Conservative Financial Policy and Pathway for Leverage Reduction • Steady organic growth through proven drilling program while remaining well within cash flow • Opportunistically pursue small to mid size accretive bolt-on acquisitions in the areas Magnolia operates • Unique in-basin opportunity and strong balance sheet allowed for accretive acquisition of WildFire Energy • Capital Expenditures limited to 55% of EBITDAX providing free cash flow every year and quick reduction of leverage Second Quarter 2026 Earnings Presentation
Appendix
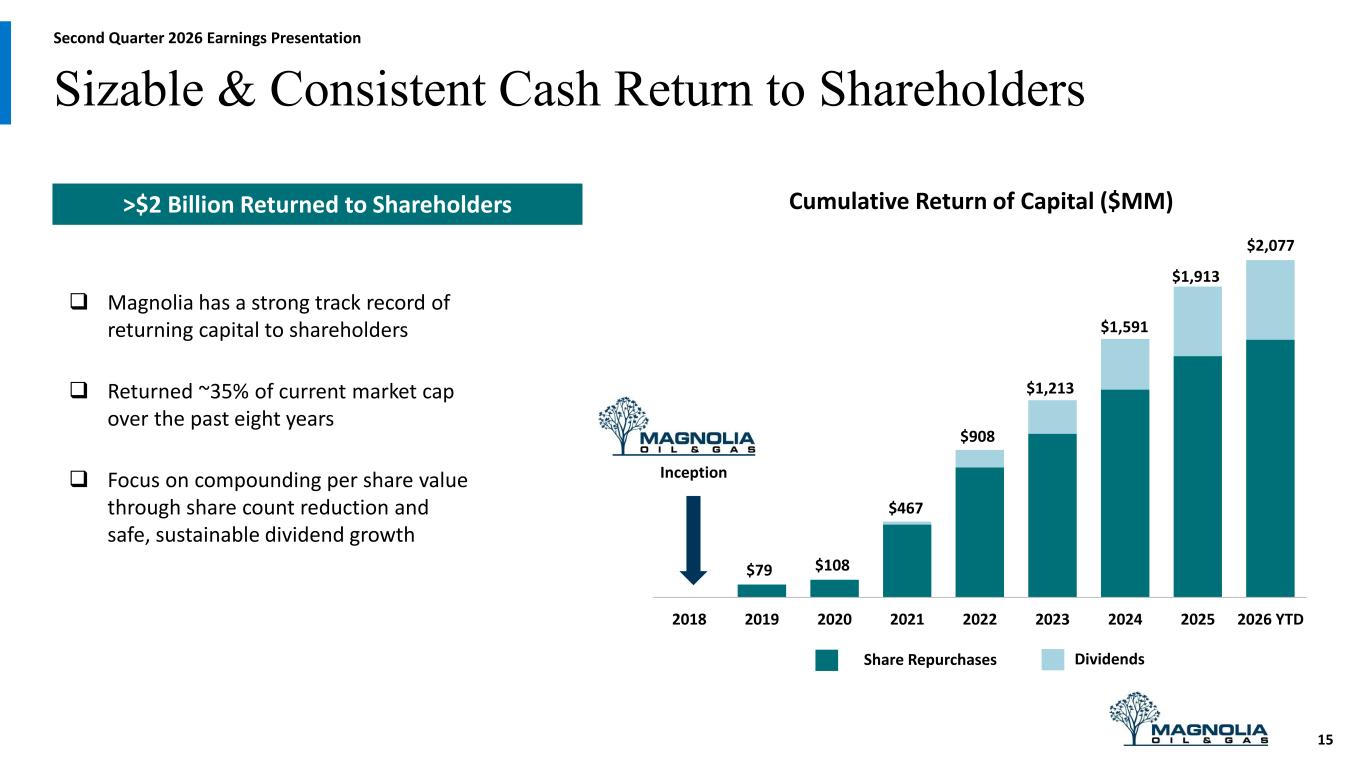
2018 2019 2020 2021 2022 2023 2024 2025 2026 YTD Sizable & Consistent Cash Return to Shareholders ❑ Magnolia has a strong track record of returning capital to shareholders ❑ Returned ~35% of current market cap over the past eight years ❑ Focus on compounding per share value through share count reduction and safe, sustainable dividend growth Inception Cumulative Return of Capital ($MM) $79 $108 $467 $908 $1,213 >$2 Billion Returned to Shareholders Share Repurchases Dividends $1,591 $1,913 15 $2,077 Second Quarter 2026 Earnings Presentation
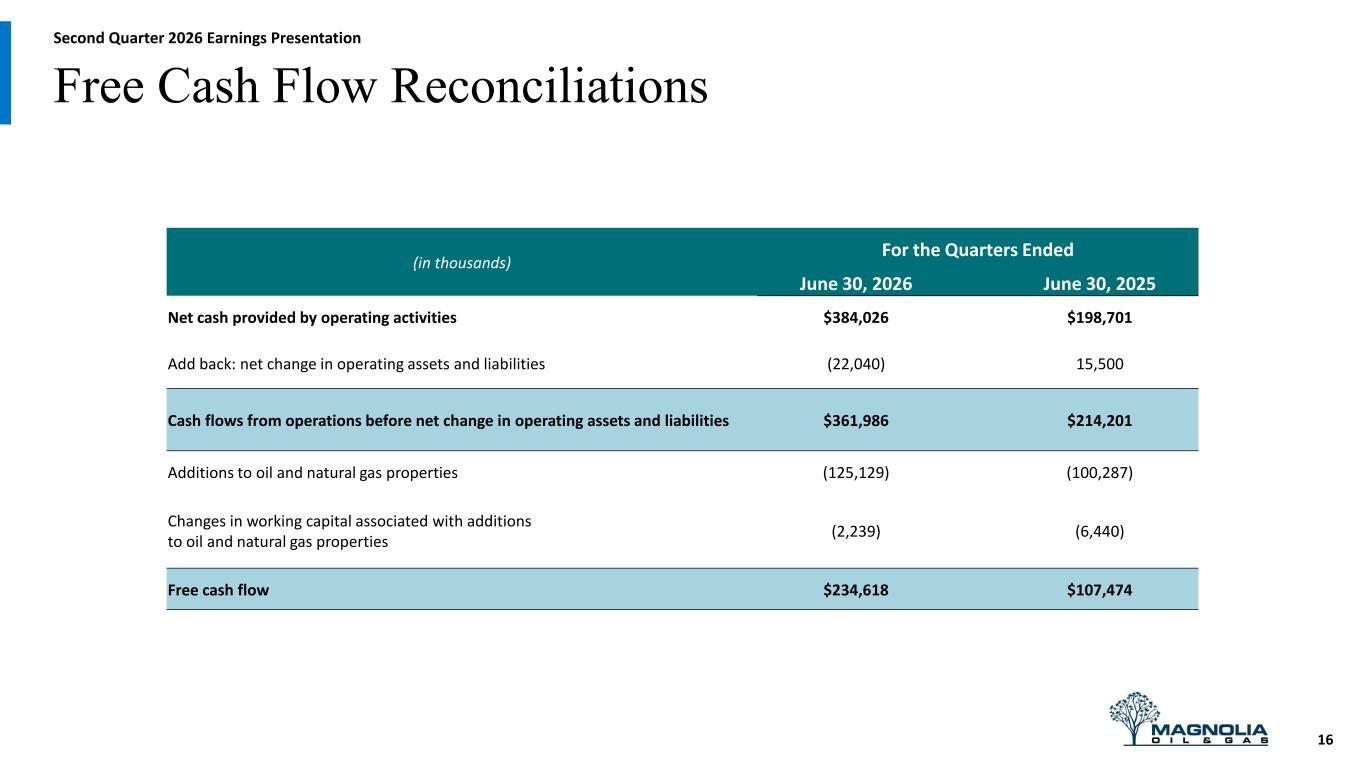
Free Cash Flow Reconciliations 16 (in thousands) For the Quarters Ended June 30, 2026 June 30, 2025 Net cash provided by operating activities $384,026 $198,701 Add back: net change in operating assets and liabilities (22,040) 15,500 Cash flows from operations before net change in operating assets and liabilities $361,986 $214,201 Additions to oil and natural gas properties (125,129) (100,287) Changes in working capital associated with additions to oil and natural gas properties (2,239) (6,440) Free cash flow $234,618 $107,474 Second Quarter 2026 Earnings Presentation
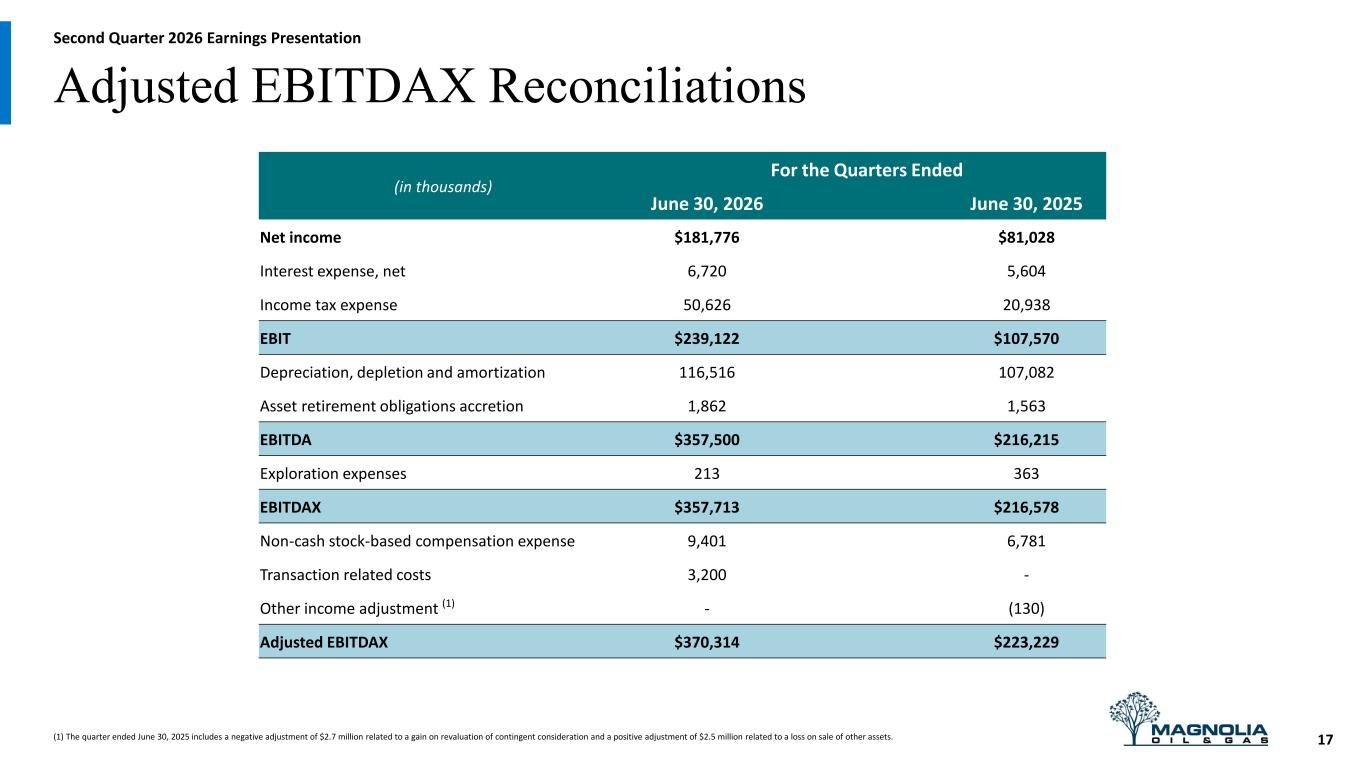
Adjusted EBITDAX Reconciliations 17 (in thousands) For the Quarters Ended June 30, 2026 June 30, 2025 Net income $181,776 $81,028 Interest expense, net 6,720 5,604 Income tax expense 50,626 20,938 EBIT $239,122 $107,570 Depreciation, depletion and amortization 116,516 107,082 Asset retirement obligations accretion 1,862 1,563 EBITDA $357,500 $216,215 Exploration expenses 213 363 EBITDAX $357,713 $216,578 Non-cash stock-based compensation expense 9,401 6,781 Transaction related costs 3,200 - Other income adjustment (1) - (130) Adjusted EBITDAX $370,314 $223,229 (1) The quarter ended June 30, 2025 includes a negative adjustment of $2.7 million related to a gain on revaluation of contingent consideration and a positive adjustment of $2.5 million related to a loss on sale of other assets. Second Quarter 2026 Earnings Presentation
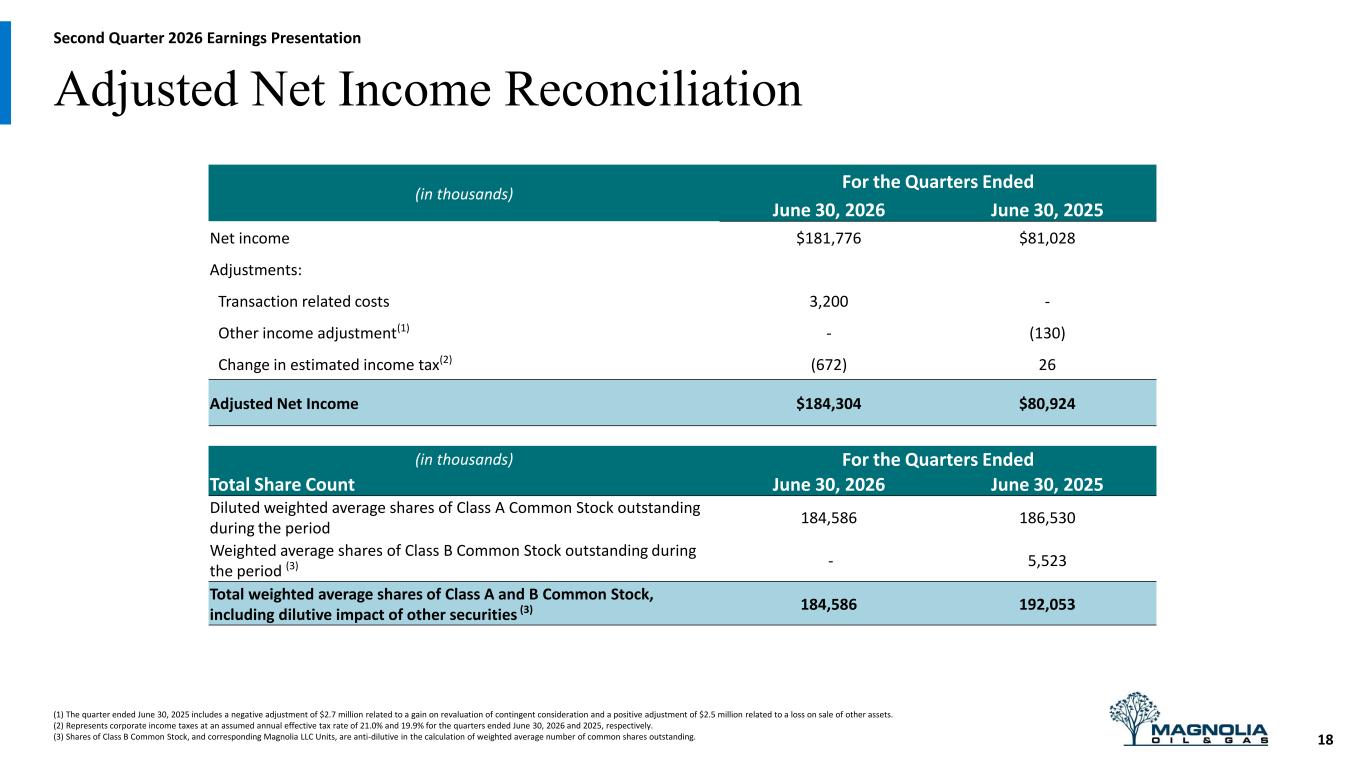
Adjusted Net Income Reconciliation 18 (1) The quarter ended June 30, 2025 includes a negative adjustment of $2.7 million related to a gain on revaluation of contingent consideration and a positive adjustment of $2.5 million related to a loss on sale of other assets. (2) Represents corporate income taxes at an assumed annual effective tax rate of 21.0% and 19.9% for the quarters ended June 30, 2026 and 2025, respectively. (3) Shares of Class B Common Stock, and corresponding Magnolia LLC Units, are anti-dilutive in the calculation of weighted average number of common shares outstanding. (in thousands) For the Quarters Ended June 30, 2026 June 30, 2025 Net income $181,776 $81,028 Adjustments: Transaction related costs 3,200 - Other income adjustment(1) - (130) Change in estimated income tax(2) (672) 26 Adjusted Net Income $184,304 $80,924 (in thousands) For the Quarters Ended Total Share Count June 30, 2026 June 30, 2025 Diluted weighted average shares of Class A Common Stock outstanding during the period 184,586 186,530 Weighted average shares of Class B Common Stock outstanding during the period (3) - 5,523 Total weighted average shares of Class A and B Common Stock, including dilutive impact of other securities (3) 184,586 192,053 Second Quarter 2026 Earnings Presentation
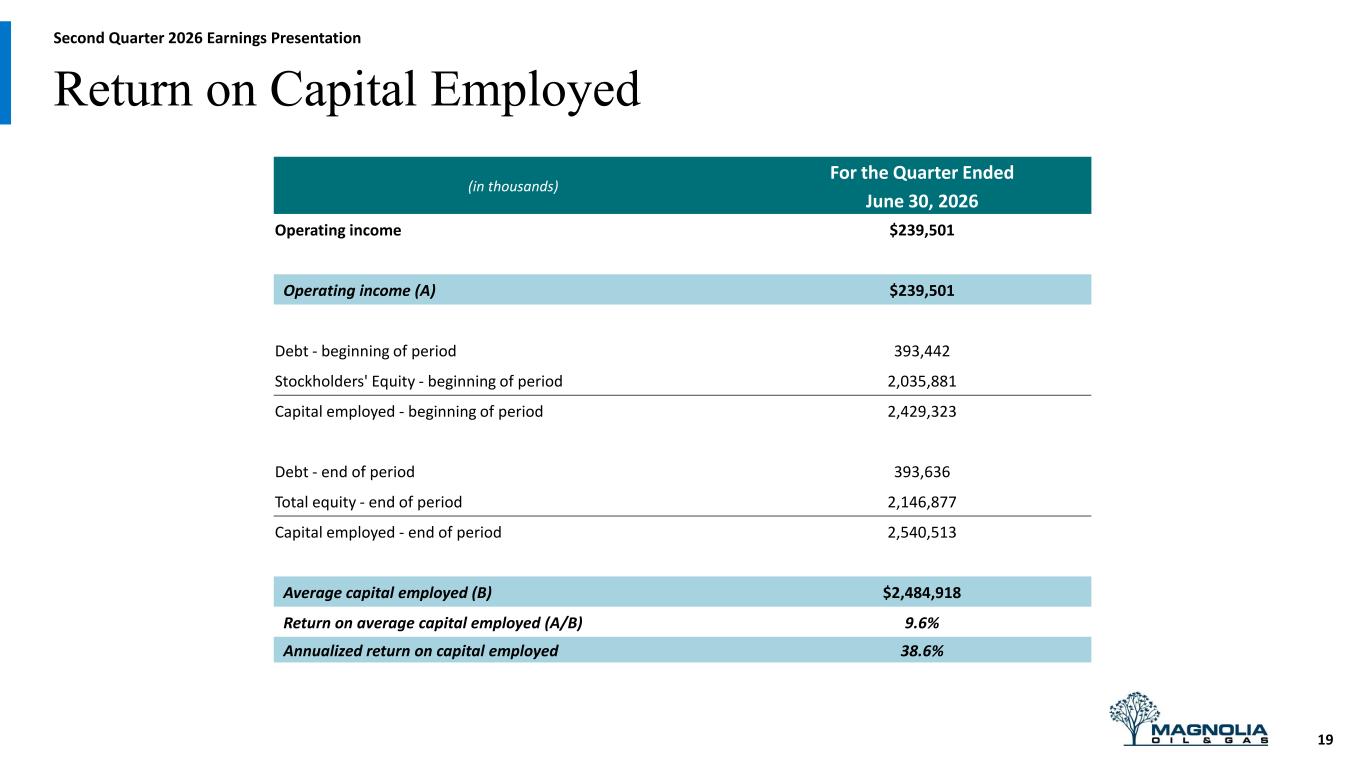
Return on Capital Employed 19 (in thousands) For the Quarter Ended June 30, 2026 Operating income $239,501 Operating income (A) $239,501 Debt - beginning of period 393,442 Stockholders' Equity - beginning of period 2,035,881 Capital employed - beginning of period 2,429,323 Debt - end of period 393,636 Total equity - end of period 2,146,877 Capital employed - end of period 2,540,513 Average capital employed (B) $2,484,918 Return on average capital employed (A/B) 9.6% Annualized return on capital employed 38.6% Second Quarter 2026 Earnings Presentation
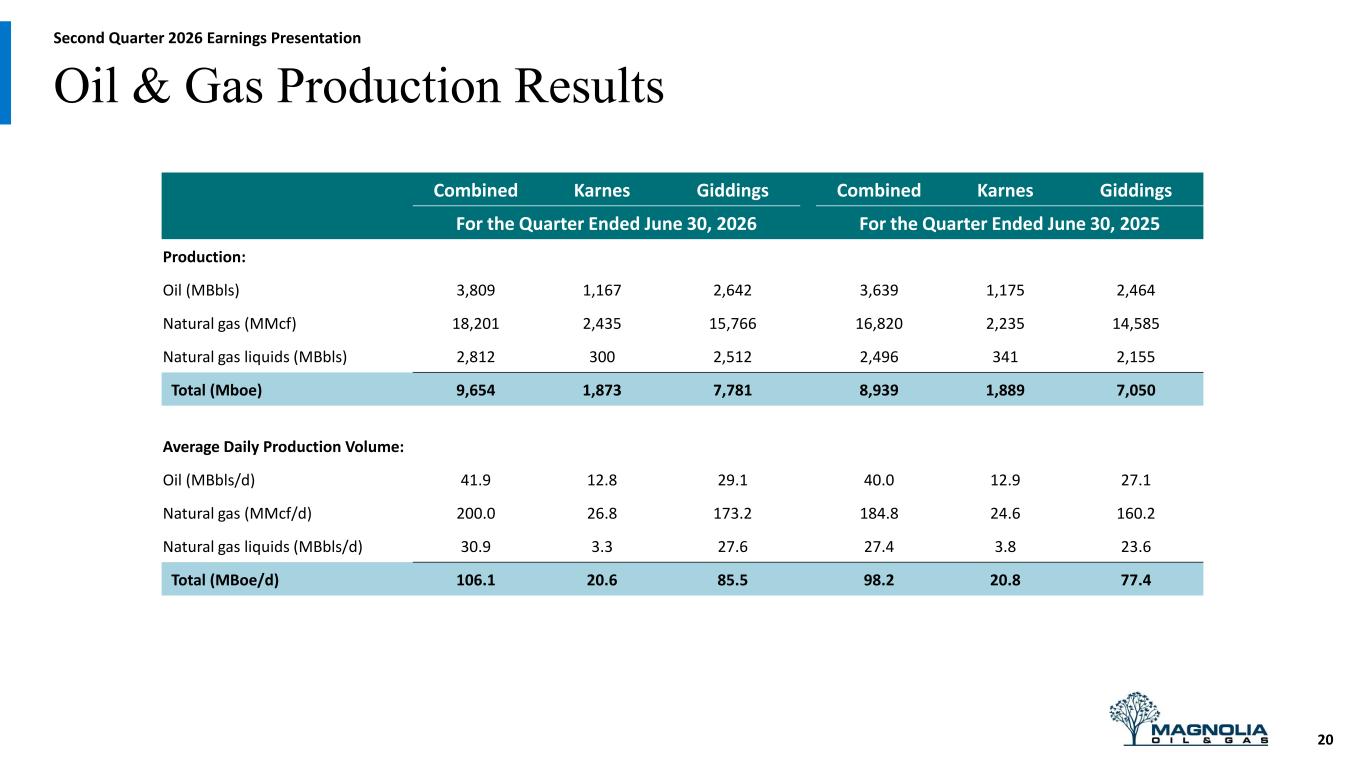
Oil & Gas Production Results 20 Combined Karnes Giddings Combined Karnes Giddings For the Quarter Ended June 30, 2026 For the Quarter Ended June 30, 2025 Production: Oil (MBbls) 3,809 1,167 2,642 3,639 1,175 2,464 Natural gas (MMcf) 18,201 2,435 15,766 16,820 2,235 14,585 Natural gas liquids (MBbls) 2,812 300 2,512 2,496 341 2,155 Total (Mboe) 9,654 1,873 7,781 8,939 1,889 7,050 Average Daily Production Volume: Oil (MBbls/d) 41.9 12.8 29.1 40.0 12.9 27.1 Natural gas (MMcf/d) 200.0 26.8 173.2 184.8 24.6 160.2 Natural gas liquids (MBbls/d) 30.9 3.3 27.6 27.4 3.8 23.6 Total (MBoe/d) 106.1 20.6 85.5 98.2 20.8 77.4 Second Quarter 2026 Earnings Presentation
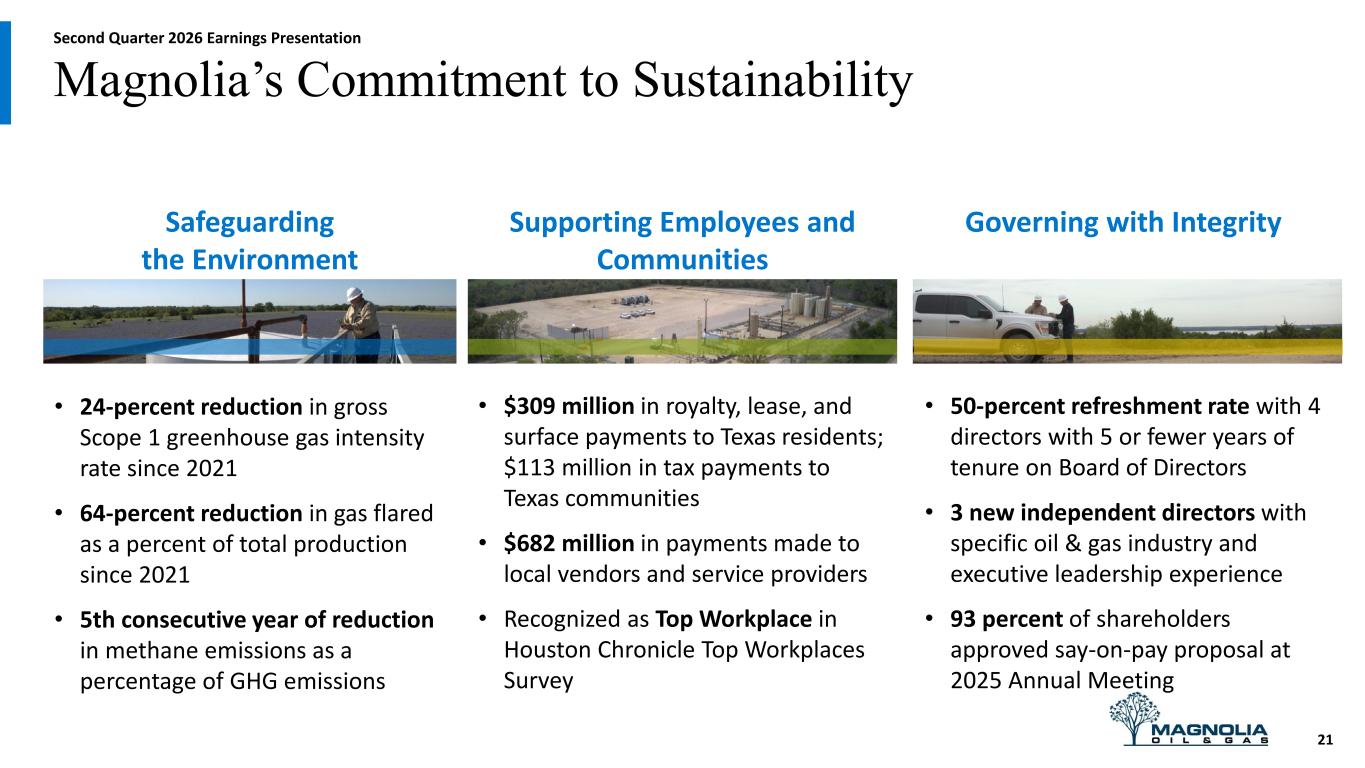
Magnolia’s Commitment to Sustainability Governing with IntegritySafeguarding the Environment Supporting Employees and Communities • 24-percent reduction in gross Scope 1 greenhouse gas intensity rate since 2021 • 64-percent reduction in gas flared as a percent of total production since 2021 • 5th consecutive year of reduction in methane emissions as a percentage of GHG emissions • $309 million in royalty, lease, and surface payments to Texas residents; $113 million in tax payments to Texas communities • $682 million in payments made to local vendors and service providers • Recognized as Top Workplace in Houston Chronicle Top Workplaces Survey • 50-percent refreshment rate with 4 directors with 5 or fewer years of tenure on Board of Directors • 3 new independent directors with specific oil & gas industry and executive leadership experience • 93 percent of shareholders approved say-on-pay proposal at 2025 Annual Meeting 21 Second Quarter 2026 Earnings Presentation