Barclays 40th Annual Energy-Power Conference September 9, 2026 Copyright 2026 Baker Hughes Company. All rights reserved. The information contained in this document is proprietary property of Baker Hughes and its affiliates. It is used only for the benefit of Baker Hughes and may not be distributed, transmitted, reproduced, altered, or used for any purpose without the express written consent of Baker Hughes. Lorenzo Simonelli Chairman & CEO
This presentation (and oral statements made regarding the subjects of this presentation) may contain forward-looking statements within the meaning of Section 27A of the Securities Act of 1933, as amended, and Section 21E of the Securities Exchange Act of 1934, as amended (each a “forward-looking statement”). The words “anticipate,” “believe,” “ensure,” “expect,” “if,” “intend,” “estimate,” “project,” “foresee,” “forecasts,” “predict,” “outlook,” “guidance,” “aim,” “will,” “could,” “should,” “potential,” “would,” “may,” “probable,” “likely,” and similar expressions, and the negative thereof, are intended to identify forward-looking statements. There are many risks and uncertainties that could cause actual results to differ materially from our forward-looking statements. The inclusion of such statements should not be regarded as a representation that such plans, estimates or expectations will be achieved. These forward-looking statements are affected by the risk factors described in the Company’s annual report on Form 10-K of Baker Hughes Company (the “Company”) and those set forth from time to time in other filings with the Securities and Exchange Commission (“SEC”). The documents are available through the Company’s website at: https://www.investors.bakerhughes.com or through the SEC’s Electronic Data Gathering, Analysis, and Retrieval system at: www.sec.gov. Any forward-looking statements speak only as of the date of this presentation. We undertake no obligation to publicly update or revise any forward-looking statement, except as required by law. The Company presents its financial results in accordance with GAAP; however, management believes that using additional non-GAAP measures will enhance the evaluation of the profitability of the Company and its ongoing operations. See the Appendix of this presentation for a reconciliation of GAAP to non-GAAP financial measures. Certain images in this presentation were generated using artificial intelligence and are included for illustrative purposes only. Copyright 2026 Baker Hughes Company. All rights reserved.
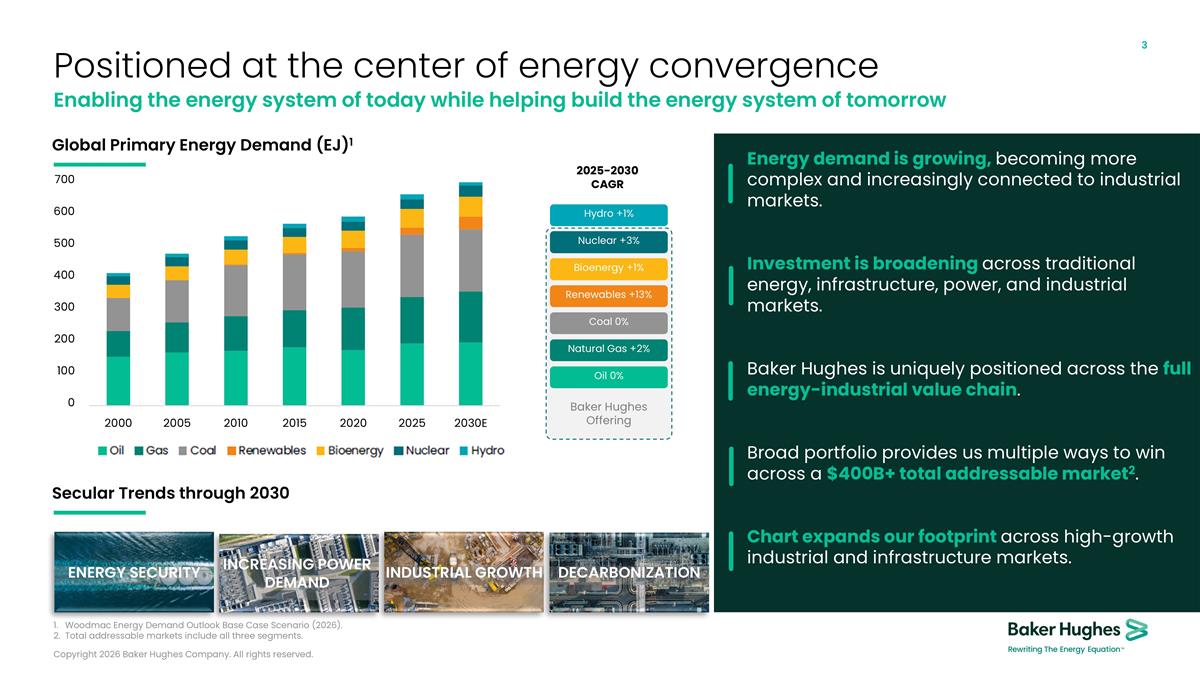
Positioned at the center of energy convergence Enabling the energy system of today while helping build the energy system of tomorrow 2025-2030 CAGR Woodmac Energy Demand Outlook Base Case Scenario (2026). Total addressable markets include all three segments. Hydro +1% Renewables +13% Nuclear +3% Bioenergy +1% Coal 0% Natural Gas +2% Oil 0% Energy demand is growing, becoming more complex and increasingly connected to industrial markets. Investment is broadening across traditional energy, infrastructure, power, and industrial markets. Baker Hughes is uniquely positioned across the full energy-industrial value chain. Broad portfolio provides us multiple ways to win across a $400B+ total addressable market2. Chart expands our footprint across high-growth industrial and infrastructure markets. Global Primary Energy Demand (EJ)1 Secular Trends through 2030 Baker Hughes Offering ENERGY SECURITY INCREASING POWER DEMAND INDUSTRIAL GROWTH DECARBONIZATION Copyright 2026 Baker Hughes Company. All rights reserved.
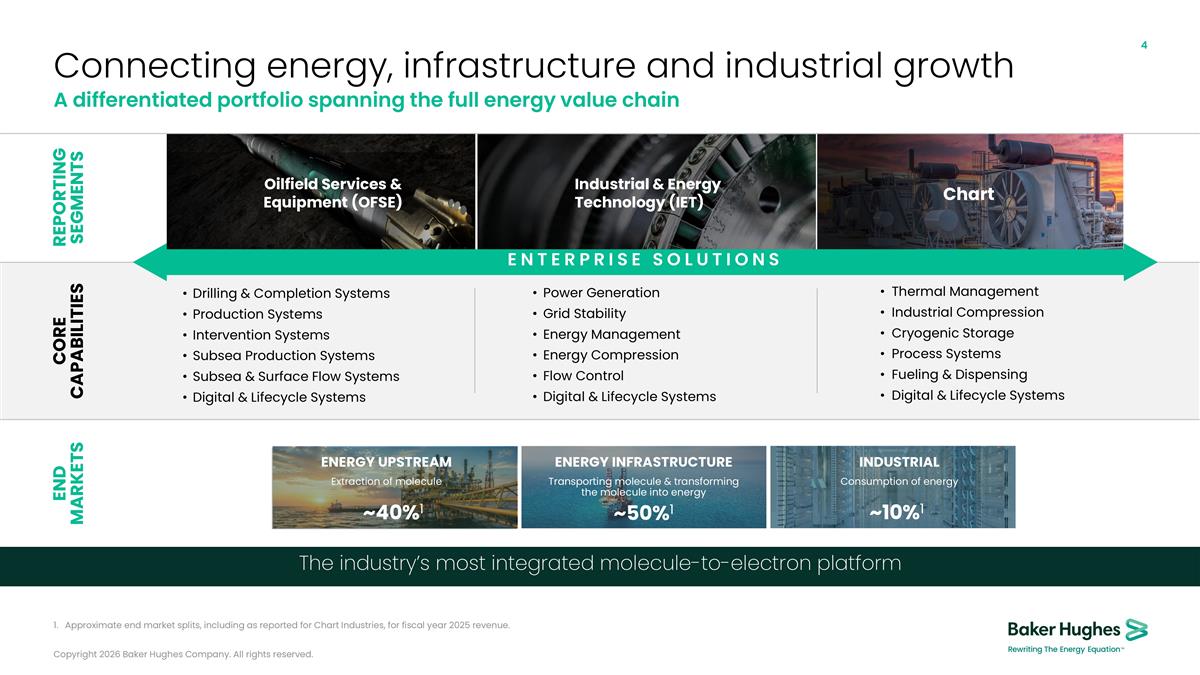
Connecting energy, infrastructure and industrial growth A differentiated portfolio spanning the full energy value chain CORE CAPABILITIES END MARKETS REPORTING SEGMENTS Power Generation Grid Stability Energy Management Energy Compression Flow Control Digital & Lifecycle Systems Thermal Management Industrial Compression Cryogenic Storage Process Systems Fueling & Dispensing Digital & Lifecycle Systems Drilling & Completion Systems Production Systems Intervention Systems Subsea Production Systems Subsea & Surface Flow Systems Digital & Lifecycle Systems The industry’s most integrated molecule-to-electron platform ENTERPRISE SOLUTIONS Industrial & Energy Technology (IET) Oilfield Services & Equipment (OFSE) Chart ENERGY INFRASTRUCTURE Transporting molecule & transforming the molecule into energy INDUSTRIAL Consumption of energy ~40%1 ~50%1 ~10%1 ENERGY UPSTREAM Extraction of molecule Approximate end market splits, including as reported for Chart Industries, for fiscal year 2025 revenue. Copyright 2026 Baker Hughes Company. All rights reserved.
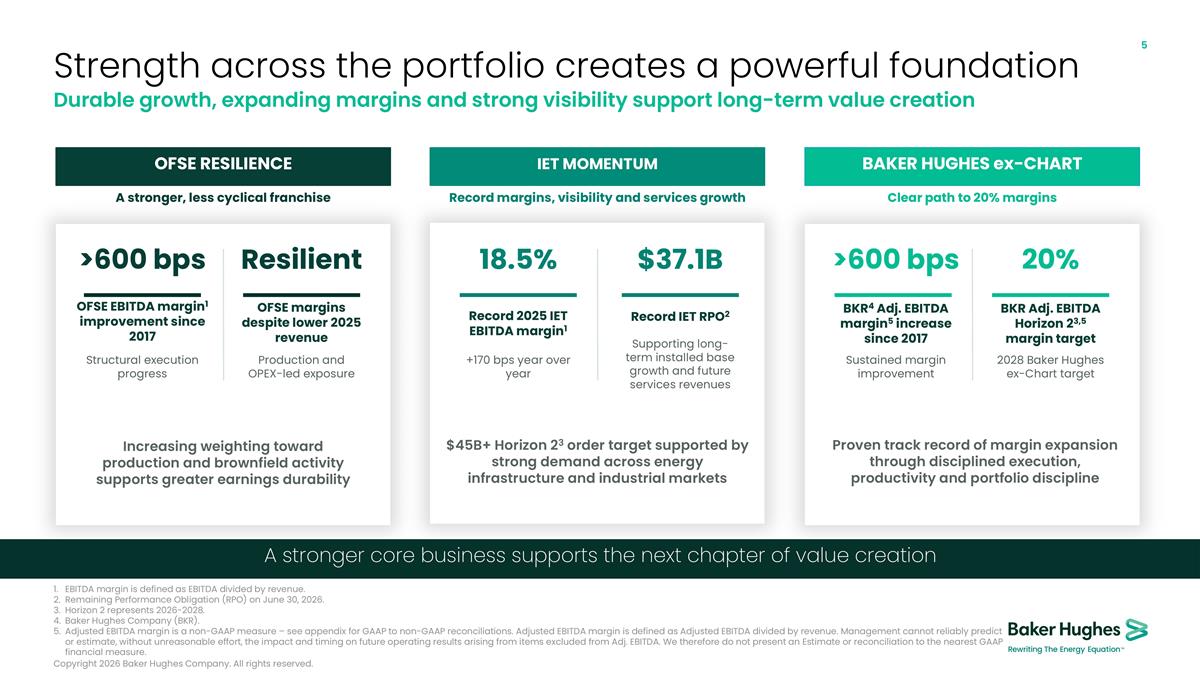
Strength across the portfolio creates a powerful foundation Durable growth, expanding margins and strong visibility support long-term value creation A stronger core business supports the next chapter of value creation OFSE RESILIENCE A stronger, less cyclical franchise IET MOMENTUM Record margins, visibility and services growth BAKER HUGHES ex-CHART Clear path to 20% margins >600 bps OFSE EBITDA margin1 improvement since 2017 Structural execution progress Resilient OFSE margins despite lower 2025 revenue Production and OPEX-led exposure Increasing weighting toward production and brownfield activity supports greater earnings durability 18.5% Record 2025 IET EBITDA margin1 +170 bps year over year Record IET RPO2 Supporting long-term installed base growth and future services revenues $45B+ Horizon 23 order target supported by strong demand across energy infrastructure and industrial markets >600 bps BKR4 Adj. EBITDA margin5 increase since 2017 Sustained margin improvement 20% BKR Adj. EBITDA Horizon 23,5 margin target 2028 Baker Hughes ex-Chart target Proven track record of margin expansion through disciplined execution, productivity and portfolio discipline $37.1B EBITDA margin is defined as EBITDA divided by revenue. Remaining Performance Obligation (RPO) on June 30, 2026. Horizon 2 represents 2026-2028. Baker Hughes Company (BKR). Adjusted EBITDA margin is a non-GAAP measure – see appendix for GAAP to non-GAAP reconciliations. Adjusted EBITDA margin is defined as Adjusted EBITDA divided by revenue. Management cannot reliably predict or estimate, without unreasonable effort, the impact and timing on future operating results arising from items excluded from Adj. EBITDA. We therefore do not present an Estimate or reconciliation to the nearest GAAP financial measure. Copyright 2026 Baker Hughes Company. All rights reserved.
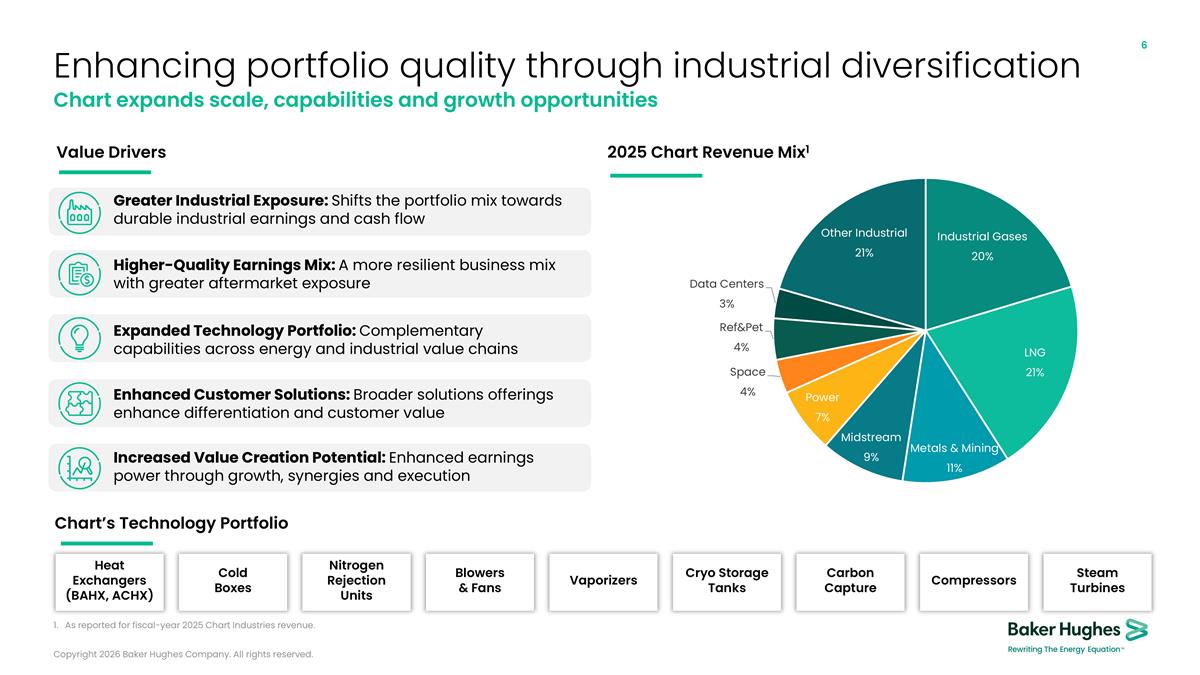
Enhancing portfolio quality through industrial diversification Chart expands scale, capabilities and growth opportunities 2025 Chart Revenue Mix1 Value Drivers Higher-Quality Earnings Mix: A more resilient business mix with greater aftermarket exposure Expanded Technology Portfolio: Complementary capabilities across energy and industrial value chains Enhanced Customer Solutions: Broader solutions offerings enhance differentiation and customer value Increased Value Creation Potential: Enhanced earnings power through growth, synergies and execution Greater Industrial Exposure: Shifts the portfolio mix towards durable industrial earnings and cash flow As reported for fiscal-year 2025 Chart Industries revenue. Chart’s Technology Portfolio Heat Exchangers (BAHX, ACHX) Cold Boxes Nitrogen Rejection Units Blowers & Fans Vaporizers Cryo Storage Tanks Carbon Capture Compressors Steam Turbines Copyright 2026 Baker Hughes Company. All rights reserved.
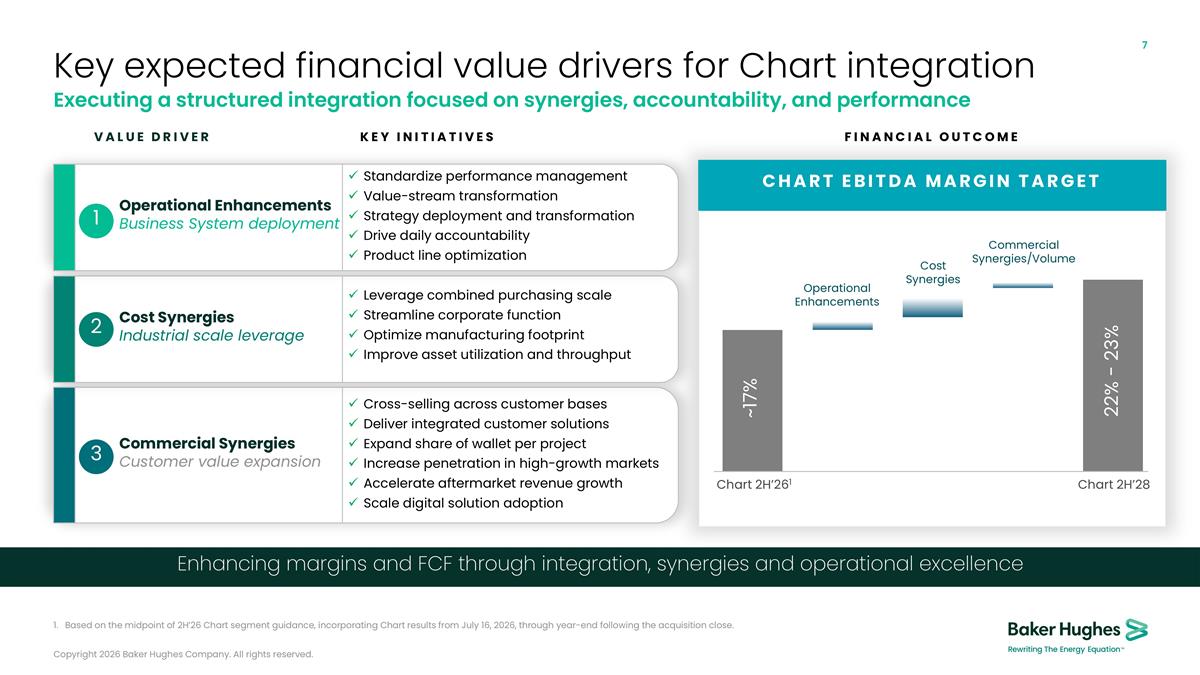
Cross-selling across customer bases Deliver integrated customer solutions Expand share of wallet per project Increase penetration in high-growth markets Accelerate aftermarket revenue growth Scale digital solution adoption Operational Enhancements Business System deployment 2 Operational Enhancements Business System deployment Standardize performance management Value-stream transformation Strategy deployment and transformation Drive daily accountability Product line optimization Key expected financial value drivers for Chart integration Executing a structured integration focused on synergies, accountability, and performance Enhancing margins and FCF through integration, synergies and operational excellence 1 VALUE DRIVER KEY INITIATIVES FINANCIAL OUTCOME Cost Synergies Industrial scale leverage Leverage combined purchasing scale Streamline corporate function Optimize manufacturing footprint Improve asset utilization and throughput 3 Commercial Synergies Customer value expansion CHART EBITDA MARGIN TARGET Operational Enhancements Cost Synergies Commercial Synergies/Volume Chart 2H’261 Chart 2H’28 ~17% 22% - 23% Based on the midpoint of 2H’26 Chart segment guidance, incorporating Chart results from July 16, 2026, through year-end following the acquisition close. Copyright 2026 Baker Hughes Company. All rights reserved.
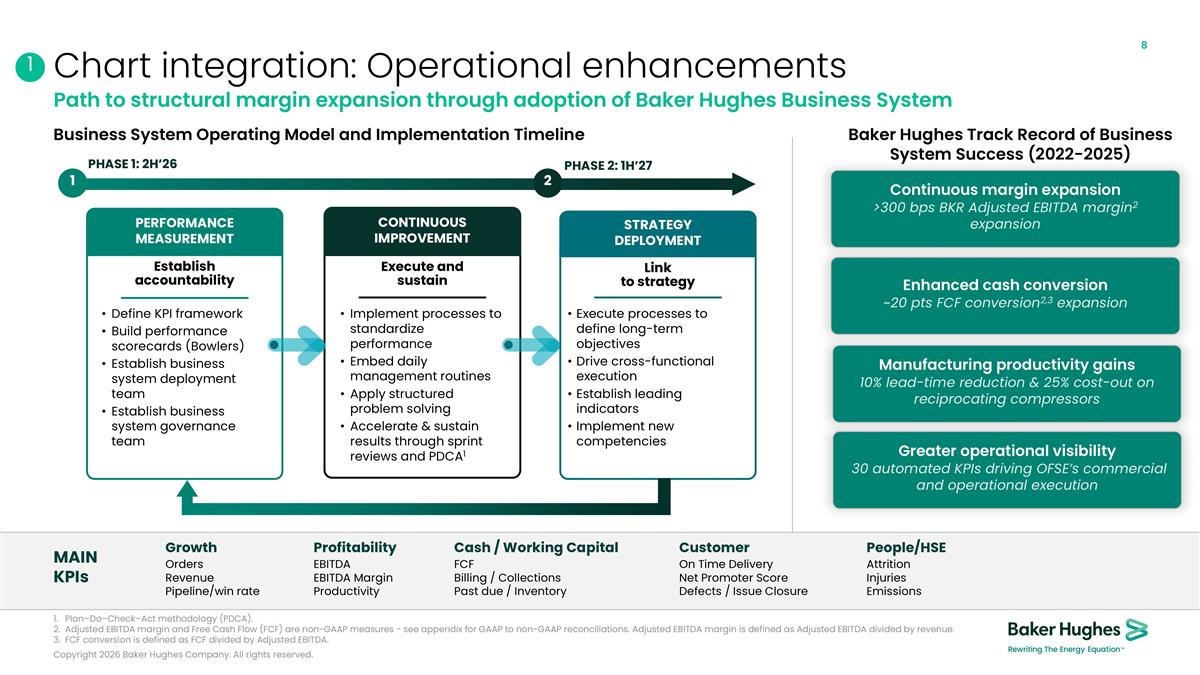
Chart integration: Operational enhancements Path to structural margin expansion through adoption of Baker Hughes Business System Business System Operating Model and Implementation Timeline Establish accountability PERFORMANCE MEASUREMENT Define KPI framework Build performance scorecards (Bowlers) Establish business system deployment team Establish business system governance team Link to strategy STRATEGY DEPLOYMENT Execute processes to define long-term objectives Drive cross-functional execution Establish leading indicators Implement new competencies 1 PHASE 1: 2H’26 2 PHASE 2: 1H’27 Customer On Time Delivery Net Promoter Score Defects / Issue Closure Cash / Working Capital FCF Billing / Collections Past due / Inventory Profitability EBITDA EBITDA Margin Productivity MAIN KPIs Growth Orders Revenue Pipeline/win rate People/HSE Attrition Injuries Emissions Plan–Do–Check–Act methodology (PDCA). Adjusted EBITDA margin and Free Cash Flow (FCF) are non-GAAP measures - see appendix for GAAP to non-GAAP reconciliations. Adjusted EBITDA margin is defined as Adjusted EBITDA divided by revenue. FCF conversion is defined as FCF divided by Adjusted EBITDA. 1 Continuous margin expansion >300 bps BKR Adjusted EBITDA margin2 expansion Manufacturing productivity gains 10% lead-time reduction & 25% cost-out on reciprocating compressors Greater operational visibility 30 automated KPIs driving OFSE’s commercial and operational execution Enhanced cash conversion ~20 pts FCF conversion2,3 expansion Baker Hughes Track Record of Business System Success (2022-2025) Execute and sustain CONTINUOUS IMPROVEMENT Implement processes to standardize performance Embed daily management routines Apply structured problem solving Accelerate & sustain results through sprint reviews and PDCA1 Copyright 2026 Baker Hughes Company. All rights reserved.
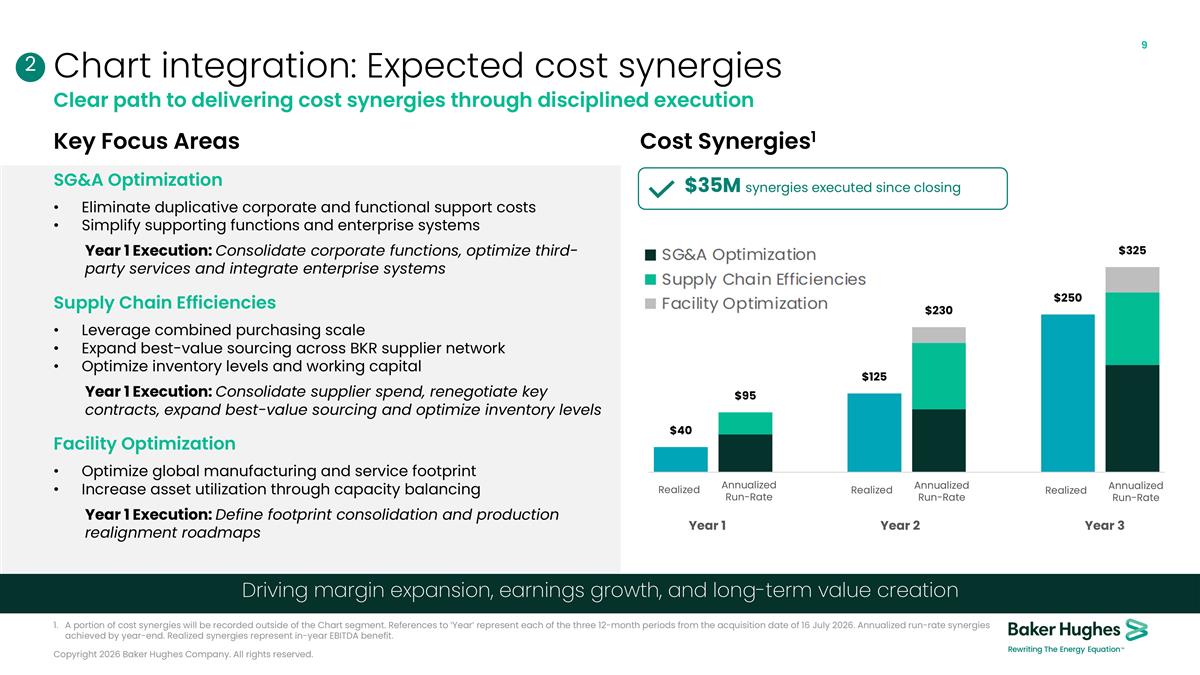
Clear path to delivering cost synergies through disciplined execution Key Focus Areas Cost Synergies1 SG&A Optimization Eliminate duplicative corporate and functional support costs Simplify supporting functions and enterprise systems Year 1 Execution: Consolidate corporate functions, optimize third-party services and integrate enterprise systems Supply Chain Efficiencies Leverage combined purchasing scale Expand best-value sourcing across BKR supplier network Optimize inventory levels and working capital Year 1 Execution: Consolidate supplier spend, renegotiate key contracts, expand best-value sourcing and optimize inventory levels Facility Optimization Optimize global manufacturing and service footprint Increase asset utilization through capacity balancing Year 1 Execution: Define footprint consolidation and production realignment roadmaps Driving margin expansion, earnings growth, and long-term value creation 2 $35M synergies executed since closing A portion of cost synergies will be recorded outside of the Chart segment. References to ‘Year’ represent each of the three 12-month periods from the acquisition date of 16 July 2026. Annualized run-rate synergies achieved by year-end. Realized synergies represent in-year EBITDA benefit. Copyright 2026 Baker Hughes Company. All rights reserved. Chart integration: Expected cost synergies
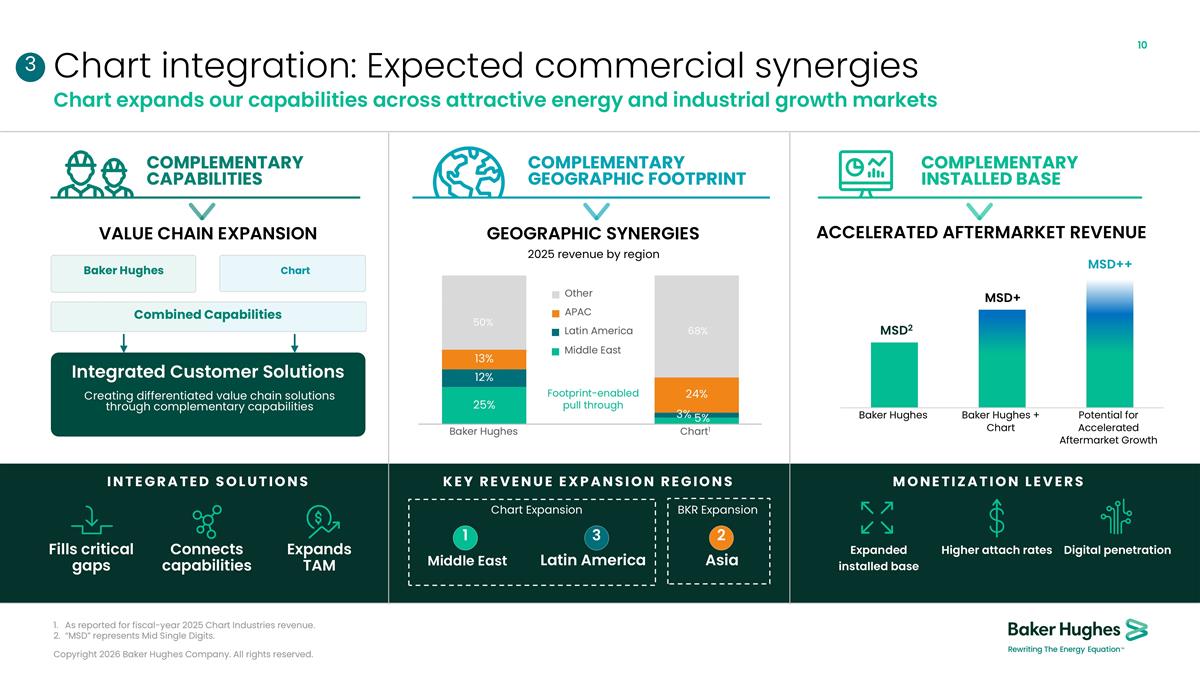
Chart integration: Expected commercial synergies Chart expands our capabilities across attractive energy and industrial growth markets Baker Hughes Chart + Creating differentiated value chain solutions through complementary capabilities Integrated Customer Solutions 2025 revenue by region KEY REVENUE EXPANSION REGIONS Footprint-enabled pull through Middle East Latin America Chart Expansion BKR Expansion Asia MONETIZATION LEVERS Expanded installed base Higher attach rates Digital penetration 3 As reported for fiscal-year 2025 Chart Industries revenue. “MSD” represents Mid Single Digits. 50% 68% Combined Capabilities Middle East APAC Latin America Baker Hughes Chart1 INTEGRATED SOLUTIONS Fills critical gaps Connects capabilities Expands TAM Other ACCELERATED AFTERMARKET REVENUE GEOGRAPHIC SYNERGIES VALUE CHAIN EXPANSION COMPLEMENTARY CAPABILITIES COMPLEMENTARY GEOGRAPHIC FOOTPRINT COMPLEMENTARY INSTALLED BASE 1 3 2 MSD2 MSD+ MSD++ Copyright 2026 Baker Hughes Company. All rights reserved.
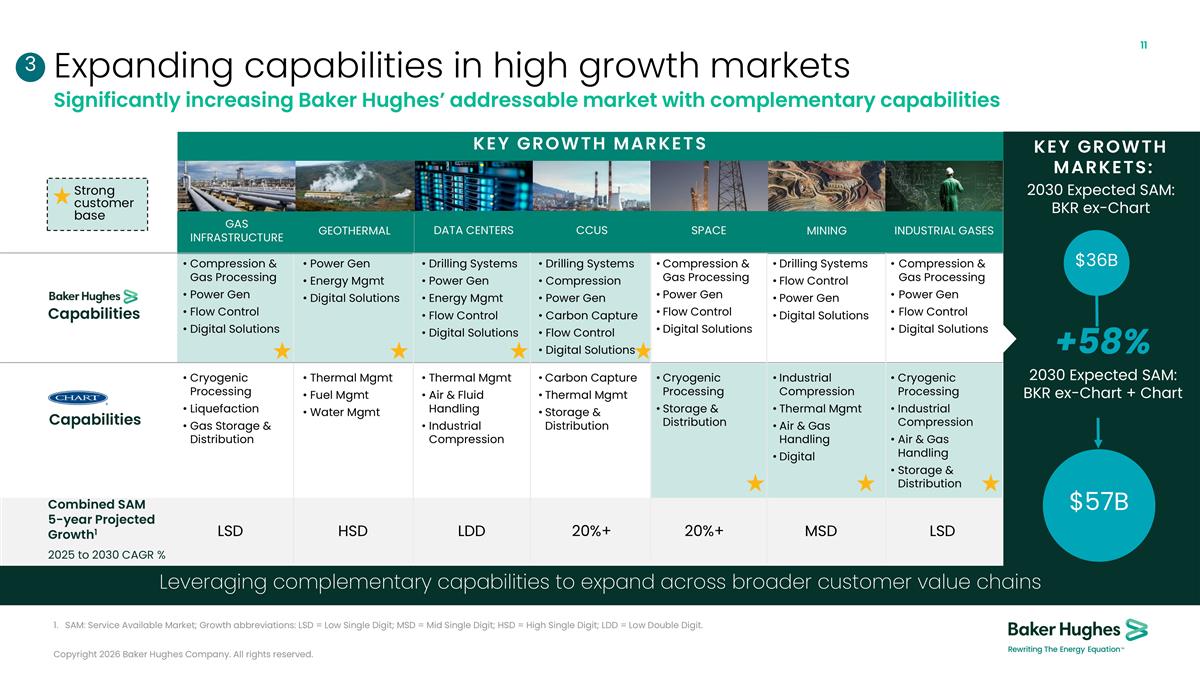
Expanding capabilities in high growth markets Significantly increasing Baker Hughes’ addressable market with complementary capabilities Cryogenic Processing Liquefaction Gas Storage & Distribution Carbon Capture Thermal Mgmt Storage & Distribution Cryogenic Processing Storage & Distribution Thermal Mgmt Air & Fluid Handling Industrial Compression Industrial Compression Thermal Mgmt Air & Gas Handling Digital Thermal Mgmt Fuel Mgmt Water Mgmt Compression & Gas Processing Power Gen Flow Control Digital Solutions Drilling Systems Compression Power Gen Carbon Capture Flow Control Digital Solutions Drilling Systems Power Gen Energy Mgmt Flow Control Digital Solutions Compression & Gas Processing Power Gen Flow Control Digital Solutions Drilling Systems Flow Control Power Gen Digital Solutions Power Gen Energy Mgmt Digital Solutions Capabilities Capabilities Compression & Gas Processing Power Gen Flow Control Digital Solutions Cryogenic Processing Industrial Compression Air & Gas Handling Storage & Distribution GEOTHERMAL MINING Combined SAM 5-year Projected Growth1 2025 to 2030 CAGR % LSD HSD LDD 20%+ 20%+ MSD LSD Strong customer base 3 KEY GROWTH MARKETS SAM: Service Available Market; Growth abbreviations: LSD = Low Single Digit; MSD = Mid Single Digit; HSD = High Single Digit; LDD = Low Double Digit. $36B $57B KEY GROWTH MARKETS: 2030 Expected SAM: BKR ex-Chart +58% 2030 Expected SAM: BKR ex-Chart + Chart GAS INFRASTRUCTURE DATA CENTERS CCUS SPACE INDUSTRIAL GASES Leveraging complementary capabilities to expand across broader customer value chains Copyright 2026 Baker Hughes Company. All rights reserved.
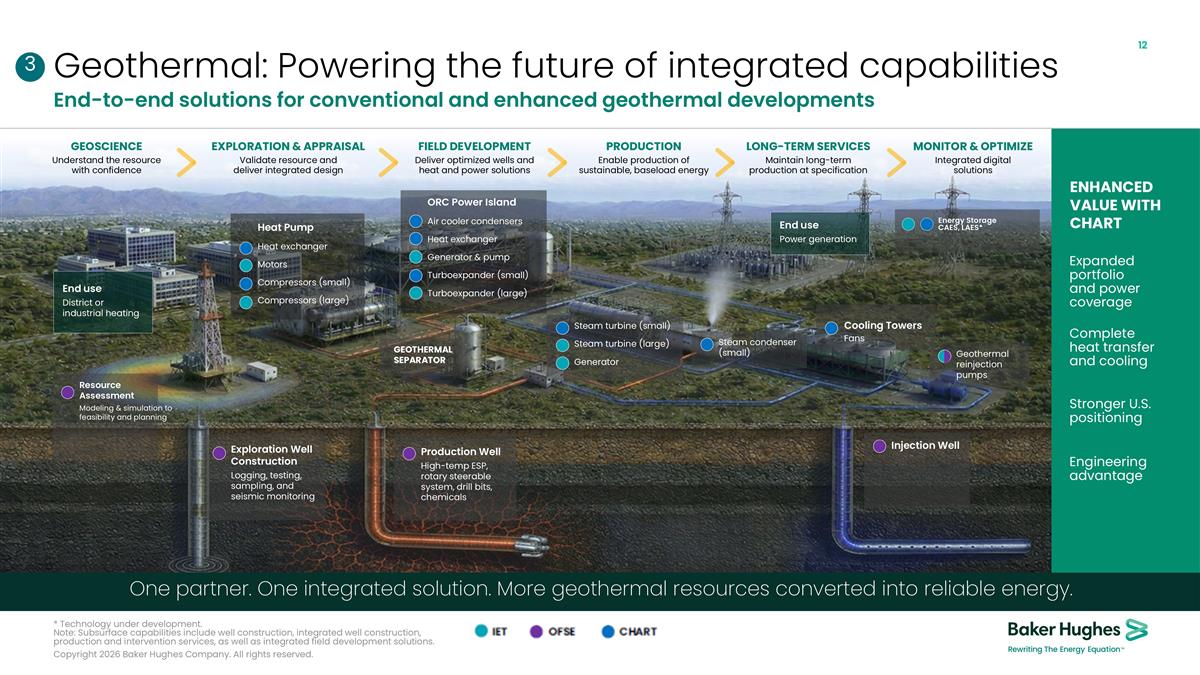
Geothermal: Powering the future of integrated capabilities End-to-end solutions for conventional and enhanced geothermal developments 3 One partner. One integrated solution. More geothermal resources converted into reliable energy. GEOSCIENCE Understand the resource with confidence EXPLORATION & APPRAISAL Validate resource and deliver integrated design FIELD DEVELOPMENT Deliver optimized wells and heat and power solutions PRODUCTION Enable production of sustainable, baseload energy LONG-TERM SERVICES Maintain long-term production at specification Resource Assessment Modeling & simulation to feasibility and planning Expanded portfolio and power coverage ENHANCED VALUE WITH CHART Complete heat transfer and cooling Stronger U.S. positioning Engineering advantage End use District or industrial heating Exploration Well Construction Logging, testing, sampling, and seismic monitoring Production Well High-temp ESP, rotary steerable system, drill bits, chemicals Heat Pump Heat exchanger Motors Compressors (small) Compressors (large) ORC Power Island Air cooler condensers Heat exchanger Generator & pump Turboexpander (small) Turboexpander (large) Steam turbine (small) Steam turbine (large) Generator End use Power generation Steam condenser (small) Injection Well Geothermal reinjection pumps MONITOR & OPTIMIZE Integrated digital solutions Cooling Towers Fans GEOTHERMAL SEPARATOR Energy Storage CAES, LAES* * Technology under development. Note: Subsurface capabilities include well construction, integrated well construction, production and intervention services, as well as integrated field development solutions. Copyright 2026 Baker Hughes Company. All rights reserved.
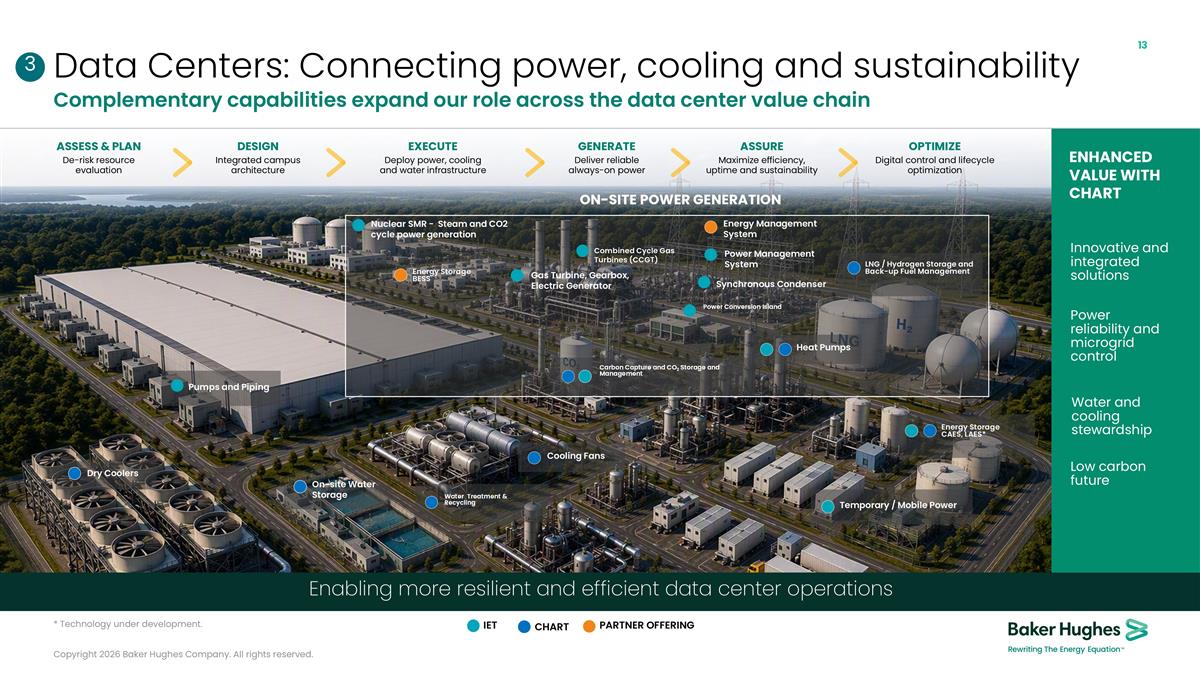
Data Centers: Connecting power, cooling and sustainability Complementary capabilities expand our role across the data center value chain 3 Enabling more resilient and efficient data center operations On-site Water Storage Cooling Fans Pumps and Piping LNG / Hydrogen Storage and Back-up Fuel Management Nuclear SMR - Steam and CO2 cycle power generation Gas Turbine, Gearbox, Electric Generator Carbon Capture and CO2 Storage and Management ON-SITE POWER GENERATION Energy Management System Power Management System Water Treatment & Recycling Combined Cycle Gas Turbines (CCGT) Temporary / Mobile Power Power Conversion Island Synchronous Condenser ASSESS & PLAN De-risk resource evaluation DESIGN Integrated campus architecture EXECUTE Deploy power, cooling and water infrastructure GENERATE Deliver reliable always-on power ASSURE Maximize efficiency, uptime and sustainability OPTIMIZE Digital control and lifecycle optimization Dry Coolers IET CHART PARTNER OFFERING Innovative and integrated solutions Power reliability and microgrid control Water and cooling stewardship Low carbon future ENHANCED VALUE WITH CHART Energy Storage BESS * Technology under development. Energy Storage CAES, LAES* Heat Pumps Copyright 2026 Baker Hughes Company. All rights reserved.
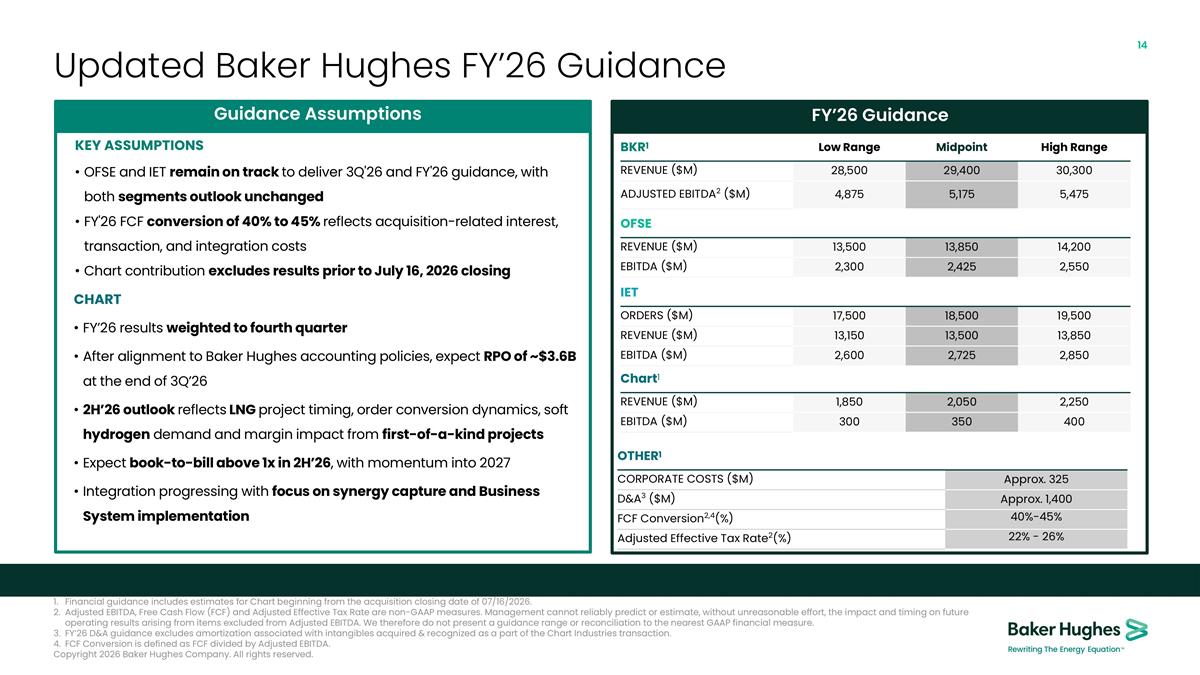
Updated Baker Hughes FY’26 Guidance FY’26 Guidance OTHER1 CORPORATE COSTS ($M) Approx. 325 D&A3 ($M) Approx. 1,400 FCF Conversion2,4(%) 40%-45% Adjusted Effective Tax Rate2(%) 22% - 26% IET ORDERS ($M) 17,500 18,500 19,500 REVENUE ($M) 13,150 13,500 13,850 EBITDA ($M) 2,600 2,725 2,850 BKR1 Low Range Midpoint High Range REVENUE ($M) 28,500 29,400 30,300 ADJUSTED EBITDA2 ($M) 4,875 5,175 5,475 OFSE REVENUE ($M) 13,500 13,850 14,200 EBITDA ($M) 2,300 2,425 2,550 Chart1 REVENUE ($M) 1,850 2,050 2,250 EBITDA ($M) 300 350 400 Guidance Assumptions FY’25 Framework KEY ASSUMPTIONS OFSE and IET remain on track to deliver 3Q'26 and FY'26 guidance, with both segments outlook unchanged FY'26 FCF conversion of 40% to 45% reflects acquisition-related interest, transaction, and integration costs Chart contribution excludes results prior to July 16, 2026 closing Guidance Assumptions CHART FY’26 results weighted to fourth quarter After alignment to Baker Hughes accounting policies, expect RPO of ~$3.6B at the end of 3Q’26 2H’26 outlook reflects LNG project timing, order conversion dynamics, soft hydrogen demand and margin impact from first-of-a-kind projects Expect book-to-bill above 1x in 2H’26, with momentum into 2027 Integration progressing with focus on synergy capture and Business System implementation Financial guidance includes estimates for Chart beginning from the acquisition closing date of 07/16/2026. Adjusted EBITDA, Free Cash Flow (FCF) and Adjusted Effective Tax Rate are non-GAAP measures. Management cannot reliably predict or estimate, without unreasonable effort, the impact and timing on future operating results arising from items excluded from Adjusted EBITDA. We therefore do not present a guidance range or reconciliation to the nearest GAAP financial measure. FY’26 D&A guidance excludes amortization associated with intangibles acquired & recognized as a part of the Chart Industries transaction. FCF Conversion is defined as FCF divided by Adjusted EBITDA. Copyright 2026 Baker Hughes Company. All rights reserved.
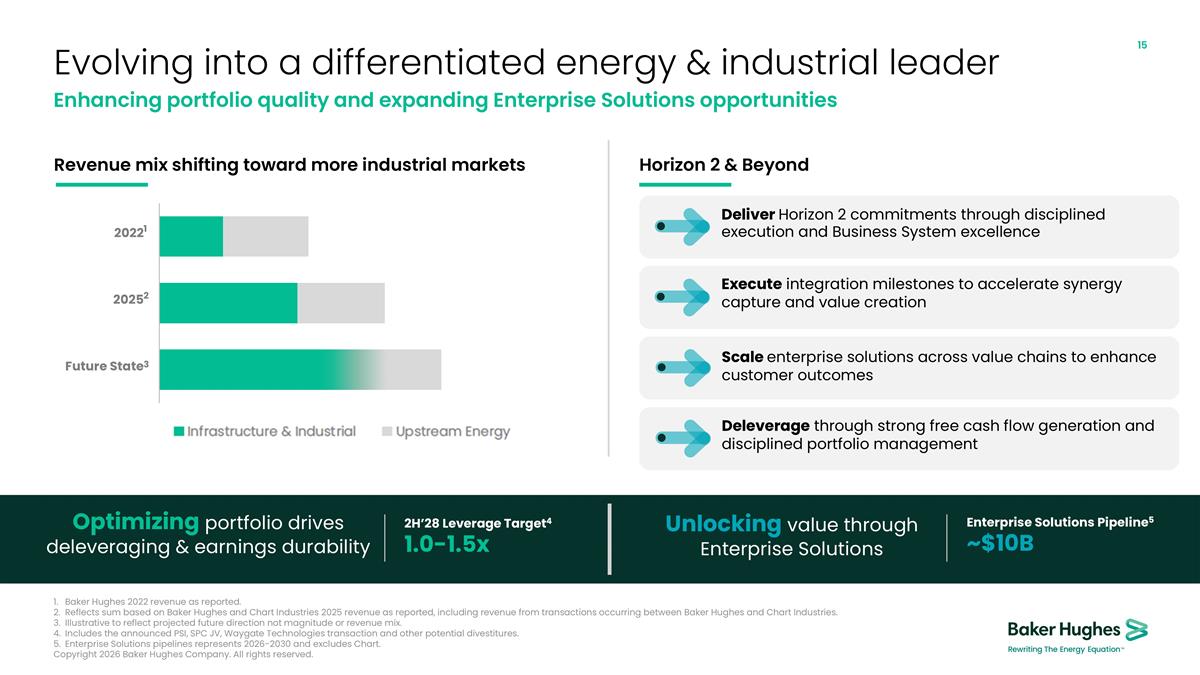
Optimizing portfolio drives deleveraging & earnings durability 2H’28 Leverage Target4 1.0-1.5x Unlocking value through Enterprise Solutions Enterprise Solutions Pipeline5 ~$10B Revenue mix shifting toward more industrial markets Horizon 2 & Beyond Evolving into a differentiated energy & industrial leader Enhancing portfolio quality and expanding Enterprise Solutions opportunities 3 Execute integration milestones to accelerate synergy capture and value creation Scale enterprise solutions across value chains to enhance customer outcomes Deleverage through strong free cash flow generation and disciplined portfolio management Deliver Horizon 2 commitments through disciplined execution and Business System excellence Baker Hughes 2022 revenue as reported. Reflects sum based on Baker Hughes and Chart Industries 2025 revenue as reported, including revenue from transactions occurring between Baker Hughes and Chart Industries. Illustrative to reflect projected future direction not magnitude or revenue mix. Includes the announced PSI, SPC JV, Waygate Technologies transaction and other potential divestitures. Enterprise Solutions pipelines represents 2026-2030 and excludes Chart. 1 2 Copyright 2026 Baker Hughes Company. All rights reserved.
Appendix Copyright 2026 Baker Hughes Company. All rights reserved.
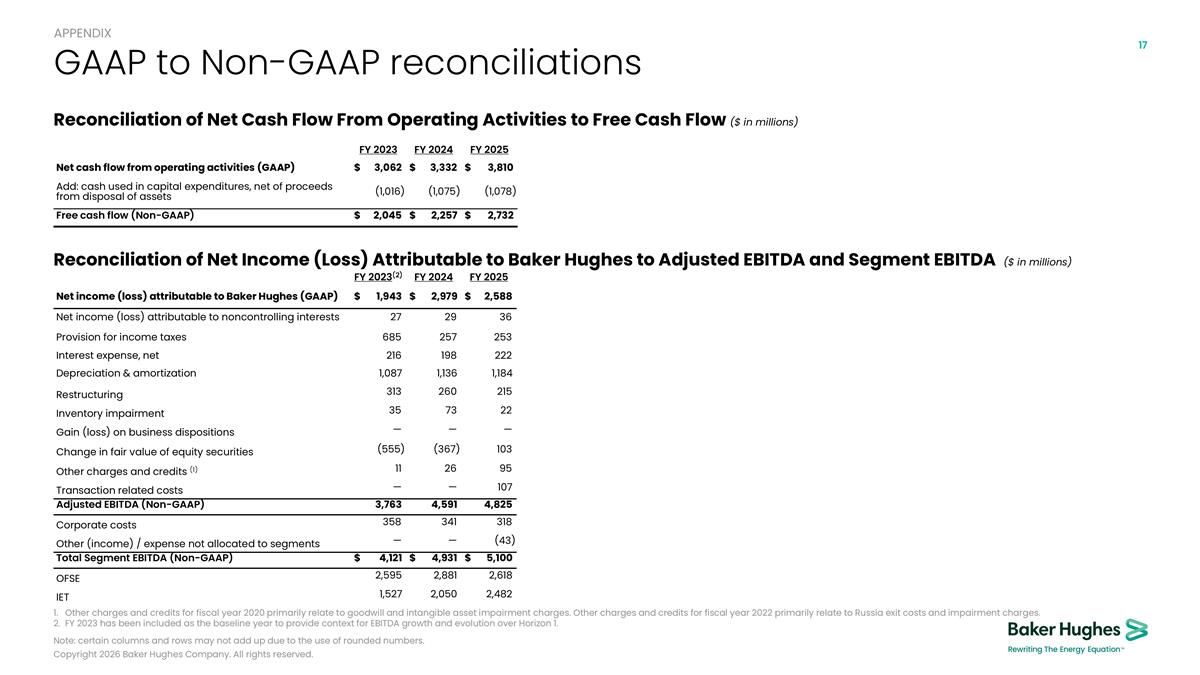
GAAP to Non-GAAP reconciliations Copyright 2026 Baker Hughes Company. All rights reserved. Reconciliation of Net Cash Flow From Operating Activities to Free Cash Flow ($ in millions) Note: certain columns and rows may not add up due to the use of rounded numbers. Other charges and credits for fiscal year 2020 primarily relate to goodwill and intangible asset impairment charges. Other charges and credits for fiscal year 2022 primarily relate to Russia exit costs and impairment charges. FY 2023 has been included as the baseline year to provide context for EBITDA growth and evolution over Horizon 1. Reconciliation of Net Income (Loss) Attributable to Baker Hughes to Adjusted EBITDA and Segment EBITDA ($ in millions) APPENDIX FY 2023(2) FY 2024 FY 2025 Net income (loss) attributable to Baker Hughes (GAAP) $1,943 $2,979 $2,588 Net income (loss) attributable to noncontrolling interests 27 29 36 Provision for income taxes 685 257 253 Interest expense, net 216 198 222 Depreciation & amortization 1,087 1,136 1,184 Restructuring 313 260 215 Inventory impairment 35 73 22 Gain (loss) on business dispositions — — — Change in fair value of equity securities (555) (367) 103 Other charges and credits (1) 11 26 95 Transaction related costs — — 107 Adjusted EBITDA (Non-GAAP) 3,763 4,591 4,825 Corporate costs 358 341 318 Other (income) / expense not allocated to segments — — (43) Total Segment EBITDA (Non-GAAP) $4,121 $4,931 $5,100 OFSE 2,595 2,881 2,618 IET 1,527 2,050 2,482 FY 2023 FY 2024 FY 2025 Net cash flow from operating activities (GAAP) $3,062 $3,332 $3,810 Add: cash used in capital expenditures, net of proceeds from disposal of assets (1,016) (1,075) (1,078) Free cash flow (Non-GAAP) $2,045 $2,257 $2,732
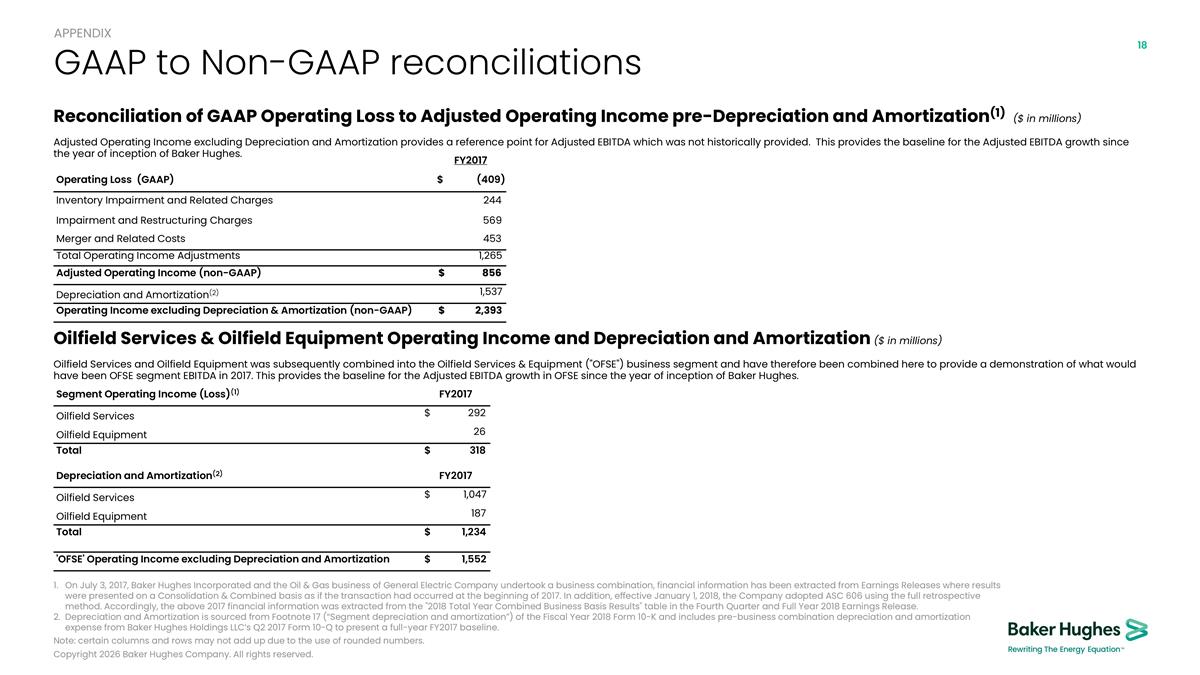
GAAP to Non-GAAP reconciliations Copyright 2026 Baker Hughes Company. All rights reserved. Note: certain columns and rows may not add up due to the use of rounded numbers. On July 3, 2017, Baker Hughes Incorporated and the Oil & Gas business of General Electric Company undertook a business combination, financial information has been extracted from Earnings Releases where results were presented on a Consolidation & Combined basis as if the transaction had occurred at the beginning of 2017. In addition, effective January 1, 2018, the Company adopted ASC 606 using the full retrospective method. Accordingly, the above 2017 financial information was extracted from the "2018 Total Year Combined Business Basis Results" table in the Fourth Quarter and Full Year 2018 Earnings Release. Depreciation and Amortization is sourced from Footnote 17 (“Segment depreciation and amortization”) of the Fiscal Year 2018 Form 10-K and includes pre-business combination depreciation and amortization expense from Baker Hughes Holdings LLC’s Q2 2017 Form 10-Q to present a full-year FY2017 baseline. Oilfield Services & Oilfield Equipment Operating Income and Depreciation and Amortization ($ in millions) Oilfield Services and Oilfield Equipment was subsequently combined into the Oilfield Services & Equipment ("OFSE") business segment and have therefore been combined here to provide a demonstration of what would have been OFSE segment EBITDA in 2017. This provides the baseline for the Adjusted EBITDA growth in OFSE since the year of inception of Baker Hughes. Reconciliation of GAAP Operating Loss to Adjusted Operating Income pre-Depreciation and Amortization(1) ($ in millions) Adjusted Operating Income excluding Depreciation and Amortization provides a reference point for Adjusted EBITDA which was not historically provided. This provides the baseline for the Adjusted EBITDA growth since the year of inception of Baker Hughes. APPENDIX Segment Operating Income (Loss)(1) FY2017 Oilfield Services $292 Oilfield Equipment 26 Total $318 Depreciation and Amortization(2) FY2017 Oilfield Services $1,047 Oilfield Equipment 187 Total $1,234 'OFSE' Operating Income excluding Depreciation and Amortization $1,552 FY2017 Operating Loss (GAAP) $(409) Inventory Impairment and Related Charges 244 Impairment and Restructuring Charges 569 Merger and Related Costs 453 Total Operating Income Adjustments 1,265 Adjusted Operating Income (non-GAAP) $856 Depreciation and Amortization(2) 1,537 Operating Income excluding Depreciation & Amortization (non-GAAP) $2,393

Join us in rewriting The Energy Equation™ bakerhughes.com @bakerhughesco Baker Hughes bakerhughesco @bakerhughesco Copyright 2026 Baker Hughes Company. All rights reserved.