

2Q25 Earnings Presentation .2
Forward-Looking Statements Forward-Looking Statements This communication contains forward-looking statements within the meaning of the U.S. federal securities laws. Forward-looking statements include, without limitation, statements concerning plans, estimates, calculations, forecasts and projections with respect to the anticipated future performance of the Company. These statements are often, but not always, made through the use of words or phrases such as ‘‘may’’, ‘‘might’’, ‘‘should’’, ‘‘could’’, ‘‘predict’’, ‘‘potential’’, ‘‘believe’’, ‘‘expect’’, ‘‘continue’’, ‘‘will’’, ‘‘anticipate’’, ‘‘seek’’, ‘‘estimate’’, ‘‘intend’’, ‘‘plan’’, ‘‘projection’’, ‘‘would’’, ‘‘annualized’’, “target” and ‘‘outlook’’, or the negative version of those words or other comparable words or phrases of a future or forward-looking nature. Forward-looking statements involve estimates and known and unknown risks, and reflect various assumptions and involve elements of subjective judgement and analysis, which may or may not prove to be correct, and which are subject to uncertainties and contingencies outside the control of Byline and its respective affiliates, directors, employees and other representatives, which could cause actual results to differ materially from those presented in this communication. No representations, warranties or guarantees are or will be made by Byline as to the reliability, accuracy or completeness of any forward-looking statements contained in this communication or that such forward-looking statements are or will remain based on reasonable assumptions. You should not place undue reliance on any forward-looking statements contained in this communication. Certain risks and important factors that could affect Byline’s future results are identified in our Annual Report on Form 10-K and other reports we file with the Securities and Exchange Commission, including among other things under the heading “Risk Factors” in our Annual Report on Form 10-K for the year ended December 31, 2024. Any forward-looking statement speaks only as of the date on which it is made, and Byline undertakes no obligation to update any forward-looking statement, whether to reflect events or circumstances after the date on which the statement is made, to reflect new information or the occurrence of unanticipated events, or otherwise unless required under the federal securities laws. Due to rounding, numbers presented throughout this document may not add up precisely to the totals provided and percentages may not precisely reflect the absolute figures.
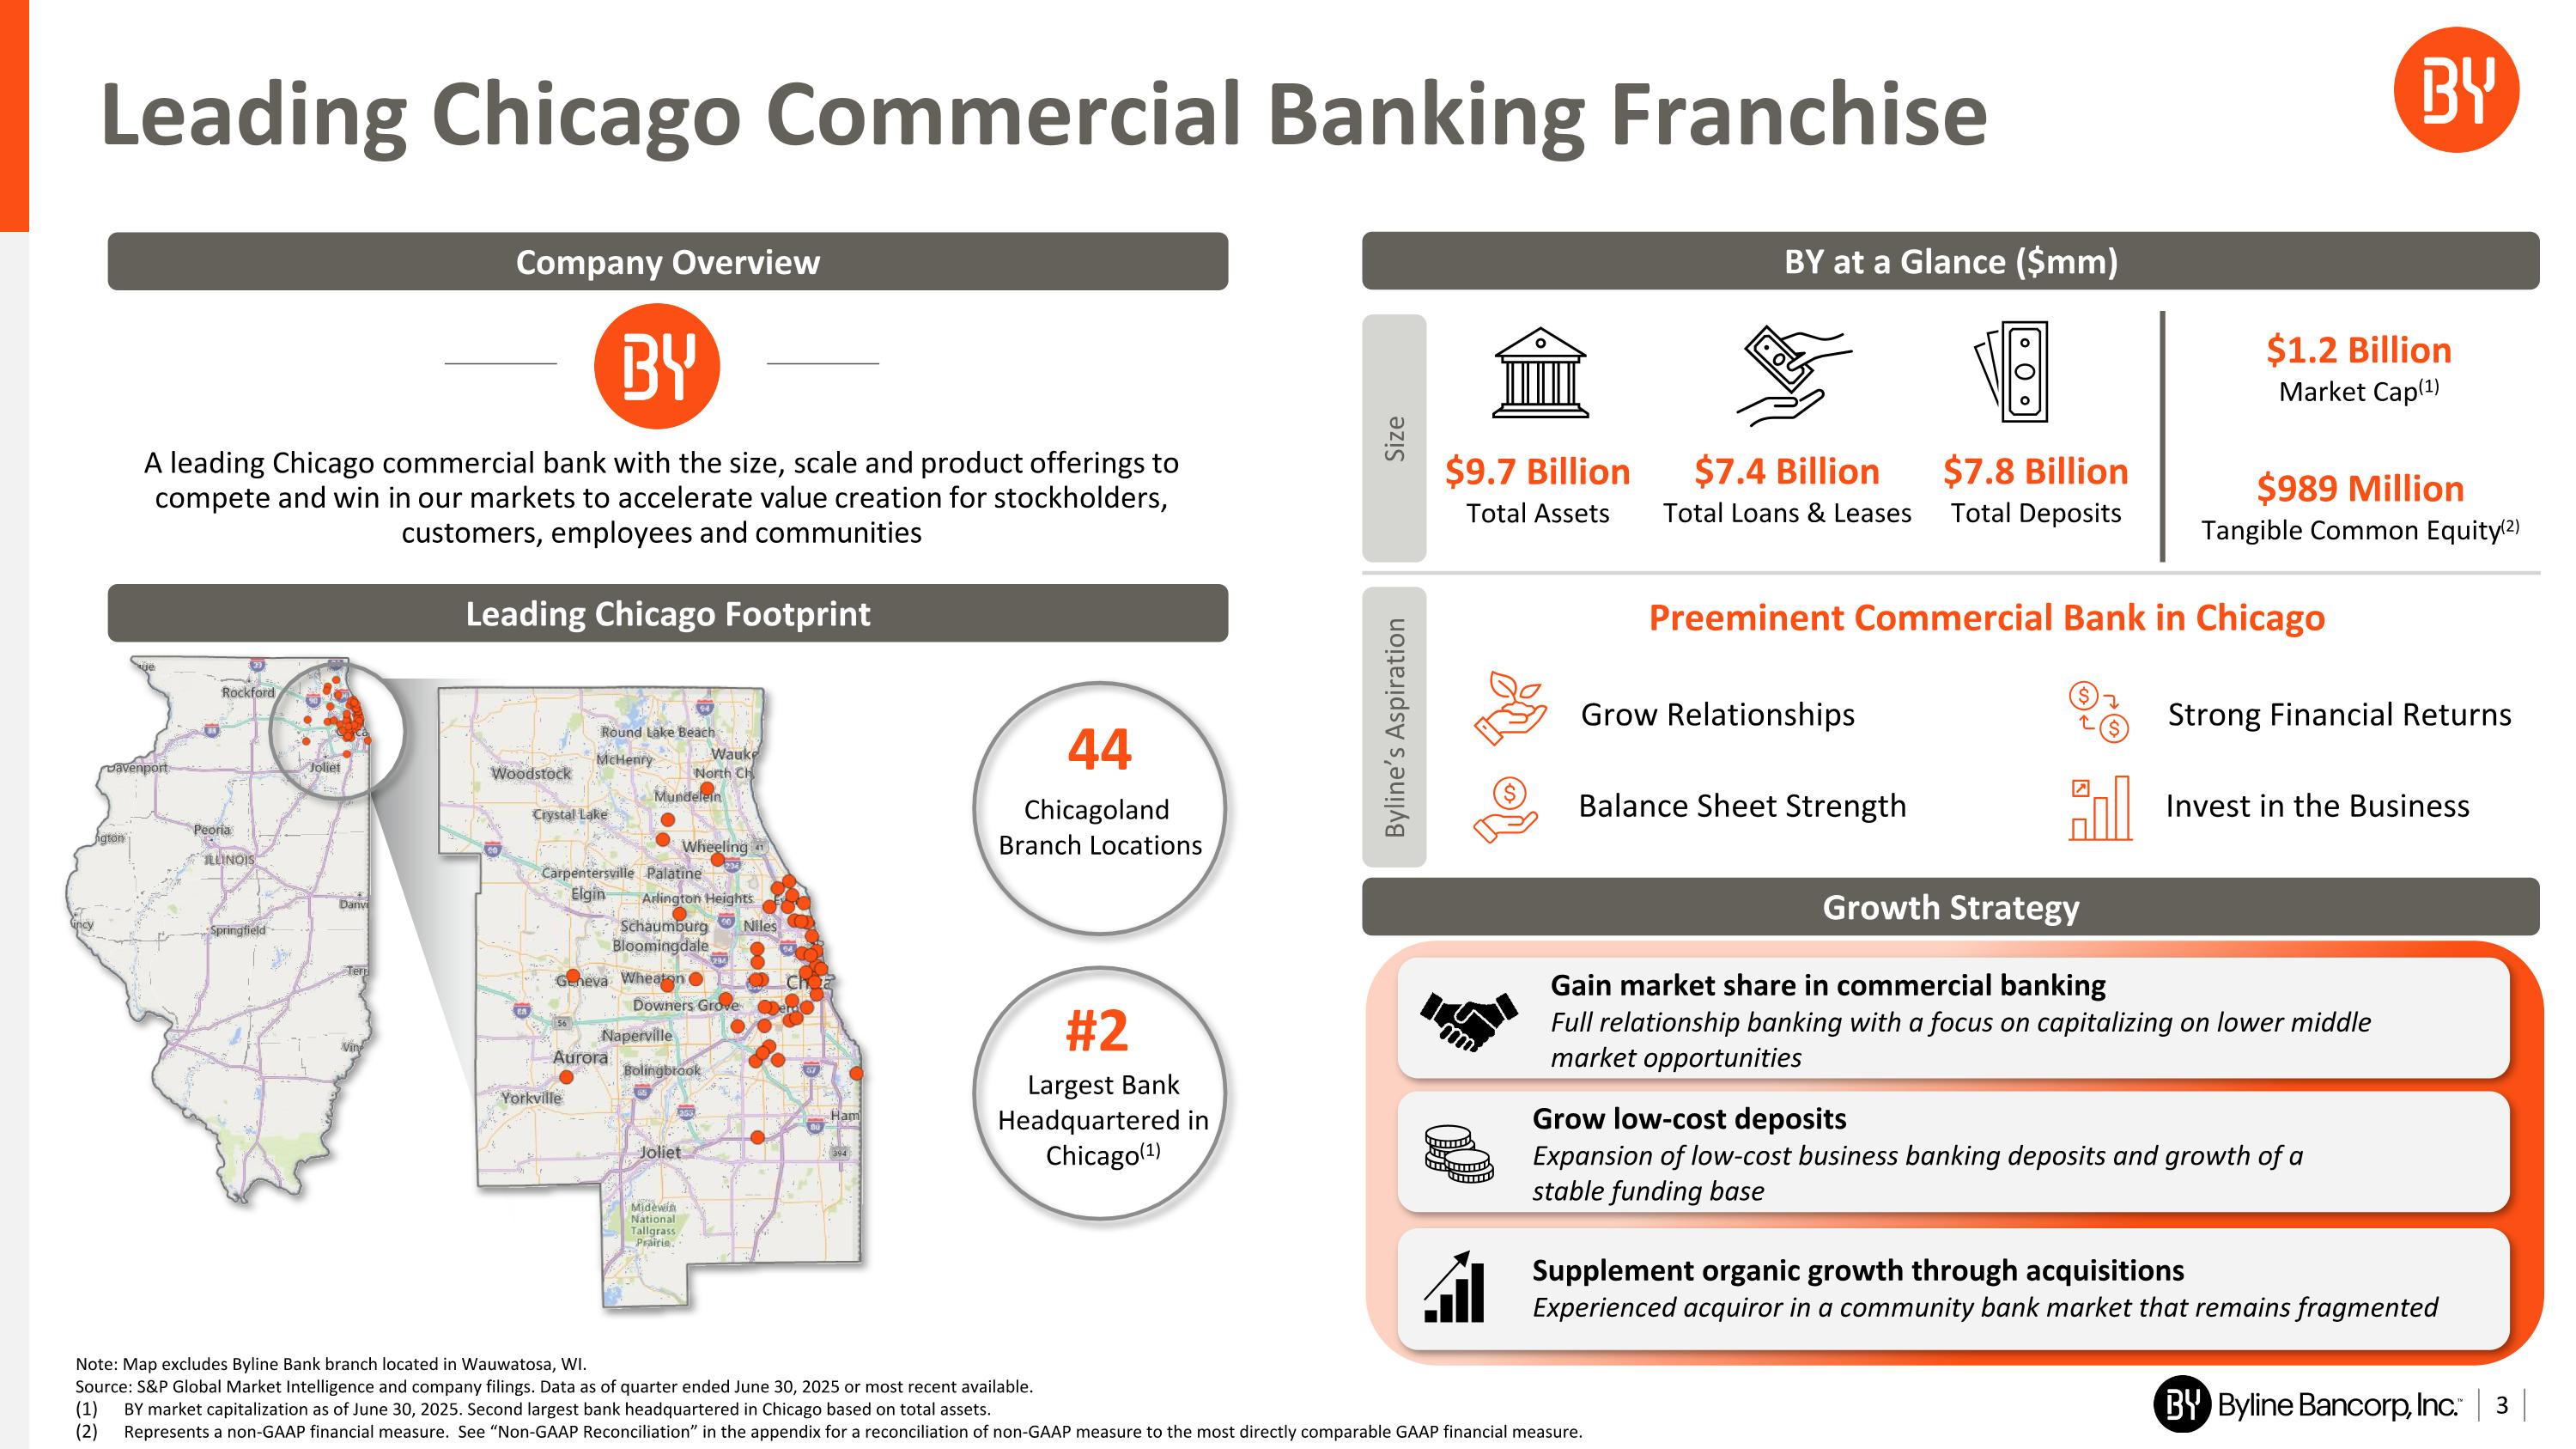
Note: Map excludes Byline Bank branch located in Wauwatosa, WI. Source: S&P Global Market Intelligence and company filings. Data as of quarter ended June 30, 2025 or most recent available. BY market capitalization as of June 30, 2025. Second largest bank headquartered in Chicago based on total assets. Represents a non-GAAP financial measure. See “Non-GAAP Reconciliation” in the appendix for a reconciliation of non-GAAP measure to the most directly comparable GAAP financial measure. Leading Chicago Commercial Banking Franchise Company Overview BY at a Glance ($mm) Leading Chicago Footprint Growth Strategy Size Byline’s Aspiration Chicagoland Branch Locations 44 Largest Bank Headquartered in Chicago(1) #2 $9.7 Billion Total Assets $7.4 Billion Total Loans & Leases $7.8 Billion Total Deposits $989 Million Tangible Common Equity(2) $1.2 Billion Market Cap(1) A leading Chicago commercial bank with the size, scale and product offerings to compete and win in our markets to accelerate value creation for stockholders, customers, employees and communities Preeminent Commercial Bank in Chicago Grow Relationships Balance Sheet Strength Strong Financial Returns Invest in the Business Gain market share in commercial banking Full relationship banking with a focus on capitalizing on lower middle market opportunities Grow low-cost deposits Expansion of low-cost business banking deposits and growth of a stable funding base Supplement organic growth through acquisitions Experienced acquiror in a community bank market that remains fragmented
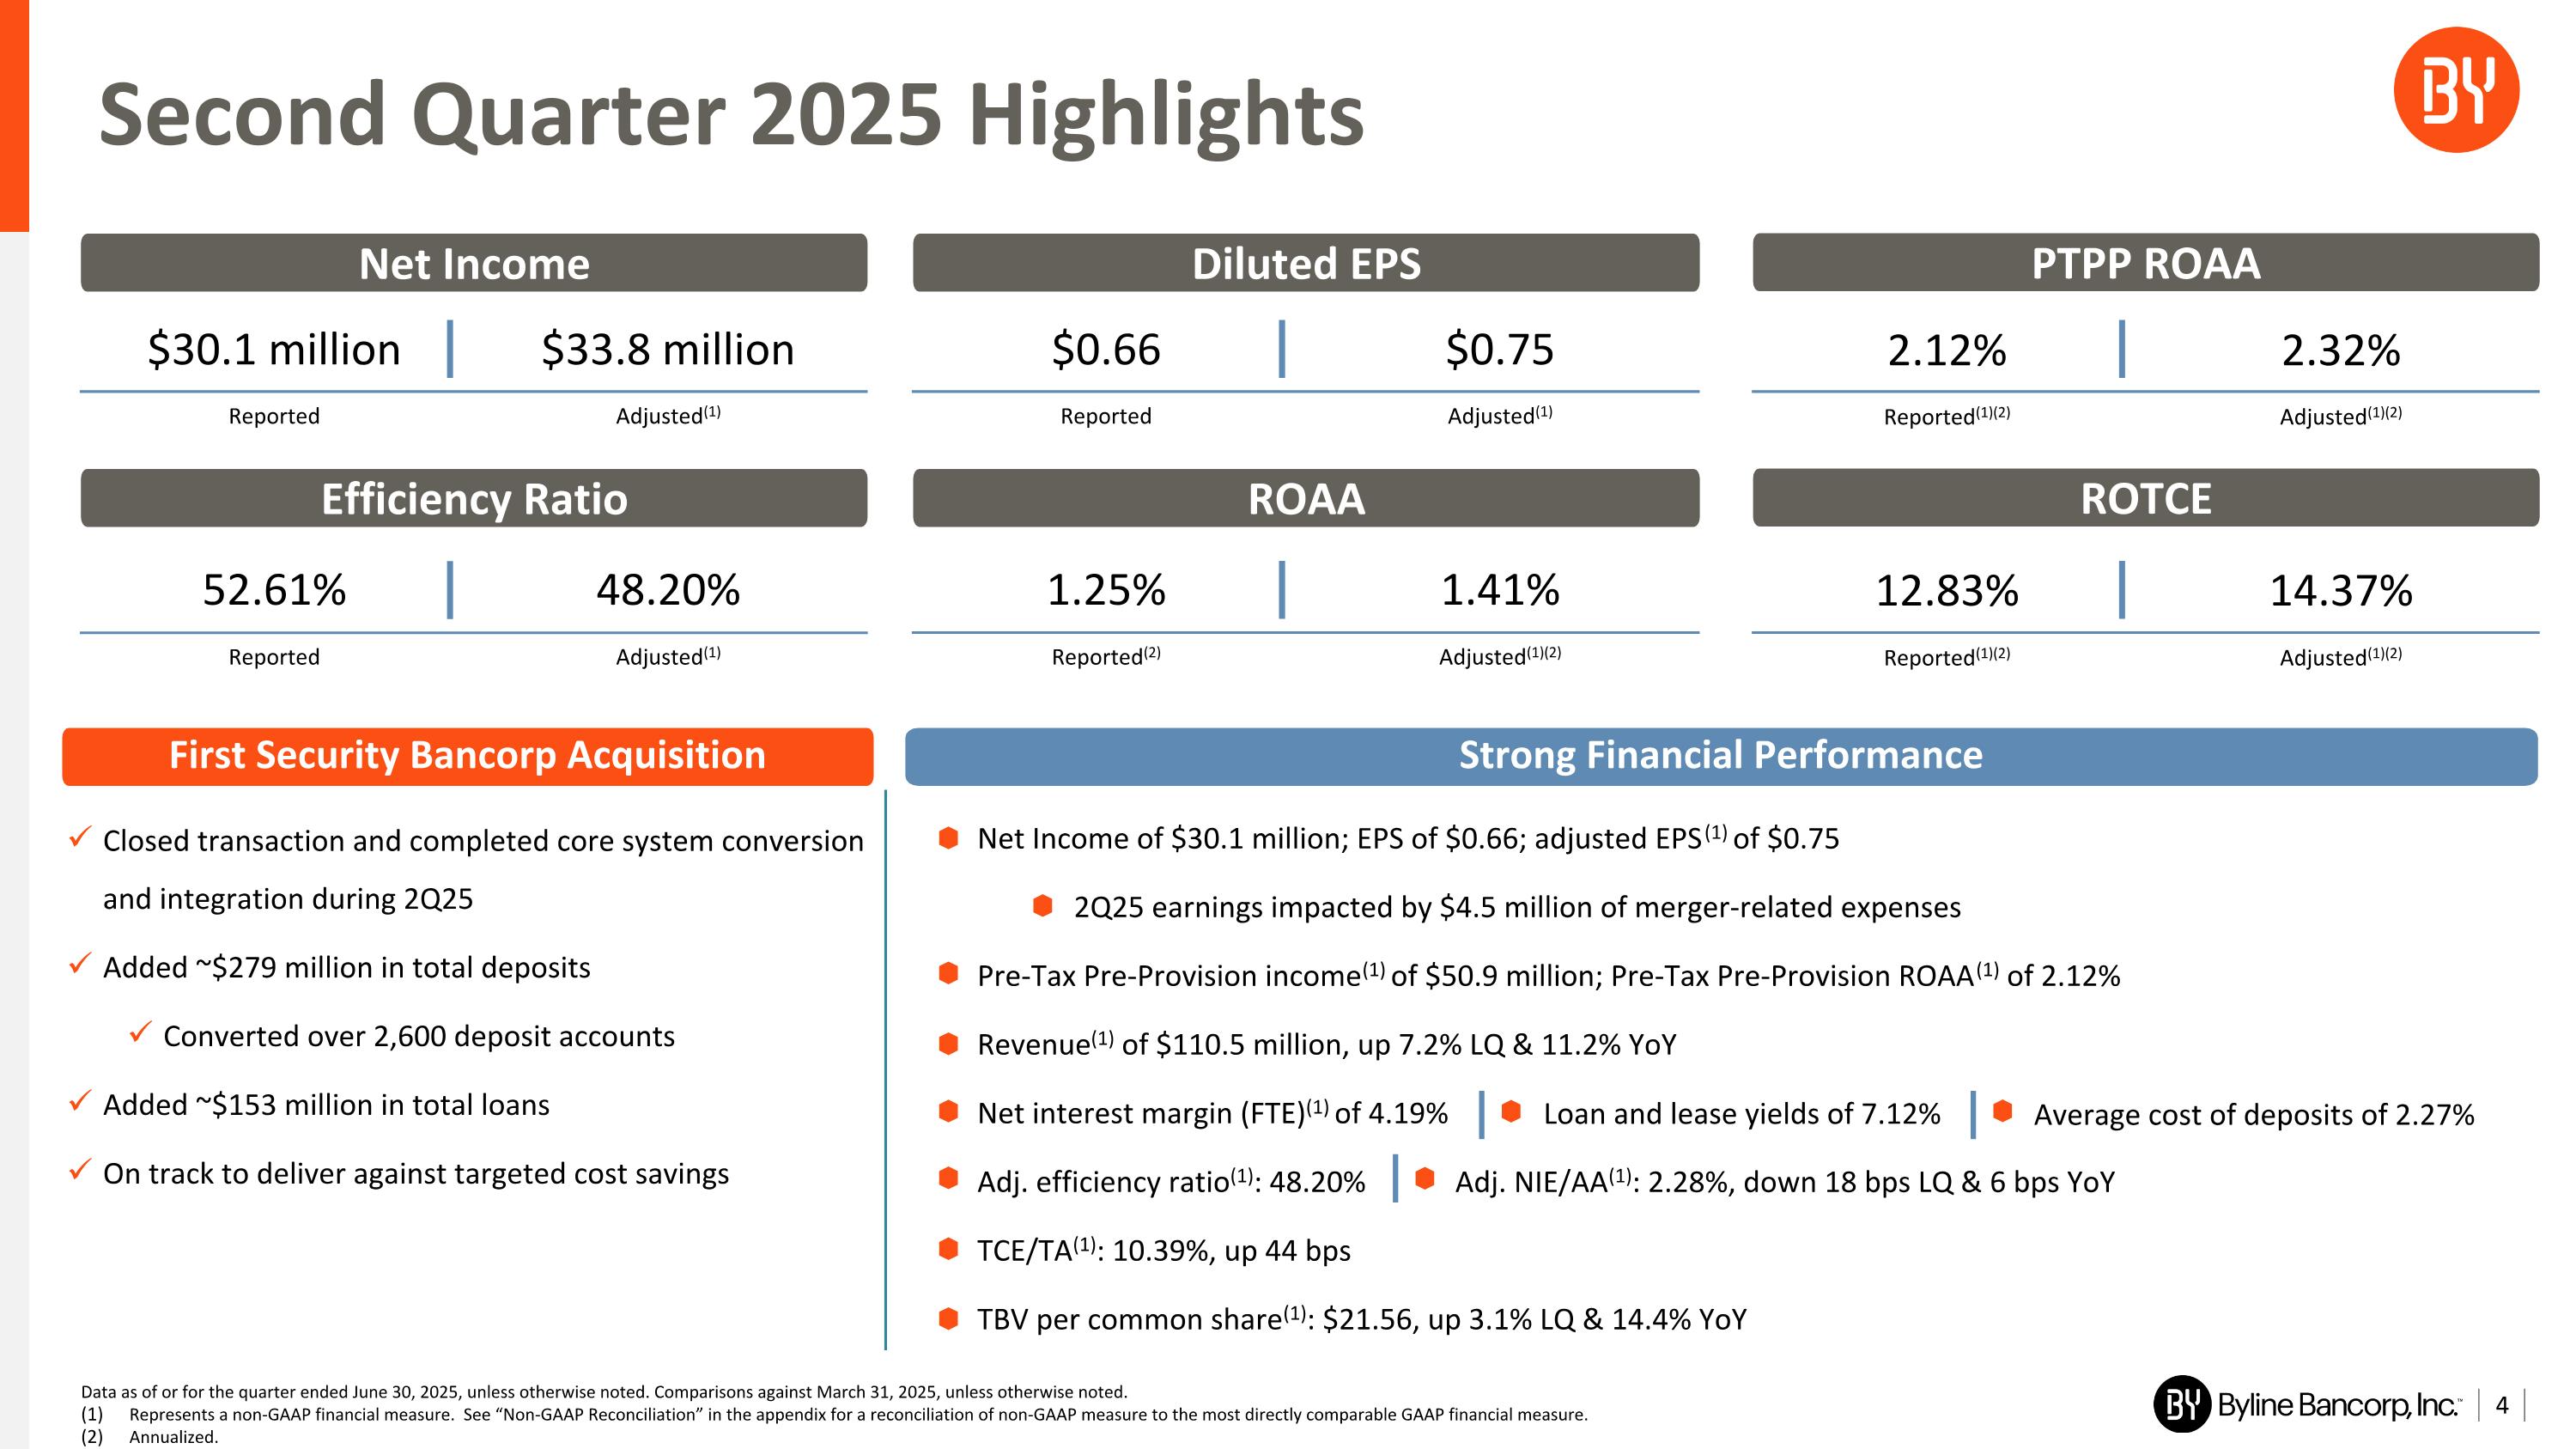
$30.1 million $33.8 million Reported Adjusted(1) 52.61% 48.20% Reported Adjusted(1) Second Quarter 2025 Highlights Data as of or for the quarter ended June 30, 2025, unless otherwise noted. Comparisons against March 31, 2025, unless otherwise noted. Represents a non-GAAP financial measure. See “Non-GAAP Reconciliation” in the appendix for a reconciliation of non-GAAP measure to the most directly comparable GAAP financial measure. Annualized. 2.12% 2.32% Reported(1)(2) Adjusted(1)(2) 12.83% 14.37% Reported(1)(2) Adjusted(1)(2) $0.66 $0.75 Reported Adjusted(1) 1.25% 1.41% Reported(2) Adjusted(1)(2) First Security Bancorp Acquisition Strong Financial Performance Closed transaction and completed core system conversion and integration during 2Q25 Added ~$279 million in total deposits Converted over 2,600 deposit accounts Added ~$153 million in total loans On track to deliver against targeted cost savings Net Income of $30.1 million; EPS of $0.66; adjusted EPS(1) of $0.75 2Q25 earnings impacted by $4.5 million of merger-related expenses Pre-Tax Pre-Provision income(1) of $50.9 million; Pre-Tax Pre-Provision ROAA(1) of 2.12% Revenue(1) of $110.5 million, up 7.2% LQ & 11.2% YoY Net interest margin (FTE)(1) of 4.19% Adj. efficiency ratio(1): 48.20% TCE/TA(1): 10.39%, up 44 bps TBV per common share(1): $21.56, up 3.1% LQ & 14.4% YoY Average cost of deposits of 2.27% Loan and lease yields of 7.12% Adj. NIE/AA(1): 2.28%, down 18 bps LQ & 6 bps YoY Net Income Diluted EPS PTPP ROAA Efficiency Ratio ROAA ROTCE
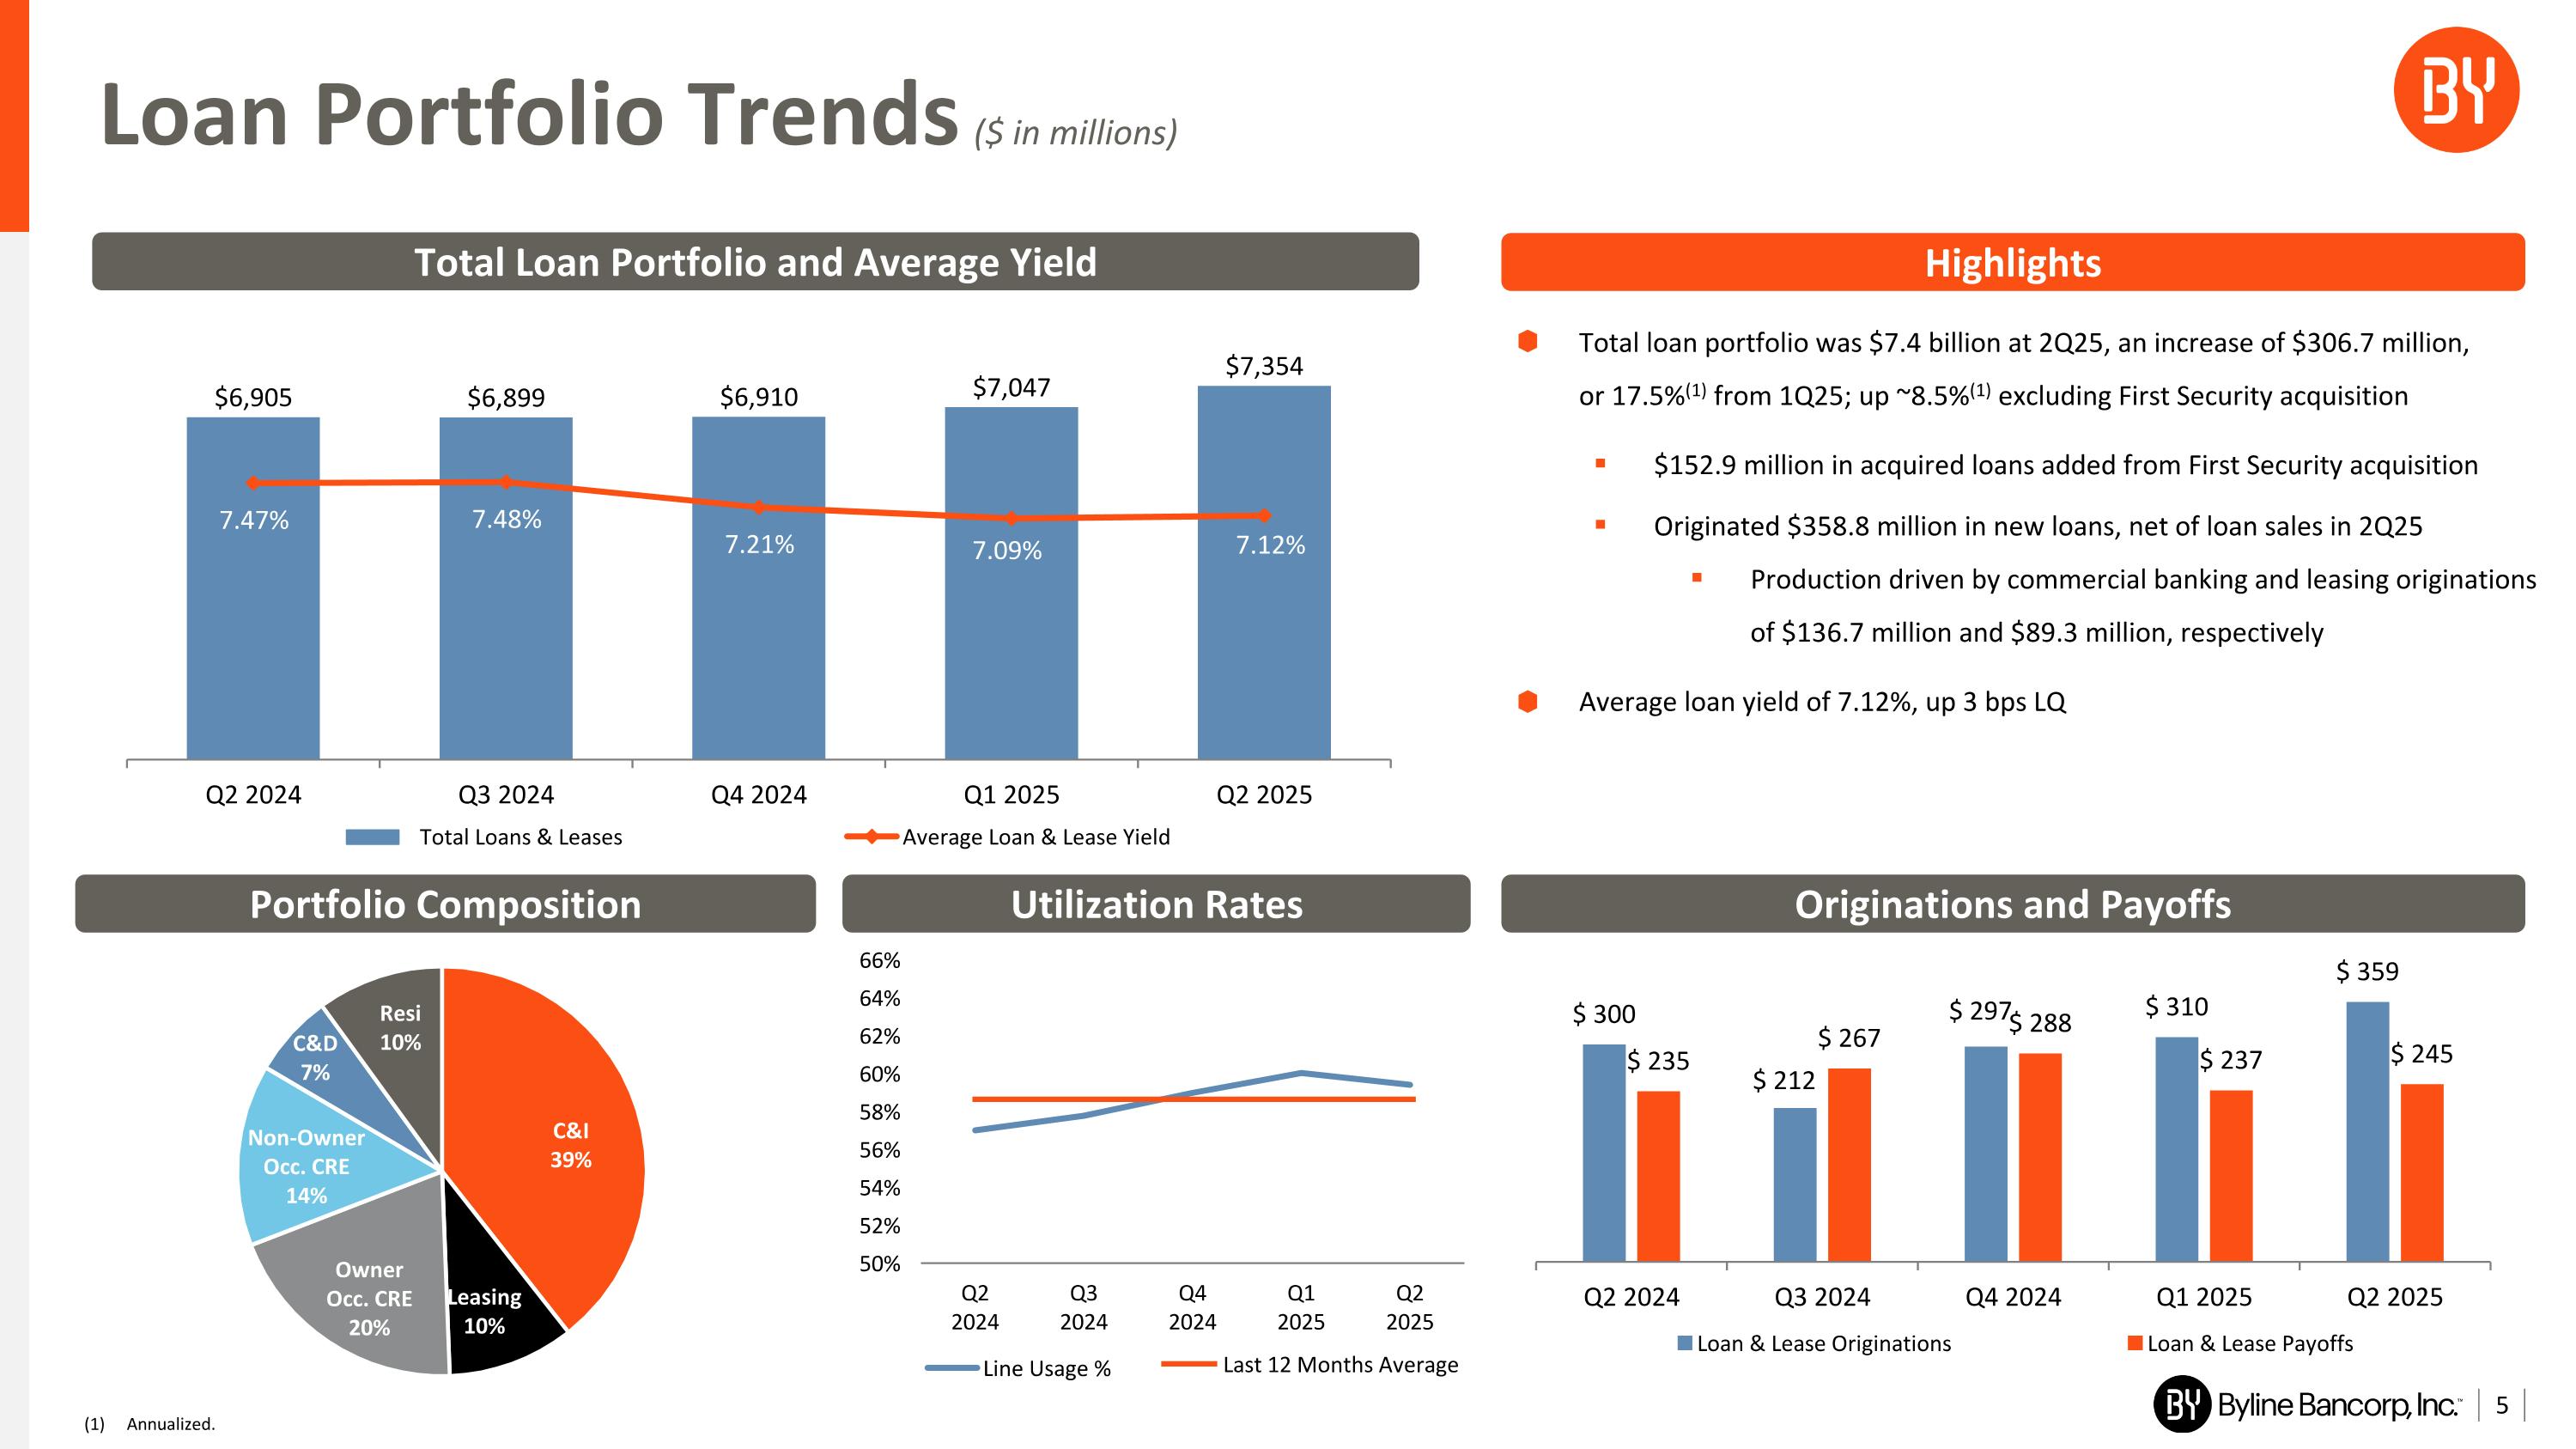
Highlights Total Loan Portfolio and Average Yield Loan Portfolio Trends ($ in millions) Portfolio Composition Total loan portfolio was $7.4 billion at 2Q25, an increase of $306.7 million, or 17.5%(1) from 1Q25; up ~8.5%(1) excluding First Security acquisition $152.9 million in acquired loans added from First Security acquisition Originated $358.8 million in new loans, net of loan sales in 2Q25 Production driven by commercial banking and leasing originations of $136.7 million and $89.3 million, respectively Average loan yield of 7.12%, up 3 bps LQ Utilization Rates Originations and Payoffs Last 12 Months Average (1) Annualized.
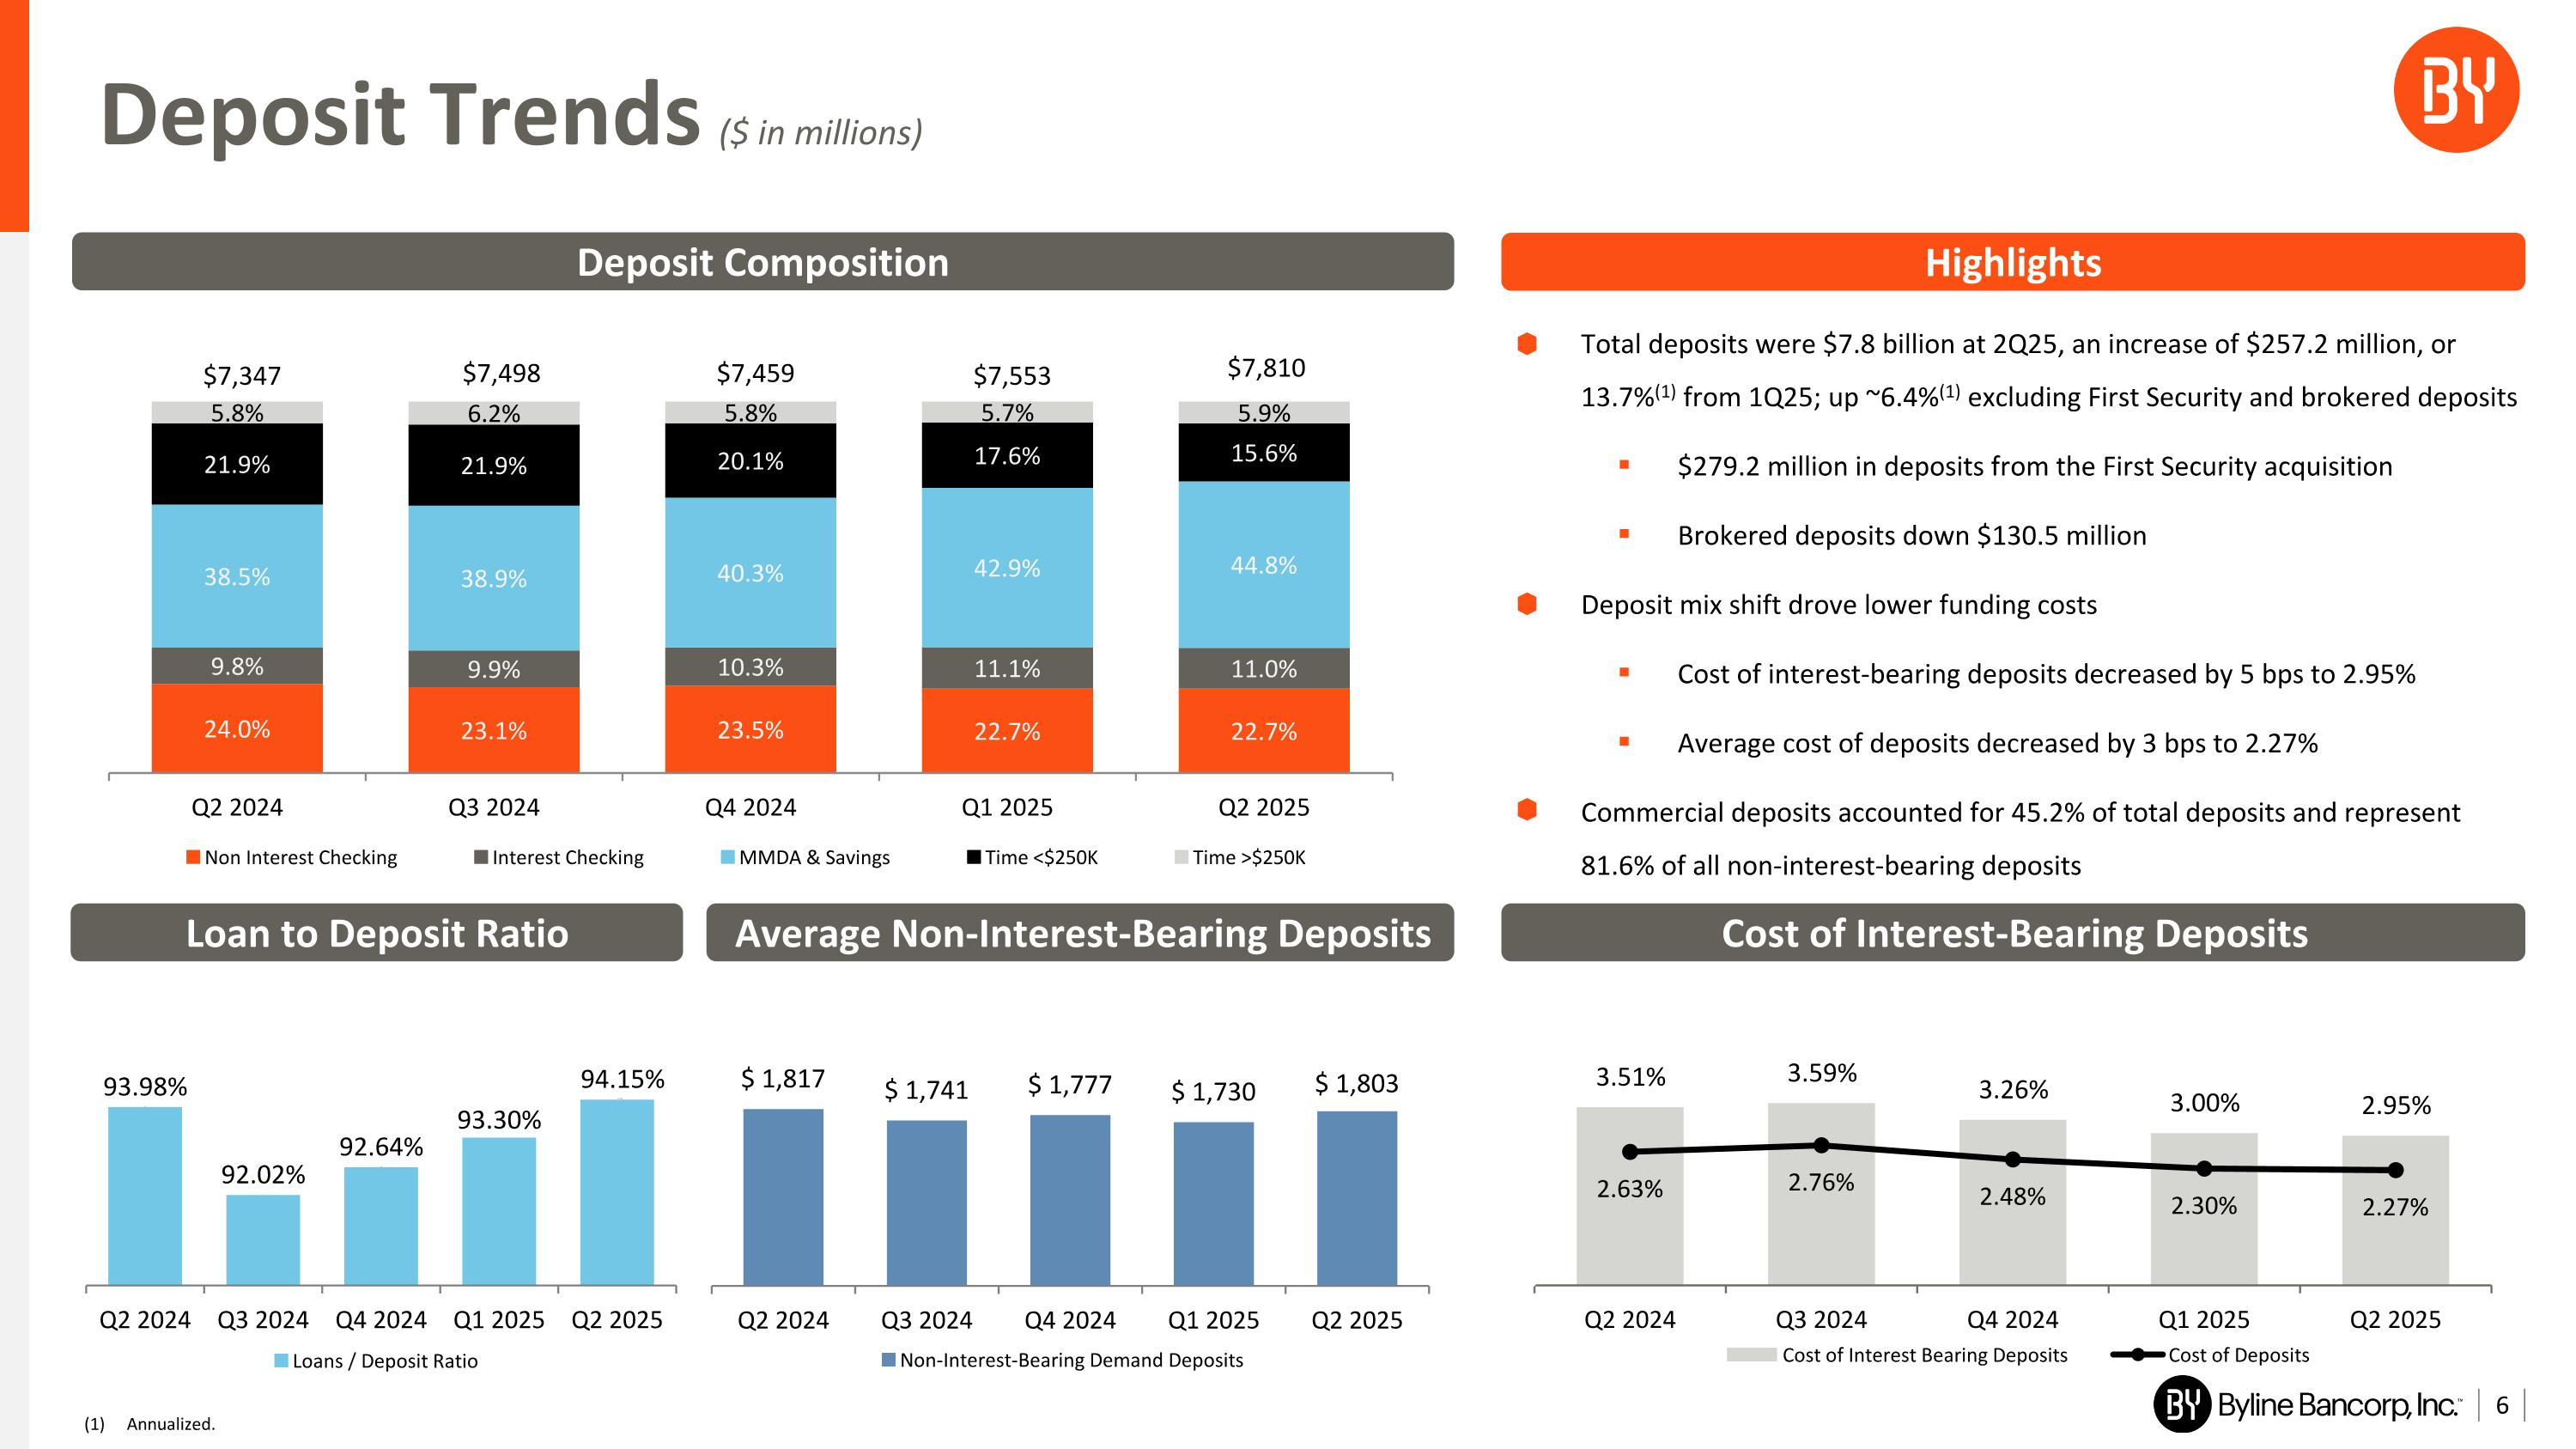
Deposit Trends ($ in millions) Total deposits were $7.8 billion at 2Q25, an increase of $257.2 million, or 13.7%(1) from 1Q25; up ~6.4%(1) excluding First Security and brokered deposits $279.2 million in deposits from the First Security acquisition Brokered deposits down $130.5 million Deposit mix shift drove lower funding costs Cost of interest-bearing deposits decreased by 5 bps to 2.95% Average cost of deposits decreased by 3 bps to 2.27% Commercial deposits accounted for 45.2% of total deposits and represent 81.6% of all non-interest-bearing deposits Deposit Composition Highlights Cost of Interest-Bearing Deposits Average Non-Interest-Bearing Deposits Loan to Deposit Ratio (1) Annualized.
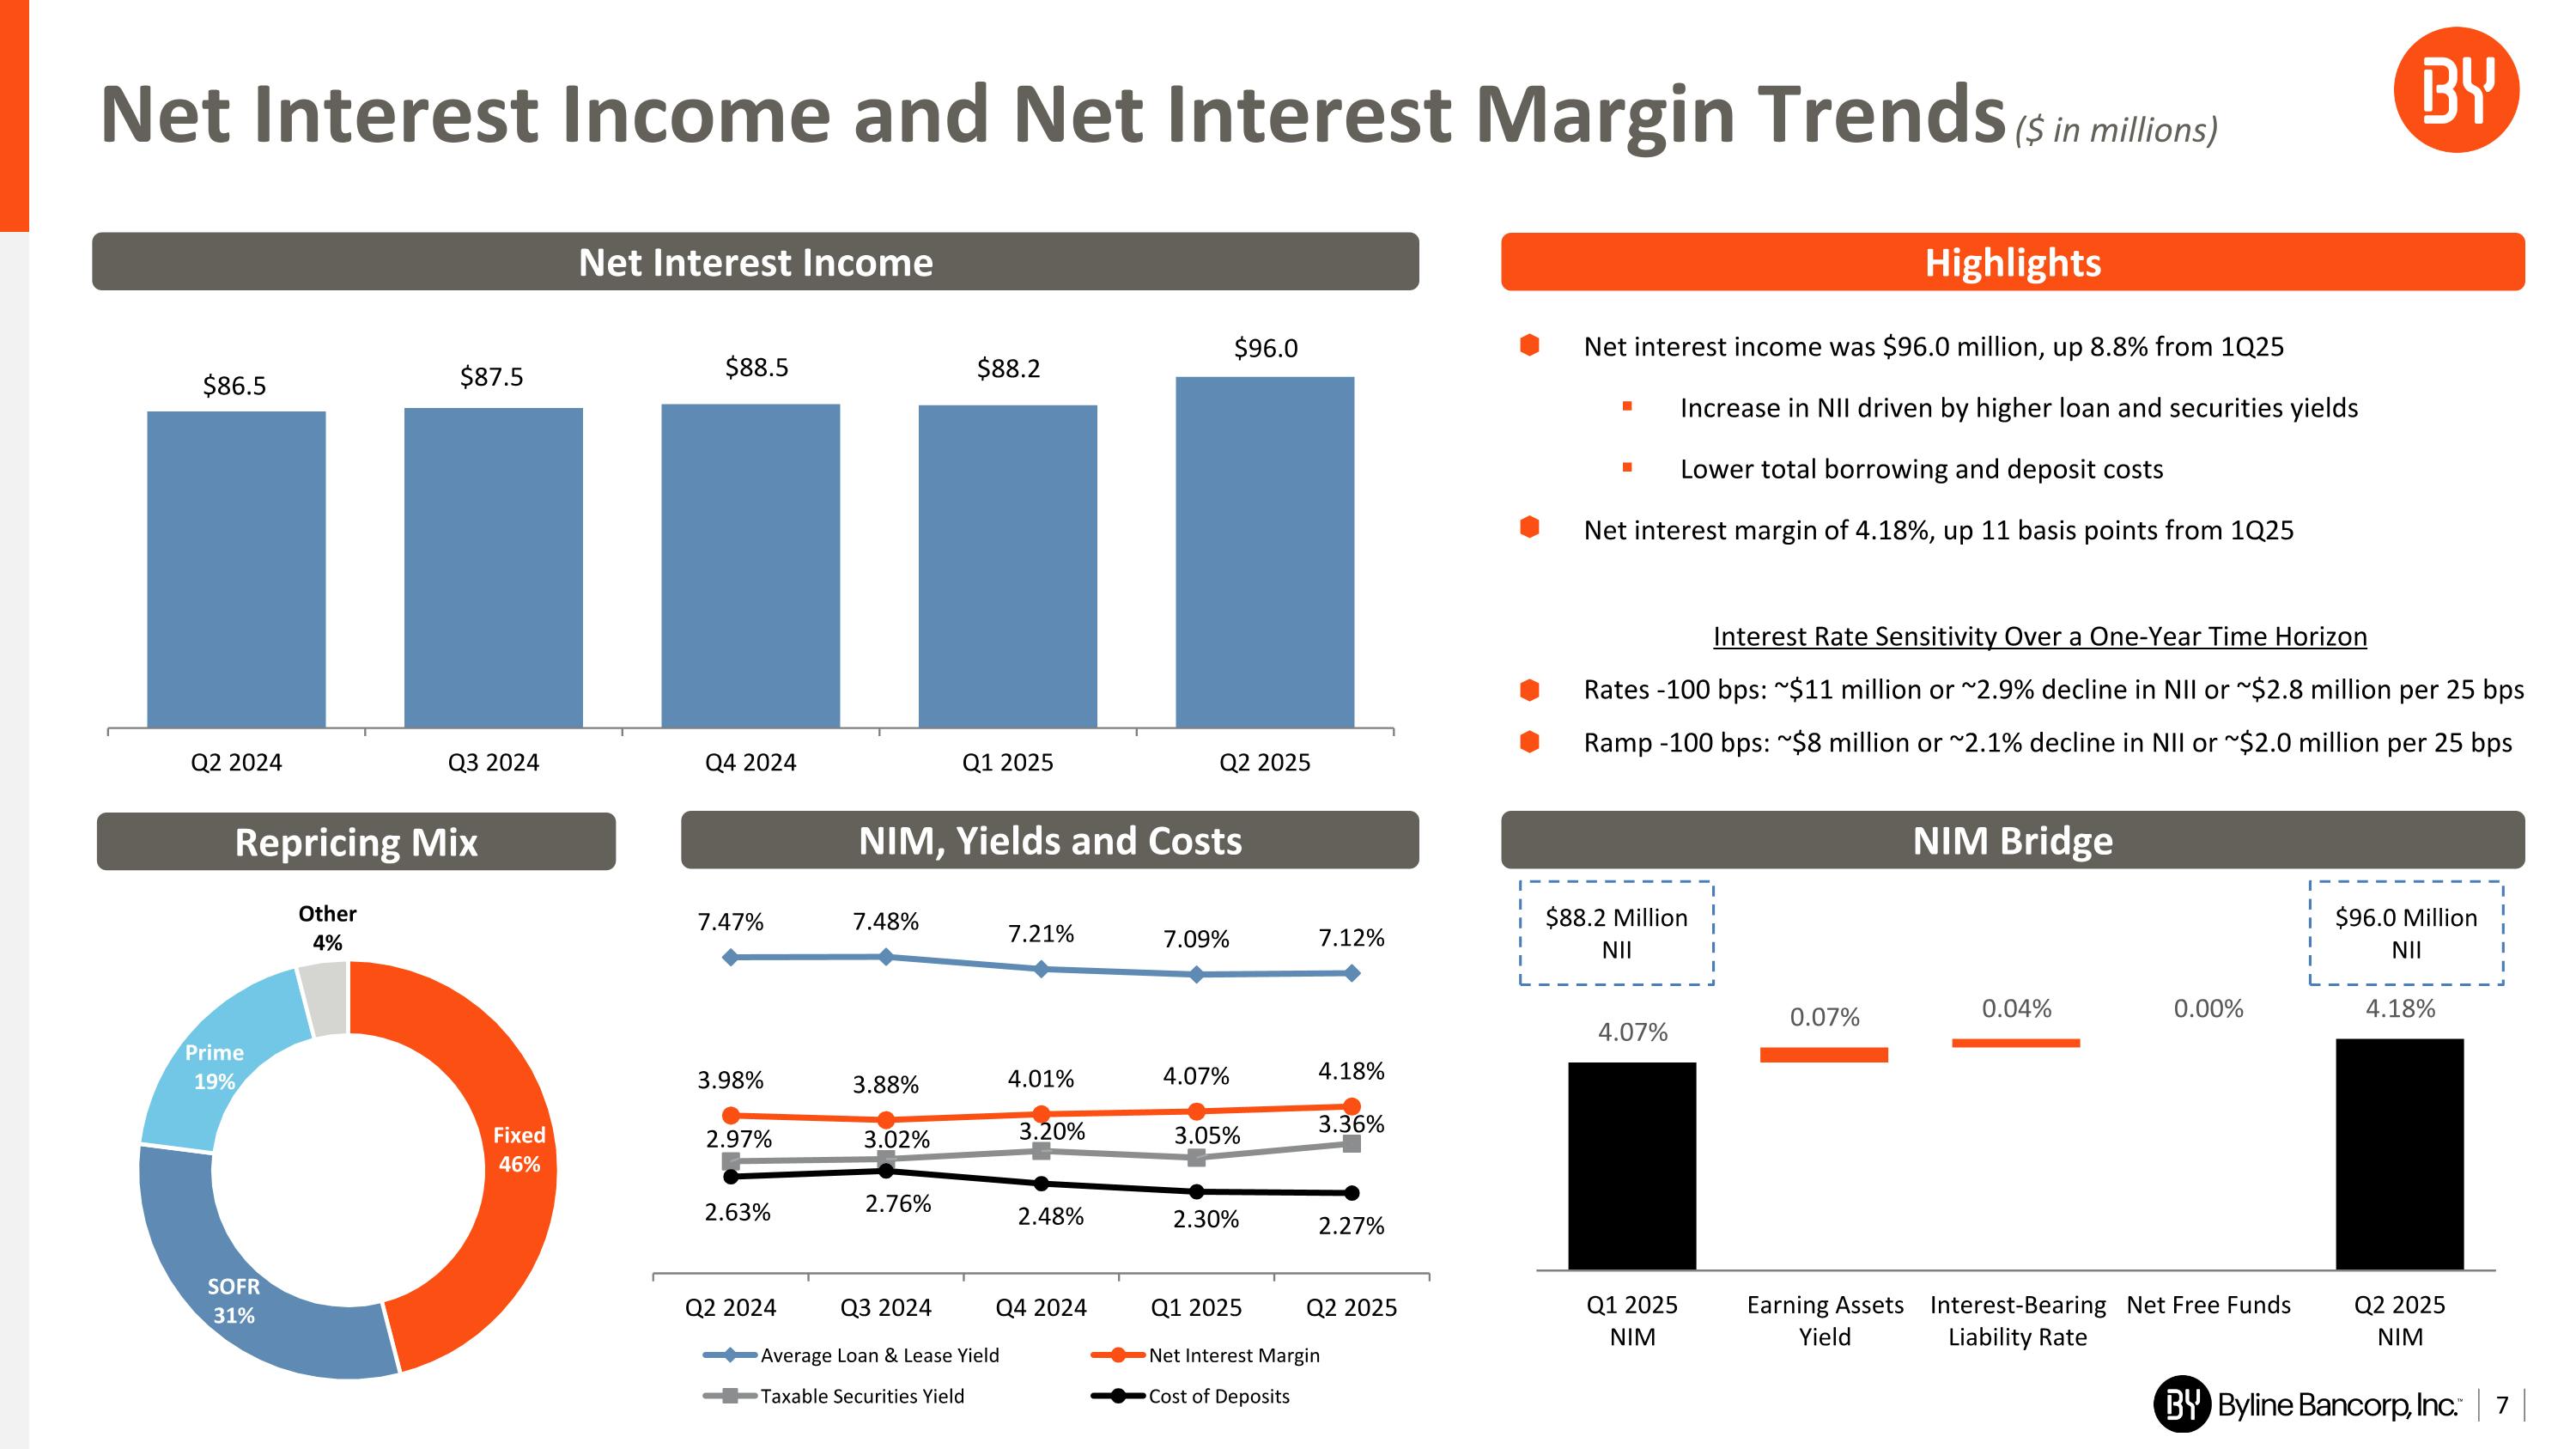
Net Interest Income and Net Interest Margin Trends ($ in millions) Net interest income was $96.0 million, up 8.8% from 1Q25 Increase in NII driven by higher loan and securities yields Lower total borrowing and deposit costs Net interest margin of 4.18%, up 11 basis points from 1Q25 Interest Rate Sensitivity Over a One-Year Time Horizon Rates -100 bps: ~$11 million or ~2.9% decline in NII or ~$2.8 million per 25 bps Ramp -100 bps: ~$8 million or ~2.1% decline in NII or ~$2.0 million per 25 bps Net Interest Income Highlights NIM Bridge NIM, Yields and Costs Repricing Mix $88.2 Million NII $96.0 Million NII
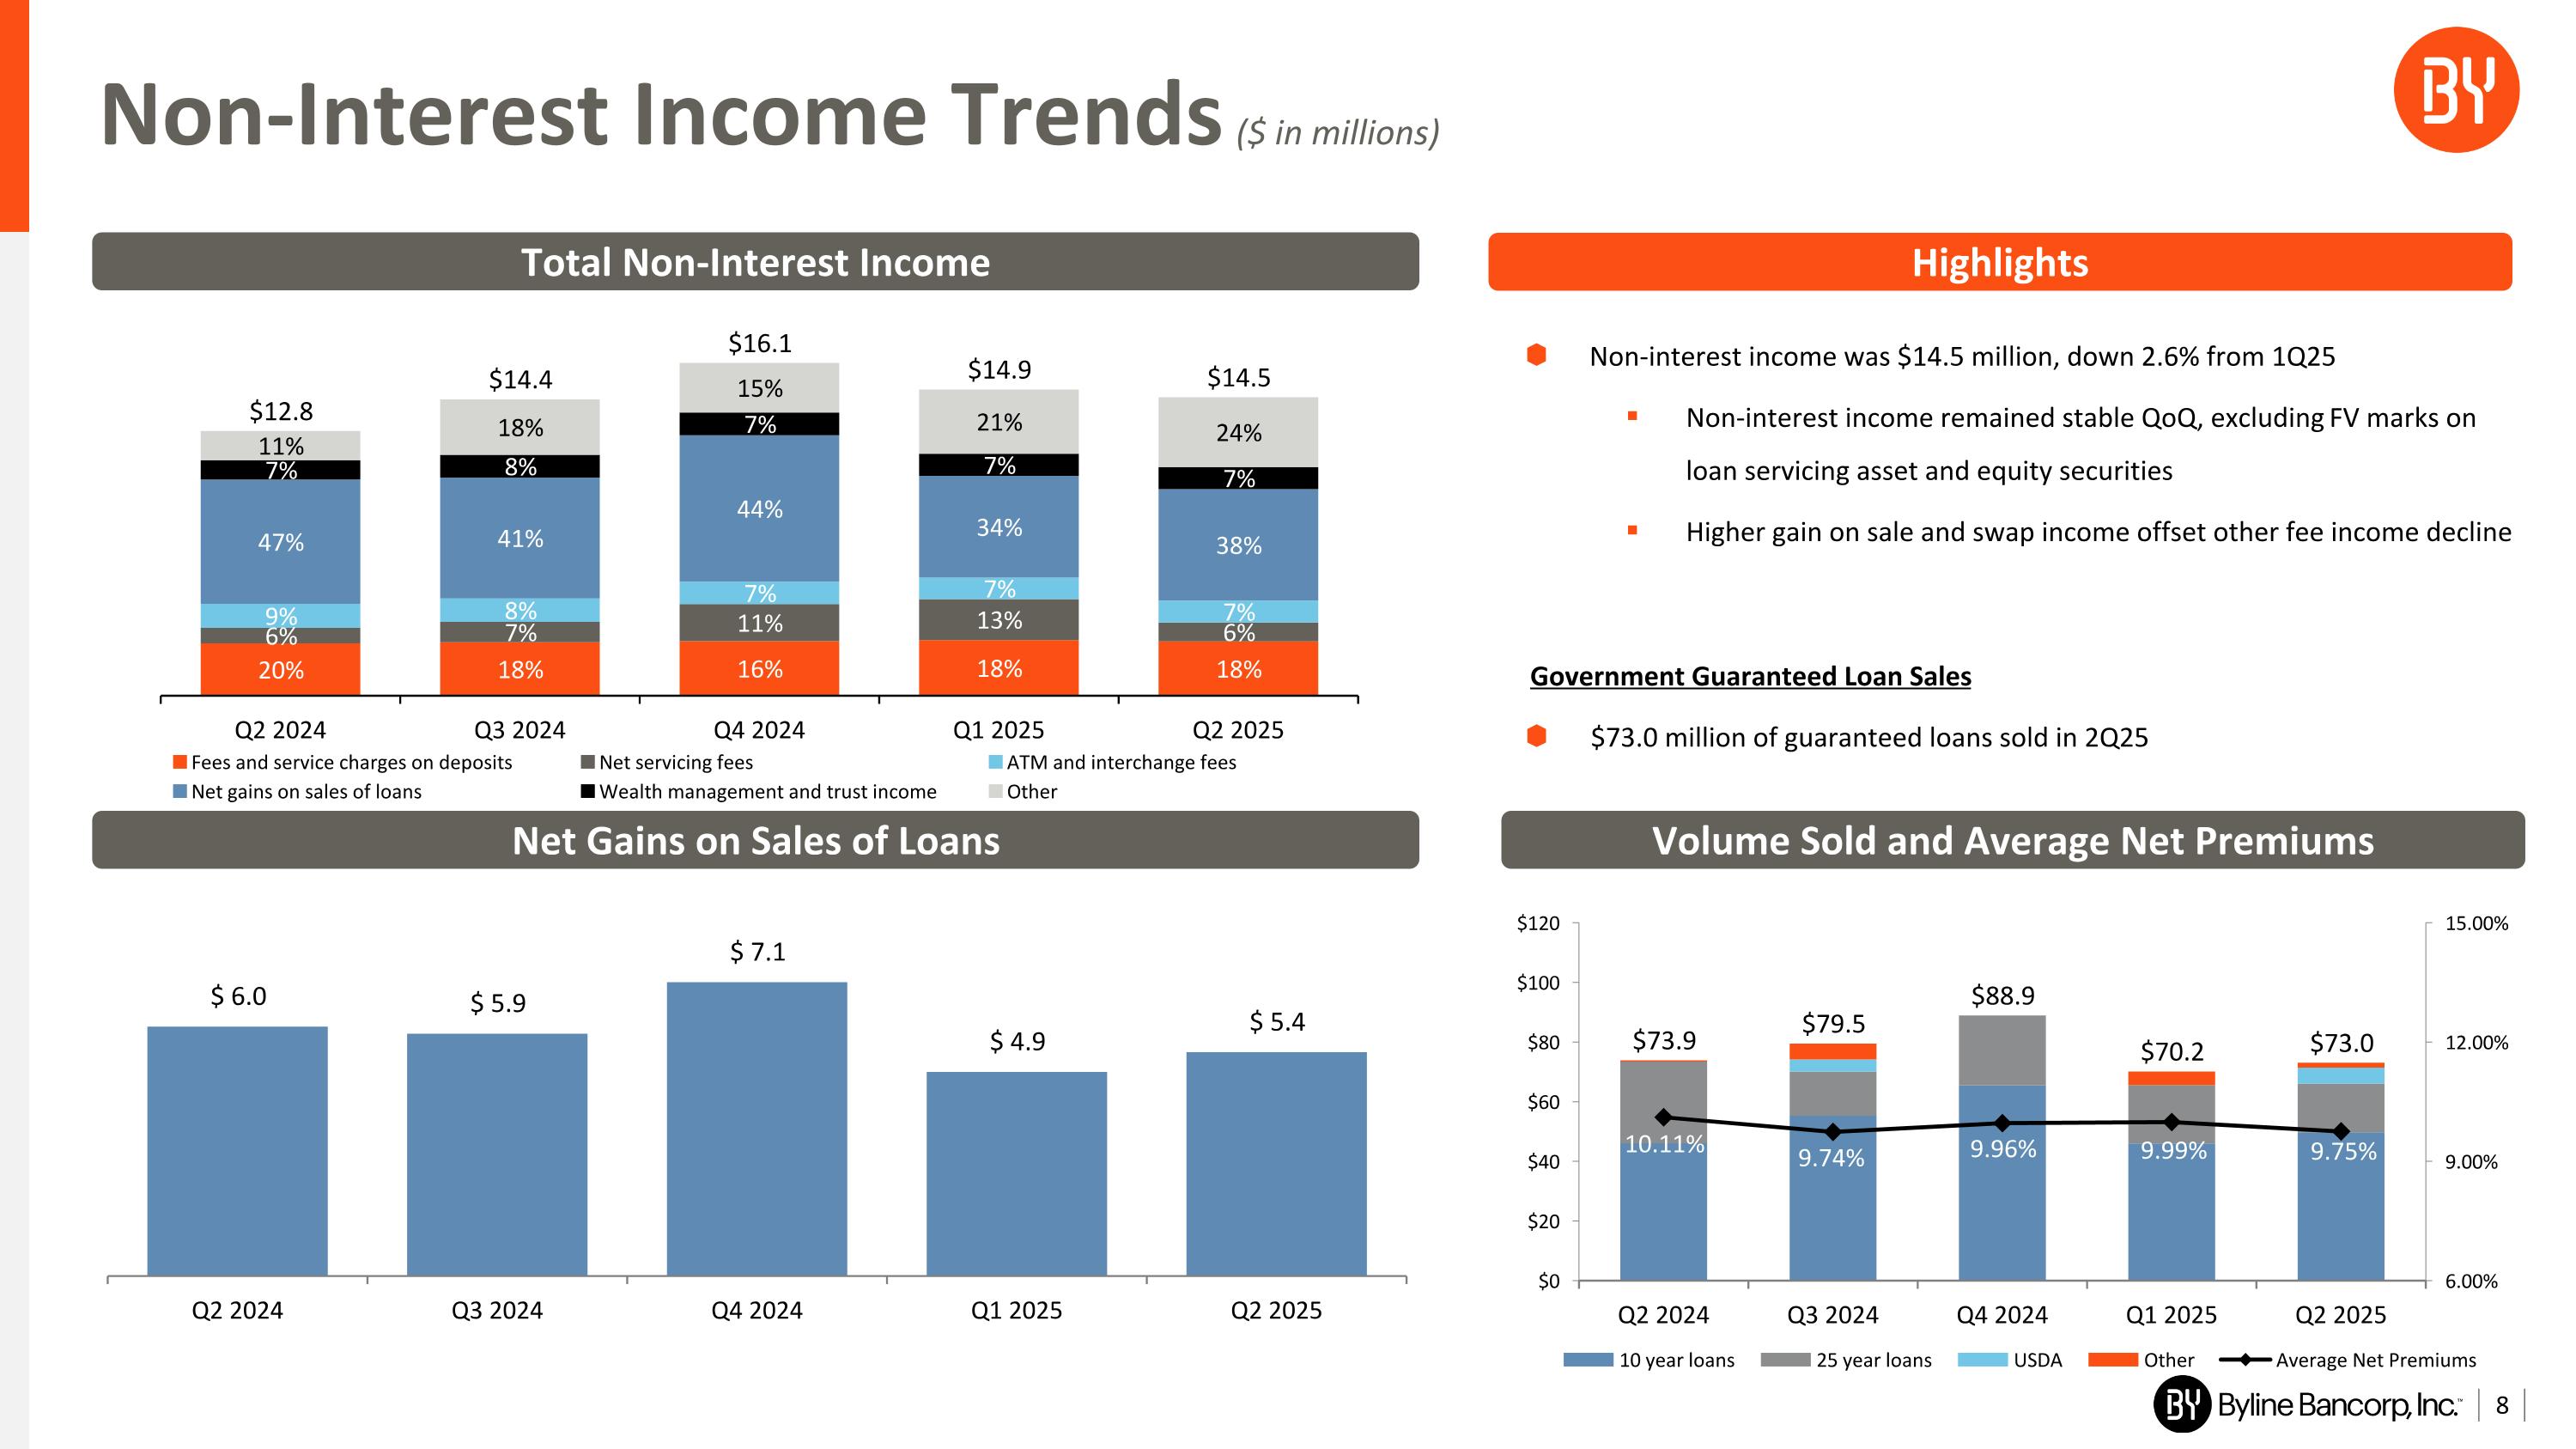
Non-Interest Income Trends ($ in millions) Government Guaranteed Loan Sales $73.0 million of guaranteed loans sold in 2Q25 Non-interest income was $14.5 million, down 2.6% from 1Q25 Non-interest income remained stable QoQ, excluding FV marks on loan servicing asset and equity securities Higher gain on sale and swap income offset other fee income decline Volume Sold and Average Net Premiums Total Non-Interest Income Highlights Net Gains on Sales of Loans
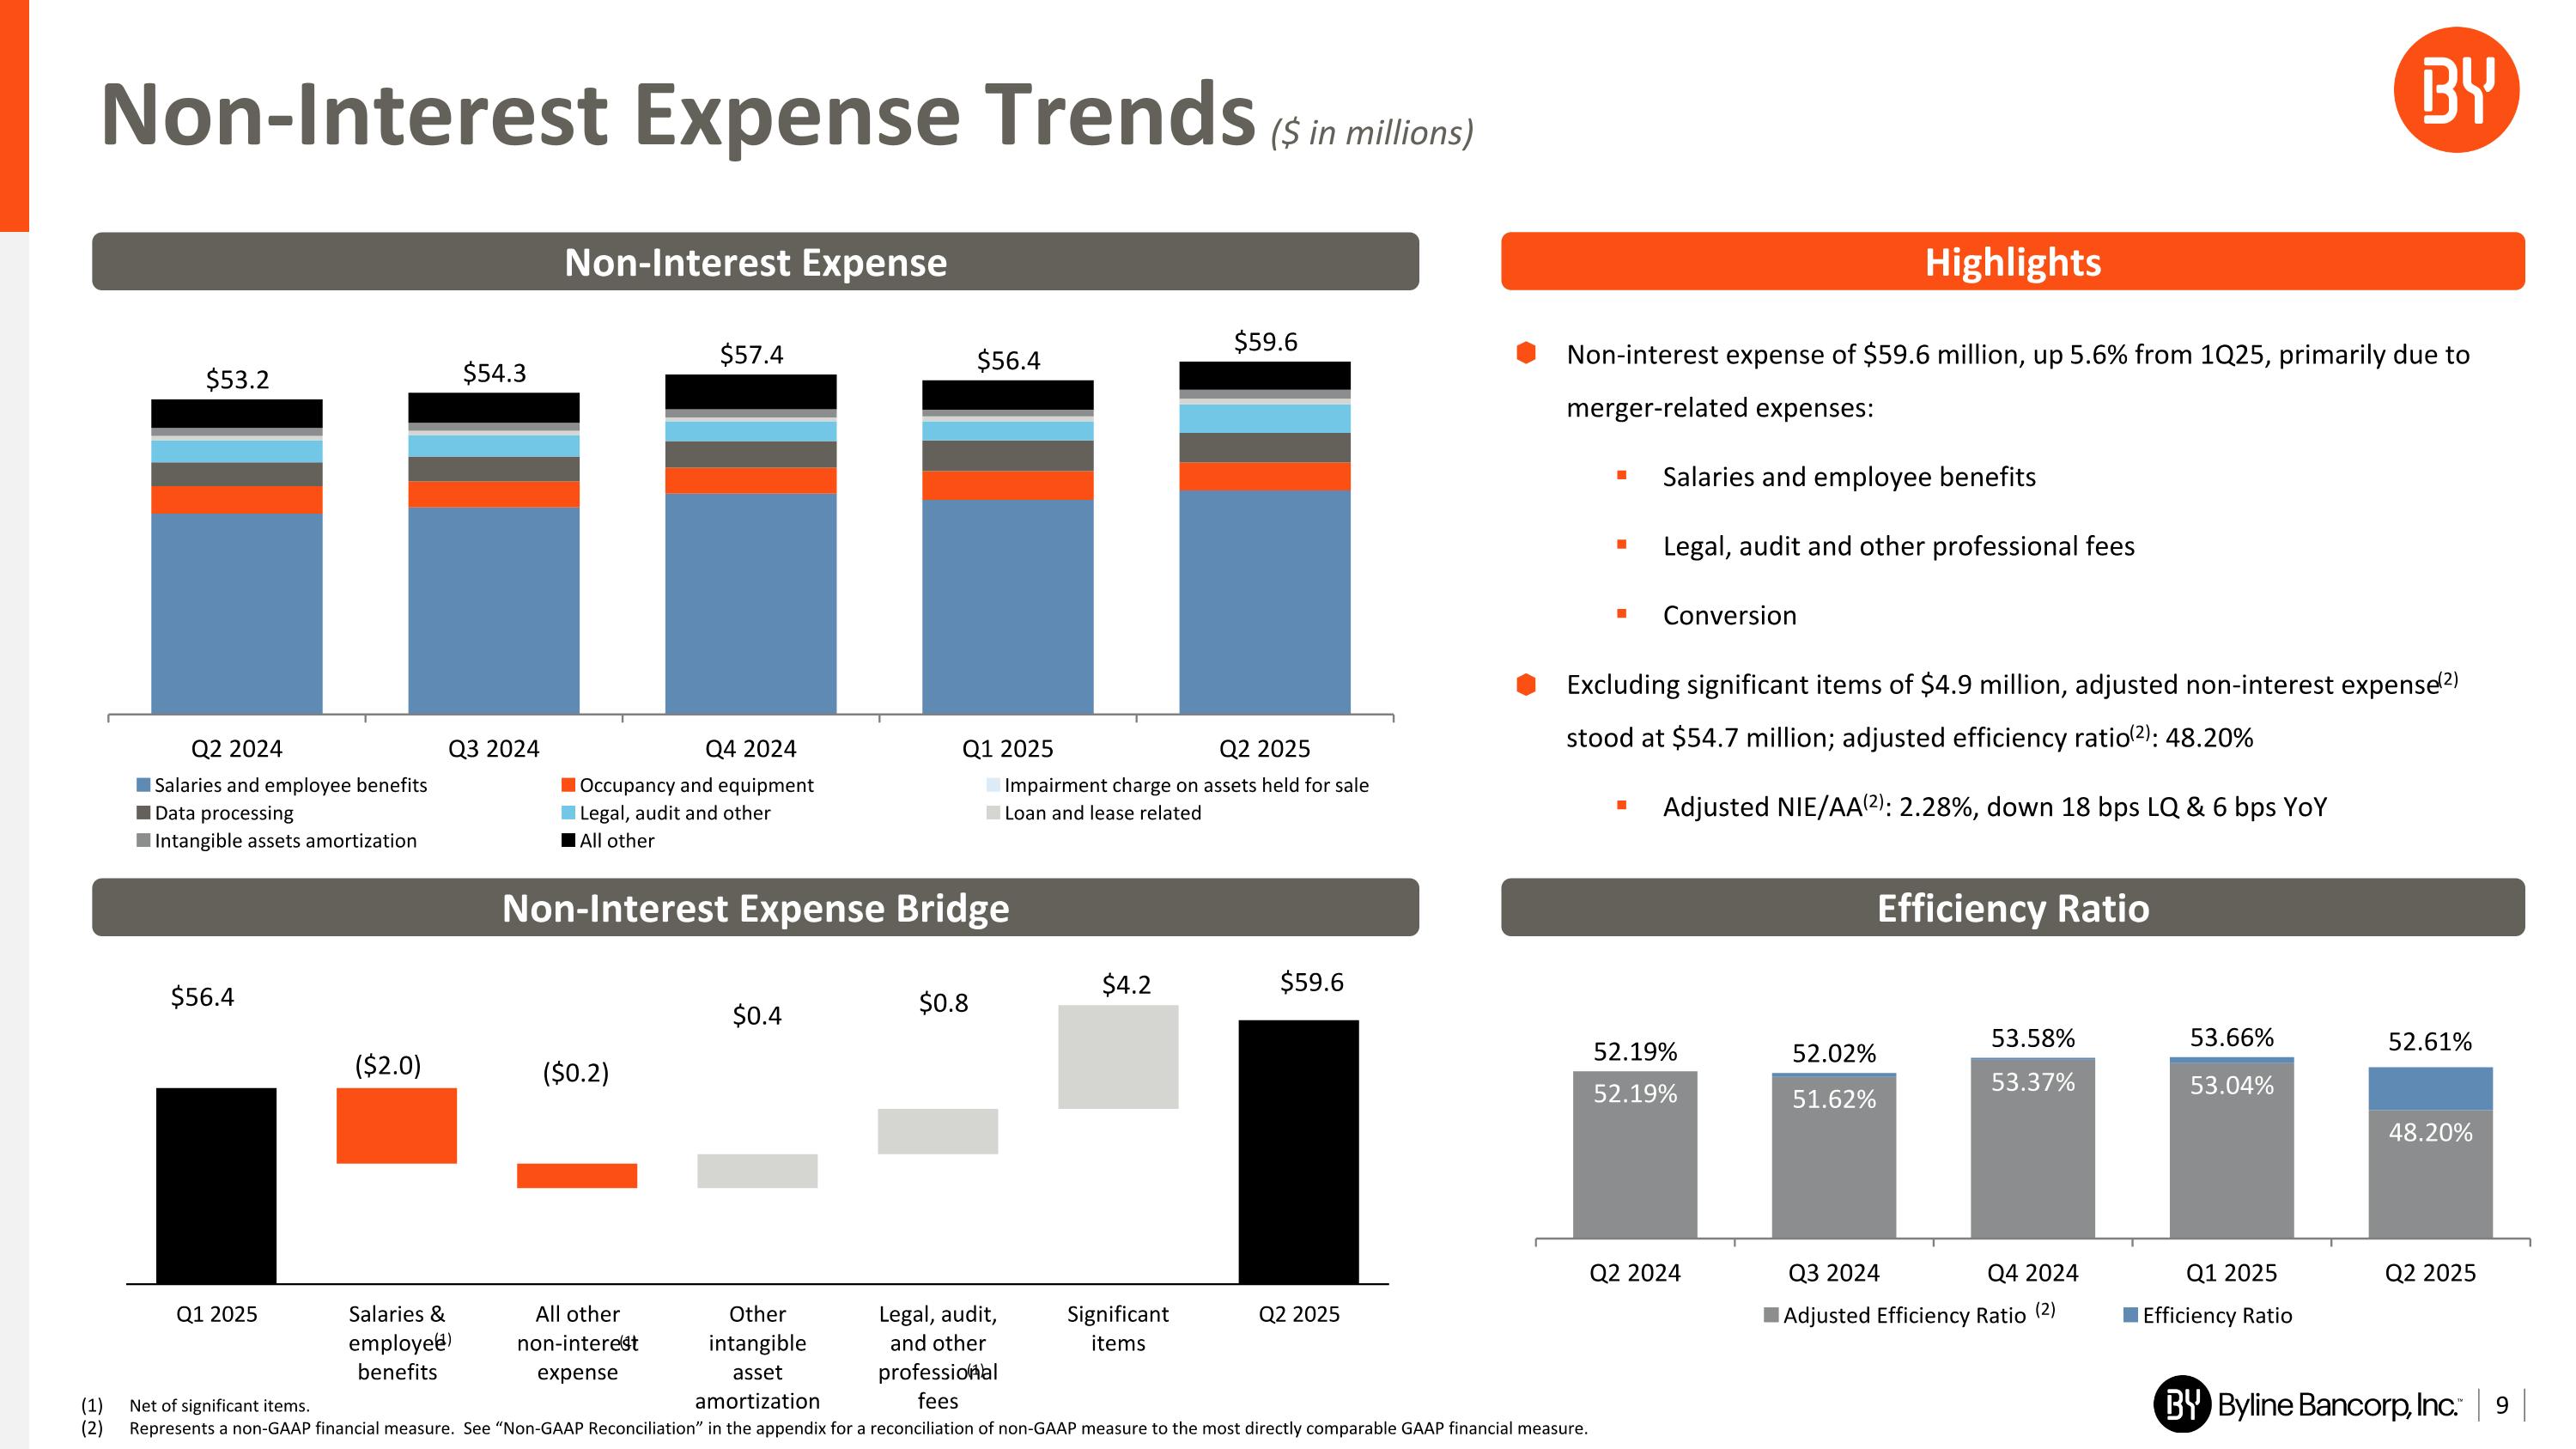
Non-Interest Expense Trends ($ in millions) (2) Non-interest expense of $59.6 million, up 5.6% from 1Q25, primarily due to merger-related expenses: Salaries and employee benefits Legal, audit and other professional fees Conversion Excluding significant items of $4.9 million, adjusted non-interest expense(2) stood at $54.7 million; adjusted efficiency ratio(2): 48.20% Adjusted NIE/AA(2): 2.28%, down 18 bps LQ & 6 bps YoY Efficiency Ratio Non-Interest Expense Highlights Non-Interest Expense Bridge Net of significant items. Represents a non-GAAP financial measure. See “Non-GAAP Reconciliation” in the appendix for a reconciliation of non-GAAP measure to the most directly comparable GAAP financial measure. ($2.0) ($0.2) $4.2 $56.4 $59.6 $0.8 $0.4 (1) (1) (1)
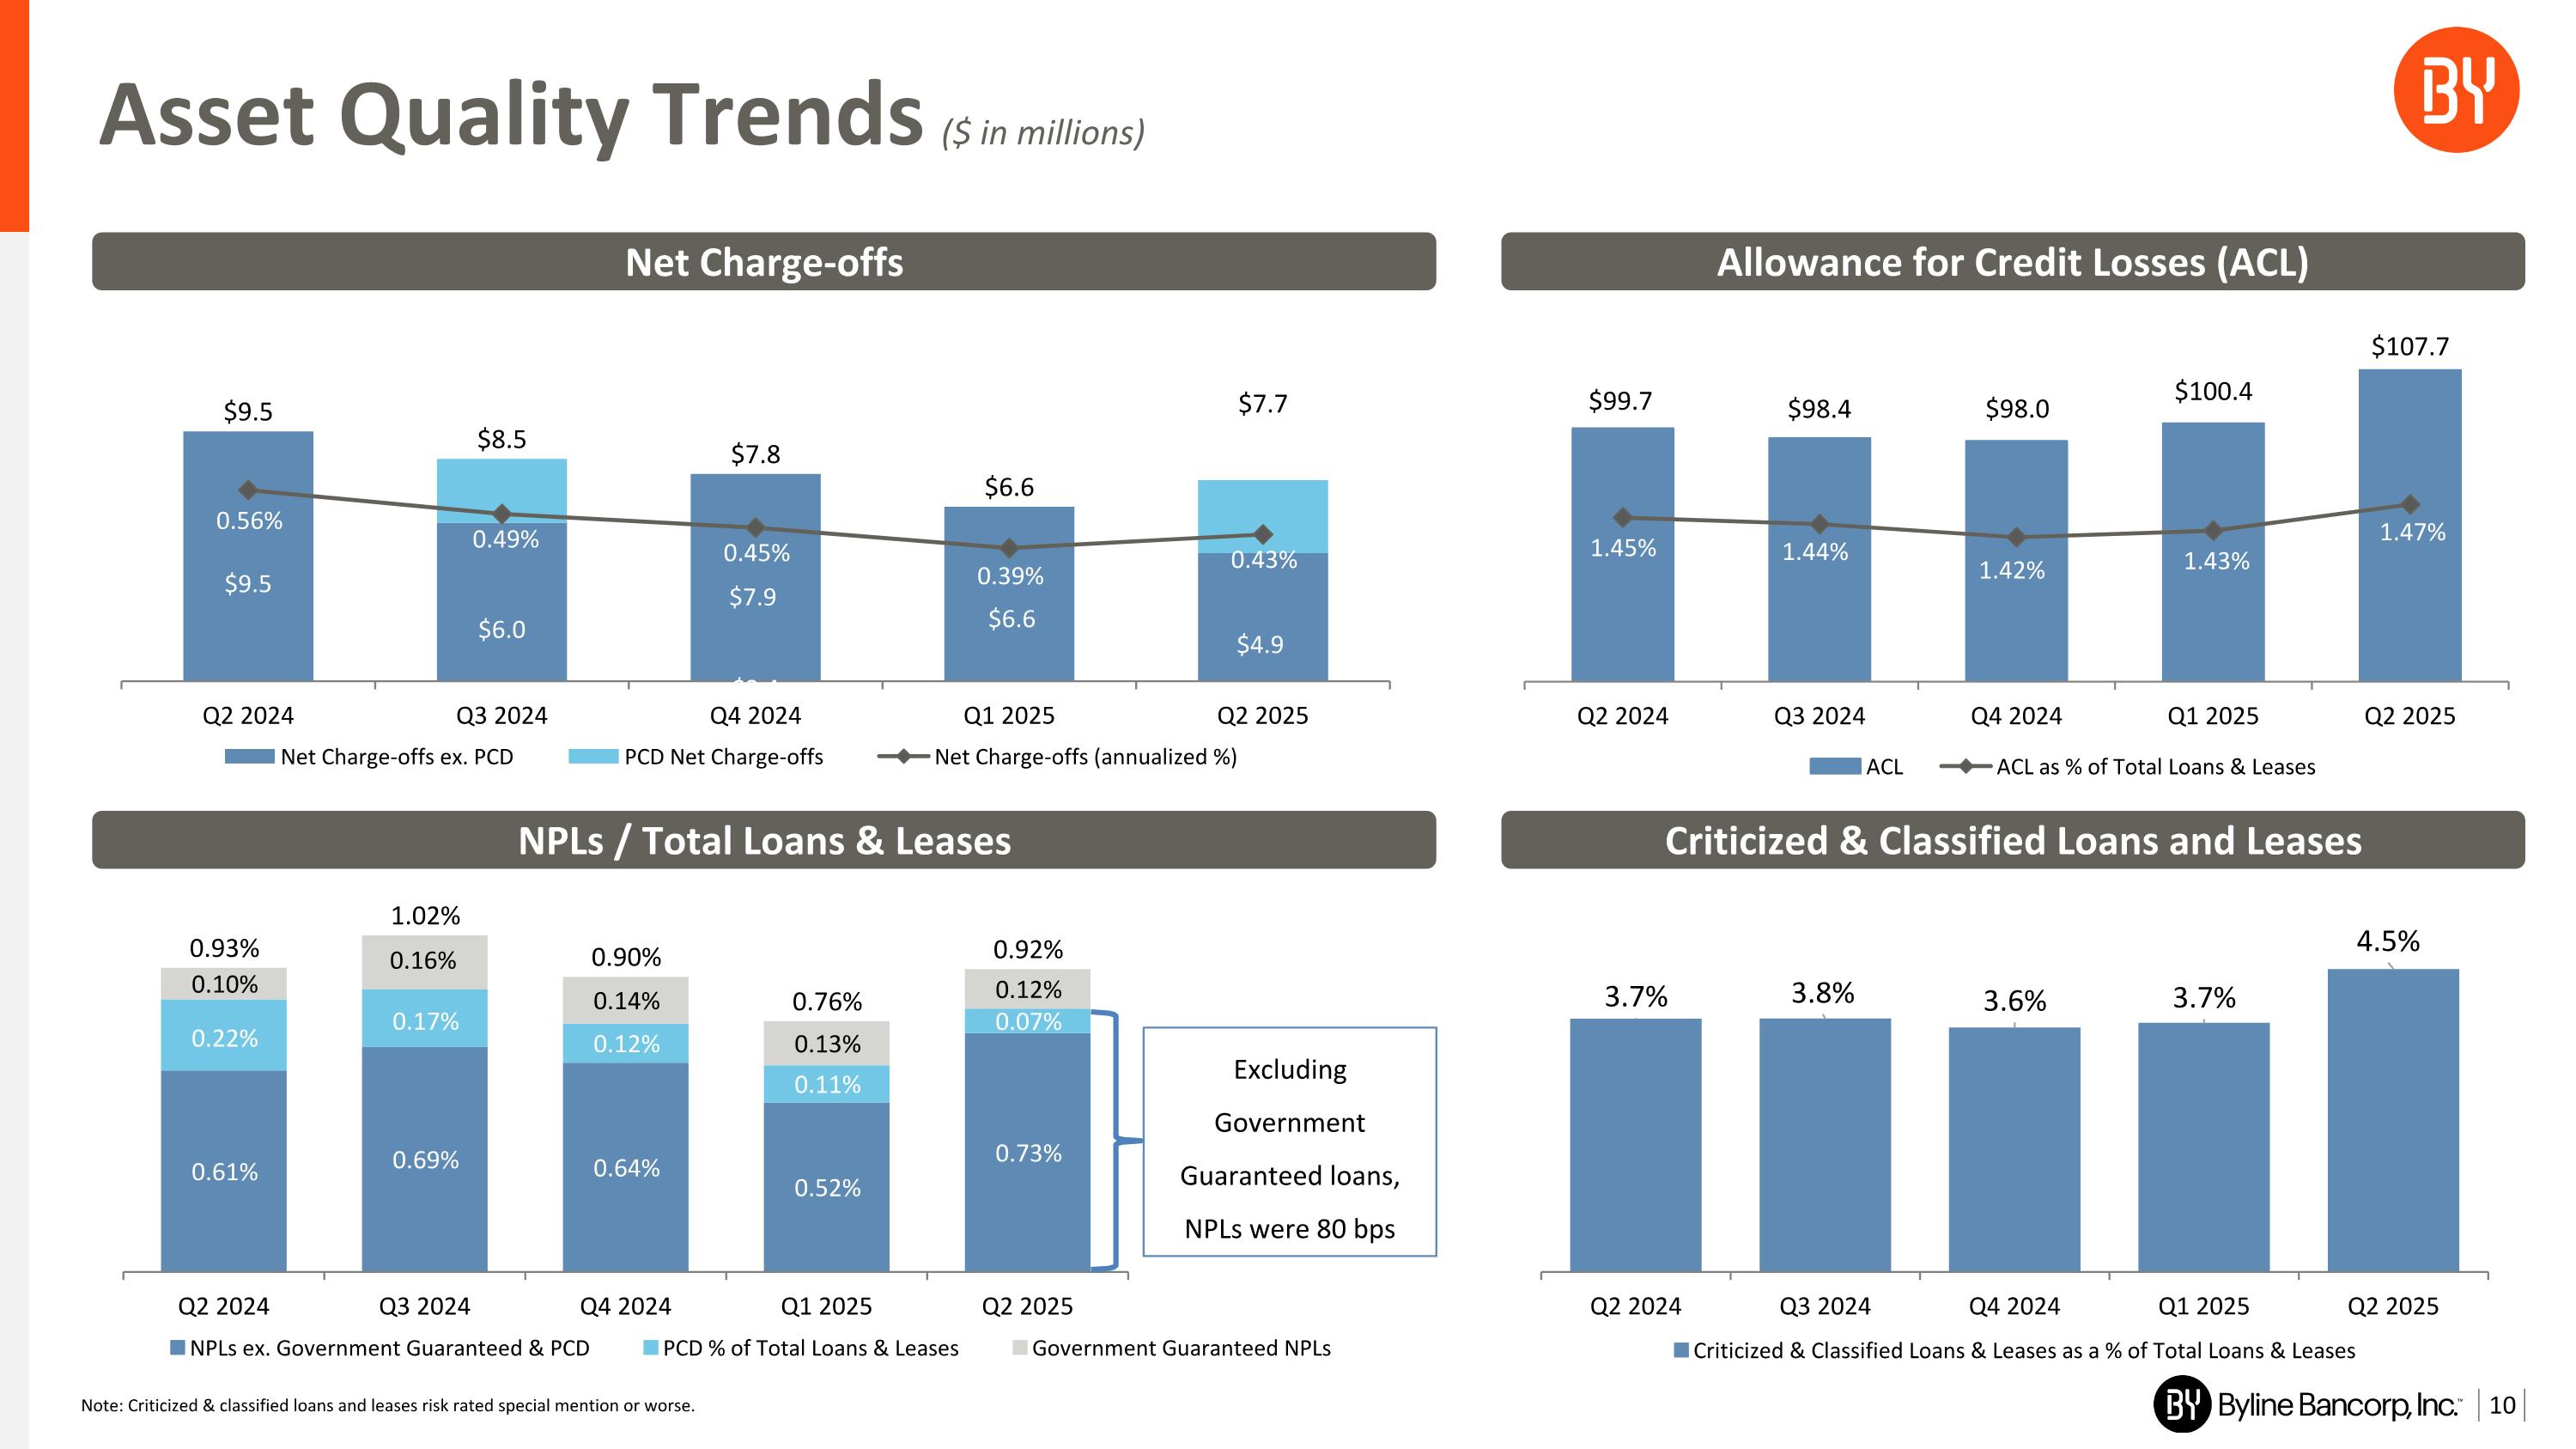
Asset Quality Trends ($ in millions) Criticized & Classified Loans and Leases Net Charge-offs NPLs / Total Loans & Leases Allowance for Credit Losses (ACL) Excluding Government Guaranteed loans, NPLs were 80 bps Note: Criticized & classified loans and leases risk rated special mention or worse.
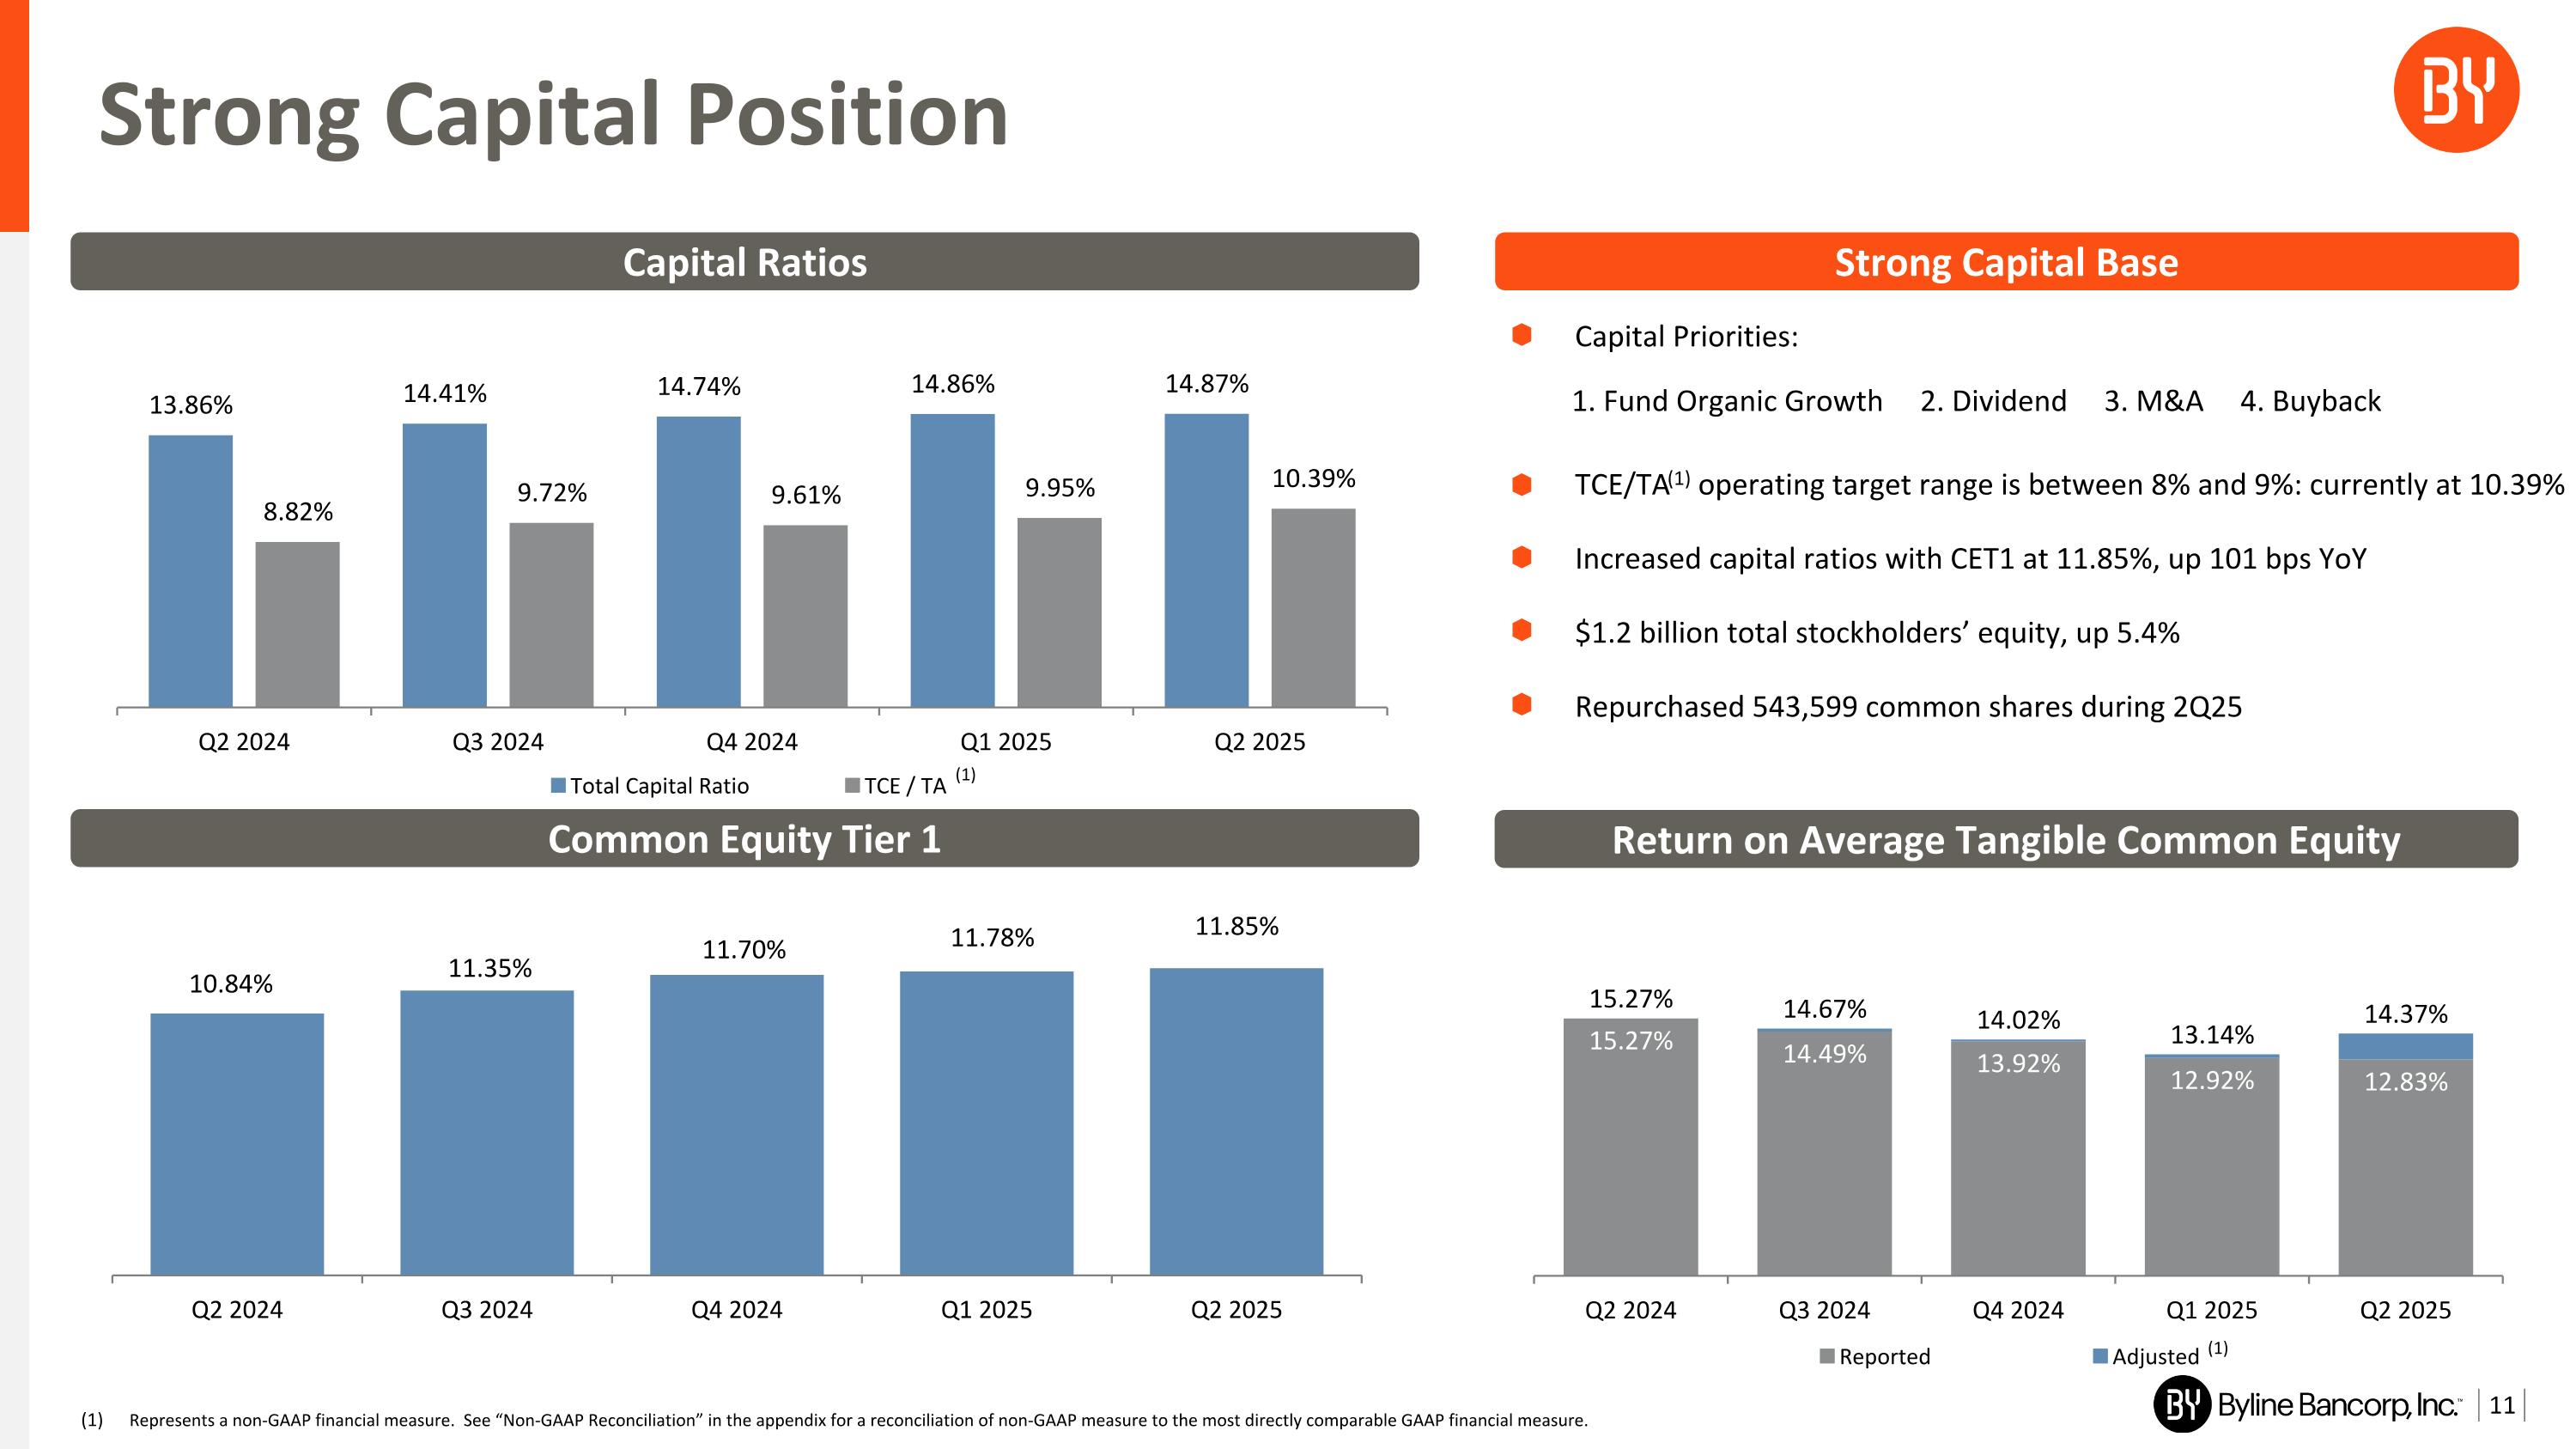
Strong Capital Position (1) Strong Capital Base Capital Ratios (1) Return on Average Tangible Common Equity Common Equity Tier 1 Capital Priorities: TCE/TA(1) operating target range is between 8% and 9%: currently at 10.39% Increased capital ratios with CET1 at 11.85%, up 101 bps YoY $1.2 billion total stockholders’ equity, up 5.4% Repurchased 543,599 common shares during 2Q25 1. Fund Organic Growth 2. Dividend 3. M&A 4. Buyback Represents a non-GAAP financial measure. See “Non-GAAP Reconciliation” in the appendix for a reconciliation of non-GAAP measure to the most directly comparable GAAP financial measure.
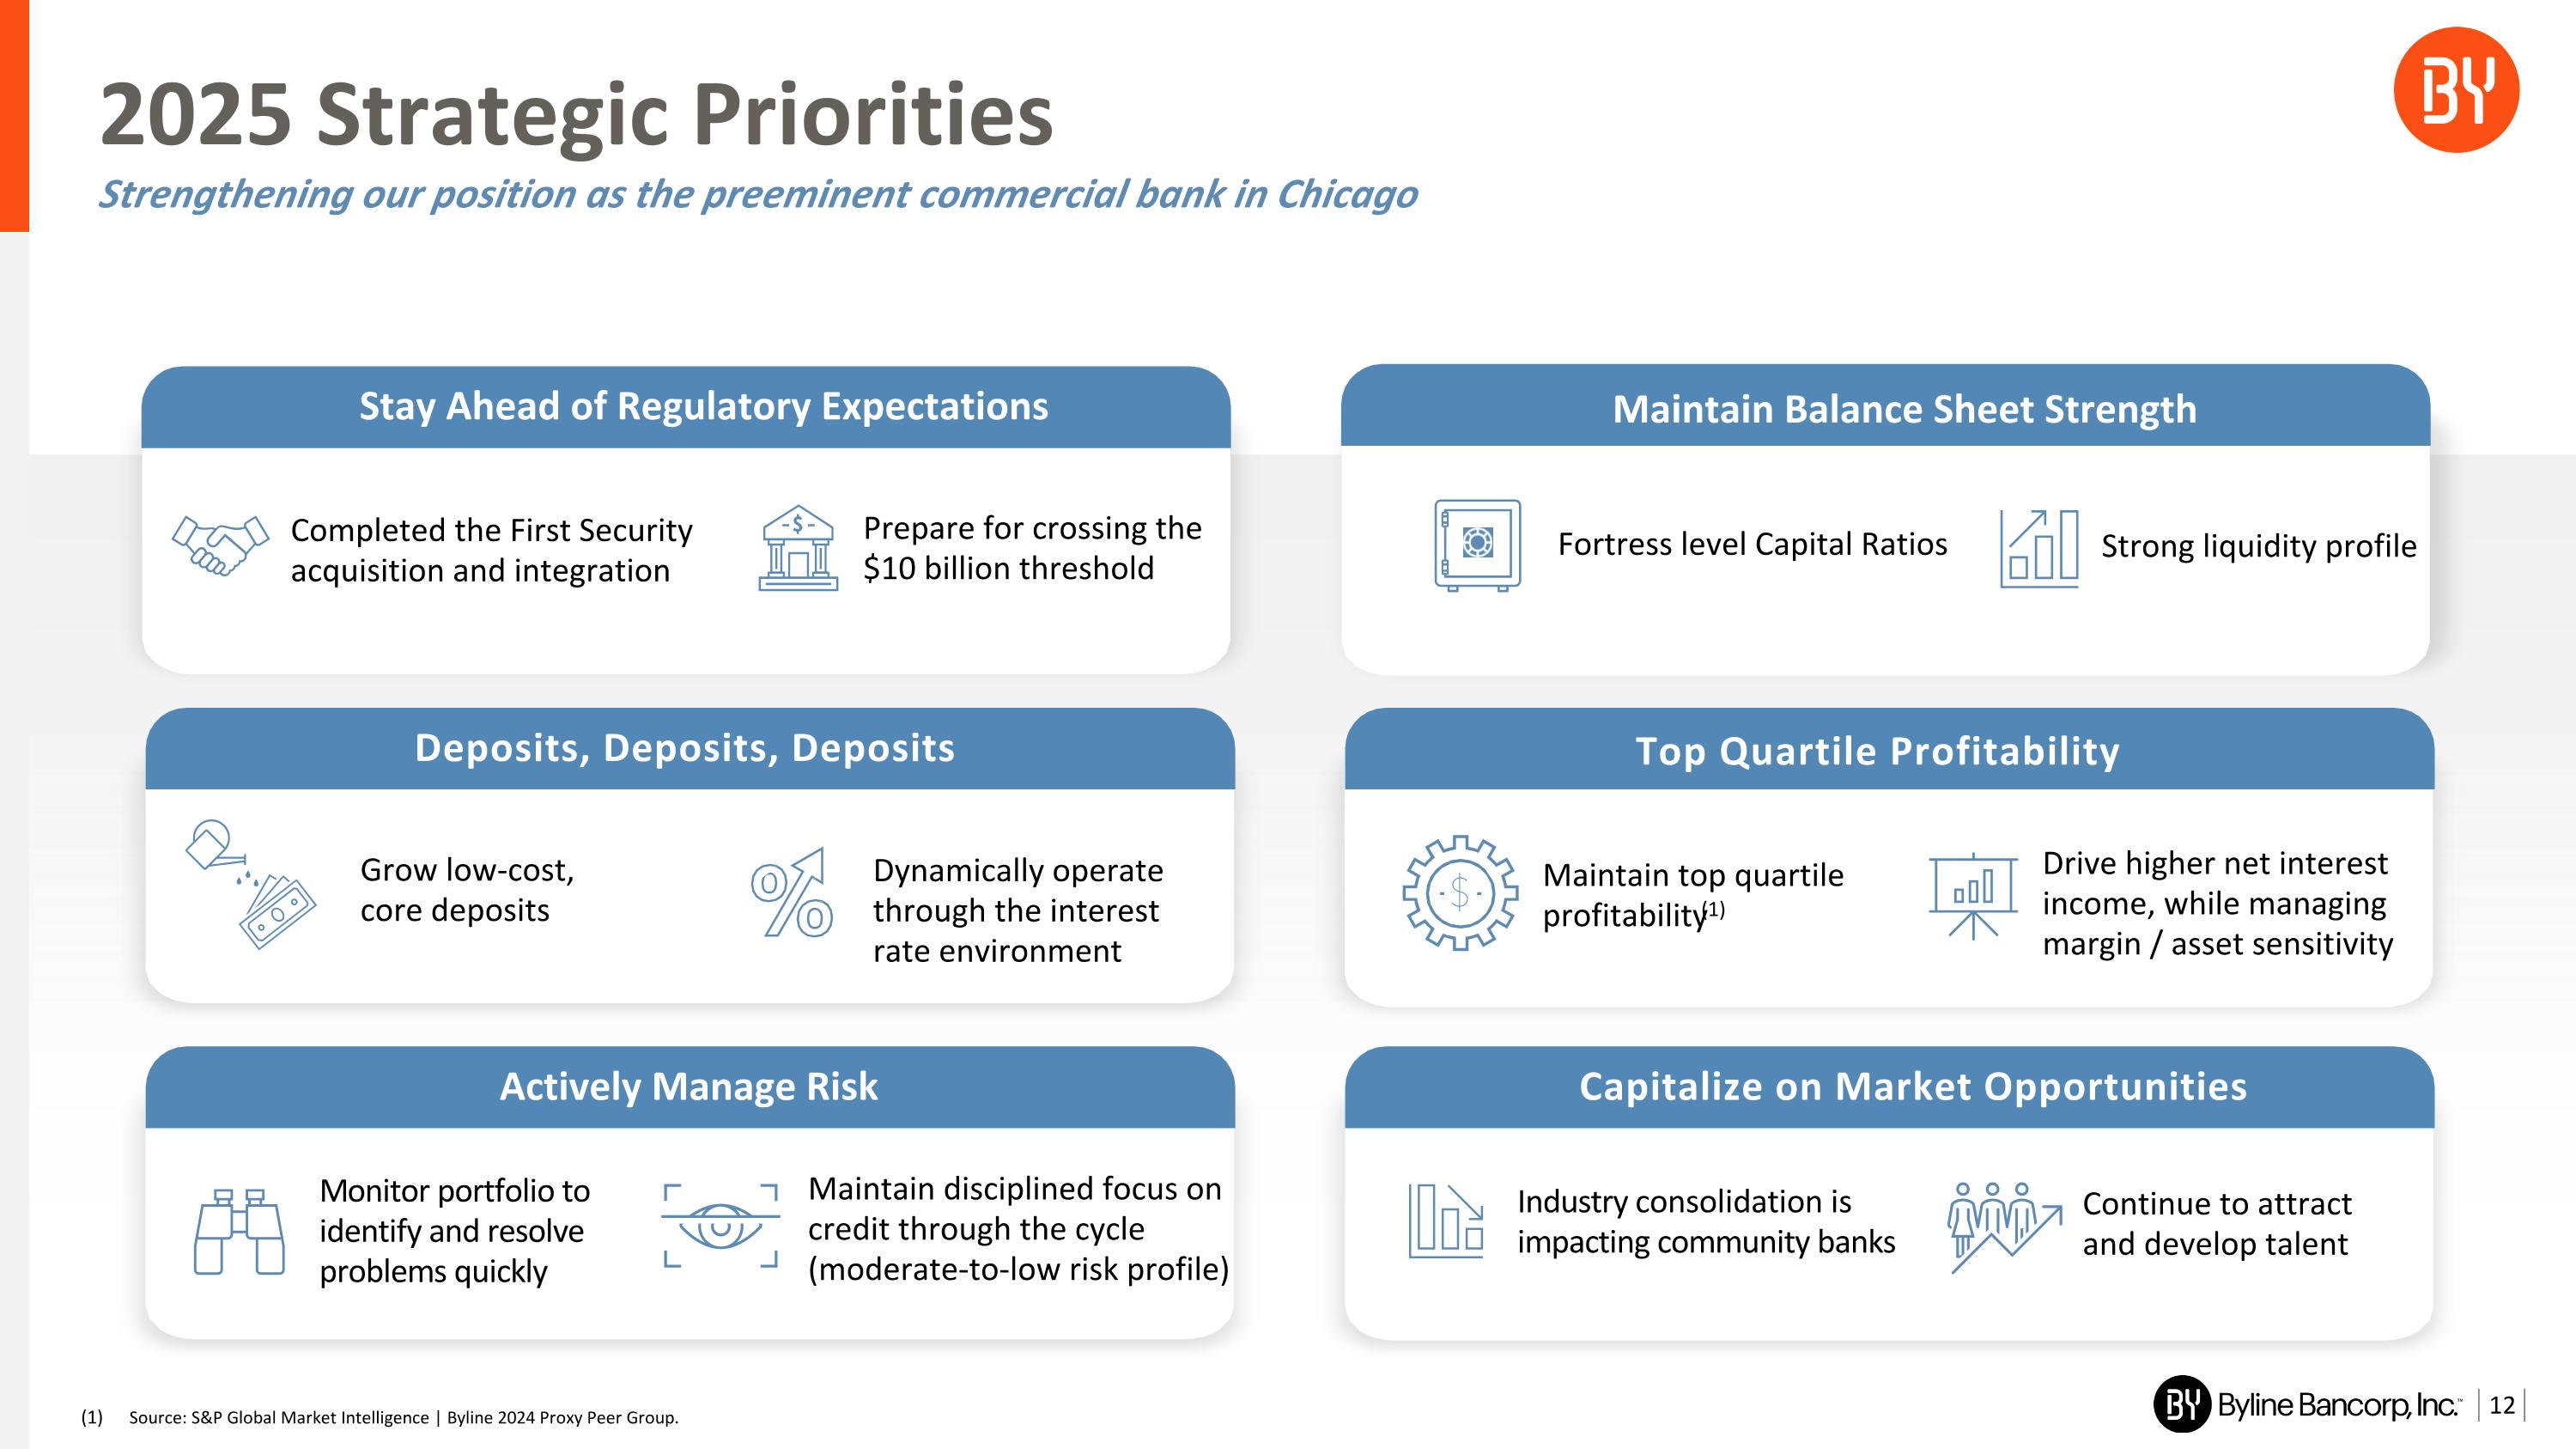
2025 Strategic Priorities Strengthening our position as the preeminent commercial bank in Chicago Stay Ahead of Regulatory Expectations Maintain Balance Sheet Strength Strong liquidity profile $ Top Quartile Profitability Deposits, Deposits, Deposits Grow low-cost, core deposits Actively Manage Risk Capitalize on Market Opportunities Industry consolidation is impacting community banks Continue to attract and develop talent Monitor portfolio to identify and resolve problems quickly Maintain disciplined focus on credit through the cycle (moderate-to-low risk profile) Dynamically operate through the interest rate environment Completed the First Security acquisition and integration Prepare for crossing the $10 billion threshold Drive higher net interest income, while managing margin / asset sensitivity Source: S&P Global Market Intelligence | Byline 2024 Proxy Peer Group. Maintain top quartile profitability(1) Fortress level Capital Ratios
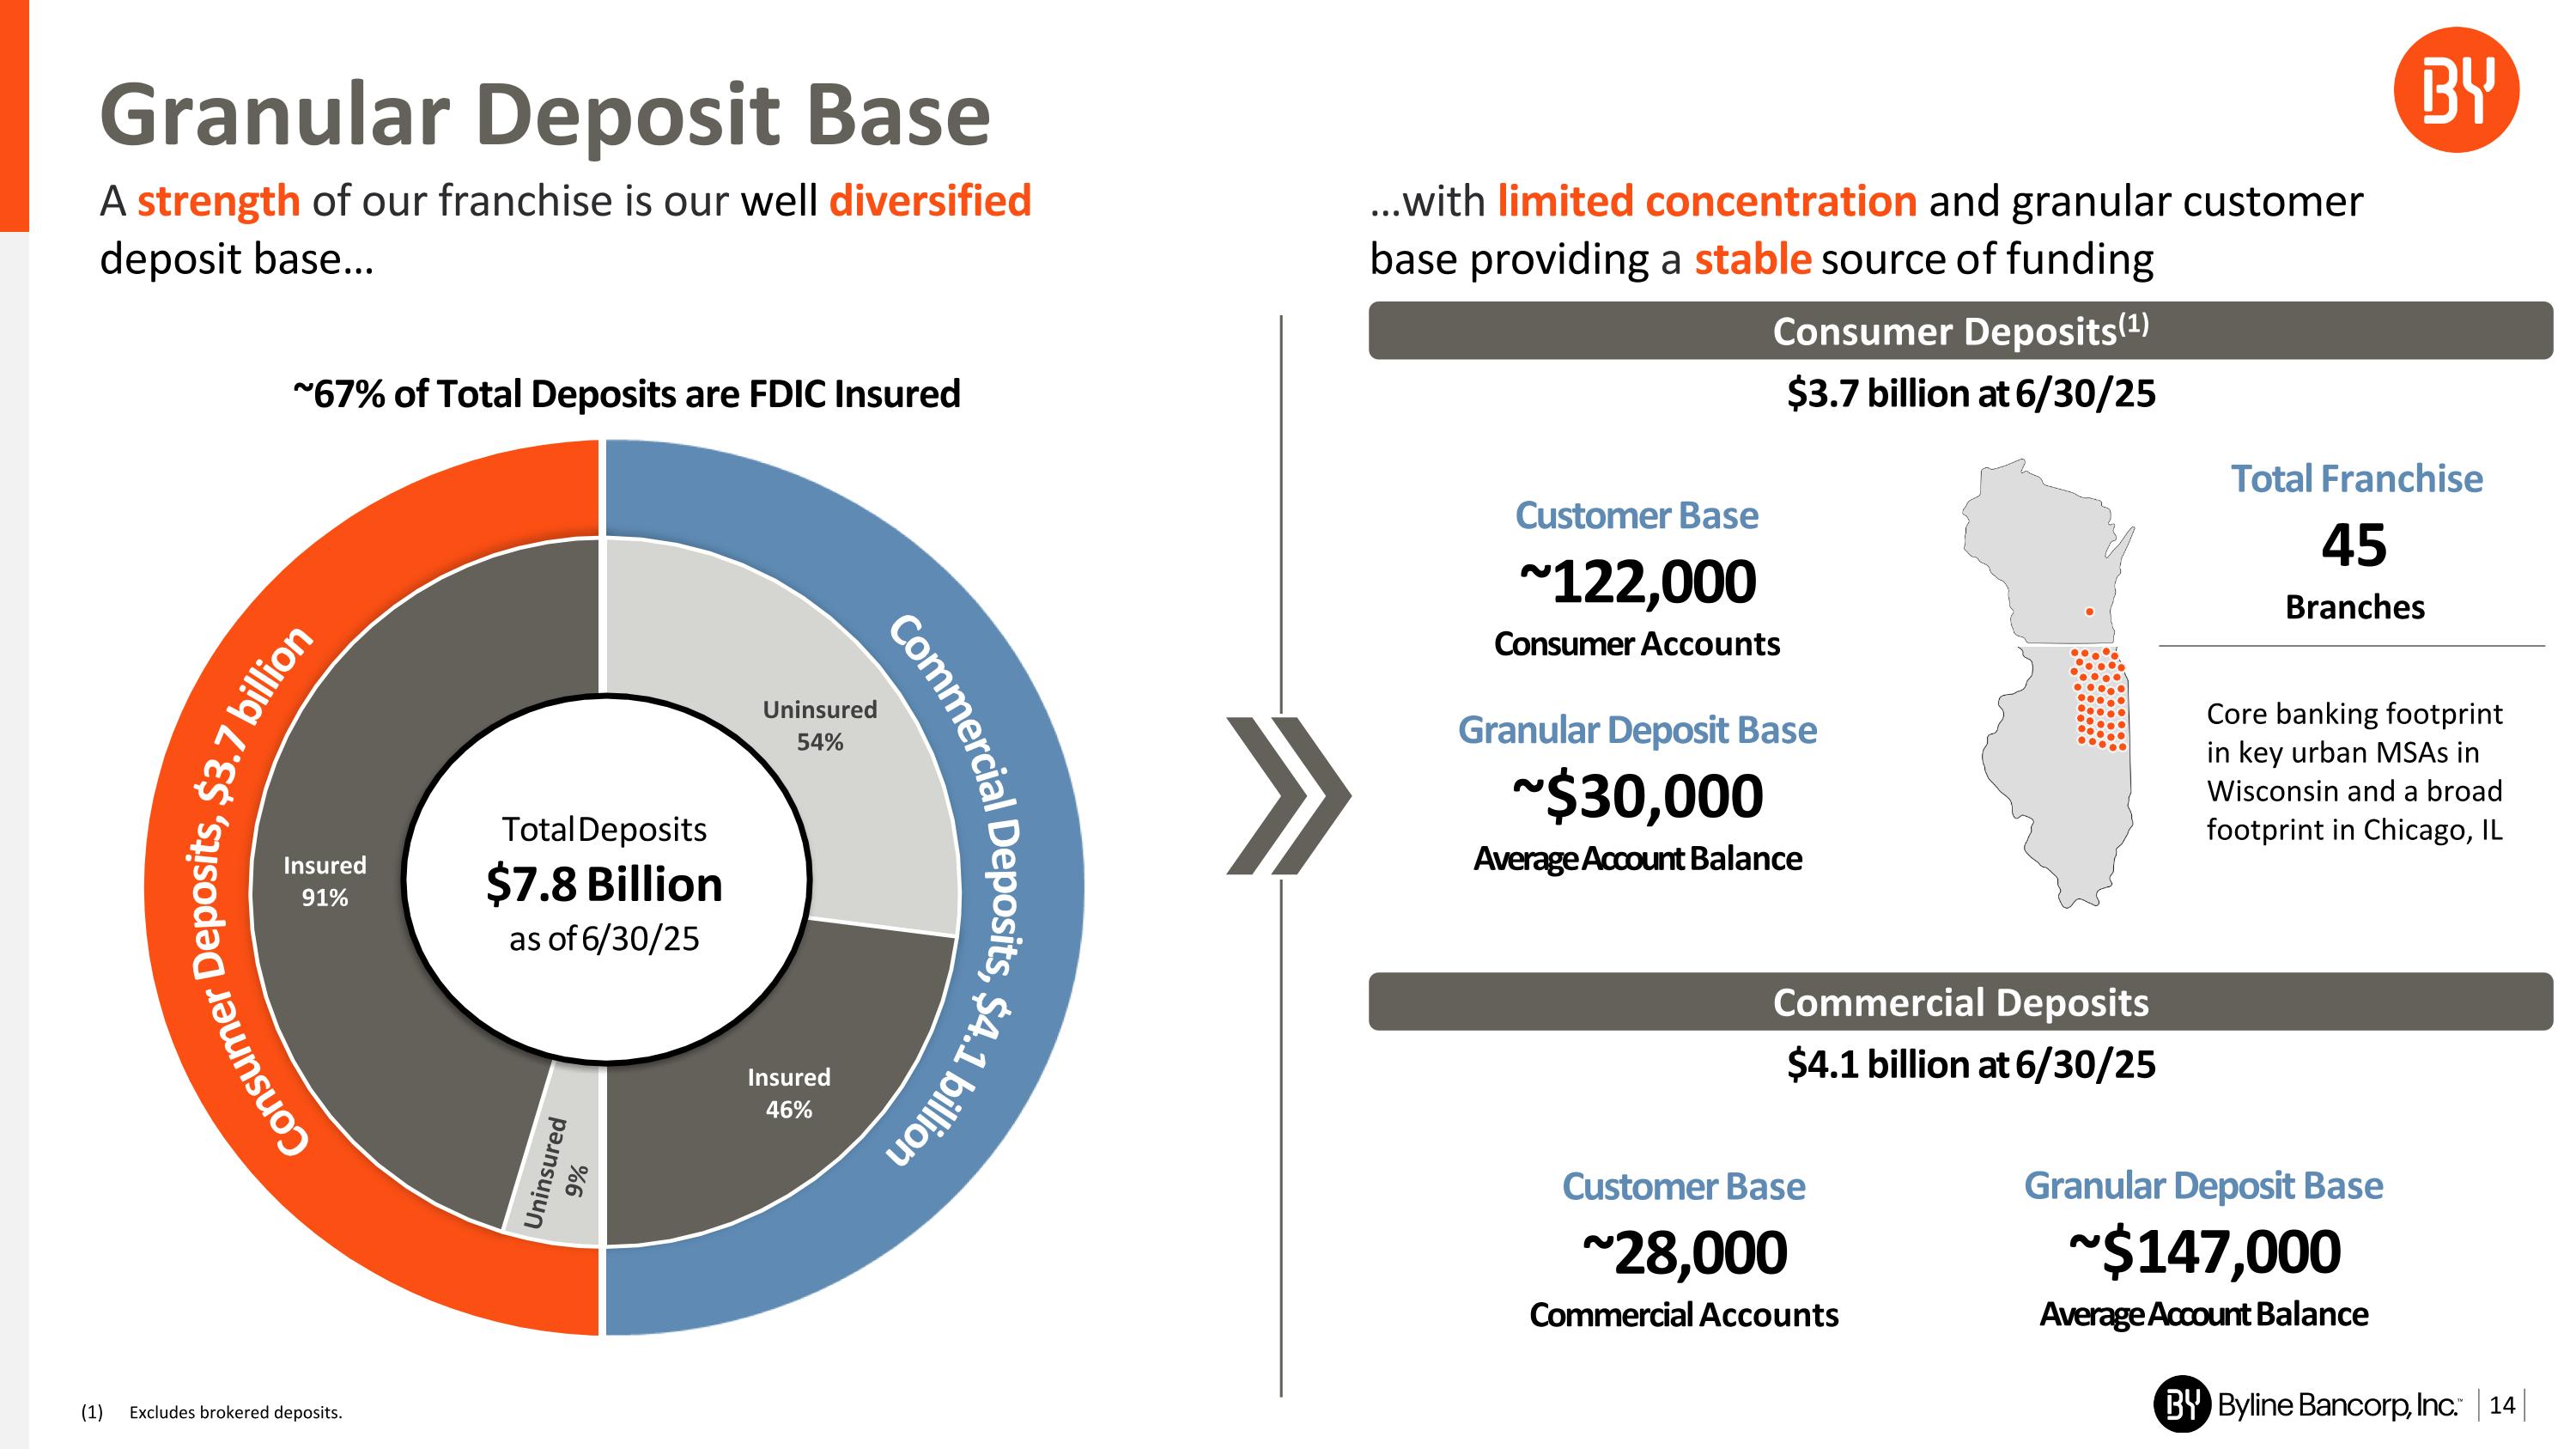
Granular Deposit Base Consumer Deposits, $3.1 billion Commercial Deposits, $2.8 billion ~67% of Total Deposits are FDIC Insured …with limited concentration and granular customer base providing a stable source of funding Consumer Deposits(1) $3.7 billion at 6/30/25 Granular Deposit Base ~$30,000 Average Account Balance Customer Base ~122,000 Consumer Accounts Total Franchise 45 Branches Commercial Deposits $4.1 billion at 6/30/25 Granular Deposit Base ~$147,000 Average Account Balance Customer Base ~28,000 Commercial Accounts Consumer Deposits, $3.7 billion Commercial Deposits, $4.1 billion Uninsured 9% d Total Deposits $7.8 Billion as of 6/30/25 Core banking footprint in key urban MSAs in Wisconsin and a broad footprint in Chicago, IL A strength of our franchise is our well diversified deposit base… Excludes brokered deposits.
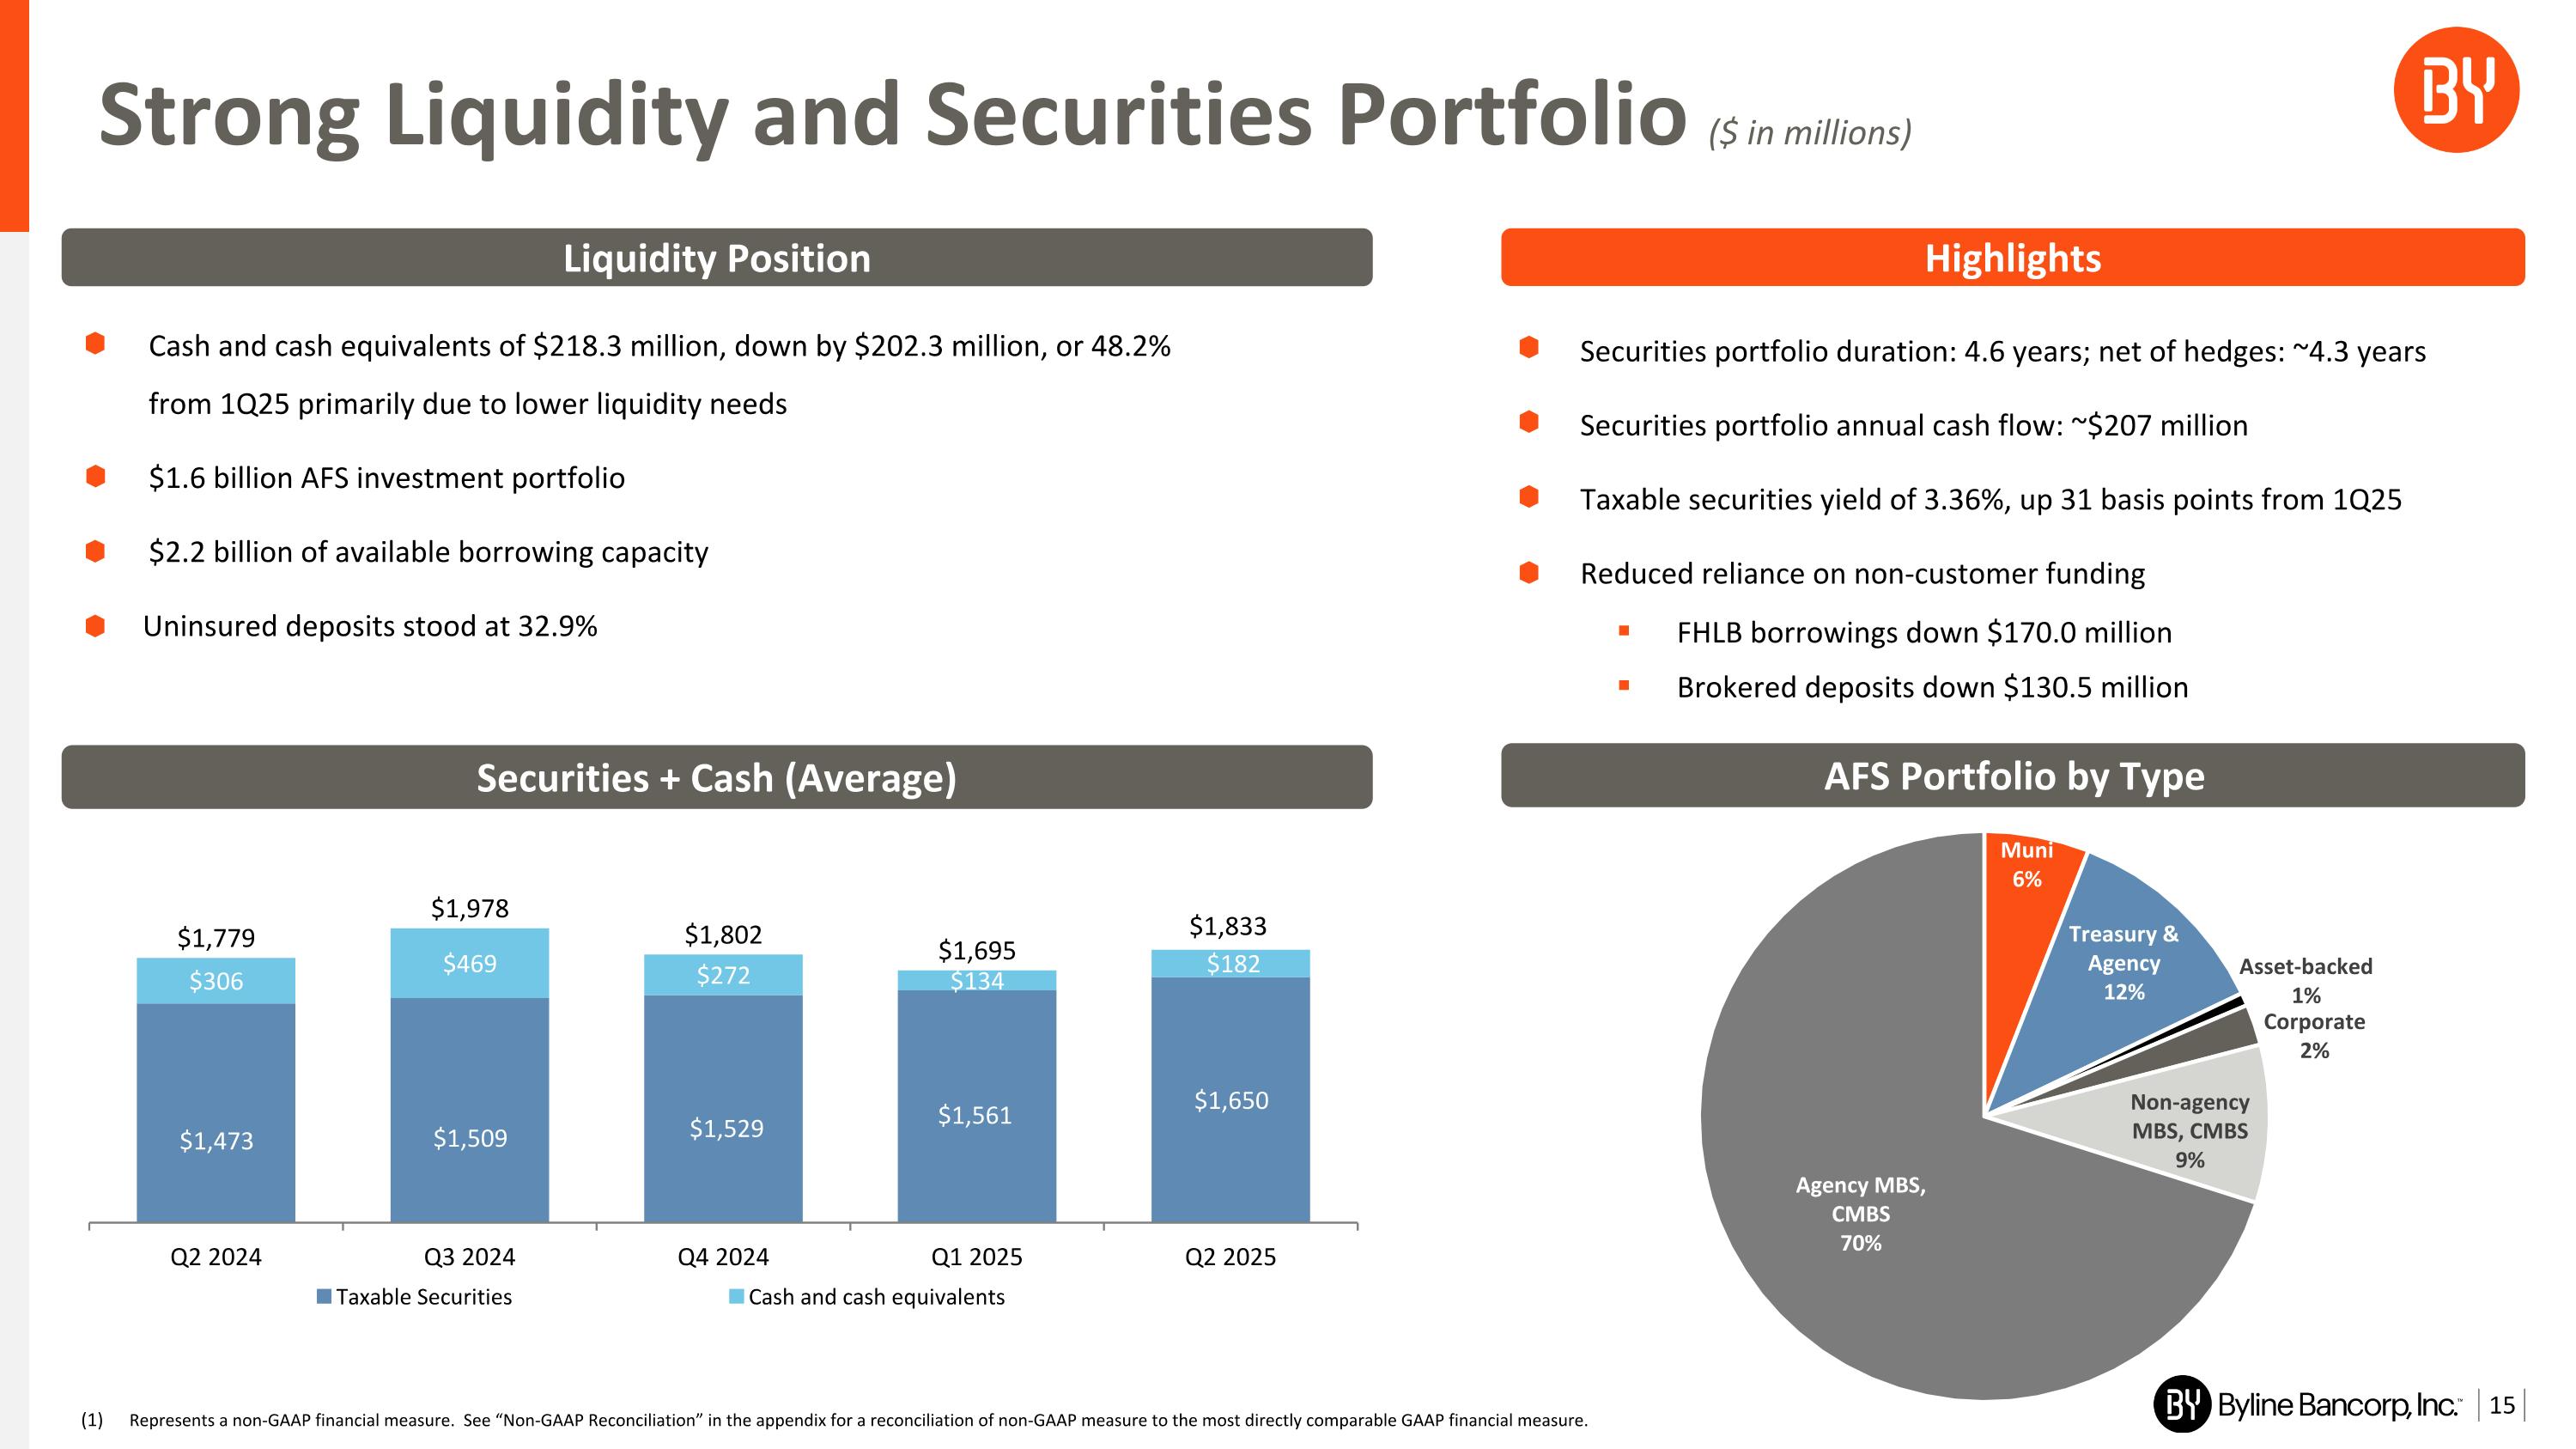
Represents a non-GAAP financial measure. See “Non-GAAP Reconciliation” in the appendix for a reconciliation of non-GAAP measure to the most directly comparable GAAP financial measure. Strong Liquidity and Securities Portfolio ($ in millions) Liquidity Position Cash and cash equivalents of $218.3 million, down by $202.3 million, or 48.2% from 1Q25 primarily due to lower liquidity needs $1.6 billion AFS investment portfolio $2.2 billion of available borrowing capacity Uninsured deposits stood at 32.9% Securities portfolio duration: 4.6 years; net of hedges: ~4.3 years Securities portfolio annual cash flow: ~$207 million Taxable securities yield of 3.36%, up 31 basis points from 1Q25 Reduced reliance on non-customer funding FHLB borrowings down $170.0 million Brokered deposits down $130.5 million Highlights AFS Portfolio by Type Securities + Cash (Average)
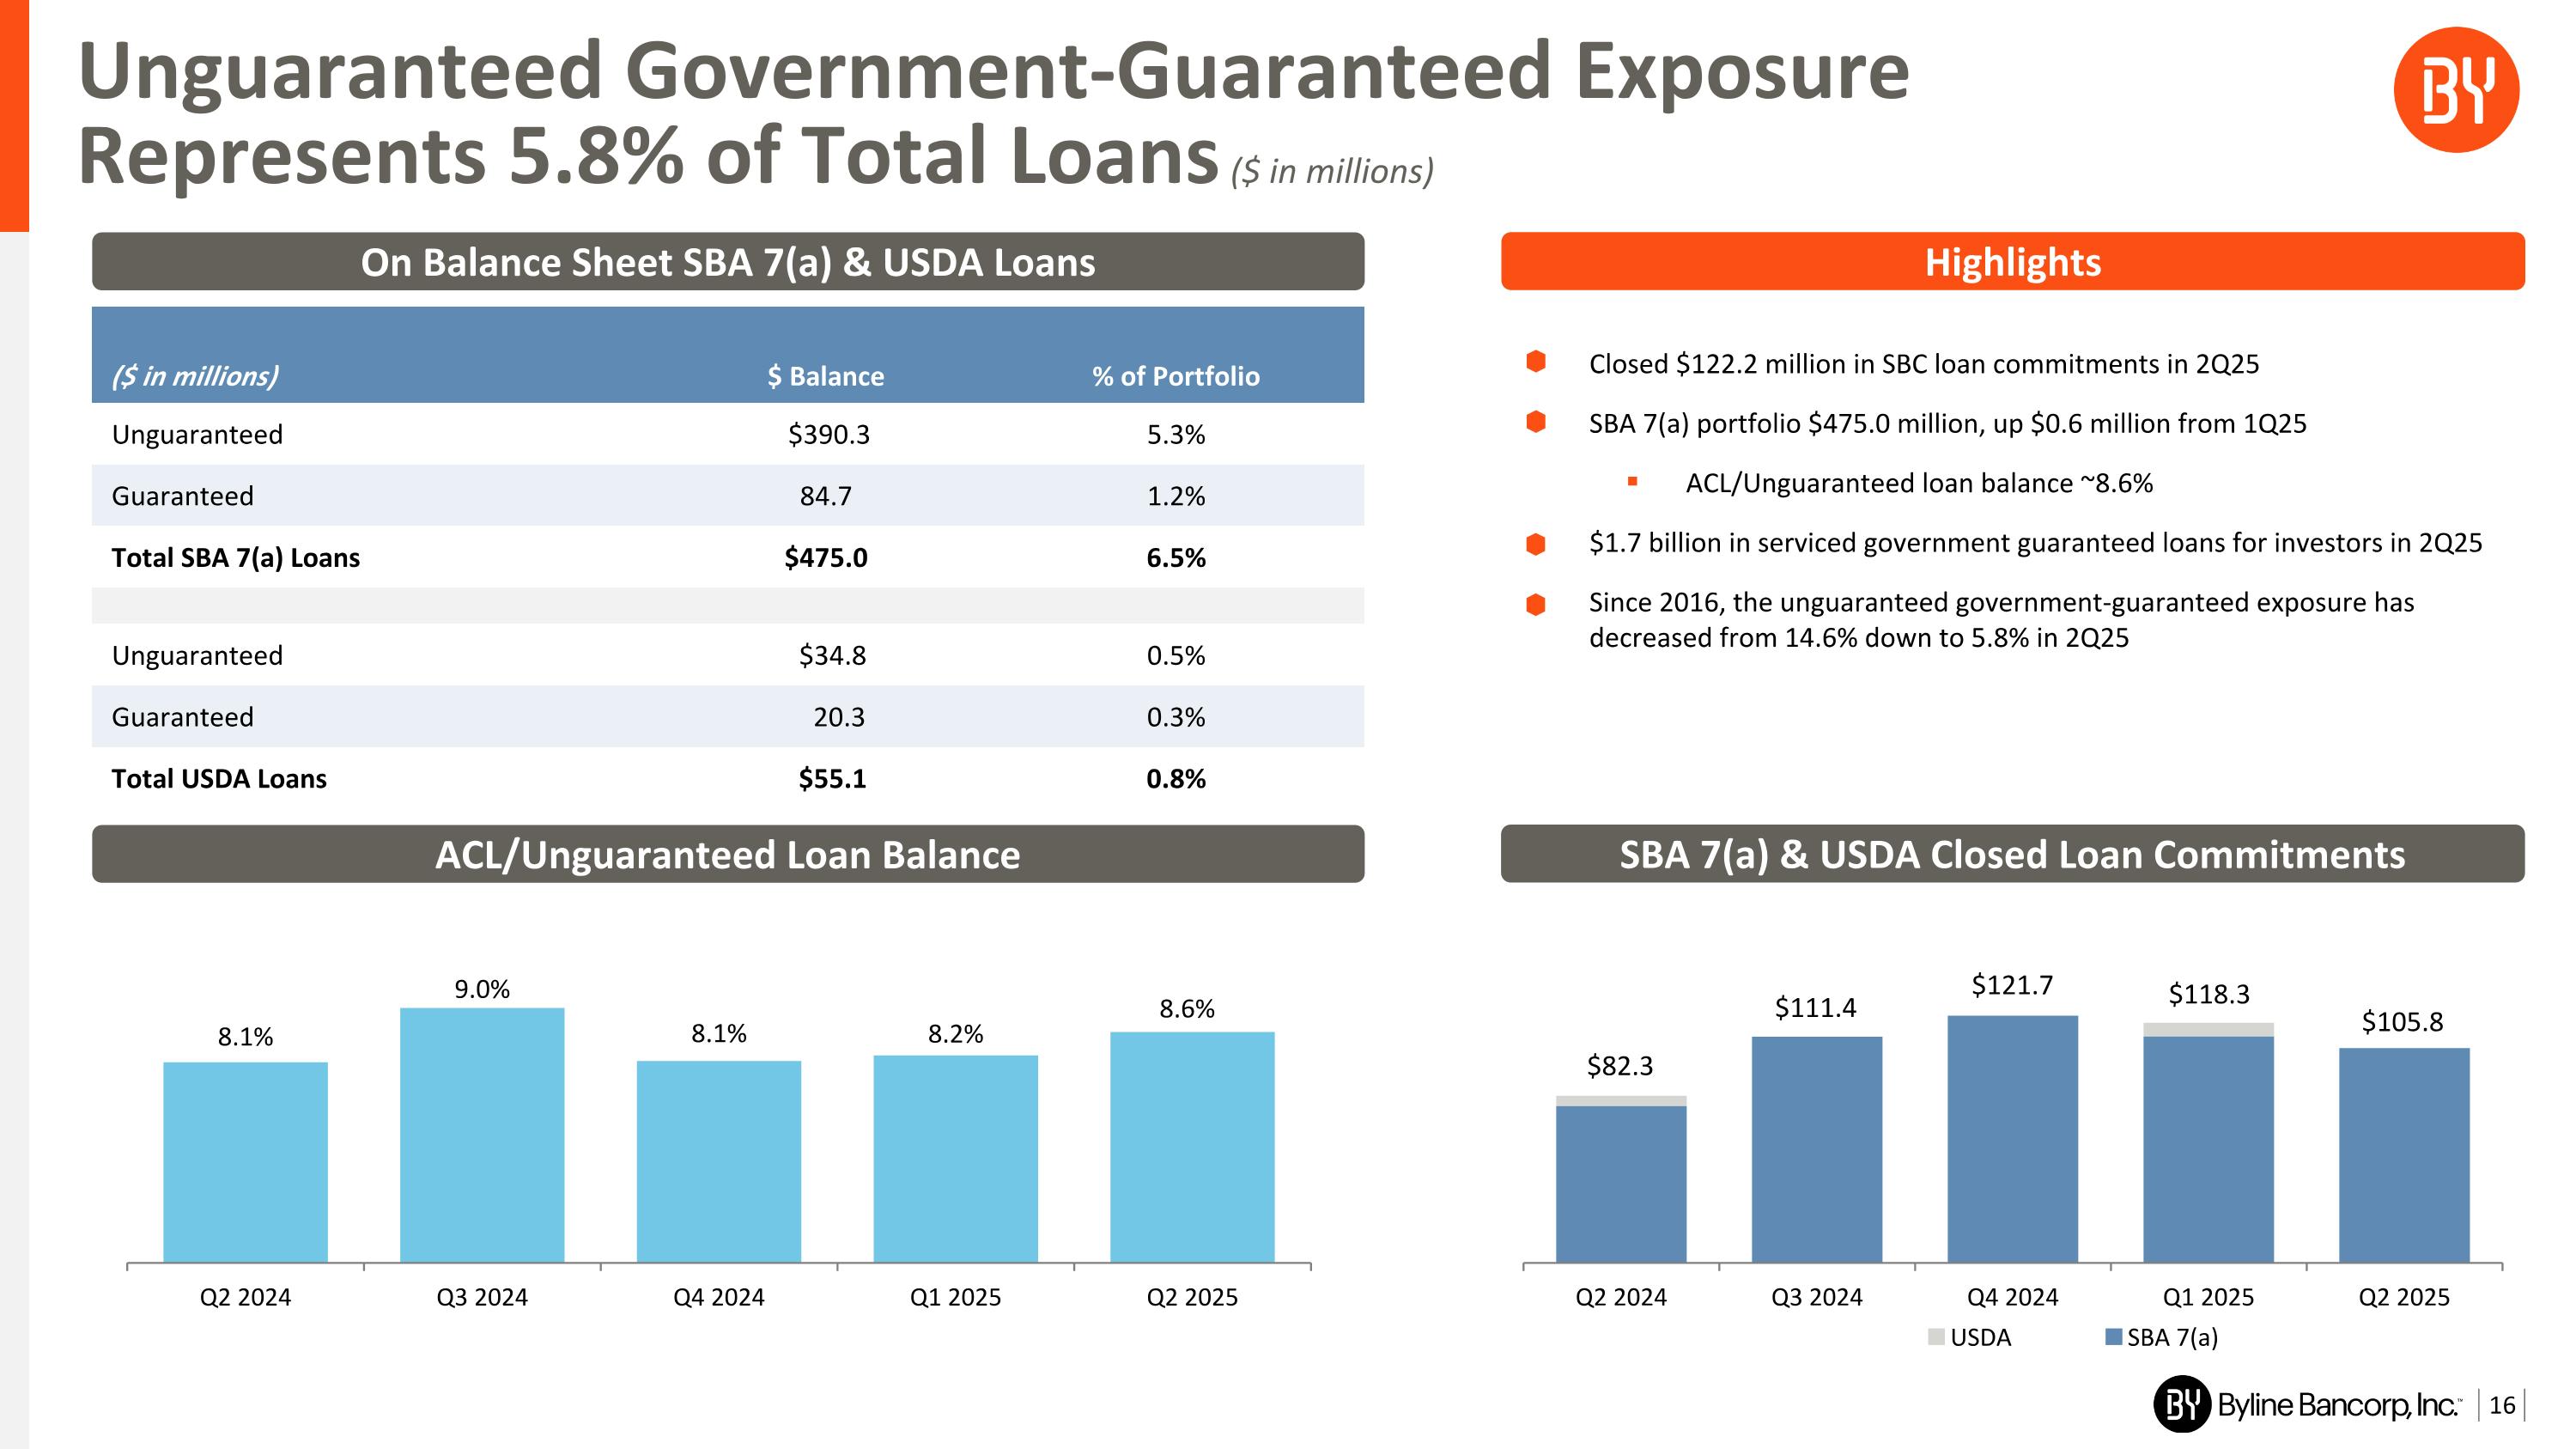
Unguaranteed Government-Guaranteed Exposure Represents 5.8% of Total Loans ($ in millions) ($ in millions) $ Balance % of Portfolio Unguaranteed $390.3 5.3% Guaranteed 84.7 1.2% Total SBA 7(a) Loans $475.0 6.5% Unguaranteed $34.8 0.5% Guaranteed 20.3 0.3% Total USDA Loans $55.1 0.8% ACL/Unguaranteed Loan Balance Closed $122.2 million in SBC loan commitments in 2Q25 SBA 7(a) portfolio $475.0 million, up $0.6 million from 1Q25 ACL/Unguaranteed loan balance ~8.6% $1.7 billion in serviced government guaranteed loans for investors in 2Q25 Since 2016, the unguaranteed government-guaranteed exposure has decreased from 14.6% down to 5.8% in 2Q25 On Balance Sheet SBA 7(a) & USDA Loans SBA 7(a) & USDA Closed Loan Commitments Highlights $82.3 $111.4 $121.7 $118.3 $105.8
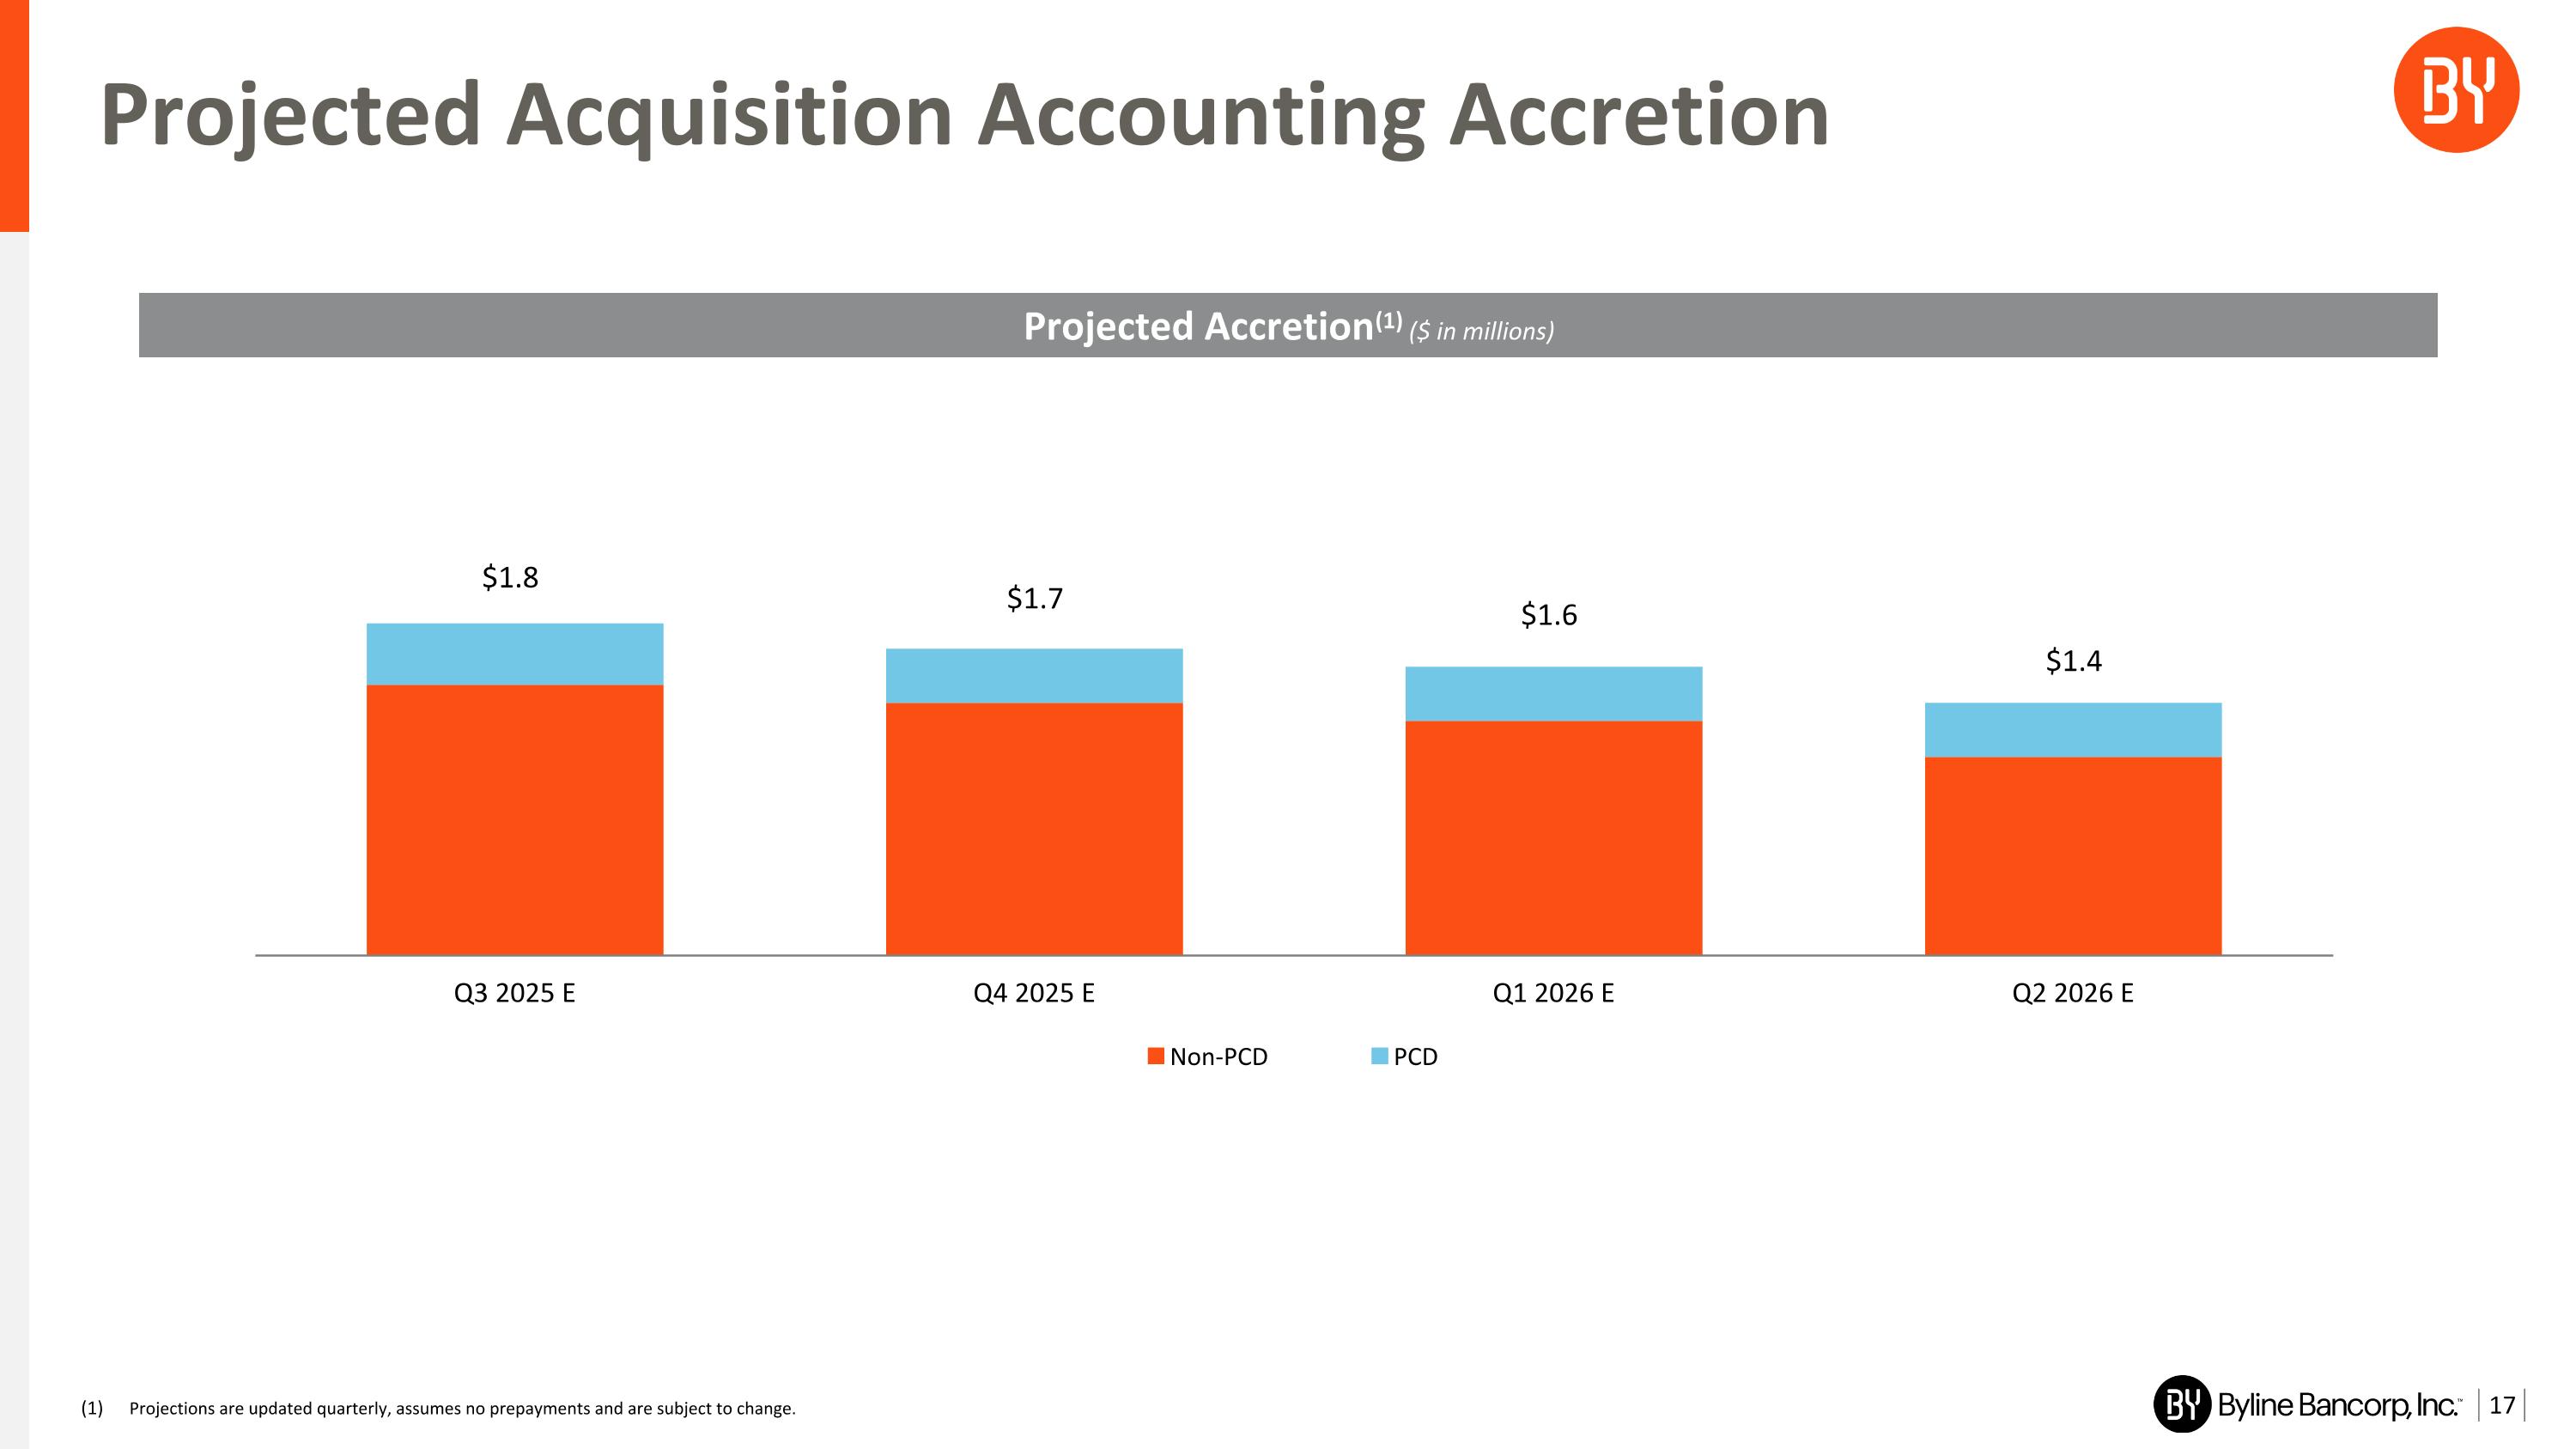
Projected Acquisition Accounting Accretion Projected Accretion(1) ($ in millions) Projections are updated quarterly, assumes no prepayments and are subject to change.
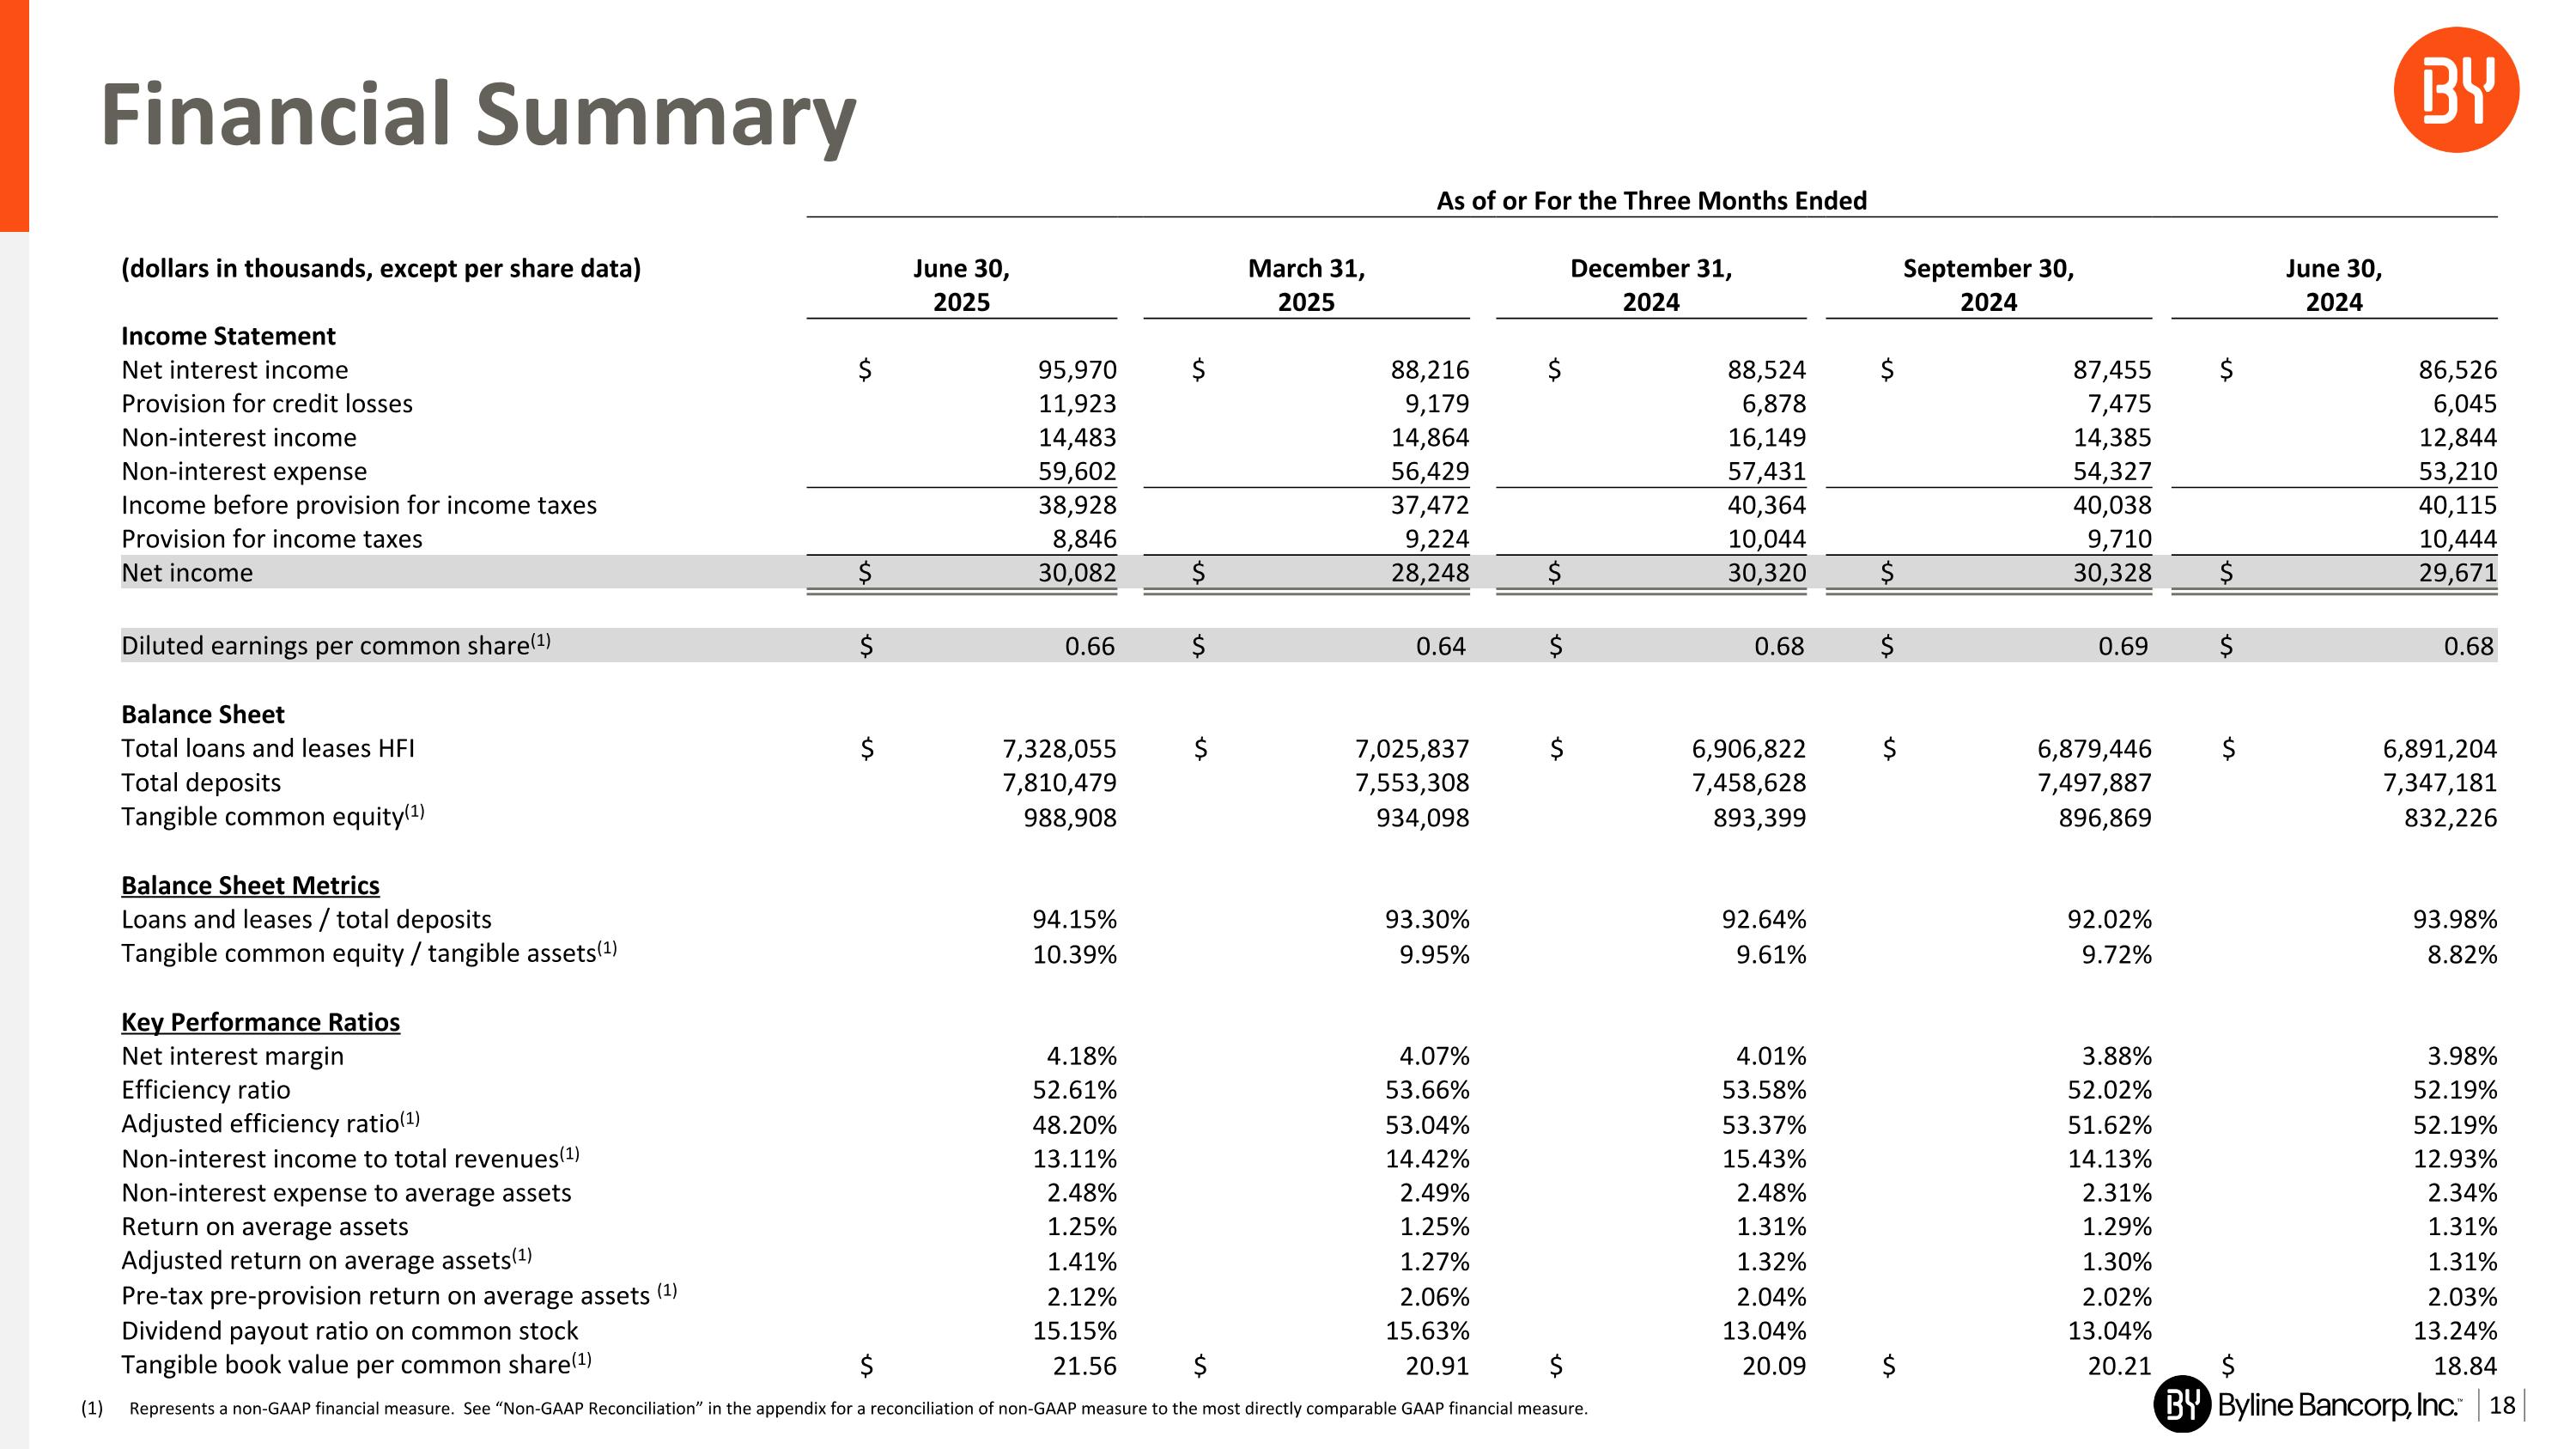
Financial Summary As of or For the Three Months Ended (dollars in thousands, except per share data) June 30, March 31, December 31, September 30, June 30, 2025 2025 2024 2024 2024 Income Statement Net interest income $ 95,970 $ 88,216 $ 88,524 $ 87,455 $ 86,526 Provision for credit losses 11,923 9,179 6,878 7,475 6,045 Non-interest income 14,483 14,864 16,149 14,385 12,844 Non-interest expense 59,602 56,429 57,431 54,327 53,210 Income before provision for income taxes 38,928 37,472 40,364 40,038 40,115 Provision for income taxes 8,846 9,224 10,044 9,710 10,444 Net income $ 30,082 $ 28,248 $ 30,320 $ 30,328 $ 29,671 Diluted earnings per common share(1) $ 0.66 $ 0.64 $ 0.68 $ 0.69 $ 0.68 Balance Sheet Total loans and leases HFI $ 7,328,055 $ 7,025,837 $ 6,906,822 $ 6,879,446 $ 6,891,204 Total deposits 7,810,479 7,553,308 7,458,628 7,497,887 7,347,181 Tangible common equity(1) 988,908 934,098 893,399 896,869 832,226 Balance Sheet Metrics Loans and leases / total deposits 94.15% 93.30% 92.64% 92.02% 93.98% Tangible common equity / tangible assets(1) 10.39% 9.95% 9.61% 9.72% 8.82% Key Performance Ratios Net interest margin 4.18% 4.07% 4.01% 3.88% 3.98% Efficiency ratio 52.61% 53.66% 53.58% 52.02% 52.19% Adjusted efficiency ratio(1) 48.20% 53.04% 53.37% 51.62% 52.19% Non-interest income to total revenues(1) 13.11% 14.42% 15.43% 14.13% 12.93% Non-interest expense to average assets 2.48% 2.49% 2.48% 2.31% 2.34% Return on average assets 1.25% 1.25% 1.31% 1.29% 1.31% Adjusted return on average assets(1) 1.41% 1.27% 1.32% 1.30% 1.31% Pre-tax pre-provision return on average assets (1) 2.12% 2.06% 2.04% 2.02% 2.03% Dividend payout ratio on common stock 15.15% 15.63% 13.04% 13.04% 13.24% Tangible book value per common share(1) $ 21.56 $ 20.91 $ 20.09 $ 20.21 $ 18.84 Represents a non-GAAP financial measure. See “Non-GAAP Reconciliation” in the appendix for a reconciliation of non-GAAP measure to the most directly comparable GAAP financial measure.
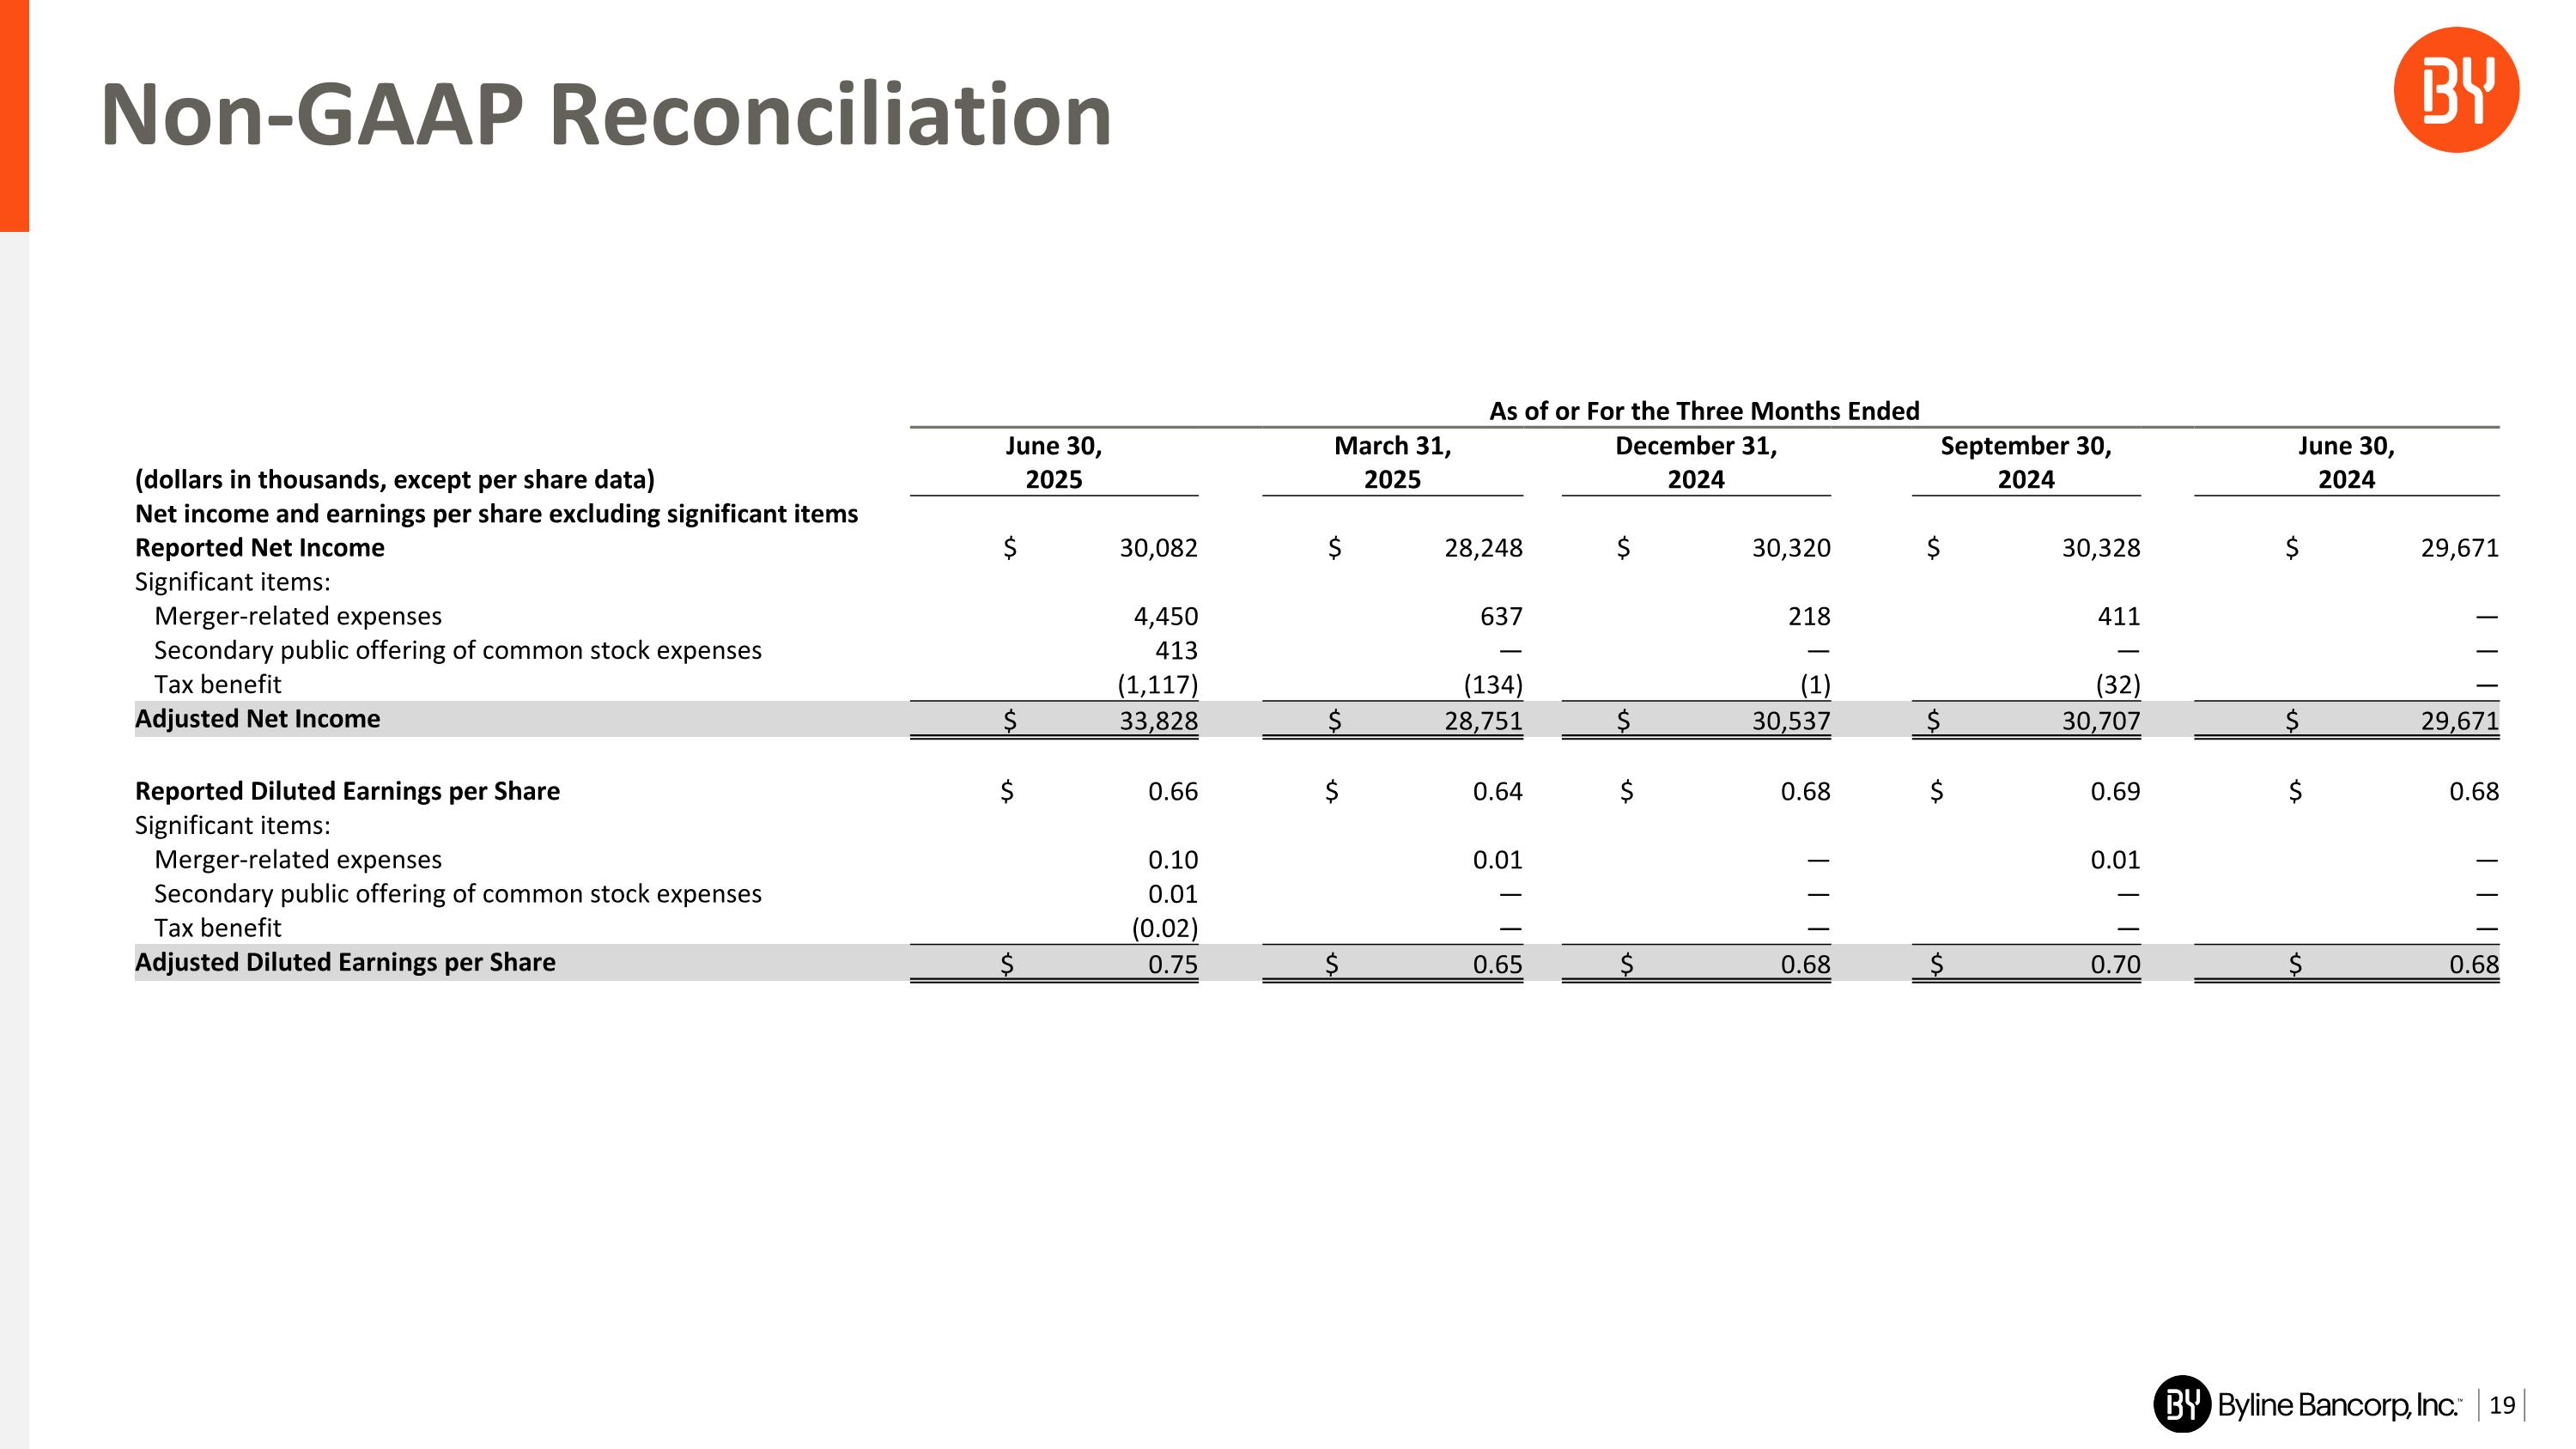
Non-GAAP Reconciliation As of or For the Three Months Ended (dollars in thousands, except per share data) June 30, 2025 March 31, 2025 December 31, 2024 September 30, 2024 June 30, 2024 Net income and earnings per share excluding significant items Reported Net Income $ 30,082 $ 28,248 $ 30,320 $ 30,328 $ 29,671 Significant items: Merger-related expenses 4,450 637 218 411 — Secondary public offering of common stock expenses 413 — — — — Tax benefit (1,117) (134) (1) (32) — Adjusted Net Income $ 33,828 $ 28,751 $ 30,537 $ 30,707 $ 29,671 Reported Diluted Earnings per Share $ 0.66 $ 0.64 $ 0.68 $ 0.69 $ 0.68 Significant items: Merger-related expenses 0.10 0.01 — 0.01 — Secondary public offering of common stock expenses 0.01 — — — — Tax benefit (0.02) — — — — Adjusted Diluted Earnings per Share $ 0.75 $ 0.65 $ 0.68 $ 0.70 $ 0.68
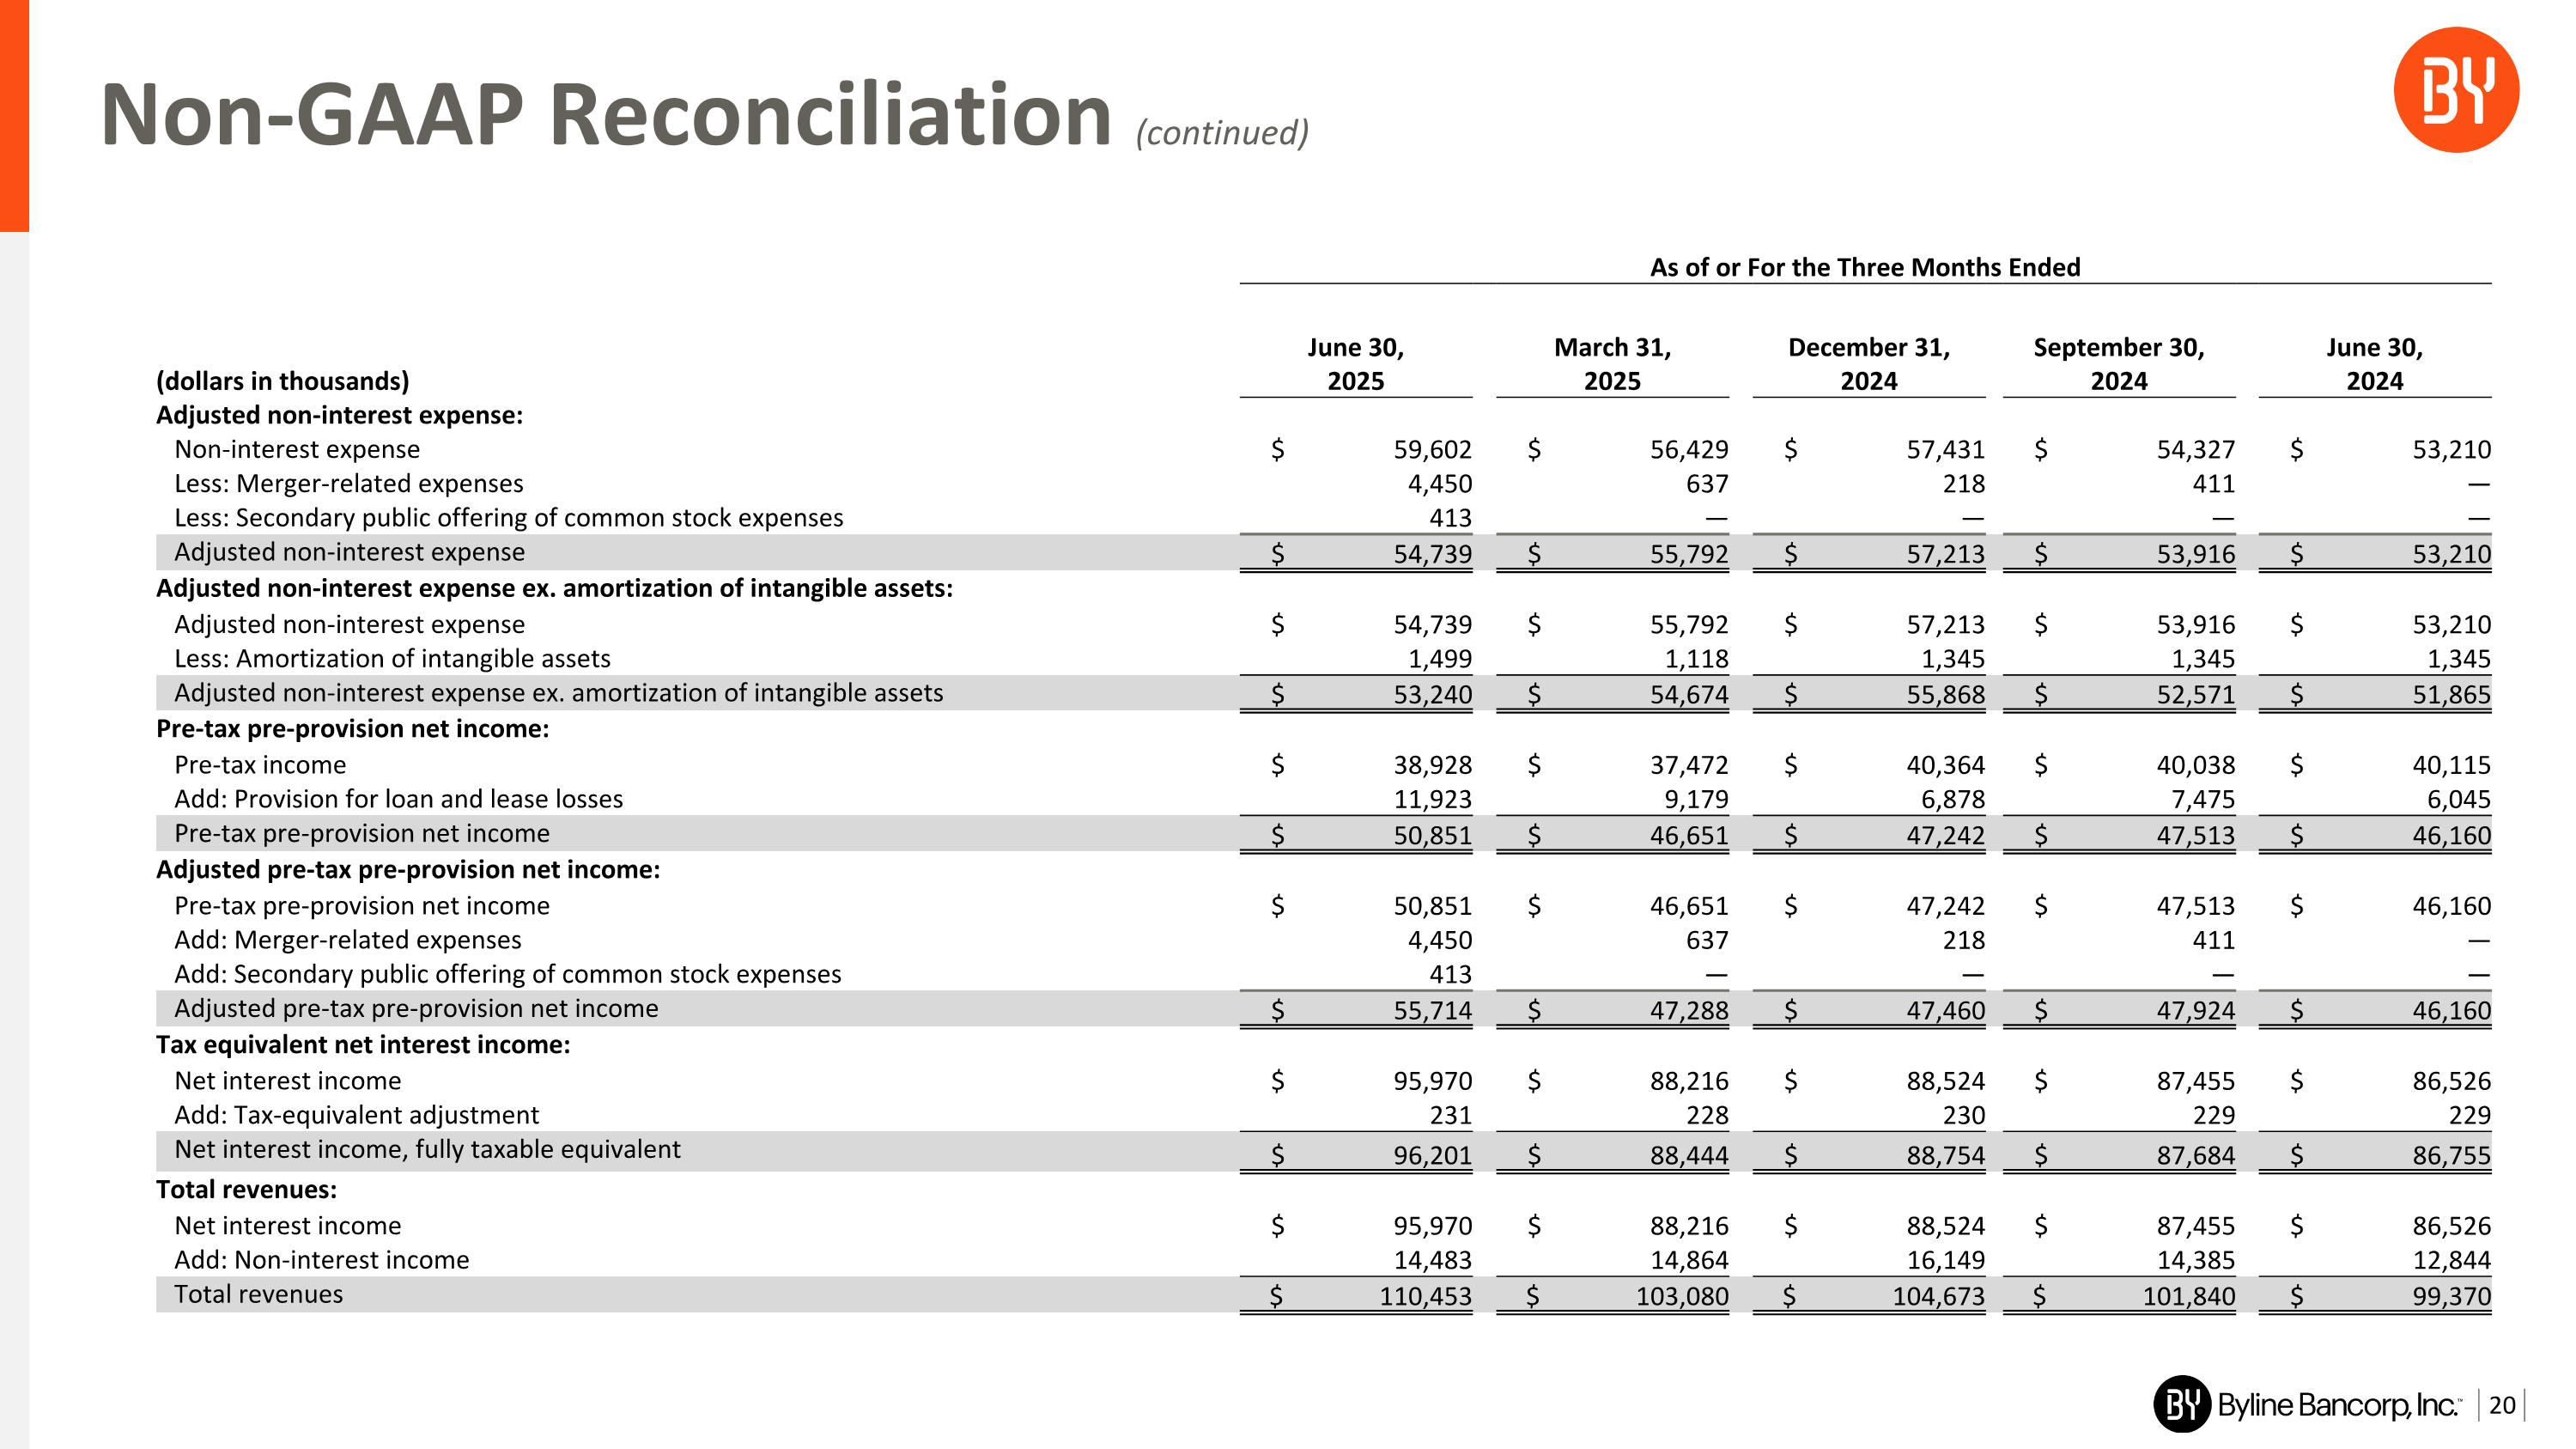
Non-GAAP Reconciliation (continued) As of or For the Three Months Ended (dollars in thousands) June 30, 2025 March 31, 2025 December 31, 2024 September 30, 2024 June 30, 2024 Adjusted non-interest expense: Non-interest expense $ 59,602 $ 56,429 $ 57,431 $ 54,327 $ 53,210 Less: Merger-related expenses 4,450 637 218 411 — Less: Secondary public offering of common stock expenses 413 — — — — Adjusted non-interest expense $ 54,739 $ 55,792 $ 57,213 $ 53,916 $ 53,210 Adjusted non-interest expense ex. amortization of intangible assets: Adjusted non-interest expense $ 54,739 $ 55,792 $ 57,213 $ 53,916 $ 53,210 Less: Amortization of intangible assets 1,499 1,118 1,345 1,345 1,345 Adjusted non-interest expense ex. amortization of intangible assets $ 53,240 $ 54,674 $ 55,868 $ 52,571 $ 51,865 Pre-tax pre-provision net income: Pre-tax income $ 38,928 $ 37,472 $ 40,364 $ 40,038 $ 40,115 Add: Provision for loan and lease losses 11,923 9,179 6,878 7,475 6,045 Pre-tax pre-provision net income $ 50,851 $ 46,651 $ 47,242 $ 47,513 $ 46,160 Adjusted pre-tax pre-provision net income: Pre-tax pre-provision net income $ 50,851 $ 46,651 $ 47,242 $ 47,513 $ 46,160 Add: Merger-related expenses 4,450 637 218 411 — Add: Secondary public offering of common stock expenses 413 — — — — Adjusted pre-tax pre-provision net income $ 55,714 $ 47,288 $ 47,460 $ 47,924 $ 46,160 Tax equivalent net interest income: Net interest income $ 95,970 $ 88,216 $ 88,524 $ 87,455 $ 86,526 Add: Tax-equivalent adjustment 231 228 230 229 229 Net interest income, fully taxable equivalent $ 96,201 $ 88,444 $ 88,754 $ 87,684 $ 86,755 Total revenues: Net interest income $ 95,970 $ 88,216 $ 88,524 $ 87,455 $ 86,526 Add: Non-interest income 14,483 14,864 16,149 14,385 12,844 Total revenues $ 110,453 $ 103,080 $ 104,673 $ 101,840 $ 99,370
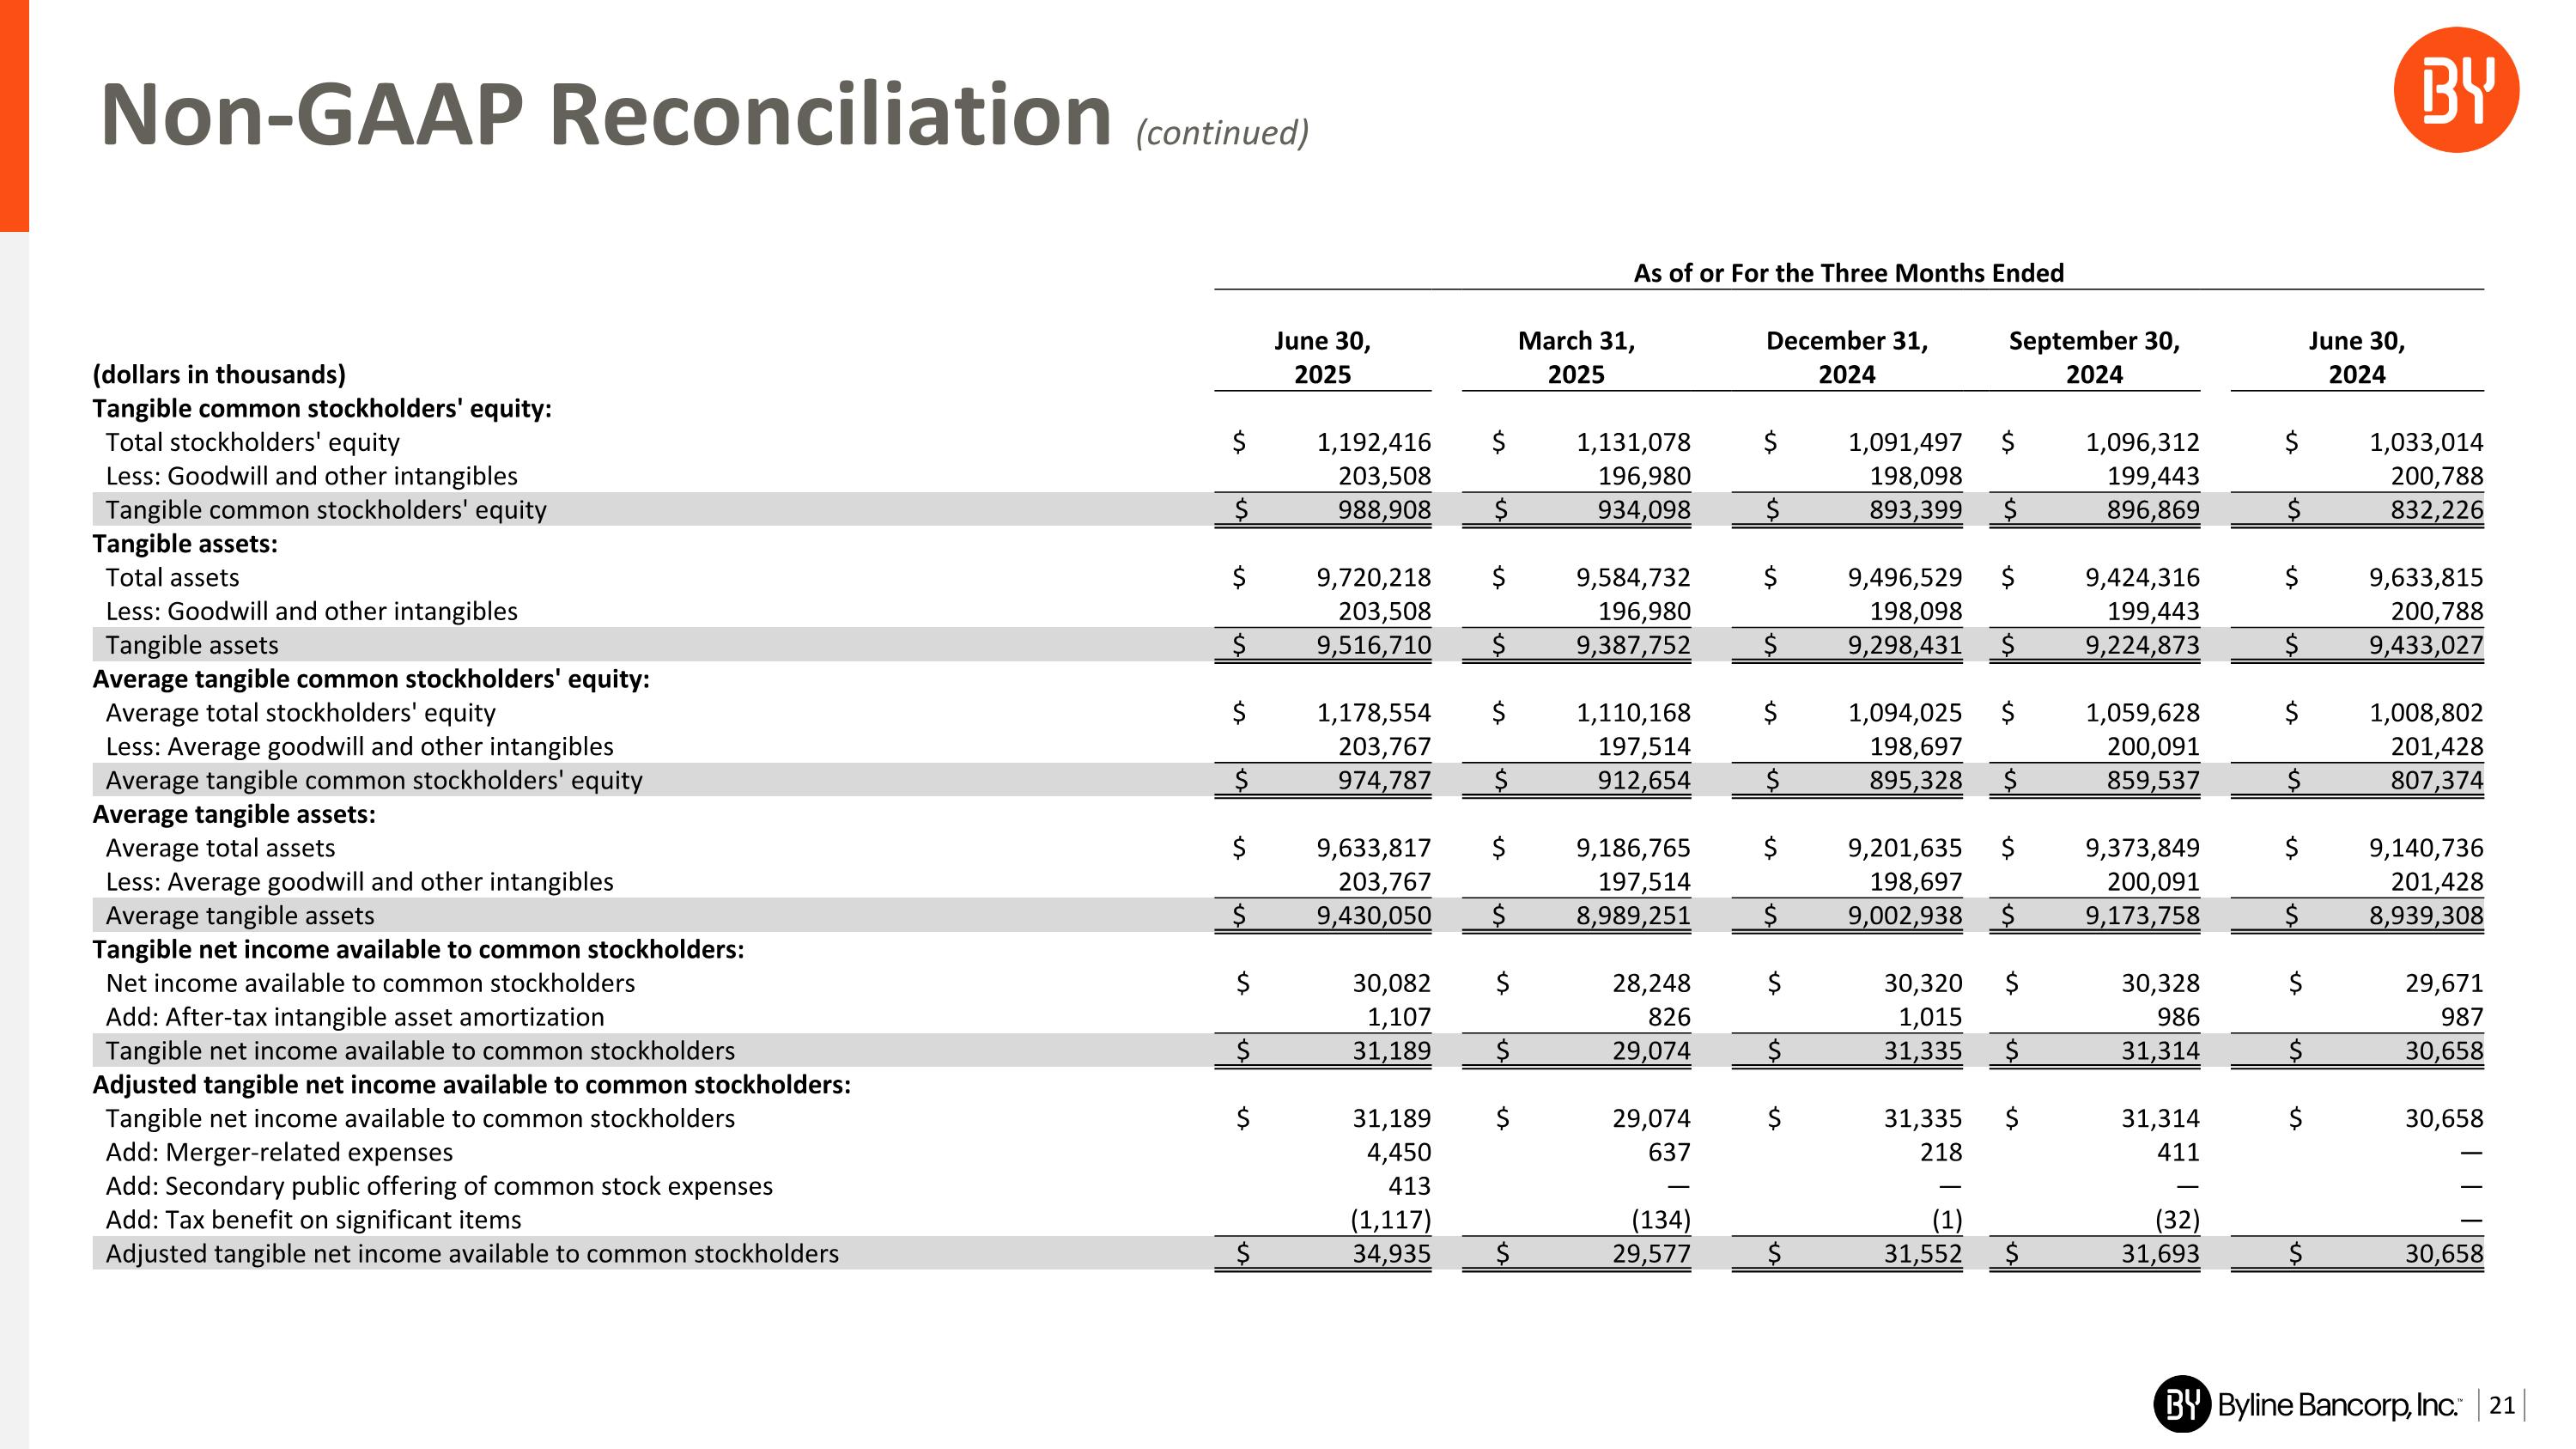
Non-GAAP Reconciliation (continued) As of or For the Three Months Ended (dollars in thousands) June 30, 2025 March 31, 2025 December 31, 2024 September 30, 2024 June 30, 2024 Tangible common stockholders' equity: Total stockholders' equity $ 1,192,416 $ 1,131,078 $ 1,091,497 $ 1,096,312 $ 1,033,014 Less: Goodwill and other intangibles 203,508 196,980 198,098 199,443 200,788 Tangible common stockholders' equity $ 988,908 $ 934,098 $ 893,399 $ 896,869 $ 832,226 Tangible assets: Total assets $ 9,720,218 $ 9,584,732 $ 9,496,529 $ 9,424,316 $ 9,633,815 Less: Goodwill and other intangibles 203,508 196,980 198,098 199,443 200,788 Tangible assets $ 9,516,710 $ 9,387,752 $ 9,298,431 $ 9,224,873 $ 9,433,027 Average tangible common stockholders' equity: Average total stockholders' equity $ 1,178,554 $ 1,110,168 $ 1,094,025 $ 1,059,628 $ 1,008,802 Less: Average goodwill and other intangibles 203,767 197,514 198,697 200,091 201,428 Average tangible common stockholders' equity $ 974,787 $ 912,654 $ 895,328 $ 859,537 $ 807,374 Average tangible assets: Average total assets $ 9,633,817 $ 9,186,765 $ 9,201,635 $ 9,373,849 $ 9,140,736 Less: Average goodwill and other intangibles 203,767 197,514 198,697 200,091 201,428 Average tangible assets $ 9,430,050 $ 8,989,251 $ 9,002,938 $ 9,173,758 $ 8,939,308 Tangible net income available to common stockholders: Net income available to common stockholders $ 30,082 $ 28,248 $ 30,320 $ 30,328 $ 29,671 Add: After-tax intangible asset amortization 1,107 826 1,015 986 987 Tangible net income available to common stockholders $ 31,189 $ 29,074 $ 31,335 $ 31,314 $ 30,658 Adjusted tangible net income available to common stockholders: Tangible net income available to common stockholders $ 31,189 $ 29,074 $ 31,335 $ 31,314 $ 30,658 Add: Merger-related expenses 4,450 637 218 411 — Add: Secondary public offering of common stock expenses 413 — — — — Add: Tax benefit on significant items (1,117) (134) (1) (32) — Adjusted tangible net income available to common stockholders $ 34,935 $ 29,577 $ 31,552 $ 31,693 $ 30,658
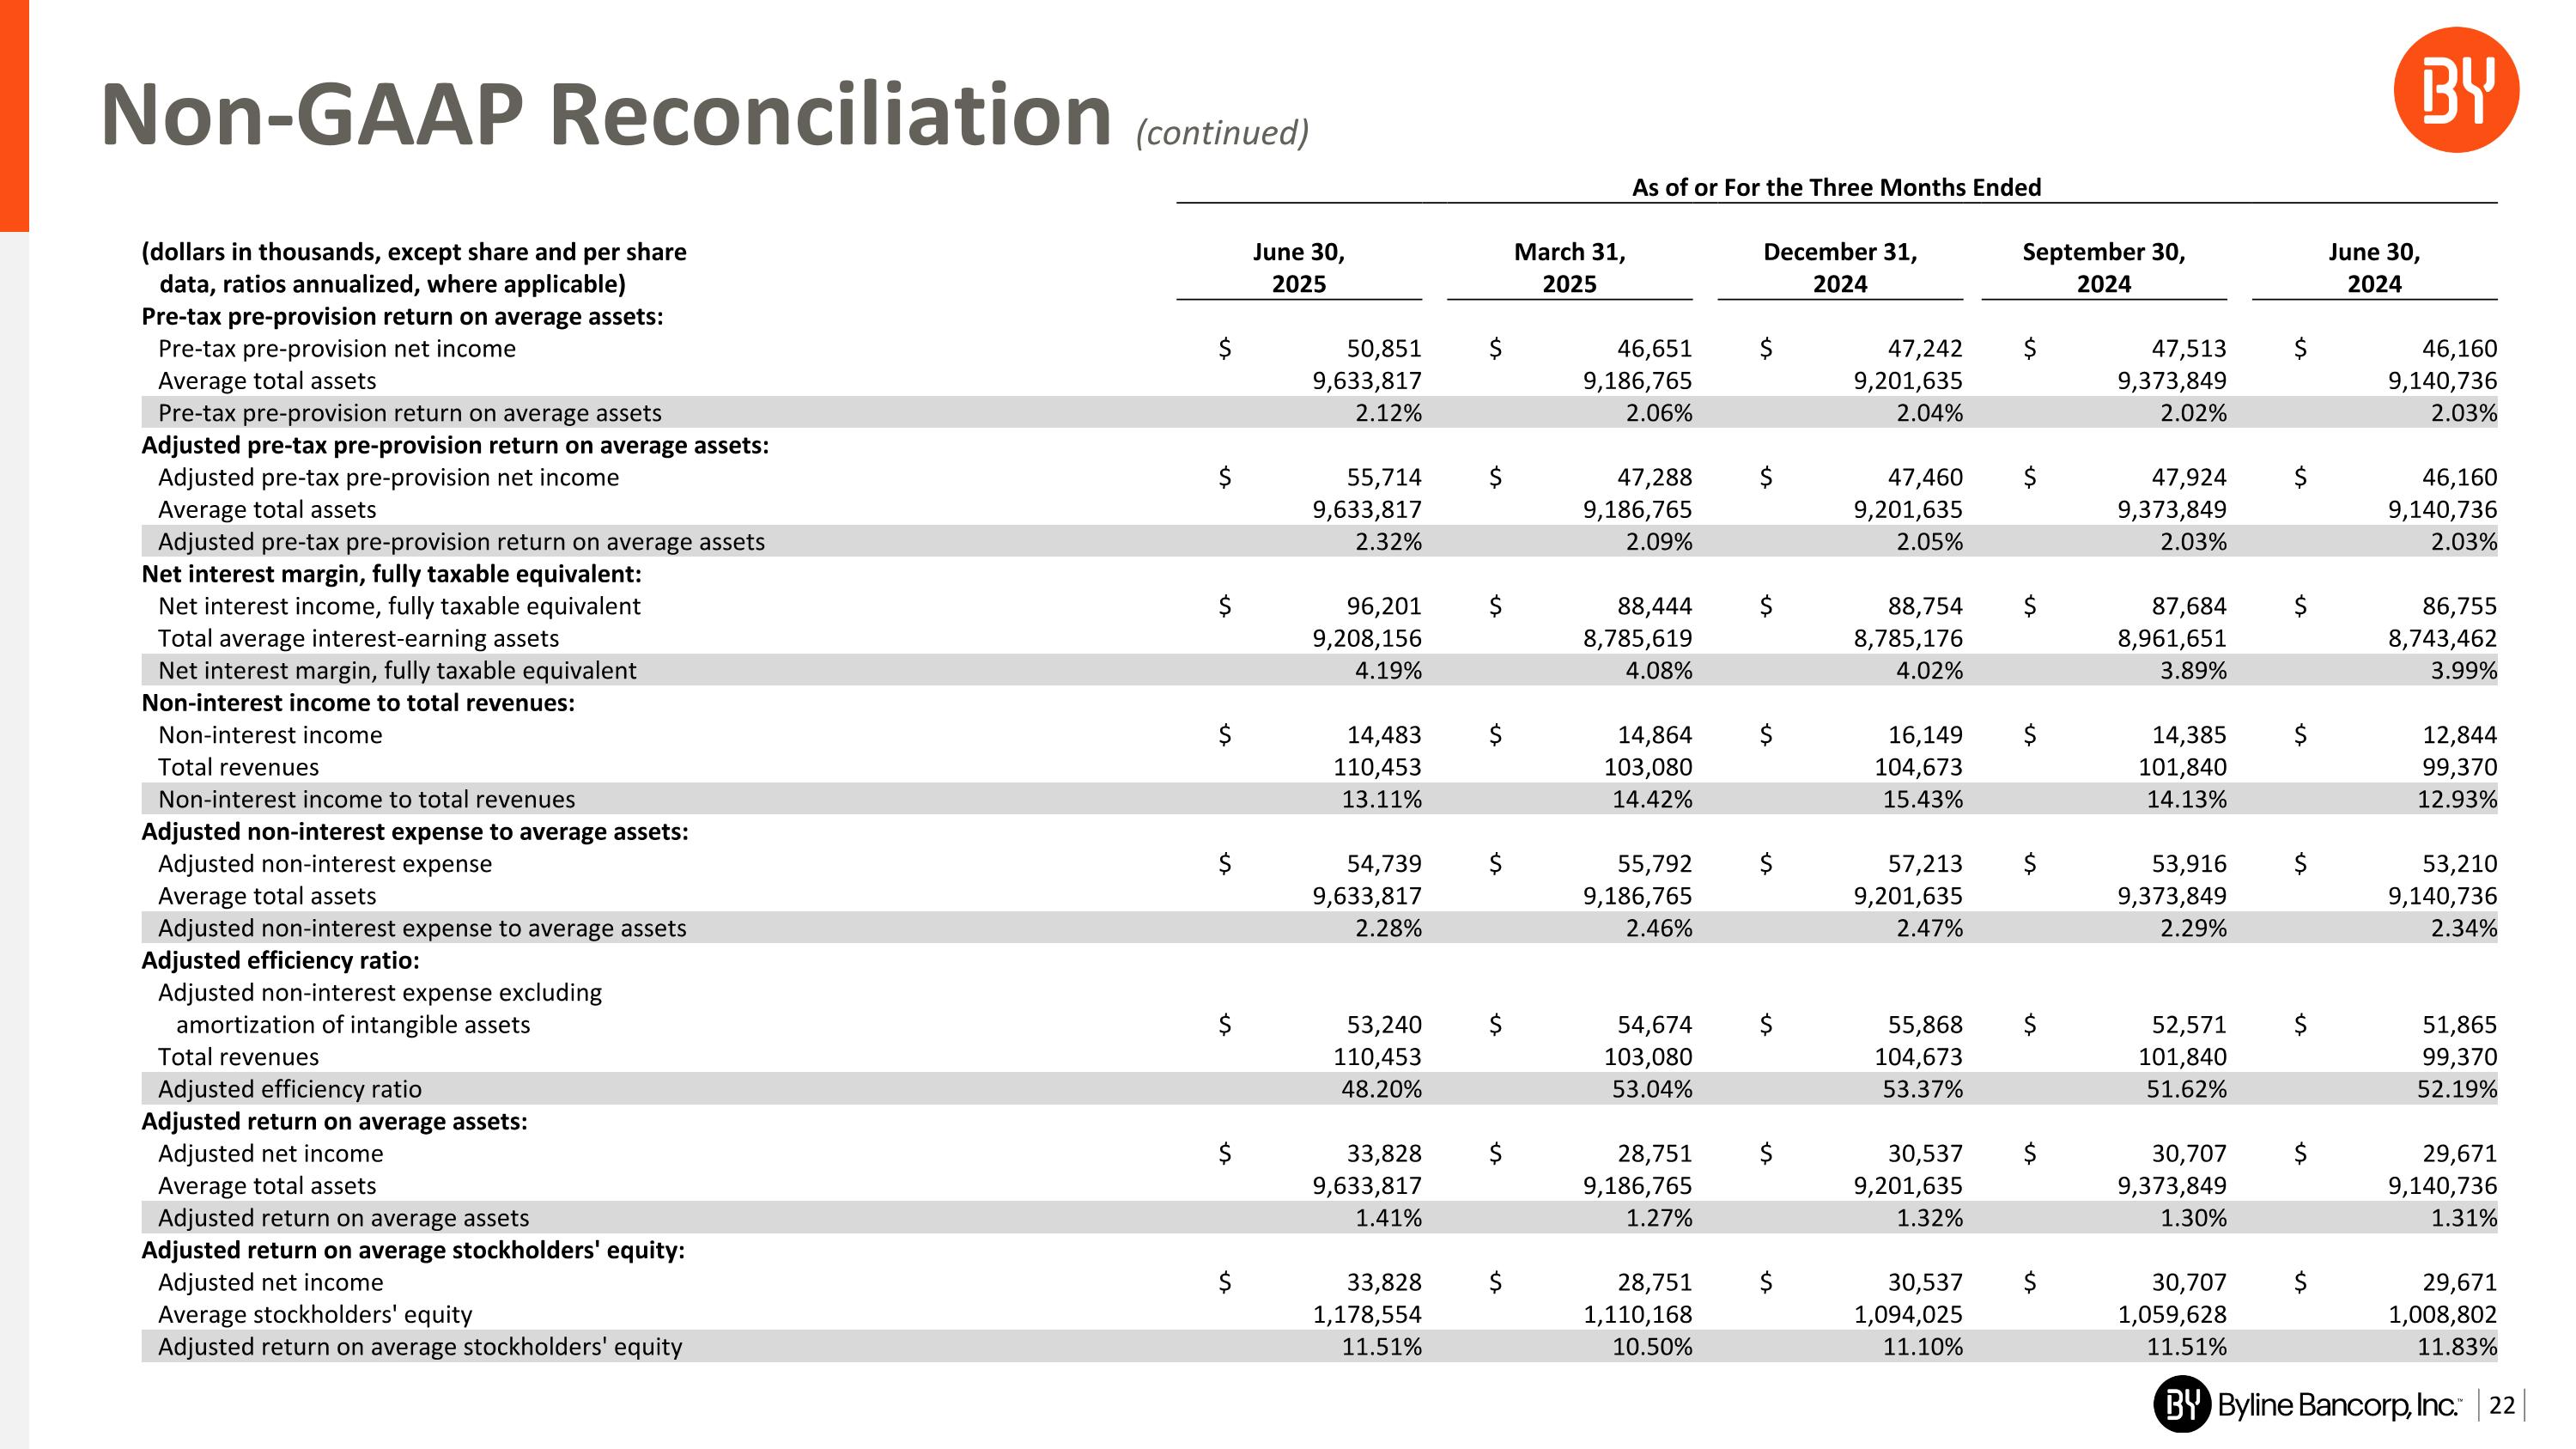
Non-GAAP Reconciliation (continued) As of or For the Three Months Ended (dollars in thousands, except share and per share data, ratios annualized, where applicable) June 30, 2025 March 31, 2025 December 31, 2024 September 30, 2024 June 30, 2024 Pre-tax pre-provision return on average assets: Pre-tax pre-provision net income $ 50,851 $ 46,651 $ 47,242 $ 47,513 $ 46,160 Average total assets 9,633,817 9,186,765 9,201,635 9,373,849 9,140,736 Pre-tax pre-provision return on average assets 2.12% 2.06% 2.04% 2.02% 2.03% Adjusted pre-tax pre-provision return on average assets: Adjusted pre-tax pre-provision net income $ 55,714 $ 47,288 $ 47,460 $ 47,924 $ 46,160 Average total assets 9,633,817 9,186,765 9,201,635 9,373,849 9,140,736 Adjusted pre-tax pre-provision return on average assets 2.32% 2.09% 2.05% 2.03% 2.03% Net interest margin, fully taxable equivalent: Net interest income, fully taxable equivalent $ 96,201 $ 88,444 $ 88,754 $ 87,684 $ 86,755 Total average interest-earning assets 9,208,156 8,785,619 8,785,176 8,961,651 8,743,462 Net interest margin, fully taxable equivalent 4.19% 4.08% 4.02% 3.89% 3.99% Non-interest income to total revenues: Non-interest income $ 14,483 $ 14,864 $ 16,149 $ 14,385 $ 12,844 Total revenues 110,453 103,080 104,673 101,840 99,370 Non-interest income to total revenues 13.11% 14.42% 15.43% 14.13% 12.93% Adjusted non-interest expense to average assets: Adjusted non-interest expense $ 54,739 $ 55,792 $ 57,213 $ 53,916 $ 53,210 Average total assets 9,633,817 9,186,765 9,201,635 9,373,849 9,140,736 Adjusted non-interest expense to average assets 2.28% 2.46% 2.47% 2.29% 2.34% Adjusted efficiency ratio: Adjusted non-interest expense excluding amortization of intangible assets $ 53,240 $ 54,674 $ 55,868 $ 52,571 $ 51,865 Total revenues 110,453 103,080 104,673 101,840 99,370 Adjusted efficiency ratio 48.20% 53.04% 53.37% 51.62% 52.19% Adjusted return on average assets: Adjusted net income $ 33,828 $ 28,751 $ 30,537 $ 30,707 $ 29,671 Average total assets 9,633,817 9,186,765 9,201,635 9,373,849 9,140,736 Adjusted return on average assets 1.41% 1.27% 1.32% 1.30% 1.31% Adjusted return on average stockholders' equity: Adjusted net income $ 33,828 $ 28,751 $ 30,537 $ 30,707 $ 29,671 Average stockholders' equity 1,178,554 1,110,168 1,094,025 1,059,628 1,008,802 Adjusted return on average stockholders' equity 11.51% 10.50% 11.10% 11.51% 11.83%
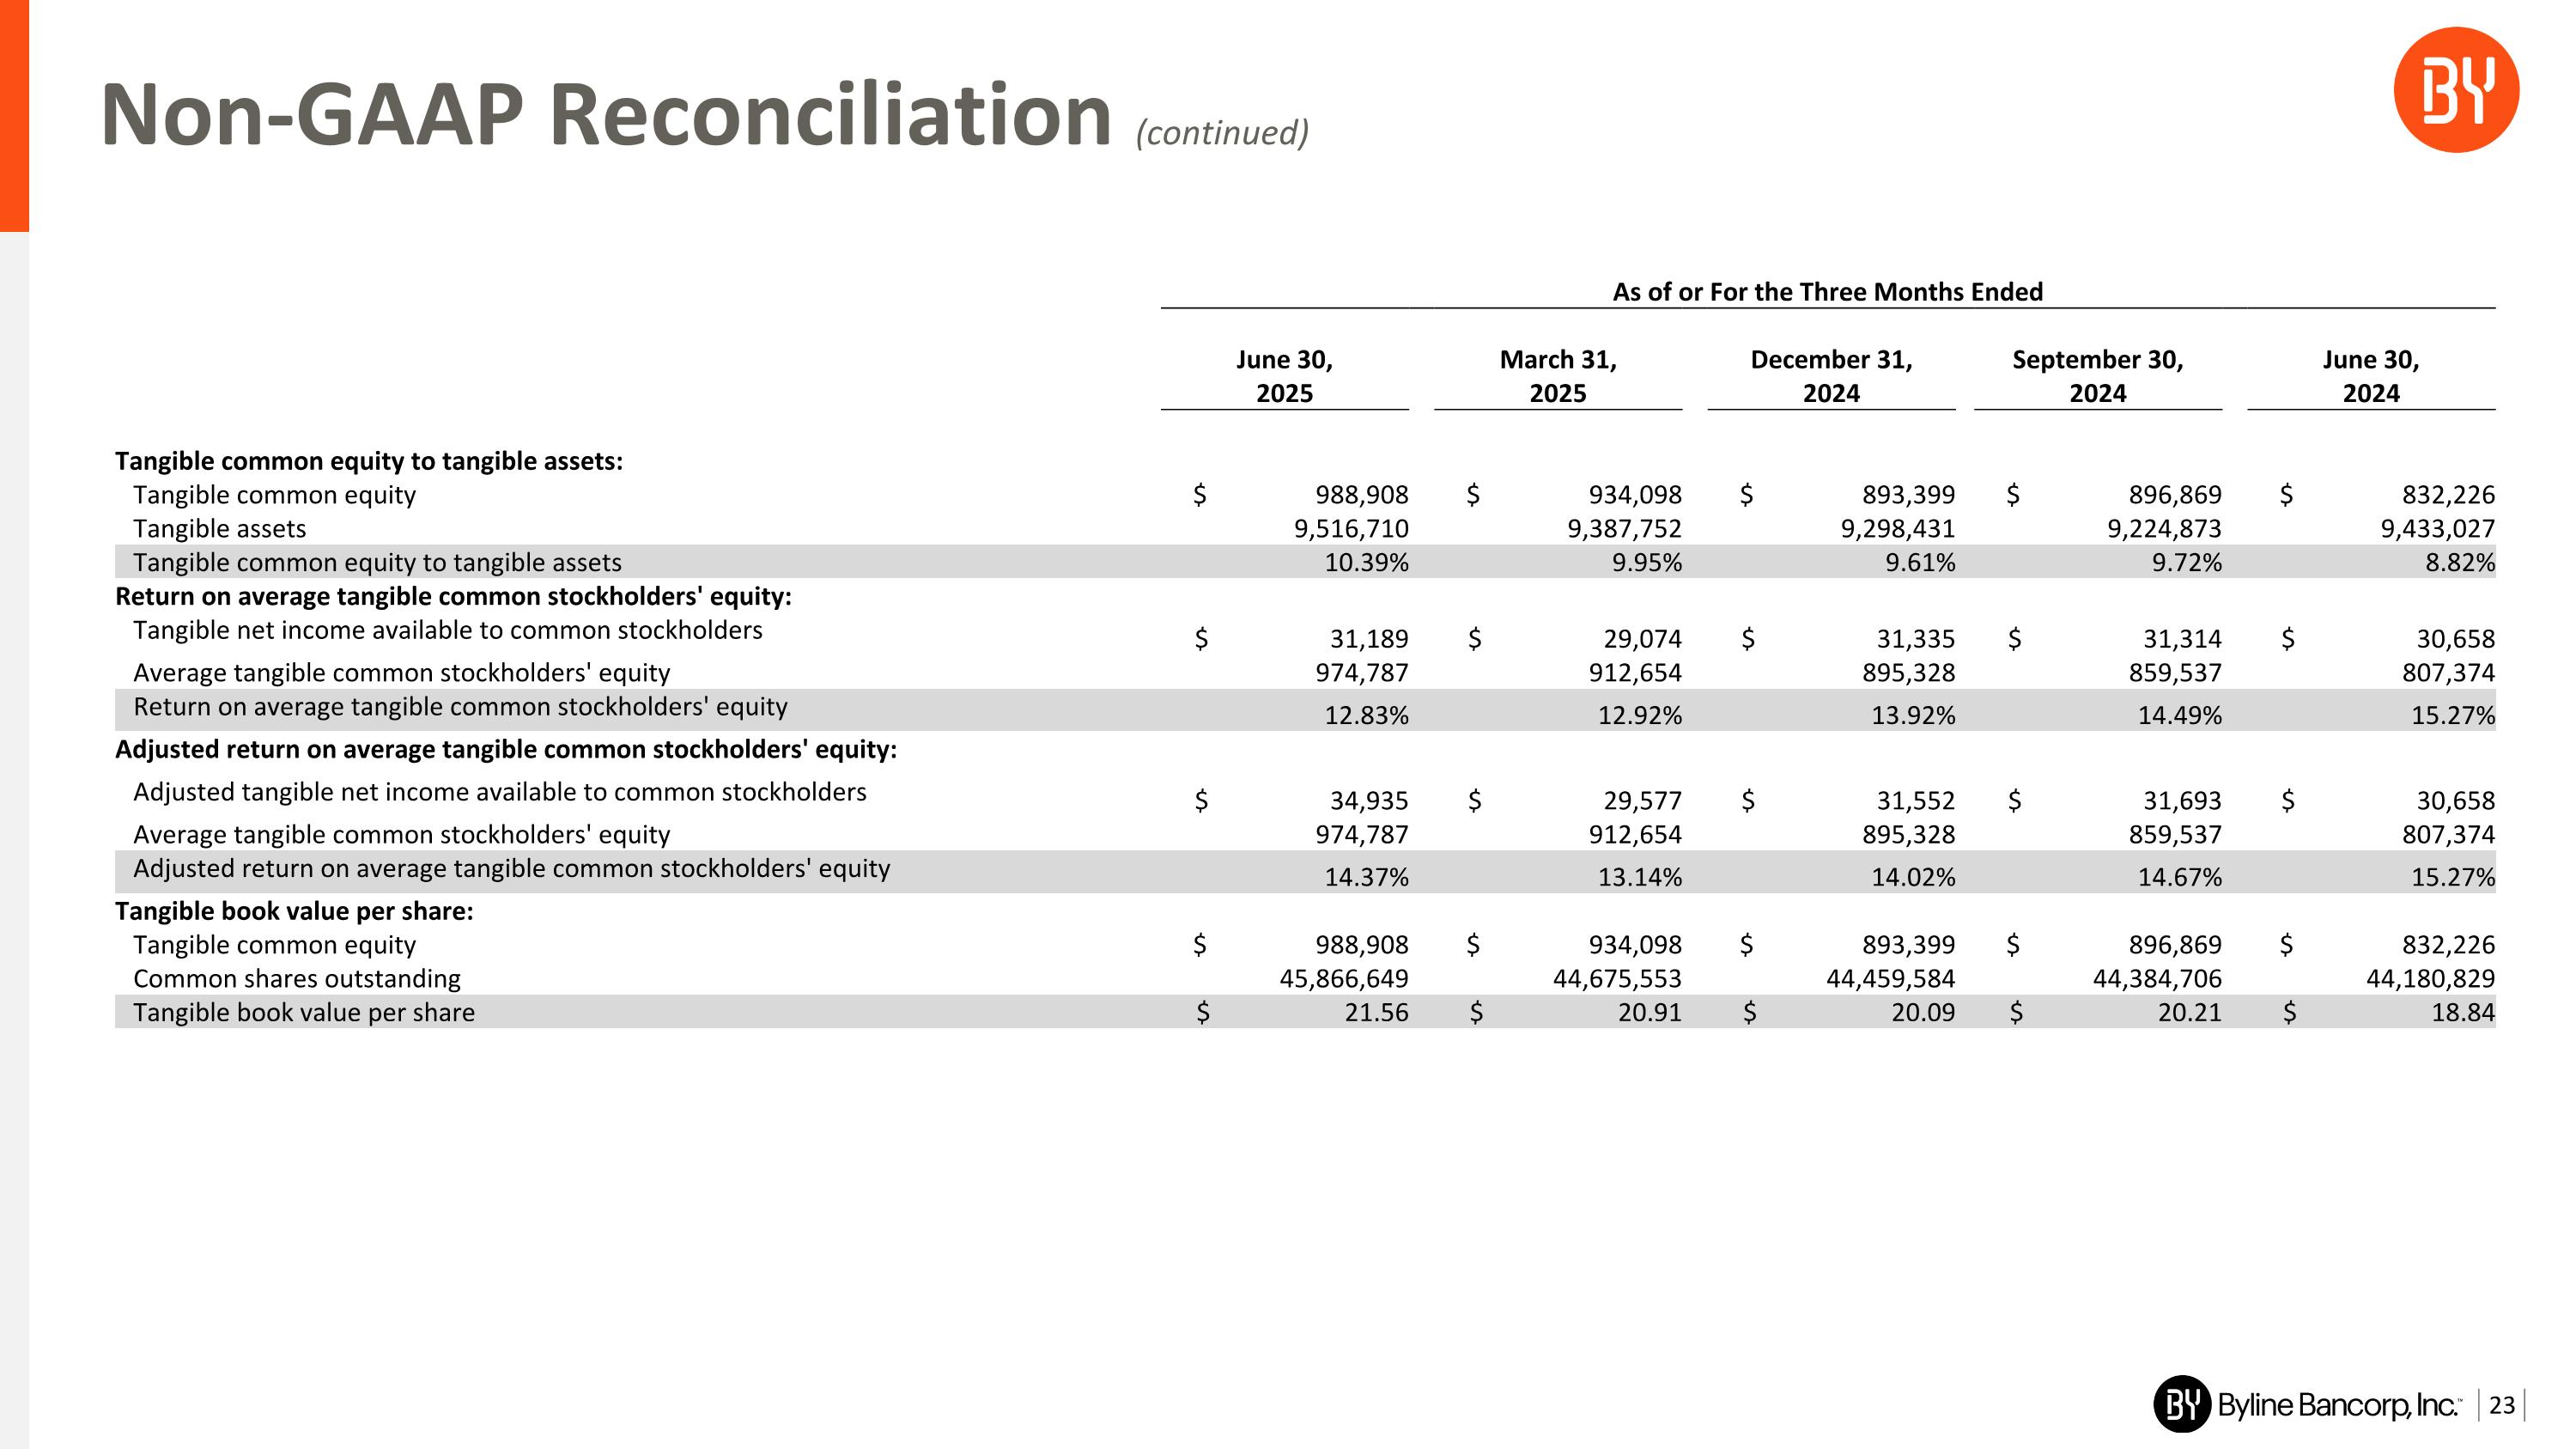
Non-GAAP Reconciliation (continued) As of or For the Three Months Ended June 30, 2025 March 31, 2025 December 31, 2024 September 30, 2024 June 30, 2024 Tangible common equity to tangible assets: Tangible common equity $ 988,908 $ 934,098 $ 893,399 $ 896,869 $ 832,226 Tangible assets 9,516,710 9,387,752 9,298,431 9,224,873 9,433,027 Tangible common equity to tangible assets 10.39% 9.95% 9.61% 9.72% 8.82% Return on average tangible common stockholders' equity: Tangible net income available to common stockholders $ 31,189 $ 29,074 $ 31,335 $ 31,314 $ 30,658 Average tangible common stockholders' equity 974,787 912,654 895,328 859,537 807,374 Return on average tangible common stockholders' equity 12.83% 12.92% 13.92% 14.49% 15.27% Adjusted return on average tangible common stockholders' equity: Adjusted tangible net income available to common stockholders $ 34,935 $ 29,577 $ 31,552 $ 31,693 $ 30,658 Average tangible common stockholders' equity 974,787 912,654 895,328 859,537 807,374 Adjusted return on average tangible common stockholders' equity 14.37% 13.14% 14.02% 14.67% 15.27% Tangible book value per share: Tangible common equity $ 988,908 $ 934,098 $ 893,399 $ 896,869 $ 832,226 Common shares outstanding 45,866,649 44,675,553 44,459,584 44,384,706 44,180,829 Tangible book value per share $ 21.56 $ 20.91 $ 20.09 $ 20.21 $ 18.84
