Nexa Reports Third Quarter 2025 Results including Net Income of US$100 million and Adjusted EBITDA of US$186 million
Luxembourg, October 30, 2025 – Nexa Resources S.A. (“Nexa Resources”, “Nexa”, or the “Company”) announces today its results for the three and nine-month periods ended on September 30, 2025.
CEO Message – Ignacio Rosado
Nexa delivered another quarter of strong financial and operational performance, as higher mining output and supportive metal prices led to increased Net revenues, Adjusted EBITDA and free cash flow, reflecting the consistent evolution of our execution capacity and our disciplined capital allocation. These results underscore our steady progress in strengthening our operational reliability, margins, and cash generation throughout 2025.
Operationally, Aripuanã achieved its highest zinc production since the start of its ramp-up, a direct result of more stable operations and higher throughput. We also reached a key milestone with the arrival of our fourth tailings filter, with installation on track for this year and commissioning expected in the first half of 2026. These achievements, alongside the advancement of the phase I of our Cerro Pasco Integration Project and continued exploration investment, are reinforcing the foundation for Nexa's long-term growth.
The market backdrop for zinc is becoming increasingly constructive. During LME Week, we observed a broad consensus around improving supply-demand fundamentals, recovering treatment charges (“TCs”), and a growing recognition of zinc’s essential role in everyday life and the global energy transition. Together, in our view, these factors support a more sustainable and positive pricing outlook.
In a global environment marked by volatility, evolving trade policies, and political uncertainty, Nexa's resilience remains a key differentiator, supported by a competitive asset base and long-term strategic focus anchored in our value catalysts.
Finally, as a global leader in low-carbon zinc production, we are accelerating our commitment to sustainability. Our Cajamarquilla operation, one of the world’s largest zinc smelters, powered entirely by renewable hydroelectric energy, exemplifies this commitment. It reflects our broader strategy to decarbonize our value chain, enhance transparency, and drive operational efficiency.
Looking ahead, we are confidently positioned to build on this momentum. Our focus remains on maximizing cash flow from our existing operations, advancing our high-return growth projects, and maintaining our leadership in sustainable zinc production.
Summary of Financial Performance
| US$ million (except per share amounts) | 3Q25 | 2Q25 | 3Q24 | 9M25 | 9M24 |
| Net revenues | 764 | 708 | 709 | 2,099 | 2,026 |
| Gross profit | 154 | 133 | 127 | 413 | 395 |
| Net income (loss) | 100 | 13 | 6 | 142 | (76) |
| EBITDA (1) | 259 | 136 | 167 | 516 | 388 |
| Basic and diluted earnings (loss) per share ("EPS") | 0.52 | 0.01 | (0.04) | 0.62 | (0.80) |
| Adjusted net income (1) | 27 | 37 | 22 | 98 | 53 |
| Adjusted EBITDA (1) | 186 | 161 | 183 | 472 | 517 |
| Adjusted basic and diluted earnings (loss) per share (1) | (0.03) | 0.11 | 0.03 | 0.25 | 0.01 |

Earnings Release 3Q25 |  |
| US$ million (except per share amounts) | 3Q25 | 2Q25 | 3Q24 | 9M25 | 9M24 |
| Cash provided by operating activities before working capital (1) (2) | 196 | 175 | 193 | 529 | 418 |
| CapEx | 90 | 87 | 53 | 227 | 191 |
| Free cash flow (1) | 52 | 17 | 51 | (156) | 56 |
| Total cash (3) | 470 | 418 | 525 | 470 | 525 |
| Net debt (1) | 1,479 | 1,515 | 1,409 | 1,479 | 1,409 |
| Net Debt/LTM Adj. EBITDA | 2.2x | 2.3x | 2.2x | 2.2x | 2.2x |
(1) Refer to “Use of Non-IFRS Financial Measures” for further information. Adjusted EBITDA, adjusted net income (loss) and adjusted EPS, exclude the items presented in the “Net Income (Loss) reconciliation to Adjusted EBITDA” section of this earnings release. For details on segment definition and accounting policy, please refer to explanatory note 2 – “Information by business segment” in the “Condensed consolidated interim financial statements at and for the three and nine-month periods ended on September 30, 2025.”
(2) Working capital variations had a positive impact of US$19 million in 3Q25 and US$3 million in 2Q25, while a negative impact of US$43 million in 3Q24, totaling a negative impact of US$243 million in 9M25 and US$184 million in 9M24.
(3) Cash, cash equivalents and financial investments.
Executive Summary
Operational Performance
| § | Zinc production reached 84kt in 3Q25, up 14% quarter-over-quarter and 1% year-over-year, mainly driven by stronger performance at Vazante and a record quarterly production at Aripuanã, which were partially offset by slightly lower output at Atacocha and Cerro Lindo. |
| § | Consolidated run-of-mine mining cost in 3Q25 averaged US$51/t, stable quarter-over-quarter. Compared to 3Q24, run-of-mine mining cost was up 11%, reflecting higher operational costs related to ongoing stabilization at the Aripuanã plant. Excluding this effect, run-of-mine mining cost was broadly flat compared to 3Q24. |
| § | Consolidated mining cash cost net of by-products in 3Q25 improved to US$(0.49)/lb versus US$(0.11)/lb in 2Q25, supported by stronger by-products contribution and higher sales volume. Compared to 3Q24, cash cost also decreased by 0.48/lb, reflecting higher by-products prices and lower treatment charges (“TCs”). |
| § | In the smelting segment, zinc metal and oxide sales totaled 150kt in 3Q25, up 3% from the previous quarter, mainly driven by improved performance across all units, despite a slight decrease in zinc oxide output at Três Marias. Compared to 3Q24, sales were down 2%, which is consistent with our full-year 2025 sales guidance. |
| § | Zinc metal and oxide production rose 6% quarter-over-quarter to 147kt, driven by record output at Cajamarquilla and an operational recovery at Três Marias. This result represents a 4% year-over-year decrease, which is consistent with our guidance, and reflects the impact of lower TCs and a more selective production mix. |
| § | Smelting conversion cost was US$0.35/lb in 3Q25, remaining relatively flat from US$0.34/lb in 2Q25, largely due to higher zinc sales and lower variable costs. Compared to 3Q24, conversion cost rose 10%, driven by reduced sales volume coupled with higher personnel and other variable expenses. |
| § | Smelting cash cost increased to US$1.32/lb in 3Q25, up 7% quarter-over-quarter and 14% year-over-year, primarily driven by increased raw material costs due to higher zinc prices, and lower TCs, partially offset by operational efficiencies. |
Financial Performance
| § | Net revenues in 3Q25 totaled US$764 million, up 8% from US$708 million in 2Q25, supported by higher smelting sales volume, ongoing operational improvements, and higher metal prices. Compared to 3Q24, net revenues also increased 8%, primarily driven by higher LME prices for copper, silver, and gold, and increased by-products contribution. In 9M25, net revenues amounted to US$2.1 billion, up 4% compared to the same period a year ago, driven by stronger by-products prices, partially offset by lower metal sales volume. |
 | 2 |
Earnings Release 3Q25 | |
| § | Net income amounted to US$100 million in 3Q25, bringing the total for the 9M25 to US$142 million, resulting in basic and diluted earnings per share attributable to Nexa’s shareholders of US$0.52 for the quarter and US$0.62 for the nine-month period. The significant quarterly increase compared to 2Q25 was primarily driven by a non-cash impairment reversal of long-lived assets at Cerro Pasco, partially offset by the appreciation of the Brazilian real against the U.S. dollar. |
| § | Adjusted net income was US$27 million in 3Q25 and US$98 million in 9M25, resulting in an adjusted basic and diluted loss per share of US$(0.03) for the quarter and an adjusted basic and diluted earnings of US$0.25 for the 9M25, both attributable to Nexa's shareholders. Refer to our “Net Income (Loss)” section for further details. |
| § | Adjusted EBITDA[1] in 3Q25 was US$186 million, up from US$161 million in 2Q25 and US$183 million in 3Q24. The quarterly improvement was driven by higher by-products sales volume (except for copper), better prices across all metals, and increased smelting sales volume. Year-over-year, the slight increase reflected stronger by-products contribution, partially offset by lower TCs, reduced consumption of own-mine concentrates, and higher maintenance-related operational costs. In 9M25, Adjusted EBITDA amounted to US$472 million, down 9% compared to the same period last year. |
| § | Consolidated Adjusted EBITDA margin was 24% in 3Q25, 1.7pp higher than in 2Q25 and 1.4pp lower than in 3Q24. |
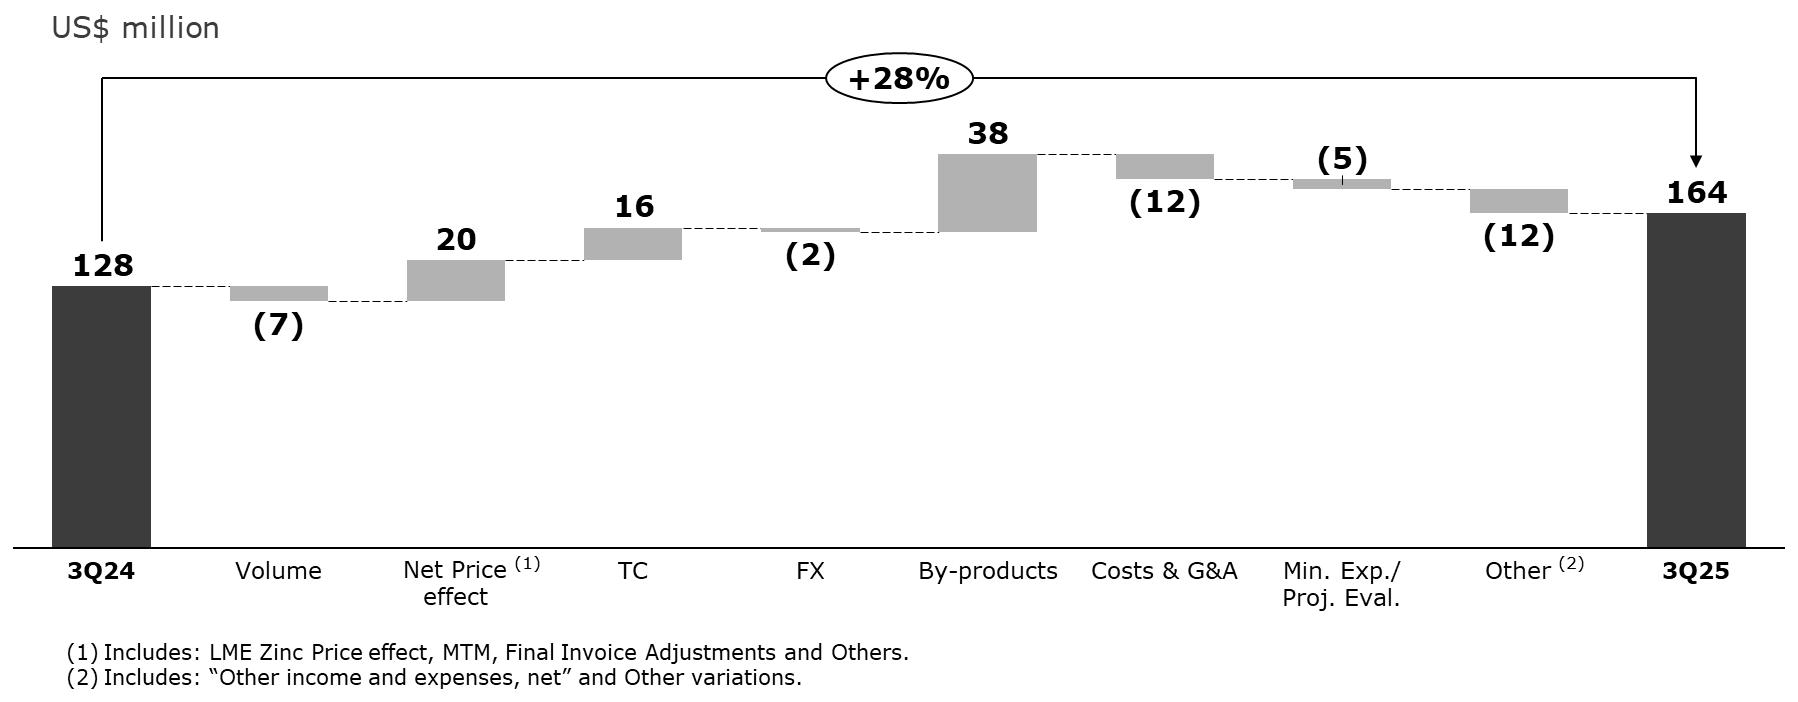
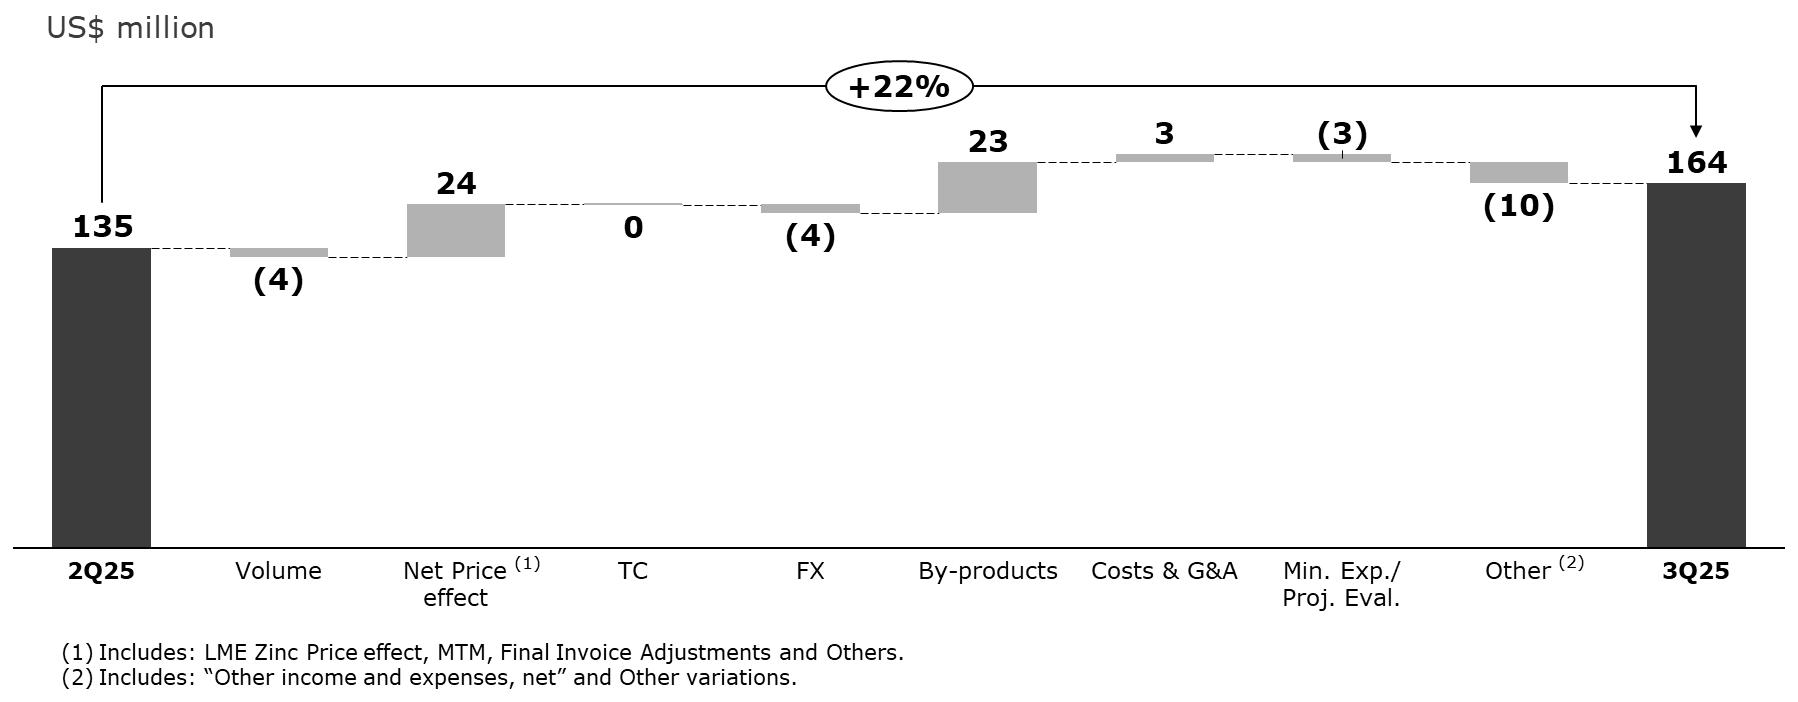
| § | The mining segment delivered strong Adjusted EBITDA of US$164 million in 3Q25, up from US$135 million in 2Q25, reflecting stronger by-products contribution and higher zinc prices. Year-over-year, mining Adjusted EBITDA rose 28%, supported by higher by-products prices (copper, silver, and gold). In 9M25, mining Adjusted EBITDA amounted to US$393 million, up 15% from prior-year period. |
| § | Adjusted EBITDA for the smelting segment was US$23 million in 3Q25, slightly below the US$25 million reported in 2Q25, primarily due to higher raw material costs from higher zinc prices and lower TCs, partially offset by improved by-products contribution. Compared to 3Q24, smelting Adjusted EBITDA decreased 59%, primarily due to lower TCs and increased raw material costs. In 9M25, smelting Adjusted EBITDA amounted to US$79 million, down 54% from the same period a year ago. |
Financial Position, Investments and Financing
| § | Total cash[2] at September 30, 2025, stood at US$470 million compared to US$418 million at June 30, 2025. Our total available liquidity in 3Q25 stood at US$790 million, including US$320 million from our undrawn sustainability-linked revolving credit facility. Excluding the RCF, our available liquidity comfortably covers all financial commitments over the next ~4 years. |
| § | In 3Q25, free cash flow was a positive US$52 million, primarily driven by higher operating cash flow and lower interest payments on loans and financing, and to a lesser extent, a working capital gain due to an increase in trade and confirming payables. For further details, please refer to the “Net cash flows from operating activities excluding working capital variations and free cash flow – Reconciliation” section. |
| § | Net debt to last twelve months (“LTM) Adjusted EBITDA ratio improved to 2.2x at the end of 3Q25, down from 2.3x at the end of 2Q25, while remaining in line with the 3Q24 level. This sequential improvement was driven by a combination of lower net debt and, to a lesser extent, higher LTM Adjusted EBITDA. Total debt slightly increased by US$14 million, mainly due to unfavorable foreign exchange variations. |
[1] Adjusted EBITDA excludes the items presented in the “Net Income (Loss) reconciliation to Adjusted EBITDA” section of this earnings release – US$(73) million in 3Q25, US$16 million in 3Q24 and US$24 million in 2Q25, totaling US$(44) million in 9M25 and US$129 million in 9M24.
[2] Cash and cash equivalents, and financial investments.
| | 3 |
Earnings Release 3Q25 | |
Key Highlights
Sustainability & Community Engagement
| § | Health & Safety Initiatives: In July, Nexa launched two major health campaigns in Peru - a Hand Care program to prevent hand injuries through safer equipment handling, and an Influenza Vaccination Drive that achieved over 80% employee coverage, reinforcing our commitment to workplace well-being. |
| § | Social Investment – Nexa Transforma: In September, we introduced Nexa Transforma to unify and scale social initiatives in Brazil, strengthening community engagement and safety awareness. Under this platform, Nexa partnered with Instituto Votorantim on the ‘Educational Connections’ pilot at Vazante, aimed at enhancing data-driven management in public schools. |
| § | Community Development: We continued to invest in infrastructure and education, funding upgrades to streets, sidewalks, and drainage systems in Yanacancha (near Cerro Pasco), and supplying new uniforms to over 300 students across 11 schools in Chincha (near Cerro Lindo). |
| § | Safety Culture: Across all operations, Nexa hosted the Internal Week for the Prevention of Occupational Accidents (SIPAT), promoting engagement and reinforcing our safety culture. |
| § | Diversity & Inclusion: In September, Nexa inaugurated Espaço Delas at Vazante, a dedicated facility for women operators, and received the PERUMIN Seal of Excellence in Gender Equity, recognizing our efforts to close gender gaps in the mining sector. We also hosted the first Plurality Leaders and Co-leaders Meeting in São Paulo, advancing diversity and inclusion initiatives. |
Decarbonization & Innovation
| § | Low-Carbon Leadership: Nexa remains among the world’s leading low-carbon zinc producers. Our Cajamarquilla smelter in Peru operates entirely on renewable hydroelectric energy and maintains one of the lowest carbon intensities in the industry. |
| § | Recognition for Transparency: In July, Nexa earned the GHG Protocol Brazil Gold Seal for the second consecutive year, acknowledging excellence in emissions management and disclosure. |
| § | Operational Efficiency: At Cerro Lindo, the deployment of a Lokotrack hybrid mobile crushing plant, reduced fuel consumption and CO₂ emissions by up to 30%, while enhancing productivity. |
| § | Circular Economy: Nexa advanced waste-to-value initiatives, selling 100,000 eco-bricks produced from jarosite residue at the Juiz de Fora smelter, and commissioned a pilot plant at Cajamarquilla with a capacity of 24,000 eco-bricks per year, expected to cut waste by approximately 3,000 tons annually. |
| § | Digital Transformation: AI-based thermographic monitoring was validated at Cerro Lindo to detect loose rocks and improve underground safety. At Cajamarquilla, machine learning models were implemented to predict silver, iron, and sulfur levels, optimizing concentrate quality and process control. |
Industry Leadership & Governance
| § | Thought Leadership: In August, Nexa showcased its ESG strategy and decarbonization roadmap at key industry forums, including the 12th Brazilian Congress of Open-Pit and Underground Mining and the ESG Summit Brazil, highlighting progress in renewable energy adoption and emission reduction. |
| § | Strategic Dialogue: At the Forbes Peru Sustainability Summit 2025, our CFO underscored the integration of finance, ESG, and operations to drive sustainable growth. |
| § | Responsible Sourcing: Nexa achieved full compliance with LME Responsible Sourcing standards (Track A), in line with OECD Due Diligence Guidance, reinforcing our leadership in ethical supply chain management and transparency. |
| § | Accessibility & Inclusion: Our Cajamarquilla smelter received the Universal Accessibility Good Practices award from the Peruvian Ministry of Housing for infrastructure that promotes inclusive mobility. |
| | 4 |
Earnings Release 3Q25 | |
| § | Client & Market Engagement: In September, Nexa hosted the Commercial Strategy Workshop (CSW) to define 2026 priorities and organized Zamac Day, an event focused on innovation and sustainability with clients in the zinc casting sector. |
Financial & Corporate Milestones
| § | On September 3, 2025, Nexa Resources El Porvenir S.A.C., a subsidiary of Nexa Perú, completed its Voluntary Public Tender Offer (OPA) for Nexa Resources Atacocha S.A.A., acquiring 121,986 Class A voting shares (at S/0.108 per share) and 27,503,370 Class B non-voting shares (at S/0.064 per share). As a result, Nexa Resources El Porvenir S.A.C. increased its ownership in Nexa Resources Atacocha S.A.A. from 82.11% to approximately 83.00% following the OPA. Further details are available on the Lima Stock Exchange (BVL) and Superintendency of the Securities Market (SMV) websites. |
| § | In September 2025, Fitch Ratings reaffirmed Nexa’s 'BBB-' investment grade rating with a 'Stable' Outlook, underscoring our solid financial position. Additionally, Fitch reaffirmed Nexa Brazil’s national scale long-term rating at 'AAA(bra)', also with a 'Stable' Outlook. |
Growth, Portfolio Optimization and Strategic Investments
| § | Cerro Pasco Integration Project: In 3Q25, we achieved important progress in Phase I, which aims to implement a tailings pumping and piping system to increase tailings storage capacity, therefore extending the life of the mine complex and improving its operational efficiency. Construction, which began in July 2025, advanced according to plan, with key milestones reached during the quarter. |
On-site activities currently include earthworks for slope cutting and containment, enabling access to Variants 1 and 3, and the progress on the Plant Platform, Tailings Thickener, and the Drive Pipe Channel, alongside drilling for Tailings Pipeline supports. Procurement also remains on schedule - two major equipment packages are fully manufactured, Factory Acceptance Tests (FAT) are in progress, and fabrication of key structural components has begun.
In parallel, Phase II preparatory work is advancing, which includes technical assessments of the Picasso shaft and underground integration to determine the most efficient long-term operational configuration. Phase I timeline remains on track, with commissioning expected in 2026, consistent with our long-term optimization plan for the Cerro Pasco complex.
| § | We remain firmly committed to enhancing free cash
flow generation through a disciplined capital allocation framework, which prioritizes sustaining investments, brownfield mineral exploration,
aimed at continuously extending the life of our mining assets, gross debt reduction and critical ESG and Health, Safety, and Environment
(“HS&E”) initiatives. Our strategic focus continues to be on optimizing our most
attractive assets and projects to strengthen operational resilience and create sustainable long-term value creation for all stakeholders. |
| | 5 |
Earnings Release 3Q25 | |
2025 Outlook
Production, Sales and Cash Cost Guidance
Guidance is based on several assumptions and estimates, including, but not limited to, metal prices, operational performance, maintenance and input costs, treatment charges, and foreign exchange rates.
| § | Nexa reaffirms its 2025 consolidated mining production guidance for all metals, as well as zinc (metallic and oxide) sales, consolidated cash costs for its mining and smelting segments, capital expenditures, exploration, project evaluation and other expenses. The outlook for 4Q25 across these areas is outlined below. |
| o | Cerro Lindo: zinc production is expected to be higher than in 3Q25. Lead output is projected to increase, while copper production is anticipated to decline. |
| o | El Porvenir: zinc production is expected to moderately increase quarter-over-quarter, driven by higher grades. Silver production is also expected to increase, while lead output should remain broadly stable. |
| o | Atacocha: we anticipate a significant increase in silver production in 4Q25 compared to 3Q25, alongside higher zinc output. Lead production, however, is expected to decrease. |
| o | Vazante: Both ore throughput and zinc head grade are expected to improve, resulting in higher zinc production in 4Q25, partially offsetting the lower output recorded in 1H25. |
| o | Aripuanã: Zinc and lead production are anticipated to be slightly higher compared to 3Q25, supported by higher average grades and improved plant and tailings filtration performance. Copper, however, is expected to slightly decrease. |
Mining segment – production
| Mining production | 9M25 | Guidance 2025 | |||||
| (Metal in concentrate) | |||||||
| Zinc | kt | 225 | 300 | - | 336 | ||
| Cerro Lindo | 63 | 85 | - | 88 | |||
| El Porvenir | 40 | 53 | - | 62 | |||
| Atacocha | 9 | 10 | - | 12 | |||
| Vazante | 91 | 123 | - | 139 | |||
| Aripuanã | 23 | 28 | - | 36 | |||
| Copper | kt | 25 | 29 | - | 35 | ||
| Cerro Lindo | 20 | 24 | - | 27 | |||
| El Porvenir | 0.3 | 0.3 | - | 0.5 | |||
| Aripuanã | 4.7 | 5.1 | - | 8.2 | |||
| Lead | kt | 45 | 54 | - | 67 | ||
| Cerro Lindo | 7 | 11 | - | 12 | |||
| El Porvenir | 20 | 21 | - | 26 | |||
| Atacocha | 9 | 12.9 | - | 13.5 | |||
| Vazante | 0.6 | 0.6 | - | 0.8 | |||
| Aripuanã | 8 | 9 | - | 14 | |||
| Silver | MMoz | 8.0 | 10.6 | - | 12.0 | ||
| Cerro Lindo | 2.9 | 3.9 | - | 4.2 | |||
| El Porvenir | 3.4 | 4.2 | - | 4.8 | |||
| Atacocha | 0.8 | 1.3 | - | 1.4 | |||
| Vazante | 0.3 | 0.3 | - | 0.5 | |||
| Aripuanã | 0.6 | 1.0 | - | 1.2 | |||
| | 6 |
Earnings Release 3Q25 | |
Smelting segment – sales guidance
Sales guidance for zinc metal and oxide remains unchanged at 560-590kt.
| o | Peru (Cajamarquilla): Production is expected to remain strong, sustaining the high levels achieved in 3Q25 – one of the best quarterly performances in the smelter’s history. |
| o | Brazil: at Três Marias, production is expected to slightly increase in 4Q25 compared to 3Q25, reflecting continued progress in plant stabilization. At Juiz de Fora, output is anticipated to remain broadly in line with 3Q25 as we advance initiatives to address ongoing operational challenges. |
| Smelting sales | 9M25 | Guidance 2025 | |||||
| Zinc metal | kt | 398 | 530 | - | 555 | ||
| Cajamarquilla | 258 | 320 | - | 330 | |||
| Três Marias | 92 | 145 | - | 155 | |||
| Juiz de Fora | 49 | 65 | - | 70 | |||
| Zinc oxide | kt | 27 | 30 | - | 35 | ||
| Três Marias | 27 | 30 | - | 35 | |||
| Total Sales | kt | 425 | 560 | - | 590 | ||
Nexa continues to monitor global macroeconomic and operational risks that could affect our business. These include commodity price volatility, inflationary pressures, supply chain constraints, and potential changes to political or regulatory environments in the jurisdictions where we operate. In addition, community-related events or extreme weather may impact production and cost pressures.
We remain focused on mitigating these risks through operational discipline, proactive stakeholder engagements, and flexibility in our capital allocation. For more details, please refer to “Risks and Uncertainties” and our “Cautionary Statement on Forward-Looking Statements.”
Cash Costs
| § | Nexa also reaffirms its 2025 cash cost guidance for both the mining and smelting segments. The estimates are based on several key assumptions, including but not limited to: |
| o | Mining and smelting volumes: We expect production to increase in 4Q25 compared to 3Q25, remaining within our full-year guidance ranges outlined above; |
| o | Operational efficiency and cost management: We anticipate further improvements, driven by ongoing implementation of key initiatives across our operations; |
| o | Commodity prices forecast for 2025e: Zinc (Zn) at US$1.24/lb, Copper (Cu) at US$4.27/lb, Lead (Pb) at US$0.89/lb, Silver (Ag) at US$33.9/oz, and Gold (Au) at US$3,162/oz; |
Nexa’s C1 cash cost remains sensitive to foreign exchange rate, by-product prices and volumes, and treatment charges, which may affect our final cost outcomes;
| o | Foreign exchange rate assumptions for 2025e: BRL/USD: 5.67 and PEN/USD: 3.66; |
| o | Zinc treatment charges (“TCs”): 2025 benchmark TCs of US$80/t of concentrate. |
| | 7 |
Earnings Release 3Q25 | |
| Mining Operating costs | Cost ROM (US$/t) |
Cash Cost (US$/lb) |
Cost ROM (US$/t) |
Cash Cost (US$/lb) | ||||||||
| 9M25 | 9M25 | Guidance 2025 | Guidance 2025 | |||||||||
| Mining(1) | 49.5 | (0.18) | 49.2 | - | 56.2 | (0.04) | - | 0.16 | ||||
| Cerro Lindo | 39.1 | (0.68) | 39.2 | - | 43.1 | (0.52) | - | (0.33) | ||||
| El Porvenir | 62.4 | (0.34) | 61.5 | - | 67.7 | (0.19) | - | 0.02 | ||||
| Atacocha | 37.1 | (1.26) | 34.5 | - | 38.3 | (1.16) | - | (1.07) | ||||
| Vazante | 48.5 | 0.51 | 52.0 | - | 57.7 | 0.46 | - | 0.52 | ||||
| Aripuanã | 91.4 | 0.33 | 86.6 | - | 108.2 | (0.10) | - | 0.69 | ||||
(1) C1 Weighted Cash cost net of by-products credits is measured with respect to zinc sold per mine.
In 9M25, consolidated run-of-mine mining cost was US$49.5/t, at the lower end of our 2025 guidance. C1 cash cost of US$(0.18)/lb came in well below the lower end of our expected guidance range, driven by a sharp increase in by-products contribution. For further details, please refer to the “Business performance – Mining segment” section.
| Smelting Operating costs | Conversion cost (US$/lb) |
Cash Cost (US$/lb) |
Conversion cost (US$/lb) |
Cash Cost (US$/lb) | ||||||||
| 9M25 | 9M25 | Guidance 2025 | Guidance 2025 | |||||||||
| Smelting(2) | 0.34 | 1.24 | 0.36 | - | 0.41 | 1.14 | - | 1.33 | ||||
| Cajamarquilla | 0.29 | 1.11 | 0.33 | - | 0.36 | 1.02 | - | 1.17 | ||||
| Três Marias | 0.36 | 1.45 | 0.33 | - | 0.40 | 1.27 | - | 1.53 | ||||
| Juiz de Fora | 0.56 | 1.46 | 0.53 | - | 0.64 | 1.38 | - | 1.58 | ||||
(2) C1 Weighted Cash cost net of by-products credits is measured with respect to zinc sold per smelter.
In 9M25, consolidated smelting conversion cost was US$0.34/lb and C1 cash cost was US$1.24/lb, both in line with our 2025 guidance. For further details, please refer to the “Business performance – Smelting segment” section.
Capital Expenditures (“CAPEX”)
| § | In 3Q25, Nexa invested US$90 million, primarily in sustaining expenditures, including mine development and operational maintenance. Total investment for 9M25 reached US$227 million. |
| § | Investments related to Phase I of the Cerro Pasco Integration Project, focused on the tailings pumping system, are classified as sustaining and amounted to US$12 million in the quarter and US$30 million in 9M25, in line with the project plan. |
| § | Our full-year CapEx guidance remains unchanged at US$347 million. |
| CAPEX | 9M25 | Guidance 2025 | ||
| (US$ million) | ||||
| Non-Expansion | 231 | 344 | ||
| Sustaining (1) | 218 | 316 | ||
| HS&E | 10 | 18 | ||
| Others (2) | 3 | 11 | ||
| Expansion projects (3) | 1 | 3 | ||
| Reconciliation to Financial Statements (4) | (4) | - | ||
| TOTAL | 227 | 347 |
(1) Investments in TSF (“Tailings Storage Facility”) are included in sustaining expenses.
(2) Modernization, IT and others.
(3) Includes several projects in Vazante to improve operational performance.
(4) The amounts are mainly related to capitalization of interest net of advanced payments for imported materials and tax credits.
| | 8 |
Earnings Release 3Q25 | |
Exploration & Project Evaluation and Other Expenses
| § | In 3Q25, we invested US$21 million in exploration and project evaluation, totaling US$53 million in 9M25, reinforcing our focus on unlocking the mineral potential of our assets. Additionally, we allocated US$3 million to technology and community initiatives during the quarter, amounting to US$10 million in 9M25, supporting the continuous operational improvements and the sustainable development of our host communities. |
| § | Exploration and project evaluation guidance for 2025 remains unchanged at US$88 million, with other expenses expected to total approximately US$20 million. |
| § | As part of our long-term strategy, we remain committed to replacing and expanding our mineral inventory. In this context, we continue to advanceon our exploration programs, identifying new ore bodies and upgrading resource classifications, particularly through infill drilling campaigns across our key operations. |
| Other Operating Expenses | 9M25 | Guidance 2025 | ||
| (US$ million) | ||||
| Exploration | 44 | 70 | ||
| Mineral Exploration | 32 | 50 | ||
| Mineral rights | 5 | 10 | ||
| Exploration (mine development) | 6 | 9 | ||
| Project Evaluation | 9 | 18 | ||
| Exploration & Project Evaluation | 53 | 88 | ||
| Other | 10 | 20 | ||
| Technology | 1 | 6 | ||
| Communities | 8 | 14 |
Note: Exploration and project evaluation expenses consider several stages of development, from mineral potential definition, R&D, and subsequent scoping and pre-feasibility studies (FEL1 and FEL2).
| | 9 |
Earnings Release 3Q25 | |
Earnings Release 3Q25
This Earnings Release should be read in conjunction with the “Condensed consolidated interim financial statements at and for the three and nine-month periods ended on September 30, 2025.” This document contains forward-looking statements.
Table of contents
| Consolidated performance | 11 |
| Business performance – Mining | 17 |
| Business performance – Smelting | 28 |
| Liquidity and Indebtedness | 35 |
| Cash flows | 37 |
| Others | 38 |
| Market scenario | 39 |
| Risks and Uncertainties | 41 |
| Use of Non-IFRS Financial Measures | 42 |
| Cautionary Statement on Forward-Looking Statements | 43 |
| Appendix | 45 |
UPCOMING EVENT
Earnings Conference Call
Date: Friday, October 31, 2025 – 9:00am (EST)
Dial In
US: +1 646 558 8656
Canada: +1 780 666 0144
Brazil: +55 21 3958 7888
UK: +44 330 088 5830
Luxembourg: +352 342 080 9265
(Webinar ID: 865 7433 4653 | Passcode: 624717)
Zoom Webinar registration and slide presentation
will be available at:
https://ir.nexaresources.com
| | 10 |
Earnings Release 3Q25 | |
Consolidated performance
Selected financial information
| US$ million (except where otherwise indicated) |
3Q25 | 2Q25 | 3Q24 | 9M25 | 9M24 |
| Net Revenues | 764 | 708 | 709 | 2,099 | 2,026 |
| Mining | 372 | 353 | 325 | 1,038 | 996 |
| Smelting | 541 | 489 | 524 | 1,484 | 1,450 |
| Intersegment results | Adjustments | (149) | (134) | (140) | (423) | (421) |
| Cost of Sales | (610) | (576) | (583) | (1,686) | (1,631) |
| Mining | (236) | (231) | (247) | (683) | (755) |
| Smelting | (523) | (477) | (474) | (1,424) | (1,297) |
| Intersegment results | Adjustments | 150 | 132 | 139 | 421 | 421 |
| Selling, general and administrative | (37) | (33) | (29) | (105) | (93) |
| Mining | (18) | (16) | (14) | (52) | (47) |
| Smelting | (18) | (16) | (13) | (52) | (43) |
| Intersegment results | Adjustments | (1) | (1) | (2) | (1) | (3) |
| Depreciation and amortization | 82 | 77 | 82 | 224 | 234 |
| Mining | 56 | 49 | 63 | 148 | 174 |
| Smelting | 24 | 24 | 19 | 71 | 58 |
| Intersegment results | Adjustments | 1 | 3 | 0 | 5 | 1 |
| Adjusted EBITDA (1) | 186 | 161 | 183 | 472 | 517 |
| Mining | 164 | 135 | 128 | 393 | 342 |
| Smelting | 23 | 25 | 55 | 79 | 174 |
| Intersegment results | Adjustments | (1) | 0 | 0 | 0 | 1 |
| Adj. EBITDA margin (%) | 24.4% | 22.7% | 25.8% | 22.5% | 25.5% |
| Net income (loss) | 100 | 13 | 6 | 142 | (76) |
| Attributable to Nexa's shareholders | 69 | 1 | (5) | 82 | (107) |
| Attributable to non-controlling interests | 31 | 12 | 11 | 60 | 31 |
| Basic and diluted earnings (loss) per share | 0.52 | 0.01 | (0.04) | 0.62 | (0.80) |
| Adjusted net income (loss) (1) | 27 | 37 | 22 | 98 | 53 |
| Attributable to Nexa's shareholders | (4) | 15 | 4 | 33 | 2 |
| Attributable to non-controlling interests | 30 | 22 | 18 | 66 | 52 |
| Adjusted basic and diluted earnings (loss) per share (1) | (0.03) | 0.11 | 0.03 | 0.25 | 0.01 |
(1) Refer to “Use of Non-IFRS Financial Measures” for further information. Adjusted EBITDA, adjusted net income (loss) and adjusted EPS, exclude the items presented in the “Net Income (Loss) reconciliation to Adjusted EBITDA” section of this earnings release. For details on segment definition and accounting policy, please refer to explanatory note 2 – “Information by business segment” in the “Condensed consolidated interim financial statements at and for the three and nine-month periods ended on September 30, 2025.” This is a note about segments, and one of the explanations for the new adjustment for cash dividend at the consolidated level was to keep consistency with segment information.
| | 11 |
Earnings Release 3Q25 | |
Net Revenues
In 3Q25, net revenues totaled US$764 million, up 8% both year-over-year and quarter-over-quarter, mainly due to higher LME prices, with notable contributions from copper, silver, and gold, which increase by-products revenue. For further details on metal prices, please refer to the “Market Scenario” section.
The quarter-over-quarter improvement was also supported by higher sales volume, reflecting stronger operational performance.
In 9M25, net revenues reached US$2.1 billion, up 4% compared to the same period a year ago due to higher by-products contribution, partially offset by lower overall metal sales volume.
Cost of Sales
In 3Q25, cost of sales amounted to US$610 million, up 5% year-over-year. This performance was primarily attributable to lower TCs and the negative impact of higher zinc LME prices on third-party concentrate purchases, and unfavorable foreign exchange variations. Compared to 2Q25, cost of sales rose 6%, mainly due to higher sales volumes, higher zinc prices in concentrate purchases and unfavorable foreign exchange variations.
In 9M25, cost of sales was US$1,686, up 3% compared to the same period a year ago, reflecting the headwinds from lower TCs and higher raw material costs at our smelters, partially offset by lower sales volume and favorable foreign exchange variations.
Mineral exploration and Project evaluation
In 3Q25, we invested US$21 million in mineral exploration and project evaluation, a 37% increase from US$15 million invested in 3Q24.
In 9M25, total exploration investments totaled US$53 million, an 18% increase compared to US$45 million in 9M24.
Drilling Execution: In 3Q25, we executed 24,773 meters of exploration drilling (93% of our plan) and 50,370 meters of mine infill drilling. The slight exploration shortfall was primarily due to operational challenges and a strategic program review.
Key Results: Our brownfield exploration programs yielded significant interceptions, still confirming attractive mineralization and supporting resource conversion and mine life extension at key sites:
Aripuanã: 10.3 meters at notable 10.21% Zn, 5.69% Pb, 0.41% Cu, and 174.34 g/t Ag confirming the continuity of mineralization and supporting efforts to delineate new mineralized zones.
Vazante: 3.85 meters at an outstanding 24.31% of Zn, 0.90% Pb, and 46.87 g/t Ag confirming mineralization at the Conexão Sucuri Norte target, located near existing underground infrastructure and indicating a potential to convert Inferred Mineral Resources into Indicated Mineral Resources.
Cerro Lindo: 31.4 meters at 1.73% Zn, 0.25% Pb, 0.06% Cu, 6.24 g/t Ag, and 0.03 g/t Au confirming the extent of mineralized zones within orebody 8B.
Cerro Pasco Complex: 6.05 meters at 4.69% Zn, 2.44% Pb, 0.22% Cu, 336.16 g/t Ag, and 0.48 g/t Au confirming both depth and continuity of mineralization.
At the end of the third quarter, cumulative drilling reached 177,773 meters, comprising 52,918 meters for exploration drilling and 124,855 meters for mining infill drilling.
SG&A
In 3Q25, SG&A expenses totaled US$37 million, up 27% year-over-year, primarily due to higher personnel costs and increased spending on legal and third-party services expenses, combined with unfavorable foreign exchange variations. Sequentially, SG&A increased by 15%, mainly reflecting
| | 12 |
Earnings Release 3Q25 | |
higher provisions for workers’ participation, increased selling expenses due to higher volumes sold in the period, and unfavorable foreign exchange impacts.
In 9M25, SG&A expenses amounted to US$105 million, up 13% compared to 9M24, driven by increased personnel and third-party services expenses associated with organizational strengthening initiatives, which were partially offset by foreign exchange gains over the period.
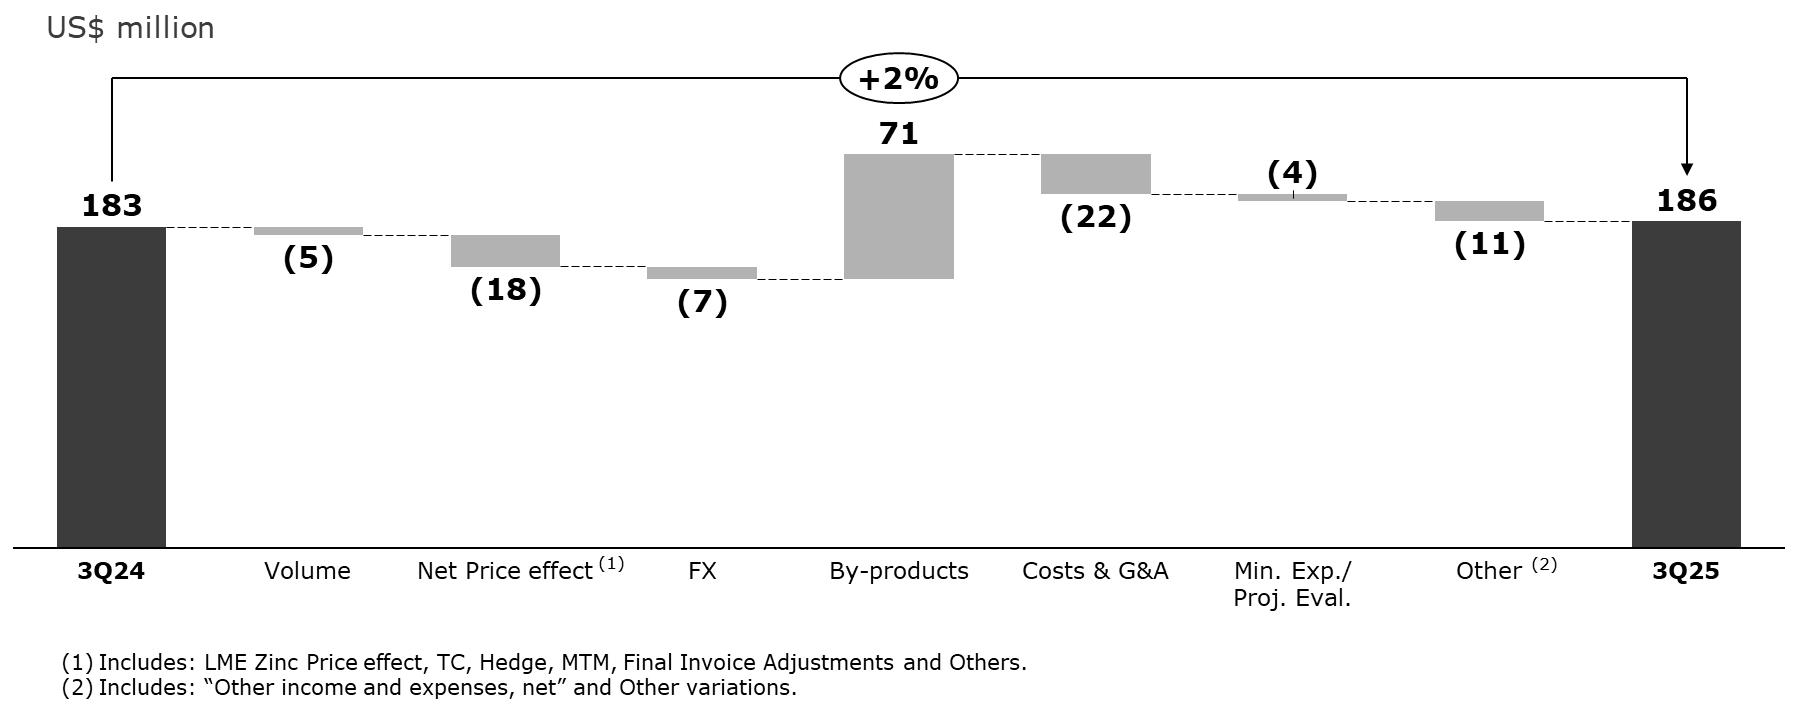
Adjusted EBITDA
In 3Q25, Adjusted EBITDA totaled US$186 million, up 2% from US$183 million in 3Q24. This increase was primarily driven by (i) higher by-products contribution of US$71 million, mainly from higher silver, gold, copper, and sulphuric acid prices, as well as increased copper cement sales volume, partially offset by lower lead and copper sales volumes. This positive impact was partially offset by (ii) US$22 million negative impact from higher costs, mainly attributed to lower TCs on third-party concentrates, reduced consumption of own-mine concentrates, and higher maintenance-related operational costs; (iii) a negative net price effect of US$18 million, reflecting a negative market-to-market impact on raw material purchases in the smelting segment despite higher zinc prices; (iv) a negative impact in other variations of US$11 million, mainly from higher environmental and tax provisions in Peru and increased obsolescence and inventory provisions at Aripuanã; (v) negative impact of US$7 million from foreign exchange variations; (vi) US$5 million reduction related to lower metal sales volume at our Brazilian smelting units, partially offset by higher sales volume at Cajamarquilla.
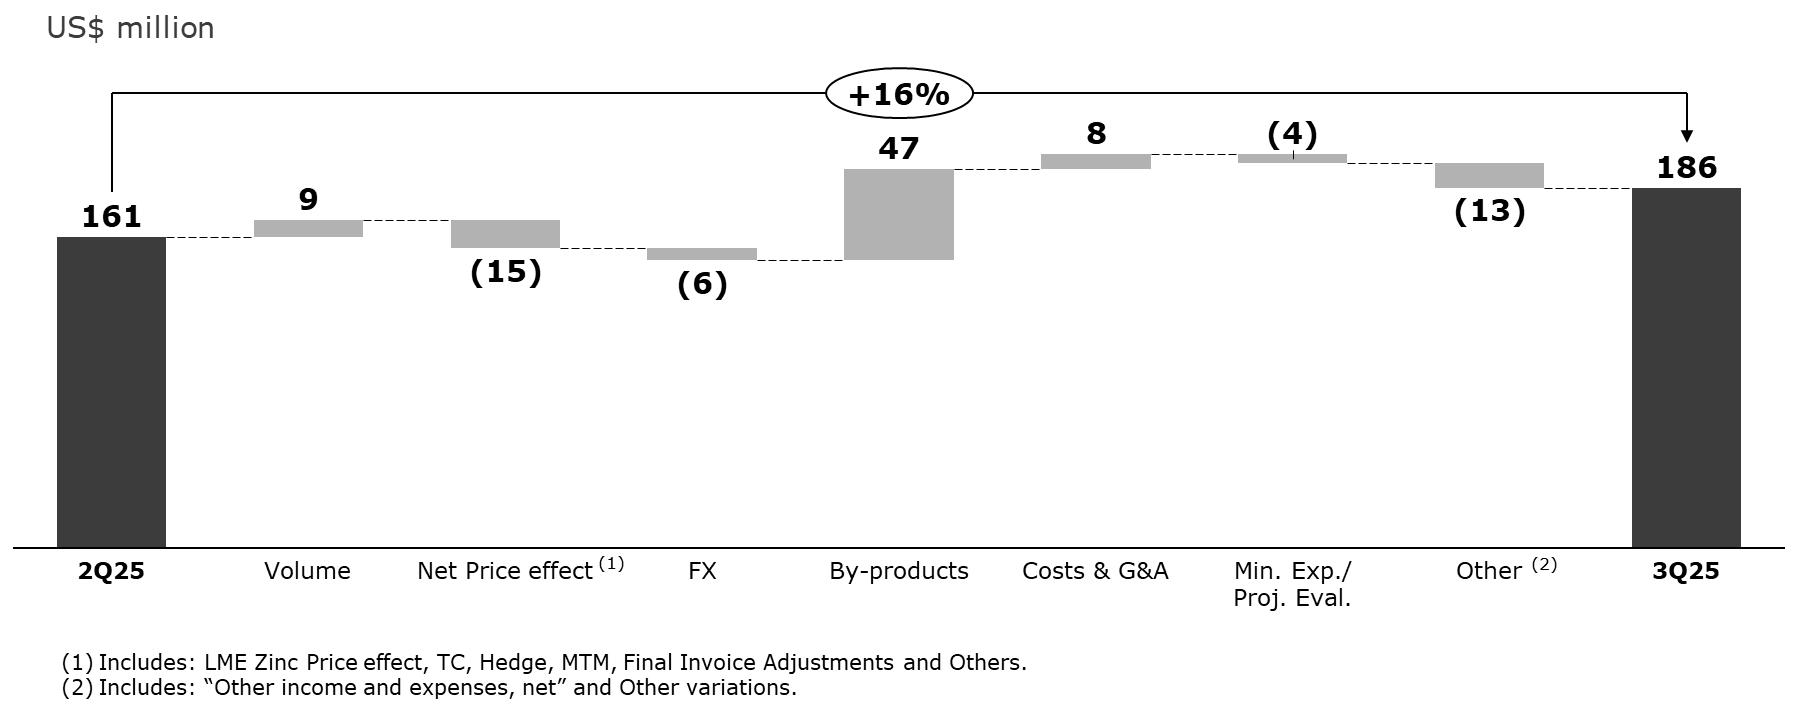
Compared to 2Q25, Adjusted EBITDA increased by 26%. This increase was mainly attributed to (i) higher by-products contribution of US$47 million, reflecting stronger prices across all metals, increased sulfuric acid sales, and higher silver concentrate sales at Cajamarquilla; (ii) higher smelting sales volume of US$9 million across all smelters, supported by improved operational performance; and (iii) a positive cost impact of US$8 million, resulting from an improved raw material mix in smelting operations and lower operational costs at Aripuanã. These positive effects were partially offset by (iv) a negative net price effect of US$15 million, primarily resulting from market-to-market losses on raw material purchases; and (v) US$13 million in other negative variations, mainly related to lower cash dividend received from Enercan compared to 2Q25, higher provisions related to low inventory turnover, and increased tax provisions in the mining segment.
| | 13 |
Earnings Release 3Q25 | |
For 9M25, Adjusted EBITDA totaled US$472 million compared to US$517 million for the same period a year ago. This decrease was primarily driven by lower metal sales volume, lower zinc TCs on third-party concentrate purchases and higher operational costs at our Brazilian smelters. These effects were partially offset by stronger by-products contribution, higher zinc prices, and a positive impact from foreign exchange variations.
Net Income (Loss) reconciliation to Adjusted EBITDA
| US$ million | 3Q25 | 2Q25 | 3Q24 | 9M25 | 9M24 |
| Net Income (loss) | 100.1 | 13.3 | 6.0 | 142.2 | (76.0) |
| Depreciation and amortization | 81.5 | 76.6 | 82.3 | 223.9 | 233.6 |
| Share in the results of associates | (5.8) | (4.4) | (5.4) | (15.1) | (16.5) |
| Net financial results | 45.5 | 27.9 | 41.5 | 74.0 | 227.9 |
| Income tax benefit (expense) | 38.0 | 23.2 | 42.8 | 90.7 | 19.3 |
| EBITDA | 259.5 | 136.5 | 167.0 | 515.7 | 388.2 |
| Changes in fair value of offtake agreement (2) | 4.5 | 2.4 | 2.5 | 17.3 | 21.5 |
| Impairment loss (reversal) of long-lived assets (3) | (106.5) | 2.0 | (17.6) | (104.2) | 25.4 |
| Ramp-up expenses of greenfield projects (Aripuanã) (4) | 0.0 | 0.0 | 0.0 | 0.0 | 25.2 |
| Impairment (reversal) of other assets (5) | 0.0 | 0.0 | 0.0 | 0.0 | 0.3 |
| Gain (Loss) on sale and write-off of property, plant and equipment (6) | 1.0 | (0.4) | 6.7 | 0.7 | 6.9 |
| Remeasurement in estimates of asset retirement obligations (7) | 1.3 | 6.9 | 5.1 | 9.0 | 22.5 |
| Remeasurement adjustment of streaming agreement (8) | 24.6 | 0.0 | 21.1 | 24.6 | 21.1 |
| Changes in fair value of energy forward contracts (9) | (4.5) | 3.1 | (3.6) | (7.6) | (11.8) |
| Tax voluntary disclosure – Value added tax ("VAT") matters (10) | 0.0 | 0.0 | 0.0 | 0.0 | 0.0 |
| Other restoration obligations (11) | 0.0 | 0.2 | (0.0) | 0.1 | 1.1 |
| Divestment and restructuring (12) | 0.0 | 0.0 | (4.7) | 0.0 | 0.9 |
| Dividends received in cash (13) | 6.1 | 10.1 | 6.5 | 16.2 | 16.2 |
| Adjusted EBITDA (1) | 186.1 | 160.6 | 182.9 | 471.9 | 517.4 |
(1) Adjusted EBITDA excludes the items presented above in the “Net Income (Loss) reconciliation to Adjusted EBITDA.” For details on segment definition and accounting policy, please refer to explanatory note 2 – “Information by business segment” in the “Condensed consolidated interim financial statements at and for the three and nine-month periods ended on September 30, 2025.”
| | 14 |
Earnings Release 3Q25 | |
(2) Non-cash adjustment: Derivative financial instrument related to the “Offtake agreement”.
(3) Non-cash adjustment: Cash generating unit and individual PP&E assets impairment loss (reversal). Please refer to “Others – Impairment” section in this Earnings Release for further details.
(4) Expenses related to pre-operating and ramp-up expenses incurred during the commissioning and ramp-up phases of greenfield projects which have not achieved their expected production capacity. Commencing in July 2024, these effects were no longer included since, at the end of June 2024 it reached the final stage of its ramp-up phase, transitioning to an ongoing operation.
(5) Non-cash adjustment: Value-added-taxes impairment loss.
(6) Non-cash adjustment: Results from sale and disposal of certain non-current assets.
(7) Non-cash adjustment: Asset retirement obligation remeasurement of discount rate and updated studies that are not subject to capitalization.
(8) Non-cash adjustment: Remeasurement of contractual obligation related to the forward sale contract of Cerro Lindo's Silver contained in the ore.
(9) Non-cash adjustment: The fair value adjustment of the energy surplus resulting from electric energy purchase contracts of our subsidiary, Pollarix and Nexa Energy.
(10) Expenses related to the impact of accruals related to VAT matters.
(11) Non-cash adjustment: Expenses related to the remeasurement of provision related to estimated costs of anticipated additional obligations in relation to certain inactive industrial waste containment structures in Brazil that have been closed for more than 20 years and that do not contain mining tailings, water or liquid waste.
(12) Expenses related to the effects of obligations of restructuring and divestment related to assets held for sale.
(13) Amount in cash dividend received from associates (currently, Enercan is our only associate), as our management considers this dividend part of the analysis of our energy costs.
Net financial results
Net financial results for 3Q25 amounted to a loss of US$46 million compared to a loss of US$28 million in 2Q25. This increase was primarily driven by lower foreign exchange gains, reflecting the 3% appreciation of the Brazilian real against the U.S. dollar[3], and by higher financial expenses associated with interest on other liabilities, following the reclassification of a VAT provision reversal to accounts payable. These effects were partially offset by higher financial income, mainly due to monetary adjustments recorded during the quarter in connection with provisions for uncertain income tax positions.
Foreign exchange variations had a positive impact of US$18 million in 3Q25 compared to US$32 million in 2Q25.
Excluding foreign exchange effects, net financial results totaled US$65 million in 3Q25, up from US$60 million in the previous quarter.
| US$ thousand | 3Q25 | 2Q25 | 3Q24 |
| Financial income | 7,171 | 5,505 | 6,206 |
| Financial expenses | (78,495) | (73,669) | (59,871) |
| Other financial items, net | 25,788 | 40,304 | 12,205 |
| Foreign exchange gain (loss) | 19,777 | 32,234 | 11,384 |
| Net financial result | (45,536) | (27,860) | (41,460) |
| Net financial result excluding FX | (65,313) | (60,094) | (52,844) |
Net Income (Loss)
In 3Q25, net income amounted to US$100 million compared to a net income of US$6 million in 3Q24 and US$13 million in 2Q25. The quarter-over-quarter increase was primarily driven by a non-cash impairment reversal of long-lived assets at Cerro Pasco. These positive effects were partially offset by the 3% appreciation of the Brazilian real against the U.S. dollar. In 9M25, net income totaled US$142 million versus a net loss of US$76 million in 9M24.
[3] In 3Q25, the Brazilian real / U.S. dollar (end of period) exchange rate was R$5.318 compared to R$5.457 in 2Q25.
| | 15 |
Earnings Release 3Q25 | |
Net Income attributable to Nexa’s shareholders was US$69 million in 3Q25, bringing the 9M25 total to US$82 million. This resulted in basic and diluted earnings per share of US$0.52 in the quarter and US$0.62 in 9M25.
Excluding miscellaneous adjustments, adjusted net income for the quarter was US$27 million, totaling US$98 million in 9M25, as detailed in the Net Income (Loss) reconciliation to Adjusted EBITDA section.
Adjusted Net loss attributable to Nexa’s shareholders amounted to US$4 million in 3Q25, corresponding to adjusted basic and diluted loss per share of US$0.03, while an adjusted net income attributable to Nexa’s shareholders of US$33 million was recorded in 9M25, resulting in adjusted earnings per share of US$0.25 in 9M25.
| US$ million (except where otherwise indicated) |
3Q25 | 2Q25 | 3Q24 | 9M25 | 9M24 |
| Net Income (loss) | 100.1 | 13.3 | 6.0 | 142.2 | (76.0) |
| Attributable to Nexa's shareholders | 69.3 | 1.1 | (5.2) | 82.3 | (106.5) |
| Attributable to non-controlling interests | 30.8 | 12.2 | 11.1 | 59.9 | 30.5 |
| Basic and diluted earnings (loss) per share | 0.52 | 0.01 | (0.04) | 0.62 | (0.80) |
| Miscellaneous adjustments (1) | (73.4) | 24.1 | 15.9 | (43.8) | 129.2 |
| Attributable to Nexa's shareholders | (72.9) | 13.9 | 8.7 | (49.5) | 108.2 |
| Attributable to non-controlling interests | (0.5) | 10.2 | 7.1 | 5.7 | 21.0 |
| Basic and diluted miscellaneous adjustments per share | (0.55) | 0.10 | 0.07 | (0.37) | 0.82 |
| Adjusted net income | 26.8 | 37.4 | 21.9 | 98.4 | 53.2 |
| Attributable to Nexa's shareholders | (3.5) | 15.0 | 3.6 | 32.8 | 1.6 |
| Attributable to non-controlling interests | 30.3 | 22.5 | 18.3 | 65.6 | 51.5 |
| Weighted average number of outstanding shares - in thousand | 132,439 | 132,439 | 132,439 | 132,439 | 132,439 |
| Adjusted basic and diluted earnings (loss) per share | (0.03) | 0.11 | 0.03 | 0.25 | 0.01 |
(1) Miscellaneous adjustments include: (i)
Changes in fair value of the offtake agreement; (ii) Impairment loss (reversal) of long-lived assets; (iii) Ramp-up expenses of greenfield
projects (Aripuanã); (iv) Impairment (reversal) of other assets; (v) Gain (loss) on sale and write-off of property, plant and equipment;
(vi) Remeasurement in estimates of asset retirement obligations; (vii) Remeasurement adjustment of streaming agreement; (viii) Changes
in fair value of energy forward contracts; (ix) Tax voluntary disclosure – VAT matters; (x) Other restoration obligations; (xi)
Divestment and restructuring; and (xii) Dividends received in cash.
| | 16 |
Earnings Release 3Q25 | |
Business Performance
Mining segment
| Consolidated | 3Q25 | 2Q25 | 3Q24 | 3Q25 vs. 3Q24 | 9M25 | 9M24 | 9M25 vs. 9M24 | |
| Ore Mined | kt | 3,305 | 3,321 | 3,426 | (3.5%) | 9,610 | 9,904 | (3.0%) |
| Treated Ore | kt | 3,382 | 3,285 | 3,381 | 0.0% | 9,715 | 10,055 | (3.4%) |
| Grade | ||||||||
| Zinc | % | 2.85 | 2.64 | 2.90 | (4 bps) | 2.71 | 2.97 | (26 bps) |
| Copper | % | 0.34 | 0.36 | 0.36 | (2 bps) | 0.34 | 0.35 | (1 bps) |
| Lead | % | 0.67 | 0.59 | 0.65 | 2 bps | 0.60 | 0.67 | (7 bps) |
| Silver | oz/t | 1.15 | 1.07 | 1.14 | 0.6% | 1.09 | 1.14 | (4.1%) |
| Gold | oz/t | 0.006 | 0.005 | 0.006 | (0.8%) | 0.005 | 0.006 | (9.1%) |
| Production | metal contained | ||||||||
| Zinc | kt | 83.7 | 73.5 | 82.7 | 1.2% | 224.5 | 253.5 | (11.4%) |
| Copper | kt | 8.6 | 9.1 | 9.3 | (7.8%) | 25.3 | 26.6 | (4.7%) |
| Lead | kt | 17.6 | 15.2 | 17.0 | 3.3% | 45.4 | 52.0 | (12.5%) |
| Silver | MMoz | 2.9 | 2.7 | 2.9 | 0.8% | 8.0 | 8.7 | (8.2%) |
| Gold | koz | 10.0 | 8.9 | 9.3 | 7.0% | 27.2 | 26.6 | 2.5% |
| Zinc Equivalent (1) | kt | 163.5 | 149.9 | 163.7 | (0.1%) | 446.8 | 492.2 | (9.2%) |
(1) Consolidated mining production in kt of zinc equivalent is calculated by converting copper, lead, silver, and gold contents to a zinc equivalent grade, assuming 2024 LME average prices: Zn: US$1.26/lb; Cu: US$4.15/lb; Pb: US$0.94/lb; Ag: US$28.3/oz; Au: US$2,386/oz.
In 3Q25, treated ore volume was 3,382kt, remaining broadly stable year-over-year. Strong performances were recorded at Aripuanã (+2.3%), Cerro Lindo (+1.6%), and El Porvenir (+1.5%), while Atacocha performance (-8%) was impacted by a short illegal blockade in early August, and Vazante (-2.3%) which continues to recover from the geotechnical constraints experienced in the first half of the year.
Zinc head grade averaged 2.85%, a slight decrease of 4bps year-over-year. Copper grade averaged 0.34%, (down 2bps), while lead grade increased to 0.67% (up 2bps), and silver grade remained relatively stable at 1.15 oz/t.
Zinc production increased 1% to 84kt, supported by higher output at Aripuanã and El Porvenir. This was partially offset by lower production at Vazante and Cerro Lindo, while Atacocha remained flat.
Lead production rose 3% to 18kt, following the same trend, while copper production fell 8% to 9kt, primarily due to lower output at Cerro Lindo. As a result, zinc equivalent production remained stable at 164 kt.
On a quarterly basis, treated ore volume increased by 3%, as a significant growth at Aripuanã (+39%), El Porvenir (+7%), and Vazante (+1%), which together more than offset lower volumes from Cerro Lindo (-3%) and Atacocha (-5%).
Metal grades improved overall compared to 2Q25, except for copper, which decreased by 2bps. Zinc grade rose by 22bps, while lead and silver grades increased by 8bps and 7%, respectively.
Zinc production rose 14% quarter-over-quarter to 84kt, mainly driven by stronger performances at Vazante and Aripuanã. Lead production increased 16% to 18kt, supported by higher output across all mines. Copper production decreased by 6% to 9kt, reflecting lower output at Cerro Lindo.
| | 17 |
Earnings Release 3Q25 | |
Consequently, zinc equivalent production increased by 9% to 164kt, reflecting sequential improvements across our assets.
In 9M25, treated ore volume totaled 9,715kt, down 3% compared to 9M24. Zinc average grade declined by 26bps to 2.71%, leading to total zinc production of 225kt, 11% lower than in 9M24. Copper production decreased by 5% to 27kt, and lead production fell 13% to 45kt. Zinc equivalent production for the first nine months of the year totaled 447kt, down 11%, mainly reflecting lower grades and volumes.
Cerro Lindo, Peru
| Cerro Lindo (100% basis) |
3Q25 | 2Q25 | 3Q24 | 3Q25 vs. 3Q24 | 9M25 | 9M24 | 9M25 vs. 9M24 | |
| Ore Mined | kt | 1,593 | 1,640 | 1,593 | 0.0% | 4,721 | 4,534 | 4.1% |
| Treated Ore | kt | 1,586 | 1,630 | 1,560 | 1.6% | 4,714 | 4,503 | 4.7% |
| Grade | ||||||||
| Zinc | % | 1.57 | 1.60 | 1.67 | (10 bps) | 1.50 | 1.80 | (30 bps) |
| Copper | % | 0.50 | 0.52 | 0.56 | (6 bps) | 0.51 | 0.58 | (7 bps) |
| Lead | % | 0.25 | 0.22 | 0.30 | (5 bps) | 0.22 | 0.35 | (13 bps) |
| Silver | oz/t | 0.89 | 0.78 | 0.89 | 0.4% | 0.82 | 0.98 | (16.4%) |
| Gold | oz/t | 0.002 | 0.002 | 0.003 | (37.8%) | 0.002 | 0.003 | (37.4%) |
| Production | metal contained | ||||||||
| Zinc | kt | 22.3 | 23.3 | 23.1 | (3.5%) | 62.6 | 71.5 | (12.5%) |
| Copper | kt | 6.8 | 7.2 | 7.5 | (9.7%) | 20.3 | 21.8 | (6.6%) |
| Lead | kt | 2.9 | 2.5 | 3.7 | (20.6%) | 7.5 | 11.9 | (37.2%) |
| Silver | MMoz | 1.1 | 0.9 | 1.1 | 0.7% | 2.9 | 3.4 | (15.1%) |
| Gold | koz | 1.0 | 1.0 | 1.3 | (20.1%) | 3.1 | 3.5 | (11.0%) |
| Zinc sales | kt | 20.4 | 22.7 | 24.1 | (15.2%) | 60.0 | 71.3 | (15.8%) |
| Costs | ||||||||
| Cost of sales | US$ mm | 81.6 | 79.3 | 88.5 | (7.8%) | 242.2 | 266.2 | (9.0%) |
| Cost ROM (2) | US$/t | 38.8 | 37.9 | 40.5 | (4.4%) | 39.1 | 42.6 | (8.2%) |
| Cash cost (1) | US$/lb | (0.98) | (0.61) | (0.36) | 170.1% | (0.68) | (0.39) | 72.1% |
| Sustaining cash cost (1) | US$/lb | (0.68) | (0.35) | (0.15) | 346.3% | (0.39) | (0.20) | 99.9% |
| CAPEX | US$ mm | |||||||
| Sustaining | 12.7 | 12.7 | 11.0 | 16.2% | 37.0 | 30.9 | 19.6% | |
| Other | 0.6 | 0.3 | 0.2 | 299.5% | 0.9 | 0.2 | 313.7% | |
| | 18 |
Earnings Release 3Q25 | |
(1) Our cash cost and sustaining cash cost are net of by-products credits, measured with respect to zinc sold per mine. For a cash cost reconciliation to COGS, please refer to Appendix – All in Sustaining Cash Cost | Mining.
(2) Our cost per ROM is measured with respect to treated ore volume. Refer to “Use of Non-IFRS Financial Measures” for further information.
In 3Q25, treated ore volume totaled 1,586kt, up 2% year-over-year and down 3% quarter-over-quarter.
Zinc production of 22kt declined 3% and 4% from 3Q24 and 2Q25, respectively, in line with the mine sequencing plan as operations progressed through lower-grade zones.
The average zinc grade was 1.57%, down by 10bps year-over-year and 3bps quarter-over-quarter.
Copper production totaled 6.8kt, down 10% from 3Q24 and 6% from 2Q25, primarily due to lower grades. The average copper grade was 0.50% versus 0.56% in 3Q24 and 0.52% in 2Q25, with an increase expected in the upcoming quarter.
Lead production was 3kt, down 21% year-over-year, also reflecting lower grades. Compared to 2Q25, lead output increased by 16%, supported by access to higher-grade mining zones.
In the first nine months of 2025, zinc production totaled 63kt, down by 12% compared to the same period a year ago. Copper output declined by 7% to 20kt, while lead production decreased 37% to 7kt, both attributed to lower average grades.
Cost
Run-of-mine cost was US$39/t in the quarter, a decrease of 4% year-over-year, mainly driven by higher treated ore volumes, lower maintenance and personnel costs. Compared to 2Q25, the cost slightly increased by 2% due to lower treated ore volumes and higher fixed costs, primarily related to maintenance and personnel expenses in the period.
Cash cost net of by-products was US$(0.98)/lb in 3Q25, a significant improvement from US$(0.36)/lb in 3Q24 and US$(0.61)/lb in 2Q25, reflecting higher by-products contribution.
CAPEX
In 3Q25, sustaining capital expenditures amounted to US$13 million, primarily allocated to mine development activities, totaling US$37 million in 9M25.
El Porvenir, Peru
| El Porvenir (100% basis) |
3Q25 | 2Q25 | 3Q24 | 3Q25 vs. 3Q24 | 9M25 | 9M24 | 9M25 vs. 9M24 | |
| Ore Mined | kt | 572 | 536 | 571 | 0.3% | 1,620 | 1,638 | (1.1%) |
| Treated Ore | kt | 572 | 537 | 564 | 1.5% | 1,618 | 1,631 | (0.8%) |
| Grade | ||||||||
| Zinc | % | 2.85 | 2.86 | 2.58 | 27 bps | 2.79 | 2.63 | 15 bps |
| Copper | % | 0.17 | 0.16 | 0.14 | 3 bps | 0.16 | 0.15 | 2 bps |
| Lead | % | 1.41 | 1.52 | 1.35 | 6 bps | 1.42 | 1.41 | 1 bps |
| Silver | oz/t | 2.50 | 2.53 | 2.34 | 6.6% | 2.46 | 2.41 | 2.2% |
| Gold | oz/t | 0.010 | 0.009 | 0.009 | 6.9% | 0.009 | 0.010 | (0.8%) |
| Production | metal contained | ||||||||
| Zinc | kt | 14.4 | 13.6 | 12.8 | 12.1% | 39.8 | 37.8 | 5.5% |
| | 19 |
Earnings Release 3Q25 | |
| El Porvenir (100% basis) |
3Q25 | 2Q25 | 3Q24 | 3Q25 vs. 3Q24 | 9M25 | 9M24 | 9M25 vs. 9M24 | |
| Copper | kt | 0.1 | 0.1 | 0.1 | 25.2% | 0.3 | 0.2 | 13.0% |
| Lead | kt | 6.9 | 7.0 | 6.4 | 7.8% | 19.6 | 19.3 | 1.4% |
| Silver | MMoz | 1.2 | 1.2 | 1.1 | 10.1% | 3.4 | 3.3 | 2.8% |
| Gold | koz | 2.2 | 2.0 | 1.8 | 24.8% | 6.0 | 5.6 | 6.6% |
| Zinc sales | kt | 14.7 | 13.2 | 12.6 | 16.4% | 39.9 | 37.4 | 6.8% |
| Costs | ||||||||
| Cost of sales | US$ mm | 50.6 | 44.8 | 51.2 | (1.3%) | 134.5 | 150.4 | (10.6%) |
| Cost ROM (2) | US$/t | 62.5 | 63.3 | 63.1 | (1.0%) | 62.4 | 63.6 | (1.8%) |
| Cash cost (1) | US$/lb | (0.49) | (0.39) | 0.18 | (371.3%) | (0.34) | 0.13 | (367.1%) |
| Sustaining cash cost (1) | US$/lb | 0.17 | 0.50 | 0.52 | (66.4%) | 0.32 | 0.69 | (53.9%) |
| CAPEX | US$ mm | |||||||
| Sustaining | 21.4 | 25.8 | 9.1 | 136.1% | 57.8 | 46.3 | 25.0% | |
| Other | (0.0) | 0.1 | 0.3 | (100.1%) | 0.1 | 0.3 | (72.1%) | |
(1) Our cash cost and sustaining cash cost are net of by-products credits, measured with respect to zinc sold per mine. For a cash cost reconciliation to COGS, please refer to Appendix – All in Sustaining Cash Cost | Mining.
(2) Our cost per ROM is measured with respect to treated ore volume. Refer to “Use of Non-IFRS Financial Measures” for further information.
In 3Q25, treated ore volume reached 572kt, up 2% and 7% year-over-year and quarter-over-quarter, respectively. This improvement was attributed to stable operational performance and full recovery from rainfall impacts experienced earlier in the year.
Zinc production totaled 14kt in the quarter, up 12% from 3Q24 and 6% from 2Q25, mainly driven by higher ore processing volumes and improved grades in the period.
Lead production increased by 8% from 3Q24 and decreased by 2% from 2Q25. Silver output rose 10% year-over-year and 5% quarter-over-quarter, reflecting access to higher-grade areas.
In the first nine months of 2025, zinc production totaled 40kt, up 5% compared to the same period in 2024. Lead production slightly decreased by 1% to 20kt, and silver output declined 3% to 3.4MMoz, both reflecting expected grade variability.
Cost
Run-of-mine cost was US$63/t in the quarter, down 1% compared to both 3Q24 and 2Q25. This was driven by higher treated ore volumes, partially offset by increased costs for drilling and blasting services.
Cash cost net of by-products in 3Q25 significantly decreased to US$(0.49)/lb compared to US$0.18/lb in 3Q24 and US$(0.39)/lb in 2Q25. This improvement was primarily driven by higher by-products contribution and increased zinc sales volume.
CAPEX
In 3Q25, sustaining capital expenditures reached US$21 million, primarily attributed to mine development activities and ongoing civil works for Phase I of the Cerro Pasco Integration Project, totaling US$58 million in 9M25.
| | 20 |
Earnings Release 3Q25 | |
Atacocha, Peru
| Atacocha (100% basis) |
3Q25 | 2Q25 | 3Q24 | 3Q25 vs. 3Q24 | 9M25 | 9M24 | 9M25 vs. 9M24 | |
| Ore Mined | kt | 366 | 383 | 365 | 0.2% | 1,061 | 1,090 | (2.7%) |
| Treated Ore | kt | 366 | 383 | 398 | (8.0%) | 1,061 | 1,123 | (5.5%) |
| Grade | ||||||||
| Zinc | % | 0.98 | 0.98 | 0.98 | (0 bps) | 0.98 | 0.91 | 7 bps |
| Lead | % | 1.17 | 1.03 | 1.14 | 2 bps | 1.03 | 0.96 | 7 bps |
| Silver | oz/t | 1.04 | 0.97 | 1.18 | (11.6%) | 0.96 | 1.07 | (10.1%) |
| Gold | oz/t | 0.013 | 0.011 | 0.012 | 6.2% | 0.012 | 0.010 | 16.0% |
| Production | metal contained | ||||||||
| Zinc | kt | 2.9 | 3.1 | 2.9 | (1.1%) | 8.5 | 7.7 | 10.2% |
| Lead | kt | 3.8 | 3.4 | 3.9 | (4.8%) | 9.5 | 9.2 | 3.0% |
| Silver | MMoz | 0.3 | 0.3 | 0.4 | (12.4%) | 0.8 | 0.9 | (9.7%) |
| Gold | koz | 2.9 | 2.6 | 2.9 | 1.0% | 7.5 | 6.4 | 17.2% |
| Zinc sales | kt | 3.0 | 3.0 | 3.0 | (3.0%) | 8.5 | 7.5 | 12.4% |
| Costs | ||||||||
| Cost of sales | US$ mm | 22.6 | 23.6 | 28.3 | (20.3%) | 66.4 | 61.2 | 8.6% |
| Cost ROM (2) | US$/t | 37.4 | 34.6 | 35.2 | 6.3% | 37.1 | 33.8 | 9.8% |
| Cash cost (1) | US$/lb | (2.37) | (0.87) | (0.93) | 154.1% | (1.26) | (0.69) | 81.7% |
| Sustaining cash cost (1) | US$/lb | (1.86) | (0.28) | (0.50) | 273.5% | (0.75) | (0.06) | 1,151.3% |
| CAPEX | US$ mm | |||||||
| Sustaining | 3.2 | 3.9 | 2.9 | 12.7% | 9.4 | 10.5 | (9.9%) | |
| Other | 0.1 | 0.0 | 0.0 | 87.4% | 0.1 | 0.0 | 125.4% | |
(1) Our cash cost and sustaining cash cost are net of by-products credits, measured with respect to zinc sold per mine. For a cash cost reconciliation to COGS, please refer to Appendix – All in Sustaining Cash Cost | Mining.
(2) Our cost per ROM is measured with respect to treated ore volume. Refer to “Use of Non-IFRS Financial Measures” for further information.
In 3Q25, treated ore volume totaled 366kt, down 8% year-over-year and 5% quarter-over-quarter. This performance was affected by an illegal blockade that lasted less than one week and restricted access to the mine, as disclosed in our press release dated August 12, 2025. Despite this temporary disruption, our full-year production guidance remains unchanged.
Zinc production totaled 2.9kt, remaining relatively flat compared to 3Q24 and down 6% from 2Q25, reflecting lower treated ore volumes, while the average zinc grade remained steady at 0.98%.
| | 21 |
Earnings Release 3Q25 | |
Lead production reached 3.8kt, down 5% from year-over-year and up 10% quarter-over-quarter. Silver production totaled 327koz, down 12% year-over-year, primarily due to lower grades. Compared to 2Q25, silver production increased by 6%, supported by improved silver grades during the period.
In the first nine months of 2025, treated ore volume totaled 1,061kt, down 6% compared to the same period last year, primarily due to the weather-related impacts in 1Q25 and a temporary blockade this quarter. Despite these challenges, zinc and lead production increased by 10% and 3%, reaching 8.5kt and 9.5kt, respectively, while silver production decreased by 10% to 842koz.
Cost
Run-of-mine mining cost was US$37/t in the quarter, up 6% from 3Q24 and 8% from 2Q25, primarily driven by lower treated ore volumes and higher operational costs, mainly related to mineral transportation, maintenance activities, and expenses incurred to resume production following the blockade.
Cash cost net of by-products was US$(2.37)/lb in 3Q25, improving significantly by US$1.44/lb from 3Q24 and by US$1.50/lb from 2Q25. These gains were supported by higher by-products prices.
CAPEX
In 3Q25, sustaining capital expenditures amounted to US$3 million, primarily related for road infrastructure investments, totaling US$9 million in 9M25.
Vazante, Brazil
| Vazante (100% basis) |
3Q25 | 2Q25 | 3Q24 | 3Q25 vs. 3Q24 | 9M25 | 9M24 | 9M25 vs. 9M24 | |
| Ore Mined | kt | 410 | 403 | 384 | 6.6% | 1,173 | 1,139 | 3.0% |
| Treated Ore | kt | 439 | 434 | 449 | (2.3%) | 1,303 | 1,320 | (1.3%) |
| Grade | ||||||||
| Zinc | % | 8.91 | 7.69 | 9.39 | (48 bps) | 8.30 | 9.37 | (107 bps) |
| Lead | % | 0.28 | 0.29 | 0.29 | (1 bps) | 0.29 | 0.28 | 1 bps |
| Silver | oz/t | 0.53 | 0.57 | 0.62 | (15.5%) | 0.58 | 0.61 | (4.1%) |
| Production | metal contained | ||||||||
| Zinc | kt | 33.7 | 27.4 | 36.4 | (7.3%) | 90.9 | 106.8 | (14.8%) |
| Lead | kt | 0.2 | 0.2 | 0.3 | (34.3%) | 0.6 | 0.7 | (18.2%) |
| Silver | MMoz | 0.1 | 0.1 | 0.1 | (15.8%) | 0.3 | 0.4 | (19.6%) |
| Zinc sales | kt | 33.7 | 27.4 | 36.4 | (7.3%) | 90.9 | 106.8 | (14.8%) |
| Costs | ||||||||
| Cost of sales | US$ mm | 35.6 | 34.2 | 31.0 | 14.7% | 100.5 | 95.8 | 4.9% |
| Cost ROM (2) | US$/t | 53.2 | 51.0 | 51.7 | 3.0% | 48.5 | 48.9 | (0.8%) |
| Cash cost (1) | US$/lb | 0.45 | 0.56 | 0.48 | (6.2%) | 0.51 | 0.50 | 2.7% |
| Sustaining cash cost (1) | US$/lb | 0.53 | 0.68 | 0.54 | (2.3%) | 0.60 | 0.58 | 4.4% |
| | 22 |
Earnings Release 3Q25 | |
| Vazante (100% basis) |
3Q25 | 2Q25 | 3Q24 | 3Q25 vs. 3Q24 | 9M25 | 9M24 | 9M25 vs. 9M24 | |
| CAPEX | US$ mm | |||||||
| Sustaining | 5.0 | 6.3 | 4.8 | 4.9% | 16.6 | 18.1 | (8.2%) | |
| Other | 1.1 | 0.7 | 0.4 | 140.5% | 2.1 | 2.0 | 6.1% |
(1) Our cash cost and sustaining cash cost are net of by-products credits, measured with respect to zinc sold per mine. For a cash cost reconciliation to COGS, please refer to Appendix – All in Sustaining Cash Cost | Mining.
(2) Our cost per ROM is measured with respect to treated ore volume. Refer to “Use of Non-IFRS Financial Measures” for further information.
In 3Q25, treated ore volume totaled 439kt, down 2% year-over-year, as operations were partially restricted by the geotechnical constraints experienced in 1H25. Compared to 2Q25, treated ore volume increased by 1%, reflecting gradual operational improvements.
Zinc production totaled 34kt, down 7% from 3Q24, driven by mining activities in lower-grades areas. Compared to 2Q25, production rose by 23%, reflecting the ongoing recovery as access to higher-grade zones has been progressively restored and prioritized since June, resulting in improved plant performance.
The average zinc grade for the quarter was 8.91%, up 122bps from 2Q25 and down 48bps from 3Q24.
Lead production totaled 0.2kt compared to 0.3kt in 3Q24, remaining relatively flat quarter-over-quarter. Silver production reached 0.1MMoz, down 16% year-over-year and up 15% quarter-over-quarter, supported by higher grades in the period.
For 9M25, treated ore volume totaled 1,303kt, down 1% from the same period of last year. Zinc production declined by 15% to 91kt (from 107kt in 9M24), mainly reflecting the operational challenges experienced in 1H25.
Cost
Run-of-mine mining cost was US$53/t in 3Q25, increased by 3% compared to US$52/t in 3Q24 and 4% compared to US$51/t in 2Q25. This result was mainly attributed to higher maintenance activities, higher variable costs, and unfavorable foreign exchange variations.
Cash cost net of by-products was US$0.45/lb in 3Q25, down 6% compared to 3Q24, mainly driven by lower TCs and higher by-product price contributions, partially offset by lower zinc sales volumes. Compared to 2Q25, cash cost decreased by 20%, reflecting higher zinc sales volumes and stronger by-products price contribution following improved grades.
CAPEX
In 3Q25, sustaining capital expenditures amounted to US$5 million, mainly allocated to mine development activities, totaling US$17 million in 9M25.
Aripuanã, Brazil
| Aripuanã (100% basis) |
3Q25 | 2Q25 | 3Q24 | 3Q25 vs. 3Q24 | 9M25 | 9M24 | 9M25 vs. 9M24 | |
| Ore Mined | kt | 365 | 358 | 513 | (28.9%) | 1,034 | 1,171 | (11.6%) |
| Treated Ore | kt | 420 | 301 | 410 | 2.3% | 1,020 | 1,099 | (7.2%) |
| Grade | ||||||||
| Zinc | % | 3.04 | 2.70 | 2.77 | 27 bps | 2.84 | 2.94 | (10 bps) |
| | 23 |
Earnings Release 3Q25 | |
| Aripuanã (100% basis) |
3Q25 | 2Q25 | 3Q24 | 3Q25 vs. 3Q24 | 9M25 | 9M24 | 9M25 vs. 9M24 | |
| Copper | % | 0.60 | 0.77 | 0.59 | 1 bps | 0.64 | 0.60 | 4 bps |
| Lead | % | 1.20 | 0.79 | 0.92 | 28 bps | 0.98 | 0.98 | 0 bps |
| Silver | oz/t | 1.02 | 0.86 | 0.98 | 3.8% | 0.95 | 0.99 | (4.4%) |
| Gold | oz/t | 0.014 | 0.016 | 0.012 | 18.7% | 0.016 | 0.018 | (13.2%) |
| Production | metal contained | ||||||||
| Zinc | kt | 10.4 | 6.1 | 7.5 | 38.7% | 22.7 | 22.4 | 1.6% |
| Copper | kt | 1.7 | 1.8 | 1.7 | (0.8%) | 4.7 | 4.5 | 3.9% |
| Lead | kt | 3.8 | 2.1 | 2.7 | 41.2% | 8.3 | 8.5 | (2.5%) |
| Silver | MMoz | 0.2 | 0.2 | 0.3 | (11.6%) | 0.6 | 0.8 | (17.8%) |
| Gold | koz | 3.8 | 3.4 | 3.4 | 12.9% | 10.7 | 11.1 | (3.7%) |
| Zinc sales | kt | 10.4 | 6.1 | - | - | 22.7 | - | - |
| Costs | ||||||||
| Cost of sales | US$ mm | 57.1 | 50.7 | - | - | 155.1 | - | - |
| Cost ROM (2) | US$/t | 87.3 | 109.0 | - | - | 89.5 | - | - |
| Cash cost (1) | US$/lb | 0.20 | 0.33 | - | - | 0.49 | - | - |
| Sustaining cash cost (1) | US$/lb | 1.11 | 1.62 | - | - | 1.37 | - | - |
| CAPEX | US$ mm | |||||||
| Sustaining | 21.1 | 17.3 | 5.9 | 254.2% | 43.4 | 30.0 | 44.6% | |
| Other | 0.0 | 0.0 | 2.0 | (99.1%) | 0.2 | 2.6 | (92.4%) | |
(1) Our cash cost and sustaining cash cost are net of by-products credits, measured with respect to zinc sold per mine. For a cash cost reconciliation to COGS, please refer to Appendix – All in Sustaining Cash Cost | Mining.
(2) Our cost per ROM is measured with respect to treated ore volume. Refer to “Use of Non-IFRS Financial Measures” for further information.
In 3Q25, treated ore volume reached 420kt, up 2% from 410kt in 3Q24 and 39% from 301kt in 2Q25. Utilization capacity averaged 74% in the period compared to 53% in 2Q25, with peak daily rates occasionally exceeding 90%.
Zinc production rose to 10.4kt, up 39% from 7.5kt in 3Q24 and 70% from 6.1kt in 2Q25, marking a quarterly record. The improvement reflected reduced plant downtime and greater operational reliability, particularly in the tailing’s filtration area. Zinc recovery averaged 82%, versus 66% in 3Q24 and 75% in 2Q25.
Copper production totaled 1.7kt in 3Q25, down 1% from year-over-year and 6% quarter-over-quarter, reflecting lower feed rates. Copper recovery stood at 68% compared to 72% in 3Q24 and 79% in 2Q25, mainly due to lower processed copper grades in the quarter.
In 9M25, zinc production totaled 23kt, up 2% from the same period last year, while copper output reached 4.7kt compared to 4.5kt in 9M24. Lead production totaled 8.3kt, slightly below 8.5kt in the same period last year.
| | 24 |
Earnings Release 3Q25 | |
The quarter was marked by continued progress in plant stability and a reduction in workforce turnover, reflecting our ongoing focus on several optimization fronts. Among these, the tailings filtration system remains an important element in improving reliability. The fourth tailings filter has arrived in Brazil, cleared customs and is currently in transit to site. Delivery is anticipated by early November, with installation scheduled to begin in 4Q25 as civil works advance on plan. Commissioning is targeted for 1H26, with nameplate capacity expected in 2H26. Once operational, this critical addition is expected to gradually enhance overall stability, particularly during seasonal rainfall, together with other ongoing initiatives such as workforce development and dry-stacking improvements.
Cost
Run-of-mine mining cost averaged US$87/t in 3Q25, down 20% from US$109/t in 2Q25. This notable result was primarily due to higher treated ore volume and lower operational costs, reflecting ongoing plant stabilization and cost optimization initiatives. Reductions were achieved mainly in maintenance, personnel, and auxiliary material expenses.
Cash cost net of by-products was US$0.20/lb in 2Q25, down US$0.13/lb compared to 2Q25. This decrease was primarily attributed to higher by-products price contributions, increased zinc sales volumes supported by improved grades, and stronger cost performance, partially offset by unfavorable exchange variations.
CAPEX
In 3Q25, sustaining capital expenditures amounted to US$21 million, mainly related to mine development, tailings storage facilities, and continued progress on the tailings filter expansion project, totaling US$43 million in 9M25.
Financial performance
| US$ million | 3Q25 | 2Q25 | 3Q24 | 3Q25 vs. 3Q24 | 9M25 | 9M24 | 9M25 vs. 9M24 | |
| Net Revenues | 371.6 | 353.3 | 324.7 | 14.4% | 1,038.1 | 996.0 | 4.2% | |
| Cost of Sales (1) | (236.3) | (231.3) | (247.4) | (4.5%) | (682.6) | (755.3) | (9.6%) | |
| Gross Profit | 135.3 | 122.0 | 77.3 | 75.0% | 355.6 | 240.7 | 47.7% | |
| Adjusted EBITDA | 164.0 | 134.8 | 128.1 | 28.0% | 392.5 | 342.3 | 14.7% | |
| Adjusted EBITDA Mrg. | 44.1% | 38.2% | 39.5% | 4.7pp | 37.8% | 34.4% | 3.5pp | |
Note: Financial performance pre-intersegment eliminations.
Net revenues for the mining segment totaled US$372 million in 3Q25, up 14% compared to 3Q24. This increase was primarily driven by higher LME prices (except for lead), higher sales volume (except for copper), and the positive impact of lower TCs. Compared to 2Q25, net revenues increased by 5%, mainly reflecting a sharp increase in sales volumes (except for copper), supported by stronger production at Vazante and Aripuanã, partially offset by the negative impact from the remeasurement adjustment related to the silver streaming agreement in Cerro Lindo.
In 9M25, net revenues totaled to US$1,038 million, 4% higher than the same period a year ago, driven by higher metal prices (except for lead) and lower TCs, partially offset by lower sales volumes.
Cost of sales in 3Q25 was US$236 million, down 4% compared to 3Q24. This decrease was mainly attributed to lower depreciation expenses of approximately US$7 million. Compared to 2Q25, cost of sales increased by 2%, primarily reflecting unfavorable foreign exchange variations and higher fixed and variable costs, while sales volumes remained broadly in line with the previous quarter.
In 9M25, cost of sales amounted to US$683 million, 10% lower compared to the same period a year ago, primarily reflecting lower sales volumes.
| | 25 |
Earnings Release 3Q25 | |
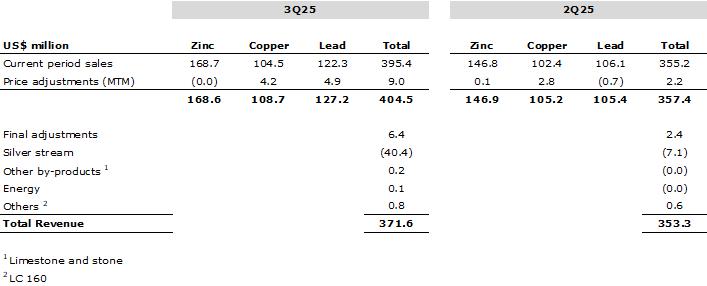
Reconciliation of realized prices
Revenues are recorded at provisional prices and, typically, an adjustment is then made after delivery, based on the pricing terms under the relevant contract. In addition, the difference between the provisional and the final price received is recognized by adjusting the price in the period in which the sale is concluded.
Adjusted EBITDA for the mining segment in 3Q25 totaled US$164 million, up 28% from US$128 million in 3Q24. This increase was primarily attributed to (i) higher by-products contribution of US$38 million, mainly reflecting stronger silver and gold prices; (ii) a positive net price effect of US$20 million, resulting from higher LME prices (except for lead) and (iii) lower TCs amounting to US$16 million. These positive effects were partially offset by (iv) a negative impact of US$12 million in other variations, reflecting higher environmental and tax provisions in Peru, as well as higher obsolescence and inventory provisions at Aripuanã, (v) higher costs of US$12 million, primarily in Aripuanã, reflecting maintenance, personnel, and auxiliary materials costs related to plant stabilization, along with higher workers’ participation in the Peruvian mines, (vi) a negative impact of US$7 million from lower sales volume at Cerro Lindo and Vazante, partially offset by higher zinc sales at El Porvenir and Aripuanã; and (vii) unfavorable foreign exchange variations totaling US$2 million.
Compared to 2Q25, Adjusted EBITDA increased by 22%. This performance was primarily driven by (i) higher by-products contribution of US$23 million, mainly reflecting stronger silver and gold prices; (ii) a positive net price impact of US$24 million, resulting from higher metal prices; and (iii) lower costs amounting US$3 million, mainly due to reduced operational expenses at Aripuanã. These positive effects were partially offset by (iv) a negative impact of US$10 million in other variations, mainly attributed to higher provisions for low inventory turnover at Aripuanã and Cerro Lindo, as well as higher
| | 26 |
Earnings Release 3Q25 | |
taxes provisions at Cerro Lindo and contingency provisions in Vazante; (v) a negative impact of US$4 million from lower sales volume, primarily due to reduced copper and zinc sales at Cerro Lindo, partially offset by higher sales volume at Vazante, Aripuanã El Porvenir; and (vi) unfavorable foreign exchange variations totaling US$4 million.
Run-of-mine cost, Cash cost and AISC[4]
| Consolidated cash cost | 3Q25 | 2Q25 | 3Q24 | 3Q25 vs. 3Q24 | 9M25 | 9M24 | 9M25 vs. 9M24 | |
| Run-of-mine mining cost | US$/t | 50.5 | 49.9 | 45.6 | 10.9% | 49.5 | 46.0 | 7.6% |
| Cash cost net of by-products | US$/t | (1,083) | (240) | (31) | 3,381.0% | (402) | 203 | (297.8%) |
| AISC | US$/t | 9 | 938 | 662 | (98.7%) | 639 | 1,044 | (38.9%) |
| Cash cost net of by-products | US$/lb | (0.49) | (0.11) | (0.01) | 3,381.0% | (0.18) | 0.09 | (297.8%) |
| AISC | US$/lb | 0.004 | 0.43 | 0.30 | (98.7%) | 0.29 | 0.47 | (38.9%) |
Note: Cash cost and AISC per ton sold does not include the impact of the cost of idleness capacity of US$1.2 million in 2Q25 and 9M25, and US$2.7 million in 9M24 in El Porvenir.
Run-of-mine mining cost averaged US$51/t in the quarter, up 11% year-over-year, mainly due to higher operational costs related to ongoing plant stabilization at Aripuanã. Excluding Aripuanã, run-of-mine mining cost of US$45/t remains broadly in line with 3Q24. Compared to previous quarter, run-of-mine cost was also stable, supported by continued operational discipline across our assets.
Cash cost net of by-products for the mining segment in 3Q25 decreased to US$(0.49)/lb compared to US$(0.01)/lb in 3Q24, primarily driven by higher by-products contribution from stronger prices and lower TCs. Compared to 2Q25, cash cost also decreased, reflecting both higher sales volume and increased by-products contribution.
AISC net of by-products in 3Q25 decreased to US$0.004/lb compared to US$0.30/lb in 3Q24 and US$0.43/lb in 2Q25, consistent with the improvement in cash costs.
For a reconciliation of cash cost and AISC net of by-products, please refer to the appendix section “All in Sustaining Cash Cost | Mining.”
[4] Our cash cost and AISC are net of by-products credits, measured with respect to zinc sold.
| | 27 |
Earnings Release 3Q25 | |
Smelting segment
| Consolidated | 3Q25 | 2Q25 | 3Q24 | 3Q25 vs. 3Q24 | 9M25 | 9M24 | 9M25 vs. 9M24 | |
| Production | ||||||||
| Zinc metal | kt | 137.3 | 129.4 | 143.5 | (4.3%) | 391.2 | 417.7 | (6.3%) |
| Zinc oxide | kt | 9.3 | 9.5 | 9.7 | (4.0%) | 27.1 | 26.2 | 3.5% |
| Total | kt | 146.6 | 138.9 | 153.2 | (4.3%) | 418.3 | 443.9 | (5.8%) |
| Sales | ||||||||
| Zinc metal | kt | 140.8 | 135.1 | 142.8 | (1.5%) | 398.2 | 413.1 | (3.6%) |
| Zinc oxide | kt | 9.3 | 10.0 | 10.1 | (7.9%) | 27.2 | 26.4 | 2.9% |
| Total | kt | 150.1 | 145.1 | 152.9 | (1.9%) | 425.3 | 439.5 | (3.2%) |
In 3Q25, total production (zinc metal and oxide) reached 147kt, down 4% year-over-year. This decrease is consistent with our 2025 sales guidance, which anticipated an annual reduction of approximately 15kt compared to 2024 as we navigate a more volatile zinc market environment and adjust to lower TCs. Sequentially, production rose 6%, driven by a record-high quarterly output at Cajamarquilla and operational recovery at Três Marias following prior hydrometallurgical challenges.
Zinc metal and oxide sales totaled 150kt in 3Q25, down 2% year-over-year, consistent with our 2025 sales guidance. Compared to 2Q25, total sales were up 3%, mainly driven by higher production volumes across all units, despite a market-driven decrease in zinc oxide output at Tres Marias.
Cajamarquilla, Peru
| Cajamarquilla (100% basis) |
3Q25 | 2Q25 | 3Q24 | 3Q25 vs. 3Q24 | 9M25 | 9M24 | 9M25 vs. 9M24 | |
| Zinc metal production | kt | 89.5 | 84.0 | 87.6 | 2.1% | 255.8 | 246.9 | 3.6% |
| Global Recovery | % | 93.0 | 94.3 | 94.4 | (143 bps) | 93.9 | 94.7 | (78 bps) |
| Zinc metal sales | kt | 89.3 | 87.2 | 86.9 | 2.8% | 257.6 | 243.3 | 5.9% |
| Zinc content in products | kt | 89.2 | 87.0 | 86.8 | 2.8% | 257.2 | 242.9 | 5.9% |
| Cost of sales (2) | US$ mm | 304 | 283 | 274 | 11.2% | 846 | 737 | 14.7% |
| (-) Raw material | (227) | (192) | (206) | 10.3% | (627) | (528) | 18.6% | |
| (+) By-product | (6.4) | (6.3) | (5.9) | 7.8% | (17.9) | (19.9) | (10.0%) | |
| (+/-) Consolidation effects | (14.4) | (35.3) | (0.2) | 6,841.4% | (52.7) | (26.6) | 98.5% | |
| (+) Others | 2.8 | 5.2 | (5.9) | (147.0%) | 17.5 | (12.4) | (241.0%) | |
| (=) Conversion cost | US$ mm | 59.1 | 54.5 | 55.7 | 6.1% | 166.1 | 150.1 | 210.6% |
| Conversion cost (3) | US$/lb | 0.30 | 0.28 | 0.29 | 3.2% | 0.29 | 0.28 | 4.5% |
| Cash cost (1) | US$/lb | 1.18 | 1.11 | 1.14 | 3.7% | 1.11 | 1.09 | 2.4% |
| Sustaining cash cost (1) | US$/lb | 1.24 | 1.17 | 1.19 | 4.1% | 1.17 | 1.15 | 1.4% |
| CAPEX | US$ mm | |||||||
| Sustaining | 11.0 | 10.9 | 8.7 | 26.4% | 29.4 | 31.8 | (7.6%) | |
| Other | 0.5 | 0.2 | 1.2 | (59.5%) | 1.0 | 2.4 | (55.8%) | |
| | 28 |
Earnings Release 3Q25 | |
(1) Our cash cost and sustaining cash cost are net of by-products credits, measured with respect to zinc sold per smelter. For a cash cost reconciliation to COGS, please refer to Appendix - Conversion and All in Sustaining Cash Cost | Smelting.
(2) Cost of sales does not include resale operations from third parties;
(3) Reclassification between lines items due to higher raw material costs in 2Q25, with no impact on cash cost C1.
In 3Q25, production at the Cajamarquilla smelter reached a record-high of 89kt, up 2% and 7% year-over-year and quarter-over-quarter, respectively. This performance reflected continued operational improvements and higher calcine availability, which enabled greater throughput during the period.
Recovery rates averaged 93.0% in the quarter, down from 94.4% in 3Q24 and 94.3% in 2Q25, resulted from a higher concentrate feed rate with increased levels of contaminants that impacts overall recovery, mainly from third-party concentrates.
Metal sales totaled 89kt in 2Q25, up 3% year-over-year and 2% quarter-over-quarter, driven by higher production volumes.
In 9M25, smelter production totaled 256kt, up 4% compared to 9M24. Smelter sales amounted to 258kt, up 6% from the same period last year.
Costs
In 3Q25, conversion cost was US$0.30/lb, up 3% compared to 3Q24, primarily driven by higher operational costs related to maintenance and personnel costs. Compared to 2Q25, conversion cost increased by 6% due to higher personnel and variable costs.
Cash cost net of by-products in 3Q25 was US$1.18/lb, up 4% from US$1.14/lb in 3Q24 and up 6% from 2Q25. This increase was mainly driven by the negative impact of higher zinc prices on raw materials costs, lower TCs and higher operational expenses, partially offset by increased by-products sales volume and prices.
CAPEX
In 3Q25, sustaining capital expenditures amounted to US$11 million, primarily related to equipment acquisitions, repairs, and other recurring operational needs, totaling US$29 million in 9M25.
Três Marias, Brazil
| Três Marias (100% basis) |
3Q25 | 2Q25 | 3Q24 | 3Q25 vs. 3Q24 | 9M25 | 9M24 | 9M25 vs. 9M24 | |
| Zinc metal production | kt | 30.4 | 28.5 | 35.8 | (15.2%) | 89.9 | 109.6 | (18.0%) |
| Zinc oxide production | kt | 9.3 | 9.5 | 9.7 | (4.0%) | 27.1 | 26.2 | 3.5% |
| Global Recovery | % | 87.6 | 87.7 | 90.6 | (296 bps) | 87.9 | 90.5 | (266 bps) |
| Zinc metal sales | kt | 32.7 | 29.5 | 37.2 | (12.1%) | 91.6 | 110.0 | (16.7%) |
| Zinc oxide sales | kt | 9.3 | 10.0 | 10.1 | (7.9%) | 27.2 | 26.4 | 2.9% |
| Zinc content in products | kt | 40.0 | 37.4 | 47.2 | (15.1%) | 113.0 | 135.5 | (16.6%) |
| Cost of sales (2) | US$ mm | 146 | 130 | 135 | 8.2% | 395 | 377 | 4.9% |
| (-) Raw material | (73) | (58) | (73) | (0.5%) | (195) | (196) | (0.3%) | |
| (+) By-product | (13.6) | (15.0) | (12.9) | 5.6% | (39.5) | (41.8) | (5.6%) |
| | 29 |
Earnings Release 3Q25 | |
| Três Marias (100% basis) |
3Q25 | 2Q25 | 3Q24 | 3Q25 vs. 3Q24 | 9M25 | 9M24 | 9M25 vs. 9M24 | |
| (+/-) Consolidation effects | (0.2) | 0.0 | (1.2) | (84.5%) | (0.3) | 0.3 | (200.2%) | |
| (+) Others | (27.3) | (25.0) | (15.1) | 80.9% | (71.4) | (51.3) | 39.1% | |
| (=) Conversion cost | US$ mm | 31.9 | 31.5 | 32.4 | (1.5%) | 89.3 | 88.5 | 0.9% |
| Conversion cost | US$/lb | 0.36 | 0.38 | 0.31 | 16.0% | 0.36 | 0.30 | 21.0% |
| Cash cost (1) | US$/lb | 1.52 | 1.43 | 1.14 | 33.1% | 1.45 | 1.12 | 29.2% |
| Sustaining cash cost (1) | US$/lb | 1.62 | 1.50 | 1.18 | 38.1% | 1.53 | 1.16 | 32.1% |
| CAPEX | US$ mm | |||||||
| Sustaining | 6.8 | 4.6 | 2.9 | 133.1% | 15.4 | 9.8 | 56.6% | |
| Other | 2.4 | 1.1 | 0.7 | 225.9% | 6.0 | 2.4 | 153.0% | |
(1) Our cash cost and sustaining cash cost are net of by-products credits, measured with respect to zinc sold per smelter. For a cash cost reconciliation to COGS, please refer to Appendix – Conversion and All in Sustaining Cash Cost | Smelting.
(2) Cost of sales does not include resale operations from third parties.
In Três Marias, total production (zinc metal + oxide) reached 40kt in 3Q25, down 13% from 3Q24, mainly reflecting persistent operational instabilities that continued to affect zinc production and recovery rates. Compared to 2Q25, production increased by 4%, supported by higher concentrate availability from Vazante.
Zinc oxide production totaled 9.3kt in 3Q25, down 4% year-over-year and 2% quarter-over-quarter.
Recovery rates averaged 87.6% during the quarter compared to 90.6% in 3Q24 and 87.7% in 2Q25, due to ongoing operational challenges.
Zinc metal sales amounted to 33kt, down 12% year-over-year due to lower production levels, while increased by 11% compared to 2Q25, supported by increased output. Zinc oxide sales reached 9.3kt, down 8% and 7% compared to 3Q24 and 2Q25, respectively, reflecting lower demand in the period.
In 9M25, Três Marias total production amounted to 117kt, 14% lower compared to 9M24. Zinc metal sales fell 17% to 92kt, while zinc oxide sales increased 3% to 27kt.
Costs
In 3Q25, conversion cost was US$0.36/lb, up 16% compared to 3Q24, driven by lower zinc sales volumes, unfavorable foreign exchange variations and higher operational costs (such as personnel, third-party services and energy). Compared to 2Q25, conversion cost decreased 5%, mainly due to higher zinc sales volume and lower variable costs associated with reduced consumption of inputs such as sulfuric acid and steam.
Cash cost net of by-products increased to US$1.52/lb in 3Q25, compared to US$1.14/lb in 3Q24 and US$1.43/lb in 2Q25. This increase was mainly explained by lower TCs, the negative impact of higher zinc prices on raw material costs and increased operational expenses.
CAPEX
In 3Q25, sustaining capital expenditures amounted to US$7 million, primarily allocated to the tailings dry stacking project and upgrades to the roaster and pumping systems, totaling US$15 million in 9M25.
| | 30 |
Earnings Release 3Q25 | |
Juiz de Fora, Brazil
| Juiz de Fora (100% basis) |
3Q25 | 2Q25 | 3Q24 | 3Q25 vs. 3Q24 | 9M25 | 9M24 | 9M25 vs. 9M24 | |
| Zinc metal production | kt | 17.4 | 16.9 | 20.0 | (13.1%) | 45.5 | 61.2 | (25.6%) |
| Global Recovery | % | 94.2 | 92.5 | 94.7 | (50 bps) | 93.7 | 93.6 | 9 bps |
| Zinc metal sales | kt | 18.7 | 18.4 | 18.7 | (0.0%) | 49.0 | 59.8 | (18.0%) |
| Zinc content in products | kt | 18.1 | 16.0 | 18.6 | (3.0%) | 45.5 | 59.4 | (23.4%) |
| Cost of sales | US$ mm | 72 | 60 | 66 | 8.6% | 177 | 191 | (7.2%) |
| (-) Raw material | (37) | (35) | (38) | (0.3%) | (90) | (106) | (15.0%) | |
| (+) By-product | (0.7) | (0.5) | (0.6) | 22.9% | (1.7) | (2.1) | (19.0%) | |
| (+/-) Consolidation effects | 0.4 | 0.8 | (2.4) | (117.1%) | 0.8 | (3.4) | (123.3%) | |
| (+) Others | (12.0) | (5.0) | (7.4) | 62.1% | (30.0) | (23.2) | 29.1% | |
| (=) Conversion cost | US$ mm | 22.0 | 20.3 | 18.1 | 21.5% | 56.2 | 56.1 | 0.1% |
| Conversion cost | US$/lb | 0.55 | 0.58 | 0.44 | 25.3% | 0.56 | 0.43 | 30.8% |
| Cash cost (1) | US$/lb | 1.55 | 1.40 | 1.31 | 18.4% | 1.46 | 1.21 | 20.6% |
| Sustaining cash cost (1) | US$/lb | 1.68 | 1.45 | 1.42 | 18.1% | 1.55 | 1.27 | 22.7% |
| CAPEX | US$ mm | |||||||
| Sustaining | 4.8 | 1.6 | 4.4 | 8.8% | 8.8 | 6.9 | 27.7% | |
| Other | 0.3 | 0.2 | 0.2 | 67.3% | 0.6 | 0.4 | 38.3% | |
(1) Our cash cost and sustaining cash cost are net of by-products credits, measured with respect to zinc sold per smelter. For a cash cost reconciliation to COGS, please refer to Appendix - Conversion and All in Sustaining Cash Cost | Smelting.
In 3Q25, production at Juiz de Fora reached 17kt, down 13% compared to 3Q24, primarily reflecting the effects of the fire incident that occurred in late December 2024, whose main operational impact was felt in early 2025, as well as the anticipated reduction in our 2025 sales guidance. Compared to 2Q25, production was up 3%, supported by the remediation measures completed in 1H25. While the unit resumed its planned production capacity as of mid-2025, utilization continued to improve through the quarter, culminating in full capacity being achieved in September.
Recovery rates averaged 94.2% in the quarter compared to 94.7% in 3Q24 and 92.5% in 2Q25, reflecting a return to normal operating levels supported by improved operational performance.
Zinc metal sales totaled 19kt in 3Q25, remaining flat year-over-year. Compared to 2Q25, zinc metal sales increased by 2%, reflecting production recovery in the period.
In 9M25, zinc metal production decreased 26% to 45kt, while sales reached 49kt, down 18% compared to 9M24, reflecting the temporary operational challenges that affected the first months of the year.
Costs
In 3Q25, conversion cost averaged US$0.55/lb, up from US$0.44/lb in 3Q24, primarily due to higher personnel and variable costs, lower zinc sales volume, and unfavorable foreign exchange variations. Compared to 2Q25, conversion cost decreased by 4%, supported by higher zinc sales volume and lower variable costs.
| | 31 |
Earnings Release 3Q25 | |
Cash cost net of by-products was US$1.55/lb in 3Q25 compared to US$1.31/lb in 3Q24, mainly due to lower TCs, higher zinc prices, unfavorable foreign exchange variations, and increased operational costs. Compared to 2Q25, cash cost net of by-products also increased, primarily attributed to higher zinc prices and unfavorable foreign exchange variations.
CAPEX
In 3Q25, sustaining capital expenditures amounted to US$5 million, primarily allocated to equipment acquisition, replacement, and repair activities, supporting the full recovery of the electro filter system, totaling US$9 million in 9M25.
Financial performance
| US$ million | 3Q25 | 2Q25 | 3Q24 | 3Q25 vs. 3Q24 | 9M25 | 9M24 | 9M25 vs. 9M24 | |
| Net Revenues | 540.8 | 489.5 | 524.4 | 3.1% | 1,483.8 | 1,450.4 | 2.3% | |
| Cost of Sales | (522.8) | (476.8) | (474.5) | 10.2% | (1,424.0) | (1,296.9) | 9.8% | |
| Gross Profit | 18.0 | 12.7 | 49.9 | (64.0%) | 59.8 | 153.4 | (61.0%) | |
| Adjusted EBITDA | 22.6 | 25.3 | 54.7 | (58.6%) | 79.2 | 174.0 | (54.4%) | |
| Adjusted EBITDA Mrg. | 4.2% | 5.2% | 10.4% | (6.2pp) | 5.3% | 12.0% | (6.7pp) | |
Note: Financial performance pre-intersegment eliminations.
Net revenues totaled US$541 million in 3Q25, up 3% compared to US$524 million in 3Q24, primarily driven by higher zinc prices and stronger by-products contribution (particularly from sulfuric acid, silver concentrate, and copper cement), partially offset by lower sales volume at Três Marias. Compared to the previous quarter, net revenues increased by 10%, mainly reflecting higher sales volume across all units, increased zinc prices, and higher by-products contribution.
In 9M25, net revenues amounted to US$1,484 million, 2% higher compared to the same period a year ago, supported by higher zinc prices and stronger by-products contribution, which offset lower sales volume.
Cost of sales increased by 10% in 3Q25, totaling US$523 million compared to US$474 million in 3Q24. This increase was mainly due to lower TCs and higher operational costs, including maintenance, third-party services and input costs, partially offset by lower sales volume. Compared to 2Q25, cost of sales also increased by 10%, primarily due to higher sales volume and higher zinc prices.
In 9M25, cost of sales amounted to US$1,424 million, 10% higher compared to the same period a year ago, reflecting higher zinc prices, lower TCs, and increased operational costs.
Reconciliation of realized prices
Purchases of zinc in concentrate are recorded at provisional prices and, typically, an adjustment is made after delivery, which is based on the pricing terms provided for under the respective contract. In addition, the difference between the provisional and the final price received is recognized by adjusting the price in the period in which the purchase is concluded.
| | 32 |
Earnings Release 3Q25 | |
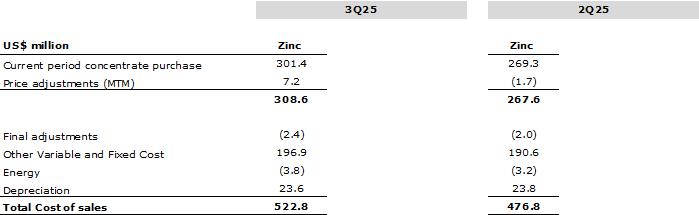
Sources of Zinc Concentrate to Nexa Smelters (kt) – 3Q25
In 3Q25, Nexa sourced 49% of its zinc concentrate from its own mines, with the remaining 51% supplied by third parties and secondary feed. The smelters use zinc concentrate as feedstock, primarily from our mines, applying a benchmark treatment charge (TC) for these operations. For third-party suppliers, TCs are based on the benchmark TC, spot TCs, or annually negotiated contracts, which have remained relatively stable throughout the year.
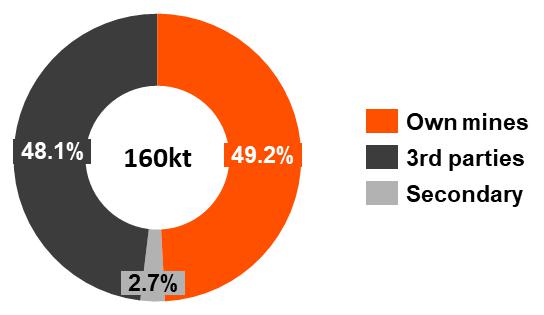
The 2025 benchmark TC, reportedly agreed between Korea Zinc and Teck in April 2025, was set at US$80/t of concentrate, down 52% from 2024 (US$165/t). The reference benchmark TCs for 2025, 2024 and 2023 were US$80/t, US$165/t, and US$274/t of concentrate, respectively. To mitigate market volatility, Nexa applies a three-year rolling average to TCs in most third-party concentrate purchase contracts, which are renewed at staggered intervals throughout the year. For 2025, only approximately 30% of our concentrate purchases (third-parties and own mines) are subject to the US$80/t benchmark, as most of our contracts were negotiated before April 2025, prior to the official benchmark being set.
Adjusted EBITDA for the smelting segment totaled US$23 million in 3Q25, down 59% compared to US$55 million in 3Q24. This decline was primarily attributed to (i) lower TCs, with a negative impact of US$26 million; (ii) a net price effect of US$20 million, reflecting higher LMEs and unfavorable market-to-market impacts on raw material purchases; (iii) adverse foreign exchange variations totaling US$5 million; and (iv) lower sales volume impact of US$2 million, as a result of lower sales volume at Três Marias, partially offset by higher sales volume at Cajamarquilla. These negative effects were partially offset by (v) higher by-products contribution of US$14 million, primarily from stronger sulfuric acid and silver concentrate prices, as well as higher copper cement sales volume; and (vi) lower costs of US$5 million due to reduced energy and third-party service expenses at Cajamarquilla.
| | 33 |
Earnings Release 3Q25 | |
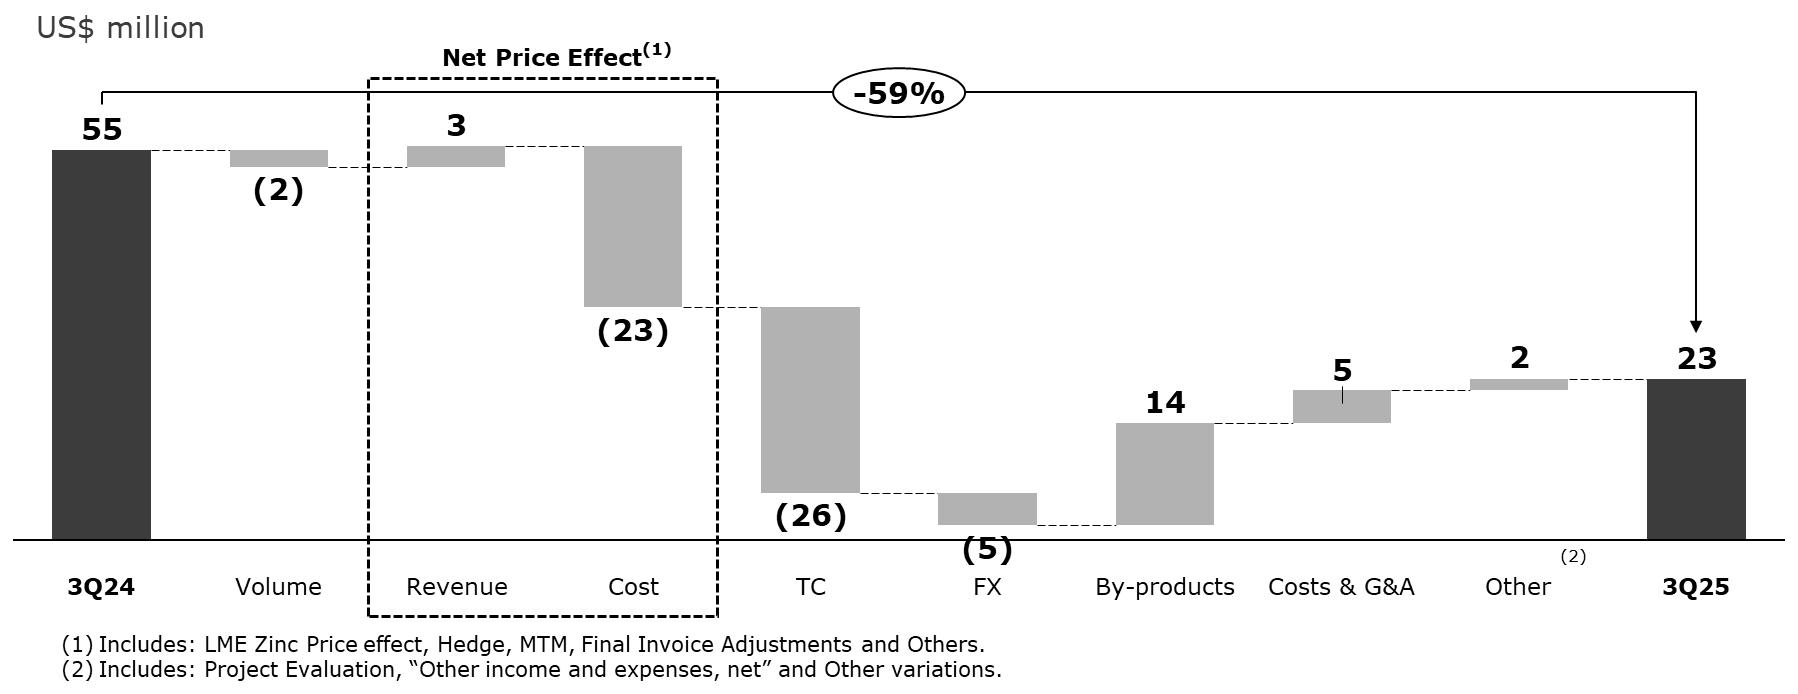
Compared to 2Q25, Adjusted EBITDA decreased by 11%, mainly due to (i) a negative net price effect of US$21 million, reflecting higher zinc prices and mark-to-market impacts on raw material purchases; (ii) unfavorable foreign exchange variations totaling US$2 million; (iii) lower TCs of US$2 million; and (iv) a negative impact of US$4 million in other variations, primarily related to lower cash dividends received from Enercan in the quarterly comparison. These negative effects were partially offset by (v) lower costs of US$14 million, mainly due to an improved raw material mix and stronger operational performance in the quarter, (vi) higher by-products contribution of US$10 million, reflecting increased sulfuric acid and silver concentrate sales volume at Cajamarquilla, as well as higher silver and copper cement prices; and (vii) a US$2 million positive impact from higher overall sales volume.
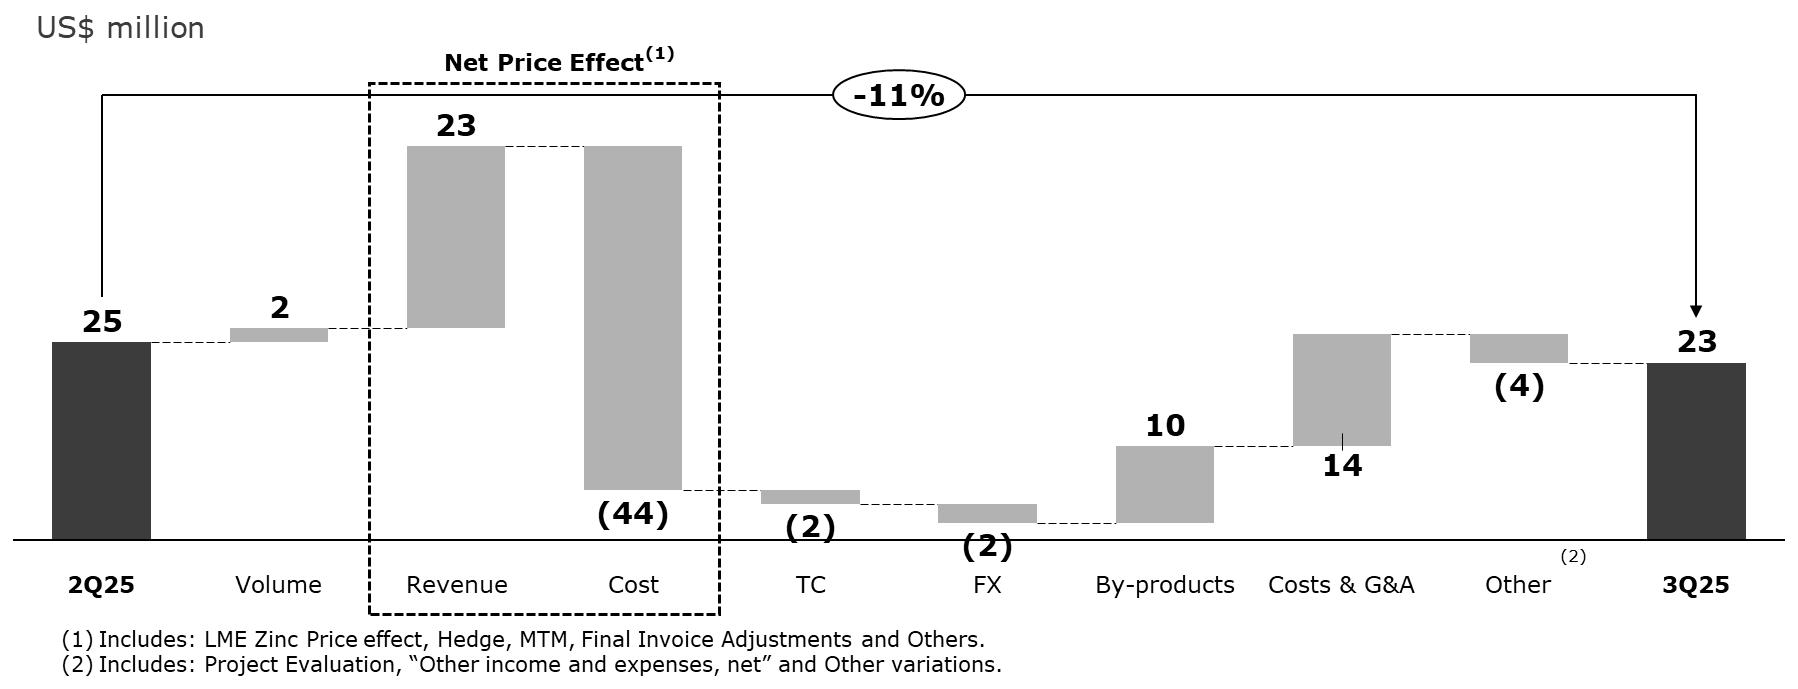
Conversion cost, Cash cost and AISC[5]
| Consolidated | 3Q25 | 2Q25 | 3Q24 | 3Q25 vs. 3Q24 | 9M25 | 9M24 | 9M25 vs. 9M24 | |
| Smelting conversion cost | US$/t | 767 | 862 | 696 | 10.2% | 750 | 673 | 11.4% |
| Cash cost net of by-products | US$/t | 2,902 | 2,703 | 2,555 | 13.6% | 2,735 | 2,453 | 11.5% |
| AISC | US$/t | 3,137 | 2,912 | 2,751 | 14.1% | 2,947 | 2,644 | 11.5% |
| Smelting conversion cost | US$/lb | 0.35 | 0.34 | 0.32 | 10.2% | 0.34 | 0.31 | 20.9% |
[5] Our conversion cost, cash cost and AISC net of by-products credits are measured with respect to zinc sold.
| | 34 |
Earnings Release 3Q25 | |
| Consolidated | 3Q25 | 2Q25 | 3Q24 | 3Q25 vs. 3Q24 | 9M25 | 9M24 | 9M25 vs. 9M24 | |
| Cash cost net of by-products | US$/lb | 1.32 | 1.23 | 1.16 | 13.6% | 1.24 | 1.11 | 11.5% |
| AISC | US$/lb | 1.42 | 1.32 | 1.25 | 14.1% | 1.34 | 1.20 | 11.5% |
Note: Cash cost and AISC per ton sold does not include the impact of the cost of metal purchased for resale and the impact of the cost of idleness capacity of US$2.1 million in Juiz de Fora in 9M25.
Conversion cost averaged US$0.35/lb in 3Q25, up 10% compared to US$0.32/lb in 3Q24, as a result of lower sales volume and higher personnel and variable costs. Compared to 2Q25, conversion cost remained broadly in line.
Cash cost net of by-products for the smelting segment was US$1.32/lb in 3Q25, up 14% from 3Q24 and 7% from 2Q25. This increase was primarily driven by lower TCs, higher zinc prices, which negatively impacted raw material costs, and increased operational costs.
AISC net of by-products in 3Q25 was US$1.42/lb, up 14% and 8% compared to 3Q24 and 2Q25 respectively, reflecting the increase in cash costs.
For a reconciliation of conversion cost, cash cost and AISC, please refer to the appendix section “Conversion and All in Sustaining Cash Cost | Smelting.”
| | 35 |
Earnings Release 3Q25 | |
Liquidity and Indebtedness
On September 30, 2025, Nexa’s total debt[6] amounted to US$1,834 million, 1% higher compared to the balance on June 30, 2025, mainly reflecting the 3% appreciation of the Brazilian real (end of period) against the U.S. dollar.
At the end of the period, the average maturity of our total debt was 7.4 years at an average interest rate of 6.32% per year, with 5% (US$85 million) of the total debt maturing in 2025, 2% (US$31 million) maturing in 2026, 30% (US$ 551 million) maturing between 2027 and 2031, 35% (US$638 million) maturing between 2032 and 2036, and 29% (US$529 million) of the total debt maturing in and after 2037. Of the total debt, 82% (or US$1,511 million) was denominated in U.S. dollars, and 18% (or US$322 million) in Brazilian reais.
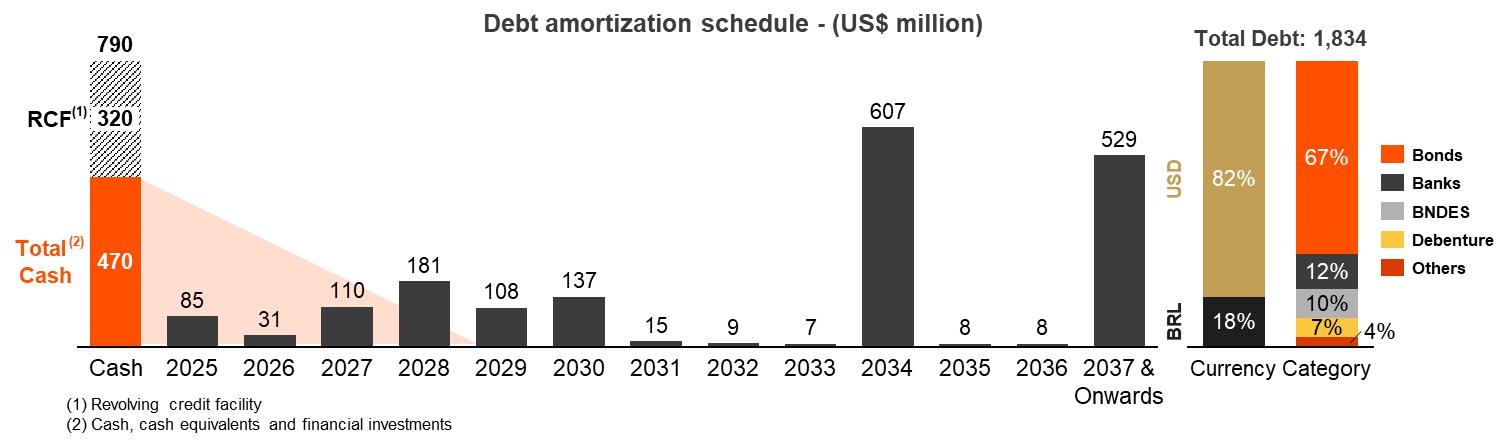
As of September 30, 2025, cash and cash equivalents and financial investments (“total cash”) amounted to US$470 million, up 13% from June 30, 2025. This increase was mainly driven by stronger operating cash flow and US$19 million working capital gain during the quarter.
Total cash, excluding the RCF, at the end of 3Q25 remains sufficient to cover all financial obligations maturing over the next ~4 years.
At quarter end, Nexa’s net debt[7] totaled US$1,479 million compared to US$1,515 million at the end of 2Q25. As a result, our Net debt/LTM Adj. EBITDA ratio improved to 2.2x, from 2.3x at the end of 2Q25.
| US$ million | Sep 30, 2025 | Jun 30, 2025 |
| Gross Debt | 1,833.6 | 1,819.6 |
| Net debt | 1,479.1 | 1,515.1 |
| LTM Adj. EBITDA | 668.6 | 665.4 |
| Net debt/LTM Adj. EBITDA | 2.21x | 2.28x |
In addition to continuing to assess short-term and mid-term commodities prices, management continuously reviews Nexa’s capital structure, financial position, and the cost and maturity profile of our debt. Actions to improve the quantum and profile of outstanding debt, focusing on extending maturity, reducing average cost of debt and assessing financing alternatives, continue to be evaluated.
Credit Ratings
In September 2025, Fitch Ratings reaffirmed Nexa Resources S.A.'s (Nexa) Long-Term Foreign and Local Currency Issuer Default Ratings at 'BBB-', and its national scale long-term rating at 'AAA(bra)', all with a Stable Outlook. The outlook reflects Nexa’s strategic relationship with its ultimate parent, Votorantim S.A. (VSA; BBB/Stable), and a Top Down -1 rating approach. Nexa's standalone credit
[6] Loans and financing (“gross debt”), excluding lease liabilities.
[7] Gross debt (US$1,834 million) minus cash and cash equivalents (US$465 million), minus financial investments (US$6 million), plus negative derivatives (US$6 million), plus Lease Liabilities (US$122 million). It does not include the financial instrument related to the offtake agreement.
| | 36 |
Earnings Release 3Q25 | |
profile continues to benefit from its competitive cost position in both mining and smelting, integrated zinc operations, and moderate leverage.
This reaffirmation underscores Nexa’s solid financial position, supported by ongoing operational improvements, disciplined capital management and stable market fundamentals.
| | 37 |
Earnings Release 3Q25 | |
Cash flows
| US$ million | 3Q25 | 3Q24 | 9M25 | 9M24 |
| Cash provided by operating activities before working capital | 196.4 | 193.1 | 528.6 | 418.0 |
| Variations in operating assets and liabilities ("Working Capital") | 19.5 | (42.9) | (242.9) | (184.2) |
| Net cash flows provided by (used in): | ||||
| Operating activities | 167.5 | 111.9 | 84.1 | 107.6 |
| Investing activities | (82.1) | (43.8) | (186.4) | (174.0) |
| Financing activities | (34.5) | (18.4) | (62.3) | 129.2 |
| Increase (decrease) in cash and cash eq. | 52.4 | 51.3 | (155.8) | 56.0 |
| Cash and cash eq. at the beginning of the period | 412.3 | 461.9 | 620.5 | 457.3 |
| Cash and cash eq. at the end of the period (1) | 464.7 | 513.2 | 464.7 | 513.2 |
(1) Does not include financial investments totaling US$6 million at September 30, 2025.
Note: For details on Cash flows, please refer to the “Condensed consolidated interim financial statements at and for the three and nine-month periods ended on September 30, 2025.”
In 3Q25, cash provided by operating activities before working capital variations totaled US$196 million. Working capital variations contributed a positive US$19 million, primarily due to (i) a US$100 million increase in trade and confirming payables, reflecting higher LME prices and the extension of payment terms with key suppliers; partially offset by (ii) a US$31 million increase in inventories due to higher semi-finished products, partially offset by decreased raw material levels; (iii) a US$30 million increase in trade accounts receivables, reflecting higher LME prices (iv) a US$16 million decrease in other liabilities, primarily from the amortization of customer prepayments, dividend payments, and insurance-related adjustments. Additionally, interest payment totaled US$26 million and tax payments US$22 million. As a result, net cash provided by operating activities amounted to US$167 million.
Net cash used in investing activities amounted to US$82 million in 3Q25, primarily including US$90 million in CapEx investments (nearly all of which was sustaining CapEx), partially offset by US$6 million in cash dividend received from Enercan, and US$3 million from net sales of financial investments.
Net cash used in financing activities in the quarter totaled US$34 million, primarily due to US$16 million in dividends paid to non-controlling interests (Pollarix and Nexa Peru), along with loan and financings, and lease liabilities.
Foreign exchange effects on cash and cash equivalents had a positive impact of US$2 million in the quarter.
As a result, cash and cash equivalents
(excluding financial investments) increased by US$52 million in the quarter, totaling US$465 million at the end of 3Q25.
| | 38 |
Earnings Release 3Q25 | |
Others
Impairment Reversal
Nexa recorded a US$106 million non-cash net impairment reversal in 3Q25. The reversal consists of a US$108 million recovery for the Cerro Pasco CGU, reflecting updated metal price forecasts, partially offset by US$2 million in impairments on specific assets and projects.
For further information, please refer to note 17 – “Impairment of long-lived assets” in the “Condensed consolidated interim financial statements at and for the three and nine-month periods ended on September 30, 2025.”
| | 39 |
Earnings Release 3Q25 | |
Market Scenario
3Q25
| LME Prices | 3Q25 | 2Q25 | 3Q24 | 3Q25 vs. 3Q24 | 9M25 | 9M24 | 9M25 vs. 9M24 | |
| Zinc | US$/t | 2,825 | 2,641 | 2,779 | 1.6% | 2,770 | 2,688 | 3.1% |
| Copper | US$/t | 9,797 | 9,524 | 9,210 | 6.4% | 9,556 | 9,131 | 4.7% |
| Lead | US$/t | 1,966 | 1,947 | 2,044 | (3.8%) | 1,961 | 2,095 | (6.4%) |
| Silver | US$/oz | 39.4 | 33.7 | 29.4 | 33.9% | 35.0 | 27.2 | 28.8% |
| Gold | US$/oz | 3,457 | 3,280 | 2,474 | 39.7% | 3,201 | 2,296 | 39.4% |
Source: Bloomberg
Zinc Market: Prices Reach 2025 High as Market Tightens Outside China
In 3Q25, the LME zinc price averaged US$2,825/t (US$1.28/lb), up 2% year-over-year and 7% quarter-over-quarter. Prices strengthened notably toward the end of the period, reaching US$3,019/t, the highest level of 2025, supported by a weaker U.S. dollar and solid fundamentals.
Supporting macroeconomic conditions emerged in September as the Federal Reserve cut its policy rate by 25bps, moving to a 4.00%-4.25% range. This decision, the first reduction since December 2024, was driven by growing risks of a labor market slowdown. Updated projections now signal an additional 50bps of cuts by year-end, a prospect of further monetary easing that should continue to support zinc and other base and precious metal prices.
Globally, manufacturing activity remained broadly resilient. The U.S. manufacturing PMI moderated slightly to 52.0 from 53.0 in August but continues to signal expansion. In the Eurozone, the PMI slipped marginally into contraction at 49.8, though it remains above 2024 levels. China’s manufacturing PMI improved for a second consecutive month to 51.2, bolstered by targeted fiscal and monetary policies that are sustaining industrial activity, benefiting base metals, despite external trade tensions.
A structural divergence is now evident in the zinc market. While China moves into a surplus, other regions are experiencing pronounced tightness. This is clear in global inventory trends: LME zinc inventories fell 65% quarter-over-quarter to 41kt, the lowest level since March 2023. This decline has kept the cash-to-three-month spread in backwardation, confirming persistent tightness in the market outside China. In contrast, SHFE inventories rose 165% from 2Q25 to 98kt, as Chinese smelters are gradually expanding production. This was enabled by rising Chinese spot treatment charges (above US$100/t CIF) and increased concentrate imports from new sources such as Russia’s Ozernoye and Iran’s Mehdiabad mines.
Although mine supply gradually improved in 2025, seasonal and logistical constraints continue to limit near-term concentrate availability. The ongoing draw on LME inventories, combined with a weaker U.S. dollar, creates a favorable backdrop for price strength into the end of the year.
In Latin America (excluding Mexico), zinc metal demand decreased 7% quarter-over-quarter, primarily due to lower consumption in Brazil, Peru, and Argentina. The Andean and Central America region posted a modest 0.2% increase. Brazil’s economy is slowing under the weight of persistently high-interest rates, while Peru’s demand was affected by seasonal factors aligned with the Northern Hemisphere vacation period.
Copper: Structural Deficit Intensifies, Reinforcing a Bullish Outlook
In 3Q25, the LME copper price averaged US$9,797/t (or US$4.44/lb), up 5% year-over-year and 6.5% quarter-over-quarter. This upward trend was supported by the weaker U.S. dollar and significant supply
| | 40 |
Earnings Release 3Q25 | |
disruptions that worsened the market’s physical deficit. Prices peaked at US$10,312/t in late September, the highest this year.
The copper concentrate market remained extremely tight. Spot treatment and refining charges (TC/RCs) held at –US$86/t, unchanged from the previous quarter and significantly below historical averages. This tightness was amplified by major operational setbacks: In September, Freeport-McMoRan’s Grasberg mine suspended operations due to a mudflow, with estimated impacts of up to approximately 200kt in 2025, extending into 2026-2027, while in August, Codelco’s El Teniente mine halted for two weeks after a tunnel collapse, reducing its 2025 output by roughly 40kt.
Despite ongoing trade and geopolitical uncertainties, copper’s demand foundation remains strong, driven by renewable energy projects, data center expansion, and electric vehicle (EV) production, reinforcing its critical role in global electrification.
Foreign Exchange
| FX | 3Q25 | 2Q25 | 3Q24 | 3Q25 vs. 3Q24 | 9M25 | 9M24 | 9M25 vs. 9M24 | |
| BRL/USD (Average) | 5.449 | 5.666 | 5.545 | (1.7%) | 5.650 | 5.244 | 7.7% | |
| BRL/USD (End of period) | 5.318 | 5.457 | 5.448 | (2.4%) | 5.318 | 5.448 | (2.4%) | |
| PEN/USD (Average) | 3.532 | 3.652 | 3.757 | (6.0%) | 3.628 | 3.753 | (3.3%) | |
| PEN/USD (End of period) | 3.472 | 3.543 | 3.704 | (6.3%) | 3.472 | 3.704 | (6.3%) | |
Source: Bloomberg
In 3Q25, the Brazilian real averaged BRL 5.45/USD, appreciating 4% quarter-over-quarter from BRL 5.55/USD. This strength was primarily driven by U.S. dollar weakness, which continued to attract foreign capital flows into Brazilian assets. For the first nine months of 2025, the BRL has averaged BRL 5.65/USD, a 7.7% depreciation compared to the same period in 2024, reflecting earlier domestic fiscal concerns and global volatility. The quarter-end rate of BRL 5.32/USD suggests a strengthening trend as the year progresses.
The Peruvian sol averaged PEN 3.63/USD in the 9M25, appreciating 3.3% year-over-year. The currency’s movement reflects a supportive monetary policy shift. In September, the Central Reserve Bank of Peru reduced its policy rate by 25 basis points to 4.25%, a decision enabled by inflation declining toward the midpoint of its target range. This proactive easing provides monetary space to stimulate domestic economic activity, a key factor for local demand.
LME Week 2025 Sentiment: Broad Optimism for Metals Driven by Energy Transition Demand
The industry tone, as reflected at the LME Week in mid-October, was optimistic. Participants highlighted resilient global growth and strong base metals demand underpinned by the energy transition and AI-related infrastructure.
For zinc, discussions focused on recovering
treatment charges and demand resilience, particularly in emerging economies. This reinforces a constructive outlook for zinc, with its
fundamental role in green infrastructure and industrial growth. For copper, sentiment was firm due to supply disruptions and rising structural
demand.
| | 41 |
Earnings Release 3Q25 | |
Risks and Uncertainties
Risk management is a key element of our business strategy and supports long-term value creation while reinforcing confidence among our stakeholders.
Nexa’s Enterprise Risk Management (“ERM”) Policy establishes a structured approach to identifying and managing risks across our operations, corporate functions and capital projects, and supports informed decision-making by our Executive Officers and Board of Directors.
The risk assessment cycle is performed annually focusing on our strategy, operations and key projects. We seek to identify material risks, which are then assessed with consideration of the potential health, safety, environmental, social, reputational, legal and financial impacts. By embedding risk management into our work processes and critical business systems, we work to ensure we make decisions based on our risk appetite, updated annually, on relevant inputs and valid data. The material risks identified during the risk management process are monitored and reported to the Executive Team and the Board of Directors. The oversight of risk, responses and mitigation actions are delegated to the various committees of the Board according to the nature of the risk and the respective board committee’s area of responsibility. The Audit Committee is responsible for financial reporting, fraud and compliance risk as well as oversight of the risk management process, policies and procedures. The Audit Committee is also responsible for oversight of cybersecurity risk management, as described below. The Finance Committee is responsible for the financial risks as well as the oversight of the financial risk management policy as described below. The Compensation, Nominating and Governance Committee is responsible for the mitigation of risks associated with the Company’s compensation policies, among others. The Sustainability and Capital Projects Committee monitors compliance with applicable laws and policies and oversight the suitability and effectiveness of the Company’s risk management processes with respect to sustainability matters and capital projects matters, including but not limited to, tailings facility management and emergency response plans.
Our operations are exposed to various inherent risks and uncertainties that could materially affect our business, operating performance, financial results, liquidity and strategic plans. These include, without limitation:
| · | commodity price and demand volatility; |
| · | inflationary pressures, foreign exchange fluctuations and interest rate movements; |
| · | changes in economics and political conditions in the countries where we operate; |
| · | evolving global trade dynamics, including potential new tariffs, supply chain disruptions or shifts in trade policy; |
| · | ongoing geopolitical tensions and related impacts on global commodity markets and supply chains; |
| · | climate change impacts and increasingly frequent extreme weather events affecting operations, logistics and energy availability; |
| · | operational and technical risks inherent to mining, including safety, environmental and geotechnical challenges; |
| · | permitting, regulatory compliance and community relations risks that could affect production and cost structures; |
| · | cyber and information security risks; and; |
| · | capital availability and execution risks associated with growth projects and sustaining investments. |
| · | other factors. |
Additional information regarding risks and uncertainties is included in our annual report on form 20-F filed with the SEC (www.sec.gov), on SEDAR+ (www.sedarplus.ca) and available on the Company’s website (ir.nexaresources.com).
| | 42 |
Earnings Release 3Q25 | |
Use of Non-IFRS Financial Measures
Nexa’s management uses Consolidated Adjusted EBITDA as an additional performance measure on a consolidated basis, in addition to, and not as a substitute for, net income. We define Adjusted EBITDA as net income (loss) for the year/period, adjusted by (i) share in the results of associates, depreciation and amortization, net financial results and income tax; (ii) addition of cash dividend received from associates; (iii) non-cash events and non-cash gains or losses that do not specifically reflect our operational performance for the specific period, including: gain (loss) on sale of investments; impairment and impairment reversals; gain (loss) on sale of long-lived assets; write-offs of long-lived assets; remeasurement in estimates of asset retirement obligations; and other restoration obligations; and (iv) pre-operating and ramp-up expenses incurred during the commissioning and ramp-up phases of greenfield projects. For future periods, when applicable, management may exclude the impact of certain types of transactions that in its judgments are (i) events that are non-recurring, unusual or infrequent, and (ii) other specific events that, by their nature and scope, do not reflect our operational performance for the specific period.
We believe this measure provides useful information about the performance of our operations as it facilitates consistent comparisons between periods, planning and forecasting of future operating results. This reflects the operational performance of our existing business without the impact of interest, taxes, amortization, depreciation, non-cash items that do not reflect our operational performance for the specific reporting period and the impact of pre-operating and ramp-up expenses during the commissioning and ramp-up phases of Aripuanã. Pre-operating and ramp-up expenses incurred during the commissioning and ramp-up of phases of Aripuanã are not considered infrequent, unusual or non-recurring expenses, as they have recurred in prior years with respect to Aripuanã and may recur in the future with respect to any other projects that may reach the commissioning or ramp-up phases. Commencing in July 2024, these effects have no longer been included since, at the end of June 2024, Aripuanã reached the final stage of its ramp-up phase, transitioning to an ongoing operation. Also, since 2024, our management includes the cash dividend received from associates (currently, Enercan is our only associate) as part of our Adjusted EBITDA calculation. Enercan is an equity method investee with which we have a long-term energy supply agreement. Energy is one of the key components of our costs; as the purpose of our equity investment in Enercan is to secure a reliable long-term energy supply, our management considers this cash dividend received from Enercan each year as part of its analysis of our energy costs for such year.
Our calculation of Adjusted EBITDA may be different from the calculation used by other companies, including our competitors in the mining industry, so our measures may not be comparable to those of other companies.
Mining segment | Cash cost net of by-products credits: for our mining operations, cash cost after by-products credits includes all direct costs associated with mining, concentrating, leaching, solvent extraction, on-site administration and general expenses, any off-site services essential to the operation, concentrate freight costs, marketing costs and property and severance taxes paid to state or federal agencies that are not profit-related. Treatment and refining charges on metal sales, which are typically recognized as a deduction component of sales revenues, are added to cash cost. Cash cost net of by-products credits is measured with respect to zinc sold per mine.
Mining segment | Cost ROM: includes all direct production costs for mining, concentrating, leaching, on-site mineral transportation, and other on-site administration expenses, excluding royalties and workers’ participation costs. Cost ROM is measured with respect to total treated ore volume and non-metallic products revenue (such as limestone and stones) are considered as cost-reduction for our mining operations.
Smelting segment | Cash cost net of by-products credits: for our smelting operations, cash cost, after by-products credits includes all the costs of smelting, including costs associated with labor, net energy, maintenance, materials, consumables and other on-site costs, as well as raw material costs. Cash cost net of by-products credits is measured with respect to zinc sold per smelter.
| | 43 |
Earnings Release 3Q25 | |
Smelting segment | Conversion cost: costs incurred to convert zinc concentrate (feed) into final products measured with respect to contained zinc sold per smelter, including energy, consumables, and other fixed and on-site expenses. Conversion cost does not include raw material, alloys, and by-products related cost.
Sustaining cost net of by-products credits is defined as the cash cost, net of by-product credits plus non-expansion capital expenditure, including sustaining, health, safety and environment, modernization and other non-expansion-related capital expenditures. Sustaining cash cost net of by-products credits is measured with respect to zinc sold.
All in sustaining cost (“AISC”) net of by-products credits is defined as sustaining cash cost, net of by-products credits plus corporate general and administrative expenses, royalties and workers’ participation. AISC net of by-products credits is measured with respect to zinc sold.
Net debt: defined as (i) loans and financing (the most comparable IFRS measure), less (ii) cash and cash equivalents, less (iii) financial investments, plus or less (iv) the fair value of derivative financial instruments, plus (v) leases liabilities. Our management believes that net debt is an important figure because it indicates our ability to repay outstanding debts that become due simultaneously using available cash and highly liquid assets.
All forward-looking non-IFRS financial measures in this release, including cash cost guidance, are provided only on a non-IFRS basis. This is due to the inherent difficulty of forecasting the timing or amount of items that would be included in the most directly comparable forward-looking IFRS financial measures. As a result, reconciliation of the forward-looking non-IFRS financial measures to IFRS financial measures is not available without unreasonable effort and the Company is unable to assess the probable significance of the unavailable information.
See “Cautionary Statement on Forward-Looking Statements” below.
Technical information
Jose Antonio Lopes, B.Geo., FAusIMM(Geo): 224829, a Mineral Resources manager, a qualified person for purposes of National Instrument 43-101 and a Nexa employee, has approved the scientific and technical information contained in this Earnings Release. Please note that the mineral reserves included in this Earnings Release were estimated in accordance with the Canadian Institute of Mining, Metallurgy and Petroleum (“CIM”) 2014 Definition Standards for Mineral Reserves and Mineral Resources, whose definitions are incorporated by reference in National Instrument 43-101. Accordingly, such information may not be comparable to similar information prepared in accordance with Subpart 1300 of Regulation S-K (“S-K 1300”). Our estimates of mineral reserves may be materially different from mineral quantities we actually recover, and market price fluctuations and changes in operating capital costs may render certain mineral reserves uneconomical to mine.
CAUTIONARY STATEMENT ON FORWARD-LOOKING STATEMENTS
This Earnings Release contains certain forward-looking information and forward-looking statements as defined in applicable securities laws (collectively referred to in this Earnings Release as “forward-looking statements”). All statements other than statements of historical fact are forward-looking statements. The words “believe,” “will,” “may,” “may have,” “would,” “estimate,” “continues,” “anticipates,” “intends,” “plans,” “expects,” “budget,” “scheduled,” “forecasts” and similar words are intended to identify estimates and forward-looking statements. Forward-looking statements are not guarantees and involve known and unknown risks, uncertainties and other factors which may cause the actual results, performance or achievements of Nexa to be materially different from any future results, performance or achievements expressed or implied by the forward-looking statements. Actual results and developments may be substantially different from the expectations described in the forward-looking statements for a number of reasons, many of which are not under our control, among them, the activities of our competition, the future global economic situation, weather conditions, market prices and conditions, exchange rates, and operational and financial risks. The unexpected occurrence of one
| | 44 |
Earnings Release 3Q25 | |
or more of the abovementioned events may significantly change the results of our operations on which we have based our estimates and forward-looking statements.
Our estimates and forward-looking statements may also be influenced by, among others, legal, political, environmental or other risks that could materially affect the potential development of our projects, including risks related to outbreaks of contagious diseases or health crises impacting overall economic activity regionally or globally, as well as risks relating to ongoing or future investigations by local authorities with respect to our business and operations and the conduct of our customers, including the impact to our financial statements regarding the resolution of any such matters.
Our estimates and forward-looking statements may also be influenced by regulatory changes in the countries where we operate, including new trade restrictions, tariff escalations, and policy shifts affecting cross-border commerce and supply chains. Certain forward-looking statements are based on third-party data, market forecasts, and assumptions that may be subject to change. Nexa does not guarantee the accuracy of such external data and disclaims any obligation to update these statements unless required by law.
These forward-looking statements related to future events or future performance and include current estimates, predictions, forecasts, beliefs and statements as to management’s expectations with respect to, but not limited to, the business and operations of the Company and mining production our growth strategy, the impact of applicable laws and regulations, future zinc and other metal prices, smelting sales, CapEx expenses related to exploration and project evaluation, estimation of mineral reserves and mineral resources, mine life and our financial liquidity.
Forward-looking statements are necessarily based upon a number of factors and assumptions that, while considered reasonable and appropriate by management, are inherently subject to significant business, economic and competitive uncertainties and contingencies and may prove to be incorrect. Statements concerning future production costs or volumes are based on numerous assumptions of management regarding operating matters and on assumptions that demand for products develops as anticipated, that customers and other counterparties perform their contractual obligations, full integration of mining and smelting operations, that operating and capital plans will not be disrupted by issues such as mechanical failure, unavailability of parts and supplies, labor disturbances, interruption in transportation or utilities, and adverse weather conditions, and that there are no material unanticipated variations in metal prices, exchange rates, or the cost of energy, supplies or transportation, among other assumptions.
We assume no obligation to update forward-looking statements except as required under securities laws. Estimates and forward-looking statements refer only to the date when they were made, and we do not undertake any obligation to update or revise any estimate or forward-looking statement due to new information, future events or otherwise, except as required by law. Estimates and forward-looking statements involve risks and uncertainties and do not guarantee future performance, as actual results or developments may be substantially different from the expectations described in the forward-looking statements. Further information concerning risks and uncertainties associated with these forward-looking statements and our business can be found in our annual report on Form 20-F and in our other public disclosures available on our website and filed under our profile on SEDAR+ (www.sedarplus.ca) and on EDGAR (www.sec.gov).
| | 45 |
Earnings Release 3Q25 | |
Appendix
| Income Statement | 46 |
| Net cash flows from operating activities excluding working capital variations and free cash flow – Reconciliation |
47 |
| CAPEX | 48 |
| All in Sustaining Cash Cost | Mining | 49 |
| Conversion and All in Sustaining Cash Cost | Smelting | 53 |
| | 46 |
Earnings Release 3Q25 | |
Income Statement
| US$ million | 1Q24 | 2Q24 | 3Q24 | 4Q24 | 1Q25 | 2Q25 | 3Q25 |
| Net Revenues | 579.8 | 736.3 | 709.5 | 740.9 | 627.1 | 708.4 | 763.5 |
| Cost of sales | (491.9) | (556.0) | (582.9) | (597.6) | (500.6) | (575.9) | (609.6) |
| Gross Profit | 87.8 | 180.3 | 126.6 | 143.3 | 126.6 | 132.5 | 154.0 |
| SG&A | (33.5) | (30.2) | (29.5) | (34.1) | (35.1) | (32.7) | (37.5) |
| Mineral Exploration and Project Evaluation | (12.7) | (18.0) | (16.1) | (21.2) | (16.0) | (17.1) | (22.1) |
| Impairment reversal (loss) of long-lived assets | 17.2 | (60.2) | 17.6 | (7.5) | (0.3) | (2.0) | 106.5 |
| Other income and expenses, net | (9.0) | (51.9) | (13.9) | 41.2 | (21.2) | (20.9) | (23.0) |
| Operating income (loss) | 49.8 | 20.1 | 84.8 | 121.7 | 54.0 | 59.9 | 177.9 |
| Share in the results of associates | 5.7 | 5.3 | 5.4 | 4.7 | 4.9 | 4.4 | 5.8 |
| Net Financial Results | (67.9) | (118.5) | (41.5) | (141.6) | (0.6) | (27.9) | (45.5) |
| Financial income | 5.0 | 6.8 | 6.2 | 6.0 | 8.9 | 5.5 | 7.2 |
| Financial expenses | (51.5) | (63.1) | (59.9) | (70.9) | (55.2) | (73.7) | (78.5) |
| Other financial items, net | (21.4) | (62.2) | 12.2 | (76.7) | 45.7 | 40.3 | 25.8 |
| Depreciation and amortization | (77.0) | (74.3) | (82.3) | (96.6) | (65.8) | (76.6) | (81.5) |
| Adjusted EBITDA | 128.4 | 206.1 | 182.9 | 196.7 | 125.2 | 160.6 | 186.1 |
| Adj. EBITDA margin | 22.2% | 28.0% | 25.8% | 26.5% | 20.0% | 22.7% | 24.4% |
| Income tax benefit (expense) | 0.4 | 23.0 | (42.8) | (96.2) | (29.5) | (23.2) | (38.0) |
| Net Income (loss) | (12.0) | (70.0) | 6.0 | (111.4) | 28.7 | 13.3 | 100.1 |
| Attributable to Nexa's shareholders | (24.4) | (77.0) | (5.2) | (98.5) | 11.8 | 1.1 | 69.3 |
| Attributable to non-controlling interests | 12.4 | 7.0 | 11.1 | (12.9) | 16.9 | 12.2 | 30.8 |
| Weighted average number of outstanding shares - in thousand | 132,439 | 132,439 | 132,439 | 132,439 | 132,439 | 132,439 | 132,439 |
| Basic and diluted earnings (loss) per share - (in US$) | (0.18) | (0.58) | (0.04) | (0.74) | 0.09 | 0.01 | 0.52 |
| Adjusted Net Income (loss) | (10.4) | 41.7 | 21.9 | (133.1) | 34.2 | 37.4 | 26.8 |
| Adjusted basic and diluted earnings (loss) per share - (in US$) | (0.16) | 0.14 | 0.03 | (1.00) | 0.16 | 0.11 | (0.03) |
| | 47 |
Earnings Release 3Q25 | |
Net cash flows from operating activities excluding working capital variations and free cash flow – Reconciliation
Nexa manages and reports cash flows from operating activities excluding variations in working capital. Working capital can be volatile due to several factors, including prices and a build-up or reduction of inventories.
Furthermore, we also exclude from the analysis interest and income tax payments. Management believes excluding these measures provides investors with better visibility of the operating cash flow performance and our capital allocation strategy.
The following table provides a reconciliation of the cash from operating activities before variations in working capital to free cash flow.
| US$ million | 3Q25 | 9M25 |
| Cash provided by operating activities | 216 | 286 |
| (-) Working capital variations | 19 | (243) |
| Trade accounts receivable | (30) | (52) |
| Inventory | (31) | (74) |
| Other assets | (3) | (90) |
| Payables | 100 | 26 |
| Other liabilities | (16) | (53) |
| Cash flows from operations excluding working capital variations | 196 | 529 |
| Interest paid | (26) | (101) |
| Income tax | (22) | (86) |
| Sustaining CAPEX (1) | (91) | (227) |
| Net cash flows from operations excluding working capital variations | 57 | 115 |
| Other CAPEX investments (2) | 0 | (1) |
| Loans and investments (3) | (10) | 7 |
| Dividends and share premium paid | (16) | (42) |
| Foreign exchange effects | 2 | 9 |
| Working capital variations | 19 | (243) |
| Free cash flow | 52 | (156) |
(1) Non expansion investments related to sustaining and HS&E.
(2) Other non-expansion investments and reconciliation to Additions of property, plant and equipment, and intangible assets. Refer to the “Capital Expenditures (“CAPEX”)” section of this earnings release for CAPEX breakdown.
(3) New loans and financings, Debt issue costs, Payments of loans and financings, Payments of lease liabilities, Payments of fair value debt, Bonds repurchase, Premium paid on bonds repurchase, Net sales (purchases) of financial investments, Effects of transactions with non-controlling interest in subsidiary, Purchase of non-controlling interest shares, Subsidiary acquisition cash effects, net, Proceeds from the sale of property, plant and equipment, Dividends received, Investments in equity instruments, Acquisition of additional shares in associates, and other high liquid short term investments.
For details on cash flows, please refer to the “Condensed consolidated interim financial statements at and for the three and nine-month periods ended on September 30, 2025.”
| | 48 |
Earnings Release 3Q25 | |
CAPEX
| US$ million | 1Q24 | 2Q24 | 3Q24 | 4Q24 | 9M24 | 1Q25 | 2Q25 | 3Q25 | 9M25 |
| Mining | 59.2 | 45.1 | 36.6 | 68.8 | 140.9 | 35.1 | 67.2 | 65.3 | 167.6 |
| Cerro Lindo | 8.5 | 11.5 | 11.1 | 17.8 | 31.1 | 11.5 | 13.0 | 13.3 | 37.9 |
| El Porvenir | 25.2 | 12.0 | 9.3 | 30.7 | 46.5 | 10.5 | 25.9 | 21.4 | 57.9 |
| Atacocha | 4.2 | 3.4 | 2.9 | 2.6 | 10.5 | 2.3 | 3.9 | 3.3 | 9.5 |
| Vazante | 6.6 | 8.2 | 5.3 | 7.5 | 20.1 | 5.5 | 7.1 | 6.1 | 18.7 |
| Morro Agudo | 0.0 | 0.1 | 0.0 | 0.0 | 0.1 | 0.0 | 0.0 | 0.0 | 0.0 |
| Aripuanã | 14.6 | 10.0 | 8.0 | 10.1 | 32.6 | 5.2 | 17.3 | 21.1 | 43.6 |
| Smelting | 16.1 | 19.4 | 18.2 | 21.9 | 53.8 | 16.7 | 18.7 | 25.9 | 61.3 |
| Cajamarquilla | 12.1 | 12.2 | 9.9 | 11.5 | 34.2 | 7.9 | 11.1 | 11.5 | 30.4 |
| Três Marias | 3.3 | 5.3 | 3.7 | 5.4 | 12.2 | 6.4 | 5.8 | 9.3 | 21.4 |
| Juiz de Fora | 0.8 | 2.0 | 4.6 | 5.0 | 7.4 | 2.5 | 1.8 | 5.2 | 9.4 |
| Other | (1.2) | (0.8) | (1.5) | (5.1) | (3.5) | (1.4) | 0.6 | (1.2) | (2.0) |
| Total | 74.1 | 63.8 | 53.3 | 85.6 | 191.2 | 50.5 | 86.5 | 89.9 | 226.9 |
| Sustaining (US$ million) | 1Q24 | 2Q24 | 3Q24 | 4Q24 | 9M24 | 1Q25 | 2Q25 | 3Q25 | 9M25 |
| Mining | 58.3 | 43.9 | 33.7 | 63.7 | 135.8 | 34.6 | 66.1 | 63.5 | 164.2 |
| Cerro Lindo | 8.5 | 11.5 | 11.0 | 16.1 | 30.9 | 11.5 | 12.7 | 12.7 | 37.0 |
| El Porvenir | 25.2 | 12.0 | 9.1 | 30.1 | 46.3 | 10.5 | 25.8 | 21.4 | 57.8 |
| Atacocha | 4.2 | 3.4 | 2.9 | 2.2 | 10.5 | 2.2 | 3.9 | 3.2 | 9.4 |
| Vazante | 5.9 | 7.3 | 4.8 | 6.6 | 18.1 | 5.2 | 6.3 | 5.0 | 16.6 |
| Morro Agudo | 0.0 | 0.1 | 0.0 | 0.0 | 0.1 | 0.0 | 0.0 | 0.0 | 0.0 |
| Aripuanã | 14.4 | 9.6 | 5.9 | 8.6 | 30.0 | 5.1 | 17.3 | 21.1 | 43.4 |
| Smelting | 14.9 | 17.7 | 16.0 | 18.9 | 48.6 | 13.8 | 17.1 | 22.6 | 53.6 |
| Cajamarquilla | 11.7 | 11.4 | 8.7 | 11.0 | 31.8 | 7.5 | 10.9 | 11.0 | 29.4 |
| Três Marias | 2.4 | 4.4 | 2.9 | 3.7 | 9.8 | 3.9 | 4.6 | 6.8 | 15.4 |
| Juiz de Fora | 0.7 | 1.8 | 4.4 | 4.3 | 6.9 | 2.4 | 1.6 | 4.8 | 8.8 |
| Total Operations | 73.1 | 61.5 | 49.7 | 82.6 | 184.4 | 48.4 | 83.2 | 86.1 | 217.8 |
| Corporate Sustaining | 0.1 | 0.4 | 0.2 | 0.3 | 0.7 | 0.0 | 0.0 | 0.0 | 0.0 |
| Total Sustaining | 73.2 | 62.0 | 49.9 | 82.9 | 185.0 | 48.4 | 83.2 | 86.1 | 217.8 |
| | 49 |
Earnings Release 3Q25 | |
All in Sustaining Cash Cost | Mining (1)
3Q25
| US$ million (excepted indicated otherwise) |
Vazante | Aripuanã | Cerro Lindo | El Porvenir | Atacocha | Consolidation of Operations | Corporate & Others | Mining | |
| Sales Volume (Zinc content in Products) | |||||||||
| Tonnes | 33,687 | 10,409 | 20,416 | 14,702 | 2,959 | 82,173 | 82,173 | ||
| (+) | COGS | 35.6 | 57.1 | 81.6 | 50.6 | 22.6 | 247.5 | (11.6) | 235.9 |
| (+) | On-site G&A | 0.2 | 0.1 | 2.0 | 1.1 | 1.1 | 4.4 | 4.4 | |
| (-) | By-products revenue | (3.6) | (38.9) | (109.1) | (61.0) | (29.5) | (242.0) | (40.2) | (282.2) |
| (+) | Treatment Charges | 11.4 | 1.1 | 4.3 | 4.0 | 0.7 | 21.5 | 21.5 | |
| (+) | Selling Expenses | 0.1 | 0.4 | 0.7 | 0.4 | 0.3 | 1.9 | 1.9 | |
| (-) | Depreciation, amortization and depletion | (8.7) | (12.6) | (17.3) | (8.5) | (8.1) | (55.2) | 0.0 | (55.2) |
| (-) | Royalties | (1.1) | (2.1) | (1.5) | (0.8) | (0.4) | (6.0) | (6.0) | |
| (-) | Workers participation & Bonus | (0.5) | (0.7) | (2.4) | (2.8) | (1.1) | (7.5) | (7.5) | |
| (+) | Others | 0.2 | 0.1 | (2.3) | 1.2 | (1.1) | (1.9) | (1.9) | |
| (=) | Cash Cost (Sold) | 33.6 | 4.5 | (44.0) | (15.8) | (15.5) | (37.2) | (51.8) | (89.0) |
| Cash Cost (Sold) (per ton) | 996.2 | 433.1 | (2,155.8) | (1,075.6) | (5,221.7) | (452.8) | 0.0 | (1,083.0) | |
| (+) | Sustaining Capital Expenditure | 5.9 | 21.1 | 13.3 | 21.4 | 3.3 | 65.0 | 0.3 | 65.3 |
| (=) | Sustaining Cash Cost (Sold) | 39.5 | 25.6 | (30.7) | 5.6 | (12.1) | 27.8 | (51.5) | (23.7) |
| Sustaining Cash Cost (Sold) (per ton) | 1,171.3 | 2,457.4 | (1,502.4) | 381.3 | (4,100.9) | 338.7 | 0.0 | (288.3) | |
| (+) | Workers participation & Bonus | 0.5 | 0.7 | 2.4 | 2.8 | 1.1 | 7.5 | 7.5 | |
| (+) | Royalties | 1.1 | 2.1 | 1.5 | 0.8 | 0.4 | 6.0 | 6.0 | |
| (+) | Corporate G&A | 11.0 | 11.0 | ||||||
| (=) | AISC (Sold) | 0.7 | |||||||
| (=) | AISC (Sold) (per ton) | 8.8 | |||||||
| (=) | AISC (Sold) in US$/lb | 0.00 |
(1) Our cash cost, sustaining cash cost and AISC are net of by-products credits, measured with respect to zinc sold.
| | 50 |
Earnings Release 3Q25 | |
3Q24
| US$ million (excepted indicated otherwise) |
Vazante | Morro Agudo | Cerro Lindo | El Porvenir | Atacocha | Consolidation of Operations | Corporate & Others | Mining | |
| Sales Volume (Zinc content in Products) | |||||||||
| Tonnes | 36,351 | - | 24,069 | 12,633 | 3,049 | 76,102 | 76,102 | ||
| (+) | COGS | 31.0 | - | 88.5 | 51.2 | 28.3 | 199.0 | 3.4 | 202.4 |
| (+) | On-site G&A | (0.1) | - | 0.3 | 0.8 | 0.8 | 1.9 | 1.9 | |
| (-) | By-products revenue | (2.7) | - | (96.1) | (38.2) | (24.3) | (161.2) | (23.9) | (185.1) |
| (+) | Treatment Charges | 17.2 | - | 8.4 | 5.6 | 1.3 | 32.4 | 32.4 | |
| (+) | Selling Expenses | 0.0 | - | 0.3 | 0.2 | 0.1 | 0.6 | 0.6 | |
| (-) | Depreciation, amortization and depletion | (6.3) | - | (19.3) | (12.5) | (12.4) | (50.5) | 0.0 | (50.5) |
| (-) | Royalties | (0.5) | - | (1.5) | (0.7) | (0.3) | (3.0) | (3.0) | |
| (-) | Workers participation & Bonus | (0.4) | - | (1.0) | (1.0) | (0.6) | (2.9) | (2.9) | |
| (+) | Others | 0.3 | - | 1.2 | (0.4) | 0.7 | 1.8 | 1.8 | |
| (=) | Cash Cost (Sold) | 38.6 | - | (19.2) | 5.0 | (6.3) | 18.1 | (20.5) | (2.4) |
| Cash Cost (Sold) (per ton) | 1,062.1 | - | (798.0) | 396.4 | (2,054.8) | 238.4 | 0.0 | (31.1) | |
| (+) | Sustaining Capital Expenditure | 5.0 | - | 11.1 | 9.3 | 2.9 | 28.3 | 8.1 | 36.4 |
| (=) | Sustaining Cash Cost (Sold) | 43.6 | - | (8.1) | 14.4 | (3.3) | 46.5 | (12.4) | 34.1 |
| Sustaining Cash Cost (Sold) (per ton) | 1,198.6 | - | (336.6) | 1,136.2 | (1,097.8) | 610.7 | 0.0 | 447.6 | |
| (+) | Workers participation & Bonus | 0.4 | - | 1.0 | 1.0 | 0.6 | 2.9 | 2.9 | |
| (+) | Royalties | 0.5 | - | 1.5 | 0.7 | 0.3 | 3.0 | 3.0 | |
| (+) | Corporate G&A | 10.3 | 10.3 | ||||||
| (=) | AISC (Sold) | 50.4 | |||||||
| (=) | AISC (Sold) (per ton) | 661.8 | |||||||
| (=) | AISC (Sold) in US$/lb | 0.30 |
(1) Our cash cost, sustaining cash cost and AISC are net of by-products credits, measured with respect to zinc sold.
| | 51 |
Earnings Release 3Q25 | |
9M25
| US$ million (excepted indicated otherwise) |
Vazante | Aripuanã | Cerro Lindo | El Porvenir | Atacocha | Consolidation of Operations | Corporate & Others | Mining | |
| Sales Volume (Zinc content in Products) | |||||||||
| Tonnes | 90,926 | 22,711 | 60,040 | 39,922 | 8,465 | 222,063 | 0 | 222,063 | |
| (+) | COGS | 100.5 | 152.0 | 242.2 | 134.5 | 66.4 | 695.6 | (14.0) | 681.6 |
| (+) | On-site G&A | 0.7 | 0.5 | 6.7 | 3.7 | 3.1 | 14.6 | 0.0 | 14.6 |
| (-) | By-products revenue | (10.9) | (97.4) | (297.3) | (154.3) | (70.1) | (630.0) | (51.7) | (681.7) |
| (+) | Treatment Charges | 38.0 | 3.0 | 14.0 | 11.8 | 2.3 | 69.3 | 0.0 | 69.3 |
| (+) | Selling Expenses | 0.2 | 1.2 | 1.6 | 0.7 | 0.4 | 4.1 | 0.0 | 4.1 |
| (-) | Depreciation, amortization and depletion | (22.5) | (35.2) | (45.7) | (19.2) | (23.0) | (145.6) | 0.0 | (145.6) |
| (-) | Royalties | (2.1) | (6.5) | (4.6) | (2.1) | (0.9) | (16.1) | 0.0 | (16.1) |
| (-) | Workers participation & Bonus | (1.5) | (1.7) | (5.0) | (6.6) | (1.9) | (16.6) | 0.0 | (16.6) |
| (+) | Others | 0.4 | 0.6 | (1.7) | 1.7 | 0.1 | 1.1 | 0.0 | 1.1 |
| (=) | Cash Cost (Sold) | 102.7 | 16.7 | (89.8) | (29.8) | (23.5) | (23.6) | (65.7) | (89.3) |
| Cash Cost (Sold) (per ton) | 1,130.0 | 733.8 | (1,494.9) | (747.3) | (2,772.2) | (106.5) | 0.0 | (402.2) | |
| (+) | Sustaining Capital Expenditure | 18.0 | 43.6 | 37.9 | 57.9 | 9.5 | 166.9 | 0.3 | 167.2 |
| (=) | Sustaining Cash Cost (Sold) | 120.8 | 60.3 | (51.9) | 28.1 | (14.0) | 143.3 | (65.4) | 77.9 |
| Sustaining Cash Cost (Sold) (per ton) | 1,328.0 | 2,653.6 | (863.7) | 702.7 | (1,648.8) | 645.1 | 0.0 | 350.7 | |
| (+) | Workers participation & Bonus | 1.5 | 1.7 | 5.0 | 6.6 | 1.9 | 16.6 | 0.0 | 16.6 |
| (+) | Royalties | 2.1 | 6.5 | 4.6 | 2.1 | 0.9 | 16.1 | 0.0 | 16.1 |
| (+) | Corporate G&A | 31.2 | 31.2 | ||||||
| (=) | AISC (Sold) | 141.8 | |||||||
| (=) | AISC (Sold) (per ton) | 638.5 | |||||||
| (=) | AISC (Sold) in US$/lb | 0.29 |
(1) Our cash cost, sustaining cash cost and AISC are net of by-products credits, measured with respect to zinc sold.
Note: Cash cost and AISC per ton sold does not include the impact of the cost of idleness capacity of US$1.2 million in 9M25 in El Porvenir.
| | 52 |
Earnings Release 3Q25 | |
9M24
| US$ million (excepted indicated otherwise) |
Vazante | Morro Agudo | Cerro Lindo | El Porvenir | Atacocha | Consolidation of Operations | Corporate & Others | Mining | |
| Sales Volume (Zinc content in Products) | |||||||||
| Tonnes | 106,770 | 7,394 | 71,324 | 37,396 | 7,529 | 230,413 | 230,413 | ||
| (+) | COGS | 95.8 | 18.4 | 266.2 | 150.4 | 61.2 | 592.0 | 4.8 | 596.8 |
| (+) | On-site G&A | 0.4 | 0.3 | 0.8 | 2.4 | 2.1 | 6.0 | 6.0 | |
| (-) | By-products revenue | (9.9) | (5.6) | (289.7) | (116.7) | (56.2) | (478.0) | (27.5) | (505.6) |
| (+) | Treatment Charges | 53.0 | 3.4 | 24.9 | 16.0 | 3.2 | 100.5 | 100.5 | |
| (+) | Selling Expenses | 0.2 | 0.1 | 1.0 | 0.8 | 0.2 | 2.4 | 2.4 | |
| (-) | Depreciation, amortization and depletion | (19.9) | (0.7) | (56.9) | (36.5) | (20.2) | (134.1) | 0.0 | (134.1) |
| (-) | Royalties | (1.7) | (0.4) | (4.3) | (2.0) | (0.7) | (9.0) | (9.0) | |
| (-) | Workers participation & Bonus | (1.6) | (0.4) | (5.3) | (3.3) | (1.4) | (12.1) | (12.1) | |
| (+) | Others | 1.2 | 0.1 | 1.2 | (0.7) | 0.2 | 2.0 | 2.0 | |
| (=) | Cash Cost (Sold) | 117.5 | 15.1 | (62.0) | 10.5 | (11.5) | 69.6 | (22.8) | 46.9 |
| Cash Cost (Sold) (per ton) | 1,100.7 | 2,041.0 | (868.7) | 279.7 | (1,525.6) | 302.2 | 0.0 | 203.4 | |
| (+) | Sustaining Capital Expenditure | 18.3 | 0.0 | 31.1 | 46.5 | 10.5 | 106.5 | 32.9 | 139.5 |
| (=) | Sustaining Cash Cost (Sold) | 135.8 | 15.1 | (30.8) | 57.0 | (1.0) | 176.1 | 10.2 | 186.3 |
| Sustaining Cash Cost (Sold) (per ton) | 1,272.1 | 2,046.3 | (432.1) | 1,524.3 | (131.8) | 462.3 | 0.0 | 808.6 | |
| (+) | Workers participation & Bonus | 1.6 | 0.4 | 5.3 | 3.3 | 1.4 | 12.1 | 12.1 | |
| (+) | Royalties | 1.7 | 0.4 | 4.3 | 2.0 | 0.7 | 9.0 | 9.0 | |
| (+) | Corporate G&A | 33.2 | 33.2 | ||||||
| (=) | AISC (Sold) | 240.6 | |||||||
| (=) | AISC (Sold) (per ton) | 1,044.3 | |||||||
| (=) | AISC (Sold) in US$/lb | 0.47 |
(1) Our cash cost, sustaining cash cost and AISC are net of by-products credits, measured with respect to zinc sold.
Note: Cash cost and AISC per ton sold does not include the impact of the cost of idleness capacity of US$2.7 million in 9M24 in El Porvenir.
| | 53 |
Earnings Release 3Q25 | |
Conversion and All in Sustaining Cash Cost | Smelting (2)
3Q25
| US$ million (excepted indicated otherwise) |
Três Marias | Juiz de Fora | Cajamarquilla | Consolidation of Operations | Corporate | Smelting | |
| Sales Volume (Zinc content in Products) | |||||||
| Tonnes | 40,049 | 18,051 | 89,211 | 147,311 | 147,311 | ||
| (+) | COGS | 146.1 | 71.7 | 304.2 | 522.0 | (1.1) | 520.9 |
| (-) | Cost of freight | (3.2) | (0.9) | (13.5) | (17.6) | (17.6) | |
| (+) | On-site G&A | 0.6 | 0.3 | 2.5 | 3.4 | 0.0 | 3.4 |
| (-) | Depreciation, amortization and depletion | (8.2) | (4.2) | (11.3) | (23.7) | (23.7) | |
| (-) | By-products revenue | (4.0) | (7.4) | (59.2) | (70.6) | 1.1 | (69.5) |
| (-) | Workers participation & Bonus | (0.4) | (0.4) | (0.9) | (1.7) | (1.7) | |
| (+) | Others | 3.3 | 2.4 | 10.1 | 15.8 | 15.8 | |
| (=) | Cash Cost (Sold) | 134.1 | 61.6 | 231.8 | 427.5 | 0.0 | 427.5 |
| Cash Cost (Sold) (per ton) | 3,349.1 | 3,413.1 | 2,598.0 | 2,902.1 | 2,902.1 | ||
| (+) | Sustaining Capital Expenditure | 9.3 | 5.2 | 11.5 | 25.9 | (1.5) | 24.4 |
| (=) | Sustaining Cash Cost (Sold) | 143.4 | 66.8 | 243.2 | 453.4 | (1.5) | 451.9 |
| Sustaining Cash Cost (Sold) (per ton) | 3,580.6 | 3,698.5 | 2,726.6 | 3,077.8 | 3,067.7 | ||
| (+) | Workers participation & Bonus | 0.4 | 0.4 | 0.9 | 1.7 | 1.7 | |
| (+) | Corporate G&A | 8.5 | 8.5 | ||||
| (=) | AISC (Sold) | 462.2 | |||||
| (=) | AISC (Sold) (per ton) | 3,137.3 | |||||
| (=) | AISC (Sold) in US$/lb | 1.42 |
Note: Cash cost and AISC per ton sold does not include the impact of the cost of metal purchased for resale.
| US$ million (excepted indicated otherwise) |
Três Marias | Juiz de Fora | Cajamarquilla | Smelting | |
| Contained Zinc Sales | |||||
| Tonnes | 40,049 | 18,051 | 89,211 | 147,311 | |
| COGS | 146.1 | 71.7 | 304.2 | 522.0 | |
| (-) | Raw Material | (73.1) | (37.5) | (227.1) | (337.7) |
| (+) | By product cost | (13.6) | (0.7) | (6.4) | (20.7) |
| (+/-) | Consolidation effects | (0.2) | 0.4 | (14.4) | (14.2) |
| (+) | Others | (27.3) | (12.0) | 2.8 | (36.6) |
| (=) | Conversion Cost | 31.9 | 22.0 | 59.1 | 112.9 |
| (=) | Conversion Cost in US$/t | 796.2 | 1,216.8 | 662.4 | 766.7 |
| (=) | Conversion Cost in US$/lb | 0.36 | 0.55 | 0.30 | 0.35 |
(2) Our conversion cost, cash cost, sustaining cash cost and AISC net of by-products credits are measured with respect to zinc sold.
| | 54 |
Earnings Release 3Q25 | |
3Q24
| US$ million (excepted indicated otherwise) |
Três Marias | Juiz de Fora | Cajamarquilla | Consolidation of Operations | Corporate | Smelting | |
| Sales Volume (Zinc content in Products) | |||||||
| Tonnes | 47,169 | 18,615 | 86,796 | 152,580 | 152,580 | ||
| (+) | COGS | 135.0 | 66.0 | 273.7 | 474.7 | (1.2) | 473.5 |
| (-) | Cost of freight | (3.6) | (1.5) | (12.9) | (18.0) | (18.0) | |
| (+) | On-site G&A | 0.5 | 0.3 | 1.3 | 2.1 | 0.0 | 2.1 |
| (-) | Depreciation, amortization and depletion | (9.1) | (4.4) | (10.4) | (23.8) | (23.8) | |
| (-) | By-products revenue | (3.8) | (7.5) | (41.6) | (53.0) | 1.2 | (51.8) |
| (-) | Workers participation & Bonus | (1.9) | (0.3) | (1.0) | (3.2) | (3.2) | |
| (+) | Others | 1.4 | 1.1 | 8.4 | 11.0 | 11.0 | |
| (=) | Cash Cost (Sold) | 118.6 | 53.7 | 217.5 | 389.8 | 0.0 | 389.8 |
| Cash Cost (Sold) (per ton) | 2,515.3 | 2,883.0 | 2,506.0 | 2,554.9 | 2,554.9 | ||
| (+) | Sustaining Capital Expenditure | 3.7 | 4.6 | 9.9 | 18.2 | 1.6 | 19.8 |
| (=) | Sustaining Cash Cost (Sold) | 122.3 | 58.3 | 227.4 | 408.0 | 1.6 | 409.6 |
| Sustaining Cash Cost (Sold) (per ton) | 2,593.3 | 3,131.3 | 2,619.8 | 2,674.0 | 2,684.6 | ||
| (+) | Workers participation & Bonus | 1.9 | 0.3 | 1.0 | 3.2 | 3.2 | |
| (+) | Corporate G&A | 6.9 | 6.9 | ||||
| (=) | AISC (Sold) | 419.7 | |||||
| (=) | AISC (Sold) (per ton) | 2,750.6 | |||||
| (=) | AISC (Sold) in US$/lb | 1.25 |
Note: Cash cost and AISC per ton sold does not include the impact of the cost of metal purchased for resale.
| US$ million (excepted indicated otherwise) |
Três Marias | Juiz de Fora | Cajamarquilla | Smelting | |
| Contained Zinc Sales | |||||
| Tonnes | 47,169 | 18,615 | 86,796 | 152,580 | |
| COGS | 135.0 | 66.0 | 273.7 | 474.7 | |
| (-) | Raw Material | (73.5) | (37.6) | (205.9) | (317.0) |
| (+) | By product cost | (12.9) | (0.6) | (5.9) | (19.4) |
| (+/-) | Consolidation effects | (1.2) | (2.4) | (0.2) | (3.8) |
| (+) | Others | (15.1) | (7.4) | (5.9) | (28.4) |
| (=) | Conversion Cost | 32.4 | 18.1 | 55.7 | 106.2 |
| (=) | Conversion Cost in US$/t | 686.4 | 971.2 | 641.7 | 695.7 |
| (=) | Conversion Cost in US$/lb | 0.31 | 0.44 | 0.29 | 0.32 |
(2) Our conversion cost, cash cost, sustaining cash cost and AISC net of by-products credits are measured with respect to zinc sold.
| | 55 |
Earnings Release 3Q25 | |
9M25
| US$ million (excepted indicated otherwise) |
Três Marias | Juiz de Fora | Cajamarquilla | Consolidation of Operations | Corporate | Smelting | |
| Sales Volume (Zinc content in Products) | |||||||
| Tonnes | 112,984 | 45,515 | 257,169 | 415,668 | 415,668 | ||
| (+) | COGS | 395.5 | 177.1 | 845.7 | 1,418.3 | (3.3) | 1,414.9 |
| (-) | Cost of freight | (8.3) | (2.1) | (37.9) | (48.4) | (48.4) | |
| (+) | On-site G&A | 2.1 | 1.0 | 7.3 | 10.4 | 0.0 | 10.4 |
| (-) | Depreciation, amortization and depletion | (23.2) | (12.0) | (35.2) | (70.3) | (70.3) | |
| (-) | By-products revenue | (11.4) | (18.6) | (146.8) | (176.8) | 3.3 | (173.5) |
| (-) | Workers participation & Bonus | (1.3) | (0.9) | (3.3) | (5.5) | (5.5) | |
| (+) | Others | 6.9 | 1.8 | 0.3 | 9.0 | 9.0 | |
| (=) | Cash Cost (Sold) | 360.4 | 146.3 | 630.0 | 1,136.7 | 0.0 | 1,136.7 |
| Cash Cost (Sold) (per ton) | 3,189.4 | 3,214.5 | 2,449.8 | 2,734.6 | 2,734.6 | ||
| (+) | Sustaining Capital Expenditure | 21.4 | 9.4 | 30.4 | 61.3 | (2.3) | 59.0 |
| (=) | Sustaining Cash Cost (Sold) | 381.7 | 155.7 | 660.5 | 1,197.9 | (2.3) | 1,195.7 |
| Sustaining Cash Cost (Sold) (per ton) | 3,378.7 | 3,421.9 | 2,568.2 | 2,882.0 | 2,876.5 | ||
| (+) | Workers participation & Bonus | 1.3 | 0.9 | 3.3 | 5.5 | 5.5 | |
| (+) | Corporate G&A | 23.7 | 23.7 | ||||
| (=) | AISC (Sold) | 1,224.8 | |||||
| (=) | AISC (Sold) (per ton) | 2,946.7 | |||||
| (=) | AISC (Sold) in US$/lb | 1.34 |
Note: Cash cost, conversion cost and AISC per ton sold does not include the impact of the cost of metal purchased for resale and the impact of the cost of idleness capacity of US$2.1 million in Juiz de Fora in 9M25.
| US$ million (excepted indicated otherwise) |
Três Marias | Juiz de Fora | Cajamarquilla | Smelting | |
| Contained Zinc Sales | |||||
| Tonnes | 112,984 | 45,515 | 257,169 | 415,668 | |
| COGS | 395.5 | 177.1 | 845.7 | 1,418.3 | |
| (-) | Raw Material | (195.0) | (90.0) | (626.5) | (911.6) |
| (+) | By product cost | (39.5) | (1.7) | (17.9) | (59.1) |
| (+/-) | Consolidation effects | (0.3) | 0.8 | (52.7) | (52.3) |
| (+) | Others | (71.4) | (30.0) | 17.5 | (83.8) |
| (=) | Conversion Cost | 89.3 | 56.2 | 166.1 | 311.6 |
| (=) | Conversion Cost in US$/t | 790.2 | 1,234.0 | 646.0 | 749.6 |
| (=) | Conversion Cost in US$/lb | 0.36 | 0.56 | 0.29 | 0.34 |
(2) Our conversion cost, cash cost, sustaining cash cost and AISC net of by-products credits are measured with respect to zinc sold.
| | 56 |
Earnings Release 3Q25 | |
9M24
| US$ million (excepted indicated otherwise) |
Três Marias | Juiz de Fora | Cajamarquilla | Consolidation of Operations | Corporate | Smelting | |
| Sales Volume (Zinc content in Products) | |||||||
| Tonnes | 135,482 | 59,443 | 242,925 | 437,850 | 437,850 | ||
| (+) | COGS | 376.8 | 190.8 | 737.3 | 1,304.9 | (2.9) | 1,302.0 |
| (-) | Cost of freight | (10.6) | (4.4) | (34.7) | (49.7) | (49.7) | |
| (+) | On-site G&A | 1.5 | 0.8 | 3.9 | 6.2 | 0.0 | 6.2 |
| (-) | Depreciation, amortization and depletion | (21.0) | (11.2) | (31.1) | (63.3) | (63.3) | |
| (-) | By-products revenue | (11.7) | (20.2) | (112.0) | (144.0) | 2.9 | (141.1) |
| (-) | Workers participation & Bonus | (6.0) | (1.4) | (4.7) | (12.2) | (12.2) | |
| (+) | Others | 5.4 | 4.1 | 22.8 | 32.3 | 32.3 | |
| (=) | Cash Cost (Sold) | 334.4 | 158.5 | 581.4 | 1,074.2 | 0.0 | 1,074.2 |
| Cash Cost (Sold) (per ton) | 2,468.3 | 2,665.9 | 2,393.1 | 2,453.4 | 2,453.4 | ||
| (+) | Sustaining Capital Expenditure | 12.2 | 7.4 | 34.2 | 53.7 | (4.0) | 49.7 |
| (=) | Sustaining Cash Cost (Sold) | 346.6 | 165.8 | 615.5 | 1,128.0 | (4.0) | 1,123.9 |
| Sustaining Cash Cost (Sold) (per ton) | 2,558.3 | 2,789.7 | 2,533.9 | 2,576.2 | 2,567.0 | ||
| (+) | Workers participation & Bonus | 6.0 | 1.4 | 4.7 | 12.2 | 12.2 | |
| (+) | Corporate G&A | 21.5 | 21.5 | ||||
| (=) | AISC (Sold) | 1,157.6 | |||||
| (=) | AISC (Sold) (per ton) | 2,643.8 | |||||
| (=) | AISC (Sold) in US$/lb | 1.20 |
Note: Cash cost and AISC per ton sold does not include the impact of the cost of metal purchased for resale.
| US$ million (excepted indicated otherwise) |
Três Marias | Juiz de Fora | Cajamarquilla | Smelting | |
| Contained Zinc Sales | |||||
| Tonnes | 135,482 | 59,443 | 242,925 | 437,850 | |
| COGS | 376.8 | 190.8 | 737.3 | 1,304.9 | |
| (-) | Raw Material | (195.6) | (105.9) | (528.3) | (829.7) |
| (+) | By product cost | (41.8) | (2.1) | (19.9) | (63.8) |
| (+/-) | Consolidation effects | 0.3 | (3.4) | (26.6) | (29.7) |
| (+) | Others | (51.3) | (23.2) | (12.4) | (86.9) |
| (=) | Conversion Cost | 88.5 | 56.1 | 150.1 | 294.7 |
| (=) | Conversion Cost in US$/t | 653.3 | 943.5 | 618.0 | 673.1 |
| (=) | Conversion Cost in US$/lb | 0.30 | 0.43 | 0.28 | 0.31 |
(2) Our conversion cost, cash cost, sustaining cash cost and AISC net of by-products credits are measured with respect to zinc sold.
| | 57 |