Third Quarter 2025 Financial Results November 5, 2025 Burford Capital This presentation is for the use of Burford’s public shareholders and is not an offering of any Burford private fund.

Notice & disclaimer This presentation (this “Presentation”) provides certain information to facilitate review and understanding of the business, financial condition and results of operations of Burford Capital Limited (together with its subsidiaries, the “Company”, “Burford”, “we”, “our” or “us”) as of and for the three and nine months ended September 30, 2025 and does not purport to be a complete description of the Company’s business, financial condition or results of operations. The information contained in this Presentation is provided as of the dates and for the periods indicated in this Presentation and is subject to change without notice. The financial condition and results of operations as of and for the three and nine months ended September 30, 2025 are not necessarily indicative of the results that may be expected for the full year ending December 31, 2025. Forward-looking statements. This Presentation contains “forward-looking statements” within the meaning of Section 27A of the US Securities Act of 1933, as amended, and Section 21E of the US Securities Exchange Act of 1934, as amended, that are intended to be covered by the safe harbor provided for under these sections. In some cases, words such as “aim”, “anticipate”, “believe”, “continue”, “could”, “estimate”, “expect”, “forecast”, “guidance”, “intend”, “may”, “plan”, “potential”, “predict”, “projected”, “should” or “will”, or the negative of such terms or other comparable terminology, are intended to identify forward-looking statements. Although the Company believes that the assumptions, expectations, projections, intentions and beliefs about future results and events reflected in forward-looking statements have a reasonable basis and are expressed in good faith, forward-looking statements involve known and unknown risks, uncertainties and other factors, which could cause the Company’s actual results and events to differ materially from (and be more negative than) future results and events expressed, targeted, projected or implied by these forward-looking statements. Factors that might cause future results and events to differ include, among others, the following: (i) adverse litigation outcomes and timing of resolution of litigation matters; (ii) the Company’s ability to identify and select suitable legal finance assets; (iii) improper use or disclosure of, or access to, privileged information under the Company’s control due to cybersecurity breaches, unauthorized use or theft; (iv) inaccuracy or failure of the probabilistic model and decision science tools, including machine learning technology and generative artificial intelligence (collectively, “AI technologies”), the Company uses to predict the returns on its legal finance assets and in its operations; (v) changes and uncertainty in laws, regulations and rules relating to the legal finance industry, including those relating to privileged information and/or disclosure and enforceability of legal finance arrangements; (vi) inadequacies in the Company’s due diligence process or unforeseen developments; (vii) credit risk and concentration risk relating to the Company’s legal finance assets; (viii) lack of liquidity of the Company’s legal finance assets and commitments in excess of its available capital; (ix) the Company’s ability to obtain attractive external capital, refinance its outstanding indebtedness or raise capital to meet its liquidity needs; (x) competitive factors and demand for the Company’s services and capital; (xi) failure of lawyers to prosecute and/or defend claims which the Company has financed with necessary skill and care or misalignment of their clients’ interests with the Company’s; (xii) poor performance by the commitments the Company makes on behalf of its private funds; (xiii) negative publicity or public perception of the legal finance industry or the Company; (xiv) valuation uncertainty with respect to the fair value of the Company’s capital provision assets; (xv) current and future legal, political and economic factors, including uncertainty surrounding the effects, severity and duration of public health threats and/or military actions; (xvi) developments in AI technologies and expectations relating to environmental, social and governance considerations; (xvii) potential liability from litigation and legal proceedings against the Company; (xviii) the Company’s ability to hire and retain key personnel; (xix) risks relating to the Company’s international operations as a result of differing legal and regulatory requirements, political, social and economic conditions and unforeseeable developments; (xx) exposure to foreign currency exchange rate fluctuations; (xxi) uncertainty relating to the tax treatment of the Company’s financing arrangements; (xxii) cybersecurity risks and improper functioning of the Company’s information systems or those of its third-party service providers; (xxiii) failure of the Company’s third-party service providers to fulfill their obligations or misconduct by its third-party service providers; (xxiv) failure by the Company to maintain the privacy and security of personal information and comply with applicable data privacy and protection laws and regulations; (xxv) failure by the Company to maintain effective internal control over financial reporting or effective disclosure controls and procedures; (xxvi) failure by the Company to comply with the requirements of being a US domestic public company and the costs associated therewith; and (xxvii) certain risks relating to the Company’s incorporation in Guernsey. These factors should not be construed as exhaustive and should be read in conjunction with the other cautionary statements contained in the Company’s periodic and current reports that it files with or furnishes to the US Securities and Exchange Commission (the “SEC"). Many of these factors are beyond the Company’s ability to control or predict, and new factors emerge from time to time. Furthermore, the Company cannot assess the impact of each such factor on its business or the extent to which any factor or combination of factors may cause actual results and events to be materially different from those contained in any forward- looking statement. Given these uncertainties, readers are cautioned not to place undue reliance on the Company’s forward-looking statements. All subsequent written and oral forward- looking statements attributable to the Company or to persons acting on its behalf are expressly qualified in their entirety by these cautionary statements. The forward-looking statements speak only as of the date of this Presentation and, except as required by applicable law, the Company undertakes no obligation to update or revise any forward-looking statements, whether as a result of new information, future events or otherwise. In addition to forward-looking statements, this Presentation includes certain data based on calculations derived from the Company’s probabilistic modeling of individual matters and its portfolio as a whole. This data is not a forecast of future results, and past performance is not a guide to future performance. The inherent volatility and unpredictability of legal finance assets precludes forecasting and limits the predictive nature of the Company’s probabilistic model. Furthermore, the inherent nature of the probabilistic model is that actual results will differ from the modeled results, and such differences could be material. The data based on calculations derived from the Company’s probabilistic model contained in this Presentation is for informational purposes only and is not intended to be a profit forecast or be relied upon as a guide to future performance.

Notice & disclaimer Basis of presentation; non-GAAP financial measures; key performance indicators; definitions. The Company reports its financial results in accordance with the generally accepted accounting principles in the United States (“US GAAP”). US GAAP requires the Company to present financial statements that consolidate some of the limited partner interests in private funds the Company manages as well as assets held on the Company’s balance sheet where it has a partner or minority investor. As a result, the Company uses various measures, including Burford-only and adjusted Burford-only financial measures, which are calculated and presented using methodologies other than in accordance with US GAAP, to supplement analysis and discussion of its consolidated financial statements prepared in accordance with US GAAP. The Company believes that the presentation of Burford-only financial measures is consistent with how management measures and assesses the performance of the Company’s reporting segments, which are evaluated by management on a Burford-only basis, and that the presentation of Burford-only and adjusted Burford-only financial measures provides valuable and useful information to investors to aid in understanding the Company’s performance in addition to its consolidated financial statements prepared in accordance with US GAAP by eliminating the effect of the consolidation. In addition, the Company’s segment reporting, which conveys the performance of its business across two reportable segments—Principal Finance and Asset Management and Other Services—is presented on a Burford-only basis. The Company refers to its segment reporting in the aggregate as “total segments”. The Company also uses additional non-GAAP financial measures, such as cash receipts, tangible book value attributable to Burford Capital Limited per ordinary share (“TBVPS”) and various indebtedness leverage ratios. The Company believes that (i) cash receipts are an important measure of the Company’s operating and financial performance and are useful to management and investors when assessing the performance of Burford-only capital provision assets and (ii) TBVPS is an important measure of the Company’s financial condition and is useful to management and investors when assessing capital adequacy and the Company’s ability to generate earnings on tangible equity invested by its shareholders. The non-GAAP financial measures should not be considered in isolation from, as substitutes for, or superior to, financial measures calculated in accordance with US GAAP. In addition, the Company uses certain unaudited key performance indicators(“KPIs”). The KPIs are presented because the Company uses them to monitor its financial condition and results of operations and/or the Company believes they are useful to investors, securities analysts and other interested parties. The presentation of the KPIs is for informational purposes only and does not purport to present what the Company’s actual financial condition or results of operations would have been, nor does it project its financial condition at any future date or its results of operations for any future period. The presentation of the KPIs is based on information available as of the date of this Presentation and certain assumptions and estimates that the Company believes are reasonable. Additional information with respect to these non- GAAP financial measures and KPIs, their respective definitions and calculations and related reconciliations are provided in “Other Reconciliations” and “Glossary” sections of this Presentation. * * * * * The Company makes no representation or warranty, express or implied, as to the fairness, accuracy, reasonableness or completeness of the information contained in this Presentation, including information obtained from third parties. Unless otherwise specified, information contained in this Presentation is sourced from and reflects the views and opinions of the Company. Certain information contained in this Presentation has been obtained from sources other than the Company. While such information is believed to be reliable for purposes used in this Presentation, no representations are made as to the accuracy or completeness thereof, and the Company does not take any responsibility for such information. Certain information contained in this Presentation discusses general market activity, industry or sector trends or other broad-based economic, market or political conditions and should not be construed as research or investment advice. There can be no assurances that any of the trends described in this Presentation will continue or will not reverse. Past events, trends and results do not imply, predict or guarantee, and are not necessarily indicative of, future events, trends or results. This Presentation is not complete, and the information contained in this Presentation may change at any time without notice. The Company does not have any responsibility to update this Presentation to account for such changes. The information contained in this Presentation is not intended to provide, and should not be relied upon for, accounting, legal or tax advice or investment recommendations. Neither the Company, its affiliates nor any officer, director, employee or representative of the Company or its affiliates accepts any liability whatsoever for any loss howsoever arising, directly or indirectly, from any use of this Presentation or its contents. * * * * * This Presentation does not constitute or form part of, and should not be construed as, an issue for sale or subscription of, or solicitation of any offer or invitation to subscribe for, underwrite or otherwise acquire or dispose of any securities of the Company or any of its affiliates, nor should this Presentation or any part of it form the basis of, or be relied on in connection with, any contract or commitment whatsoever which may at any time be entered into by the recipient nor any other person, nor does this Presentation constitute an invitation or inducement to engage in investment activity under Section 21 of the Financial Services and Markets Act 2000, as amended. This Presentation does not constitute an invitation to effect any transaction with the Company or any of its affiliates or to make use of any services provided by the Company. This Presentation does not constitute an offer to sell, or a solicitation of an offer to buy, any ordinary shares or other securities of the Company or any of its affiliates. This Presentation is not an offering of any private fund of the Company. Burford Capital Investment Management LLC, which acts as the fund manager of all private funds of the Company, is registered as an investment adviser with the SEC. The information relating to the private funds of the Company provided in this Presentation is for informational purposes only. Past performance is not indicative of future results. Any information contained in this Presentation is not, and should not be construed as, an offer to sell or the solicitation of an offer to buy any securities (including interests or shares in the private funds). Any such offer or solicitation may be made only by means of a final confidential private placement memorandum and other offering documents.
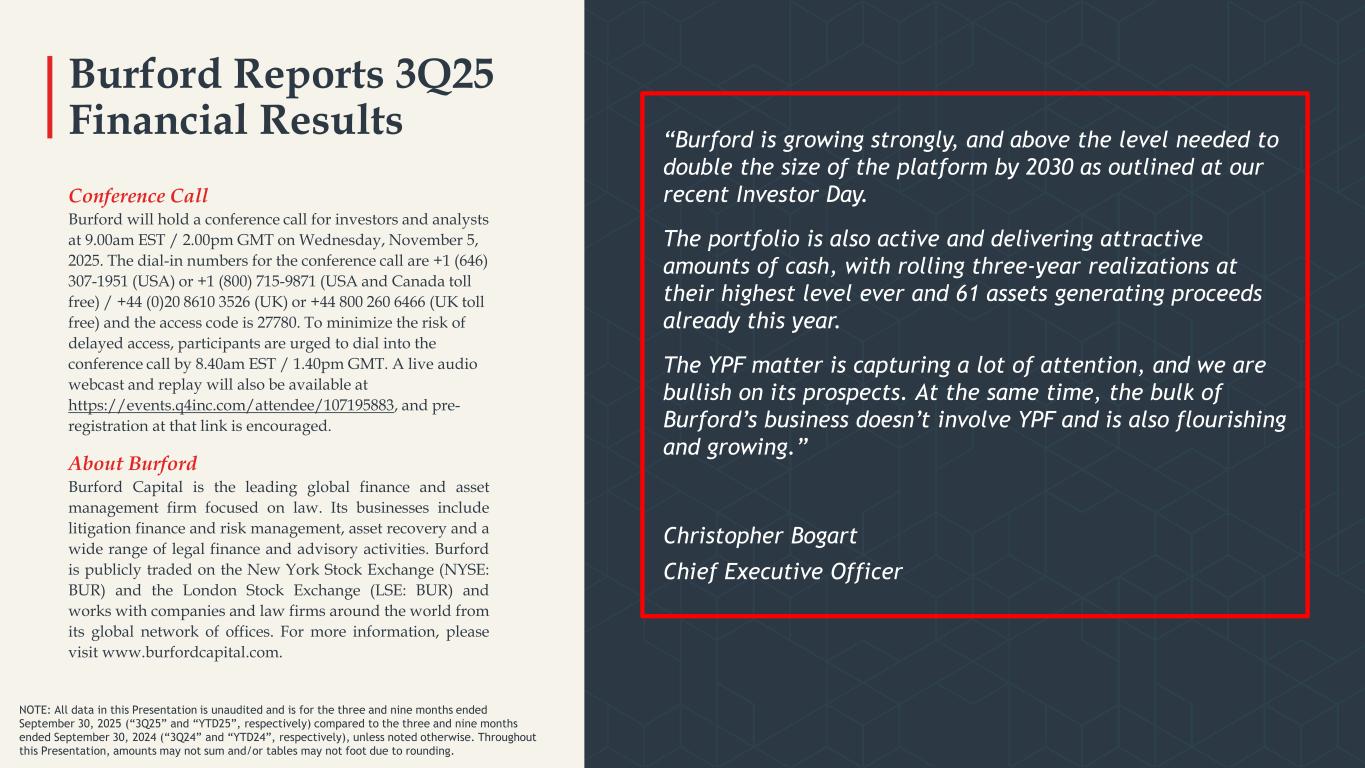
Burford Reports 3Q25 Financial Results “Burford is growing strongly, and above the level needed to double the size of the platform by 2030 as outlined at our recent Investor Day. The portfolio is also active and delivering attractive amounts of cash, with rolling three-year realizations at their highest level ever and 61 assets generating proceeds already this year. The YPF matter is capturing a lot of attention, and we are bullish on its prospects. At the same time, the bulk of Burford’s business doesn’t involve YPF and is also flourishing and growing.” Christopher Bogart Chief Executive Officer Conference Call Burford will hold a conference call for investors and analysts at 9.00am EST / 2.00pm GMT on Wednesday, November 5, 2025. The dial-in numbers for the conference call are +1 (646) 307-1951 (USA) or +1 (800) 715-9871 (USA and Canada toll free) / +44 (0)20 8610 3526 (UK) or +44 800 260 6466 (UK toll free) and the access code is 27780. To minimize the risk of delayed access, participants are urged to dial into the conference call by 8.40am EST / 1.40pm GMT. A live audio webcast and replay will also be available at https://events.q4inc.com/attendee/107195883, and pre- registration at that link is encouraged. About Burford Burford Capital is the leading global finance and asset management firm focused on law. Its businesses include litigation finance and risk management, asset recovery and a wide range of legal finance and advisory activities. Burford is publicly traded on the New York Stock Exchange (NYSE: BUR) and the London Stock Exchange (LSE: BUR) and works with companies and law firms around the world from its global network of offices. For more information, please visit www.burfordcapital.com. NOTE: All data in this Presentation is unaudited and is for the three and nine months ended September 30, 2025 (“3Q25” and “YTD25”, respectively) compared to the three and nine months ended September 30, 2024 (“3Q24” and “YTD24”, respectively), unless noted otherwise. Throughout this Presentation, amounts may not sum and/or tables may not foot due to rounding.
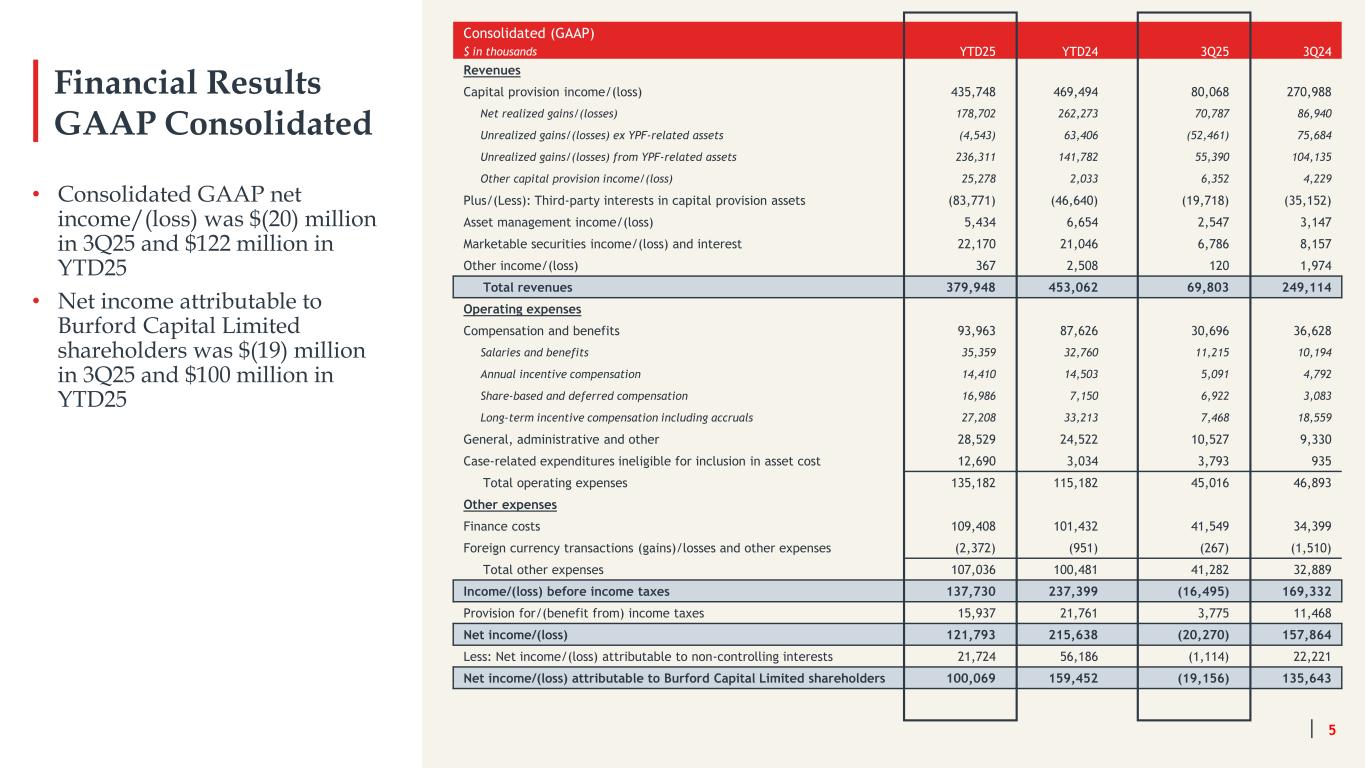
Financial Results GAAP Consolidated Consolidated (GAAP) $ in thousands YTD25 YTD24 3Q25 3Q24 Revenues Capital provision income/(loss) 435,748 469,494 80,068 270,988 Net realized gains/(losses) 178,702 262,273 70,787 86,940 Unrealized gains/(losses) ex YPF-related assets (4,543) 63,406 (52,461) 75,684 Unrealized gains/(losses) from YPF-related assets 236,311 141,782 55,390 104,135 Other capital provision income/(loss) 25,278 2,033 6,352 4,229 Plus/(Less): Third-party interests in capital provision assets (83,771) (46,640) (19,718) (35,152) Asset management income/(loss) 5,434 6,654 2,547 3,147 Marketable securities income/(loss) and interest 22,170 21,046 6,786 8,157 Other income/(loss) 367 2,508 120 1,974 Total revenues 379,948 453,062 69,803 249,114 Operating expenses Compensation and benefits 93,963 87,626 30,696 36,628 Salaries and benefits 35,359 32,760 11,215 10,194 Annual incentive compensation 14,410 14,503 5,091 4,792 Share-based and deferred compensation 16,986 7,150 6,922 3,083 Long-term incentive compensation including accruals 27,208 33,213 7,468 18,559 General, administrative and other 28,529 24,522 10,527 9,330 Case-related expenditures ineligible for inclusion in asset cost 12,690 3,034 3,793 935 Total operating expenses 135,182 115,182 45,016 46,893 Other expenses Finance costs 109,408 101,432 41,549 34,399 Foreign currency transactions (gains)/losses and other expenses (2,372) (951) (267) (1,510) Total other expenses 107,036 100,481 41,282 32,889 Income/(loss) before income taxes 137,730 237,399 (16,495) 169,332 Provision for/(benefit from) income taxes 15,937 21,761 3,775 11,468 Net income/(loss) 121,793 215,638 (20,270) 157,864 Less: Net income/(loss) attributable to non-controlling interests 21,724 56,186 (1,114) 22,221 Net income/(loss) attributable to Burford Capital Limited shareholders 100,069 159,452 (19,156) 135,643 5 • Consolidated GAAP net income/(loss) was $(20) million in 3Q25 and $122 million in YTD25 • Net income attributable to Burford Capital Limited shareholders was $(19) million in 3Q25 and $100 million in YTD25

Key Messages on 3Q25 Results and Our Business
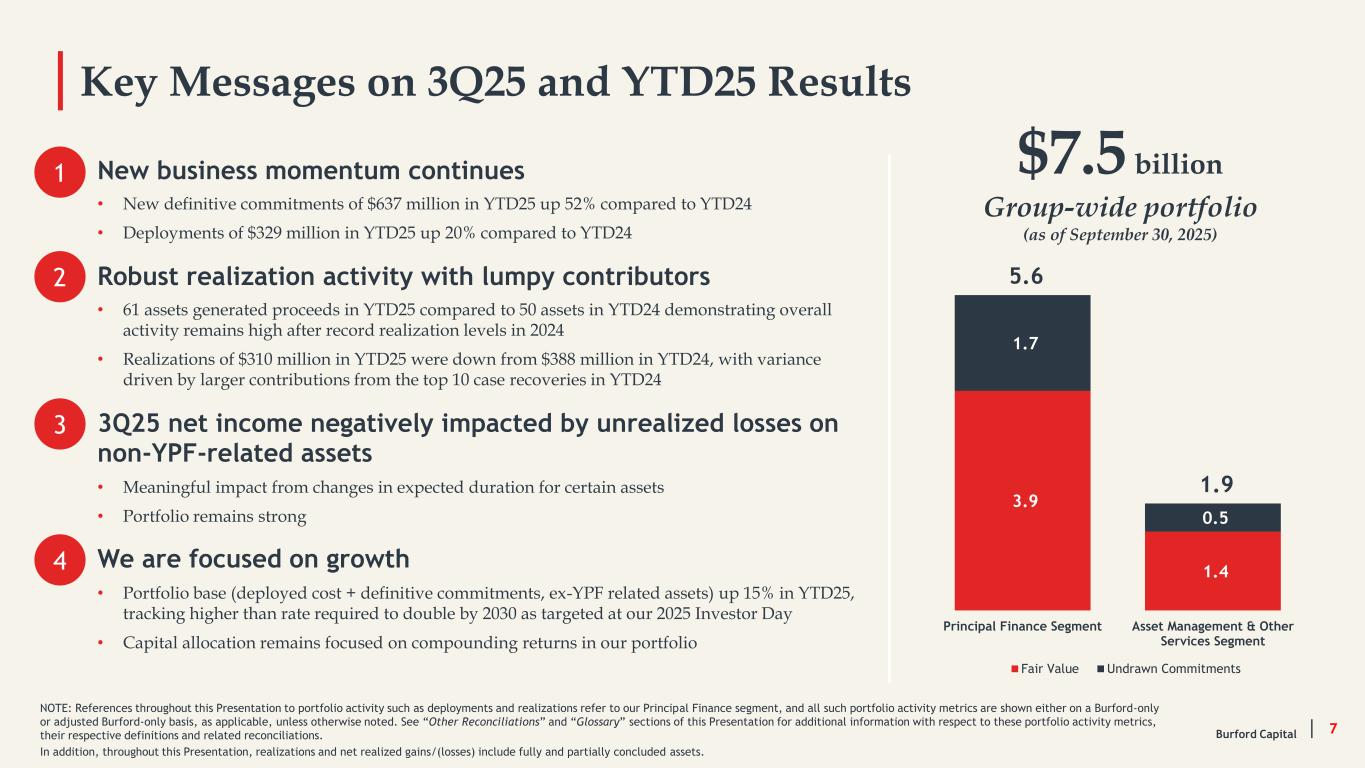
Key Messages on 3Q25 and YTD25 Results 7 New business momentum continues • New definitive commitments of $637 million in YTD25 up 52% compared to YTD24 • Deployments of $329 million in YTD25 up 20% compared to YTD24 Robust realization activity with lumpy contributors • 61 assets generated proceeds in YTD25 compared to 50 assets in YTD24 demonstrating overall activity remains high after record realization levels in 2024 • Realizations of $310 million in YTD25 were down from $388 million in YTD24, with variance driven by larger contributions from the top 10 case recoveries in YTD24 3Q25 net income negatively impacted by unrealized losses on non-YPF-related assets • Meaningful impact from changes in expected duration for certain assets • Portfolio remains strong We are focused on growth • Portfolio base (deployed cost + definitive commitments, ex-YPF related assets) up 15% in YTD25, tracking higher than rate required to double by 2030 as targeted at our 2025 Investor Day • Capital allocation remains focused on compounding returns in our portfolio NOTE: References throughout this Presentation to portfolio activity such as deployments and realizations refer to our Principal Finance segment, and all such portfolio activity metrics are shown either on a Burford-only or adjusted Burford-only basis, as applicable, unless otherwise noted. See “Other Reconciliations” and “Glossary” sections of this Presentation for additional information with respect to these portfolio activity metrics, their respective definitions and related reconciliations. In addition, throughout this Presentation, realizations and net realized gains/(losses) include fully and partially concluded assets. Burford Capital 3.9 1.4 1.7 0.5 5.6 1.9 Principal Finance Segment Asset Management & Other Services Segment Fair Value Undrawn Commitments 1 2 3 $7.5 billion Group-wide portfolio (as of September 30, 2025) 4
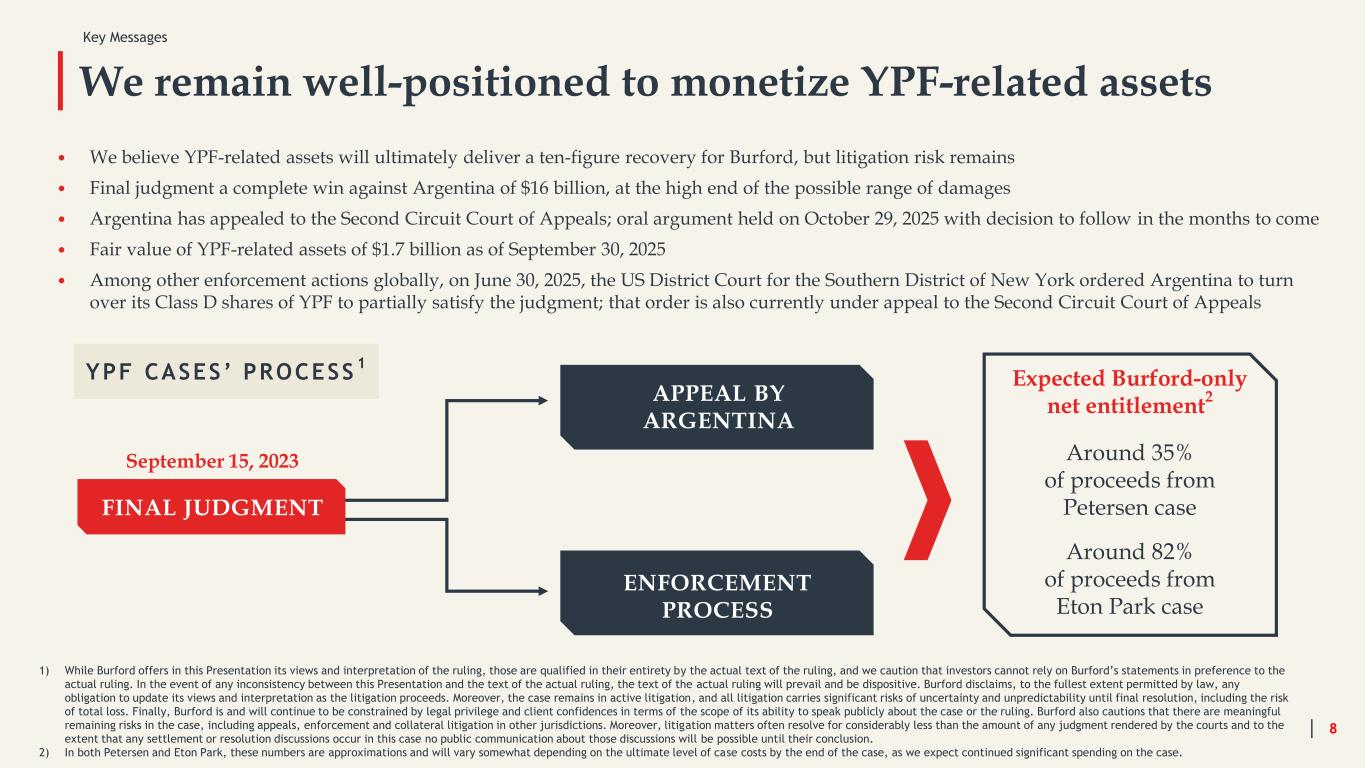
We remain well-positioned to monetize YPF-related assets 8 • We believe YPF-related assets will ultimately deliver a ten-figure recovery for Burford, but litigation risk remains • Final judgment a complete win against Argentina of $16 billion, at the high end of the possible range of damages • Argentina has appealed to the Second Circuit Court of Appeals; oral argument held on October 29, 2025 with decision to follow in the months to come • Fair value of YPF-related assets of $1.7 billion as of September 30, 2025 • Among other enforcement actions globally, on June 30, 2025, the US District Court for the Southern District of New York ordered Argentina to turn over its Class D shares of YPF to partially satisfy the judgment; that order is also currently under appeal to the Second Circuit Court of Appeals YPF CASES’ PROCESS 1 Expected Burford-only net entitlement 2 Around 35% of proceeds from Petersen case Around 82% of proceeds from Eton Park case ENFORCEMENT PROCESS September 15, 2023 FINAL JUDGMENT APPEAL BY ARGENTINA 1) While Burford offers in this Presentation its views and interpretation of the ruling, those are qualified in their entirety by the actual text of the ruling, and we caution that investors cannot rely on Burford’s statements in preference to the actual ruling. In the event of any inconsistency between this Presentation and the text of the actual ruling, the text of the actual ruling will prevail and be dispositive. Burford disclaims, to the fullest extent permitted by law, any obligation to update its views and interpretation as the litigation proceeds. Moreover, the case remains in active litigation, and all litigation carries significant risks of uncertainty and unpredictability until final resolution, including the risk of total loss. Finally, Burford is and will continue to be constrained by legal privilege and client confidences in terms of the scope of its ability to speak publicly about the case or the ruling. Burford also cautions that there are meaningful remaining risks in the case, including appeals, enforcement and collateral litigation in other jurisdictions. Moreover, litigation matters often resolve for considerably less than the amount of any judgment rendered by the courts and to the extent that any settlement or resolution discussions occur in this case no public communication about those discussions will be possible until their conclusion. 2) In both Petersen and Eton Park, these numbers are approximations and will vary somewhat depending on the ultimate level of case costs by the end of the case, as we expect continued significant spending on the case. Key Messages
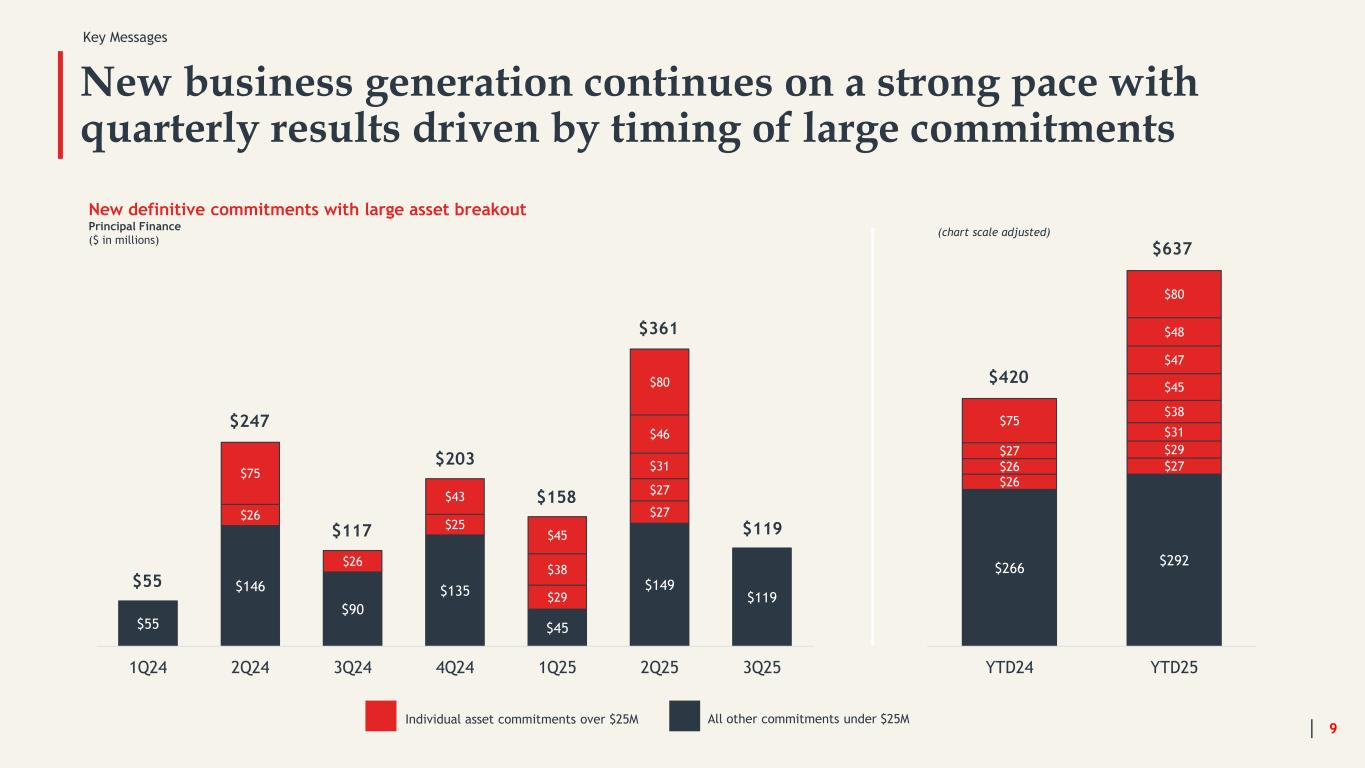
New business generation continues on a strong pace with quarterly results driven by timing of large commitments 9 $55 $146 $90 $135 $45 $149 $119 $26 $26 $25 $29 $27 $75 $43 $38 $27 $45 $31 $46 $80 1Q24 2Q24 3Q24 4Q24 1Q25 2Q25 3Q25 $55 $247 $117 $203 $158 $361 $119 Individual asset commitments over $25M All other commitments under $25M New definitive commitments with large asset breakout Principal Finance ($ in millions) Key Messages $266 $292 $26 $27$26 $29$27 $31 $75 $38 $45 $47 $48 $80 YTD24 YTD25 $420 $637 (chart scale adjusted)
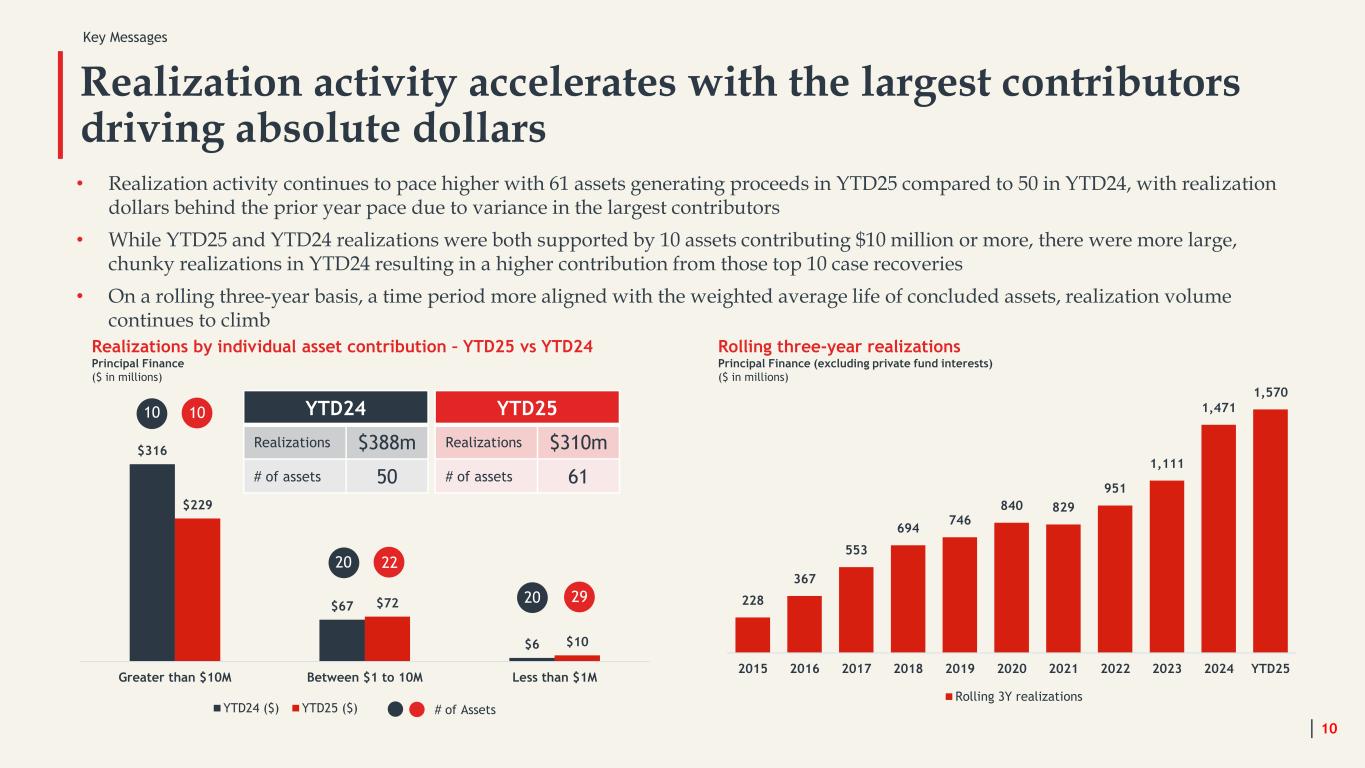
Realization activity accelerates with the largest contributors driving absolute dollars 10 • Realization activity continues to pace higher with 61 assets generating proceeds in YTD25 compared to 50 in YTD24, with realization dollars behind the prior year pace due to variance in the largest contributors • While YTD25 and YTD24 realizations were both supported by 10 assets contributing $10 million or more, there were more large, chunky realizations in YTD24 resulting in a higher contribution from those top 10 case recoveries • On a rolling three-year basis, a time period more aligned with the weighted average life of concluded assets, realization volume continues to climb 228 367 553 694 746 840 829 951 1,111 1,471 1,570 2015 2016 2017 2018 2019 2020 2021 2022 2023 2024 YTD25 Rolling 3Y realizations Rolling three-year realizations Principal Finance (excluding private fund interests) ($ in millions) $316 $67 $6 $229 $72 $10 Greater than $10M Between $1 to 10M Less than $1M YTD24 ($) YTD25 ($) Realizations by individual asset contribution – YTD25 vs YTD24 Principal Finance ($ in millions) YTD25 Realizations $310m # of assets 61 YTD24 Realizations $388m # of assets 50 1010 2220 2920 # of Assets Key Messages
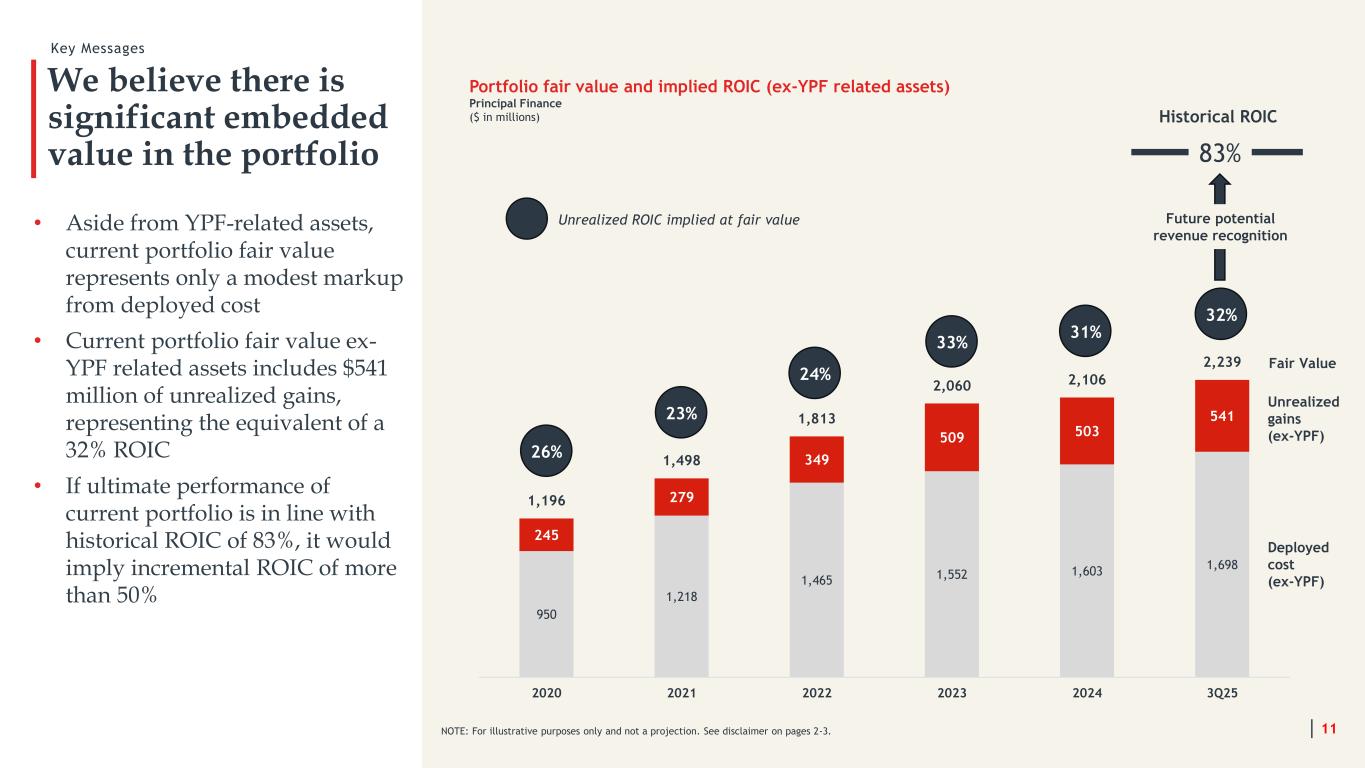
We believe there is significant embedded value in the portfolio • Aside from YPF-related assets, current portfolio fair value represents only a modest markup from deployed cost • Current portfolio fair value ex- YPF related assets includes $541 million of unrealized gains, representing the equivalent of a 32% ROIC • If ultimate performance of current portfolio is in line with historical ROIC of 83%, it would imply incremental ROIC of more than 50% 11 950 1,218 1,465 1,552 1,603 1,698 245 279 349 509 503 541 1,196 1,498 1,813 2,060 2,106 2,239 2020 2021 2022 2023 2024 3Q25 26% 23% 24% 33% 31% 32% Historical ROIC Unrealized ROIC implied at fair value Deployed cost (ex-YPF) Unrealized gains (ex-YPF) Fair Value Portfolio fair value and implied ROIC (ex-YPF related assets) Principal Finance ($ in millions) Key Messages 83% Future potential revenue recognition NOTE: For illustrative purposes only and not a projection. See disclaimer on pages 2-3.
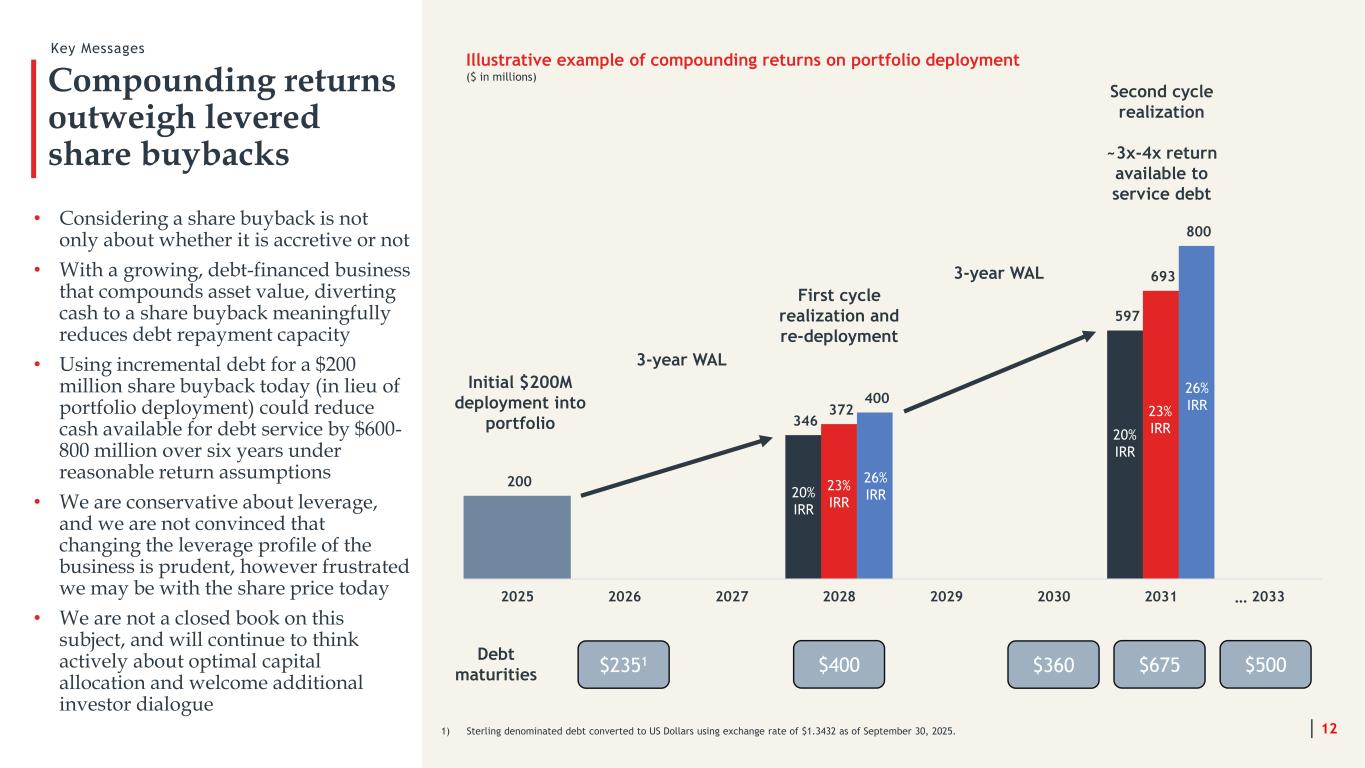
346 597 200 372 693 400 800 2025 2026 2027 2028 2029 2030 2031 2033 Compounding returns outweigh levered share buybacks • Considering a share buyback is not only about whether it is accretive or not • With a growing, debt-financed business that compounds asset value, diverting cash to a share buyback meaningfully reduces debt repayment capacity • Using incremental debt for a $200 million share buyback today (in lieu of portfolio deployment) could reduce cash available for debt service by $600- 800 million over six years under reasonable return assumptions • We are conservative about leverage, and we are not convinced that changing the leverage profile of the business is prudent, however frustrated we may be with the share price today • We are not a closed book on this subject, and will continue to think actively about optimal capital allocation and welcome additional investor dialogue 12 Second cycle realization ~3x-4x return available to service debt Initial $200M deployment into portfolio 3-year WAL First cycle realization and re-deployment 3-year WAL Illustrative example of compounding returns on portfolio deployment ($ in millions) $2351 $400 $360 $675 $500 … Debt maturities Key Messages 20% IRR 23% IRR 26% IRR 20% IRR 23% IRR 26% IRR 1) Sterling denominated debt converted to US Dollars using exchange rate of $1.3432 as of September 30, 2025.
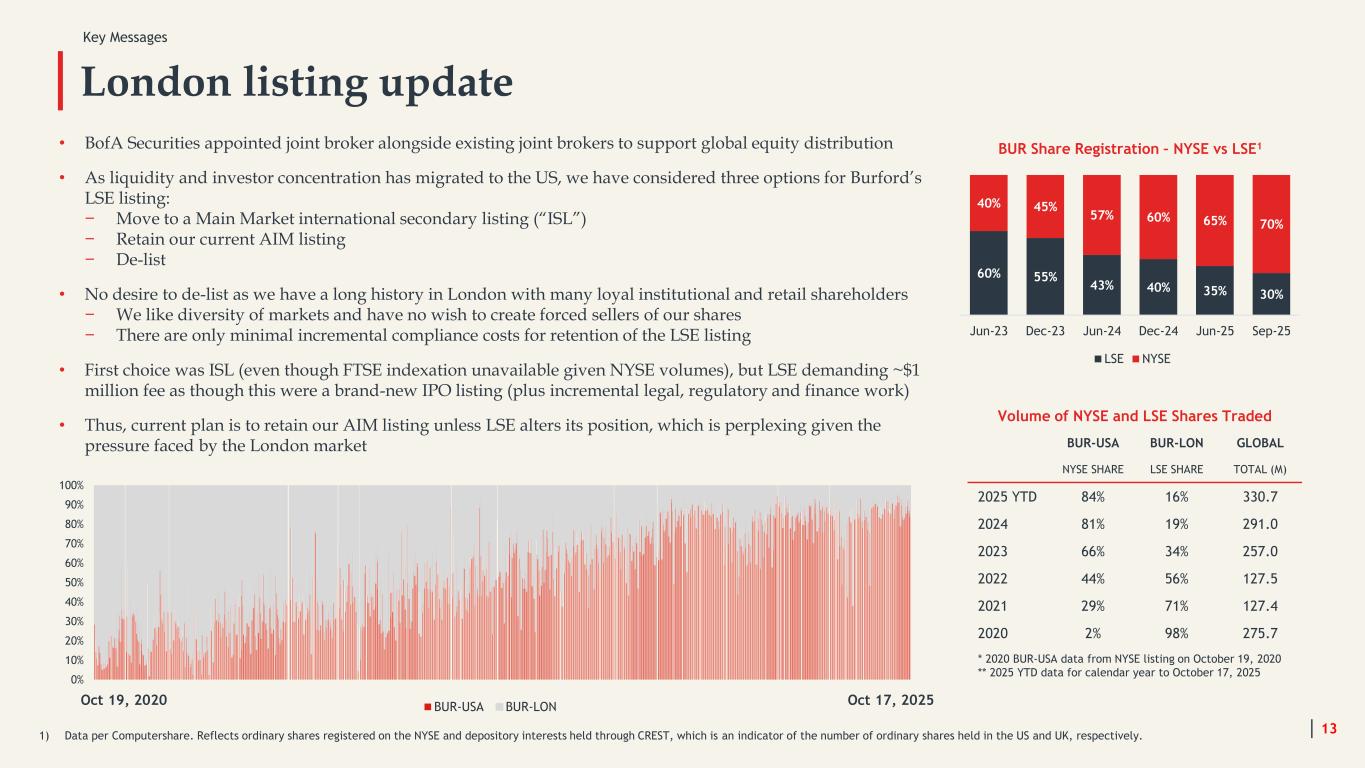
London listing update 13 • BofA Securities appointed joint broker alongside existing joint brokers to support global equity distribution • As liquidity and investor concentration has migrated to the US, we have considered three options for Burford’s LSE listing: − Move to a Main Market international secondary listing (“ISL”) − Retain our current AIM listing − De-list • No desire to de-list as we have a long history in London with many loyal institutional and retail shareholders − We like diversity of markets and have no wish to create forced sellers of our shares − There are only minimal incremental compliance costs for retention of the LSE listing • First choice was ISL (even though FTSE indexation unavailable given NYSE volumes), but LSE demanding ~$1 million fee as though this were a brand-new IPO listing (plus incremental legal, regulatory and finance work) • Thus, current plan is to retain our AIM listing unless LSE alters its position, which is perplexing given the pressure faced by the London market 0% 10% 20% 30% 40% 50% 60% 70% 80% 90% 100% BUR-USA BUR-LON Volume of NYSE and LSE Shares Traded BUR-USA BUR-LON GLOBAL NYSE SHARE LSE SHARE TOTAL (M) 2025 YTD 84% 16% 330.7 2024 81% 19% 291.0 2023 66% 34% 257.0 2022 44% 56% 127.5 2021 29% 71% 127.4 2020 2% 98% 275.7 * 2020 BUR-USA data from NYSE listing on October 19, 2020 ** 2025 YTD data for calendar year to October 17, 2025 Oct 19, 2020 Oct 17, 2025 60% 55% 43% 40% 35% 30% 40% 45% 57% 60% 65% 70% Jun-23 Dec-23 Jun-24 Dec-24 Jun-25 Sep-25 BUR Share Registration – NYSE vs LSE1 LSE NYSE Key Messages 1) Data per Computershare. Reflects ordinary shares registered on the NYSE and depository interests held through CREST, which is an indicator of the number of ordinary shares held in the US and UK, respectively.

Total Segments
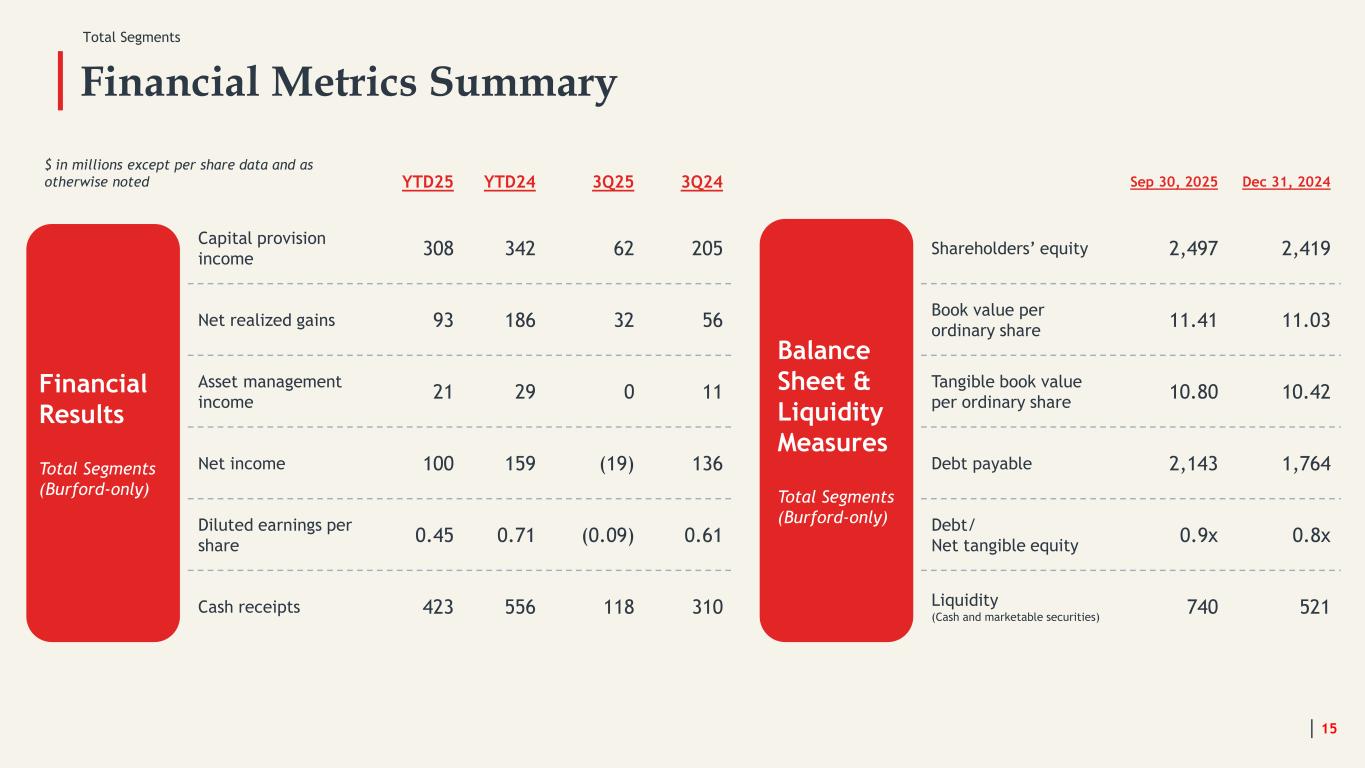
Financial Metrics Summary $ in millions except per share data and as otherwise noted YTD25 YTD24 3Q25 3Q24 Capital provision income 308 342 62 205 Net realized gains 93 186 32 56 Asset management income 21 29 0 11 Net income 100 159 (19) 136 Diluted earnings per share 0.45 0.71 (0.09) 0.61 Cash receipts 423 556 118 310 Sep 30, 2025 Dec 31, 2024 Shareholders’ equity 2,497 2,419 Book value per ordinary share 11.41 11.03 Tangible book value per ordinary share 10.80 10.42 Debt payable 2,143 1,764 Debt/ Net tangible equity 0.9x 0.8x Liquidity (Cash and marketable securities) 740 521 Financial Results Total Segments (Burford-only) Balance Sheet & Liquidity Measures Total Segments (Burford-only) 15 Total Segments
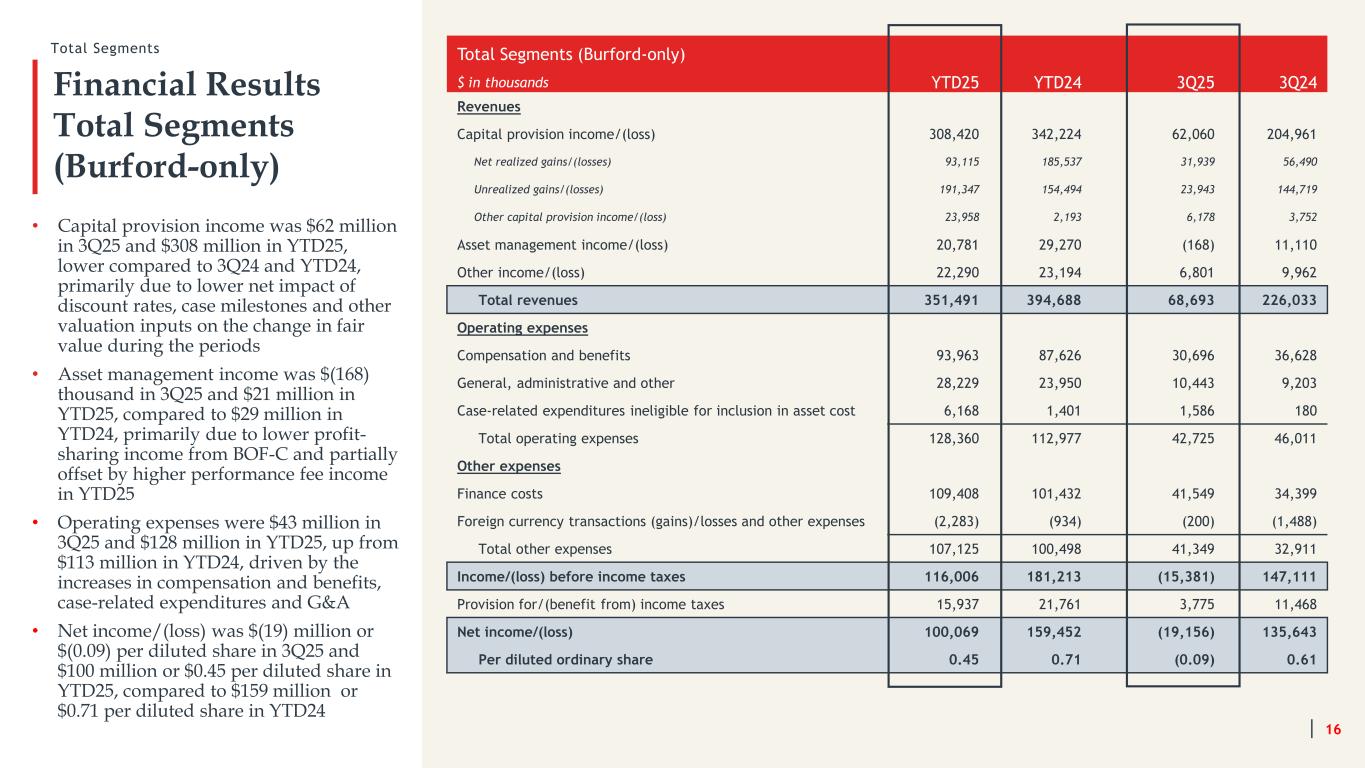
Financial Results Total Segments (Burford-only) Total Segments (Burford-only) $ in thousands YTD25 YTD24 3Q25 3Q24 Revenues Capital provision income/(loss) 308,420 342,224 62,060 204,961 Net realized gains/(losses) 93,115 185,537 31,939 56,490 Unrealized gains/(losses) 191,347 154,494 23,943 144,719 Other capital provision income/(loss) 23,958 2,193 6,178 3,752 Asset management income/(loss) 20,781 29,270 (168) 11,110 Other income/(loss) 22,290 23,194 6,801 9,962 Total revenues 351,491 394,688 68,693 226,033 Operating expenses Compensation and benefits 93,963 87,626 30,696 36,628 General, administrative and other 28,229 23,950 10,443 9,203 Case-related expenditures ineligible for inclusion in asset cost 6,168 1,401 1,586 180 Total operating expenses 128,360 112,977 42,725 46,011 Other expenses Finance costs 109,408 101,432 41,549 34,399 Foreign currency transactions (gains)/losses and other expenses (2,283) (934) (200) (1,488) Total other expenses 107,125 100,498 41,349 32,911 Income/(loss) before income taxes 116,006 181,213 (15,381) 147,111 Provision for/(benefit from) income taxes 15,937 21,761 3,775 11,468 Net income/(loss) 100,069 159,452 (19,156) 135,643 Per diluted ordinary share 0.45 0.71 (0.09) 0.61 16 • Capital provision income was $62 million in 3Q25 and $308 million in YTD25, lower compared to 3Q24 and YTD24, primarily due to lower net impact of discount rates, case milestones and other valuation inputs on the change in fair value during the periods • Asset management income was $(168) thousand in 3Q25 and $21 million in YTD25, compared to $29 million in YTD24, primarily due to lower profit- sharing income from BOF-C and partially offset by higher performance fee income in YTD25 • Operating expenses were $43 million in 3Q25 and $128 million in YTD25, up from $113 million in YTD24, driven by the increases in compensation and benefits, case-related expenditures and G&A • Net income/(loss) was $(19) million or $(0.09) per diluted share in 3Q25 and $100 million or $0.45 per diluted share in YTD25, compared to $159 million or $0.71 per diluted share in YTD24 Total Segments

Segments: Principal Finance
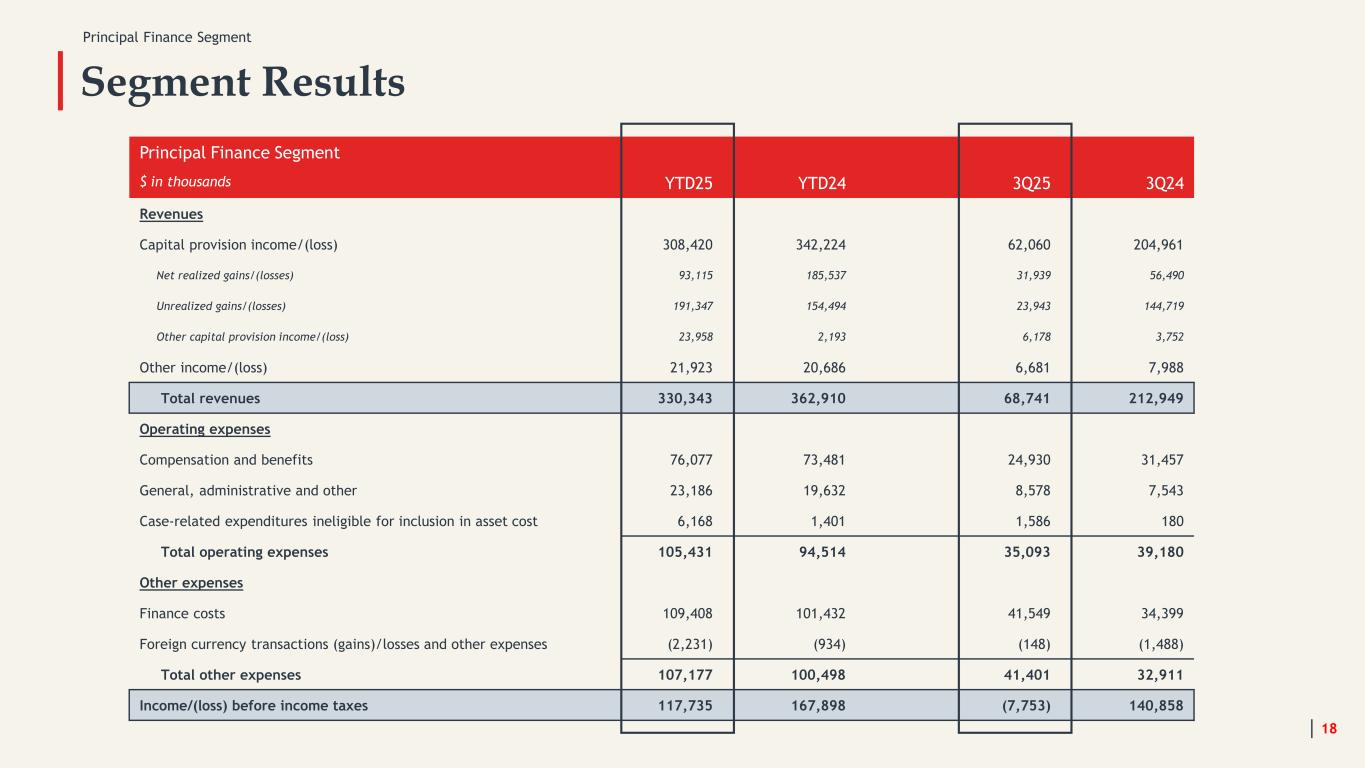
Segment Results 18 Principal Finance Segment $ in thousands YTD25 YTD24 3Q25 3Q24 Revenues Capital provision income/(loss) 308,420 342,224 62,060 204,961 Net realized gains/(losses) 93,115 185,537 31,939 56,490 Unrealized gains/(losses) 191,347 154,494 23,943 144,719 Other capital provision income/(loss) 23,958 2,193 6,178 3,752 Other income/(loss) 21,923 20,686 6,681 7,988 Total revenues 330,343 362,910 68,741 212,949 Operating expenses Compensation and benefits 76,077 73,481 24,930 31,457 General, administrative and other 23,186 19,632 8,578 7,543 Case-related expenditures ineligible for inclusion in asset cost 6,168 1,401 1,586 180 Total operating expenses 105,431 94,514 35,093 39,180 Other expenses Finance costs 109,408 101,432 41,549 34,399 Foreign currency transactions (gains)/losses and other expenses (2,231) (934) (148) (1,488) Total other expenses 107,177 100,498 41,401 32,911 Income/(loss) before income taxes 117,735 167,898 (7,753) 140,858 Principal Finance Segment
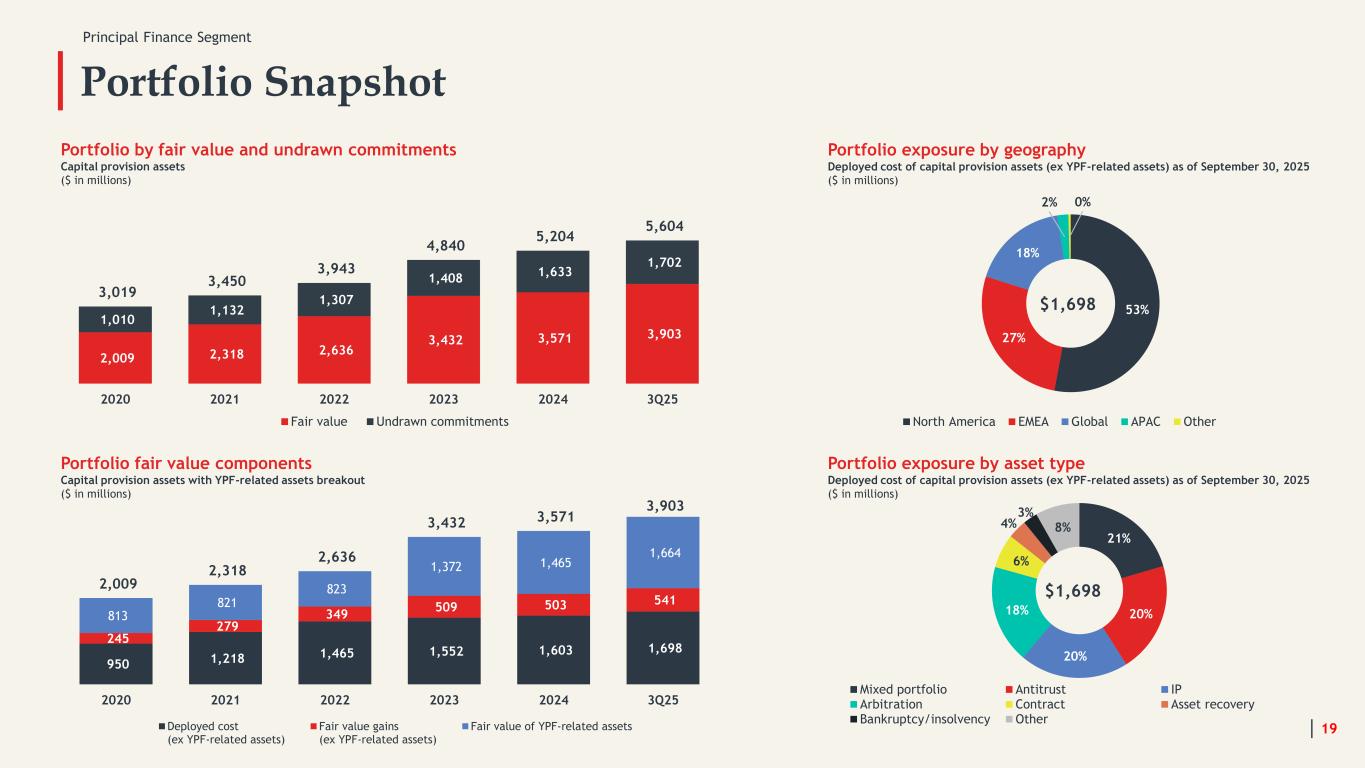
21% 20% 20% 18% 6% 4% 3% 8% Mixed portfolio Antitrust IP Arbitration Contract Asset recovery Bankruptcy/insolvency Other Portfolio Snapshot 19 2,009 2,318 2,636 3,432 3,571 3,903 1,010 1,132 1,307 1,408 1,633 1,702 3,019 3,450 3,943 4,840 5,204 5,604 2020 2021 2022 2023 2024 3Q25 Fair value Undrawn commitments Portfolio by fair value and undrawn commitments Capital provision assets ($ in millions) 950 1,218 1,465 1,552 1,603 1,698 245 279 349 509 503 541 813 821 823 1,372 1,465 1,664 2,009 2,318 2,636 3,432 3,571 3,903 2020 2021 2022 2023 2024 3Q25 Deployed cost (ex YPF-related assets) Fair value gains (ex YPF-related assets) Fair value of YPF-related assets Portfolio fair value components Capital provision assets with YPF-related assets breakout ($ in millions) 53% 27% 18% 2% 0% North America EMEA Global APAC Other Portfolio exposure by geography Deployed cost of capital provision assets (ex YPF-related assets) as of September 30, 2025 ($ in millions) Portfolio exposure by asset type Deployed cost of capital provision assets (ex YPF-related assets) as of September 30, 2025 ($ in millions) $1,698 $1,698 Principal Finance Segment
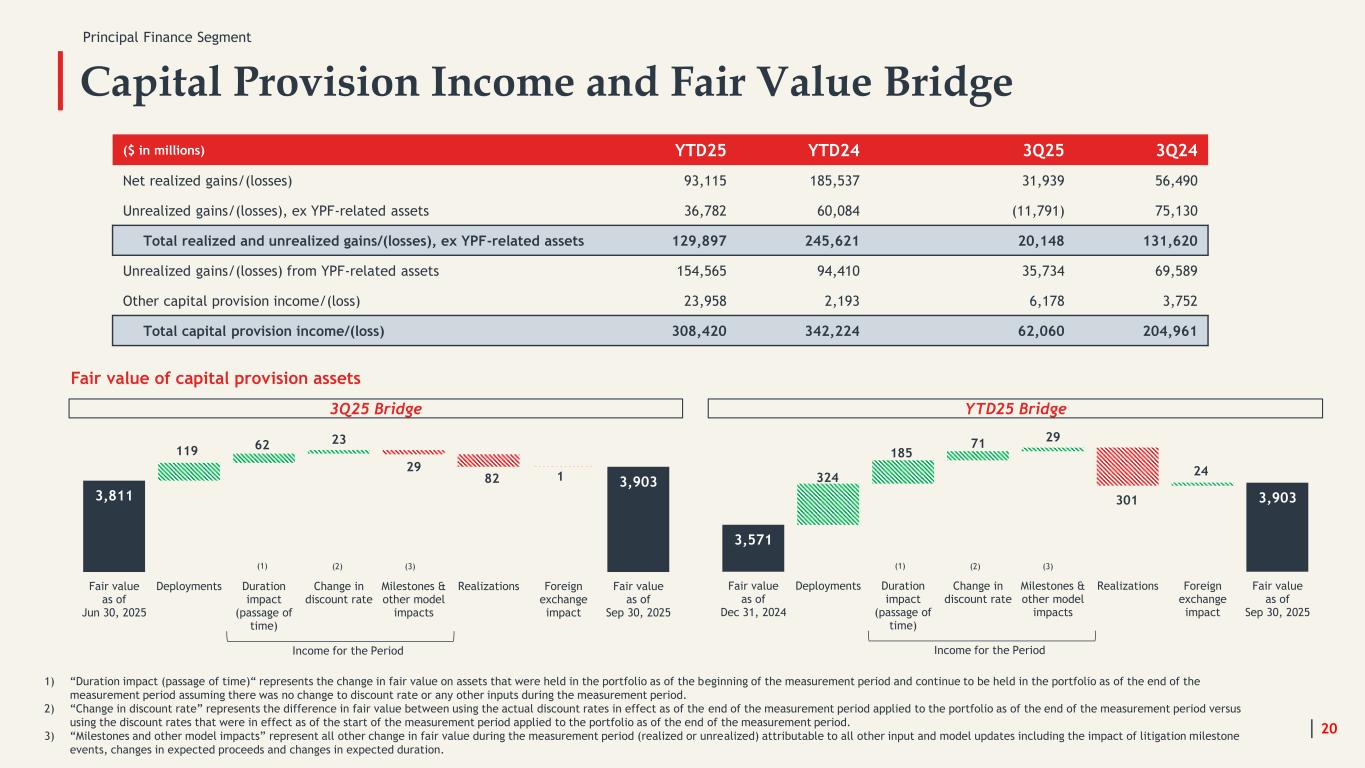
Capital Provision Income and Fair Value Bridge 20 1) “Duration impact (passage of time)“ represents the change in fair value on assets that were held in the portfolio as of the beginning of the measurement period and continue to be held in the portfolio as of the end of the measurement period assuming there was no change to discount rate or any other inputs during the measurement period. 2) “Change in discount rate” represents the difference in fair value between using the actual discount rates in effect as of the end of the measurement period applied to the portfolio as of the end of the measurement period versus using the discount rates that were in effect as of the start of the measurement period applied to the portfolio as of the end of the measurement period. 3) “Milestones and other model impacts” represent all other change in fair value during the measurement period (realized or unrealized) attributable to all other input and model updates including the impact of litigation milestone events, changes in expected proceeds and changes in expected duration. ($ in millions) YTD25 YTD24 3Q25 3Q24 Net realized gains/(losses) 93,115 185,537 31,939 56,490 Unrealized gains/(losses), ex YPF-related assets 36,782 60,084 (11,791) 75,130 Total realized and unrealized gains/(losses), ex YPF-related assets 129,897 245,621 20,148 131,620 Unrealized gains/(losses) from YPF-related assets 154,565 94,410 35,734 69,589 Other capital provision income/(loss) 23,958 2,193 6,178 3,752 Total capital provision income/(loss) 308,420 342,224 62,060 204,961 3,811 3,903 119 62 23 29 82 1 Fair value as of Jun 30, 2025 Deployments Duration impact (passage of time) Change in discount rate Milestones & other model impacts Realizations Foreign exchange impact Fair value as of Sep 30, 2025 Fair value of capital provision assets Income for the Period (1) (2) Principal Finance Segment (3) 3,571 3,903 324 185 71 29 301 24 Fair value as of Dec 31, 2024 Deployments Duration impact (passage of time) Change in discount rate Milestones & other model impacts Realizations Foreign exchange impact Fair value as of Sep 30, 2025 3Q25 Bridge Income for the Period YTD25 Bridge (1) (2) (3)
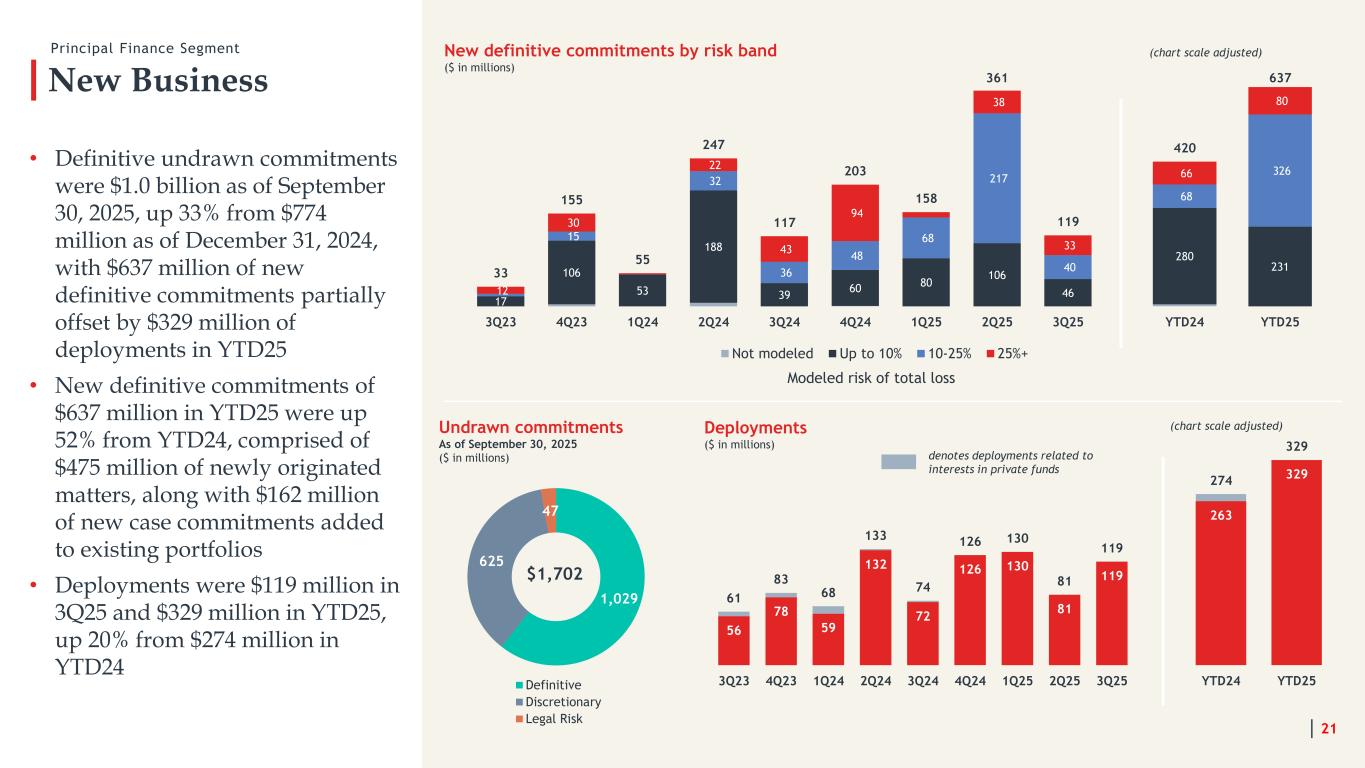
New Business • Definitive undrawn commitments were $1.0 billion as of September 30, 2025, up 33% from $774 million as of December 31, 2024, with $637 million of new definitive commitments partially offset by $329 million of deployments in YTD25 • New definitive commitments of $637 million in YTD25 were up 52% from YTD24, comprised of $475 million of newly originated matters, along with $162 million of new case commitments added to existing portfolios • Deployments were $119 million in 3Q25 and $329 million in YTD25, up 20% from $274 million in YTD24 New definitive commitments by risk band ($ in millions) 21 Principal Finance Segment 17 106 53 188 39 60 80 106 46 15 32 36 48 68 217 40 12 30 22 43 94 38 33 33 155 55 247 117 203 158 361 119 3Q23 4Q23 1Q24 2Q24 3Q24 4Q24 1Q25 2Q25 3Q25 Not modeled Up to 10% 10-25% 25%+ Undrawn commitments As of September 30, 2025 ($ in millions) 1,029 625 47 Definitive Discretionary Legal Risk $1,702 Deployments ($ in millions) 56 78 59 132 72 126 130 81 119 61 83 68 133 74 126 130 81 119 3Q23 4Q23 1Q24 2Q24 3Q24 4Q24 1Q25 2Q25 3Q25 denotes deployments related to interests in private funds Modeled risk of total loss 280 231 68 326 66 80 420 637 YTD24 YTD25 263 329 274 329 YTD24 YTD25 (chart scale adjusted) (chart scale adjusted)
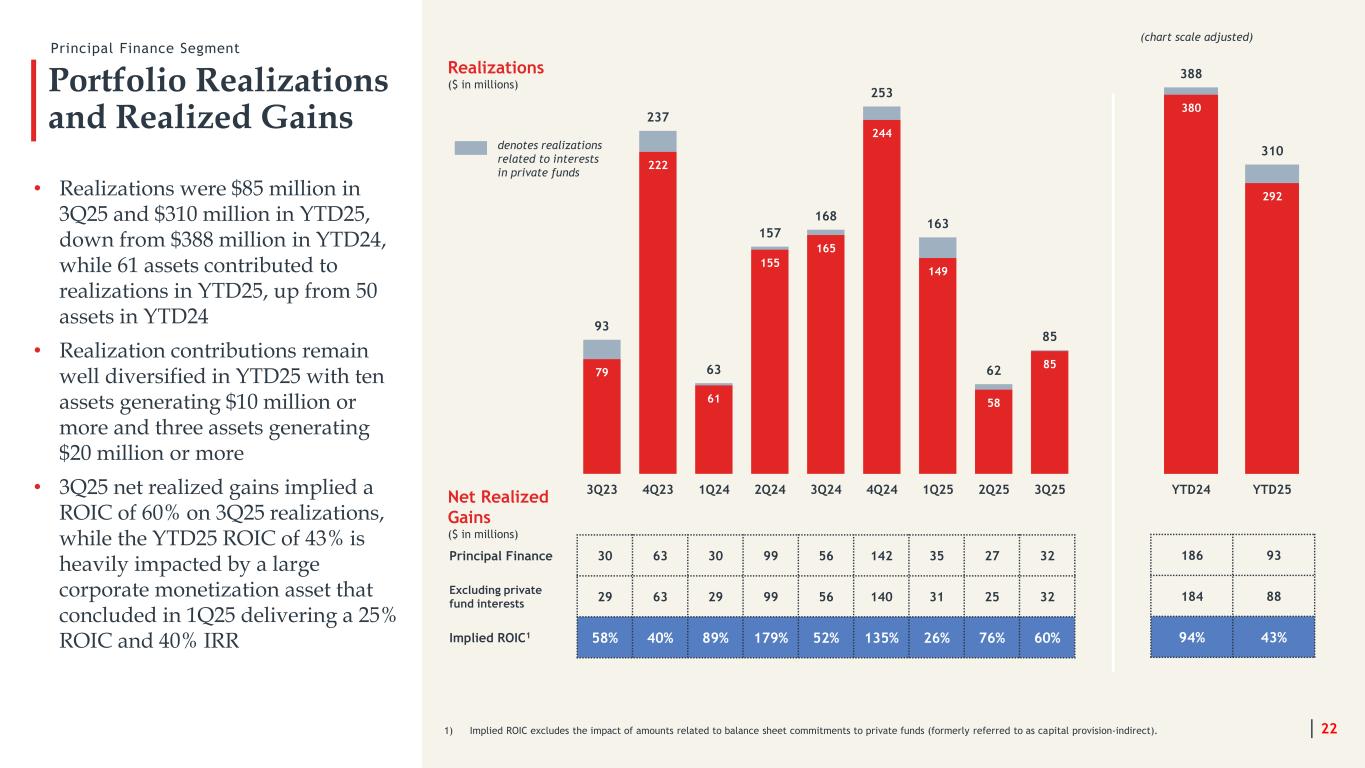
Portfolio Realizations and Realized Gains • Realizations were $85 million in 3Q25 and $310 million in YTD25, down from $388 million in YTD24, while 61 assets contributed to realizations in YTD25, up from 50 assets in YTD24 • Realization contributions remain well diversified in YTD25 with ten assets generating $10 million or more and three assets generating $20 million or more • 3Q25 net realized gains implied a ROIC of 60% on 3Q25 realizations, while the YTD25 ROIC of 43% is heavily impacted by a large corporate monetization asset that concluded in 1Q25 delivering a 25% ROIC and 40% IRR Realizations ($ in millions) Principal Finance Segment Principal Finance 30 63 30 99 56 142 35 27 32 Excluding private fund interests 29 63 29 99 56 140 31 25 32 Implied ROIC1 58% 40% 89% 179% 52% 135% 26% 76% 60% 1) Implied ROIC excludes the impact of amounts related to balance sheet commitments to private funds (formerly referred to as capital provision-indirect). 79 222 61 155 165 244 149 58 85 93 237 63 157 168 253 163 62 85 3Q23 4Q23 1Q24 2Q24 3Q24 4Q24 1Q25 2Q25 3Q25 denotes realizations related to interests in private funds Net Realized Gains ($ in millions) 22 380 292 388 310 YTD24 YTD25 186 93 184 88 94% 43% (chart scale adjusted)
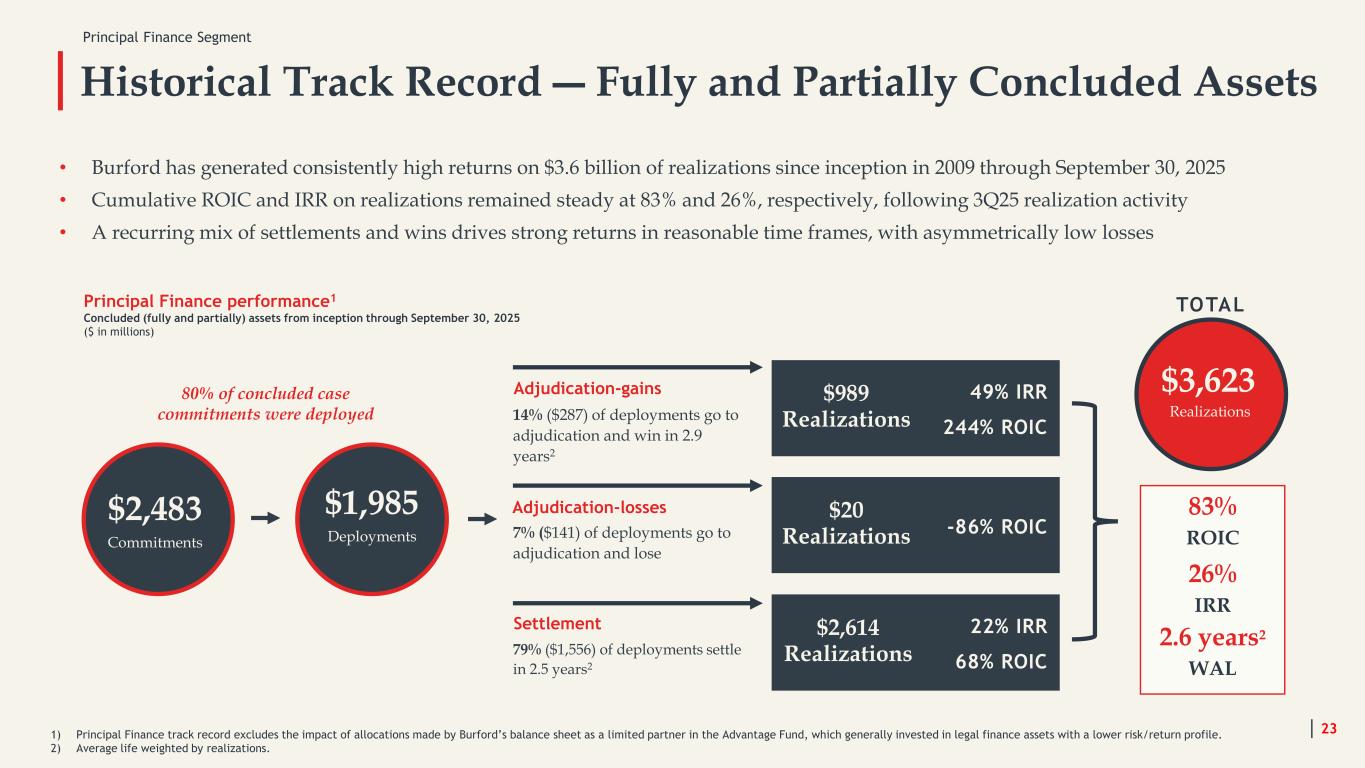
Historical Track Record ― Fully and Partially Concluded Assets $16 Recoveries $889 Recoveries $956 Recoveries Principal Finance performance1 Concluded (fully and partially) assets from inception through September 30, 2025 ($ in millions) 80% of concluded case commitments were deployed $2,483 Commitments Adjudication-losses 79% ($1,556) of deployments settle in 2.5 years2 Settlement 7% ($141) of deployments go to adjudication and lose 14% ($287) of deployments go to adjudication and win in 2.9 years2 Adjudication-gains $989 Realizations 49% IRR 244% ROIC $1,985 Deployments $3,623 Realizations $20 Realizations -86% ROIC $2,614 Realizations 22% IRR 68% ROIC 83% ROIC 26% IRR 2.6 years2 WAL TOTAL • Burford has generated consistently high returns on $3.6 billion of realizations since inception in 2009 through September 30, 2025 • Cumulative ROIC and IRR on realizations remained steady at 83% and 26%, respectively, following 3Q25 realization activity • A recurring mix of settlements and wins drives strong returns in reasonable time frames, with asymmetrically low losses 1) Principal Finance track record excludes the impact of allocations made by Burford’s balance sheet as a limited partner in the Advantage Fund, which generally invested in legal finance assets with a lower risk/return profile. 2) Average life weighted by realizations. Principal Finance Segment 23
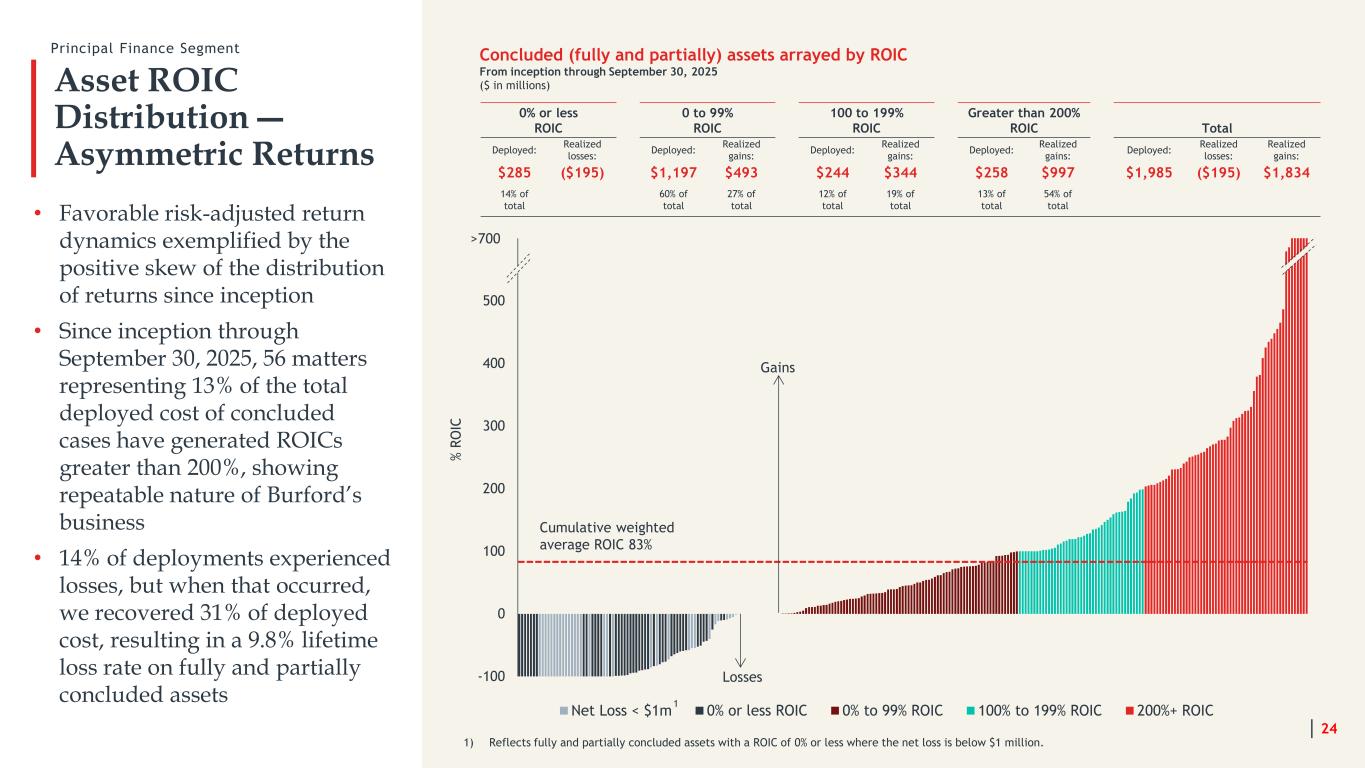
-100 0 100 200 300 400 500 600 Net Loss < $1m 0% or less ROIC 0% to 99% ROIC 100% to 199% ROIC 200%+ ROIC Asset ROIC Distribution ― Asymmetric Returns • Favorable risk-adjusted return dynamics exemplified by the positive skew of the distribution of returns since inception • Since inception through September 30, 2025, 56 matters representing 13% of the total deployed cost of concluded cases have generated ROICs greater than 200%, showing repeatable nature of Burford’s business • 14% of deployments experienced losses, but when that occurred, we recovered 31% of deployed cost, resulting in a 9.8% lifetime loss rate on fully and partially concluded assets 0% or less ROIC 0 to 99% ROIC 100 to 199% ROIC Greater than 200% ROIC Total Deployed: Realized losses: Deployed: Realized gains: Deployed: Realized gains: Deployed: Realized gains: Deployed: Realized losses: Realized gains: $285 ($195) $1,197 $493 $244 $344 $258 $997 $1,985 ($195) $1,834 14% of total 60% of total 27% of total 12% of total 19% of total 13% of total 54% of total Concluded (fully and partially) assets arrayed by ROIC From inception through September 30, 2025 ($ in millions) Cumulative weighted average ROIC 83% Gains Losses >700 % R O IC 24 Principal Finance Segment 1) Reflects fully and partially concluded assets with a ROIC of 0% or less where the net loss is below $1 million. 1

Segments: Asset Management and Other Services
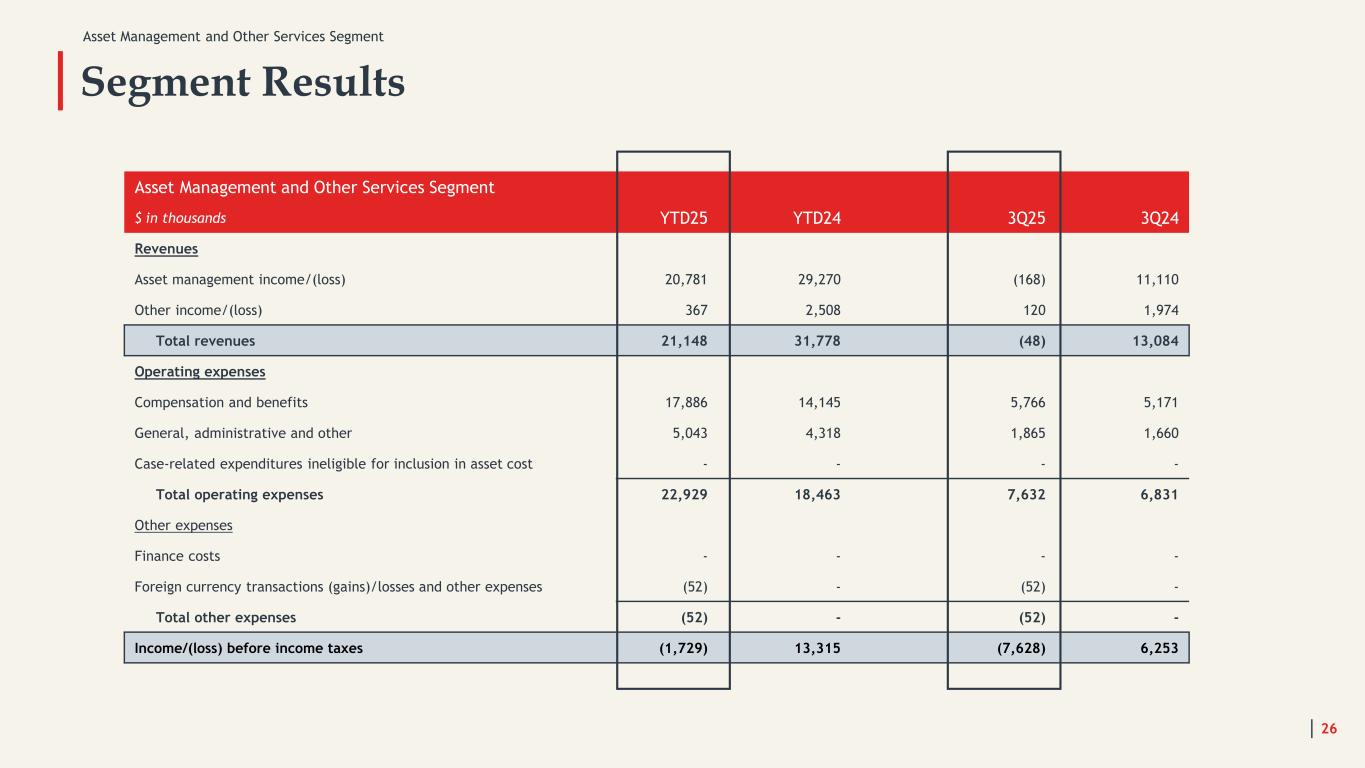
Asset Management and Other Services Segment Asset Management and Other Services Segment $ in thousands YTD25 YTD24 3Q25 3Q24 Revenues Asset management income/(loss) 20,781 29,270 (168) 11,110 Other income/(loss) 367 2,508 120 1,974 Total revenues 21,148 31,778 (48) 13,084 Operating expenses Compensation and benefits 17,886 14,145 5,766 5,171 General, administrative and other 5,043 4,318 1,865 1,660 Case-related expenditures ineligible for inclusion in asset cost - - - - Total operating expenses 22,929 18,463 7,632 6,831 Other expenses Finance costs - - - - Foreign currency transactions (gains)/losses and other expenses (52) - (52) - Total other expenses (52) - (52) - Income/(loss) before income taxes (1,729) 13,315 (7,628) 6,253 Segment Results 26
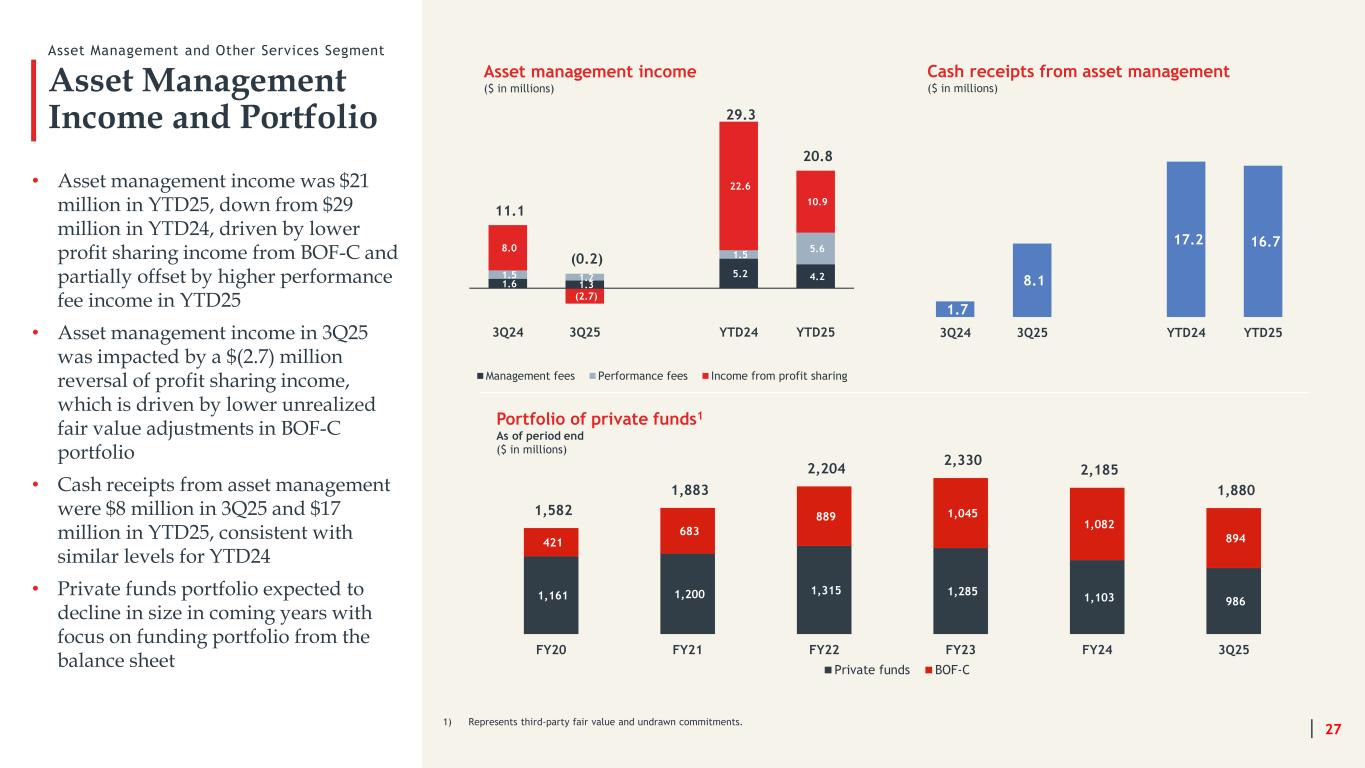
1.6 1.3 5.2 4.2 1.5 1.2 1.5 5.6 8.0 (2.7) 22.6 10.9 11.1 (0.2) 29.3 20.8 3Q24 3Q25 YTD24 YTD25 Management fees Performance fees Income from profit sharing Asset Management Income and Portfolio Asset Management and Other Services Segment • Asset management income was $21 million in YTD25, down from $29 million in YTD24, driven by lower profit sharing income from BOF-C and partially offset by higher performance fee income in YTD25 • Asset management income in 3Q25 was impacted by a $(2.7) million reversal of profit sharing income, which is driven by lower unrealized fair value adjustments in BOF-C portfolio • Cash receipts from asset management were $8 million in 3Q25 and $17 million in YTD25, consistent with similar levels for YTD24 • Private funds portfolio expected to decline in size in coming years with focus on funding portfolio from the balance sheet 27 Asset management income ($ in millions) 1) Represents third-party fair value and undrawn commitments. 1,161 1,200 1,315 1,285 1,103 986 421 683 889 1,045 1,082 894 1,582 1,883 2,204 2,330 2,185 1,880 FY20 FY21 FY22 FY23 FY24 3Q25 Private funds BOF-C Portfolio of private funds1 As of period end ($ in millions) 1.7 8.1 17.2 16.7 3Q24 3Q25 YTD24 YTD25 Cash receipts from asset management ($ in millions)

Liquidity and Capital Management
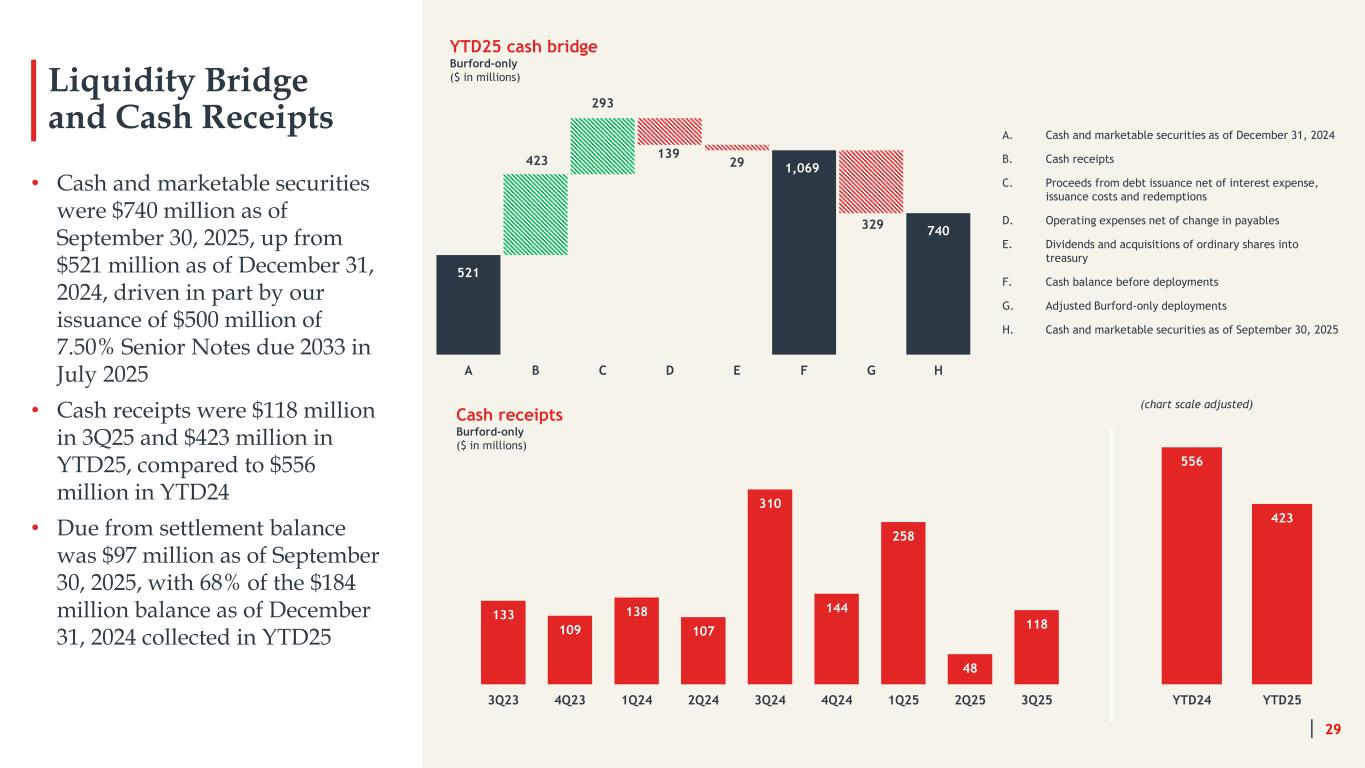
Liquidity Bridge and Cash Receipts A. Cash and marketable securities as of December 31, 2024 B. Cash receipts C. Proceeds from debt issuance net of interest expense, issuance costs and redemptions D. Operating expenses net of change in payables E. Dividends and acquisitions of ordinary shares into treasury F. Cash balance before deployments G. Adjusted Burford-only deployments H. Cash and marketable securities as of September 30, 2025 29 423 293 139 29 329 521 1,069 740 A B C D E F G H YTD25 cash bridge Burford-only ($ in millions) Cash receipts Burford-only ($ in millions) • Cash and marketable securities were $740 million as of September 30, 2025, up from $521 million as of December 31, 2024, driven in part by our issuance of $500 million of 7.50% Senior Notes due 2033 in July 2025 • Cash receipts were $118 million in 3Q25 and $423 million in YTD25, compared to $556 million in YTD24 • Due from settlement balance was $97 million as of September 30, 2025, with 68% of the $184 million balance as of December 31, 2024 collected in YTD25 133 109 138 107 310 144 258 48 118 3Q23 4Q23 1Q24 2Q24 3Q24 4Q24 1Q25 2Q25 3Q25 556 423 YTD24 YTD25 (chart scale adjusted)
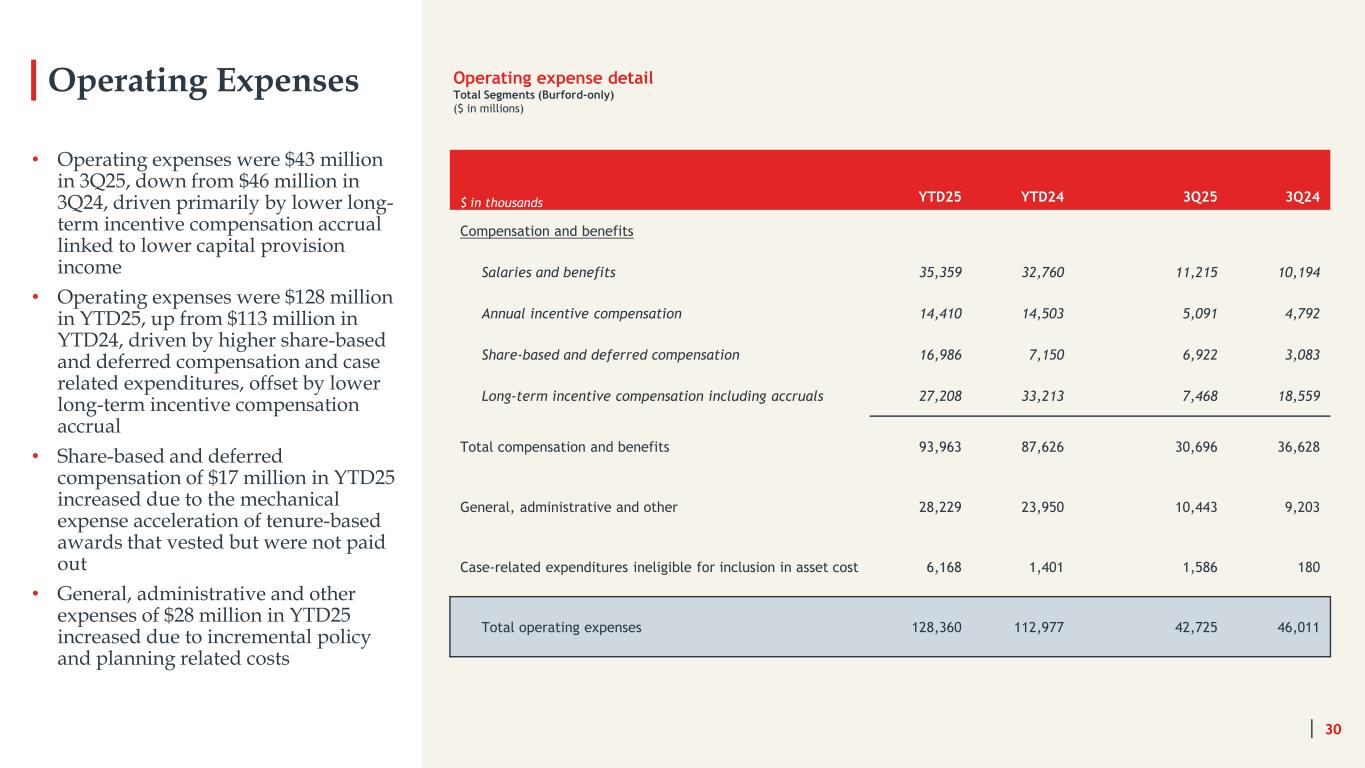
Operating Expenses $ in thousands YTD25 YTD24 3Q25 3Q24 Compensation and benefits Salaries and benefits 35,359 32,760 11,215 10,194 Annual incentive compensation 14,410 14,503 5,091 4,792 Share-based and deferred compensation 16,986 7,150 6,922 3,083 Long-term incentive compensation including accruals 27,208 33,213 7,468 18,559 Total compensation and benefits 93,963 87,626 30,696 36,628 General, administrative and other 28,229 23,950 10,443 9,203 Case-related expenditures ineligible for inclusion in asset cost 6,168 1,401 1,586 180 Total operating expenses 128,360 112,977 42,725 46,011 30 Operating expense detail Total Segments (Burford-only) ($ in millions) • Operating expenses were $43 million in 3Q25, down from $46 million in 3Q24, driven primarily by lower long- term incentive compensation accrual linked to lower capital provision income • Operating expenses were $128 million in YTD25, up from $113 million in YTD24, driven by higher share-based and deferred compensation and case related expenditures, offset by lower long-term incentive compensation accrual • Share-based and deferred compensation of $17 million in YTD25 increased due to the mechanical expense acceleration of tenure-based awards that vested but were not paid out • General, administrative and other expenses of $28 million in YTD25 increased due to incremental policy and planning related costs
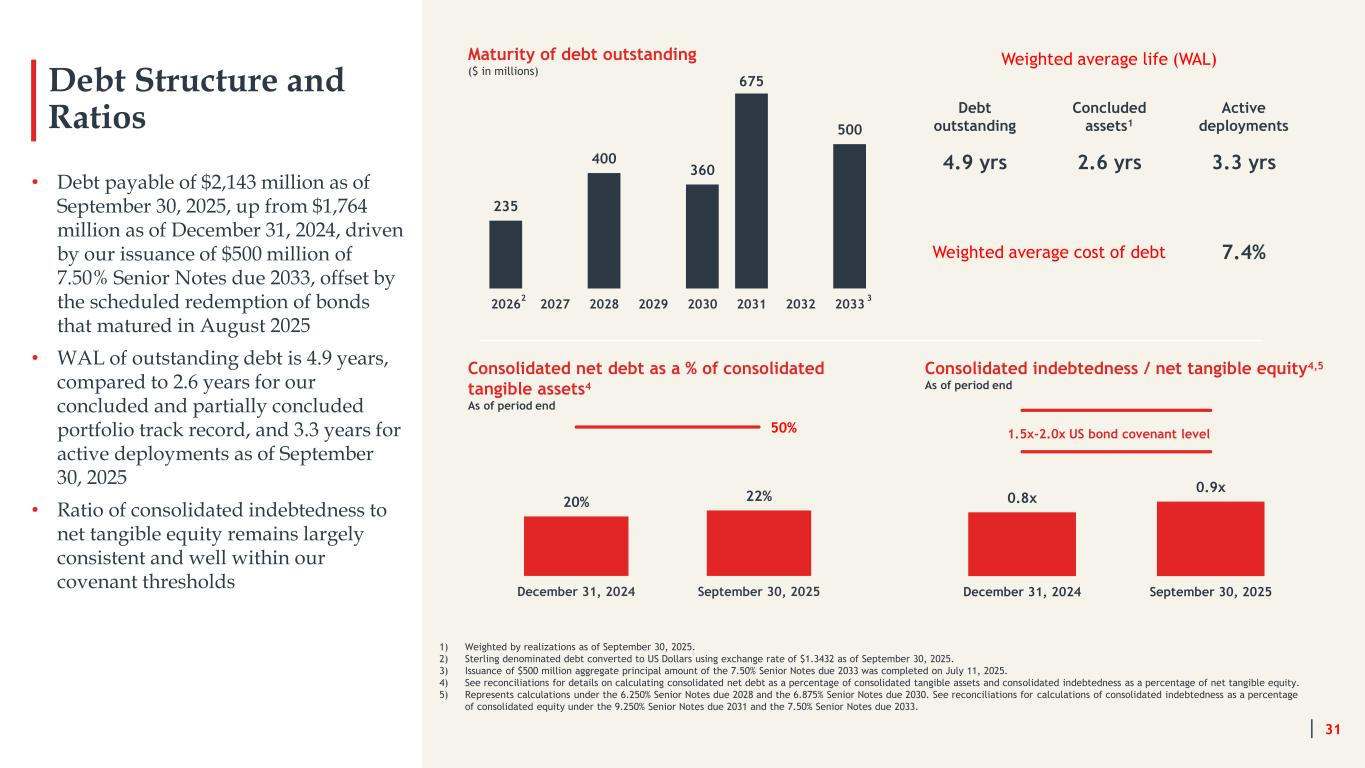
0.8x 0.9x December 31, 2024 September 30, 2025 1.5x-2.0x US bond covenant level 20% 22% December 31, 2024 September 30, 2025 Debt Structure and Ratios • Debt payable of $2,143 million as of September 30, 2025, up from $1,764 million as of December 31, 2024, driven by our issuance of $500 million of 7.50% Senior Notes due 2033, offset by the scheduled redemption of bonds that matured in August 2025 • WAL of outstanding debt is 4.9 years, compared to 2.6 years for our concluded and partially concluded portfolio track record, and 3.3 years for active deployments as of September 30, 2025 • Ratio of consolidated indebtedness to net tangible equity remains largely consistent and well within our covenant thresholds 31 1) Weighted by realizations as of September 30, 2025. 2) Sterling denominated debt converted to US Dollars using exchange rate of $1.3432 as of September 30, 2025. 3) Issuance of $500 million aggregate principal amount of the 7.50% Senior Notes due 2033 was completed on July 11, 2025. 4) See reconciliations for details on calculating consolidated net debt as a percentage of consolidated tangible assets and consolidated indebtedness as a percentage of net tangible equity. 5) Represents calculations under the 6.250% Senior Notes due 2028 and the 6.875% Senior Notes due 2030. See reconciliations for calculations of consolidated indebtedness as a percentage of consolidated equity under the 9.250% Senior Notes due 2031 and the 7.50% Senior Notes due 2033. Consolidated net debt as a % of consolidated tangible assets4 As of period end Consolidated indebtedness / net tangible equity4,5 As of period end Maturity of debt outstanding ($ in millions) 235 400 360 675 500 2026 2027 2028 2029 2030 2031 2032 2033 2 Weighted average life (WAL) Debt outstanding Concluded assets1 Active deployments 4.9 yrs 2.6 yrs 3.3 yrs Weighted average cost of debt 7.4% 3 50%

Consolidated Financial Statement Reconciliations
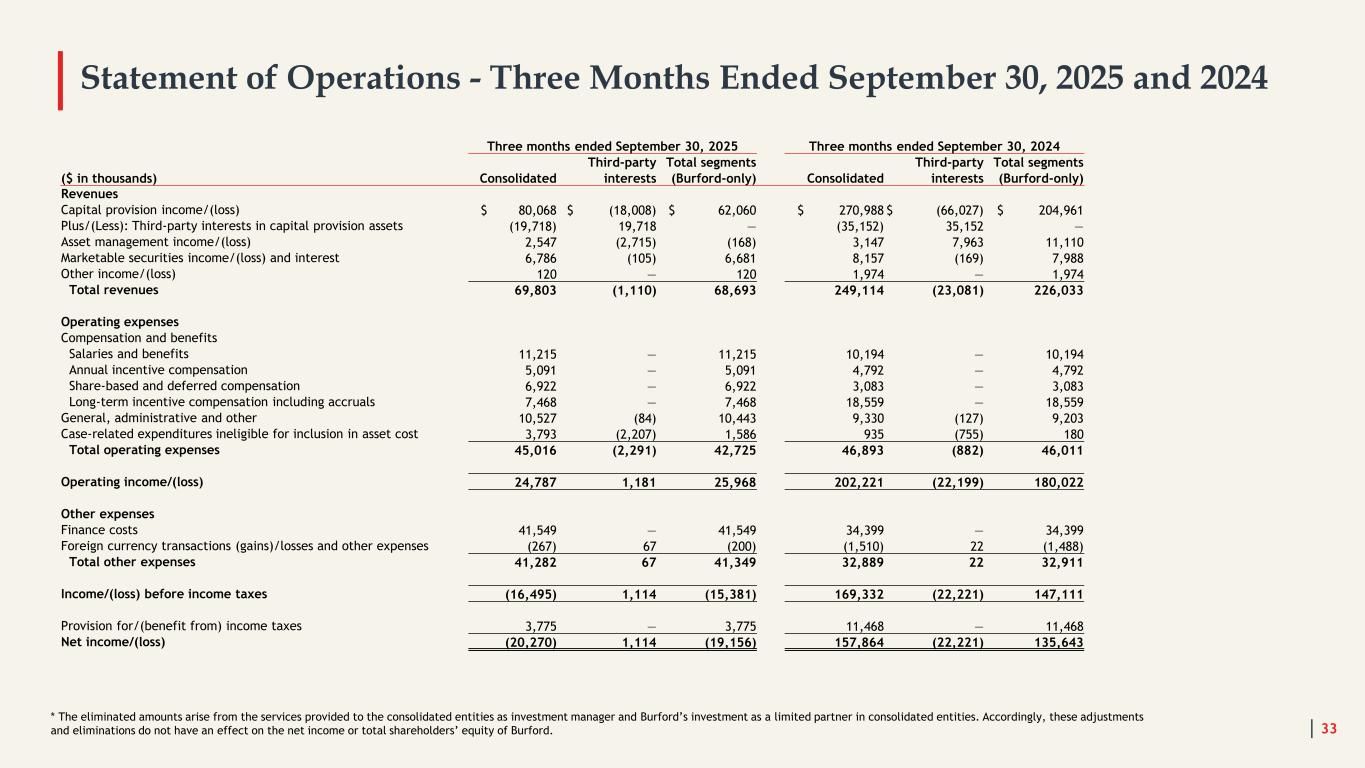
Statement of Operations - Three Months Ended September 30, 2025 and 2024 33 * The eliminated amounts arise from the services provided to the consolidated entities as investment manager and Burford’s investment as a limited partner in consolidated entities. Accordingly, these adjustments and eliminations do not have an effect on the net income or total shareholders’ equity of Burford. Three months ended September 30, 2025 Three months ended September 30, 2024 Third-party Total segments Third-party Total segments ($ in thousands) Consolidated interests (Burford-only) Consolidated interests (Burford-only) Revenues Capital provision income/(loss) $ 80,068 $ (18,008) $ 62,060 $ 270,988 $ (66,027) $ 204,961 Plus/(Less): Third-party interests in capital provision assets (19,718) 19,718 — (35,152) 35,152 — Asset management income/(loss) 2,547 (2,715) (168) 3,147 7,963 11,110 Marketable securities income/(loss) and interest 6,786 (105) 6,681 8,157 (169) 7,988 Other income/(loss) 120 — 120 1,974 — 1,974 Total revenues 69,803 (1,110) 68,693 249,114 (23,081) 226,033 Operating expenses Compensation and benefits Salaries and benefits 11,215 — 11,215 10,194 — 10,194 Annual incentive compensation 5,091 — 5,091 4,792 — 4,792 Share-based and deferred compensation 6,922 — 6,922 3,083 — 3,083 Long-term incentive compensation including accruals 7,468 — 7,468 18,559 — 18,559 General, administrative and other 10,527 (84) 10,443 9,330 (127) 9,203 Case-related expenditures ineligible for inclusion in asset cost 3,793 (2,207) 1,586 935 (755) 180 Total operating expenses 45,016 (2,291) 42,725 46,893 (882) 46,011 Operating income/(loss) 24,787 1,181 25,968 202,221 (22,199) 180,022 Other expenses Finance costs 41,549 — 41,549 34,399 — 34,399 Foreign currency transactions (gains)/losses and other expenses (267) 67 (200) (1,510) 22 (1,488) Total other expenses 41,282 67 41,349 32,889 22 32,911 Income/(loss) before income taxes (16,495) 1,114 (15,381) 169,332 (22,221) 147,111 Provision for/(benefit from) income taxes 3,775 — 3,775 11,468 — 11,468 Net income/(loss) (20,270) 1,114 (19,156) 157,864 (22,221) 135,643
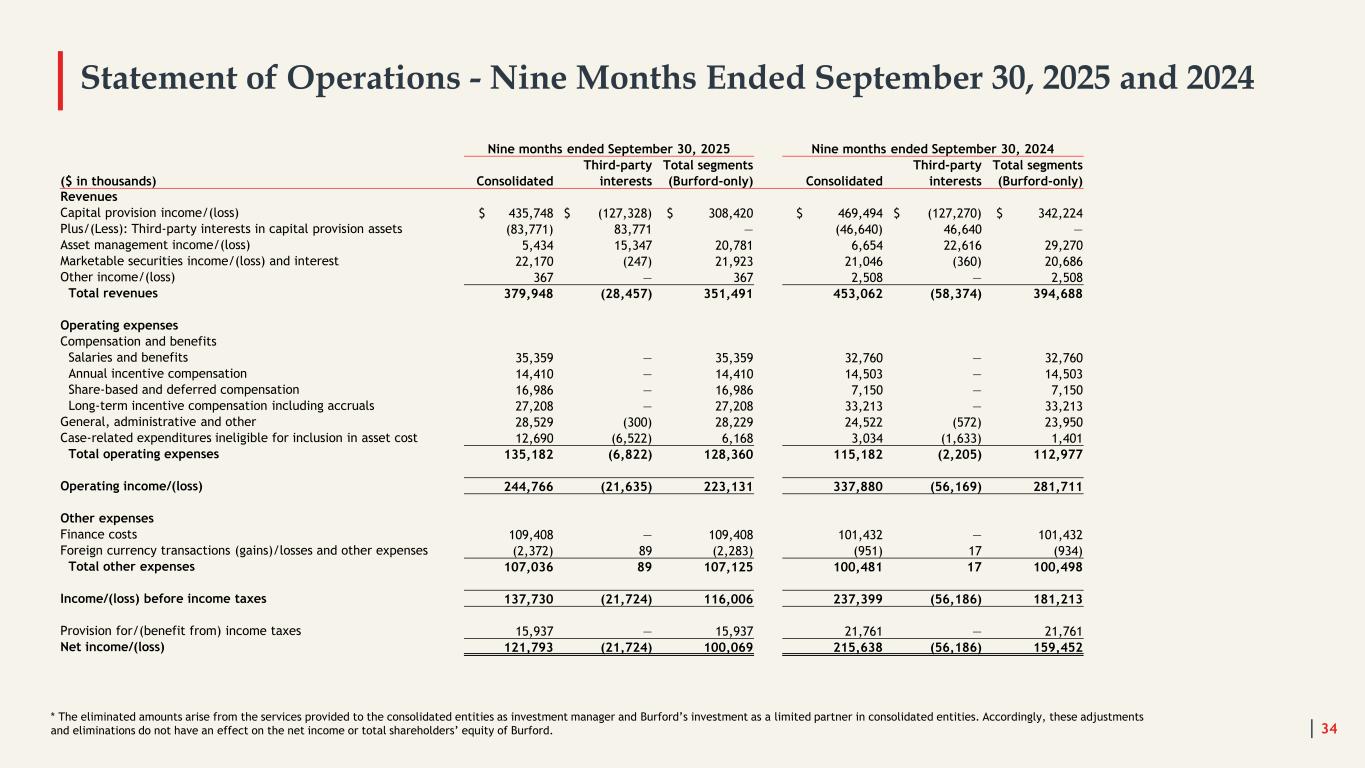
Statement of Operations - Nine Months Ended September 30, 2025 and 2024 34 * The eliminated amounts arise from the services provided to the consolidated entities as investment manager and Burford’s investment as a limited partner in consolidated entities. Accordingly, these adjustments and eliminations do not have an effect on the net income or total shareholders’ equity of Burford. Nine months ended September 30, 2025 Nine months ended September 30, 2024 Third-party Total segments Third-party Total segments ($ in thousands) Consolidated interests (Burford-only) Consolidated interests (Burford-only) Revenues Capital provision income/(loss) $ 435,748 $ (127,328) $ 308,420 $ 469,494 $ (127,270) $ 342,224 Plus/(Less): Third-party interests in capital provision assets (83,771) 83,771 — (46,640) 46,640 — Asset management income/(loss) 5,434 15,347 20,781 6,654 22,616 29,270 Marketable securities income/(loss) and interest 22,170 (247) 21,923 21,046 (360) 20,686 Other income/(loss) 367 — 367 2,508 — 2,508 Total revenues 379,948 (28,457) 351,491 453,062 (58,374) 394,688 Operating expenses Compensation and benefits Salaries and benefits 35,359 — 35,359 32,760 — 32,760 Annual incentive compensation 14,410 — 14,410 14,503 — 14,503 Share-based and deferred compensation 16,986 — 16,986 7,150 — 7,150 Long-term incentive compensation including accruals 27,208 — 27,208 33,213 — 33,213 General, administrative and other 28,529 (300) 28,229 24,522 (572) 23,950 Case-related expenditures ineligible for inclusion in asset cost 12,690 (6,522) 6,168 3,034 (1,633) 1,401 Total operating expenses 135,182 (6,822) 128,360 115,182 (2,205) 112,977 Operating income/(loss) 244,766 (21,635) 223,131 337,880 (56,169) 281,711 Other expenses Finance costs 109,408 — 109,408 101,432 — 101,432 Foreign currency transactions (gains)/losses and other expenses (2,372) 89 (2,283) (951) 17 (934) Total other expenses 107,036 89 107,125 100,481 17 100,498 Income/(loss) before income taxes 137,730 (21,724) 116,006 237,399 (56,186) 181,213 Provision for/(benefit from) income taxes 15,937 — 15,937 21,761 — 21,761 Net income/(loss) 121,793 (21,724) 100,069 215,638 (56,186) 159,452
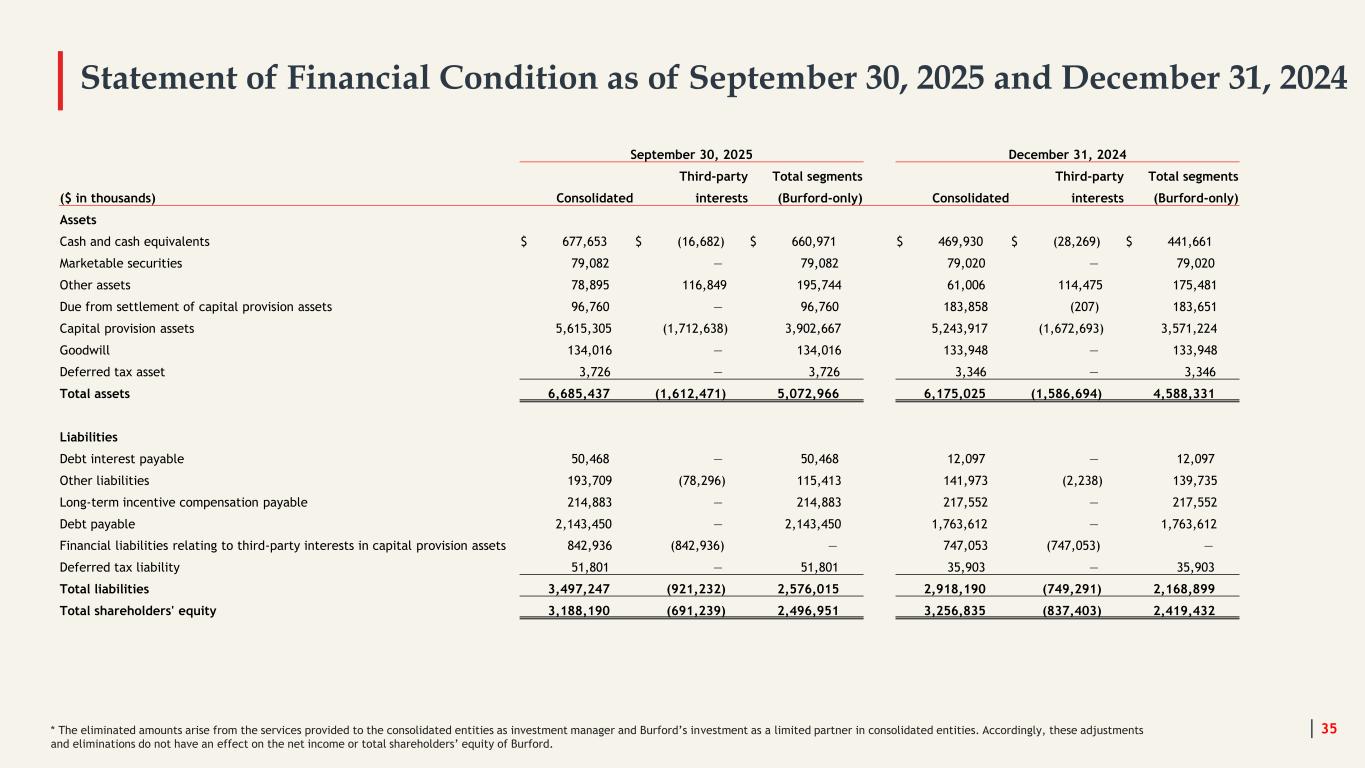
Statement of Financial Condition as of September 30, 2025 and December 31, 2024 35* The eliminated amounts arise from the services provided to the consolidated entities as investment manager and Burford’s investment as a limited partner in consolidated entities. Accordingly, these adjustments and eliminations do not have an effect on the net income or total shareholders’ equity of Burford. September 30, 2025 December 31, 2024 Third-party Total segments Third-party Total segments ($ in thousands) Consolidated interests (Burford-only) Consolidated interests (Burford-only) Assets Cash and cash equivalents $ 677,653 $ (16,682) $ 660,971 $ 469,930 $ (28,269) $ 441,661 Marketable securities 79,082 — 79,082 79,020 — 79,020 Other assets 78,895 116,849 195,744 61,006 114,475 175,481 Due from settlement of capital provision assets 96,760 — 96,760 183,858 (207) 183,651 Capital provision assets 5,615,305 (1,712,638) 3,902,667 5,243,917 (1,672,693) 3,571,224 Goodwill 134,016 — 134,016 133,948 — 133,948 Deferred tax asset 3,726 — 3,726 3,346 — 3,346 Total assets 6,685,437 (1,612,471) 5,072,966 6,175,025 (1,586,694) 4,588,331 Liabilities Debt interest payable 50,468 — 50,468 12,097 — 12,097 Other liabilities 193,709 (78,296) 115,413 141,973 (2,238) 139,735 Long-term incentive compensation payable 214,883 — 214,883 217,552 — 217,552 Debt payable 2,143,450 — 2,143,450 1,763,612 — 1,763,612 Financial liabilities relating to third-party interests in capital provision assets 842,936 (842,936) — 747,053 (747,053) — Deferred tax liability 51,801 — 51,801 35,903 — 35,903 Total liabilities 3,497,247 (921,232) 2,576,015 2,918,190 (749,291) 2,168,899 Total shareholders' equity 3,188,190 (691,239) 2,496,951 3,256,835 (837,403) 2,419,432

Other Reconciliations
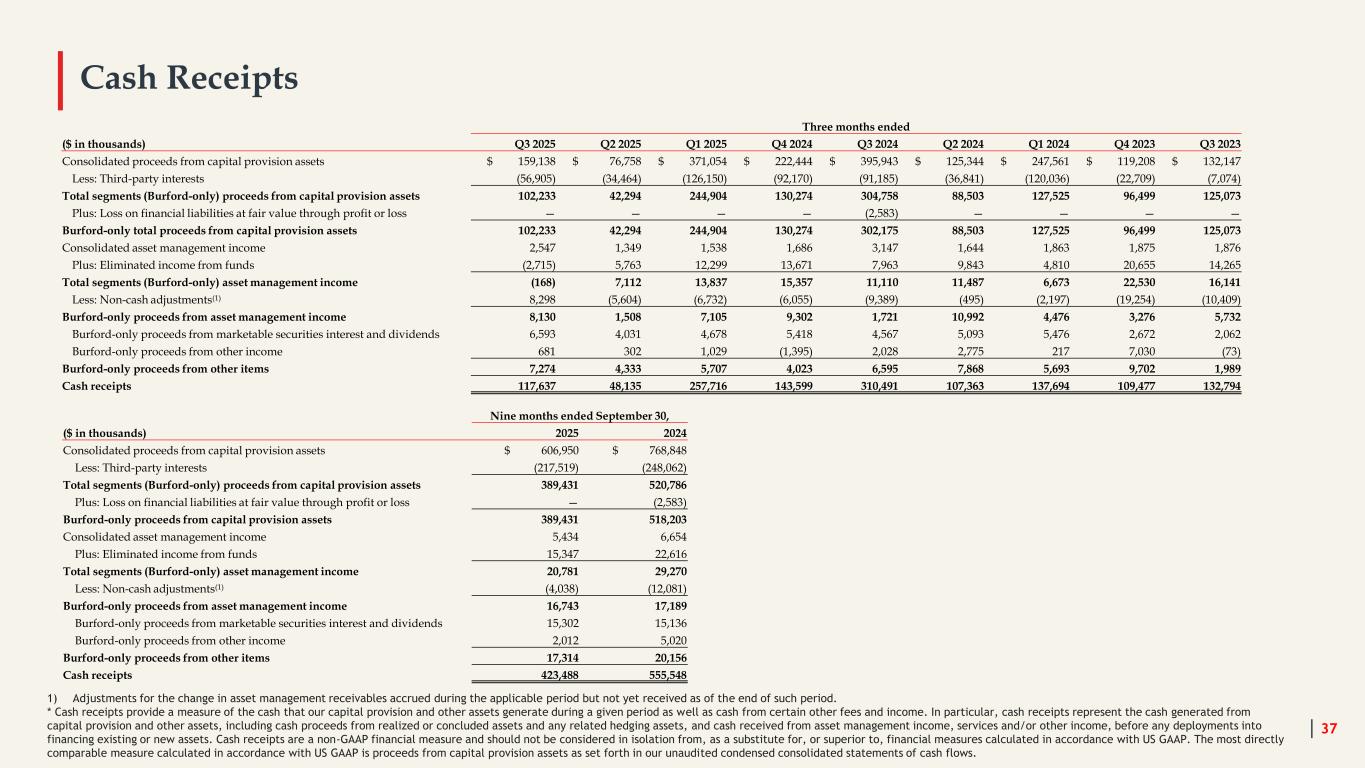
Cash Receipts 1) Adjustments for the change in asset management receivables accrued during the applicable period but not yet received as of the end of such period. * Cash receipts provide a measure of the cash that our capital provision and other assets generate during a given period as well as cash from certain other fees and income. In particular, cash receipts represent the cash generated from capital provision and other assets, including cash proceeds from realized or concluded assets and any related hedging assets, and cash received from asset management income, services and/or other income, before any deployments into financing existing or new assets. Cash receipts are a non-GAAP financial measure and should not be considered in isolation from, as a substitute for, or superior to, financial measures calculated in accordance with US GAAP. The most directly comparable measure calculated in accordance with US GAAP is proceeds from capital provision assets as set forth in our unaudited condensed consolidated statements of cash flows. 37 Three months ended ($ in thousands) Q3 2025 Q2 2025 Q1 2025 Q4 2024 Q3 2024 Q2 2024 Q1 2024 Q4 2023 Q3 2023 Consolidated proceeds from capital provision assets $ 159,138 $ 76,758 $ 371,054 $ 222,444 $ 395,943 $ 125,344 $ 247,561 $ 119,208 $ 132,147 Less: Third-party interests (56,905) (34,464) (126,150) (92,170) (91,185) (36,841) (120,036) (22,709) (7,074) Total segments (Burford-only) proceeds from capital provision assets 102,233 42,294 244,904 130,274 304,758 88,503 127,525 96,499 125,073 Plus: Loss on financial liabilities at fair value through profit or loss — — — — (2,583) — — — — Burford-only total proceeds from capital provision assets 102,233 42,294 244,904 130,274 302,175 88,503 127,525 96,499 125,073 Consolidated asset management income 2,547 1,349 1,538 1,686 3,147 1,644 1,863 1,875 1,876 Plus: Eliminated income from funds (2,715) 5,763 12,299 13,671 7,963 9,843 4,810 20,655 14,265 Total segments (Burford-only) asset management income (168) 7,112 13,837 15,357 11,110 11,487 6,673 22,530 16,141 Less: Non-cash adjustments(1) 8,298 (5,604) (6,732) (6,055) (9,389) (495) (2,197) (19,254) (10,409) Burford-only proceeds from asset management income 8,130 1,508 7,105 9,302 1,721 10,992 4,476 3,276 5,732 Burford-only proceeds from marketable securities interest and dividends 6,593 4,031 4,678 5,418 4,567 5,093 5,476 2,672 2,062 Burford-only proceeds from other income 681 302 1,029 (1,395) 2,028 2,775 217 7,030 (73) Burford-only proceeds from other items 7,274 4,333 5,707 4,023 6,595 7,868 5,693 9,702 1,989 Cash receipts 117,637 48,135 257,716 143,599 310,491 107,363 137,694 109,477 132,794 Nine months ended September 30, ($ in thousands) 2025 2024 Consolidated proceeds from capital provision assets $ 606,950 $ 768,848 Less: Third-party interests (217,519) (248,062) Total segments (Burford-only) proceeds from capital provision assets 389,431 520,786 Plus: Loss on financial liabilities at fair value through profit or loss — (2,583) Burford-only proceeds from capital provision assets 389,431 518,203 Consolidated asset management income 5,434 6,654 Plus: Eliminated income from funds 15,347 22,616 Total segments (Burford-only) asset management income 20,781 29,270 Less: Non-cash adjustments(1) (4,038) (12,081) Burford-only proceeds from asset management income 16,743 17,189 Burford-only proceeds from marketable securities interest and dividends 15,302 15,136 Burford-only proceeds from other income 2,012 5,020 Burford-only proceeds from other items 17,314 20,156 Cash receipts 423,488 555,548
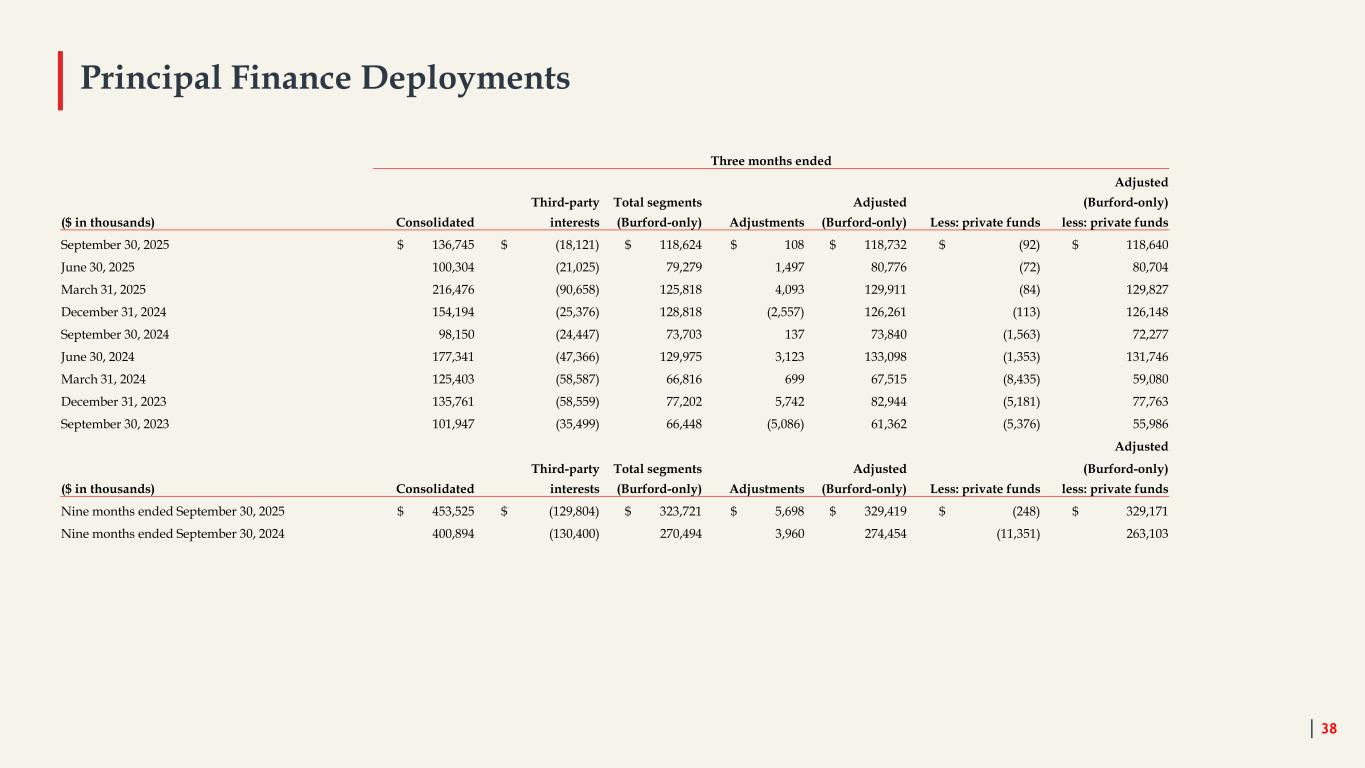
Principal Finance Deployments 38 Three months ended Adjusted Third-party Total segments Adjusted (Burford-only) ($ in thousands) Consolidated interests (Burford-only) Adjustments (Burford-only) Less: private funds less: private funds September 30, 2025 $ 136,745 $ (18,121) $ 118,624 $ 108 $ 118,732 $ (92) $ 118,640 June 30, 2025 100,304 (21,025) 79,279 1,497 80,776 (72) 80,704 March 31, 2025 216,476 (90,658) 125,818 4,093 129,911 (84) 129,827 December 31, 2024 154,194 (25,376) 128,818 (2,557) 126,261 (113) 126,148 September 30, 2024 98,150 (24,447) 73,703 137 73,840 (1,563) 72,277 June 30, 2024 177,341 (47,366) 129,975 3,123 133,098 (1,353) 131,746 March 31, 2024 125,403 (58,587) 66,816 699 67,515 (8,435) 59,080 December 31, 2023 135,761 (58,559) 77,202 5,742 82,944 (5,181) 77,763 September 30, 2023 101,947 (35,499) 66,448 (5,086) 61,362 (5,376) 55,986 Adjusted Third-party Total segments Adjusted (Burford-only) ($ in thousands) Consolidated interests (Burford-only) Adjustments (Burford-only) Less: private funds less: private funds Nine months ended September 30, 2025 $ 453,525 $ (129,804) $ 323,721 $ 5,698 $ 329,419 $ (248) $ 329,171 Nine months ended September 30, 2024 400,894 (130,400) 270,494 3,960 274,454 (11,351) 263,103
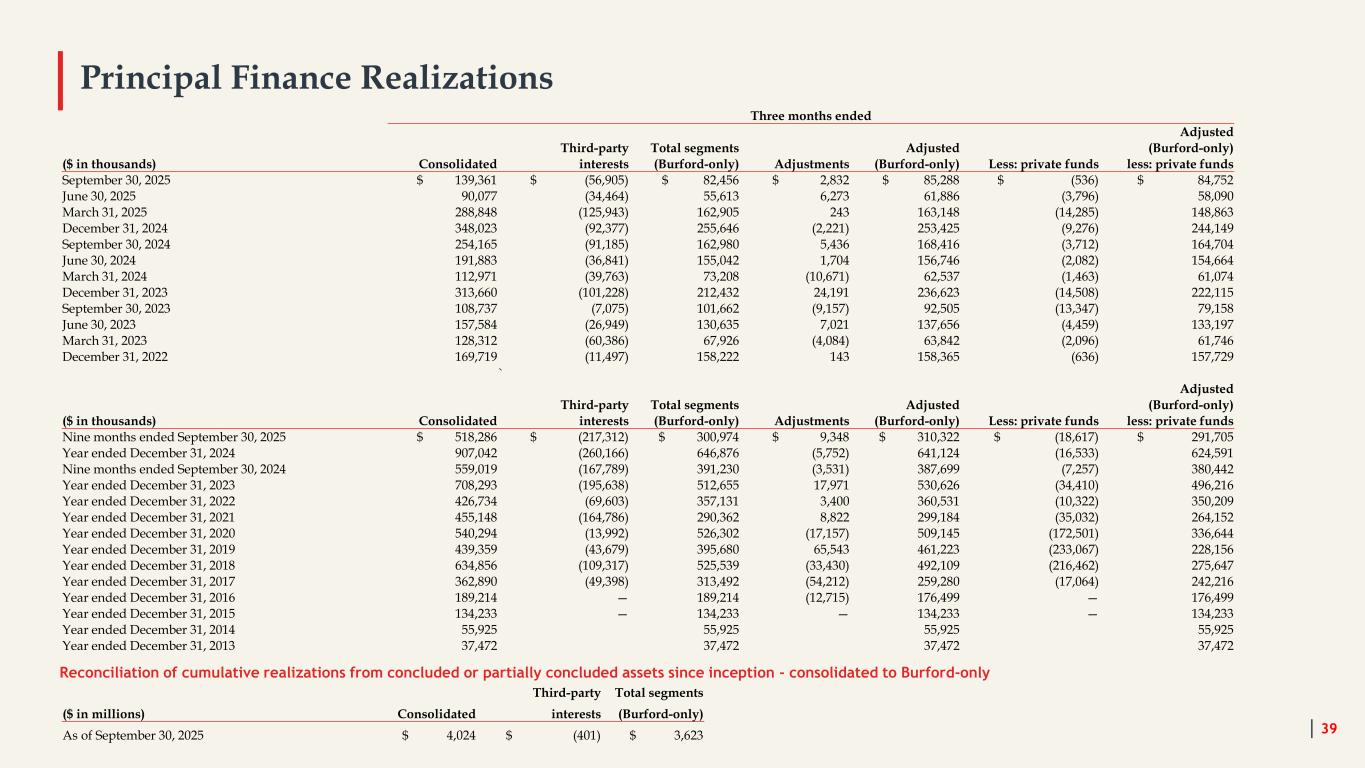
Three months ended Adjusted Third-party Total segments Adjusted (Burford-only) ($ in thousands) Consolidated interests (Burford-only) Adjustments (Burford-only) Less: private funds less: private funds September 30, 2025 $ 139,361 $ (56,905) $ 82,456 $ 2,832 $ 85,288 $ (536) $ 84,752 June 30, 2025 90,077 (34,464) 55,613 6,273 61,886 (3,796) 58,090 March 31, 2025 288,848 (125,943) 162,905 243 163,148 (14,285) 148,863 December 31, 2024 348,023 (92,377) 255,646 (2,221) 253,425 (9,276) 244,149 September 30, 2024 254,165 (91,185) 162,980 5,436 168,416 (3,712) 164,704 June 30, 2024 191,883 (36,841) 155,042 1,704 156,746 (2,082) 154,664 March 31, 2024 112,971 (39,763) 73,208 (10,671) 62,537 (1,463) 61,074 December 31, 2023 313,660 (101,228) 212,432 24,191 236,623 (14,508) 222,115 September 30, 2023 108,737 (7,075) 101,662 (9,157) 92,505 (13,347) 79,158 June 30, 2023 157,584 (26,949) 130,635 7,021 137,656 (4,459) 133,197 March 31, 2023 128,312 (60,386) 67,926 (4,084) 63,842 (2,096) 61,746 December 31, 2022 169,719 (11,497) 158,222 143 158,365 (636) 157,729 ` Adjusted Third-party Total segments Adjusted (Burford-only) ($ in thousands) Consolidated interests (Burford-only) Adjustments (Burford-only) Less: private funds less: private funds Nine months ended September 30, 2025 $ 518,286 $ (217,312) $ 300,974 $ 9,348 $ 310,322 $ (18,617) $ 291,705 Year ended December 31, 2024 907,042 (260,166) 646,876 (5,752) 641,124 (16,533) 624,591 Nine months ended September 30, 2024 559,019 (167,789) 391,230 (3,531) 387,699 (7,257) 380,442 Year ended December 31, 2023 708,293 (195,638) 512,655 17,971 530,626 (34,410) 496,216 Year ended December 31, 2022 426,734 (69,603) 357,131 3,400 360,531 (10,322) 350,209 Year ended December 31, 2021 455,148 (164,786) 290,362 8,822 299,184 (35,032) 264,152 Year ended December 31, 2020 540,294 (13,992) 526,302 (17,157) 509,145 (172,501) 336,644 Year ended December 31, 2019 439,359 (43,679) 395,680 65,543 461,223 (233,067) 228,156 Year ended December 31, 2018 634,856 (109,317) 525,539 (33,430) 492,109 (216,462) 275,647 Year ended December 31, 2017 362,890 (49,398) 313,492 (54,212) 259,280 (17,064) 242,216 Year ended December 31, 2016 189,214 — 189,214 (12,715) 176,499 — 176,499 Year ended December 31, 2015 134,233 — 134,233 — 134,233 — 134,233 Year ended December 31, 2014 55,925 55,925 55,925 55,925 Year ended December 31, 2013 37,472 37,472 37,472 37,472 Principal Finance Realizations Reconciliation of cumulative realizations from concluded or partially concluded assets since inception - consolidated to Burford-only 39 Third-party Total segments ($ in millions) Consolidated interests (Burford-only) As of September 30, 2025 $ 4,024 $ (401) $ 3,623
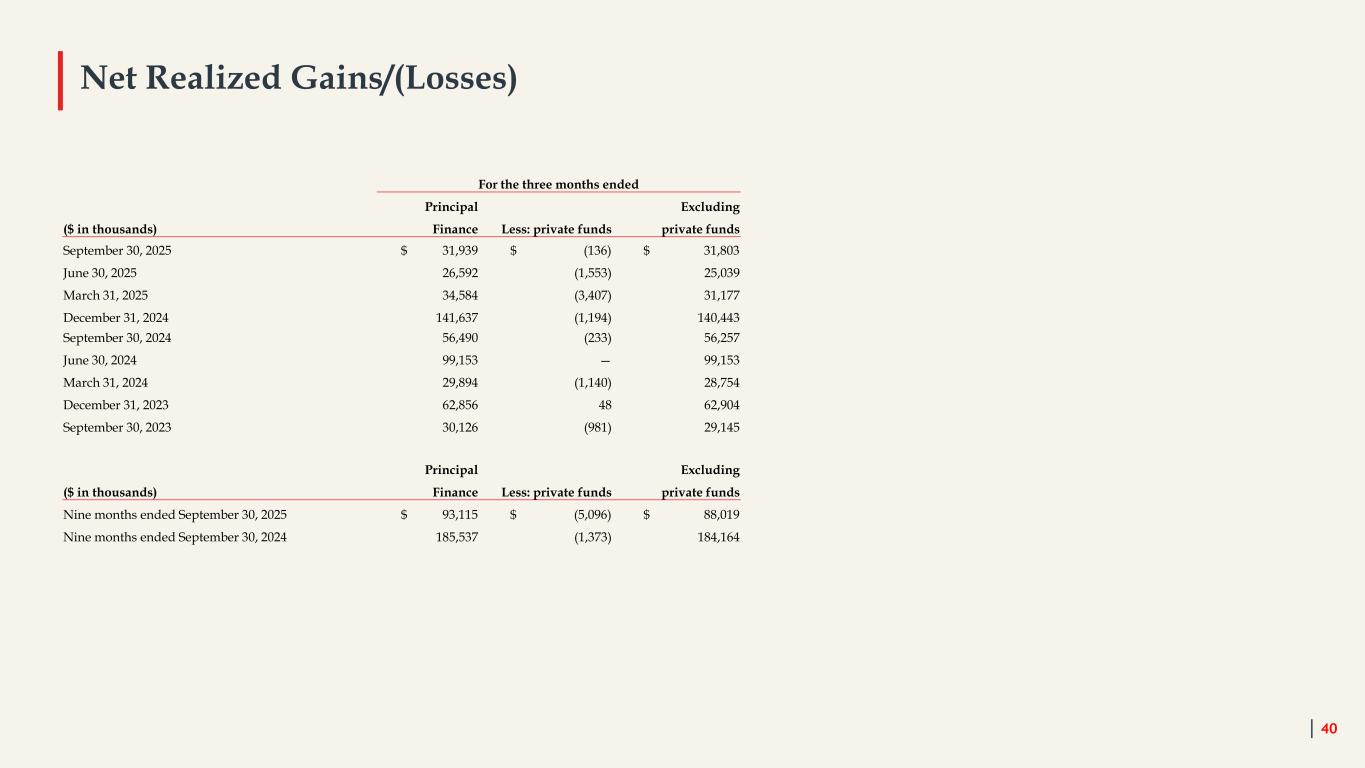
Net Realized Gains/(Losses) 40 For the three months ended Principal Excluding ($ in thousands) Finance Less: private funds private funds September 30, 2025 $ 31,939 $ (136) $ 31,803 June 30, 2025 26,592 (1,553) 25,039 March 31, 2025 34,584 (3,407) 31,177 December 31, 2024 141,637 (1,194) 140,443 September 30, 2024 56,490 (233) 56,257 June 30, 2024 99,153 — 99,153 March 31, 2024 29,894 (1,140) 28,754 December 31, 2023 62,856 48 62,904 September 30, 2023 30,126 (981) 29,145 Principal Excluding ($ in thousands) Finance Less: private funds private funds Nine months ended September 30, 2025 $ 93,115 $ (5,096) $ 88,019 Nine months ended September 30, 2024 185,537 (1,373) 184,164
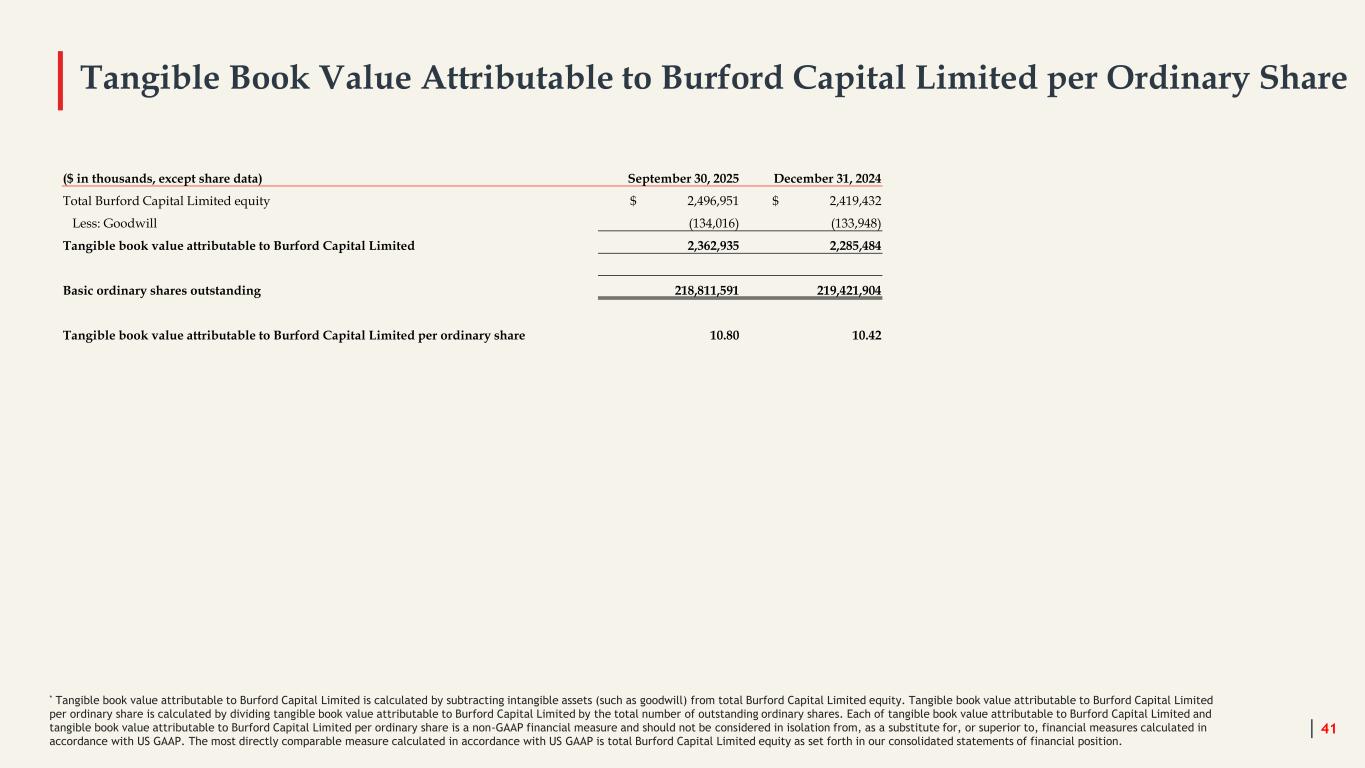
Tangible Book Value Attributable to Burford Capital Limited per Ordinary Share 41 * Tangible book value attributable to Burford Capital Limited is calculated by subtracting intangible assets (such as goodwill) from total Burford Capital Limited equity. Tangible book value attributable to Burford Capital Limited per ordinary share is calculated by dividing tangible book value attributable to Burford Capital Limited by the total number of outstanding ordinary shares. Each of tangible book value attributable to Burford Capital Limited and tangible book value attributable to Burford Capital Limited per ordinary share is a non-GAAP financial measure and should not be considered in isolation from, as a substitute for, or superior to, financial measures calculated in accordance with US GAAP. The most directly comparable measure calculated in accordance with US GAAP is total Burford Capital Limited equity as set forth in our consolidated statements of financial position. ($ in thousands, except share data) September 30, 2025 December 31, 2024 Total Burford Capital Limited equity $ 2,496,951 $ 2,419,432 Less: Goodwill (134,016) (133,948) Tangible book value attributable to Burford Capital Limited 2,362,935 2,285,484 Basic ordinary shares outstanding 218,811,591 219,421,904 Tangible book value attributable to Burford Capital Limited per ordinary share 10.80 10.42
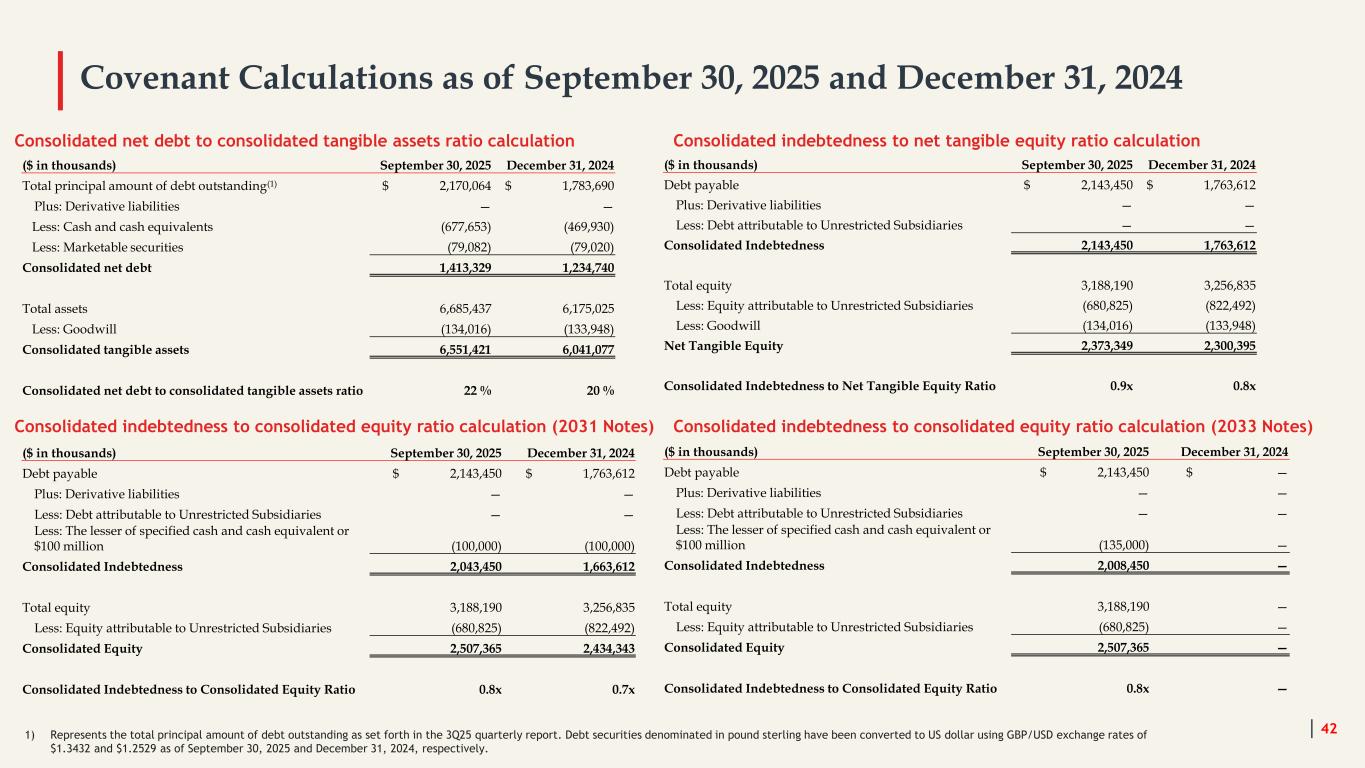
Covenant Calculations as of September 30, 2025 and December 31, 2024 42 Consolidated net debt to consolidated tangible assets ratio calculation Consolidated indebtedness to net tangible equity ratio calculation 1) Represents the total principal amount of debt outstanding as set forth in the 3Q25 quarterly report. Debt securities denominated in pound sterling have been converted to US dollar using GBP/USD exchange rates of $1.3432 and $1.2529 as of September 30, 2025 and December 31, 2024, respectively. Consolidated indebtedness to consolidated equity ratio calculation (2031 Notes) ($ in thousands) September 30, 2025 December 31, 2024 Total principal amount of debt outstanding(1) $ 2,170,064 $ 1,783,690 Plus: Derivative liabilities — — Less: Cash and cash equivalents (677,653) (469,930) Less: Marketable securities (79,082) (79,020) Consolidated net debt 1,413,329 1,234,740 Total assets 6,685,437 6,175,025 Less: Goodwill (134,016) (133,948) Consolidated tangible assets 6,551,421 6,041,077 Consolidated net debt to consolidated tangible assets ratio 22 % 20 % ($ in thousands) September 30, 2025 December 31, 2024 Debt payable $ 2,143,450 $ 1,763,612 Plus: Derivative liabilities — — Less: Debt attributable to Unrestricted Subsidiaries — — Consolidated Indebtedness 2,143,450 1,763,612 Total equity 3,188,190 3,256,835 Less: Equity attributable to Unrestricted Subsidiaries (680,825) (822,492) Less: Goodwill (134,016) (133,948) Net Tangible Equity 2,373,349 2,300,395 Consolidated Indebtedness to Net Tangible Equity Ratio 0.9x 0.8x ($ in thousands) September 30, 2025 December 31, 2024 Debt payable $ 2,143,450 $ 1,763,612 Plus: Derivative liabilities — — Less: Debt attributable to Unrestricted Subsidiaries — — Less: The lesser of specified cash and cash equivalent or $100 million (100,000) (100,000) Consolidated Indebtedness 2,043,450 1,663,612 Total equity 3,188,190 3,256,835 Less: Equity attributable to Unrestricted Subsidiaries (680,825) (822,492) Consolidated Equity 2,507,365 2,434,343 Consolidated Indebtedness to Consolidated Equity Ratio 0.8x 0.7x Consolidated indebtedness to consolidated equity ratio calculation (2033 Notes) ($ in thousands) September 30, 2025 December 31, 2024 Debt payable $ 2,143,450 $ — Plus: Derivative liabilities — — Less: Debt attributable to Unrestricted Subsidiaries — — Less: The lesser of specified cash and cash equivalent or $100 million (135,000) — Consolidated Indebtedness 2,008,450 — Total equity 3,188,190 — Less: Equity attributable to Unrestricted Subsidiaries (680,825) — Consolidated Equity 2,507,365 — Consolidated Indebtedness to Consolidated Equity Ratio 0.8x —
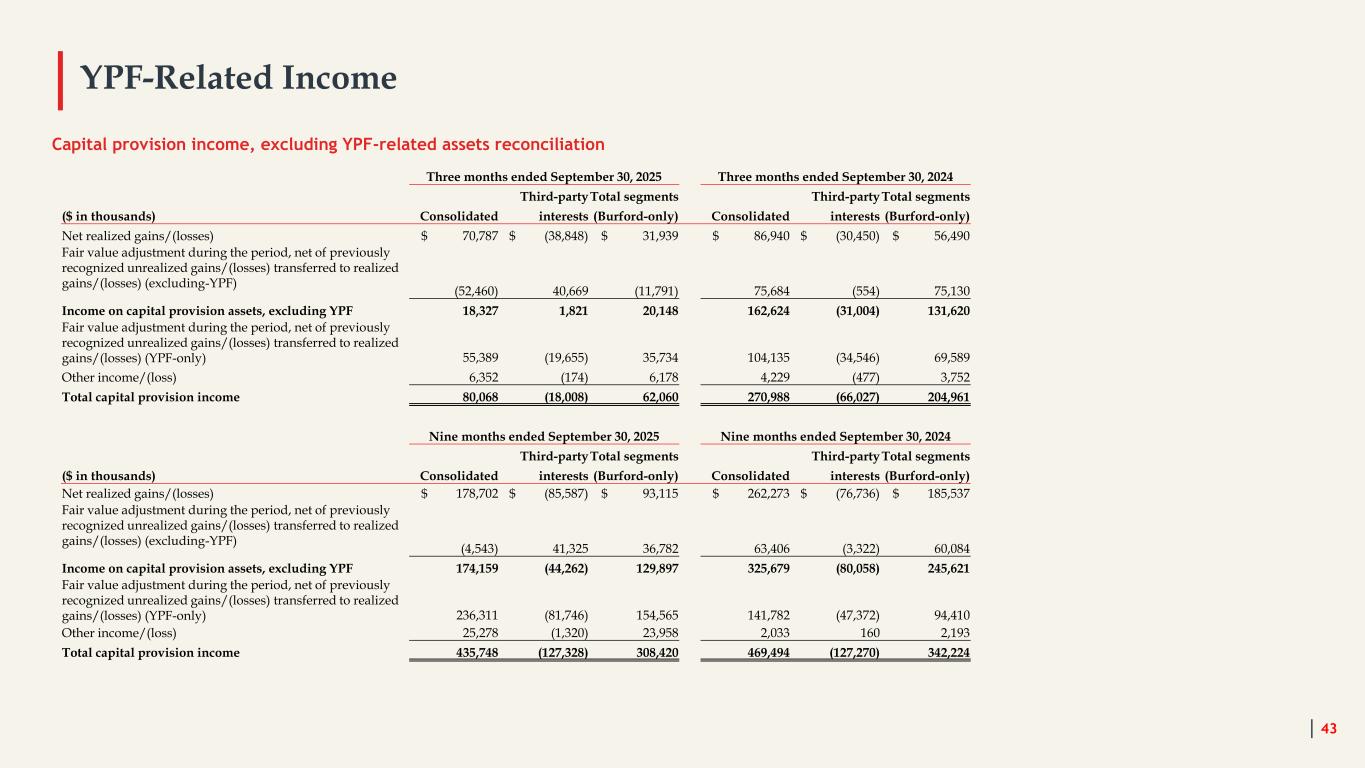
YPF-Related Income 43 Capital provision income, excluding YPF-related assets reconciliation Three months ended September 30, 2025 Three months ended September 30, 2024 Third-partyTotal segments Third-partyTotal segments ($ in thousands) Consolidated interests (Burford-only) Consolidated interests (Burford-only) Net realized gains/(losses) $ 70,787 $ (38,848) $ 31,939 $ 86,940 $ (30,450) $ 56,490 Fair value adjustment during the period, net of previously recognized unrealized gains/(losses) transferred to realized gains/(losses) (excluding-YPF) (52,460) 40,669 (11,791) 75,684 (554) 75,130 Income on capital provision assets, excluding YPF 18,327 1,821 20,148 162,624 (31,004) 131,620 Fair value adjustment during the period, net of previously recognized unrealized gains/(losses) transferred to realized gains/(losses) (YPF-only) 55,389 (19,655) 35,734 104,135 (34,546) 69,589 Other income/(loss) 6,352 (174) 6,178 4,229 (477) 3,752 Total capital provision income 80,068 (18,008) 62,060 270,988 (66,027) 204,961 Nine months ended September 30, 2025 Nine months ended September 30, 2024 Third-partyTotal segments Third-partyTotal segments ($ in thousands) Consolidated interests (Burford-only) Consolidated interests (Burford-only) Net realized gains/(losses) $ 178,702 $ (85,587) $ 93,115 $ 262,273 $ (76,736) $ 185,537 Fair value adjustment during the period, net of previously recognized unrealized gains/(losses) transferred to realized gains/(losses) (excluding-YPF) (4,543) 41,325 36,782 63,406 (3,322) 60,084 Income on capital provision assets, excluding YPF 174,159 (44,262) 129,897 325,679 (80,058) 245,621 Fair value adjustment during the period, net of previously recognized unrealized gains/(losses) transferred to realized gains/(losses) (YPF-only) 236,311 (81,746) 154,565 141,782 (47,372) 94,410 Other income/(loss) 25,278 (1,320) 23,958 2,033 160 2,193 Total capital provision income 435,748 (127,328) 308,420 469,494 (127,270) 342,224
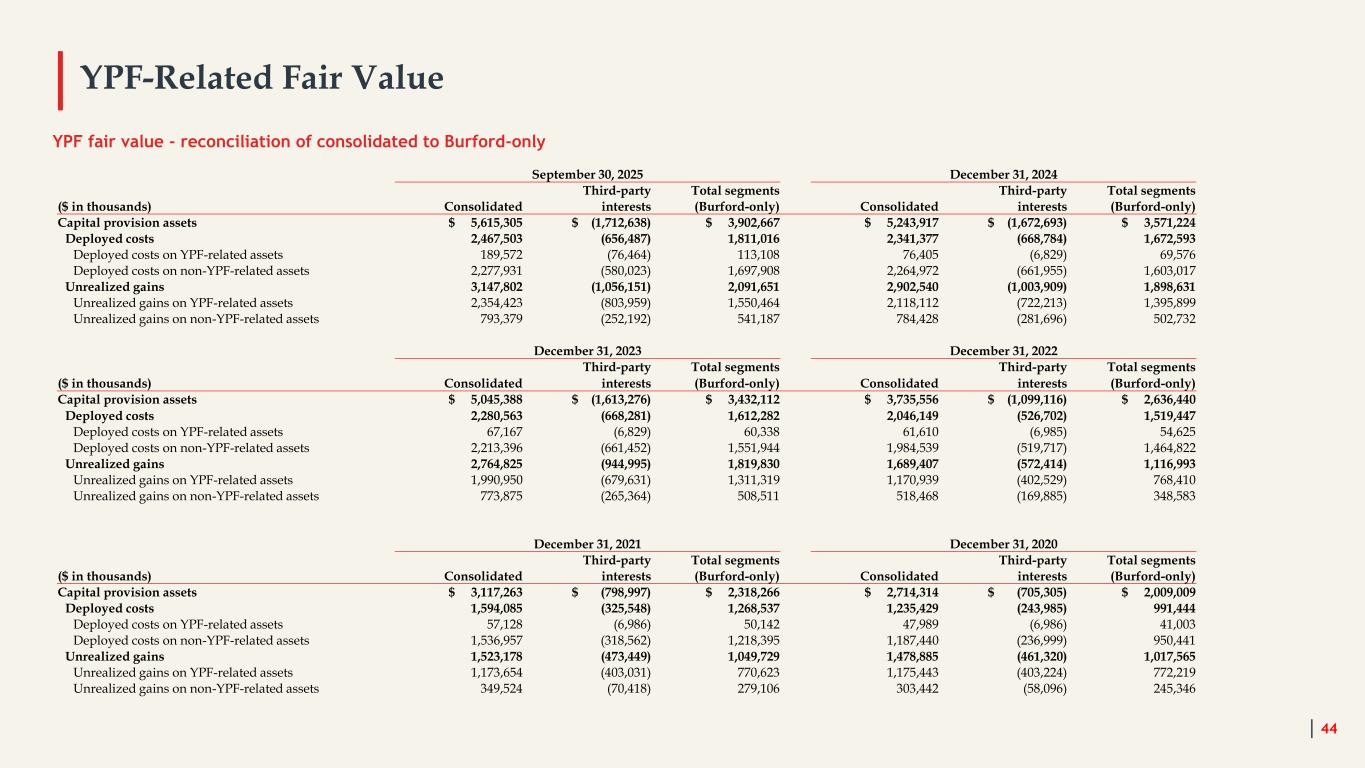
YPF-Related Fair Value 44 YPF fair value - reconciliation of consolidated to Burford-only September 30, 2025 December 31, 2024 Third-party Total segments Third-party Total segments ($ in thousands) Consolidated interests (Burford-only) Consolidated interests (Burford-only) Capital provision assets $ 5,615,305 $ (1,712,638) $ 3,902,667 $ 5,243,917 $ (1,672,693) $ 3,571,224 Deployed costs 2,467,503 (656,487) 1,811,016 2,341,377 (668,784) 1,672,593 Deployed costs on YPF-related assets 189,572 (76,464) 113,108 76,405 (6,829) 69,576 Deployed costs on non-YPF-related assets 2,277,931 (580,023) 1,697,908 2,264,972 (661,955) 1,603,017 Unrealized gains 3,147,802 (1,056,151) 2,091,651 2,902,540 (1,003,909) 1,898,631 Unrealized gains on YPF-related assets 2,354,423 (803,959) 1,550,464 2,118,112 (722,213) 1,395,899 Unrealized gains on non-YPF-related assets 793,379 (252,192) 541,187 784,428 (281,696) 502,732 December 31, 2023 December 31, 2022 Third-party Total segments Third-party Total segments ($ in thousands) Consolidated interests (Burford-only) Consolidated interests (Burford-only) Capital provision assets $ 5,045,388 $ (1,613,276) $ 3,432,112 $ 3,735,556 $ (1,099,116) $ 2,636,440 Deployed costs 2,280,563 (668,281) 1,612,282 2,046,149 (526,702) 1,519,447 Deployed costs on YPF-related assets 67,167 (6,829) 60,338 61,610 (6,985) 54,625 Deployed costs on non-YPF-related assets 2,213,396 (661,452) 1,551,944 1,984,539 (519,717) 1,464,822 Unrealized gains 2,764,825 (944,995) 1,819,830 1,689,407 (572,414) 1,116,993 Unrealized gains on YPF-related assets 1,990,950 (679,631) 1,311,319 1,170,939 (402,529) 768,410 Unrealized gains on non-YPF-related assets 773,875 (265,364) 508,511 518,468 (169,885) 348,583 December 31, 2021 December 31, 2020 Third-party Total segments Third-party Total segments ($ in thousands) Consolidated interests (Burford-only) Consolidated interests (Burford-only) Capital provision assets $ 3,117,263 $ (798,997) $ 2,318,266 $ 2,714,314 $ (705,305) $ 2,009,009 Deployed costs 1,594,085 (325,548) 1,268,537 1,235,429 (243,985) 991,444 Deployed costs on YPF-related assets 57,128 (6,986) 50,142 47,989 (6,986) 41,003 Deployed costs on non-YPF-related assets 1,536,957 (318,562) 1,218,395 1,187,440 (236,999) 950,441 Unrealized gains 1,523,178 (473,449) 1,049,729 1,478,885 (461,320) 1,017,565 Unrealized gains on YPF-related assets 1,173,654 (403,031) 770,623 1,175,443 (403,224) 772,219 Unrealized gains on non-YPF-related assets 349,524 (70,418) 279,106 303,442 (58,096) 245,346
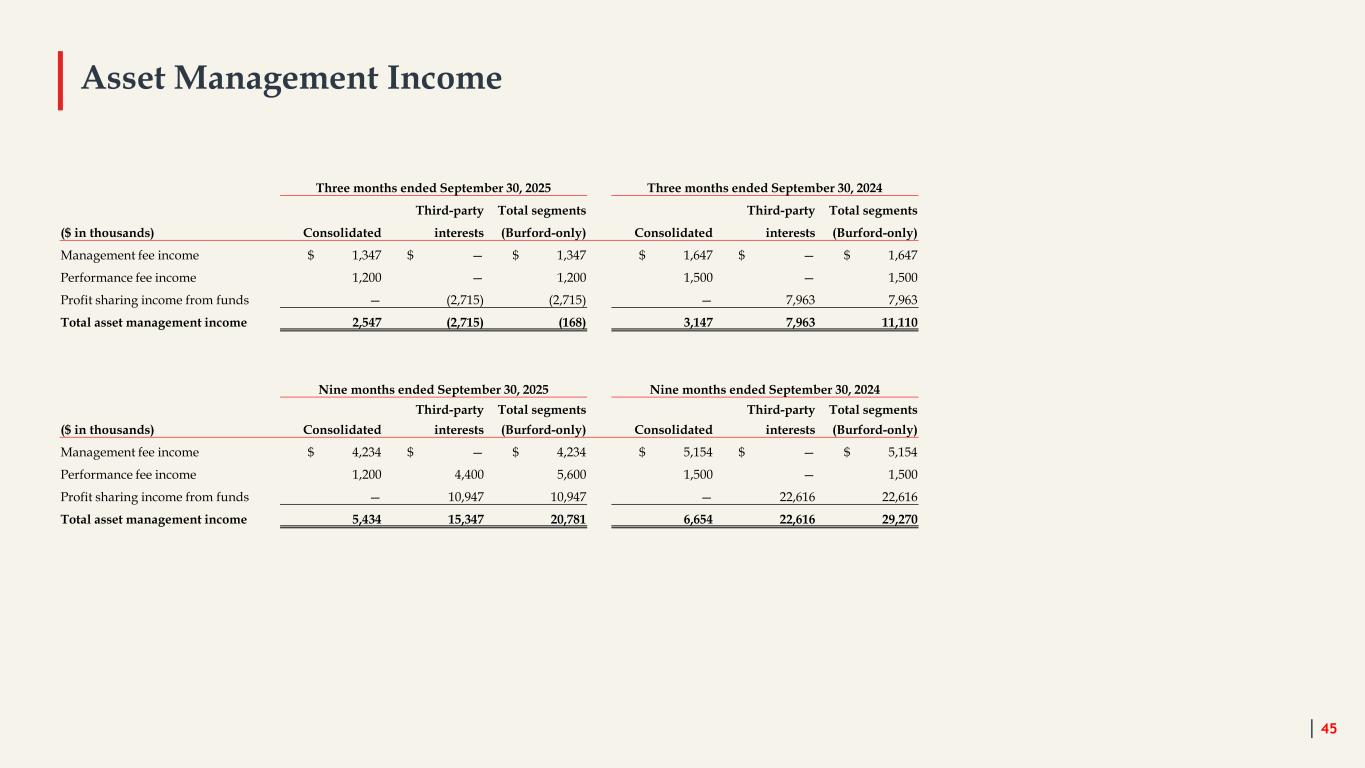
Asset Management Income 45 Three months ended September 30, 2025 Three months ended September 30, 2024 Third-party Total segments Third-party Total segments ($ in thousands) Consolidated interests (Burford-only) Consolidated interests (Burford-only) Management fee income $ 1,347 $ — $ 1,347 $ 1,647 $ — $ 1,647 Performance fee income 1,200 — 1,200 1,500 — 1,500 Profit sharing income from funds — (2,715) (2,715) — 7,963 7,963 Total asset management income 2,547 (2,715) (168) 3,147 7,963 11,110 Nine months ended September 30, 2025 Nine months ended September 30, 2024 Third-party Total segments Third-party Total segments ($ in thousands) Consolidated interests (Burford-only) Consolidated interests (Burford-only) Management fee income $ 4,234 $ — $ 4,234 $ 5,154 $ — $ 5,154 Performance fee income 1,200 4,400 5,600 1,500 — 1,500 Profit sharing income from funds — 10,947 10,947 — 22,616 22,616 Total asset management income 5,434 15,347 20,781 6,654 22,616 29,270
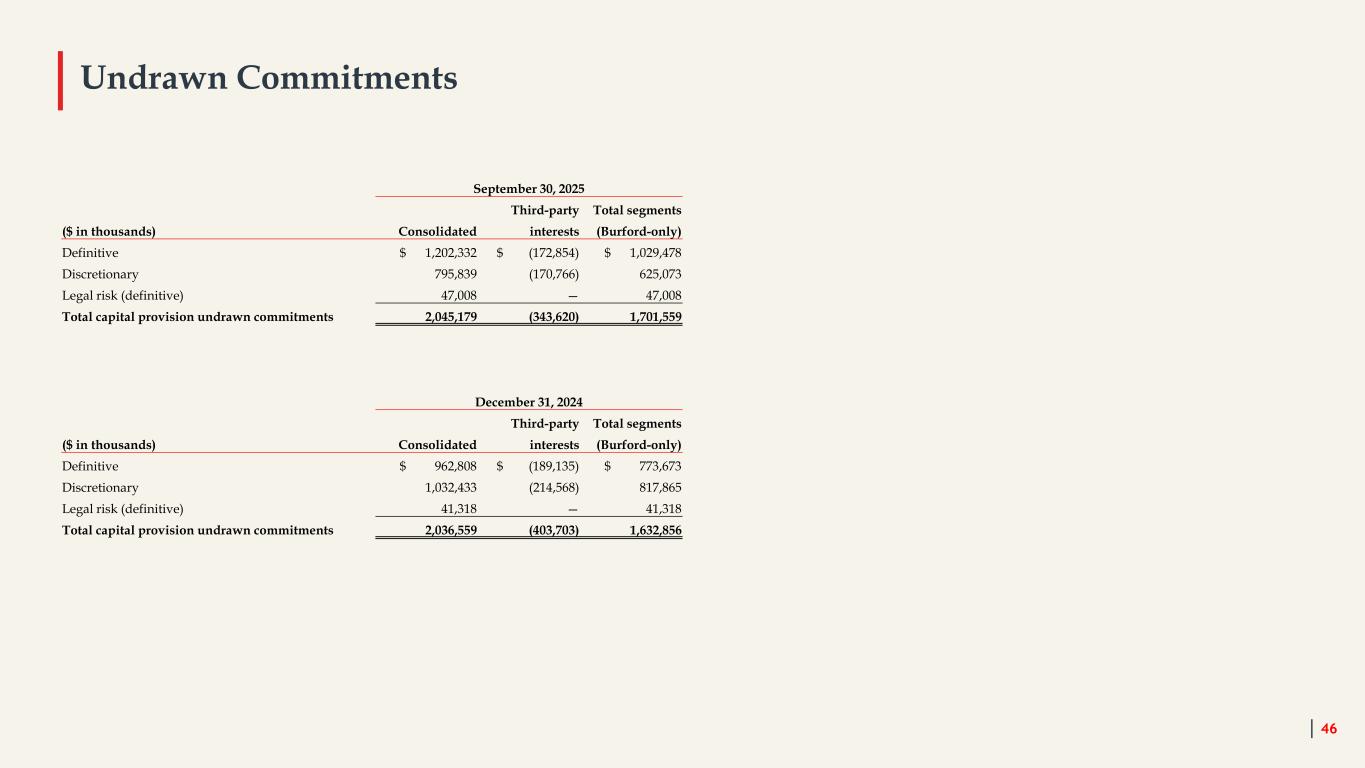
Undrawn Commitments 46 September 30, 2025 Third-party Total segments ($ in thousands) Consolidated interests (Burford-only) Definitive $ 1,202,332 $ (172,854) $ 1,029,478 Discretionary 795,839 (170,766) 625,073 Legal risk (definitive) 47,008 — 47,008 Total capital provision undrawn commitments 2,045,179 (343,620) 1,701,559 December 31, 2024 Third-party Total segments ($ in thousands) Consolidated interests (Burford-only) Definitive $ 962,808 $ (189,135) $ 773,673 Discretionary 1,032,433 (214,568) 817,865 Legal risk (definitive) 41,318 — 41,318 Total capital provision undrawn commitments 2,036,559 (403,703) 1,632,856
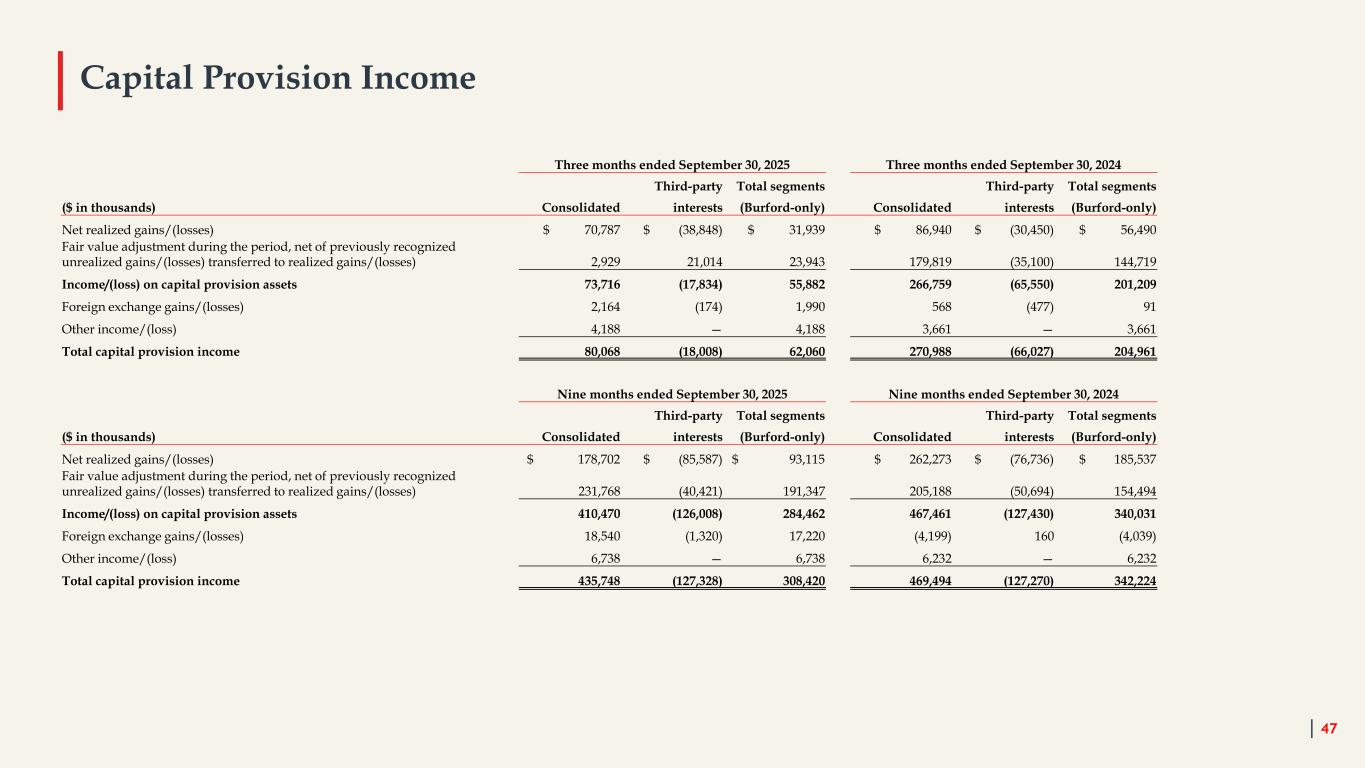
Capital Provision Income 47 Three months ended September 30, 2025 Three months ended September 30, 2024 Third-party Total segments Third-party Total segments ($ in thousands) Consolidated interests (Burford-only) Consolidated interests (Burford-only) Net realized gains/(losses) $ 70,787 $ (38,848) $ 31,939 $ 86,940 $ (30,450) $ 56,490 Fair value adjustment during the period, net of previously recognized unrealized gains/(losses) transferred to realized gains/(losses) 2,929 21,014 23,943 179,819 (35,100) 144,719 Income/(loss) on capital provision assets 73,716 (17,834) 55,882 266,759 (65,550) 201,209 Foreign exchange gains/(losses) 2,164 (174) 1,990 568 (477) 91 Other income/(loss) 4,188 — 4,188 3,661 — 3,661 Total capital provision income 80,068 (18,008) 62,060 270,988 (66,027) 204,961 Nine months ended September 30, 2025 Nine months ended September 30, 2024 Third-party Total segments Third-party Total segments ($ in thousands) Consolidated interests (Burford-only) Consolidated interests (Burford-only) Net realized gains/(losses) $ 178,702 $ (85,587) $ 93,115 $ 262,273 $ (76,736) $ 185,537 Fair value adjustment during the period, net of previously recognized unrealized gains/(losses) transferred to realized gains/(losses) 231,768 (40,421) 191,347 205,188 (50,694) 154,494 Income/(loss) on capital provision assets 410,470 (126,008) 284,462 467,461 (127,430) 340,031 Foreign exchange gains/(losses) 18,540 (1,320) 17,220 (4,199) 160 (4,039) Other income/(loss) 6,738 — 6,738 6,232 — 6,232 Total capital provision income 435,748 (127,328) 308,420 469,494 (127,270) 342,224
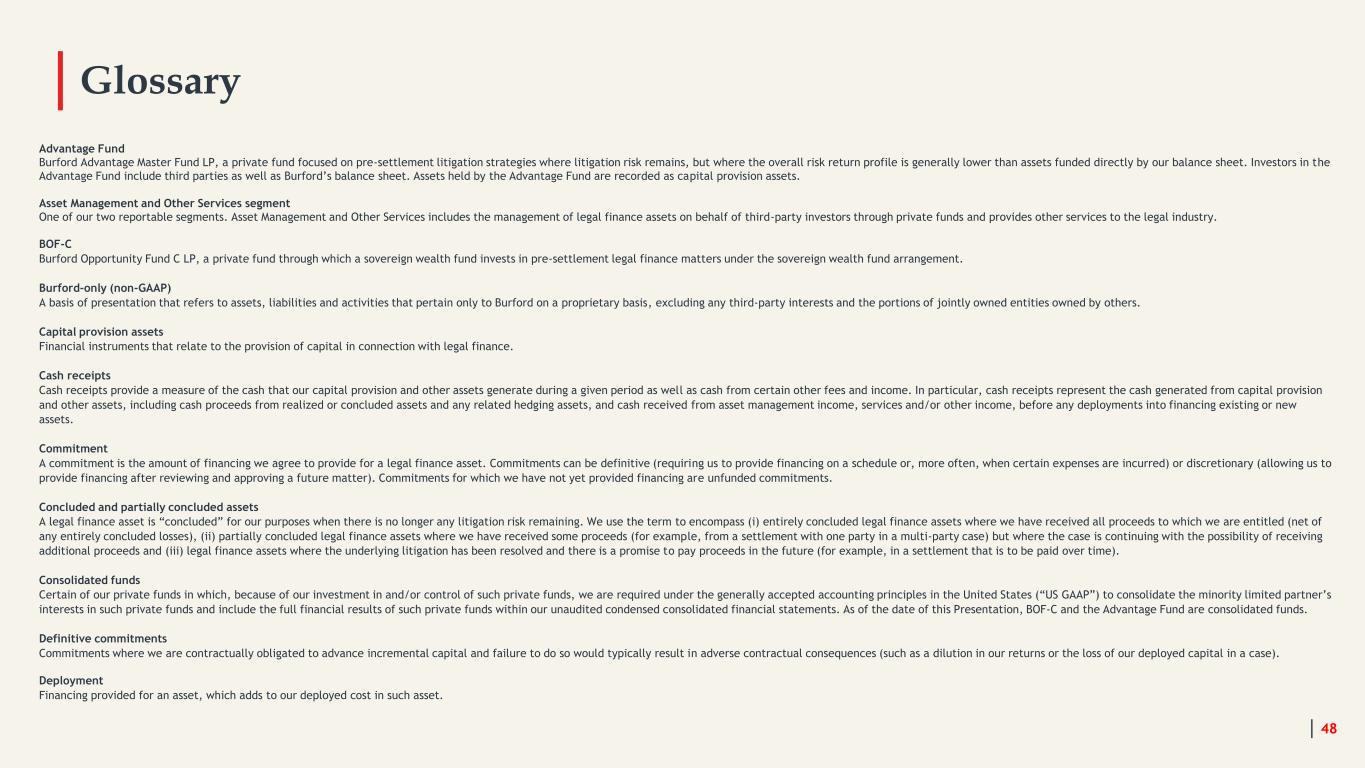
Advantage Fund Burford Advantage Master Fund LP, a private fund focused on pre-settlement litigation strategies where litigation risk remains, but where the overall risk return profile is generally lower than assets funded directly by our balance sheet. Investors in the Advantage Fund include third parties as well as Burford’s balance sheet. Assets held by the Advantage Fund are recorded as capital provision assets. Asset Management and Other Services segment One of our two reportable segments. Asset Management and Other Services includes the management of legal finance assets on behalf of third-party investors through private funds and provides other services to the legal industry. BOF-C Burford Opportunity Fund C LP, a private fund through which a sovereign wealth fund invests in pre-settlement legal finance matters under the sovereign wealth fund arrangement. Burford-only (non-GAAP) A basis of presentation that refers to assets, liabilities and activities that pertain only to Burford on a proprietary basis, excluding any third-party interests and the portions of jointly owned entities owned by others. Capital provision assets Financial instruments that relate to the provision of capital in connection with legal finance. Cash receipts Cash receipts provide a measure of the cash that our capital provision and other assets generate during a given period as well as cash from certain other fees and income. In particular, cash receipts represent the cash generated from capital provision and other assets, including cash proceeds from realized or concluded assets and any related hedging assets, and cash received from asset management income, services and/or other income, before any deployments into financing existing or new assets. Commitment A commitment is the amount of financing we agree to provide for a legal finance asset. Commitments can be definitive (requiring us to provide financing on a schedule or, more often, when certain expenses are incurred) or discretionary (allowing us to provide financing after reviewing and approving a future matter). Commitments for which we have not yet provided financing are unfunded commitments. Concluded and partially concluded assets A legal finance asset is “concluded” for our purposes when there is no longer any litigation risk remaining. We use the term to encompass (i) entirely concluded legal finance assets where we have received all proceeds to which we are entitled (net of any entirely concluded losses), (ii) partially concluded legal finance assets where we have received some proceeds (for example, from a settlement with one party in a multi-party case) but where the case is continuing with the possibility of receiving additional proceeds and (iii) legal finance assets where the underlying litigation has been resolved and there is a promise to pay proceeds in the future (for example, in a settlement that is to be paid over time). Consolidated funds Certain of our private funds in which, because of our investment in and/or control of such private funds, we are required under the generally accepted accounting principles in the United States (“US GAAP”) to consolidate the minority limited partner’s interests in such private funds and include the full financial results of such private funds within our unaudited condensed consolidated financial statements. As of the date of this Presentation, BOF-C and the Advantage Fund are consolidated funds. Definitive commitments Commitments where we are contractually obligated to advance incremental capital and failure to do so would typically result in adverse contractual consequences (such as a dilution in our returns or the loss of our deployed capital in a case). Deployment Financing provided for an asset, which adds to our deployed cost in such asset. Glossary 48
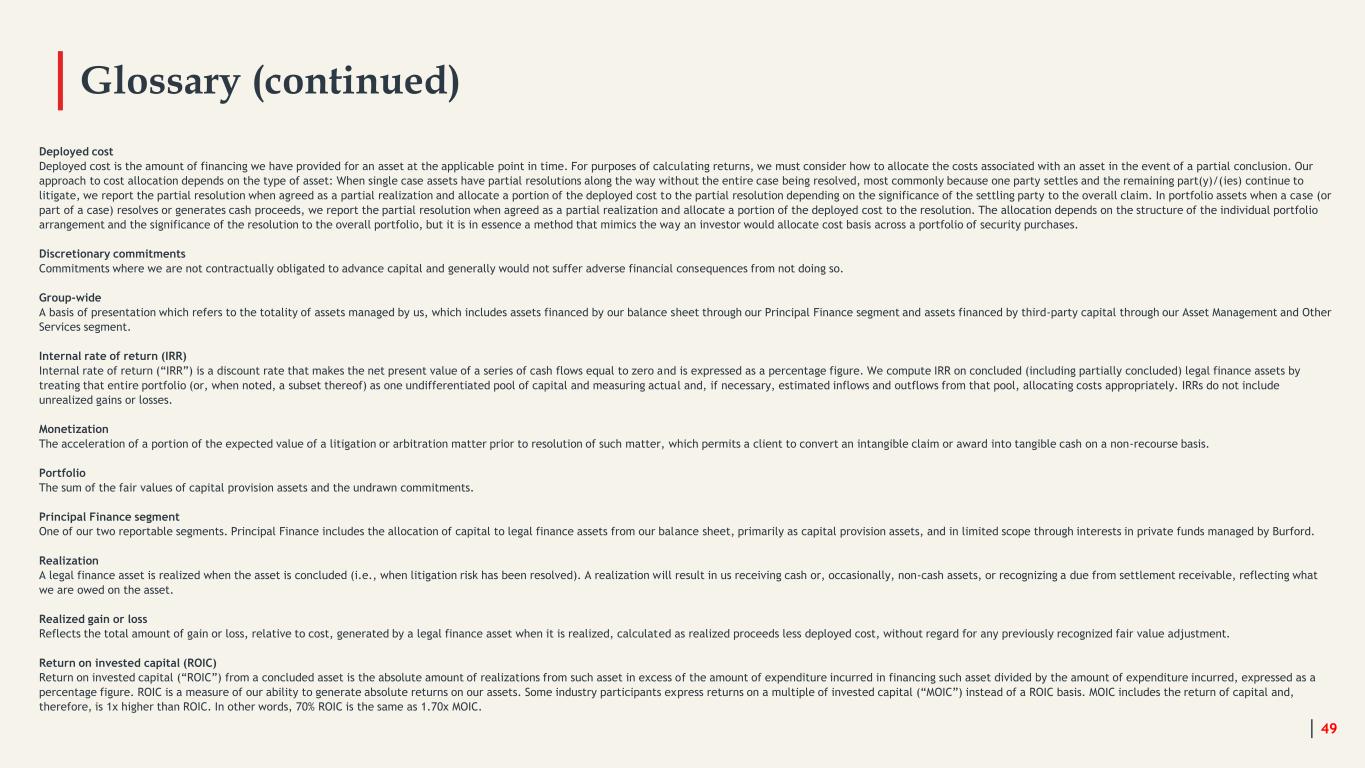
Deployed cost Deployed cost is the amount of financing we have provided for an asset at the applicable point in time. For purposes of calculating returns, we must consider how to allocate the costs associated with an asset in the event of a partial conclusion. Our approach to cost allocation depends on the type of asset: When single case assets have partial resolutions along the way without the entire case being resolved, most commonly because one party settles and the remaining part(y)/(ies) continue to litigate, we report the partial resolution when agreed as a partial realization and allocate a portion of the deployed cost to the partial resolution depending on the significance of the settling party to the overall claim. In portfolio assets when a case (or part of a case) resolves or generates cash proceeds, we report the partial resolution when agreed as a partial realization and allocate a portion of the deployed cost to the resolution. The allocation depends on the structure of the individual portfolio arrangement and the significance of the resolution to the overall portfolio, but it is in essence a method that mimics the way an investor would allocate cost basis across a portfolio of security purchases. Discretionary commitments Commitments where we are not contractually obligated to advance capital and generally would not suffer adverse financial consequences from not doing so. Group-wide A basis of presentation which refers to the totality of assets managed by us, which includes assets financed by our balance sheet through our Principal Finance segment and assets financed by third-party capital through our Asset Management and Other Services segment. Internal rate of return (IRR) Internal rate of return (“IRR”) is a discount rate that makes the net present value of a series of cash flows equal to zero and is expressed as a percentage figure. We compute IRR on concluded (including partially concluded) legal finance assets by treating that entire portfolio (or, when noted, a subset thereof) as one undifferentiated pool of capital and measuring actual and, if necessary, estimated inflows and outflows from that pool, allocating costs appropriately. IRRs do not include unrealized gains or losses. Monetization The acceleration of a portion of the expected value of a litigation or arbitration matter prior to resolution of such matter, which permits a client to convert an intangible claim or award into tangible cash on a non-recourse basis. Portfolio The sum of the fair values of capital provision assets and the undrawn commitments. Principal Finance segment One of our two reportable segments. Principal Finance includes the allocation of capital to legal finance assets from our balance sheet, primarily as capital provision assets, and in limited scope through interests in private funds managed by Burford. Realization A legal finance asset is realized when the asset is concluded (i.e., when litigation risk has been resolved). A realization will result in us receiving cash or, occasionally, non-cash assets, or recognizing a due from settlement receivable, reflecting what we are owed on the asset. Realized gain or loss Reflects the total amount of gain or loss, relative to cost, generated by a legal finance asset when it is realized, calculated as realized proceeds less deployed cost, without regard for any previously recognized fair value adjustment. Return on invested capital (ROIC) Return on invested capital (“ROIC”) from a concluded asset is the absolute amount of realizations from such asset in excess of the amount of expenditure incurred in financing such asset divided by the amount of expenditure incurred, expressed as a percentage figure. ROIC is a measure of our ability to generate absolute returns on our assets. Some industry participants express returns on a multiple of invested capital (“MOIC”) instead of a ROIC basis. MOIC includes the return of capital and, therefore, is 1x higher than ROIC. In other words, 70% ROIC is the same as 1.70x MOIC. Glossary (continued) 49
Glossary (continued) 50 Total segments Refers to the sum of our two reportable segments, (i) Principal Finance and (ii) Asset Management and Other Services, and is presented on a Burford-only basis. Unrealized gain or loss Represents the fair value of our legal finance assets over or under their deployed cost, as determined in accordance with the requirements of the applicable US GAAP standards, for the relevant financial reporting period (unaudited condensed consolidated statements of operations) or cumulatively (unaudited condensed consolidated statements of financial condition). Vintage Refers to the calendar year in which a legal finance commitment is initially made. YPF-related assets Refers to our Petersen and Eton Park legal finance assets, which are two claims relating to the Republic of Argentina’s nationalization of YPF S.A., the Argentine energy company.
