UNITED STATES
SECURITIES AND EXCHANGE COMMISSION
Washington, D.C. 20549
FORM 6-K
Report of Foreign Private Issuer
Pursuant to Rule 27a-16 or 15d-16
under the Securities Exchange Act of 1934
For the month of March, 2026
Commission File Number: 001-38376
Central Puerto S.A.
(Exact name of registrant as specified in its charter)
Port Central S.A.
(Translation of registrant’s name into English)
Avenida Thomas Edison 2701
C1104BAB Buenos Aires
Republic of Argentina
+54 (11) 4317-5000
(Address of principal executive offices)
Indicate by check mark whether the registrant files or will file annual reports under cover Form 20-F or Form 40-F.
Form 20-F [X] Form 40-F [_]
Indicate by check mark if the registrant is submitting the Form 6-K in paper as permitted by Regulation S-T Rule 101(b)(1):
Yes [_] No [X]
Indicate by check mark if the registrant is submitting the Form 6-K in paper as permitted by Regulation S-T Rule 101(b)(7):
Yes [_] No [X]
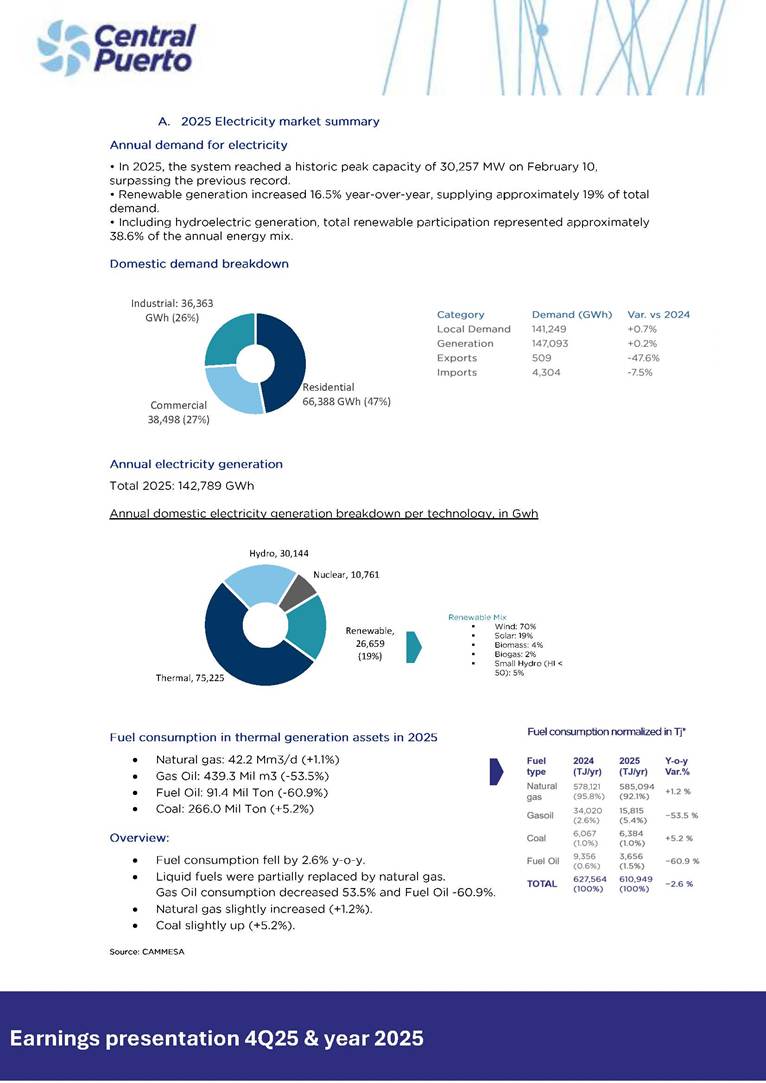
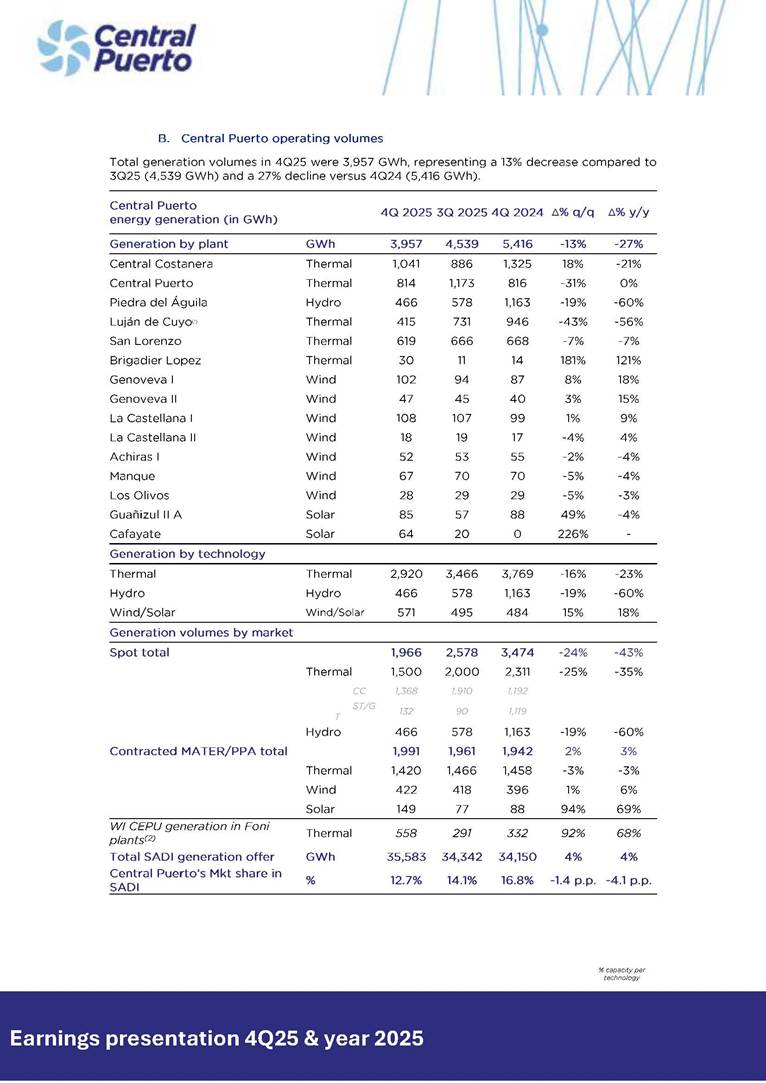
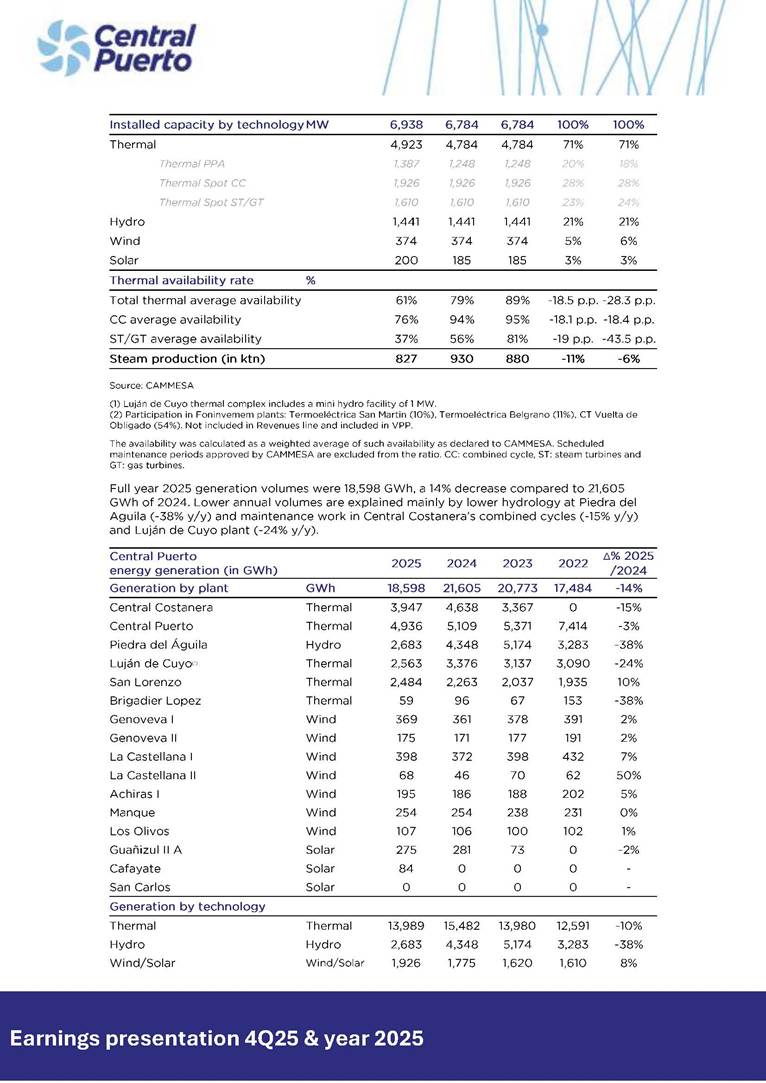
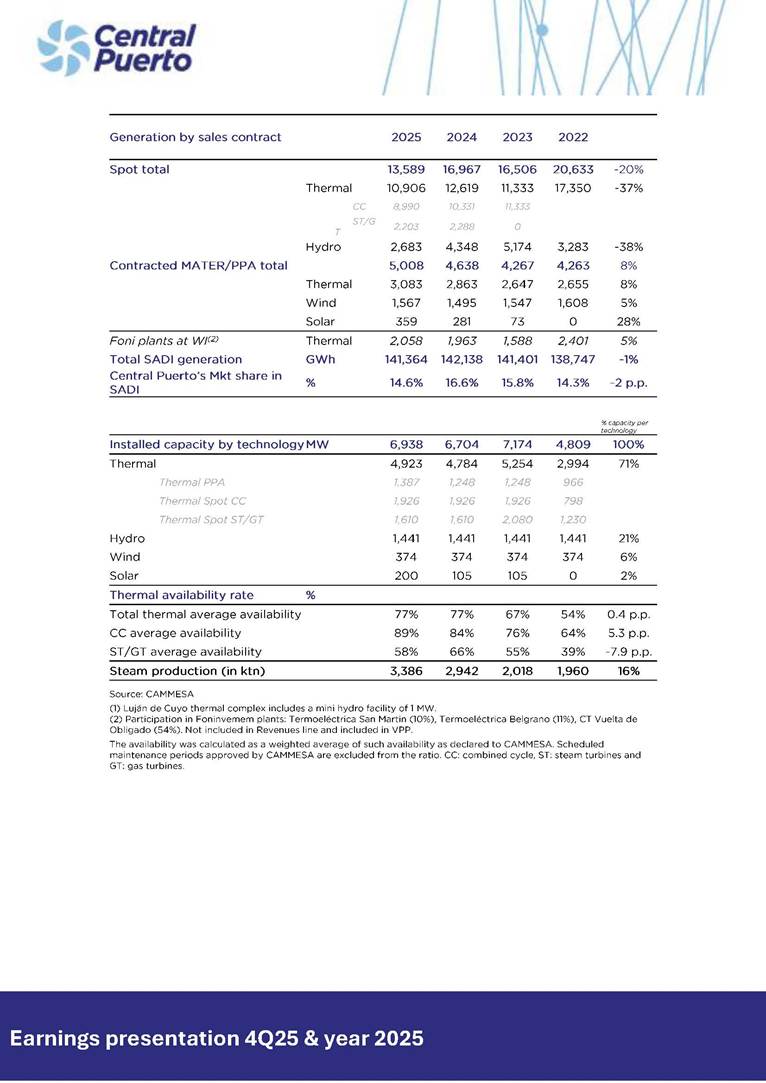
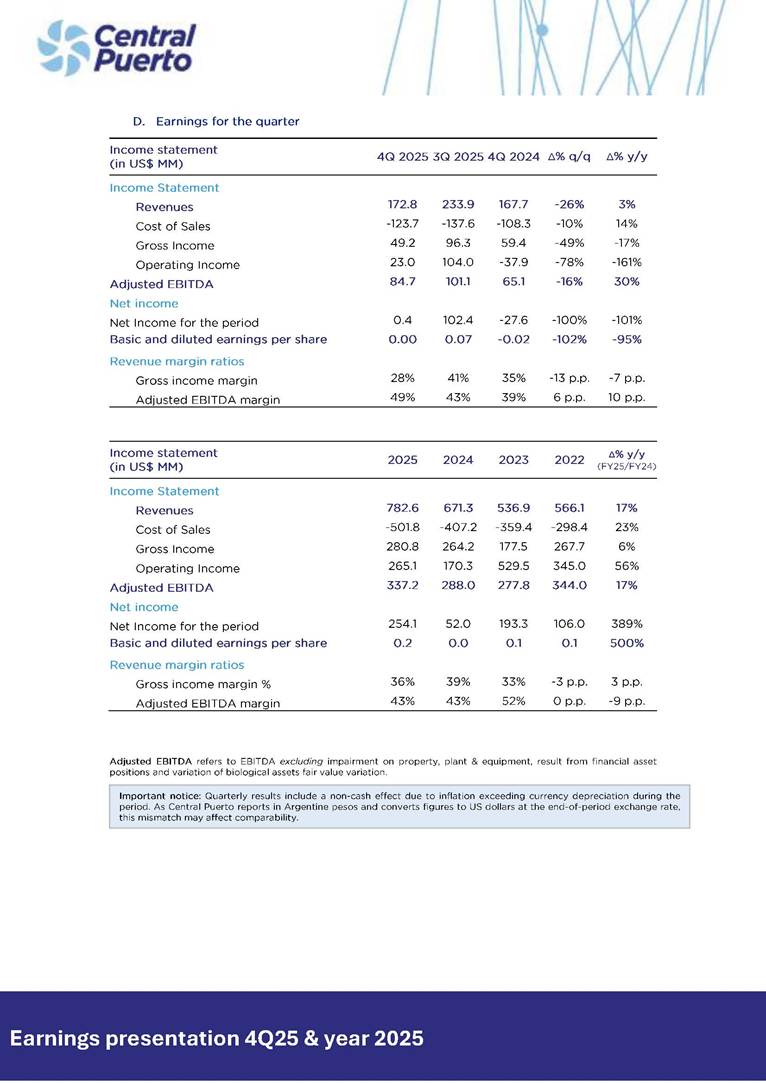
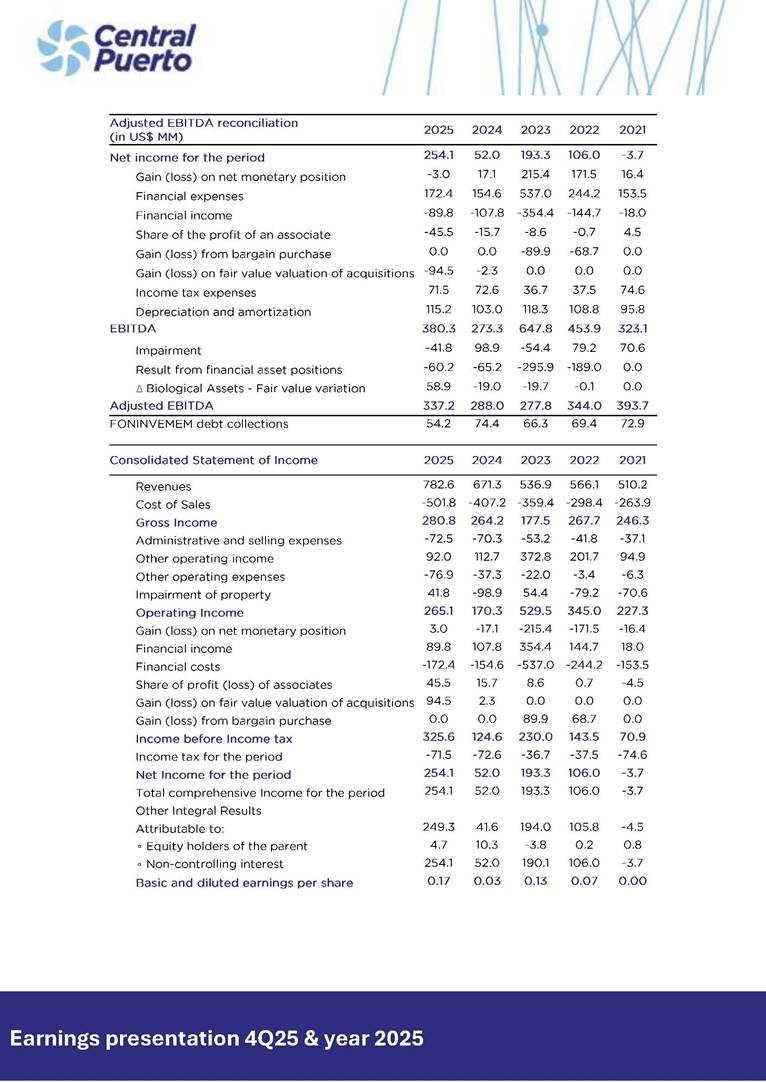
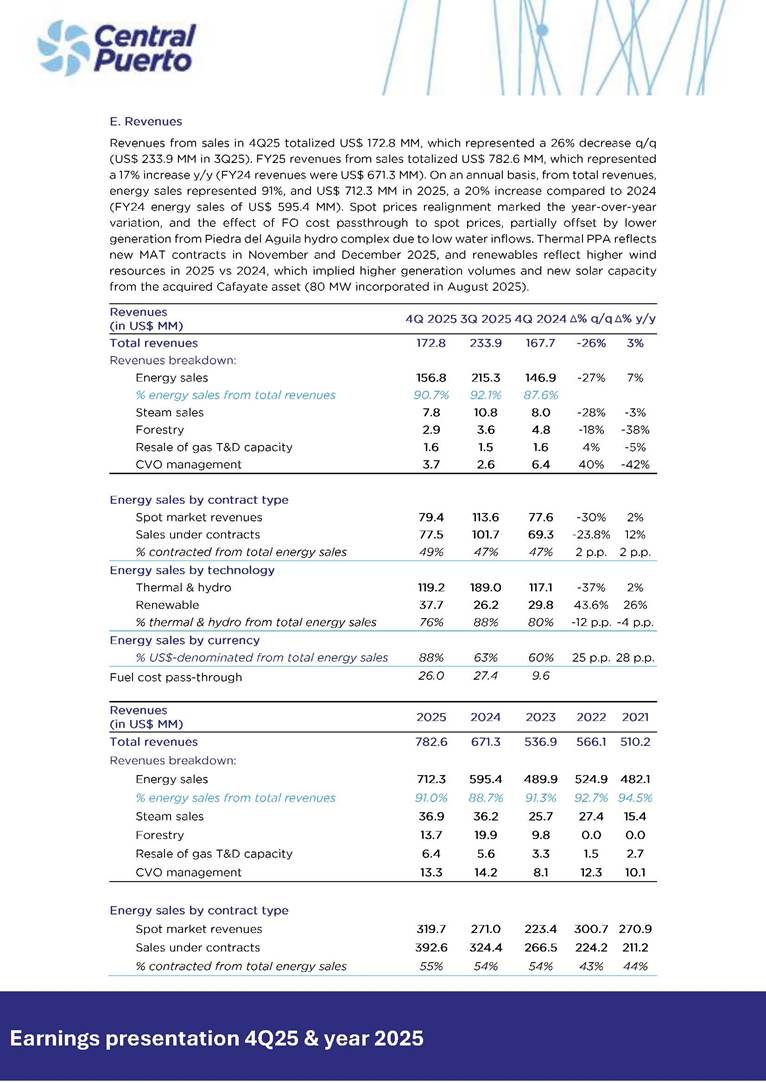
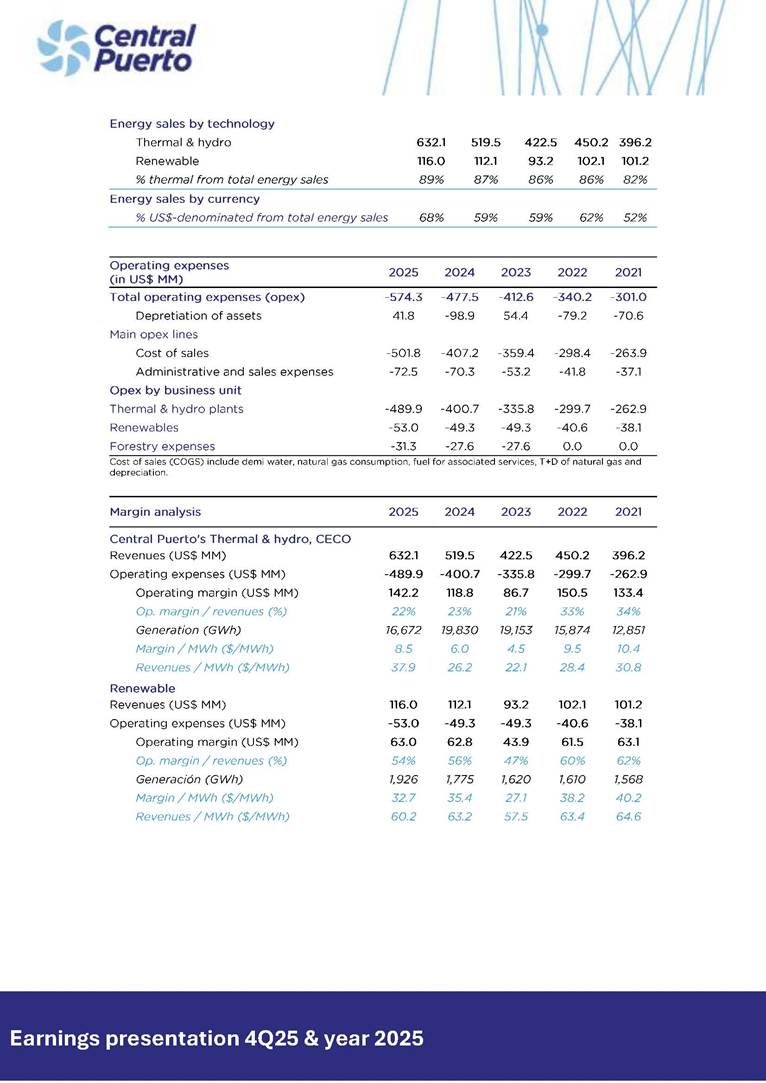
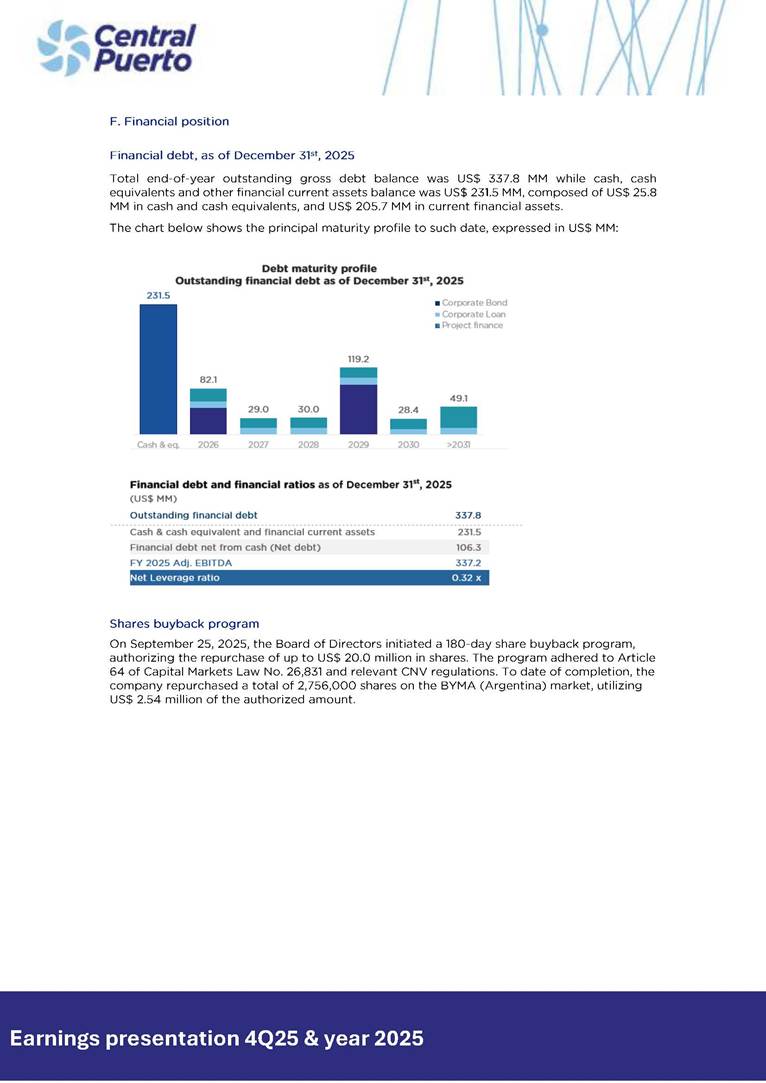
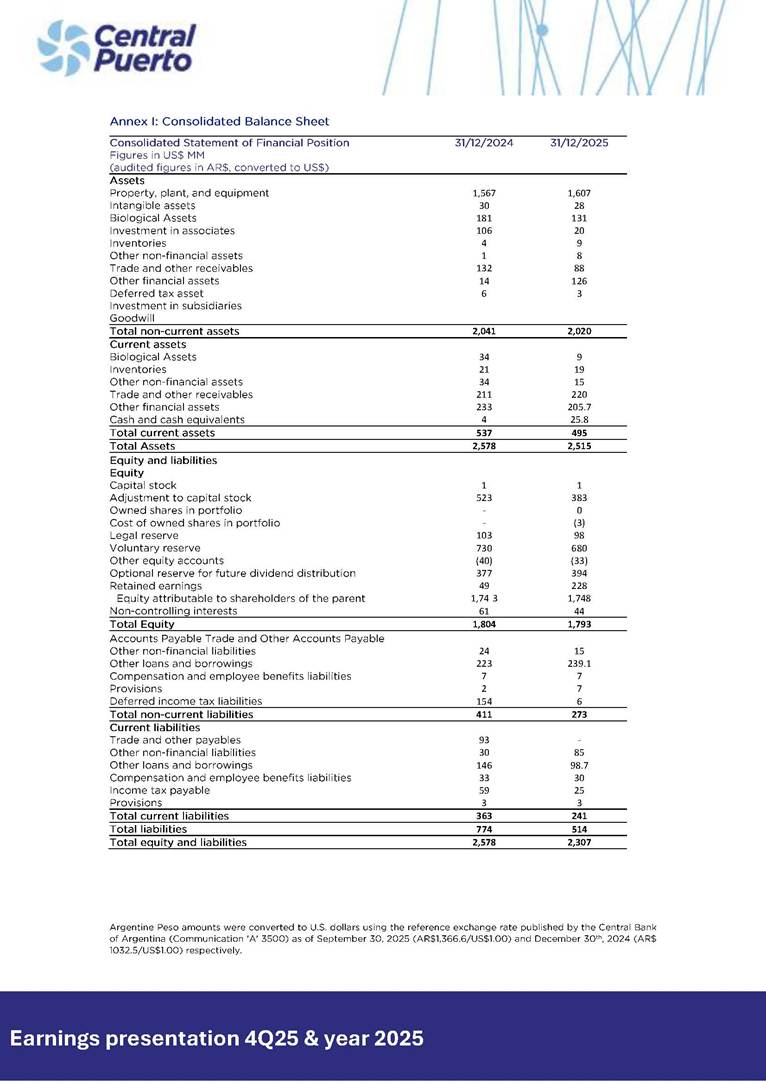
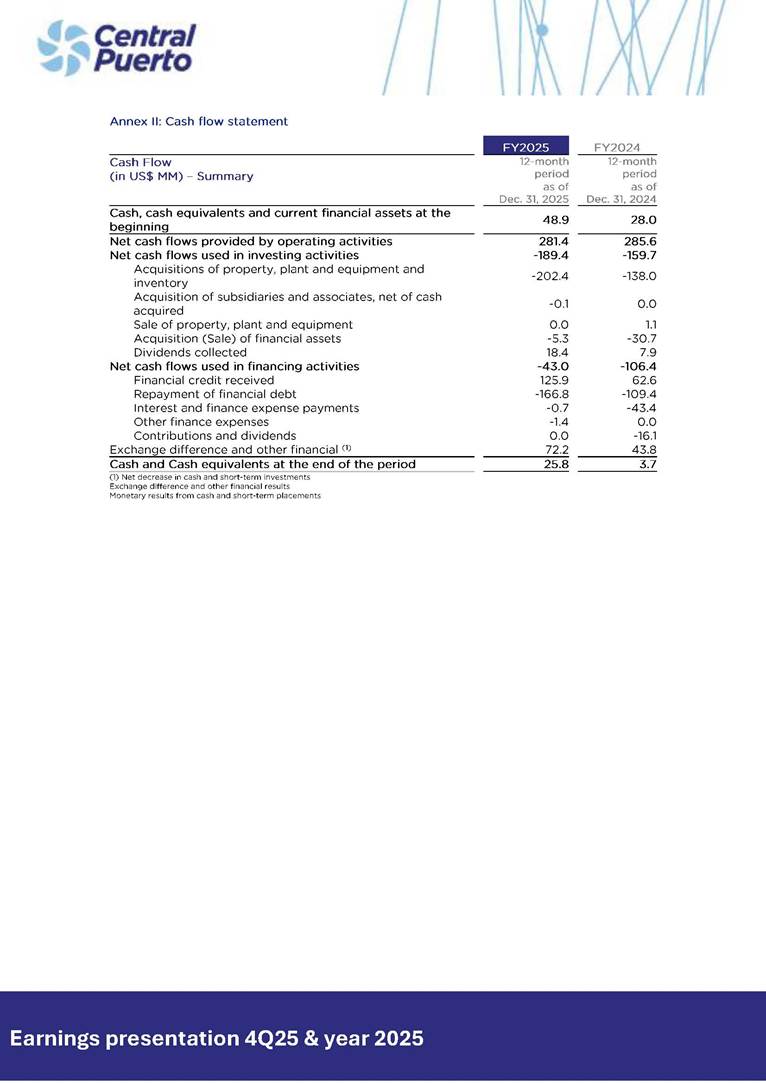
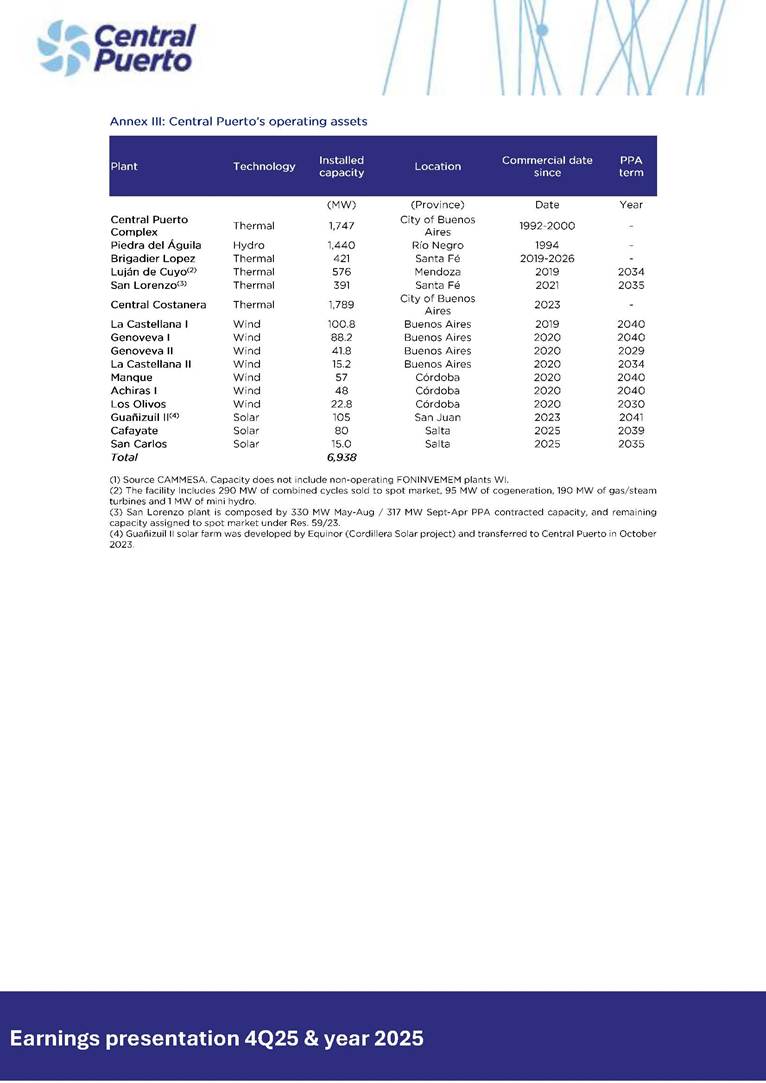
Earnings presentation Consolidated results 4Q25 & FY 2025 Earnings presentation 4Q25 & year 2025 Earnings presentation 4Q25 and FY2025 Buenos Aires, March 5th, Central Puerto S.A (“Central Puerto” or the “Company”) (NYSE: CEPU; BYMA: CEPU), the largest private power generation company in Argentina, reports its financial results for the fourth quarter 2025 (“4Q25”), ended on December 31st, 2025, and full year 2025. A conference call to discuss the results of this quarter and full year will be held tomorrow, March 6th at 10:00 AM ET Eastern Time (12:00 PM BAT). Webcast Access is available on our website. Business development projects & events update • Piedra del Águila concession extension to 2055: In December 2025, the Company was awarded the concession under the Comahue Hydroelectric Complex privatization process, extending the operating term of the Piedra del Águila hydroelectric facility through 2055. Winning bid offer was US$ 245 MM, paid in January 2026. • San Carlos solar farm: The asset reached commercial operation (COD) in November 2025, adding 15 MW of renewable capacity to our portfolio. Together with Cafayate (acquired through M&A), our two 2025 solar projects doubled our installed solar capacity and increased our total renewable portfolio (wind and solar) by 20%. • Closing of Brigadier Lopez combined cycle of 420 MW: The asset achieved commercial operation date (COD) during 1Q26. • Maintenance update: Luján de Cuyo LDCU TG26 (47 MW). In November 2025, after a comprehensive technical assessment with Siemens Energy, we decided to undertake a full stator replacement. While this represents an unplanned maintenance event, the selected scope will ensure long-term reliability and asset integrity. The unit is expected to return to service in the second half of 2026. Financial & operational highlights of the 4th quarter and full year 2025 • 4Q25 Adjusted EBITDA was US$ 84.7 MM, 16% below the US$ 101.1 MM Adjusted EBITDA in 3Q25. FY25 Adjusted EBITDA was US$ 337.2 MM, 17% above FY24 Adjusted EBITDA of US$ 288.0 MM. • Total generation volumes in 4Q25 were 3,957 GWh, representing a 13% decrease compared to 3Q25 (4,539 GWh) and a 27% decline versus 4Q24 (5,416 GWh). Full year 2025 generation volumes were 18,598 GWh, a 14% decrease compared to 21,605 GWh of 2024. Lower annual volumes are explained mainly by lower hydrology at Piedra del Aguila (-38% y/y) and maintenance work in Central Costanera’s combined cycles (-15% y/y) and Luján de Cuyo cogeneration downtime in 4Q25 (-24% y/y). • Revenues from sales in 4Q25 totalized US$ 172.8 MM, which represented a 26% decrease q/q (US$ 233.9 MM in 3Q25). FY25 revenues from sales totalized US$ 782.6 MM, which represented a 17% increase y/y (FY24 revenues were US$ 671.3 MM). On an annual basis, from total revenues, energy sales represented 91%, and US$ 712.3 MM in 2025, a 20% increase compared to 2024 (FY24 energy sales of US$ 595.4 MM). Spot prices realignment marked the year-over-year variation, and the effect of FO cost passthrough to spot prices, partially offset by lower generation from Piedra del Aguila hydro complex due to low water inflows. Thermal PPA reflects Terminal 6 (San Lorenzo) self purchased liquids (Resol 21/2025), new MAT contracts in November and December 2025, and renewables reflect higher wind resources in 2025 vs 2024, which implied higher generation volumes and new solar capacity from the acquired Cafayate asset (80 MW incorporated in August 2025). • Capital Expenditures: In 2025, total capex reached US$ 202.4 million. This included US$ 48.5 million for the acquisition of the Cafayate solar farm, completed in August, as well Earnings presentation 4Q25 & year 2025 as investments related to the completion of the Brigadier López combined cycle plant and the San Carlos solar project—both initiated in 2024—along with maintenance capex composed of recurrent maintenance capex (US$ 25 MM) and non-recurrent from Central Costanera and Luján de Cuyo (US$ 27 MM). • As of December 31, 2025, total outstanding gross debt balance was US$ 337.8 MM, and net financial debt resulted in US$ 106.3 MM and net leverage ratio was 0.32 x Adj. EBITDA. • Outstanding credit from Foninvemem program stood at US$ 118.6 MM, to continue being collected in monthly installments through May 2028. • The Company signed on Dec. 19, 2025, a US$ 300 MM A/B syndicated loan with International Finance Corporation (IFC), with an average life of approximately five years. The credit line was granted to finance the privatization fee of Piedra del Águila and the battery energy system storage (BESS) project. Resolution SE 400/25: Wholesale Electricity Market reform initiated – transition explained In October 2025, the generation units without PPAs—mainly Central Puerto and Central Costanera—continued to be remunerated under Energy Secretariat Resolution No. 381/25. Effective November 1, 2025, these thermal units transitioned to the framework established by Resolution No. 400/25, marking a further step toward Wholesale Electricity Market (WEM) normalization. The new scheme introduced two revenue streams: (i) a marginalist spot market remuneration for dispatched energy, and (ii) the Term Market (MAT), through which capacity and energy may be contracted with large users and distributors. As part of this ramp-up toward contractualization, during November and December 2025 Central Puerto delivered approximately 900 MWh under new TERM contracts with industrial customers, representing around 11% of total new TERM volumes executed in the market during that period. Under Resolution No. 400/25, the 4Q25 spot remuneration scheme for thermal assets consisted of: • Energy component: Spot price formula based on CVP + RMA, equivalent to approximately US$ 7/MWh net of fuel costs. • Capacity payment: US$ 12 per MW-month with a remunerated availability of 90 hours per week. Fuel-related factors: Natural gas (single-fuel units): 1.1 (summer/winter) and 0.9 (shoulder months). Alternative fuels (FO, GO): 1.5 (summer/winter) and 1.0 (shoulder months). • Reliability reserve component: Additional remuneration of US$ 1,000 per MW-month for assets previously categorized as spot thermal units. Meanwhile, the hydro plant Piedra del Águila remained under its prior regulatory framework during the quarter. However, it was reached by Resolutions No. 483/25 and No. 602/25, applicable to November and December 2025, respectively. Additionally, the Gas and Steam Turbine (GT/ST) units at Central Puerto and Central Costanera that adhered to Resolution No. 294/2024—within the Contingency and Forecast Plan for the 2024–2026 critical period—continued receiving incremental remuneration of US$ 2,500 per MW (which will be applicable through March 2027). This scheme aims to ensure system reliability during peak demand and critical supply conditions. Earnings presentation 4Q25 & year 2025 A. 2025 Electricity market summary Annual demand for electricity • In 2025, the system reached a historic peak capacity of 30,257 MW on February 10, surpassing the previous record. • Renewable generation increased 16.5% year -over - year, supplying approximately 19% of total demand. • Including hydroelectric generation, total renewable participation represented approximately 38.6% of the annual energy mix. Domestic demand breakdown Annual electricity generation Total 2025: 142,789 GWh Annual domestic electricity generation breakdown per technology, in Gwh Fuel consumption in thermal generation assets in 2025 • Natural gas: 42.2 Mm3/d (+1.1%) • Gas Oil: 439.3 Mil m3 ( -53.5%) • Fuel Oil: 91.4 Mil Ton ( -60.9%) • Coal: 266.0 Mil Ton (+5.2%) Overview: • Fuel consumption fell by 2.6% y -o- y. • Liquid fuels were partially replaced by natural gas. Gas Oil consumption decreased 53.5% and Fuel Oil -60.9%. • Natural gas slightly increased (+1.2%). • Coal slightly up (+5.2%). Source: CAMMESA Residential Commercial 66,388 GWh (47%) 38,498 (27%) Industrial: 36,363 GWh (26%) Thermal, 75,225 Hydro, 30,144 Nuclear, 10,761 Renewable, 26,659 (19%) Renewable Mix ▪ Wind: 70% ▪ Solar: 19% ▪ Biomass: 4% ▪ Biogas: 2% ▪ Small Hydro (HI < 50): 5% Fuel consumption normalized in Tj* Earnings presentation 4Q25 & year 2025 B. Central Puerto operating volumes Total generation volumes in 4Q25 were 3,957 GWh, representing a 13% decrease compared to 3Q25 (4,539 GWh) and a 27% decline versus 4Q24 (5,416 GWh). Central Puerto energy generation (in GWh) 4Q 2025 3Q 2025 4Q 2024 Δ% q/q Δ% y/y Generation by plant GWh 3,957 4,539 5,416 -13% -27% Central Costanera Thermal 1,041 886 1,325 18% -21% Central Puerto Thermal 814 1,173 816 -31% 0% Piedra del Águila Hydro 466 578 1,163 -19% -60% Luján de Cuyo (1) Thermal 415 731 946 -43% -56% San Lorenzo Thermal 619 666 668 -7% -7% Brigadier Lopez Thermal 30 11 14 181% 121% Genoveva I Wind 102 94 87 8% 18% Genoveva II Wind 47 45 40 3% 15% La Castellana I Wind 108 107 99 1% 9% La Castellana II Wind 18 19 17 -4% 4% Achiras I Wind 52 53 55 -2% -4% Manque Wind 67 70 70 -5% -4% Los Olivos Wind 28 29 29 -5% -3% Guañizul II A Solar 85 57 88 49% -4% Cafayate Solar 64 20 0 226% - Generation by technology Thermal Thermal 2,920 3,466 3,769 -16% -23% Hydro Hydro 466 578 1,163 -19% -60% Wind/Solar Wind/Solar 571 495 484 15% 18% Generation volumes by market Spot total 1,966 2,578 3,474 -24% -43% Thermal 1,500 2,000 2,311 -25% -35% CC 1,368 1,910 1,192 ST/G T 132 90 1,119 Hydro 466 578 1,163 -19% -60% Contracted MATER/PPA total 1,991 1,961 1,942 2% 3% Thermal 1,420 1,466 1,458 -3% -3% Wind 422 418 396 1% 6% Solar 149 77 88 94% 69% WI CEPU generation in Foni plants (2) Thermal 558 291 332 92% 68% Total SADI generation offer GWh 35,583 34,342 34,150 4% 4% Central Puerto’s Mkt share in SADI % 12.7% 14.1% 16.8% - 1.4 p.p. - 4.1 p.p. % capacity per technology Earnings presentation 4Q25 & year 2025 Installed capacity by technology MW 6,938 6,784 6,784 100% 100% Thermal 4,923 4,784 4,784 71% 71% Thermal PPA 1,387 1,248 1,248 20% 18% Thermal Spot CC 1,926 1,926 1,926 28% 28% Thermal Spot ST/GT 1,610 1,610 1,610 23% 24% Hydro 1,441 1,441 1,441 21% 21% Wind 374 374 374 5% 6% Solar 200 185 185 3% 3% Thermal availability rate % Total thermal average availability 61% 79% 89% -18.5 p.p. -28.3 p.p. CC average availability 76% 94% 95% -18.1 p.p. -18.4 p.p. ST/GT average availability 37% 56% 81% -19 p.p. -43.5 p.p. Steam production (in ktn) 827 930 880 -11% -6% Source: CAMMESA (1) Luján de Cuyo thermal complex includes a mini hydro facility of 1 MW. (2) Participation in Foninvemem plants: Termoeléctrica San Martin (10%), Termoeléctrica Belgrano (11%), CT Vuelta de Obligado (54%). Not included in Revenues line and included in VPP. The availability was calculated as a weighted average of such availability as declared to CAMMESA. Scheduled maintenance periods approved by CAMMESA are excluded from the ratio. CC: combined cycle, ST: steam turbines and GT: gas turbines. Full year 2025 generation volumes were 18,598 GWh, a 14% decrease compared to 21,605 GWh of 2024. Lower annual volumes are explained mainly by lower hydrology at Piedra del Aguila (-38% y/y) and maintenance work in Central Costanera’s combined cycles (-15% y/y) and Luján de Cuyo plant (-24% y/y). Central Puerto energy generation (in GWh) 2025 2024 2023 2022 Δ% 2025 /2024 Generation by plant GWh 18,598 21,605 20,773 17,484 -14% Central Costanera Thermal 3,947 4,638 3,367 0 -15% Central Puerto Thermal 4,936 5,109 5,371 7,414 -3% Piedra del Águila Hydro 2,683 4,348 5,174 3,283 -38% Luján de Cuyo(1) Thermal 2,563 3,376 3,137 3,090 -24% San Lorenzo Thermal 2,484 2,263 2,037 1,935 10% Brigadier Lopez Thermal 59 96 67 153 -38% Genoveva I Wind 369 361 378 391 2% Genoveva II Wind 175 171 177 191 2% La Castellana I Wind 398 372 398 432 7% La Castellana II Wind 68 46 70 62 50% Achiras I Wind 195 186 188 202 5% Manque Wind 254 254 238 231 0% Los Olivos Wind 107 106 100 102 1% Guañizul II A Solar 275 281 73 0 -2% Cafayate Solar 84 0 0 0 - San Carlos Solar 0 0 0 0 - Generation by technology Thermal Thermal 13,989 15,482 13,980 12,591 -10% Hydro Hydro 2,683 4,348 5,174 3,283 -38% Wind/Solar Wind/Solar 1,926 1,775 1,620 1,610 8% Earnings presentation 4Q25 & year 2025 Generation by sales contract 2025 2024 2023 2022 Spot total 13,589 16,967 16,506 20,633 -20% Thermal 10,906 12,619 11,333 17,350 -37% CC 8,990 10,331 11,333 ST/GT 2,203 2,288 0 Hydro 2,683 4,348 5,174 3,283 -38% Contracted MATER/PPA total 5,008 4,638 4,267 4,263 8% Thermal 3,083 2,863 2,647 2,655 8% Wind 1,567 1,495 1,547 1,608 5% Solar 359 281 73 0 28% Foni plants at WI(2) Thermal 2,058 1,963 1,588 2,401 5% Total SADI generation GWh 141,364 142,138 141,401 138,747 -1% Central Puerto’s Mkt share in SADI % 14.6% 16.6% 15.8% 14.3% -2 p.p. % capacity per technology Installed capacity by technology MW 6,938 6,704 7,174 4,809 100% Thermal 4,923 4,784 5,254 2,994 71% Thermal PPA 1,387 1,248 1,248 966 Thermal Spot CC 1,926 1,926 1,926 798 Thermal Spot ST/GT 1,610 1,610 2,080 1,230 Hydro 1,441 1,441 1,441 1,441 21% Wind 374 374 374 374 6% Solar 200 105 105 0 2% Thermal availability rate % Total thermal average availability 77% 77% 67% 54% 0.4 p.p. CC average availability 89% 84% 76% 64% 5.3 p.p. ST/GT average availability 58% 66% 55% 39% -7.9 p.p. Steam production (in ktn) 3,386 2,942 2,018 1,960 16% Source: CAMMESA (1) Luján de Cuyo thermal complex includes a mini hydro facility of 1 MW. (2) Participation in Foninvemem plants: Termoeléctrica San Martin (10%), Termoeléctrica Belgrano (11%), CT Vuelta de Obligado (54%). Not included in Revenues line and included in VPP. The availability was calculated as a weighted average of such availability as declared to CAMMESA. Scheduled maintenance periods approved by CAMMESA are excluded from the ratio. CC: combined cycle, ST: steam turbines and GT: gas turbines. Earnings presentation 4Q25 & year 2025 D. Earnings for the quarter Income statement (in US$ MM) 4Q 2025 3Q 2025 4Q 2024 Δ% q/q Δ% y/y Income Statement Revenues 172.8 233.9 167.7 -26% 3% Cost of Sales -123.7 -137.6 -108.3 -10% 14% Gross Income 49.2 96.3 59.4 -49% -17% Operating Income 23.0 104.0 -37.9 -78% -161% Adjusted EBITDA 84.7 101.1 65.1 -16% 30% Net income Net Income for the period 0.4 102.4 -27.6 -100% -101% Basic and diluted earnings per share 0.00 0.07 - 0.02 -102% -95% Revenue margin ratios Gross income margin 28% 41% 35% - 13 p.p. - 7 p.p. Adjusted EBITDA margin 49% 43% 39% 6 p.p. 10 p.p. Income statement (in US$ MM) 2025 2024 2023 2022 Δ% y/y (FY25/FY24) Income Statement Revenues 782.6 671.3 536.9 566.1 17% Cost of Sales -501.8 -407.2 -359.4 -298.4 23% Gross Income 280.8 264.2 177.5 267.7 6% Operating Income 265.1 170.3 529.5 345.0 56% Adjusted EBITDA 337.2 288.0 277.8 344.0 17% Net income Net Income for the period 254.1 52.0 193.3 106.0 389% Basic and diluted earnings per share 0.2 0.0 0.1 0.1 500% Revenue margin ratios Gross income margin % 36% 39% 33% - 3 p.p. 3 p.p. Adjusted EBITDA margin 43% 43% 52% 0 p.p. - 9 p.p. Adjusted EBITDA refers to EBITDA excluding impairment on property, plant & equipment, result from financial asset positions and variation of biological assets fair value variation. Important notice: Quarterly results include a non - cash effect due to inflation exceeding currency depreciation during the period. As Central Puerto reports in Argentine pesos and converts figures to US dollars at the end - of - period exchange rate, this mismatch may affect co mparability. Earnings presentation 4Q25 & year 2025 Adjusted EBITDA reconciliation (in US$ MM) 2025 2024 2023 2022 2021 Net income for the period 254.1 52.0 193.3 106.0 -3.7 Gain (loss) on net monetary position -3.0 17.1 215.4 171.5 16.4 Financial expenses 172.4 154.6 537.0 244.2 153.5 Financial income -89.8 -107.8 -354.4 -144.7 -18.0 Share of the profit of an associate -45.5 -15.7 -8.6 -0.7 4.5 Gain (loss) from bargain purchase 0.0 0.0 -89.9 -68.7 0.0 Gain (loss) on fair value valuation of acquisitions -94.5 -2.3 0.0 0.0 0.0 Income tax expenses 71.5 72.6 36.7 37.5 74.6 Depreciation and amortization 115.2 103.0 118.3 108.8 95.8 EBITDA 380.3 273.3 647.8 453.9 323.1 Impairment -41.8 98.9 -54.4 79.2 70.6 Result from financial asset positions -60.2 -65.2 -295.9 -189.0 0.0 Δ Biological Assets - Fair value variation 58.9 -19.0 -19.7 -0.1 0.0 Adjusted EBITDA 337.2 288.0 277.8 344.0 393.7 FONINVEMEM debt collections 54.2 74.4 66.3 69.4 72.9 Consolidated Statement of Income 2025 2024 2023 2022 2021 Revenues 782.6 671.3 536.9 566.1 510.2 Cost of Sales -501.8 -407.2 -359.4 -298.4 -263.9 Gross Income 280.8 264.2 177.5 267.7 246.3 Administrative and selling expenses -72.5 -70.3 -53.2 -41.8 -37.1 Other operating income 92.0 112.7 372.8 201.7 94.9 Other operating expenses -76.9 -37.3 -22.0 -3.4 -6.3 Impairment of property 41.8 -98.9 54.4 -79.2 -70.6 Operating Income 265.1 170.3 529.5 345.0 227.3 Gain (loss) on net monetary position 3.0 -17.1 -215.4 -171.5 -16.4 Financial income 89.8 107.8 354.4 144.7 18.0 Financial costs -172.4 -154.6 -537.0 -244.2 -153.5 Share of profit (loss) of associates 45.5 15.7 8.6 0.7 -4.5 Gain (loss) on fair value valuation of acquisitions 94.5 2.3 0.0 0.0 0.0 Gain (loss) from bargain purchase 0.0 0.0 89.9 68.7 0.0 Income before Income tax 325.6 124.6 230.0 143.5 70.9 Income tax for the period -71.5 -72.6 -36.7 -37.5 -74.6 Net Income for the period 254.1 52.0 193.3 106.0 -3.7 Total comprehensive Income for the period 254.1 52.0 193.3 106.0 -3.7 Other Integral Results Attributable to: 249.3 41.6 194.0 105.8 -4.5 ◦ Equity holders of the parent 4.7 10.3 -3.8 0.2 0.8 ◦ Non-controlling interest 254.1 52.0 190.1 106.0 -3.7 Basic and diluted earnings per share 0.17 0.03 0.13 0.07 0.00 Earnings presentation 4Q25 & year 2025 E. Revenues Revenues from sales in 4Q25 totalized US$ 172.8 MM, which represented a 26% decrease q/q (US$ 233.9 MM in 3Q25). FY25 revenues from sales totalized US$ 782.6 MM, which represented a 17% increase y/y (FY24 revenues were US$ 671.3 MM). On an annual basis, from total revenues, energy sales represented 91%, and US$ 712.3 MM in 2025, a 20% increase compared to 2024 (FY24 energy sales of US$ 595.4 MM). Spot prices realignment marked the year-over-year variation, and the effect of FO cost passthrough to spot prices, partially offset by lower generation from Piedra del Aguila hydro complex due to low water inflows. Thermal PPA reflects new MAT contracts in November and December 2025, and renewables reflect higher wind resources in 2025 vs 2024, which implied higher generation volumes and new solar capacity from the acquired Cafayate asset (80 MW incorporated in August 2025). Revenues (in US$ MM) 4Q 2025 3Q 2025 4Q 2024 Δ% q/q Δ% y/y Total revenues 172.8 233.9 167.7 -26% 3% Revenues breakdown: Energy sales 156.8 215.3 146.9 -27% 7% % energy sales from total revenues 90.7% 92.1% 87.6% Steam sales 7.8 10.8 8.0 -28% -3% Forestry 2.9 3.6 4.8 -18% -38% Resale of gas T&D capacity 1.6 1.5 1.6 4% -5% CVO management 3.7 2.6 6.4 40% -42% Energy sales by contract type Spot market revenues 79.4 113.6 77.6 -30% 2% Sales under contracts 77.5 101.7 69.3 -23.8% 12% % contracted from total energy sales 49% 47% 47% 2 p.p. 2 p.p. Energy sales by technology Thermal & hydro 119.2 189.0 117.1 -37% 2% Renewable 37.7 26.2 29.8 43.6% 26% % thermal & hydro from total energy sales 76% 88% 80% -12 p.p. -4 p.p. Energy sales by currency % US$-denominated from total energy sales 88% 63% 60% 25 p.p. 28 p.p. Fuel cost pass-through 26.0 27.4 9.6 Revenues (in US$ MM) 2025 2024 2023 2022 2021 Total revenues 782.6 671.3 536.9 566.1 510.2 Revenues breakdown: Energy sales 712.3 595.4 489.9 524.9 482.1 % energy sales from total revenues 91.0% 88.7% 91.3% 92.7% 94.5% Steam sales 36.9 36.2 25.7 27.4 15.4 Forestry 13.7 19.9 9.8 0.0 0.0 Resale of gas T&D capacity 6.4 5.6 3.3 1.5 2.7 CVO management 13.3 14.2 8.1 12.3 10.1 Energy sales by contract type Spot market revenues 319.7 271.0 223.4 300.7 270.9 Sales under contracts 392.6 324.4 266.5 224.2 211.2 % contracted from total energy sales 55% 54% 54% 43% 44% Earnings presentation 4Q25 & year 2025 Energy sales by technology Thermal & hydro 632.1 519.5 422.5 450.2 396.2 Renewable 116.0 112.1 93.2 102.1 101.2 % thermal from total energy sales 89% 87% 86% 86% 82% Energy sales by currency % US$-denominated from total energy sales 68% 59% 59% 62% 52% Operating expenses (in US$ MM) 2025 2024 2023 2022 2021 Total operating expenses (opex) -574.3 -477.5 -412.6 -340.2 -301.0 Depretiation of assets 41.8 -98.9 54.4 -79.2 -70.6 Main opex lines Cost of sales -501.8 -407.2 -359.4 -298.4 -263.9 Administrative and sales expenses -72.5 -70.3 -53.2 -41.8 -37.1 Opex by business unit Thermal & hydro plants -489.9 -400.7 -335.8 -299.7 -262.9 Renewables -53.0 -49.3 -49.3 -40.6 -38.1 Forestry expenses -31.3 -27.6 -27.6 0.0 0.0 Cost of sales (COGS) include demi water, natural gas consumption, fuel for associated services, T+D of natural gas and depreciation. Margin analysis 2025 2024 2023 2022 2021 Central Puerto's Thermal & hydro, CECO Revenues (US$ MM) 632.1 519.5 422.5 450.2 396.2 Operating expenses (US$ MM) -489.9 -400.7 -335.8 -299.7 -262.9 Operating margin (US$ MM) 142.2 118.8 86.7 150.5 133.4 Op. margin / revenues (%) 22% 23% 21% 33% 34% Generation (GWh) 16,672 19,830 19,153 15,874 12,851 Margin / MWh ($/MWh) 8.5 6.0 4.5 9.5 10.4 Revenues / MWh ($/MWh) 37.9 26.2 22.1 28.4 30.8 Renewable Revenues (US$ MM) 116.0 112.1 93.2 102.1 101.2 Operating expenses (US$ MM) -53.0 -49.3 -49.3 -40.6 -38.1 Operating margin (US$ MM) 63.0 62.8 43.9 61.5 63.1 Op. margin / revenues (%) 54% 56% 47% 60% 62% Generación (GWh) 1,926 1,775 1,620 1,610 1,568 Margin / MWh ($/MWh) 32.7 35.4 27.1 38.2 40.2 Revenues / MWh ($/MWh) 60.2 63.2 57.5 63.4 64.6 Earnings presentation 4Q25 & year 2025 F. Financial position Financial debt, as of December 31st, 2025 Total end-of-year outstanding gross debt balance was US$ 337.8 MM while cash, cash equivalents and other financial current assets balance was US$ 231.5 MM, composed of US$ 25.8 MM in cash and cash equivalents, and US$ 205.7 MM in current financial assets. The chart below shows the principal maturity profile to such date, expressed in US$ MM: Shares buyback program On September 25, 2025, the Board of Directors initiated a 180-day share buyback program, authorizing the repurchase of up to US$ 20.0 million in shares. The program adhered to Article 64 of Capital Markets Law No. 26,831 and relevant CNV regulations. To date of completion, the company repurchased a total of 2,756,000 shares on the BYMA (Argentina) market, utilizing US$ 2.54 million of the authorized amount. Earnings presentation 4Q25 & year 2025 Annex I: Consolidated Balance Sheet Consolidated Statement of Financial Position 31/12/2024 31/12/2025 Figures in US$ MM (audited figures in AR$, converted to US$) Assets Property, plant, and equipment 1,567 1,607 Intangible assets 30 28 Biological Assets 181 131 Investment in associates 106 20 Inventories 4 9 Other non-financial assets 1 8 Trade and other receivables 132 88 Other financial assets 14 126 Deferred tax asset 6 3 Investment in subsidiaries Goodwill Total non-current assets 2,041 2,020 Current assets Biological Assets 34 9 Inventories 21 19 Other non-financial assets 34 15 Trade and other receivables 211 220 Other financial assets 233 205.7 Cash and cash equivalents 4 25.8 Total current assets 537 495 Total Assets 2,578 2,515 Equity and liabilities Equity Capital stock 1 1 Adjustment to capital stock 523 383 Owned shares in portfolio - 0 Cost of owned shares in portfolio - (3) Legal reserve 103 98 Voluntary reserve 730 680 Other equity accounts (40) (33) Optional reserve for future dividend distribution 377 394 Retained earnings 49 228 Equity attributable to shareholders of the parent 1,74 3 1,748 Non-controlling interests 61 44 Total Equity 1,804 1,793 Accounts Payable Trade and Other Accounts Payable Other non-financial liabilities 24 15 Other loans and borrowings 223 239.1 Compensation and employee benefits liabilities 7 7 Provisions 2 7 Deferred income tax liabilities 154 6 Total non-current liabilities 411 273 Current liabilities Trade and other payables 93 - Other non-financial liabilities 30 85 Other loans and borrowings 146 98.7 Compensation and employee benefits liabilities 33 30 Income tax payable 59 25 Provisions 3 3 Total current liabilities 363 241 Total liabilities 774 514 Total equity and liabilities 2,578 2,307 Argentine Peso amounts were converted to U.S. dollars using the reference exchange rate published by the Central Bank of Argentina (Communication 'A' 3500) as of September 30, 2025 (AR$1,366.6/US$1.00) and December 30th, 2024 (AR$ 1032.5/US$1.00) respectively. Earnings presentation 4Q25 & year 2025 Annex II: Cash flow statement FY2025 FY2024 Cash Flow (in US$ MM) – Summary 12-month period 12-month period as of Dec. 31, 2025 as of Dec. 31, 2024 Cash, cash equivalents and current financial assets at the beginning 48.9 28.0 Net cash flows provided by operating activities 281.4 285.6 Net cash flows used in investing activities -189.4 -159.7 Acquisitions of property, plant and equipment and inventory -202.4 -138.0 Acquisition of subsidiaries and associates, net of cash acquired -0.1 0.0 Sale of property, plant and equipment 0.0 1.1 Acquisition (Sale) of financial assets -5.3 -30.7 Dividends collected 18.4 7.9 Net cash flows used in financing activities -43.0 -106.4 Financial credit received 125.9 62.6 Repayment of financial debt -166.8 -109.4 Interest and finance expense payments -0.7 -43.4 Other finance expenses -1.4 0.0 Contributions and dividends 0.0 -16.1 Exchange difference and other financial (1) 72.2 43.8 Cash and Cash equivalents at the end of the period 25.8 3.7 (1) Net decrease in cash and short-term investments Exchange difference and other financial results Monetary results from cash and short-term placements Earnings presentation 4Q25 & year 2025 Annex III: Central Puerto’s operating assets Plant Technology Installed capacity Location Commercial date since PPA term (MW) (Province) Date Year Central Puerto Complex Thermal 1,747 City of Buenos Aires 1992-2000 - Piedra del Águila Hydro 1,440 Río Negro 1994 - Brigadier Lopez Thermal 421 Santa Fé 2019-2026 - Luján de Cuyo(2) Thermal 576 Mendoza 2019 2034 San Lorenzo(3) Thermal 391 Santa Fé 2021 2035 Central Costanera Thermal 1,789 City of Buenos Aires 2023 - La Castellana I Wind 100.8 Buenos Aires 2019 2040 Genoveva I Wind 88.2 Buenos Aires 2020 2040 Genoveva II Wind 41.8 Buenos Aires 2020 2029 La Castellana II Wind 15.2 Buenos Aires 2020 2034 Manque Wind 57 Córdoba 2020 2040 Achiras I Wind 48 Córdoba 2020 2040 Los Olivos Wind 22.8 Córdoba 2020 2030 Guañizuil II(4) Solar 105 San Juan 2023 2041 Cafayate Solar 80 Salta 2025 2039 San Carlos Solar 15.0 Salta 2025 2035 Total 6,938 (1) Source CAMMESA. Capacity does not include non-operating FONINVEMEM plants WI. (2) The facility Includes 290 MW of combined cycles sold to spot market, 95 MW of cogeneration, 190 MW of gas/steam turbines and 1 MW of mini hydro. (3) San Lorenzo plant is composed by 330 MW May-Aug / 317 MW Sept-Apr PPA contracted capacity, and remaining capacity assigned to spot market under Res. 59/23. (4) Guañizuil II solar farm was developed by Equinor (Cordillera Solar project) and transferred to Central Puerto in October 2023. Earnings presentation 4Q25 & year 2025 Glossary of terms and abbreviations 4Q25 Fourth quarter of 2025 (October, November, December 2025). In the same way, 3Q25/4Q24 refers to 3rd quarter 2025/4th quarter 2024. FY25 Full year 2025 (12 months of the year). AR$ Argentine pesos. BCRA Banco Central de la República Argentina, Argentina’s Central Bank CAMMESA Compañía Administradora del Mercado Mayorista Eléctrico Sociedad Anónima – the administrator of Argentina’s wholesale electricity market CC Combined cycle COD Commercial Operation Date – the date a generation unit is authorized by CAMMESA to sell electricity under commercial conditions Energía Base Legacy energy framework under Resolution SE No. 95/13, currently regulated by Resolution SE No. 9/24 FONINVEMEM / FONI Former National Fund for Investments to Increase Electric Power Supply, including programs like the Central Vuelta de Obligado (CVO) Agreement. GWh / GW Gigawatt-hour / Gigawatt MW/MWh Megawatt-hour / Megawatt ON Corporate Bonds (Obligaciones Negociables) p.p. Percentage point Plan Gas Plan de Promoción de la Producción del Gas Natural DNU N° 892/20 and 730/22, Arg. PPA Power Purchase Agreement q/q Quarter over quarter comparison SE Argentina’s Secretariat of Energy Tn Metric ton WEM / MEM Wholesale Electricity Market (Mercado Eléctrico Mayorista) y/y Year on year comparison Earnings presentation 4Q25 & year 2025 Disclaimer Financial statements as of December 31st, 2025, include the effects of the inflation adjustment, applying IAS 29. Accordingly, the financial statements have been stated in terms of the measuring unit current at the end of the reporting period, including the corresponding financial figures for previous periods reported for comparative purposes. Comparative analysis refers to the previous period of the same year, and same period of the previous year. We present figures converted from Argentine Pesos to U.S. dollars for comparison purposes only. The exchange rate used to convert Argentine Pesos to U.S. dollars was the reference exchange rate (Communication “A” 3500) reported by the Central Bank for U.S. dollars for the end of each period. The information presented in U.S. dollars is for the convenience of the reader only and may defer if such conversion for each period is performed at the exchange rate applicable at the end of the latest period. You should not consider these translations to be representations that the Argentine Peso amounts actually represent these U.S. dollars amounts or could be converted into U.S. dollars at the rate indicated. Definitions and terms used herein are provided in the Glossary at the end of this document. This release does not contain all the Company’s financial information. As a result, investors should read this release in conjunction with Central Puerto’s Audited Consolidated Financial Statements for the fiscal period ended on December 31st, 2025, and the notes thereto, which will be available on the Company’s website. Rounding amounts and percentages: Certain amounts and percentages included in this release have been rounded for ease of presentation. Percentage figures included in this release have not in all cases been calculated on the basis of such rounded figures, but on the basis of such amounts prior to rounding. For this reason, certain percentage amounts in this release may vary from those obtained by performing the same calculations using the figures in the financial statements. In addition, certain other amounts that appear in this release may not sum due to rounding. This release contains certain metrics, including information per share, operating information, and others, which do not have standardized meanings or standard methods of calculation and therefore such measures may not be comparable to similar measures used by other companies. Such metrics have been included herein to provide readers with additional measures to evaluate the Company’s performance; however, such measures are not reliable indicators of the future performance of the Company and future performance may not compare to the performance in previous periods. OTHER INFORMATION Central Puerto routinely posts relevant information for investors in the “Investors” support section on its website, www.centralpuerto.com. From time to time, Central Puerto may use its website as a channel of distribution of material Company information. Accordingly, investors should monitor Central Puerto’s website, in addition to following the Company’s press releases, SEC and CNV filings, public conference calls and webcasts. The information contained on, or that may be accessed through, the Company’s website is not incorporated by reference into, and is not a part of, this release. CAUTIONARY STATEMENTS RELEVANT TO FORWARD-LOOKING INFORMATION This release contains certain forward-looking information and forward-looking statements as defined in applicable securities laws (collectively referred to in this Earnings Release as “forward-looking statements”) that constitute forward-looking statements. All statements other than statements of historical fact are forward-looking statements. The words ‘‘anticipate’’, ‘‘believe’’, ‘‘could’’, ‘‘expect’’, ‘‘should’’, ‘‘plan’’, ‘‘intend’’, ‘‘will’’, ‘‘estimate’’ and ‘‘potential’’, and similar expressions, as they relate to the Company, are intended to identify forward-looking statements. Statements regarding possible or assumed future results of operations, business strategies, financing plans, competitive position, industry environment, potential growth opportunities, the effects of future regulation and the effects of competition, expected power generation and capital expenditures plan, are examples of forward-looking statements. Forward-looking statements are necessarily based upon a number of factors and assumptions that, while considered reasonable by management, are inherently subject to significant business, economic Earnings presentation 4Q25 & year 2025 and competitive uncertainties, and contingencies, which may cause the actual results, performance, or achievements of the Company to be materially different from any future results, performance or achievements expressed or implied by the forward - looking statements . The Company assumes no obligation to update forward-looking statements except as required under securities laws. Further information concerning risks and uncertainties associated with these forward-looking statements and the Company’s business can be found in the Company’s public disclosures filed on EDGAR ( www.sec.gov) and CNV. EBITDA and Adjusted EBITDA In this release, EBITDA, a non-IFRS financial measure, is defined as net income for the period, plus finance expenses, minus finance income, minus share of the profit (loss) of associates, plus (minus) losses (gains) on net monetary position, plus income tax expense, plus depreciation and amortization, minus net results of discontinued operations. Adjusted EBITDA refers to EBITDA excluding impairment on property, plant & equipment, foreign exchange differences and interests related to FONI trade receivables and variations in fair value of biological asset. Adjusted EBITDA is believed to provide useful supplemental information to investors about the Company and its results. Adjusted EBITDA is among the measures used by the Company’s management team to evaluate the financial and operating performance and make day-to-day financial and operating decisions. In addition, Adjusted EBITDA is frequently used by securities analysts, investors, and other parties to evaluate companies in the industry. Adjusted EBITDA is believed to be helpful to investors because it provides additional information about trends in the core operating performance prior to considering the impact of capital structure, depreciation, amortization, and taxation on the results. Adjusted EBITDA should not be considered in isolation or as a substitute for other measures of financial performance reported in accordance with IFRS. Adjusted EBITDA has limitations as an analytical tool, including: • Adjusted EBITDA does not reflect changes in, including cash requirements for, working capital needs or contractual commitments. • Adjusted EBITDA does not reflect the finance expenses, or the cash requirements to service interest or principal payments on indebtedness, or interest income or other finance income. • Adjusted EBITDA does not reflect income tax expense or the cash requirements to pay income taxes. • Although depreciation and amortization are non-cash charges, the assets being depreciated or amortized often will need to be replaced in the future, and Adjusted EBITDA does not reflect any cash requirements for these replacements. • Although a certain share of the profit of associates is a non-cash charge, Adjusted EBITDA does not consider the potential collection of dividends; and • Other companies may calculate Adjusted EBITDA differently, limiting its usefulness as a comparative measure. The Company compensates for the inherent limitations associated with using Adjusted EBITDA through disclosure of these limitations, presentation of the Company’s consolidated financial statements in accordance with IFRS and reconciliation of Adjusted EBITDA to the most directly comparable IFRS measure, net income. For a reconciliation of the net income to Adjusted EBITDA, see the tables included in this release. All the information presented must be considered as consolidated unless otherwise specified. • Contact: inversores@centralpuerto.com – www.centralpuerto.com - +54 11 4317 5000 Earnings presentation 4Q25 & year 2025 Contact us Linkedin Access Central Puerto Phone Number (5411) 4317 5000 Location Av. Tomas Alva Edison 2701 Dock E Puerto de Buenos Aires Web / E-Mail www.centralpuerto.com info@centralpuerto.com 4Q & FY25 Earnings Presentation March 2026
SIGNATURES
Pursuant to the requirements of the Securities Exchange Act of 1934, the registrant has duly caused this report to be signed on its behalf by the undersigned, thereunto duly authorized.
| Central Puerto S.A. | ||||||
| Date: March 5, 2026 | By: |
/s/ Leonardo Marinaro | ||||
| Name: | Leonardo Marinaro | |||||
| Title: | Attorney-in-Fact | |||||