Financial Results and Supplemental Information October 28, 2025 THIRD QUARTER 2025 .2 2020 Joe B. Jackson Parkway Murfreesboro, TN 1,016,281 Square Feet ILPT Ownership: 100%
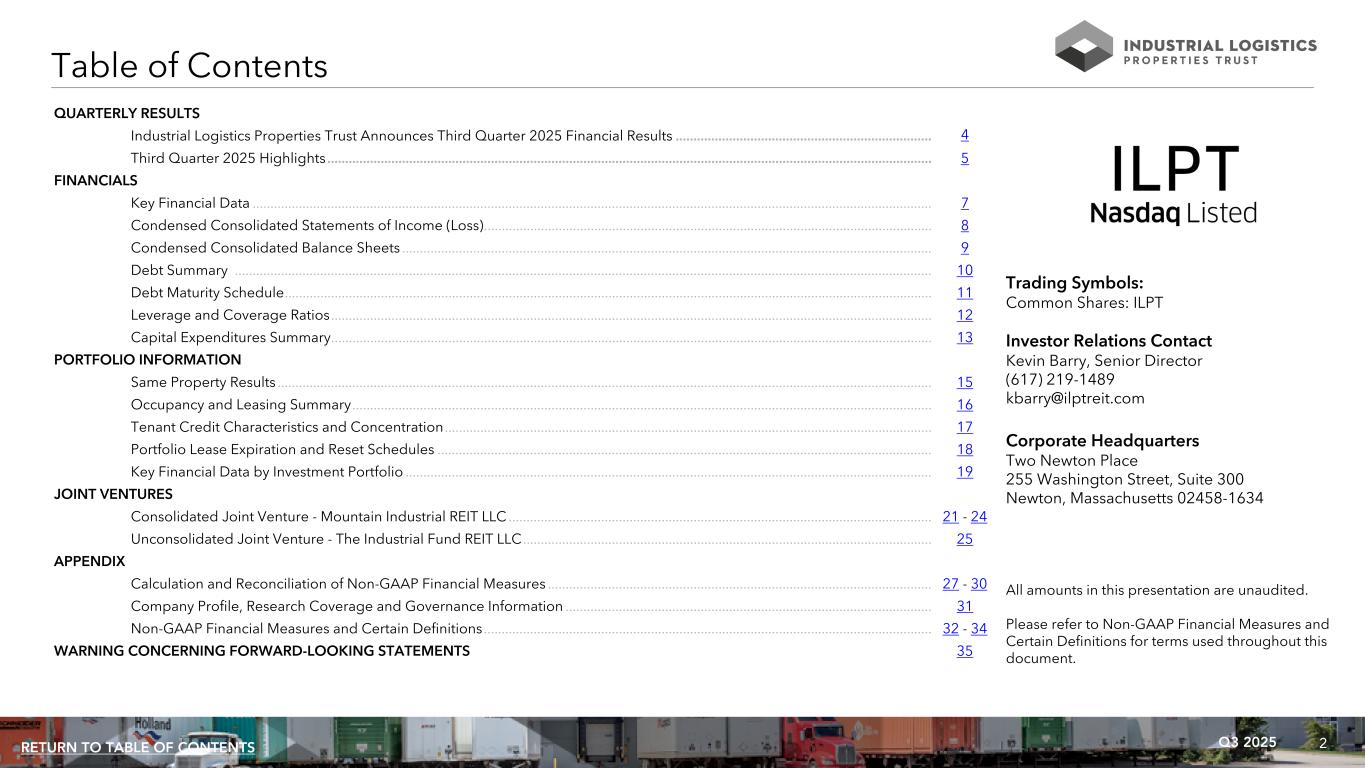
2Q3 2025RETURN TO TABLE OF CONTENTS QUARTERLY RESULTS Industrial Logistics Properties Trust Announces Third Quarter 2025 Financial Results ........................................................................ 4 Third Quarter 2025 Highlights .......................................................................................................................................................................... 5 FINANCIALS Key Financial Data ............................................................................................................................................................................................... 7 Condensed Consolidated Statements of Income (Loss) .............................................................................................................................. 8 Condensed Consolidated Balance Sheets ..................................................................................................................................................... 9 Debt Summary .................................................................................................................................................................................................... 10 Debt Maturity Schedule ...................................................................................................................................................................................... 11 Leverage and Coverage Ratios ......................................................................................................................................................................... 12 Capital Expenditures Summary ......................................................................................................................................................................... 13 PORTFOLIO INFORMATION Same Property Results ........................................................................................................................................................................................ 15 Occupancy and Leasing Summary ................................................................................................................................................................... 16 Tenant Credit Characteristics and Concentration ......................................................................................................................................... 17 Portfolio Lease Expiration and Reset Schedules ........................................................................................................................................... 18 Key Financial Data by Investment Portfolio .................................................................................................................................................... 19 JOINT VENTURES Consolidated Joint Venture - Mountain Industrial REIT LLC ....................................................................................................................... 21 - 24 Unconsolidated Joint Venture - The Industrial Fund REIT LLC ................................................................................................................... 25 APPENDIX Calculation and Reconciliation of Non-GAAP Financial Measures ............................................................................................................ 27 - 30 Company Profile, Research Coverage and Governance Information ....................................................................................................... 31 Non-GAAP Financial Measures and Certain Definitions .............................................................................................................................. 32 - 34 WARNING CONCERNING FORWARD-LOOKING STATEMENTS 35 Table of Contents All amounts in this presentation are unaudited. Please refer to Non-GAAP Financial Measures and Certain Definitions for terms used throughout this document. Trading Symbols: Common Shares: ILPT Investor Relations Contact Kevin Barry, Senior Director (617) 219-1489 kbarry@ilptreit.com Corporate Headquarters Two Newton Place 255 Washington Street, Suite 300 Newton, Massachusetts 02458-1634
3Q3 2025RETURN TO TABLE OF CONTENTS Quarterly Results
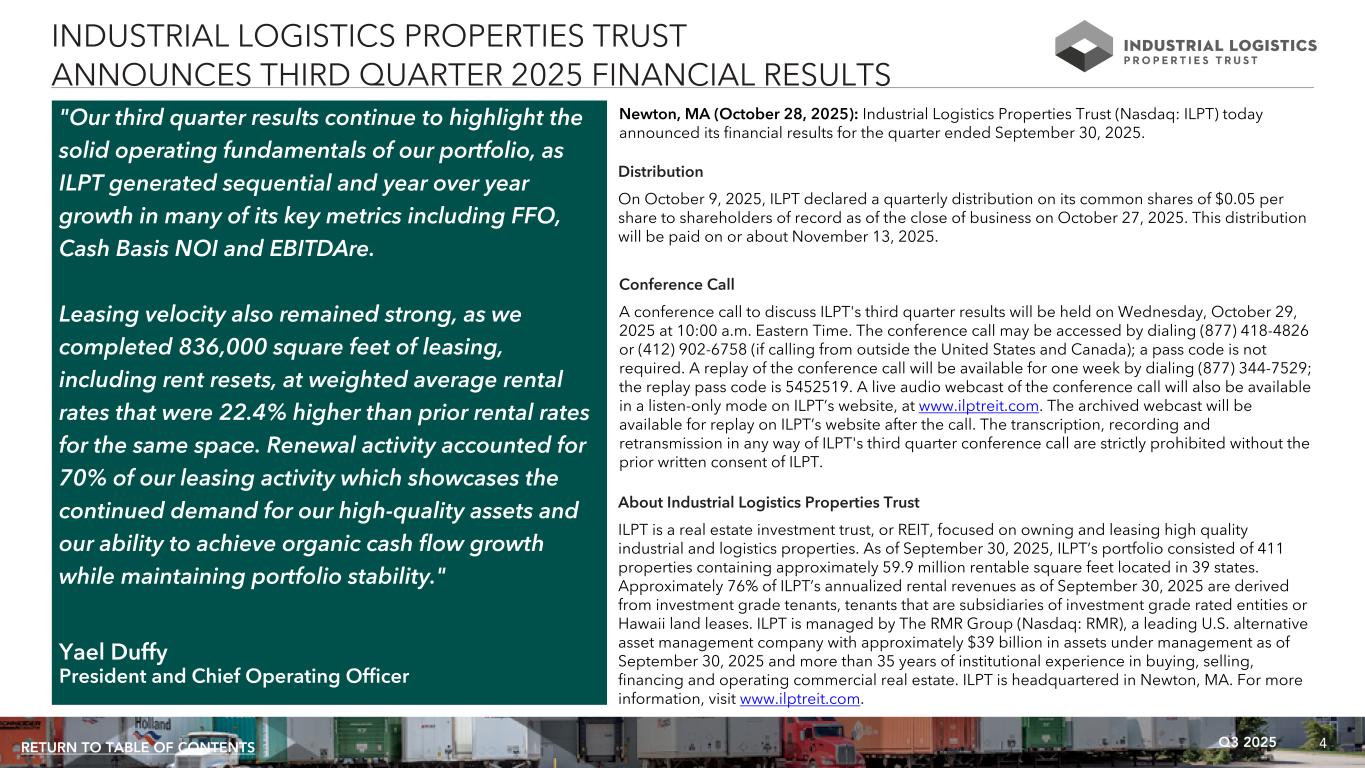
4Q3 2025RETURN TO TABLE OF CONTENTS "Our third quarter results continue to highlight the solid operating fundamentals of our portfolio, as ILPT generated sequential and year over year growth in many of its key metrics including FFO, Cash Basis NOI and EBITDAre. Leasing velocity also remained strong, as we completed 836,000 square feet of leasing, including rent resets, at weighted average rental rates that were 22.4% higher than prior rental rates for the same space. Renewal activity accounted for 70% of our leasing activity which showcases the continued demand for our high-quality assets and our ability to achieve organic cash flow growth while maintaining portfolio stability." Yael Duffy President and Chief Operating Officer INDUSTRIAL LOGISTICS PROPERTIES TRUST ANNOUNCES THIRD QUARTER 2025 FINANCIAL RESULTS Newton, MA (October 28, 2025): Industrial Logistics Properties Trust (Nasdaq: ILPT) today announced its financial results for the quarter ended September 30, 2025. Distribution On October 9, 2025, ILPT declared a quarterly distribution on its common shares of $0.05 per share to shareholders of record as of the close of business on October 27, 2025. This distribution will be paid on or about November 13, 2025. Conference Call A conference call to discuss ILPT's third quarter results will be held on Wednesday, October 29, 2025 at 10:00 a.m. Eastern Time. The conference call may be accessed by dialing (877) 418-4826 or (412) 902-6758 (if calling from outside the United States and Canada); a pass code is not required. A replay of the conference call will be available for one week by dialing (877) 344-7529; the replay pass code is 5452519. A live audio webcast of the conference call will also be available in a listen-only mode on ILPT’s website, at www.ilptreit.com. The archived webcast will be available for replay on ILPT’s website after the call. The transcription, recording and retransmission in any way of ILPT's third quarter conference call are strictly prohibited without the prior written consent of ILPT. About Industrial Logistics Properties Trust ILPT is a real estate investment trust, or REIT, focused on owning and leasing high quality industrial and logistics properties. As of September 30, 2025, ILPT’s portfolio consisted of 411 properties containing approximately 59.9 million rentable square feet located in 39 states. Approximately 76% of ILPT’s annualized rental revenues as of September 30, 2025 are derived from investment grade tenants, tenants that are subsidiaries of investment grade rated entities or Hawaii land leases. ILPT is managed by The RMR Group (Nasdaq: RMR), a leading U.S. alternative asset management company with approximately $39 billion in assets under management as of September 30, 2025 and more than 35 years of institutional experience in buying, selling, financing and operating commercial real estate. ILPT is headquartered in Newton, MA. For more information, visit www.ilptreit.com.
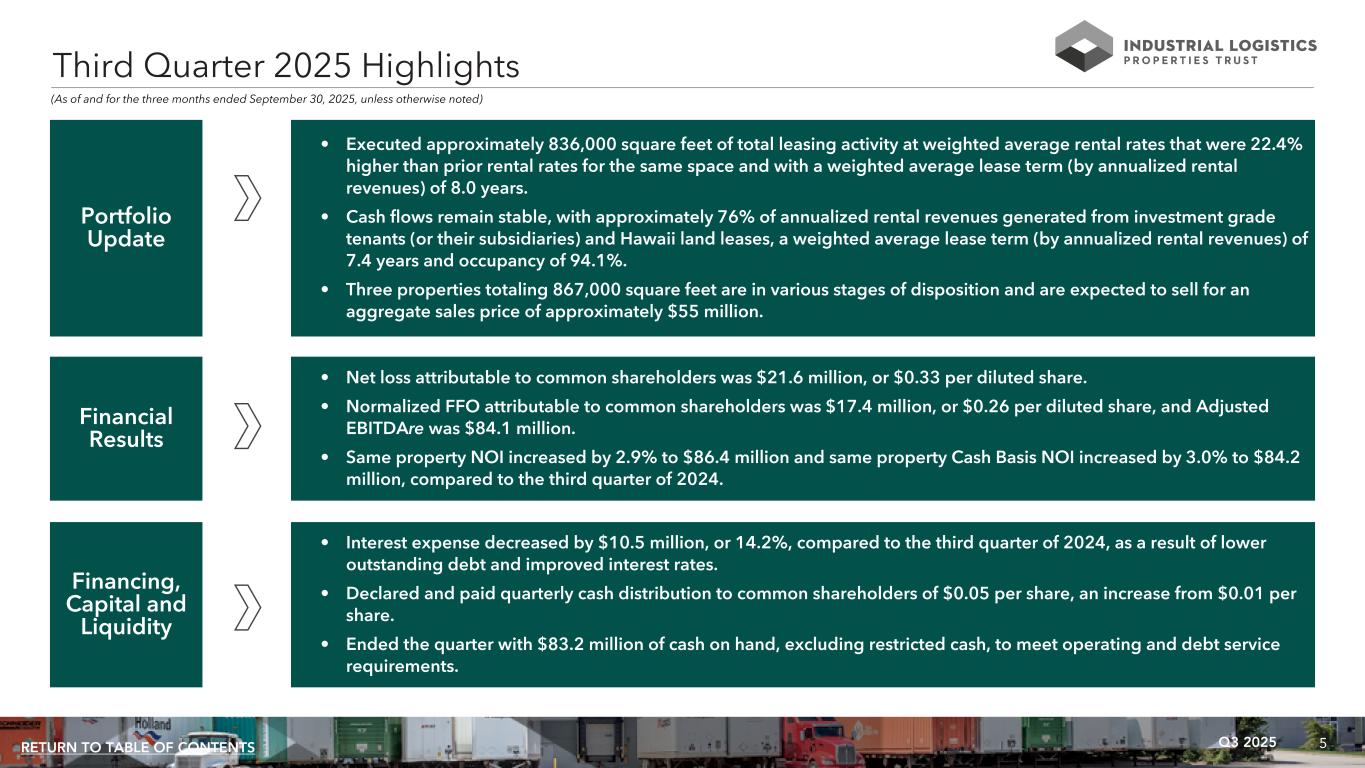
5Q3 2025RETURN TO TABLE OF CONTENTS Portfolio Update • Executed approximately 836,000 square feet of total leasing activity at weighted average rental rates that were 22.4% higher than prior rental rates for the same space and with a weighted average lease term (by annualized rental revenues) of 8.0 years. • Cash flows remain stable, with approximately 76% of annualized rental revenues generated from investment grade tenants (or their subsidiaries) and Hawaii land leases, a weighted average lease term (by annualized rental revenues) of 7.4 years and occupancy of 94.1%. • Three properties totaling 867,000 square feet are in various stages of disposition and are expected to sell for an aggregate sales price of approximately $55 million. Financial Results • Net loss attributable to common shareholders was $21.6 million, or $0.33 per diluted share. • Normalized FFO attributable to common shareholders was $17.4 million, or $0.26 per diluted share, and Adjusted EBITDAre was $84.1 million. • Same property NOI increased by 2.9% to $86.4 million and same property Cash Basis NOI increased by 3.0% to $84.2 million, compared to the third quarter of 2024. Financing, Capital and Liquidity • Interest expense decreased by $10.5 million, or 14.2%, compared to the third quarter of 2024, as a result of lower outstanding debt and improved interest rates. • Declared and paid quarterly cash distribution to common shareholders of $0.05 per share, an increase from $0.01 per share. • Ended the quarter with $83.2 million of cash on hand, excluding restricted cash, to meet operating and debt service requirements. Third Quarter 2025 Highlights (As of and for the three months ended September 30, 2025, unless otherwise noted)

6Q3 2025RETURN TO TABLE OF CONTENTS Financials
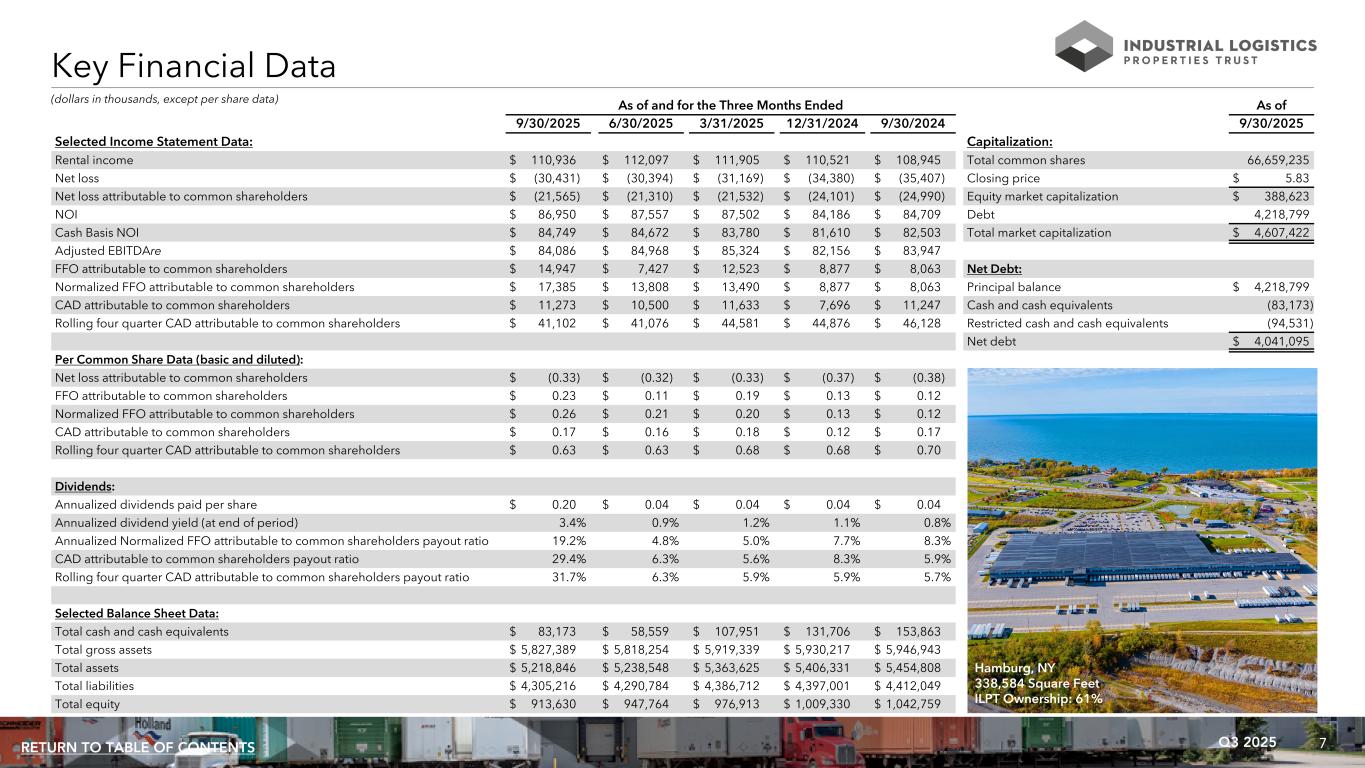
7Q3 2025RETURN TO TABLE OF CONTENTS As of and for the Three Months Ended As of 9/30/2025 6/30/2025 3/31/2025 12/31/2024 9/30/2024 9/30/2025 Selected Income Statement Data: Capitalization: Rental income $ 110,936 $ 112,097 $ 111,905 $ 110,521 $ 108,945 Total common shares 66,659,235 Net loss $ (30,431) $ (30,394) $ (31,169) $ (34,380) $ (35,407) Closing price $ 5.83 Net loss attributable to common shareholders $ (21,565) $ (21,310) $ (21,532) $ (24,101) $ (24,990) Equity market capitalization $ 388,623 NOI $ 86,950 $ 87,557 $ 87,502 $ 84,186 $ 84,709 Debt 4,218,799 Cash Basis NOI $ 84,749 $ 84,672 $ 83,780 $ 81,610 $ 82,503 Total market capitalization $ 4,607,422 Adjusted EBITDAre $ 84,086 $ 84,968 $ 85,324 $ 82,156 $ 83,947 FFO attributable to common shareholders $ 14,947 $ 7,427 $ 12,523 $ 8,877 $ 8,063 Net Debt: Normalized FFO attributable to common shareholders $ 17,385 $ 13,808 $ 13,490 $ 8,877 $ 8,063 Principal balance $ 4,218,799 CAD attributable to common shareholders $ 11,273 $ 10,500 $ 11,633 $ 7,696 $ 11,247 Cash and cash equivalents (83,173) Rolling four quarter CAD attributable to common shareholders $ 41,102 $ 41,076 $ 44,581 $ 44,876 $ 46,128 Restricted cash and cash equivalents (94,531) Net debt $ 4,041,095 Per Common Share Data (basic and diluted): Net loss attributable to common shareholders $ (0.33) $ (0.32) $ (0.33) $ (0.37) $ (0.38) FFO attributable to common shareholders $ 0.23 $ 0.11 $ 0.19 $ 0.13 $ 0.12 Normalized FFO attributable to common shareholders $ 0.26 $ 0.21 $ 0.20 $ 0.13 $ 0.12 CAD attributable to common shareholders $ 0.17 $ 0.16 $ 0.18 $ 0.12 $ 0.17 Rolling four quarter CAD attributable to common shareholders $ 0.63 $ 0.63 $ 0.68 $ 0.68 $ 0.70 Dividends: Annualized dividends paid per share $ 0.20 $ 0.04 $ 0.04 $ 0.04 $ 0.04 Annualized dividend yield (at end of period) 3.4% 0.9% 1.2% 1.1% 0.8% Annualized Normalized FFO attributable to common shareholders payout ratio 19.2% 4.8% 5.0% 7.7% 8.3% CAD attributable to common shareholders payout ratio 29.4% 6.3% 5.6% 8.3% 5.9% Rolling four quarter CAD attributable to common shareholders payout ratio 31.7% 6.3% 5.9% 5.9% 5.7% Selected Balance Sheet Data: Total cash and cash equivalents $ 83,173 $ 58,559 $ 107,951 $ 131,706 $ 153,863 Total gross assets $ 5,827,389 $ 5,818,254 $ 5,919,339 $ 5,930,217 $ 5,946,943 Total assets $ 5,218,846 $ 5,238,548 $ 5,363,625 $ 5,406,331 $ 5,454,808 Total liabilities $ 4,305,216 $ 4,290,784 $ 4,386,712 $ 4,397,001 $ 4,412,049 Total equity $ 913,630 $ 947,764 $ 976,913 $ 1,009,330 $ 1,042,759 (dollars in thousands, except per share data) Key Financial Data Hamburg, NY 338,584 Square Feet ILPT Ownership: 61%
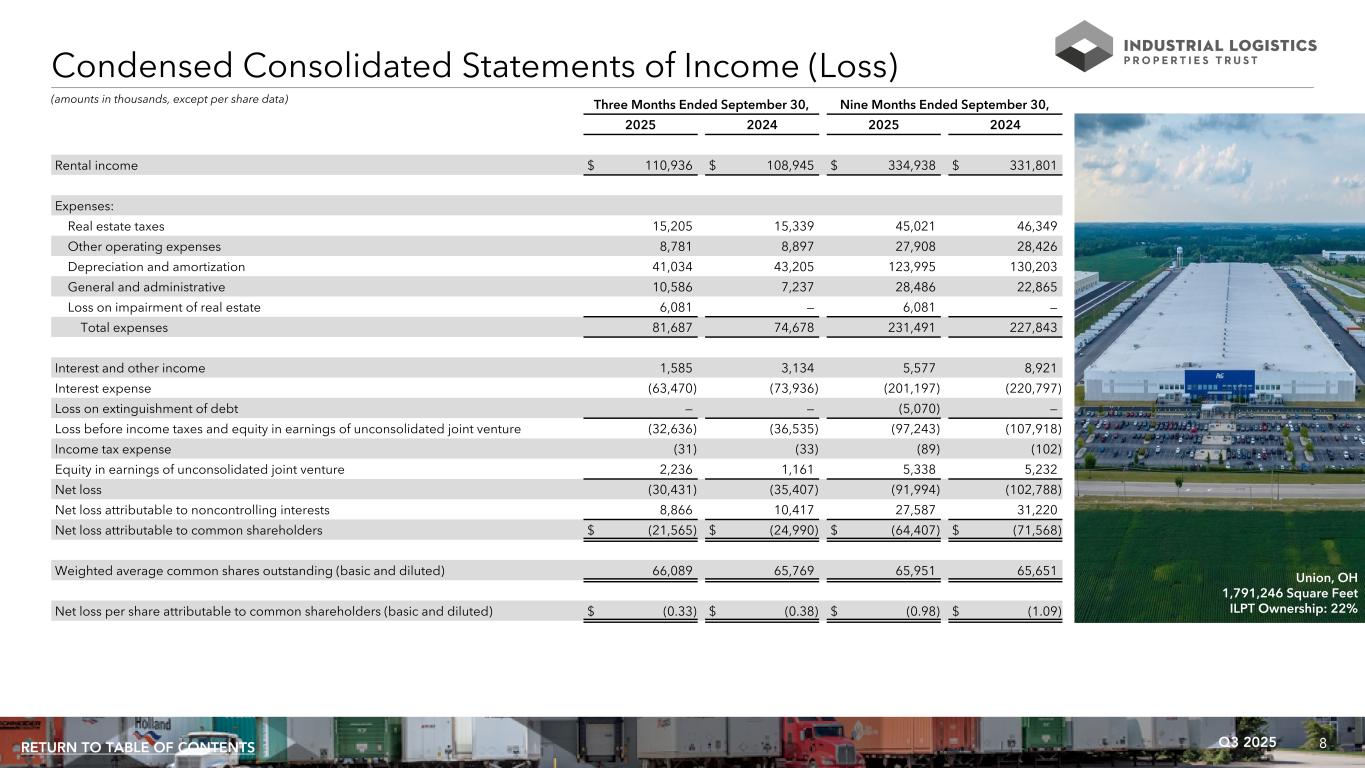
8Q3 2025RETURN TO TABLE OF CONTENTS Condensed Consolidated Statements of Income (Loss) Three Months Ended September 30, Nine Months Ended September 30, 2025 2024 2025 2024 Rental income $ 110,936 $ 108,945 $ 334,938 $ 331,801 Expenses: Real estate taxes 15,205 15,339 45,021 46,349 Other operating expenses 8,781 8,897 27,908 28,426 Depreciation and amortization 41,034 43,205 123,995 130,203 General and administrative 10,586 7,237 28,486 22,865 Loss on impairment of real estate 6,081 — 6,081 — Total expenses 81,687 74,678 231,491 227,843 Interest and other income 1,585 3,134 5,577 8,921 Interest expense (63,470) (73,936) (201,197) (220,797) Loss on extinguishment of debt — — (5,070) — Loss before income taxes and equity in earnings of unconsolidated joint venture (32,636) (36,535) (97,243) (107,918) Income tax expense (31) (33) (89) (102) Equity in earnings of unconsolidated joint venture 2,236 1,161 5,338 5,232 Net loss (30,431) (35,407) (91,994) (102,788) Net loss attributable to noncontrolling interests 8,866 10,417 27,587 31,220 Net loss attributable to common shareholders $ (21,565) $ (24,990) $ (64,407) $ (71,568) Weighted average common shares outstanding (basic and diluted) 66,089 65,769 65,951 65,651 Net loss per share attributable to common shareholders (basic and diluted) $ (0.33) $ (0.38) $ (0.98) $ (1.09) (amounts in thousands, except per share data) Union, OH 1,791,246 Square Feet ILPT Ownership: 22%
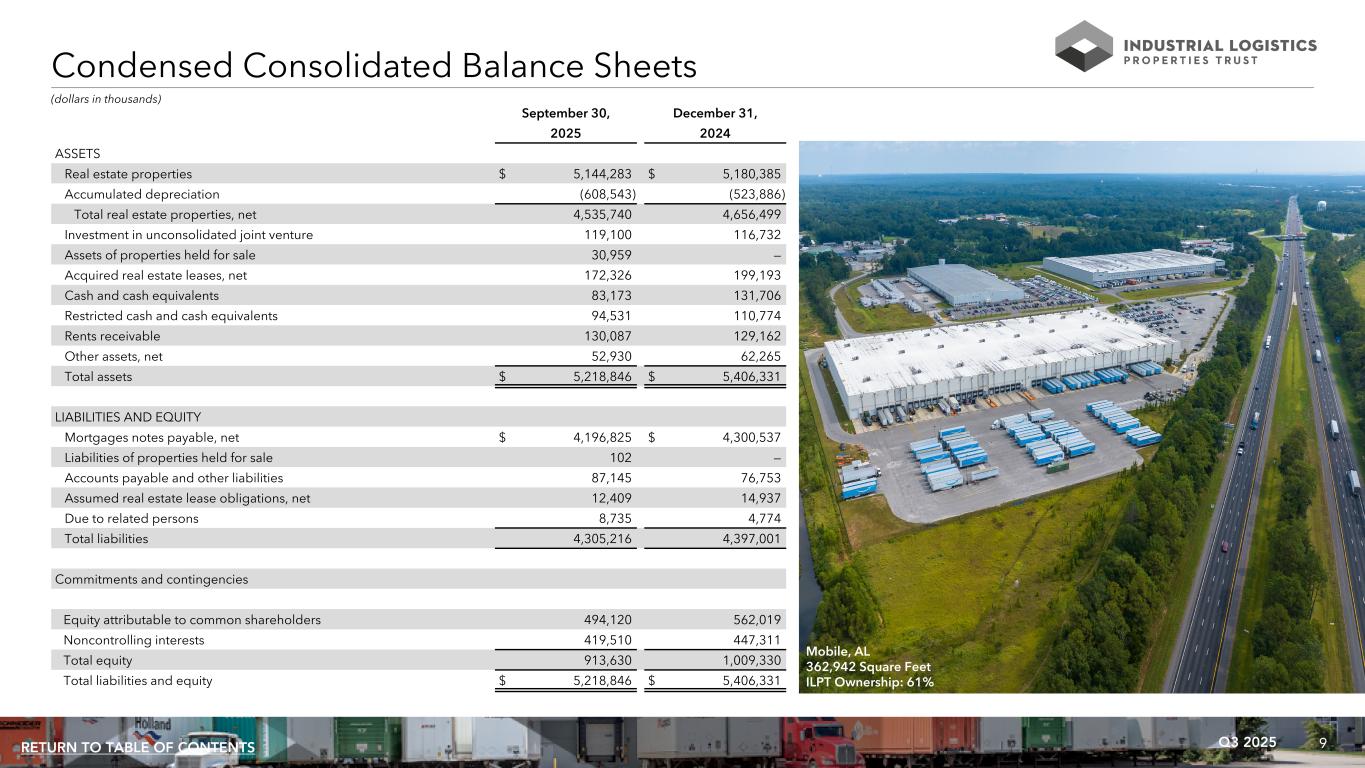
9Q3 2025RETURN TO TABLE OF CONTENTS Condensed Consolidated Balance Sheets September 30, December 31, 2025 2024 ASSETS Real estate properties $ 5,144,283 $ 5,180,385 Accumulated depreciation (608,543) (523,886) Total real estate properties, net 4,535,740 4,656,499 Investment in unconsolidated joint venture 119,100 116,732 Assets of properties held for sale 30,959 — Acquired real estate leases, net 172,326 199,193 Cash and cash equivalents 83,173 131,706 Restricted cash and cash equivalents 94,531 110,774 Rents receivable 130,087 129,162 Other assets, net 52,930 62,265 Total assets $ 5,218,846 $ 5,406,331 LIABILITIES AND EQUITY Mortgages notes payable, net $ 4,196,825 $ 4,300,537 Liabilities of properties held for sale 102 — Accounts payable and other liabilities 87,145 76,753 Assumed real estate lease obligations, net 12,409 14,937 Due to related persons 8,735 4,774 Total liabilities 4,305,216 4,397,001 Commitments and contingencies Equity attributable to common shareholders 494,120 562,019 Noncontrolling interests 419,510 447,311 Total equity 913,630 1,009,330 Total liabilities and equity $ 5,218,846 $ 5,406,331 (dollars in thousands) Mobile, AL 362,942 Square Feet ILPT Ownership: 61%
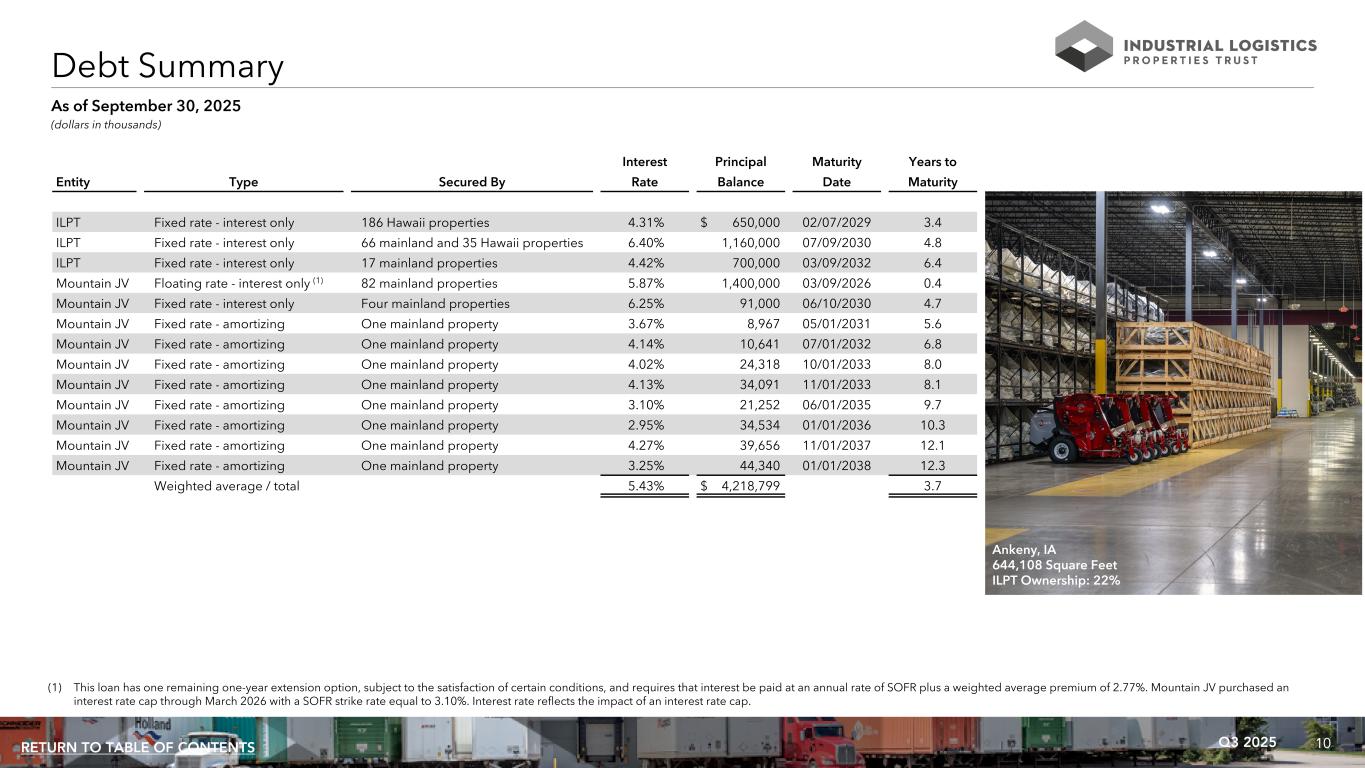
10Q3 2025RETURN TO TABLE OF CONTENTS (1) This loan has one remaining one-year extension option, subject to the satisfaction of certain conditions, and requires that interest be paid at an annual rate of SOFR plus a weighted average premium of 2.77%. Mountain JV purchased an interest rate cap through March 2026 with a SOFR strike rate equal to 3.10%. Interest rate reflects the impact of an interest rate cap. Interest Principal Maturity Years to Entity Type Secured By Rate Balance Date Maturity ILPT Fixed rate - interest only 186 Hawaii properties 4.31% $ 650,000 02/07/2029 3.4 ILPT Fixed rate - interest only 66 mainland and 35 Hawaii properties 6.40% 1,160,000 07/09/2030 4.8 ILPT Fixed rate - interest only 17 mainland properties 4.42% 700,000 03/09/2032 6.4 Mountain JV Floating rate - interest only (1) 82 mainland properties 5.87% 1,400,000 03/09/2026 0.4 Mountain JV Fixed rate - interest only Four mainland properties 6.25% 91,000 06/10/2030 4.7 Mountain JV Fixed rate - amortizing One mainland property 3.67% 8,967 05/01/2031 5.6 Mountain JV Fixed rate - amortizing One mainland property 4.14% 10,641 07/01/2032 6.8 Mountain JV Fixed rate - amortizing One mainland property 4.02% 24,318 10/01/2033 8.0 Mountain JV Fixed rate - amortizing One mainland property 4.13% 34,091 11/01/2033 8.1 Mountain JV Fixed rate - amortizing One mainland property 3.10% 21,252 06/01/2035 9.7 Mountain JV Fixed rate - amortizing One mainland property 2.95% 34,534 01/01/2036 10.3 Mountain JV Fixed rate - amortizing One mainland property 4.27% 39,656 11/01/2037 12.1 Mountain JV Fixed rate - amortizing One mainland property 3.25% 44,340 01/01/2038 12.3 Weighted average / total 5.43% $ 4,218,799 3.7 Debt Summary (dollars in thousands) As of September 30, 2025 Ankeny, IA 644,108 Square Feet ILPT Ownership: 22%
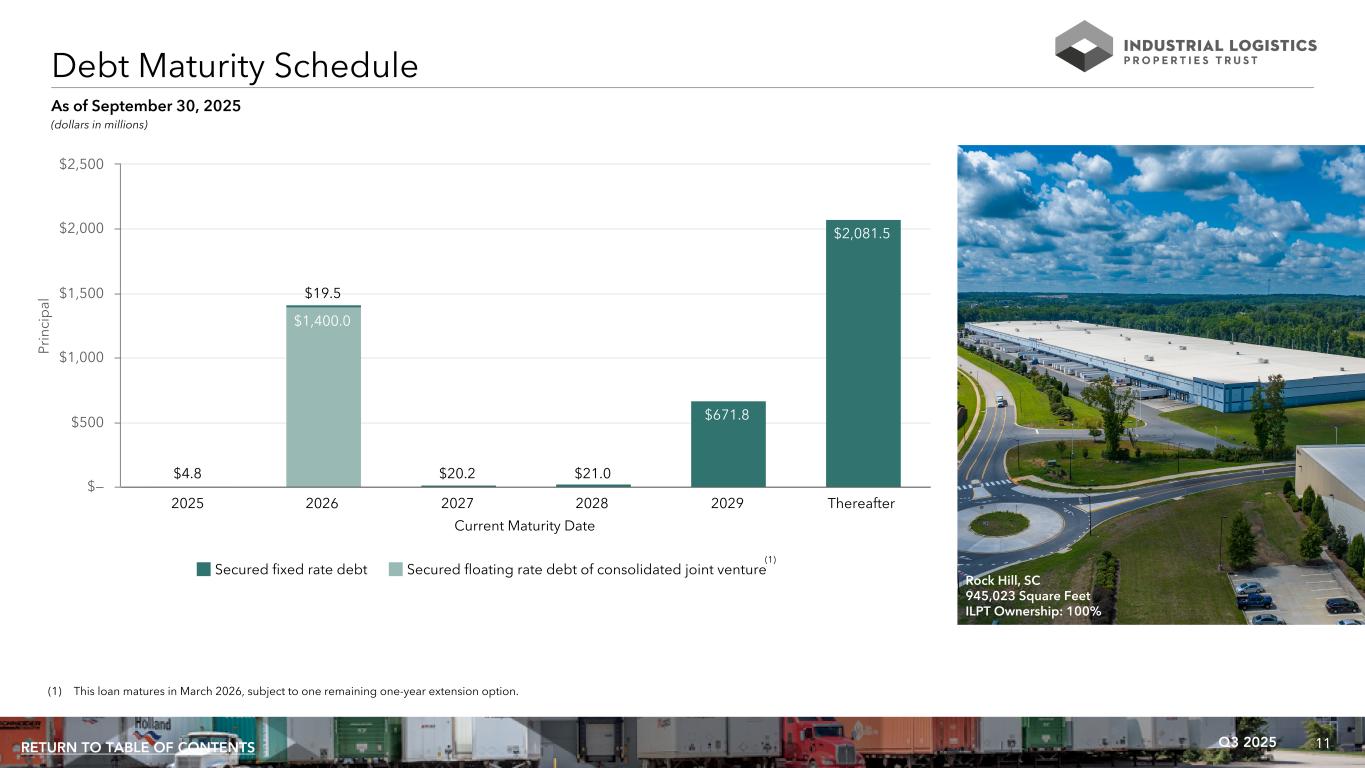
11Q3 2025RETURN TO TABLE OF CONTENTS (1) This loan matures in March 2026, subject to one remaining one-year extension option. Debt Maturity Schedule (dollars in millions) As of September 30, 2025 Current Maturity Date Pr in ci p al $1,400.0 $4.8 $19.5 $20.2 $21.0 $671.8 $2,081.5 Secured fixed rate debt Secured floating rate debt of consolidated joint venture 2025 2026 2027 2028 2029 Thereafter $— $500 $1,000 $1,500 $2,000 $2,500 Rock Hill, SC 945,023 Square Feet ILPT Ownership: 100% (1)
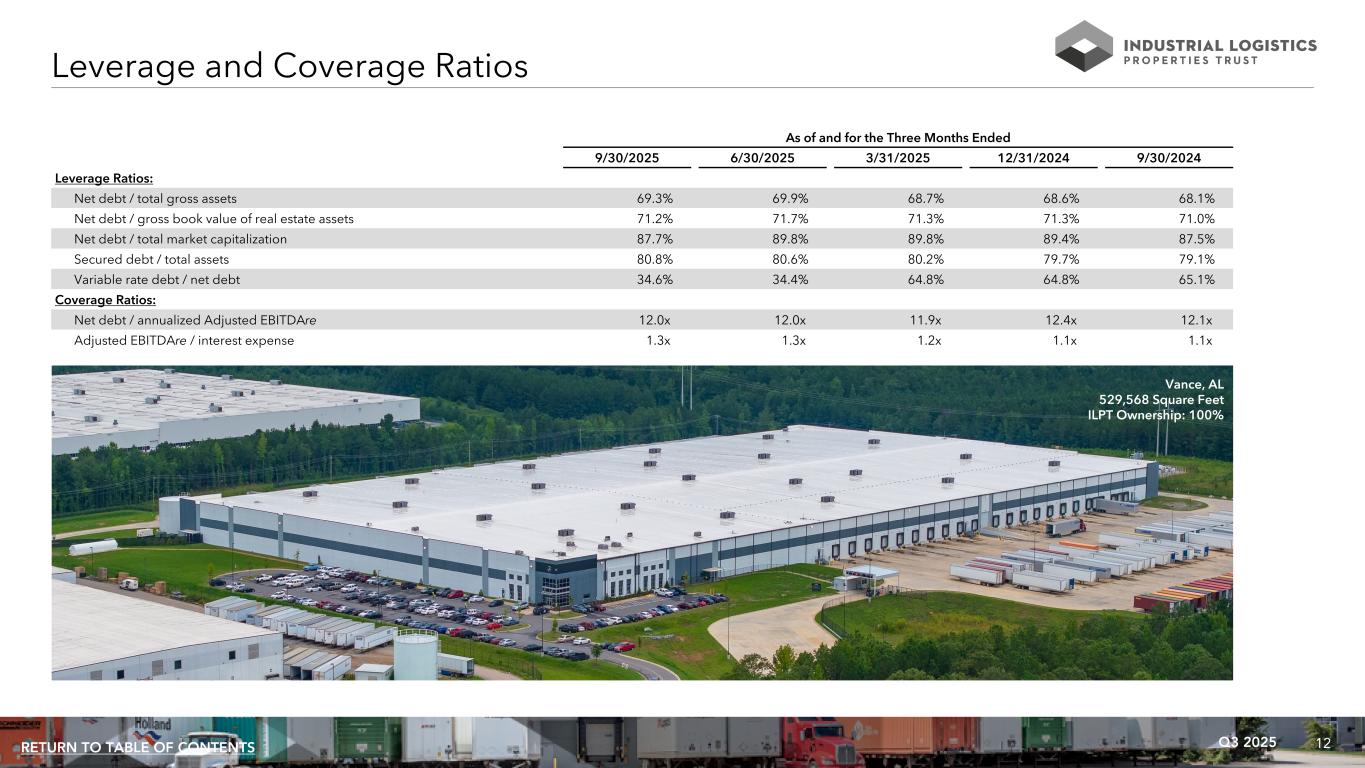
12Q3 2025RETURN TO TABLE OF CONTENTS As of and for the Three Months Ended 9/30/2025 6/30/2025 3/31/2025 12/31/2024 9/30/2024 Leverage Ratios: Net debt / total gross assets 69.3% 69.9% 68.7% 68.6% 68.1% Net debt / gross book value of real estate assets 71.2% 71.7% 71.3% 71.3% 71.0% Net debt / total market capitalization 87.7% 89.8% 89.8% 89.4% 87.5% Secured debt / total assets 80.8% 80.6% 80.2% 79.7% 79.1% Variable rate debt / net debt 34.6% 34.4% 64.8% 64.8% 65.1% Coverage Ratios: Net debt / annualized Adjusted EBITDAre 12.0x 12.0x 11.9x 12.4x 12.1x Adjusted EBITDAre / interest expense 1.3x 1.3x 1.2x 1.1x 1.1x Leverage and Coverage Ratios Vance, AL 529,568 Square Feet ILPT Ownership: 100%
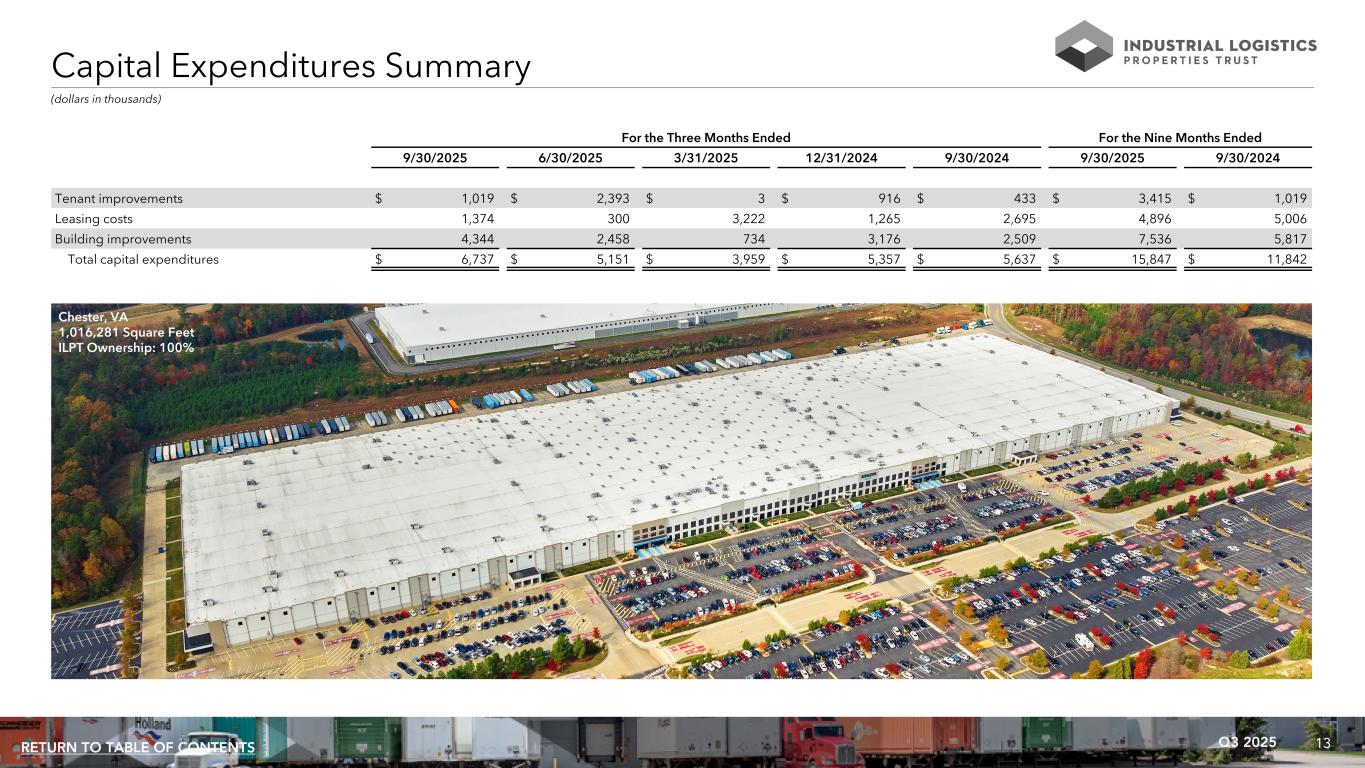
13Q3 2025RETURN TO TABLE OF CONTENTS (dollars in thousands) For the Three Months Ended For the Nine Months Ended 9/30/2025 6/30/2025 3/31/2025 12/31/2024 9/30/2024 9/30/2025 9/30/2024 Tenant improvements $ 1,019 $ 2,393 $ 3 $ 916 $ 433 $ 3,415 $ 1,019 Leasing costs 1,374 300 3,222 1,265 2,695 4,896 5,006 Building improvements 4,344 2,458 734 3,176 2,509 7,536 5,817 Total capital expenditures $ 6,737 $ 5,151 $ 3,959 $ 5,357 $ 5,637 $ 15,847 $ 11,842 Capital Expenditures Summary Chester, VA 1,016,281 Square Feet ILPT Ownership: 100%

14Q3 2025RETURN TO TABLE OF CONTENTS Portfolio Information
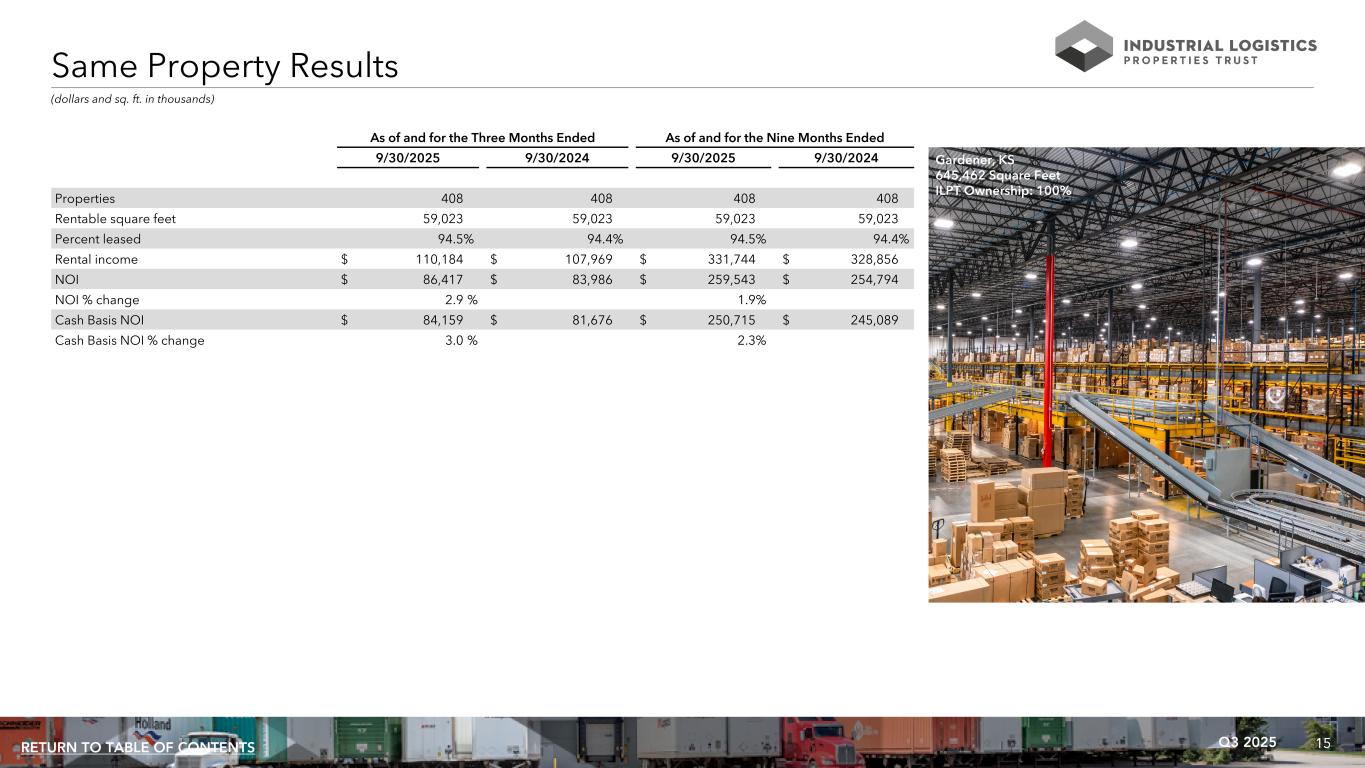
15Q3 2025RETURN TO TABLE OF CONTENTS (dollars and sq. ft. in thousands) As of and for the Three Months Ended As of and for the Nine Months Ended 9/30/2025 9/30/2024 9/30/2025 9/30/2024 Properties 408 408 408 408 Rentable square feet 59,023 59,023 59,023 59,023 Percent leased 94.5% 94.4% 94.5% 94.4% Rental income $ 110,184 $ 107,969 $ 331,744 $ 328,856 NOI $ 86,417 $ 83,986 $ 259,543 $ 254,794 NOI % change 2.9 % 1.9% Cash Basis NOI $ 84,159 $ 81,676 $ 250,715 $ 245,089 Cash Basis NOI % change 3.0 % 2.3% Same Property Results Gardener, KS 645,462 Square Feet ILPT Ownership: 100%
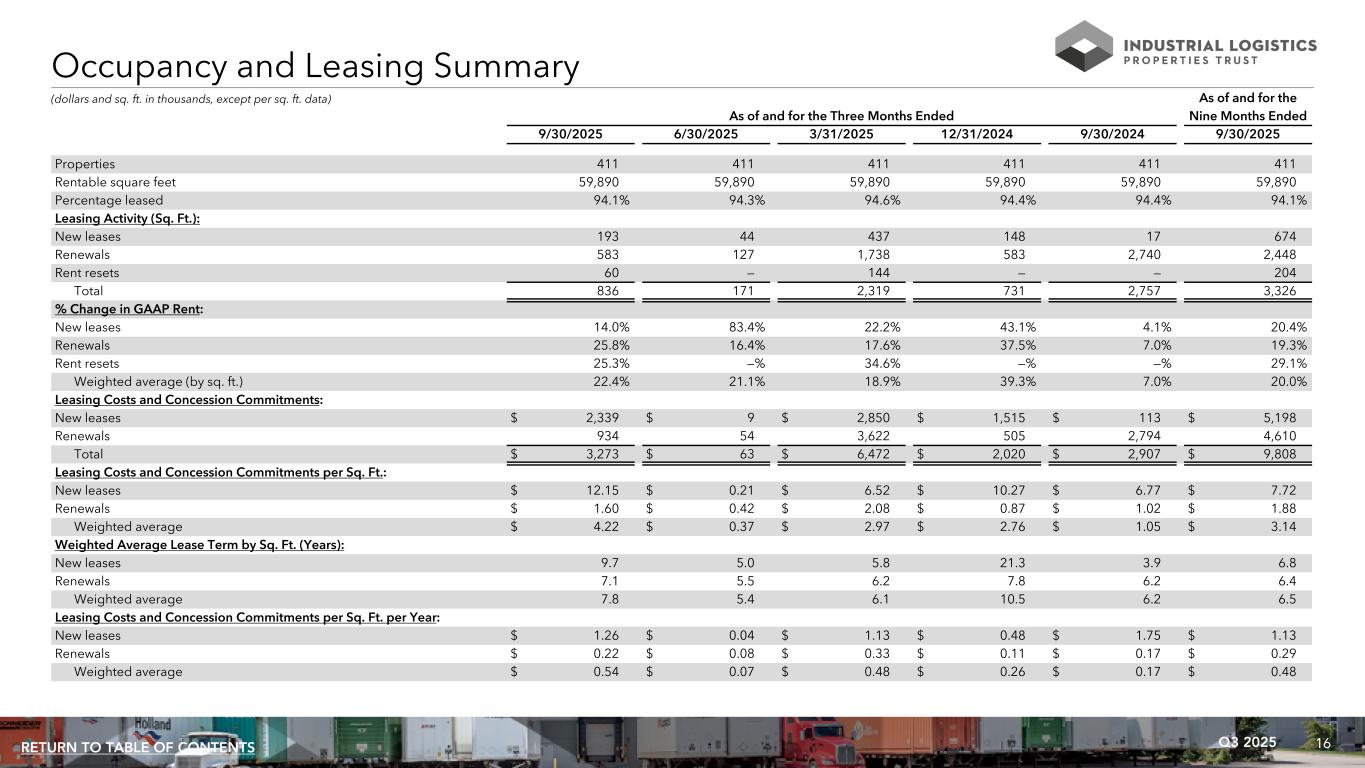
16Q3 2025RETURN TO TABLE OF CONTENTS (dollars and sq. ft. in thousands, except per sq. ft. data) As of and for the As of and for the Three Months Ended Nine Months Ended 9/30/2025 6/30/2025 3/31/2025 12/31/2024 9/30/2024 9/30/2025 Properties 411 411 411 411 411 411 Rentable square feet 59,890 59,890 59,890 59,890 59,890 59,890 Percentage leased 94.1% 94.3% 94.6% 94.4% 94.4% 94.1% Leasing Activity (Sq. Ft.): New leases 193 44 437 148 17 674 Renewals 583 127 1,738 583 2,740 2,448 Rent resets 60 — 144 — — 204 Total 836 171 2,319 731 2,757 3,326 % Change in GAAP Rent: New leases 14.0% 83.4% 22.2% 43.1% 4.1% 20.4% Renewals 25.8% 16.4% 17.6% 37.5% 7.0% 19.3% Rent resets 25.3% —% 34.6% —% —% 29.1% Weighted average (by sq. ft.) 22.4% 21.1% 18.9% 39.3% 7.0% 20.0% Leasing Costs and Concession Commitments: New leases $ 2,339 $ 9 $ 2,850 $ 1,515 $ 113 $ 5,198 Renewals 934 54 3,622 505 2,794 4,610 Total $ 3,273 $ 63 $ 6,472 $ 2,020 $ 2,907 $ 9,808 Leasing Costs and Concession Commitments per Sq. Ft.: New leases $ 12.15 $ 0.21 $ 6.52 $ 10.27 $ 6.77 $ 7.72 Renewals $ 1.60 $ 0.42 $ 2.08 $ 0.87 $ 1.02 $ 1.88 Weighted average $ 4.22 $ 0.37 $ 2.97 $ 2.76 $ 1.05 $ 3.14 Weighted Average Lease Term by Sq. Ft. (Years): New leases 9.7 5.0 5.8 21.3 3.9 6.8 Renewals 7.1 5.5 6.2 7.8 6.2 6.4 Weighted average 7.8 5.4 6.1 10.5 6.2 6.5 Leasing Costs and Concession Commitments per Sq. Ft. per Year: New leases $ 1.26 $ 0.04 $ 1.13 $ 0.48 $ 1.75 $ 1.13 Renewals $ 0.22 $ 0.08 $ 0.33 $ 0.11 $ 0.17 $ 0.29 Weighted average $ 0.54 $ 0.07 $ 0.48 $ 0.26 $ 0.17 $ 0.48 Occupancy and Leasing Summary
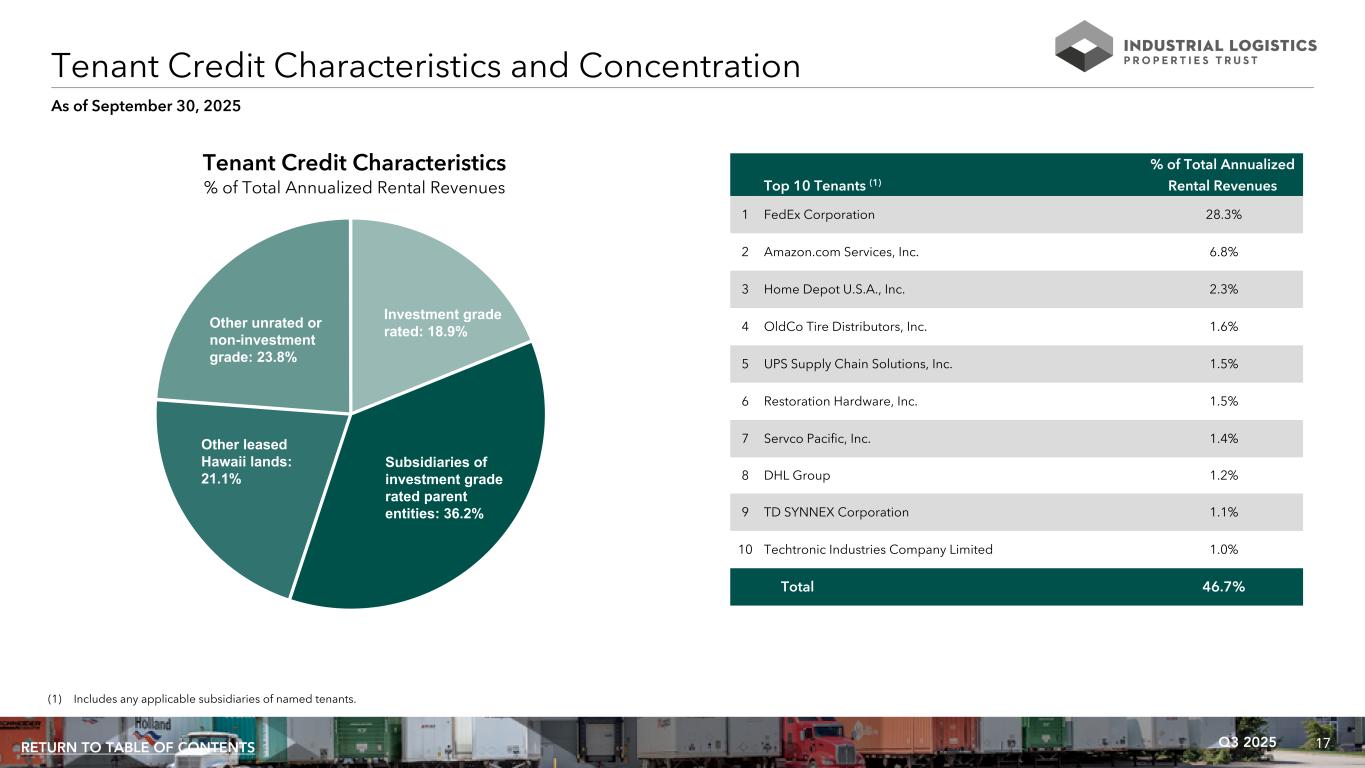
17Q3 2025RETURN TO TABLE OF CONTENTS As of September 30, 2025 Tenant Credit Characteristics and Concentration % of Total Annualized Top 10 Tenants (1) Rental Revenues 1 FedEx Corporation 28.3% 2 Amazon.com Services, Inc. 6.8% 3 Home Depot U.S.A., Inc. 2.3% 4 OldCo Tire Distributors, Inc. 1.6% 5 UPS Supply Chain Solutions, Inc. 1.5% 6 Restoration Hardware, Inc. 1.5% 7 Servco Pacific, Inc. 1.4% 8 DHL Group 1.2% 9 TD SYNNEX Corporation 1.1% 10 Techtronic Industries Company Limited 1.0% Total 46.7% Investment grade rated: 18.9% Subsidiaries of investment grade rated parent entities: 36.2% Other leased Hawaii lands: 21.1% Other unrated or non-investment grade: 23.8% Tenant Credit Characteristics % of Total Annualized Rental Revenues (1) Includes any applicable subsidiaries of named tenants.
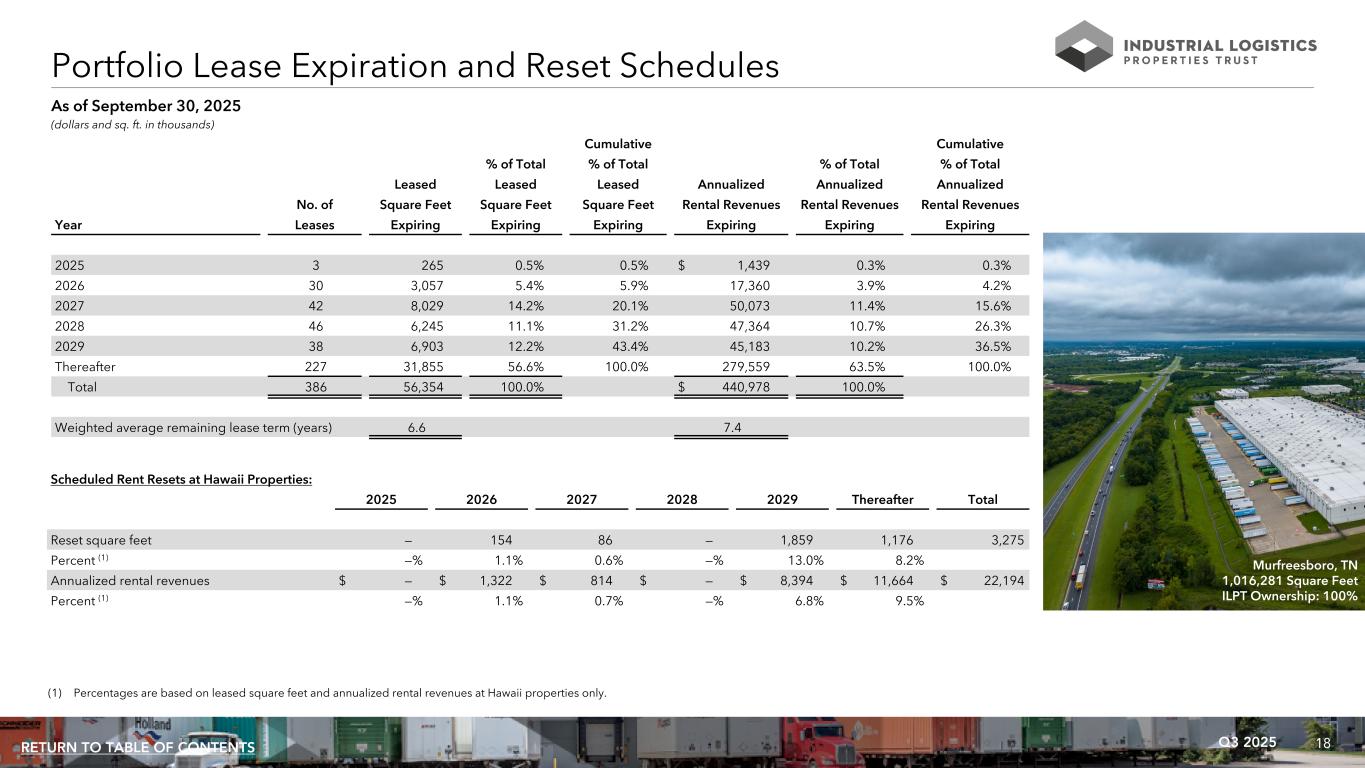
18Q3 2025RETURN TO TABLE OF CONTENTS Cumulative Cumulative % of Total % of Total % of Total % of Total Leased Leased Leased Annualized Annualized Annualized No. of Square Feet Square Feet Square Feet Rental Revenues Rental Revenues Rental Revenues Year Leases Expiring Expiring Expiring Expiring Expiring Expiring 2025 3 265 0.5% 0.5% $ 1,439 0.3% 0.3% 2026 30 3,057 5.4% 5.9% 17,360 3.9% 4.2% 2027 42 8,029 14.2% 20.1% 50,073 11.4% 15.6% 2028 46 6,245 11.1% 31.2% 47,364 10.7% 26.3% 2029 38 6,903 12.2% 43.4% 45,183 10.2% 36.5% Thereafter 227 31,855 56.6% 100.0% 279,559 63.5% 100.0% Total 386 56,354 100.0% $ 440,978 100.0% Weighted average remaining lease term (years) 6.6 7.4 Portfolio Lease Expiration and Reset Schedules (dollars and sq. ft. in thousands) As of September 30, 2025 Scheduled Rent Resets at Hawaii Properties: 2025 2026 2027 2028 2029 Thereafter Total Reset square feet — 154 86 — 1,859 1,176 3,275 Percent (1) —% 1.1% 0.6% —% 13.0% 8.2% Annualized rental revenues $ — $ 1,322 $ 814 $ — $ 8,394 $ 11,664 $ 22,194 Percent (1) —% 1.1% 0.7% —% 6.8% 9.5% (1) Percentages are based on leased square feet and annualized rental revenues at Hawaii properties only. Murfreesboro, TN 1,016,281 Square Feet ILPT Ownership: 100%
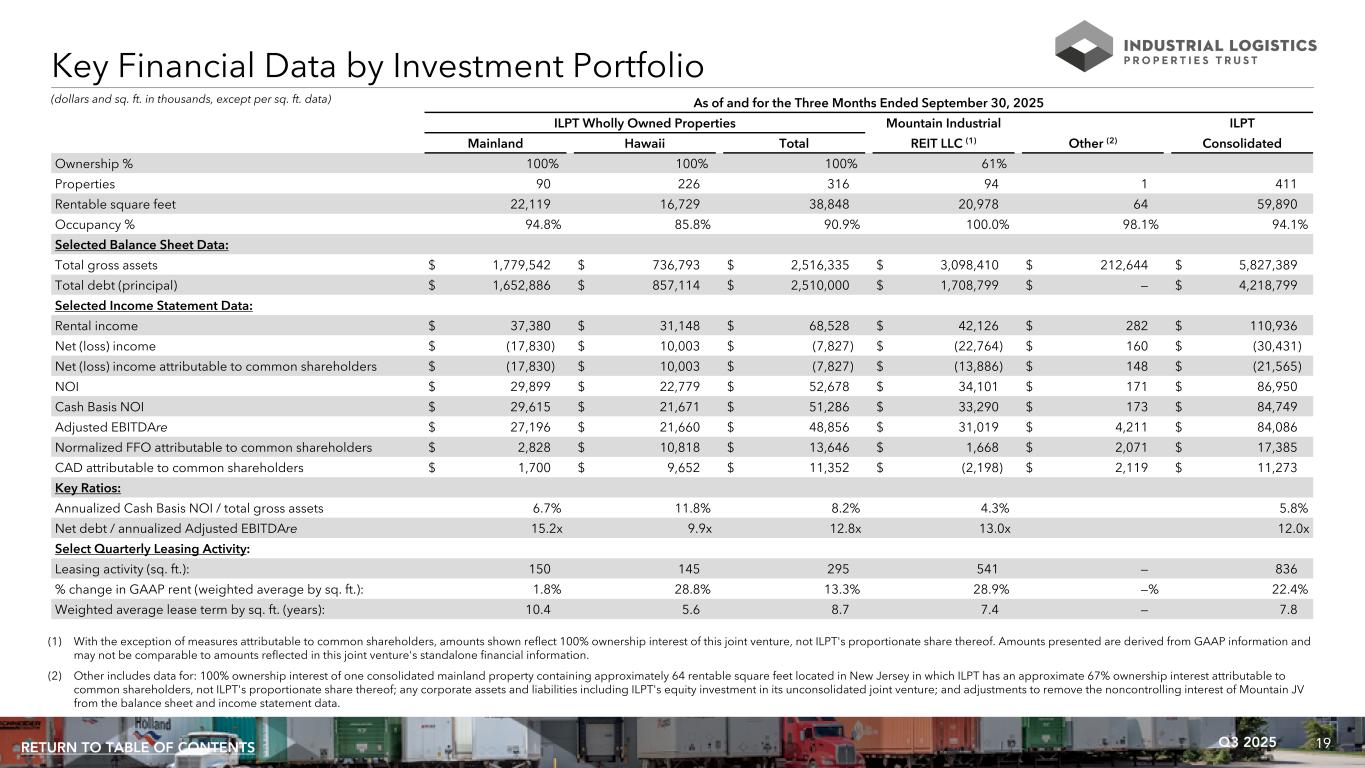
19Q3 2025RETURN TO TABLE OF CONTENTS (dollars and sq. ft. in thousands, except per sq. ft. data) Key Financial Data by Investment Portfolio As of and for the Three Months Ended September 30, 2025 ILPT Wholly Owned Properties Mountain Industrial ILPT Mainland Hawaii Total REIT LLC (1) Other (2) Consolidated Ownership % 100% 100% 100% 61% Properties 90 226 316 94 1 411 Rentable square feet 22,119 16,729 38,848 20,978 64 59,890 Occupancy % 94.8% 85.8% 90.9% 100.0% 98.1% 94.1% Selected Balance Sheet Data: Total gross assets $ 1,779,542 $ 736,793 $ 2,516,335 $ 3,098,410 $ 212,644 $ 5,827,389 Total debt (principal) $ 1,652,886 $ 857,114 $ 2,510,000 $ 1,708,799 $ — $ 4,218,799 Selected Income Statement Data: Rental income $ 37,380 $ 31,148 $ 68,528 $ 42,126 $ 282 $ 110,936 Net (loss) income $ (17,830) $ 10,003 $ (7,827) $ (22,764) $ 160 $ (30,431) Net (loss) income attributable to common shareholders $ (17,830) $ 10,003 $ (7,827) $ (13,886) $ 148 $ (21,565) NOI $ 29,899 $ 22,779 $ 52,678 $ 34,101 $ 171 $ 86,950 Cash Basis NOI $ 29,615 $ 21,671 $ 51,286 $ 33,290 $ 173 $ 84,749 Adjusted EBITDAre $ 27,196 $ 21,660 $ 48,856 $ 31,019 $ 4,211 $ 84,086 Normalized FFO attributable to common shareholders $ 2,828 $ 10,818 $ 13,646 $ 1,668 $ 2,071 $ 17,385 CAD attributable to common shareholders $ 1,700 $ 9,652 $ 11,352 $ (2,198) $ 2,119 $ 11,273 Key Ratios: Annualized Cash Basis NOI / total gross assets 6.7% 11.8% 8.2% 4.3% 5.8% Net debt / annualized Adjusted EBITDAre 15.2x 9.9x 12.8x 13.0x 12.0x Select Quarterly Leasing Activity: Leasing activity (sq. ft.): 150 145 295 541 — 836 % change in GAAP rent (weighted average by sq. ft.): 1.8% 28.8% 13.3% 28.9% —% 22.4% Weighted average lease term by sq. ft. (years): 10.4 5.6 8.7 7.4 — 7.8 (1) With the exception of measures attributable to common shareholders, amounts shown reflect 100% ownership interest of this joint venture, not ILPT's proportionate share thereof. Amounts presented are derived from GAAP information and may not be comparable to amounts reflected in this joint venture's standalone financial information. (2) Other includes data for: 100% ownership interest of one consolidated mainland property containing approximately 64 rentable square feet located in New Jersey in which ILPT has an approximate 67% ownership interest attributable to common shareholders, not ILPT's proportionate share thereof; any corporate assets and liabilities including ILPT's equity investment in its unconsolidated joint venture; and adjustments to remove the noncontrolling interest of Mountain JV from the balance sheet and income statement data.

20Q3 2025RETURN TO TABLE OF CONTENTS Joint Ventures
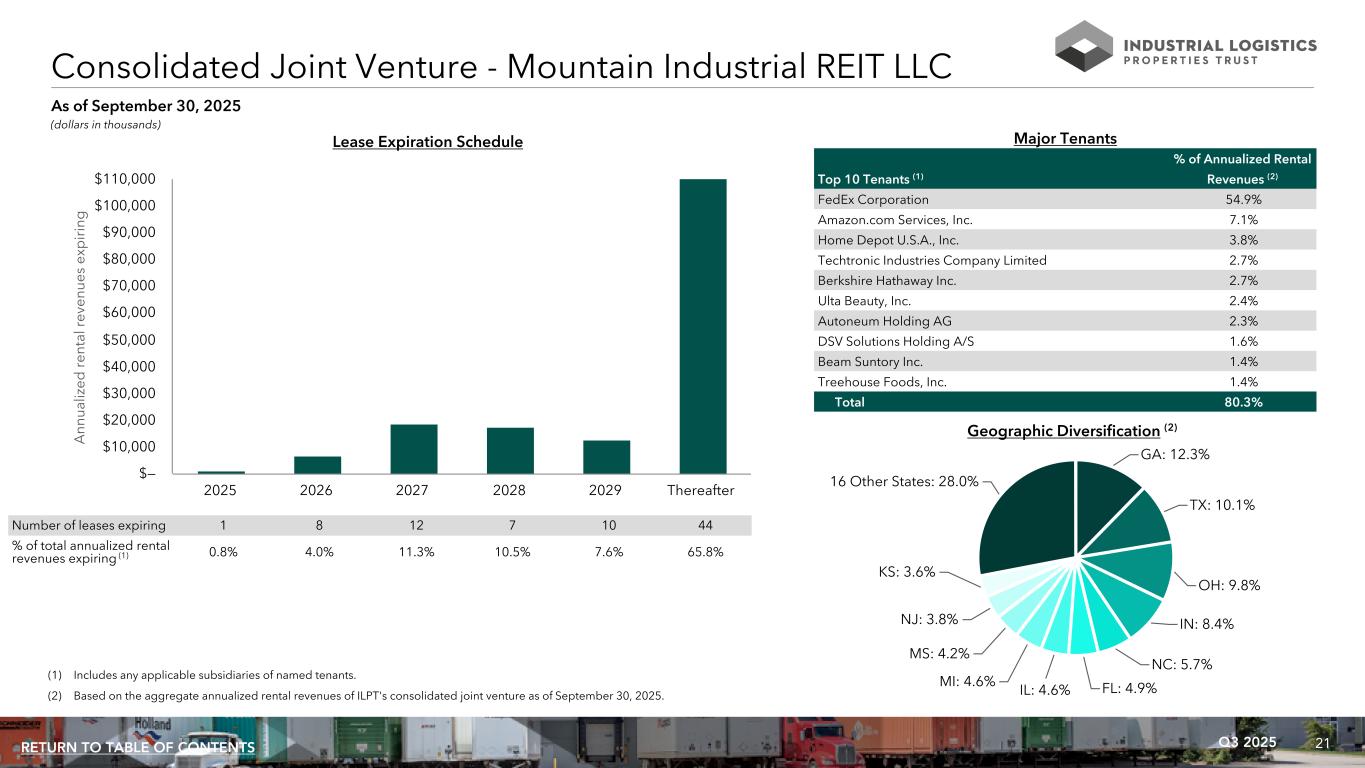
21Q3 2025RETURN TO TABLE OF CONTENTS GA: 12.3% TX: 10.1% OH: 9.8% IN: 8.4% NC: 5.7% FL: 4.9%IL: 4.6% MI: 4.6% MS: 4.2% NJ: 3.8% KS: 3.6% 16 Other States: 28.0% Consolidated Joint Venture - Mountain Industrial REIT LLC (dollars in thousands) Number of leases expiring 1 8 12 7 10 44 % of total annualized rental revenues expiring (1) 0.8% 4.0% 11.3% 10.5% 7.6% 65.8% A nn ua liz ed r en ta l r ev en ue s ex p ir in g 2025 2026 2027 2028 2029 Thereafter $— $10,000 $20,000 $30,000 $40,000 $50,000 $60,000 $70,000 $80,000 $90,000 $100,000 $110,000 Lease Expiration Schedule As of September 30, 2025 Major Tenants % of Annualized Rental Top 10 Tenants (1) Revenues (2) FedEx Corporation 54.9% Amazon.com Services, Inc. 7.1% Home Depot U.S.A., Inc. 3.8% Techtronic Industries Company Limited 2.7% Berkshire Hathaway Inc. 2.7% Ulta Beauty, Inc. 2.4% Autoneum Holding AG 2.3% DSV Solutions Holding A/S 1.6% Beam Suntory Inc. 1.4% Treehouse Foods, Inc. 1.4% Total 80.3% Geographic Diversification (2) (1) Includes any applicable subsidiaries of named tenants. (2) Based on the aggregate annualized rental revenues of ILPT's consolidated joint venture as of September 30, 2025.
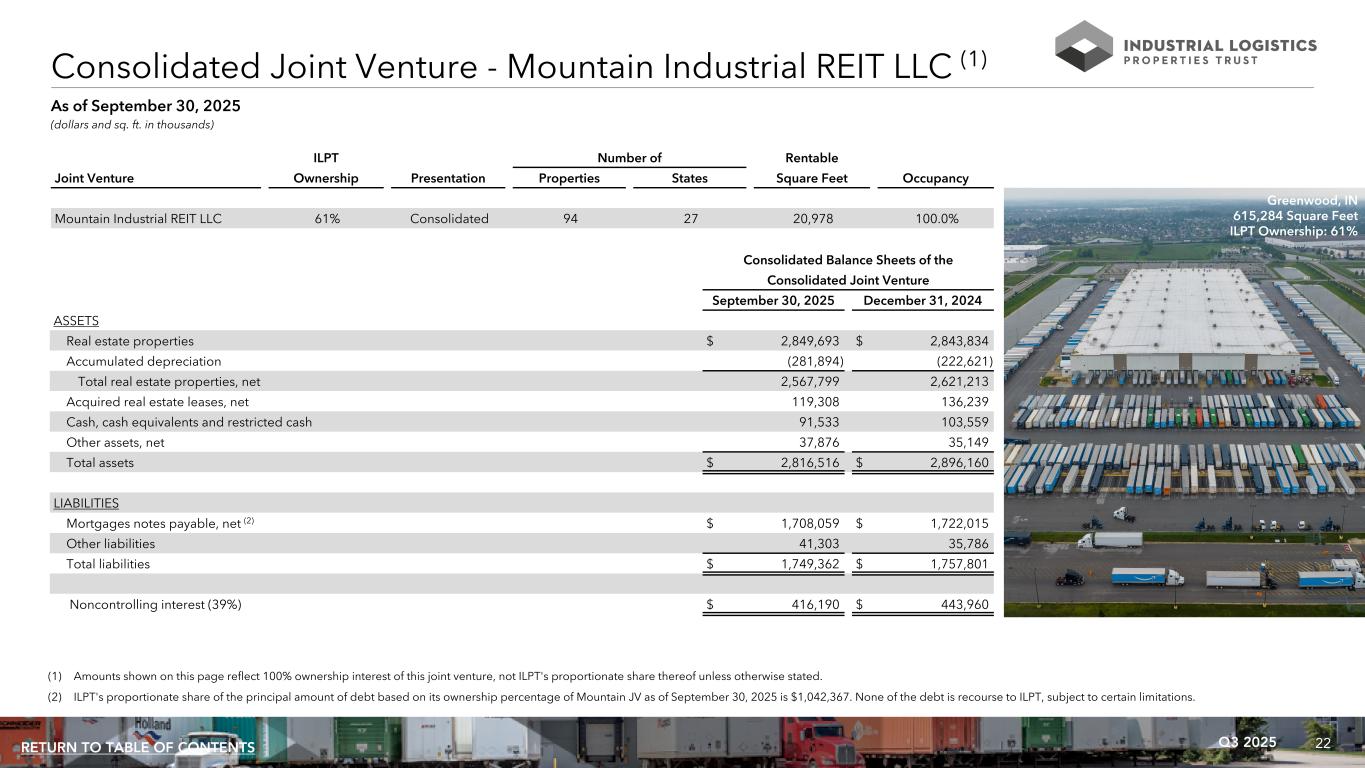
22Q3 2025RETURN TO TABLE OF CONTENTS (dollars and sq. ft. in thousands) ILPT Number of Rentable Joint Venture Ownership Presentation Properties States Square Feet Occupancy Mountain Industrial REIT LLC 61% Consolidated 94 27 20,978 100.0% (1) Amounts shown on this page reflect 100% ownership interest of this joint venture, not ILPT's proportionate share thereof unless otherwise stated. (2) ILPT's proportionate share of the principal amount of debt based on its ownership percentage of Mountain JV as of September 30, 2025 is $1,042,367. None of the debt is recourse to ILPT, subject to certain limitations. As of September 30, 2025 Consolidated Balance Sheets of the Consolidated Joint Venture September 30, 2025 December 31, 2024 ASSETS Real estate properties $ 2,849,693 $ 2,843,834 Accumulated depreciation (281,894) (222,621) Total real estate properties, net 2,567,799 2,621,213 Acquired real estate leases, net 119,308 136,239 Cash, cash equivalents and restricted cash 91,533 103,559 Other assets, net 37,876 35,149 Total assets $ 2,816,516 $ 2,896,160 LIABILITIES Mortgages notes payable, net (2) $ 1,708,059 $ 1,722,015 Other liabilities 41,303 35,786 Total liabilities $ 1,749,362 $ 1,757,801 Noncontrolling interest (39%) $ 416,190 $ 443,960 Consolidated Joint Venture - Mountain Industrial REIT LLC (1) Greenwood, IN 615,284 Square Feet ILPT Ownership: 61%
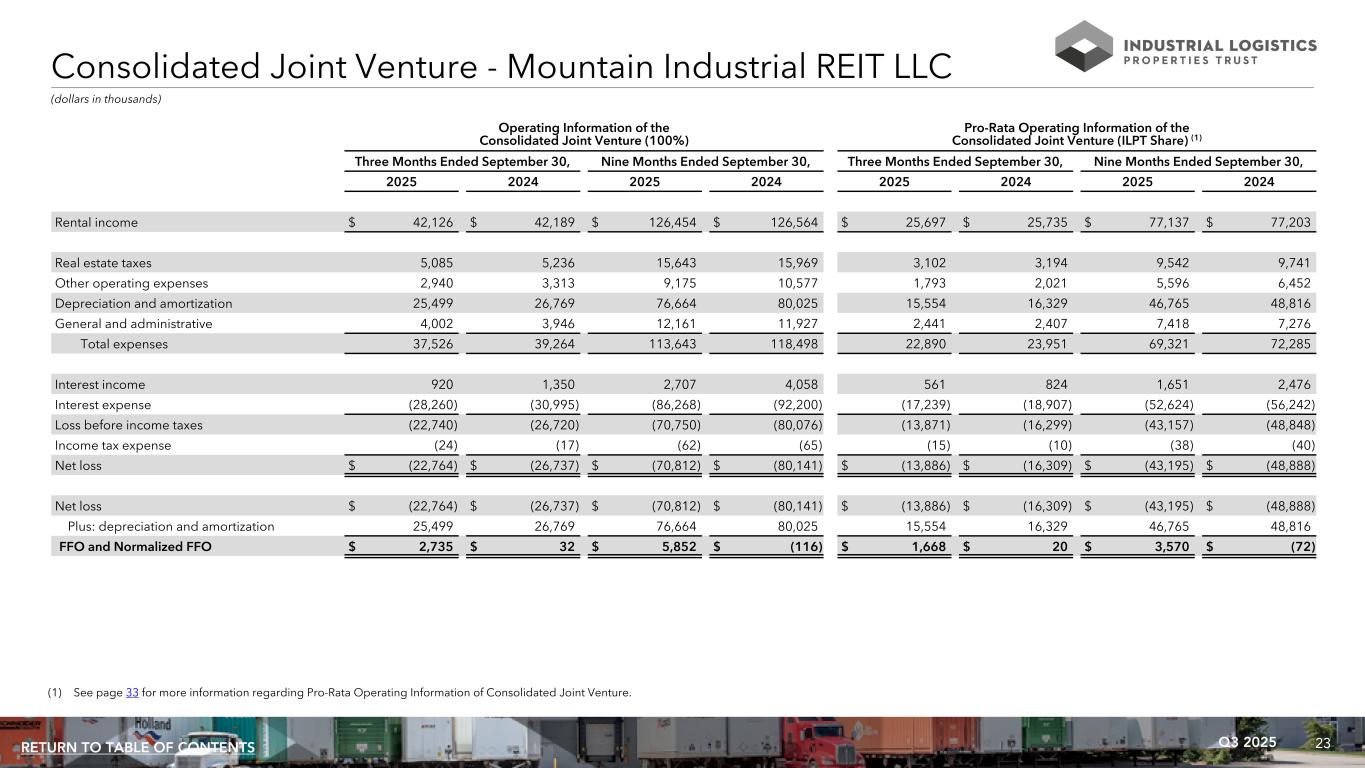
23Q3 2025RETURN TO TABLE OF CONTENTS Operating Information of the Consolidated Joint Venture (100%) Pro-Rata Operating Information of the Consolidated Joint Venture (ILPT Share) (1) Three Months Ended September 30, Nine Months Ended September 30, Three Months Ended September 30, Nine Months Ended September 30, 2025 2024 2025 2024 2025 2024 2025 2024 Rental income $ 42,126 $ 42,189 $ 126,454 $ 126,564 $ 25,697 $ 25,735 $ 77,137 $ 77,203 Real estate taxes 5,085 5,236 15,643 15,969 3,102 3,194 9,542 9,741 Other operating expenses 2,940 3,313 9,175 10,577 1,793 2,021 5,596 6,452 Depreciation and amortization 25,499 26,769 76,664 80,025 15,554 16,329 46,765 48,816 General and administrative 4,002 3,946 12,161 11,927 2,441 2,407 7,418 7,276 Total expenses 37,526 39,264 113,643 118,498 22,890 23,951 69,321 72,285 Interest income 920 1,350 2,707 4,058 561 824 1,651 2,476 Interest expense (28,260) (30,995) (86,268) (92,200) (17,239) (18,907) (52,624) (56,242) Loss before income taxes (22,740) (26,720) (70,750) (80,076) (13,871) (16,299) (43,157) (48,848) Income tax expense (24) (17) (62) (65) (15) (10) (38) (40) Net loss $ (22,764) $ (26,737) $ (70,812) $ (80,141) $ (13,886) $ (16,309) $ (43,195) $ (48,888) Net loss $ (22,764) $ (26,737) $ (70,812) $ (80,141) $ (13,886) $ (16,309) $ (43,195) $ (48,888) Plus: depreciation and amortization 25,499 26,769 76,664 80,025 15,554 16,329 46,765 48,816 FFO and Normalized FFO $ 2,735 $ 32 $ 5,852 $ (116) $ 1,668 $ 20 $ 3,570 $ (72) (dollars in thousands) (1) See page 33 for more information regarding Pro-Rata Operating Information of Consolidated Joint Venture. Consolidated Joint Venture - Mountain Industrial REIT LLC
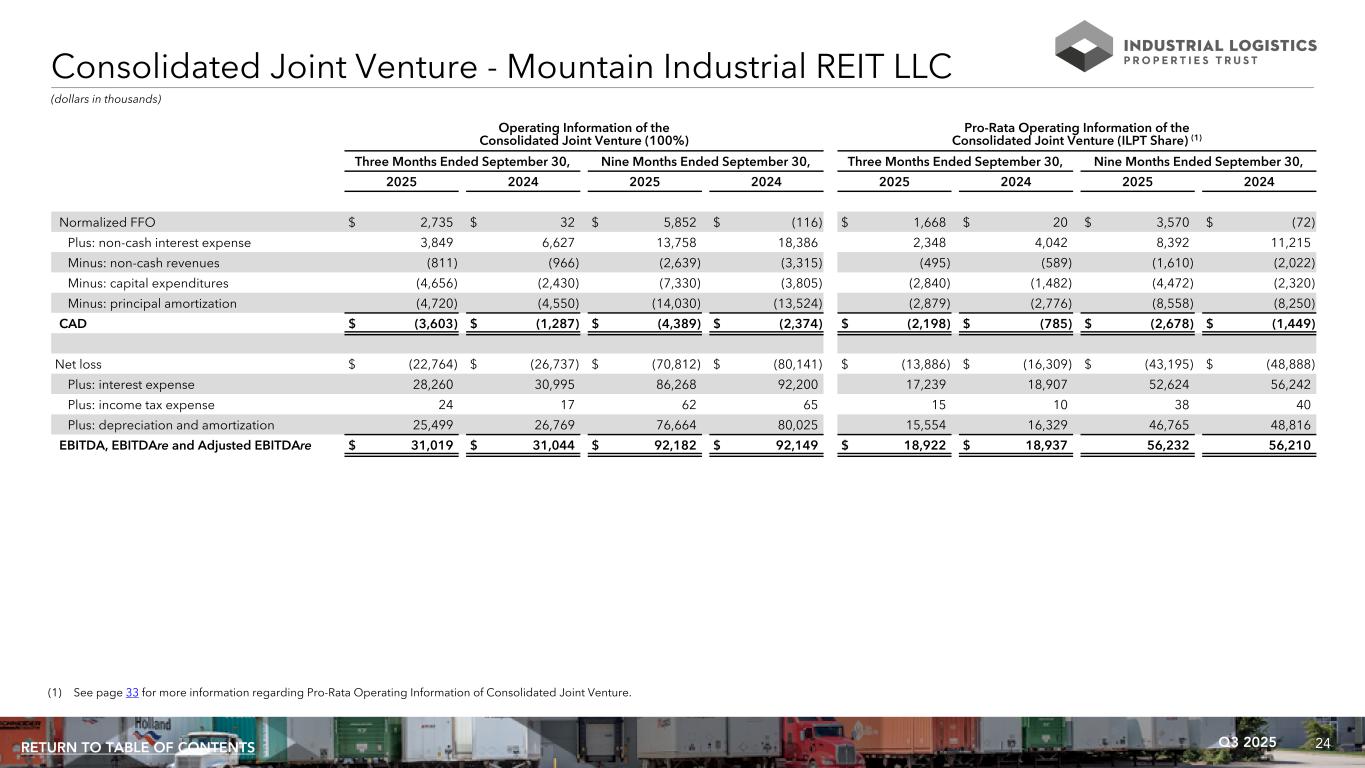
24Q3 2025RETURN TO TABLE OF CONTENTS Operating Information of the Consolidated Joint Venture (100%) Pro-Rata Operating Information of the Consolidated Joint Venture (ILPT Share) (1) Three Months Ended September 30, Nine Months Ended September 30, Three Months Ended September 30, Nine Months Ended September 30, 2025 2024 2025 2024 2025 2024 2025 2024 Normalized FFO $ 2,735 $ 32 $ 5,852 $ (116) $ 1,668 $ 20 $ 3,570 $ (72) Plus: non-cash interest expense 3,849 6,627 13,758 18,386 2,348 4,042 8,392 11,215 Minus: non-cash revenues (811) (966) (2,639) (3,315) (495) (589) (1,610) (2,022) Minus: capital expenditures (4,656) (2,430) (7,330) (3,805) (2,840) (1,482) (4,472) (2,320) Minus: principal amortization (4,720) (4,550) (14,030) (13,524) (2,879) (2,776) (8,558) (8,250) CAD $ (3,603) $ (1,287) $ (4,389) $ (2,374) $ (2,198) $ (785) $ (2,678) $ (1,449) Net loss $ (22,764) $ (26,737) $ (70,812) $ (80,141) $ (13,886) $ (16,309) $ (43,195) $ (48,888) Plus: interest expense 28,260 30,995 86,268 92,200 17,239 18,907 52,624 56,242 Plus: income tax expense 24 17 62 65 15 10 38 40 Plus: depreciation and amortization 25,499 26,769 76,664 80,025 15,554 16,329 46,765 48,816 EBITDA, EBITDAre and Adjusted EBITDAre $ 31,019 $ 31,044 $ 92,182 $ 92,149 $ 18,922 $ 18,937 56,232 56,210 (dollars in thousands) Consolidated Joint Venture - Mountain Industrial REIT LLC (1) See page 33 for more information regarding Pro-Rata Operating Information of Consolidated Joint Venture.
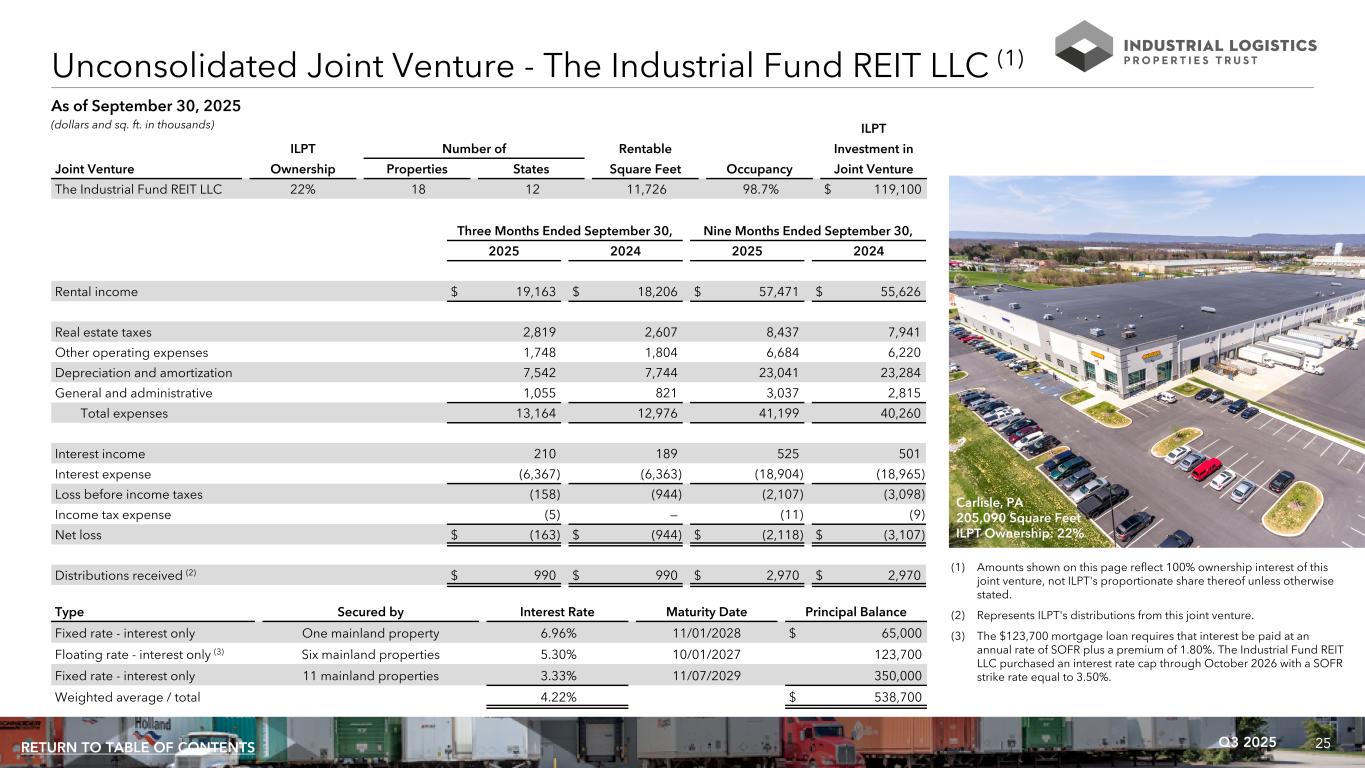
25Q3 2025RETURN TO TABLE OF CONTENTS Unconsolidated Joint Venture - The Industrial Fund REIT LLC (1) As of September 30, 2025 ILPT ILPT Number of Rentable Investment in Joint Venture Ownership Properties States Square Feet Occupancy Joint Venture The Industrial Fund REIT LLC 22% 18 12 11,726 98.7% $ 119,100 Three Months Ended September 30, Nine Months Ended September 30, 2025 2024 2025 2024 Rental income $ 19,163 $ 18,206 $ 57,471 $ 55,626 Real estate taxes 2,819 2,607 8,437 7,941 Other operating expenses 1,748 1,804 6,684 6,220 Depreciation and amortization 7,542 7,744 23,041 23,284 General and administrative 1,055 821 3,037 2,815 Total expenses 13,164 12,976 41,199 40,260 Interest income 210 189 525 501 Interest expense (6,367) (6,363) (18,904) (18,965) Loss before income taxes (158) (944) (2,107) (3,098) Income tax expense (5) — (11) (9) Net loss $ (163) $ (944) $ (2,118) $ (3,107) Distributions received (2) $ 990 $ 990 $ 2,970 $ 2,970 Type Secured by Interest Rate Maturity Date Principal Balance Fixed rate - interest only One mainland property 6.96% 11/01/2028 $ 65,000 Floating rate - interest only (3) Six mainland properties 5.30% 10/01/2027 123,700 Fixed rate - interest only 11 mainland properties 3.33% 11/07/2029 350,000 Weighted average / total 4.22% $ 538,700 (1) Amounts shown on this page reflect 100% ownership interest of this joint venture, not ILPT's proportionate share thereof unless otherwise stated. (2) Represents ILPT's distributions from this joint venture. (3) The $123,700 mortgage loan requires that interest be paid at an annual rate of SOFR plus a premium of 1.80%. The Industrial Fund REIT LLC purchased an interest rate cap through October 2026 with a SOFR strike rate equal to 3.50%. (dollars and sq. ft. in thousands) Carlisle, PA 205,090 Square Feet ILPT Ownership: 22%

26Q3 2025RETURN TO TABLE OF CONTENTS Appendix
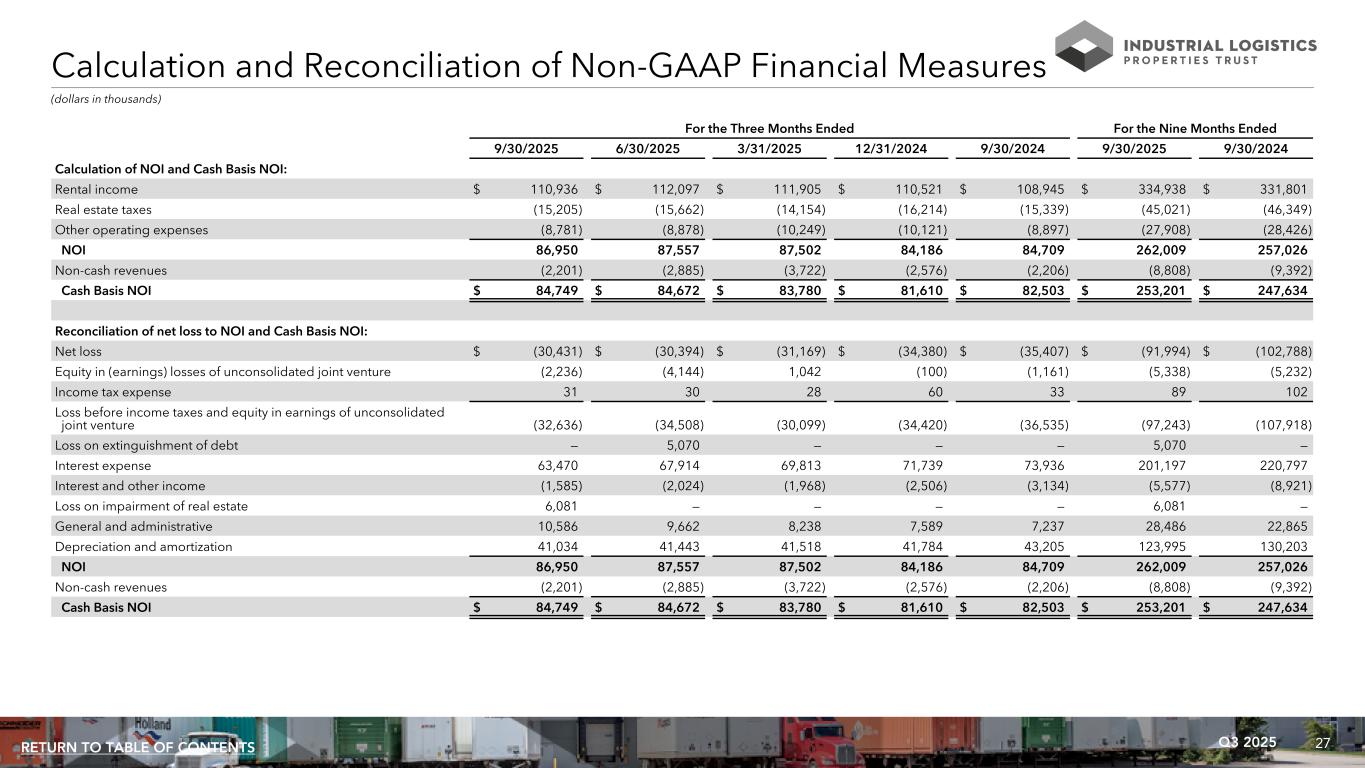
27Q3 2025RETURN TO TABLE OF CONTENTS (dollars in thousands) For the Three Months Ended For the Nine Months Ended 9/30/2025 6/30/2025 3/31/2025 12/31/2024 9/30/2024 9/30/2025 9/30/2024 Calculation of NOI and Cash Basis NOI: Rental income $ 110,936 $ 112,097 $ 111,905 $ 110,521 $ 108,945 $ 334,938 $ 331,801 Real estate taxes (15,205) (15,662) (14,154) (16,214) (15,339) (45,021) (46,349) Other operating expenses (8,781) (8,878) (10,249) (10,121) (8,897) (27,908) (28,426) NOI 86,950 87,557 87,502 84,186 84,709 262,009 257,026 Non-cash revenues (2,201) (2,885) (3,722) (2,576) (2,206) (8,808) (9,392) Cash Basis NOI $ 84,749 $ 84,672 $ 83,780 $ 81,610 $ 82,503 $ 253,201 $ 247,634 Reconciliation of net loss to NOI and Cash Basis NOI: Net loss $ (30,431) $ (30,394) $ (31,169) $ (34,380) $ (35,407) $ (91,994) $ (102,788) Equity in (earnings) losses of unconsolidated joint venture (2,236) (4,144) 1,042 (100) (1,161) (5,338) (5,232) Income tax expense 31 30 28 60 33 89 102 Loss before income taxes and equity in earnings of unconsolidated joint venture (32,636) (34,508) (30,099) (34,420) (36,535) (97,243) (107,918) Loss on extinguishment of debt — 5,070 — — — 5,070 — Interest expense 63,470 67,914 69,813 71,739 73,936 201,197 220,797 Interest and other income (1,585) (2,024) (1,968) (2,506) (3,134) (5,577) (8,921) Loss on impairment of real estate 6,081 — — — — 6,081 — General and administrative 10,586 9,662 8,238 7,589 7,237 28,486 22,865 Depreciation and amortization 41,034 41,443 41,518 41,784 43,205 123,995 130,203 NOI 86,950 87,557 87,502 84,186 84,709 262,009 257,026 Non-cash revenues (2,201) (2,885) (3,722) (2,576) (2,206) (8,808) (9,392) Cash Basis NOI $ 84,749 $ 84,672 $ 83,780 $ 81,610 $ 82,503 $ 253,201 $ 247,634 Calculation and Reconciliation of Non-GAAP Financial Measures
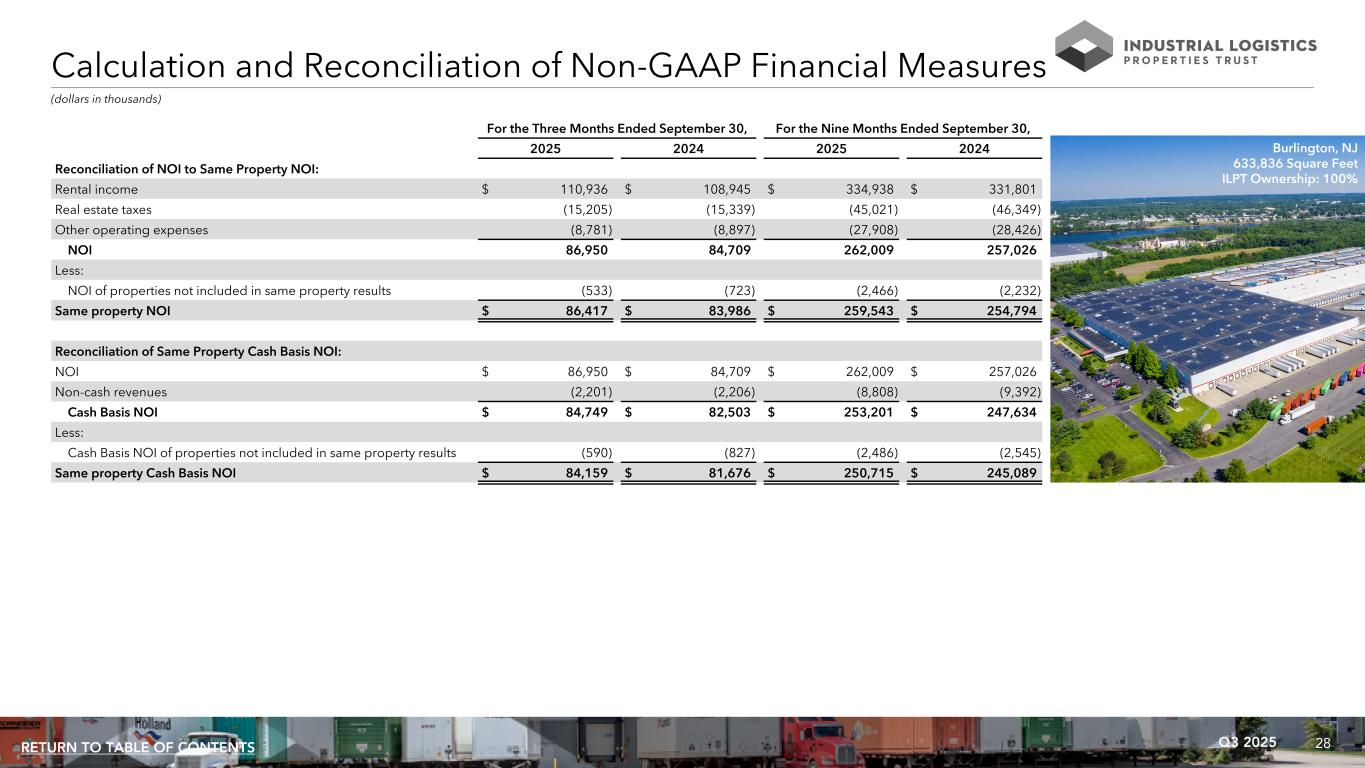
28Q3 2025RETURN TO TABLE OF CONTENTS (dollars in thousands) For the Three Months Ended September 30, For the Nine Months Ended September 30, 2025 2024 2025 2024 Reconciliation of NOI to Same Property NOI: Rental income $ 110,936 $ 108,945 $ 334,938 $ 331,801 Real estate taxes (15,205) (15,339) (45,021) (46,349) Other operating expenses (8,781) (8,897) (27,908) (28,426) NOI 86,950 84,709 262,009 257,026 Less: NOI of properties not included in same property results (533) (723) (2,466) (2,232) Same property NOI $ 86,417 $ 83,986 $ 259,543 $ 254,794 Reconciliation of Same Property Cash Basis NOI: NOI $ 86,950 $ 84,709 $ 262,009 $ 257,026 Non-cash revenues (2,201) (2,206) (8,808) (9,392) Cash Basis NOI $ 84,749 $ 82,503 $ 253,201 $ 247,634 Less: Cash Basis NOI of properties not included in same property results (590) (827) (2,486) (2,545) Same property Cash Basis NOI $ 84,159 $ 81,676 $ 250,715 $ 245,089 Burlington, NJ 633,836 Square Feet ILPT Ownership: 100% Calculation and Reconciliation of Non-GAAP Financial Measures
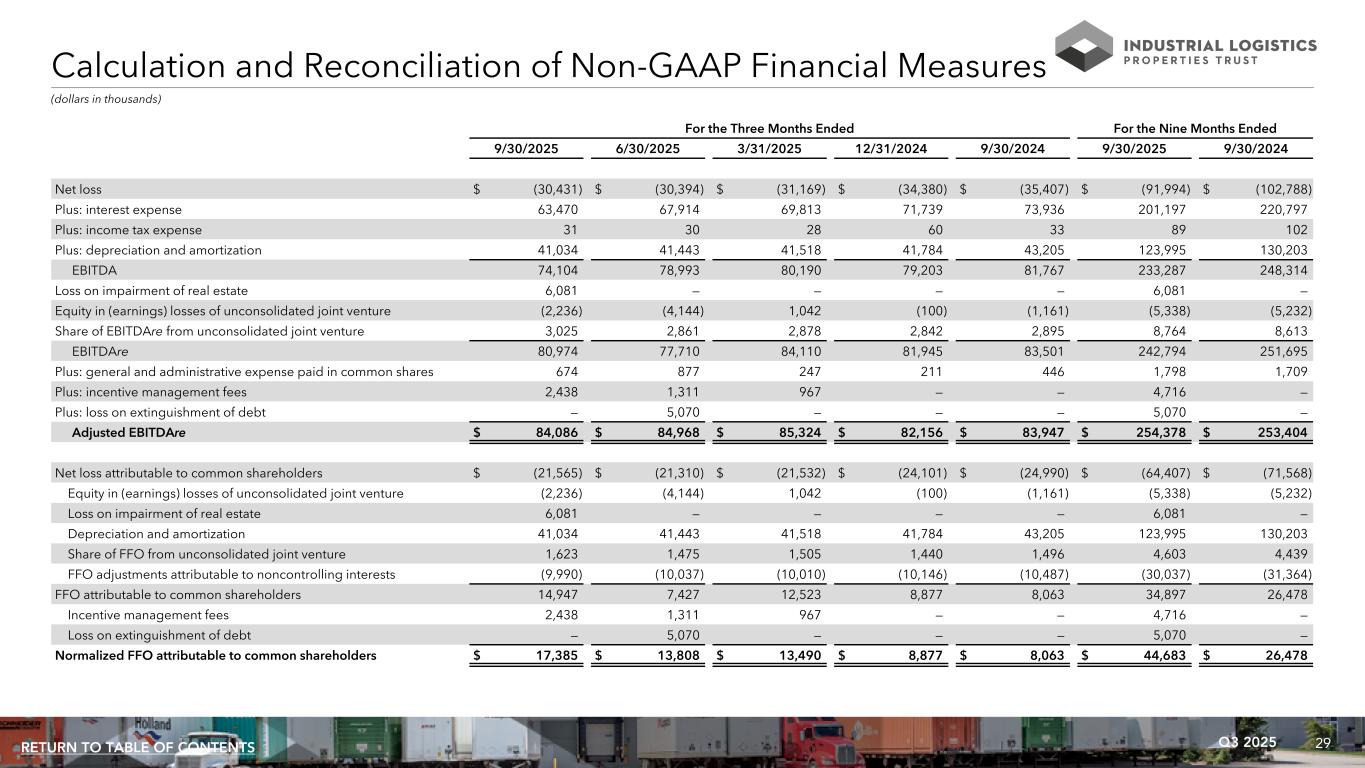
29Q3 2025RETURN TO TABLE OF CONTENTS (dollars in thousands) For the Three Months Ended For the Nine Months Ended 9/30/2025 6/30/2025 3/31/2025 12/31/2024 9/30/2024 9/30/2025 9/30/2024 Net loss $ (30,431) $ (30,394) $ (31,169) $ (34,380) $ (35,407) $ (91,994) $ (102,788) Plus: interest expense 63,470 67,914 69,813 71,739 73,936 201,197 220,797 Plus: income tax expense 31 30 28 60 33 89 102 Plus: depreciation and amortization 41,034 41,443 41,518 41,784 43,205 123,995 130,203 EBITDA 74,104 78,993 80,190 79,203 81,767 233,287 248,314 Loss on impairment of real estate 6,081 — — — — 6,081 — Equity in (earnings) losses of unconsolidated joint venture (2,236) (4,144) 1,042 (100) (1,161) (5,338) (5,232) Share of EBITDAre from unconsolidated joint venture 3,025 2,861 2,878 2,842 2,895 8,764 8,613 EBITDAre 80,974 77,710 84,110 81,945 83,501 242,794 251,695 Plus: general and administrative expense paid in common shares 674 877 247 211 446 1,798 1,709 Plus: incentive management fees 2,438 1,311 967 — — 4,716 — Plus: loss on extinguishment of debt — 5,070 — — — 5,070 — Adjusted EBITDAre $ 84,086 $ 84,968 $ 85,324 $ 82,156 $ 83,947 $ 254,378 $ 253,404 Net loss attributable to common shareholders $ (21,565) $ (21,310) $ (21,532) $ (24,101) $ (24,990) $ (64,407) $ (71,568) Equity in (earnings) losses of unconsolidated joint venture (2,236) (4,144) 1,042 (100) (1,161) (5,338) (5,232) Loss on impairment of real estate 6,081 — — — — 6,081 — Depreciation and amortization 41,034 41,443 41,518 41,784 43,205 123,995 130,203 Share of FFO from unconsolidated joint venture 1,623 1,475 1,505 1,440 1,496 4,603 4,439 FFO adjustments attributable to noncontrolling interests (9,990) (10,037) (10,010) (10,146) (10,487) (30,037) (31,364) FFO attributable to common shareholders 14,947 7,427 12,523 8,877 8,063 34,897 26,478 Incentive management fees 2,438 1,311 967 — — 4,716 — Loss on extinguishment of debt — 5,070 — — — 5,070 — Normalized FFO attributable to common shareholders $ 17,385 $ 13,808 $ 13,490 $ 8,877 $ 8,063 $ 44,683 $ 26,478 Calculation and Reconciliation of Non-GAAP Financial Measures
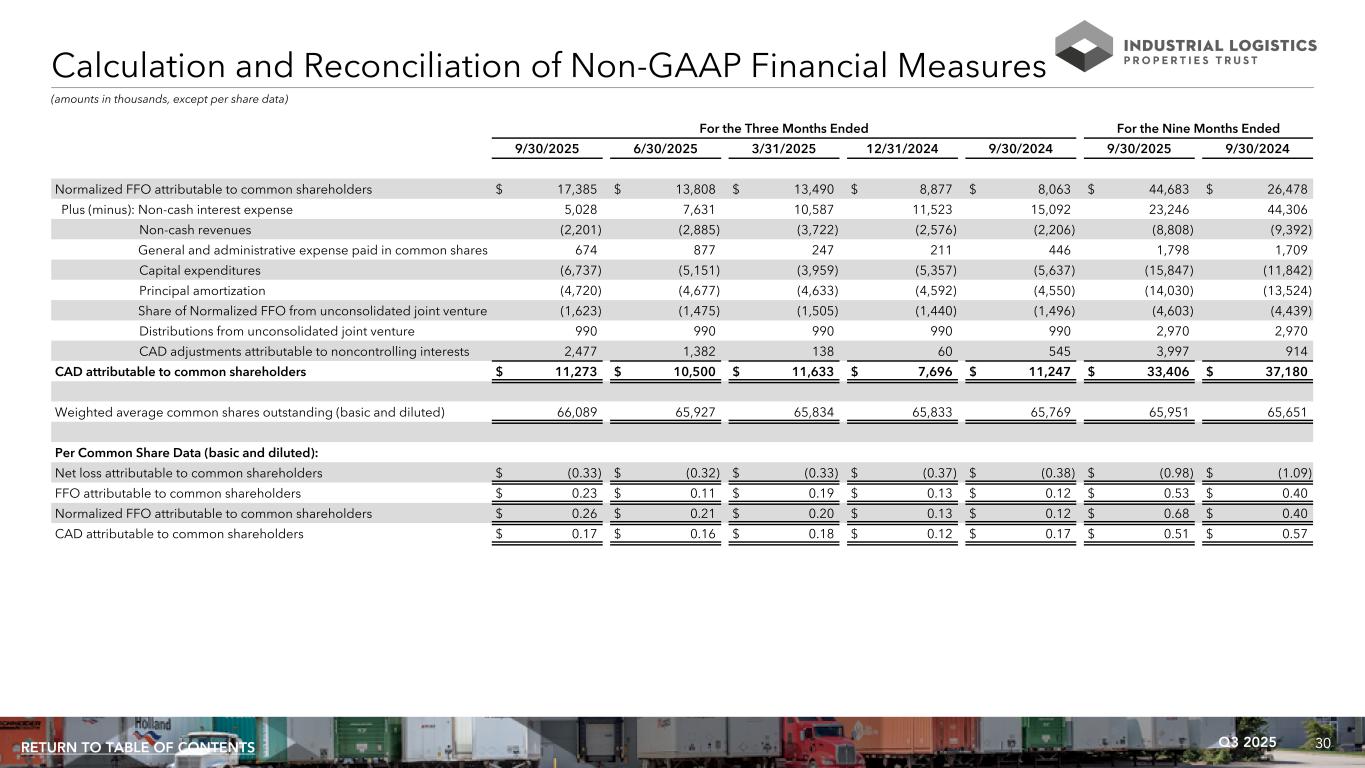
30Q3 2025RETURN TO TABLE OF CONTENTS (amounts in thousands, except per share data) For the Three Months Ended For the Nine Months Ended 9/30/2025 6/30/2025 3/31/2025 12/31/2024 9/30/2024 9/30/2025 9/30/2024 Normalized FFO attributable to common shareholders $ 17,385 $ 13,808 $ 13,490 $ 8,877 $ 8,063 $ 44,683 $ 26,478 Plus (minus): Non-cash interest expense 5,028 7,631 10,587 11,523 15,092 23,246 44,306 Non-cash revenues (2,201) (2,885) (3,722) (2,576) (2,206) (8,808) (9,392) General and administrative expense paid in common shares 674 877 247 211 446 1,798 1,709 Capital expenditures (6,737) (5,151) (3,959) (5,357) (5,637) (15,847) (11,842) Principal amortization (4,720) (4,677) (4,633) (4,592) (4,550) (14,030) (13,524) Share of Normalized FFO from unconsolidated joint venture (1,623) (1,475) (1,505) (1,440) (1,496) (4,603) (4,439) Distributions from unconsolidated joint venture 990 990 990 990 990 2,970 2,970 CAD adjustments attributable to noncontrolling interests 2,477 1,382 138 60 545 3,997 914 CAD attributable to common shareholders $ 11,273 $ 10,500 $ 11,633 $ 7,696 $ 11,247 $ 33,406 $ 37,180 Weighted average common shares outstanding (basic and diluted) 66,089 65,927 65,834 65,833 65,769 65,951 65,651 Per Common Share Data (basic and diluted): Net loss attributable to common shareholders $ (0.33) $ (0.32) $ (0.33) $ (0.37) $ (0.38) $ (0.98) $ (1.09) FFO attributable to common shareholders $ 0.23 $ 0.11 $ 0.19 $ 0.13 $ 0.12 $ 0.53 $ 0.40 Normalized FFO attributable to common shareholders $ 0.26 $ 0.21 $ 0.20 $ 0.13 $ 0.12 $ 0.68 $ 0.40 CAD attributable to common shareholders $ 0.17 $ 0.16 $ 0.18 $ 0.12 $ 0.17 $ 0.51 $ 0.57 Calculation and Reconciliation of Non-GAAP Financial Measures
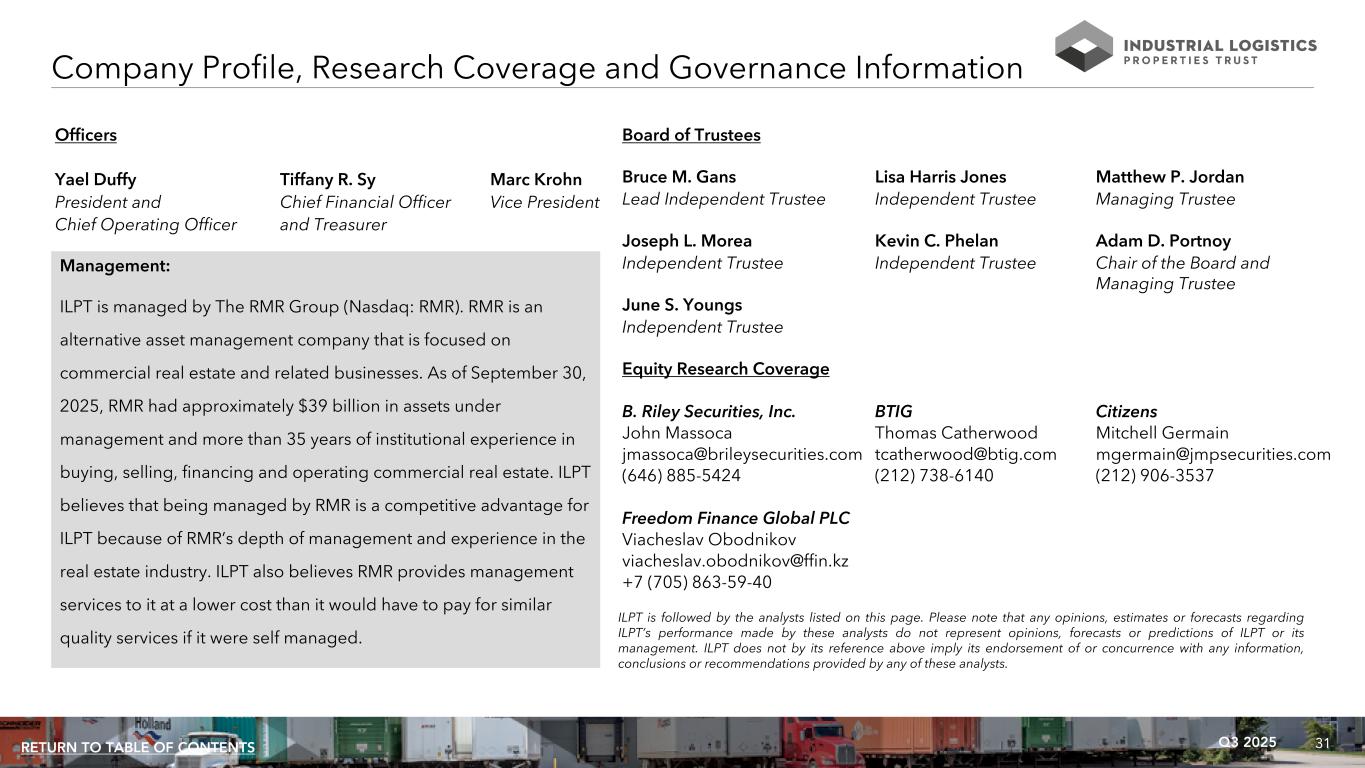
31Q3 2025RETURN TO TABLE OF CONTENTS Company Profile, Research Coverage and Governance Information Management: ILPT is managed by The RMR Group (Nasdaq: RMR). RMR is an alternative asset management company that is focused on commercial real estate and related businesses. As of September 30, 2025, RMR had approximately $39 billion in assets under management and more than 35 years of institutional experience in buying, selling, financing and operating commercial real estate. ILPT believes that being managed by RMR is a competitive advantage for ILPT because of RMR’s depth of management and experience in the real estate industry. ILPT also believes RMR provides management services to it at a lower cost than it would have to pay for similar quality services if it were self managed. Board of Trustees Bruce M. Gans Lisa Harris Jones Matthew P. Jordan Lead Independent Trustee Independent Trustee Managing Trustee Joseph L. Morea Kevin C. Phelan Adam D. Portnoy Independent Trustee Independent Trustee Chair of the Board and Managing Trustee June S. Youngs Independent Trustee Equity Research Coverage B. Riley Securities, Inc. BTIG Citizens John Massoca Thomas Catherwood Mitchell Germain jmassoca@brileysecurities.com tcatherwood@btig.com mgermain@jmpsecurities.com (646) 885-5424 (212) 738-6140 (212) 906-3537 Freedom Finance Global PLC Viacheslav Obodnikov viacheslav.obodnikov@ffin.kz +7 (705) 863-59-40 ILPT is followed by the analysts listed on this page. Please note that any opinions, estimates or forecasts regarding ILPT’s performance made by these analysts do not represent opinions, forecasts or predictions of ILPT or its management. ILPT does not by its reference above imply its endorsement of or concurrence with any information, conclusions or recommendations provided by any of these analysts. Officers Yael Duffy Tiffany R. Sy Marc Krohn President and Chief Financial Officer Vice President Chief Operating Officer and Treasurer
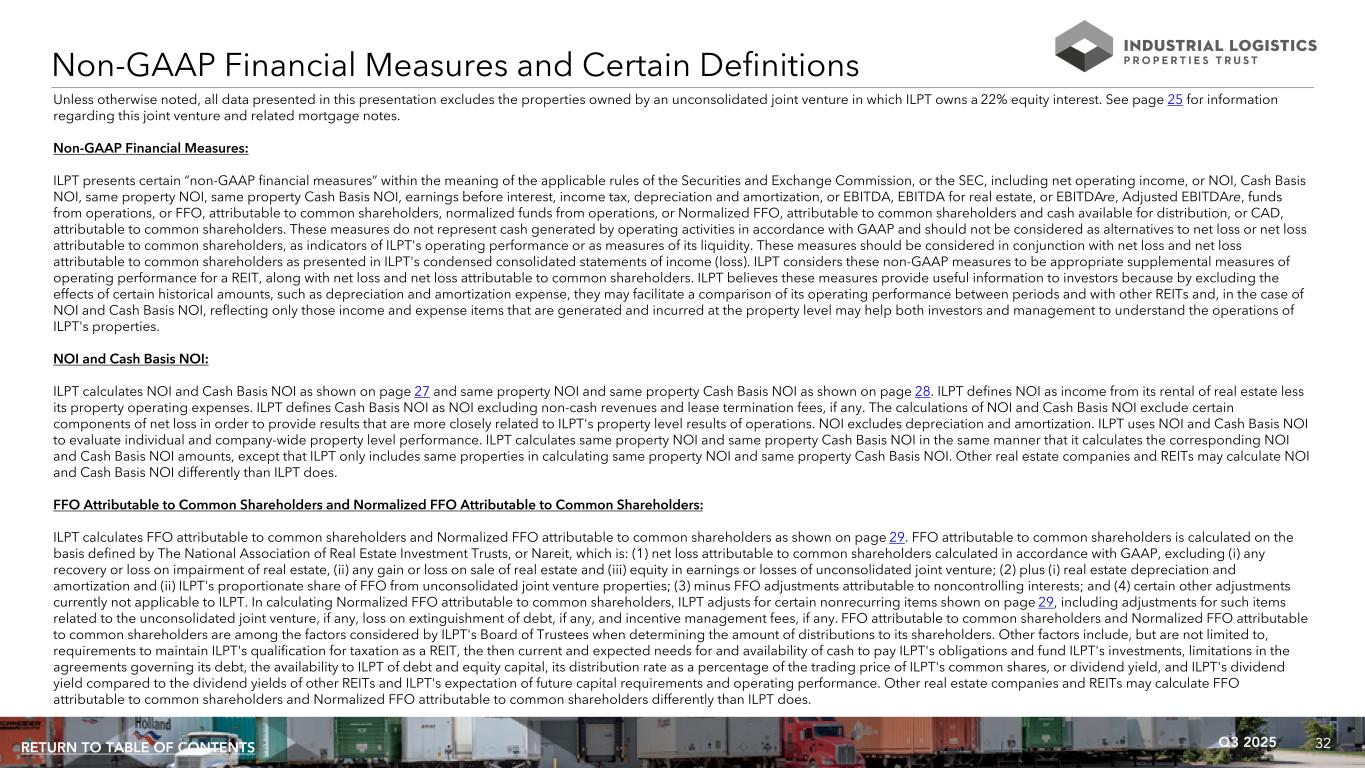
32Q3 2025RETURN TO TABLE OF CONTENTS Unless otherwise noted, all data presented in this presentation excludes the properties owned by an unconsolidated joint venture in which ILPT owns a 22% equity interest. See page 25 for information regarding this joint venture and related mortgage notes. Non-GAAP Financial Measures: ILPT presents certain “non-GAAP financial measures” within the meaning of the applicable rules of the Securities and Exchange Commission, or the SEC, including net operating income, or NOI, Cash Basis NOI, same property NOI, same property Cash Basis NOI, earnings before interest, income tax, depreciation and amortization, or EBITDA, EBITDA for real estate, or EBITDAre, Adjusted EBITDAre, funds from operations, or FFO, attributable to common shareholders, normalized funds from operations, or Normalized FFO, attributable to common shareholders and cash available for distribution, or CAD, attributable to common shareholders. These measures do not represent cash generated by operating activities in accordance with GAAP and should not be considered as alternatives to net loss or net loss attributable to common shareholders, as indicators of ILPT's operating performance or as measures of its liquidity. These measures should be considered in conjunction with net loss and net loss attributable to common shareholders as presented in ILPT's condensed consolidated statements of income (loss). ILPT considers these non-GAAP measures to be appropriate supplemental measures of operating performance for a REIT, along with net loss and net loss attributable to common shareholders. ILPT believes these measures provide useful information to investors because by excluding the effects of certain historical amounts, such as depreciation and amortization expense, they may facilitate a comparison of its operating performance between periods and with other REITs and, in the case of NOI and Cash Basis NOI, reflecting only those income and expense items that are generated and incurred at the property level may help both investors and management to understand the operations of ILPT's properties. NOI and Cash Basis NOI: ILPT calculates NOI and Cash Basis NOI as shown on page 27 and same property NOI and same property Cash Basis NOI as shown on page 28. ILPT defines NOI as income from its rental of real estate less its property operating expenses. ILPT defines Cash Basis NOI as NOI excluding non-cash revenues and lease termination fees, if any. The calculations of NOI and Cash Basis NOI exclude certain components of net loss in order to provide results that are more closely related to ILPT's property level results of operations. NOI excludes depreciation and amortization. ILPT uses NOI and Cash Basis NOI to evaluate individual and company-wide property level performance. ILPT calculates same property NOI and same property Cash Basis NOI in the same manner that it calculates the corresponding NOI and Cash Basis NOI amounts, except that ILPT only includes same properties in calculating same property NOI and same property Cash Basis NOI. Other real estate companies and REITs may calculate NOI and Cash Basis NOI differently than ILPT does. FFO Attributable to Common Shareholders and Normalized FFO Attributable to Common Shareholders: ILPT calculates FFO attributable to common shareholders and Normalized FFO attributable to common shareholders as shown on page 29. FFO attributable to common shareholders is calculated on the basis defined by The National Association of Real Estate Investment Trusts, or Nareit, which is: (1) net loss attributable to common shareholders calculated in accordance with GAAP, excluding (i) any recovery or loss on impairment of real estate, (ii) any gain or loss on sale of real estate and (iii) equity in earnings or losses of unconsolidated joint venture; (2) plus (i) real estate depreciation and amortization and (ii) ILPT's proportionate share of FFO from unconsolidated joint venture properties; (3) minus FFO adjustments attributable to noncontrolling interests; and (4) certain other adjustments currently not applicable to ILPT. In calculating Normalized FFO attributable to common shareholders, ILPT adjusts for certain nonrecurring items shown on page 29, including adjustments for such items related to the unconsolidated joint venture, if any, loss on extinguishment of debt, if any, and incentive management fees, if any. FFO attributable to common shareholders and Normalized FFO attributable to common shareholders are among the factors considered by ILPT's Board of Trustees when determining the amount of distributions to its shareholders. Other factors include, but are not limited to, requirements to maintain ILPT's qualification for taxation as a REIT, the then current and expected needs for and availability of cash to pay ILPT's obligations and fund ILPT's investments, limitations in the agreements governing its debt, the availability to ILPT of debt and equity capital, its distribution rate as a percentage of the trading price of ILPT's common shares, or dividend yield, and ILPT's dividend yield compared to the dividend yields of other REITs and ILPT's expectation of future capital requirements and operating performance. Other real estate companies and REITs may calculate FFO attributable to common shareholders and Normalized FFO attributable to common shareholders differently than ILPT does. Non-GAAP Financial Measures and Certain Definitions
33Q3 2025RETURN TO TABLE OF CONTENTS Non-GAAP Financial Measures and Certain Definitions (Continued) Cash Available for Distribution: ILPT calculates CAD as shown on page 30. ILPT defines CAD as Normalized FFO minus ILPT's proportionate share of Normalized FFO from unconsolidated joint venture properties, plus operating cash flow distributions received from ILPT's unconsolidated joint venture, recurring real estate related capital expenditures, adjustments for other non-cash and nonrecurring items, certain amounts excluded from Normalized FFO but settled in cash, excluding CAD adjustments attributable to noncontrolling interests, equity based compensation, and principal amortization, as well as certain other adjustments currently not applicable to ILPT. CAD is among the factors considered by ILPT's Board of Trustees when determining the amount of distributions to ILPT's shareholders. Other real estate companies and REITs may calculate CAD differently than ILPT does. EBITDA, EBITDAre and Adjusted EBITDAre: ILPT calculates EBITDA, EBITDAre and Adjusted EBITDAre as shown on page 29. EBITDAre is calculated on the basis defined by Nareit, which is EBITDA, including ILPT's proportionate share of EBITDAre from unconsolidated joint venture properties, and excluding any gain or loss on the sale of real estate, equity in earnings or losses of unconsolidated joint venture, recovery or loss on impairment of real estate, as well as certain other adjustments currently not applicable to ILPT. In calculating Adjusted EBITDAre, ILPT adjusts for the items shown on page 29. Other real estate companies and REITs may calculate EBITDA, EBITDAre and Adjusted EBITDAre differently than ILPT does. Pro-Rata Operating Information of Consolidated Joint Venture: ILPT believes this financial presentation of its consolidated joint venture information provides useful information to investors by providing additional insight into the financial performance of its consolidated joint venture, in which ILPT owns a 61% equity interest. This information may not accurately depict the impact of these investments in accordance with GAAP. Pro-rata information should not be considered in isolation or as a substitute for ILPT's condensed consolidated financial statements in accordance with GAAP. Certain Definitions: Annualized dividend yield - Annualized dividend yield is the annualized dividend paid during the applicable period divided by the closing price of ILPT's common shares at the end of the relevant period. Annualized rental revenues - Annualized rental revenues is the annualized contractual base rents from ILPT's tenants pursuant to its lease agreements as of the measurement date, including straight line rent adjustments and estimated recurring expense reimbursements to be paid to ILPT, and excluding lease value amortization. Building improvements - Building improvements generally include expenditures to replace obsolete building components and expenditures that extend the useful life of existing assets. GAAP - GAAP refers to U.S. generally accepted accounting principles. Gross book value of real estate assets - Gross book value of real estate assets is real estate assets at cost, plus certain acquisition related costs, if any, before depreciation and impairments, if any. ILPT Wholly Owned Properties - ILPT Wholly Owned Properties refers to 316 properties that are wholly owned by ILPT, including 226 buildings, leasable land parcels and easements containing approximately 16.7 million rentable square feet that are primarily industrial lands located on the island of Oahu, Hawaii, or the Hawaii Portfolio, and 90 properties containing approximately 22.1 million rentable square feet located in 34 other states, or the Mainland Portfolio. Information included in this presentation with respect to the Mainland Portfolio and the Hawaii Portfolio include certain allocations of interest expense on debts secured by properties in each portfolio and of general and administrative expense based upon the gross asset value of properties in each portfolio. ILPT believes the information presented for these portfolios is useful to investors to provide insight into the financial performance of these portfolios.
34Q3 2025RETURN TO TABLE OF CONTENTS Incentive management fees - Incentive management fees are estimated and accrued during the applicable measurement period. Actual incentive management fees will be calculated based on common share total return, as defined in ILPT's business management agreement, for the three year period ending December 31 of the applicable calendar year, are included in general and administrative expenses in ILPT's condensed consolidated statements of comprehensive income (loss) and will be payable to RMR in January of the following calendar year. Leased square feet - Leased square feet is pursuant to existing leases as of September 30, 2025, and includes space being fitted out for occupancy, if any, and space which is leased but is not occupied, if any. Leasing costs - Leasing costs include leasing related costs, such as brokerage commissions and tenant inducements. Leasing costs and concession commitments - Leasing costs and concession commitments include commitments made for leasing expenditures and concessions, such as tenant improvements, leasing commissions, tenant reimbursements and free rent. Mountain JV - Mountain Industrial REIT LLC, or Mountain JV, owns 94 mainland properties containing approximately 21.0 million rentable square feet located in 27 states. ILPT owns a 61% equity interest in this joint venture. ILPT consolidates 100% of this joint venture in its financial statements in accordance with GAAP. Net debt - Net debt is the total outstanding principal of ILPT's debt less cash and cash equivalents and restricted cash and cash equivalents. Non-cash interest expense - Non-cash interest expense includes the amortization of debt discounts, premiums, issuance costs and interest rate caps. Non-cash revenues - Non-cash revenues include lease value amortization and straight line rent adjustments, if any. Percent change in GAAP rent - Percent change in GAAP rent is the percent change from prior rents charged for same space. Rents include estimated recurring expense reimbursements and exclude lease value amortization. Same space represents the same land area and building area (with leasing rates for vacant space based upon the most recent rental rate for the same space). Rentable square feet - Represents total square feet available for lease as of the measurement date. Square footage measurements are subject to changes when space is remeasured or reconfigured for new tenants. Rolling four quarter CAD - Represents CAD for the preceding twelve month period as of the respective quarter end date. Same property - For the three months ended September 30, 2025 and 2024, same property results include properties that ILPT owned continuously since July 1, 2024, and excludes three properties classified as held for sale as of September 30, 2025. For the nine months ended September 30, 2025 and 2024, same property results include properties that ILPT owned continuously since January 1, 2024, and excludes three properties classified as held for sale as of September 30, 2025. SOFR - SOFR is the secured overnight financing rate. Tenant improvements - Tenant improvements include capital expenditures used to improve tenants' space or amounts paid directly to tenants to improve their space. Total gross assets - Total gross assets is total assets plus accumulated depreciation. Total market capitalization - Total market capitalization is the total principal amount of debt plus the market value of ILPT's common shares at the end of the applicable period. Non-GAAP Financial Measures and Certain Definitions (Continued)
35Q3 2025RETURN TO TABLE OF CONTENTS Warning Concerning Forward-Looking Statements This presentation contains forward-looking statements within the meaning of the Private Securities Litigation Reform Act of 1995 and other securities laws that are subject to risks and uncertainties. These statements may include words such as “believe”, “expect”, “anticipate”, “intend”, “plan”, “estimate”, “will”, “may” and negatives or derivatives of these or similar expressions. These forward-looking statements include, among others, statements about: operating fundamentals of ILPT’s portfolio; demand for ILPT’s properties; ILPT’s leasing activity; ILPT's ability to achieve organic cash flow growth and maintain portfolio stability; ILPT’s potential property dispositions; debt maturities; Mountain JV's potential exercise of the extension option for the maturity date of its floating rate loan; and ILPT’s capital expenditure plans and commitments. Forward-looking statements reflect ILPT’s current expectations, are based on judgments and assumptions, are inherently uncertain and are subject to risks, uncertainties and other factors, which could cause ILPT’s actual results, performance or achievements to differ materially from expected future results, performance or achievements expressed or implied in those forward-looking statements. Some of the risks, uncertainties and other factors that may cause its actual results, performance or achievements to differ materially from those expressed or implied by forward-looking statements include, but are not limited to, the following: whether ILPT's tenants will renew or extend their leases or whether ILPT will obtain replacement tenants on terms as favorable to it as the terms of its existing leases; ILPT's ability to successfully compete for tenancies, the likelihood that the rents it realizes will increase when ILPT renews or extends its leases, enters new leases, or its rents reset at ILPT’s properties located in Hawaii; ILPT’s ability to maintain high occupancy at its properties; ILPT’s ability to reduce its leverage, generate cash flow and take advantage of mark-to-market leasing opportunities; ILPT's ability to cost-effectively raise and balance its use of debt or equity capital; ILPT’s ability to pay interest on and principal of its debt; ILPT’s ability to purchase cost effective interest rate caps; ILPT's expected capital expenditures and leasing costs; ILPT’s ability to maintain sufficient liquidity; demand for industrial and logistics properties; competition within the commercial real estate industry, particularly for industrial and logistics properties in those markets in which ILPT’s properties are located; ILPT's tenant and geographic concentrations; whether the industrial and logistics sector and the extent to which ILPT's tenants' businesses are critical to sustaining a resilient supply chain and that ILPT's business will benefit as a result; ILPT’s ability and the ability of its tenants to operate under unfavorable market and commercial real estate industry conditions, due to uncertainties surrounding interest rates and inflation, impacts of or changes to tariffs or trading policies, supply chain disruptions, emerging technologies, volatility in the public equity and debt markets, pandemics, geopolitical instability and tensions, any U.S. government shutdowns, economic downturns or a possible recession, labor market conditions or changes in real estate utilization; ILPT’s tenants’ ability and willingness to pay their rent obligations to ILPT; the credit qualities of ILPT’s tenants; changes in the security of cash flows from ILPT’s properties; potential defaults of ILPT's leases by its tenants; ILPT’s ability to pay distributions to its shareholders and to increase or sustain the amount of such distributions; ILPT’s ability to sell properties at prices or returns it targets, and the timing of such sales; ILPT's ability to complete sales without delay, or at all, pursuant to existing agreement terms; ILPT’s ability to sell additional equity interests in, or contribute additional properties to, its existing joint ventures, to enter into additional real estate joint ventures or to attract co-venturers and benefit from its existing joint ventures or any real estate joint ventures ILPT may enter into; ILPT’s ability to prudently pursue, and successfully and profitably complete, expansion and renovation projects at its properties and to realize its expected returns on those projects; risks and uncertainties regarding the development, redevelopment or repositioning of ILPT’s properties, including as a result of inflation, cost overruns, tariffs, supply chain challenges, labor market conditions, construction delays or ILPT's inability to obtain necessary permits; ILPT’s ability to lease space at these properties at targeted returns and volatility in the commercial real estate markets; non-performance by the counterparty to ILPT's interest rate cap; the ability of ILPT’s manager, RMR, to successfully manage it; changes in environmental laws or in their interpretations or enforcement as a result of climate change or otherwise, or ILPT’s incurring environmental remediation costs or other liabilities; compliance with, and changes to, federal, state and local laws and regulations, accounting rules, tax laws and similar matters; limitations imposed by and ILPT’s ability to satisfy complex rules to maintain its qualification for taxation as a REIT for U.S. federal income tax purposes; actual and potential conflicts of interest with ILPT’s related parties, including its managing trustees, RMR and others affiliated with them; acts of terrorism, outbreaks of pandemics or other public health safety events or conditions, war or other hostilities, global climate change or other manmade or natural disasters beyond ILPT's control; and other matters. These risks, uncertainties and other factors are not exhaustive and should be read in conjunction with other cautionary statements that are included in ILPT’s periodic filings. The information contained in ILPT’s filings with the SEC, including under the caption “Risk Factors” in ILPT’s periodic reports, or incorporated therein, identifies important factors that could cause differences from ILPT’s forward-looking statements in this presentation. ILPT’s filings with the SEC are available on the SEC’s website at www.sec.gov. You should not place undue reliance upon ILPT’s forward-looking statements. Except as required by law, ILPT does not intend to update or change any forward-looking statements as a result of new information, future events or otherwise.