The information in this preliminary prospectus supplement is not complete and may be changed. This preliminary prospectus supplement and the accompanying prospectus are not an offer to sell these securities and are not soliciting an offer to buy these securities in any jurisdiction where the offer and sale is not permitted.
Filed Pursuant to Rule 424(b)(5)
Registration No. 333-293530, 333-293530-01 and 333-293530-02
SUBJECT TO COMPLETION
PRELIMINARY PROSPECTUS SUPPLEMENT, DATED SEPTEMBER 15, 2026
PRELIMINARY PROSPECTUS SUPPLEMENT, DATED SEPTEMBER 15, 2026
Prospectus Supplement
(To Prospectus Dated February 17, 2026)
(To Prospectus Dated February 17, 2026)
$
HOFFMAN SCHROFF HOLDINGS, INC.
% Senior Notes due 20
Fully and Unconditionally and Jointly and Severally Guaranteed by
NVENT ELECTRIC PLC
NVENT FINANCE S.À R.L.
Hoffman Schroff Holdings, Inc. (“Hoffman Schroff”) is offering $ aggregate principal amount of % Senior Notes due 20 (the “notes”).
The notes will bear interest at a rate of % per year, payable semi-annually on and of each year, beginning on , 2027. The interest rate payable on the notes will be subject to adjustment based on certain rating events. See “Description of Notes — Interest Rate Adjustment of the Notes Based on Certain Rating Events.”
Hoffman Schroff may redeem any of the notes at the redemption price set forth in this prospectus supplement, plus accrued and unpaid interest to, but excluding, the redemption date. If we experience a change of control triggering event, we may be required to offer to purchase the notes from holders. See “Description of Notes — Change of Control.” In addition, the notes may be redeemed in whole but not in part, at any time at our option, in the event of certain developments affecting U.S. taxation. See “Description of Notes — Payment of Additional Amounts and Redemption upon Changes in Withholding Taxes.”
The notes are primarily being issued to finance the previously announced acquisition by nVent Electric plc (“nVent”) of Maverick Power (as defined herein). This offering is not contingent upon, and may be settled before, the consummation of the Maverick Power acquisition (as defined herein). However, if (a) the consummation of the Maverick Power acquisition does not occur on or prior to November 20, 2026 (or such later date on or before February 19, 2027 as extended by the parties to the Purchase Agreement (as defined herein) pursuant to the terms and conditions set forth therein, the “outside date”), (b) Hoffman Schroff notifies the trustee and the holders of the notes that in its reasonable judgment the Maverick Power acquisition will not be consummated on or prior to the outside date or (c) the Purchase Agreement has been terminated without the consummation of the Maverick Power acquisition, then Hoffman Schroff will be required to redeem all of the notes then outstanding on the Special Mandatory Redemption Date (as defined herein) at a special mandatory redemption price equal to 101% of the aggregate principal amount of the notes then outstanding plus accrued and unpaid interest, if any, to, but excluding, the Special Mandatory Redemption Date, as described under the heading “Description of Notes — Special Mandatory Redemption” in this prospectus supplement.
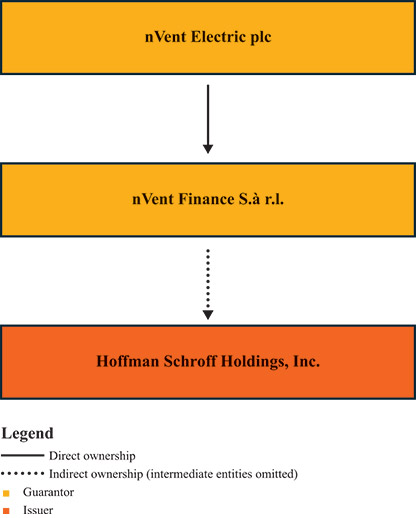
The notes will be unsecured and will rank equally with Hoffman Schroff’s other existing and future senior unsecured and unsubordinated debt. Payment of principal and interest on the notes will be fully and unconditionally and jointly and severally guaranteed as to the due and punctual payment of the principal of, premium, if any, and interest and any Additional Amounts (as defined herein), if any, on the notes when and as the same shall become due and payable, whether at maturity, upon redemption or otherwise, by nVent and nVent Finance S.à r.l. (“nVent Finance”).
The notes will be issued in minimum denominations of $2,000 and integral multiples of $1,000 in excess thereof.
We do not intend to apply for a listing of the notes on any securities exchange or automated quotation system. Currently there is no public market for the notes.
Investing in the notes involves risks. See “Risk Factors” beginning on page S-13 of this prospectus supplement for important factors you should consider before investing in the notes.
Neither the Securities and Exchange Commission nor any state securities commission has approved or disapproved of these securities or determined if this prospectus supplement or the accompanying prospectus to which it relates is truthful or complete. Any representation to the contrary is a criminal offense.
Neither this prospectus supplement nor the accompanying prospectus is a prospectus for the purposes of the EU Prospectus Regulation (as defined below) or the Luxembourg law dated 16 July 2019 on prospectuses for securities (Loi du 16 juillet 2019 relative aux prospectus pour valeurs mobilières).
| | | |
Per Note
|
| |
Total
|
| ||||||
|
Public offering price(1)
|
| | | | % | | | | | $ | | | |
|
Underwriting discount
|
| | | | % | | | | | $ | | | |
|
Proceeds, before expenses, to Hoffman Schroff
|
| | | | % | | | | | $ | | | |
(1)
Plus accrued interest from , 2026, if settlement occurs after that date.
The underwriters expect to deliver the notes through the book-entry delivery system of The Depository Trust Company and its direct and indirect participants, including Clearstream Banking, société anonyme, and Euroclear Bank S.A./N.V., on or about , 2026, which is the tenth business day following the date of this prospectus supplement. Purchasers of the notes should note that trading of the notes may be affected by this settlement date. See “Underwriting” beginning on page S-49 of this prospectus supplement.
Joint Book-Running Managers
| | BofA Securities | | |
Citigroup
|
| |
J.P. Morgan
|
|
| |
BMO Capital Markets
|
| |
US Bancorp
|
|
The date of this prospectus supplement is , 2026.