Please wait
UNITED STATES
SECURITIES AND EXCHANGE COMMISSION
Washington, D.C. 20549
FORM 10-K
|
|
ANNUAL REPORT PURSUANT TO SECTION 13 OR 15(d) |
OF THE SECURITIES EXCHANGE ACT OF 1934 |
For the fiscal year ended December 31, 2018
Commission file number 001-38414
SPIRIT MTA REIT
(Exact name of registrant as specified in its charter)
|
| | | | |
Maryland | | | | 82-6712510 |
(State or other jurisdiction of incorporation or organization) | | | | (I.R.S. Employer Identification Number) |
| | | | |
2727 North Harwood Street, Suite 300, Dallas, Texas 75201 | | | | (972) 476-1409 |
(Address of principal executive offices; zip code) | | | | (Registrant’s telephone number, including area code) |
Securities registered pursuant to Section 12(b) of the Act:
|
| | | |
Title of each class: | | | Name of exchange on which registered: |
Common Shares of Beneficial Interest, par value $0.01 per share | | | New York Stock Exchange |
Securities registered pursuant to Section 12(g) of the Act: None.
Indicate by check mark if the registrant is a well-known seasoned issuer, as defined in Rule 405 of the Securities Act. Yes o No x
Indicate by check mark if the registrant is not required to file reports pursuant to Section 13 or Section 15(d) of the Act. Yes o No x
Indicate by check mark whether the registrant (1) has filed all reports required to be filed by Section 13 or 15(d) of the Securities Exchange Act of 1934 during the preceding 12 months (or for such shorter period that the registrant was required to file such reports), and (2) has been subject to such filing requirements for the past 90 days. Yes x No o
Indicate by check mark whether the registrant has submitted electronically every Interactive Data File required to be submitted pursuant to Rule 405 of Regulation S-T (§ 232.405 of this chapter) during the preceding 12 months (or for such shorter period that the registrant was required to submit such files). Yes x No o
Indicate by check mark if disclosure of delinquent filers pursuant to Item 405 of Regulation S-K (§ 229.405 of this chapter) is not contained herein, and will not be contained, to the best of registrant’s knowledge, in definitive proxy or information statements incorporated by reference in Part III of this Form 10-K or any amendment to this Form 10-K. x
Indicate by check mark whether the registrant is a large accelerated filer, an accelerated filer, a non-accelerated filer, a smaller reporting company, or an emerging growth company. See the definitions of “large accelerated filer,” “accelerated filer,” “smaller reporting company,” and "emerging growth company" in Rule 12b-2 of the Exchange Act.
|
| | | | | | | |
Large accelerated filer | o | Accelerated filer | o | Non-accelerated filer | x | Smaller reporting company | o |
Emerging growth company | x | | | | | | |
If an emerging growth company, indicate by check mark if the registrant has elected not to use the extended transition period for complying with any new or revised financial accounting standards provided pursuant to Section 13(a) of the Exchange Act. o
Indicate by check mark whether the registrant is a shell company (as defined in Rule 12b-2 of the Exchange Act). Yes o No x
As of June 29, 2018 (the last business day of the registrant’s most recently completed second fiscal quarter), the aggregate market value of Spirit MTA REIT's common shares, $0.01 par value, held by non-affiliates of the Registrant, was $441.4 million based on the last reported sale price of $10.30 per share on the New York Stock Exchange on June 29, 2018.
The number of outstanding shares of Spirit MTA REIT's common shares, $0.01 par value, as of March 19, 2019, was 43,085,751 shares.
Documents Incorporated by Reference
Certain specific portions of the definitive Proxy Statement for Spirit MTA REIT's 2019 Annual Meeting of Shareholders to be filed pursuant to Regulation 14A are incorporated by reference into Part III, Items 10, 11, 12, 13 and 14 of this Annual Report on Form 10-K. Only those portions of the Proxy Statement which are specifically incorporated by reference herein shall constitute a part of this Annual Report on Form 10-K.
EXPLANATORY NOTE
This annual report of Spirit MTA REIT includes the financial information of the Company as of December 31, 2018 and December 31, 2017 and for the years ended December 31, 2018, 2017 and 2016.
On May 31, 2018, the distribution date, Spirit Realty Capital, Inc. completed the previously announced Spin-Off of the assets that collateralize Master Trust 2014, all of its properties leased to Shopko, and certain other assets into an independent, publicly traded REIT, Spirit MTA REIT. The Spin-Off was effected by means of a pro rata distribution of one SMTA common share for every ten shares of Spirit common stock held by each of Spirit's stockholders as of May 18, 2018, the record date.
The accompanying financial statements include the consolidated accounts of the Company and its wholly-owned subsidiaries for the period subsequent to the Spin-Off on May 31, 2018. The pre-spin financial statements were prepared on a carve-out basis and reflect the combined net assets and operations of the predecessor legal entities for periods prior to the Spin-Off which formed the Company at the time of the Spin-Off. Accordingly, the results of operations for the years ended December 31, 2018, 2017 and 2016 reflect the aggregate operations and changes in cash flows and equity on a combined basis for all periods prior to May 31, 2018 and on a consolidated basis for all periods subsequent to May 31, 2018. The discussion of our results of operations, cash flows and financial condition set forth in this report is not necessarily indicative of the future results of operations, cash flows or financial condition as an independent, publicly traded company.
GLOSSARY
|
| |
2017 Tax Legislation | Tax Cuts and Jobs Act |
2018 Incentive Award Plan | Spirit MTA REIT and Spirit MTA REIT, L.P. 2018 Incentive Award Plan |
ACM | Asbestos-containing materials |
ADA | Americans with Disabilities Act |
Adjusted Debt | Adjusted Debt is a non-GAAP financial measure. See definition in Item 6. Selected Financial Data. |
Adjusted EBITDAre | Adjusted EBITDAre is a non-GAAP financial measure. See definition in Item 6. Selected Financial Data. |
AFFO | Adjusted Funds From Operations is a non-GAAP financial measure. See definition in Item 6. Selected Financial Data. |
ASC | Accounting Standards Codification |
Asset Management Agreement | Asset Management Agreement between Spirit Realty, L.P. and Spirit MTA REIT dated May 31, 2018 |
ASU | Accounting Standards Update |
CMBS | Commercial mortgage-backed securities |
Code | Internal Revenue Code of 1986, as amended |
Collateral Pool | Pool of collateral assets that are pledged to the indenture trustee for the benefit of the noteholders and secure obligations of issuers under Master Trust 2014 |
Contractual Rent | Monthly contractual cash rent, excluding percentage rents, from properties owned fee-simple or ground leased, recognized during the final month of the reporting period, adjusted to exclude amounts received from properties sold during that period and adjusted to include a full month of contractual rent for properties acquired during that period. We use Contractual Rent when calculating certain metrics that are useful to evaluate portfolio credit, asset type, industry, and geographic diversity and to manage risk. |
CPI | Consumer Price Index |
EBITDA | Earnings Before Interest, Taxes, Depreciation and Amortization |
EBITDAR | EBITDAR is a non-GAAP financial measure defined as Earnings Before Interest, Taxes, Depreciation, Amortization and Rent |
EBITDAre | EBITDAre is a non-GAAP financial measure and is computed in accordance with standards established by NAREIT. See definition in Item 6. Selected Financial Data. |
EDF | Expected Default Frequency |
Exchange Act | Securities Exchange Act of 1934, as amended |
FASB | Financial Accounting Standards Board |
FFO | Funds From Operations. See definition in Item 6. Selected Financial Data. |
GAAP | Generally Accepted Accounting Principles in the United States |
LIBOR | London Interbank Offered Rate |
Liquidity Reserve | Cash held on deposit until there is a cashflow shortfall as defined in the Master Trust 2014 agreements or a liquidation of Master Trust 2014 occurs |
Manager | Spirit Realty, L.P., a wholly-owned subsidiary of Spirit |
Master Trust 2014 | The asset-backed securitization trust established in 2005, and amended and restated in 2014, which issues non-recourse net-lease mortgage notes collateralized by commercial real estate, net-leases and mortgage loans from time to time. Indirect special purpose entity subsidiaries of the Company are the borrowers. |
MGCL | Maryland General Corporation Law |
|
| |
NAREIT | National Association of Real Estate Investment Trusts |
NYSE | New York Stock Exchange |
Occupancy | The number of economically yielding owned properties divided by total owned properties |
Other Properties | One of two reportable segments consisting of all properties not included in the Master Trust 2014 Collateral Pool |
Properties | Owned properties and mortgage loans receivable secured by properties |
Property Management and Servicing Agreement | Second amended and restated agreement governing the management services and special services provided to Master Trust 2014 by Spirit Realty, L.P., dated as of May 20, 2014, as amended, supplemented, amended and restated or otherwise modified |
Real Estate Investment Value | The gross acquisition cost, including capitalized transaction costs, plus improvements and less impairments, if any |
REIT | Real Estate Investment Trust |
Release Account | Proceeds from the sale of assets securing Master Trust 2014 held in a restricted account until a qualifying substitution is made or the funds are applied as prepayment of principal |
Separation and Distribution Agreement | Separation and Distribution Agreement between Spirit Realty Capital, Inc. and Spirit MTA REIT dated May 21, 2018 |
SEC | Securities and Exchange Commission |
Shopko | Shopko Stores Inc. and its affiliates and subsidiaries, including Specialty Retail Shops Holding Corp. |
Shopko B-1 Term Loan | The secured loan made to Shopko in the initial principal amount of $35.0 million |
Shopko CMBS Loan Agreements | The combination of the non-recourse mortgage loan agreement, establishing an aggregate loan amount of $125.0 million, and the mezzanine loan agreement, establishing an aggregate loan amount of $40.0 million |
Shopko Lenders | An institutional lender and certain other lenders from time to time party to the Shopko CMBS Loan Agreements |
SMTA | Spirit MTA REIT |
Spin-Off | Creation of an independent, publicly traded REIT, SMTA, through the a pro rata distribution of one SMTA common share for every ten shares of Spirit common stock held by each of Spirit's stockholders as of May 18, 2018, the record date |
Spirit | Spirit Realty Capital, Inc. |
SubREIT | Spirit MTA SubREIT, Inc., a wholly-owned subsidiary of SMTA |
TRS | Taxable REIT Subsidiary, a corporation, other than a REIT, in which a REIT directly or indirectly holds stock or shares, and that has made a joint election with such REIT to be treated as a taxable REIT subsidiary |
U.S. | United States of America |
Vacant | Owned properties that are not economically yielding |
VFN | Variable funding notes |
Unless otherwise indicated or unless the context requires otherwise, all references to the "Company," "Spirit MTA REIT," “SMTA,” "we," "us" or "our" refer to Spirit MTA REIT and its wholly-owned subsidiaries.
INDEX
|
| | |
PART I | | |
Item 1. | Business | |
Item 1A. | Risk Factors | |
Item 1B. | Unresolved Staff Comments | |
Item 2. | Properties | |
Item 3. | Legal Proceedings | |
Item 4. | Mine Safety Disclosure | |
PART II | | |
Item 5. | Market for Registrant’s Common Equity, Related Stockholder Matters and Issuer Purchases of Equity Securities | |
Item 6. | Selected Financial Data | |
Item 7. | Management’s Discussion and Analysis of Financial Condition and Results of Operations | |
Item 7A. | Quantitative and Qualitative Disclosures About Market Risk | |
Item 8. | Financial Statements and Supplementary Data | |
PART III | | |
Item 9. | Changes in and Disagreements with Accountants on Accounting and Financial Disclosure | |
Item 9A. | Controls and Procedures | |
Item 9B. | Other Information | |
Item 10. | Trustees, Executive Officers and Corporate Governance | |
Item 11. | Executive Compensation | |
Item 12. | Security Ownership of Certain Beneficial Owners and Management and Related Stockholder Matters | |
Item 13. | Certain Relationships and Related Transactions, and Trustee Independence | |
Item 14. | Principal Accountant Fees and Services | |
PART IV | | |
Item 15. | Exhibits, Financial Statement Schedules | |
SIGNATURES | | |
PART I
SPECIAL NOTE REGARDING FORWARD-LOOKING STATEMENTS
This Annual Report on Form 10-K contains forward-looking statements within the meaning of Section 27A of the Securities Act of 1933 (the “Securities Act”) and Section 21E of the Securities Exchange Act of 1934 (the “Exchange Act”). When used in this Annual Report on Form 10-K, the words “estimate,” “anticipate,” “expect,” “believe,” “intend,” “may,” “will,” “should,” “seek,” “approximately” or “plan,” or the negative of these words or similar words or phrases that are predictions of or indicate future events or trends and which do not relate solely to historical matters are intended to identify forward-looking statements. You can also identify forward-looking statements by discussions of strategy, plans or intentions of management.
Forward-looking statements involve numerous risks and uncertainties and you should not rely on them as predictions of future events. Forward-looking statements depend on assumptions, data or methods which may be incorrect or imprecise and we may not be able to realize them. We do not guarantee that the transactions and events described will happen as described (or that they will happen at all).
The following risks and uncertainties, among others, could cause actual results and future events to differ materially from those set forth or contemplated in the forward-looking statements:
| |
• | our success in pursuing and executing on strategic alternatives to maximize shareholder value; |
| |
• | industry and economic conditions; |
| |
• | the financial performance of our retail tenants and the demand for retail space, particularly with respect to challenges being experienced by general merchandise retailers; |
| |
• | the impact of any financial, accounting, legal or regulatory issues, bankruptcy or litigation that may affect us or our major tenants, in particular the bankruptcy petition of Shopko; |
| |
• | the nature and extent of future competition; |
| |
• | increases in our costs of borrowing as a result of changes in interest rates and other factors; |
| |
• | our ability to pay down, refinance, restructure and/or extend our indebtedness as it becomes due; |
| |
• | our ability and willingness to renew our leases upon expiration and to reposition our properties on the same or better terms upon expiration in the event such properties are not renewed by tenants or we exercise our rights to replace existing tenants upon default; |
| |
• | our ability to manage our operations; |
| |
• | our ability and willingness to maintain our qualification as a REIT; |
| |
• | our relationship with our Manager and its ability to retain qualified personnel; |
| |
• | potential conflicts of interest with our Manager or Spirit; |
| |
• | our ability to achieve the intended benefits from our Spin-Off from Spirit; and |
| |
• | other risks inherent in the real estate business, including tenant defaults, potential liability relating to environmental matters, illiquidity of real estate investments and potential damages from natural disasters. |
You are cautioned not to place undue reliance on forward-looking statements, which speak only as of the date of this Annual Report on Form 10-K. While forward-looking statements reflect our good faith beliefs, they are not guarantees of future performance. We disclaim any obligation to publicly update or revise any forward-looking statement to reflect changes in underlying assumptions or factors, new information, data or methods, future events or other changes, except as required by law.
Available Information
The Company's principal executive offices are located at 2727 North Harwood Street, Suite 300, Dallas, Texas 75201. Our telephone number at that location is 972-476-1409. We maintain a website at www.spiritmastertrust.com. On the Investor Relations page of our website, we post the following filings as soon as reasonably practicable after they are electronically filed with or furnished to the SEC: our Annual Report on Form 10-K, our Quarterly Reports on Form 10-Q, our Current Reports on Form 8-K, and the Section 16 filings of our directors and officers, as well as any amendments to those reports filed or furnished pursuant to Section 13(a) or 15(d) of the Exchange Act. All such filings on our Investor Relations page of our website are available to be viewed free of charge. Also available on our website, free of charge, are our corporate governance guidelines, the charters of the related party transaction, nominating and corporate
governance, audit and compensation committees of our Board of Trustees and our code of business conduct and ethics (which applies to all directors and our principal executive officer).
Information contained on or hyperlinked from our website is not incorporated by reference into and should not be considered part of this Annual Report on Form 10-K or our other filings with the SEC. Our common shares are listed on the NYSE under the symbol “SMTA.”
Item 1. Business
THE COMPANY
We operate as an externally managed REIT formed in Maryland that invests in and manages a portfolio of single-tenant, operationally essential real estate throughout the U.S. that is generally leased on a long-term, triple-net basis to tenants operating within retail, office, and industrial property types.
We began operations through predecessor legal entities which were wholly-owned subsidiaries of Spirit. On May 31, 2018, Spirit completed the Spin-Off that resulted in our establishment as an independent, publicly traded company. The Spin-Off was effected by means of a pro rata distribution of SMTA common shares to Spirit shareholders of record as of the close of business on the record date of May 18, 2018. In conjunction with the Spin-Off, we and our Manager, a wholly-owned subsidiary of Spirit, entered into an Asset Management Agreement under which our Manager provides external management of SMTA for a flat rate of $20 million per annum. As of December 31, 2018, we had no employees.
Our portfolio currently includes (i) Master Trust 2014, an asset-backed securitization trust which issues non-recourse asset-backed securities collateralized by commercial real estate, net-leases and mortgage loans, (ii) a portfolio of properties leased to Shopko encumbered with CMBS debt under the Shopko CMBS Loan Agreements, subject to the Shopko bankruptcy filing and subsequent foreclosure on the CMBS debt as discussed elsewhere in this Annual Report, (iii) a single distribution center property leased to a sporting goods tenant encumbered with CMBS debt, and (iv) a portfolio of 14 unencumbered properties. As of December 31, 2018, our gross investment in real estate and loans totaled approximately $2.56 billion, representing investments in 876 owned properties (788 excluding properties leased to Shopko) and eight properties securing our mortgage loans. See Item 2. "Properties" for further information on our properties and tenants.
RECENT DEVELOPMENTS
Shopko Bankruptcy Filing
On January 16, 2019, Shopko, our largest tenant, filed a petition for relief under chapter 11 of title 11 of the United States Code (the “Bankruptcy Code”). As of December 31, 2018, we received $42.1 million in annualized Contractual Rent from Shopko, which represented 17.9% of our total annualized Contractual Rent. As a consequence of the bankruptcy filing and the subsequent foreclosure by the Shopko Lenders on the majority of our Shopko assets, we do not expect to receive any additional cash flow going forward from any of the assets leased to Shopko, nor bear further meaningful expenses related to those assets. On March 18, 2019, Shopko announced that it would seek to liquidate its operations.
We also hold a secured loan previously made to Shopko with principal outstanding of $34.4 million as of December 31, 2018 (the "Shopko B-1 Term Loan"). While the outcome of the Shopko bankruptcy filing is uncertain and there can be no assurances that we will recover any amounts due to us under the Shopko B-1 Term Loan, we intend to pursue all of our rights and remedies in connection with the bankruptcy proceedings, with the goal of maximizing the receipt of amounts due to us under the Shopko B-1 Term loan.
Strategy Update
On January 16, 2019, in connection with Shopko filing for relief under Chapter 11 of the Bankruptcy Code, we announced that our Board of Trustees had elected to accelerate our strategic plan by initiating a process to explore strategic alternatives focused on maximizing shareholder value. Strategic alternatives to be considered may include, but are not limited to, a sale of the Company or the Master Trust 2014, a merger, the sale of the single distribution center property and other non-core assets, and the maximizing of recoveries in connection with the Shopko bankruptcy. We have not set a timetable for completion of the execution of any portion of this strategic plan, and there can be no assurance that the exploration of strategic alternatives will result in any transaction or other alternative.
Recent Financings
Shopko CMBS
On November 1, 2018, four indirectly wholly-owned, property-owning subsidiaries of the Company entered into a non-recourse mortgage loan agreement with an institutional lender and certain other lenders from time to time party thereto (the "Shopko Lenders"), in an aggregate amount of $165.0 million. The Company received net proceeds from this loan agreement of approximately $141.9 million after the payment of fees, expenses and required reserves. The loan was secured by a pledge of the equity in the four subsidiaries, which collectively hold 85 assets (83 owned properties and two seller-financed notes on properties) that are leased to Shopko. On November 27, 2018, SMTA, through the indirectly wholly-owned subsidiary that owns the four property-owning subsidiaries, entered into a non-recourse mezzanine loan agreement with the Shopko Lenders, pursuant to which $40.0 million of the original $165.0 million was carved out, resulting in no additional proceeds to SMTA (such mezzanine loan agreement, together with the original loan agreement, the “Shopko CMBS Loan Agreements”). The mezzanine loan was secured by an equity pledge of the indirect wholly-owned subsidiary that owns the four property-owning subsidiaries.
In connection with the Shopko CMBS Loan Agreements, SMTA entered into a customary non-recourse loan guaranty agreement, in favor of the Shopko Lenders, pursuant to which SMTA guaranteed the payment and performance of the liabilities of the property-owning subsidiaries under the non-recourse loan agreements for damages resulting from certain breaches or actions, including, but not limited to, fraud or intentional misrepresentation by the borrowers, and for the repayment in full of the debt in the event of certain actions, including, without limitation, certain bankruptcy events and prohibited transactions.
On January 16, 2019, our indirect wholly-owned subsidiaries as borrowers under the Shopko CMBS Loan Agreements defaulted on the loans when those entities ceased to make interest payments as a result of Shopko ceasing to pay its rent obligations following its bankruptcy filing. The full principal amount of $157.4 million outstanding under the Shopko CMBS Loan Agreements immediately became due and payable, and interest is accruing at the default rate of LIBOR plus 12.5% on the original loan portion and LIBOR plus 18.0% on the mezzanine loan portion. On March 1, 2019, the Shopko Lenders foreclosed on the equity of the entity that owns the four property-owning subsidiaries.
Variable Funding Notes
On November 1, 2018 (the “VFN Closing Date”), the Company completed the issuance of net-lease mortgage notes Series 2018-1, Class A (the “Variable Funding Notes” or "VFN"), which allow for the funding of up to $50.0 million of Variable Funding Notes within Master Trust 2014. Master Trust 2014 is comprised of five issuers, each an indirectly wholly-owned, bankruptcy remote subsidiary of the Company. The VFN has been rated “A+” by Standard & Poor’s Rating Services. The VFN was sold in reliance on certain exemptions from registration under the Securities Act. The VFN may only be acquired by qualified institutional buyers in reliance on Rule 144A under the Securities Act or pursuant to another exemption under the Securities Act. Prior to the VFN Closing Date, Master Trust 2014 had existing notes that are secured by the same collateral as the VFN, which had approximately $1.95 billion in aggregate outstanding principal as of the VFN Closing Date.
For further discussion of the Non-Recourse Loan, Mezzanine Loan and Variable Funding Notes, see Item 7. “Management’s Discussion and Analysis of Financial Condition and Results of Operations - Liquidity and Capital Resources.”
Real Estate Portfolio Activities
Concentration
During the year ended December 31, 2018, no tenant, excluding Shopko, exceeded 7.0% of our Contractual Rent and no one single property contributed more than 7.0% of our Contractual Rent. See Item 2. “Properties" for further information on our ten largest tenants and the composition of our tenant base.
Acquisitions and Dispositions
During the year ended December 31, 2018, we purchased nine properties, representing an aggregate gross investment of $112.6 million, and invested $2.6 million in revenue producing capital expenditures on existing properties. During the same period, we sold 47 properties for $91.0 million in gross sales proceeds. See Note 3 to our consolidated financial statements included in this Annual Report on Form 10-K for additional discussion of our investments.
Declaration of Quarterly and Special Dividend
On December 5, 2019, we announced that our Board of Trustees declared a quarterly cash dividend of $0.33 per common share for the fourth quarter of 2018. In addition, the Board of Trustees declared a special cash dividend of $1.00 per common share. Both dividends were paid on January 15, 2019 to shareholders of record as of December 31, 2018.
On March 5, 2019, the Board of Trustees declared a special cash dividend of $0.33 per common share for the first quarter ended March 31, 2019. The dividend will be paid on April 15, 2019 to holders of record as of March 29, 2019.
LEASING
We typically enter into master leases, leases with contractual rent escalators and leases that require ongoing tenant financial reporting. Most of our leases contain rent escalators, or provisions that periodically increase the base rent payable by the tenant under the lease. Although 34.7% of our rent escalators increase rent at a fixed amount on fixed dates, as of December 31, 2018, approximately 59.6% (41.5% excluding Shopko) (excluding leases on multi-tenant properties) of our rent escalators increase rent by a multiple of any increases in the CPI or the lesser of (a) a multiple of any increase in the CPI over a specified period or (b) a fixed percentage.
Many of our tenants are required to provide financial information, which includes balance sheet, income statement and cash flow statement data, on a quarterly and/or annual basis, and, as of December 31, 2018, approximately 76.2% (58.3% excluding Shopko) of our lease investment portfolio requires the tenant to provide property-level performance information, which includes income statement data on a quarterly and/or annual basis. To assist in our determination of a tenant’s credit quality, we license a product from Moody’s Analytics that provides an EDF and a “shadow rating,” and we evaluate a lease’s property-level rent coverage ratio. An EDF is only an estimate of default probability based, in part, on assumptions incorporated into the product. A shadow rating does not constitute a published credit rating and lacks the extensive company participation that is typically involved when a rating agency publishes a rating; accordingly, a shadow rating may not be as indicative of creditworthiness as a rating published by Moody’s, S&P, or another nationally recognized statistical rating organization. Our calculations of EDFs, shadow ratings and rent coverage ratios are based on financial information provided to us by our tenants and prospective tenants without independent verification on our part, and we must assume the appropriateness of estimates and judgments that were made by the party preparing the financial information. See Item 2. “Properties."
OUR MANAGER
We and our Manager are parties to the Asset Management Agreement, pursuant to which our Manager provides a management team that is responsible for implementing our business strategy and performing certain services for us, subject to oversight by our Board of Trustees. We do not have any employees. Our officers and the other individuals who execute our business strategy are employees of our Manager or its affiliates. Our Manager’s duties, subject to the supervision of our Board of Trustees, include: (1) performing all of our day-to-day functions, (2) sourcing, analyzing and executing on investments and dispositions, (3) determining investment criteria, (4) performing liability management duties, including financing and hedging, and (5) performing financial and accounting management. For its services, our Manager is entitled to an annual management fee and incentive compensation, as well as a termination fee and a promoted interest under certain circumstances. This description of our Asset Management Agreement is qualified in its entirety by the text of the Asset Management Agreement, which has been included as an exhibit to this Annual Report.
COMPETITION
As a landlord, we compete in the multi-billion dollar commercial real estate market with numerous developers and owners of properties, many of which own properties similar to ours in the same markets in which our properties are located. In operating and managing our portfolio, we compete for tenants based on a number of factors, including location, rental rates and flexibility. Some of our competitors have greater economies of scale, have lower cost of capital, have access to more resources and have greater name recognition than we do. If our competitors offer space at rental rates below current market rates or below the rental rates we currently charge our tenants, we may lose our tenants or prospective tenants and we may be pressured to reduce our rental rates or to offer substantial rent abatements, tenant improvement allowances, early termination rights or below-market renewal options in order to retain tenants when our leases expire.
REGULATION
General
Our properties are subject to various covenants, laws, ordinances and regulations, including regulations relating to common areas and fire and safety requirements. We believe that each of our properties has the necessary permits and approvals.
Americans With Disabilities Act
Pursuant to the ADA, our properties are required to meet federal requirements related to access and use by persons with disabilities. Compliance with the ADA, as well as a number of additional federal, state and local laws and regulations, may require modifications to properties we currently own and any properties we purchase, or may restrict renovations of those properties. Noncompliance with these laws or regulations could result in the imposition of fines or an award of damages to private litigants, as well as the incurrence of the costs of making modifications to attain compliance, and future legislation could impose additional financial obligations or restrictions on our properties. Although our tenants are generally responsible for all maintenance and repair costs pursuant to triple-net leases, including compliance with the ADA and other similar laws or regulations, we could be held liable as the owner of the property for a failure of one of our tenants to comply with such laws or regulations.
Environmental Matters
Federal, state and local environmental laws and regulations regulate, and impose liability for, releases of hazardous or toxic substances into the environment. Under various of these laws and regulations, a current or previous owner, operator or tenant of real estate may be required to investigate and clean up hazardous or toxic substances, hazardous wastes or petroleum product releases or threats of releases at the property, and may be held liable to a government entity or to third parties for property damage and for investigation, clean-up and monitoring costs incurred by those parties in connection with actual or threatened contamination. These laws typically impose clean-up responsibility and liability without regard to fault, or whether or not the owner, operator or tenant knew of or caused the presence of the contamination. The liability under these laws may be joint and several for the full amount of the investigation, clean-up and monitoring costs incurred or to be incurred or actions to be undertaken, although a party held jointly and severally liable may seek contributions from other identified, solvent, responsible parties for their fair share toward these costs. These costs may be substantial, and can exceed the value of the property. The presence of contamination, or the failure to properly remediate contamination, on a property may adversely affect the ability of the owner, operator or tenant to sell or rent that property or to borrow using the property as collateral and may adversely impact our investment in that property.
Some of our properties contain, have contained, or are adjacent to or near other properties that have contained or currently contain storage tanks for the storage of petroleum products or other hazardous or toxic substances. Similarly, some of our properties are or were used for commercial or industrial purposes that involve or involved the use of petroleum products or other hazardous or toxic substances, or are adjacent to or near properties that have been or are used for similar commercial or industrial purposes. These operations create a potential for the release of petroleum products or other hazardous or toxic substances, and we could potentially be required to pay to clean up any contamination. In addition, strict environmental laws regulate a variety of activities that can occur on a property, including the storage of petroleum products or other hazardous or toxic substances, air emissions and water discharges. Such laws may impose fines or penalties for violations. As a result of the foregoing, we could be materially and adversely affected.
Environmental laws also govern the presence, maintenance and removal of ACM. Federal regulations require building owners and those exercising control over a building’s management to identify and warn, through signs and labels, of potential hazards posed by workplace exposure to installed ACM in their building. The regulations also have employee training, record keeping and due diligence requirements pertaining to ACM. Significant fines can be assessed for violation of these regulations. As a result of these regulations, building owners and those exercising control over a building’s management may be subject to an increased risk of personal injury lawsuits by workers and others exposed to ACM. The regulations may affect the value of a building containing ACM in which we have invested. Federal, state and local laws and regulations also govern the removal, encapsulation, disturbance, handling and/or disposal of ACM when those materials are in poor condition or in the event of construction, remodeling, renovation or demolition of a building. These laws may impose liability for improper handling or a release into the environment of ACM and may provide for fines to owners or operators of real properties. In addition, owners or operators of real properties can be exposed to third-party liability for personal injury or improper work exposure associated with ACM.
When excessive moisture accumulates in buildings or on building materials, mold growth may occur, particularly if the moisture problem remains undiscovered or is not addressed over a period of time. Some molds may produce airborne toxins or irritants. Indoor air quality issues can also stem from inadequate ventilation, chemical contamination from indoor or outdoor sources, and other biological contaminants such as pollen, viruses and bacteria. Indoor exposure to airborne toxins or irritants above certain levels can be alleged to cause a variety of adverse health effects and symptoms, including allergic or other reactions. As a result, the presence of significant mold or other airborne contaminants at any of our properties could require us to undertake a costly remediation program to contain or remove the mold or other airborne contaminants from the affected property or increase indoor ventilation. In addition, the presence of significant mold or other airborne contaminants could expose us to liability from our tenants, employees of our tenants or others if property damage or personal injury occurs. We are not presently aware of any material adverse indoor air quality issues at our properties that have not been previously addressed or remediated by us.
Before completing any property acquisition, we obtain environmental assessments in order to identify potential environmental concerns at the property. These assessments are carried out in accordance with the Standard Practice for Environmental Site Assessments (ASTM Practice E 1527-13) as set by ASTM International, formerly known as the American Society for Testing and Materials, and generally include a physical site inspection, a review of relevant federal, state and local environmental and health agency database records, one or more interviews with appropriate site-related personnel, review of the property’s chain of title and review of historical aerial photographs and other information on past uses of the property. These assessments are limited in scope; however, if recommended in the initial assessments, we may undertake additional assessments such as soil and/or groundwater sampling or other limited subsurface investigations and ACM or mold surveys to test for substances of concern. A prior owner or operator of a property or historic operations at our properties may have created a material environmental condition that is not known to us or the independent consultants preparing the site assessments. Material environmental conditions may have arisen after the review was completed or may arise in the future, and future laws, ordinances or regulations may impose material additional environmental liability. If environmental concerns are not satisfactorily resolved in any initial or additional assessments, we may obtain environment insurance policies to insure against potential environmental risk or loss depending on the type of property, the availability and cost of the insurance and various other factors we deem relevant (e.g., an environmental occurrence affects one of our properties where our lessee may not have the financial capability to honor its indemnification obligations to us).
Generally, our leases provide that the lessee will indemnify us for any loss or expense we incur as a result of the presence, use or release of hazardous materials on our property. However, our ultimate liability for environmental conditions may exceed the policy limits on any environmental insurance policies we obtain, if any. If we are unable to enforce the indemnification obligations of our lessees or if the amount of environmental insurance we carry is inadequate, our results of operations would be adversely affected.
INSURANCE
Our tenants are generally required to maintain liability and property insurance coverage for the properties they lease from us pursuant to triple-net leases. Under such leases, our tenants are generally required to name us (and any of our lenders that have a mortgage on the property leased by the tenant) as additional insureds on their liability policies and additional insured and/or loss payee (or mortgagee, in the case of our lenders) on their property policies. Tenants are required to maintain casualty coverage and most carry limits at 100% of replacement cost. Depending on the location of the property, losses of a catastrophic nature, such as those caused by earthquakes and floods, may be covered by insurance policies that are held by our tenant with limitations such as large deductibles or co-payments that a tenant may not be able to meet. In addition, losses of a catastrophic nature, such as those caused by wind/hail, hurricanes, terrorism or acts of war, may be uninsurable or not economically insurable. In the event there is damage to our properties that is not covered by insurance and such properties are subject to recourse indebtedness, we will continue to be liable for the indebtedness, even if these properties are irreparably damaged. See Item 1A. “Risk Factors - Risks Related to Our Business and Properties - Insurance on our properties may not adequately cover all losses, which could materially and adversely affect us.”
In addition to being generally named as additional insureds on our tenants’ liability policies, we separately maintain commercial general liability coverage with limits of $1.0 million for each occurrence and $2.0 million general aggregate. We also maintain primary property coverage on (i) all unleased properties, (ii) all properties for which such coverage is not required to be carried by a tenant and (iii) all properties for which we obtain such coverage but the costs of which are reimbursed by tenants. In addition, we maintain excess property coverage on all remaining properties and other property coverage as may be required by our lenders.
Item 1A. Risk Factors
You should consider carefully the risks and uncertainties described below, together with all of the other information in this Annual Report on Form 10-K, which could materially affect our business, financial condition, results of operations and prospects. The risks described below are not the only risks facing us. Risks and uncertainties not currently known to us or that we currently deem to be immaterial also may materially affect our business, financial condition, results of operations and prospects.
RISKS RELATED TO OUR BUSINESS AND PROPERTIES
We are exploring and evaluating strategic alternatives and there can be no assurance that we will be successful in identifying or completing any strategic alternative or that any such strategic alternative will yield additional value for our shareholders.
On January 16, 2019, our Board of Trustees announced the intention to explore strategic alternatives focused on maximizing shareholder value. Strategic alternatives being considered by the Board of Trustees may include, but are not limited to, a sale of SMTA or the Master Trust 2014, a merger or other potential alternatives transactions. There can be no assurance that the exploration of strategic alternatives will result in the identification or consummation of any transaction or transactions or that any resulting plans or transactions will yield additional value for shareholders. In addition, we may incur substantial expenses associated with identifying and evaluating potential strategic alternatives. The process of exploring strategic alternatives may be time consuming and disruptive. Any potential transaction would be dependent upon a number of factors that may be beyond our control, including, among other factors, market conditions, industry trends, regulatory limitations and the interest of third parties in our business.
The bankruptcy or insolvency of Shopko is likely to result in the termination of Shopko leases and material losses to us.
On January 16, 2019, Shopko filed a petition for relief under chapter 11 of the Bankruptcy Code, and subsequently announced on March 18, 2019 that it intends to liquidate its operations. Rental revenues generated from Shopko represented 17.9% of our Contractual Rent at December 31, 2018. As a consequence of the Shopko bankruptcy filing, we do not expect to receive any additional cash flow going forward from any of the assets leased to Shopko. The loss of Shopko as a tenant will reduce our contractual rent in future periods, which is likely to have a material adverse effect on our business, financial condition and results of operations.
We also made the Shopko B-1 Term Loan to Shopko, with principal outstanding of $34.4 million as of December 31, 2018. This secured loan has been accelerated due to the Shopko bankruptcy filing. The outcome of the Shopko bankruptcy is uncertain and there can be no assurances that there will be any recovery with respect to the Shopko B-1 Term Loan.
The bankruptcy or insolvency of any of our other tenants could result in the termination of such tenant’s lease and incremental material losses to us, in addition to those from the Shopko leases.
The occurrence of a bankruptcy or insolvency of any of our other tenants could diminish the income we receive from that tenant’s lease or leases. In particular, the retail industry is facing reductions in sales revenues and increased bankruptcies throughout the United States, and revenues generated from retail tenants other than Shopko represented 29.4% of our Contractual Rent at December 31, 2018. If a tenant becomes bankrupt or insolvent, federal law may prohibit us from evicting such tenant based solely upon such bankruptcy or insolvency. In addition, a bankrupt or insolvent tenant may be authorized to reject and terminate its lease or leases with us. Any claims against such bankrupt tenant for unpaid future rent would be subject to statutory limitations that would likely result in our receipt of rental revenues that are substantially less than the contractually specified rent we are owed under the lease or leases. In addition, any claim we have for unpaid past rent, if any, may not be paid in full. We may also be unable to re-lease a terminated or rejected space or to re-lease it on comparable or more favorable terms. Moreover, tenants who are considering filing for bankruptcy protection may request that we agree to amendments of their master leases to remove certain of the properties they lease from us under such master leases. We cannot guarantee that we will be able to sell or re-lease such properties or that lease termination fees, if any, received in exchange for such releases will be sufficient to make up for the rental revenues lost as a result of such lease amendments. As a result, future tenant bankruptcies may materially and adversely affect us.
Risks related to commercial real estate ownership could reduce the value of our properties.
Our core business is the ownership of real estate that is leased to retail, service and distribution companies on a triple-net basis. Accordingly, our performance is subject to risks inherent to the ownership of commercial real estate, including:
| |
• | inability to collect rent from tenants due to financial hardship, including bankruptcy; |
| |
• | changes in local real estate markets resulting in the lack of availability or demand for single-tenant retail space; |
| |
• | changes in consumer trends and preferences that reduce the demand for products/services of our tenants; |
| |
• | inability to lease or sell properties upon expiration or termination of existing leases; |
| |
• | environmental risks related to the presence of hazardous or toxic substances or materials on our properties; |
| |
• | subjectivity of real estate valuations and changes in such valuations over time; |
| |
• | illiquid nature of real estate compared to most other financial assets; |
| |
• | changes in laws and regulations, including those governing real estate usage and zoning; |
| |
• | changes in interest rates and the availability of financing; and |
| |
• | changes in the general economic and business climate. |
The occurrence of any of the risks described above may cause the value of our real estate to decline, which could materially and adversely affect our business, financial condition and results of operations.
Credit and capital market conditions may adversely affect our access to and/or the cost of capital.
Periods of volatility in the credit and capital markets negatively affect the amounts, sources and cost of capital available to us. We primarily use external financing to refinance indebtedness as it matures. If sufficient sources of external financing are not available to us on cost effective terms, we could be forced to limit our business activities and repayment of debt, such as selling assets. To the extent that we access capital at a higher cost (reflected in higher interest rates for debt financing or lower share price for equity financing), our earnings per share and cash flow could be adversely affected.
Our tenants may fail to successfully operate their businesses, which could adversely affect us.
The success of our investments is dependent on the financial stability of our tenants’ financial condition and leasing practices. Adverse economic conditions such as high unemployment levels, interest rates, tax rates and fuel and energy costs may have an impact on the results of operations and financial condition of our tenants and result in a decline in rent or an increased incidence of default under existing leases. Such adverse economic conditions may also reduce overall demand for rental space, which could adversely affect our ability to maintain our current tenants and attract new tenants.
At any given time, our tenants may experience a downturn in their business that may weaken the operating results and financial condition of individual properties or of their business as whole. As a result, a tenant may delay lease commencement, decline to extend a lease upon its expiration, fail to make rental payments when due, become insolvent or declare bankruptcy, as in the case of Shopko's recent bankruptcy filing. We depend on our tenants to operate the properties we own in a manner which generates revenues sufficient to allow them to meet their obligations to us, including their obligations to pay rent, maintain certain insurance coverage and pay real estate taxes and maintain the properties in a manner so as not to jeopardize their operating licenses or regulatory status. The ability of our tenants to fulfill their obligations under our leases may depend, in part, upon the overall profitability of their operations. Cash flow generated by certain tenant businesses may not be sufficient for a tenant to meet its obligations to us. Although our occupied properties are generally operationally essential to our tenants, meaning the property is essential to the tenant’s generation of sales and profits, this does not guarantee that a tenant’s operations at a particular property will be successful or that the tenant will be able to meet all of its obligations to us. Our tenants’ failure to successfully operate their businesses could materially and adversely affect us.
Single-tenant leases involve particular and significant risks related to tenant default.
Many properties in our portfolio are single-tenant triple-net leased properties throughout the U.S. The financial failure of, or default in payment by, a single tenant under its lease is likely to cause a significant reduction in, or elimination of, our rental revenue from that property and a reduction in the value of the property. We may also experience difficulty or a significant delay in re-leasing or selling such property. This risk is magnified in situations where we lease multiple properties to a single tenant under a master lease. The failure or default of a tenant under a master lease could reduce or eliminate rental revenue from multiple properties and reduce the value of such properties. Although the master
lease structure may be beneficial to us because it restricts the ability of tenants to individually remove underperforming properties from the portfolio of properties leased from us, there is no guarantee that a tenant will not default in its obligations to us or decline to renew its master lease upon expiration. The default of a tenant that leases multiple properties from us, as in the case of Shopko's recent bankruptcy filing, could materially and adversely affect us.
A substantial portion of our properties are leased to unrated tenants and the tools we use to measure the credit quality of such tenants may not be accurate.
A substantial portion of our properties are leased to unrated tenants whom we determine, through our internal underwriting and credit analysis, to be creditworthy. Many of our tenants are required to provide financial information, which includes balance sheet, income statement and cash flow statement data, on a quarterly and/or annual basis, and, as of December 31, 2018, approximately 76.2% (58.3% excluding Shopko) of our Contractual Rent was generated pursuant to leases that require the tenant to provide property-level performance information, which includes income statement data on a quarterly and/or annual basis. To assist in our determination of a tenant’s credit quality, we license a product from Moody’s Analytics that provides an EDF and a “shadow rating,” and we evaluate a lease’s property-level rent coverage ratio. An EDF is only an estimate of default probability based, in part, on assumptions incorporated into the product. A shadow rating does not constitute a published credit rating and lacks the extensive company participation that is typically involved when a rating agency publishes a rating; accordingly, a shadow rating may not be as indicative of creditworthiness as a rating published by Moody’s, S&P, or another nationally recognized statistical rating organization. Our calculations of EDFs, shadow ratings and rent coverage ratios are based on financial information provided to us by our tenants and prospective tenants without independent verification on our part, and we must assume the appropriateness of estimates and judgments that were made by the party preparing the financial information. If our measurement of credit quality proves to be inaccurate, we may be subject to defaults, and investors may view our cash flows as less stable.
Decrease in demand for retail and restaurant space may materially and adversely affect us.
As of December 31, 2018, leases representing approximately 47.3% (29.4% excluding Shopko) and 19.6% of our Contractual Rent were with tenants in the retail and restaurant industries, respectively, and we may enter into leases with additional retail and restaurant tenants in the future. Accordingly, a decrease in the demand for retail and/or restaurant spaces adversely impacts us. The market for retail and restaurant space has previously been, and could continue to be, adversely affected by the following factors: weakness in the national, regional and local economies; the adverse financial condition of some large retail and restaurant companies; the ongoing consolidation in the retail and restaurant industries; the excess amount of retail and restaurant space in a number of markets; and, in the case of the retail industry, increasing consumer purchases over the Internet. To the extent that these conditions continue, they are likely to negatively affect market rents for retail and restaurant space, which could materially and adversely affect our business, financial condition and results of operations.
High geographic concentration of our properties could magnify the effects of adverse economic or regulatory developments in such geographic areas on our operations and financial condition.
As of December 31, 2018, 11.7% of our portfolio (as a percentage of Contractual Rent) was located in Texas, representing the highest concentration of our assets. Geographic concentration exposes us to greater economic or regulatory risks than if we owned a more geographically diverse portfolio. We are susceptible to adverse developments in the economic or regulatory environments of the geographic areas in which we concentrate (or in which we may develop a substantial concentration of assets in the future), such as business layoffs or downsizing, industry slowdowns, relocations of businesses, increases in real estate and other taxes or costs of complying with governmental regulations.
We may be unable to renew leases, lease vacant space or re-lease space as leases expire on favorable terms or at all.
Our results of operations depend on our ability to strategically lease space in our properties (by renewing or re-leasing expiring leases and leasing vacant space), optimize our tenant mix or lease properties on more economically favorable terms. As of December 31, 2018, leases representing approximately 4.7% of our Contractual Revenue will expire during 2020. As of December 31, 2018, 25 of our properties, representing approximately 2.9% of our total number of owned properties, were Vacant. Current tenants may decline, or may not have the financial resources available, to renew current leases and we cannot guarantee that leases that are renewed will have terms that are as economically favorable to us as the expiring lease terms. If tenants do not renew the leases as they expire, we will have to find new tenants to lease our properties and there is no guarantee that we will be able to find new tenants or that our properties will be re-leased at rental rates equal to or above the current average rental rates or that substantial rent abatements, tenant improvement allowances, early termination rights, below-market renewal options or other lease incentive
payments will not be offered to attract new tenants. We may experience significant costs in connection with renewing, leasing or re-leasing a significant number of our properties, which could materially and adversely affect our results of operations.
Our ability to realize future rent increases will vary depending on changes in the CPI.
Most of our leases contain rent escalators, or provisions that periodically increase the base rent payable by the tenant under the lease. Although 34.7% of our rent escalators increase rent at a fixed amount on fixed dates, as of December 31, 2018, approximately 59.6% (41.5% excluding Shopko) (excluding leases on multi-tenant properties) of our rent escalators increase rent by a multiple of any increases in the CPI or the lesser of (a) a multiple of any increase in the CPI over a specified period or (b) a fixed percentage. If the product of any increase in the CPI multiplied by the applicable factor is less than the fixed percentage, the increased rent we are entitled to receive will be less than what we otherwise would have been entitled to receive if the rent escalator was based solely on a fixed percentage. Therefore, during periods of low inflation or deflation, small increases or decreases in the CPI will subject us to the risk of receiving lower rental revenue than we otherwise would have been entitled to receive if our rent escalators were based solely on fixed percentages or amounts. Conversely, if the product of any increase in the CPI multiplied by the applicable factor is more than the fixed percentage, the increased rent we are entitled to receive will be less than what we otherwise would have been entitled to receive if the rent escalator was based solely on an increase in CPI. Therefore, periods of high inflation will subject us to the risk of receiving lower rental revenue than we otherwise would have been entitled to receive if our rent escalators were based solely on CPI increases.
Property vacancies could result in significant capital expenditures and illiquidity.
The loss of a tenant, either through lease expiration or tenant bankruptcy or insolvency, may require us to spend significant amounts of capital to renovate the property before it is suitable for a new tenant. Many of the leases we enter into or acquire are for properties that are specially suited to the particular business of our tenants. Because these properties have been designed or physically modified for a particular tenant, if the current lease is terminated or not renewed, we may be required to renovate the property at substantial costs, decrease the rent we charge or provide other concessions in order to lease the property to another tenant. In the event we are required to sell these or other properties, we may have difficulty selling it then due to the special purpose for which the property may have been designed or modified. This potential illiquidity may limit our ability to quickly modify our portfolio in response to changes in economic or other conditions, including tenant demand. These limitations could have a material adverse effect on our business, financial condition and results of operations.
Operational risks may disrupt our businesses or result in losses.
We are completely dependent on our Manager’s financial, accounting, communications and other data processing systems. Such systems may fail to operate properly or become disabled as a result of tampering or a breach of the network security systems or otherwise. In addition, such systems are from time to time subject to cyberattacks. Breaches of our Manager’s network security systems could involve attacks that are intended to obtain unauthorized access to our proprietary information or personal identifying information of our shareholders, destroy data or disable, degrade or sabotage our systems, often through the introduction of computer viruses, cyberattacks and other means, and could originate from a wide variety of sources, including unknown third parties. There can be no assurance that measures to provide adequate protection to the integrity of our systems will be successful. If such systems are compromised, do not operate properly or are disabled, we could suffer financial loss, a disruption of our businesses, liability to investors, regulatory intervention or reputational damage. Finally, our Manager relies on third-party service providers for certain aspects of our business, including for certain information systems, technology and administration. Any interruption or deterioration in the performance of these third parties or failures of their information systems and technology could impair the quality of our operations and could affect our reputation and hence adversely affect our business.
Illiquidity of real estate investments could significantly impede our ability to pursue our ongoing business strategy to sell certain of our assets or respond to adverse changes in the performance of our properties and harm our financial condition.
The real estate investments we have made are relatively difficult to sell quickly. As a result, our ability to promptly sell one or more properties in our portfolio in response to changing economic, financial or investment conditions is limited. Return of capital and realization of gains, if any, from an investment generally will occur upon disposition or refinancing of the underlying property. We may be unable to realize our investment objective by sale, other disposition or refinancing at attractive prices within any given period of time or may otherwise be unable to complete any exit strategy. In particular, these risks could arise from weakness in or even the lack of an established market for a property, changes in the
financial condition or prospects of prospective purchasers, changes in national or international economic conditions and changes in laws, regulations or fiscal policies of the jurisdiction in which a property is located.
In addition, the Code imposes restrictions on a REIT’s ability to dispose of properties that are not applicable to other types of real estate companies. In particular, the tax laws applicable to REITs effectively require that we hold our properties for investment, rather than primarily for sale in the ordinary course of business, which may cause us to forego or defer sales of properties that otherwise would be in our best interest. Therefore, we may not be able to vary our portfolio in response to economic or other conditions promptly or on favorable terms, which may materially and adversely affect our business and results of operations.
We face significant competition for tenants, which may decrease or prevent increases of the occupancy and rental rates of our properties.
We compete with numerous developers, owners and operators of properties, many of which own properties similar to ours in the same markets in which our properties are located. In operating and managing our portfolio, we compete for tenants based on a number of factors, including location, rental rates and flexibility. Some of our competitors have greater economies of scale, have lower cost of capital, have access to more resources and have greater name recognition than we do. If our competitors offer space at rental rates below current market rates or below the rental rates we currently charge our tenants, we may lose existing or potential tenants and we may be pressured to reduce our rental rates or to offer more substantial rent abatements, tenant improvements, early termination rights, below-market renewal options or other lease incentive payments in order to retain tenants when our leases expire. Competition for tenants could decrease or prevent increases of the occupancy and rental rates of our properties, which could materially and adversely affect us.
The loss of a borrower or the failure of a borrower to make loan payments on a timely basis will reduce our revenues, which could lead to losses on our investments and reduced returns to our shareholders.
We have originated or acquired long-term, commercial mortgage and other loans. The success of our loan investments is dependent on the financial stability of our borrowers. The success of our borrowers is dependent on each of their individual businesses and their industries, which could be affected by economic conditions in general, changes in consumer trends and preferences and other factors over which neither they nor we have control. For example, in connection with Shopko’s bankruptcy filing, Shopko has filed pleadings asserting that any recovery under the Shopko B-1 Term Loan will be limited and may be impaired in full. We have therefore established a loss reserve in the amount of approximately $33.8 million, representing the remaining amount of the Shopko B-1 Term Loan as of the date hereof. A default on loans owed to us, including the loan made to Shopko, could prevent us from earning interest or receiving a return of the principal of our loan and, as a result, would materially and adversely affect us. In the event of a default, we may also experience delays in enforcing our rights as lender and may incur substantial costs in collecting the amounts owed to us and in liquidating any collateral.
Foreclosure and other similar proceedings used to enforce payment of real estate loans are generally subject to principles of equity, which are designed to relieve the indebted party from the legal effect of that party’s default. Foreclosure and other similar laws may limit our right to obtain a deficiency judgment against the defaulting party after a foreclosure or sale. The application of any of these principles may lead to a loss or delay in the payment on loans we hold, which in turn could reduce the amounts we have available to make distributions. Further, in the event we have to foreclose on a property, the amount we receive from the foreclosure sale of the property may be inadequate to fully pay the amounts owed to us by the borrower and our costs incurred to foreclose, repossess and sell the property which could materially and adversely affect us.
Our investments in mortgage loans may be affected by unfavorable real estate market conditions, including interest rate fluctuations, which could decrease the value of those loans.
Our investments in mortgage loans are subject to risk of default by the borrowers and to interest rate risks. To the extent we incur delays in liquidating defaulted mortgage loans, we may not be able to obtain all amounts due to us under such loans. Further, we will not know whether the values of the properties securing the mortgage loans will remain at the levels existing on the dates of origination of those mortgage loans or the dates of our investment in the loans. If the values of the underlying properties decline, the value of the collateral securing our mortgage loans will also decline and if we were to foreclose on any of the properties securing the mortgage loans, we may not be able to sell or lease them for an amount equal to the unpaid amounts due to us under the mortgage loans. As such, defaults on mortgage loans in which we invest may materially and adversely affect our investment strategy.
Inflation may materially and adversely affect us and our tenants.
Increased inflation could have a negative impact on variable-rate debt we currently have or that we may incur in the future. Our leases typically contain provisions designed to mitigate the adverse impact of inflation on our results of operations. Because tenants are typically required to pay all property operating expenses, increases in property-level expenses at our leased properties generally do not affect us. However, increased operating expenses at vacant properties and the limited number of properties that are not subject to full triple-net leases could cause us to incur additional operating expenses, which could increase our exposure to inflation. Additionally, the increases in rent provided by many of our leases may not keep up with the rate of inflation. Increased costs may also have an adverse impact on our tenants if increases in their operating expenses exceed increases in revenue, which may adversely affect the tenants’ ability to pay rent owed to us.
If we fail to maintain effective internal controls over financial reporting, we may not be able to accurately and timely report our financial results.
Section 404(a) of Sarbanes-Oxley Act of 2002 ("SOX") requires that, beginning with our annual report for the fiscal year ending December 31, 2020, our management is required to assess and report annually on the effectiveness of our internal controls over financial reporting and identify any material weaknesses in internal controls over financial reporting. However, for so long as we are an “emerging growth company”, our independent registered public accounting firm will not be required to issue an annual report that addresses the effectiveness of our internal controls over financial reporting.
Effective internal controls over financial reporting are necessary for us to provide reliable financial reports, effectively prevent fraud and operate successfully as a public company. If we cannot provide reliable financial reports or prevent fraud, our reputation and operating results would be harmed. We are required to perform system and process evaluation and testing of our internal control over financial reporting to allow management to report on, and our independent registered public accounting firm to attest to, the effectiveness of our internal control over financial reporting, as required by Section 404 of the Sarbanes-Oxley Act of SOX.
Any failure to maintain effective internal controls or timely effect any necessary improvement of our internal control over financial reporting controls could harm operating results or cause us to fail to meet our reporting obligations, which could affect the listing of our common shares on the NYSE. Ineffective internal control over financial reporting could also cause investors to lose confidence in our reported financial information, which would likely have a negative effect on the trading price of our common shares.
The requirements of being a public company may strain our resources.
We are subject to the reporting requirements of the Exchange Act, SOX, the listing requirements of the NYSE, and other applicable securities rules and regulations. Compliance with these rules and regulations requires substantial legal and financial compliance costs, makes some activities more difficult, time-consuming, or costly, and places increased demand on our systems and resources. The Exchange Act requires, among other things, that we file annual and current reports with respect to our business and operating results. SOX requires, among other things, that we maintain effective disclosure controls and procedures and internal control over financial reporting. In order to maintain disclosure controls and procedures and internal control over financial reporting that meet this standard, significant resources and oversight are required.
In addition, changing laws, regulations, and standards relating to corporate governance and public disclosure are creating uncertainty for public companies, increasing legal and financial compliance costs and making some activities more time consuming. These laws, regulations, and standards are subject to varying interpretations, in many cases due to their lack of specificity, and, as a result, their application in practice may evolve over time as new guidance is provided by regulatory and governing bodies. This could result in continuing uncertainty regarding compliance matters and higher costs necessitated by ongoing revisions to disclosure and governance practices. We intend to continue to invest resources to complying with evolving laws, regulations, and standards, and this investment may result in increased general and administrative expenses. If our efforts to comply with new laws, regulations, and standards differ from the activities intended by regulatory or governing bodies due to ambiguities related to practice, regulatory authorities may initiate legal proceedings against us and our business may be harmed.
We depend on external sources of capital that are outside of our control and may not be available to us on commercially reasonable terms or at all.
In order to maintain our qualification as a REIT, we are required under the Code to distribute annually at least 90% of our REIT taxable income, determined without regard to the dividends paid deduction and excluding any net capital gain. In addition, we will be subject to income tax at regular corporate rates to the extent that we distribute less than 100% of our REIT taxable income, determined without regard to the dividends paid deduction and including any net capital gain. Because of these distribution requirements, we may not be able to fund future capital needs from operating cash flow. Consequently, we may rely on third-party sources to fund our capital needs. We may not be able to obtain the financing on favorable terms or at all. Any additional debt we incur will increase our leverage and likelihood of default. Our access to third-party sources of capital depends, in part, on:
| |
• | general market conditions; |
| |
• | our current debt levels; |
| |
• | our current and expected future earnings; |
| |
• | our cash flow and cash distributions; and |
| |
• | the market price of our common shares. |
If we cannot obtain capital from third-party sources, we may not be able to meet the capital and operating needs of our existing properties, satisfy our debt service obligations or make the cash distributions to our shareholders necessary to maintain our qualification as a REIT.
Historically, we have raised a significant amount of capital through debt issuances of our Master Trust 2014. We have generally used the proceeds from this program to repay other debt and fund real estate acquisitions. As of December 31, 2018, we had issued notes under our Master Trust 2014 in seven different series over five separate issuances with $1.94 billion aggregate principal amount outstanding. Additionally, under our Master Trust 2014, we had availability of $41.1 million borrowing capacity under our variable funding note as of December 31, 2018 ($45.8 million as of March 19, 2019). The Master Trust 2014 notes have a weighted average maturity of 4.4 years as of December 31, 2018. Our obligations under this program are generally secured by liens on certain of our properties. Subject to certain conditions, we may substitute real estate collateral within our securitization trust from time to time. Moreover, we view our ability to substitute collateral under our Master Trust 2014 favorably, and no assurance can be given that financing facilities offering similar flexibility will be available to us in the future.
Dispositions of real estate assets could change the holding period assumption in our valuation analyses, which could result in material impairment losses and adversely affect our financial results.
We evaluate real estate assets for impairment based on the projected cash flow of the asset over our anticipated holding period. If we change our intended holding period due to our intention to sell or otherwise dispose of an asset, we must reevaluate whether that asset is impaired under GAAP. Depending on the carrying value of the property at the time we change our intention and the amount that we estimate we would receive on disposal, we may record an impairment loss that would adversely affect our financial results. Such losses could be material to our assets in the period that it is recognized. In December 2018, we recorded $167.2 million of impairment charges related to tangible and intangible assets due to the Shopko bankruptcy filing.
We may become subject to litigation, which could materially and adversely affect us.
In the ordinary course of business, we may become subject to litigation, including claims relating to our operations, security offerings and otherwise. Some of these claims may result in significant defense costs and potentially significant judgments against us, some of which are not, or cannot be, insured against. We generally intend to vigorously defend ourselves. However, we cannot be certain of the ultimate outcomes of any claims that may arise in the future. Resolution of these types of matters against us may result in our having to pay significant fines, judgments, or settlements, which, if uninsured, or if the fines, judgments, and settlements exceed insured levels, could adversely impact our earnings and cash flows, thereby materially and adversely affecting us. Certain litigation or the resolution of certain litigation may affect the availability or cost of some of our insurance coverage, which could materially and adversely impact us, expose us to increased risks that would be uninsured, and materially and adversely impact our ability to attract directors and officers.
Costs of compliance with, or liabilities related to, environmental laws may materially and adversely affect us.
The properties we own or have owned in the past may subject us to known and unknown environmental liabilities. Under various federal, state and local laws and regulations relating to the environment, as a current or former owner
or operator of real property, we may be liable for costs and damages resulting from the presence or discharge of hazardous or toxic substances, waste or petroleum products at, on, in, under or migrating from such property, including costs to investigate and clean up such contamination and liability for harm to natural resources. We may face liability regardless of:
| |
• | our knowledge of the contamination; |
| |
• | the timing of the contamination; |
| |
• | the cause of the contamination; or |
| |
• | the existence of other parties responsible for the contamination of the property. |
There may be environmental liabilities associated with our properties of which we are unaware. We obtain Phase I environmental site assessments on all properties we finance or acquire. The Phase I environmental site assessments are limited in scope and therefore may not reveal all environmental conditions affecting a property. Therefore, there could be undiscovered environmental liabilities on the properties we own. Some of our properties use, or may have used in the past, underground tanks for the storage of petroleum-based products or other hazardous or toxic substances that could create a potential for release of hazardous substances or penalties if tanks do not comply with legal standards. If environmental contamination exists on our properties, we could be subject to strict, joint and/or several liability for the contamination by virtue of our ownership interest. Some of our properties may contain ACM. Strict environmental laws govern the presence, maintenance and removal of ACM and such laws may impose fines and penalties for failure to comply with these requirements or expose us to third-party liability (e.g., liability for personal injury associated with exposure to asbestos). Strict environmental laws also apply to other activities that can occur on a property, such as air emissions and water discharges, and such laws may impose fines and penalties for violations.
The presence of hazardous substances on a property may adversely affect our ability to sell, lease or improve the property or to borrow using the property as collateral. In addition, environmental laws may create liens on contaminated properties in favor of the government for damages and costs it incurs to address such contamination. Moreover, if contamination is discovered on our properties, environmental laws may impose restrictions on the manner in which they may be used or businesses may be operated, and these restrictions may require substantial expenditures.
In addition, although our leases generally require our tenants to operate in compliance with all applicable laws and to indemnify us against any environmental liabilities arising from a tenant’s activities on the property, we could be subject to strict liability by virtue of our ownership interest. We cannot be sure that our tenants will, or will be able to, satisfy their indemnification obligations, if any, under our leases. Furthermore, the discovery of environmental liabilities on any of our properties could lead to significant remediation costs or to other liabilities or obligations attributable to the tenant of that property, which may affect such tenant’s ability to make payments to us, including rental payments and, where applicable, indemnification payments.
Our environmental liabilities may include property damage, personal injury, investigation and clean-up costs. These costs could be substantial. Although we may obtain insurance for environmental liability for certain properties that are deemed to warrant coverage, our insurance may be insufficient to address any particular environmental situation and we may be unable to continue to obtain insurance for environmental matters, at a reasonable cost or at all, in the future. If our environmental liability insurance is inadequate, we may become subject to material losses for environmental liabilities. Our ability to receive the benefits of any environmental liability insurance policy will depend on the financial stability of our insurance company and the position it takes with respect to our insurance policies. If we were to become subject to significant environmental liabilities, we could be materially and adversely affected.
Most of the environmental risks discussed above refer to properties that we own or may acquire in the future. However, each of the risks identified also applies to the owners (and potentially, the lessees) of the properties that secure each of the loans we have made and any loans we may acquire or make in the future. Therefore, the existence of environmental conditions could diminish the value of each of the loans and the abilities of the borrowers to repay the loans and could materially and adversely affect us.
Our properties may contain or develop harmful mold, which could lead to liability for adverse health effects and costs of remediation.
When excessive moisture accumulates in buildings or on building materials, mold growth may occur, particularly if the moisture problem remains undiscovered or is not addressed over a period of time. Some molds may produce airborne toxins or irritants. Concern about indoor exposure to mold has been increasing, as exposure to mold may cause a variety of adverse health effects and symptoms, including allergic or other reactions. As a result, should our tenants or their employees or customers be exposed to mold at any of our properties we could be required to undertake a costly remediation program to contain or remove the mold from the affected property. In addition, exposure to mold
by our tenants or others could subject us to liability if property damage or health concerns arise. If we were to become subject to significant mold-related liabilities, our business and results of operations could be materially and adversely affected.
Insurance on our properties may not adequately cover all losses, which could materially and adversely affect us.
Our tenants are required to maintain liability and property insurance coverage for the properties they lease from us pursuant to triple-net leases. Pursuant to such leases, our tenants are generally required to name us (and any of our lenders that have a mortgage on the property leased by the tenant) as additional insureds on their liability policies and additional insured and/or loss payee (or mortgagee, in the case of our lenders) on their property policies. All tenants are required to maintain casualty coverage and most carry limits at 100% of replacement cost. Depending on the location of the property, losses of a catastrophic nature, such as those caused by earthquakes and floods, may be covered by insurance policies that are held by our tenant with limitations such as large deductibles or co-payments that a tenant may not be able to meet. In addition, losses of a catastrophic nature, such as those caused by wind/hail, hurricanes, terrorism or acts of war, may be uninsurable or not economically insurable. In the event there is damage to our properties that is not covered by insurance and such properties are subject to recourse indebtedness, we will continue to be liable for the indebtedness, even if these properties are irreparably damaged.
As of December 31, 2018, 11.7% of our portfolio (as a percentage of Contractual Rent) was located in Texas, representing the highest concentration of our assets. We recognize that the frequency and / or intensity of extreme weather events may continue to increase due to climate change, and as a result, our exposure to these events could increase. These weather conditions also disrupt our business and the business of our tenants, which could affect the ability of some tenants to pay rent and may reduce the willingness of residents to remain in or move to the affected area. Therefore, as a result of the geographic concentration of our properties in Texas, we face risks, including higher costs, such as uninsured property losses and higher insurance premiums, and disruptions to our business and the businesses of our tenants.
Inflation, changes in building codes and ordinances, environmental considerations, and other factors, including terrorism or acts of war, may make any insurance proceeds we receive insufficient to repair or replace a property if it is damaged or destroyed. In that situation, the insurance proceeds received may not be adequate to restore our economic position with respect to the affected real property. Furthermore, in the event we experience a substantial or comprehensive loss of one of our properties, we may not be able to rebuild such property to its existing specifications without significant capital expenditures which may exceed any amounts received pursuant to insurance policies, as reconstruction or improvement of such a property would likely require significant upgrades to meet zoning and building code requirements. The loss of our capital investment in or anticipated future returns from our properties due to material uninsured losses could materially and adversely affect us.
Compliance with the ADA and fire, safety and other regulations may require us to make unanticipated expenditures that materially and adversely affect us.
Our properties are subject to the ADA. Under the ADA, all public accommodations must meet federal requirements related to access and use by disabled persons. Compliance with the ADA requirements could require removal of access barriers and non-compliance could result in imposition of fines by the U.S. government or an award of damages to private litigants, or both. While our tenants are obligated by law to comply with the ADA and typically obligated under our leases and financing agreements to cover costs associated with compliance, if required changes involve greater expenditures than anticipated or if the changes must be made on a more accelerated basis than anticipated, our tenants' ability to cover the costs could be adversely affected. We may be required to expend our own funds to comply with the provisions of the ADA, which could materially and adversely affect us.
In addition, we are required to operate our properties in compliance with fire and safety regulations, building codes and other land use regulations, as they may be adopted by governmental agencies and bodies and become applicable to our properties. We may be required to make substantial capital expenditures to comply with those requirements and may be required to obtain approvals from various authorities with respect to our properties, including prior to acquiring a property or when undertaking renovations of any of our existing properties. There can be no assurance that existing laws and regulatory policies will not adversely affect us or the timing or cost of any renovations, or that additional regulations will not be adopted that increase such delays or result in additional costs. Additionally, failure to comply with any of these requirements could result in the imposition of fines by governmental authorities or awards of damages to private litigants. While we intend to only acquire properties that we believe are currently in substantial
compliance with all regulatory requirements, these requirements may change and new requirements may be imposed which would require significant unanticipated expenditures by us and could materially and adversely affect us.
As a result of acquiring C corporations in carry-over basis transactions, we may inherit material tax liabilities and other tax attributes from such acquired corporations, and we may be required to distribute earnings and profits.
From time to time, we have acquired C corporations in transactions in which the basis of the corporations’ assets in our hands is determined by reference to the basis of the assets in the hands of the acquired corporations, or carry-over basis transactions.
If we acquire any asset from a corporation that is or has been a C corporation in a carry-over basis transaction, and we subsequently recognize gain on the disposition of the asset during the five-year period beginning on the date on which we acquired the asset, then we will be required to pay regular U.S. federal corporate income tax on this gain to the extent of the excess of (1) the fair market value of the asset over (2) our adjusted basis in the asset, in each case determined as of the date on which we acquired the asset. Any taxes we pay as a result of such gain would reduce the amount available for distribution to our shareholders. The imposition of such tax may require us to forgo an otherwise attractive disposition of any assets we acquire from a C corporation in a carry-over basis transaction, and as a result may reduce the liquidity of our portfolio of investments. In addition, in such a carry-over basis transaction, we will succeed to any tax liabilities and earnings and profits of the acquired C corporation. To qualify as a REIT, we must distribute any non-REIT earnings and profits by the close of the taxable year in which such transaction occurs. Any adjustments to the acquired corporation’s income for taxable years ending on or before the date of the transaction, including as a result of an examination of the corporation’s tax returns by the IRS, could affect the calculation of the corporation’s earnings and profits. If the IRS were to determine that we acquired non-REIT earnings and profits from a corporation that we failed to distribute prior to the end of the taxable year in which the carry-over basis transaction occurred, we could avoid disqualification as a REIT by paying a “deficiency dividend.” Under these procedures, we generally would be required to distribute any such non-REIT earnings and profits to our shareholders within 90 days of the determination and pay a statutory interest charge at a specified rate to the IRS. Such a distribution would be in addition to the distribution of REIT taxable income necessary to satisfy the REIT distribution requirement and may require that we borrow funds to make the distribution even if the then-prevailing market conditions are not favorable for borrowings. In addition, payment of the statutory interest charge could materially and adversely affect us.
Changes in accounting standards may materially and adversely affect us.
From time to time the FASB, and the SEC, who create and interpret appropriate accounting standards, respectively, may change the financial accounting and reporting standards or their interpretation and application of these standards that will govern the preparation of our financial statements. These changes could materially and adversely affect our reported financial condition and results of operations. In some cases, we could be required to apply a new or revised standard retroactively, resulting in restating prior period financial statements. Similarly, these changes could materially and adversely affect our tenants’ reported financial condition or results of operations and affect their preferences regarding leasing real estate.
The FASB is considering various changes to GAAP, some of which may be significant, as part of a joint effort with the IASB to converge accounting standards. In particular, FASB issued a new accounting standard that requires companies to capitalize all leases on their balance sheets by recognizing a lessee’s rights and obligations. For public companies, this new standard will be effective for fiscal years beginning after December 15, 2018, including interim periods within those fiscal years. Many companies that account for certain leases on an “off balance sheet” basis would be required to account for such leases “on balance sheet” upon adoption of this rule. This change removes many of the differences in the way companies account for owned property and leased property, and could have a material effect on various aspects of our tenants’ businesses, including their credit quality and the factors they consider in deciding whether to own or lease properties. Additionally, it could cause companies that lease properties to prefer shorter lease terms in an effort to reduce the leasing liability required to be recorded on their balance sheet. This new standard could also make lease renewal options less attractive, because, under certain circumstances, the rule would require a tenant to assume that a renewal right will be exercised and accrue a liability relating to the longer lease term.
RISKS RELATED TO OUR INDEBTEDNESS
We are in default of payment obligations under certain of our indebtedness.
On January 16, 2019, our indirect wholly-owned subsidiaries as borrowers under the Shopko CMBS Loan Agreements defaulted on the loans secured by Shopko assets when those entities ceased to make interest payments as a result
of Shopko ceasing to pay its rent obligations following its bankruptcy filing. The full outstanding principal amount of $157.4 million under the Shopko CMBS Loan Agreements immediately became due and payable, and interest is accruing at the default rate of LIBOR plus 12.5% on the original loan portion and LIBOR plus 18.0% on the mezzanine loan portion. On March 1, 2019, the lenders foreclosed on the equity of the entity that owns the four property-owning subsidiaries.
We have have a significant amount of indebtedness.
As of December 31, 2018, we had approximately $2.18 billion aggregate principal amount of indebtedness outstanding, of which $2.02 billion incurs interest at a fixed rate. We may also incur significant additional debt to finance future investment activities. As of December 31, 2018, our Adjusted Debt to Annualized Adjusted EBITDAre ratio was 12.6x, our Adjusted Debt + Preferred to Annualized Adjusted EBITDAre ratio was 13.6x and our Fixed Charge Coverage Ratio was 1.4x, each of which include an adjustment to reflect the impact of Shopko's complete default on its payments to us. Our Fixed Charge Coverage Ratio does not reflect the impact of our amortizing debt principal payments. Payments of principal and interest on borrowings may leave us with insufficient cash resources to meet our cash needs or make the distributions to our shareholders necessary to maintain our REIT qualification. Our level of debt and the limitations imposed on us by our debt agreements could have significant adverse consequences, including the following:
| |
• | our cash flow may be insufficient to meet our required principal and interest payments; |
| |
• | cash interest expense and financial covenants relating to our indebtedness may limit or eliminate our ability to make distributions to our common shareholders and the holders of our Series A preferred shares and may adversely affect our ability to pay the asset management fee due under the Asset Management Agreement; |
| |
• | the inability to borrow additional funds as needed or on favorable terms, which could, among other things, adversely affect our ability to meet operational needs; |
| |
• | the inability to refinance our indebtedness at maturity or the refinancing terms may be less favorable than the terms of our original indebtedness; |
| |
• | the inability to hedge floating rate debt, counterparties may fail to honor their obligations under any hedge agreements we enter into, such agreements may not effectively hedge interest rate fluctuation risk, and, upon the expiration of any hedge agreements we enter into, we would be exposed to then-existing market rates of interest and future interest rate volatility; |
| |
• | the need to dispose of properties, possibly on unfavorable terms or in violation of certain covenants to which we may be subject; |
| |
• | the default on our obligations and foreclosure of the lenders or mortgagees on our properties or our interests in the entities that own the properties that secure their loans; |
| |
• | the restriction from accessing some of our excess cash flow after debt service if certain of our tenants fail to meet certain financial performance metric thresholds; |
| |
• | the violation of restrictive covenants in our loan documents, which would entitle the lenders to accelerate our debt obligations; and |
| |
• | our default under any loan with cross-default provisions could result in a default on other indebtedness. |
Changes in our leverage ratios may also negatively impact the market price of our equity or debt securities. Furthermore, foreclosures could create taxable income without accompanying cash proceeds, which could hinder our ability to meet the REIT distribution requirements imposed by the Code.
Current market conditions could adversely affect our ability to refinance existing indebtedness or obtain additional financing for growth on acceptable terms or at all.
Over the last few years, the credit markets have experienced significant price volatility, displacement and liquidity disruptions, including the bankruptcy, insolvency or restructuring of certain financial institutions. These circumstances have materially impacted liquidity in the financial markets, making financing terms for borrowers less attractive, and in certain cases, have resulted in the unavailability of various types of debt financing. As a result, we may be unable to obtain debt financing on favorable terms or at all or fully refinance maturing indebtedness with new indebtedness. Reductions in our available borrowing capacity or inability to obtain credit when required or when business conditions warrant could materially and adversely affect us.
Furthermore, if prevailing interest rates or other factors at the time of refinancing result in higher interest rates upon refinancing, then the interest expense relating to that refinanced indebtedness would increase. Higher interest rates on newly incurred debt may negatively impact us as well. If interest rates increase, our interest costs and overall costs
of capital will increase, which could materially and adversely affect us. Total debt service, including scheduled principal maturities and interest, for 2019 and 2020 is $314.6 million and $491.4 million, respectively.
Our financing arrangements involve balloon payment obligations.
Our financings require us to make a lump-sum or “balloon” payment at maturity. In addition, there are principal amortization payments of $110.8 million due under our debt instruments prior to January 1, 2022. Our ability to make any balloon payment is uncertain and may depend on our ability to obtain additional financing or our ability to sell our properties. At the time the balloon payment is due, we may or may not be able to refinance the balloon payment on terms as favorable as the original loan or sell our properties at a price sufficient to make the balloon payment, if at all. If the balloon payment is refinanced at a higher rate, it will reduce or eliminate any income from our properties. Our inability to meet a balloon payment obligation, through refinancing or sale proceeds, or refinancing on less attractive terms could materially and adversely affect us.
The agreements governing our indebtedness contain restrictions and covenants which may limit our ability to enter into or obtain funding for certain transactions, operate our business or make distributions to our common shareholders.
The agreements governing our indebtedness contain restrictions and covenants that limit or will limit our ability to operate our business. These covenants, as well as any additional covenants to which we may be subject in the future because of additional indebtedness, could cause us to forgo investment opportunities, reduce or eliminate distributions to our common shareholders or obtain financing that is more expensive than financing we could obtain if we were not subject to the covenants. In addition, the agreements may have cross default provisions, which provide that a default under one of our financing agreements would lead to a default on some or all of our debt financing agreements.
If an event of default occurs under our current or future CMBS loans, if the master tenants at the properties that secure such CMBS loans fail to maintain certain EBITDAR ratios, or if an uncured monetary default exists under the master leases, such as in the case of the Shopko CMBS Loan Agreements, then a portion of or all of the cash which would otherwise be distributed to us may be restricted by our lenders and unavailable to us until the terms are cured or the debt refinanced. If the financial performance of the collateral for our indebtedness under our Master Trust 2014 fails to achieve certain financial performance criteria, cash from such collateral may be unavailable to us until the terms are cured or the debt refinanced. Such cash sweep triggering events have occurred previously and may be ongoing from time to time. The occurrence of these events limit the amount of cash available to us for use in our business and could limit or eliminate our ability to make distributions to our common shareholders.
The covenants and other restrictions under our debt agreements affect, among other things, our ability to:
| |
• | sell or substitute assets; |
| |
• | modify certain terms of our leases; |
| |
• | prepay debt with higher interest rates; |
| |
• | manage our cash flows; and |
| |
• | make distributions to equity holders. |
Additionally, we must comply with certain covenants in order to incur additional leverage under our Master Trust 2014. All of these restrictions may adversely affect our operating and financial flexibility and may limit our ability to respond to changes in our business or competitive environment, all of which may materially and adversely affect us.
RISKS RELATED TO OUR RELATIONSHIP WITH OUR MANAGER
We depend on our Manager to conduct our business and any material adverse change in its financial condition or our relationship with our Manager could have a material adverse effect on our business and ability to achieve our investment objectives.
We have no employees. We are completely reliant on our Manager for the effective operation of our business, which has discretion regarding the implementation of our operating policies and strategies, subject to the supervision of our Board of Trustees. Our officers and other individuals who perform services for us are employees of our Manager, including certain key employees of our Manager whose continued service is not guaranteed. Our Manager may suffer or become distracted by adverse financial or operational problems in connection with our Manager’s business and activities unrelated to us and over which we have no control. Should our Manager fail to allocate sufficient resources to perform its responsibilities to us for any reason, we may be unable to achieve our investment objectives or to pay distributions to our shareholders.
Lastly, we are subject to the risk that our Manager may terminate the Asset Management Agreement and that we will not be able to find a suitable replacement for our Manager in a timely manner, at a reasonable cost or at all. Our Manager may terminate our Asset Management Agreement without cause upon 180-day notice prior to the expiration of the original term or any renewal term. Our Manager may terminate our Asset Management Agreement upon 60 days’ prior written notice for cause in the event that we are in default in the performance or observance of any material term, condition or covenant contained in our Asset Management Agreement and such default continues for a period of 30 days after such notice specifying such default and requesting that the same be remedied within 30 days, or effective immediately concurrently with or within 90 days following a Change in Control or a non-cause termination of the Property Management and Servicing Agreement, in each case upon 30 days’ notice to us. Furthermore, if the Asset Management Agreement is terminated for any reason, our Manager may resign as property manager and special servicer of Master Trust 2014, subject to certain conditions, which could adversely our results of operations and financial condition.
There are conflicts of interest in our relationship with our Manager.
There are conflicts of interest in our relationship with our Manager insofar as our Manager and its parent, Spirit, have investment objectives that overlap with our investment objectives. Spirit has instituted a proprietary Spirit Property Ranking Model that our Manager will also apply to our portfolio. The Spirit Property Ranking Model is used annually to rank all properties across twelve factors and weightings, consisting of both real estate quality scores and credit underwriting criteria, in order to benchmark property quality, identify asset recycling opportunities and to enhance disposition decisions. Spirit also updates the Spirit Heat Map that will be used for us and Spirit, which analyzes tenant industries across Porter’s Five Forces and potential causes of technological disruption to identify tenant industries which Spirit believes to have good fundamentals for future performance. Our Manager will use an “every other” rotation system when considering potential investments by Spirit and us, subject to available liquidity and certain other criteria. As a result, we may not be presented with certain investment opportunities that may be appropriate for us. Additionally, we own real estate assets in the same geographic regions as Spirit and may compete with it for tenants. This competition may affect our ability to attract and retain tenants and may reduce the rent we are able to charge.
The ability of our Manager and its officers and employees to engage in other business activities, subject to the terms of our Asset Management Agreement with our Manager, may reduce the amount of time our Manager, its officers or other employees spend managing us. In addition, we may engage (subject to our investment manual and conflicts of interest policy) in material transactions with our Manager or Spirit, which may present an actual, potential or perceived conflict of interest. In order to avoid any actual, potential or perceived conflicts of interest with our Manager or Spirit, we adopted a conflicts of interest policy to address specifically some of the conflicts relating to our activities. However, there is no assurance that this policy will be adequate to address all of the conflicts of interest that may arise or to address such conflicts in a manner that is favorable to us.
It is possible that actual, potential or perceived conflicts of interest could give rise to investor dissatisfaction, litigation or regulatory enforcement actions. Appropriately dealing with conflicts of interest is complex and difficult, and our reputation could be damaged if we fail, or appear to fail, to deal appropriately with one or more potential, actual or perceived conflicts of interest. Regulatory scrutiny of, or litigation in connection with, conflicts of interest could have a material adverse effect on our reputation, which could materially adversely affect our business in a number of ways, including difficulty in raising additional funds, a reluctance of counterparties to do business with us, a decrease in the prices of our equity securities and a resulting risk of litigation and regulatory enforcement actions.
Certain terms of our Asset Management Agreement could make it difficult and costly to terminate our Manager and could delay or prevent a change of control transaction.
The initial term of our Asset Management Agreement will be three years from its effective date, with automatic one-year renewal terms on each anniversary date thereof, unless previously terminated by us or by our Manager. In the event of a termination of our Asset Management Agreement by us without cause or a termination for cause by our Manager for cause (including upon a Change in Control, as defined elsewhere in this information statement), our Manager will be entitled to a termination fee equal to 1.75 times the sum of (x) the management fee for the 12 full calendar months preceding the effective termination date, plus (y) all fees due to the Manager or its affiliates under the Property Management and Servicing Agreement for the 12 full calendar months preceding the effective termination date. Additionally, our Manager will receive a promoted interest pursuant to our Asset Management Agreement based on our performance and our ability to generate total shareholder return, due upon the earlier of (i) a termination of our Asset Management Agreement by us without cause, (ii) a termination of our Asset Management Agreement by our Manager for cause (including upon a Change in Control), and (iii) the date that is 36 full calendar months after the distribution date. The termination fee and promoted interest will increase the cost to us of terminating our Asset
Management Agreement and may make termination more difficult. Additionally, the termination fee and promoted interest could have the effect of delaying, deferring or preventing a Change in Control that would otherwise be economically attractive to us.
The offer to purchase feature of the Series A preferred shares owned by our Manager could affect change of control transactions.
Our Manager owns Series A preferred shares, which may give it different incentives from our common shareholders in a change of control transaction. Upon the occurrence of a Change of Control (as defined), we must offer to purchase the Series A preferred shares held by our Manager at the liquidation preference, plus any accrued and unpaid dividends to, but not including, the payment date. As such, our Manager might be incentivized to facilitate a Change of Control even if such Change of Control might not otherwise prove beneficial to our common shareholders. At the same time, the offer to purchase feature of the Series A preferred shares held by our Manager may have the effect of discouraging a third party from making an acquisition proposal for our company or of delaying, deferring or preventing a Change of Control if we do not have sufficient cash to complete such offer to purchase, under circumstances that otherwise could provide our common shareholders with the opportunity to realize a premium over the then-current market price or that our common shareholders may otherwise believe is in their best interests.
We must pay a base management fee to our Manager regardless of our performance.
Our Manager is entitled to a substantial base management fee from us for the first three years, regardless of the performance of our portfolio. Our Manager’s entitlement to a base fee, which is not based upon performance metrics or goals, might reduce its incentive to devote its time and effort to seeking investments that maximize total returns to our shareholders. This in turn could negatively impact both our ability to make distributions to our shareholders and the market price of our common shares.
We do not own the Spirit name and may not be able to continue to use the Spirit name in the future.
Under our Asset Management Agreement, we and our affiliates have a royalty-free, non-exclusive and nontransferable license to use the name “Spirit”. Pursuant to the Asset Management Agreement, we have a right to use this name for so long as Spirit Realty, L.P. (or an affiliate thereof) serves as our Manager. The Manager and its affiliates retain the right to continue using the “Spirit” name. We will be unable to preclude the Manager or its affiliates from licensing or transferring the ownership of the “Spirit” name to third parties, some of whom may compete with us. Consequently, we will be unable to prevent any damage to goodwill that may occur as a result of the activities of the Manager or others. Furthermore, in the event that our Asset Management Agreement is terminated, we and our affiliates will be required to, among other things, change our name. Any of these events could disrupt our recognition in the market place, damage any goodwill we may have generated and otherwise harm our business.
RISKS RELATED TO THE SPIN-OFF
Prior to the Spin-off, we had no history operating as an independent company, and most of our historical financial information is not necessarily representative of the results that we would have achieved as a separate, publicly traded company and may not be a reliable indicator of our future results.
Most of the historical information we have included in this Annual Report on Form 10-K, including for the fiscal years ended 2016, 2017 and six months ended June 30, 2018, has been derived from Spirit’s consolidated financial statements and accounting records and does not necessarily reflect what our financial position, results of operation or cash flows would have been had we been a separate, stand-alone company during those periods presented, or those that we will achieve in the future. Our cost structure, management, financing and business operations are significantly different as a result of recently operating as an independent, externally-managed public company. These changes result in increased costs, including, but not limited to, fees paid to our Manager, legal, accounting, compliance and other costs associated with being a public company.
Certain of our agreements with Spirit may not reflect terms that would have resulted from arm’s-length negotiations among unaffiliated third parties.
Certain of the agreements related to the Spin-off, including the Separation and Distribution Agreement and Management Agreement, were prepared in the context of the Spin-off while we were still part of Spirit and, accordingly, did not result from arm’s-length negotiations among unaffiliated third parties and, therefore, may not reflect terms that would have resulted from an arm's-length negotiation. The terms of the agreements prepared in the context of our Spin-off related
to, among other things, allocation of assets, liabilities, rights, indemnifications and other obligations among Spirit and us.
The ownership by our executive officers and some of our trustees of shares of common stock, options, or other equity awards of Spirit may create, or may create the appearance of, conflicts of interest.
Some of our trustees and employees of the Manager own common stock or options to purchase common stock of Spirit, or any other equity awards, which creates, or may create, the appearance of conflicts of interest when these trustees and officers are faced with decisions regarding transaction between Spirit and us, or our Manager and us, that could have different implications for Spirit or our Manager, as applicable, than they do for us.
RISKS RELATED TO OWNERSHIP OF OUR COMMON SHARES AND OUR ORGANIZATIONAL STRUCTURE
Changes in market interest rates may adversely impact the value of our common shares.
The market price of our common shares will generally be influenced by the dividend yield on our common shares (as a percentage of the price of our common shares) relative to market interest rates. An increase in market interest rates, which are currently at low levels relative to historical rates, may lead prospective purchasers of shares of our common shares to expect a higher dividend yield. However, higher market interest rates would likely increase our borrowing costs and potentially decrease funds available for distribution. Thus, higher market interest rates could cause the market price of our common shares to decrease.
The market price and trading volume of our common shares may fluctuate or decline.
The market price and trading volume of our common shares may fluctuate widely due to various factors, including:
| |
• | actual or anticipated variations in our or our competitors' quarterly operating results or distributions; |
| |
• | publication of research reports about us, our competitors or the real estate industry; |
| |
• | adverse market reaction to any additional indebtedness we incur or debt or equity securities we or the Operating Partnership issue in the future; |
| |
• | additions or departures of key management personnel; |
| |
• | changes in our credit ratings; |
| |
• | the financial condition, performance and prospects of our tenants; and |
| |
• | the realization of any of the other risk factors presented in this Annual Report on Form 10-K. |
We may issue shares of our common shares or other securities without shareholder approval, including shares issued to satisfy REIT dividend distribution requirements. Our existing shareholders have no preemptive rights to acquire any of these securities, and any issuance of equity securities by us may dilute shareholder investment.
Broad market fluctuations could negatively impact the market price of our common shares.
The stock market has experienced extreme price and volume fluctuations that have affected the market price of the common equity of many companies in industries similar or related to ours and that have been unrelated to these companies’ operating performances. These broad market fluctuations could reduce the market price of our common shares. Furthermore, our operating results and prospects may be below the expectations of public market analysts and investors or may be lower than those of companies with comparable market capitalizations. Either of these factors could lead to a material decline in the per share trading price of our common shares.
We have not established a minimum distribution payment level and we cannot assure you of our ability to pay distributions in the future.
We intend to make quarterly distributions of an amount at least equal to all or substantially all of our REIT taxable income to holders of our common shares out of assets legally available therefore. We have not established a minimum distribution payment level and our ability to pay distributions may be adversely affected by a number of factors, including the risk factors described in this Annual Report. Distributions will be authorized by our Board of Trustees and declared by us based upon a number of factors, including actual results of operations, restrictions under Delaware law or any applicable debt covenants, our financial condition, our taxable income, the annual distribution requirements under the REIT provisions of the Code, our operating expenses and other factors our Board of Trustees deems relevant. We cannot assure you that we will achieve investment results that will allow us to make a specified level of cash distributions or year-to-year increases in cash distributions in the future.
Furthermore, we may elect not to maintain our REIT status, subject to the requirements of the Tax Matters Agreement, in which case we would no longer be required to make distributions in order to maintain our REIT status (as described below under "Risks Related to Taxes and Our Status as a REIT"). Moreover, even if we do elect to maintain our REIT status, we may elect to comply with the applicable requirements by, after completing various procedural steps, distributing, under certain circumstances, a portion of the required amount in the form of our common shares in lieu of cash. If we elect not to maintain our REIT status or to satisfy any required distributions in shares of common shares in lieu of cash, such action could negatively affect our business and financial condition as well as the price of our common shares. No assurance can be given that we will pay any dividends on our common shares in the future.
Future offerings of additional debt securities, which would be senior to our common shares upon liquidation, and/or preferred equity securities that may be senior to our common shares for purposes of distributions or upon liquidation, may materially and adversely affect the market price of our common shares.
In the future, we may attempt to increase our capital resources by making offerings of preferred equity securities or additional debt securities (or causing our Operating Partnership to issue debt securities). Upon liquidation, holders of our debt securities and preferred shares and lenders with respect to other borrowings will receive distributions of our available assets prior to our common shareholders. Additionally, any additional convertible or exchangeable securities that we issue in the future may have rights, preferences and privileges more favorable than those of our common shares and may result in dilution to owners of our common shares. Our common shareholders are not entitled to preemptive rights or other protections against dilution. Our preferred shares, if issued, could have a preference on liquidating distributions or a preference on distribution payments that could limit our ability to make distributions to our common shareholders. In addition, our common shares ranks junior to our Series A preferred shares. Our outstanding Series A preferred shares also have a preference upon our dissolution, liquidation or winding up in respect of assets available for distribution to our common shareholders. Because our decision to issue securities in any future offering will depend on market conditions and other factors beyond our control, we cannot predict or estimate the amount, timing or nature of our future offerings. Our common shareholders bear the risk of our future offerings reducing the per share trading price of our common shares.
Your percentage ownership in us may be diluted in the future.
Your percentage ownership of common shares may be diluted in the future because of equity awards that we expect to be granted to our Manager, to the directors, officers and employees of our Manager who perform services for us, and to our trustees and officers, as well as other equity instruments. Our Board of Trustees approved an equity incentive plan (the "2018 Incentive Award Plan"), providing for the grant of equity-based awards, under which we reserved 3,645,000 shares of our common shares for issuance. The issuance of these shares of common shares and other potential issuances are likely to have a dilutive effect on your ownership percentage.
We are an “emerging growth company” and we cannot be certain if the reduced disclosure requirements applicable to emerging growth companies will make our common shares less attractive to investors.
We are an “emerging growth company,” as defined in the JOBS Act, and we may choose to take advantage of certain exemptions from various reporting requirements that are applicable to other public companies, including, but not limited to, not being required to comply with the auditor attestation requirements of Section 404(b) of SOX, reduced disclosure obligations regarding executive compensation in our periodic reports and proxy statements, and exemptions from the requirements of holding a nonbinding advisory vote on executive compensation and shareholder approval of any golden parachute payments not previously approved. We may choose to take advantage of these reporting exemptions until we are no longer an emerging growth company. We cannot predict if investors will find our common shares less attractive if we choose to rely on these exemptions. If some investors find our common shares less attractive as a result, there may be a less active trading market for our common shares and our share price may be more volatile.
We will remain an emerging growth company for up to five years, although we may lose that status sooner. We would cease to qualify as an emerging growth company on the earliest of (i) the last day of any fiscal year in which we have more than $1.07 billion of revenue, (ii) the last day of any fiscal year in which we have more than $700.0 million in market value of our common shares held by non-affiliates as of June 30 of such fiscal year and (iii) the date on which we issue more than $1.0 billion of non-convertible debt over a rolling three-year period.
Under the JOBS Act, emerging growth companies can delay adopting new or revised accounting standards until such time as those standards apply to private companies. We may choose to elect to avail ourselves of this exemption from new or revised accounting standards and, if we do, we would be subject to the different new or revised accounting standards than public companies that are not emerging growth companies.
To the extent that we rely on any of the exemptions available to emerging growth companies, you will receive less information about our executive compensation and internal control over financial reporting than issuers that are not emerging growth companies. If some investors find our common shares to be less attractive as a result, there may be a less active trading market for our common shares and our share price may be more volatile.
Our declaration of trust and bylaws and Maryland law contain provisions that may delay, defer or prevent a change of control transaction, even if such a change in control may be in the interest of our shareholders.
Our declaration of trust contains certain restrictions on ownership and transfer of our common shares. Our declaration of trust contains various provisions that are intended to preserve our qualification as a REIT and, subject to certain exceptions, authorize our trustees to take such actions as are necessary or appropriate to preserve our qualification as a REIT. For example, our declaration of trust prohibits the actual, beneficial or constructive ownership by any person of more than 9.8% in value of the aggregate of our outstanding shares of all classes and series, or more than 9.8% in value or in number of shares, whichever is more restrictive, of our outstanding common shares or any class or series of our outstanding preferred shares. Our Board of Trustees, in its sole and absolute discretion, may exempt a person, prospectively or retroactively, from these ownership limits if certain conditions are satisfied. The restrictions on ownership and transfer of our common shares may:
| |
• | discourage a tender offer or other transactions or a change in management or of control that might involve a premium price for our common shares or that our shareholders otherwise believe to be in their best interests; or |
| |
• | result in the transfer of shares acquired in excess of the restrictions to a trust for the benefit of a charitable beneficiary and, as a result, the forfeiture by the acquirer of the benefits of owning the additional shares. |
We could increase the number of authorized shares of common shares of beneficial interest, classify and reclassify unissued shares of beneficial interest and issue shares of beneficial interest without shareholder approval. Our Board of Trustees, without shareholder approval, has the power under our declaration of trust to amend our declaration of trust to increase the aggregate number of shares of beneficial interest or the number of shares of beneficial interest of any class or series that we are authorized to issue, to authorize us to issue authorized but unissued common shares or preferred shares and to classify or reclassify any unissued common shares or preferred shares into one or more classes or series of shares of beneficial interest and to set the terms of such newly classified or reclassified shares. As a result, we may issue one or more series or classes of common shares or preferred shares with preferences, dividends, powers and rights, voting or otherwise, that are senior to, or otherwise conflict with, the rights of our common shareholders. Although our Board of Trustees has no such intention at the present time, it could establish a class or series of common shares or preferred shares that could, depending on the terms of such series, delay, defer or prevent a transaction or a change of control that might involve a premium price for our common shares or otherwise be in the best interest of our shareholders.
Certain provisions of Maryland law could inhibit changes in control, which may discourage third parties from conducting a tender offer or seeking other change of control transactions that could involve a premium price for our common shares or that our shareholders otherwise believe to be in their best interest. For more information regarding these provisions, see “Certain Provisions of Maryland Law and Our Declaration of Trust and Bylaws.” Such provisions include the following:
| |
• | “business combination” provisions that, subject to certain limitations, prohibit certain business combinations between us and an “interested shareholder” (defined generally as any person who beneficially owns 10% or more of the voting power of our shares or of an affiliate of ours or an affiliate or associate of ours who was the beneficial owner, directly or indirectly, of 10% or more of the voting power of our then outstanding voting shares at any time within a two-year period immediately prior to the date in question) or any affiliate of an interested shareholder for five years after the most recent date on which the shareholder becomes an interested shareholder, and thereafter impose fair price and/or supermajority and shareholder voting requirements on these combinations; and |
| |
• | “control share” provisions that provide that a holder of “control shares” of our Company (defined as shares that, when aggregated with other shares controlled by the shareholder, entitle the shareholder to exercise one of three increasing ranges of voting power in electing trustees) acquired in a “control share acquisition” (defined as the direct or indirect acquisition of ownership or control of outstanding “control shares”) has no voting rights with respect to those shares except to the extent approved by our shareholders by the affirmative vote of at least two-thirds of all the votes entitled to be cast on the matter, excluding all interested shares. |
As permitted by Maryland law, we have elected, pursuant to provisions in our declaration of trust, to opt out of the Maryland Business Combination Act and to exempt any acquisition of our common shares from the Maryland Control
Share Acquisition Act. Any amendment to or repeal of either of these provisions of our declaration of trust must be approved by our shareholders by the affirmative vote of a majority of all the votes entitled to be cast on the matter. In the event that either of these provisions of our declaration of trust are amended or revoked by our shareholders, we would be subject to the Maryland Business Combination Act and/or the Maryland Control Share Acquisition Act, as the case may be.
Certain provisions of Maryland law permit our Board of Trustees, without shareholder approval and regardless of what is currently provided in our declaration of trust or bylaws, to implement certain corporate governance provisions, some of which (for example, a classified board) are not currently applicable to us. These provisions may have the effect of limiting or precluding a third party from making an unsolicited acquisition proposal for us or of delaying, deferring or preventing a change in control of us under circumstances that otherwise could be in the best interests of our shareholders. Our declaration of trust contains a provision whereby we elect, at such time as we become eligible to do so, to be subject to the provisions of Title 3, Subtitle 8 of the MGCL, or Subtitle 8, relating to the filling of vacancies on our Board of Trustees. However, we have opted out of the provision of Subtitle 8 that would have permitted our Board of Trustees to unilaterally divide itself into classes with staggered terms of three years each (also referred to as a classified board) without shareholder approval, and we are prohibited from electing to be subject to such provision of Subtitle 8 unless such election is first approved by our shareholders by the affirmative vote of a majority of all the votes entitled to be cast on the matter. We do not currently have a classified board.
Our Board of Trustees may change our investment and financing policies without shareholder approval and we may become more highly leveraged, which may increase our risk of default under our debt obligations.
Our investment and financing policies are exclusively determined by our Board of Trustees. Accordingly, our shareholders do not control these policies. Further, our organizational documents do not limit the amount or percentage of indebtedness, funded or otherwise, that we may incur. Our Board of Trustees may alter or eliminate our current policy on borrowing at any time without shareholder approval. If this policy changed, we could become more highly leveraged, which could result in an increase in our debt service. Higher leverage also increases the risk of default on our obligations. In addition, a change in our investment policies, including the manner in which we allocate our resources across our portfolio or the types of assets in which we seek to invest, may increase our exposure to interest rate risk, real estate market fluctuations and liquidity risk. Changes to our policies with regards to the foregoing could materially and adversely affect us.
Our rights and the rights of our shareholders to take action against our trustees and officers are limited.
As permitted by Maryland law, our declaration of trust limits the liability of our trustees and officers to us and our shareholders for money damages, except for liability resulting from:
| |
• | actual receipt of an improper benefit or profit in money, property or services; or |
| |
• | active and deliberate dishonesty by the trustee or officer that was established by a final judgment as being material to the cause of action adjudicated. |
As a result, we and our shareholders have rights against our trustees and officers that are more limited than might otherwise exist. Accordingly, in the event that actions taken in good faith by any of our trustees or officers impede the performance of our company, our shareholders’ and our ability to recover damages from such trustee or officer will be limited. In addition, our declaration of trust authorizes us to obligate our company, and our bylaws require us, to indemnify our trustees and officers (and, with the approval of our Board of Trustees, any employee or agent of ours) for actions taken by them in those and certain other capacities to the maximum extent permitted by Maryland law.
We are a holding company with no direct operations and will rely on funds received from the Operating Partnership to pay liabilities.
We are a holding company and conduct substantially all of our operations through the Operating Partnership. We do not have, apart from an interest in the Operating Partnership, any independent operations. As a result, we rely on distributions from the Operating Partnership to pay any dividends we might declare on our common shares. We also rely on distributions from the Operating Partnership to meet any of our obligations, including any tax liability on taxable income allocated to us from the Operating Partnership. In addition, because we are a holding company, shareholder claims will be structurally subordinated to all existing and future liabilities and obligations (whether or not for borrowed money) of the Operating Partnership and its subsidiaries. Therefore, in the event of our bankruptcy, liquidation or reorganization, our assets and those of the Operating Partnership and its subsidiaries will be able to satisfy the claims of our shareholders only after all of our and the Operating Partnership’s and its subsidiaries’ liabilities and obligations have been paid in full.
We own directly or indirectly 100% of the interests in the Operating Partnership. However, in the future, we may issue partnership interests of the Operating Partnership to third parties. Such issuances would reduce our ownership in the Operating Partnership. Because our shareholders will not directly own partnership interests of the Operating Partnership, they will not have any voting rights with respect to any such issuances or other partnership level activities of the Operating Partnership.
Conflicts of interest could arise in the future between the interests of our shareholders and the interests of holders of partnership interests in the Operating Partnership, which may impede business decisions that could benefit our shareholders.
Conflicts of interest could arise in the future as a result of the relationships between us and our affiliates, on the one hand, and the Operating Partnership or any future partner thereof, on the other. Our trustees and officers have duties to our company under applicable Maryland law in connection with the management of our company. At the same time, one of our wholly-owned subsidiaries, OP Holdings, as the general partner of the Operating Partnership, has fiduciary duties and obligations to the Operating Partnership and its future limited partners under Delaware law and the partnership agreement of the Operating Partnership in connection with the management of the Operating Partnership. The fiduciary duties and obligations of OP Holdings, as general partner of the Operating Partnership, and its future partners may come into conflict with the duties of the trustees and officers of our company.
Under the terms of the partnership agreement of the Operating Partnership, if there is a conflict between the interests of our shareholders on one hand and any future limited partners on the other, we will endeavor in good faith to resolve the conflict in a manner not adverse to either our shareholders or any future limited partners; provided, however, that for so long as we own a controlling interest in the Operating Partnership, any conflict that cannot be resolved in a manner not adverse to either our shareholders or any future limited partners shall be resolved in favor of our shareholders.
The partnership agreement also provides that the general partner will not be liable to the Operating Partnership, its partners or any other person bound by the partnership agreement for monetary damages for losses sustained, liabilities incurred or benefits not derived by the Operating Partnership or any future limited partner, except for liability for the general partner’s intentional harm or gross negligence. Moreover, the partnership agreement provides that the Operating Partnership is required to indemnify the general partner and its members, managers, managing members, officers, employees, agents and designees from and against any and all claims that relate to the operations of the Operating Partnership, except (1) if the act or omission of the person was material to the matter giving rise to the action and either was committed in bad faith or was the result of active or deliberate dishonesty, (2) for any transaction for which the indemnified party received an improper personal benefit, in money, property or services or otherwise in violation or breach of any provision of the partnership agreement or (3) in the case of a criminal proceeding, if the indemnified person had reasonable cause to believe that the act or omission was unlawful.
RISKS RELATED TO OUR TAXES AND OUR STATUS AS A REIT
Failure to qualify as a REIT would materially and adversely affect us and the value of our common shares.
We will elect to be taxed as a REIT and believe we will be organized and operate in a manner that will allow us to qualify and to remain qualified as a REIT for U.S. federal income tax purposes commencing with our taxable year ended December 31, 2018. We have not requested and do not plan to request a ruling from the IRS that we qualify as a REIT and the statements in this Annual Report are not binding on the IRS or any court. Therefore, we cannot guarantee that we will qualify as a REIT or that we will remain qualified as such in the future. If we fail to qualify as a REIT or lose our REIT status, we will face significant tax consequences that would substantially reduce our cash available for distribution to our shareholders for each of the years involved because:
| |
• | we would not be allowed a deduction for distributions to shareholders in computing our taxable income and would be subject to regular U.S. federal corporate income tax; |
| |
• | we could be subject to increased state and local taxes; and |
| |
• | unless we are entitled to relief under applicable statutory provisions, we could not elect to be taxed as a REIT for four taxable years following the year during which we were disqualified. |
Any such corporate tax liability could be substantial and would reduce our cash available for, among other things, our operations and distributions to shareholders. In addition, if we fail to qualify as a REIT, we will not be required to make distributions to our shareholders. As a result of all these factors, our failure to qualify as a REIT also could impair our ability to expand our business and raise capital, and could materially and adversely affect the trading price of our common shares.
Qualification as a REIT involves the application of highly technical and complex Code provisions for which there are only limited judicial and administrative interpretations. The determination of various factual matters and circumstances not entirely within our control may affect our ability to qualify as a REIT. In order to qualify as a REIT, we must satisfy a number of requirements, including requirements regarding the ownership of our common shares, requirements regarding the composition of our assets and a requirement that at least 95% of our gross income in any year must be derived from qualifying sources, such as “rents from real property.” Also, we must make distributions to shareholders aggregating annually at least 90% of our REIT taxable income, determined without regard to the dividends paid deduction and excluding any net capital gains. In addition, legislation, new regulations, administrative interpretations or court decisions may materially and adversely affect our investors, our ability to qualify as a REIT for federal income tax purposes or the desirability of an investment in a REIT relative to other investments.
We own and may acquire direct or indirect interests in one or more entities that have elected or will elect to be taxed as REITs under the Code (each, a “Subsidiary REIT”). A Subsidiary REIT is subject to the various REIT qualification requirements and other limitations described herein that are applicable to us. If a Subsidiary REIT were to fail to qualify as a REIT, then (i) that Subsidiary REIT would become subject to federal income tax, (ii) shares in such Subsidiary REIT would cease to be qualifying assets for purposes of the asset tests applicable to REITs, and (iii) it is possible that we would fail certain of the asset tests applicable to REITs, in which event we would fail to qualify as a REIT unless we could avail ourselves of certain relief provisions.
Even if we qualify as a REIT for federal income tax purposes, we may be subject to some federal, state and local income, property and excise taxes on our income or property and, in certain cases, a 100% penalty tax, in the event we sell property as a dealer. In addition, our TRSs will be subject to income tax as regular corporations in the jurisdictions in which they operate.
If Spirit failed to qualify as a REIT during certain periods prior to the Spin-Off, we would be prevented from electing to qualify as a REIT.
Under applicable Treasury Regulations, if Spirit failed to qualify as a REIT during certain periods prior to the Spin-Off, unless Spirit’s failure was subject to relief under U.S. federal income tax laws, we would be prevented from electing to qualify as a REIT prior to the fifth calendar year following the year in which Spirit failed to qualify.
If certain of our subsidiaries, including the Operating Partnership, fail to qualify as partnerships or disregarded entities for federal income tax purposes, we would cease to qualify as a REIT and suffer other adverse consequences.
One or more of our subsidiaries may be treated as a partnership or disregarded entity for federal income tax purposes and, therefore, will not be subject to federal income tax on its income. Instead, each of its partners or its owner, as applicable, which may include us, will be allocated, and may be required to pay tax with respect to, such partner’s or owner’s share of its income. We cannot assure you that the IRS will not challenge the status of any subsidiary partnership or limited liability company in which we own an interest as a disregarded entity or partnership for federal income tax purposes, or that a court would not sustain such a challenge. If the IRS were successful in treating any subsidiary partnership or limited liability company as an entity taxable as a corporation for federal income tax purposes, we could fail to meet the gross income tests and certain of the asset tests applicable to REITs and, accordingly, we would likely cease to qualify as a REIT. Also, the failure of any subsidiary partnerships or limited liability company to qualify as a disregarded entity or partnership for applicable income tax purposes could cause it to become subject to federal and state corporate income tax, which would reduce significantly the amount of cash available for debt service and for distribution to its partners or members, including us.
Our ownership of TRSs is subject to certain restrictions, and we will be required to pay a 100% penalty tax on certain income or deductions if our transactions with our TRSs are not conducted on arm’s-length terms.
From time to time we may own interests in one or more TRSs. A TRS is a corporation, other than a REIT, in which a REIT directly or indirectly holds shares and that has made a joint election with such REIT to be treated as a TRS. If a TRS owns more than 35% of the total voting power or value of the outstanding securities of another corporation, such other corporation will also be treated as a TRS. Other than some activities relating to lodging and health care facilities, a TRS may generally engage in any business, including the provision of customary or non-customary services to tenants of its parent REIT. A TRS is subject to federal income tax as a regular C corporation. In addition, a 100% excise tax will be imposed on certain transactions between a TRS and its parent REIT that are not conducted on an arm’s-length basis.
A REIT’s ownership of securities of a TRS is not subject to the 5% or 10% asset tests applicable to REITs. Not more than 25% of the value of our total assets may be represented by securities (including securities of TRSs), other than those securities includable in the 75% asset test, and not more than 20% of the value of our total assets may be represented by securities of TRSs. We anticipate that the aggregate value of the shares and securities of any TRS and other nonqualifying assets that we own will be less than 20% of the value of our total assets, and we will monitor the value of these investments to ensure compliance with applicable ownership limitations. In addition, we intend to structure our transactions with any TRSs that we own to ensure that they are entered into on arm’s-length terms to avoid incurring the 100% excise tax described above. There can be no assurance, however, that we will be able to comply with the above limitations or to avoid application of the 100% excise tax discussed above.
We may be forced to borrow funds to maintain our REIT status, and the unavailability of such capital on favorable terms at the desired times, or at all, may cause us to curtail our investment activities and/or to dispose of assets at inopportune times, which could materially and adversely affect us.
To qualify as a REIT, we generally must distribute to our shareholders at least 90% of our REIT taxable income each year, determined without regard to the dividends paid deduction and excluding any net capital gains, and we will be subject to regular corporate income taxes on our undistributed taxable income to the extent that we distribute less than 100% of our REIT taxable income, determined without regard to the dividends paid deduction and including any net capital gains, each year. In addition, we will be subject to a 4% nondeductible excise tax on the amount, if any, by which distributions paid by us in any calendar year are less than the sum of 85% of our ordinary income, 95% of our capital gain net income and 100% of our undistributed income from prior years. We could have a potential distribution shortfall as a result of, among other things, differences in timing between the actual receipt of cash and recognition of income for federal income tax purposes, or the effect of non-deductible capital expenditures, the creation of reserves or required debt or amortization payments. Also, the ability of Master Trust 2014 to make cash distributions is limited and, in some cases, could be eliminated entirely. In addition, as discussed in this Annual Report, our tenants, such as Shopko in connection with its bankruptcy filing, may experience a downturn in their business, and as a result may delay lease commencement, decline to extend a lease upon its expiration, fail to make rental payments when due, become insolvent or declare bankruptcy. In order to maintain REIT status and avoid the payment of income and excise taxes, we may need to borrow funds to meet the REIT distribution requirements. Our ability to borrow funds, however, may not be available on favorable terms or at all. Our access to third-party sources of capital depends on a number of factors, including our current debt levels, the market price of our common shares, and our current and potential future earnings. We cannot assure you that we will have access to such capital on favorable terms at the desired times, or at all, which may cause us to dispose of assets at inopportune times, and could materially and adversely affect us. Alternatively, we may make taxable in-kind distributions of our own shares, which may cause our shareholders to be required to pay income taxes with respect to such distributions in excess of any cash they receive, or we may be required to withhold taxes with respect to such distributions in excess of any cash our shareholders receive.
The IRS may treat sale-leaseback transactions as loans, which could jeopardize our REIT status or require us to make an unexpected distribution.
The IRS may take the position that specific sale-leaseback transactions that we treat as leases are not true leases for federal income tax purposes but are, instead, financing arrangements or loans. If a sale-leaseback transaction were so re-characterized, we might fail to satisfy the REIT asset tests, the income tests or distribution requirements and consequently lose our REIT status effective with the year of re-characterization unless we elect to make an additional distribution to maintain our REIT status. The primary risk relates to our loss of previously incurred depreciation expenses, which could affect the calculation of our REIT taxable income and could cause us to fail the REIT distribution test that requires a REIT to distribute at least 90% of its REIT taxable income, determined without regard to the dividends paid deduction and excluding any net capital gain. In this circumstance, we may elect to distribute an additional dividend of the increased taxable income so as not to fail the REIT distribution test. This distribution would be paid to all shareholders at the time of declaration rather than the shareholders existing in the taxable year affected by the re-characterization.
Dividends payable by REITs generally do not qualify for the reduced tax rates available for some dividends, which may negatively affect the value of our shares.
Income from “qualified dividends” payable to U.S. shareholders that are individuals, trusts and estates are generally subject to tax at preferential rates, currently at a maximum federal rate of 20%. Dividends payable by REITs, however, generally are not eligible for the preferential tax rates applicable to qualified dividend income. Under the recently enacted 2017 Tax Legislation, however, U.S. shareholders that are individuals, trusts and estates generally may deduct up to 20% of the ordinary dividends (e.g., dividends not designated as capital gain dividends or qualified
dividend income) received from a REIT for taxable years beginning after December 31, 2017 and before January 1, 2026. Although this deduction reduces the effective tax rate applicable to certain dividends paid by REITs (generally to 29.6% assuming the shareholder is subject to the 37% maximum rate), such tax rate is still higher than the tax rate applicable to corporate dividends that constitute qualified dividend income. Accordingly, investors who are individuals, trusts and estates may perceive investments in REITs to be relatively less attractive than investments in the shares of non-REIT corporations that pay dividends, which could materially and adversely affect the value of the shares of REITs, including the per share trading price of our common shares.
The tax imposed on REITs engaging in “prohibited transactions” may limit our ability to engage in transactions which would be treated as sales for federal income tax purposes.
A REIT’s net income from prohibited transactions is subject to a 100% penalty tax. In general, prohibited transactions are sales or other dispositions of property, other than foreclosure property, held primarily for sale to customers in the ordinary course of business. Although we do not intend to hold any properties that would be characterized as held for sale to customers in the ordinary course of our business, unless a sale or disposition qualifies under certain statutory safe harbors, such characterization is a factual determination and no guarantee can be given that the IRS would agree with our characterization of our properties or that we will always be able to make use of the available safe harbors. Accordingly, these rules could limit our ability to execute sales of the Shopko assets or assets that collateralize Master Trust 2014 in accordance with our business strategy outlined herein.
Complying with REIT requirements may affect our profitability and may force us to liquidate or forgo otherwise attractive investments.
To qualify as a REIT, we must continually satisfy tests concerning, among other things, the nature and diversification of our assets, the sources of our income and the amounts we distribute to our shareholders. We may be required to liquidate otherwise attractive investments in order to satisfy the asset and income tests or to qualify under certain statutory relief provisions. We also may be required to make distributions to shareholders at disadvantageous times or when we do not have funds readily available for distribution. As a result, having to comply with the distribution requirement could cause us to: (1) sell assets in adverse market conditions; (2) borrow on unfavorable terms; or (3) distribute amounts that would otherwise be used for repayment of debt. Accordingly, satisfying the REIT requirements could materially and adversely affect us. Moreover, if we are compelled to liquidate our investments to meet any of these asset, income or distribution tests, or to repay obligations to our lenders, we may be unable to comply with one or more of the requirements applicable to REITs or may be subject to a 100% tax on any resulting gain if such sales constitute prohibited transactions.
Legislative or other actions affecting REITs could have a negative effect on us.
The rules dealing with federal income taxation are constantly under review by persons involved in the legislative process and by the IRS and the U.S. Department of the Treasury. Changes to the tax laws, with or without retroactive application, could materially and adversely affect our investors or us. We cannot predict how changes in the tax laws might affect our investors or us. New legislation, Treasury Regulations, administrative interpretations or court decisions could significantly and negatively affect our ability to qualify as a REIT or the federal income tax consequences of such qualification, or the federal income tax consequences of an investment in us. Also, the law relating to the tax treatment of other entities, or an investment in other entities, could change, making an investment in such other entities more attractive relative to an investment in a REIT. The 2017 Tax Legislation has significantly changed the U.S. federal income taxation of U.S. businesses and their owners, including REITs and their stockholders. Changes made by the 2017 Tax Legislation that could affect us and our shareholders include:
| |
• | temporarily reducing individual U.S. federal income tax rates on ordinary income; the highest individual U.S. federal income tax rate has been reduced from 39.6% to 37% for taxable years beginning after December 31, 2017 and before January 1, 2026; |
| |
• | permanently eliminating the progressive corporate tax rate structure, which previously imposed a maximum corporate tax rate of 35%, and replacing it with a flat corporate tax rate of 21%; |
| |
• | permitting a deduction for certain pass-through business income, including dividends received by our shareholders from us that are not designated by us as capital gain dividends or qualified dividend income, which will allow individuals, trusts, and estates to deduct up to 20% of such amounts for taxable years beginning after December 31, 2017 and before January 1, 2026; |
| |
• | reducing the highest rate of withholding with respect to our distributions to non-U.S. stockholders that are treated as attributable to gains from the sale or exchange of U.S. real property interests from 35% to 21%; |
| |
• | limiting our deduction for net operating losses arising in taxable years beginning after December 31, 2017 to 80% of our REIT taxable income (determined without regard to the dividends paid deduction); |
| |
• | generally limiting the deduction for net business interest expense in excess of 30% of a business’s “adjusted taxable income,” except for taxpayers that engage in certain real estate businesses (including most equity REITs) and elect out of this rule (provided that such electing taxpayers must use an alternative depreciation system with longer depreciation periods); and |
| |
• | eliminating the corporate alternative minimum tax. |
Many of these changes that are applicable to us became effective with our 2018 taxable year, without any transition periods or grandfathering for existing transactions. The legislation is unclear in many respects and could be subject to potential amendments and technical corrections, as well as interpretations and implementing regulations by the Treasury and IRS, any of which could lessen or increase the impact of the legislation. In addition, it is unclear how these U.S. federal income tax changes will affect state and local taxation, which often uses federal taxable income as a starting point for computing state and local tax liabilities. While some of the changes made by the tax legislation may adversely affect us in one or more reporting periods and prospectively, other changes may be beneficial on a going forward basis. We continue to work with our tax advisors and auditors to determine the full impact that the 2017 Tax Legislation as a whole will have on us.
Item 1B. Unresolved Staff Comments
None.
Item 2. Properties
|
| | | | |
876 | $235.6M | 45 | 203 | 23 |
Owned Properties | Annualized Contractual Rent | States | Tenants | Industries |
Our diverse real estate portfolio at December 31, 2018 had:
| |
◦ | 57.5% of Contractual Rent from master leases; |
| |
◦ | 94.3% of leases containing contractual rent escalators (based on Contractual Rent); and |
| |
◦ | a weighted average remaining lease term of 9.7 years. |
Diversification By Tenant
Tenant concentration represents the tenant’s contribution to Contractual Rent of our owned real estate properties at December 31, 2018 (total square feet in thousands):
|
| | | | | | | | | |
Tenant (1) | | Number of
Properties | | Total Square
Feet | | Percent of
Contractual Rent |
| | | | | | |
Shopko (2) | | 88 |
| | 6,022 |
| | 17.9 | % |
AMC Entertainment, Inc. | | 14 |
| | 696 |
| | 4.6 |
|
Academy, LTD. | | 2 |
| | 1,564 |
| | 4.2 |
|
Universal Pool Co., Inc. | | 14 |
| | 543 |
| | 3.0 |
|
Crème De La Crème, Inc. | | 9 |
| | 190 |
| | 2.3 |
|
Goodrich Quality Theaters, Inc. | | 4 |
| | 245 |
| | 2.3 |
|
Life Time Fitness, Inc. | | 3 |
| | 420 |
| | 2.2 |
|
Destination XL Group, Inc. | | 1 |
| | 756 |
| | 2.2 |
|
Buehler Food Markets Inc. | | 5 |
| | 503 |
| | 2.2 |
|
Carmax, Inc. | | 4 |
| | 201 |
| | 2.1 |
|
Other | | 707 |
| | 8,301 |
| | 57.0 |
|
Vacant | | 25 |
| | 356 |
| | — |
|
Total | | 876 |
| | 19,797 |
| | 100.0 | % |
| |
(1) | Tenants represent legal entities ultimately responsible for obligations under the lease agreements or affiliated entities. Other tenants may operate the same or similar business concepts or brands as those set forth above. |
| |
(2) | SMTA had 88 owned properties leased to Shopko as of December 31, 2018, 83 were encumbered by the Shopko CMBS Loan Agreements and were within the Other Properties segment and the remaining five constituted collateral within Master Trust 2014. |
Diversification By Asset Type
Asset type concentration represents the type of asset's contribution to Contractual Rent within our owned real estate properties as of December 31, 2018 (total square feet in thousands):
|
| | | | | | | | | |
Asset Type | | Number of
Properties | | Total Square
Feet | | Percent of
Contractual Rent |
| | | | | | |
Retail | | 755 |
| | 15,338 |
| | 83.0 | % |
Industrial | | 40 |
| | 3,616 |
| | 9.2 |
|
Office | | 81 |
| | 843 |
| | 7.8 |
|
Total | | 876 |
| | 19,797 |
| | 100.0 | % |
Diversification By Industry
Industry concentration represents the type of asset's contribution to Contractual Rent within our owned real estate properties as of December 31, 2018 (total square feet in thousands):
|
| | | | | | | | | |
Industry | | Number of
Properties | | Total Square
Feet | | Percent of
Contractual Rent |
| | | | | | |
General Merchandise | | 91 |
| | 6,121 |
| | 18.1 | % |
Restaurants - Quick Service | | 305 |
| | 792 |
| | 10.9 |
|
Movie Theaters | | 29 |
| | 1,519 |
| | 10.2 |
|
Restaurants - Casual Dining | | 89 |
| | 640 |
| | 8.7 |
|
Health and Fitness | | 19 |
| | 1,049 |
| | 5.9 |
|
Medical / Other Office | | 79 |
| | 517 |
| | 5.5 |
|
Sporting Goods | | 4 |
| | 1,832 |
| | 5.4 |
|
Specialty Retail | | 22 |
| | 857 |
| | 4.5 |
|
Education | | 18 |
| | 429 |
| | 4.5 |
|
Home Furnishings | | 17 |
| | 907 |
| | 3.8 |
|
Automotive Parts and Service | | 79 |
| | 362 |
| | 3.7 |
|
Grocery | | 19 |
| | 1,020 |
| | 3.6 |
|
Automotive Dealers | | 12 |
| | 323 |
| | 3.4 |
|
Apparel | | 3 |
| | 1,019 |
| | 2.6 |
|
Other | | 3 |
| | 183 |
| | 2.1 |
|
Entertainment | | 4 |
| | 200 |
| | 1.7 |
|
Multi-Tenant | | 3 |
| | 169 |
| | 1.1 |
|
Manufacturing | | 7 |
| | 763 |
| | 1.0 |
|
Car Washes | | 6 |
| | 49 |
| | 1.0 |
|
Building Materials | | 28 |
| | 458 |
| | 0.9 |
|
Drug Stores / Pharmacies | | 8 |
| | 83 |
| | 0.7 |
|
Distribution | | 1 |
| | 94 |
| | 0.5 |
|
Dollar Stores | | 5 |
| | 55 |
| | 0.2 |
|
Vacant | | 25 |
| | 356 |
| | — |
|
Total | | 876 |
| | 19,797 |
| | 100.0 | % |
Diversification By Geography
Geographic concentration represents the type of asset's contribution to Contractual Rent within our owned real estate properties as of December 31, 2018 (total square feet in thousands):
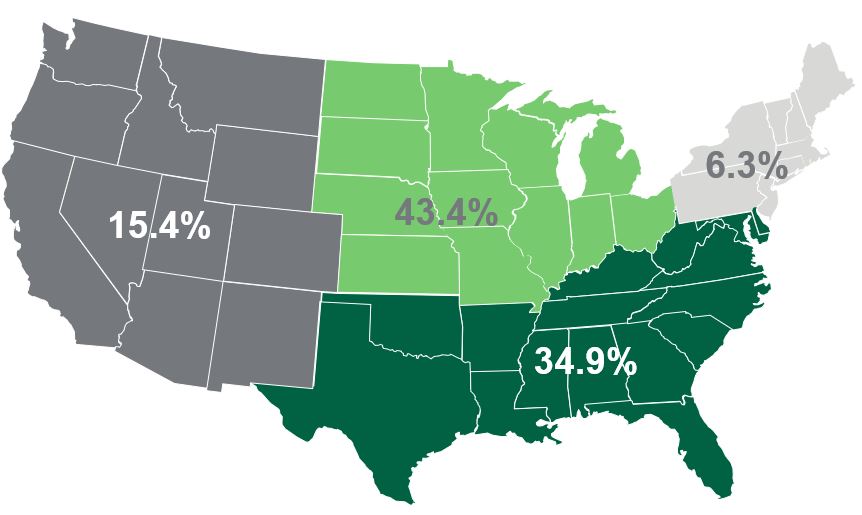
|
| | | | | | | | | | | | | | | | | | | | |
Location | | Number of Properties | | Total Square Feet (in thousands) | | Percent of Contractual Rent | | Location | | Number of Properties | | Total Square Feet (in thousands) | | Percent of Contractual Rent |
| | | | | | | | | | | | | | |
Texas | | 64 |
| | 2,696 |
| | 11.7 | % | | New Mexico | | 10 |
| | 76 |
| | 1.3 | % |
Wisconsin | | 32 |
| | 2,481 |
| | 8.5 | % | | Arkansas | | 19 |
| | 318 |
| | 1.2 | % |
Illinois | | 69 |
| | 1,363 |
| | 7.8 | % | | Washington | | 5 |
| | 348 |
| | 1.2 | % |
Minnesota | | 26 |
| | 1,574 |
| | 6.3 | % | | New York | | 10 |
| | 104 |
| | 1.2 | % |
Georgia | | 73 |
| | 459 |
| | 5.3 | % | | Kansas | | 17 |
| | 236 |
| | 1.1 | % |
Ohio | | 40 |
| | 1,162 |
| | 5.1 | % | | Virginia | | 15 |
| | 202 |
| | 1.0 | % |
Indiana | | 41 |
| | 637 |
| | 4.3 | % | | South Dakota | | 3 |
| | 205 |
| | 0.9 | % |
Michigan | | 63 |
| | 1,148 |
| | 4.3 | % | | Montana | | 3 |
| | 254 |
| | 0.8 | % |
Arizona | | 22 |
| | 346 |
| | 3.0 | % | | West Virginia | | 8 |
| | 233 |
| | 0.7 | % |
Missouri | | 37 |
| | 520 |
| | 2.9 | % | | Nebraska | | 7 |
| | 227 |
| | 0.7 | % |
South Carolina | | 16 |
| | 415 |
| | 2.7 | % | | Kentucky | | 15 |
| | 95 |
| | 0.6 | % |
Florida | | 46 |
| | 380 |
| | 2.6 | % | | Idaho | | 4 |
| | 233 |
| | 0.6 | % |
Pennsylvania | | 23 |
| | 405 |
| | 2.5 | % | | Mississippi | | 11 |
| | 60 |
| | 0.6 | % |
North Carolina | | 20 |
| | 387 |
| | 2.3 | % | | Wyoming | | 6 |
| | 113 |
| | 0.5 | % |
Massachusetts | | 1 |
| | 756 |
| | 2.2 | % | | Maryland | | 10 |
| | 34 |
| | 0.3 | % |
Colorado | | 8 |
| | 328 |
| | 2.1 | % | | New Jersey | | 2 |
| | 195 |
| | 0.3 | % |
Oklahoma | | 16 |
| | 303 |
| | 2.0 | % | | Louisiana | | 7 |
| | 19 |
| | 0.3 | % |
Oregon | | 6 |
| | 300 |
| | 1.9 | % | | Utah | | 2 |
| | 97 |
| | 0.2 | % |
Nevada | | 3 |
| | 166 |
| | 1.9 | % | | Rhode Island | | 1 |
| | 22 |
| | 0.1 | % |
Tennessee | | 48 |
| | 233 |
| | 1.8 | % | | Alaska | | 1 |
| | 50 |
| | 0.1 | % |
California | | 13 |
| | 122 |
| | 1.8 | % | | North Dakota | | 1 |
| | 8 |
| | 0.1 | % |
Alabama | | 31 |
| | 110 |
| | 1.8 | % | | Maine | | 1 |
| | 6 |
| | — | % |
Iowa | | 20 |
| | 371 |
| | 1.4 | % | | | | | | | | |
Lease Expirations
The following table sets forth a summary schedule of expiration dates for leases in place as of December 31, 2018. The information set forth in the table assumes that tenants do not exercise renewal options and/or any early termination rights (Annualized Contractual Rent and total square feet in thousands):
|
| | | | | | | | | | | | |
Leases Expiring In: | | Number of
Properties | | Annualized Contractual Rent (1) | | Total Square
Feet | | Percent of Expiring
Contractual Rent |
| | | | | | | | |
2019 | | 62 | | $ | 11,109 |
| | 921 |
| | 4.7 | % |
2020 | | 39 | | 6,726 |
| | 465 |
| | 2.9 |
|
2021 | | 64 | | 12,260 |
| | 1,225 |
| | 5.2 |
|
2022 | | 77 | | 13,514 |
| | 1,054 |
| | 5.7 |
|
2023 | | 24 | | 4,103 |
| | 369 |
| | 1.7 |
|
2024 | | 41 | | 8,159 |
| | 423 |
| | 3.5 |
|
2025 | | 38 | | 16,061 |
| | 783 |
| | 6.8 |
|
2026 | | 106 | | 19,708 |
| | 1,918 |
| | 8.4 |
|
2027 | | 57 | | 36,847 |
| | 3,374 |
| | 15.6 |
|
2028 | | 27 | | 10,372 |
| | 655 |
| | 4.5 |
|
Thereafter | | 316 | | 96,678 |
| | 8,254 |
| | 41.0 |
|
Vacant | | 25 | | — |
| | 356 |
| | — |
|
Total owned properties | | 876 | | $ | 235,537 |
| | 19,797 |
| | 100.0 | % |
| |
(1) | Contractual Rent for the month ended December 31, 2018 for properties owned at December 31, 2018, multiplied by twelve. |
Item 3. Legal Proceedings
From time-to-time, we may be subject to certain claims and lawsuits in the ordinary course of business, the outcome of which cannot be determined at this time. In the opinion of management, any liability we might incur upon the resolution of these ordinary course claims and lawsuits will not, in the aggregate, have a material adverse effect on our consolidated financial position or results of operations.
SMTA, through four indirectly wholly-owned, property-owning subsidiaries, entered into the Shopko CMBS Loan Agreements. The loan was secured by a pledge of the equity of the entity that owns the four property-owning subsidiaries, which collectively hold 85 assets (83 owned and two financed) that were leased to Shopko. In connection with the Shopko CMBS Loan Agreements, SMTA entered into a customary non-recourse loan guaranty agreement, in favor of the Shopko Lenders, pursuant to which SMTA guaranteed the payment and performance of the liabilities of the property-owning subsidiaries under the non-recourse loan agreements for damages resulting from certain breaches or actions, including, but not limited to, fraud or intentional misrepresentation by the borrowers, and for the repayment in full of the debt in the event of certain actions, including, without limitation, certain bankruptcy events and prohibited transactions.
On January 16, 2019, our indirect wholly-owned subsidiaries as borrowers under the Shopko CMBS Loan Agreements defaulted on the loans when those entities ceased to make interest payments as a result of Shopko ceasing to pay its rent obligations following its bankruptcy filing. The full outstanding principal amount of $157.4 million outstanding under the Shopko CMBS Loan Agreements immediately became due and payable, and interest is accruing at the default rate of LIBOR plus 12.5% on the original loan portion and LIBOR plus 18.0% on the mezzanine loan portion. On March 1, 2019, the Shopko Lenders foreclosed on the equity of the entity that owns the four property-owning subsidiaries.
On March 4, 2019, SMTA received a demand notice from the Shopko Lenders seeking repayment of the loans under the Shopko CMBS Loan Agreements pursuant to SMTA’s guaranty of the loans in which the Shopko Lenders allege, among other things, fraud and intentional misrepresentations by the borrowers. SMTA believes the allegations are without merit, will not honor the demand and intends to vigorously defend against any lawsuit initiated by the Shopko Lenders in connection with SMTA’s decision not to comply with the repayment request made under the notice of demand.
Item 4. Mine Safety Disclosure
None.
PART II
Item 5. Market for Registrant’s Common Equity, Related Stockholder Matters and Issuer Purchases of Equity Securities
MARKET INFORMATION FOR COMMON SHARE, HOLDERS OF RECORD AND DIVIDEND POLICY
Our common shares are traded on the NYSE under the symbol “SMTA.” As of March 19, 2019, there were approximately 2,447 shareholders of record of our common shares. Because many of our common shares are held by brokers and other institutions on behalf of shareholders, we are unable to estimate the total number of shareholders represented by these record holders.
We intend to pay dividends to our shareholders to maintain our REIT status, although all future distributions will be declared and paid at the discretion of the Board of Trustees and will depend upon cash generated by operating activities, our financial condition, capital requirements, annual distribution requirements under the REIT provisions of the Code and such other factors as the Board of Trustees deems relevant.
RECENT SALES OF UNREGISTERED SECURITIES; USE OF PROCEEDS FROM REGISTERED SECURITIES
Our subsidiary, SubReit, Inc. issued and sold 125 Series B preferred shares with an aggregate liquidation preference of $125 thousand in December 2018 to certain institutional investors pursuant to Regulation D under the Securities Act of 1933.
In December 2018, the Company's Board of Trustees approved a share repurchase program, which authorized repurchases of up to $50.0 million of the Company's common shares. These repurchases can be made in the open market or through private transactions. The amount and timing of repurchases is dependent on management's assessment of the capital needs of the Company. No repurchases have been made under the program as of December 31, 2018.
ISSUER PURCHASES OF EQUITY SECURITIES
None.
EQUITY COMPENSATION PLAN INFORMATION
Our equity compensation plan information required by this item will be included in the Proxy Statement to be filed relating to our 2019 Annual Meeting of Shareholders and is incorporated herein by reference. As of December 31, 2018, 3.5 million shares are available for award under the 2018 Incentive Award Plan.
PERFORMANCE GRAPH
The information below shall not be deemed to be “soliciting material” or to be “filed” with the SEC or subject to Regulation 14A or 14C, other than as provided in Item 201 of Regulation S-K, or to the liabilities of Section 18 of the Exchange Act, except to the extent we specifically request that such information be treated as soliciting material or specifically incorporate it by reference into a filing under the Securities Act or the Exchange Act.
The following graph shows our cumulative total shareholder return for the period beginning with the initial listing of our common shares on the NYSE on May 31, 2018 and ending on December 31, 2018. The graph assumes a $100 investment in each of the indices on May 31, 2018 and the reinvestment of all dividends. Our share price performance shown in the following graph is not indicative of future share price performance.
|
| | | | | | | | | |
Index | Spirit MTA REIT | S&P 500 | FTSE NAREIT US Equity REIT Index |
| | | |
May 31, 2018 |
| $100.00 |
|
| $100.00 |
|
| $100.00 |
|
December 31, 2018 |
| $95.49 |
|
| $92.67 |
|
| $98.54 |
|
Item 6. Selected Financial Data
The following tables set forth, on a historical basis, selected financial and operating data for the Company. The following data should be read in conjunction with our financial statements and notes thereto and Item 7. "Management’s Discussion and Analysis of Financial Condition and Results of Operations” included in this Annual Report on Form 10-K.
|
| | | | | | | | | | | | | | | |
Operating Data: | Years Ended December 31, |
(In Thousands) | 2018 | | 2017 | | 2016 | | 2015 |
| | | | | | | |
Revenues: | | | | | | | |
Rental income | $ | 240,410 |
| | $ | 226,586 |
| | $ | 236,801 |
| | $ | 251,084 |
|
Interest income on loans receivable | 3,080 |
| | 768 |
| | 2,207 |
| | 3,685 |
|
Other income | 2,817 |
| | 4,448 |
| | 6,295 |
| | 6,394 |
|
Total revenues | 246,307 |
| | 231,802 |
| | 245,303 |
| | 261,163 |
|
Expenses: | | | | | | | |
General and administrative | 13,425 |
| | 20,491 |
| | 18,956 |
| | 20,790 |
|
Related party fees | 19,533 |
| | 5,500 |
| | 5,427 |
| | 5,506 |
|
Restructuring charges | — |
| | — |
| | 2,465 |
| | 3,036 |
|
Transaction costs | 8,676 |
| | 4,354 |
| | — |
| | — |
|
Property costs (including reimbursable) | 12,758 |
| | 12,496 |
| | 5,258 |
| | 5,043 |
|
Interest | 114,997 |
| | 76,733 |
| | 77,895 |
| | 83,719 |
|
Depreciation and amortization | 84,678 |
| | 80,386 |
| | 85,761 |
| | 93,692 |
|
Impairment and allowance for loan losses | 221,349 |
| | 33,548 |
| | 26,565 |
| | 19,935 |
|
Total expenses | 475,416 |
| | 233,508 |
| | 222,327 |
| | 231,721 |
|
Other income: | | | | | | | |
Loss on debt extinguishment | (366 | ) | | (2,223 | ) | | (1,372 | ) | | (787 | ) |
Gain on disposition of assets | 9,458 |
| | 22,393 |
| | 26,499 |
| | 84,111 |
|
Total other income | 9,092 |
| | 20,170 |
| | 25,127 |
| | 83,324 |
|
(Loss) income before income tax expense | (220,017 | ) | | 18,464 |
| | 48,103 |
| | 112,766 |
|
Income tax (expense) benefit | (221 | ) | | (179 | ) | | (181 | ) | | 33 |
|
(Loss) income from continuing operations | (220,238 | ) | | 18,285 |
| | 47,922 |
| | 112,799 |
|
Income from discontinued operations | — |
| | — |
| | — |
| | 98 |
|
Gain on disposition of assets | — |
| | — |
| | — |
| | 590 |
|
Income from discontinued operations | — |
| | — |
| | — |
| | 688 |
|
Net (loss) income and total comprehensive (loss) income | (220,238 | ) | | 18,285 |
| | 47,922 |
| | 113,487 |
|
Preferred dividends | (9,275 | ) | | — |
| | — |
| | — |
|
Net (loss) income attributable to common shareholders | $ | (229,513 | ) | | $ | 18,285 |
| | $ | 47,922 |
| | $ | 113,487 |
|
| | | | | | | |
Net (loss) income per share attributable to common shareholders | | | | | | | |
Basic | $ | (5.36 | ) | | $ | 0.43 |
| | $ | 1.12 |
| | $ | 2.65 |
|
Diluted | $ | (5.36 | ) | | $ | 0.43 |
| | $ | 1.12 |
| | $ | 2.65 |
|
| | | | | | | |
Weighted average common shares outstanding: | | | | | | | |
Basic | 42,851,010 |
| | 42,851,010 |
| | 42,851,010 |
| | 42,851,010 |
|
Diluted | 42,851,010 |
| | 42,851,010 |
| | 42,851,010 |
| | 42,851,010 |
|
| | | | | | | |
Dividends declared per common share issued | $ | 1.66 |
| | N/A |
| | N/A |
| | N/A |
|
|
| | | | | | | | | | | |
Balance Sheet Data (end of period): | Years Ended December 31, |
(Dollars In Thousands) | 2018 | | 2017 | | 2016 |
| | | | | |
Gross investments, including related lease intangibles | $ | 2,560,745 |
| | $ | 2,870,592 |
| | $ | 2,817,732 |
|
Net investments | 2,036,861 |
| | 2,212,488 |
| | 2,226,235 |
|
Cash and cash equivalents | 161,013 |
| | 6 |
| | 1,268 |
|
Total assets | 2,305,649 |
| | 2,357,660 |
| | 2,325,538 |
|
Mortgages and notes payable, net | 2,138,804 |
| | 1,926,835 |
| | 1,339,614 |
|
Total liabilities | 2,240,109 |
| | 1,966,742 |
| | 1,380,681 |
|
Total shareholders' and parent company (deficit) equity | (89,585 | ) | | 390,918 |
| | 944,857 |
|
| | | | | |
Other Data: | | | | | |
FFO | $ | 25,048 |
| | $ | 109,826 |
| | $ | 133,749 |
|
AFFO | $ | 89,798 |
| | $ | 126,765 |
| | $ | 143,560 |
|
Number of properties in investment portfolio | 876 |
| | 918 |
| | 982 |
|
Owned properties occupancy at period end (based on number of properties) | 97.1 | % | | 99.2 | % | | 98.2 | % |
Non-GAAP Financial Measures
FFO AND AFFO
We calculate FFO in accordance with the standards established by NAREIT. FFO represents net income (loss) attributable to common shareholders (computed in accordance with GAAP) excluding real estate-related depreciation and amortization, impairment charges and net (gains) losses from property dispositions. FFO is a supplemental non-GAAP financial measure. We use FFO as a supplemental performance measure because we believe that FFO is beneficial to investors as a starting point in measuring our operational performance. Specifically, in excluding real estate-related depreciation and amortization, gains and losses from property dispositions and impairment charges, which do not relate to or are not indicative of operating performance, FFO provides a performance measure that, when compared year over year, captures trends in occupancy rates, rental rates and operating costs. We also believe that, as a widely recognized measure of the performance of equity REITs, FFO will be used by investors as a basis to compare our operating performance with that of other equity REITs. However, because FFO excludes depreciation and amortization and does not capture the changes in the value of our properties that result from use or market conditions, all of which have real economic effects and could materially impact our results from operations, the utility of FFO as a measure of our performance is limited. In addition, other equity REITs may not calculate FFO as we do, and, accordingly, our FFO may not be comparable to such other equity REITs’ FFO. Accordingly, FFO should be considered only as a supplement to net income (loss) attributable to common shareholders (computed in accordance with GAAP) as a measure of our performance.
AFFO is a non-GAAP financial measure of operating performance used by many companies in the REIT industry. We adjust FFO to eliminate the impact of certain items that we believe are not indicative of our core operating performance, including restructuring and divestiture costs, other general and administrative costs associated with relocation of the Company's headquarters, transaction costs associated with our Spin-Off, default interest and fees on non-recourse mortgage indebtedness, debt extinguishment gains (losses), transaction costs incurred in connection with the acquisition of real estate investments subject to existing leases, amortization of the promote fee and certain non-cash items. These certain non-cash items include non-cash revenues (comprised of straight-line rents, amortization of above- and below- market rent on our leases, amortization of lease incentives, amortization of net premium/discount on loans receivable,bad debt expense and amortization of capitalized lease transaction costs), non-cash interest expense (comprised of amortization of deferred financing costs and amortization of net debt discount/premium) and non-cash compensation expense (stock-based compensation expense). In addition, other equity REITs may not calculate AFFO as we do, and, accordingly, our AFFO may not be comparable to such other equity REITs’ AFFO. AFFO does not represent cash generated from operating activities determined in accordance with GAAP, is not necessarily indicative of cash available to fund cash needs and should only be considered a supplement, and not an alternative, to net income (loss) attributable to common shareholders (computed in accordance with GAAP) as a performance measure.
Adjusted Debt
Adjusted Debt represents interest bearing debt (reported in accordance with GAAP) adjusted to exclude unamortized debt discount/premium, deferred financing costs, and reduced by cash and cash equivalents and cash reserves on deposit with lenders as additional security. By excluding these amounts, the result provides an estimate of the contractual amount of borrowed capital to be repaid, net of cash available to repay it. We believe this calculation constitutes a beneficial supplemental non-GAAP financial disclosure to investors in understanding our financial condition.
EBITDAre
EBITDAre is a non-GAAP financial measure and is computed in accordance with standards established by NAREIT. EBITDAre is defined as net income (loss) (computed in accordance with GAAP), plus interest expense, plus income tax expense (if any), plus depreciation and amortization, plus (minus) losses and gains on the disposition of depreciated property, plus impairment write-downs of depreciated property and investments in unconsolidated real estate ventures, plus adjustments to reflect the Company's share of EBITDAre of unconsolidated real estate ventures. We believe this calculation constitutes a beneficial supplemental non-GAAP financial disclosure to investors in understanding our financial condition.
Adjusted EBITDAre
Adjusted EBITDAre represents EBITDAre adjusted for transaction costs, revenue producing acquisition costs and dispositions for the quarter as if such acquisitions and dispositions had occurred as of the beginning of the quarter, real estate acquisition costs, impairments and loan losses related to the Shopko loan, debt extinguishment gains (losses), and amortization (recovery) of the promote fee. We focus our business plans to enable us to sustain increasing shareholder value. Accordingly, we believe that excluding these items, which are not key drivers of our investment decisions and may cause short-term fluctuations in net income (loss), provides a useful supplemental measure to investors and analysts in assessing the net earnings contribution of our real estate portfolio. Because these measures do not represent net income (loss) that is computed in accordance with GAAP, they should only be considered a supplement, and not an alternative, to net income (loss) attributable to common shareholders (computed in accordance with GAAP) as a performance measure.
Annualized Adjusted EBITDAre
Annualized Adjusted EBITDAre is calculated as Adjusted EBITDAre for the quarter, adjusted for items where annualization would not be appropriate, multiplied by four. Our computation of Adjusted EBITDAre and Annualized Adjusted EBITDAre may differ from the methodology used by other equity REITs to calculate these measures and, therefore, may not be comparable to such other REITs.
Adjusted Debt to Annualized Adjusted EBITDAre
Adjusted Debt to Annualized Adjusted EBITDAre is a supplemental non-GAAP financial measure we use to evaluate the level of borrowed capital being used to increase the potential return of our real estate investments and a proxy for a measure we believe is used by many lenders and ratings agencies to evaluate our ability to repay and service our debt obligations over time. We believe this ratio is a beneficial disclosure to investors as a supplemental means of evaluating our ability to meet obligations senior to those of our equity holders. Our computation of this ratio may differ from the methodology used by other equity REITs and, therefore, may not be comparable to such other REITs.
Fixed Charge Coverage Ratio (FCCR)
Fixed Charge Coverage Ratio is the ratio of Adjusted EBITDAre to Fixed Charges, a ratio derived from non-GAAP measures that we use to evaluate our liquidity and ability to obtain financing. Fixed Charges consist of interest
expense, reported in accordance with GAAP, less non-cash interest expense.
FFO AND AFFO
|
| | | | | | | | | | | | | | | | |
| | Year Ended December 31, |
(Unaudited, In Thousands) | | 2018 (1) | | 2017 (2) | | 2016 (2) | | 2015 (2) |
| | | | | | |
Net (loss) income attributable to common shareholders | | $ | (229,513 | ) | | $ | 18,285 |
| | $ | 47,922 |
| | $ | 113,487 |
|
Add/(less): | | |
| | |
| | | | |
Portfolio depreciation and amortization | | 84,678 |
| | 80,386 |
| | 85,761 |
| | 93,692 |
|
Portfolio impairments | | 179,341 |
| | 33,548 |
| | 26,565 |
| | 19,969 |
|
Gain on disposition of real estate assets | | (9,458 | ) | | (22,393 | ) | | (26,499 | ) | | (84,701 | ) |
FFO | | $ | 25,048 |
| | $ | 109,826 |
| | $ | 133,749 |
| | $ | 142,447 |
|
Add/(less): | | |
| | |
| | | | |
Loss on debt extinguishment | | 366 |
| | 2,223 |
| | 1,372 |
| | 787 |
|
Restructuring charges | | — |
| | — |
| | 2,465 |
| | 3,036 |
|
Other cost included in general and administrative associated with headquarters relocation | | — |
| | — |
| | 1,411 |
| | — |
|
Transaction costs | | 8,676 |
| | 4,354 |
| | — |
| | — |
|
Real Estate Acquisition Costs | | 411 |
| | — |
| | 6 |
| | 201 |
|
Non-cash interest expense | | 11,623 |
| | 6,069 |
| | 4,839 |
| | 4,257 |
|
Straight-line rent, net of related bad debt expense | | (3,000 | ) | | (2,406 | ) | | (4,266 | ) | | (4,439 | ) |
Other amortization and non-cash charges | | 507 |
| | 568 |
| | 264 |
| | 206 |
|
Non-cash compensation expense | | 3,326 |
| | 6,131 |
| | 3,720 |
| | 5,731 |
|
(Recovery) amortization of the promote fee | | 833 |
| | — |
| | — |
| | — |
|
Other impairment and allowance for loan losses | | 42,008 |
| | — |
| | — |
| | — |
|
AFFO | | $ | 89,798 |
| | $ | 126,765 |
| | $ | 143,560 |
| | $ | 152,226 |
|
| | | | | | | | |
Dividends declared to common shareholders | | $ | 71,381 |
| | N/A |
| | N/A |
| | N/A |
|
| | | | | | | | |
Net (loss) income per common share | | | | | | | | |
Diluted (3) | | $ | (5.36 | ) | | $ | 0.43 |
| | $ | 1.12 |
| | $ | 2.65 |
|
FFO per common share | | | | | | | | |
Diluted (3) | | $ | 0.58 |
| | $ | 2.56 |
| | $ | 3.12 |
| | $ | 3.32 |
|
AFFO per share of common share | | | | | | | | |
Diluted (3) | | $ | 2.09 |
| | $ | 2.96 |
| | $ | 3.35 |
| | $ | 3.55 |
|
| | | | | | | | |
Weighted average common shares outstanding: | | | | | | | | |
Basic | | 42,851,010 |
| | 42,851,010 |
| | 42,851,010 |
| | 42,851,010 |
|
Diluted | | 42,851,010 |
| | 42,851,010 |
| | 42,851,010 |
| | 42,851,010 |
|
(1) Amounts for the year ended December 31, 2018 include five months of income and expense items based on SMTA's legal predecessor entities and seven months of actual results from SMTA operations as a stand alone company.
| |
(2) | Amounts for the years ended 2017, 2016 and 2015 are based entirely on results of SMTA's legal predecessor entities. |
| |
(3) | For the year ended December 31, 2018, there were dividends declared to unvested restricted shareholders of $249 thousand. |
Leverage - Adjusted Debt, Adjusted EBITDAre and Annualized Adjusted EBITDAre
|
| | | | | | | | |
| | December 31, |
(Unaudited, In Thousands) | | 2018 | | 2017 |
| | |
Master Trust 2014, net | | $ | 1,905,321 |
| | $ | 1,926,835 |
|
CMBS, net | | 233,483 |
| | — |
|
Total debt, net | | $ | 2,138,804 |
| | $ | 1,926,835 |
|
Add/(less): | | |
| | |
|
Unamortized debt discount | | 21,155 |
| | 36,342 |
|
Unamortized deferred financing costs | | 21,885 |
| | 17,989 |
|
Cash and cash equivalents | | (161,013 | ) | | (6 | ) |
Cash reserves on deposit with lenders as additional security classified as other assets | | (44,087 | ) | | (66,504 | ) |
Adjusted Debt | | 1,976,744 |
| | 1,914,656 |
|
Preferred Stock at liquidation value | | 155,125 |
| | — |
|
Adjusted Debt + Preferred Stock | | 2,131,869 |
| | 1,914,656 |
|
| | |
| | Three Months Ended December 31, |
(Unaudited, In Thousands) | | 2018 | | 2017 (1) |
| | |
Net (loss) income | | $ | (210,064 | ) | | $ | 1,472 |
|
Add/(less): | | | | |
|
Interest | | 31,570 |
| | 20,409 |
|
Depreciation and amortization | | 21,607 |
| | 19,610 |
|
Income tax expense | | 82 |
| | 44 |
|
Gain on disposition of real estate assets | | (1,994 | ) | | (4,197 | ) |
Portfolio impairments | | 163,926 |
| | 6,200 |
|
EBITDAre | | $ | 5,127 |
| | $ | 43,538 |
|
Add/(less): | | | | |
|
Adjustments to revenue producing acquisitions and dispositions (2) | | (294 | ) | | — |
|
Transaction costs | | 56 |
| | 2,254 |
|
Real estate acquisition costs | | 138 |
| | — |
|
Loss on debt extinguishment | | 3 |
| | 2,224 |
|
(Recovery) amortization of the promote fee | | (786 | ) | | — |
|
Other impairment and allowance for loan losses | | 42,008 |
| | — |
|
Adjusted EBITDAre | | $ | 46,252 |
| | $ | 48,016 |
|
Other adjustments for Annualized Adjusted EBITDAre | | — |
| | — |
|
Impact of Shopko bankruptcy (3) | | (6,991 | ) | | |
Annualized Adjusted EBITDAre | | $ | 157,044 |
| | $ | 192,064 |
|
| | | | |
Interest Expense | | 31,570 |
| | 20,409 |
|
Less: Non-cash interest | | (3,751 | ) | | (1,878 | ) |
Preferred Share Dividends | | 3,975 |
| | — |
|
Fixed Charges | | $ | 31,794 |
| | $ | 18,531 |
|
| | | | |
Adjusted Debt / Annualized Adjusted EBITDAre (3) | | 12.6x |
| | 10.0x |
|
Adjusted Debt + Preferred / Adjusted EBITDAre (3) | | 13.6x |
| | N/A |
|
Fixed Charge Coverage Ratio (Adjusted EBITDAre / Fixed Charges) (4) | | 1.4x |
| | 2.6x |
|
| |
(1) | Amounts for 2017 are based on SMTA's allocated portion of Spirit’s expense. For further detail on the allocation, see related party transactions as described in Note 11 to the consolidated financial statements herein. |
| |
(2) | Revenue producing acquisitions and dispositions were adjusted as if such acquisitions and dispositions had occurred at the beginning of the quarter. |
| |
(3) | Adjustments to exclude contractual rent and interest income received from Shopko, as SMTA does not expect to receive any additional cash flow going forward from Shopko, and property operating costs on assets leased to Shopko, as SMTA does not expect to pay due to the foreclosure on the loans secured by such properties. Excluding the Shopko CMBS Loan Agreements and related unamortized deferred costs of $157.4 |
million, the Adjusted Debt/ Annualized Adjusted EBITDAre ratio would be 11.6x and the Adjusted Debt + Preferred/Annualized Adjusted EBITDAre ratio would be 12.6x for the year ended December 31, 2018.
| |
(4) | For the Fixed Charge Coverage Ratio, Adjusted EBITDAre was adjusted to exclude the $7.0 million impact of Shopko bankruptcy described above and Fixed Charges were adjusted to exclude the $2.7 million of cash interest expense on the Shopko CMBS Loan Agreements. |
Item 7. Management’s Discussion and Analysis of Financial Condition and Results of Operations
The following discussion relates to our consolidated financial statements and should be read in conjunction with the consolidated financial statements and notes thereto appearing elsewhere in this Annual Report on Form 10-K. Statements contained in Item 7. “Management’s Discussion and Analysis of Financial Condition and Results of Operations”, and elsewhere in this report, that are not historical facts may be forward-looking statements. Such statements are subject to certain risks and uncertainties, which could cause actual results to differ materially. Some of the financial and other information presented is forward-looking in nature, including information concerning projected future occupancy rates, rental rate increases, property development timing and investment amounts. Although the information is based on our current expectations, actual results could vary from expectations stated in this report. Numerous factors will affect our actual results, some of which are beyond our control. These include the breadth and duration of the current economic environment and its impact on our tenants, particularly Shopko, which filed for bankruptcy protection and recently announced that it intends to liquidate its operations, the strength of commercial and industrial real estate markets, market conditions affecting tenants, competitive market conditions, interest rate levels, volatility in our share price, capital markets conditions and our ability to execute on our strategic plans. You are cautioned not to place undue reliance on this information, which speaks only as of the date of this report. We assume no obligation to update publicly any forward-looking information, whether as a result of new information, future events, or otherwise, except to the extent required by law. For a discussion of important risks related to our business, financial condition and results of operations and related to investing in our securities, including risks that could cause actual results and events to differ materially from results and events referred to in the forward-looking information, see Item 1A. and Item 7. - "Liquidity and Capital Resources.”
OVERVIEW
SMTA was formed for the purpose of receiving, via contribution from Spirit, the legal entities which held (i) Master Trust 2014, an asset-backed securitization trust which issues non-recourse asset-back securities collateralized by commercial real estate, net-leases and mortgage loans, (ii) all of Spirit's properties leased to Shopko, (iii) a single distribution center property leased to a sporting goods tenant encumbered with CMBS debt, and (iv) a portfolio of unencumbered properties, as well as a $35.0 million B-1 Term Loan with Shopko as borrower, and a cash contribution of $3.0 million. The activities of the newly formed legal entities are not reflected in the accompanying financial statements balances or results of operations prior to May 31, 2018, but the ten additional properties, the B-1 Term Loan and cash are reflected as contributions as of their respective legal dates of transfer.
On May 31, 2018, the distribution date, Spirit completed the Spin-Off of SMTA. On the distribution date, Spirit distributed on a pro rata basis one SMTA common share for every ten shares of Spirit common stock held by each of Spirit's stockholders as of May 18, 2018, the record date. As a result, 42,851,010 shares of SMTA common were issued on May 31, 2018.
In conjunction with the Spin-Off, we and our Manager, a wholly-owned subsidiary of Spirit, entered into an Asset Management Agreement under which our Manager provides various services including, but not limited to: active portfolio management (including underwriting and risk management), financial reporting, and SEC compliance. The fees for these services are a flat rate of $20 million per annum. Additionally, Spirit Realty, L.P. continues as the property manager and special servicer of Master Trust 2014, under which Spirit Realty, L.P. receives property management fees which accrue daily at 0.25% per annum of the collateral value of the Master Trust 2014 Collateral Pool less any specially serviced assets, and special servicing fees which accrue daily at 0.75% per annum of the collateral value of any assets deemed to be specially serviced per the terms of the Property Management and Servicing Agreement. SMTA and Spirit also entered into a Separation and Distribution Agreement, an Insurance-Sharing Agreement, a Tax Matters Agreement, and a Registration Rights Agreement in connection with the Spin-Off.
SMTA expects to operate in a manner intended to enable it to qualify as a REIT under the applicable provisions of the Internal Revenue Code of 1986, as amended. To maintain REIT status, SMTA must meet a number of organizational and operational requirements, including a requirement to distribute annually to shareholders at least 90% of SMTA’s REIT taxable income, determined without regard to the dividends paid deduction and excluding any net capital gains. Management believes the Company has qualified and will continue to qualify as a REIT and therefore, no provision has been made for federal income taxes for the period presented subsequent to the Spin-Off. For the period presented prior to the Spin-Off, the Company was disregarded for federal income tax purposes, so no provision for federal income tax was made. SMTA is subject to certain other taxes, including state taxes, which have been reflected as income tax expense in the consolidated statements of operations and comprehensive income (loss).
The accompanying financial statements include the consolidated accounts of the Company and its wholly-owned subsidiaries for the period subsequent to the Spin-Off on May 31, 2018. The pre-spin financial statements were prepared on a carve-out basis and reflect the combined net assets and operations of the predecessor legal entities which formed the Company at the time of the Spin-Off. GAAP requires us to make estimates and assumptions that affect the reported amounts of assets and liabilities, and revenues and expenses during the reporting periods. Actual results could differ from these estimates. The historical financial results prior to the Spin-Off include allocated expenses for certain corporate costs which we believe are reasonable. These expenses were based on either actual costs incurred or a proportion of costs estimated to be allocable to SMTA based on the relative property count of the Company to those owned by Spirit as a whole. Such costs do not necessarily reflect what the actual costs would have been if SMTA had been operating as a separate standalone public company. These expenses are discussed further in Note 11 of the accompanying financial statements.
Recent Developments
Shopko Bankruptcy Filing
On January 16, 2019, Shopko, the Company's largest tenant, filed for relief under the Bankruptcy Code. As of December 31, 2018, we received $42.1 million in annualized Contractual Rent from Shopko, which represented 17.9% of our total annualized Contractual Rent. On January 16, 2019, our indirect wholly-owned subsidiaries as borrowers under the Shopko CMBS Loan Agreements defaulted on the loans when those entities ceased to make interest payments as a result of Shopko ceasing to pay its rent obligations following its bankruptcy filing. The full outstanding principal amount of $157.4 million outstanding under the Shopko CMBS Loan Agreements immediately became due and payable, and interest is accruing at the default rate of LIBOR plus 12.5% on the original loan portion and LIBOR plus 18.0% on the mezzanine loan portion. On March 1, 2019, the Shopko Lenders foreclosed on the equity of the entity that owns the four property-owning subsidiaries.
We also hold the Shopko B-1 Term Loan, with principal outstanding of $34.4 million as of December 31, 2018. While the outcome of the Shopko bankruptcy filing is uncertain and there can be no assurances that we will recover any amounts due to us under the Shopko B-1 Term Loan, we intend to pursue all of our rights and remedies in connection with the bankruptcy proceedings, with the goal of maximizing the receipt of amounts due to us under the the Shopko B-1 Term loan.
As a consequence of the bankruptcy filing and the subsequent foreclosure by the Shopko Lenders on the equity of the entity that indirectly holds the majority of our Shopko assets, we do not expect to receive any additional cash flow going forward from any of the assets leased to Shopko, nor bear further meaningful expenses related to those assets. On March 18, 2019, Shopko announced that it would seek to liquidate its operations.
On January 16, 2019, in connection with the Shopko bankruptcy filing, the Company announced that its Board of Trustees had elected to accelerate its strategic plan by engaging advisors to explore strategic alternatives focused on maximizing shareholder value. Strategic alternatives to be considered may include, but are not limited to, a sale of the Company or Master Trust 2014, a merger, the sale of other assets, and the maximizing of recoveries in connection with the Shopko bankruptcy. The Company has not set a timetable for completion of the execution of any portion of this strategic plan, and there can be no assurance that the exploration of strategic alternatives will result in any transaction or other alternative.
Common Dividend Declared
On March 5, 2019, the Board of Trustees declared a special cash dividend of $0.33 per common share for the first quarter ended March 31, 2019. The dividend will be paid on April 15, 2019 to holders of record as of March 29, 2019.
CRITICAL ACCOUNTING POLICIES AND ESTIMATES
Our accounting policies are determined in accordance with GAAP. The preparation of our financial statements requires us to make estimates and assumptions that are subjective in nature and, as a result, our actual results could differ materially from our estimates. Estimates and assumptions include, among other things, subjective judgments regarding the fair values and useful lives of our properties for depreciation and lease classification purposes, the collectability of receivables and asset impairment analysis. Set forth below are the more critical accounting policies that require management judgment and estimates in the preparation of our consolidated financial statements. See Notes 2 and 8 to the consolidated financial statements for further details.
Purchase Accounting and Acquisition of Real Estate; Lease Intangibles
We use a number of sources to estimate fair value of real estate acquisitions, including building age, building location, building condition, rent comparables from similar properties, and terms of in-place leases, if any. Lease intangibles, if any, acquired in conjunction with the purchase of real estate represent the value of in-place leases and above or below-market leases. In-place lease intangibles are valued based on our estimates of costs related to tenant acquisition and the carrying costs that would be incurred during the time it would take to locate a tenant if the property were vacant, considering current market conditions and costs to execute similar leases at the time of the acquisition. We then allocate the purchase price (including acquisition and closing costs) to land, building, improvements and equipment based on their relative fair values. For properties acquired with in-place leases, we allocate the purchase price of real estate to the tangible and intangible assets and liabilities acquired based on their estimated fair values. Above and below-market lease intangibles are recorded based on the present value of the difference between the contractual amounts to be paid pursuant to the leases at the time of acquisition of the real estate and our estimate of current market lease rates for the property, measured over a period equal to the remaining initial term of the lease.
Impairment
We review our real estate investments and related lease intangibles periodically for indicators of impairment, including the asset being held for sale, vacant or non-operating, tenant bankruptcy or delinquency, and leases expiring in 60 days or less. For assets with indicators of impairment, we then evaluate if its carrying amount may not be recoverable. We consider factors such as expected future undiscounted cash flows, estimated residual value, market trends (such as the effects of leasing demand and competition) and other factors in making this assessment. An asset is considered impaired if its carrying value exceeds its estimated undiscounted cash flows.
Impairment is then calculated as the amount by which the carrying value exceeds the estimated fair value, or for assets held for sale, as the amount by which the carrying value exceeds fair value less costs to sell. Estimating future cash flows and fair values is highly subjective and such estimates could differ materially from actual results. Key assumptions used in estimating future cash flows and fair values include, but are not limited to, revenue growth rates, interest rates, discount rates, capitalization rates, lease renewal probabilities, tenant vacancy rates and other factors.
Impairment and Allowance for Loan Losses
We periodically evaluate the collectability of our loans receivable, including accrued interest, by analyzing the underlying property-level economics and trends, collateral value and quality, and other relevant factors in determining the adequacy of its allowance for loan losses. A loan is determined to be impaired when, in management’s judgment based on current information and events, it is probable that we will be unable to collect all amounts due according to the contractual terms of the loan agreement. Specific allowances for loan losses are provided for impaired loans on an individual loan basis in the amount by which the carrying value exceeds the estimated fair value of the underlying collateral less disposition costs. Delinquent loans receivable are written off against the allowance when all possible means of collection have been exhausted.
A loan is placed on non-accrual status when the loan has become 60 days past due, or earlier if management determines that full recovery of the contractually specified payments of principal and interest is doubtful. While on non-accrual status, interest income is recognized only when received.
REIT Status
We will elect to be taxed as a REIT for federal income tax purposes commencing with our taxable year ended December 31, 2018. We believe that we have been organized and have operated in a manner that has allowed us to qualify as a REIT commencing with such taxable year. To maintain our REIT status, we are required to annually distribute to our shareholders at least 90% of our REIT taxable income, determined without regard to the dividends paid deduction and excluding any net capital gain, and meet the various other requirements imposed by the Code relating to such matters as operating results, asset holdings, distribution levels and diversity of share ownership. Provided that we qualify for taxation as a REIT, we are generally not subject to corporate level federal income tax on the earnings distributed to our shareholders that we derive from our REIT qualifying activities. We are still subject to state and local income and franchise taxes and to federal income and excise tax on our undistributed income. If we fail to qualify as a REIT in any taxable year, or we elect not to maintain our REIT status, and are unable to avail ourselves of certain savings provisions set forth in the Code, all of our taxable income would be subject to federal income tax at regular corporate rates. Unless entitled to relief under specific statutory provisions, we would be ineligible to elect to be treated as a REIT for the four taxable years following the year for which we lose our qualification. It is not possible to state whether in all circumstances we would be entitled to this statutory relief.
RESULTS OF OPERATIONS: COMPARISON OF THE YEARS ENDED DECEMBER 31, 2018 AND 2017
|
| | | | | | | | | | | | | | |
| Year Ended December 31, |
(In Thousands) | 2018 | | 2017 | | Change | | % Change |
| | | | | | | |
Revenues: | | | | | | | |
Rental income | $ | 240,410 |
| | $ | 226,586 |
| | $ | 13,824 |
| | 6.1 | % |
Interest income on loans receivable | 3,080 |
| | 768 |
| | 2,312 |
| | NM |
|
Other income | 2,817 |
| | 4,448 |
| | (1,631 | ) | | (36.7 | )% |
Total revenues | 246,307 |
| | 231,802 |
| | 14,505 |
| | 6.3 | % |
Expenses: | |
| | |
| | | | |
General and administrative | 13,425 |
| | 20,491 |
| | (7,066 | ) | | (34.5 | )% |
Related party fees | 19,533 |
| | 5,500 |
| | 14,033 |
| | NM |
|
Transaction costs | 8,676 |
| | 4,354 |
| | 4,322 |
| | 99.3 | % |
Property costs (including reimbursable) | 12,758 |
| | 12,496 |
| | 262 |
| | 2.1 | % |
Interest | 114,997 |
| | 76,733 |
| | 38,264 |
| | 49.9 | % |
Depreciation and amortization | 84,678 |
| | 80,386 |
| | 4,292 |
| | 5.3 | % |
Impairment and allowance for loan losses | 221,349 |
| | 33,548 |
| | 187,801 |
| | NM |
|
Total expenses | 475,416 |
| | 233,508 |
| | 241,908 |
| | NM |
|
Other income: | |
| | |
| | | | |
Loss on debt extinguishment | (366 | ) | | (2,223 | ) | | 1,857 |
| | (83.5 | )% |
Gain on disposition of real estate assets | 9,458 |
| | 22,393 |
| | (12,935 | ) | | (57.8 | )% |
Total other income | 9,092 |
| | 20,170 |
| | (11,078 | ) | | (54.9 | )% |
(Loss) income before income tax expense | (220,017 | ) | | 18,464 |
| | (238,481 | ) | | NM |
|
Income tax expense | (221 | ) | | (179 | ) | | (42 | ) | | (23.5 | )% |
Net (loss) income | $ | (220,238 | ) | | $ | 18,285 |
| | $ | (238,523 | ) | | NM |
|
NM-Percentages over 100% are not displayed.
Revenues
Rental income
Rental income for the comparative period increased primarily due to SMTA being a net acquirer during 2018, based on the following activity:
| |
• | Acquisitions/Contributions: |
| |
◦ | Nine properties acquired into the Master Trust 2014 segment, with a Real Estate Investment Value of $112.6 million |
| |
◦ | Ten properties contributed from Spirit in conjunction with the Spin-Off into the Other Properties segment, with a Real Estate Investment Value of $54.2 million |
| |
• | Dispositions/Distributions: |
| |
◦ | 35 properties disposed from the Master Trust 2014 segment, with a Real Estate Investment Value of $45.0 million, of which ten properties were Vacant |
| |
◦ | 12 properties disposed from the Other Properties segment, with a Real Estate Investment Value of $59.9 million, of which two properties were Vacant |
| |
◦ | Three properties distributed to Spirit in conjunction with the Spin-Off from the Other Properties segment, with a Real Estate Investment Value of $3.2 million |
As of December 31, 2018 and 2017, respectively, 25 and six of our properties were Vacant, representing approximately 2.9% and 0.7% of our owned properties, respectively.
Also included in rental income are tenant reimbursements, where our tenants are obligated under the lease agreement to reimburse us for certain property costs we incur, and non-cash rental income. Tenant reimbursement income is driven by the tenant reimbursable property costs described below and comprised 0.8% and 1.0% of rental income for the years ended December 31, 2018 and 2017, respectively. Non-cash rental income primarily consists of straight-line rental revenue and amortization of above- and below-market lease intangibles. During the years ended
December 31, 2018 and 2017, non-cash rentals were $3.1 million and $5.2 million, respectively, representing approximately 1.3% and 2.3%, respectively, of total rental income.
On January 16, 2019, Shopko filed for bankruptcy, and subsequently announced that it intends to liquidate its operations. As a result of Shopko's bankruptcy filing and the subsequent foreclosure by the Shopko Lenders on the equity of the entity that indirectly owns the majority of our assets leased to Shopko, we do not expect to receive any significant future cash flows from Shopko. Shopko contributed 19.1% of our contractual rent for the year ended December 31, 2018, almost all of which was attributable to our Other Properties segment.
Interest income on loans receivable
The increase in interest income on loans receivable is a result of the contribution from Spirit of the $35.0 million B-1 12% term loan with Shopko as borrower prior to the completion of the Spin-Off. Interest income on mortgage loans remained relatively flat period-over-period. In connection with Shopko’s bankruptcy filing, Shopko has filed pleadings asserting that any recovery under the Shopko B-1 Term Loan will be limited and may be impaired in full. Therefore, the Company has recorded an allowance for loan losses of $33.8 million in relation to the Shopko B-1 Term Loan, the remaining amount of the Shopko B-1 Term Loan as of the date hereof. While the outcome of the Shopko bankruptcy filing is uncertain and there can be no assurances that we will recover any amounts due to us under the Shopko B-1 Term Loan, we intend to pursue all of our rights and remedies in connection with the bankruptcy proceedings, with the goal of maximizing the receipt of amounts due to us under the the Shopko B-1 Term Loan. Shopko contributed 86.8% of our interest income on loans receivable for the year ended December 31, 2018, all of which was attributable to our Other Properties segment.
Other income
Period-over-period other income decreased primarily due to a decrease in lease termination fees received. For the year ended December 31, 2018, we received $0.5 million in lease termination fees primarily received from eight properties with tenants in the restaurant - casual dining industry, compared to $3.6 million in lease termination fees received primarily from one property with a tenant in the medical/other office industry and nine properties with tenants in the restaurant - casual dining industry during the year ended December 31, 2017.
Expenses
General and administrative and Transaction costs
For periods prior to the Spin-Off, general administrative expenses and transaction costs are comprised of amounts specifically identified and amounts allocated from Spirit's financial statements.
Specifically identified expenses: General and administrative expenses of $5.0 million and $0.7 million during the year ended December 31, 2018 and 2017, respectively, were specifically identified based on direct usage or benefit. Transaction costs are the expenses associated with the Spin-Off and, for the year ended December 31, 2018, $4.7 million were specifically identified based on direct usage or benefit. For year ended December 31, 2017, $3.2 million of transaction costs were specifically identified. As such, specifically identified expenses increased period-over-period, primarily as a result of professional costs incurred in 2018 subsequent to the Spin-Off in conjunction with operating as a separate publicly-traded company.
Allocated expenses: The increase from specifically identified expenses was offset by a decrease in allocated general and administrative expenses and transaction costs period-over-period. These have been allocated from Spirit’s financial statements for the periods prior to the completion of the Spin-Off, based on SMTA's property count relative to Spirit’s property count. SMTA’s property count decreased from 920 properties at December 31, 2017 compared to 893 properties at May 31, 2018. Spirit’s property count also decreased from 2,525 properties to 2,432 for the same period. As such, the allocation percentage year over year remained relatively flat. Therefore, the net decrease in allocated expenses is a direct result of there being only five months of allocated expenses in 2018 compared to a full year of allocated expenses in 2017.
Related party fees
In conjunction with the Spin-Off, SMTA entered into the Asset Management Agreement with Spirit Realty, L.P. for a $20 million flat fee per annum, plus a promoted interest fee based on the total shareholder return of SMTA's common shares during the relevant period if certain conditions are met. Therefore, asset management fees of $11.7 million were incurred and a promoted interest fee of $0.8 million was recognized for the seven months subsequent to the Spin-Off, which was the primary driver of the increase in related party fees period-over-period.
Additionally, property management fees for Master Trust 2014 accrue daily at 0.25% per annum of the collateral value of the Master Trust 2014 Collateral Pool less any specially serviced assets and special servicing fees which accrue daily at 0.75% per annum of the collateral value of any assets deemed to be specially serviced per the terms of the Property Management and Servicing Agreement. Collateral value of Master Trust 2014 increased from $2.0 billion at December 31, 2016 to $2.6 billion at December 31, 2017 as a result of the December 2017 issuance, and then remained flat at $2.6 billion until December 31, 2018. As a result, property management and special servicing fees paid to our Manager increased $1.5 million period-over-period.
Property costs (including reimbursable)
For the year ended December 31, 2018, property costs excluding bad debt expense were $12.3 million (including $2.8 million of tenant reimbursable expenses) compared to $9.1 million (including $2.8 million of tenant reimbursable expenses) for the same period in 2017. The increase in non-reimbursable costs of $3.2 million was driven primarily by $4.9 million of non-reimbursable property tax expenses recorded to the Other Properties segment in conjunction with Shopko's bankruptcy, offset by a decrease in other non-reimbursable property tax expense year-over-year. Bad debt expense for the year ended December 31, 2017 was $3.4 million, which reflects the write-off of straight-line rent receivables deemed to be uncollectible, compared to $0.5 million of bad debt expense for the year ended December 31, 2018.
Interest
The increase in interest expense is primarily related to the new issuance of Master Trust 2014 notes in December 2017 and the two CMBS loans, both in the Other Properties segment, entered into in January 2018 and November 2018, respectively. See Note 4 to the financial statements herein.
The following table summarizes our interest expense:
|
| | | | | | | |
| Year Ended December 31, |
(In Thousands) | 2018 | | 2017 |
| |
Interest expense-Master Trust 2014 | $ | 96,532 |
| | $ | 70,664 |
|
Interest expense-CMBS | 6,842 |
| | — |
|
Non-cash interest expense: | |
| | |
|
Amortization of deferred financing costs | 4,653 |
| | 1,480 |
|
Amortization of debt discount, net | 6,970 |
| | 4,589 |
|
Total interest expense | $ | 114,997 |
| | $ | 76,733 |
|
Depreciation and amortization
During the year ended December 31, 2018, we acquired or received through contribution 19 properties, representing a Real Estate Investment Value of $166.8 million, and we disposed of or contributed 50 properties with a Real Estate Investment Value of $108.1 million. Therefore, as a net acquirer during the period based on Real Estate Investment Value, depreciation and amortization increased year-over-year. This increase was attributable to the Master Trust 2014 segment, as this segment was a net acquirer of depreciable real estate, partially offset by a slight decrease in depreciation and amortization in the Other Properties segment, at this segment was a net disposer of decpreciable real estate year-over-year.
The following table summarizes our depreciation and amortization expenses:
|
| | | | | | | |
| Year Ended December 31, |
(In Thousands) | 2018 | | 2017 |
| |
Depreciation of real estate assets | $ | 73,791 |
| | $ | 69,909 |
|
Amortization of lease intangibles | 10,883 |
| | 10,477 |
|
Other depreciation | 4 |
| | — |
|
Total depreciation and amortization | $ | 84,678 |
| | $ | 80,386 |
|
Impairment and allowance for loan losses
During the year ended December 31, 2018, we recorded impairment and allowance for loan losses of $221.3 million. This primarily consisted of $202.3 million of impairment charges and allowance for loan losses related to tangible and intangible assets due to the Shopko bankruptcy filing, including $6.5 million of impairment charges recorded on the Other Properties segment's goodwill and a $33.8 million allowance for loan losses in relation to the Shopko B-1 Term Loan.
During the year ended December 31, 2017, we recorded impairment charges of $33.5 million, of which $25.2 million of the impairment was recorded on vacant properties, comprised of $21.4 million on 19 vacant held for use properties and $3.8 million on eight vacant held for sale properties. $8.0 million of impairment was recorded on underperforming properties, comprised of $8.5 million recorded on 11 underperforming held for sale properties, offset by $0.5 million recoveries recorded on 14 underperforming held for use properties as a result of the write-off of intangible lease liabilities. The remaining $0.3 million of impairment charges related to unrecoverable amounts from loans receivable.
Loss on debt extinguishment
During the year ended December 31, 2018, we extinguished $6.3 million of Master Trust 2014 debt, resulting in approximately $0.4 million in losses on debt extinguishment related to pre-payment premiums paid. During the same period in 2017, we extinguished the full outstanding balance of Master Trust 2014 Series 2014-1 Class A1 notes of $43.1 million. The loss on the extinguishment was primarily attributable to the $1.6 million pre-payment premium paid in conjunction with this voluntary pre-payment.
Gain on disposition of assets
During the year ended December 31, 2018, we disposed of 47 properties and recorded net gains totaling $9.5 million. There were $8.8 million in net gains on the sale of 35 active properties, including the sale of 10 properties operated by Shopko. There were additionally $0.7 million in net gains from the sale of 12 vacant properties.
For the same period in 2017, we disposed of 76 properties and recorded net gains totaling $22.4 million. There were $23.6 million in net gains on the sale of 32 active properties, including the sale of 12 properties operated by Shopko. This was partially offset by $1.2 million in net losses from the sale of 44 vacant properties.
RESULTS OF OPERATIONS: COMPARISON OF THE YEARS ENDED DECEMBER 31, 2017 AND 2016
|
| | | | | | | | | | | | | | |
| Year Ended December 31, |
(In Thousands) | 2017 | | 2016 | | Change | | % Change |
| | | | | | | |
Revenues: | | | | | | | |
Rentals | $ | 226,586 |
| | $ | 236,801 |
| | $ | (10,215 | ) | | (4.3 | )% |
Interest income on loans receivable | 768 |
| | 2,207 |
| | (1,439 | ) | | (65.2 | )% |
Other income | 4,448 |
| | 6,295 |
| | (1,847 | ) | | (29.3 | )% |
Total revenues | 231,802 |
| | 245,303 |
| | (13,501 | ) | | (5.5 | )% |
Expenses: | | | | | | | |
General and administrative | 20,491 |
| | 18,956 |
| | 1,535 |
| | 8.1 | % |
Related party fees | 5,500 |
| | 5,427 |
| | 73 |
| | 1.3 | % |
Restructuring charges | — |
| | 2,465 |
| | (2,465 | ) | | (100.0 | )% |
Transaction costs | 4,354 |
| | — |
| | 4,354 |
| | 100.0 | % |
Property costs (including reimbursable) | 12,496 |
| | 5,258 |
| | 7,238 |
| | NM |
|
Interest | 76,733 |
| | 77,895 |
| | (1,162 | ) | | (1.5 | )% |
Depreciation and amortization | 80,386 |
| | 85,761 |
| | (5,375 | ) | | (6.3 | )% |
Impairment and allowance for loan losses | 33,548 |
| | 26,565 |
| | 6,983 |
| | 26.3 | % |
Total expenses | 233,508 |
| | 222,327 |
| | 11,181 |
| | 5.0 | % |
Other income: | |
| | |
| | | |
|
|
Loss on debt extinguishment | (2,223 | ) | | (1,372 | ) | | (851 | ) | | 62.0 | % |
Gain on disposition of real estate assets | 22,393 |
| | 26,499 |
| | (4,106 | ) | | (15.5 | )% |
Total other income | 20,170 |
| | 25,127 |
| | (4,957 | ) | | (19.7 | )% |
Income before income tax expense | 18,464 |
| | 48,103 |
| | (29,639 | ) | | (61.6 | )% |
Income tax expense | (179 | ) | | (181 | ) | | 2 |
| | (1.1 | )% |
Net income | $ | 18,285 |
| | $ | 47,922 |
| | $ | (29,637 | ) | | (61.8 | )% |
NM-Percentages over 100% are not displayed.
Revenues
Rental income
Rental income for the comparative period decreased primarily due to a decrease in contractual rental revenue resulting from the timing of real estate transactions subsequent to December 31, 2016. While Real Estate Investment Value increased by $265.5 million for the year ended December 31, 2017 through the acquisition of two properties and Spirit’s contribution of 10 properties in conjunction with the Master Trust 2014 issuance, the 10 properties were not contributed until December 2017. During the same period, 76 properties were disposed with a Real Estate Investment Value of $145.7 million. As of December 31, 2017 and 2016, respectively, six and 18 of our properties were Vacant, representing approximately 0.7% and 1.8% of our owned properties. Of the six Vacant properties, none were held for sale as of December 31, 2017.
Also included in rental income are tenant reimbursements, where our tenants are obligated under the lease agreement to reimburse us for certain property costs we incur, and non-cash rental income. Tenant reimbursement income is driven by the tenant reimbursable property costs described below and comprised 1.0% and 0.9% of rental income for the years ended December 31, 2017 and 2016, respectively. Non-cash rental income primarily consists of straight-line rental revenue and amortization of above- and below-market lease intangibles. During the years ended December 31, 2017 and 2016, non-cash rentals were $5.2 million and $4.1 million, respectively, representing approximately 2.3% and 1.7%, respectively, of total rental income.
Interest income on loans receivable
The decrease in interest income on loans receivable year over year primarily relates to the timing of change in outstanding loans during the year ended December 31, 2016, where mortgage loans receivable decreased from 79
loans collateralized by 81 properties at the beginning of 2016 to nine loans collateralized by 11 properties at December 31, 2016. Mortgage loans receivable then remained flat, with nine loans collateralized by 11 properties still outstanding at December 31, 2017.
Other income
Year-over-year other income decreased primarily due to a decrease in lease termination fees received. For the year ended December 31, 2017, other income is primarily attributable to $3.6 million in lease termination fees received from one property with a tenant in the medical office industry and nine properties with tenants in the restaurant – casual dining industry. For the year ended December 31, 2016, other income is primarily attributable to $5.4 million in lease termination fees received from three properties with a tenant in the education industry.
Expenses
General and administrative, Restructuring charges and Transaction costs
General and administrative expenses of $0.7 million and $1.4 million during the years ended December 31, 2017 and 2016, respectively, were specifically identified based on direct usage or benefit. The change in specifically identified expenses is a result of internalization of certain property servicing functions in 2017, resulting in the elimination of certain servicing fees. Transaction costs are the expenses associated with the spin-off, and there were no transaction costs incurred for the year ended 2016. For the transaction costs incurred during the year ended December 31, 2017, $3.2 million were specifically identified based on direct usage or benefit.
The remaining general and administrative expenses, restructuring charges and transaction costs have been allocated from Spirit’s financial statements, based on SMTA's property count relative to Spirit’s property count. SMTA's property count decreased from 982 properties at December 31, 2016 to 918 properties at December 31, 2017. Spirit’s property count also decreased from 2,615 properties to 2,480 for the same period. As such, the allocation percentage year over year remained relatively flat. Therefore, the increase in general and administrative expenses is a direct result of Spirit’s increased expenses year-over-year. The relocation of Spirit’s headquarters from Scottsdale, Arizona to Dallas, Texas was completed in 2016 and therefore there were no restructuring charges recognized at Spirit for the year ended December 31, 2017.
Related party fees
Spirit Realty, L.P., a wholly-owned subsidiary of Spirit, is the property manager and special servicer of Master Trust 2014, under which Spirit Realty, L.P. receives property management fees which accrue daily at 0.25% per annum of the collateral value of the Master Trust 2014 collateral pool less any specially serviced assets and special servicing fees which accrue daily at 0.75% per annum of the collateral value of any assets deemed to be specially serviced per the terms of the Property Management and Servicing Agreement. Collateral value remained relatively flat from $2.0 billion at December 31, 2016 to $1.9 billion at November 31, 2017. In conjunction with the issuance completed in December 2017, collateral value increased to $2.6 billion at December 31, 2017. However, due to the timing of the issuance, the increase in collateral value had little impact on the related party fees for the year ended December 31, 2017, resulting in relatively flat related party fees year-over-year.
Property costs (including reimbursable)
For the year ended December 31, 2017, property costs excluding bad debt expense were $9.1 million (including $2.8 million of tenant reimbursable expenses) compared to $5.3 million (including $2.0 million of tenant reimbursable expenses) for the same period in 2016. The increase was driven primarily by an increase in non-reimbursable property taxes on operating properties of $2.4 million, which relates primarily to the timing of dispositions of vacant properties during 2017, as well as an increase in tenant credit issues year-over-year. Bad debt expense for the year ended December 31, 2017 was $3.4 million, which reflects the write-off of straight-line rent receivables deemed to be uncollectible, compared to no bad debt expense for the year ended December 31, 2016.
Interest
Interest expense decreased slightly year-over year, primarily due to the timing of debt extinguishment in both 2016 and 2017. For the year ended December 31, 2016, $119.3 million of CMBS debt was extinguished with a weighted average interest rate of 6.0%; however, most of the debt was extinguished in the first half of 2016. For the year ended December 31, 2017, $43.1 million of Master Trust 2014 debt was extinguished with an interest rate of 5.1%, however, it was not extinguished until November 2017.
The following table summarizes our interest expense:
|
| | | | | | | |
| Year Ended December 31, |
(In Thousands) | 2017 | | 2016 |
| |
Interest expense-Master Trust 2014 | $ | 70,664 |
| | $ | 70,223 |
|
Interest expense-CMBS | — |
| | 2,833 |
|
Non-cash interest expense: | |
| | |
|
Amortization of deferred financing costs | 1,480 |
| | 1,285 |
|
Amortization of debt discount, net | 4,589 |
| | 3,554 |
|
Total interest expense | $ | 76,733 |
| | $ | 77,895 |
|
Depreciation and amortization
Depreciation and amortization expense relates to the commercial buildings and improvements we own and to amortization of the related lease intangibles. The year-over-year decrease is primarily due to the disposition of 76 properties with a depreciable basis of $145.7 million, during the year ended December 31, 2017. The decrease was partially offset by acquisitions of 12 properties during 2017 with a depreciable basis of $265.5 million; however, 10 of these properties were contributed to the Predecessor Entities in conjunction with the Master Trust 2014 issuance in December 2017 and therefore did not contribute significantly to depreciation and amortization expenses for the year ended 2017. The decline in depreciable basis was furthered by impairment charges recorded in 2017 on properties that remain in our portfolio.
The following table summarizes our depreciation and amortization expenses:
|
| | | | | | | |
| Year Ended December 31, |
(In Thousands) | 2017 | | 2016 |
| |
Depreciation of real estate assets | $ | 69,909 |
| | $ | 73,866 |
|
Amortization of lease intangibles | 10,477 |
| | 11,895 |
|
Total depreciation and amortization | $ | 80,386 |
| | $ | 85,761 |
|
Impairment and allowance for loan losses
During the year ended December 31, 2017, we recorded impairment charges of $33.5 million, of which $25.2 million of the impairment was recorded on vacant properties, comprised of $21.4 million on 19 vacant held for use properties and $3.8 million on eight vacant held for sale properties. $8.0 million of impairment was recorded on underperforming properties, comprised of $8.5 million recorded on 11 underperforming held for sale properties, offset by $0.5 million recoveries recorded on 14 underperforming held for use properties as a result of the write-off of intangible lease liabilities. The remaining $0.3 million of impairment charges related to unrecoverable amounts from loans receivable.
During the year ended December 31, 2016, we recorded impairment charges of $26.6 million, of which $9.3 million of the impairment was recorded on vacant properties, comprised of $6.4 million recorded on 15 vacant held for use properties and $2.9 million recorded on three vacant held for sale properties. The remaining $17.3 million of impairment was recorded on underperforming properties, comprised of $8.5 million recorded on 12 underperforming held for sale properties and $8.8 million recorded on 28 underperforming held for use properties.
Loss on debt extinguishment
During the year ended December 31, 2017, we extinguished the full outstanding balance of Master Trust 2014 Series 2014-1 Class A1 note of $43.1 million. The loss on the extinguishment was primarily attributable to the $1.6 million pre-payment premium paid in conjunction with this voluntary pre-payment. During the same period in 2016, we extinguished $119.3 million of CMBS debt and recognized a loss on debt extinguishment of $1.4 million. The CMBS debt related to three fixed rate loans collateralized by 56 properties with a weighted average interest rate of 6.0%.
Gain on disposition of assets
During the year ended December 31, 2017, we disposed of 76 properties and recorded net gains totaling $22.4 million. There were $23.6 million in net gains on the sale of 32 active properties, including the sale of 12 properties operated by Shopko. This was partially offset by $1.2 million in net losses from the sale of 44 vacant properties.
For the same period in 2016, we disposed of 48 properties and recorded net gains totaling $26.5 million. There were $25.5 million in net gains on the sale of 37 active properties, including the sale of nine properties operated by Shopko. The remaining $1.0 million was primarily comprised of net gains on the sale of 11 vacant properties and a partial taking.
LIQUIDITY AND CAPITAL RESOURCES
Short-term Liquidity and Capital Resources
On a short-term basis, our principal demands for funds will be for operating expenses, as well as distributions to shareholders and interest and principal on our debt financings. We expect to fund our operating expenses and other short-term liquidity requirements, capital expenditures, payment of principal and interest on our outstanding indebtedness, property improvements, re-leasing costs and cash distributions to common and preferred shareholders, primarily through cash provided by operating activities, from refinancings within Master Trust 2014, and continued dispositions of assets within our Other Properties segment.
Long-term Liquidity and Capital Resources
On January 16, 2019, in connection with the Shopko bankruptcy filing, we announced that our Board of Trustees had elected to accelerate our strategic plan by identifying and engaging advisors to explore strategic alternatives focused on maximizing shareholder value. Strategic alternatives to be considered may include, but are not limited to, a sale of the Company or the Master Trust 2014, a merger, the sale of the single distribution center property and other non-core assets, and the maximizing of recoveries in connection with the Shopko bankruptcy. The execution of strategic alternatives may materially impact our long-term capital needs and plan to meet those needs. Currently, we plan to meet our long-term capital needs, including long-term financing of debt maturities, by issuing bonds using the Master Trust 2014 program discussed below or by issuing debt or equity securities. We will continually evaluate and seek to obtain alternative financing, but we cannot assure you that we will have access to the capital markets at times and on terms that are acceptable to us. We expect that our primary uses of capital will be for the payment of tenant improvements, operating expenses, including debt service payments on any outstanding indebtedness, and distributions to our shareholders. We believe that cash on hand and other available borrowings are sufficient to meet these obligations over the next 12 months.
Description of Certain Debt
The following descriptions of debt should be read in conjunction with Note 4 to the consolidated financial statements herein.
Master Trust 2014
Master Trust 2014 is an asset-backed securitization platform through which we raise capital by issuing non-recourse asset-backed securities collateralized by commercial real estate, net leases and mortgage loans. The Master Trust 2014 Collateral Pool is managed by Spirit Realty, L.P., a related party, in its capacity as property manager and special servicer. In general, monthly rental and mortgage receipts are deposited with the indenture trustee, who first utilizes these funds to satisfy the debt service requirements on the notes and any fees and costs associated with the administration of Master Trust 2014. Any remaining funds are remitted to SMTA monthly on the note payment date.
Upon satisfaction of certain conditions, we may, from time to time, sell or exchange real estate properties or mortgage loans from the Collateral Pool. Proceeds from these transactions are held on deposit by the indenture trustee in the Release Account until a qualifying substitution is made or the amounts are distributed as an early repayment of principal. At December 31, 2018, $16.1 million and $5.6 million were held on deposit in the Release Account and Liquidity Reserve Account, respectively, and classified as restricted cash within deferred costs and other assets, net in the consolidated balance sheet. All outstanding series of Master Trust 2014 were rated investment grade as of December 31, 2018.
As of December 31, 2018, the Master Trust 2014 notes were secured by 784 owned and financed properties. The notes issued under Master Trust 2014 are cross-collateralized by the assets of all issuers (each its own special purpose entity) within this trust. The assets of these special purpose entities are not available to pay, or otherwise satisfy
obligations to, the creditors of any affiliate or owner of another entity unless the special purpose entities have expressly agreed and are permitted under their governing documents. As of December 31, 2018, total assets of $1.91 billion were held by the Master Trust 2014 special purpose entities. The Master Trust 2014 debt is summarized below:
|
| | | | | | | | | | | |
| Stated
Rates (1) | | Maturity | | December 31, 2018 | | December 31, 2017 |
| | | | | | | |
| | | (in Years) | (in Thousands) |
Series 2014-1 Class A2 | 5.4% | | 1.6 | | $ | 240,908 |
| | $ | 252,437 |
|
Series 2014-2 | 5.8% | | 2.2 | | 229,516 |
| | 234,329 |
|
Series 2014-3 | 5.7% | | 3.2 | | 309,753 |
| | 311,336 |
|
Series 2014-4 Class A1 | 3.5% | | 1.1 | | 149,484 |
| | 150,000 |
|
Series 2014-4 Class A2 | 4.6% | | 11.1 | | 341,022 |
| | 358,664 |
|
Series 2017-1 Class A | 4.4% | | 4.0 | | 538,705 |
| | 542,400 |
|
Series 2017-1 Class B | 5.5% | | 4.0 | | 132,000 |
| | 132,000 |
|
Series 2018-1 Class A VFN | 4.6% | | 2.8 | | — |
| | — |
|
Total Master Trust 2014 notes | 5.0% | | 4.4 | | 1,941,388 |
| | 1,981,166 |
|
Debt discount, net | | | | | (21,155 | ) | | (36,342 | ) |
Deferred financing costs, net | | | | | (14,912 | ) | | (17,989 | ) |
Total Master Trust 2014, net | | | | | $ | 1,905,321 |
| | $ | 1,926,835 |
|
(1) Represents the individual series stated interest rates as of December 31, 2018 and the weighted average stated rate of the total Master Trust 2014 notes, based on the collective series outstanding principal balances as of December 31, 2018.
Academy CMBS
On January 22, 2018, we entered into a new non-recourse loan agreement, which is collateralized by a single distribution center property located in Katy, Texas. The loan has a fixed interest rate of 5.14%. As a result of the issuance, we received approximately $84.0 million in proceeds, all of which was distributed to Spirit. This CMBS loan and its collateral are held in special purpose entities, which are separate legal entities, and are the sole owner of their assets and responsible for their liabilities. The assets of the special purpose entities are not available to pay, or otherwise satisfy obligations to, the creditors of any affiliate or owner of another entity unless the special purpose entities have expressly agreed and are permitted to do so under their governing documents. As of December 31, 2018, total assets of $101.4 million were held by the CMBS special purpose entities, and the loan had an outstanding principal balance of $83.0 million with a remaining maturity of 9.1 years.
Shopko CMBS
On November 1, 2018, four indirectly wholly-owned, property-owning subsidiaries of the Company entered into a non-recourse mortgage loan agreement with the Shopko Lenders, in an aggregate amount of $165.0 million. The Company received net proceeds from this loan agreement of approximately $141.9 million after the payment of fees, expenses and required reserves. The loan was secured by a pledge of the equity in the four subsidiaries, which collectively hold 85 assets (83 owned properties and two seller-financed notes on properties) that are leased to Shopko. On November 27, 2018, SMTA, through the indirectly wholly-owned subsidiary that owns the four property-owning subsidiaries, entered into a non-recourse mezzanine loan agreement with the Shopko Lenders, pursuant to which $40.0 million of the original $165.0 million was carved out, resulting in no additional proceeds to SMTA (such mezzanine loan agreement, together with the original loan agreement, the “Shopko CMBS Loan Agreements”). The mezzanine loan was secured by an equity pledge of the indirect wholly-owned subsidiary that owns the four property-owning subsidiaries.
On January 16, 2019, our indirect wholly-owned subsidiaries as borrowers under the Shopko CMBS Loan Agreements defaulted on the loans when those entities ceased to make interest payments as a result of Shopko ceasing to pay its rent obligations following its bankruptcy filing. The full outstanding principal amount of $157.4 million outstanding under the Shopko CMBS Loan Agreements immediately became due and payable, and interest is accruing at the default rate of LIBOR plus 12.5% on the original loan portion and LIBOR plus 18.0% on the mezzanine loan portion. On March 1, 2019, the Shopko Lenders foreclosed on the equity of the entity that owns the four property-owning subsidiaries.
Debt Maturities
Future principal payments due on our Master Trust 2014 and CMBS debt outstanding as of December 31, 2018: |
| | | | | | | | | | | | | | | | | | | | | | | | | | | |
(in thousands) | Total | | 2019 (1) | | 2020 | | 2021 | | 2022 | | 2023 | | Thereafter |
| | | | | | | | | | | | | |
Master Trust 2014 | $ | 1,941,388 |
| | $ | 35,199 |
| | $ | 404,132 |
| | $ | 242,248 |
| | $ | 993,273 |
| | $ | 21,063 |
| | $ | 245,473 |
|
CMBS | 240,456 |
| | 158,620 |
| | 1,251 |
| | 1,330 |
| | 1,401 |
| | 1,475 |
| | 76,379 |
|
Total | $ | 2,181,844 |
| | $ | 193,819 |
| | $ | 405,383 |
| | $ | 243,578 |
| | $ | 994,674 |
| | $ | 22,538 |
| | $ | 321,852 |
|
(1) $157.4 million of the CMBS principal balance is attributable to the Shopko CMBS Loan Agreements, which was relieved on March 1, 2019 as a result of the Shopko Lenders foreclosing on the equity of the entity that indirectly owns the Shopko assets that secured the loan.
Contractual Obligations
Our commitments, based on period in which payment is due, as of December 31, 2018:
|
| | | | | | | | | | | | | | | | | | | |
(in thousands) | Total | | Less than 1 year | | 1-3 years | | 3-5 years | | More than 5 years |
| | | | | | | | | |
Debt - Principal (1) | $ | 2,181,844 |
| | $ | 193,819 |
| | $ | 648,961 |
| | $ | 1,017,212 |
| | $ | 321,852 |
|
Debt - Interest (2) | 401,854 |
| | 120,741 |
| | 154,169 |
| | 63,552 |
| | 63,392 |
|
Capital Improvements | 5,066 |
| | 5,026 |
| | 40 |
| | — |
| | — |
|
Operating Lease Obligations | 21,581 |
| | 1,149 |
| | 2,305 |
| | 2,408 |
| | 15,719 |
|
Total | $ | 2,610,345 |
| | $ | 320,735 |
| | $ | 805,475 |
| | $ | 1,083,172 |
| | $ | 400,963 |
|
(1) $157.4 million of the CMBS principal balance for less than one year is attributable to the Shopko CMBS Loan Agreements, which was relieved on March 1, 2019 as a result of the Shopko Lenders foreclosing on the equity of the entity that indirectly owns the Shopko assets that secured the loan.
(2) Debt - Interest has been calculated based on outstanding balances as of December 31, 2018 through their respective maturity dates and excludes unamortized non-cash deferred financing costs of $21.9 million and unamortized debt discount, net of $21.2 million as of December 31, 2018.
Distribution Policy
Distributions from our current or accumulated earnings are generally classified as ordinary income, whereas distributions in excess of our current and accumulated earnings, to the extent of a shareholder’s federal income tax basis in our common shares, are generally classified as a return of capital. Under the 2017 Tax Legislation, U.S. shareholders that are individuals, trusts and estates generally may deduct up to 20% of the ordinary dividends (e.g., dividends not designated as capital gain dividends or qualified dividend income) received from a REIT for taxable years beginning after December 31, 2017 and before January 1, 2026. Distributions in excess of a shareholder’s federal income tax basis in our common shares are generally characterized as capital gain.
We are required to distribute 90% of our taxable income (subject to certain adjustments and excluding net capital gains) on an annual basis to maintain qualification as a REIT for federal income tax purposes and are required to pay federal income tax at regular corporate rates to the extent we distribute less than 100% of our taxable income (including capital gains). We currently intend to make distributions that will enable us to meet the distribution requirements applicable to REITs and to eliminate or minimize our obligation to pay corporate-level federal income and excise taxes.
Any distributions made to our shareholders will be at the sole discretion of our Board of Trustees, and their form, timing and amount, if any, will depend upon a number of factors, including our actual and projected results of operations, FFO, liquidity, cash flows and financial condition, the revenue we actually receive from our properties, our operating expenses, our debt service requirements, our capital expenditures, prohibitions and other limitations under our financing arrangements, our REIT taxable income, the annual REIT distribution requirements, applicable law and such other factors as our Board of Trustees deems relevant.
CASH FLOWS: COMPARISON OF THE YEARS ENDED DECEMBER 31, 2018 AND 2017
The following table presents a summary of our cash flows for the year ended December 31, 2018 and 2017:
|
| | | | | | | | | | | | |
| | Year Ended December 31, |
(In Thousands) | | 2018 | | 2017 | | Change |
| | |
Net cash provided by operating activities | | $ | 96,678 |
| | $ | 130,900 |
| | $ | (34,222 | ) |
Net cash (used in) provided by investing activities | | (33,752 | ) | | 128,071 |
| | (161,823 | ) |
Net cash provided by (used in) financing activities | | 75,664 |
| | (205,150 | ) | | 280,814 |
|
Net increase in cash, cash equivalents and restricted cash | | $ | 138,590 |
| | $ | 53,821 |
| | $ | 84,769 |
|
As of December 31, 2018, we had $205.1 million in cash, cash equivalents and restricted cash as compared to $66.5 million as of December 31, 2017.
Operating Activities
Our cash flows from operating activities are primarily dependent upon the occupancy level of our portfolio, the rental rates specified in our leases, the collectability of rent and the level of our operating expenses and other general and administrative costs.
The net decrease in cash provided by operating activities was primarily attributable to an increase in cash interest expense of $32.0 million, an increase in related party fees of $14.0 million and an increase in transaction costs of $4.3 million. The net decrease in cash provided by operating activities was partially offset by an increase in cash rental revenue totaling $15.9 million.
Investing Activities
Cash used in investing activities is generally used to fund property acquisitions, for investments in loans receivable and, to a limited extent, for capital expenditures. Cash provided by investing activities generally relates to the disposition of real estate and other assets.
Net cash used in investing activities during the year ended December 31, 2018 included the use of $112.6 million to fund the acquisition of nine properties and capitalized real estate expenditures of $3.1 million, partially offset by the receipt of $76.9 million in net proceeds from the disposition of 47 properties and collections of principal on loans receivable totaling $5.1 million.
During the same period in 2017, net cash provided by investing activities included cash proceeds of $146.6 million from the disposition of 76 properties, partially offset by $26.0 million of cash used to fund the acquisition of two properties (of which one was a related party purchase from Spirit as discussed in Note 11: Related Party Transactions). Net cash provided by investing activities also included collections on loans receivable during the year ended December 31, 2017 of $8.8 million.
Financing Activities
Generally, our net cash used in financing activities is impacted by our contributions/distributions to Spirit for the period prior to the Spin-Off and our net borrowings under Master Trust 2014 and CMBS.
Net cash provided by financing activities during the year ended December 31, 2018 was attributable to borrowings under mortgages and notes payable of $257.7 million as a result of entering into new CMBS debt agreements. This was partially offset by cash used in financing activities primarily related to net distributions to Spirit of $106.4 million, repayments under mortgages and notes payable of $42.2 million, payments of common share dividends totaling $14.2 million, payments of preferred dividends totaling $9.3 million, and deferred financing costs of $9.6 million.
During the same period in 2017, net cash used in financing activities was primarily attributable to net distributions to Spirit of $749.3 million, repayments under Master Trust 2014 of $61.1 million, and deferred financing costs of $11.2 million. Net cash used in financing activities also included borrowings under Master Trust 2014 of $618.1 million.
CASH FLOWS: COMPARISON OF THE YEARS ENDED DECEMBER 31, 2017 AND 2016
|
| | | | | | | | | | | | |
| | Year Ended December 31, |
(In Thousands) | | 2017 | | 2016 | | Change |
| | |
Net cash provided by operating activities | | $ | 130,900 |
| | $ | 138,175 |
| | $ | (7,275 | ) |
Net cash provided by investing activities | | 128,071 |
| | 82,861 |
| | 45,210 |
|
Net cash used in financing activities | | (205,150 | ) | | (218,672 | ) | | 13,522 |
|
Net increase in cash, cash equivalents and restricted cash | | $ | 53,821 |
| | $ | 2,364 |
| | $ | 51,457 |
|
As of December 31, 2017, we had $66.5 million in cash, cash equivalents and restricted cash as compared to $12.7 million as of December 31, 2016.
Operating Activities
Our cash flows from operating activities are primarily dependent upon the occupancy level of our portfolio, the rental rates specified in our leases, the collectability of rent and the level of our operating expenses and other general and administrative costs.
The decrease in net cash provided by operating activities was primarily attributable to a decrease in cash rental revenue and interest income on loans receivable of $13.0 million, due to the disposition of 76 properties during 2017 with a Real Estate Investment value of $145.7 million and the payoff of one loan receivable with a principal balance of $2.9 million, which was partially offset by the acquisition of two properties during the same period with a Real Estate Investment Value of $25.0 million. Additionally, there was a $2.4 million decrease in cash interest expense as a result of principal repayments of $53.9 million of Master Trust 2014 during the year ended December 31, 2017.
Investing Activities
Cash used in investing activities is generally used to fund property acquisitions, for investments in loans receivable and, to a limited extent, for capital expenditures. Cash provided by investing activities generally relates to the disposition of real estate and other assets.
Net cash provided by investing activities during 2017 included cash proceeds of $146.6 million from the disposition of 76 properties, partially offset by $26.0 million of cash used to fund the acquisition of two properties (of which one was a related party purchase from Spirit as discussed in Note 11: Related Party Transactions). Net cash provided by investing activities also included collections on loans receivable during the year ended December 31, 2017 of $8.8 million.
During the same period in 2016, net cash provided by investing activities included cash proceeds of $141.3 million from the disposition of 48 properties, partially offset by $62.7 million of cash used to fund the acquisition of 17 properties (of which seven were related party purchases from Spirit as discussed in Note 11: Related Party Transactions). Net cash provided by investing activities also included collections on loans receivable during the year ended December 31, 2016 of $6.9 million.
Financing Activities
Generally, our net cash used in financing activities is impacted by our contributions/distributions to Spirit and net borrowings under Master Trust 2014 and CMBS.
Net cash used in financing activities during 2017 was primarily attributable to net distributions to Spirit of $749.3 million, repayments under Master Trust 2014 of $61.1 million, and deferred financing costs of $11.2 million. Net cash provided by financing activities also included borrowings under Master Trust 2014 of $618.1 million.
For the same period in 2016, net cash used in financing activities was primarily attributable to net distributions to Spirit of $81.6 million, repayments under Master Trust 2014 of $15.1 million and repayments under CMBS of $119.5 million.
Off-Balance Sheet Arrangements
As of December 31, 2018, we did not have any off-balance sheet financing arrangements.
Item 7A. Quantitative and Qualitative Disclosures About Market Risk
We are exposed to financial market risks, especially interest rate risk. Interest rates and other factors, such as occupancy, rental rates and the financial condition of our tenants, influence our performance more so than does inflation. Changes in interest rates do not necessarily correlate with inflation rates or changes in inflation rates. We generally offer leases that provide for payments of base rent with scheduled increases, based on a fixed amount or the lesser of a multiple of the increase in the CPI over a specified period term or fixed percentage and, to a lesser extent, contingent rent based on a percentage of the tenant’s gross sales, to help mitigate the effect of inflation. Because the properties in our portfolio are generally leased to tenants under triple-net leases, where the tenant is responsible for property operating costs and expenses, our exposure to rising property operating costs due to inflation is mitigated.
Interest rates are highly sensitive to many factors, including governmental monetary policies, domestic and global economic and political conditions, and other factors which are beyond our control. Our operating results will depend heavily on the difference between the revenue from our assets and the interest expense incurred on our borrowings. We may incur variable rate debt in the future. In addition, decreases in interest rates may lead to additional competition for the acquisition of real estate due to a reduction in desirable alternative income-producing investments. Increased competition for the acquisition of real estate may lead to a decrease in the yields on real estate we have targeted for acquisition. In such circumstances, if we are not able to offset the decrease in yields by obtaining lower interest costs on our borrowings, our results of operations will be adversely affected. Significant increases in interest rates may also have an adverse impact on our earnings if we are unable to acquire real estate with rental rates high enough to offset the increase in interest rates on our borrowings.
In the event interest rates rise significantly or there is an economic downturn, defaults may increase and result in credit losses, which may adversely affect our liquidity and operating results. In a decreasing interest rate environment, borrowers are generally more likely to prepay their loans in order to obtain financing at lower interest rates. Some of our investments in our mortgage loans receivable have significant prepayment protection in the form of yield maintenance provisions, which provide us with yield protection in a decreasing interest rate environment with respect to this portion of our investment portfolio.
As of December 31, 2018, $2.02 billion of our indebtedness consisted of long-term, fixed-rate obligations, consisting of our Master Trust 2014 notes and Academy CMBS loan. As of December 31, 2018, the weighted average stated interest rate of the Master Trust 2014 obligations, excluding amortization of deferred financing costs and debt discounts, was approximately 5.03%. The stated interest rate of the Academy CMBS obligation, excluding amortization of deferred financing costs, was 5.14%. As of December 31, 2018, $157.4 million of our indebtedness was variable-rate, consisting of our Shopko CMBS Loan Agreements, with a weighted average interest rate of 9.96%, excluding amortization of deferred financing costs. If LIBOR as of December 31, 2018 increased by 12.5 basis points, or 0.125%, the resulting increase in annual interest expense with respect to the our variable-rate debt would impact our future earnings and cash flows by $196.8 thousand.
The estimated fair values of our debt instruments have been derived based on market quotes for comparable instruments or discounted cash flow analyses using estimates of the amount and timing of future cash flows, market rates and credit spreads. The debt instrument balances as of December 31, 2018 are as follows (in thousands):
|
| | | | | | | |
| Carrying
Value | | Estimated
Fair Value |
| | | |
Loans receivable, net | $ | 30,093 |
| | $ | 26,852 |
|
Mortgages and notes payable, net (1) | $ | 2,138,804 |
| | $ | 2,219,119 |
|
(1) The carrying value of the debt instruments are net of unamortized deferred financing costs and certain debt discounts/premiums.
Item 8. Financial Statements and Supplementary Data
INDEX TO CONSOLIDATED FINANCIAL STATEMENTS
|
| |
Financial Statements and Supplemental Data | |
Report of Independent Registered Public Accounting Firm | |
Consolidated Balance Sheets of Spirit MTA REIT as of December 31, 2018 and 2017 | |
Consolidated Statements of Operations and Comprehensive Income (Loss) of Spirit MTA REIT for the Years Ended December 31, 2018, 2017 and 2016 | |
Consolidated Statements of Changes in (Deficit) Equity of Spirit MTA REIT for the Years Ended December 31, 2018, 2017 and 2016 | |
Consolidated Statements of Cash Flows of Spirit MTA REIT for the Years Ended December 31, 2018, 2017 and 2016 | |
Notes to Consolidated Financial Statements | |
Report of Independent Registered Public Accounting Firm
To the Shareholders and the Board of Trustees of
Spirit MTA REIT
Opinion on the Financial Statements
We have audited the accompanying consolidated balance sheets of Spirit MTA REIT (the Company) as of December 31, 2018 and 2017, the related consolidated statements of operations and comprehensive income (loss), changes in (deficit) equity and cash flows for each of the three years in the period ended December 31, 2018, and the related notes and financial statement schedules listed in the Index at Item 15(a) (collectively referred to as the “consolidated financial statements”). In our opinion, the consolidated financial statements present fairly, in all material respects, the financial position of the Company at December 31, 2018 and 2017, and the results of its operations and its cash flows for each of the three years in the period ended December 31, 2018, in conformity with U.S. generally accepted accounting principles.
Basis for Opinion
These financial statements are the responsibility of the Company's management. Our responsibility is to express an opinion on the Company’s financial statements based on our audits. We are a public accounting firm registered with the Public Company Accounting Oversight Board (United States) (PCAOB) and are required to be independent with respect to the Company in accordance with the U.S. federal securities laws and the applicable rules and regulations of the Securities and Exchange Commission and the PCAOB.
We conducted our audits in accordance with the standards of the PCAOB. Those standards require that we plan and perform the audit to obtain reasonable assurance about whether the financial statements are free of material misstatement, whether due to error or fraud. The Company is not required to have, nor were we engaged to perform, an audit of its internal control over financial reporting. As part of our audits we are required to obtain an understanding of internal control over financial reporting but not for the purpose of expressing an opinion on the effectiveness of the Company's internal control over financial reporting. Accordingly, we express no such opinion.
Our audits included performing procedures to assess the risks of material misstatement of the financial statements, whether due to error or fraud, and performing procedures that respond to those risks. Such procedures included examining, on a test basis, evidence regarding the amounts and disclosures in the financial statements. Our audits also included evaluating the accounting principles used and significant estimates made by management, as well as evaluating the overall presentation of the financial statements. We believe that our audits provide a reasonable basis for our opinion.
/s/ Ernst & Young LLP
We have served as the Company’s auditor since 2017.
Dallas, Texas
March 22, 2019
SPIRIT MTA REIT
Consolidated Balance Sheets
(In Thousands, Except Share and Per Share Data)
|
| | | | | | | |
| December 31, 2018 | | December 31, 2017 |
Assets | | | |
Investments: | | | |
Real estate investments: | | | |
Land and improvements | $ | 870,549 |
| | $ | 973,231 |
|
Buildings and improvements | 1,526,933 |
| | 1,658,023 |
|
Total real estate investments | 2,397,482 |
| | 2,631,254 |
|
Less: accumulated depreciation | (459,615 | ) | | (557,948 | ) |
| 1,937,867 |
| | 2,073,306 |
|
Loans receivable, net | 30,093 |
| | 32,307 |
|
Intangible lease assets, net | 79,314 |
| | 102,262 |
|
Real estate assets held for sale, net | 7,263 |
| | 28,460 |
|
Net investments | 2,054,537 |
| | 2,236,335 |
|
Cash and cash equivalents | 161,013 |
| | 6 |
|
Deferred costs and other assets, net | 83,087 |
| | 107,770 |
|
Goodwill | 7,012 |
| | 13,549 |
|
Total assets | $ | 2,305,649 |
| | $ | 2,357,660 |
|
Liabilities and (deficit) equity | | | |
Liabilities: | | | |
Mortgages and notes payable, net | $ | 2,138,804 |
| | $ | 1,926,835 |
|
Intangible lease liabilities, net | 17,676 |
| | 23,847 |
|
Accounts payable, accrued expenses and other liabilities | 83,629 |
| | 16,060 |
|
Total liabilities | 2,240,109 |
| | 1,966,742 |
|
Commitments and contingencies (see Note 6) |
|
| |
|
|
Redeemable preferred equity: | |
| | |
|
SMTA Preferred Shares, $0.01 par value, $25 per share liquidation preference, 20,000,000 shares authorized: 6,000,000 and 0 shares issued and outstanding at December 31, 2018 and 2017, respectively | 150,000 |
| | — |
|
SubREIT Preferred Shares, $0.01 par value, $1,000 per share liquidation preference, 50,000,000 shares authorized: 5,125 and 0 shares issued and outstanding at December 31, 2018 and 2017, respectively | 5,125 |
| | — |
|
Total redeemable preferred equity | 155,125 |
| | — |
|
Shareholders' and parent company (deficit) equity: | | | |
Net parent investment | — |
| | 390,918 |
|
Common shares, $0.01 par value, 750,000,000 shares authorized; 43,000,862 and 10,000 shares issued and outstanding at December 31, 2018 and December 31, 2017, respectively | 430 |
| | — |
|
Capital in excess of common share par value | 201,056 |
| | — |
|
Accumulated deficit | (291,071 | ) | | — |
|
Total shareholders' and parent company (deficit) equity | (89,585 | ) | | 390,918 |
|
Total liabilities and (deficit) equity | $ | 2,305,649 |
| | $ | 2,357,660 |
|
See accompanying notes.
SPIRIT MTA REIT
Consolidated Statements of Operations and Comprehensive Income (Loss)
(In Thousands, Except Share and Per Share Data)
|
| | | | | | | | | | | |
| Year Ended December 31, |
| 2018 | | 2017 | | 2016 |
Revenues: | | | | | |
Rental income | $ | 240,410 |
| | $ | 226,586 |
| | $ | 236,801 |
|
Interest income on loans receivable | 3,080 |
| | 768 |
| | 2,207 |
|
Other income | 2,817 |
| | 4,448 |
| | 6,295 |
|
Total revenues | 246,307 |
| | 231,802 |
| | 245,303 |
|
Expenses: | | | | | |
General and administrative | 13,425 |
| | 20,491 |
| | 18,956 |
|
Related party fees | 19,533 |
| | 5,500 |
| | 5,427 |
|
Restructuring charges | — |
| | — |
| | 2,465 |
|
Transaction costs | 8,676 |
| | 4,354 |
| | — |
|
Property costs (including reimbursable) | 12,758 |
| | 12,496 |
| | 5,258 |
|
Interest | 114,997 |
| | 76,733 |
| | 77,895 |
|
Depreciation and amortization | 84,678 |
| | 80,386 |
| | 85,761 |
|
Impairment and allowance for loan losses | 221,349 |
| | 33,548 |
| | 26,565 |
|
Total expenses | 475,416 |
| | 233,508 |
| | 222,327 |
|
Other income: | | | | | |
Loss on debt extinguishment | (366 | ) | | (2,223 | ) | | (1,372 | ) |
Gain on disposition of assets | 9,458 |
| | 22,393 |
| | 26,499 |
|
Total other income | 9,092 |
| | 20,170 |
| | 25,127 |
|
(Loss) income before income tax expense | (220,017 | ) | | 18,464 |
| | 48,103 |
|
Income tax expense | (221 | ) | | (179 | ) | | (181 | ) |
Net (loss) income and total comprehensive (loss) income | (220,238 | ) | | 18,285 |
| | 47,922 |
|
Preferred dividends | (9,275 | ) | | — |
| | — |
|
Net (loss) income attributable to common shareholders | $ | (229,513 | ) | | $ | 18,285 |
| | $ | 47,922 |
|
| | | | | |
Net (loss) income per share attributable to common shareholders | | | | | |
Basic | $ | (5.36 | ) | | $ | 0.43 |
| | $ | 1.12 |
|
Diluted | $ | (5.36 | ) | | $ | 0.43 |
| | $ | 1.12 |
|
| | | | | |
Weighted average common shares outstanding: | | | | | |
Basic | 42,851,010 |
| | 42,851,010 |
| | 42,851,010 |
|
Diluted | 42,851,010 |
| | 42,851,010 |
| | 42,851,010 |
|
See accompanying notes.
SPIRIT MTA REIT
Consolidated Statements of Changes in (Deficit) Equity
(In Thousands, Except Share and Per Share Data)
|
| | | | | | | | | | | | | | | | | | | | | | | | | | | | | | | | | | | | | | | | |
| Redeemable Preferred Equity | | Shareholders' (Deficit) Equity and Parent Company Equity |
| SMTA Preferred Shares | | SubREIT Preferred Shares | | | | Common Shares | | | | |
| Shares | | Par Value and Capital in Excess of Par Value | | Shares | | Par Value and Capital in Excess of Par Value | | Total Redeemable Preferred Equity | | Shares | | Par
Value | | Capital in
Excess of
Par Value | | Accumulated
Deficit | | Net Parent Investment | | Total Shareholders' and Parent Company (Deficit) Equity |
Balances, December 31, 2015 | — |
| | $ | — |
| | — |
| | $ | — |
| | $ | — |
| | — |
| | $ | — |
| | $ | — |
| | $ | — |
| | $ | 974,824 |
| | $ | 974,824 |
|
Net income | — |
| | — |
| | — |
| | — |
| | — |
| | — |
| | — |
| | — |
| | — |
| | 47,922 |
| | 47,922 |
|
Contributions from parent company | — |
| | — |
| | — |
| | — |
| | — |
| | — |
| | — |
| | — |
| | — |
| | 266,298 |
| | 266,298 |
|
Distributions to parent company | — |
| | — |
| | — |
| | — |
| | — |
| | — |
| | — |
| | — |
| | — |
| | (344,187 | ) | | (344,187 | ) |
Balances, December 31, 2016 | — |
| | $ | — |
| | — |
| | $ | — |
| | $ | — |
| | — |
| | $ | — |
| | $ | — |
| | $ | — |
| | $ | 944,857 |
| | $ | 944,857 |
|
Net income | — |
| | — |
| | — |
| | — |
| | — |
| | — |
| | — |
| | — |
| | — |
| | 18,285 |
| | 18,285 |
|
Contributions from parent company | — |
| | — |
| | — |
| | — |
| | — |
| | — |
| | — |
| | — |
| | — |
| | 405,695 |
| | 405,695 |
|
Distributions to parent company | — |
| | — |
| | — |
| | — |
| | — |
| | — |
| | — |
| | — |
| | — |
| | (977,919 | ) | | (977,919 | ) |
Balances, December 31, 2017 | — |
| | $ | — |
| | — |
| | $ | — |
| | $ | — |
| | — |
| | $ | — |
| | $ | — |
| | $ | — |
| | $ | 390,918 |
| | $ | 390,918 |
|
Net loss | — |
| | — |
| | — |
| | — |
| | — |
| | — |
| | — |
| | — |
| | (210,415 | ) | | (9,823 | ) | | (220,238 | ) |
Contributions from parent company | — |
| | — |
| | — |
| | — |
| | — |
| | — |
| | — |
| | — |
| | — |
| | 174,515 |
| | 174,515 |
|
Distributions to parent company | — |
| | — |
| | — |
| | — |
| | — |
| | — |
| | — |
| | — |
| | — |
| | (199,902 | ) | | (199,902 | ) |
Issuance of common shares, net | — |
| | — |
| | — |
| | — |
| | — |
| | 42,851,010 |
| | 429 |
| | 200,279 |
| | — |
| | (200,708 | ) | | — |
|
Issuance of preferred shares, net | 6,000,000 |
| | 150,000 |
| | 5,125 |
| | 5,125 |
| | 155,125 |
| | — |
| | — |
| | (124 | ) | | — |
| | (155,000 | ) | | (155,124 | ) |
Dividends declared on preferred shares | — |
| | — |
| | — |
| | — |
| | — |
| | — |
| | — |
| | — |
| | (9,275 | ) | | — |
| | (9,275 | ) |
Dividends declared on common shares | — |
| | — |
| | — |
| | — |
| | — |
| | — |
| | — |
| | — |
| | (71,381 | ) | | — |
| | (71,381 | ) |
Share-based compensation, net | — |
| | — |
| | — |
| | — |
| | — |
| | 149,852 |
| | 1 |
| | 901 |
| | — |
| | — |
| | 902 |
|
Balances, December 31, 2018 | 6,000,000 |
| | $ | 150,000 |
| | 5,125 |
| | $ | 5,125 |
| | $ | 155,125 |
| | 43,000,862 |
| | $ | 430 |
| | $ | 201,056 |
| | $ | (291,071 | ) | | $ | — |
| | $ | (89,585 | ) |
See accompanying notes.
SPIRIT MTA REIT
Consolidated Statements of Cash Flows
(In Thousands)
|
| | | | | | | | | | | |
| Year Ended December 31, |
| 2018 | | 2017 | | 2016 |
Operating activities | |
| | |
| | |
Net (loss) income | $ | (220,238 | ) | | $ | 18,285 |
| | $ | 47,922 |
|
Adjustments to reconcile net (loss) income to net cash provided by operating activities: | |
| | |
| | |
|
Depreciation and amortization | 84,678 |
| | 80,386 |
| | 85,761 |
|
Impairments and allowance for loan losses | 221,349 |
| | 33,548 |
| | 26,565 |
|
Amortization of deferred financing costs | 4,653 |
| | 1,480 |
| | 1,285 |
|
Amortization of debt discounts | 6,970 |
| | 4,589 |
| | 3,554 |
|
Share based compensation expense | 3,326 |
| | 6,131 |
| | 3,720 |
|
Loss on debt extinguishment, net | 366 |
| | 2,223 |
| | 1,372 |
|
Gain on disposition of real estate assets | (9,458 | ) | | (22,393 | ) | | (26,499 | ) |
Non-cash revenue | (2,978 | ) | | (5,204 | ) | | (4,002 | ) |
Non-cash promote fee expense | 833 |
| | — |
| | — |
|
Bad debt expense and other | 784 |
| | 3,002 |
| | 17 |
|
Changes in operating assets and liabilities: | |
| | |
| | |
|
Deferred costs and other assets, net | (3,142 | ) | | 5,264 |
| | (1,252 | ) |
Accounts payable, accrued expenses and other liabilities | 9,535 |
| | 3,589 |
| | (268 | ) |
Net cash provided by operating activities | 96,678 |
| | 130,900 |
| | 138,175 |
|
Investing activities | |
| | |
| | |
Acquisitions of real estate | (112,554 | ) | | (26,004 | ) | | (62,663 | ) |
Capitalized real estate expenditures | (3,120 | ) | | (1,369 | ) | | (2,689 | ) |
Collections of principal on loans receivable | 5,065 |
| | 8,811 |
| | 6,866 |
|
Proceeds from dispositions of real estate and other assets | 76,857 |
| | 146,633 |
| | 141,347 |
|
Net cash (used in) provided by investing activities | (33,752 | ) | | 128,071 |
| | 82,861 |
|
Financing activities | |
| | |
| | |
Borrowings under mortgages and notes payable | 257,716 |
| | 618,117 |
| | — |
|
Repayments under mortgages and notes payable | (42,244 | ) | | (61,110 | ) | | (134,662 | ) |
Debt extinguishment costs | (363 | ) | | (1,604 | ) | | (2,353 | ) |
Deferred financing costs | (9,605 | ) | | (11,214 | ) | | (47 | ) |
Proceeds from issuance of preferred shares, net of offering costs | 1 |
| | — |
| | — |
|
Dividends paid on preferred shares | (9,275 | ) | | — |
| | — |
|
Dividends paid on common shares | (14,190 | ) | | — |
| | — |
|
Contributions from parent company | 91,662 |
| | 194,860 |
| | 235,960 |
|
Distributions to parent company | (198,038 | ) | | (944,199 | ) | | (317,570 | ) |
Net cash provided by (used in) financing activities | 75,664 |
| | (205,150 | ) | | (218,672 | ) |
Net increase in cash, cash equivalents and restricted cash | 138,590 |
| | 53,821 |
| | 2,364 |
|
Cash, cash equivalents and restricted cash, beginning of period | 66,510 |
| | 12,689 |
| | 10,325 |
|
Cash, cash equivalents and restricted cash, end of period | $ | 205,100 |
| | $ | 66,510 |
| | $ | 12,689 |
|
SPIRIT MTA REIT
Consolidated Statements of Cash Flows
(In Thousands)
|
| | | | | | | | | | | |
Supplemental Disclosures of Non-Cash Activities: | | | | | |
Investment contribution from parent | $ | 80,429 |
| | $ | 204,704 |
| | $ | 26,618 |
|
Investment distribution to parent | 1,864 |
| | 33,720 |
| | 26,618 |
|
Financing provided in connection with the disposition of assets | 2,888 |
| | — |
| | — |
|
Issuance of common shares | 200,708 |
| | — |
| | — |
|
Issuance of preferred shares | 155,000 |
| | — |
| | — |
|
Distributions declared and unpaid | 57,191 |
| | — |
| | — |
|
Relief of debt through sale of real estate properties | 6,579 |
| | — |
| | — |
|
Accrued capitalized costs | 311 |
| | — |
| | — |
|
| | | | | |
Supplemental Cash Flow Disclosures: | |
| | |
| | |
Interest paid | $ | 101,367 |
| | $ | 69,408 |
| | $ | 73,653 |
|
Taxes paid | 337 |
| | 269 |
| | 308 |
|
See accompanying notes.
SPIRIT MTA REIT
Notes to Consolidated Financial Statements
NOTE 1. ORGANIZATION
Organization and Operations
Spirit MTA REIT ("SMTA" or the "Company") operates as an externally managed REIT formed in Maryland that invests in and manages a portfolio of single-tenant, operationally essential real estate throughout the U.S. that is generally leased on a long-term, triple-net basis to tenants operating within retail, office, and industrial property types. Single tenant, operationally essential real estate generally refers to free-standing, commercial real estate facilities where tenants conduct activities that are essential to the generation of their sales and profits.
The Company's portfolio includes (i) an asset-backed securitization trust which issues non-recourse asset-backed securities collateralized by commercial real estate, net-leases and mortgage loans (“Master Trust 2014”), (ii) a portfolio of properties leased to Specialty Retail Shops Holding Corp. ("Shopko") and its subsidiaries, encumbered with CMBS debt, (iii) a single distribution center property leased to a sporting goods tenant encumbered with CMBS debt, and (iv) a portfolio of unencumbered properties.
The Company began operations through predecessor legal entities which were wholly-owned subsidiaries of Spirit Realty Capital, Inc. ("Spirit"). On May 31, 2018, Spirit completed the Spin-Off that resulted in the Company's establishment as an independent, publicly traded company. The Spin-Off was effected by means of a pro rata distribution of SMTA common shares to Spirit stockholders of record as of the close of business on the record date. In conjunction with the Spin-Off, SMTA and Spirit Realty, L.P. (the "Manager"), a wholly-owned subsidiary of Spirit, entered into an Asset Management Agreement under which Spirit Realty, L.P. provides external management of SMTA.
Costs associated with the Spin-Off incurred in the years ended December 31, 2018 and 2017 totaled $8.7 million and $4.4 million, respectively. There were no costs associated with the Spin-Off incurred prior to 2017. These expenses are reflected as transaction costs on the accompanying consolidated statements of operations and comprehensive income (loss).
Reclassification of Prior Year Presentation
Certain reclassifications have been made to prior periods to conform with current reporting on the consolidated statements of operations and comprehensive income (loss):
| |
• | tenant reimbursement income of $2.3 million and $2.1 million for the years ended December 31, 2017 and 2016, respectively, has been combined into "rental income" and |
| |
• | bad debt expense of $3.4 million for year ended December 31, 2017 has been reclassified from "general and administrative" to "property costs (including reimbursable)." No bad debt expense was recorded for the year ended December 31, 2016. |
These reclassifications had no effect on the total reported results of operations.
NOTE 2. SUMMARY OF SIGNIFICANT ACCOUNTING POLICIES
Basis of Accounting
The accompanying consolidated financial statements of the Company have been prepared on the accrual basis of accounting, in accordance with GAAP. All intercompany balances and transactions have been eliminated in consolidation. Subsequent to the Spin-Off on May 31, 2018, the consolidated financial statements include the accounts of the Company and its wholly-owned subsidiaries. The pre-spin consolidated financial statements were prepared on a carve-out basis and reflect significant assumptions and allocations.
For the periods prior to the Spin-Off, the financial position and results of operations reflect a combination of entities under common control that have been carved-out from Spirit’s consolidated financial statements and present Spirit's historical carrying values of the assets and liabilities, consistent with accounting for spin-off transactions in accordance with GAAP. Since the Company prior to the Spin-Off did not represent one entity, a separate capital structure did not exist. As a result, the combined net assets of the predecessor legal entities have been reflected in the consolidated financial statements as net parent investment for periods prior to the Spin-Off. All transactions between Spirit and the predecessor legal entities are considered effectively settled through equity in the consolidated financial statements at the time the transaction is recorded, other than certain mortgages as discussed in Note 11. The settlement of these transactions is reflected as contributions from and distributions to parent in the consolidated statement of changes in
SPIRIT MTA REIT
Notes to Consolidated Financial Statements
(deficit) equity and contributions from and distributions to parent in the consolidated statements of cash flows as a financing activity.
Through May 31, 2018, the pre-spin consolidated financial statements include expense allocations related to certain Spirit corporate general and administrative functions. These expenses have been allocated based on direct usage or benefit where specifically identifiable, with the remainder allocated pro rata based on property count. All the expense allocations were deemed to have been incurred and settled through net parent investment in the period in which the costs were incurred. Management considers the expense allocation methodology and results to be reasonable. However, the allocations may not be indicative of the actual expense that would have been incurred had the Company operated as an independent, publicly traded company for the periods presented prior to May 31, 2018. At time of the Spin-Off, SMTA entered into an Asset Management Agreement with Spirit to provide these corporate functions.
These consolidated financial statements include certain special purpose entities that were formed to acquire and hold real estate encumbered by indebtedness (see Note 4). Each special purpose entity is a separate legal entity and is the sole owner of its assets and responsible for its liabilities. The assets of these special purpose entities are not available to pay, or otherwise satisfy obligations to, the creditors of any affiliate or owner of another entity unless the special purpose entities have expressly agreed and are permitted under their governing documents. As of December 31, 2018 and December 31, 2017, net assets totaling $2.18 billion and $1.82 billion, respectively, were held and net liabilities totaling $2.18 billion and $1.96 billion, respectively, were owed by these encumbered special purpose entities included in the accompanying consolidated balance sheets.
Use of Estimates
The preparation of financial statements in conformity with GAAP requires management to make estimates and assumptions that affect the reported amounts of assets and liabilities at the date of the financial statements and the reported amounts of revenues and expenses during the reporting period. Although management believes its estimates are reasonable, actual results could differ from those estimates.
Segment Reporting
The Company views its operations in two segments—Master Trust 2014 and all other properties ("Other Properties"), see Note 7 for further discussion on these segments. The Company has no other reportable segments.
Real Estate Investments
Carrying Value of Real Estate Investments
The Company’s real estate properties are recorded at cost and depreciated using the straight-line method over the estimated remaining useful lives of the properties, which generally range from 20 to 50 years for buildings and improvements and from 5 to 20 years for land improvements. Portfolio assets classified as “held for sale” are not depreciated. Properties classified as “held for sale” are recorded at the lower of their carrying value or their fair value, less anticipated selling costs.
Purchase Accounting and Acquisition of Real Estate
When acquiring a property, the purchase price (including acquisition and closing costs) is allocated to land, building, improvements and equipment based on their relative fair values. For properties acquired with in-place leases, the purchase price of real estate is allocated to the tangible and intangible assets and liabilities acquired based on their estimated fair values. In making estimates of fair values for this purpose, a number of sources are used, including independent appraisals and information obtained about each property as a result of pre-acquisition due diligence and marketing and leasing activities.
Lease Intangibles
Lease intangibles, if any, acquired in conjunction with the purchase of real estate represent the value of in-place leases and above- or below-market leases. For real estate acquired subject to existing lease agreements, in-place lease intangibles are valued based on the Company’s estimate of costs related to acquiring a tenant and the carrying costs that would be incurred during the time it would take to locate a tenant if the property were vacant, considering current market conditions and costs to execute similar leases at the time of the acquisition. Above- and below-market lease intangibles are recorded based on the present value of the difference between the contractual amounts to be paid
SPIRIT MTA REIT
Notes to Consolidated Financial Statements
pursuant to the leases at the time of acquisition of the real estate and the Company’s estimate of current market lease rates for the property, measured over a period equal to the remaining initial term of the lease.
In-place lease intangibles are amortized on a straight-line basis over the remaining initial term of the related lease and included in depreciation and amortization expense. Above-market lease intangibles are amortized over the remaining initial terms of the respective leases as a decrease in rental revenue. Below-market lease intangibles are amortized as an increase to rental revenue over the remaining initial term of the respective leases, but may be amortized over the renewal periods if the Company believes it is likely the tenant will exercise the renewal option. If the Company believes it is likely a lease will terminate early, the unamortized portion of any related lease intangible is immediately recognized in impairment loss in the Company’s consolidated statements of operations and comprehensive income (loss).
Impairment
The Company reviews its real estate investments and related lease intangibles periodically for indicators of impairment, including the asset being held for sale, vacant or non-operating, tenant bankruptcy or delinquency, and leases expiring in 60 days or less. For assets with indicators of impairment, the Company then evaluates if its carrying amount may not be recoverable. The Company considers factors such as expected future undiscounted cash flows, estimated residual value, market trends (such as the effects of leasing demand and competition) and other factors in making this assessment. An asset is considered impaired if its carrying value exceeds its estimated undiscounted cash flows.
Impairment is then calculated as the amount by which the carrying value exceeds the estimated fair value, or for assets held for sale, as the amount by which the carrying value exceeds fair value less costs to sell. Estimating future cash flows and fair values is highly subjective and such estimates could differ materially from actual results. Key assumptions used in estimating future cash flows and fair values include, but are not limited to, revenue growth rates, interest rates, discount rates, capitalization rates, lease renewal probabilities, tenant vacancy rates and other factors.
Revenue Recognition
The Company primarily leases real estate to its tenants under long-term, triple-net leases that are classified as operating leases. Lease origination fees are deferred and amortized over the related lease term as an adjustment to rental revenue. Under a triple-net lease, the tenant is typically responsible for all improvements and is contractually obligated to pay all property operating expenses, such as real estate taxes, insurance premiums and repair and maintenance costs. Under certain leases, tenant reimbursement revenue, which is comprised of additional amounts recoverable from tenants for common area maintenance expenses and certain other recoverable expenses, is recognized as revenue in the period in which the related expenses are incurred. Tenant reimbursements are recorded on a gross basis in instances when our tenants reimburse us for property costs which we incur. Tenant receivables are carried net of the allowances for uncollectible amounts.
The Company’s leases generally provide for rent escalations throughout the lease terms. For leases that provide for specific contractual escalations, rental revenue is recognized on a straight-line basis so as to produce a constant periodic rent over the term of the lease. Accordingly, accrued rental revenue, calculated as the aggregate difference between the rental revenue recognized on a straight-line basis and scheduled rents, represents unbilled rent receivables that the Company will receive only if the tenants make all rent payments required through the expiration of the initial term of the leases. The accrued rental revenue representing this straight-line adjustment is subject to an evaluation for collectability, and the Company records a provision for losses against rental revenues if collectability of these future rents is not reasonably assured.
For leases that have contingent rent escalators indexed to future increases in the CPI, they may adjust over a one-year period or over multiple-year periods. Typically, these CPI-based escalators increase rent at the lesser of (a) multiple of any increase in the CPI over a specified period or (b) a fixed percentage. Because of the volatility and uncertainty with respect to future changes in the CPI, the Company’s inability to determine the extent to which any specific future change in the CPI is probable at each rent adjustment date during the entire term of these leases and the Company’s view that the multiplier does not represent a significant leverage factor, rental revenue from leases with this type of escalator are recognized only after the changes in the rental rates have occurred.
Some of the Company’s leases also provide for contingent rent based on a percentage of the tenant’s gross sales. For contingent rentals that are based on a percentage of the tenant’s gross sales, the Company recognizes contingent rental revenue when the change in the factor on which the contingent lease payment is based actually occurs.
SPIRIT MTA REIT
Notes to Consolidated Financial Statements
The Company suspends revenue recognition if the collectability of amounts due pursuant to a lease is not reasonably assured or if the tenant’s monthly lease payments become more than 60 days past due, whichever is earlier.
Lease termination fees are included in other income on the Company’s consolidated statements of operations and are recognized when there is a signed termination agreement and all of the conditions of the agreement have been met. The Company recorded lease termination fees of $0.5 million, $3.6 million and $5.5 million during the years ended December 31, 2018, 2017 and 2016, respectively.
Allowance for Doubtful Accounts
The Company reviews its rent and other tenant receivables for collectability on a regular basis, taking into consideration changes in factors such as the tenant’s payment history, the financial condition of the tenant, business conditions in the industry in which the tenant operates, and economic conditions in the area in which the tenant operates. If the collectability of a receivable with respect to any tenant is in doubt, a provision for uncollectible amounts will be established or a direct write-off of the specific receivable will be made. The Company’s reserves for uncollectible amounts totaled $6.6 million and $3.5 million as of December 31, 2018 and December 31, 2017, respectively, against accounts receivable balances of $8.2 million and $5.0 million, respectively. Receivables are recorded within deferred costs and other assets, net in the accompanying consolidated balance sheets. Receivables are written off against the reserves for uncollectible amounts when all possible means of collection have been exhausted.
For receivable balances related to the straight-line method of reporting rental revenue, the collectability review includes management’s estimates of amounts that will not be realized based on an assessment of the risks inherent in the portfolio, considering historical experience. The Company has a reserve for losses of $0.5 million and $1.0 million as of December 31, 2018 and December 31, 2017, respectively, against straight-line receivables of $28.2 million and$24.9 million, respectively. These receivables are recorded within deferred costs and other assets, net in the accompanying consolidated balance sheets.
Goodwill
Goodwill arises from business combinations and represents the excess of the cost of an acquired entity over the net fair value amounts that were assigned to the identifiable assets acquired and the liabilities assumed. Spirit recorded goodwill as a result of its merger with Cole Credit Property II, Inc. (“Cole”) on July 17, 2013. Goodwill was allocated to the Company based on the fair value of the Cole assets attributable to the Company relative to the total fair value of Cole assets acquired through the merger. Goodwill is tested for impairment at the reporting unit level on an annual basis and between annual tests if an event occurs or circumstances change that would more likely than not reduce the fair value of the reporting unit below its carrying value. Goodwill has been allocated to each reporting unit based upon the relative fair value of each reporting unit, resulting in $7.0 million allocated to Master Trust 2014 and $6.5 million allocated to Other Properties at time of Spin-Off. Prior to 2018, no impairment charges had been recorded on goodwill. During the year ended December 31, 2018 and subsequent to the Spin-Off, $6.5 million of impairment charges were recorded on goodwill, fully impairing the goodwill related to the Other Properties segment, as a result of the Company's expectation that it will not receive any significant future cash flows from Shopko and the impairment of assets leased to Shopko due to Shopko's bankruptcy filing. The charges are included in impairments on the accompanying consolidated statement of operations and comprehensive income (loss). Revenue attributable to Shopko constituted the majority of the revenues within the reporting unit.
Loans Receivable
Loans receivable consist of mortgage loans, net of premium, and notes receivables. Interest on loans receivable is recognized using the effective interest rate method.
Impairment and Allowance for Loan Losses
The Company periodically evaluates the collectability of its loans receivable, including accrued interest, by analyzing the underlying property-level economics and trends, collateral value and quality, and other relevant factors in determining the adequacy of its allowance for loan losses. A loan is determined to be impaired when, in management’s judgment based on current information and events, it is probable that the Company will be unable to collect all amounts due according to the contractual terms of the loan agreement. Specific allowances for loan losses are provided for impaired loans on an individual loan basis in the amount by which the carrying value exceeds the estimated fair value of the underlying collateral less disposition costs. Delinquent loans receivable are written off against the allowance
SPIRIT MTA REIT
Notes to Consolidated Financial Statements
when all possible means of collection have been exhausted. As of December 31, 2018 and 2017, there was an allowance for loan losses on loans receivable of $35.1 million and $0.4 million, respectively. $33.8 million of the allowance for loan losses as of December 31, 2018 relate to an allowance on the B-1 Term Loan due from Shopko as a result of Shopko's bankruptcy, see Note 3 and Note 15 for additional detail.
A loan is placed on non-accrual status when the loan has become 60 days past due, or earlier if management determines that full recovery of the contractually specified payments of principal and interest is doubtful. While on non-accrual status, interest income is recognized only when received. No mortgage loans were on non-accrual status as of December 31, 2018, compared to five with a balance of $1.5 million as of December 31, 2017. The B-1 Term Loan due from Shopko, with an outstanding principal balance of $34.4 million, was on non-accrual status as of December 31, 2018. No notes receivable were on non-accrual status as of December 31, 2017.
Cash, Cash Equivalents and Restricted Cash
Cash and cash equivalents include cash and highly liquid investment securities with maturities at acquisition of three months or less. The Company invests cash primarily in money market funds of major financial institutions with fund investments consisting of highly-rated money market instruments and other short-term instruments. Restricted cash is classified within deferred costs and other assets, net in the accompanying consolidated balance sheets. Cash, cash equivalents and restricted cash as shown in the consolidated statements of cash flows consisted of the following (in thousands):
|
| | | | | | | | | | | |
| December 31, 2018 | | December 31, 2017 | | December 31, 2016 |
Cash and cash equivalents | $ | 161,013 |
| | $ | 6 |
| | $ | 1,268 |
|
Restricted cash: | | | | | |
Release Account (1) | 16,141 |
| | 61,001 |
| | 11,421 |
|
Liquidity Reserve (2) | 5,599 |
| | 5,503 |
| | — |
|
Lender controlled accounts (3) | 22,347 |
| | — |
| | — |
|
Total cash, cash equivalents and restricted cash | $ | 205,100 |
| | $ | 66,510 |
| | $ | 12,689 |
|
(1) Release Account cash consists of proceeds from the sales of assets pledged as collateral under Master Trust 2014 and is held on deposit until a qualifying substitution is made or the funds are applied as prepayment of principal.
| |
(2) | Liquidity Reserve cash was placed on deposit in conjunction with the issuance of additional series of notes under Master Trust 2014 and is held until there is a cashflow shortfall, as defined in the Master Trust 2014 agreements, or a liquidation of Master Trust 2014 occurs. |
| |
(3) | Funds held in lender controlled accounts released after scheduled debt service requirements are met. As of December 31, 2018, $3.9 million of this balance was rent-related receipts associated with Master Trust 2014. $17.6 million of the balance as of December 31, 2018 was associated with the Shopko CMBS Loan Agreements and was included in the equity of the entity that was foreclosed on by the Shopko Lenders on March 1, 2019. |
Income Taxes
For the period prior to the Spin-Off, the Company applied the provisions of FASB ASC Topic 740, Income Taxes, and computed the provision for income taxes on a separate return basis. The separate return method applies the accounting guidance for income taxes to the stand-alone consolidated financial statements as if the Company was a separate taxpayer and a stand-alone enterprise for the periods presented.
The Company was wholly-owned by the Manager prior to the Spin-Off and was disregarded for federal income tax purposes. The Manager is wholly-owned by Spirit through certain direct and indirect ownership interests and is taxed as a partnership for Federal income tax purposes. Spirit has elected to be taxed as a REIT under the applicable provisions of the Code and, as a result, will not be subject to federal income tax as long as it distributes 100% of its taxable income and satisfies certain other requirements. Therefore, no provision for federal income tax has been made in the accompanying consolidated financial statements for the periods prior to the Spin-Off.
For the period subsequent to the Spin-Off, the Company intends to elect to be taxed as a REIT under the Code beginning with its initial tax year ended December 31, 2018. As a REIT, the Company generally will not be subject to federal income tax provided it continues to satisfy certain tests concerning the Company’s sources of income, the nature of its assets, the amounts distributed to its shareholders, and the ownership of Company shares. Management believes the Company has qualified and will continue to qualify as a REIT and therefore, no provision has been made for federal income taxes in the accompanying consolidated financial statements. Even if the Company qualifies for taxation as a
SPIRIT MTA REIT
Notes to Consolidated Financial Statements
REIT, it may be subject to state and local income and franchise taxes, and to federal income tax and excise tax on its undistributed income.
The Company is subject to certain other taxes which are reflected as income tax expense in the consolidated statements of operations and comprehensive income (loss). Franchise taxes are included in general and administrative expenses in the accompanying consolidated statements of operations and comprehensive income (loss).
Earnings Per Share
The Company’s unvested restricted common shares, which contain non-forfeitable rights to receive dividends, are considered participating securities requiring the two-class method of computing earnings per share. Under the two class method, earnings attributable to unvested restricted shares are deducted from income from continuing operations in the computation of net income (loss) attributable to common shareholders. Under the two-class method, earnings per common share are computed by dividing the sum of distributed earnings to common shareholders and undistributed earnings allocated to common shareholders by the weighted average number of common shares outstanding for the period. In applying the two-class method, undistributed earnings are allocated to both common shares and participating securities based on their respective weighted average shares outstanding during the period. Under the terms of the 2018 Incentive Award Plan and the related restricted share awards (see Note 9), losses are not allocated to participating securities including undistributed losses as a result of dividends declared exceeding net income. The Company uses income or loss from continuing operations as the basis for determining whether potential common shares are dilutive or anti-dilutive and undistributed net income or loss as the basis for determining whether undistributed earnings are allocable to participating securities.
Unaudited Interim Information
The consolidated quarterly financial data in Note 14 is unaudited. In the opinion of management, this financial information reflects all adjustments necessary for a fair presentation of the respective interim periods. All such adjustments are of a normal recurring nature.
New Accounting Pronouncements
In May 2014, the FASB issued ASU 2014-09, Revenue from Contracts with Customers: Topic 606. This new guidance establishes a principles-based approach for accounting for revenue from contracts with customers and is effective for annual reporting periods beginning after December 15, 2017, with early application permitted for annual reporting periods beginning after December 15, 2016. The Company adopted the new revenue recognition standard effective January 1, 2018 under the modified retrospective method, and elected to apply the standard only to contracts that were not completed as of the date of adoption (i.e., January 1, 2018). In evaluating the impact of this new standard, the Company identified that lease contracts covered by Leases (Topic 840) are excluded from the scope of this new guidance. As such, this ASU had no material impact on the Company's reported revenues, results of operations, financial position, cash flows and disclosures.
In February 2016, the FASB issued ASU 2016-02, Leases (Topic 842), which supersedes the existing guidance for lease accounting Leases (Topic 840). ASU 2016-02 requires lessees to recognize leases on their balance sheets, and leaves lessor accounting largely unchanged. Leases pursuant to which the Company is the lessee consist of its ground leases. The amendments in this ASU are effective for the fiscal years beginning after December 15, 2018 and interim periods within those fiscal years. Early application is permitted for all entities. ASU 2016-02 requires a modified retrospective approach for all leases existing at, or entered into after, the date of initial application, with an option to elect to use certain transition relief. The Company has elected to use all of the practical expedients available for adoption of this ASU except for the hindsight expedient, which would require the re-evaluation of the lease term on all leases using current facts and circumstances. The Company has evaluated implementation of the ASU and does not anticipate the overall impact of this ASU on its consolidated financial statements to be material. The Company anticipates the recognition of leases on its consolidated balance sheet for lessee contracts will represent less than 1% of total assets and of total liabilities as of December 31, 2018.
In June 2016, the FASB issued ASU 2016-13, Measurement of Credit Losses on Financial Instruments, which requires more timely recognition of credit losses associated with financial assets. ASU 2016-13 requires financial assets (or a group of financial assets) measured at an amortized cost basis to be presented at the net amount expected to be collected. ASU 2016-13 is effective for fiscal years beginning after December 15, 2019, including interim periods within those fiscal years. Early adoption is permitted for fiscal years beginning after December 15, 2018, including interim
SPIRIT MTA REIT
Notes to Consolidated Financial Statements
periods within those fiscal years. Per the subsequently issued ASU 2018-19, receivables arising from operating leases are not within the scope of ASU 2016-13. As such, the Company is currently evaluating the impact of this ASU on its consolidated financial statements, but does not expect its impact to be material.
NOTE 3. INVESTMENTS
Real Estate Investments
As of December 31, 2018, the Company’s gross investment in real estate properties and loans totaled approximately $2.6 billion, representing investments in 876 owned properties and eight properties securing mortgage loans. The gross investment is comprised of land, buildings, lease intangible assets and lease intangible liabilities, as adjusted for any impairment, and the carrying amount of loans receivable and real estate assets held for sale. The portfolio is geographically dispersed throughout 45 states with Texas, at 13.4%, as the only state with a Real Estate Investment Value greater than 10.0% of the Real Estate Investment Value of the Company’s entire portfolio.
During the years ended December 31, 2018 and 2017, the Company had the following real estate and loan activity, net of accumulated depreciation and amortization:
|
| | | | | | | | | | | | | | | | | | | | |
| Number of Properties | | Dollar Amount of Investments |
| Owned | | Financed | | Total | | Owned | | Financed | | Total |
| | | | | | | (In Thousands) |
Gross balance, December 31, 2016 | 971 |
| | 11 |
| | 982 |
| | $ | 2,778,092 |
| | $ | 39,640 |
| | $ | 2,817,732 |
|
Acquisitions/improvements | 12 |
| | — |
| | 12 |
| | 265,549 |
| | — |
| | 265,549 |
|
Dispositions of real estate | (76 | ) | | — |
| | (76 | ) | | (145,651 | ) | | (4,020 | ) | | (149,671 | ) |
Principal payments and payoffs | — |
| | — |
| | — |
| | — |
| | (2,921 | ) | | (2,921 | ) |
Impairment and allowance for loan losses | — |
| | — |
| | — |
| | (33,159 | ) | | (389 | ) | | (33,548 | ) |
Write-off of gross lease intangibles | — |
| | — |
| | — |
| | (29,244 | ) | | — |
| | (29,244 | ) |
Loan premium amortization and other | — |
| | — |
| | — |
| | 2,698 |
| | (3 | ) | | 2,695 |
|
Gross balance, December 31, 2017 | 907 |
| | 11 |
| | 918 |
| | $ | 2,838,285 |
| | $ | 32,307 |
| | $ | 2,870,592 |
|
Acquisitions/improvements (1) | 19 |
| | 2 |
| | 21 |
| | 170,554 |
| | 2,888 |
| | 173,442 |
|
Dispositions of real estate (2)(3) | (50 | ) | | — |
| | (50 | ) | | (108,128 | ) | | — |
| | (108,128 | ) |
Principal payments and payoffs | — |
| | (5 | ) | | (5 | ) | | — |
| | (4,417 | ) | | (4,417 | ) |
Impairment and allowance for loan losses | — |
| | — |
| | — |
| | (152,670 | ) | | (1,299 | ) | | (153,969 | ) |
Write-off of gross lease intangibles | — |
| | — |
| | — |
| | (216,507 | ) | | — |
| | (216,507 | ) |
Loan premium amortization and other | — |
| | — |
| | — |
| | (268 | ) | | — |
| | (268 | ) |
Gross balance, December 31, 2018 | 876 |
| | 8 |
| | 884 |
| | $ | 2,531,266 |
| | $ | 29,479 |
| | $ | 2,560,745 |
|
Accumulated depreciation and amortization | |
| | |
| | |
| | (524,542 | ) | | — |
| | (524,542 | ) |
Other non-real estate assets | |
| | |
| | |
| | 44 |
| | 614 |
| | 658 |
|
Net balance, December 31, 2018 | |
| | |
| | |
| | $ | 2,006,768 |
| | $ | 30,093 |
| | $ | 2,036,861 |
|
(1) Includes investments of $2.6 million in revenue producing capitalized expenditures, as well as $0.9 million of non-revenue producing capitalized expenditures as of December 31, 2018.
(2) The total accumulated depreciation and amortization associated with dispositions of real estate was $28.4 million and $21.5 million, respectively, for the years ended December 31, 2018 and 2017.
(3) The total gain on disposal of assets on held and used properties was $5.2 million, $4.8 million and $13.6 million for the years ended December 31, 2018, 2017 and 2016. The total gain on disposal of assets on held for sale properties was $4.3 million, $17.6 million and $12.9 million for the years ended December 31, 2018, 2017 and 2016.
SPIRIT MTA REIT
Notes to Consolidated Financial Statements
Scheduled minimum future contractual rent to be received under the remaining non-cancelable term of the operating leases (including contractual fixed rent increases occurring on or after January 1, 2019) are as follows (in thousands):
|
| | | | | | | | | |
| December 31, 2018 |
| Shopko | Remaining | Total |
2019 | $ | 42,889 |
| $ | 190,181 |
| $ | 233,070 |
|
2020 | 42,791 |
| 180,876 |
| 223,667 |
|
2021 | 41,706 |
| 174,747 |
| 216,453 |
|
2022 | 40,932 |
| 161,734 |
| 202,666 |
|
2023 | 40,932 |
| 155,054 |
| 195,986 |
|
Thereafter | 410,072 |
| 904,226 |
| 1,314,298 |
|
Total future minimum rentals | $ | 619,322 |
| $ | 1,766,818 |
| $ | 2,386,140 |
|
Because lease renewal periods are exercisable at the option of the lessee, the preceding table presents future minimum lease payments due during the initial lease term only. In addition, the future minimum rentals do not include any contingent rent based on a percentage of the lessees’ gross sales or lease escalations based on future changes in the CPI or other stipulated reference rate.
Loans Receivable
The following table details loans receivable, net of premium and allowance for loan losses (in thousands):
|
| | | | | | | |
| December 31, 2018 | | December 31, 2017 |
Mortgage loans-principal | $ | 30,778 |
| | $ | 32,665 |
|
Mortgage loans-premium, net of amortization | — |
| | 31 |
|
Allowance for loan losses on mortgage loans | (1,299 | ) | | (389 | ) |
Mortgage loans, net | 29,479 |
| | 32,307 |
|
Other note receivables - principal | 34,416 |
| | — |
|
Allowance for loan losses on other notes receivable | (33,802 | ) | | — |
|
Total loans receivable, net | $ | 30,093 |
| | $ | 32,307 |
|
The mortgage loans are secured by single-tenant commercial properties and generally have fixed interest rates over the term of the loans.
On April 30, 2018, Spirit contributed to the Company a $35.0 million B-1 Term Loan, included in the table above in other notes, as part of a syndicated loan and security agreement with Shopko as borrower and several banks as lenders. The B-1 Term Loan bears interest at a rate of 12% per annum and matures on June 19, 2020. Principal repayments are in quarterly installments of $0.6 million commencing on November 1, 2018, while interest is paid monthly. The loan is secured by Shopko’s assets in its $784 million asset-backed lending facility and is subordinate to other loans made under the syndicated loan and security agreement. In connection with Shopko’s bankruptcy filing, Shopko has filed pleadings asserting that any recovery under the Shopko B-1 Term Loan will be limited and may be impaired in full. Therefore, the Company has recorded an allowance for loan losses of $33.8 million for the Shopko B-1 Term Loan. While the outcome of the Shopko bankruptcy filing is uncertain and there can be no assurances that the Company will recover any amounts due to it under the Shopko B-1 Term Loan, the Company intends to pursue all of its rights and remedies in connection with the bankruptcy proceedings, with the goal of maximizing the receipt of amounts due to the Company under the the Shopko B-1 Term loan. During the year ended December 31, 2018, the Company recorded interest income on loans receivable of $2.8 million on the B-1 Term Loan.
SPIRIT MTA REIT
Notes to Consolidated Financial Statements
Lease Intangibles, Net
The following table details lease intangible assets and liabilities, net of accumulated amortization (in thousands):
|
| | | | | | | |
| December 31, 2018 | | December 31, 2017 |
In-place leases | $ | 130,477 |
| | $ | 191,557 |
|
Above-market leases | 23,661 |
| | 24,691 |
|
Less: accumulated amortization | (74,824 | ) | | (113,986 | ) |
Intangible lease assets, net | $ | 79,314 |
| | $ | 102,262 |
|
| | | |
Below-market leases | $ | 28,193 |
| | $ | 39,274 |
|
Less: accumulated amortization | (10,517 | ) | | (15,427 | ) |
Intangible lease liabilities, net | $ | 17,676 |
| | $ | 23,847 |
|
The amounts amortized as a net increase (decrease) to rental revenue for capitalized above and below-market leases were $0.7 million, $(0.5) million and $0.9 million for the years ended December 31, 2018 , 2017 and 2016, respectively. The value of in place leases amortized and included in depreciation and amortization expense was $10.9 million, $10.5 million and $11.9 million for the years ended December 31, 2018 , 2017 and 2016 respectively. The remaining weighted average amortization period for in-place leases, above-market leases, below-market leases and in total was 11.9 years 8.2 years, 13.2 years and 10.9 years, respectively, as of December 31, 2018. The remaining weighted average amortization period for in-place leases, above-market leases, below-market leases and in total was 12.4 years, 8.4 years, 13.9 years and 11.3 years, respectively, as of December 31, 2017. During the year ended December 31, 2018, the Company acquired in-place lease intangible assets of $14.4 million, above-market lease intangible assets of $0.6 million and below-market lease intangible liabilities of $40 thousand.
Based on the balance of intangible assets and liabilities at December 31, 2018, the net aggregate amortization expense for the next five years and thereafter is expected to be as follows (in thousands):
|
| | | |
2019 | $ | 8,298 |
|
2020 | 7,352 |
|
2021 | 6,516 |
|
2022 | 5,909 |
|
2023 | 6,031 |
|
Thereafter | 27,532 |
|
Total future minimum amortization | $ | 61,638 |
|
SPIRIT MTA REIT
Notes to Consolidated Financial Statements
Real Estate Assets Held for Sale
The Company is continually evaluating the portfolio of real estate assets and may elect to dispose of assets considering criteria including, but not limited to, tenant concentration, tenant credit quality, unit financial performance, local market conditions and lease rates, associated indebtedness, asset location, and tenant operation type (e.g., industry, sector, or concept/brand). Real estate assets held for sale are expected to be sold within twelve months. The following table shows the activity in real estate assets held for sale for the years ended December 31, 2018 and 2017 (dollars in thousands):
|
| | | | | | |
| Number of
Properties | | Carrying
Value |
| | | (In Thousands) |
Balances, December 31, 2016 | 21 |
| | $ | 59,720 |
|
Transfers from real estate investments | 37 |
| | 86,252 |
|
Sales | (47 | ) | | (89,607 | ) |
Transfers to real estate investments held and used | (4 | ) | | (15,703 | ) |
Impairments | — |
| | (12,202 | ) |
Balances, December 31, 2017 | 7 |
| | $ | 28,460 |
|
Transfers from real estate investments | 20 |
| | 45,606 |
|
Sales | (11 | ) | | (23,043 | ) |
Transfers to real estate investments held and used | (9 | ) | | (42,859 | ) |
Impairments | — |
| | (901 | ) |
Balances, December 31, 2018 | 7 |
| | $ | 7,263 |
|
$2.7 million of held for sale asset balance at December 31, 2018 was within the Master Trust 2014 segment, with the remaining $4.6 million in the Other Properties segment. $3.2 million of held for sale asset balance at December 31, 2017 was within the Master Trust 2014 segment, with the remaining $25.3 million in the Other Properties segment.
Impairments and Allowance for Loan Losses
The following table summarizes total impairment losses recognized on the accompanying consolidated statements of operations and comprehensive income (loss) (in thousands):
|
| | | | | | | | | | | |
| Year Ended December 31, |
| 2018 | | 2017 | | 2016 |
Portfolio asset impairment | $ | 152,251 |
| | $ | 29,419 |
| | $ | 25,041 |
|
Intangibles impairment | 27,475 |
| | 3,740 |
| | 1,502 |
|
Provision for loan losses | 35,101 |
| | 389 |
| | — |
|
Recovery of loans receivable, previously reserved | (16 | ) | | — |
| | — |
|
Goodwill impairment and other | 6,538 |
| | — |
| | 22 |
|
Total impairment and allowance for loan loss | $ | 221,349 |
| | $ | 33,548 |
| | $ | 26,565 |
|
Impairments for the year ended December 31, 2018 were comprised of $0.9 million on properties classified as held for sale, $178.4 million on properties classified as held and used, and $35.5 million on mortgages and notes receivables. The Shopko bankruptcy filing resulted in our recording of impairment charges and allowance for loan losses in the year ended December 31, 2018 of $202.3 million. Impairments for the year ended December 31, 2017 were comprised of $12.2 million on properties classified as held for sale, 20.9 million on properties classified as held and used, and 0.4 million on mortgage notes receivables. Impairments for the year ended December 31, 2016 were comprised of $11.4 million on properties classified as held for sale and $15.2 million on properties classified as held and used.
SPIRIT MTA REIT
Notes to Consolidated Financial Statements
NOTE 4. DEBT
Master Trust 2014
The Company has access to an asset-backed securitization platform, Master Trust 2014, to raise capital through the issuance of non-recourse asset-back securities collateralized by commercial real estate, net-leases and mortgage loans. Master Trust 2014 has five bankruptcy-remote, special purpose entities as issuers or co-issuers of the notes.
In December 2017, the existing issuers under Master Trust 2014, collectively as co-issuers, completed the issuance of $674.4 million aggregate principal amount of Series 2017-1 net-lease mortgage notes comprised of $542.4 million of 4.36%, Class A, amortizing notes and $132.0 million of 6.35%, Class B, interest only notes, both expected to be repaid in December 2022 and a legal final payment date in December 2047. In conjunction with the issuance, the Company pre-paid the Series 2014-1 Class A1 notes, resulting in a loss on debt extinguishment of approximately $2.2 million primarily related to the pre-payment premium. On January 23, 2018, the Company re-priced the private offering of the Master Trust 2014 Series 2017-1 notes. As a result, the interest rate on the Class B Notes was reduced from 6.35% to 5.49%, while the other terms of the Class B Notes remained unchanged. The terms of the Class A Notes were unaffected by the repricing. In connection with the repricing, the Company received $8.2 million in additional proceeds that reduced the debt discount. The additional proceeds were distributed to Spirit.
On November 1, 2018, SMTA closed on variable funding notes ("VFN") within Master Trust 2014 with up to $50.0 million in borrowing capacity, which is secured by properties of Master Trust 2014 and has an anticipated repayment date of November 1, 2021. Interest on the VFN is payable at a rate per annum equal to the CP Rate, Base Rate or Eurodollar Rate, each as defined in the Note Purchase Agreement. There is a commitment fee on the unused portion of the VFN of 0.5% per annum. No funds were drawn on the VFN as of December 31, 2018 and there was $41.1 million available borrowing capacity under the VFN as of December 31, 2018.
During the year ended December 31, 2018, the Company extinguished $6.3 million of Master Trust 2014 debt as a result of unscheduled principal pre-payments, resulting in approximately $0.4 million in losses on debt extinguishment attributable to the pre-payment premiums paid. During the same period, scheduled principal payments of $33.4 million were made on the Master Trust 2014 notes.
The Master Trust 2014 notes are summarized below:
|
| | | | | | | | | | | |
| Stated
Rates (1) | | Maturity | | December 31, 2018 | | December 31, 2017 |
| | | (in Years) | (in Thousands) |
Series 2014-1 Class A2 | 5.4% | | 1.6 | | $ | 240,908 |
| | $ | 252,437 |
|
Series 2014-2 | 5.8% | | 2.2 | | 229,516 |
| | 234,329 |
|
Series 2014-3 | 5.7% | | 3.2 | | 309,753 |
| | 311,336 |
|
Series 2014-4 Class A1 | 3.5% | | 1.1 | | 149,484 |
| | 150,000 |
|
Series 2014-4 Class A2 | 4.6% | | 11.1 | | 341,022 |
| | 358,664 |
|
Series 2017-1 Class A | 4.4% | | 4.0 | | 538,705 |
| | 542,400 |
|
Series 2017-1 Class B | 5.5% | | 4.0 | | 132,000 |
| | 132,000 |
|
Series 2018-1 Class A VFN | 4.6% | | 2.8 | | — |
| | — |
|
Total Master Trust 2014 notes | 5.0% | | 4.4 | | 1,941,388 |
| | 1,981,166 |
|
Debt discount, net | | | | (21,155 | ) | (36,342 | ) |
Deferred financing costs, net | | | | (14,912 | ) | (17,989 | ) |
Total Master Trust 2014, net | | | | | $ | 1,905,321 |
| | $ | 1,926,835 |
|
(1) Represents the individual series stated interest rates as of December 31, 2018 and the weighted average stated rate of the total Master Trust 2014 notes, based on the collective series outstanding principal balances as of December 31, 2018.
As of December 31, 2018, the Master Trust 2014 notes were secured by 784 owned and financed properties. The notes issued under Master Trust 2014 are cross-collateralized by the assets of all issuers within this trust.
SPIRIT MTA REIT
Notes to Consolidated Financial Statements
CMBS
As of January 1, 2016, three of the Company's subsidiaries were borrowers under fixed-rate non-recourse loans, which were securitized into CMBS and were secured by the borrowers’ respective leased properties and related assets. During the year ended December 31, 2016, the Company extinguished this $119.3 million aggregate principal amount of CMBS debt with a weighted average contractual interest rate of 6.0%. As a result, the Company recognized a net loss on debt extinguishment of approximately $1.4 million, primarily related to defeasance costs and fees paid for the retirement of debt.
Academy CMBS
On January 22, 2018, the Company entered into a new non-recourse loan agreement with Société Générale and Barclays Bank PLC as lenders, which is collateralized by a single distribution center property located in Katy, Texas. The loan has a fixed interest rate of 5.14% and an effective interest rate of 5.42%. As a result of the issuance, the Company received approximately $84.0 million in proceeds. The Company distributed all of the proceeds to Spirit. As of December 31, 2018, the loan had an outstanding principal balance of $83.0 million, unamortized deferred financing costs of $1.1 million and a remaining maturity of 9.1 years.
Shopko CMBS
On November 1, 2018, SMTA, through four indirectly wholly-owned, property-owning subsidiaries, entered into a $165.0 million non-recourse mortgage loan agreement and, on November 27, 2018, $40.0 million of the loan was carved out into a separate mezzanine loan agreement. These Shopko CMBS Loan Agreements were secured by the equity of the entity that owns the four property-owning subsidiaries, which collectively hold 85 assets (83 owned properties and two seller-financed notes on properties) that are leased to Shopko. The loans were pre-payable, in whole or in part, without penalty. The $125.0 million loan originally bore interest at a rate of LIBOR plus 7.5% and the $40.0 million mezzanine loan originally bore interest at LIBOR plus 13.0%. The loans are subject to scheduled amortization payments of $1.0 million per month, with an initial maturity of November 15, 2019 and two one-year extension options, subject to certain conditions. As of December 31, 2018, the loans had an outstanding principal balance of $157.4 million, unamortized deferred financing costs of $5.9 million and a remaining maturity of 0.9 years. Subsequent to year end, the Company's indirect wholly-owned subsidiaries as borrowers under the Shopko CMBS Loan Agreements defaulted on loans in conjunction with the Shopko bankruptcy filing and on March 1, 2019, the Shopko Lenders foreclosed on the equity of the entity that owns the four property-owning subsidiaries. See Note 15 for additional detail.
Debt Maturities
As of December 31, 2018, scheduled debt maturities of Master Trust 2014 and CMBS debt are as follows (in thousands):
|
| | | | | | | | | | | |
| Scheduled
Principal | | Balloon
Payment | | Total |
2019 (1) | $ | 46,398 |
| | $ | 147,421 |
| | $ | 193,819 |
|
2020 | 40,738 |
| | 364,645 |
| | 405,383 |
|
2021 | 23,614 |
| | 219,964 |
| | 243,578 |
|
2022 | 23,221 |
| | 971,453 |
| | 994,674 |
|
2023 | 22,538 |
| | — |
| | 22,538 |
|
Thereafter | 160,187 |
| | 161,665 |
| | 321,852 |
|
Total | $ | 316,696 |
| | $ | 1,865,148 |
| | $ | 2,181,844 |
|
(1) $10.0 million of 2019 scheduled principal is attributable to the Shopko CMBS Loan Agreements. The 2019 balloon payment represents the remainder of debt payments related to Shopko CMBS Loan Agreements.
SPIRIT MTA REIT
Notes to Consolidated Financial Statements
Interest Expense
The following table is a summary of the components of interest expense related to the Company’s borrowings (in thousands):
|
| | | | | | | | | | | |
| Year Ended December 31, |
| 2018 | | 2017 | | 2016 |
Interest expense | $ | 103,374 |
| | $ | 70,664 |
| | $ | 73,056 |
|
Non-cash interest expense: | | | | | |
Amortization of deferred financing costs | 4,653 |
| | 1,480 |
| | 1,285 |
|
Amortization of debt discount | 6,970 |
| | 4,589 |
| | 3,554 |
|
Total interest expense | $ | 114,997 |
| | $ | 76,733 |
| | $ | 77,895 |
|
NOTE 5. SHAREHOLDERS' EQUITY AND REDEEMABLE PREFERRED EQUITY
The Company's declaration of trust authorizes it to issue 750,000,000 common shares of beneficial interest, $0.01 par value per share, and 20,000,000 preferred shares of beneficial interest, $0.01 par value per share. The Board of Trustees has the power, without shareholder approval, to increase or decrease the number of common shares the Company is authorized to issue.
Issuance of Common Shares
SMTA was originally capitalized on November 17, 2017 with the issuance of 10,000 shares of common shares of beneficial interest ($0.01 par value per share) for a total of $10,000.
On May 31, 2018, the distribution date, Spirit completed the Spin-Off of SMTA. On the distribution date, Spirit distributed on a pro rata basis one SMTA common share for every ten shares of Spirit common stock held by each of Spirit's stockholders as of May 18, 2018, the record date. As a result, 42,851,010 SMTA common shares were issued on May 31, 2018.
During the year ended December 31, 2018, the Company declared $71.4 million in SMTA Common Share dividends and had 43,000,862 shares of common shares outstanding as of December 31, 2018.
Issuance of SMTA Preferred Shares
In conjunction with the Spin-Off, SMTA issued to the Manager and one of its affiliates, also a wholly-owned subsidiary of Spirit, 6.0 million shares of Series A preferred shares with an aggregate liquidation preference of $150.0 million (the "SMTA Preferred Shares"). Redemption value of the SMTA Preferred Shares are equal to the liquidation preference plus any accrued and unpaid dividends and redemption is under the control of SMTA unless a change of control event occurs, as defined in the SMTA Preferred Shares agreements. Therefore, as redemption may occur outside the control of SMTA, the SMTA Preferred Shares are classified as temporary equity.
The SMTA Preferred Shares pays cash dividends at the rate of 10.0% per annum on the liquidation preference of $25.00 per share (equivalent to $0.625 per share on a quarterly basis and $2.50 per share on an annual basis). During the year ended December 31, 2018, the Company paid $8.8 million in SMTA Preferred Share dividends and had 6.0 million shares of 10.0% SMTA Preferred Shares outstanding as of December 31, 2018.
Issuance of SubREIT Preferred Shares
Prior to the Spin-Off, in exchange for property, SubREIT issued to the Manager 5,000 Series A preferred shares with an aggregate liquidation preference of $5.0 million (the "SubREIT Preferred Shares"). Redemption value of the SubREIT Preferred Shares are equal to the liquidation preference plus any accrued and unpaid dividends and redemption is under the control of SubREIT unless a change of control event occurs, as defined in the SubREIT Preferred Share agreements. Therefore, as redemption may occur outside the control of SubREIT, the SubREIT Preferred Shares are classified as temporary equity. In conjunction with the Spin-Off, the Manager sold the SubREIT Preferred Shares to a third-party.
The SubREIT Preferred Shares pay cash dividends at the rate of 18.0% per annum on the liquidation preference of $1,000.00 per share (equivalent to $45.00 per share on a quarterly basis and $180.00 per share on an annual basis).
SPIRIT MTA REIT
Notes to Consolidated Financial Statements
During the year ended December 31, 2018, the Company paid $525 thousand in SubREIT Preferred Share dividends and had 5,000 shares of the SubREIT Preferred Shares outstanding as of December 31, 2018.
On December 19, 2018, SubREIT issued 125 Shares of Series B SubREIT Preferred Shares with an aggregate liquidation preference of $125 thousand. Series B SubREIT Preferred Shares pays cash dividends at the rate of 12.0% per annum on the liquidation preference of $1,000.00 per share (equivalent to $30.00 per share on a quarterly basis and $120.00 per share on an annual basis). During the year ended December 31, 2018, the company paid no dividends on the Series B SubREIT Preferred Shares and will distribute catch-up dividends for the prorated December dividend in 2019.
Share Repurchase Program
In December 2018, the Company's Board of Trustees approved a share repurchase program, which authorized repurchases of up to $50.0 million of the Company's common shares. These repurchases can be made in the open market or through private transactions. The amount and timing of repurchases is dependent on management's assessment of the capital needs of the Company. No repurchases have been made under the program as of December 31, 2018.
Dividends Declared
For the year ended December 31, 2018, the Company's Board of Trustees declared the following share dividends for SMTA Preferred Shares and SMTA Common Shares and SubREIT's Board of Directors declared the following share dividends for SubREIT Preferred Shares:
|
| | | | | | | | | | | | | |
| Declaration Date | | Dividend Per Share | | Record Date | | Total Amount
(in thousands) | | Payment Date |
Preferred Shares | | | | | | | | | |
SMTA Preferred Shares (1) | Jun 19, 2018 | | $ | 0.2083 |
| | Jun 19, 2018 | | $ | 1,250 |
| | Jun 29, 2018 |
SubREIT Preferred Shares (1) | Jun 14, 2018 | | $ | 15.0000 |
| | Jun 19, 2018 | | $ | 75 |
| | Jun 29, 2018 |
SMTA Preferred Shares | Aug 9, 2018 | | $ | 0.6250 |
| | Sep 14, 2018 | | $ | 3,750 |
| | Sep 28, 2018 |
SubREIT Preferred Shares | Aug 9, 2018 | | $ | 45.0000 |
| | Sep 14, 2018 | | $ | 225 |
| | Sep 28, 2018 |
SMTA Preferred Shares | Dec 5, 2018 | | $ | 0.6250 |
| | Dec 17, 2018 | | $ | 3,750 |
| | Dec 31, 2018 |
SubREIT Preferred Shares | Dec 4, 2018 | | $ | 45.0000 |
| | Dec 17, 2018 | | $ | 225 |
| | Dec 31, 2018 |
Common Shares | | | | | | | | | |
SMTA Common Shares | Aug 9, 2018 | | $ | 0.3300 |
| | Sep 28, 2018 | | $ | 14,190 |
| | Oct 15, 2018 |
SMTA Common Shares (2) | Dec 5, 2018 | | $ | 1.3300 |
| | Dec 31, 2018 | | $ | 57,191 |
| | Jan 15, 2019 |
| |
(1) | Dividend was prorated for the period from June 1, 2018 to June 30, 2018. |
| |
(2) | Dividend includes quarterly dividend of $0.33 per share and special dividend of $1.00 per share. |
The Common Share dividend declared on December 5, 2018 was paid on January 15, 2019 and is included in accounts payable, accrued expenses and other liabilities as of December 31, 2018.
NOTE 6. COMMITMENTS AND CONTINGENCIES
The Company is periodically subject to claims or litigation in the ordinary course of business, including claims generated from business conducted by tenants on real estate owned by the Company. In these instances, the Company is typically indemnified by the tenant against any losses that might be suffered, and the Company and/or the tenant are insured against such claims.
As of December 31, 2018, there were no outstanding claims against the Company that are expected to have a material adverse effect on the Company’s financial position, results of operations or cash flows.
As of December 31, 2018, the Company had commitments totaling $5.1 million, all of which relate to funding improvements on properties the Company currently owns. The Company expects to fund $5.0 million of these commitments by the end of fiscal year 2019.
SPIRIT MTA REIT
Notes to Consolidated Financial Statements
The Company estimates future costs for known environmental remediation requirements when it is probable that the Company has incurred a liability and the related costs can be reasonably estimated. The Company considers various factors when estimating its environmental liabilities, and adjustments are made when additional information becomes available that affects the estimated costs to study or remediate any environmental issues. When only a wide range of estimated amounts can be reasonably established and no other amount within the range is better than another, the low end of the range is recorded in the consolidated financial statements. As of December 31, 2018, no accruals have been made.
The Company is also a lessee under five long-term, non-cancelable ground leases under which it is obligated to pay monthly rent as of December 31, 2018. Total rental expense included in property costs (including reimbursable) amounted to $1.1 million, $1.1 million and $1.0 million for the years ended December 31, 2018, 2017 and 2016, respectively. Certain ground lease rental expenses are reimbursed by unrelated third parties, and the corresponding rental revenue is recorded in rentals on the accompanying consolidated statements of operations and comprehensive income (loss).
The Company’s minimum aggregate rental commitments under all non-cancelable operating leases as of December 31, 2018 are as follows (in thousands):
|
| | | | | | | | | | | |
| Non-reimbursable Ground Leases | | Reimbursable Ground Leases | | Total Ground Leases |
2019 | $ | 26 |
| | $ | 1,123 |
| | $ | 1,149 |
|
2020 | 26 |
| | 1,125 |
| | 1,151 |
|
2021 | 26 |
| | 1,128 |
| | 1,154 |
|
2022 | 26 |
| | 1,151 |
| | 1,177 |
|
2023 | 26 |
| | 1,205 |
| | 1,231 |
|
Thereafter | 35 |
| | 15,684 |
| | 15,719 |
|
Total | $ | 165 |
| | $ | 21,416 |
| | $ | 21,581 |
|
NOTE 7. SEGMENTS
Management views the operations of the Company as two separate segments—Master Trust 2014 and Other Properties—and makes operating decisions based on these two reportable segments. The initial business strategy for the Company as a whole was (i) to grow and reinforce Master Trust 2014 and (ii) to monetize the Other Properties to distribute proceeds to shareholders or redeploy into assets that can be added to the Collateral Pool of Master Trust 2014.
Master Trust 2014 is an asset-backed securitization platform, see Note 4, with specific criteria for operating the Collateral Pool, including restrictions on use of Release Account cash, concentration thresholds which cannot be exceeded, and a minimum debt service coverage ratio which must be met. Operations for the Other Properties are focused on monetization of the assets through dispositions, or could include redevelopment or outparcel development where prudent.
Segment results are comprised of revenues, property management and servicing fees, property expenses (which include property costs, depreciation and amortization, and impairments), and interest expense. General and administrative expenses, asset management fees under the Asset Management Agreement, transaction costs, and income taxes are not allocated to individual segments for purposes of assessing segment performance. The Company believes that segment results serve as a useful supplement to net (loss) income because they allow investors and management to measure the Company's progress against its stated strategy.
The performance of the reportable segments is not comparable with the Company's consolidated results and is not necessarily comparable with similar information for any other REITs. Additionally, because of the interrelationship of the segments, the information presented is not indicative of how the segments would perform if they operated as independent entities.
SPIRIT MTA REIT
Notes to Consolidated Financial Statements
Segment results for the years ended December 31, 2018, 2017 and 2016 are as follows (in thousands):
|
| | | | | | | | | | | | |
| | Year Ended December 31, 2018 |
Segment Results: | | Master Trust 2014 | | Other Properties | | Total |
Rental income | | $ | 180,317 |
| | $ | 60,093 |
| | $ | 240,410 |
|
Interest income on loans receivable | | 294 |
| | 2,786 |
| | 3,080 |
|
Other income | | 1,908 |
| | 909 |
| | 2,817 |
|
Property Management and Servicing Fees (1) | | (7,033 | ) | | — |
| | (7,033 | ) |
Property costs (including reimbursable) | | (3,869 | ) | | (8,889 | ) | | (12,758 | ) |
Depreciation and amortization | | (62,942 | ) | | (21,736 | ) | | (84,678 | ) |
Impairment and allowance for loan losses | | (19,838 | ) | | (201,511 | ) | | (221,349 | ) |
Interest expense | | (106,915 | ) | | (8,082 | ) | | (114,997 | ) |
Loss on debt extinguishment | | (363 | ) | | (3 | ) | | (366 | ) |
Gain on disposition of assets | | 1,314 |
| | 8,144 |
| | 9,458 |
|
Segment loss | | $ | (17,127 | ) | | $ | (168,289 | ) | | $ | (185,416 | ) |
Non-allocated expenses | | | | | | (34,601 | ) |
Loss before income tax expense | | | | | | $ | (220,017 | ) |
|
| | | | | | | | | | | | |
| | Year Ended December 31, 2017 |
Rental income | | $ | 164,683 |
| | $ | 61,903 |
| | $ | 226,586 |
|
Interest income on loans receivable | | 748 |
| | 20 |
| | 768 |
|
Other income | | 4,186 |
| | 262 |
| | 4,448 |
|
Property Management and Servicing Fees (1) | | (5,500 | ) | | — |
| | (5,500 | ) |
Property costs (including reimbursable) | | (9,528 | ) | | (2,968 | ) | | (12,496 | ) |
Depreciation and amortization | | (57,819 | ) | | (22,567 | ) | | (80,386 | ) |
Impairment and allowance for loan losses | | (20,928 | ) | | (12,620 | ) | | (33,548 | ) |
Interest expense | | (76,733 | ) | | — |
| | (76,733 | ) |
(Loss) gain on debt extinguishment | | (2,224 | ) | | 1 |
| | (2,223 | ) |
Gain on disposition of assets | | 7,422 |
| | 14,971 |
| | 22,393 |
|
Segment income | | $ | 4,307 |
| | $ | 39,002 |
| | $ | 43,309 |
|
Non-allocated expenses | | | | | | (24,845 | ) |
Income before income tax expense | | | | | | $ | 18,464 |
|
|
| | | | | | | | | | | | |
| | Year Ended December 31, 2016 |
Rental income | | $ | 166,047 |
| | $ | 70,754 |
| | $ | 236,801 |
|
Interest income on loans receivable | | 2,207 |
| | — |
| | 2,207 |
|
Other income | | 6,113 |
| | 182 |
| | 6,295 |
|
Property Management and Servicing Fees (1) | | (5,427 | ) | | — |
| | (5,427 | ) |
Property costs (including reimbursable) | | (3,638 | ) | | (1,620 | ) | | (5,258 | ) |
Depreciation and amortization | | (58,913 | ) | | (26,848 | ) | | (85,761 | ) |
Impairment and allowance for loan losses | | (17,176 | ) | | (9,389 | ) | | (26,565 | ) |
Interest expense | | (75,671 | ) | | (2,224 | ) | | (77,895 | ) |
Loss on debt extinguishment | | — |
| | (1,372 | ) | | (1,372 | ) |
Gain on disposition of assets | | 12,208 |
| | 14,291 |
| | 26,499 |
|
Segment income | | $ | 25,750 |
| | $ | 43,774 |
| | $ | 69,524 |
|
Non-allocated expenses | | | | | | (21,421 | ) |
Income before income tax expense | | | | | | $ | 48,103 |
|
(1) Property Management and Servicing Fees are included in related party fees in the consolidated statements of operations and comprehensive income (loss). Asset Management Fees, the other component of related party fees, are included in non-allocated expenses above.
SPIRIT MTA REIT
Notes to Consolidated Financial Statements
Assets and liabilities by reportable segment are as follows (in thousands):
|
| | | | | | | | | | | | | | | | | | | | | | | | |
| | December 31, 2018 | | December 31, 2017 |
| | Master Trust 2014 | | Other Properties | | Total | | Master Trust 2014 | | Other Properties | | Total |
Net investments | | $ | 1,719,268 |
| | $ | 335,269 |
| | $ | 2,054,537 |
| | $ | 1,721,583 |
| | $ | 514,752 |
| | $ | 2,236,335 |
|
Restricted cash | | 25,683 |
| | 18,404 |
| | 44,087 |
| | 66,504 |
| | — |
| | 66,504 |
|
Segment assets | | $ | 1,744,951 |
| | $ | 353,673 |
| | $ | 2,098,624 |
| | $ | 1,788,087 |
| | $ | 514,752 |
| | $ | 2,302,839 |
|
Other assets | | | | | | 207,025 |
| | | | | | 54,821 |
|
Total assets | | | | | | $ | 2,305,649 |
| | | | | | $ | 2,357,660 |
|
| | | | | | | | | | | | |
Mortgages and notes payable, net | | $ | 1,905,322 |
| | $ | 233,482 |
| | $ | 2,138,804 |
| | $ | 1,926,835 |
| | $ | — |
| | $ | 1,926,835 |
|
Intangible lease liabilities, net | | 17,053 |
| | 623 |
| | 17,676 |
| | 19,725 |
| | 4,122 |
| | 23,847 |
|
Segment liabilities | | $ | 1,922,375 |
| | $ | 234,105 |
| | $ | 2,156,480 |
| | $ | 1,946,560 |
| | $ | 4,122 |
| | $ | 1,950,682 |
|
Other liabilities | | | | | | 83,629 |
| | | | | | 16,060 |
|
Total liabilities | | | | | | $ | 2,240,109 |
| | | | | | $ | 1,966,742 |
|
Dispositions by reportable segment are as follows (dollars in thousands):
|
| | | | | | | | | | | | | | |
| | Year Ended December 31, 2018 | | Year Ended December 31, 2017 |
| | Properties(1) | | Gross Proceeds(1) | | Properties | | Gross Proceeds |
Master Trust 2014 | | 35 |
| | $ | 38,911 |
| | 52 |
| | $ | 74,134 |
|
Other Properties | | 12 |
| | 52,074 |
| | 24 |
| | 80,066 |
|
Total | | 47 |
| | $ | 90,985 |
| | 76 |
| | $ | 154,200 |
|
(1) Excludes three properties transfered to Spirit prior to the Spin-Off, see Note 11.
NOTE 8. FAIR VALUE MEASUREMENTS
Nonrecurring Fair Value Measurements
Fair value measurement of an asset on a nonrecurring basis occurs when events or changes in circumstances related to an asset indicate that the carrying amount of the asset is no longer recoverable. Real estate and the related intangible assets are evaluated for impairment based on certain indicators including, but not limited to: the asset being held for sale, vacant, non-operating or the lease on the asset expiring in 60 days or less. The fair values of impaired real estate and intangible assets were determined by using the following information, depending on availability, in order of preference: signed purchase and sale agreements or letters of intent; recently quoted bid or ask prices, or market
prices for comparable properties; estimates of cashflow, which consider, among other things, contractual and forecasted rental revenues, leasing assumptions, and expenses based upon market conditions; and expectations for the use of the real estate. Based on these inputs, the Company determined that its valuation of the impaired real estate and intangible assets falls within Level 3 of the fair value hierarchy.
The following table sets forth the Company’s assets that were accounted for at fair value on a nonrecurring basis as of December 31, 2018 and December 31, 2017 (in thousands):
|
| | | | | | | | | | | | | | | |
| | | Fair Value Hierarchy Level |
Description | Fair Value | | Level 1 | | Level 2 | | Level 3 |
December 31, 2018 | | | | | | | |
Long-lived assets held and used | $ | 183,502 |
| | $ | — |
| | $ | — |
| | $ | 183,502 |
|
Long-lived assets held for sale | $ | 723 |
| | $ | — |
| | $ | — |
| | $ | 723 |
|
| | | | | | | |
December 31, 2017 | | | |
| | |
| | |
|
Long-lived assets held and used | $ | 11,077 |
| | $ | — |
| | $ | — |
| | $ | 11,077 |
|
Long-lived assets held for sale | $ | 30,956 |
| | $ | — |
| | $ | — |
| | $ | 30,956 |
|
$28.0 million of the fair value balance at December 31, 2018 was within the Master Trust 2014 segment, with the remaining $156.2 million within the Other Properties segment. $16.8 million of the fair value balance at December 31, 2017 was within the Master Trust 2014 segment, with the remaining $25.2 million within the Other Properties segment.
The fair values for the year ended December 31, 2018 relate to 96 held and used assets and one held for sale assets. The fair values for the year ended December 31, 2017 relate to five held and used assets and six held for sale assets. The significant inputs for the fair values are described below.
Held and Used Impairment of Shopko assets
The Company utilized the income capitalization approach in determining the fair value of the Shopko assets, resulting in 77 impaired properties for the year ended December 31, 2018. Inputs utilized in determining the fair value included: vacancy period, vacancy costs, lease-up costs, market rent, expected collection losses and capitalization rates. The range of inputs used to determine the fair value are as follows:
|
| | | | | | | | | | | | |
Vacancy Period | | Vacancy Costs | | Leasing Commission | | Tenant Improvement Allowance | | Market Rent | | Expected Collection Losses | | Capitalization Rates |
18 - 24 months | | $1.68 - $5.52 psf | | 6% of Contractual Rent | | $25 - $30 psf | | $5.00 - $9.75 psf | | 1% of Contractual Rent | | 8% - 9.25% |
Held and Used Impairment of other assets
For six of the held and used properties impaired during the year ended December 31, 2018 and four of the held and used properties impaired during the year ended December 31, 2017, the Company estimated property fair value using the price per square foot of comparable properties. The following table provides information about the price per square foot of comparable properties used as inputs (price per square foot in dollars):
|
| | | | | | | | | | | | | | | | | |
| December 31, 2018 | | December 31, 2017 |
| Range | | Weighted
Average | | Square
Footage | | Range | | Weighted
Average | | Square
Footage |
Long-lived assets held and used by asset type |
Retail | $53.49 - $499.17 | |
| $112.85 |
| | 54,341 | | $18.40 - $285.98 | |
| $72.04 |
| | 68,871 |
Office | $ | — |
| | $ | — |
| | — | | $81.61 - $244.86 | |
| $149.49 |
| | 19,821 |
For the remaining 13 held and used properties impaired during the year ended December 31, 2018 and one held and used property impaired during the year ended December 31, 2017, the Company estimated property fair value using the price per square foot based on a listing price or a broker opinion of value. The following table provides information
SPIRIT MTA REIT
Notes to Consolidated Financial Statements
about the price per square foot based on a listing price and a broker opinion of value used as inputs (price per square foot in dollars):
|
| | | | | | | | | | | |
| December 31, 2018 | | December 31, 2017 |
| Range | | Weighted
Average | | Square
Footage | | Range | | Weighted
Average | | Square
Footage |
Long-lived assets held and used by asset type |
Retail | $57.50 - $125.03 | | $90.17 | | 242,165 | | $88.89 | | $88.89 | | 22,500 |
Held for Sale Impairment
For the year ended December 31, 2018 and year ended December 31, 2017, we determined that one and six long-lived assets held for sale, respectively, were impaired. The Company estimated fair value of held for sale properties using price per square foot from signed purchase and sale agreements as follows (price per square foot in dollars):
|
| | | | | | | | | | | | | | | |
| December 31, 2018 | | December 31, 2017 |
| Range | | Weighted
Average | | Square
Footage | | Range | | Weighted
Average | | Square
Footage |
Long-lived assets held for sale by asset type |
Retail | $99.36 | | $99.36 | | 7,800 | | $55.30 - $346.23 | | $299.89 | | 87,248 |
Industrial | $ | — |
| | $ | — |
| | — | | $54.21 | | $54.21 | | 96,845 |
Estimated Fair Value of Financial Instruments
Financial assets and liabilities for which the carrying values approximate their fair values include cash and cash equivalents, restricted cash and escrow deposits, and accounts receivable and payable. Generally, these assets and liabilities are short-term in duration and are recorded at cost, which approximates fair value, on the accompanying consolidated balance sheets.
In addition to the disclosures for assets and liabilities required to be measured at fair value at the balance sheet date, companies are required to disclose the estimated fair values of all financial instruments, even if they are not carried at their fair values. The fair values of financial instruments are estimates based upon market conditions and perceived risks at December 31, 2018 and December 31, 2017. These estimates require management’s judgment and may not be indicative of the future fair values of the assets and liabilities.
The estimated fair values of the following financial instruments have been derived based on market quotes for comparable instruments or discounted cash flow analyses using estimates of the amount and timing of future cash flows, market rates and credit spreads. These measurements are classified as Level 2 of the fair value hierarchy. The following table discloses fair value information for these financial instruments (in thousands):
|
| | | | | | | | | | | | | | | |
| December 31, 2018 | | December 31, 2017 |
| Carrying
Value | | Estimated
Fair Value | | Carrying
Value | | Estimated
Fair Value |
Loans receivable, net | $ | 30,093 |
| | $ | 26,852 |
| | $ | 32,307 |
| | $ | 29,076 |
|
Mortgages and notes payable, net (1) | $ | 2,138,804 |
| | $ | 2,219,119 |
| | $ | 1,926,835 |
| | $ | 2,030,191 |
|
(1) The carrying value of the debt instruments are net of unamortized deferred financing costs and certain debt discounts/premiums.
NOTE 9. 2018 INCENTIVE AWARD PLAN
During the year ended December 31, 2018 the Company granted 150 thousand restricted shares under the 2018 Incentive Award Plan to members of the Board of Trustees, all of which were unvested as of December 31, 2018. The fair value of the restricted share grants was determined based on the Company's closing share price on the date of grant. The Company recorded $1.7 million in deferred compensation associated with these grants. Deferred compensation for restricted shares will be recognized in expense over the requisite service period, generally which is
SPIRIT MTA REIT
Notes to Consolidated Financial Statements
the earlier of the annual shareholder meeting subsequent to grant date or one year. Grants under the 2018 Incentive Award Plan have a remaining weighted average recognition period of 0.4 years. The Company will recognize share-based compensation forfeitures as they occur. As of December 31, 2018, 3.5 million shares are available for award under the 2018 Incentive Award Plan.
The following table summarizes restricted share activity under the 2018 Incentive Award Plan:
|
| | | | | | |
| 2018 |
| Number of Shares | | Weighted Average Price (1)
(per share) |
Outstanding non-vested shares, beginning of year | — |
| | $ | — |
|
Shares granted | 149,852 |
| | 11.04 |
|
Shares vested | — |
| | — |
|
Shares forfeited | — |
| | — |
|
Outstanding non-vested shares, end of year | 149,852 |
| | $ | 11.04 |
|
(1) Based on grant date fair values.
For the year ended December 31, 2018, the Company recognized $0.9 million in share-based compensation expense, which is included in general and administrative expenses in the accompanying consolidated statements of operations and comprehensive income (loss).
As of December 31, 2018, the remaining unamortized share-based compensation expense totaled $0.8 million, all of which is related to restricted share awards. Amortization is recognized on a straight-line basis over the service period of the awards.
NOTE 10. INCOME (LOSS) PER SHARE
Income (loss) per share has been computed using the two-class method, which is computed by dividing the sum of distributed earnings to common shareholders and undistributed earnings allocated to common shareholders by the weighted average number of shares of common shares outstanding for the period. In applying the two-class method, undistributed earnings are allocated to both shares of common shares and any participating securities based on the weighted average shares outstanding during the period. Under the two-class method, any earnings attributable to unvested restricted shares are deducted from income (loss) from continuing operations in the computation of net income (loss) attributable to common shareholders.
SPIRIT MTA REIT
Notes to Consolidated Financial Statements
The common shares outstanding at the Spin-Off date are reflected as outstanding for all periods prior to the Spin-Off. The table below is a reconciliation of the numerator and denominator used in the computation of basic and diluted net income (loss) per share computed using the two-class method (dollars in thousands):
|
| | | | | | | | | | | |
| Year Ended December 31, |
| 2018 | | 2017 | | 2016 |
Basic and diluted (loss) income: | | | | | |
Net (loss) income and total comprehensive (loss) income | $ | (220,238 | ) | | $ | 18,285 |
| | $ | 47,922 |
|
Less: dividends paid to preferred shareholders | (9,275 | ) | | — |
| | — |
|
Less: income attributable to unvested restricted shares | (249 | ) | | — |
| | — |
|
Net (loss) income attributable to common shareholders used in basic and diluted (loss) income per share | $ | (229,762 | ) | | $ | 18,285 |
| | $ | 47,922 |
|
| | | | | |
Basic weighted average common shares outstanding: | | | | | |
Weighted average common shares outstanding | 42,919,983 |
| | 42,851,010 |
| | 42,851,010 |
|
Less: Unvested weighted average shares of restricted shares | (68,973 | ) | | — |
| | — |
|
Weighted average common shares outstanding used in basic (loss) income per share | 42,851,010 |
| | 42,851,010 |
| | 42,851,010 |
|
Net (loss) income per share attributable to common shareholders | $ | (5.36 | ) | | $ | 0.43 |
| | $ | 1.12 |
|
| | | | | |
Dilutive weighted average common shares (1): | | | | | |
Weighted average common shares outstanding used in diluted (loss) income per share | 42,851,010 |
| | 42,851,010 |
| | 42,851,010 |
|
Net (loss) income per share attributable to common shareholders - diluted | $ | (5.36 | ) | | $ | 0.43 |
| | $ | 1.12 |
|
| | | | | |
Total potentially dilutive shares of common shares (1) | — |
| | — |
| | — |
|
(1) As of December 31, 2018, 2017, and 2016 there were no adjustments to the weighted average common shares outstanding used in the diluted calculation given there were no potentially dilutive shares.
NOTE 11. RELATED PARTY TRANSACTIONS
Cost Sharing Arrangements
In conjunction with the Spin-Off, SMTA and Spirit entered into certain agreements, including the Separation and Distribution Agreement, Tax Matters Agreement, Registration Rights Agreement and Insurance Sharing Agreement. These agreements provide a framework for the relationship between the Company and Spirit after the Spin-Off, by which Spirit may incur certain expenses on behalf of SMTA that SMTA must reimburse in a timely manner. As part of the Separation and Distribution Agreement, Spirit contributed $3.0 million of cash to SMTA at the time of the Spin-Off. Additionally, in relation to rental payments received by SMTA subsequent to the Spin-Off that relate to rents prior to the Spin-Off, SMTA was required to reimburse $2.0 million to Spirit within 60 days of the Spin-Off, which was reimbursed to Spirit during the quarter ended September 30, 2018. There was $0.1 million payable to Spirit and $1.8 million receivable from Spirit in connection with these arrangements as of December 31, 2018.
Asset Management Agreement
In conjunction with the Spin-Off, SMTA and the Manager entered into the Asset Management Agreement pursuant to which the Manager will provide various services subject to the supervision of SMTA's Board of Trustees, including, but not limited to: (i) performing all of SMTA's day-to-day functions, (ii) sourcing, analyzing and executing on investments and dispositions, (iii) determining investment criteria, (iv) performing investment and liability management duties, including financing and hedging, and (v) performing financial and accounting management. As compensation for these services, SMTA is obligated to pay $20 million per annum, payable monthly in arrears. Additionally, the Manager may be entitled to, under certain circumstances, a promoted interest fee based on the total shareholder return of SMTA's common shares during the relevant period, as well as a termination fee. The fair value of the promote fee was calculated using a Monte Carlo simulation model, which incorporated the initial 30-day volume weighted average share price of SMTA of $10.01, a projected volatility rate for SMTA, a risk-free rate, and other variables over the 36 month service period as defined in the Asset Management Agreement. The resulting total estimated fair value of the promote is $4.3
SPIRIT MTA REIT
Notes to Consolidated Financial Statements
million as of December 31, 2018 and is amortized over the service period. During the year ended December 31, 2018, asset management and promote fees of $11.7 million and $0.8 million, respectively, were incurred, which are included in related party fees in the consolidated statements of operations and comprehensive income (loss). Asset management fees of $1.7 million and promote fees of $0.8 million, respectively, were accrued at December 31, 2018 and are included in accounts payable, accrued expenses and other liabilities in the accompanying consolidated balance sheet.
Property Management and Servicing Agreement
The Manager provides property management services and special services for Master Trust 2014. The property management fees accrue daily at 0.25% per annum of the collateral value of the Master Trust 2014 Collateral Pool less any specially serviced assets, and the special servicing fees accrue daily at 0.75% per annum of the collateral value of any assets deemed to be specially serviced per the terms of the Property Management and Servicing Agreement dated May 20, 2014. During the years ended December 31, 2018, 2017 and 2016, property management fees of $6.2 million, $4.5 million and $4.7 million, respectively, were incurred. Also during the years ended December 31, 2018, 2017 and 2016, special servicing fees of $0.8 million, $1.0 million and $0.7 million, respectively, were incurred. The property management fees and special servicing fees are included in related party fees in the consolidated statements of operations and comprehensive income (loss). As of December 31, 2018, the Company had an accrued payable balance of $0.5 million related to these fees.
Related Party Loans Receivable
SMTA has four mortgage loans receivable where wholly-owned subsidiaries of Spirit are the borrower, and the loans are secured by six single-tenant commercial properties. These mortgage loans, which have a weighted average stated interest rate of 1.0%, were entered into by entities under common control of Spirit in conjunction with the issuance of the Series 2014 notes of Master Trust 2014 because the underlying properties did not qualify to be held directly as collateral by Master Trust 2014 under its governing agreements. In total, these mortgage notes had outstanding principal of $27.9 million and $30.8 million as of December 31, 2018 and December 31, 2017, respectively, which is included in loans receivable, net on the consolidated balance sheets. The mortgage notes generated $0.3 million, $0.3 million and $0.4 million of income for the years ended December 31, 2018, 2017 and 2016, respectively, which is included in interest income on loans receivable in the consolidated statements of operations and comprehensive income (loss). As specified in the original loan agreements dated May 20, 2014, these mortgage notes have maturity dates between June 1, 2027 and April 1, 2028, with a weighted average maturity of 9.2 years at December 31, 2018.
Related Party Notes Payable
In conjunction with the Series 2017-1 notes issuance completed in December 2017, the Manager, as sponsor of the issuance, retained a 5% economic interest in the Master Trust 2014 Series 2017-1 notes as required by the risk retention rules issued under 17 CFR Part 246. The principal amount due to the Manager under the notes was $33.5 million and $33.7 million at December 31, 2018 and December 31, 2017, respectively, and is included in mortgages and notes payable, net on the consolidated balance sheets. The notes have a weighted average stated interest rate of 4.6% with a weighted average term of four years to expected maturity as of December 31, 2018. Interest expense on the consolidated statements of operations and comprehensive income (loss) for the year ended December 31, 2018 includes $1.5 million of interest expense paid to the Manager in relation to these notes.
Related Party Acquisitions and Transfers
The financial statements include transfers of properties between the Company and Spirit and its wholly-owned subsidiaries prior to the Spin-Off. During the year ended December 31, 2018, the Company transferred three properties to Spirit with a net book value of $2.1 million, and during the year ended December 31, 2018 Spirit contributed ten properties to the Company with an aggregate net book value of $44.9 million and a $35.0 million B-1 Term Loan with Shopko as borrower, all of which are reflected as non-cash activity in the consolidated statement of cash flows.
During the year ended December 31, 2018, Spirit acquired a portfolio of properties and subsequently assigned three of the acquired properties to SMTA. In conjunction with the assignment, the Company paid a $393 thousand equalization payment to Spirit to ensure a consistent capitalization rate for the acquired properties between the Company and Spirit.
For the year ended December 31, 2017, the Company purchased one property from Spirit for $16.0 million, which is reflected in the consolidated statement of cash flows as acquisitions of real estate. Additionally, during 2017, Spirit contributed ten real estate properties to the collateral pool of Master Trust 2014 with total net book value of $204.7
SPIRIT MTA REIT
Notes to Consolidated Financial Statements
million in conjunction with the issuance of the Series 2017-1 notes. For the year ended December 31, 2016, the Company purchased three properties from Spirit for $12.1 million. Additionally, during 2016, the Company exchanged $11.3 million in cash and two mortgage loans collateralized by a total of 66 properties with outstanding principal receivable of $26.6 million to Spirit for four properties with a net book value of $36.9 million. The amount paid in excess of historical cost basis was recognized as distribution to parent company. For these transactions, due to all entities being under common control at the time of transaction, no gain or loss was recognized by the Company and the acquired properties are accounted for by the Company at their historical cost basis to Spirit.
Expense Allocations
As described in Note 2, the accompanying consolidated financial statements present the operations of the Company as carved-out from the financial statements of Spirit through the date of the Spin-Off. General and administrative expenses and transaction costs were first specifically identified based on direct usage or benefit. The remaining general and administrative expenses and transaction costs for the period prior to the Spin-Off have been allocated to the Company based on relative property count, which the Company believes to be a reasonable methodology. These allocated expenses are centralized corporate costs borne by Spirit for management and other services, including, but not limited to, executive oversight, asset management, property management, treasury, finance, human resources, tax, accounting, financial reporting, information technology and investor relations, as well as transaction costs incurred in connection with the Spin-Off. A summary of the amounts allocated by property count is provided below:
|
| | | | | | | | | | | |
| Year Ended December 31, |
| 2018 (1) | | 2017 | | 2016 |
Allocated corporate expenses: | | | | |
|
Cash compensation and benefits | $ | 3,965 |
| | $ | 8,078 |
| | $ | 7,647 |
|
Share compensation | 2,424 |
| | 6,131 |
| | 3,720 |
|
Professional fees | 1,013 |
| | 3,350 |
| | 3,625 |
|
Other corporate expenses | 1,068 |
| | 2,255 |
| | 2,541 |
|
Total corporate expenses | 8,470 |
| | 19,814 |
| | 17,533 |
|
Restructuring charges | — |
| | — |
| | 2,465 |
|
Transaction Costs | 3,957 |
| | 1,180 |
| | — |
|
Total allocated costs | $ | 12,427 |
| | $ | 20,994 |
| | $ | 19,998 |
|
(1) Allocation for the year ended December 31, 2018 is for the period prior to the Spin-Off.
Corporate expenses have been included within general and administrative expenses in the consolidated statements of operations and comprehensive income (loss).
NOTE 12. SIGNIFICANT CREDIT AND REVENUE CONCENTRATION
As of December 31, 2018 and December 31, 2017, the Company's real estate investments were operated by 203 and 201 tenants, respectively, that operate within retail, office and industrial property types across various industries throughout the U.S. Shopko operates in the general merchandise industry and is the Company's largest tenant as a percentage of rental revenue. For the years ended December 31, 2018 and 2017, properties leased to Shopko, which are primarily in the Other Properties segment, contributed 19.1% and 21.8% of the rental revenue presented in the accompanying consolidated statements of operations and comprehensive income (loss). No other tenant contributed 5% or more of the rental revenue during any of the periods presented. As of both December 31, 2018 and December 31, 2017, the Company's net investment in Shopko properties represents approximately 7.3% and 15.8%, respectively, of the Company's total assets presented in the accompanying consolidated balance sheets. Additionally, the Company holds a B-1 Term Loan that was issued by Shopko, see Note 3 and Note 15 for further discussion. This B-1 Term Loan contributed 86.8% of the interest income on loans receivable presented in the accompanying consolidated statement of operations and comprehensive income (loss) for the year ended December 31, 2018. As of December 31, 2018, the B-1 Term Loan represents approximately 1.5% of the Company's total assets presented in the accompanying consolidated balance sheet.
SPIRIT MTA REIT
Notes to Consolidated Financial Statements
NOTE 13. INCOME TAXES
The Company’s total state income tax expense was $0.2 million for each of the years ended December 31, 2018, 2017 and 2016, respectively.
The Company's deferred income tax expense (benefit) and its ending balance in deferred tax assets and liabilities, which are recorded within accounts payable, accrued expenses and other liabilities in the accompanying combined balance sheets, were immaterial at December 31, 2018 and 2017.
To the extent that the Company acquires property that has been owned by a C corporation in a transaction in which the tax basis of the property carries over, and the Company recognizes a gain on the disposition of such property during the subsequent recognition period, it will be required to pay tax at the regular corporate tax rate to the extent of such built-in gain. No properties subject to state built-in gain tax were sold during 2018.
The Company files federal, state and local income tax returns commencing with our taxable year ending December 31, 2018. The Company’s policy is to recognize interest related to any underpayment of income taxes as interest expense and to recognize any penalties as operating expenses. There was no accrual for interest or penalties at December 31, 2018 or 2017. The Company believes that it has appropriate support for the income tax positions taken and to be taken on its tax returns and that its accruals for tax liabilities are adequate for all open years based on an assessment of many factors, including past experience and interpretations of tax law applied to the facts of each matter.
For the year ended December 31, 2018, common share dividends per share paid were characterized for tax as follows:
|
| | | |
| Year Ended December 31, 2018 |
Ordinary income | $ | 0.26 |
|
Return of capital | — |
|
Capital gain | 0.14 |
|
Total (1) | $ | 0.40 |
|
(1) The remaining common share dividend of $0.31 per share and the remaining common share special dividend of $0.95 per share that were paid on January 15, 2019, with a record date of December 31, 2018, will be treated as a 2019 distribution for federal tax purposes.
NOTE 14. CONSOLIDATED QUARTERLY FINANCIAL DATA
The following tables sets forth certain unaudited consolidated financial information for each of the four quarters included in the years ended December 31, 2018 and 2017 (in thousands, except share and per share data):
|
| | | | | | | | | | | | | | | | | | | |
2018 | First | | Second | | Third | | Fourth | | |
(Unaudited) | Quarter | | Quarter | | Quarter | | Quarter | | Year |
Total revenues | $ | 60,068 |
| | $ | 60,958 |
| | $ | 62,411 |
| | $ | 62,870 |
| | $ | 246,307 |
|
Depreciation and amortization | (20,993 | ) | | (21,109 | ) | | (20,969 | ) | | (21,607 | ) | | (84,678 | ) |
Interest | (28,012 | ) | | (27,743 | ) | | (27,672 | ) | | (31,570 | ) | | (114,997 | ) |
Related party fees | (1,730 | ) | | (3,351 | ) | | (8,369 | ) | | (6,083 | ) | | (19,533 | ) |
Impairment and allowance for loan losses | (4,825 | ) | | (1,247 | ) | | (9,343 | ) | | (205,934 | ) | | (221,349 | ) |
Other expenses | (10,138 | ) | | (11,369 | ) | | (3,842 | ) | | (9,731 | ) | | (35,080 | ) |
Loss on debt extinguishment | (255 | ) | | (108 | ) | | — |
| | (3 | ) | | (366 | ) |
(Loss) gain on disposition of assets | (1,694 | ) | | 4,948 |
| | 4,210 |
| | 1,994 |
| | 9,458 |
|
Net (loss) income | (7,579 | ) | | 979 |
| | (3,574 | ) | | (210,064 | ) | | (220,238 | ) |
Preferred dividends | — |
| | (1,325 | ) | | (3,975 | ) | | (3,975 | ) | | (9,275 | ) |
Net loss attributable to common shareholders | $ | (7,579 | ) | | $ | (346 | ) | | $ | (7,549 | ) | | $ | (214,039 | ) | | $ | (229,513 | ) |
| | | | | | | | | |
Net loss per share attributable to common shareholders | $ | (0.18 | ) | | $ | (0.01 | ) | | $ | (0.18 | ) | | $ | (5.00 | ) | | $ | (5.36 | ) |
Dividends declared per common share | N/A |
| | $ | — |
| | $ | 0.33 |
| | $ | 1.33 |
| | $ | 1.66 |
|
SPIRIT MTA REIT
Notes to Consolidated Financial Statements
|
| | | | | | | | | | | | | | | | | | | |
2017 | First | | Second | | Third | | Fourth | | |
(Unaudited) | Quarter | | Quarter | | Quarter | | Quarter | | Year |
Total revenues | $ | 57,848 |
| | $ | 57,245 |
| | $ | 59,159 |
| | $ | 57,550 |
| | $ | 231,802 |
|
Depreciation and amortization | (20,610 | ) | | (20,275 | ) | | (19,891 | ) | | (19,610 | ) | | (80,386 | ) |
Interest | (18,816 | ) | | (18,775 | ) | | (18,733 | ) | | (20,409 | ) | | (76,733 | ) |
Related party fees | (1,354 | ) | | (1,385 | ) | | (1,411 | ) | | (1,350 | ) | | (5,500 | ) |
Impairment and allowance for loan losses | (6,493 | ) | | (5,419 | ) | | (15,436 | ) | | (6,200 | ) | | (33,548 | ) |
Other expenses | (7,770 | ) | | (10,439 | ) | | (8,829 | ) | | (10,482 | ) | | (37,520 | ) |
Gain (loss) on debt extinguishment | — |
| | 1 |
| | — |
| | (2,224 | ) | | (2,223 | ) |
Gain (loss) on disposition of assets | 11,189 |
| | 8,389 |
| | (1,382 | ) | | 4,197 |
| | 22,393 |
|
Net (loss) income | 13,994 |
| | 9,342 |
| | (6,523 | ) | | 1,472 |
| | 18,285 |
|
Preferred dividends | — |
| | — |
| | — |
| | — |
| | — |
|
Net income (loss) attributable to common shareholders | $ | 13,994 |
| | $ | 9,342 |
| | $ | (6,523 | ) | | $ | 1,472 |
| | $ | 18,285 |
|
| | | | | | | | | |
Net income (loss) per share attributable to common shareholders | $ | 0.33 |
| | $ | 0.22 |
| | $ | (0.15 | ) | | $ | 0.03 |
| | $ | 0.43 |
|
Dividends declared per common share | N/A |
| | N/A |
| | N/A |
| | N/A |
| | N/A |
|
NOTE 15. SUBSEQUENT EVENTS
Shopko Bankruptcy Filing
On January 16, 2019, Shopko, the Company's largest tenant, filed for relief under Chapter 11 of the Bankruptcy Code, and subsequently announced on March 18, 2019 that it intends to liquidate its operations. As a consequence of the Shopko bankruptcy filing, the Company does not expect to receive any additional cash flows from any of the assets leased to Shopko, nor bear further meaningful expenses related to those assets.
The Company also holds a secured loan previously made to Shopko with principal outstanding of $34.4 million at December 31, 2018. The Company has recorded an allowance for loan losses of $33.8 million, based on the current financial disclosure statement filed in connection with the Shopko bankruptcy filing. While the outcome of the Shopko bankruptcy filing is uncertain and there can be no assurances that the Company will recover any amounts due to it under the Shopko B-1 Term Loan, the Company intends to pursue all of its rights and remedies in connection with the bankruptcy proceedings, with the goal of maximizing the receipt of amounts due to the Company under the the Shopko B-1 Term Loan.
On January 16, 2019, the Company's indirect wholly-owned subsidiaries as borrowers under the Shopko CMBS Loan Agreements defaulted on the loans when those entities ceased to make interest payments as a result of Shopko ceasing to pay its rent obligations following its bankruptcy filing. Upon the default, the full balance of principal outstanding under the loans immediately became due and payable accelerated and interest began accruing interest at the default rate of LIBOR plus 12.5% on the $125.0 million portion and LIBOR plus 18% on the $40.0 million mezzanine portion. On March 1, 2019, the Shopko Lenders foreclosed on the equity of the entity that owns the four property-owning subsidiaries. On March 4, 2019, SMTA received a demand notice from the Shopko Lenders seeking repayment of the loans under the Shopko CMBS Loan Agreements pursuant to SMTA’s guaranty of the loans in which the Shopko Lenders allege, among other things, fraud and intentional misrepresentations by the borrowers. SMTA believes the allegations are without merit, will not honor the demand and intends to vigorously defend against any lawsuit initiated by the Shopko Lenders in connection with SMTA’s decision not to comply with the repayment request made under the notice of demand.
On January 16, 2019, in connection with the Shopko bankruptcy filing, the Company announced that its Board of Trustees had elected to accelerate its strategic plan by engaging advisors to explore strategic alternatives focused on maximizing shareholder value. Strategic alternatives to be considered may include, but are not limited to, a sale of the Company or Master Trust 2014, a merger, the sale of other assets, and the maximizing of recoveries in connection with the Shopko bankruptcy. The Company has not set a timetable for completion of the execution of any portion of this strategic plan, and there can be no assurance that the exploration of strategic alternatives will result in any transaction or other alternative.
SPIRIT MTA REIT
Notes to Consolidated Financial Statements
Common Dividend Declared
On March 5, 2019, the Board of Trustees declared a special cash dividend of $0.33 per common share for the first quarter ended March 31, 2019. The dividend will be paid on April 15, 2019 to holders of record as of March 29, 2019.
PART III
Item 9. Changes in and Disagreements with Accountants on Accounting and Financial Disclosure
None.
Item 9A. Controls and Procedures
Evaluation of Disclosure Controls and Procedures
An evaluation was performed under the supervision and with the participation of the Company’s management, including the Chief Executive Officer and Chief Financial Officer, of the effectiveness, as of December 31, 2018, of the design and operation of the Company's disclosure controls and procedures as defined in Rules 13a-15(e) and 15d-15(e) under the Exchange Act. Based on that evaluation, the Chief Executive Officer and Chief Financial Officer concluded that the design and operation of the disclosure controls and procedures were effective as of the end of the period covered by this quarterly report.
Changes in Internal Control over Financial Reporting
There were no changes to the Company's internal control over financial reporting (as defined in Rule 13a-15(e) and 15d-15(e) under the Exchange Act) that occurred during the quarter ended December 31, 2018 that have materially affected, or are reasonably likely to materially affect, the Company's internal control over financial reporting.
This Annual Report on Form 10-K does not include a report of management’s assessment regarding internal control over financial reporting due to a transition period established by rules of the Securities and Exchange Commission for newly public companies.
This Annual Report on Form 10-K does not include an attestation report of our registered public accounting firm related to management’s assessment of internal control over financial reporting as required by Section 404(b) of the Sarbanes-Oxley Act of 2002 because we qualify as an “emerging growth company” under Section 3(a)(80) of the Exchange Act and, as a result, are exempt from the requirements under Section 404(b) of the Sarbanes-Oxley Act of 2002.
INHERENT LIMITATIONS ON EFFECTIVENESS OF CONTROLS
Our management, including our Chief Executive Officer and Chief Financial Officer, believes that our disclosure controls and procedures are designed to provide reasonable assurance of achieving their objectives and are effective at the reasonable assurance level. However, our management does not expect that our disclosure controls and procedures will prevent all errors and all fraud. A control system, no matter how well conceived and operated, can provide only reasonable, not absolute, assurance that the objectives of the control system are met. Further, the design of a control system must reflect the fact that there are resource constraints, and the benefits of controls must be considered relative to their costs. Because of the inherent limitations in all control systems, no evaluation of controls can provide absolute assurance that all control issues and instances of fraud, if any, have been detected. These inherent limitations include the realities that judgments in decision making can be faulty, and that breakdowns can occur because of a simple error or mistake. Additionally, controls can be circumvented by the individual acts of some persons, by collusion of two or more people or by management override of the controls. The design of any system of controls also is based in part upon certain assumptions about the likelihood of future events, and there can be no assurance that any design will succeed in achieving its stated goals under all potential future conditions; over time, controls may become inadequate because of changes in conditions, or the degree of compliance with policies or procedures may deteriorate. Because of the inherent limitations in a cost-effective control system, misstatements due to error or fraud may occur and not be detected.
Item 9B. Other Information
None.
Item 10. Trustees, Executive Officers and Corporate Governance
The information concerning our trustees and executive officers required by Item 10 will be included in the Proxy Statement to be filed relating to our 2019 Annual Meeting of Shareholders and is incorporated herein by reference.
Item 11. Executive Compensation
The information concerning our executive compensation required by Item 11 will be included in the Proxy Statement to be filed relating to our 2019 Annual Meeting of Shareholders and is incorporated herein by reference.
Item 12. Security Ownership of Certain Beneficial Owners and Management and Related Stockholder Matters
The information concerning our security ownership of certain beneficial owners and management and related shareholder matters (including equity compensation plan information) required by Item 12 will be included in the Proxy Statement to be filed relating to our 2019 Annual Meeting of Shareholders and is incorporated herein by reference.
Item 13. Certain Relationships and Related Transactions, and Trustee Independence
The information concerning certain relationships, related transactions and trustee independence required by Item 13 will be included in the Proxy Statement to be filed relating to our 2019 Annual Meeting of Shareholders and is incorporated herein by reference.
Item 14. Principal Accountant Fees and Services
The information concerning our principal accounting fees and services required by Item 14 will be included in the Proxy Statement to be filed relating to our 2019 Annual Meeting of Shareholders and is incorporated herein by reference.
PART IV
Item 15. Exhibits, Financial Statement Schedules
(a)(1) and (2)
Financial Statements and Schedules. The following documents are filed as a part of this report (see Item 8):
Report of Independent Registered Public Accounting Firm.
Consolidated Balance Sheets as of December 31, 2018 and 2017.
Consolidated Statements of Operations and Comprehensive Income (Loss) for the Years Ended December 31, 2018, 2017 and 2016.
Consolidated Statements of Changes in (Deficit) Equity for the Years Ended December 31, 2018, 2017 and 2016.
Consolidated Statements of Cash Flows for the Years Ended December 31, 2018, 2017 and 2016.
Notes to Consolidated Financial Statements.
Schedule III - Real Estate and Accumulated Depreciation as of December 31, 2018.
Schedule IV - Mortgage Loans on Real Estate as of December 31, 2018.
All other schedules are omitted since the required information is not present in amounts sufficient to require submission of the schedule or because the information required is included in the financial statements and the notes thereto.
(b) Exhibits.
|
| |
Exhibit No. | Description |
| |
2.1 | |
| |
3.1 | |
| |
3.2 | |
| |
3.3 | |
| |
4.1 | Second Amended and Restated Master Indenture among Spirit Master Funding, LLC, Spirit Master Funding II, LLC, Spirit Master Funding III, LLC and Citibank, N.A., dated May 20, 2014, filed as Exhibit 4.1 to Amendment No. 1 to the Company's Registration Statement on Form 10-12B on April 13, 2018 and incorporated herein by reference. |
| |
4.2 | Amendment No. 1 to the Second Amended and Restated Master Indenture among Spirit Master Funding, LLC, Spirit Master Funding II, LLC, Spirit Master Funding III, LLC and Citibank, N.A., dated November 26, 2014, filed as Exhibit 4.2 to Amendment No. 1 to the Company's Registration Statement on Form 10-12B on April 13, 2018 and incorporated herein by reference. |
| |
4.3 | Series 2014-1 Indenture Supplement among Spirit Master Funding, LLC, Spirit Master Funding II, LLC, Spirit Master Funding III, LLC and Citibank, N.A., dated May 20, 2014, filed as Exhibit 4.3 to Amendment No. 1 to the Company's Registration Statement on Form 10-12B on April 13, 2018 and incorporated herein by reference. |
| |
|
| |
4.4 | Series 2014-2 Indenture Supplement among Spirit Master Funding, LLC, Spirit Master Funding II, LLC, Spirit Master Funding III, LLC and Citibank, N.A., dated May 20, 2014, filed as Exhibit 4.4 to Amendment No. 1 to the Company's Registration Statement on Form 10-12B on April 13, 2018 and incorporated herein by reference. |
| |
4.5 | Series 2014-3 Indenture Supplement among Spirit Master Funding, LLC, Spirit Master Funding II, LLC, Spirit Master Funding III, LLC and Citibank, N.A., dated May 20, 2014, filed as Exhibit 4.5 to Amendment No. 1 to the Company's Registration Statement on Form 10-12B on April 13, 2018 and incorporated herein by reference. |
| |
4.6 | Series 2014-4 Indenture Supplement among Spirit Master Funding, LLC, Spirit Master Funding II, LLC, Spirit Master Funding III, LLC, Spirit Master Funding VI, LLC, Spirit Master Funding VIII, LLC and Citibank, N.A., dated November 26, 2014, filed as Exhibit 4.6 to Amendment No. 1 to the Company's Registration Statement on Form 10-12B on April 13, 2018 and incorporated herein by reference. |
| |
4.7 | Omnibus Amendment to Certain Series Supplements among Spirit Master Funding, LLC, Spirit Master Funding II, LLC, Spirit Master Funding III, LLC, Spirit Master Funding VI, LLC, Spirit Master Funding VIII, LLC and Citibank, N.A., dated December 14, 2017, filed as Exhibit 4.7 to Amendment No. 1 to the Company's Registration Statement on Form 10-12B on April 13, 2018 and incorporated herein by reference. |
| |
4.8 | Amendment No. 2 to Second Amended and Restated Master Indenture among Spirit Master Funding, LLC, Spirit Master Funding II, LLC, Spirit Master Funding III, LLC, Spirit Master Funding VI, LLC, Spirit Master Funding VIII, LLC and Citibank, N.A., dated December 14, 2017, filed as Exhibit 4.8 to Amendment No. 1 to the Company's Registration Statement on Form 10-12B on April 13, 2018 and incorporated herein by reference. |
| |
4.9 | Amendment No. 3 to Second Amended and Restated Master Indenture among Spirit Master Funding, LLC, Spirit Master Funding II, LLC, Spirit Master Funding III, LLC, Spirit Master Funding VI, LLC, Spirit Master Funding VIII, LLC and Citibank, N.A., dated January 29, 2018, filed as Exhibit 4.9 to Amendment No. 1 to the Company's Registration Statement on Form 10-12B on April 13, 2018 and incorporated herein by reference. |
| |
4.10 | Series 2017-1 Indenture Supplement among Spirit Master Funding, LLC, Spirit Master Funding II, LLC, Spirit Master Funding III, LLC, Spirit Master Funding VI, LLC, Spirit Master Funding VIII, LLC and Citibank, N.A., dated December 14, 2017, filed as Exhibit 4.10 to Amendment No. 1 to the Company's Registration Statement on Form 10-12B on April 13, 2018 and incorporated herein by reference. |
| |
4.11 | Amendment No. 1 to Series 2017-1 Indenture Supplement among Spirit Master Funding, LLC, Spirit Master Funding II, LLC, Spirit Master Funding III, LLC, Spirit Master Funding VI, LLC, Spirit Master Funding VIII, LLC and Citibank, N.A., dated January 30, 2018, filed as Exhibit 4.11 to Amendment No. 1 to the Company's Registration Statement on Form 10-12B on April 13, 2018 and incorporated herein by reference. |
| |
10.1 | |
| |
10.2 | |
| |
10.3 | |
| |
10.4 | |
| |
10.5 | |
| |
10.6+ | |
| |
10.7+ | |
|
| |
| |
10.8 | |
| |
10.9 | Second Amended and Restated Property Management and Servicing Agreement by and among Spirit Realty, L.P., Spirit Master Funding, LLC, Spirit Master Funding II, LLC, Spirit Master Funding III, LLC and Midland Loan Services, a division of PNC Bank, National Association, dated May 20, 2014, filed as Exhibit 10.6 to Amendment No. 1 to the Company's Registration Statement on Form 10-12B on April 13, 2018 and incorporated herein by reference. |
| |
10.10 | Amendment No. 1 to the Second Amended and Restated Property Management and Servicing Agreement by and among Spirit Realty, L.P., Spirit Master Funding, LLC, Spirit Master Funding II, LLC, Spirit Master Funding III, LLC and Midland Loan Services, a division of PNC Bank, National Association, dated November 26, 2014, filed as Exhibit 10.7 to Amendment No.1 to the Company's Registration Statement on Form 10-12B on April 13, 2018 and incorporated herein by reference. |
| |
10.11 | Amendment No. 2 to the Second Amended and Restated Property Management and Servicing Agreement by and among Spirit Realty, L.P., Spirit Master Funding, LLC, Spirit Master Funding II, LLC, Spirit Master Funding III, LLC, Spirit Master Funding VI, LLC, Spirit Master Funding VIII, LLC and Midland Loan Services, a division of PNC Bank, National Association, dated December 14, 2017, filed as Exhibit 10.8 to Amendment No. 1 to the Company's Registration Statement on Form 10-12B on April 13, 2018 and incorporated herein by reference. |
| |
10.12* | Amendment No. 3 to the Second Amended and Restated Property Management and Servicing Agreement by and among Spirit Realty, L.P., Spirit Master Funding, LLC, Spirit Master Funding II, LLC, Spirit Master funding III, LLC, Spirit Master Funding VI, LLC, Spirit Master Funding VIII, LLC and Midland Loan Services, a division of PNC Bank, National Association, dated November 1, 2018. |
| |
10.13* | Class A Note Purchase Agreement between Spirit Master Funding, LLC, Spirit Master Funding II, LLC, Spirit Master Funding III, LLC, Spirit Master Funding VI, LLC, Spirit Master Funding VIII, LLC, Spirit Realty, L.P., Certain Conduit Investors, Certain Financial Institutions, Certain Funding Agents and Barclays Bank PLC, dated November 1, 2018. |
| |
10.14* | Fee Letter between Spirit Master Funding, LLC, Spirit Master Funding II, LLC, Spirit Master Funding III, LLC, Spirit Master Funding VI, LLC, Spirit Master Funding VIII, LLC, Spirit Realty, L.P., Certain Conduit Investors, Certain Funding Agents, Committed Note Purchasers and Barclays Bank PLC, dated November 1, 2018. |
| |
10.15 | |
| |
10.16 | |
| |
21.1* | |
| |
23.1* | |
| |
31.1* | |
| |
32.1* | |
| |
101.INS | XBRL Instance Document |
| |
101.SCH | XBRL Taxonomy Extension Schema |
| |
101.CAL | XBRL Taxonomy Extension Calculation Linkbase |
| |
101.DEF | XBRL Taxonomy Extension Definition Linkbase |
| |
101.LAB | XBRL Taxonomy Extension Label Linkbase |
| |
101.PRE | XBRL Taxonomy Extension Presentation Linkbase |
* Filed herewith.
+ Indicates a management or non-employee trustee compensatory plan.
|
| | | | | | | | | | | | | | | | | | | | | | | | | | | | | | | | | |
10 Box | Fort Smith, AR | | (a) | | 837 |
| | 1,831 |
| | — |
| | — |
| | 837 |
| | 1,831 |
| | 2,668 |
| | (500 | ) | | 1994 | | 04/30/14 | | 3 to 20 Years
|
10 Box | Rogers, AR | | (a) | | 1,028 |
| | 1,685 |
| | — |
| | — |
| | 1,028 |
| | 1,685 |
| | 2,713 |
| | (445 | ) | | 1994 | | 03/31/14 | | 6 to 20 Years |
ABRA | Suwanee, GA | | (a) | | 480 |
| | 1,350 |
| | — |
| | — |
| | 480 |
| | 1,350 |
| | 1,830 |
| | (296 | ) | | 1986 | | 10/21/13 | | 13 to 30 Years |
Academy Sports + Outdoors | Greenville, TX | | (a) | | 2,229 |
| | 5,182 |
| | 7 |
| | 114 |
| | 2,236 |
| | 5,296 |
| | 7,532 |
| | (450 | ) | | 2016 | | 12/07/16 | | 14 to 40 Years |
Academy Sports + Outdoors | Katy, TX | | (b) | | 13,144 |
| | 96,194 |
| | — |
| | — |
| | 13,144 |
| | 96,194 |
| | 109,338 |
| | (17,438 | ) | | 1976 | | 07/17/13 | | 8 to 34 Years |
Adult & Pediatric Orthopedics | Vernon Hills, IL | | (a) | | 992 |
| | 5,020 |
| | — |
| | — |
| | 992 |
| | 5,020 |
| | 6,012 |
| | (889 | ) | | 1991 | | 03/31/14 | | 15 to 30 Years |
Advance Auto Parts | Greenfield, IN | | (a) | | 458 |
| | 996 |
| | — |
| | — |
| | 458 |
| | 996 |
| | 1,454 |
| | (179 | ) | | 2003 | | 07/17/13 | | 7 to 47 Years |
Advance Auto Parts | Trenton, OH | | (a) | | 324 |
| | 842 |
| | — |
| | — |
| | 324 |
| | 842 |
| | 1,166 |
| | (165 | ) | | 2003 | | 07/17/13 | | 7 to 47 Years |
Affordable Care, Inc. | Lincoln, NE | | (a) | | 711 |
| | 825 |
| | 14 |
| | 17 |
| | 725 |
| | 842 |
| | 1,567 |
| | (128 | ) | | 2010 | | 08/07/15 | | 8 to 40 Years |
Affordable Care, Inc. | Bellevue, NE | | (a) | | 560 |
| | 446 |
| | 5 |
| | 4 |
| | 565 |
| | 450 |
| | 1,015 |
| | (85 | ) | | 2008 | | 08/07/15 | | 5 to 40 Years |
Aggregate Industries | Annapolis Junction, MD | | (a) | | 2,245 |
| | 1,105 |
| | (1,535 | ) | | (547 | ) | | 710 |
| | 558 |
| | 1,268 |
| | (277 | ) | | 1930 | | 09/29/06 | | 15 to 30 Years |
AMC Theatres | South Bend, IN | | (a) | | 4,352 |
| | 9,411 |
| | — |
| | 21 |
| | 4,352 |
| | 9,432 |
| | 13,784 |
| | (1,649 | ) | | 1997 | | 01/04/16 | | 28 to 28 Years |
AMC Theatres | Phoenix, AZ | | (a) | | 2,652 |
| | 11,495 |
| | — |
| | 205 |
| | 2,652 |
| | 11,700 |
| | 14,352 |
| | (3,514 | ) | | 1997 | | 07/01/05 | | 12 to 40 Years |
SPIRIT MTA REIT
Schedule III Real Estate and
Accumulated Depreciation
(Amounts in thousands)
|
| | | | | | | | | | | | | | | | | | | | | | | | | |
| | | | | Initial Cost to Company | | Cost Capitalized Subsequent to Acquisition including impairment | | Gross Amount at December 31, 2018 | | | | | | | | |
Concept | City, State | | Encumbrances (d) | | Land and Improvements | | Buildings and Improvements | | Land and Improvements | | Buildings and Improvements | | Land and Improvements | | Buildings and Improvements | | Total | | Final Accumulated Depreciation | | Date of Construction | | Date Acquired | | Life in which depreciation in latest Statement of Operations is computed |
|
| | | | | | | | | | | | | | | | | | | | | | | | | | | | | | | | | |
AMC Theatres | Raleigh, NC | | (a) | | 3,636 |
| | 8,833 |
| | — |
| | — |
| | 3,636 |
| | 8,833 |
| | 12,469 |
| | (4,156 | ) | | 1988 | | 06/10/10 | | 9 to 27 Years |
AMC Theatres | Chubbuck, ID | | (a) | | 1,845 |
| | 2,691 |
| | — |
| | — |
| | 1,845 |
| | 2,691 |
| | 4,536 |
| | (466 | ) | | 2004 | | 12/23/14 | | 10 to 30 Years |
AMC Theatres | Colorado Springs, CO | | (a) | | 1,892 |
| | 1,732 |
| | — |
| | — |
| | 1,892 |
| | 1,732 |
| | 3,624 |
| | (1,135 | ) | | 1995 | | 09/30/05 | | 14 to 30 Years |
AMC Theatres | Longview, TX | | (a) | | 1,432 |
| | 2,946 |
| | — |
| | — |
| | 1,432 |
| | 2,946 |
| | 4,378 |
| | (1,513 | ) | | 1995 | | 09/30/05 | | 15 to 30 Years |
AMC Theatres | Surprise, AZ | | (a) | | 2,918 |
| | 7,122 |
| | 5 |
| | 11 |
| | 2,923 |
| | 7,133 |
| | 10,056 |
| | (829 | ) | | 2008 | | 11/10/15 | | 12 to 40 Years |
AMC Theatres | Fort Wayne, IN | | (a) | | 2,696 |
| | 9,849 |
| | 682 |
| | — |
| | 3,378 |
| | 9,849 |
| | 13,227 |
| | (3,876 | ) | | 2005 | | 11/30/05 | | 15 to 40 Years |
AMC Theatres | Wilmington, NC | | (a) | | 1,552 |
| | 2,934 |
| | — |
| | — |
| | 1,552 |
| | 2,934 |
| | 4,486 |
| | (1,453 | ) | | 1997 | | 09/30/05 | | 15 to 30 Years |
AMC Theatres | Winston-Salem, NC | | (a) | | 1,567 |
| | 2,140 |
| | — |
| | — |
| | 1,567 |
| | 2,140 |
| | 3,707 |
| | (1,297 | ) | | 1993 | | 10/28/05 | | 13 to 30 Years |
AMC Theatres | Durham, NC | | (a) | | 1,630 |
| | 2,685 |
| | — |
| | — |
| | 1,630 |
| | 2,685 |
| | 4,315 |
| | (1,618 | ) | | 1994 | | 09/30/05 | | 13 to 30 Years |
AMC Theatres | Columbia, SC | | (a) | | 2,115 |
| | 2,091 |
| | — |
| | — |
| | 2,115 |
| | 2,091 |
| | 4,206 |
| | (1,045 | ) | | 1996 | | 09/30/05 | | 15 to 30 Years |
AMC Theatres | Greensboro, NC | | (a) | | 2,359 |
| | 2,431 |
| | — |
| | — |
| | 2,359 |
| | 2,431 |
| | 4,790 |
| | (1,260 | ) | | 1996 | | 09/30/05 | | 15 to 30 Years |
AMC Theatres | Cedar Rapids, IA | | (a) | | 2,521 |
| | 5,461 |
| | — |
| | — |
| | 2,521 |
| | 5,461 |
| | 7,982 |
| | (2,178 | ) | | 1998 | | 07/01/05 | | 15 to 40 Years |
American Lubefast | Waycross, GA | | (a) | | 380 |
| | 142 |
| | — |
| | — |
| | 380 |
| | 142 |
| | 522 |
| | (67 | ) | | 1998 | | 12/10/13 | | 15 to 30 Years |
SPIRIT MTA REIT
Schedule III Real Estate and
Accumulated Depreciation
(Amounts in thousands)
|
| | | | | | | | | | | | | | | | | | | | | | | | | |
| | | | | Initial Cost to Company | | Cost Capitalized Subsequent to Acquisition including impairment | | Gross Amount at December 31, 2018 | | | | | | | | |
Concept | City, State | | Encumbrances (d) | | Land and Improvements | | Buildings and Improvements | | Land and Improvements | | Buildings and Improvements | | Land and Improvements | | Buildings and Improvements | | Total | | Final Accumulated Depreciation | | Date of Construction | | Date Acquired | | Life in which depreciation in latest Statement of Operations is computed |
|
| | | | | | | | | | | | | | | | | | | | | | | | | | | | | | | | | |
American Lubefast | Wetumpka, AL | | (a) | | 185 |
| | 332 |
| | — |
| | — |
| | 185 |
| | 332 |
| | 517 |
| | (62 | ) | | 1995 | | 06/24/14 | | 12 to 30 Years |
America's Auto Auction | Irving, TX | | (a) | | 7,348 |
| | 970 |
| | — |
| | — |
| | 7,348 |
| | 970 |
| | 8,318 |
| | (2,754 | ) | | 1960 | | 09/01/09 | | 12 to 27 Years |
America's Auto Auction | Irving, TX | | (a) | | 931 |
| | 268 |
| | — |
| | — |
| | 931 |
| | 268 |
| | 1,199 |
| | (208 | ) | | 1965 | | 09/01/09 | | 12 to 17 Years |
America's Auto Auction | Jacksonville, FL | | (a) | | 3,170 |
| | 938 |
| | — |
| | — |
| | 3,170 |
| | 938 |
| | 4,108 |
| | (712 | ) | | 1989 | | 12/28/05 | | 15 to 30 Years |
America's Auto Auction | Tulsa, OK | | (a) | | 1,225 |
| | 373 |
| | — |
| | — |
| | 1,225 |
| | 373 |
| | 1,598 |
| | (816 | ) | | 1999 | | 12/28/05 | | 15 to 20 Years |
America's Auto Auction | Conroe, TX | | (a) | | 4,338 |
| | 448 |
| | 955 |
| | 145 |
| | 5,293 |
| | 593 |
| | 5,886 |
| | (2,029 | ) | | 2005 | | 09/01/09 | | 12 to 47 Years |
America's Auto Auction | Greenville, SC | | (a) | | 2,561 |
| | 1,526 |
| | — |
| | — |
| | 2,561 |
| | 1,526 |
| | 4,087 |
| | (1,581 | ) | | 1999 | | 12/28/05 | | 15 to 30 Years |
America's Service Station | Dacula, GA | | (a) | | 1,067 |
| | 976 |
| | — |
| | — |
| | 1,067 |
| | 976 |
| | 2,043 |
| | (164 | ) | | 2000 | | 03/28/14 | | 15 to 40 Years |
America's Service Station | Farragut, TN | | (a) | | 986 |
| | 1,148 |
| | — |
| | — |
| | 986 |
| | 1,148 |
| | 2,134 |
| | (210 | ) | | 2011 | | 03/28/14 | | 15 to 40 Years |
Anixter | Fort Myers, FL | | (a) | | 641 |
| | 1,069 |
| | — |
| | — |
| | 641 |
| | 1,069 |
| | 1,710 |
| | (661 | ) | | 1999 | | 07/01/05 | | 14 to 30 Years |
Anixter | Conroe, TX | | (a) | | 492 |
| | 723 |
| | — |
| | — |
| | 492 |
| | 723 |
| | 1,215 |
| | (398 | ) | | 1999 | | 07/01/05 | | 14 to 30 Years |
Anixter | Mattoon, IL | | (a) | | 233 |
| | 263 |
| | — |
| | — |
| | 233 |
| | 263 |
| | 496 |
| | (245 | ) | | 1984 | | 05/01/05 | | 15 to 20 Years |
Applebee's | Joliet, IL | | (a) | | 1,994 |
| | 1,207 |
| | — |
| | — |
| | 1,994 |
| | 1,207 |
| | 3,201 |
| | (761 | ) | | 1996 | | 12/29/06 | | 15 to 30 Years |
SPIRIT MTA REIT
Schedule III Real Estate and
Accumulated Depreciation
(Amounts in thousands)
|
| | | | | | | | | | | | | | | | | | | | | | | | | |
| | | | | Initial Cost to Company | | Cost Capitalized Subsequent to Acquisition including impairment | | Gross Amount at December 31, 2018 | | | | | | | | |
Concept | City, State | | Encumbrances (d) | | Land and Improvements | | Buildings and Improvements | | Land and Improvements | | Buildings and Improvements | | Land and Improvements | | Buildings and Improvements | | Total | | Final Accumulated Depreciation | | Date of Construction | | Date Acquired | | Life in which depreciation in latest Statement of Operations is computed |
|
| | | | | | | | | | | | | | | | | | | | | | | | | | | | | | | | | |
Applebee's | Chicago, IL | | (a) | | 1,675 |
| | 1,112 |
| | — |
| | — |
| | 1,675 |
| | 1,112 |
| | 2,787 |
| | (570 | ) | | 1999 | | 12/29/06 | | 15 to 30 Years |
Arby's | Sun City, AZ | | (a) | | 771 |
| | 372 |
| | — |
| | 250 |
| | 771 |
| | 622 |
| | 1,393 |
| | (333 | ) | | 1986 | | 12/29/06 | | 10 to 20 Years |
Arby's | Madisonville, KY | | (a) | | 1,198 |
| | 819 |
| | (95 | ) | | — |
| | 1,103 |
| | 819 |
| | 1,922 |
| | (453 | ) | | 1990 | | 09/24/04 | | 15 to 30 Years |
Arby's | Brunswick, GA | | (a) | | 774 |
| | 614 |
| | — |
| | — |
| | 774 |
| | 614 |
| | 1,388 |
| | (449 | ) | | 1999 | | 09/24/04 | | 15 to 20 Years |
Arby's | Tooele, UT | | (a) | | 552 |
| | 624 |
| | — |
| | — |
| | 552 |
| | 624 |
| | 1,176 |
| | (521 | ) | | 1988 | | 09/24/04 | | 15 to 20 Years |
Arby's | Jacksonville, FL | | (a) | | 480 |
| | 631 |
| | — |
| | — |
| | 480 |
| | 631 |
| | 1,111 |
| | (357 | ) | | 1998 | | 09/24/04 | | 15 to 30 Years |
Arby's | McDonough, GA | | (a) | | 938 |
| | 697 |
| | — |
| | — |
| | 938 |
| | 697 |
| | 1,635 |
| | (430 | ) | | 1985 | | 09/24/04 | | 15 to 30 Years |
Arby's | Cumming, GA | | (a) | | 967 |
| | 844 |
| | — |
| | — |
| | 967 |
| | 844 |
| | 1,811 |
| | (495 | ) | | 1986 | | 09/24/04 | | 15 to 30 Years |
Arby's | Indianapolis, IN | | (a) | | 460 |
| | 587 |
| | — |
| | — |
| | 460 |
| | 587 |
| | 1,047 |
| | (305 | ) | | 1998 | | 09/24/04 | | 15 to 30 Years |
Arby's | Crawfordsville, IN | | (a) | | 557 |
| | 624 |
| | — |
| | — |
| | 557 |
| | 624 |
| | 1,181 |
| | (355 | ) | | 1998 | | 09/23/05 | | 15 to 30 Years |
Arby's | Mooresville, IN | | (a) | | 560 |
| | 549 |
| | — |
| | — |
| | 560 |
| | 549 |
| | 1,109 |
| | (450 | ) | | 1998 | | 09/23/05 | | 15 to 20 Years |
Arby's | Nappanee, IN | | (a) | | 301 |
| | 413 |
| | — |
| | — |
| | 301 |
| | 413 |
| | 714 |
| | (342 | ) | | 2005 | | 12/21/07 | | 15 to 20 Years |
Arby's | North Canton, OH | | (a) | | 484 |
| | 497 |
| | (14 | ) | | — |
| | 470 |
| | 497 |
| | 967 |
| | (371 | ) | | 1989 | | 12/29/06 | | 15 to 20 Years |
SPIRIT MTA REIT
Schedule III Real Estate and
Accumulated Depreciation
(Amounts in thousands)
|
| | | | | | | | | | | | | | | | | | | | | | | | | |
| | | | | Initial Cost to Company | | Cost Capitalized Subsequent to Acquisition including impairment | | Gross Amount at December 31, 2018 | | | | | | | | |
Concept | City, State | | Encumbrances (d) | | Land and Improvements | | Buildings and Improvements | | Land and Improvements | | Buildings and Improvements | | Land and Improvements | | Buildings and Improvements | | Total | | Final Accumulated Depreciation | | Date of Construction | | Date Acquired | | Life in which depreciation in latest Statement of Operations is computed |
|
| | | | | | | | | | | | | | | | | | | | | | | | | | | | | | | | | |
Arby's | Jacksonville, FL | | (a) | | 872 |
| | 509 |
| | — |
| | — |
| | 872 |
| | 509 |
| | 1,381 |
| | (402 | ) | | 1984 | | 09/24/04 | | 15 to 20 Years |
|
| | | | | | | | | | | | | | | | | | | | | | | | | | | | | | | | | |
Arby's | Lexington, KY | | (a) | | 713 |
| | 451 |
| | — |
| | — |
| | 713 |
| | 451 |
| | 1,164 |
| | (536 | ) | | 1976 | | 01/26/05 | | 10 to 15 Years |
Arby's | Jacksonville, FL | | (a) | | 487 |
| | 871 |
| | — |
| | — |
| | 487 |
| | 871 |
| | 1,358 |
| | (557 | ) | | 1985 | | 12/30/04 | | 15 to 20 Years |
Arby's | Orlando, FL | | (a) | | 642 |
| | 178 |
| | — |
| | — |
| | 642 |
| | 178 |
| | 820 |
| | (262 | ) | | 1967 | | 12/30/04 | | 10 to 15 Years |
Arby's | Winter Springs, FL | | (a) | | 523 |
| | 446 |
| | — |
| | — |
| | 523 |
| | 446 |
| | 969 |
| | (378 | ) | | 1988 | | 12/30/04 | | 15 to 20 Years |
Arby's | Lexington, KY | | (a) | | 636 |
| | 362 |
| | — |
| | — |
| | 636 |
| | 362 |
| | 998 |
| | (428 | ) | | 1978 | | 12/30/04 | | 10 to 15 Years |
Arby's | Eustis, FL | | (a) | | 451 |
| | 377 |
| | — |
| | — |
| | 451 |
| | 377 |
| | 828 |
| | (446 | ) | | 1969 | | 12/30/04 | | 10 to 15 Years |
Arby's | Statesboro, GA | | (a) | | 779 |
| | 777 |
| | — |
| | — |
| | 779 |
| | 777 |
| | 1,556 |
| | (497 | ) | | 1985 | | 09/24/04 | | 15 to 20 Years |
Arby's | Moncks Corner, SC | | (a) | | 573 |
| | 466 |
| | — |
| | — |
| | 573 |
| | 466 |
| | 1,039 |
| | (403 | ) | | 1998 | | 09/24/04 | | 15 to 20 Years |
Arby's | Martinsburg, WV | | (a) | | 887 |
| | 992 |
| | — |
| | — |
| | 887 |
| | 992 |
| | 1,879 |
| | (536 | ) | | 1999 | | 12/29/05 | | 15 to 30 Years |
Arby's | Mount Pleasant, MI | | (a) | | 485 |
| | 642 |
| | — |
| | — |
| | 485 |
| | 642 |
| | 1,127 |
| | (339 | ) | | 1997 | | 12/29/05 | | 15 to 30 Years |
Arby's | Sterling Heights, MI | | (a) | | 866 |
| | 960 |
| | — |
| | — |
| | 866 |
| | 960 |
| | 1,826 |
| | (492 | ) | | 2000 | | 12/29/05 | | 15 to 30 Years |
Arby's | Rock Hill, SC | | (a) | | 373 |
| | 722 |
| | — |
| | — |
| | 373 |
| | 722 |
| | 1,095 |
| | (502 | ) | | 1978 | | 12/29/05 | | 15 to 20 Years |
SPIRIT MTA REIT
Schedule III Real Estate and
Accumulated Depreciation
(Amounts in thousands)
|
| | | | | | | | | | | | | | | | | | | | | | | | | |
| | | | | Initial Cost to Company | | Cost Capitalized Subsequent to Acquisition including impairment | | Gross Amount at December 31, 2018 | | | | | | | | |
Concept | City, State | | Encumbrances (d) | | Land and Improvements | | Buildings and Improvements | | Land and Improvements | | Buildings and Improvements | | Land and Improvements | | Buildings and Improvements | | Total | | Final Accumulated Depreciation | | Date of Construction | | Date Acquired | | Life in which depreciation in latest Statement of Operations is computed |
|
| | | | | | | | | | | | | | | | | | | | | | | | | | | | | | | | | |
Arby's | Amarillo, TX | | (a) | | 538 |
| | 615 |
| | 1 |
| | 1 |
| | 539 |
| | 616 |
| | 1,155 |
| | (98 | ) | | 1985 | | 12/29/15 | | 14 to 30 Years |
Ashley Furniture | Abilene, TX | | (a) | | 1,316 |
| | 2,649 |
| | — |
| | — |
| | 1,316 |
| | 2,649 |
| | 3,965 |
| | (1,117 | ) | | 2000 | | 05/19/05 | | 15 to 40 Years |
Ashley Furniture | El Paso, TX | | (a) | | 1,536 |
| | 3,852 |
| | — |
| | — |
| | 1,536 |
| | 3,852 |
| | 5,388 |
| | (1,882 | ) | | 1973 | | 07/01/05 | | 14 to 30 Years |
At Home | Lubbock, TX | | (a) | | 4,585 |
| | 4,550 |
| | 11 |
| | 93 |
| | 4,596 |
| | 4,643 |
| | 9,239 |
| | (792 | ) | | 1985 | | 11/15/16 | | 6 to 20 Years |
Austin's Park n' Pizza | Pflugerville, TX | | (a) | | 6,182 |
| | 1,349 |
| | — |
| | — |
| | 6,182 |
| | 1,349 |
| | 7,531 |
| | (475 | ) | | 2003 | | 08/29/14 | | 15 to 30 Years |
Axels | Chanhassen, MN | | (a) | | 1,439 |
| | 784 |
| | — |
| | — |
| | 1,439 |
| | 784 |
| | 2,223 |
| | (244 | ) | | 1953 | | 05/22/14 | | 15 to 30 Years |
Axels | Mendota, MN | | (a) | | 536 |
| | 963 |
| | — |
| | — |
| | 536 |
| | 963 |
| | 1,499 |
| | (186 | ) | | 1995 | | 05/22/14 | | 15 to 30 Years |
B&B Theatres | Kansas City, MO | | (a) | | 2,543 |
| | 7,943 |
| | — |
| | — |
| | 2,543 |
| | 7,943 |
| | 10,486 |
| | (2,632 | ) | | 2003 | | 07/01/05 | | 14 to 50 Years |
B&B Theatres | Lees Summit, MO | | (a) | | 3,517 |
| | 9,735 |
| | — |
| | — |
| | 3,517 |
| | 9,735 |
| | 13,252 |
| | (3,865 | ) | | 1999 | | 07/01/05 | | 14 to 40 Years |
B&B Theatres | Bixby, OK | | (a) | | 5,585 |
| | 10,101 |
| | — |
| | — |
| | 5,585 |
| | 10,101 |
| | 15,686 |
| | (5,310 | ) | | 1998 | | 07/01/05 | | 14 to 30 Years |
B&B Theatres | Overland Park, KS | | (a) | | 4,935 |
| | 12,281 |
| | — |
| | — |
| | 4,935 |
| | 12,281 |
| | 17,216 |
| | (3,545 | ) | | 2004 | | 08/01/09 | | 10 to 57 Years |
Bagger Dave's Burger Tavern | Berkley, MI | | (a) | | 390 |
| | 540 |
| | — |
| | — |
| | 390 |
| | 540 |
| | 930 |
| | (111 | ) | | 1927 | | 10/31/14 | | 14 to 30 Years |
Bagger Dave's Burger Tavern | Grand Rapids, MI | | (a) | | 986 |
| | 524 |
| | — |
| | — |
| | 986 |
| | 524 |
| | 1,510 |
| | (141 | ) | | 1985 | | 10/31/14 | | 14 to 30 Years |
SPIRIT MTA REIT
Schedule III Real Estate and
Accumulated Depreciation
(Amounts in thousands)
|
| | | | | | | | | | | | | | | | | | | | | | | | | |
| | | | | Initial Cost to Company | | Cost Capitalized Subsequent to Acquisition including impairment | | Gross Amount at December 31, 2018 | | | | | | | | |
Concept | City, State | | Encumbrances (d) | | Land and Improvements | | Buildings and Improvements | | Land and Improvements | | Buildings and Improvements | | Land and Improvements | | Buildings and Improvements | | Total | | Final Accumulated Depreciation | | Date of Construction | | Date Acquired | | Life in which depreciation in latest Statement of Operations is computed |
|
| | | | | | | | | | | | | | | | | | | | | | | | | | | | | | | | | |
Baptist Emergency Hospital | Schertz, TX | | (a) | | 2,596 |
| | 9,944 |
| | — |
| | — |
| | 2,596 |
| | 9,944 |
| | 12,540 |
| | (1,364 | ) | | 2013 | | 05/16/14 | | 13 to 40 Years |
Big Al's | Vancouver, WA | | (a) | | 2,077 |
| | 9,395 |
| | — |
| | — |
| | 2,077 |
| | 9,395 |
| | 11,472 |
| | (1,193 | ) | | 2006 | | 06/30/14 | | 15 to 40 Years |
Big Al's | Beaverton, OR | | (a) | | 5,608 |
| | 8,733 |
| | — |
| | — |
| | 5,608 |
| | 8,733 |
| | 14,341 |
| | (1,267 | ) | | 2010 | | 06/30/14 | | 15 to 40 Years |
Big Sandy Furniture | South Point, OH | | (a) | | 848 |
| | 2,948 |
| | — |
| | — |
| | 848 |
| | 2,948 |
| | 3,796 |
| | (1,323 | ) | | 1990 | | 08/27/09 | | 12 to 27 Years |
Big Sandy Furniture | Parkersburg, WV | | (a) | | 1,800 |
| | 3,183 |
| | — |
| | — |
| | 1,800 |
| | 3,183 |
| | 4,983 |
| | (1,622 | ) | | 1976 | | 08/27/09 | | 12 to 27 Years |
Big Sandy Furniture | Ashland, KY | | (a) | | 775 |
| | 2,037 |
| | — |
| | — |
| | 775 |
| | 2,037 |
| | 2,812 |
| | (933 | ) | | 1990 | | 08/27/09 | | 12 to 27 Years |
Big Sandy Furniture | Hurricane, WV | | (a) | | 727 |
| | 3,005 |
| | — |
| | — |
| | 727 |
| | 3,005 |
| | 3,732 |
| | (1,318 | ) | | 1998 | | 08/27/09 | | 12 to 27 Years |
Big Sandy Furniture | Chillicothe, OH | | (a) | | 499 |
| | 2,296 |
| | — |
| | — |
| | 499 |
| | 2,296 |
| | 2,795 |
| | (1,044 | ) | | 1995 | | 08/27/09 | | 12 to 27 Years |
Big Sandy Furniture | Ashland, KY | | (a) | | 629 |
| | 754 |
| | — |
| | — |
| | 629 |
| | 754 |
| | 1,383 |
| | (399 | ) | | 1993 | | 08/27/09 | | 12 to 27 Years |
Big Sandy Furniture | Portsmouth, OH | | (a) | | 561 |
| | 1,563 |
| | — |
| | — |
| | 561 |
| | 1,563 |
| | 2,124 |
| | (746 | ) | | 1988 | | 08/27/09 | | 12 to 27 Years |
Black Angus Steakhouse | Glendale, AZ | | (a) | | 1,480 |
| | 1,329 |
| | — |
| | — |
| | 1,480 |
| | 1,329 |
| | 2,809 |
| | (641 | ) | | 1996 | | 06/25/04 | | 15 to 30 Years |
Blue Rhino | Tavares, FL | | (a) | | 1,075 |
| | 5,098 |
| | — |
| | — |
| | 1,075 |
| | 5,098 |
| | 6,173 |
| | (1,982 | ) | | 2004 | | 07/01/05 | | 14 to 40 Years |
Blue Rhino | Riverside, CA | | (a) | | 1,203 |
| | 6,254 |
| | — |
| | — |
| | 1,203 |
| | 6,254 |
| | 7,457 |
| | (2,065 | ) | | 2004 | | 07/01/05 | | 14 to 40 Years |
SPIRIT MTA REIT
Schedule III Real Estate and
Accumulated Depreciation
(Amounts in thousands)
|
| | | | | | | | | | | | | | | | | | | | | | | | | |
| | | | | Initial Cost to Company | | Cost Capitalized Subsequent to Acquisition including impairment | | Gross Amount at December 31, 2018 | | | | | | | | |
Concept | City, State | | Encumbrances (d) | | Land and Improvements | | Buildings and Improvements | | Land and Improvements | | Buildings and Improvements | | Land and Improvements | | Buildings and Improvements | | Total | | Final Accumulated Depreciation | | Date of Construction | | Date Acquired | | Life in which depreciation in latest Statement of Operations is computed |
|
| | | | | | | | | | | | | | | | | | | | | | | | | | | | | | | | | |
Bojangles' | Hickory, NC | | (a) | | 1,105 |
| | 851 |
| | — |
| | — |
| | 1,105 |
| | 851 |
| | 1,956 |
| | (787 | ) | | 1995 | | 12/29/06 | | 13 to 28 Years |
Bondcote | Dublin, VA | | (a) | | 491 |
| | 1,401 |
| | — |
| | — |
| | 491 |
| | 1,401 |
| | 1,892 |
| | (1,018 | ) | | 1985 | | 12/11/06 | | 15 to 20 Years |
Bondcote | Pulaski, VA | | (a) | | 333 |
| | 1,536 |
| | — |
| | — |
| | 333 |
| | 1,536 |
| | 1,869 |
| | (1,053 | ) | | 1967 | | 12/11/06 | | 15 to 20 Years |
Bonfire | Woodbury, MN | | (a) | | 3,165 |
| | 1,707 |
| | — |
| | — |
| | 3,165 |
| | 1,707 |
| | 4,872 |
| | (428 | ) | | 1995 | | 05/22/14 | | 15 to 30 Years |
Bonfire | Eagen, MN | | (a) | | 724 |
| | 1,230 |
| | — |
| | — |
| | 724 |
| | 1,230 |
| | 1,954 |
| | (240 | ) | | 1996 | | 05/22/14 | | 15 to 30 Years |
Boozman-Hof | Rogers, AR | | (a) | | 2,014 |
| | 2,313 |
| | — |
| | — |
| | 2,014 |
| | 2,313 |
| | 4,327 |
| | (578 | ) | | 1988 | | 11/14/13 | | 13 to 30 Years |
Boscovs | Voorhees, NJ | | (a) | | 2,027 |
| | 6,776 |
| | — |
| | — |
| | 2,027 |
| | 6,776 |
| | 8,803 |
| | (2,834 | ) | | 1970 | | 07/17/13 | | 5 to 20 Years |
Bricktown Brewery | Oklahoma City, OK | | (a) | | 479 |
| | 1,877 |
| | — |
| | 177 |
| | 479 |
| | 2,054 |
| | 2,533 |
| | (492 | ) | | 1904 | | 12/02/13 | | 16 to 20 Years |
Bricktown Brewery | Shawnee, OK | | (a) | | 621 |
| | 1,399 |
| | — |
| | — |
| | 621 |
| | 1,399 |
| | 2,020 |
| | (282 | ) | | 1984 | | 07/29/05 | | 15 to 30 Years |
Bridgestone Tire | Atlanta, GA | | (a) | | 1,830 |
| | 363 |
| | — |
| | — |
| | 1,830 |
| | 363 |
| | 2,193 |
| | (177 | ) | | 1998 | | 07/17/13 | | 5 to 24 Years |
Brookshire Brothers | Alto, TX | | (a) | | 204 |
| | 464 |
| | — |
| | — |
| | 204 |
| | 464 |
| | 668 |
| | (150 | ) | | 1996 | | 03/31/14 | | 7 to 20 Years |
Brookshire Brothers | Buffalo, TX | | (a) | | 522 |
| | 987 |
| | — |
| | — |
| | 522 |
| | 987 |
| | 1,509 |
| | (224 | ) | | 1990 | | 03/31/14 | | 7 to 30 Years |
Brookshire Brothers | Groveton, TX | | (a) | | 264 |
| | 540 |
| | — |
| | — |
| | 264 |
| | 540 |
| | 804 |
| | (136 | ) | | 1996 | | 03/31/14 | | 7 to 30 Years |
SPIRIT MTA REIT
Schedule III Real Estate and
Accumulated Depreciation
(Amounts in thousands)
|
| | | | | | | | | | | | | | | | | | | | | | | | | |
| | | | | Initial Cost to Company | | Cost Capitalized Subsequent to Acquisition including impairment | | Gross Amount at December 31, 2018 | | | | | | | | |
Concept | City, State | | Encumbrances (d) | | Land and Improvements | | Buildings and Improvements | | Land and Improvements | | Buildings and Improvements | | Land and Improvements | | Buildings and Improvements | | Total | | Final Accumulated Depreciation | | Date of Construction | | Date Acquired | | Life in which depreciation in latest Statement of Operations is computed |
|
| | | | | | | | | | | | | | | | | | | | | | | | | | | | | | | | | |
Brookshire Brothers | Lorena, TX | | (a) | | 657 |
| | 751 |
| | — |
| | — |
| | 657 |
| | 751 |
| | 1,408 |
| | (227 | ) | | 1999 | | 03/31/14 | | 7 to 20 Years |
Brookshire Brothers | McGregor, TX | | (a) | | 748 |
| | 795 |
| | — |
| | — |
| | 748 |
| | 795 |
| | 1,543 |
| | (262 | ) | | 1999 | | 03/31/14 | | 7 to 20 Years |
Bru Burger Bar | Lexington, KY | | (a) | | 1,267 |
| | 944 |
| | — |
| | — |
| | 1,267 |
| | 944 |
| | 2,211 |
| | (719 | ) | | 1996 | | 02/26/07 | | 14 to 30 Years |
Buck's Sports Grill | Rawlins, WY | | (a) | | 25 |
| | 406 |
| | — |
| | — |
| | 25 |
| | 406 |
| | 431 |
| | (263 | ) | | 1958 | | 12/29/06 | | 15 to 20 Years |
Buehler's Fresh Foods | Ashland, OH | | (a) | | 2,596 |
| | 8,200 |
| | — |
| | — |
| | 2,596 |
| | 8,200 |
| | 10,796 |
| | (947 | ) | | 2000 | | 10/14/15 | | 15 to 40 Years |
Buehler's Fresh Foods | Wooster, OH | | (a) | | 3,694 |
| | 8,087 |
| | — |
| | — |
| | 3,694 |
| | 8,087 |
| | 11,781 |
| | (1,136 | ) | | 1980 | | 10/14/15 | | 15 to 30 Years |
Buehler's Fresh Foods | Dover, OH | | (a) | | 2,596 |
| | 8,087 |
| | — |
| | — |
| | 2,596 |
| | 8,087 |
| | 10,683 |
| | (1,114 | ) | | 1990 | | 10/14/15 | | 15 to 30 Years |
Buehler's Fresh Foods | Medina, OH | | (a) | | 4,892 |
| | 10,983 |
| | — |
| | — |
| | 4,892 |
| | 10,983 |
| | 15,875 |
| | (1,601 | ) | | 1990 | | 10/14/15 | | 15 to 30 Years |
Buehler's Fresh Foods | Wadsworth, OH | | (a) | | 2,197 |
| | 9,285 |
| | — |
| | — |
| | 2,197 |
| | 9,285 |
| | 11,482 |
| | (1,179 | ) | | 1985 | | 10/14/15 | | 15 to 30 Years |
Buffalo Wild Wings | Gaylord, MI | | (a) | | 1,003 |
| | 1,478 |
| | — |
| | — |
| | 1,003 |
| | 1,478 |
| | 2,481 |
| | (355 | ) | | 2014 | | 11/05/14 | | 14 to 30 Years |
Buffalo Wild Wings | Hammond, IN | | (a) | | 976 |
| | 1,080 |
| | — |
| | — |
| | 976 |
| | 1,080 |
| | 2,056 |
| | (298 | ) | | 2014 | | 12/24/14 | | 14 to 30 Years |
Burger King | Saint Ann, MO | | (a) | | 588 |
| | 613 |
| | — |
| | — |
| | 588 |
| | 613 |
| | 1,201 |
| | (516 | ) | | 1985 | | 09/23/05 | | 15 to 20 Years |
Burger King | Hickory, NC | | (a) | | 292 |
| | 818 |
| | — |
| | — |
| | 292 |
| | 818 |
| | 1,110 |
| | (348 | ) | | 2000 | | 09/29/06 | | 15 to 40 Years |
SPIRIT MTA REIT
Schedule III Real Estate and
Accumulated Depreciation
(Amounts in thousands)
|
| | | | | | | | | | | | | | | | | | | | | | | | | |
| | | | | Initial Cost to Company | | Cost Capitalized Subsequent to Acquisition including impairment | | Gross Amount at December 31, 2018 | | | | | | | | |
Concept | City, State | | Encumbrances (d) | | Land and Improvements | | Buildings and Improvements | | Land and Improvements | | Buildings and Improvements | | Land and Improvements | | Buildings and Improvements | | Total | | Final Accumulated Depreciation | | Date of Construction | | Date Acquired | | Life in which depreciation in latest Statement of Operations is computed |
|
| | | | | | | | | | | | | | | | | | | | | | | | | | | | | | | | | |
Burger King | Hudson, NC | | (a) | | 794 |
| | 616 |
| | — |
| | — |
| | 794 |
| | 616 |
| | 1,410 |
| | (338 | ) | | 1998 | | 09/29/06 | | 15 to 40 Years |
Burger King | Fayetteville, NC | | (a) | | 470 |
| | 629 |
| | — |
| | — |
| | 470 |
| | 629 |
| | 1,099 |
| | (342 | ) | | 1999 | | 09/29/06 | | 15 to 30 Years |
Burger King | Detroit, MI | | (a) | | 613 |
| | 688 |
| | 1 |
| | — |
| | 614 |
| | 688 |
| | 1,302 |
| | (515 | ) | | 1987 | | 02/13/09 | | 13 to 18 Years |
|
| | | | | | | | | | | | | | | | | | | | | | | | | | | | | | | | | |
Burger King | Apopka, FL | | (a) | | 1,038 |
| | 482 |
| | — |
| | — |
| | 1,038 |
| | 482 |
| | 1,520 |
| | (637 | ) | | 1977 | | 06/25/04 | | 10 to 15 Years |
Burger King | Saint Cloud, FL | | (a) | | 1,193 |
| | 557 |
| | — |
| | — |
| | 1,193 |
| | 557 |
| | 1,750 |
| | (433 | ) | | 1983 | | 06/25/04 | | 15 to 20 Years |
Burger King | Orlando, FL | | (a) | | 1,249 |
| | 729 |
| | — |
| | — |
| | 1,249 |
| | 729 |
| | 1,978 |
| | (603 | ) | | 1985 | | 06/25/04 | | 15 to 20 Years |
Burger King | Springfield, IL | | (a) | | 1,072 |
| | 642 |
| | — |
| | — |
| | 1,072 |
| | 642 |
| | 1,714 |
| | (589 | ) | | 1988 | | 09/23/05 | | 15 to 20 Years |
Burger King | Effingham, IL | | (a) | | 539 |
| | 575 |
| | — |
| | — |
| | 539 |
| | 575 |
| | 1,114 |
| | (340 | ) | | 1985 | | 09/23/05 | | 15 to 30 Years |
Burger King | Decatur, IL | | (a) | | 940 |
| | 126 |
| | — |
| | — |
| | 940 |
| | 126 |
| | 1,066 |
| | (417 | ) | | 1992 | | 09/23/05 | | 15 to 20 Years |
Burger King | Springfield, IL | | (a) | | 571 |
| | 630 |
| | — |
| | — |
| | 571 |
| | 630 |
| | 1,201 |
| | (387 | ) | | 1997 | | 09/23/05 | | 15 to 30 Years |
Burger King | Buffalo, NY | | (a) | | 737 |
| | 629 |
| | — |
| | — |
| | 737 |
| | 629 |
| | 1,366 |
| | (296 | ) | | 1993 | | 11/10/05 | | 15 to 30 Years |
Burger King | Buffalo, NY | | (a) | | 821 |
| | 694 |
| | — |
| | — |
| | 821 |
| | 694 |
| | 1,515 |
| | (331 | ) | | 1976 | | 11/10/05 | | 15 to 30 Years |
Burger King | Cheektowaga, NY | | (a) | | 561 |
| | 549 |
| | — |
| | — |
| | 561 |
| | 549 |
| | 1,110 |
| | (280 | ) | | 1985 | | 11/10/05 | | 15 to 30 Years |
SPIRIT MTA REIT
Schedule III Real Estate and
Accumulated Depreciation
(Amounts in thousands)
|
| | | | | | | | | | | | | | | | | | | | | | | | | |
| | | | | Initial Cost to Company | | Cost Capitalized Subsequent to Acquisition including impairment | | Gross Amount at December 31, 2018 | | | | | | | | |
Concept | City, State | | Encumbrances (d) | | Land and Improvements | | Buildings and Improvements | | Land and Improvements | | Buildings and Improvements | | Land and Improvements | | Buildings and Improvements | | Total | | Final Accumulated Depreciation | | Date of Construction | | Date Acquired | | Life in which depreciation in latest Statement of Operations is computed |
|
| | | | | | | | | | | | | | | | | | | | | | | | | | | | | | | | | |
Burger King | Jamestown, NY | | (a) | | 508 |
| | 573 |
| | — |
| | — |
| | 508 |
| | 573 |
| | 1,081 |
| | (411 | ) | | 1988 | | 11/10/05 | | 15 to 20 Years |
Burger King | Louisville, KY | | (a) | | 1,010 |
| | 577 |
| | — |
| | — |
| | 1,010 |
| | 577 |
| | 1,587 |
| | (335 | ) | | 1994 | | 11/10/05 | | 15 to 30 Years |
Burger King | Louisville, KY | | (a) | | 854 |
| | 514 |
| | — |
| | — |
| | 854 |
| | 514 |
| | 1,368 |
| | (302 | ) | | 1994 | | 11/10/05 | | 15 to 30 Years |
Burger King | Niagara Falls, NY | | (a) | | 1,359 |
| | 551 |
| | — |
| | — |
| | 1,359 |
| | 551 |
| | 1,910 |
| | (335 | ) | | 1979 | | 11/10/05 | | 15 to 30 Years |
Burger King | Springville, NY | | (a) | | 678 |
| | 586 |
| | — |
| | — |
| | 678 |
| | 586 |
| | 1,264 |
| | (317 | ) | | 1988 | | 11/10/05 | | 15 to 30 Years |
Burger King | Hope Mills, NC | | (a) | | 408 |
| | 930 |
| | — |
| | — |
| | 408 |
| | 930 |
| | 1,338 |
| | (448 | ) | | 1990 | | 09/29/06 | | 15 to 30 Years |
Burger King | Fayetteville, NC | | (a) | | 489 |
| | 612 |
| | — |
| | — |
| | 489 |
| | 612 |
| | 1,101 |
| | (314 | ) | | 1987 | | 09/29/06 | | 15 to 30 Years |
Burger King | Lillington, NC | | (a) | | 419 |
| | 687 |
| | — |
| | — |
| | 419 |
| | 687 |
| | 1,106 |
| | (302 | ) | | 1992 | | 09/29/06 | | 15 to 40 Years |
Burger King | Escanaba, MI | | (a) | | 772 |
| | 767 |
| | — |
| | 300 |
| | 772 |
| | 1,067 |
| | 1,839 |
| | (854 | ) | | 1984 | | 12/29/05 | | 3 to 20 Years |
Burger King | Oshkosh, WI | | (a) | | 765 |
| | 829 |
| | (40 | ) | | 300 |
| | 725 |
| | 1,129 |
| | 1,854 |
| | (717 | ) | | 1984 | | 12/29/05 | | 15 to 20 Years |
Burger King | Quincy, FL | | (a) | | 1,015 |
| | 416 |
| | — |
| | — |
| | 1,015 |
| | 416 |
| | 1,431 |
| | (518 | ) | | 1989 | | 09/24/04 | | 15 to 20 Years |
Burger King | Sweetwater, TN | | (a) | | 602 |
| | 550 |
| | — |
| | 250 |
| | 602 |
| | 800 |
| | 1,402 |
| | (312 | ) | | 1999 | | 12/29/06 | | 15 to 40 Years |
Burger King | Winchester, TN | | (a) | | 400 |
| | 291 |
| | — |
| | 250 |
| | 400 |
| | 541 |
| | 941 |
| | (268 | ) | | 1993 | | 12/29/06 | | 10 to 20 Years |
SPIRIT MTA REIT
Schedule III Real Estate and
Accumulated Depreciation
(Amounts in thousands)
|
| | | | | | | | | | | | | | | | | | | | | | | | | |
| | | | | Initial Cost to Company | | Cost Capitalized Subsequent to Acquisition including impairment | | Gross Amount at December 31, 2018 | | | | | | | | |
Concept | City, State | | Encumbrances (d) | | Land and Improvements | | Buildings and Improvements | | Land and Improvements | | Buildings and Improvements | | Land and Improvements | | Buildings and Improvements | | Total | | Final Accumulated Depreciation | | Date of Construction | | Date Acquired | | Life in which depreciation in latest Statement of Operations is computed |
|
| | | | | | | | | | | | | | | | | | | | | | | | | | | | | | | | | |
Burger King | Artesia, NM | | (a) | | 435 |
| | 1,106 |
| | — |
| | — |
| | 435 |
| | 1,106 |
| | 1,541 |
| | (243 | ) | | 1984 | | 04/16/14 | | 15 to 30 Years |
Burger King | Garner, NC | | (a) | | 600 |
| | 765 |
| | (600 | ) | | (765 | ) | | — |
| | — |
| | — |
| | — |
| | 1995 | | 09/26/06 | | (e) |
Burger King | Mebane, NC | | (a) | | 846 |
| | 682 |
| | (846 | ) | | (682 | ) | | — |
| | — |
| | — |
| | — |
| | 1993 | | 09/26/06 | | (e) |
Burger King | Fayetteville, NC | | (a) | | 470 |
| | 629 |
| | (470 | ) | | (629 | ) | | — |
| | — |
| | — |
| | — |
| | 1996 | | 09/26/06 | | (e) |
Burger King | Parma Heights, OH | | (a) | | 598 |
| | 535 |
| | — |
| | — |
| | 598 |
| | 535 |
| | 1,133 |
| | (259 | ) | | 2004 | | 08/27/09 | | 13 to 38 Years |
Burger King | Sandusky, OH | | (a) | | 923 |
| | 406 |
| | (315 | ) | | (89 | ) | | 608 |
| | 317 |
| | 925 |
| | (164 | ) | | 1987 | | 08/27/09 | | 14 to 29 Years |
Burger King | Seven Hills, OH | | (a) | | 496 |
| | 489 |
| | — |
| | (1 | ) | | 496 |
| | 488 |
| | 984 |
| | (258 | ) | | 1977 | | 08/27/09 | | 13 to 28 Years |
Burger King | Aurora, IL | | (a) | | 286 |
| | 726 |
| | — |
| | — |
| | 286 |
| | 726 |
| | 1,012 |
| | (417 | ) | | 1998 | | 12/29/06 | | 15 to 30 Years |
Burger King | Romeoville, IL | | (a) | | 789 |
| | 713 |
| | (62 | ) | | — |
| | 727 |
| | 713 |
| | 1,440 |
| | (491 | ) | | 1999 | | 09/23/05 | | 15 to 20 Years |
Burger King | Gilman, IL | | (a) | | 219 |
| | 414 |
| | — |
| | — |
| | 219 |
| | 414 |
| | 633 |
| | (343 | ) | | 1998 | | 09/23/05 | | 15 to 20 Years |
Caldwell Country Chevrolet | Caldwell, TX | | (a) | | 1,775 |
| | 1,725 |
| | — |
| | — |
| | 1,775 |
| | 1,725 |
| | 3,500 |
| | (1,167 | ) | | 2000 | | 04/29/11 | | 11 to 36 Years |
Camping World | Kenosha, WI | | (a) | | 3,421 |
| | 7,407 |
| | — |
| | 1,260 |
| | 3,421 |
| | 8,667 |
| | 12,088 |
| | (2,969 | ) | | 2004 | | 07/01/05 | | 14 to 40 Years |
Camping World | Saukville, WI | | (a) | | 2,061 |
| | 4,794 |
| | — |
| | — |
| | 2,061 |
| | 4,794 |
| | 6,855 |
| | (899 | ) | | 2014 | | 09/30/14 | | 15 to 40 Years |
SPIRIT MTA REIT
Schedule III Real Estate and
Accumulated Depreciation
(Amounts in thousands)
|
| | | | | | | | | | | | | | | | | | | | | | | | | |
| | | | | Initial Cost to Company | | Cost Capitalized Subsequent to Acquisition including impairment | | Gross Amount at December 31, 2018 | | | | | | | | |
Concept | City, State | | Encumbrances (d) | | Land and Improvements | | Buildings and Improvements | | Land and Improvements | | Buildings and Improvements | | Land and Improvements | | Buildings and Improvements | | Total | | Final Accumulated Depreciation | | Date of Construction | | Date Acquired | | Life in which depreciation in latest Statement of Operations is computed |
|
| | | | | | | | | | | | | | | | | | | | | | | | | | | | | | | | | |
CarMax | Kennesaw, GA | | (a) | | 3,931 |
| | 5,334 |
| | — |
| | — |
| | 3,931 |
| | 5,334 |
| | 9,265 |
| | (1,889 | ) | | 1995 | | 02/16/12 | | 15 to 30 Years |
CarMax | Greenville, SC | | (a) | | 9,731 |
| | 11,625 |
| | — |
| | — |
| | 9,731 |
| | 11,625 |
| | 21,356 |
| | (2,797 | ) | | 1999 | | 07/17/13 | | 3 to 40 Years |
CarMax | Jacksonville, FL | | (a) | | 6,155 |
| | 10,957 |
| | — |
| | — |
| | 6,155 |
| | 10,957 |
| | 17,112 |
| | (3,266 | ) | | 2005 | | 06/30/05 | | 15 to 40 Years |
CarMax | Raleigh, NC | | (a) | | 4,163 |
| | 4,017 |
| | — |
| | — |
| | 4,163 |
| | 4,017 |
| | 8,180 |
| | (1,890 | ) | | 1994 | | 07/17/13 | | 4 to 25 Years |
Carrington College | Phoenix, AZ | | (a) | | 1,840 |
| | 3,582 |
| | (528 | ) | | (1,436 | ) | | 1,312 |
| | 2,146 |
| | 3,458 |
| | — |
| | 1975 | | 07/01/05 | | 3 to 28 Years |
Casual Male | Canton, MA | | (a) | | 28,721 |
| | 27,798 |
| | (28 | ) | | 15 |
| | 28,693 |
| | 27,813 |
| | 56,506 |
| | (11,377 | ) | | 1962 | | 02/01/06 | | 15 to 30 Years |
Cermak Fresh Market | Aurora, IL | | (a) | | 2,450 |
| | 7,566 |
| | — |
| | 343 |
| | 2,450 |
| | 7,909 |
| | 10,359 |
| | (643 | ) | | 1989 | | 01/09/17 | | 10 to 30 Years |
Chapala | Boise, ID | | (a) | | 809 |
| | 601 |
| | (400 | ) | | (259 | ) | | 409 |
| | 342 |
| | 751 |
| | (260 | ) | | 1998 | | 06/25/04 | | 15 to 30 Years |
Charleston's Restaurant | Tulsa, OK | | (a) | | 1,540 |
| | 1,997 |
| | — |
| | — |
| | 1,540 |
| | 1,997 |
| | 3,537 |
| | (880 | ) | | 2002 | | 07/02/07 | | 14 to 40 Years |
Charleston's Restaurant | Norman, OK | | (a) | | 1,466 |
| | 2,294 |
| | — |
| | — |
| | 1,466 |
| | 2,294 |
| | 3,760 |
| | (1,275 | ) | | 1992 | | 07/02/07 | | 14 to 30 Years |
Children's Learning Adventure | The Woodlands, TX | | (c) | | 2,039 |
| | 7,154 |
| | (453 | ) | | (1,317 | ) | | 1,586 |
| | 5,837 |
| | 7,423 |
| | (292 | ) | | 2011 | | 09/25/13 | | 10 to 35 Years |
Children's Learning Adventure | East Humble, TX | | (c) | | 2,108 |
| | 7,208 |
| | (497 | ) | | (1,298 | ) | | 1,611 |
| | 5,910 |
| | 7,521 |
| | (309 | ) | | 2012 | | 12/10/13 | | 10 to 35 Years |
Children's Learning Adventure | Henderson, NV | | (c) | | 2,757 |
| | 6,113 |
| | (456 | ) | | (1,043 | ) | | 2,301 |
| | 5,070 |
| | 7,371 |
| | (246 | ) | | 2010 | | 05/16/14 | | 12 to 37 Years |
SPIRIT MTA REIT
Schedule III Real Estate and
Accumulated Depreciation
(Amounts in thousands)
|
| | | | | | | | | | | | | | | | | | | | | | | | | |
| | | | | Initial Cost to Company | | Cost Capitalized Subsequent to Acquisition including impairment | | Gross Amount at December 31, 2018 | | | | | | | | |
Concept | City, State | | Encumbrances (d) | | Land and Improvements | | Buildings and Improvements | | Land and Improvements | | Buildings and Improvements | | Land and Improvements | | Buildings and Improvements | | Total | | Final Accumulated Depreciation | | Date of Construction | | Date Acquired | | Life in which depreciation in latest Statement of Operations is computed |
|
| | | | | | | | | | | | | | | | | | | | | | | | | | | | | | | | | |
Church's Chicken | Overland, MO | | (a) | | 278 |
| | 494 |
| | — |
| | — |
| | 278 |
| | 494 |
| | 772 |
| | (335 | ) | | 1972 | | 05/25/05 | | 15 to 20 Years |
Church's Chicken | Normandy, MO | | (a) | | 265 |
| | 329 |
| | (6 | ) | | — |
| | 259 |
| | 329 |
| | 588 |
| | (246 | ) | | 1978 | | 05/25/05 | | 15 to 20 Years |
Church's Chicken | St. Louis, MO | | (a) | | 464 |
| | 218 |
| | — |
| | — |
| | 464 |
| | 218 |
| | 682 |
| | (210 | ) | | 1978 | | 05/25/05 | | 15 to 20 Years |
Church's Chicken | Ferguson, MO | | (a) | | 293 |
| | 212 |
| | — |
| | — |
| | 293 |
| | 212 |
| | 505 |
| | (180 | ) | | 1974 | | 05/25/05 | | 15 to 20 Years |
Church's Chicken | St. Louis, MO | | (a) | | 231 |
| | 337 |
| | — |
| | — |
| | 231 |
| | 337 |
| | 568 |
| | (237 | ) | | 1972 | | 05/25/05 | | 15 to 20 Years |
Church's Chicken | St. Louis, MO | | (a) | | 290 |
| | 211 |
| | — |
| | — |
| | 290 |
| | 211 |
| | 501 |
| | (184 | ) | | 1973 | | 05/25/05 | | 15 to 20 Years |
Church's Chicken | Maplewood, MO | | (a) | | 180 |
| | 225 |
| | — |
| | — |
| | 180 |
| | 225 |
| | 405 |
| | (168 | ) | | 1980 | | 05/25/05 | | 15 to 20 Years |
Church's Chicken | Washington Park, IL | | (a) | | 119 |
| | 324 |
| | — |
| | — |
| | 119 |
| | 324 |
| | 443 |
| | (228 | ) | | 1980 | | 05/25/05 | | 15 to 20 Years |
Church's Chicken | East St. Louis, IL | | (a) | | 117 |
| | 334 |
| | — |
| | — |
| | 117 |
| | 334 |
| | 451 |
| | (173 | ) | | 1990 | | 05/25/05 | | 15 to 30 Years |
Church's Chicken | St. Louis, MO | | (a) | | 189 |
| | 227 |
| | — |
| | — |
| | 189 |
| | 227 |
| | 416 |
| | (176 | ) | | 1972 | | 05/25/05 | | 15 to 20 Years |
|
| | | | | | | | | | | | | | | | | | | | | | | | | | | | | | | | | |
Church's Chicken | Canton, OH | | (a) | | 215 |
| | 483 |
| | — |
| | — |
| | 215 |
| | 483 |
| | 698 |
| | (304 | ) | | 1974 | | 05/25/05 | | 15 to 20 Years |
Church's Chicken | Chicago, IL | | (a) | | 313 |
| | 275 |
| | — |
| | — |
| | 313 |
| | 275 |
| | 588 |
| | (187 | ) | | 1982 | | 05/25/05 | | 15 to 20 Years |
Church's Chicken | Flint, MI | | (a) | | 340 |
| | 258 |
| | — |
| | — |
| | 340 |
| | 258 |
| | 598 |
| | (211 | ) | | 1979 | | 05/25/05 | | 15 to 20 Years |
SPIRIT MTA REIT
Schedule III Real Estate and
Accumulated Depreciation
(Amounts in thousands)
|
| | | | | | | | | | | | | | | | | | | | | | | | | |
| | | | | Initial Cost to Company | | Cost Capitalized Subsequent to Acquisition including impairment | | Gross Amount at December 31, 2018 | | | | | | | | |
Concept | City, State | | Encumbrances (d) | | Land and Improvements | | Buildings and Improvements | | Land and Improvements | | Buildings and Improvements | | Land and Improvements | | Buildings and Improvements | | Total | | Final Accumulated Depreciation | | Date of Construction | | Date Acquired | | Life in which depreciation in latest Statement of Operations is computed |
|
| | | | | | | | | | | | | | | | | | | | | | | | | | | | | | | | | |
Church's Chicken | Chicago, IL | | (a) | | 340 |
| | 220 |
| | — |
| | — |
| | 340 |
| | 220 |
| | 560 |
| | (174 | ) | | 1975 | | 05/25/05 | | 15 to 20 Years |
Church's Chicken | Indianapolis, IN | | (a) | | 449 |
| | 153 |
| | — |
| | — |
| | 449 |
| | 153 |
| | 602 |
| | (170 | ) | | 1968 | | 05/25/05 | | 15 to 20 Years |
Church's Chicken | Gary, IN | | (a) | | 161 |
| | 493 |
| | — |
| | — |
| | 161 |
| | 493 |
| | 654 |
| | (347 | ) | | 1973 | | 05/25/05 | | 15 to 20 Years |
Church's Chicken | Detroit, MI | | (a) | | 426 |
| | 223 |
| | — |
| | — |
| | 426 |
| | 223 |
| | 649 |
| | (187 | ) | | 1979 | | 05/25/05 | | 15 to 20 Years |
Church's Chicken | Indianapolis, IN | | (a) | | 170 |
| | 749 |
| | — |
| | — |
| | 170 |
| | 749 |
| | 919 |
| | (468 | ) | | 1983 | | 05/25/05 | | 15 to 20 Years |
Church's Chicken | Chicago, IL | | (a) | | 242 |
| | 256 |
| | — |
| | — |
| | 242 |
| | 256 |
| | 498 |
| | (183 | ) | | 1974 | | 05/25/05 | | 15 to 20 Years |
Church's Chicken | Detroit, MI | | (a) | | 270 |
| | 305 |
| | — |
| | — |
| | 270 |
| | 305 |
| | 575 |
| | (207 | ) | | 1976 | | 05/25/05 | | 15 to 20 Years |
Church's Chicken | Akron, OH | | (a) | | 310 |
| | 394 |
| | — |
| | — |
| | 310 |
| | 394 |
| | 704 |
| | (282 | ) | | 1982 | | 05/25/05 | | 15 to 20 Years |
Church's Chicken | Gary, IN | | (a) | | 109 |
| | 410 |
| | — |
| | — |
| | 109 |
| | 410 |
| | 519 |
| | (274 | ) | | 1980 | | 05/25/05 | | 15 to 20 Years |
Church's Chicken | Chicago, IL | | (a) | | 532 |
| | 279 |
| | — |
| | — |
| | 532 |
| | 279 |
| | 811 |
| | (202 | ) | | 1982 | | 05/25/05 | | 15 to 20 Years |
Church's Chicken | Detroit, MI | | (a) | | 413 |
| | 235 |
| | — |
| | — |
| | 413 |
| | 235 |
| | 648 |
| | (190 | ) | | 1977 | | 05/25/05 | | 15 to 20 Years |
Church's Chicken | Detroit, MI | | (a) | | 425 |
| | 200 |
| | — |
| | — |
| | 425 |
| | 200 |
| | 625 |
| | (168 | ) | | 1977 | | 05/25/05 | | 15 to 20 Years |
Church's Chicken | Columbus, OH | | (a) | | 268 |
| | 354 |
| | — |
| | — |
| | 268 |
| | 354 |
| | 622 |
| | (263 | ) | | 1975 | | 05/25/05 | | 15 to 20 Years |
SPIRIT MTA REIT
Schedule III Real Estate and
Accumulated Depreciation
(Amounts in thousands)
|
| | | | | | | | | | | | | | | | | | | | | | | | | |
| | | | | Initial Cost to Company | | Cost Capitalized Subsequent to Acquisition including impairment | | Gross Amount at December 31, 2018 | | | | | | | | |
Concept | City, State | | Encumbrances (d) | | Land and Improvements | | Buildings and Improvements | | Land and Improvements | | Buildings and Improvements | | Land and Improvements | | Buildings and Improvements | | Total | | Final Accumulated Depreciation | | Date of Construction | | Date Acquired | | Life in which depreciation in latest Statement of Operations is computed |
|
| | | | | | | | | | | | | | | | | | | | | | | | | | | | | | | | | |
Church's Chicken | Detroit, MI | | (a) | | 428 |
| | 189 |
| | — |
| | — |
| | 428 |
| | 189 |
| | 617 |
| | (158 | ) | | 1979 | | 05/25/05 | | 15 to 20 Years |
Church's Chicken | Detroit, MI | | (a) | | 301 |
| | 219 |
| | — |
| | — |
| | 301 |
| | 219 |
| | 520 |
| | (171 | ) | | 1972 | | 05/25/05 | | 15 to 20 Years |
Church's Chicken | Akron, OH | | (a) | | 247 |
| | 198 |
| | — |
| | — |
| | 247 |
| | 198 |
| | 445 |
| | (166 | ) | | 1971 | | 05/25/05 | | 15 to 20 Years |
Church's Chicken | Detroit, MI | | (a) | | 385 |
| | 258 |
| | — |
| | — |
| | 385 |
| | 258 |
| | 643 |
| | (213 | ) | | 1979 | | 05/25/05 | | 15 to 20 Years |
Church's Chicken | Indianapolis, IN | | (a) | | 258 |
| | 262 |
| | — |
| | — |
| | 258 |
| | 262 |
| | 520 |
| | (223 | ) | | 1970 | | 05/25/05 | | 15 to 20 Years |
Church's Chicken | Warren, MI | | (a) | | 488 |
| | 215 |
| | — |
| | — |
| | 488 |
| | 215 |
| | 703 |
| | (178 | ) | | 1979 | | 05/25/05 | | 15 to 20 Years |
Church's Chicken | Chicago, IL | | (a) | | 289 |
| | 260 |
| | — |
| | — |
| | 289 |
| | 260 |
| | 549 |
| | (182 | ) | | 1982 | | 05/25/05 | | 15 to 20 Years |
Church's Chicken | Columbus, OH | | (a) | | 294 |
| | 262 |
| | — |
| | — |
| | 294 |
| | 262 |
| | 556 |
| | (214 | ) | | 1976 | | 05/25/05 | | 15 to 20 Years |
Church's Chicken | Indianapolis, IN | | (a) | | 370 |
| | 150 |
| | — |
| | — |
| | 370 |
| | 150 |
| | 520 |
| | (151 | ) | | 1970 | | 05/25/05 | | 15 to 20 Years |
Church's Chicken | Chicago, IL | | (a) | | 242 |
| | 244 |
| | — |
| | — |
| | 242 |
| | 244 |
| | 486 |
| | (191 | ) | | 1970 | | 05/25/05 | | 15 to 20 Years |
Church's Chicken | Detroit, MI | | (a) | | 271 |
| | 157 |
| | — |
| | — |
| | 271 |
| | 157 |
| | 428 |
| | (131 | ) | | 1978 | | 05/25/05 | | 15 to 20 Years |
Church's Chicken | Gary, IN | | (a) | | 210 |
| | 318 |
| | — |
| | — |
| | 210 |
| | 318 |
| | 528 |
| | (263 | ) | | 1979 | | 05/25/05 | | 15 to 20 Years |
Church's Chicken | Joliet, IL | | (a) | | 245 |
| | 193 |
| | — |
| | — |
| | 245 |
| | 193 |
| | 438 |
| | (170 | ) | | 1985 | | 05/25/05 | | 15 to 20 Years |
SPIRIT MTA REIT
Schedule III Real Estate and
Accumulated Depreciation
(Amounts in thousands)
|
| | | | | | | | | | | | | | | | | | | | | | | | | |
| | | | | Initial Cost to Company | | Cost Capitalized Subsequent to Acquisition including impairment | | Gross Amount at December 31, 2018 | | | | | | | | |
Concept | City, State | | Encumbrances (d) | | Land and Improvements | | Buildings and Improvements | | Land and Improvements | | Buildings and Improvements | | Land and Improvements | | Buildings and Improvements | | Total | | Final Accumulated Depreciation | | Date of Construction | | Date Acquired | | Life in which depreciation in latest Statement of Operations is computed |
|
| | | | | | | | | | | | | | | | | | | | | | | | | | | | | | | | | |
Church's Chicken | Peoria, IL | | (a) | | 154 |
| | 320 |
| | — |
| | — |
| | 154 |
| | 320 |
| | 474 |
| | (238 | ) | | 1976 | | 05/25/05 | | 15 to 20 Years |
Church's Chicken | Harvey, IL | | (a) | | 361 |
| | 269 |
| | (80 | ) | | — |
| | 281 |
| | 269 |
| | 550 |
| | (382 | ) | | 1978 | | 05/25/05 | | 15 to 20 Years |
Church's Chicken | Akron, OH | | (a) | | 218 |
| | 273 |
| | — |
| | — |
| | 218 |
| | 273 |
| | 491 |
| | (200 | ) | | 1976 | | 05/25/05 | | 15 to 20 Years |
Church's Chicken | Indianapolis, IN | | (a) | | 266 |
| | 310 |
| | — |
| | — |
| | 266 |
| | 310 |
| | 576 |
| | (239 | ) | | 1971 | | 05/25/05 | | 15 to 20 Years |
Church's Chicken | Mansfield, OH | | (a) | | 225 |
| | 327 |
| | — |
| | — |
| | 225 |
| | 327 |
| | 552 |
| | (223 | ) | | 1972 | | 05/25/05 | | 15 to 20 Years |
Church's Chicken | Detroit, MI | | (a) | | 351 |
| | 209 |
| | — |
| | — |
| | 351 |
| | 209 |
| | 560 |
| | (170 | ) | | 1977 | | 05/25/05 | | 15 to 20 Years |
Columbus Arts & Tech Academy | Columbus, OH | | (a) | | 417 |
| | 5,100 |
| | — |
| | 849 |
| | 417 |
| | 5,949 |
| | 6,366 |
| | (2,731 | ) | | 1980 | | 03/17/06 | | 13 to 30 Years |
Columbus Preparatory Academy | Columbus, OH | | (a) | | 1,069 |
| | 3,363 |
| | 330 |
| | 1,340 |
| | 1,399 |
| | 4,703 |
| | 6,102 |
| | (3,159 | ) | | 2004 | | 03/17/06 | | 13 to 20 Years |
ConForm Automotive | Sidney, OH | | (a) | | 921 |
| | 4,177 |
| | — |
| | 415 |
| | 921 |
| | 4,592 |
| | 5,513 |
| | (2,777 | ) | | 1987 | | 12/22/05 | | 8 to 20 Years |
Core & Main | Riviera Beach, FL | | (a) | | 500 |
| | 170 |
| | — |
| | — |
| | 500 |
| | 170 |
| | 670 |
| | (171 | ) | | 1987 | | 07/01/05 | | 15 to 20 Years |
Core & Main | Jacksonville, FL | | (a) | | 339 |
| | 226 |
| | — |
| | — |
| | 339 |
| | 226 |
| | 565 |
| | (226 | ) | | 1987 | | 07/01/05 | | 15 to 20 Years |
Core & Main | West Columbia, SC | | (a) | | 324 |
| | 108 |
| | — |
| | — |
| | 324 |
| | 108 |
| | 432 |
| | (97 | ) | | 1989 | | 05/01/05 | | 15 to 20 Years |
Core & Main | Tontitown, AR | | (a) | | 230 |
| | 92 |
| | — |
| | — |
| | 230 |
| | 92 |
| | 322 |
| | (100 | ) | | 1987 | | 05/01/05 | | 15 to 20 Years |
SPIRIT MTA REIT
Schedule III Real Estate and
Accumulated Depreciation
(Amounts in thousands)
|
| | | | | | | | | | | | | | | | | | | | | | | | | |
| | | | | Initial Cost to Company | | Cost Capitalized Subsequent to Acquisition including impairment | | Gross Amount at December 31, 2018 | | | | | | | | |
Concept | City, State | | Encumbrances (d) | | Land and Improvements | | Buildings and Improvements | | Land and Improvements | | Buildings and Improvements | | Land and Improvements | | Buildings and Improvements | | Total | | Final Accumulated Depreciation | | Date of Construction | | Date Acquired | | Life in which depreciation in latest Statement of Operations is computed |
|
| | | | | | | | | | | | | | | | | | | | | | | | | | | | | | | | | |
Core & Main | Indianapolis, IN | | (a) | | 607 |
| | 520 |
| | — |
| | — |
| | 607 |
| | 520 |
| | 1,127 |
| | (416 | ) | | 1990 | | 05/01/05 | | 15 to 20 Years |
Core & Main | Knoxville, TN | | (a) | | 259 |
| | 111 |
| | — |
| | — |
| | 259 |
| | 111 |
| | 370 |
| | (192 | ) | | 1981 | | 05/01/05 | | 10 to 15 Years |
Core & Main | Wilmington, NC | | (a) | | 370 |
| | 122 |
| | — |
| | — |
| | 370 |
| | 122 |
| | 492 |
| | (121 | ) | | 1987 | | 05/01/05 | | 15 to 20 Years |
Core & Main | Greer, SC | | (a) | | 268 |
| | 236 |
| | — |
| | — |
| | 268 |
| | 236 |
| | 504 |
| | (193 | ) | | 1993 | | 05/01/05 | | 15 to 30 Years |
Core & Main | Florence, SC | | (a) | | 221 |
| | 174 |
| | — |
| | — |
| | 221 |
| | 174 |
| | 395 |
| | (231 | ) | | 1974 | | 05/01/05 | | 10 to 15 Years |
Core & Main | Martinsburg, WV | | (a) | | 173 |
| | 20 |
| | — |
| | — |
| | 173 |
| | 20 |
| | 193 |
| | (53 | ) | | 1972 | | 05/01/05 | | 10 to 15 Years |
Core & Main | Spokane, WA | | (a) | | 518 |
| | 193 |
| | — |
| | — |
| | 518 |
| | 193 |
| | 711 |
| | (204 | ) | | 1998 | | 05/01/05 | | 15 to 30 Years |
Core & Main | Lawrenceville, GA | | (a) | | 500 |
| | 237 |
| | — |
| | — |
| | 500 |
| | 237 |
| | 737 |
| | (231 | ) | | 1996 | | 05/01/05 | | 15 to 30 Years |
Core & Main | Roanoke, VA | | (a) | | 333 |
| | 124 |
| | — |
| | — |
| | 333 |
| | 124 |
| | 457 |
| | (189 | ) | | 1975 | | 05/01/05 | | 10 to 15 Years |
Core & Main | Hickory, NC | | (a) | | 199 |
| | 262 |
| | — |
| | — |
| | 199 |
| | 262 |
| | 461 |
| | (230 | ) | | 1989 | | 05/01/05 | | 15 to 20 Years |
Core & Main | Jacksonville, FL | | (a) | | 963 |
| | 1,007 |
| | — |
| | — |
| | 963 |
| | 1,007 |
| | 1,970 |
| | (1,098 | ) | | 2001 | | 07/01/05 | | 9 to 20 Years |
Core & Main | Pompano Beach, FL | | (a) | | 1,144 |
| | 337 |
| | — |
| | — |
| | 1,144 |
| | 337 |
| | 1,481 |
| | (277 | ) | | 1990 | | 07/01/05 | | 15 to 30 Years |
Courthouse Athletic Club | Salem, OR | | (a) | | 1,214 |
| | 4,911 |
| | — |
| | — |
| | 1,214 |
| | 4,911 |
| | 6,125 |
| | (1,810 | ) | | 1980 | | 12/01/05 | | 15 to 40 Years |
SPIRIT MTA REIT
Schedule III Real Estate and
Accumulated Depreciation
(Amounts in thousands)
|
| | | | | | | | | | | | | | | | | | | | | | | | | |
| | | | | Initial Cost to Company | | Cost Capitalized Subsequent to Acquisition including impairment | | Gross Amount at December 31, 2018 | | | | | | | | |
Concept | City, State | | Encumbrances (d) | | Land and Improvements | | Buildings and Improvements | | Land and Improvements | | Buildings and Improvements | | Land and Improvements | | Buildings and Improvements | | Total | | Final Accumulated Depreciation | | Date of Construction | | Date Acquired | | Life in which depreciation in latest Statement of Operations is computed |
|
| | | | | | | | | | | | | | | | | | | | | | | | | | | | | | | | | |
Courthouse Athletic Club | Salem, OR | | (a) | | 941 |
| | 2,620 |
| | 1,018 |
| | 5,042 |
| | 1,959 |
| | 7,662 |
| | 9,621 |
| | (2,733 | ) | | 1996 | | 12/01/05 | | 15 to 40 Years |
Courthouse Athletic Club | Keizer, OR | | (a) | | 1,208 |
| | 4,089 |
| | — |
| | — |
| | 1,208 |
| | 4,089 |
| | 5,297 |
| | (1,492 | ) | | 1988 | | 12/01/05 | | 15 to 40 Years |
Courthouse Athletic Club | Salem, OR | | (a) | | 1,589 |
| | 3,834 |
| | — |
| | — |
| | 1,589 |
| | 3,834 |
| | 5,423 |
| | (1,886 | ) | | 1977 | | 12/01/05 | | 15 to 30 Years |
Courthouse Athletic Club | Salem, OR | | (a) | | 1,509 |
| | 5,635 |
| | — |
| | — |
| | 1,509 |
| | 5,635 |
| | 7,144 |
| | (2,043 | ) | | 2001 | | 12/01/05 | | 15 to 40 Years |
Crème de la Crème | Leawood, KS | | (a) | | 1,854 |
| | 3,914 |
| | — |
| | — |
| | 1,854 |
| | 3,914 |
| | 5,768 |
| | (2,023 | ) | | 1999 | | 09/29/05 | | 15 to 30 Years |
Crème de la Crème | Westmont, IL | | (a) | | 1,375 |
| | 5,087 |
| | — |
| | — |
| | 1,375 |
| | 5,087 |
| | 6,462 |
| | (1,736 | ) | | 2003 | | 12/28/05 | | 15 to 40 Years |
Crème de la Crème | Warrenville, IL | | (a) | | 2,542 |
| | 3,813 |
| | — |
| | — |
| | 2,542 |
| | 3,813 |
| | 6,355 |
| | (2,062 | ) | | 1999 | | 09/29/05 | | 15 to 30 Years |
Crème de la Crème | Lone Tree, CO | | (a) | | 2,020 |
| | 3,748 |
| | — |
| | — |
| | 2,020 |
| | 3,748 |
| | 5,768 |
| | (1,860 | ) | | 1999 | | 09/29/05 | | 15 to 30 Years |
Crème de la Crème | Duluth, GA | | (a) | | 2,289 |
| | 4,274 |
| | — |
| | — |
| | 2,289 |
| | 4,274 |
| | 6,563 |
| | (2,073 | ) | | 2007 | | 12/23/08 | | 13 to 48 Years |
Crème de la Crème | Chicago, IL | | (a) | | 5,057 |
| | 5,939 |
| | — |
| | — |
| | 5,057 |
| | 5,939 |
| | 10,996 |
| | (738 | ) | | 2009 | | 05/30/14 | | 15 to 40 Years |
Crème de la Crème | Barrington, IL | | (a) | | 1,180 |
| | 5,939 |
| | — |
| | — |
| | 1,180 |
| | 5,939 |
| | 7,119 |
| | (793 | ) | | 2008 | | 05/30/14 | | 15 to 40 Years |
Crème de la Crème | Romeoville, IL | | (a) | | 1,684 |
| | 5,676 |
| | — |
| | — |
| | 1,684 |
| | 5,676 |
| | 7,360 |
| | (1,602 | ) | | 2008 | | 11/07/08 | | 14 to 49 Years |
Crème de la Crème | Mount Laurel, NJ | | (a) | | 1,404 |
| | 5,655 |
| | — |
| | — |
| | 1,404 |
| | 5,655 |
| | 7,059 |
| | (1,722 | ) | | 2007 | | 05/01/09 | | 13 to 48 Years |
SPIRIT MTA REIT
Schedule III Real Estate and
Accumulated Depreciation
(Amounts in thousands)
|
| | | | | | | | | | | | | | | | | | | | | | | | | |
| | | | | Initial Cost to Company | | Cost Capitalized Subsequent to Acquisition including impairment | | Gross Amount at December 31, 2018 | | | | | | | | |
Concept | City, State | | Encumbrances (d) | | Land and Improvements | | Buildings and Improvements | | Land and Improvements | | Buildings and Improvements | | Land and Improvements | | Buildings and Improvements | | Total | | Final Accumulated Depreciation | | Date of Construction | | Date Acquired | | Life in which depreciation in latest Statement of Operations is computed |
|
| | | | | | | | | | | | | | | | | | | | | | | | | | | | | | | | | |
Crown Distributing | Arlington, WA | | (c) | | 1,860 |
| | 10,402 |
| | — |
| | — |
| | 1,860 |
| | 10,402 |
| | 12,262 |
| | (1,280 | ) | | 2002 | | 11/21/14 | | 7 to 40 Years |
Crunch Fitness | Lawrenceville, GA | | (a) | | 2,095 |
| | 2,463 |
| | — |
| | 22 |
| | 2,095 |
| | 2,485 |
| | 4,580 |
| | (36 | ) | | 2017 | | 08/21/18 | | 12 to 39 Years |
|
| | | | | | | | | | | | | | | | | | | | | | | | | | | | | | | | | |
Dave & Buster's | Marietta, GA | | (a) | | 3,908 |
| | 8,630 |
| | (74 | ) | | — |
| | 3,834 |
| | 8,630 |
| | 12,464 |
| | (4,090 | ) | | 1992 | | 07/01/05 | | 15 to 30 Years |
Denny's | Fountain Hills, AZ | | (a) | | 825 |
| | 561 |
| | — |
| | — |
| | 825 |
| | 561 |
| | 1,386 |
| | (395 | ) | | 1995 | | 09/24/04 | | 15 to 30 Years |
Diagnostic Health | Port Arthur, TX | | (a) | | 468 |
| | 2,057 |
| | — |
| | — |
| | 468 |
| | 2,057 |
| | 2,525 |
| | (397 | ) | | 1997 | | 03/31/14 | | 15 to 30 Years |
Diagnostic Health | Beaumont, TX | | (a) | | 438 |
| | 1,976 |
| | — |
| | — |
| | 438 |
| | 1,976 |
| | 2,414 |
| | (384 | ) | | 1985 | | 03/31/14 | | 15 to 30 Years |
Dillon Tire | Lincoln, NE | | (a) | | 1,319 |
| | 1,604 |
| | (1 | ) | | — |
| | 1,318 |
| | 1,604 |
| | 2,922 |
| | (947 | ) | | 1972 | | 04/29/11 | | 11 to 26 Years |
Dollar General | Laurel, MS | | (a) | | 431 |
| | 705 |
| | 2 |
| | 2 |
| | 433 |
| | 707 |
| | 1,140 |
| | (112 | ) | | 2012 | | 06/22/15 | | 11 to 40 Years |
Dollar General | Oppelo, AR | | (a) | | 354 |
| | 553 |
| | 13 |
| | 20 |
| | 367 |
| | 573 |
| | 940 |
| | (100 | ) | | 2015 | | 07/14/15 | | 14 to 40 Years |
Dollar General | Red Oak, OK | | (a) | | 245 |
| | 675 |
| | 3 |
| | 8 |
| | 248 |
| | 683 |
| | 931 |
| | (88 | ) | | 2015 | | 07/14/15 | | 13 to 40 Years |
Eddie Merlot's | Fort Wayne, IN | | (a) | | 989 |
| | 2,057 |
| | — |
| | — |
| | 989 |
| | 2,057 |
| | 3,046 |
| | (899 | ) | | 2001 | | 11/10/05 | | 15 to 30 Years |
Eddie Merlot's | Indianapolis, IN | | (a) | | 1,971 |
| | 2,295 |
| | — |
| | — |
| | 1,971 |
| | 2,295 |
| | 4,266 |
| | (782 | ) | | 2003 | | 11/10/05 | | 15 to 40 Years |
Eddie Merlot's | Burr Ridge, IL | | (a) | | 759 |
| | 977 |
| | 16 |
| | 1,584 |
| | 775 |
| | 2,561 |
| | 3,336 |
| | (1,344 | ) | | 1997 | | 06/25/04 | | 15 to 30 Years |
SPIRIT MTA REIT
Schedule III Real Estate and
Accumulated Depreciation
(Amounts in thousands)
|
| | | | | | | | | | | | | | | | | | | | | | | | | |
| | | | | Initial Cost to Company | | Cost Capitalized Subsequent to Acquisition including impairment | | Gross Amount at December 31, 2018 | | | | | | | | |
Concept | City, State | | Encumbrances (d) | | Land and Improvements | | Buildings and Improvements | | Land and Improvements | | Buildings and Improvements | | Land and Improvements | | Buildings and Improvements | | Total | | Final Accumulated Depreciation | | Date of Construction | | Date Acquired | | Life in which depreciation in latest Statement of Operations is computed |
|
| | | | | | | | | | | | | | | | | | | | | | | | | | | | | | | | | |
El Chico | Tulsa, OK | | (a) | | 983 |
| | 1,232 |
| | (716 | ) | | (924 | ) | | 267 |
| | 308 |
| | 575 |
| | (114 | ) | | 1976 | | 02/26/07 | | 3 to 19 Years |
Express Oil Change | Birmingham, AL | | (a) | | 300 |
| | 839 |
| | — |
| | — |
| | 300 |
| | 839 |
| | 1,139 |
| | (192 | ) | | 1998 | | 12/22/06 | | 50 to 50 Years |
Express Oil Change | Bessemer, AL | | (a) | | 358 |
| | 1,197 |
| | — |
| | — |
| | 358 |
| | 1,197 |
| | 1,555 |
| | (342 | ) | | 1988 | | 12/22/06 | | 40 to 40 Years |
Express Oil Change | Birmingham, AL | | (a) | | 334 |
| | 1,119 |
| | — |
| | — |
| | 334 |
| | 1,119 |
| | 1,453 |
| | (319 | ) | | 1989 | | 12/22/06 | | 40 to 40 Years |
Express Oil Change | Huntsville, AL | | (a) | | 252 |
| | 917 |
| | — |
| | — |
| | 252 |
| | 917 |
| | 1,169 |
| | (349 | ) | | 1965 | | 12/22/06 | | 30 to 30 Years |
Express Oil Change | Birmingham, AL | | (a) | | 343 |
| | 901 |
| | — |
| | — |
| | 343 |
| | 901 |
| | 1,244 |
| | (257 | ) | | 1989 | | 12/22/06 | | 40 to 40 Years |
Express Oil Change | Oxford, AL | | (a) | | 120 |
| | 1,224 |
| | — |
| | — |
| | 120 |
| | 1,224 |
| | 1,344 |
| | (349 | ) | | 1990 | | 12/22/06 | | 40 to 40 Years |
Express Oil Change | Huntsville, AL | | (a) | | 184 |
| | 1,037 |
| | — |
| | — |
| | 184 |
| | 1,037 |
| | 1,221 |
| | (237 | ) | | 2001 | | 12/22/06 | | 50 to 50 Years |
Express Oil Change | Auburn, AL | | (a) | | 354 |
| | 1,182 |
| | 30 |
| | 78 |
| | 384 |
| | 1,260 |
| | 1,644 |
| | (500 | ) | | 1987 | | 12/22/06 | | 15 to 30 Years |
Express Oil Change | Alabaster, AL | | (a) | | 631 |
| | 1,010 |
| | — |
| | — |
| | 631 |
| | 1,010 |
| | 1,641 |
| | (288 | ) | | 1995 | | 12/22/06 | | 40 to 40 Years |
Express Oil Change | Florence, AL | | (a) | | 130 |
| | 1,128 |
| | — |
| | — |
| | 130 |
| | 1,128 |
| | 1,258 |
| | (258 | ) | | 1999 | | 12/22/06 | | 50 to 50 Years |
Express Oil Change | Madison, AL | | (a) | | 211 |
| | 1,401 |
| | — |
| | — |
| | 211 |
| | 1,401 |
| | 1,612 |
| | (400 | ) | | 1997 | | 12/22/06 | | 40 to 40 Years |
Express Oil Change | Gardendale, AL | | (a) | | 586 |
| | 1,274 |
| | — |
| | — |
| | 586 |
| | 1,274 |
| | 1,860 |
| | (364 | ) | | 1989 | | 12/22/06 | | 40 to 40 Years |
SPIRIT MTA REIT
Schedule III Real Estate and
Accumulated Depreciation
(Amounts in thousands)
|
| | | | | | | | | | | | | | | | | | | | | | | | | |
| | | | | Initial Cost to Company | | Cost Capitalized Subsequent to Acquisition including impairment | | Gross Amount at December 31, 2018 | | | | | | | | |
Concept | City, State | | Encumbrances (d) | | Land and Improvements | | Buildings and Improvements | | Land and Improvements | | Buildings and Improvements | | Land and Improvements | | Buildings and Improvements | | Total | | Final Accumulated Depreciation | | Date of Construction | | Date Acquired | | Life in which depreciation in latest Statement of Operations is computed |
|
| | | | | | | | | | | | | | | | | | | | | | | | | | | | | | | | | |
Express Oil Change | Decatur, AL | | (a) | | 187 |
| | 1,174 |
| | 141 |
| | 742 |
| | 328 |
| | 1,916 |
| | 2,244 |
| | (317 | ) | | 2000 | | 12/22/06 | | 19 to 50 Years |
Express Oil Change | Birmingham, AL | | (a) | | 607 |
| | 1,379 |
| | — |
| | — |
| | 607 |
| | 1,379 |
| | 1,986 |
| | (394 | ) | | 1988 | | 12/22/06 | | 40 to 40 Years |
Express Oil Change | Birmingham, AL | | (a) | | 339 |
| | 858 |
| | — |
| | — |
| | 339 |
| | 858 |
| | 1,197 |
| | (245 | ) | | 1990 | | 12/22/06 | | 40 to 40 Years |
Express Oil Change | Madison, AL | | (a) | | 359 |
| | 1,505 |
| | 40 |
| | 456 |
| | 399 |
| | 1,961 |
| | 2,360 |
| | (473 | ) | | 1995 | | 12/22/06 | | 15 to 40 Years |
Express Oil Change | Huntsville, AL | | (a) | | 295 |
| | 893 |
| | — |
| | — |
| | 295 |
| | 893 |
| | 1,188 |
| | (255 | ) | | 1994 | | 12/22/06 | | 40 to 40 Years |
Express Oil Change | Pinson, AL | | (a) | | 320 |
| | 916 |
| | — |
| | — |
| | 320 |
| | 916 |
| | 1,236 |
| | (209 | ) | | 2001 | | 12/22/06 | | 50 to 50 Years |
Express Oil Change | Huntsville, AL | | (a) | | 374 |
| | 1,295 |
| | — |
| | 109 |
| | 374 |
| | 1,404 |
| | 1,778 |
| | (424 | ) | | 1997 | | 12/22/06 | | 19 to 40 Years |
Express Oil Change | Birmingham, AL | | (a) | | 372 |
| | 1,073 |
| | — |
| | — |
| | 372 |
| | 1,073 |
| | 1,445 |
| | (408 | ) | | 1965 | | 12/22/06 | | 30 to 30 Years |
Express Oil Change | Birmingham, AL | | (a) | | 417 |
| | 1,237 |
| | — |
| | — |
| | 417 |
| | 1,237 |
| | 1,654 |
| | (353 | ) | | 1970 | | 12/22/06 | | 40 to 40 Years |
Express Oil Change | Decatur, AL | | (a) | | 84 |
| | 803 |
| | — |
| | — |
| | 84 |
| | 803 |
| | 887 |
| | (183 | ) | | 2001 | | 12/22/06 | | 50 to 50 Years |
Express Oil Change | Huntsville, AL | | (a) | | 195 |
| | 1,649 |
| | — |
| | — |
| | 195 |
| | 1,649 |
| | 1,844 |
| | (471 | ) | | 1993 | | 12/22/06 | | 40 to 40 Years |
Family Dollar Stores | Texarkana, AR | | (a) | | 303 |
| | 201 |
| | — |
| | — |
| | 303 |
| | 201 |
| | 504 |
| | (75 | ) | | 1988 | | 03/31/14 | | 4 to 20 Years |
Famous Dave's | Maple Grove, MN | | (a) | | 1,852 |
| | 1,096 |
| | — |
| | — |
| | 1,852 |
| | 1,096 |
| | 2,948 |
| | (680 | ) | | 1997 | | 09/24/04 | | 15 to 30 Years |
SPIRIT MTA REIT
Schedule III Real Estate and
Accumulated Depreciation
(Amounts in thousands)
|
| | | | | | | | | | | | | | | | | | | | | | | | | |
| | | | | Initial Cost to Company | | Cost Capitalized Subsequent to Acquisition including impairment | | Gross Amount at December 31, 2018 | | | | | | | | |
Concept | City, State | | Encumbrances (d) | | Land and Improvements | | Buildings and Improvements | | Land and Improvements | | Buildings and Improvements | | Land and Improvements | | Buildings and Improvements | | Total | | Final Accumulated Depreciation | | Date of Construction | | Date Acquired | | Life in which depreciation in latest Statement of Operations is computed |
|
| | | | | | | | | | | | | | | | | | | | | | | | | | | | | | | | | |
Famous Dave's | Apple Valley, MN | | (a) | | 1,119 |
| | 1,055 |
| | — |
| | — |
| | 1,119 |
| | 1,055 |
| | 2,174 |
| | (568 | ) | | 1999 | | 09/24/04 | | 15 to 30 Years |
Fazoli's | Lees Summit, MO | | (a) | | 590 |
| | 69 |
| | 55 |
| | (69 | ) | | 645 |
| | — |
| | 645 |
| | — |
| | (f) | | 09/23/05 | | (f) |
Fazoli's | Rochester, MN | | (a) | | 561 |
| | 83 |
| | 66 |
| | (83 | ) | | 627 |
| | — |
| | 627 |
| | — |
| | (f) | | 09/23/05 | | (f) |
Fazoli's | Fort Wayne, IN | | (a) | | 660 |
| | 204 |
| | — |
| | — |
| | 660 |
| | 204 |
| | 864 |
| | (315 | ) | | 1982 | | 09/23/05 | | 10 to 15 Years |
Fitness Evolution | Sacramento, CA | | (c) | | 1,236 |
| | 2,883 |
| | — |
| | — |
| | 1,236 |
| | 2,883 |
| | 4,119 |
| | (537 | ) | | 1990 | | 09/29/15 | | 15 to 20 Years |
Flying Star Café | Albuquerque, NM | | (a) | | 1,036 |
| | 1,655 |
| | — |
| | — |
| | 1,036 |
| | 1,655 |
| | 2,691 |
| | (890 | ) | | 1994 | | 07/01/05 | | 15 to 30 Years |
Flying Star Café | Albuquerque, NM | | (a) | | 120 |
| | 1,336 |
| | — |
| | — |
| | 120 |
| | 1,336 |
| | 1,456 |
| | (508 | ) | | 1999 | | 07/01/05 | | 30 to 30 Years |
Focus Child Development Center | Riverdale, GA | | (a) | | 436 |
| | 525 |
| | (185 | ) | | (229 | ) | | 251 |
| | 296 |
| | 547 |
| | (4 | ) | | 1965 | | 06/29/16 | | 7 to 27 Years |
Focus Child Development Center | Riverdale, GA | | (a) | | 663 |
| | 1,336 |
| | (198 | ) | | (369 | ) | | 465 |
| | 967 |
| | 1,432 |
| | (10 | ) | | 1998 | | 06/29/16 | | 7 to 40 Years |
Focus Child Development Center | Dalton, GA | | (a) | | 396 |
| | 1,396 |
| | — |
| | — |
| | 396 |
| | 1,396 |
| | 1,792 |
| | (117 | ) | | 1996 | | 06/29/16 | | 10 to 40 Years |
Fred's Super Dollar | Cabot, AR | | (a) | | 132 |
| | 404 |
| | — |
| | — |
| | 132 |
| | 404 |
| | 536 |
| | (198 | ) | | 1970 | | 03/31/14 | | 1 to 15 Years |
Fuddruckers | Glendale, AZ | | (a) | | 1,236 |
| | 272 |
| | — |
| | — |
| | 1,236 |
| | 272 |
| | 1,508 |
| | (296 | ) | | 1995 | | 06/25/04 | | 15 to 20 Years |
Fuddruckers | Mesa, AZ | | (a) | | 1,318 |
| | 234 |
| | — |
| | — |
| | 1,318 |
| | 234 |
| | 1,552 |
| | (287 | ) | | 1995 | | 06/25/04 | | 15 to 20 Years |
SPIRIT MTA REIT
Schedule III Real Estate and
Accumulated Depreciation
(Amounts in thousands)
|
| | | | | | | | | | | | | | | | | | | | | | | | | |
| | | | | Initial Cost to Company | | Cost Capitalized Subsequent to Acquisition including impairment | | Gross Amount at December 31, 2018 | | | | | | | | |
Concept | City, State | | Encumbrances (d) | | Land and Improvements | | Buildings and Improvements | | Land and Improvements | | Buildings and Improvements | | Land and Improvements | | Buildings and Improvements | | Total | | Final Accumulated Depreciation | | Date of Construction | | Date Acquired | | Life in which depreciation in latest Statement of Operations is computed |
|
| | | | | | | | | | | | | | | | | | | | | | | | | | | | | | | | | |
Fuddruckers | Kingwood, TX | | (a) | | 936 |
| | 387 |
| | — |
| | (131 | ) | | 936 |
| | 256 |
| | 1,192 |
| | (225 | ) | | 1994 | | 06/25/04 | | 15 to 30 Years |
Fuddruckers | Houston, TX | | (a) | | 1,098 |
| | 439 |
| | — |
| | — |
| | 1,098 |
| | 439 |
| | 1,537 |
| | (418 | ) | | 1995 | | 06/25/04 | | 15 to 40 Years |
Fuddruckers | Houston, TX | | (a) | | 1,156 |
| | 352 |
| | (22 | ) | | — |
| | 1,134 |
| | 352 |
| | 1,486 |
| | (347 | ) | | 1995 | | 06/25/04 | | 15 to 30 Years |
Gerber Collision & Glass | Clayton, NC | | (a) | | 684 |
| | 1,254 |
| | — |
| | — |
| | 684 |
| | 1,254 |
| | 1,938 |
| | (254 | ) | | 2001 | | 03/31/14 | | 7 to 30 Years |
Gerber Collision & Glass | Greensboro, NC | | (a) | | 721 |
| | 1,179 |
| | — |
| | — |
| | 721 |
| | 1,179 |
| | 1,900 |
| | (263 | ) | | 2002 | | 03/31/14 | | 7 to 30 Years |
Golden Corral | Fort Smith, AR | | (a) | | 1,503 |
| | 1,323 |
| | — |
| | — |
| | 1,503 |
| | 1,323 |
| | 2,826 |
| | (1,060 | ) | | 1993 | | 09/23/05 | | 15 to 20 Years |
Golden Corral | Branson, MO | | (a) | | 1,497 |
| | 1,684 |
| | — |
| | — |
| | 1,497 |
| | 1,684 |
| | 3,181 |
| | (973 | ) | | 1994 | | 09/23/05 | | 15 to 30 Years |
Golden Corral | Springfield, MO | | (a) | | 1,655 |
| | 1,467 |
| | — |
| | — |
| | 1,655 |
| | 1,467 |
| | 3,122 |
| | (937 | ) | | 1993 | | 09/23/05 | | 15 to 30 Years |
Golden Corral | North Little Rock, AR | | (a) | | 1,398 |
| | 1,289 |
| | — |
| | — |
| | 1,398 |
| | 1,289 |
| | 2,687 |
| | (968 | ) | | 1993 | | 09/23/05 | | 15 to 20 Years |
Golden Corral | Lynchburg, VA | | (a) | | 2,033 |
| | 2,013 |
| | 11 |
| | 12 |
| | 2,044 |
| | 2,025 |
| | 4,069 |
| | (496 | ) | | 2000 | | 08/21/13 | | 12 to 30 Years |
Golden Corral | Lexington, NC | | (a) | | 910 |
| | 1,059 |
| | — |
| | — |
| | 910 |
| | 1,059 |
| | 1,969 |
| | (278 | ) | | 1998 | | 10/25/13 | | 15 to 30 Years |
Golden Corral | Gallipolis, OH | | (a) | | 375 |
| | 1,295 |
| | — |
| | — |
| | 375 |
| | 1,295 |
| | 1,670 |
| | (289 | ) | | 1996 | | 10/25/13 | | 15 to 30 Years |
Golden Corral | Danville, VA | | (a) | | 957 |
| | 2,813 |
| | 6 |
| | 16 |
| | 963 |
| | 2,829 |
| | 3,792 |
| | (482 | ) | | 2009 | | 08/21/13 | | 12 to 40 Years |
SPIRIT MTA REIT
Schedule III Real Estate and
Accumulated Depreciation
(Amounts in thousands)
|
| | | | | | | | | | | | | | | | | | | | | | | | | |
| | | | | Initial Cost to Company | | Cost Capitalized Subsequent to Acquisition including impairment | | Gross Amount at December 31, 2018 | | | | | | | | |
Concept | City, State | | Encumbrances (d) | | Land and Improvements | | Buildings and Improvements | | Land and Improvements | | Buildings and Improvements | | Land and Improvements | | Buildings and Improvements | | Total | | Final Accumulated Depreciation | | Date of Construction | | Date Acquired | | Life in which depreciation in latest Statement of Operations is computed |
|
| | | | | | | | | | | | | | | | | | | | | | | | | | | | | | | | | |
Golden Corral | Colonial Heights, VA | | (a) | | 1,947 |
| | 500 |
| | 37 |
| | 1,463 |
| | 1,984 |
| | 1,963 |
| | 3,947 |
| | (232 | ) | | 1989 | | 10/25/13 | | 15 to 40 Years |
Golden Corral | Roanoke, VA | | (a) | | 1,362 |
| | 1,836 |
| | 8 |
| | 10 |
| | 1,370 |
| | 1,846 |
| | 3,216 |
| | (384 | ) | | 2000 | | 08/21/13 | | 11 to 30 Years |
Golden Corral | New Boston, OH | | (a) | | 599 |
| | 1,498 |
| | (450 | ) | | (1,147 | ) | | 149 |
| | 351 |
| | 500 |
| | (17 | ) | | 1996 | | 10/25/13 | | 10 to 25 Years |
Gold's Gym | Grand Junction, CO | | (a) | | 1,825 |
| | 10,478 |
| | — |
| | — |
| | 1,825 |
| | 10,478 |
| | 12,303 |
| | (954 | ) | | 2007 | | 11/05/15 | | 15 to 40 Years |
Gold's Gym | Clifton, CO | | (a) | | 1,280 |
| | 6,975 |
| | — |
| | — |
| | 1,280 |
| | 6,975 |
| | 8,255 |
| | (898 | ) | | 1983 | | 06/30/15 | | 15 to 30 Years |
Goodrich Quality Theaters | Batavia, IL | | (a) | | 4,705 |
| | 7,561 |
| | — |
| | — |
| | 4,705 |
| | 7,561 |
| | 12,266 |
| | (3,196 | ) | | 1995 | | 06/30/09 | | 11 to 38 Years |
Goodrich Quality Theaters | Noblesville, IN | | (a) | | 1,760 |
| | — |
| | 2,338 |
| | 10,172 |
| | 4,098 |
| | 10,172 |
| | 14,270 |
| | (4,241 | ) | | 2008 | | 06/30/09 | | 14 to 39 Years |
Goodrich Quality Theaters | Saginaw, MI | | (a) | | 2,538 |
| | 8,359 |
| | — |
| | — |
| | 2,538 |
| | 8,359 |
| | 10,897 |
| | (1,306 | ) | | 2013 | | 12/02/13 | | 15 to 50 Years |
|
| | | | | | | | | | | | | | | | | | | | | | | | | | | | | | | | | |
Goodrich Quality Theaters | Portage, IN | | (a) | | 4,621 |
| | 8,300 |
| | — |
| | — |
| | 4,621 |
| | 8,300 |
| | 12,921 |
| | (3,909 | ) | | 2007 | | 06/30/09 | | 13 to 38 Years |
Greater Texas Emergency Centers | Midland, TX | | (c) | | 3,074 |
| | 2,033 |
| | — |
| | — |
| | 3,074 |
| | 2,033 |
| | 5,107 |
| | (198 | ) | | 2015 | | 06/20/16 | | 11 to 50 Years |
GYM-550 | Pawtucket, RI | | (a) | | 946 |
| | 3,093 |
| | (598 | ) | | (1,889 | ) | | 348 |
| | 1,204 |
| | 1,552 |
| | (16 | ) | | 1980 | | 06/28/16 | | 2 to 30 Years |
|
| | | | | | | | | | | | | | | | | | | | | | | | | | | | | | | | | |
Hajoca Corporation | Sebring, FL | | (a) | | 318 |
| | 291 |
| | — |
| | — |
| | 318 |
| | 291 |
| | 609 |
| | (237 | ) | | 1982 | | 07/01/05 | | 15 to 20 Years |
Hajoca Corporation | West Columbia, SC | | (a) | | 262 |
| | 598 |
| | — |
| | — |
| | 262 |
| | 598 |
| | 860 |
| | (407 | ) | | 1984 | | 05/01/05 | | 9 to 20 Years |
SPIRIT MTA REIT
Schedule III Real Estate and
Accumulated Depreciation
(Amounts in thousands)
|
| | | | | | | | | | | | | | | | | | | | | | | | | |
| | | | | Initial Cost to Company | | Cost Capitalized Subsequent to Acquisition including impairment | | Gross Amount at December 31, 2018 | | | | | | | | |
Concept | City, State | | Encumbrances (d) | | Land and Improvements | | Buildings and Improvements | | Land and Improvements | | Buildings and Improvements | | Land and Improvements | | Buildings and Improvements | | Total | | Final Accumulated Depreciation | | Date of Construction | | Date Acquired | | Life in which depreciation in latest Statement of Operations is computed |
|
| | | | | | | | | | | | | | | | | | | | | | | | | | | | | | | | | |
Hajoca Corporation | D'Iberville, MS | | (a) | | 250 |
| | 339 |
| | — |
| | — |
| | 250 |
| | 339 |
| | 589 |
| | (238 | ) | | 1984 | | 05/01/05 | | 15 to 20 Years |
Hajoca Corporation | Aiken, SC | | (a) | | 108 |
| | 265 |
| | — |
| | — |
| | 108 |
| | 265 |
| | 373 |
| | (169 | ) | | 1985 | | 05/01/05 | | 15 to 20 Years |
Hajoca Corporation | Statesville, NC | | (a) | | 614 |
| | 355 |
| | — |
| | — |
| | 614 |
| | 355 |
| | 969 |
| | (439 | ) | | 1976 | | 05/01/05 | | 9 to 15 Years |
Hajoca Corporation | Greenville, SC | | (a) | | 344 |
| | 210 |
| | — |
| | — |
| | 344 |
| | 210 |
| | 554 |
| | (278 | ) | | 1981 | | 05/01/05 | | 9 to 15 Years |
Hardee's | Watertown, WI | | (a) | | 267 |
| | 338 |
| | — |
| | — |
| | 267 |
| | 338 |
| | 605 |
| | (228 | ) | | 1986 | | 06/30/09 | | 13 to 18 Years |
Hardee's | Adairsville, GA | | (a) | | 557 |
| | 318 |
| | — |
| | — |
| | 557 |
| | 318 |
| | 875 |
| | (214 | ) | | 1986 | | 09/29/06 | | 15 to 20 Years |
Hardee's | Mayfield, KY | | (a) | | 316 |
| | 603 |
| | — |
| | — |
| | 316 |
| | 603 |
| | 919 |
| | (367 | ) | | 1986 | | 12/08/09 | | 12 to 27 Years |
Hardee's | East Ellijay, GA | | (a) | | 562 |
| | 354 |
| | — |
| | — |
| | 562 |
| | 354 |
| | 916 |
| | (296 | ) | | 1984 | | 12/29/05 | | 15 to 20 Years |
|
| | | | | | | | | | | | | | | | | | | | | | | | | | | | | | | | | |
Hardee's | Paxton, IL | | (a) | | 324 |
| | 658 |
| | — |
| | — |
| | 324 |
| | 658 |
| | 982 |
| | (553 | ) | | 1986 | | 12/29/05 | | 15 to 20 Years |
Hardee's | Hawkinsville, GA | | (a) | | 169 |
| | 946 |
| | — |
| | — |
| | 169 |
| | 946 |
| | 1,115 |
| | (198 | ) | | 1986 | | 12/24/13 | | 15 to 30 Years |
Hardee's | Griffin, GA | | (a) | | 249 |
| | 877 |
| | — |
| | — |
| | 249 |
| | 877 |
| | 1,126 |
| | (183 | ) | | 1979 | | 12/24/13 | | 15 to 30 Years |
Hardee's | Warner Robins, GA | | (a) | | 229 |
| | 887 |
| | — |
| | — |
| | 229 |
| | 887 |
| | 1,116 |
| | (201 | ) | | 1978 | | 12/24/13 | | 15 to 30 Years |
Hardee's | McDonough, GA | | (a) | | 418 |
| | 847 |
| | — |
| | — |
| | 418 |
| | 847 |
| | 1,265 |
| | (198 | ) | | 1995 | | 12/24/13 | | 15 to 30 Years |
SPIRIT MTA REIT
Schedule III Real Estate and
Accumulated Depreciation
(Amounts in thousands)
|
| | | | | | | | | | | | | | | | | | | | | | | | | |
| | | | | Initial Cost to Company | | Cost Capitalized Subsequent to Acquisition including impairment | | Gross Amount at December 31, 2018 | | | | | | | | |
Concept | City, State | | Encumbrances (d) | | Land and Improvements | | Buildings and Improvements | | Land and Improvements | | Buildings and Improvements | | Land and Improvements | | Buildings and Improvements | | Total | | Final Accumulated Depreciation | | Date of Construction | | Date Acquired | | Life in which depreciation in latest Statement of Operations is computed |
|
| | | | | | | | | | | | | | | | | | | | | | | | | | | | | | | | | |
Hardee's | Atlanta, GA | | (a) | | 309 |
| | 867 |
| | — |
| | — |
| | 309 |
| | 867 |
| | 1,176 |
| | (184 | ) | | 1994 | | 12/24/13 | | 15 to 30 Years |
Hardee's | Thomasville, GA | | (a) | | 408 |
| | 837 |
| | — |
| | — |
| | 408 |
| | 837 |
| | 1,245 |
| | (179 | ) | | 1985 | | 12/24/13 | | 15 to 30 Years |
Hardee's | Graceville, FL | | (a) | | 279 |
| | 1,036 |
| | — |
| | — |
| | 279 |
| | 1,036 |
| | 1,315 |
| | (232 | ) | | 1985 | | 12/24/13 | | 15 to 30 Years |
Hardee's | McDonough, GA | | (a) | | 179 |
| | 806 |
| | — |
| | 1 |
| | 179 |
| | 807 |
| | 986 |
| | (168 | ) | | 1989 | | 12/24/13 | | 15 to 30 Years |
Hardee's | Commerce, GA | | (a) | | 219 |
| | 797 |
| | — |
| | — |
| | 219 |
| | 797 |
| | 1,016 |
| | (173 | ) | | 1990 | | 12/24/13 | | 15 to 30 Years |
Hardee's | Quitman, GA | | (a) | | 259 |
| | 936 |
| | — |
| | — |
| | 259 |
| | 936 |
| | 1,195 |
| | (196 | ) | | 1985 | | 12/24/13 | | 15 to 30 Years |
Hardee's | Monroe, GA | | (a) | | 618 |
| | 787 |
| | — |
| | — |
| | 618 |
| | 787 |
| | 1,405 |
| | (188 | ) | | 1977 | | 12/24/13 | | 15 to 30 Years |
Hardee's | Pearson, GA | | (a) | | 159 |
| | 817 |
| | — |
| | — |
| | 159 |
| | 817 |
| | 976 |
| | (176 | ) | | 1994 | | 12/24/13 | | 15 to 30 Years |
Hardee's | Forsyth, GA | | (a) | | 249 |
| | 936 |
| | — |
| | — |
| | 249 |
| | 936 |
| | 1,185 |
| | (203 | ) | | 1983 | | 12/24/13 | | 15 to 30 Years |
Hardee's | Cumming, GA | | (a) | | 408 |
| | 827 |
| | — |
| | — |
| | 408 |
| | 827 |
| | 1,235 |
| | (188 | ) | | 1988 | | 12/24/13 | | 15 to 30 Years |
Hardee's | Moultrie, GA | | (a) | | 359 |
| | 827 |
| | — |
| | — |
| | 359 |
| | 827 |
| | 1,186 |
| | (174 | ) | | 1997 | | 12/24/13 | | 15 to 30 Years |
Hardee's | Kansas City, MO | | (a) | | 538 |
| | 936 |
| | — |
| | — |
| | 538 |
| | 936 |
| | 1,474 |
| | (209 | ) | | 1979 | | 12/24/13 | | 15 to 30 Years |
Hardee's | Independence, MO | | (a) | | 279 |
| | 936 |
| | — |
| | — |
| | 279 |
| | 936 |
| | 1,215 |
| | (196 | ) | | 1979 | | 12/24/13 | | 15 to 30 Years |
SPIRIT MTA REIT
Schedule III Real Estate and
Accumulated Depreciation
(Amounts in thousands)
|
| | | | | | | | | | | | | | | | | | | | | | | | | |
| | | | | Initial Cost to Company | | Cost Capitalized Subsequent to Acquisition including impairment | | Gross Amount at December 31, 2018 | | | | | | | | |
Concept | City, State | | Encumbrances (d) | | Land and Improvements | | Buildings and Improvements | | Land and Improvements | | Buildings and Improvements | | Land and Improvements | | Buildings and Improvements | | Total | | Final Accumulated Depreciation | | Date of Construction | | Date Acquired | | Life in which depreciation in latest Statement of Operations is computed |
|
| | | | | | | | | | | | | | | | | | | | | | | | | | | | | | | | | |
Hardee's | Trenton, MO | | (a) | | 309 |
| | 1,175 |
| | — |
| | — |
| | 309 |
| | 1,175 |
| | 1,484 |
| | (246 | ) | | 1976 | | 12/24/13 | | 15 to 30 Years |
Hardee's | Emporia, KS | | (a) | | 508 |
| | 1,175 |
| | — |
| | — |
| | 508 |
| | 1,175 |
| | 1,683 |
| | (256 | ) | | 1969 | | 12/24/13 | | 15 to 30 Years |
Hardee's | Rolla, MO | | (a) | | 229 |
| | 857 |
| | — |
| | — |
| | 229 |
| | 857 |
| | 1,086 |
| | (183 | ) | | 1978 | | 12/24/13 | | 15 to 30 Years |
Hardee's | Columbia, MO | | (a) | | 339 |
| | 1,126 |
| | — |
| | — |
| | 339 |
| | 1,126 |
| | 1,465 |
| | (227 | ) | | 1985 | | 12/24/13 | | 15 to 30 Years |
Hardee's | Harrisonville, MO | | (a) | | 369 |
| | 1,195 |
| | — |
| | — |
| | 369 |
| | 1,195 |
| | 1,564 |
| | (252 | ) | | 1981 | | 12/24/13 | | 15 to 30 Years |
Hardee's | Lees Summit, MO | | (a) | | 319 |
| | 906 |
| | — |
| | — |
| | 319 |
| | 906 |
| | 1,225 |
| | (198 | ) | | 1985 | | 12/24/13 | | 15 to 30 Years |
Hardee's | Kansas City, KS | | (a) | | 289 |
| | 1,066 |
| | — |
| | — |
| | 289 |
| | 1,066 |
| | 1,355 |
| | (224 | ) | | 1980 | | 12/24/13 | | 15 to 30 Years |
Hardee's | Parkersburg, WV | | (a) | | 416 |
| | 658 |
| | — |
| | 75 |
| | 416 |
| | 733 |
| | 1,149 |
| | (526 | ) | | 1986 | | 03/07/07 | | 4 to 20 Years |
Heartland Dental | East Alton, IL | | (a) | | 170 |
| | 80 |
| | — |
| | — |
| | 170 |
| | 80 |
| | 250 |
| | (35 | ) | | 1960 | | 03/31/14 | | 15 to 20 Years |
Heartland Dental | Debary, FL | | (a) | | 100 |
| | 641 |
| | — |
| | — |
| | 100 |
| | 641 |
| | 741 |
| | (114 | ) | | 1989 | | 03/31/14 | | 15 to 30 Years |
Heartland Dental | Orlando, FL | | (a) | | 291 |
| | 230 |
| | — |
| | — |
| | 291 |
| | 230 |
| | 521 |
| | (46 | ) | | 1979 | | 03/31/14 | | 15 to 30 Years |
Heartland Dental | Mechanicsburg, PA | | (a) | | 231 |
| | 1,032 |
| | 152 |
| | 114 |
| | 383 |
| | 1,146 |
| | 1,529 |
| | (189 | ) | | 1990 | | 03/31/14 | | 15 to 30 Years |
Heartland Dental | Litchfield, IL | | (a) | | 210 |
| | 311 |
| | — |
| | — |
| | 210 |
| | 311 |
| | 521 |
| | (93 | ) | | 1962 | | 03/31/14 | | 15 to 20 Years |
SPIRIT MTA REIT
Schedule III Real Estate and
Accumulated Depreciation
(Amounts in thousands)
|
| | | | | | | | | | | | | | | | | | | | | | | | | |
| | | | | Initial Cost to Company | | Cost Capitalized Subsequent to Acquisition including impairment | | Gross Amount at December 31, 2018 | | | | | | | | |
Concept | City, State | | Encumbrances (d) | | Land and Improvements | | Buildings and Improvements | | Land and Improvements | | Buildings and Improvements | | Land and Improvements | | Buildings and Improvements | | Total | | Final Accumulated Depreciation | | Date of Construction | | Date Acquired | | Life in which depreciation in latest Statement of Operations is computed |
|
| | | | | | | | | | | | | | | | | | | | | | | | | | | | | | | | | |
Heartland Dental | Monroe, GA | | (a) | | 110 |
| | 631 |
| | — |
| | — |
| | 110 |
| | 631 |
| | 741 |
| | (119 | ) | | 2001 | | 03/31/14 | | 15 to 30 Years |
Heartland Dental | Raytown, MO | | (a) | | 80 |
| | 631 |
| | — |
| | — |
| | 80 |
| | 631 |
| | 711 |
| | (116 | ) | | 1989 | | 03/31/14 | | 15 to 30 Years |
Heartland Dental | Wylie, TX | | (a) | | 210 |
| | 912 |
| | — |
| | — |
| | 210 |
| | 912 |
| | 1,122 |
| | (167 | ) | | 1986 | | 03/31/14 | | 15 to 30 Years |
Heartland Dental | Anderson, IN | | (a) | | 411 |
| | 1,673 |
| | — |
| | — |
| | 411 |
| | 1,673 |
| | 2,084 |
| | (230 | ) | | 1981 | | 03/31/14 | | 15 to 40 Years |
Heartland Dental | Camp Hill, PA | | (a) | | 140 |
| | 641 |
| | — |
| | — |
| | 140 |
| | 641 |
| | 781 |
| | (114 | ) | | 1990 | | 03/31/14 | | 15 to 30 Years |
Heartland Dental | South Bend, IN | | (a) | | 341 |
| | 321 |
| | — |
| | — |
| | 341 |
| | 321 |
| | 662 |
| | (98 | ) | | 1955 | | 03/31/14 | | 15 to 20 Years |
Heartland Dental | Gainesville, FL | | (a) | | 180 |
| | 711 |
| | — |
| | — |
| | 180 |
| | 711 |
| | 891 |
| | (119 | ) | | 1941 | | 03/31/14 | | 15 to 30 Years |
Heartland Dental | Eastman, GA | | (a) | | 130 |
| | 551 |
| | — |
| | — |
| | 130 |
| | 551 |
| | 681 |
| | (113 | ) | | 1988 | | 03/31/14 | | 15 to 30 Years |
Heartland Dental | Columbia, MO | | (a) | | 1,012 |
| | 7,054 |
| | — |
| | — |
| | 1,012 |
| | 7,054 |
| | 8,066 |
| | (917 | ) | | 2004 | | 03/31/14 | | 15 to 40 Years |
Heartland Dental | Longview, TX | | (a) | | 200 |
| | 601 |
| | — |
| | — |
| | 200 |
| | 601 |
| | 801 |
| | (124 | ) | | 2003 | | 03/31/14 | | 15 to 30 Years |
Heartland Dental | Defiance, OH | | (a) | | 130 |
| | 491 |
| | — |
| | — |
| | 130 |
| | 491 |
| | 621 |
| | (97 | ) | | 1959 | | 03/31/14 | | 15 to 30 Years |
Heartland Dental | Marion, IN | | (a) | | 130 |
| | 421 |
| | — |
| | — |
| | 130 |
| | 421 |
| | 551 |
| | (89 | ) | | 1974 | | 03/31/14 | | 15 to 30 Years |
Heartland Dental | Melbourne, FL | | (a) | | 321 |
| | 651 |
| | — |
| | — |
| | 321 |
| | 651 |
| | 972 |
| | (113 | ) | | 1987 | | 03/31/14 | | 15 to 30 Years |
SPIRIT MTA REIT
Schedule III Real Estate and
Accumulated Depreciation
(Amounts in thousands)
|
| | | | | | | | | | | | | | | | | | | | | | | | | |
| | | | | Initial Cost to Company | | Cost Capitalized Subsequent to Acquisition including impairment | | Gross Amount at December 31, 2018 | | | | | | | | |
Concept | City, State | | Encumbrances (d) | | Land and Improvements | | Buildings and Improvements | | Land and Improvements | | Buildings and Improvements | | Land and Improvements | | Buildings and Improvements | | Total | | Final Accumulated Depreciation | | Date of Construction | | Date Acquired | | Life in which depreciation in latest Statement of Operations is computed |
|
| | | | | | | | | | | | | | | | | | | | | | | | | | | | | | | | | |
Heartland Dental | Columbus, GA | | (a) | | 190 |
| | 531 |
| | — |
| | — |
| | 190 |
| | 531 |
| | 721 |
| | (113 | ) | | 1993 | | 03/31/14 | | 15 to 30 Years |
Heartland Dental | York, PA | | (a) | | 100 |
| | 481 |
| | — |
| | — |
| | 100 |
| | 481 |
| | 581 |
| | (86 | ) | | 1984 | | 03/31/14 | | 15 to 30 Years |
Heartland Dental | Osceola, IN | | (a) | | 291 |
| | 671 |
| | — |
| | — |
| | 291 |
| | 671 |
| | 962 |
| | (137 | ) | | 1996 | | 03/31/14 | | 15 to 40 Years |
Heartland Dental | Springfield, MO | | (a) | | 561 |
| | 631 |
| | — |
| | — |
| | 561 |
| | 631 |
| | 1,192 |
| | (132 | ) | | 1996 | | 03/31/14 | | 15 to 30 Years |
Heartland Dental | Pataskala, OH | | (a) | | 261 |
| | 782 |
| | — |
| | — |
| | 261 |
| | 782 |
| | 1,043 |
| | (118 | ) | | 1995 | | 03/31/14 | | 15 to 40 Years |
Heartland Dental | Glendale, AZ | | (a) | | 371 |
| | 491 |
| | — |
| | — |
| | 371 |
| | 491 |
| | 862 |
| | (90 | ) | | 1988 | | 03/31/14 | | 15 to 30 Years |
Heartland Dental | New Port Richey, FL | | (a) | | 456 |
| | 1,151 |
| | — |
| | — |
| | 456 |
| | 1,151 |
| | 1,607 |
| | (226 | ) | | 2004 | | 04/08/14 | | 15 to 30 Years |
Heartland Dental | Litchfield, IL | | (a) | | 110 |
| | 120 |
| | — |
| | — |
| | 110 |
| | 120 |
| | 230 |
| | (32 | ) | | 1962 | | 03/31/14 | | 15 to 20 Years |
Heartland Dental | Camp Hill, PA | | (a) | | 180 |
| | 581 |
| | — |
| | — |
| | 180 |
| | 581 |
| | 761 |
| | (108 | ) | | 1991 | | 03/31/14 | | 15 to 30 Years |
Heartland Dental | Fort Wayne, IN | | (a) | | 150 |
| | 1,022 |
| | — |
| | — |
| | 150 |
| | 1,022 |
| | 1,172 |
| | (140 | ) | | 1965 | | 03/31/14 | | 15 to 40 Years |
Heartland Dental | Brandon, MS | | (a) | | 200 |
| | 281 |
| | — |
| | — |
| | 200 |
| | 281 |
| | 481 |
| | (73 | ) | | 1986 | | 03/31/14 | | 15 to 30 Years |
Heartland Dental | Westfield, IN | | (a) | | 361 |
| | 751 |
| | — |
| | — |
| | 361 |
| | 751 |
| | 1,112 |
| | (134 | ) | | 1992 | | 03/31/14 | | 15 to 40 Years |
Heartland Dental | Gahanna, OH | | (a) | | 411 |
| | 982 |
| | — |
| | — |
| | 411 |
| | 982 |
| | 1,393 |
| | (193 | ) | | 1998 | | 03/31/14 | | 15 to 40 Years |
SPIRIT MTA REIT
Schedule III Real Estate and
Accumulated Depreciation
(Amounts in thousands)
|
| | | | | | | | | | | | | | | | | | | | | | | | | |
| | | | | Initial Cost to Company | | Cost Capitalized Subsequent to Acquisition including impairment | | Gross Amount at December 31, 2018 | | | | | | | | |
Concept | City, State | | Encumbrances (d) | | Land and Improvements | | Buildings and Improvements | | Land and Improvements | | Buildings and Improvements | | Land and Improvements | | Buildings and Improvements | | Total | | Final Accumulated Depreciation | | Date of Construction | | Date Acquired | | Life in which depreciation in latest Statement of Operations is computed |
|
| | | | | | | | | | | | | | | | | | | | | | | | | | | | | | | | | |
Heartland Dental | Brandon, FL | | (a) | | 110 |
| | 671 |
| | — |
| | — |
| | 110 |
| | 671 |
| | 781 |
| | (109 | ) | | 1999 | | 03/31/14 | | 15 to 30 Years |
Heartland Dental | Waynesboro, PA | | (a) | | 100 |
| | 601 |
| | — |
| | — |
| | 100 |
| | 601 |
| | 701 |
| | (84 | ) | | 1957 | | 03/31/14 | | 15 to 40 Years |
Heartland Dental | Belleville, IL | | (a) | | 140 |
| | 431 |
| | — |
| | — |
| | 140 |
| | 431 |
| | 571 |
| | (115 | ) | | 1979 | | 03/31/14 | | 15 to 20 Years |
Heartland Dental | Vero Beach, FL | | (a) | | 220 |
| | 731 |
| | — |
| | — |
| | 220 |
| | 731 |
| | 951 |
| | (129 | ) | | 1974 | | 03/31/14 | | 15 to 30 Years |
Heartland Dental | Maryville, IL | | (a) | | 301 |
| | 401 |
| | — |
| | — |
| | 301 |
| | 401 |
| | 702 |
| | (89 | ) | | 1995 | | 03/31/14 | | 15 to 30 Years |
Heartland Dental | Vicksburg, MS | | (a) | | 150 |
| | 351 |
| | — |
| | — |
| | 150 |
| | 351 |
| | 501 |
| | (78 | ) | | 1984 | | 03/31/14 | | 15 to 30 Years |
Heartland Dental | Clayton, GA | | (a) | | 70 |
| | 311 |
| | — |
| | — |
| | 70 |
| | 311 |
| | 381 |
| | (62 | ) | | 1963 | | 03/31/14 | | 15 to 30 Years |
Heartland Dental | Jacksonville, FL | | (a) | | 57 |
| | 365 |
| | — |
| | — |
| | 57 |
| | 365 |
| | 422 |
| | (61 | ) | | 1986 | | 04/08/14 | | 15 to 30 Years |
Heartland Dental | Okeechobee, FL | | (a) | | 190 |
| | 521 |
| | — |
| | — |
| | 190 |
| | 521 |
| | 711 |
| | (92 | ) | | 1990 | | 03/31/14 | | 15 to 30 Years |
Heartland Dental | Crystal Lake, IL | | (a) | | 200 |
| | 631 |
| | — |
| | — |
| | 200 |
| | 631 |
| | 831 |
| | (122 | ) | | 2001 | | 03/31/14 | | 15 to 30 Years |
Heartland Dental | New Port Richey, FL | | (a) | | 274 |
| | 1,162 |
| | — |
| | — |
| | 274 |
| | 1,162 |
| | 1,436 |
| | (202 | ) | | 2004 | | 04/08/14 | | 15 to 30 Years |
Heartland Dental | Rio Rancho, NM | | (a) | | 301 |
| | 461 |
| | — |
| | — |
| | 301 |
| | 461 |
| | 762 |
| | (95 | ) | | 1992 | | 03/31/14 | | 15 to 30 Years |
Heartland Dental | Springfield, IL | | (a) | | 451 |
| | 1,162 |
| | — |
| | — |
| | 451 |
| | 1,162 |
| | 1,613 |
| | (228 | ) | | 1992 | | 03/31/14 | | 15 to 30 Years |
SPIRIT MTA REIT
Schedule III Real Estate and
Accumulated Depreciation
(Amounts in thousands)
|
| | | | | | | | | | | | | | | | | | | | | | | | | |
| | | | | Initial Cost to Company | | Cost Capitalized Subsequent to Acquisition including impairment | | Gross Amount at December 31, 2018 | | | | | | | | |
Concept | City, State | | Encumbrances (d) | | Land and Improvements | | Buildings and Improvements | | Land and Improvements | | Buildings and Improvements | | Land and Improvements | | Buildings and Improvements | | Total | | Final Accumulated Depreciation | | Date of Construction | | Date Acquired | | Life in which depreciation in latest Statement of Operations is computed |
|
| | | | | | | | | | | | | | | | | | | | | | | | | | | | | | | | | |
Heartland Dental | Marion, IN | | (a) | | 140 |
| | 321 |
| | — |
| | — |
| | 140 |
| | 321 |
| | 461 |
| | (73 | ) | | 1988 | | 03/31/14 | | 15 to 30 Years |
Heartland Dental | Hartsville, SC | | (a) | | 90 |
| | 180 |
| | — |
| | — |
| | 90 |
| | 180 |
| | 270 |
| | (31 | ) | | 1973 | | 03/31/14 | | 15 to 40 Years |
Heartland Dental | North Myrtle Beach, SC | | (a) | | 581 |
| | 601 |
| | — |
| | — |
| | 581 |
| | 601 |
| | 1,182 |
| | (146 | ) | | 2004 | | 03/31/14 | | 15 to 30 Years |
Heartland Dental | Memphis, TN | | (a) | | 91 |
| | 490 |
| | — |
| | — |
| | 91 |
| | 490 |
| | 581 |
| | (85 | ) | | 1987 | | 04/08/14 | | 15 to 30 Years |
Heartland Dental | Largo, FL | | (a) | | 150 |
| | 311 |
| | — |
| | — |
| | 150 |
| | 311 |
| | 461 |
| | (56 | ) | | 1962 | | 03/31/14 | | 15 to 30 Years |
Heartland Dental | Elkhart, IN | | (a) | | 90 |
| | 341 |
| | — |
| | — |
| | 90 |
| | 341 |
| | 431 |
| | (60 | ) | | 1969 | | 03/31/14 | | 15 to 30 Years |
Heartland Dental | Devine, TX | | (a) | | 240 |
| | 481 |
| | — |
| | — |
| | 240 |
| | 481 |
| | 721 |
| | (105 | ) | | 2002 | | 03/31/14 | | 15 to 30 Years |
Heartland Dental | Clarksville, TN | | (a) | | 281 |
| | 531 |
| | — |
| | — |
| | 281 |
| | 531 |
| | 812 |
| | (97 | ) | | 1997 | | 03/31/14 | | 15 to 30 Years |
Heartland Dental | Wittenberg, WI | | (a) | | 41 |
| | 210 |
| | — |
| | — |
| | 41 |
| | 210 |
| | 251 |
| | (36 | ) | | 1982 | | 03/31/14 | | 15 to 30 Years |
Heartland Dental | Logansport, IN | | (a) | | 30 |
| | 421 |
| | — |
| | — |
| | 30 |
| | 421 |
| | 451 |
| | (70 | ) | | 1920 | | 03/31/14 | | 15 to 30 Years |
Heartland Dental | Ocala, FL | | (a) | | 23 |
| | 547 |
| | — |
| | — |
| | 23 |
| | 547 |
| | 570 |
| | (87 | ) | | 1984 | | 04/08/14 | | 30 to 30 Years |
Heartland Dental | Spartanburg, SC | | (a) | | 150 |
| | 401 |
| | — |
| | — |
| | 150 |
| | 401 |
| | 551 |
| | (76 | ) | | 1992 | | 03/31/14 | | 15 to 30 Years |
Heartland Dental | Bullhead City, AZ | | (a) | | 57 |
| | 946 |
| | — |
| | — |
| | 57 |
| | 946 |
| | 1,003 |
| | (120 | ) | | 2005 | | 04/08/14 | | 15 to 40 Years |
SPIRIT MTA REIT
Schedule III Real Estate and
Accumulated Depreciation
(Amounts in thousands)
|
| | | | | | | | | | | | | | | | | | | | | | | | | |
| | | | | Initial Cost to Company | | Cost Capitalized Subsequent to Acquisition including impairment | | Gross Amount at December 31, 2018 | | | | | | | | |
Concept | City, State | | Encumbrances (d) | | Land and Improvements | | Buildings and Improvements | | Land and Improvements | | Buildings and Improvements | | Land and Improvements | | Buildings and Improvements | | Total | | Final Accumulated Depreciation | | Date of Construction | | Date Acquired | | Life in which depreciation in latest Statement of Operations is computed |
|
| | | | | | | | | | | | | | | | | | | | | | | | | | | | | | | | | |
Heartland Dental | Germantown, TN | | (a) | | 91 |
| | 171 |
| | — |
| | — |
| | 91 |
| | 171 |
| | 262 |
| | (24 | ) | | 1984 | | 04/08/14 | | 15 to 40 Years |
Heartland Dental | Evansville, IN | | (a) | | 130 |
| | 391 |
| | — |
| | — |
| | 130 |
| | 391 |
| | 521 |
| | (78 | ) | | 1986 | | 03/31/14 | | 15 to 30 Years |
HHI-Formtech | Troy, MI | | (a) | | 1,128 |
| | 947 |
| | — |
| | — |
| | 1,128 |
| | 947 |
| | 2,075 |
| | (425 | ) | | 1952 | | 03/10/06 | | 15 to 30 Years |
HHI-Formtech | Royal Oak, MI | | (a) | | 3,426 |
| | 7,071 |
| | — |
| | — |
| | 3,426 |
| | 7,071 |
| | 10,497 |
| | (3,124 | ) | | 1952 | | 03/10/06 | | 15 to 30 Years |
HOM Furniture | Hermantown, MN | | (a) | | 1,881 |
| | 7,761 |
| | — |
| | — |
| | 1,881 |
| | 7,761 |
| | 9,642 |
| | (2,783 | ) | | 2003 | | 04/08/05 | | 15 to 40 Years |
HOM Furniture | Eau Claire, WI | | (a) | | 1,597 |
| | 6,964 |
| | — |
| | — |
| | 1,597 |
| | 6,964 |
| | 8,561 |
| | (3,353 | ) | | 2004 | | 04/08/05 | | 15 to 30 Years |
Hooters | Richmond, VA | | (a) | | 1,253 |
| | 1,410 |
| | — |
| | 29 |
| | 1,253 |
| | 1,439 |
| | 2,692 |
| | (645 | ) | | 1977 | | 11/28/06 | | 15 to 30 Years |
Hooters | Midlothian, VA | | (a) | | 823 |
| | 1,151 |
| | — |
| | 246 |
| | 823 |
| | 1,397 |
| | 2,220 |
| | (641 | ) | | 1994 | | 11/28/06 | | 15 to 30 Years |
Hughes | Bowling Green, KY | | (a) | | 136 |
| | 228 |
| | — |
| | 262 |
| | 136 |
| | 490 |
| | 626 |
| | (129 | ) | | 1993 | | 05/01/05 | | 15 to 30 Years |
Humperdinks | Arlington, TX | | (a) | | 2,064 |
| | 2,043 |
| | — |
| | — |
| | 2,064 |
| | 2,043 |
| | 4,107 |
| | (974 | ) | | 1995 | | 07/01/05 | | 15 to 30 Years |
Jack in the Box | Auburn, CA | | (a) | | 579 |
| | 299 |
| | — |
| | — |
| | 579 |
| | 299 |
| | 878 |
| | (170 | ) | | 1992 | | 12/29/06 | | 15 to 30 Years |
Jack Stack Barbeque | Overland Park, KS | | (a) | | 2,549 |
| | 3,219 |
| | — |
| | — |
| | 2,549 |
| | 3,219 |
| | 5,768 |
| | (611 | ) | | 1983 | | 05/15/14 | | 15 to 30 Years |
Jack's Family Restaurant | Attalla, AL | | (a) | | 814 |
| | 1,187 |
| | — |
| | 23 |
| | 814 |
| | 1,210 |
| | 2,024 |
| | (48 | ) | | 2008 | | 04/04/18 | | 10 to 30 Years |
SPIRIT MTA REIT
Schedule III Real Estate and
Accumulated Depreciation
(Amounts in thousands)
|
| | | | | | | | | | | | | | | | | | | | | | | | | |
| | | | | Initial Cost to Company | | Cost Capitalized Subsequent to Acquisition including impairment | | Gross Amount at December 31, 2018 | | | | | | | | |
Concept | City, State | | Encumbrances (d) | | Land and Improvements | | Buildings and Improvements | | Land and Improvements | | Buildings and Improvements | | Land and Improvements | | Buildings and Improvements | | Total | | Final Accumulated Depreciation | | Date of Construction | | Date Acquired | | Life in which depreciation in latest Statement of Operations is computed |
|
| | | | | | | | | | | | | | | | | | | | | | | | | | | | | | | | | |
Jack's Family Restaurant | Gadsden, AL | | (a) | | 804 |
| | 1,285 |
| | — |
| | 23 |
| | 804 |
| | 1,308 |
| | 2,112 |
| | (44 | ) | | 2012 | | 04/04/18 | | 15 to 30 Years |
Jack's Family Restaurant | Leeds, AL | | (a) | | 1,020 |
| | 1,412 |
| | — |
| | 24 |
| | 1,020 |
| | 1,436 |
| | 2,456 |
| | (56 | ) | | 2016 | | 04/04/18 | | 15 to 30 Years |
Joe's Crab Shack | Beaumont, TX | | (a) | | 1,435 |
| | 1,541 |
| | — |
| | — |
| | 1,435 |
| | 1,541 |
| | 2,976 |
| | (830 | ) | | 1997 | | 06/29/07 | | 15 to 40 Years |
Joe's Crab Shack | Colorado Springs, CO | | (a) | | 674 |
| | 519 |
| | — |
| | — |
| | 674 |
| | 519 |
| | 1,193 |
| | (170 | ) | | 1989 | | 11/19/12 | | 5 to 30 Years |
Kerry's Car Care | Phoenix, AZ | | (a) | | 956 |
| | 1,485 |
| | — |
| | — |
| | 956 |
| | 1,485 |
| | 2,441 |
| | (208 | ) | | 2015 | | 06/24/16 | | 4 to 40 Years |
KFC | Kansas City, KS | | (a) | | 349 |
| | 425 |
| | — |
| | — |
| | 349 |
| | 425 |
| | 774 |
| | (133 | ) | | 1977 | | 10/03/11 | | 14 to 29 Years |
KFC | Roswell, GA | | (a) | | 513 |
| | 559 |
| | — |
| | — |
| | 513 |
| | 559 |
| | 1,072 |
| | (130 | ) | | 2006 | | 02/02/12 | | 15 to 40 Years |
KFC | Atlanta, GA | | (a) | | 513 |
| | 483 |
| | — |
| | — |
| | 513 |
| | 483 |
| | 996 |
| | (142 | ) | | 2002 | | 02/02/12 | | 15 to 30 Years |
Kohl's | Manchester, MO | | (a) | | 4,119 |
| | 4,547 |
| | (630 | ) | | (518 | ) | | 3,489 |
| | 4,029 |
| | 7,518 |
| | (166 | ) | | 1986 | | 05/14/18 | | 10 to 30 Years |
Krispy Kreme | Lubbock, TX | | (a) | | 687 |
| | 856 |
| | — |
| | — |
| | 687 |
| | 856 |
| | 1,543 |
| | (473 | ) | | 2003 | | 07/07/05 | | 15 to 30 Years |
Krispy Kreme | Bentonville, AR | | (a) | | 635 |
| | 900 |
| | — |
| | — |
| | 635 |
| | 900 |
| | 1,535 |
| | (480 | ) | | 2004 | | 07/07/05 | | 15 to 30 Years |
Krispy Kreme | Little Rock, AR | | (a) | | 917 |
| | 847 |
| | — |
| | — |
| | 917 |
| | 847 |
| | 1,764 |
| | (472 | ) | | 2004 | | 07/07/05 | | 15 to 30 Years |
Krispy Kreme | Lone Tree, CO | | (a) | | 1,717 |
| | 1,117 |
| | — |
| | — |
| | 1,717 |
| | 1,117 |
| | 2,834 |
| | (722 | ) | | 2000 | | 12/23/08 | | 13 to 38 Years |
SPIRIT MTA REIT
Schedule III Real Estate and
Accumulated Depreciation
(Amounts in thousands)
|
| | | | | | | | | | | | | | | | | | | | | | | | | |
| | | | | Initial Cost to Company | | Cost Capitalized Subsequent to Acquisition including impairment | | Gross Amount at December 31, 2018 | | | | | | | | |
Concept | City, State | | Encumbrances (d) | | Land and Improvements | | Buildings and Improvements | | Land and Improvements | | Buildings and Improvements | | Land and Improvements | | Buildings and Improvements | | Total | | Final Accumulated Depreciation | | Date of Construction | | Date Acquired | | Life in which depreciation in latest Statement of Operations is computed |
|
| | | | | | | | | | | | | | | | | | | | | | | | | | | | | | | | | |
LA Fitness | Tucson, AZ | | (a) | | 2,114 |
| | 5,870 |
| | — |
| | 35 |
| | 2,114 |
| | 5,905 |
| | 8,019 |
| | (86 | ) | | 2012 | | 08/21/18 | | 9 to 37 Years |
LA Fitness | Clinton Township, MI | | (a) | | 5,430 |
| | 7,254 |
| | (2,799 | ) | | (1,160 | ) | | 2,631 |
| | 6,094 |
| | 8,725 |
| | (1,253 | ) | | 1999 | | 01/09/07 | | 15 to 30 Years |
Lerner and Rowe | Mesa, AZ | | (a) | | 372 |
| | 1,398 |
| | — |
| | — |
| | 372 |
| | 1,398 |
| | 1,770 |
| | (178 | ) | | 2003 | | 09/30/13 | | 15 to 50 Years |
Lerner and Rowe | Chicago, IL | | (a) | | 186 |
| | 1,780 |
| | — |
| | — |
| | 186 |
| | 1,780 |
| | 1,966 |
| | (187 | ) | | 2007 | | 09/30/13 | | 50 to 50 Years |
Lerner and Rowe | Bullhead City, AZ | | (a) | | 147 |
| | 489 |
| | — |
| | — |
| | 147 |
| | 489 |
| | 636 |
| | (79 | ) | | 1970 | | 09/30/13 | | 15 to 50 Years |
Lerner and Rowe | Phoenix, AZ | | (a) | | 352 |
| | 2,435 |
| | — |
| | — |
| | 352 |
| | 2,435 |
| | 2,787 |
| | (276 | ) | | 1973 | | 09/30/13 | | 15 to 50 Years |
Lerner and Rowe | Las Vegas, NV | | (a) | | 430 |
| | 3,589 |
| | — |
| | — |
| | 430 |
| | 3,589 |
| | 4,019 |
| | (428 | ) | | 2002 | | 09/30/13 | | 15 to 50 Years |
Life Time Fitness | Bixby, OK | | (a) | | 5,319 |
| | 16,929 |
| | — |
| | 11 |
| | 5,319 |
| | 16,940 |
| | 22,259 |
| | (250 | ) | | 2012 | | 08/30/18 | | 8 to 39 Years |
Life Time Fitness | Eden Prairie, MN | | (a) | | 5,826 |
| | 14,079 |
| | — |
| | 12 |
| | 5,826 |
| | 14,091 |
| | 19,917 |
| | (277 | ) | | 1987 | | 08/30/18 | | 6 to 25 Years |
Life Time Fitness | Centennial, CO | | (a) | | 11,205 |
| | 17,633 |
| | — |
| | 12 |
| | 11,205 |
| | 17,645 |
| | 28,850 |
| | (366 | ) | | 2010 | | 08/30/18 | | 6 to 37 Years |
Long John Silver's | Knoxville, TN | | (a) | | 332 |
| | 185 |
| | — |
| | — |
| | 332 |
| | 185 |
| | 517 |
| | (145 | ) | | 1977 | | 09/01/05 | | 15 to 20 Years |
Long John Silver's | Harriman, TN | | (a) | | 387 |
| | 502 |
| | — |
| | — |
| | 387 |
| | 502 |
| | 889 |
| | (319 | ) | | 1976 | | 09/01/05 | | 15 to 20 Years |
Long John Silver's | Morristown, TN | | (a) | | 588 |
| | 781 |
| | — |
| | — |
| | 588 |
| | 781 |
| | 1,369 |
| | (368 | ) | | 1987 | | 09/01/05 | | 15 to 30 Years |
SPIRIT MTA REIT
Schedule III Real Estate and
Accumulated Depreciation
(Amounts in thousands)
|
| | | | | | | | | | | | | | | | | | | | | | | | | |
| | | | | Initial Cost to Company | | Cost Capitalized Subsequent to Acquisition including impairment | | Gross Amount at December 31, 2018 | | | | | | | | |
Concept | City, State | | Encumbrances (d) | | Land and Improvements | | Buildings and Improvements | | Land and Improvements | | Buildings and Improvements | | Land and Improvements | | Buildings and Improvements | | Total | | Final Accumulated Depreciation | | Date of Construction | | Date Acquired | | Life in which depreciation in latest Statement of Operations is computed |
|
| | | | | | | | | | | | | | | | | | | | | | | | | | | | | | | | | |
Long John Silver's | Oak Ridge, TN | | (a) | | 669 |
| | 548 |
| | — |
| | — |
| | 669 |
| | 548 |
| | 1,217 |
| | (250 | ) | | 1976 | | 09/01/05 | | 15 to 30 Years |
Long John Silver's | Greenville, TN | | (a) | | 289 |
| | 311 |
| | — |
| | — |
| | 289 |
| | 311 |
| | 600 |
| | (344 | ) | | 1972 | | 09/01/05 | | 10 to 15 Years |
Long John Silver's | Crossville, TN | | (a) | | 353 |
| | 382 |
| | — |
| | — |
| | 353 |
| | 382 |
| | 735 |
| | (142 | ) | | 1977 | | 09/01/05 | | 15 to 40 Years |
Marcus Theaters | Arnold, MO | | (a) | | 3,275 |
| | 3,014 |
| | — |
| | — |
| | 3,275 |
| | 3,014 |
| | 6,289 |
| | (1,498 | ) | | 1999 | | 07/17/13 | | 5 to 21 Years |
Martin's | Marietta, GA | | (a) | | 797 |
| | 428 |
| | — |
| | — |
| | 797 |
| | 428 |
| | 1,225 |
| | (299 | ) | | 1990 | | 02/28/06 | | 15 to 30 Years |
Martin's | Kennesaw, GA | | (a) | | 907 |
| | 499 |
| | — |
| | — |
| | 907 |
| | 499 |
| | 1,406 |
| | (292 | ) | | 2001 | | 02/28/06 | | 15 to 40 Years |
Martin's | Floyd, GA | | (a) | | 973 |
| | 415 |
| | — |
| | — |
| | 973 |
| | 415 |
| | 1,388 |
| | (217 | ) | | 1993 | | 02/28/06 | | 15 to 30 Years |
Martin's | Morrow, GA | | (a) | | 652 |
| | 450 |
| | — |
| | — |
| | 652 |
| | 450 |
| | 1,102 |
| | (257 | ) | | 1995 | | 02/28/06 | | 15 to 30 Years |
Martin's | Carrollton, GA | | (a) | | 508 |
| | 603 |
| | — |
| | — |
| | 508 |
| | 603 |
| | 1,111 |
| | (282 | ) | | 2000 | | 02/28/06 | | 15 to 40 Years |
Martin's | Mableton, GA | | (a) | | 454 |
| | 826 |
| | — |
| | — |
| | 454 |
| | 826 |
| | 1,280 |
| | (374 | ) | | 1987 | | 02/28/06 | | 15 to 30 Years |
Martin's | Hiram, GA | | (a) | | 1,006 |
| | 1,142 |
| | — |
| | — |
| | 1,006 |
| | 1,142 |
| | 2,148 |
| | (642 | ) | | 1987 | | 02/28/06 | | 15 to 30 Years |
Martin's | Cartersville, GA | | (a) | | 581 |
| | 730 |
| | — |
| | — |
| | 581 |
| | 730 |
| | 1,311 |
| | (416 | ) | | 1997 | | 02/28/06 | | 15 to 30 Years |
Martin's | Douglasville, GA | | (a) | | 712 |
| | 669 |
| | — |
| | — |
| | 712 |
| | 669 |
| | 1,381 |
| | (301 | ) | | 2003 | | 02/28/06 | | 15 to 40 Years |
SPIRIT MTA REIT
Schedule III Real Estate and
Accumulated Depreciation
(Amounts in thousands)
|
| | | | | | | | | | | | | | | | | | | | | | | | | |
| | | | | Initial Cost to Company | | Cost Capitalized Subsequent to Acquisition including impairment | | Gross Amount at December 31, 2018 | | | | | | | | |
Concept | City, State | | Encumbrances (d) | | Land and Improvements | | Buildings and Improvements | | Land and Improvements | | Buildings and Improvements | | Land and Improvements | | Buildings and Improvements | | Total | | Final Accumulated Depreciation | | Date of Construction | | Date Acquired | | Life in which depreciation in latest Statement of Operations is computed |
|
| | | | | | | | | | | | | | | | | | | | | | | | | | | | | | | | | |
Martin's | Mableton, GA | | (a) | | 634 |
| | 578 |
| | — |
| | — |
| | 634 |
| | 578 |
| | 1,212 |
| | (289 | ) | | 1981 | | 02/28/06 | | 15 to 30 Years |
Martin's | Villa Rica, GA | | (a) | | 807 |
| | 629 |
| | — |
| | — |
| | 807 |
| | 629 |
| | 1,436 |
| | (385 | ) | | 1999 | | 02/28/06 | | 15 to 30 Years |
Martin's | Austell, GA | | (a) | | 838 |
| | 216 |
| | — |
| | — |
| | 838 |
| | 216 |
| | 1,054 |
| | (264 | ) | | 1962 | | 02/28/06 | | 15 to 20 Years |
Martin's | Douglasville, GA | | (a) | | 764 |
| | 941 |
| | — |
| | — |
| | 764 |
| | 941 |
| | 1,705 |
| | (469 | ) | | 1990 | | 02/28/06 | | 15 to 30 Years |
Martin's | Douglasville, GA | | (a) | | 127 |
| | — |
| | — |
| | 210 |
| | 127 |
| | 210 |
| | 337 |
| | — |
| | (f) | | 11/14/14 | | (f) |
Martin's | Cartersville, GA | | (a) | | 439 |
| | 451 |
| | — |
| | — |
| | 439 |
| | 451 |
| | 890 |
| | (306 | ) | | 1990 | | 02/28/06 | | 15 to 30 Years |
Martin's | Norcross, GA | | (a) | | 678 |
| | 402 |
| | — |
| | — |
| | 678 |
| | 402 |
| | 1,080 |
| | (291 | ) | | 1982 | | 02/28/06 | | 15 to 20 Years |
Max & Erma's | Canton, MI | | (a) | | 2,071 |
| | 1,224 |
| | — |
| | — |
| | 2,071 |
| | 1,224 |
| | 3,295 |
| | (819 | ) | | 1996 | | 06/25/04 | | 15 to 30 Years |
Max & Erma's | Hilliard, OH | | (a) | | 1,149 |
| | 1,291 |
| | — |
| | — |
| | 1,149 |
| | 1,291 |
| | 2,440 |
| | (733 | ) | | 1997 | | 09/24/04 | | 15 to 30 Years |
Max & Erma's | Mars, PA | | (a) | | 946 |
| | 2,221 |
| | — |
| | — |
| | 946 |
| | 2,221 |
| | 3,167 |
| | (1,102 | ) | | 1990 | | 06/25/04 | | 15 to 30 Years |
Max & Erma's | Pittsburgh, PA | | (a) | | 1,289 |
| | 1,871 |
| | — |
| | — |
| | 1,289 |
| | 1,871 |
| | 3,160 |
| | (911 | ) | | 1992 | | 06/25/04 | | 15 to 30 Years |
Mealey's Furniture | Morrisville, PA | | (a) | | 1,345 |
| | 8,288 |
| | — |
| | — |
| | 1,345 |
| | 8,288 |
| | 9,633 |
| | (3,342 | ) | | 2004 | | 01/03/07 | | 15 to 40 Years |
Mealey's Furniture | Bensalem, PA | | (a) | | 1,653 |
| | 3,085 |
| | — |
| | — |
| | 1,653 |
| | 3,085 |
| | 4,738 |
| | (1,503 | ) | | 1987 | | 01/03/07 | | 15 to 30 Years |
SPIRIT MTA REIT
Schedule III Real Estate and
Accumulated Depreciation
(Amounts in thousands)
|
| | | | | | | | | | | | | | | | | | | | | | | | | |
| | | | | Initial Cost to Company | | Cost Capitalized Subsequent to Acquisition including impairment | | Gross Amount at December 31, 2018 | | | | | | | | |
Concept | City, State | | Encumbrances (d) | | Land and Improvements | | Buildings and Improvements | | Land and Improvements | | Buildings and Improvements | | Land and Improvements | | Buildings and Improvements | | Total | | Final Accumulated Depreciation | | Date of Construction | | Date Acquired | | Life in which depreciation in latest Statement of Operations is computed |
|
| | | | | | | | | | | | | | | | | | | | | | | | | | | | | | | | | |
Mealey's Furniture | Fairless Hills, PA | | (a) | | 3,655 |
| | 5,271 |
| | — |
| | — |
| | 3,655 |
| | 5,271 |
| | 8,926 |
| | (2,712 | ) | | 1994 | | 01/03/07 | | 15 to 30 Years |
Meineke Car Care Center | Acworth, GA | | (a) | | 823 |
| | 976 |
| | — |
| | — |
| | 823 |
| | 976 |
| | 1,799 |
| | (161 | ) | | 1999 | | 03/28/14 | | 15 to 40 Years |
Meineke Car Care Center | Kennesaw, GA | | (a) | | 874 |
| | 1,270 |
| | — |
| | — |
| | 874 |
| | 1,270 |
| | 2,144 |
| | (209 | ) | | 1999 | | 03/28/14 | | 15 to 40 Years |
Meineke Car Care Center | Woodstock, GA | | (a) | | 1,108 |
| | 1,281 |
| | — |
| | — |
| | 1,108 |
| | 1,281 |
| | 2,389 |
| | (226 | ) | | 1999 | | 03/28/14 | | 15 to 40 Years |
Meineke Car Care Center | Lawrenceville, GA | | (a) | | 722 |
| | 976 |
| | — |
| | — |
| | 722 |
| | 976 |
| | 1,698 |
| | (164 | ) | | 2000 | | 03/28/14 | | 15 to 40 Years |
Metaldyne BSM | Fremont, IN | | (a) | | 427 |
| | 2,176 |
| | — |
| | — |
| | 427 |
| | 2,176 |
| | 2,603 |
| | (999 | ) | | 1960 | | 02/21/07 | | 14 to 30 Years |
Mills Fleet Farm | Waite Park, MN | | (a) | | 4,919 |
| | 25,384 |
| | — |
| | 54 |
| | 4,919 |
| | 25,438 |
| | 30,357 |
| | (3,064 | ) | | 1979 | | 06/09/16 | | 4 to 40 Years |
Milo's | Homewood, AL | | (a) | | 583 |
| | 839 |
| | — |
| | — |
| | 583 |
| | 839 |
| | 1,422 |
| | (196 | ) | | 2002 | | 12/05/13 | | 15 to 30 Years |
Mister Car Wash | Houston, TX | | (a) | | 1,703 |
| | 1,221 |
| | — |
| | — |
| | 1,703 |
| | 1,221 |
| | 2,924 |
| | (389 | ) | | 1996 | | 06/18/14 | | 15 to 30 Years |
Mister Car Wash | Albuquerque, NM | | (a) | | 2,472 |
| | 2,117 |
| | — |
| | — |
| | 2,472 |
| | 2,117 |
| | 4,589 |
| | (603 | ) | | 2005 | | 05/13/14 | | 15 to 30 Years |
Mister Car Wash | Albuquerque, NM | | (a) | | 1,151 |
| | 1,677 |
| | — |
| | — |
| | 1,151 |
| | 1,677 |
| | 2,828 |
| | (416 | ) | | 1976 | | 05/13/14 | | 15 to 30 Years |
Mister Car Wash | Albuquerque, NM | | (a) | | 2,657 |
| | 3,225 |
| | — |
| | — |
| | 2,657 |
| | 3,225 |
| | 5,882 |
| | (939 | ) | | 1960 | | 05/13/14 | | 15 to 30 Years |
Mister Car Wash | Albuquerque, NM | | (a) | | 2,586 |
| | 2,742 |
| | — |
| | — |
| | 2,586 |
| | 2,742 |
| | 5,328 |
| | (656 | ) | | 2002 | | 05/13/14 | | 15 to 30 Years |
SPIRIT MTA REIT
Schedule III Real Estate and
Accumulated Depreciation
(Amounts in thousands)
|
| | | | | | | | | | | | | | | | | | | | | | | | | |
| | | | | Initial Cost to Company | | Cost Capitalized Subsequent to Acquisition including impairment | | Gross Amount at December 31, 2018 | | | | | | | | |
Concept | City, State | | Encumbrances (d) | | Land and Improvements | | Buildings and Improvements | | Land and Improvements | | Buildings and Improvements | | Land and Improvements | | Buildings and Improvements | | Total | | Final Accumulated Depreciation | | Date of Construction | | Date Acquired | | Life in which depreciation in latest Statement of Operations is computed |
|
| | | | | | | | | | | | | | | | | | | | | | | | | | | | | | | | | |
Mister Car Wash | Albuquerque, NM | | (a) | | 1,563 |
| | 2,700 |
| | — |
| | — |
| | 1,563 |
| | 2,700 |
| | 4,263 |
| | (548 | ) | | 1994 | | 05/13/14 | | 15 to 30 Years |
Monterey's Tex Mex | Bryan, TX | | (a) | | 739 |
| | 700 |
| | — |
| | — |
| | 739 |
| | 700 |
| | 1,439 |
| | (532 | ) | | 1988 | | 12/30/04 | | 15 to 20 Years |
|
| | | | | | | | | | | | | | | | | | | | | | | | | | | | | | | | | |
Monterey's Tex Mex | Alvin, TX | | (a) | | 256 |
| | 585 |
| | — |
| | — |
| | 256 |
| | 585 |
| | 841 |
| | (632 | ) | | 1997 | | 12/30/04 | | 10 to 15 Years |
Monterey's Tex Mex | Houston, TX | | (a) | | 585 |
| | 561 |
| | — |
| | — |
| | 585 |
| | 561 |
| | 1,146 |
| | (634 | ) | | 1979 | | 12/30/04 | | 10 to 15 Years |
Mountainside Fitness | Chandler, AZ | | (a) | | 1,028 |
| | 5,318 |
| | — |
| | — |
| | 1,028 |
| | 5,318 |
| | 6,346 |
| | (890 | ) | | 2002 | | 07/17/13 | | 8 to 40 Years |
NAPA Auto Parts | North Little Rock, AR | | (a) | | 244 |
| | 311 |
| | — |
| | — |
| | 244 |
| | 311 |
| | 555 |
| | (71 | ) | | 2001 | | 03/31/14 | | 2 to 30 Years |
Norms | Torrance, CA | | (a) | | 3,509 |
| | 2,754 |
| | — |
| | — |
| | 3,509 |
| | 2,754 |
| | 6,263 |
| | (411 | ) | | 1998 | | 12/19/14 | | 15 to 40 Years |
Norms | Huntington Park, CA | | (a) | | 1,822 |
| | 1,211 |
| | — |
| | — |
| | 1,822 |
| | 1,211 |
| | 3,033 |
| | (239 | ) | | 1957 | | 12/19/14 | | 15 to 30 Years |
Norms | Riverside, CA | | (a) | | 1,988 |
| | 1,211 |
| | — |
| | — |
| | 1,988 |
| | 1,211 |
| | 3,199 |
| | (272 | ) | | 2002 | | 12/19/14 | | 15 to 30 Years |
Norms | Bellflower, CA | | (a) | | 1,284 |
| | 1,636 |
| | — |
| | — |
| | 1,284 |
| | 1,636 |
| | 2,920 |
| | (279 | ) | | 1970 | | 12/19/14 | | 15 to 30 Years |
Norms | Bellflower, CA | | (a) | | 1,273 |
| | 1,501 |
| | — |
| | — |
| | 1,273 |
| | 1,501 |
| | 2,774 |
| | (184 | ) | | 1981 | | 12/19/14 | | 15 to 50 Years |
Norms | Pico Rivera, CA | | (a) | | 2,785 |
| | 3,126 |
| | — |
| | — |
| | 2,785 |
| | 3,126 |
| | 5,911 |
| | (462 | ) | | 2014 | | 12/19/14 | | 15 to 40 Years |
Norms | Whittier, CA | | (a) | | 1,439 |
| | 1,874 |
| | — |
| | — |
| | 1,439 |
| | 1,874 |
| | 3,313 |
| | (265 | ) | | 1991 | | 12/19/14 | | 15 to 40 Years |
SPIRIT MTA REIT
Schedule III Real Estate and
Accumulated Depreciation
(Amounts in thousands)
|
| | | | | | | | | | | | | | | | | | | | | | | | | |
| | | | | Initial Cost to Company | | Cost Capitalized Subsequent to Acquisition including impairment | | Gross Amount at December 31, 2018 | | | | | | | | |
Concept | City, State | | Encumbrances (d) | | Land and Improvements | | Buildings and Improvements | | Land and Improvements | | Buildings and Improvements | | Land and Improvements | | Buildings and Improvements | | Total | | Final Accumulated Depreciation | | Date of Construction | | Date Acquired | | Life in which depreciation in latest Statement of Operations is computed |
|
| | | | | | | | | | | | | | | | | | | | | | | | | | | | | | | | | |
Norms | Claremont, CA | | (a) | | 2,764 |
| | 2,919 |
| | — |
| | — |
| | 2,764 |
| | 2,919 |
| | 5,683 |
| | (480 | ) | | 2011 | | 12/19/14 | | 15 to 40 Years |
Norms | Santa Ana, CA | | (a) | | 2,112 |
| | 1,501 |
| | — |
| | — |
| | 2,112 |
| | 1,501 |
| | 3,613 |
| | (275 | ) | | 1976 | | 12/19/14 | | 15 to 30 Years |
Norms | Downey, CA | | (a) | | 2,329 |
| | 2,526 |
| | — |
| | — |
| | 2,329 |
| | 2,526 |
| | 4,855 |
| | (371 | ) | | 1993 | | 12/19/14 | | 15 to 40 Years |
Off the Hook Seafood & More | Oklahoma City, OK | | (a) | | 541 |
| | 842 |
| | (398 | ) | | (614 | ) | | 143 |
| | 228 |
| | 371 |
| | (82 | ) | | 2007 | | 07/17/13 | | 4 to 33 Years |
Ojos Locos Sports Cantina | San Antonio, TX | | (a) | | 1,204 |
| | 519 |
| | — |
| | — |
| | 1,204 |
| | 519 |
| | 1,723 |
| | (82 | ) | | 1993 | | 09/26/13 | | 30 to 30 Years |
Old Mexico Cantina | Gadsden, AL | | (a) | | 626 |
| | 1,439 |
| | (229 | ) | | (506 | ) | | 397 |
| | 933 |
| | 1,330 |
| | (354 | ) | | 2007 | | 12/21/07 | | 10 to 50 Years |
Oregano's Pizza Bistro | Phoenix, AZ | | (a) | | 787 |
| | 663 |
| | — |
| | — |
| | 787 |
| | 663 |
| | 1,450 |
| | (275 | ) | | 1964 | | 10/28/11 | | 14 to 29 Years |
Oregano's Pizza Bistro | Mesa, AZ | | (a) | | 675 |
| | 911 |
| | 1 |
| | — |
| | 676 |
| | 911 |
| | 1,587 |
| | (280 | ) | | 1978 | | 10/28/11 | | 14 to 39 Years |
Oregano's Pizza Bistro | Gilbert, AZ | | (a) | | 643 |
| | 1,669 |
| | — |
| | — |
| | 643 |
| | 1,669 |
| | 2,312 |
| | (422 | ) | | 2006 | | 10/28/11 | | 14 to 39 Years |
O'Reilly Auto Parts | Warren, AR | | (a) | | 217 |
| | 375 |
| | — |
| | — |
| | 217 |
| | 375 |
| | 592 |
| | (96 | ) | | 2006 | | 03/31/14 | | 13 to 30 Years |
O'Reilly Auto Parts | Pea Ridge, AR | | (a) | | 217 |
| | — |
| | — |
| | — |
| | 217 |
| | — |
| | 217 |
| | — |
| | (f) | | 03/31/14 | | (f) |
Orscheln Farm and Home | Mountain Home, AR | | (a) | | 944 |
| | 690 |
| | — |
| | — |
| | 944 |
| | 690 |
| | 1,634 |
| | (392 | ) | | 1977 | | 03/31/14 | | 6 to 15 Years |
Orscheln Farm and Home | Pocahontas, AR | | (a) | | 361 |
| | 471 |
| | — |
| | — |
| | 361 |
| | 471 |
| | 832 |
| | (189 | ) | | 1986 | | 03/31/14 | | 7 to 20 Years |
SPIRIT MTA REIT
Schedule III Real Estate and
Accumulated Depreciation
(Amounts in thousands)
|
| | | | | | | | | | | | | | | | | | | | | | | | | |
| | | | | Initial Cost to Company | | Cost Capitalized Subsequent to Acquisition including impairment | | Gross Amount at December 31, 2018 | | | | | | | | |
Concept | City, State | | Encumbrances (d) | | Land and Improvements | | Buildings and Improvements | | Land and Improvements | | Buildings and Improvements | | Land and Improvements | | Buildings and Improvements | | Total | | Final Accumulated Depreciation | | Date of Construction | | Date Acquired | | Life in which depreciation in latest Statement of Operations is computed |
|
| | | | | | | | | | | | | | | | | | | | | | | | | | | | | | | | | |
Oxford Orthopaedics & Sports | Oxford, MS | | (a) | | 1,416 |
| | 4,451 |
| | — |
| | — |
| | 1,416 |
| | 4,451 |
| | 5,867 |
| | (636 | ) | | 2001 | | 05/15/14 | | 15 to 40 Years |
Pier1 Imports | St. Louis, MO | | (a) | | 785 |
| | 1,023 |
| | — |
| | — |
| | 785 |
| | 1,023 |
| | 1,808 |
| | (182 | ) | | 1996 | | 08/30/13 | | 15 to 40 Years |
Pike Nursery | Alpharetta, GA | | (a) | | 4,079 |
| | 1,948 |
| | — |
| | — |
| | 4,079 |
| | 1,948 |
| | 6,027 |
| | (1,735 | ) | | 1983 | | 07/01/05 | | 15 to 20 Years |
Pike Nursery | Marietta, GA | | (a) | | 2,610 |
| | 865 |
| | — |
| | — |
| | 2,610 |
| | 865 |
| | 3,475 |
| | (860 | ) | | 1977 | | 07/01/05 | | 15 to 20 Years |
Pike Nursery | Atlanta, GA | | (a) | | 4,863 |
| | 815 |
| | — |
| | — |
| | 4,863 |
| | 815 |
| | 5,678 |
| | (860 | ) | | 1970 | | 07/01/05 | | 15 to 20 Years |
Pike Nursery | Alpharetta, GA | | (a) | | 2,497 |
| | 2,160 |
| | — |
| | — |
| | 2,497 |
| | 2,160 |
| | 4,657 |
| | (1,376 | ) | | 1994 | | 07/01/05 | | 15 to 30 Years |
Pike Nursery | Marietta, GA | | (a) | | 4,675 |
| | 854 |
| | — |
| | — |
| | 4,675 |
| | 854 |
| | 5,529 |
| | (894 | ) | | 1996 | | 07/01/05 | | 15 to 30 Years |
Pine Creek Medical Center | Dallas, TX | | (a) | | 1,915 |
| | 9,150 |
| | — |
| | — |
| | 1,915 |
| | 9,150 |
| | 11,065 |
| | (2,222 | ) | | 2006 | | 03/28/13 | | 11 to 50 Years |
Pine Creek Medical Center | Dallas, TX | | (a) | | 1,633 |
| | 21,835 |
| | — |
| | 2,019 |
| | 1,633 |
| | 23,854 |
| | 25,487 |
| | (6,175 | ) | | 2005 | | 08/29/05 | | 15 to 50 Years |
Pizza Hut | Burlington, IA | | (a) | | 318 |
| | 484 |
| | — |
| | — |
| | 318 |
| | 484 |
| | 802 |
| | (291 | ) | | 2006 | | 12/04/06 | | 15 to 30 Years |
Pizza Hut | De Witt, IA | | (a) | | 248 |
| | 333 |
| | — |
| | — |
| | 248 |
| | 333 |
| | 581 |
| | (289 | ) | | 1984 | | 09/23/05 | | 15 to 20 Years |
Pizza Hut | Rock Falls, IL | | (a) | | 314 |
| | 631 |
| | — |
| | — |
| | 314 |
| | 631 |
| | 945 |
| | (355 | ) | | 1995 | | 09/23/05 | | 15 to 30 Years |
Pizza Hut | Burlington, IA | | (a) | | 304 |
| | 588 |
| | — |
| | — |
| | 304 |
| | 588 |
| | 892 |
| | (344 | ) | | 1996 | | 09/23/05 | | 15 to 30 Years |
SPIRIT MTA REIT
Schedule III Real Estate and
Accumulated Depreciation
(Amounts in thousands)
|
| | | | | | | | | | | | | | | | | | | | | | | | | |
| | | | | Initial Cost to Company | | Cost Capitalized Subsequent to Acquisition including impairment | | Gross Amount at December 31, 2018 | | | | | | | | |
Concept | City, State | | Encumbrances (d) | | Land and Improvements | | Buildings and Improvements | | Land and Improvements | | Buildings and Improvements | | Land and Improvements | | Buildings and Improvements | | Total | | Final Accumulated Depreciation | | Date of Construction | | Date Acquired | | Life in which depreciation in latest Statement of Operations is computed |
|
| | | | | | | | | | | | | | | | | | | | | | | | | | | | | | | | | |
Pizza Hut | Silver Spring, MD | | (a) | | 1,008 |
| | 251 |
| | — |
| | — |
| | 1,008 |
| | 251 |
| | 1,259 |
| | (222 | ) | | 1983 | | 11/27/06 | | 15 to 20 Years |
Pizza Hut | Clinton, MD | | (a) | | 300 |
| | 193 |
| | — |
| | 200 |
| | 300 |
| | 393 |
| | 693 |
| | (237 | ) | | 1980 | | 11/27/06 | | 13 to 20 Years |
Pizza Hut | Hyattsville, MD | | (a) | | 702 |
| | 245 |
| | — |
| | — |
| | 702 |
| | 245 |
| | 947 |
| | (201 | ) | | 1985 | | 11/27/06 | | 15 to 20 Years |
Pizza Hut | Hagerstown, MD | | (a) | | 546 |
| | 342 |
| | — |
| | 68 |
| | 546 |
| | 410 |
| | 956 |
| | (274 | ) | | 1975 | | 11/27/06 | | 11 to 20 Years |
Pizza Hut | Lanham, MD | | (a) | | 302 |
| | 193 |
| | — |
| | 200 |
| | 302 |
| | 393 |
| | 695 |
| | (240 | ) | | 1980 | | 11/27/06 | | 13 to 20 Years |
Pizza Hut | Bowie, MD | | (a) | | 333 |
| | 173 |
| | — |
| | 200 |
| | 333 |
| | 373 |
| | 706 |
| | (293 | ) | | 1983 | | 11/27/06 | | 15 to 20 Years |
Pizza Hut | Alexandria, VA | | (a) | | 1,024 |
| | 202 |
| | — |
| | 12 |
| | 1,024 |
| | 214 |
| | 1,238 |
| | (180 | ) | | 1979 | | 12/19/06 | | 11 to 20 Years |
Pizza Hut | Culpeper, VA | | (a) | | 367 |
| | 169 |
| | — |
| | — |
| | 367 |
| | 169 |
| | 536 |
| | (140 | ) | | 1977 | | 12/19/06 | | 15 to 20 Years |
Pizza Hut | Walkersville, MD | | (a) | | 381 |
| | 238 |
| | — |
| | 68 |
| | 381 |
| | 306 |
| | 687 |
| | (204 | ) | | 1985 | | 11/27/06 | | 11 to 20 Years |
Pizza Hut | Emmitsburg, MD | | (a) | | 141 |
| | 182 |
| | — |
| | — |
| | 141 |
| | 182 |
| | 323 |
| | (126 | ) | | 1981 | | 11/27/06 | | 15 to 20 Years |
Pizza Hut | Frederick, MD | | (a) | | 440 |
| | 236 |
| | — |
| | 5 |
| | 440 |
| | 241 |
| | 681 |
| | (168 | ) | | 1977 | | 11/27/06 | | 11 to 20 Years |
Pizza Hut | Mechanicsburg, PA | | (a) | | 801 |
| | 481 |
| | — |
| | — |
| | 801 |
| | 481 |
| | 1,282 |
| | (398 | ) | | 1995 | | 01/30/06 | | 15 to 20 Years |
Pizza Hut | New Cumberland, PA | | (a) | | 634 |
| | 278 |
| | — |
| | 176 |
| | 634 |
| | 454 |
| | 1,088 |
| | (377 | ) | | 1990 | | 01/30/06 | | 15 to 20 Years |
SPIRIT MTA REIT
Schedule III Real Estate and
Accumulated Depreciation
(Amounts in thousands)
|
| | | | | | | | | | | | | | | | | | | | | | | | | |
| | | | | Initial Cost to Company | | Cost Capitalized Subsequent to Acquisition including impairment | | Gross Amount at December 31, 2018 | | | | | | | | |
Concept | City, State | | Encumbrances (d) | | Land and Improvements | | Buildings and Improvements | | Land and Improvements | | Buildings and Improvements | | Land and Improvements | | Buildings and Improvements | | Total | | Final Accumulated Depreciation | | Date of Construction | | Date Acquired | | Life in which depreciation in latest Statement of Operations is computed |
|
| | | | | | | | | | | | | | | | | | | | | | | | | | | | | | | | | |
Pizza Hut | Ephrata, PA | | (a) | | 685 |
| | 231 |
| | — |
| | — |
| | 685 |
| | 231 |
| | 916 |
| | (230 | ) | | 1978 | | 01/30/06 | | 15 to 20 Years |
Pizza Hut | Harrisburg, PA | | (a) | | 611 |
| | 239 |
| | — |
| | — |
| | 611 |
| | 239 |
| | 850 |
| | (310 | ) | | 1978 | | 01/30/06 | | 15 to 20 Years |
Pizza Hut | Harrisburg, PA | | (a) | | 423 |
| | 307 |
| | — |
| | — |
| | 423 |
| | 307 |
| | 730 |
| | (207 | ) | | 1973 | | 01/30/06 | | 15 to 20 Years |
Pizza Hut | Lebanon, PA | | (a) | | 616 |
| | 316 |
| | — |
| | 176 |
| | 616 |
| | 492 |
| | 1,108 |
| | (390 | ) | | 1980 | | 01/30/06 | | 15 to 20 Years |
Pizza Hut | Harrisburg, PA | | (a) | | 762 |
| | 241 |
| | — |
| | 176 |
| | 762 |
| | 417 |
| | 1,179 |
| | (377 | ) | | 1977 | | 01/30/06 | | 15 to 20 Years |
Pizza Hut | Sweetwater, TN | | (a) | | 231 |
| | 307 |
| | — |
| | — |
| | 231 |
| | 307 |
| | 538 |
| | (188 | ) | | 1979 | | 11/02/07 | | 15 to 30 Years |
Pizza Hut | Crossville, TN | | (a) | | 220 |
| | 288 |
| | — |
| | 176 |
| | 220 |
| | 464 |
| | 684 |
| | (275 | ) | | 1978 | | 11/02/07 | | 15 to 30 Years |
Pizza Hut | Clinton, TN | | (a) | | 417 |
| | 293 |
| | — |
| | — |
| | 417 |
| | 293 |
| | 710 |
| | (208 | ) | | 1994 | | 11/02/07 | | 15 to 30 Years |
Pizza Hut | Harriman, TN | | (a) | | 314 |
| | 143 |
| | — |
| | 176 |
| | 314 |
| | 319 |
| | 633 |
| | (218 | ) | | 1979 | | 11/02/07 | | 15 to 30 Years |
Pizza Hut | Knoxville, TN | | (a) | | 296 |
| | 343 |
| | — |
| | 176 |
| | 296 |
| | 519 |
| | 815 |
| | (284 | ) | | 1978 | | 11/02/07 | | 15 to 30 Years |
Pizza Hut | Soddy Daisy, TN | | (a) | | 316 |
| | 405 |
| | — |
| | — |
| | 316 |
| | 405 |
| | 721 |
| | (235 | ) | | 1989 | | 11/02/07 | | 15 to 30 Years |
Pizza Hut | Chatsworth, GA | | (a) | | 213 |
| | 558 |
| | — |
| | — |
| | 213 |
| | 558 |
| | 771 |
| | (283 | ) | | 1979 | | 11/02/07 | | 15 to 30 Years |
Pizza Hut | Knoxville, TN | | (a) | | 172 |
| | 700 |
| | — |
| | — |
| | 172 |
| | 700 |
| | 872 |
| | (306 | ) | | 1991 | | 11/02/07 | | 15 to 30 Years |
SPIRIT MTA REIT
Schedule III Real Estate and
Accumulated Depreciation
(Amounts in thousands)
|
| | | | | | | | | | | | | | | | | | | | | | | | | |
| | | | | Initial Cost to Company | | Cost Capitalized Subsequent to Acquisition including impairment | | Gross Amount at December 31, 2018 | | | | | | | | |
Concept | City, State | | Encumbrances (d) | | Land and Improvements | | Buildings and Improvements | | Land and Improvements | | Buildings and Improvements | | Land and Improvements | | Buildings and Improvements | | Total | | Final Accumulated Depreciation | | Date of Construction | | Date Acquired | | Life in which depreciation in latest Statement of Operations is computed |
|
| | | | | | | | | | | | | | | | | | | | | | | | | | | | | | | | | |
Pizza Hut | Powell, TN | | (a) | | 252 |
| | 377 |
| | — |
| | 176 |
| | 252 |
| | 553 |
| | 805 |
| | (311 | ) | | 1982 | | 11/02/07 | | 15 to 30 Years |
Pizza Hut | Trenton, GA | | (a) | | 300 |
| | 227 |
| | — |
| | — |
| | 300 |
| | 227 |
| | 527 |
| | (172 | ) | | 1991 | | 11/02/07 | | 15 to 30 Years |
Pizza Hut | Alcoa, TN | | (a) | | 483 |
| | 318 |
| | — |
| | — |
| | 483 |
| | 318 |
| | 801 |
| | (206 | ) | | 1978 | | 11/02/07 | | 15 to 30 Years |
Pizza Hut | Ringgold, GA | | (a) | | 387 |
| | 374 |
| | — |
| | — |
| | 387 |
| | 374 |
| | 761 |
| | (216 | ) | | 1990 | | 11/02/07 | | 15 to 30 Years |
Pizza Hut | Chattanooga, TN | | (a) | | 352 |
| | 246 |
| | — |
| | — |
| | 352 |
| | 246 |
| | 598 |
| | (218 | ) | | 1984 | | 11/02/07 | | 15 to 30 Years |
Pizza Hut | Athens, TN | | (a) | | 197 |
| | 341 |
| | — |
| | 176 |
| | 197 |
| | 517 |
| | 714 |
| | (294 | ) | | 1977 | | 11/02/07 | | 15 to 30 Years |
Pizza Hut | Kimball, TN | | (a) | | 367 |
| | 283 |
| | — |
| | 176 |
| | 367 |
| | 459 |
| | 826 |
| | (277 | ) | | 1987 | | 11/02/07 | | 15 to 30 Years |
Pizza Hut | LaFayette, GA | | (a) | | 246 |
| | 434 |
| | — |
| | 176 |
| | 246 |
| | 610 |
| | 856 |
| | (326 | ) | | 1991 | | 11/02/07 | | 15 to 30 Years |
Pizza Hut | Alcoa, TN | | (a) | | 228 |
| | 219 |
| | — |
| | — |
| | 228 |
| | 219 |
| | 447 |
| | (138 | ) | | 1982 | | 11/02/07 | | 15 to 30 Years |
Pizza Hut | Dayton, TN | | (a) | | 308 |
| | 291 |
| | — |
| | 176 |
| | 308 |
| | 467 |
| | 775 |
| | (274 | ) | | 1979 | | 11/02/07 | | 15 to 30 Years |
Pizza Hut | Creston, IA | | (a) | | 103 |
| | 180 |
| | — |
| | — |
| | 103 |
| | 180 |
| | 283 |
| | (217 | ) | | 1974 | | 12/15/05 | | 10 to 15 Years |
Pizza Hut | Lakeville, MN | | (a) | | 342 |
| | 439 |
| | — |
| | 80 |
| | 342 |
| | 519 |
| | 861 |
| | (219 | ) | | 1988 | | 05/24/05 | | 15 to 30 Years |
Pizza Hut | Woodbury, MN | | (a) | | 555 |
| | 411 |
| | (180 | ) | | (121 | ) | | 375 |
| | 290 |
| | 665 |
| | (41 | ) | | 1987 | | 05/24/05 | | 4 to 20 Years |
SPIRIT MTA REIT
Schedule III Real Estate and
Accumulated Depreciation
(Amounts in thousands)
|
| | | | | | | | | | | | | | | | | | | | | | | | | |
| | | | | Initial Cost to Company | | Cost Capitalized Subsequent to Acquisition including impairment | | Gross Amount at December 31, 2018 | | | | | | | | |
Concept | City, State | | Encumbrances (d) | | Land and Improvements | | Buildings and Improvements | | Land and Improvements | | Buildings and Improvements | | Land and Improvements | | Buildings and Improvements | | Total | | Final Accumulated Depreciation | | Date of Construction | | Date Acquired | | Life in which depreciation in latest Statement of Operations is computed |
|
| | | | | | | | | | | | | | | | | | | | | | | | | | | | | | | | | |
Pizza Hut | Duluth, MN | | (a) | | 74 |
| | 423 |
| | — |
| | — |
| | 74 |
| | 423 |
| | 497 |
| | (162 | ) | | 1915 | | 05/24/05 | | 15 to 30 Years |
Pizza Hut | Salem, IL | | (a) | | 271 |
| | 218 |
| | — |
| | — |
| | 271 |
| | 218 |
| | 489 |
| | (137 | ) | | 2000 | | 07/28/04 | | 15 to 30 Years |
Pizza Hut | Geneva, AL | | (a) | | 522 |
| | 570 |
| | — |
| | — |
| | 522 |
| | 570 |
| | 1,092 |
| | (673 | ) | | 1990 | | 06/25/04 | | 10 to 15 Years |
Pizza Hut | Mayfield, KY | | (a) | | 307 |
| | 596 |
| | — |
| | — |
| | 307 |
| | 596 |
| | 903 |
| | (407 | ) | | 1997 | | 06/25/04 | | 15 to 30 Years |
Pizza Hut | Blakely, GA | | (a) | | 288 |
| | 744 |
| | — |
| | — |
| | 288 |
| | 744 |
| | 1,032 |
| | (570 | ) | | 1987 | | 06/25/04 | | 15 to 20 Years |
Pizza Hut | Madill, OK | | (a) | | 352 |
| | 648 |
| | — |
| | — |
| | 352 |
| | 648 |
| | 1,000 |
| | (798 | ) | | 1972 | | 06/25/04 | | 10 to 15 Years |
Pizza Hut | Vandalia, IL | | (a) | | 409 |
| | 202 |
| | — |
| | — |
| | 409 |
| | 202 |
| | 611 |
| | (372 | ) | | 1977 | | 09/23/05 | | 10 to 15 Years |
Pizza Hut | Decorah, IA | | (a) | | 207 |
| | 91 |
| | — |
| | — |
| | 207 |
| | 91 |
| | 298 |
| | (123 | ) | | 1985 | | 09/23/05 | | 10 to 15 Years |
|
| | | | | | | | | | | | | | | | | | | | | | | | | | | | | | | | | |
Pizza Hut | Maquoketa, IA | | (a) | | 184 |
| | 90 |
| | — |
| | — |
| | 184 |
| | 90 |
| | 274 |
| | (155 | ) | | 1973 | | 09/23/05 | | 10 to 15 Years |
Pizza Hut | Charleston, IL | | (a) | | 272 |
| | 220 |
| | — |
| | — |
| | 272 |
| | 220 |
| | 492 |
| | (251 | ) | | 1986 | | 09/23/05 | | 10 to 15 Years |
Pizza Hut | Effingham, IL | | (a) | | 357 |
| | 228 |
| | — |
| | — |
| | 357 |
| | 228 |
| | 585 |
| | (306 | ) | | 1973 | | 09/23/05 | | 10 to 15 Years |
Pizza Hut | Vinton, IA | | (a) | | 121 |
| | 114 |
| | — |
| | — |
| | 121 |
| | 114 |
| | 235 |
| | (187 | ) | | 1978 | | 09/23/05 | | 10 to 15 Years |
Pizza Hut | Taylorville, IL | | (a) | | 154 |
| | 352 |
| | — |
| | — |
| | 154 |
| | 352 |
| | 506 |
| | (382 | ) | | 1980 | | 09/23/05 | | 10 to 15 Years |
SPIRIT MTA REIT
Schedule III Real Estate and
Accumulated Depreciation
(Amounts in thousands)
|
| | | | | | | | | | | | | | | | | | | | | | | | | |
| | | | | Initial Cost to Company | | Cost Capitalized Subsequent to Acquisition including impairment | | Gross Amount at December 31, 2018 | | | | | | | | |
Concept | City, State | | Encumbrances (d) | | Land and Improvements | | Buildings and Improvements | | Land and Improvements | | Buildings and Improvements | | Land and Improvements | | Buildings and Improvements | | Total | | Final Accumulated Depreciation | | Date of Construction | | Date Acquired | | Life in which depreciation in latest Statement of Operations is computed |
|
| | | | | | | | | | | | | | | | | | | | | | | | | | | | | | | | | |
Pizza Hut | Manchester, IA | | (a) | | 351 |
| | 495 |
| | — |
| | — |
| | 351 |
| | 495 |
| | 846 |
| | (586 | ) | | 1977 | | 09/23/05 | | 10 to 15 Years |
Pizza Hut | Independence, IA | | (a) | | 223 |
| | 473 |
| | — |
| | — |
| | 223 |
| | 473 |
| | 696 |
| | (561 | ) | | 1976 | | 09/23/05 | | 10 to 15 Years |
Pizza Hut | Tipton, IA | | (a) | | 240 |
| | 408 |
| | — |
| | — |
| | 240 |
| | 408 |
| | 648 |
| | (531 | ) | | 1991 | | 09/23/05 | | 10 to 15 Years |
Pizza Hut | Dyersville, IA | | (a) | | 267 |
| | 513 |
| | — |
| | — |
| | 267 |
| | 513 |
| | 780 |
| | (432 | ) | | 1983 | | 09/23/05 | | 14 to 20 Years |
Pizza Hut | Dubuque, IA | | (a) | | 479 |
| | 298 |
| | — |
| | — |
| | 479 |
| | 298 |
| | 777 |
| | (402 | ) | | 1970 | | 09/23/05 | | 10 to 15 Years |
Pizza Hut | Evansville, IN | | (a) | | 270 |
| | 231 |
| | — |
| | — |
| | 270 |
| | 231 |
| | 501 |
| | (88 | ) | | 2000 | | 06/25/04 | | 30 to 30 Years |
Pizza Hut | Owensboro, KY | | (a) | | 250 |
| | 502 |
| | — |
| | — |
| | 250 |
| | 502 |
| | 752 |
| | (191 | ) | | 1991 | | 06/25/04 | | 30 to 30 Years |
Planet Fitness | Chicago, IL | | (a) | | 1,009 |
| | 2,965 |
| | — |
| | — |
| | 1,009 |
| | 2,965 |
| | 3,974 |
| | (495 | ) | | 2007 | | 12/09/13 | | 14 to 40 Years |
Popeye's Chicken & Biscuits | Bartlett, TN | | (a) | | 411 |
| | — |
| | — |
| | — |
| | 411 |
| | — |
| | 411 |
| | — |
| | (f) | | 10/30/13 | | (f) |
Popeye's Chicken & Biscuits | Memphis, TN | | (a) | | 320 |
| | — |
| | — |
| | — |
| | 320 |
| | — |
| | 320 |
| | — |
| | (f) | | 10/30/13 | | (f) |
Popeye's Chicken & Biscuits | Holly Springs, MS | | (a) | | 116 |
| | — |
| | — |
| | — |
| | 116 |
| | — |
| | 116 |
| | — |
| | (f) | | 10/30/13 | | (f) |
Popeye's Chicken & Biscuits | Collierville, TN | | (a) | | 539 |
| | — |
| | — |
| | — |
| | 539 |
| | — |
| | 539 |
| | — |
| | (f) | | 10/30/13 | | (f) |
Popeye's Chicken & Biscuits | Nashville, TN | | (a) | | 264 |
| | — |
| | — |
| | — |
| | 264 |
| | — |
| | 264 |
| | — |
| | (f) | | 10/30/13 | | (f) |
SPIRIT MTA REIT
Schedule III Real Estate and
Accumulated Depreciation
(Amounts in thousands)
|
| | | | | | | | | | | | | | | | | | | | | | | | | |
| | | | | Initial Cost to Company | | Cost Capitalized Subsequent to Acquisition including impairment | | Gross Amount at December 31, 2018 | | | | | | | | |
Concept | City, State | | Encumbrances (d) | | Land and Improvements | | Buildings and Improvements | | Land and Improvements | | Buildings and Improvements | | Land and Improvements | | Buildings and Improvements | | Total | | Final Accumulated Depreciation | | Date of Construction | | Date Acquired | | Life in which depreciation in latest Statement of Operations is computed |
|
| | | | | | | | | | | | | | | | | | | | | | | | | | | | | | | | | |
Popeye's Chicken & Biscuits | Horn Lake, MS | | (a) | | 231 |
| | — |
| | — |
| | — |
| | 231 |
| | — |
| | 231 |
| | — |
| | (f) | | 10/30/13 | | (f) |
Popeye's Chicken & Biscuits | Nashville, TN | | (a) | | 538 |
| | — |
| | — |
| | — |
| | 538 |
| | — |
| | 538 |
| | — |
| | (f) | | 10/30/13 | | (f) |
Popeye's Chicken & Biscuits | Lauderdale Lakes, FL | | (a) | | 411 |
| | 346 |
| | — |
| | — |
| | 411 |
| | 346 |
| | 757 |
| | (181 | ) | | 1998 | | 12/29/06 | | 15 to 30 Years |
Popeye's Chicken & Biscuits | Miami, FL | | (a) | | 602 |
| | 14 |
| | — |
| | — |
| | 602 |
| | 14 |
| | 616 |
| | (220 | ) | | 1978 | | 09/24/04 | | 10 to 15 Years |
Popeye's Chicken & Biscuits | St. Louis, MO | | (a) | | 503 |
| | 651 |
| | — |
| | — |
| | 503 |
| | 651 |
| | 1,154 |
| | (468 | ) | | 1976 | | 09/24/04 | | 15 to 20 Years |
Popeye's Chicken & Biscuits | Pensacola, FL | | (a) | | 860 |
| | 291 |
| | — |
| | — |
| | 860 |
| | 291 |
| | 1,151 |
| | (435 | ) | | 1977 | | 07/28/04 | | 10 to 15 Years |
Popeye's Chicken & Biscuits | Deerfield Beach, FL | | (a) | | 668 |
| | 295 |
| | — |
| | — |
| | 668 |
| | 295 |
| | 963 |
| | (195 | ) | | 1970 | | 09/24/04 | | 15 to 30 Years |
Popeye's Chicken & Biscuits | Fort Lauderdale, FL | | (a) | | 601 |
| | 121 |
| | — |
| | — |
| | 601 |
| | 121 |
| | 722 |
| | (227 | ) | | 1984 | | 09/24/04 | | 10 to 15 Years |
Popeye's Chicken & Biscuits | North Miami, FL | | (a) | | 596 |
| | 105 |
| | — |
| | — |
| | 596 |
| | 105 |
| | 701 |
| | (171 | ) | | 1978 | | 09/24/04 | | 10 to 15 Years |
Popeye's Chicken & Biscuits | St. Louis, MO | | (a) | | 828 |
| | 351 |
| | — |
| | — |
| | 828 |
| | 351 |
| | 1,179 |
| | (364 | ) | | 1986 | | 09/24/04 | | 15 to 20 Years |
Popeye's Chicken & Biscuits | Fort Pierce, FL | | (a) | | 667 |
| | 184 |
| | — |
| | — |
| | 667 |
| | 184 |
| | 851 |
| | (167 | ) | | 1999 | | 09/24/04 | | 15 to 30 Years |
Popeye's Chicken & Biscuits | Port Allen, LA | | (a) | | 521 |
| | 575 |
| | — |
| | — |
| | 521 |
| | 575 |
| | 1,096 |
| | (377 | ) | | 1997 | | 09/24/04 | | 15 to 30 Years |
Popeye's Chicken & Biscuits | Baton Rouge, LA | | (a) | | 472 |
| | 642 |
| | — |
| | — |
| | 472 |
| | 642 |
| | 1,114 |
| | (350 | ) | | 1987 | | 09/24/04 | | 15 to 30 Years |
SPIRIT MTA REIT
Schedule III Real Estate and
Accumulated Depreciation
(Amounts in thousands)
|
| | | | | | | | | | | | | | | | | | | | | | | | | |
| | | | | Initial Cost to Company | | Cost Capitalized Subsequent to Acquisition including impairment | | Gross Amount at December 31, 2018 | | | | | | | | |
Concept | City, State | | Encumbrances (d) | | Land and Improvements | | Buildings and Improvements | | Land and Improvements | | Buildings and Improvements | | Land and Improvements | | Buildings and Improvements | | Total | | Final Accumulated Depreciation | | Date of Construction | | Date Acquired | | Life in which depreciation in latest Statement of Operations is computed |
|
| | | | | | | | | | | | | | | | | | | | | | | | | | | | | | | | | |
Popeye's Chicken & Biscuits | Opelousas, LA | | (a) | | 419 |
| | 659 |
| | — |
| | — |
| | 419 |
| | 659 |
| | 1,078 |
| | (148 | ) | | 1968 | | 10/30/13 | | 15 to 30 Years |
Popeye's Chicken & Biscuits | Lafayette, LA | | (a) | | 300 |
| | 779 |
| | — |
| | — |
| | 300 |
| | 779 |
| | 1,079 |
| | (158 | ) | | 1972 | | 10/30/13 | | 15 to 30 Years |
Popeye's Chicken & Biscuits | Baton Rouge, LA | | (a) | | 594 |
| | 417 |
| | — |
| | — |
| | 594 |
| | 417 |
| | 1,011 |
| | (363 | ) | | 1979 | | 06/25/04 | | 15 to 20 Years |
Popeye's Chicken & Biscuits | Baton Rouge, LA | | (a) | | 565 |
| | 286 |
| | — |
| | — |
| | 565 |
| | 286 |
| | 851 |
| | (275 | ) | | 1991 | | 06/25/04 | | 15 to 20 Years |
Popeye's Chicken & Biscuits | San Antonio, TX | | (a) | | 517 |
| | 373 |
| | — |
| | — |
| | 517 |
| | 373 |
| | 890 |
| | (242 | ) | | 2002 | | 09/25/06 | | 15 to 30 Years |
Popeye's Chicken & Biscuits | San Antonio, TX | | (a) | | 428 |
| | 339 |
| | — |
| | — |
| | 428 |
| | 339 |
| | 767 |
| | (224 | ) | | 2001 | | 09/25/06 | | 15 to 30 Years |
Popeye's Chicken & Biscuits | Tempe, AZ | | (a) | | 480 |
| | 361 |
| | — |
| | — |
| | 480 |
| | 361 |
| | 841 |
| | (231 | ) | | 2003 | | 09/25/06 | | 15 to 30 Years |
Popeye's Chicken & Biscuits | Houston, TX | | (a) | | 592 |
| | 302 |
| | — |
| | — |
| | 592 |
| | 302 |
| | 894 |
| | (216 | ) | | 1979 | | 09/28/06 | | 15 to 20 Years |
Popeye's Chicken & Biscuits | San Antonio, TX | | (a) | | 349 |
| | 429 |
| | — |
| | — |
| | 349 |
| | 429 |
| | 778 |
| | (316 | ) | | 1983 | | 09/25/06 | | 15 to 20 Years |
Popeye's Chicken & Biscuits | San Antonio, TX | | (a) | | 539 |
| | 300 |
| | — |
| | — |
| | 539 |
| | 300 |
| | 839 |
| | (242 | ) | | 2001 | | 09/25/06 | | 15 to 30 Years |
Primanti Bros. | Avon, IN | | (a) | | 899 |
| | 614 |
| | — |
| | 188 |
| | 899 |
| | 802 |
| | 1,701 |
| | (167 | ) | | 2014 | | 10/31/14 | | 14 to 30 Years |
Primanti Bros. | Indianapolis, IN | | (a) | | 590 |
| | 633 |
| | — |
| | — |
| | 590 |
| | 633 |
| | 1,223 |
| | (164 | ) | | 2014 | | 10/31/14 | | 14 to 30 Years |
PwC | Columbia, SC | | (c) | | 2,095 |
| | 16,191 |
| | (627 | ) | | (1,136 | ) | | 1,468 |
| | 15,055 |
| | 16,523 |
| | (7,883 | ) | | 1988 | | 09/09/05 | | 5 to 29 Years |
SPIRIT MTA REIT
Schedule III Real Estate and
Accumulated Depreciation
(Amounts in thousands)
|
| | | | | | | | | | | | | | | | | | | | | | | | | |
| | | | | Initial Cost to Company | | Cost Capitalized Subsequent to Acquisition including impairment | | Gross Amount at December 31, 2018 | | | | | | | | |
Concept | City, State | | Encumbrances (d) | | Land and Improvements | | Buildings and Improvements | | Land and Improvements | | Buildings and Improvements | | Land and Improvements | | Buildings and Improvements | | Total | | Final Accumulated Depreciation | | Date of Construction | | Date Acquired | | Life in which depreciation in latest Statement of Operations is computed |
|
| | | | | | | | | | | | | | | | | | | | | | | | | | | | | | | | | |
Rainbow Kids Clinic | Clarksville, TN | | (a) | | 978 |
| | 2,718 |
| | — |
| | — |
| | 978 |
| | 2,718 |
| | 3,696 |
| | (347 | ) | | 2011 | | 12/04/14 | | 15 to 40 Years |
Rally's | New Albany, IN | | (a) | | 497 |
| | 278 |
| | — |
| | — |
| | 497 |
| | 278 |
| | 775 |
| | (209 | ) | | 1992 | | 09/24/04 | | 15 to 30 Years |
Rally's | Louisville, KY | | (a) | | 334 |
| | 251 |
| | — |
| | — |
| | 334 |
| | 251 |
| | 585 |
| | (174 | ) | | 1991 | | 09/24/04 | | 15 to 20 Years |
Rally's | Florence, KY | | (a) | | 524 |
| | 209 |
| | — |
| | — |
| | 524 |
| | 209 |
| | 733 |
| | (202 | ) | | 1992 | | 09/24/04 | | 15 to 30 Years |
|
| | | | | | | | | | | | | | | | | | | | | | | | | | | | | | | | | |
Rally's | Marion, IN | | (a) | | 503 |
| | 153 |
| | — |
| | — |
| | 503 |
| | 153 |
| | 656 |
| | (161 | ) | | 1990 | | 09/24/04 | | 15 to 20 Years |
Raymour & Flanigan Furniture | Horseheads, NY | | (a) | | 1,376 |
| | 12,506 |
| | 13 |
| | 125 |
| | 1,389 |
| | 12,631 |
| | 14,020 |
| | (889 | ) | | 2005 | | 10/06/15 | | 14 to 50 Years |
Raymour & Flanigan Furniture | Johnson City, NY | | (a) | | 1,459 |
| | 10,433 |
| | 18 |
| | 131 |
| | 1,477 |
| | 10,564 |
| | 12,041 |
| | (952 | ) | | 1978 | | 10/06/15 | | 14 to 40 Years |
Red Robin Gourmet Burgers | Gurnee, IL | | (a) | | 586 |
| | 619 |
| | — |
| | — |
| | 586 |
| | 619 |
| | 1,205 |
| | (464 | ) | | 1995 | | 06/25/04 | | 15 to 20 Years |
Regal Cinemas | Fenton, MO | | (a) | | 2,792 |
| | 5,982 |
| | — |
| | — |
| | 2,792 |
| | 5,982 |
| | 8,774 |
| | (1,088 | ) | | 2008 | | 09/29/14 | | 13 to 40 Years |
Regal Cinemas | Lebanon, PA | | (a) | | 747 |
| | 4,295 |
| | — |
| | — |
| | 747 |
| | 4,295 |
| | 5,042 |
| | (689 | ) | | 2006 | | 09/29/14 | | 13 to 30 Years |
Regal Cinemas | Massillon, OH | | (a) | | 1,767 |
| | 2,667 |
| | — |
| | 1,600 |
| | 1,767 |
| | 4,267 |
| | 6,034 |
| | (792 | ) | | 2005 | | 09/29/14 | | 13 to 30 Years |
Regal Cinemas | Nitro, WV | | (a) | | 1,816 |
| | 3,068 |
| | — |
| | — |
| | 1,816 |
| | 3,068 |
| | 4,884 |
| | (748 | ) | | 2005 | | 09/29/14 | | 13 to 30 Years |
Regal Cinemas | Dickson City, PA | | (a) | | 4,198 |
| | 5,269 |
| | — |
| | — |
| | 4,198 |
| | 5,269 |
| | 9,467 |
| | (1,451 | ) | | 2010 | | 09/29/14 | | 13 to 30 Years |
SPIRIT MTA REIT
Schedule III Real Estate and
Accumulated Depreciation
(Amounts in thousands)
|
| | | | | | | | | | | | | | | | | | | | | | | | | |
| | | | | Initial Cost to Company | | Cost Capitalized Subsequent to Acquisition including impairment | | Gross Amount at December 31, 2018 | | | | | | | | |
Concept | City, State | | Encumbrances (d) | | Land and Improvements | | Buildings and Improvements | | Land and Improvements | | Buildings and Improvements | | Land and Improvements | | Buildings and Improvements | | Total | | Final Accumulated Depreciation | | Date of Construction | | Date Acquired | | Life in which depreciation in latest Statement of Operations is computed |
|
| | | | | | | | | | | | | | | | | | | | | | | | | | | | | | | | | |
Regal Cinemas | Simpsonville, SC | | (a) | | 1,862 |
| | 5,453 |
| | — |
| | — |
| | 1,862 |
| | 5,453 |
| | 7,315 |
| | (1,012 | ) | | 2010 | | 09/29/14 | | 13 to 40 Years |
Renn Kirby Chevrolet Buick | Gettysburg, PA | | (a) | | 1,385 |
| | 3,259 |
| | — |
| | — |
| | 1,385 |
| | 3,259 |
| | 4,644 |
| | (1,712 | ) | | 2005 | | 02/16/07 | | 5 to 30 Years |
Repair One | Port Orange, FL | | (a) | | 599 |
| | 967 |
| | — |
| | 35 |
| | 599 |
| | 1,002 |
| | 1,601 |
| | (112 | ) | | 1997 | | 06/24/16 | | 13 to 30 Years |
RGB Eye Associates | Sherman, TX | | (a) | | 1,249 |
| | 4,713 |
| | — |
| | — |
| | 1,249 |
| | 4,713 |
| | 5,962 |
| | (506 | ) | | 2013 | | 06/30/15 | | 15 to 40 Years |
Rick Johnson Auto & Tire | Naples, FL | | (a) | | 249 |
| | 265 |
| | — |
| | — |
| | 249 |
| | 265 |
| | 514 |
| | (80 | ) | | 1966 | | 10/28/13 | | 9 to 20 Years |
Rick Johnson Auto & Tire | Naples, FL | | (a) | | 425 |
| | 424 |
| | — |
| | — |
| | 425 |
| | 424 |
| | 849 |
| | (118 | ) | | 2006 | | 10/28/13 | | 9 to 30 Years |
Rick Johnson Auto & Tire | Estero, FL | | (a) | | 334 |
| | 571 |
| | — |
| | — |
| | 334 |
| | 571 |
| | 905 |
| | (143 | ) | | 2009 | | 10/28/13 | | 9 to 30 Years |
Rick Johnson Auto & Tire | Estero, FL | | (a) | | 394 |
| | 399 |
| | — |
| | — |
| | 394 |
| | 399 |
| | 793 |
| | (117 | ) | | 2004 | | 10/28/13 | | 9 to 30 Years |
Rite Aid | St. Clair Shores, MI | | (a) | | 1,169 |
| | 761 |
| | — |
| | — |
| | 1,169 |
| | 761 |
| | 1,930 |
| | (350 | ) | | 1991 | | 05/02/05 | | 15 to 30 Years |
Rite Aid | Buffalo, NY | | (a) | | 681 |
| | 925 |
| | — |
| | — |
| | 681 |
| | 925 |
| | 1,606 |
| | (315 | ) | | 1993 | | 07/01/05 | | 19 to 40 Years |
Rite Aid | Uhrichsville, OH | | (a) | | 617 |
| | 2,345 |
| | — |
| | — |
| | 617 |
| | 2,345 |
| | 2,962 |
| | (749 | ) | | 2000 | | 07/01/05 | | 19 to 40 Years |
Rite Aid | Philadelphia, PA | | (a) | | 733 |
| | 1,087 |
| | — |
| | — |
| | 733 |
| | 1,087 |
| | 1,820 |
| | (370 | ) | | 1993 | | 07/01/05 | | 19 to 40 Years |
Rite Aid | Philadelphia, PA | | (a) | | 1,613 |
| | 1,880 |
| | — |
| | — |
| | 1,613 |
| | 1,880 |
| | 3,493 |
| | (629 | ) | | 1999 | | 07/01/05 | | 19 to 40 Years |
SPIRIT MTA REIT
Schedule III Real Estate and
Accumulated Depreciation
(Amounts in thousands)
|
| | | | | | | | | | | | | | | | | | | | | | | | | |
| | | | | Initial Cost to Company | | Cost Capitalized Subsequent to Acquisition including impairment | | Gross Amount at December 31, 2018 | | | | | | | | |
Concept | City, State | | Encumbrances (d) | | Land and Improvements | | Buildings and Improvements | | Land and Improvements | | Buildings and Improvements | | Land and Improvements | | Buildings and Improvements | | Total | | Final Accumulated Depreciation | | Date of Construction | | Date Acquired | | Life in which depreciation in latest Statement of Operations is computed |
|
| | | | | | | | | | | | | | | | | | | | | | | | | | | | | | | | | |
Rite Aid | Moundsville, WV | | (a) | | 706 |
| | 1,002 |
| | — |
| | — |
| | 706 |
| | 1,002 |
| | 1,708 |
| | (346 | ) | | 1993 | | 07/01/05 | | 19 to 40 Years |
Saltgrass | Plano, TX | | (a) | | 2,418 |
| | 1,529 |
| | — |
| | — |
| | 2,418 |
| | 1,529 |
| | 3,947 |
| | (736 | ) | | 1998 | | 06/29/07 | | 15 to 40 Years |
Sanford's Grub & Pub | Dickinson, ND | | (a) | | 616 |
| | 1,301 |
| | — |
| | — |
| | 616 |
| | 1,301 |
| | 1,917 |
| | (508 | ) | | 2003 | | 12/29/06 | | 15 to 40 Years |
Sanford's Grub & Pub | Cheyenne, WY | | (a) | | 277 |
| | 2,041 |
| | — |
| | — |
| | 277 |
| | 2,041 |
| | 2,318 |
| | (1,230 | ) | | 1928 | | 12/29/06 | | 15 to 20 Years |
Service King | Madison, TN | | (a) | | 662 |
| | 1,567 |
| | — |
| | — |
| | 662 |
| | 1,567 |
| | 2,229 |
| | (250 | ) | | 2000 | | 03/31/14 | | 14 to 40 Years |
Service King | Nashville, TN | | (a) | | 828 |
| | 1,405 |
| | — |
| | — |
| | 828 |
| | 1,405 |
| | 2,233 |
| | (303 | ) | | 2000 | | 03/31/14 | | 14 to 30 Years |
Service King | Clarksville, TN | | (a) | | 658 |
| | 1,243 |
| | — |
| | — |
| | 658 |
| | 1,243 |
| | 1,901 |
| | (247 | ) | | 2000 | | 03/31/14 | | 14 to 30 Years |
Sexton Town & Country Foods | Bald Knob, AR | | (a) | | 328 |
| | 327 |
| | — |
| | — |
| | 328 |
| | 327 |
| | 655 |
| | (174 | ) | | 1971 | | 03/31/14 | | 1 to 15 Years |
ShopKo | Ainsworth, NE | | (a) | | 361 |
| | 1,829 |
| | (237 | ) | | (1,023 | ) | | 124 |
| | 806 |
| | 930 |
| | — |
| | 2007 | | 12/08/09 | | 12 to 47 Years |
ShopKo | Gothenburg, NE | | (a) | | 391 |
| | 1,798 |
| | (277 | ) | | (1,162 | ) | | 114 |
| | 636 |
| | 750 |
| | — |
| | 2007 | | 12/08/09 | | 12 to 47 Years |
ShopKo | O'Neill, NE | | (a) | | 400 |
| | 1,752 |
| | (263 | ) | | (889 | ) | | 137 |
| | 863 |
| | 1,000 |
| | — |
| | 1972 | | 12/08/09 | | 12 to 47 Years |
ShopKo | Thermopolis, WY | | (a) | | 589 |
| | 1,601 |
| | (258 | ) | | (692 | ) | | 331 |
| | 909 |
| | 1,240 |
| | — |
| | 2007 | | 12/08/09 | | 12 to 47 Years |
ShopKo | Glenwood, MN | | (b) | | 775 |
| | 1,404 |
| | (487 | ) | | (972 | ) | | 288 |
| | 432 |
| | 720 |
| | — |
| | 1996 | | 05/31/06 | | 15 to 40 Years |
SPIRIT MTA REIT
Schedule III Real Estate and
Accumulated Depreciation
(Amounts in thousands)
|
| | | | | | | | | | | | | | | | | | | | | | | | | |
| | | | | Initial Cost to Company | | Cost Capitalized Subsequent to Acquisition including impairment | | Gross Amount at December 31, 2018 | | | | | | | | |
Concept | City, State | | Encumbrances (d) | | Land and Improvements | | Buildings and Improvements | | Land and Improvements | | Buildings and Improvements | | Land and Improvements | | Buildings and Improvements | | Total | | Final Accumulated Depreciation | | Date of Construction | | Date Acquired | | Life in which depreciation in latest Statement of Operations is computed |
|
| | | | | | | | | | | | | | | | | | | | | | | | | | | | | | | | | |
ShopKo | Dyersville, IA | | (b) | | 381 |
| | 1,082 |
| | (163 | ) | | (600 | ) | | 218 |
| | 482 |
| | 700 |
| | — |
| | 2000 | | 05/31/06 | | 15 to 30 Years |
ShopKo | Waukon, IA | | (b) | | 604 |
| | 971 |
| | (290 | ) | | (585 | ) | | 314 |
| | 386 |
| | 700 |
| | — |
| | 1998 | | 05/31/06 | | 15 to 30 Years |
ShopKo | Memphis, MO | | (b) | | 448 |
| | 313 |
| | (120 | ) | | (211 | ) | | 328 |
| | 102 |
| | 430 |
| | — |
| | 1983 | | 05/31/06 | | 15 to 20 Years |
ShopKo | Lancaster, WI | | (b) | | 581 |
| | 1,018 |
| | — |
| | — |
| | 581 |
| | 1,018 |
| | 1,599 |
| | (582 | ) | | 1999 | | 05/31/06 | | 15 to 30 Years |
ShopKo | Clarion, IA | | (b) | | 365 |
| | 812 |
| | (174 | ) | | (473 | ) | | 191 |
| | 339 |
| | 530 |
| | — |
| | 2000 | | 05/31/06 | | 15 to 30 Years |
ShopKo | Newaygo, MI | | (b) | | 633 |
| | 1,155 |
| | (409 | ) | | (859 | ) | | 224 |
| | 296 |
| | 520 |
| | — |
| | 2000 | | 05/31/06 | | 15 to 30 Years |
ShopKo | Manistique, MI | | (b) | | 659 |
| | 1,223 |
| | (381 | ) | | (821 | ) | | 278 |
| | 402 |
| | 680 |
| | — |
| | 2000 | | 05/31/06 | | 15 to 30 Years |
ShopKo | Perry, IA | | (b) | | 651 |
| | 1,015 |
| | (421 | ) | | (725 | ) | | 230 |
| | 290 |
| | 520 |
| | — |
| | 1998 | | 05/31/06 | | 15 to 30 Years |
ShopKo | Glasgow, MT | | (b) | | 772 |
| | 1,623 |
| | — |
| | — |
| | 772 |
| | 1,623 |
| | 2,395 |
| | (887 | ) | | 1998 | | 05/31/06 | | 15 to 30 Years |
ShopKo | Hart, MI | | (b) | | 565 |
| | 1,377 |
| | (310 | ) | | (922 | ) | | 255 |
| | 455 |
| | 710 |
| | — |
| | 1999 | | 05/31/06 | | 15 to 30 Years |
ShopKo | Lander, WY | | (b) | | 289 |
| | 589 |
| | — |
| | — |
| | 289 |
| | 589 |
| | 878 |
| | (432 | ) | | 1974 | | 05/31/06 | | 15 to 20 Years |
ShopKo | Powell, WY | | (b) | | 1,264 |
| | 859 |
| | (393 | ) | | (580 | ) | | 871 |
| | 279 |
| | 1,150 |
| | — |
| | 1985 | | 05/31/06 | | 15 to 25 Years |
ShopKo | Arcadia, WI | | (b) | | 673 |
| | 983 |
| | — |
| | — |
| | 673 |
| | 983 |
| | 1,656 |
| | (670 | ) | | 2000 | | 05/31/06 | | 15 to 30 Years |
SPIRIT MTA REIT
Schedule III Real Estate and
Accumulated Depreciation
(Amounts in thousands)
|
| | | | | | | | | | | | | | | | | | | | | | | | | |
| | | | | Initial Cost to Company | | Cost Capitalized Subsequent to Acquisition including impairment | | Gross Amount at December 31, 2018 | | | | | | | | |
Concept | City, State | | Encumbrances (d) | | Land and Improvements | | Buildings and Improvements | | Land and Improvements | | Buildings and Improvements | | Land and Improvements | | Buildings and Improvements | | Total | | Final Accumulated Depreciation | | Date of Construction | | Date Acquired | | Life in which depreciation in latest Statement of Operations is computed |
|
| | | | | | | | | | | | | | | | | | | | | | | | | | | | | | | | | |
ShopKo | Clintonville, WI | | (b) | | 495 |
| | 1,089 |
| | — |
| | — |
| | 495 |
| | 1,089 |
| | 1,584 |
| | (749 | ) | | 1978 | | 05/31/06 | | 15 to 25 Years |
ShopKo | Albany, MO | | (b) | | 66 |
| | 410 |
| | — |
| | — |
| | 66 |
| | 410 |
| | 476 |
| | (188 | ) | | 1990 | | 05/31/06 | | 15 to 30 Years |
ShopKo | Carrollton, MO | | (b) | | 352 |
| | 345 |
| | — |
| | — |
| | 352 |
| | 345 |
| | 697 |
| | (309 | ) | | 1994 | | 07/21/11 | | 9 to 20 Years |
ShopKo | Woodsfield, OH | | (b) | | 691 |
| | 1,009 |
| | (316 | ) | | (594 | ) | | 375 |
| | 415 |
| | 790 |
| | — |
| | 2000 | | 05/31/06 | | 15 to 30 Years |
ShopKo | Mount Carmel, IL | | (b) | | 972 |
| | 1,602 |
| | (640 | ) | | (1,334 | ) | | 332 |
| | 268 |
| | 600 |
| | — |
| | 2000 | | 05/31/06 | | 15 to 20 Years |
ShopKo | Mount Ayr, IA | | (b) | | 228 |
| | 666 |
| | — |
| | — |
| | 228 |
| | 666 |
| | 894 |
| | (340 | ) | | 1995 | | 05/31/06 | | 15 to 30 Years |
ShopKo | Clare, MI | | (b) | | 1,219 |
| | 760 |
| | (831 | ) | | (588 | ) | | 388 |
| | 172 |
| | 560 |
| | — |
| | 2000 | | 05/31/06 | | 15 to 30 Years |
ShopKo | Tuscola, IL | | (b) | | 724 |
| | 897 |
| | (455 | ) | | (646 | ) | | 269 |
| | 251 |
| | 520 |
| | — |
| | 2000 | | 05/31/06 | | 15 to 30 Years |
ShopKo | Dowagiac, MI | | (b) | | 762 |
| | 984 |
| | (535 | ) | | (781 | ) | | 227 |
| | 203 |
| | 430 |
| | — |
| | 2000 | | 05/31/06 | | 15 to 30 Years |
ShopKo | Gallatin, MO | | (b) | | 57 |
| | 405 |
| | — |
| | — |
| | 57 |
| | 405 |
| | 462 |
| | (192 | ) | | 1990 | | 05/31/06 | | 15 to 30 Years |
ShopKo | Burlington, KS | | (b) | | 371 |
| | 565 |
| | — |
| | — |
| | 371 |
| | 565 |
| | 936 |
| | (440 | ) | | 1990 | | 05/31/06 | | 15 to 20 Years |
ShopKo | Monticello, IL | | (b) | | 641 |
| | 1,172 |
| | (412 | ) | | (861 | ) | | 229 |
| | 311 |
| | 540 |
| | — |
| | 1999 | | 05/31/06 | | 15 to 30 Years |
ShopKo | Fergus Falls, MN | | (b) | | 738 |
| | 1,175 |
| | (302 | ) | | (861 | ) | | 436 |
| | 314 |
| | 750 |
| | — |
| | 1986 | | 05/31/06 | | 15 to 20 Years |
SPIRIT MTA REIT
Schedule III Real Estate and
Accumulated Depreciation
(Amounts in thousands)
|
| | | | | | | | | | | | | | | | | | | | | | | | | |
| | | | | Initial Cost to Company | | Cost Capitalized Subsequent to Acquisition including impairment | | Gross Amount at December 31, 2018 | | | | | | | | |
Concept | City, State | | Encumbrances (d) | | Land and Improvements | | Buildings and Improvements | | Land and Improvements | | Buildings and Improvements | | Land and Improvements | | Buildings and Improvements | | Total | | Final Accumulated Depreciation | | Date of Construction | | Date Acquired | | Life in which depreciation in latest Statement of Operations is computed |
|
| | | | | | | | | | | | | | | | | | | | | | | | | | | | | | | | | |
ShopKo | Minerva, OH | | (b) | | 1,103 |
| | 902 |
| | (573 | ) | | (572 | ) | | 530 |
| | 330 |
| | 860 |
| | — |
| | 2000 | | 05/31/06 | | 15 to 30 Years |
ShopKo | Attica, IN | | (b) | | 550 |
| | 1,116 |
| | (284 | ) | | (692 | ) | | 266 |
| | 424 |
| | 690 |
| | — |
| | 1999 | | 05/31/06 | | 15 to 30 Years |
ShopKo | Rockville, IN | | (b) | | 628 |
| | 939 |
| | (355 | ) | | (632 | ) | | 273 |
| | 307 |
| | 580 |
| | — |
| | 1999 | | 05/31/06 | | 15 to 30 Years |
ShopKo | Rochester, MN | | (a) | | 6,466 |
| | 4,232 |
| | (4,239 | ) | | (3,539 | ) | | 2,227 |
| | 693 |
| | 2,920 |
| | — |
| | 1981 | | 05/31/06 | | 15 to 28 Years |
|
| | | | | | | | | | | | | | | | | | | | | | | | | | | | | | | | | |
ShopKo | Mitchell, SD | | (b) | | 3,918 |
| | 3,126 |
| | (1,477 | ) | | (2,187 | ) | | 2,441 |
| | 939 |
| | 3,380 |
| | — |
| | 1973 | | 05/31/06 | | 15 to 28 Years |
ShopKo | Aberdeen, SD | | (b) | | 3,857 |
| | 3,348 |
| | (1,888 | ) | | (2,167 | ) | | 1,969 |
| | 1,181 |
| | 3,150 |
| | — |
| | 1984 | | 05/31/06 | | 15 to 30 Years |
ShopKo | De Pere, WI | | (b) | | 264 |
| | 1,681 |
| | (96 | ) | | (779 | ) | | 168 |
| | 902 |
| | 1,070 |
| | — |
| | 2000 | | 05/31/06 | | 15 to 30 Years |
ShopKo | River Falls, WI | | (b) | | 1,787 |
| | 4,283 |
| | (736 | ) | | (2,304 | ) | | 1,051 |
| | 1,979 |
| | 3,030 |
| | — |
| | 1994 | | 05/31/06 | | 15 to 30 Years |
ShopKo | Helena, MT | | (b) | | 3,176 |
| | 5,583 |
| | (1,549 | ) | | (2,930 | ) | | 1,627 |
| | 2,653 |
| | 4,280 |
| | — |
| | 1992 | | 05/31/06 | | 15 to 30 Years |
ShopKo | Watertown, SD | | (b) | | 3,064 |
| | 3,519 |
| | (1,320 | ) | | (2,143 | ) | | 1,744 |
| | 1,376 |
| | 3,120 |
| | — |
| | 1985 | | 05/31/06 | | 15 to 30 Years |
ShopKo | Escanaba, MI | | (b) | | 3,030 |
| | 3,321 |
| | (1,968 | ) | | (2,753 | ) | | 1,062 |
| | 568 |
| | 1,630 |
| | — |
| | 1971 | | 05/31/06 | | 15 to 28 Years |
ShopKo | Kingsford, MI | | (b) | | 3,736 |
| | 3,570 |
| | (2,361 | ) | | (2,925 | ) | | 1,375 |
| | 645 |
| | 2,020 |
| | — |
| | 1970 | | 05/31/06 | | 15 to 28 Years |
ShopKo | Wisconsin Rapids, WI | | (b) | | 3,689 |
| | 4,806 |
| | (1,076 | ) | | (3,149 | ) | | 2,613 |
| | 1,657 |
| | 4,270 |
| | — |
| | 1969 | | 05/31/06 | | 15 to 28 Years |
SPIRIT MTA REIT
Schedule III Real Estate and
Accumulated Depreciation
(Amounts in thousands)
|
| | | | | | | | | | | | | | | | | | | | | | | | | |
| | | | | Initial Cost to Company | | Cost Capitalized Subsequent to Acquisition including impairment | | Gross Amount at December 31, 2018 | | | | | | | | |
Concept | City, State | | Encumbrances (d) | | Land and Improvements | | Buildings and Improvements | | Land and Improvements | | Buildings and Improvements | | Land and Improvements | | Buildings and Improvements | | Total | | Final Accumulated Depreciation | | Date of Construction | | Date Acquired | | Life in which depreciation in latest Statement of Operations is computed |
|
| | | | | | | | | | | | | | | | | | | | | | | | | | | | | | | | | |
ShopKo | Marshfield, WI | | (b) | | 3,272 |
| | 4,406 |
| | (796 | ) | | (2,802 | ) | | 2,476 |
| | 1,604 |
| | 4,080 |
| | — |
| | 1968 | | 05/31/06 | | 15 to 28 Years |
ShopKo | Belvidere, IL | | (b) | | 3,061 |
| | 3,609 |
| | (2,008 | ) | | (2,732 | ) | | 1,053 |
| | 877 |
| | 1,930 |
| | — |
| | 1995 | | 05/31/06 | | 15 to 30 Years |
ShopKo | Norfolk, NE | | (b) | | 2,701 |
| | 2,912 |
| | (1,263 | ) | | (1,720 | ) | | 1,438 |
| | 1,192 |
| | 2,630 |
| | — |
| | 1984 | | 05/31/06 | | 15 to 30 Years |
ShopKo | Stevens Point, WI | | (b) | | 1,383 |
| | 5,401 |
| | (529 | ) | | (3,805 | ) | | 854 |
| | 1,596 |
| | 2,450 |
| | — |
| | 1985 | | 05/31/06 | | 15 to 25 Years |
ShopKo | Albert Lea, MN | | (b) | | 2,526 |
| | 3,141 |
| | (1,492 | ) | | (2,435 | ) | | 1,034 |
| | 706 |
| | 1,740 |
| | — |
| | 1985 | | 05/31/06 | | 15 to 27 Years |
ShopKo | Marquette, MI | | (b) | | 4,423 |
| | 5,774 |
| | (3,094 | ) | | (4,933 | ) | | 1,329 |
| | 841 |
| | 2,170 |
| | — |
| | 1969 | | 05/31/06 | | 15 to 25 Years |
ShopKo | Monmouth, IL | | (b) | | 2,037 |
| | 1,166 |
| | (1,367 | ) | | (956 | ) | | 670 |
| | 210 |
| | 880 |
| | — |
| | 1971 | | 05/31/06 | | 15 to 25 Years |
ShopKo | Fort Atkinson, WI | | (b) | | 1,005 |
| | 2,873 |
| | — |
| | — |
| | 1,005 |
| | 2,873 |
| | 3,878 |
| | (1,338 | ) | | 1984 | | 05/31/06 | | 15 to 30 Years |
ShopKo | Houghton, MI | | (b) | | 1,963 |
| | 4,025 |
| | (1,348 | ) | | (3,070 | ) | | 615 |
| | 955 |
| | 1,570 |
| | — |
| | 1994 | | 05/31/06 | | 15 to 30 Years |
ShopKo | Kenosha, WI | | (b) | | 3,079 |
| | 4,259 |
| | (1,086 | ) | | (2,842 | ) | | 1,993 |
| | 1,417 |
| | 3,410 |
| | — |
| | 1980 | | 05/31/06 | | 15 to 25 Years |
ShopKo | Watertown, WI | | (b) | | 3,124 |
| | 4,436 |
| | (1,316 | ) | | (3,184 | ) | | 1,808 |
| | 1,252 |
| | 3,060 |
| | — |
| | 1972 | | 05/31/06 | | 15 to 25 Years |
ShopKo | Fond du Lac, WI | | (b) | | 4,110 |
| | 5,210 |
| | (1,959 | ) | | (3,371 | ) | | 2,151 |
| | 1,839 |
| | 3,990 |
| | — |
| | 1985 | | 05/31/06 | | 15 to 30 Years |
ShopKo | Marshall, MN | | (b) | | 4,152 |
| | 2,872 |
| | (2,388 | ) | | (2,266 | ) | | 1,764 |
| | 606 |
| | 2,370 |
| | — |
| | 1972 | | 05/31/06 | | 15 to 28 Years |
SPIRIT MTA REIT
Schedule III Real Estate and
Accumulated Depreciation
(Amounts in thousands)
|
| | | | | | | | | | | | | | | | | | | | | | | | | |
| | | | | Initial Cost to Company | | Cost Capitalized Subsequent to Acquisition including impairment | | Gross Amount at December 31, 2018 | | | | | | | | |
Concept | City, State | | Encumbrances (d) | | Land and Improvements | | Buildings and Improvements | | Land and Improvements | | Buildings and Improvements | | Land and Improvements | | Buildings and Improvements | | Total | | Final Accumulated Depreciation | | Date of Construction | | Date Acquired | | Life in which depreciation in latest Statement of Operations is computed |
|
| | | | | | | | | | | | | | | | | | | | | | | | | | | | | | | | | |
ShopKo | Green Bay, WI | | (b) | | 6,155 |
| | 6,298 |
| | (2,687 | ) | | (3,996 | ) | | 3,468 |
| | 2,302 |
| | 5,770 |
| | — |
| | 1979 | | 05/31/06 | | 15 to 30 Years |
ShopKo | Janesville, WI | | (b) | | 3,166 |
| | 4,808 |
| | (1,080 | ) | | (3,224 | ) | | 2,086 |
| | 1,584 |
| | 3,670 |
| | — |
| | 1980 | | 05/31/06 | | 15 to 28 Years |
ShopKo | Oshkosh, WI | | (b) | | 3,594 |
| | 4,384 |
| | (1,431 | ) | | (2,597 | ) | | 2,163 |
| | 1,787 |
| | 3,950 |
| | — |
| | 1984 | | 05/31/06 | | 15 to 30 Years |
ShopKo | Mason City, IA | | (b) | | 2,186 |
| | 3,888 |
| | (1,335 | ) | | (3,099 | ) | | 851 |
| | 789 |
| | 1,640 |
| | — |
| | 1985 | | 05/31/06 | | 15 to 28 Years |
ShopKo | Green Bay, WI | | (b) | | 8,698 |
| | 12,160 |
| | (3,676 | ) | | (8,912 | ) | | 5,022 |
| | 3,248 |
| | 8,270 |
| | — |
| | 2000 | | 05/31/06 | | 15 to 28 Years |
ShopKo | Freeport, IL | | (b) | | 1,941 |
| | 2,431 |
| | (1,411 | ) | | (1,911 | ) | | 530 |
| | 520 |
| | 1,050 |
| | — |
| | 1994 | | 05/31/06 | | 15 to 30 Years |
ShopKo | Duluth, MN | | (b) | | 4,722 |
| | 6,955 |
| | (3,568 | ) | | (5,809 | ) | | 1,154 |
| | 1,146 |
| | 2,300 |
| | — |
| | 1993 | | 05/31/06 | | 15 to 30 Years |
ShopKo | Hutchinson, MN | | (b) | | 2,793 |
| | 4,108 |
| | (1,852 | ) | | (3,169 | ) | | 941 |
| | 939 |
| | 1,880 |
| | — |
| | 1991 | | 05/31/06 | | 15 to 30 Years |
ShopKo | Logan, UT | | (b) | | 454 |
| | 3,453 |
| | (454 | ) | | (3,453 | ) | | — |
| | — |
| | — |
| | — |
| | 1989 | | 05/31/06 | | (e) |
ShopKo | Kimberly, WI | | (b) | | 3,550 |
| | 4,749 |
| | (1,515 | ) | | (3,444 | ) | | 2,035 |
| | 1,305 |
| | 3,340 |
| | — |
| | 1979 | | 05/31/06 | | 15 to 28 Years |
ShopKo | Appleton, WI | | (b) | | 4,898 |
| | 5,804 |
| | (2,458 | ) | | (3,914 | ) | | 2,440 |
| | 1,890 |
| | 4,330 |
| | — |
| | 1971 | | 05/31/06 | | 15 to 30 Years |
ShopKo | Dixon, IL | | (b) | | 1,502 |
| | 2,810 |
| | (1,110 | ) | | (2,252 | ) | | 392 |
| | 558 |
| | 950 |
| | — |
| | 1993 | | 05/31/06 | | 15 to 30 Years |
ShopKo | Beloit, WI | | (b) | | 3,191 |
| | 4,414 |
| | (1,277 | ) | | (3,048 | ) | | 1,914 |
| | 1,366 |
| | 3,280 |
| | — |
| | 1978 | | 05/31/06 | | 15 to 25 Years |
SPIRIT MTA REIT
Schedule III Real Estate and
Accumulated Depreciation
(Amounts in thousands)
|
| | | | | | | | | | | | | | | | | | | | | | | | | |
| | | | | Initial Cost to Company | | Cost Capitalized Subsequent to Acquisition including impairment | | Gross Amount at December 31, 2018 | | | | | | | | |
Concept | City, State | | Encumbrances (d) | | Land and Improvements | | Buildings and Improvements | | Land and Improvements | | Buildings and Improvements | | Land and Improvements | | Buildings and Improvements | | Total | | Final Accumulated Depreciation | | Date of Construction | | Date Acquired | | Life in which depreciation in latest Statement of Operations is computed |
|
| | | | | | | | | | | | | | | | | | | | | | | | | | | | | | | | | |
ShopKo | Racine, WI | | (b) | | 3,076 |
| | 5,305 |
| | (1,226 | ) | | (3,805 | ) | | 1,850 |
| | 1,500 |
| | 3,350 |
| | — |
| | 1979 | | 05/31/06 | | 15 to 25 Years |
ShopKo | Grafton, WI | | (b) | | 2,952 |
| | 4,206 |
| | (1,391 | ) | | (2,607 | ) | | 1,561 |
| | 1,599 |
| | 3,160 |
| | — |
| | 1989 | | 05/31/06 | | 15 to 30 Years |
ShopKo | Twin Falls, ID | | (b) | | 2,037 |
| | 3,696 |
| | (517 | ) | | (2,296 | ) | | 1,520 |
| | 1,400 |
| | 2,920 |
| | — |
| | 1986 | | 05/31/06 | | 15 to 20 Years |
ShopKo | Union Gap, WA | | (b) | | 481 |
| | 4,079 |
| | (481 | ) | | (4,079 | ) | | — |
| | — |
| | — |
| | — |
| | 1991 | | 05/31/06 | | (e) |
ShopKo | Spokane, WA | | (b) | | 1,014 |
| | 3,005 |
| | (1,014 | ) | | (3,005 | ) | | — |
| | — |
| | — |
| | — |
| | 1987 | | 05/31/06 | | (e) |
ShopKo | Austin, MN | | (b) | | 4,246 |
| | 4,444 |
| | (3,029 | ) | | (3,581 | ) | | 1,217 |
| | 863 |
| | 2,080 |
| | — |
| | 1983 | | 05/31/06 | | 15 to 30 Years |
ShopKo | Lewiston, ID | | (b) | | 409 |
| | 2,999 |
| | (409 | ) | | (2,999 | ) | | — |
| | — |
| | — |
| | — |
| | 1987 | | 05/31/06 | | (e) |
ShopKo | Worthington, MN | | (b) | | 2,861 |
| | 3,767 |
| | (1,873 | ) | | (2,865 | ) | | 988 |
| | 902 |
| | 1,890 |
| | — |
| | 1984 | | 05/31/06 | | 15 to 30 Years |
ShopKo | Rochester, MN | | (b) | | 6,189 |
| | 4,511 |
| | (4,739 | ) | | (4,031 | ) | | 1,450 |
| | 480 |
| | 1,930 |
| | — |
| | 1981 | | 05/31/06 | | 15 to 20 Years |
ShopKo | St. Cloud, MN | | (b) | | 3,749 |
| | 4,884 |
| | (2,693 | ) | | (4,220 | ) | | 1,056 |
| | 664 |
| | 1,720 |
| | — |
| | 1985 | | 05/31/06 | | 15 to 20 Years |
ShopKo | Mankato, MN | | (b) | | 6,167 |
| | 4,861 |
| | (4,039 | ) | | (4,079 | ) | | 2,128 |
| | 782 |
| | 2,910 |
| | — |
| | 1971 | | 05/31/06 | | 15 to 28 Years |
ShopKo | Missoula, MT | | (b) | | 4,123 |
| | 5,253 |
| | (1,333 | ) | | (3,563 | ) | | 2,790 |
| | 1,690 |
| | 4,480 |
| | — |
| | 1987 | | 05/31/06 | | 15 to 28 Years |
ShopKo | Lake Hallie, WI | | (b) | | 2,627 |
| | 3,965 |
| | (1,329 | ) | | (2,313 | ) | | 1,298 |
| | 1,652 |
| | 2,950 |
| | — |
| | 1982 | | 05/31/06 | | 15 to 30 Years |
SPIRIT MTA REIT
Schedule III Real Estate and
Accumulated Depreciation
(Amounts in thousands)
|
| | | | | | | | | | | | | | | | | | | | | | | | | |
| | | | | Initial Cost to Company | | Cost Capitalized Subsequent to Acquisition including impairment | | Gross Amount at December 31, 2018 | | | | | | | | |
Concept | City, State | | Encumbrances (d) | | Land and Improvements | | Buildings and Improvements | | Land and Improvements | | Buildings and Improvements | | Land and Improvements | | Buildings and Improvements | | Total | | Final Accumulated Depreciation | | Date of Construction | | Date Acquired | | Life in which depreciation in latest Statement of Operations is computed |
|
| | | | | | | | | | | | | | | | | | | | | | | | | | | | | | | | | |
ShopKo | Rothschild, WI | | (b) | | 2,685 |
| | 4,231 |
| | (507 | ) | | (2,439 | ) | | 2,178 |
| | 1,792 |
| | 3,970 |
| | — |
| | 1977 | | 05/31/06 | | 15 to 29 Years |
ShopKo | Sheboygan, WI | | (b) | | 2,973 |
| | 4,340 |
| | (1,447 | ) | | (2,626 | ) | | 1,526 |
| | 1,714 |
| | 3,240 |
| | — |
| | 1993 | | 05/31/06 | | 15 to 30 Years |
ShopKo | Jacksonville, IL | | (b) | | 3,603 |
| | 3,569 |
| | (2,430 | ) | | (2,632 | ) | | 1,173 |
| | 937 |
| | 2,110 |
| | — |
| | 1996 | | 05/31/06 | | 15 to 30 Years |
ShopKo | Monroe, WI | | (b) | | 1,526 |
| | 4,027 |
| | (561 | ) | | (2,002 | ) | | 965 |
| | 2,025 |
| | 2,990 |
| | — |
| | 1994 | | 05/31/06 | | 15 to 30 Years |
ShopKo | St. Cloud, MN | | (b) | | 5,033 |
| | 6,589 |
| | (3,396 | ) | | (5,126 | ) | | 1,637 |
| | 1,463 |
| | 3,100 |
| | — |
| | 1991 | | 05/31/06 | | 15 to 30 Years |
Skyline Chili | Fairborn, OH | | (a) | | 923 |
| | 468 |
| | — |
| | — |
| | 923 |
| | 468 |
| | 1,391 |
| | (326 | ) | | 1998 | | 06/25/04 | | 15 to 30 Years |
Skyline Chili | Lewis Center, OH | | (a) | | 626 |
| | 560 |
| | — |
| | — |
| | 626 |
| | 560 |
| | 1,186 |
| | (332 | ) | | 1998 | | 06/25/04 | | 15 to 30 Years |
Slim Chickens | Texarkana, TX | | (a) | | 265 |
| | 747 |
| | — |
| | — |
| | 265 |
| | 747 |
| | 1,012 |
| | (167 | ) | | 2013 | | 11/04/13 | | 14 to 30 Years |
Slim Chickens | Fayetteville, AR | | (a) | | 1,019 |
| | 1,150 |
| | — |
| | — |
| | 1,019 |
| | 1,150 |
| | 2,169 |
| | (214 | ) | | 2014 | | 06/23/14 | | 15 to 40 Years |
Solea Mexican Grill | Appleton, WI | | (a) | | 727 |
| | 1,329 |
| | — |
| | 9 |
| | 727 |
| | 1,338 |
| | 2,065 |
| | (736 | ) | | 1993 | | 12/29/06 | | 7 to 30 Years |
Sonic Drive-In | D'Iberville, MS | | (a) | | 597 |
| | 995 |
| | — |
| | — |
| | 597 |
| | 995 |
| | 1,592 |
| | (193 | ) | | 2005 | | 07/14/14 | | 15 to 30 Years |
Sonic Drive-In | Hattiesburg, MS | | (a) | | 845 |
| | 995 |
| | — |
| | — |
| | 845 |
| | 995 |
| | 1,840 |
| | (195 | ) | | 2010 | | 07/14/14 | | 15 to 40 Years |
Sonic Drive-In | Flowood, MS | | (a) | | 338 |
| | 848 |
| | — |
| | — |
| | 338 |
| | 848 |
| | 1,186 |
| | (154 | ) | | 1994 | | 07/31/14 | | 15 to 30 Years |
SPIRIT MTA REIT
Schedule III Real Estate and
Accumulated Depreciation
(Amounts in thousands)
|
| | | | | | | | | | | | | | | | | | | | | | | | | |
| | | | | Initial Cost to Company | | Cost Capitalized Subsequent to Acquisition including impairment | | Gross Amount at December 31, 2018 | | | | | | | | |
Concept | City, State | | Encumbrances (d) | | Land and Improvements | | Buildings and Improvements | | Land and Improvements | | Buildings and Improvements | | Land and Improvements | | Buildings and Improvements | | Total | | Final Accumulated Depreciation | | Date of Construction | | Date Acquired | | Life in which depreciation in latest Statement of Operations is computed |
|
| | | | | | | | | | | | | | | | | | | | | | | | | | | | | | | | | |
Sonic Drive-In | Bay Minette, AL | | (a) | | 583 |
| | 754 |
| | — |
| | — |
| | 583 |
| | 754 |
| | 1,337 |
| | (169 | ) | | 2000 | | 09/22/14 | | 15 to 30 Years |
Sonic Drive-In | Laurel, MS | | (a) | | 543 |
| | 754 |
| | — |
| | — |
| | 543 |
| | 754 |
| | 1,297 |
| | (167 | ) | | 1993 | | 09/22/14 | | 15 to 30 Years |
Sonic Drive-In | Knoxville, TN | | (a) | | 547 |
| | 230 |
| | — |
| | — |
| | 547 |
| | 230 |
| | 777 |
| | (402 | ) | | 1987 | | 07/01/05 | | 10 to 15 Years |
Sonic Drive-In | Bristol, TN | | (a) | | 484 |
| | 134 |
| | — |
| | — |
| | 484 |
| | 134 |
| | 618 |
| | (271 | ) | | 1991 | | 07/01/05 | | 15 to 20 Years |
Sonic Drive-In | Kingsport, TN | | (a) | | 592 |
| | 200 |
| | — |
| | — |
| | 592 |
| | 200 |
| | 792 |
| | (393 | ) | | 1992 | | 07/01/05 | | 15 to 20 Years |
Sonic Drive-In | Knoxville, TN | | (a) | | 635 |
| | 227 |
| | — |
| | — |
| | 635 |
| | 227 |
| | 862 |
| | (346 | ) | | 1995 | | 07/01/05 | | 15 to 20 Years |
Sonic Drive-In | Radford, VA | | (a) | | 499 |
| | 248 |
| | — |
| | — |
| | 499 |
| | 248 |
| | 747 |
| | (421 | ) | | 1995 | | 07/01/05 | | 15 to 20 Years |
Sonic Drive-In | Christiansburg, VA | | (a) | | 666 |
| | 168 |
| | — |
| | — |
| | 666 |
| | 168 |
| | 834 |
| | (338 | ) | | 1994 | | 07/01/05 | | 15 to 20 Years |
Sonic Drive-In | Pulaski, VA | | (a) | | 444 |
| | 236 |
| | — |
| | — |
| | 444 |
| | 236 |
| | 680 |
| | (358 | ) | | 1994 | | 07/01/05 | | 15 to 20 Years |
Sonic Drive-In | Wytheville, VA | | (a) | | 446 |
| | 172 |
| | — |
| | — |
| | 446 |
| | 172 |
| | 618 |
| | (255 | ) | | 1995 | | 07/01/05 | | 15 to 20 Years |
Sonic Drive-In | Elizabethton, TN | | (a) | | 655 |
| | 129 |
| | — |
| | — |
| | 655 |
| | 129 |
| | 784 |
| | (274 | ) | | 1993 | | 07/01/05 | | 15 to 20 Years |
Sonic Drive-In | Maryville, TN | | (a) | | 810 |
| | 306 |
| | — |
| | — |
| | 810 |
| | 306 |
| | 1,116 |
| | (327 | ) | | 1993 | | 07/01/05 | | 15 to 20 Years |
Southwest Stainless | Lakeland, FL | | (a) | | 1,098 |
| | 1,281 |
| | — |
| | — |
| | 1,098 |
| | 1,281 |
| | 2,379 |
| | (1,062 | ) | | 1984 | | 07/01/05 | | 14 to 20 Years |
SPIRIT MTA REIT
Schedule III Real Estate and
Accumulated Depreciation
(Amounts in thousands)
|
| | | | | | | | | | | | | | | | | | | | | | | | | |
| | | | | Initial Cost to Company | | Cost Capitalized Subsequent to Acquisition including impairment | | Gross Amount at December 31, 2018 | | | | | | | | |
Concept | City, State | | Encumbrances (d) | | Land and Improvements | | Buildings and Improvements | | Land and Improvements | | Buildings and Improvements | | Land and Improvements | | Buildings and Improvements | | Total | | Final Accumulated Depreciation | | Date of Construction | | Date Acquired | | Life in which depreciation in latest Statement of Operations is computed |
|
| | | | | | | | | | | | | | | | | | | | | | | | | | | | | | | | | |
Sportsman's Warehouse | Soldotna, AK | | (a) | | 1,177 |
| | 2,245 |
| | — |
| | — |
| | 1,177 |
| | 2,245 |
| | 3,422 |
| | (321 | ) | | 1983 | | 05/22/14 | | 15 to 40 Years |
SRS Distribution | Port Richey, FL | | (a) | | 741 |
| | 660 |
| | 40 |
| | 105 |
| | 781 |
| | 765 |
| | 1,546 |
| | (788 | ) | | 1975 | | 07/01/05 | | 5 to 15 Years |
|
| | | | | | | | | | | | | | | | | | | | | | | | | | | | | | | | | |
Station Casinos | Las Vegas, NV | | (a) | | 3,225 |
| | 30,483 |
| | — |
| | — |
| | 3,225 |
| | 30,483 |
| | 33,708 |
| | (3,971 | ) | | 2007 | | 07/17/13 | | 13 to 55 Years |
Taco Bell | Mount Pleasant, MI | | (a) | | 657 |
| | 854 |
| | — |
| | — |
| | 657 |
| | 854 |
| | 1,511 |
| | (414 | ) | | 2010 | | 02/13/09 | | 13 to 38 Years |
Taco Bell | Sedalia, MO | | (a) | | 751 |
| | 662 |
| | — |
| | — |
| | 751 |
| | 662 |
| | 1,413 |
| | (426 | ) | | 1983 | | 12/29/06 | | 15 to 30 Years |
Taco Bell | Springfield, MO | | (a) | | 439 |
| | 719 |
| | — |
| | — |
| | 439 |
| | 719 |
| | 1,158 |
| | (407 | ) | | 2004 | | 12/29/06 | | 15 to 40 Years |
Taco Bell | Red Bank, TN | | (a) | | 610 |
| | 557 |
| | — |
| | — |
| | 610 |
| | 557 |
| | 1,167 |
| | (424 | ) | | 1997 | | 06/25/04 | | 15 to 30 Years |
Taco Bell | Chattanooga, TN | | (a) | | 482 |
| | 682 |
| | — |
| | — |
| | 482 |
| | 682 |
| | 1,164 |
| | (397 | ) | | 1997 | | 06/25/04 | | 15 to 30 Years |
Taco Bell | Boone, NC | | (a) | | 750 |
| | 379 |
| | — |
| | — |
| | 750 |
| | 379 |
| | 1,129 |
| | (258 | ) | | 2006 | | 12/29/06 | | 15 to 30 Years |
Taco Bell | Cleveland, TN | | (a) | | 501 |
| | 459 |
| | — |
| | — |
| | 501 |
| | 459 |
| | 960 |
| | (224 | ) | | 2004 | | 12/29/06 | | 15 to 40 Years |
Taco Bell | Chattanooga, TN | | (a) | | 600 |
| | 389 |
| | — |
| | — |
| | 600 |
| | 389 |
| | 989 |
| | (213 | ) | | 1995 | | 09/29/06 | | 15 to 30 Years |
Taco Bell | Danville, IL | | (a) | | 619 |
| | 672 |
| | — |
| | — |
| | 619 |
| | 672 |
| | 1,291 |
| | (423 | ) | | 1995 | | 12/29/06 | | 15 to 30 Years |
Taco Bell | Dayton, OH | | (a) | | 526 |
| | 598 |
| | — |
| | — |
| | 526 |
| | 598 |
| | 1,124 |
| | (436 | ) | | 1982 | | 12/08/09 | | 12 to 17 Years |
SPIRIT MTA REIT
Schedule III Real Estate and
Accumulated Depreciation
(Amounts in thousands)
|
| | | | | | | | | | | | | | | | | | | | | | | | | |
| | | | | Initial Cost to Company | | Cost Capitalized Subsequent to Acquisition including impairment | | Gross Amount at December 31, 2018 | | | | | | | | |
Concept | City, State | | Encumbrances (d) | | Land and Improvements | | Buildings and Improvements | | Land and Improvements | | Buildings and Improvements | | Land and Improvements | | Buildings and Improvements | | Total | | Final Accumulated Depreciation | | Date of Construction | | Date Acquired | | Life in which depreciation in latest Statement of Operations is computed |
|
| | | | | | | | | | | | | | | | | | | | | | | | | | | | | | | | | |
Taco Bueno | Cedar Hill, TX | | (a) | | 620 |
| | 501 |
| | — |
| | — |
| | 620 |
| | 501 |
| | 1,121 |
| | (332 | ) | | 2005 | | 12/29/06 | | 15 to 30 Years |
Taco Bueno | Mansfield, TX | | (a) | | 472 |
| | 760 |
| | — |
| | — |
| | 472 |
| | 760 |
| | 1,232 |
| | (470 | ) | | 1991 | | 12/29/06 | | 15 to 30 Years |
Taco Bueno | Yukon, OK | | (a) | | 555 |
| | 373 |
| | — |
| | — |
| | 555 |
| | 373 |
| | 928 |
| | (286 | ) | | 2003 | | 07/01/05 | | 15 to 30 Years |
Ted's Cafe Escondido | Broken Arrow, OK | | (a) | | 1,636 |
| | 1,620 |
| | — |
| | — |
| | 1,636 |
| | 1,620 |
| | 3,256 |
| | (361 | ) | | 2006 | | 07/21/14 | | 14 to 30 Years |
Ted's Cafe Escondido | Tulsa, OK | | (a) | | 1,465 |
| | 1,728 |
| | 120 |
| | — |
| | 1,585 |
| | 1,728 |
| | 3,313 |
| | (366 | ) | | 2013 | | 07/21/14 | | 10 to 30 Years |
Texas Roadhouse | Memphis, TN | | (a) | | 817 |
| | 1,637 |
| | — |
| | — |
| | 817 |
| | 1,637 |
| | 2,454 |
| | (711 | ) | | 2005 | | 01/16/15 | | 9 to 15 Years |
Texas Roadhouse | Hiram, GA | | (a) | | 1,255 |
| | 1,766 |
| | — |
| | — |
| | 1,255 |
| | 1,766 |
| | 3,021 |
| | (768 | ) | | 2003 | | 01/16/15 | | 9 to 15 Years |
Texas Roadhouse | Marietta, GA | | (a) | | 1,221 |
| | 1,533 |
| | — |
| | — |
| | 1,221 |
| | 1,533 |
| | 2,754 |
| | (659 | ) | | 2003 | | 01/16/15 | | 9 to 15 Years |
The Atlanta Center for Foot & Ankle Surgery | Sandy Springs, GA | | (a) | | 455 |
| | 1,147 |
| | — |
| | — |
| | 455 |
| | 1,147 |
| | 1,602 |
| | (289 | ) | | 1963 | | 04/17/14 | | 14 to 20 Years |
The Forge Bar and Grill | Lander, WY | | (a) | | 57 |
| | 1,010 |
| | — |
| | — |
| | 57 |
| | 1,010 |
| | 1,067 |
| | (618 | ) | | 1883 | | 12/29/06 | | 15 to 20 Years |
The Great Escape | Merrillville, IN | | (a) | | 1,323 |
| | 3,975 |
| | 1 |
| | — |
| | 1,324 |
| | 3,975 |
| | 5,299 |
| | (1,905 | ) | | 1986 | | 04/30/09 | | 13 to 28 Years |
The Great Escape | Loves Park, IL | | (a) | | 1,550 |
| | 6,447 |
| | 1 |
| | — |
| | 1,551 |
| | 6,447 |
| | 7,998 |
| | (2,182 | ) | | 2004 | | 04/30/09 | | 13 to 38 Years |
The Great Escape | Algonquin, IL | | (a) | | 4,171 |
| | 5,613 |
| | — |
| | — |
| | 4,171 |
| | 5,613 |
| | 9,784 |
| | (2,132 | ) | | 2007 | | 04/30/09 | | 13 to 38 Years |
SPIRIT MTA REIT
Schedule III Real Estate and
Accumulated Depreciation
(Amounts in thousands)
|
| | | | | | | | | | | | | | | | | | | | | | | | | |
| | | | | Initial Cost to Company | | Cost Capitalized Subsequent to Acquisition including impairment | | Gross Amount at December 31, 2018 | | | | | | | | |
Concept | City, State | | Encumbrances (d) | | Land and Improvements | | Buildings and Improvements | | Land and Improvements | | Buildings and Improvements | | Land and Improvements | | Buildings and Improvements | | Total | | Final Accumulated Depreciation | | Date of Construction | | Date Acquired | | Life in which depreciation in latest Statement of Operations is computed |
|
| | | | | | | | | | | | | | | | | | | | | | | | | | | | | | | | | |
The Great Escape | Gurnee, IL | | (a) | | 767 |
| | 1,633 |
| | — |
| | (1 | ) | | 767 |
| | 1,632 |
| | 2,399 |
| | (849 | ) | | 1999 | | 04/30/09 | | 13 to 28 Years |
The Great Escape | Aurora, IL | | (a) | | 1,979 |
| | 4,111 |
| | — |
| | — |
| | 1,979 |
| | 4,111 |
| | 6,090 |
| | (1,834 | ) | | 1989 | | 04/30/09 | | 13 to 28 Years |
The Great Escape | Batavia, IL | | (a) | | 1,858 |
| | 3,441 |
| | (1 | ) | | — |
| | 1,857 |
| | 3,441 |
| | 5,298 |
| | (1,631 | ) | | 2001 | | 04/30/09 | | 13 to 28 Years |
The Great Escape | Joliet, IL | | (a) | | 1,700 |
| | 5,698 |
| | — |
| | — |
| | 1,700 |
| | 5,698 |
| | 7,398 |
| | (2,007 | ) | | 2004 | | 04/30/09 | | 13 to 38 Years |
The Great Escape | Downers Grove, IL | | (a) | | 1,772 |
| | 2,227 |
| | — |
| | — |
| | 1,772 |
| | 2,227 |
| | 3,999 |
| | (1,145 | ) | | 1994 | | 04/30/09 | | 13 to 28 Years |
The Great Escape | Tinley Park, IL | | (a) | | 1,108 |
| | 2,091 |
| | — |
| | — |
| | 1,108 |
| | 2,091 |
| | 3,199 |
| | (947 | ) | | 1990 | | 04/30/09 | | 13 to 28 Years |
The Great Escape | Avon, OH | | (a) | | 1,550 |
| | 2,750 |
| | — |
| | (1 | ) | | 1,550 |
| | 2,749 |
| | 4,299 |
| | (1,089 | ) | | 2007 | | 04/30/09 | | 13 to 38 Years |
The Great Escape | Mundelein, IL | | (a) | | 1,991 |
| | 4,307 |
| | — |
| | 1 |
| | 1,991 |
| | 4,308 |
| | 6,299 |
| | (1,998 | ) | | 2002 | | 04/30/09 | | 13 to 28 Years |
The Great Escape | Peoria, IL | | (a) | | 2,497 |
| | 4,401 |
| | — |
| | — |
| | 2,497 |
| | 4,401 |
| | 6,898 |
| | (1,789 | ) | | 2004 | | 04/30/09 | | 13 to 38 Years |
The Great Escape | Schaumburg, IL | | (a) | | 2,067 |
| | 2,632 |
| | — |
| | — |
| | 2,067 |
| | 2,632 |
| | 4,699 |
| | (1,272 | ) | | 2002 | | 04/30/09 | | 13 to 28 Years |
The Great Escape | Davenport, IA | | (a) | | 2,823 |
| | 4,475 |
| | — |
| | — |
| | 2,823 |
| | 4,475 |
| | 7,298 |
| | (1,883 | ) | | 2007 | | 04/30/09 | | 13 to 38 Years |
Tire Warehouse | Portland, ME | | (a) | | 650 |
| | 566 |
| | — |
| | — |
| | 650 |
| | 566 |
| | 1,216 |
| | (342 | ) | | 1993 | | 06/30/09 | | 13 to 28 Years |
Touchstone Imaging | Waco, TX | | (a) | | 232 |
| | 1,510 |
| | — |
| | — |
| | 232 |
| | 1,510 |
| | 1,742 |
| | (191 | ) | | 1992 | | 06/20/14 | | 15 to 40 Years |
SPIRIT MTA REIT
Schedule III Real Estate and
Accumulated Depreciation
(Amounts in thousands)
|
| | | | | | | | | | | | | | | | | | | | | | | | | |
| | | | | Initial Cost to Company | | Cost Capitalized Subsequent to Acquisition including impairment | | Gross Amount at December 31, 2018 | | | | | | | | |
Concept | City, State | | Encumbrances (d) | | Land and Improvements | | Buildings and Improvements | | Land and Improvements | | Buildings and Improvements | | Land and Improvements | | Buildings and Improvements | | Total | | Final Accumulated Depreciation | | Date of Construction | | Date Acquired | | Life in which depreciation in latest Statement of Operations is computed |
|
| | | | | | | | | | | | | | | | | | | | | | | | | | | | | | | | | |
Tractor Supply | Clovis, NM | | (a) | | 1,704 |
| | 1,342 |
| | — |
| | — |
| | 1,704 |
| | 1,342 |
| | 3,046 |
| | (572 | ) | | 2007 | | 07/17/13 | | 9 to 33 Years |
Twin Peaks | Little Rock, AR | | (a) | | 886 |
| | — |
| | — |
| | — |
| | 886 |
| | — |
| | 886 |
| | — |
| | (f) | | 06/26/14 | | (f) |
Uncle Ed's Oil Shoppe | Ypsilanti, MI | | (a) | | 1,107 |
| | 745 |
| | — |
| | — |
| | 1,107 |
| | 745 |
| | 1,852 |
| | (196 | ) | | 1999 | | 06/23/14 | | 15 to 30 Years |
Uncle Ed's Oil Shoppe | Kalamazoo, MI | | (a) | | 247 |
| | 333 |
| | — |
| | — |
| | 247 |
| | 333 |
| | 580 |
| | (89 | ) | | 1982 | | 07/30/14 | | 15 to 20 Years |
Uncle Ed's Oil Shoppe | Kalamazoo, MI | | (a) | | 201 |
| | 362 |
| | — |
| | — |
| | 201 |
| | 362 |
| | 563 |
| | (100 | ) | | 1987 | | 06/23/14 | | 15 to 20 Years |
Uncle Ed's Oil Shoppe | Troy, MI | | (a) | | 322 |
| | 392 |
| | — |
| | — |
| | 322 |
| | 392 |
| | 714 |
| | (109 | ) | | 1984 | | 06/23/14 | | 15 to 20 Years |
Uncle Ed's Oil Shoppe | Livonia, MI | | (a) | | 252 |
| | 262 |
| | — |
| | — |
| | 252 |
| | 262 |
| | 514 |
| | (80 | ) | | 1986 | | 06/23/14 | | 15 to 20 Years |
Uncle Ed's Oil Shoppe | Kalamazoo, MI | | (a) | | 171 |
| | 332 |
| | — |
| | — |
| | 171 |
| | 332 |
| | 503 |
| | (105 | ) | | 1979 | | 06/23/14 | | 15 to 20 Years |
Uncle Ed's Oil Shoppe | Kalamazoo, MI | | (a) | | 503 |
| | 342 |
| | — |
| | — |
| | 503 |
| | 342 |
| | 845 |
| | (168 | ) | | 1989 | | 06/23/14 | | 15 to 20 Years |
Uncle Ed's Oil Shoppe | Kalamazoo, MI | | (a) | | 312 |
| | 262 |
| | — |
| | — |
| | 312 |
| | 262 |
| | 574 |
| | (80 | ) | | 1984 | | 06/23/14 | | 15 to 20 Years |
Uncle Ed's Oil Shoppe | Troy, MI | | (a) | | 281 |
| | 267 |
| | — |
| | — |
| | 281 |
| | 267 |
| | 548 |
| | (51 | ) | | 1989 | | 12/03/14 | | 15 to 30 Years |
Uncle Ed's Oil Shoppe | Madison Heights, MI | | (a) | | 352 |
| | 493 |
| | — |
| | — |
| | 352 |
| | 493 |
| | 845 |
| | (141 | ) | | 1984 | | 06/23/14 | | 15 to 20 Years |
Uncle Ed's Oil Shoppe | Bloomfield, MI | | (a) | | 554 |
| | 332 |
| | — |
| | — |
| | 554 |
| | 332 |
| | 886 |
| | (105 | ) | | 1987 | | 06/23/14 | | 15 to 20 Years |
SPIRIT MTA REIT
Schedule III Real Estate and
Accumulated Depreciation
(Amounts in thousands)
|
| | | | | | | | | | | | | | | | | | | | | | | | | |
| | | | | Initial Cost to Company | | Cost Capitalized Subsequent to Acquisition including impairment | | Gross Amount at December 31, 2018 | | | | | | | | |
Concept | City, State | | Encumbrances (d) | | Land and Improvements | | Buildings and Improvements | | Land and Improvements | | Buildings and Improvements | | Land and Improvements | | Buildings and Improvements | | Total | | Final Accumulated Depreciation | | Date of Construction | | Date Acquired | | Life in which depreciation in latest Statement of Operations is computed |
|
| | | | | | | | | | | | | | | | | | | | | | | | | | | | | | | | | |
Uncle Ed's Oil Shoppe | Battle Creek, MI | | (a) | | 594 |
| | 262 |
| | — |
| | — |
| | 594 |
| | 262 |
| | 856 |
| | (137 | ) | | 1998 | | 06/23/14 | | 15 to 20 Years |
Uncle Ed's Oil Shoppe | Warren, MI | | (a) | | 409 |
| | 344 |
| | — |
| | — |
| | 409 |
| | 344 |
| | 753 |
| | (98 | ) | | 1986 | | 07/30/14 | | 15 to 20 Years |
Uncle Ed's Oil Shoppe | Battle Creek, MI | | (a) | | 302 |
| | 262 |
| | — |
| | — |
| | 302 |
| | 262 |
| | 564 |
| | (80 | ) | | 1987 | | 06/23/14 | | 15 to 20 Years |
Uncle Ed's Oil Shoppe | Clinton Township, MI | | (a) | | 141 |
| | 282 |
| | — |
| | — |
| | 141 |
| | 282 |
| | 423 |
| | (82 | ) | | 1987 | | 06/23/14 | | 15 to 20 Years |
Uncle Ed's Oil Shoppe | Portage, MI | | (a) | | 423 |
| | 262 |
| | — |
| | — |
| | 423 |
| | 262 |
| | 685 |
| | (83 | ) | | 1985 | | 06/23/14 | | 15 to 20 Years |
Uncle Ed's Oil Shoppe | Shelby Township, MI | | (a) | | 387 |
| | 355 |
| | — |
| | — |
| | 387 |
| | 355 |
| | 742 |
| | (110 | ) | | 1989 | | 07/30/14 | | 15 to 20 Years |
Uncle Ed's Oil Shoppe | Kalamazoo, MI | | (a) | | 141 |
| | 141 |
| | — |
| | — |
| | 141 |
| | 141 |
| | 282 |
| | (50 | ) | | 1959 | | 06/23/14 | | 15 to 20 Years |
Uncle Ed's Oil Shoppe | Macomb Township, MI | | (a) | | 181 |
| | 262 |
| | — |
| | — |
| | 181 |
| | 262 |
| | 443 |
| | (77 | ) | | 1986 | | 06/23/14 | | 15 to 20 Years |
Uncle Ed's Oil Shoppe | St Clair Shores, MI | | (a) | | 242 |
| | 272 |
| | — |
| | — |
| | 242 |
| | 272 |
| | 514 |
| | (82 | ) | | 1985 | | 06/23/14 | | 15 to 20 Years |
Uncle Ed's Oil Shoppe | Battle Creek, MI | | (a) | | 211 |
| | 419 |
| | — |
| | — |
| | 211 |
| | 419 |
| | 630 |
| | (115 | ) | | 1981 | | 06/23/14 | | 15 to 20 Years |
Uncle Ed's Oil Shoppe | Chesterfield Township, MI | | (a) | | 181 |
| | 302 |
| | — |
| | — |
| | 181 |
| | 302 |
| | 483 |
| | (92 | ) | | 1990 | | 06/23/14 | | 15 to 20 Years |
Uncle Ed's Oil Shoppe | Kalamazoo, MI | | (a) | | 60 |
| | 211 |
| | — |
| | — |
| | 60 |
| | 211 |
| | 271 |
| | (57 | ) | | 1986 | | 06/23/14 | | 15 to 20 Years |
Uncle Ed's Oil Shoppe | Ann Arbor, MI | | (a) | | 684 |
| | 413 |
| | — |
| | — |
| | 684 |
| | 413 |
| | 1,097 |
| | (120 | ) | | 1989 | | 06/23/14 | | 15 to 20 Years |
SPIRIT MTA REIT
Schedule III Real Estate and
Accumulated Depreciation
(Amounts in thousands)
|
| | | | | | | | | | | | | | | | | | | | | | | | | |
| | | | | Initial Cost to Company | | Cost Capitalized Subsequent to Acquisition including impairment | | Gross Amount at December 31, 2018 | | | | | | | | |
Concept | City, State | | Encumbrances (d) | | Land and Improvements | | Buildings and Improvements | | Land and Improvements | | Buildings and Improvements | | Land and Improvements | | Buildings and Improvements | | Total | | Final Accumulated Depreciation | | Date of Construction | | Date Acquired | | Life in which depreciation in latest Statement of Operations is computed |
|
| | | | | | | | | | | | | | | | | | | | | | | | | | | | | | | | | |
Uncle Ed's Oil Shoppe | Clawson, MI | | (a) | | 262 |
| | 242 |
| | — |
| | — |
| | 262 |
| | 242 |
| | 504 |
| | (72 | ) | | 1984 | | 06/23/14 | | 15 to 20 Years |
Uncle Ed's Oil Shoppe | Kalamazoo, MI | | (a) | | 352 |
| | 262 |
| | — |
| | — |
| | 352 |
| | 262 |
| | 614 |
| | (95 | ) | | 1987 | | 06/23/14 | | 15 to 20 Years |
Uncle Ed's Oil Shoppe | Farmington Hills, MI | | (a) | | 382 |
| | 282 |
| | — |
| | — |
| | 382 |
| | 282 |
| | 664 |
| | (94 | ) | | 1987 | | 06/23/14 | | 15 to 20 Years |
Uncle Ed's Oil Shoppe | Waterford, MI | | (a) | | 292 |
| | 362 |
| | — |
| | — |
| | 292 |
| | 362 |
| | 654 |
| | (112 | ) | | 1989 | | 06/23/14 | | 15 to 20 Years |
United Supermarkets | Abilene, TX | | (a) | | 1,586 |
| | 2,230 |
| | — |
| | — |
| | 1,586 |
| | 2,230 |
| | 3,816 |
| | (841 | ) | | 1979 | | 03/27/13 | | 6 to 20 Years |
United Supermarkets | Amarillo, TX | | (a) | | 1,574 |
| | 1,389 |
| | — |
| | — |
| | 1,574 |
| | 1,389 |
| | 2,963 |
| | (601 | ) | | 1989 | | 05/23/05 | | 9 to 30 Years |
United Supermarkets | Burkburnett, TX | | (a) | | 2,030 |
| | 2,706 |
| | — |
| | — |
| | 2,030 |
| | 2,706 |
| | 4,736 |
| | (909 | ) | | 1997 | | 05/23/05 | | 11 to 40 Years |
United Supermarkets | Lubbock, TX | | (a) | | 1,782 |
| | 2,055 |
| | — |
| | — |
| | 1,782 |
| | 2,055 |
| | 3,837 |
| | (690 | ) | | 1997 | | 05/23/05 | | 11 to 40 Years |
United Supermarkets | Perryton, TX | | (a) | | 1,029 |
| | 597 |
| | — |
| | — |
| | 1,029 |
| | 597 |
| | 1,626 |
| | (238 | ) | | 1997 | | 05/23/05 | | 7 to 40 Years |
United Supermarkets | Vernon, TX | | (a) | | 1,791 |
| | 2,550 |
| | — |
| | — |
| | 1,791 |
| | 2,550 |
| | 4,341 |
| | (856 | ) | | 1997 | | 05/23/05 | | 11 to 40 Years |
Vacant | Denver, CO | | (c) | | 4,124 |
| | 4,229 |
| | (2,258 | ) | | (2,395 | ) | | 1,866 |
| | 1,834 |
| | 3,700 |
| | (50 | ) | | 1980 | | 08/21/15 | | 12 to 40 Years |
Vacant | Lincoln, IL | | (a) | | 203 |
| | 616 |
| | (95 | ) | | (376 | ) | | 108 |
| | 240 |
| | 348 |
| | — |
| | 1990 | | 09/23/05 | | 3 to 8 Years |
Vacant | Carrollton, KY | | (a) | | 229 |
| | 730 |
| | (100 | ) | | (343 | ) | | 129 |
| | 387 |
| | 516 |
| | — |
| | 1990 | | 06/30/09 | | 3 to 18 Years |
SPIRIT MTA REIT
Schedule III Real Estate and
Accumulated Depreciation
(Amounts in thousands)
|
| | | | | | | | | | | | | | | | | | | | | | | | | |
| | | | | Initial Cost to Company | | Cost Capitalized Subsequent to Acquisition including impairment | | Gross Amount at December 31, 2018 | | | | | | | | |
Concept | City, State | | Encumbrances (d) | | Land and Improvements | | Buildings and Improvements | | Land and Improvements | | Buildings and Improvements | | Land and Improvements | | Buildings and Improvements | | Total | | Final Accumulated Depreciation | | Date of Construction | | Date Acquired | | Life in which depreciation in latest Statement of Operations is computed |
|
| | | | | | | | | | | | | | | | | | | | | | | | | | | | | | | | | |
Vacant | Independence, MO | | (a) | | 1,450 |
| | 1,967 |
| | (843 | ) | | (1,259 | ) | | 607 |
| | 708 |
| | 1,315 |
| | (43 | ) | | 2002 | | 06/29/07 | | 4 to 29 Years |
Vacant | Arlington, TX | | (c) | | 1,301 |
| | 1,032 |
| | — |
| | — |
| | 1,301 |
| | 1,032 |
| | 2,333 |
| | (872 | ) | | 1978 | | 02/26/07 | | 14 to 20 Years |
Vacant | Martinsburg, WV | | (a) | | 2,450 |
| | 3,528 |
| | (1,004 | ) | | (1,974 | ) | | 1,446 |
| | 1,554 |
| | 3,000 |
| | (29 | ) | | 1998 | | 09/30/05 | | 3 to 18 Years |
Vacant | Stillwater, OK | | (a) | | 647 |
| | 687 |
| | (205 | ) | | (253 | ) | | 442 |
| | 434 |
| | 876 |
| | (18 | ) | | 1987 | | 06/04/14 | | 11 to 26 Years |
Vacant | Dodge City, KS | | (a) | | 249 |
| | 587 |
| | (81 | ) | | (216 | ) | | 168 |
| | 371 |
| | 539 |
| | (13 | ) | | 1985 | | 06/04/14 | | 11 to 26 Years |
Vacant | Colby, KS | | (a) | | 269 |
| | 567 |
| | (172 | ) | | (365 | ) | | 97 |
| | 202 |
| | 299 |
| | — |
| | 1987 | | 06/04/14 | | 25 to 39 Years |
Vacant | Newton, KS | | (a) | | 175 |
| | 661 |
| | (127 | ) | | (466 | ) | | 48 |
| | 195 |
| | 243 |
| | — |
| | 1987 | | 06/30/14 | | 10 to 25 Years |
Vacant | Winfield, KS | | (a) | | 239 |
| | 866 |
| | (171 | ) | | (599 | ) | | 68 |
| | 267 |
| | 335 |
| | — |
| | 1995 | | 06/04/14 | | 10 to 25 Years |
Vacant | Arkansas City, KS | | (a) | | 239 |
| | 975 |
| | (176 | ) | | (703 | ) | | 63 |
| | 272 |
| | 335 |
| | — |
| | 1987 | | 06/04/14 | | 10 to 25 Years |
Vacant | Emporia, KS | | (a) | | 657 |
| | 219 |
| | (371 | ) | | (136 | ) | | 286 |
| | 83 |
| | 369 |
| | — |
| | 1997 | | 06/04/14 | | 10 to 25 Years |
Vacant | Lewisville, TX | | (a) | | 1,767 |
| | 8,086 |
| | (1,213 | ) | | (5,677 | ) | | 554 |
| | 2,409 |
| | 2,963 |
| | (100 | ) | | 2002 | | 03/31/14 | | 4 to 36 Years |
Vacant | DeKalb, IL | | (a) | | 1,423 |
| | 1,552 |
| | (473 | ) | | (763 | ) | | 950 |
| | 789 |
| | 1,739 |
| | (30 | ) | | 1996 | | 12/29/06 | | 4 to 19 Years |
Vacant | Kansas City, KS | | (c) | | 1,932 |
| | 5,629 |
| | (1,175 | ) | | (3,386 | ) | | 757 |
| | 2,243 |
| | 3,000 |
| | — |
| | 2009 | | 07/17/13 | | 1 to 37 Years |
SPIRIT MTA REIT
Schedule III Real Estate and
Accumulated Depreciation
(Amounts in thousands)
|
| | | | | | | | | | | | | | | | | | | | | | | | | |
| | | | | Initial Cost to Company | | Cost Capitalized Subsequent to Acquisition including impairment | | Gross Amount at December 31, 2018 | | | | | | | | |
Concept | City, State | | Encumbrances (d) | | Land and Improvements | | Buildings and Improvements | | Land and Improvements | | Buildings and Improvements | | Land and Improvements | | Buildings and Improvements | | Total | | Final Accumulated Depreciation | | Date of Construction | | Date Acquired | | Life in which depreciation in latest Statement of Operations is computed |
|
| | | | | | | | | | | | | | | | | | | | | | | | | | | | | | | | | |
Vacant | Altus, OK | | (a) | | 103 |
| | 237 |
| | — |
| | — |
| | 103 |
| | 237 |
| | 340 |
| | (78 | ) | | 1998 | | 07/17/13 | | 4 to 28 Years |
Vacant | Knoxville, TN | | (c) | | 1,508 |
| | 2,017 |
| | (555 | ) | | 827 |
| | 953 |
| | 2,844 |
| | 3,797 |
| | (18 | ) | | 1987 | | 12/10/15 | | 6 to 57 Years |
Vacant | Tipp City, OH | | (a) | | 789 |
| | 332 |
| | — |
| | — |
| | 789 |
| | 332 |
| | 1,121 |
| | (305 | ) | | 1991 | | 12/29/06 | | 15 to 20 Years |
Vacant | Bellefontaine, OH | | (a) | | 388 |
| | 778 |
| | (12 | ) | | — |
| | 376 |
| | 778 |
| | 1,154 |
| | (526 | ) | | 1989 | | 12/29/06 | | 15 to 20 Years |
Walgreens | Saginaw, MI | | (a) | | 1,064 |
| | 3,906 |
| | — |
| | — |
| | 1,064 |
| | 3,906 |
| | 4,970 |
| | (646 | ) | | 2000 | | 07/17/13 | | 7 to 41 Years |
Walgreens | Oneida, NY | | (a) | | 1,315 |
| | 1,411 |
| | — |
| | — |
| | 1,315 |
| | 1,411 |
| | 2,726 |
| | (486 | ) | | 1999 | | 07/01/05 | | 19 to 40 Years |
Wendy's | Greenville, TX | | (a) | | 223 |
| | 304 |
| | — |
| | — |
| | 223 |
| | 304 |
| | 527 |
| | (206 | ) | | 1985 | | 12/29/05 | | 15 to 20 Years |
Wendy's | Pineville, LA | | (a) | | 558 |
| | 1,044 |
| | — |
| | — |
| | 558 |
| | 1,044 |
| | 1,602 |
| | (528 | ) | | 1996 | | 06/25/04 | | 11 to 30 Years |
|
| | | | | | | | | | | | | | | | | | | | | | | | | | | | | | | | | |
Wendy's | Madison, GA | | (a) | | 892 |
| | 739 |
| | — |
| | — |
| | 892 |
| | 739 |
| | 1,631 |
| | (399 | ) | | 1989 | | 01/12/06 | | 15 to 40 Years |
Wendy's | Forsyth, GA | | (a) | | 495 |
| | 1,007 |
| | — |
| | — |
| | 495 |
| | 1,007 |
| | 1,502 |
| | (512 | ) | | 1984 | | 01/12/06 | | 15 to 30 Years |
Winsteads | Overland Park, KS | | (a) | | 953 |
| | 886 |
| | — |
| | — |
| | 953 |
| | 886 |
| | 1,839 |
| | (289 | ) | | 2009 | | 08/22/13 | | 15 to 20 Years |
Yard House | Cincinnati, OH | | (a) | | 1,614 |
| | 4,134 |
| | — |
| | — |
| | 1,614 |
| | 4,134 |
| | 5,748 |
| | (630 | ) | | 2013 | | 01/15/14 | | 9 to 40 Years |
YouFit | Chandler, AZ | | (a) | | 1,326 |
| | 2,665 |
| | 3 |
| | 24 |
| | 1,329 |
| | 2,689 |
| | 4,018 |
| | (288 | ) | | 2007 | | 09/30/16 | | 10 to 30 Years |
SPIRIT MTA REIT
Schedule III Real Estate and
Accumulated Depreciation
(Amounts in thousands)
|
| | | | | | | | | | | | | | | | | | | | | | | | | |
| | | | | Initial Cost to Company | | Cost Capitalized Subsequent to Acquisition including impairment | | Gross Amount at December 31, 2018 | | | | | | | | |
Concept | City, State | | Encumbrances (d) | | Land and Improvements | | Buildings and Improvements | | Land and Improvements | | Buildings and Improvements | | Land and Improvements | | Buildings and Improvements | | Total | | Final Accumulated Depreciation | | Date of Construction | | Date Acquired | | Life in which depreciation in latest Statement of Operations is computed |
|
| | | | | | | | | | | | | | | | | | | | | | | | | | | | | | | | | |
YouFit | Phoenix, AZ | | (a) | | 1,402 |
| | 2,879 |
| | (4 | ) | | (2 | ) | | 1,398 |
| | 2,877 |
| | 4,275 |
| | (304 | ) | | 2008 | | 09/30/16 | | 10 to 30 Years |
| | | | | 987,483 |
| | 1,711,913 |
| | (116,934 | ) | | (184,980 | ) | | 870,549 |
| | 1,526,933 |
| | 2,397,482 |
| | (459,615 | ) | | | | | | |
|
| |
(a) | Represents properties collateralized with Master Trust 2014 debt. |
(b) | Represents properties collateralized with CMBS debt. |
(c) | Represents unencumbered properties. |
(d) | The aggregate cost of properties for federal income tax purposes is approximately $3.03 billion at December 31, 2018. |
(e) | Represents assets that are fully impaired as of December 31, 2018 and, as such, are not depreciating. |
(f) | Represents land only properties with no depreciation and therefore date of construction and estimated life for depreciation not applicable. |
|
| | | | | | | | | | | |
| 2018 | | 2017 | | 2016 |
| | | | | |
Land, buildings, and improvements | | | | | |
Balance at the beginning of the year | $ | 2,631,254 |
| | $ | 2,541,175 |
| | $ | 2,646,146 |
|
Additions: | | | | | |
Acquisitions, contributions, capital expenditures, and reclassifications from held for sale and deferred financing leases | 205,824 |
| | 261,875 |
| | 98,119 |
|
Deductions: | | | | | |
Dispositions of land, buildings, and improvements and other adjustments | (70,568 | ) | | (101,168 | ) | | (112,750 | ) |
Reclassifications to held for sale | (58,860 | ) | | (27,342 | ) | | (48,672 | ) |
Impairments and basis reset due to impairment | (310,168 | ) | | (43,286 | ) | | (41,668 | ) |
Gross Real Estate Balance at close of the year | $ | 2,397,482 |
| | $ | 2,631,254 |
| | $ | 2,541,175 |
|
| | | | | |
Accumulated depreciation and amortization | | | | | |
Balance at the beginning of the year | $ | (557,948 | ) | | $ | (496,579 | ) | | $ | (469,344 | ) |
Additions: | | | | | |
Depreciation expense, contributions and reclassifications from held for sale | (89,513 | ) | | (95,328 | ) | | (73,858 | ) |
Deductions: | | | | | |
Dispositions and transfers of land, buildings, and improvements and other adjustments including basis reset due to impairment | 175,666 |
| | 39,852 |
| | 49,985 |
|
Reclassifications to held for sale | 12,180 |
| | (5,893 | ) | | (3,362 | ) |
Balance at close of the year | $ | (459,615 | ) | | $ | (557,948 | ) | | $ | (496,579 | ) |
| | | | | |
Net Real Estate Investment | $ | 1,937,867 |
| | $ | 2,073,306 |
| | $ | 2,044,596 |
|
SPIRIT MTA REIT
Schedule IV
Mortgage Loans on Real Estate
As of December 31, 2018
(In thousands)
|
| | | | | | | | | | | | | | | | | | | | | | | | | | |
| | | | | | | | | | | | | | | | | | |
Description | | Location(s) | | Stated Interest Rate | | Final Maturity Date (1) | | Periodic Payment Terms | | Prior Liens | | Face Amount of Mortgages | | Carrying Amount of Mortgages (2) (3) | | Principal Amount of Loans Subject to Delinquent Principal or Interest |
General Merchandise | | WI (2) | | 6.5% | | 5/31/2019 | | Interest Only (4) | | $ | — |
| | $ | 2,888 |
| | $ | 1,589 |
| | $ | — |
|
Convenience Stores | | FL, IN, KY | | 1.0% | | 3/1/2028 | | Principal & Interest | | — |
| | 38,200 |
| | 25,909 |
| | — |
|
Restaurants - Quick Service <3% | | NC (3) | | 1.0% | | 10/1/2025 - 11/1/2025 | | Principal & Interest | | — |
| | 3,650 |
| | 1,981 |
| | — |
|
Total | | | | | | | | | | | | $ | — |
| | $ | 44,738 |
| | $ | 29,479 |
| | $ | — |
|
| | | | | | | | | | | | | | | | | | |
(1) Reflects current maturity of the investment and does not consider any options to extend beyond the current maturity. |
(2) The aggregate tax basis of the mortgage loans outstanding on December 31, 2017 was $29.5 million. |
(3) The tenant occupying both general merchandise locations filed for bankruptcy on January 16, 2019. As a result, the remaining balance of the mortgage notes and related accrued interest have been reserved, totaling $1.3 million. |
(4) Interest only over term of loan with a balloon payment of $2.9 million due at maturity. |
|
SPIRIT MTA REIT
Schedule IV
Mortgage Loans on Real Estate
As of December 31, 2018
(In thousands)
|
| | | | | | | | | | | |
| 2018 | | 2017 | | 2016 |
| | | | | |
Reconciliation of Mortgage Loans on Real Estate | | | | | |
Balance January 1, | $ | 32,307 |
| | $ | 35,929 |
| | $ | 69,743 |
|
Additions during period | | | | | |
New mortgage loans | 2,888 |
| | — |
| | — |
|
Deductions during period | | | | | |
Collections of principal (inclusive of loans receivable exchanged for real estate acquired) | (4,417 | ) | | (3,227 | ) | | (33,277 | ) |
Amortization of premium | — |
| | (6 | ) | | (537 | ) |
Mortgage loans receivable December 31, | 30,778 |
| | 32,696 |
| | 35,929 |
|
Mortgage loan loss provisions | (1,299 | ) | | (389 | ) | | — |
|
Total mortgage loans receivable, net | $ | 29,479 |
| | $ | 32,307 |
| | $ | 35,929 |
|
SIGNATURES
Pursuant to the requirements of the Securities Exchange Act of 1934, the registrants have duly caused this report to be signed on their behalf by the undersigned thereunto duly authorized.
|
| | |
| | |
SPIRIT MTA REIT |
| |
By: | | /s/ Ricardo Rodriguez |
Name: | | Ricardo Rodriguez |
Title:
| | Chief Executive Officer, President, Chief Financial Officer and Treasurer |
Date: March 22, 2019
POWER OF ATTORNEY
KNOW ALL PERSONS BY THESE PRESENTS, that each person whose signature appears below does hereby constitute and appoint Ricardo Rodriguez and Jay Young, and each of them singly, our true and lawful attorneys with full power to them, and each of them singly, to sign for us and in our names in the capacities indicated below, the Form 10-K filed herewith and any and all amendments to said Form 10-K, and generally to do all such things in our names and in our capacities as officers and trustees to enable Spirit MTA REIT to comply with the provisions of the Securities Exchange Act of 1934, as amended, and all requirements of the Securities and Exchange Commission in connection therewith, hereby ratifying and confirming our signatures as they may be signed by our said attorneys, or any of them, to said Form 10-K and any and all amendments thereto.
Pursuant to the requirements of the Securities and Exchange Act, this report has been signed below by the following persons on behalf of the registrant and in the capacities and on the dates indicated.
|
| | |
Name | Title | Date |
/s/ Ricardo Rodriguez | Chief Executive Officer, President, Chief Financial Officer and Treasurer (Principal Executive Officer and Principal Financial Officer) | March 22, 2019 |
| | |
/s/ Jackson Hsieh | Trustee | March 22, 2019 |
| | |
/s/ Steven G. Panagos | Trustee | March 22, 2019 |
| | |
/s/ Steven H. Shepsman | Trustee | March 22, 2019 |
| | |
/s/ Richard J. Stockton | Trustee | March 22, 2019 |
| | |
/s/ Thomas J. Sullivan | Trustee | March 22, 2019 |