
.2
Alarum Technologies Investor Presentation First Quarter 2026 NASDAQ; TASE: ALAR May 2026
Safe Harbor Forward-Looking Statements This presentation of Alarum Technologies Ltd. ("Alarum" or the "Company") contains forward-looking statements within the meaning of the "safe harbor" words such as "expects," "anticipates," "intends," "plans," "believes," "seeks," "estimates" and similar expressions or variations of such words are intended to identify forward-looking statements. For example, Alarum is using forward-looking statements in this presentation when it discusses the benefits and advantages of Alarum's solutions and technology, growing AI data demand, the size of the market, growth of the Company's profit, the Company's goals, platform developments and the timing thereof, and its business model, strategic roadmap, long- term vision and market opportunity. Because such statements deal with future events and are based on Alarum's current expectations, they are subject to various risks and uncertainties and actual results, performance or achievements of Alarum could differ materially from those described in or implied by the statements in this presentation. The forward-looking statements contained or implied in this presentation are subject to other risks and uncertainties, including those discussed under the heading "Risk Factors" in Alarum's annual report on Form 20-F filed with the Securities and Exchange Commission ("SEC") on March 19, 2026, and in any subsequent filings with the SEC. Except as otherwise required by law, Alarum undertakes no obligation to publicly release any revisions to these forward- looking statements to reflect events or circumstances after the date hereof or to reflect the occurrence of unanticipated events. References and links to websites have been provided as a convenience, and the information contained on such websites is not incorporated by reference into this presentation. Alarum is not responsible for the contents of third- party websites.
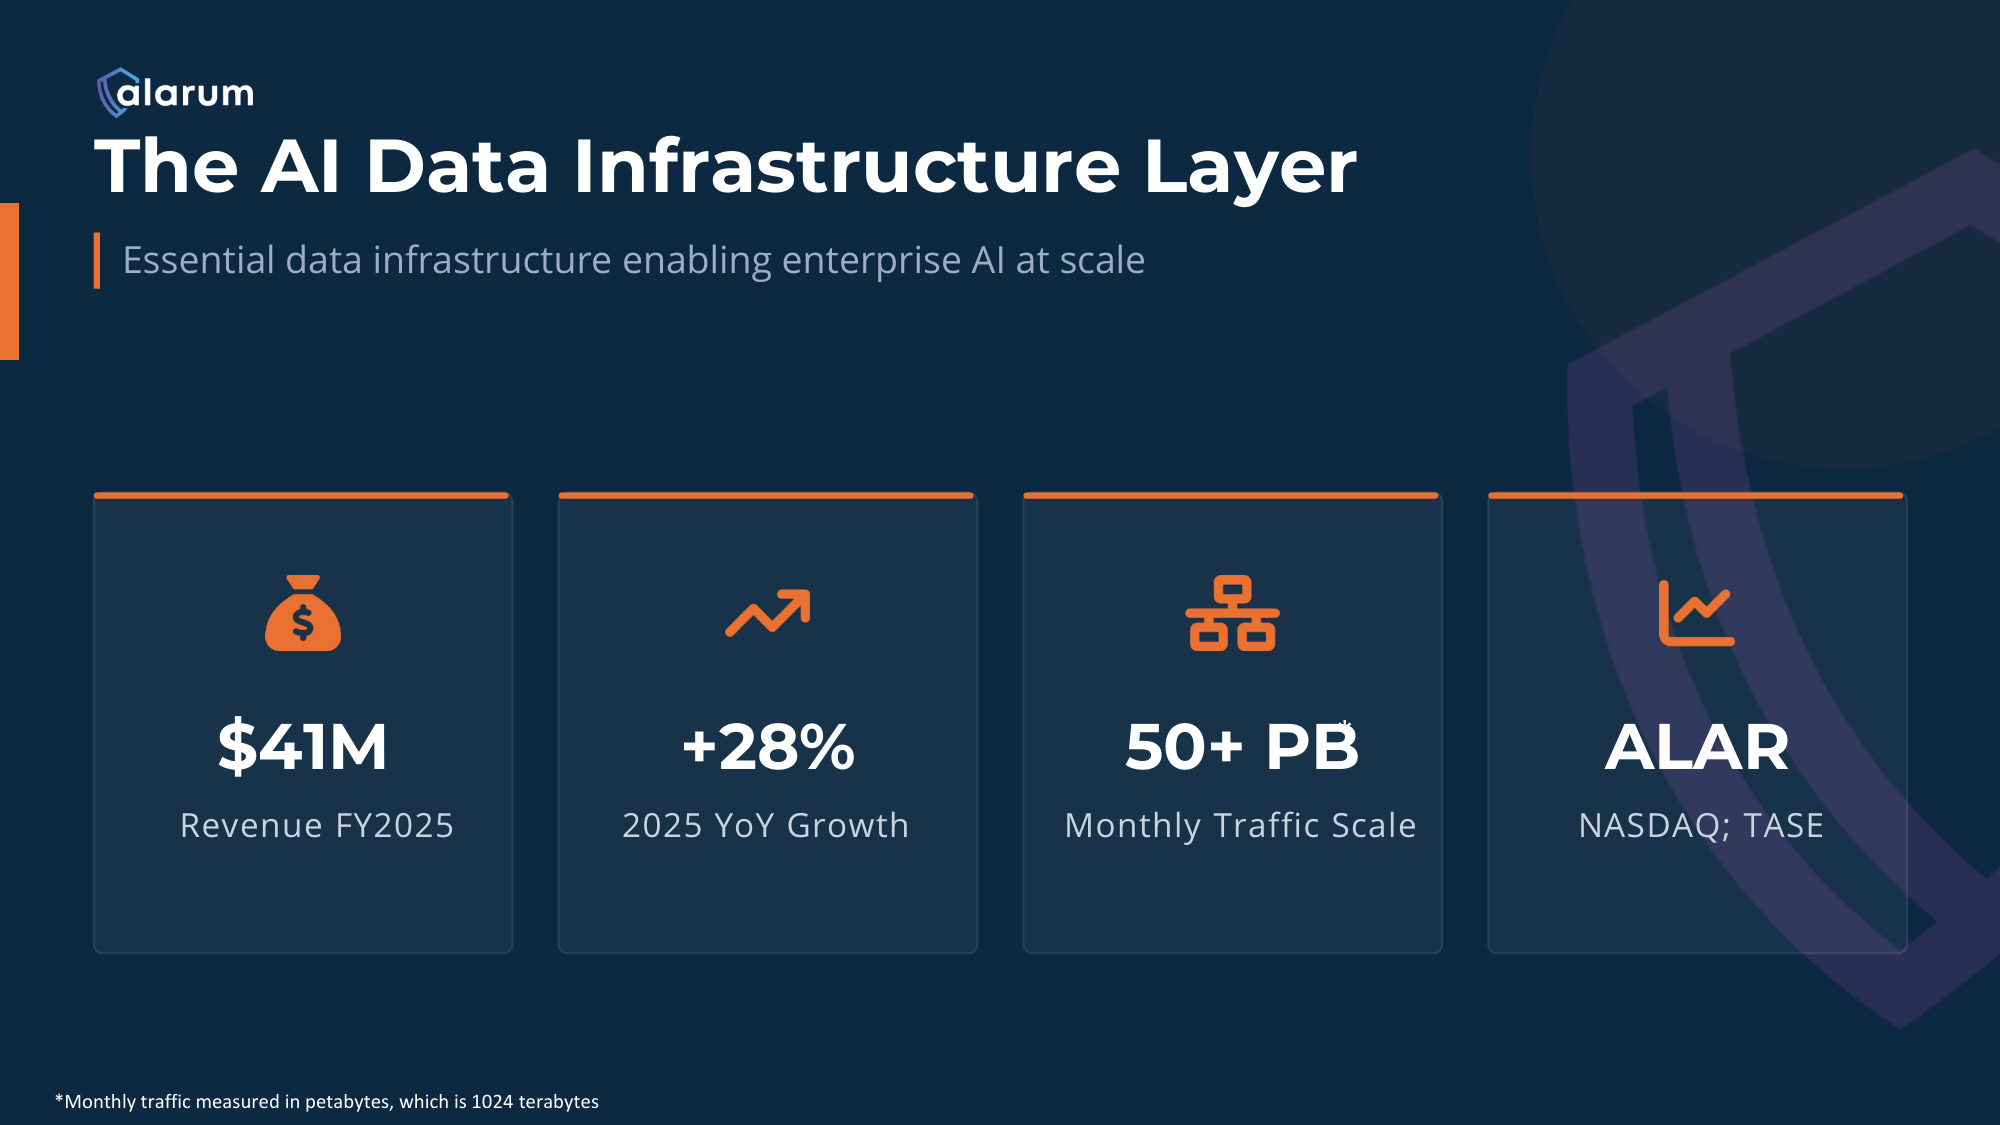
The AI Data Infrastructure Layer Essential data infrastructure enabling enterprise AI at scale $41M Revenue FY2025 +28% 2025 YoY Growth 50+ PB Monthly Traffic Scale ALAR NASDAQ; TASE *Monthly traffic measured in petabytes, which is 1024 terabytes *
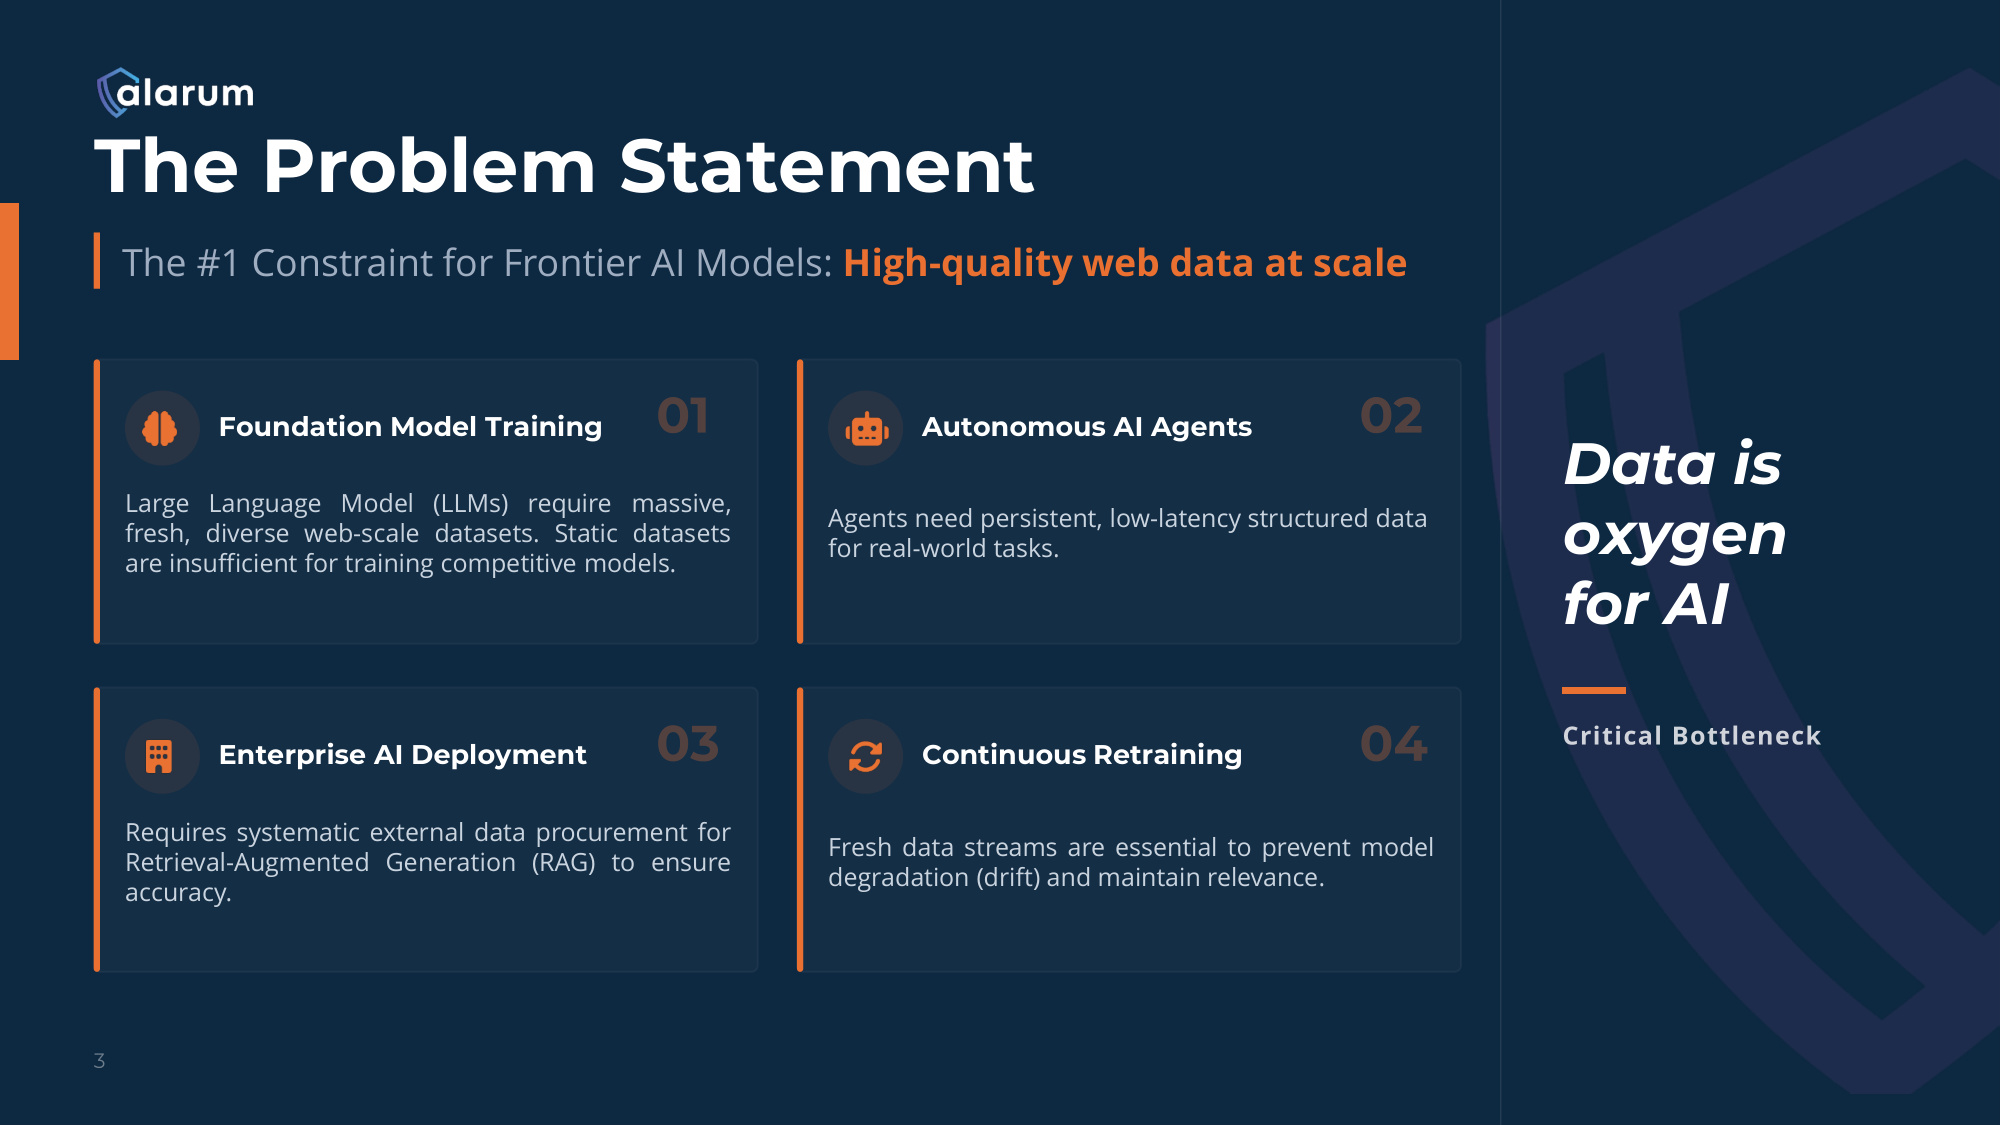
The Problem Statement The #1 Constraint for Frontier AI Models: High-quality web data at scale Foundation Model Training Large Language Model (LLMs) require massive, fresh, diverse web-scale datasets. Static datasets are insufficient for training competitive models. Autonomous AI Agents Agents need persistent, low-latency structured data for real-world tasks. Enterprise AI Deployment Requires systematic external data procurement for Retrieval-Augmented Generation (RAG) to ensure accuracy. Continuous Retraining Fresh data streams are essential to prevent model degradation (drift) and maintain relevance. Data is oxygen for AI
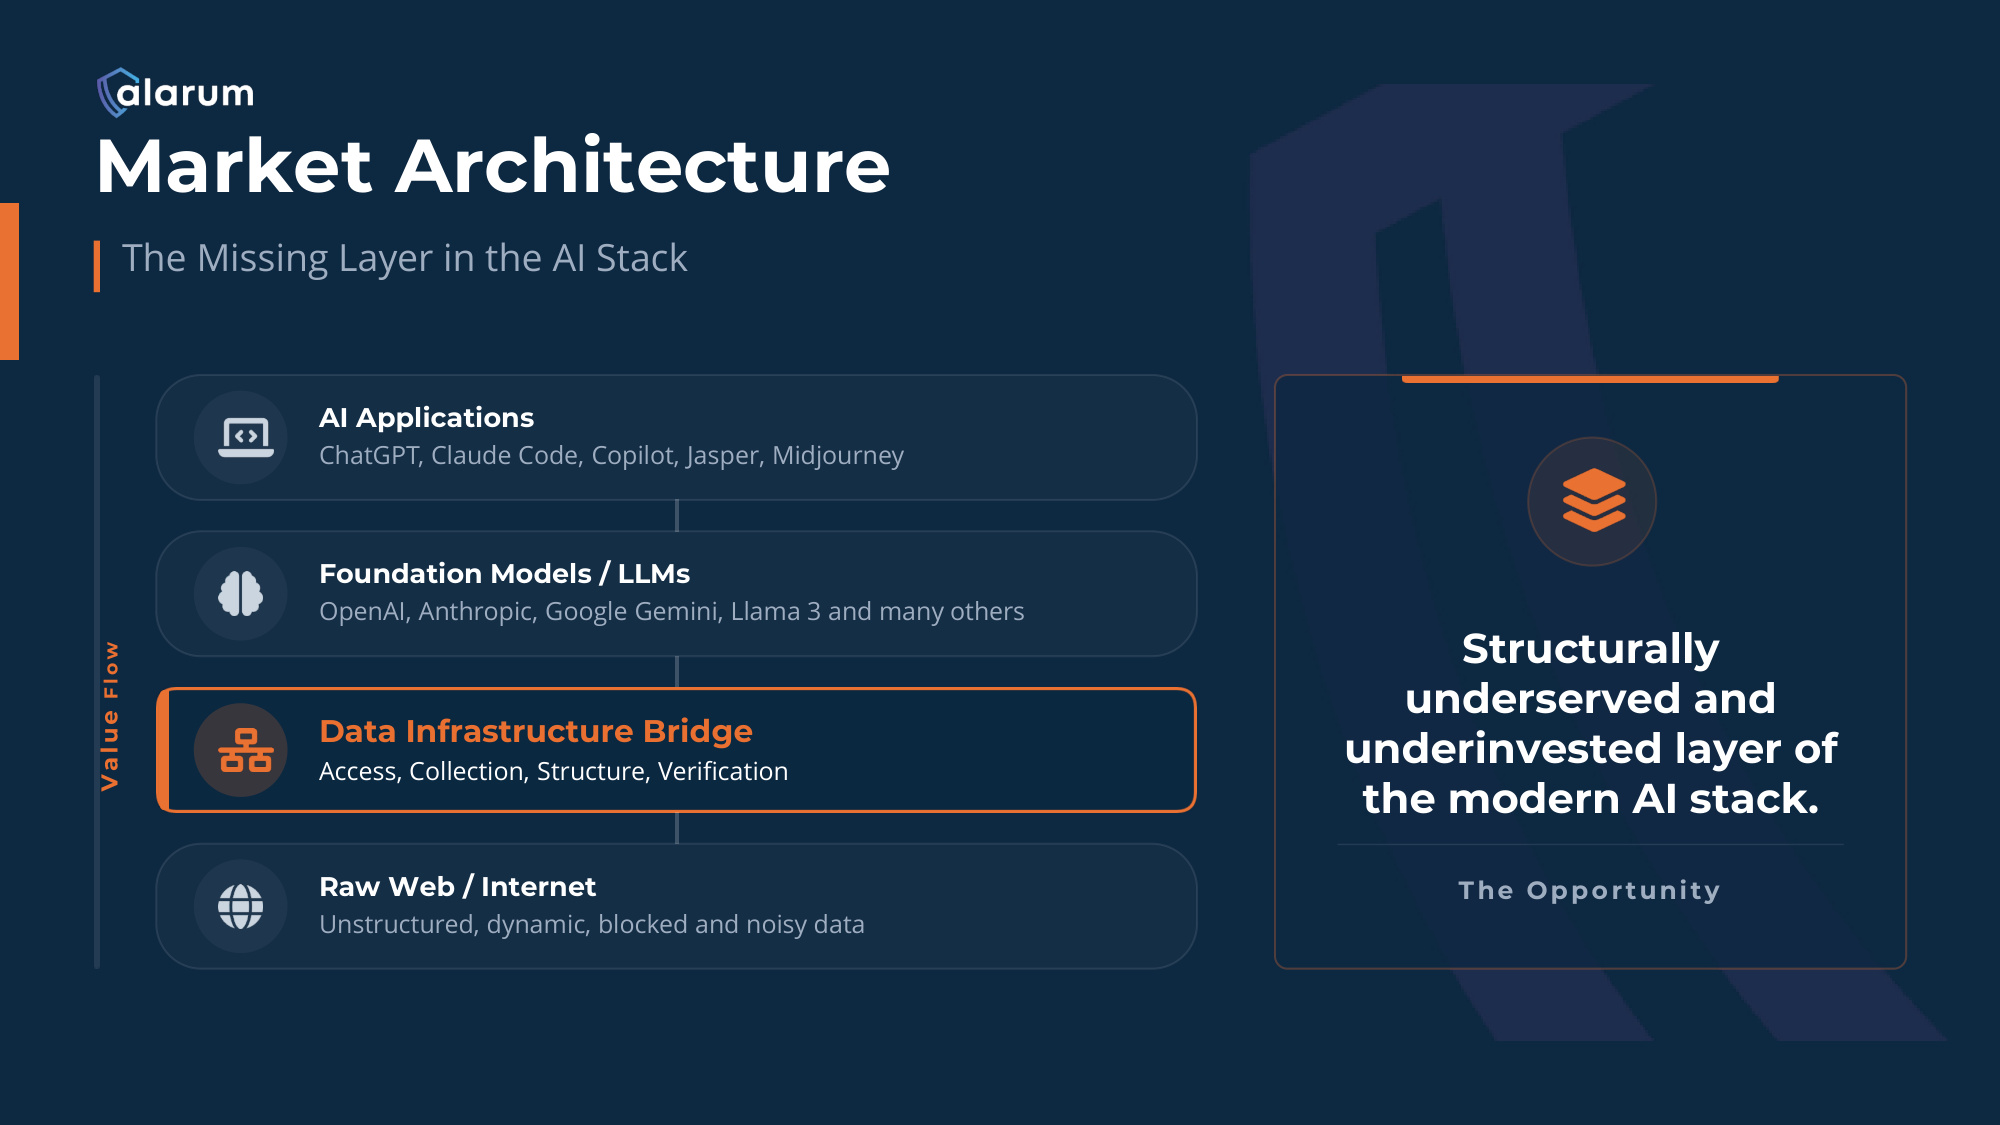
Market Architecture The Missing Layer in the AI Stack Value F l o w AI Applications ChatGPT, Claude Code, Copilot, Jasper, Midjourney Foundation Models / LLMs OpenAI, Anthropic, Google Gemini, Llama 3 and many others Data Infrastructure Bridge Access, Collection, Structure, Verification Raw Web / Internet Unstructured, dynamic, blocked and noisy data Structurally underserved and underinvested layer of the modern AI stack. The Opportunity
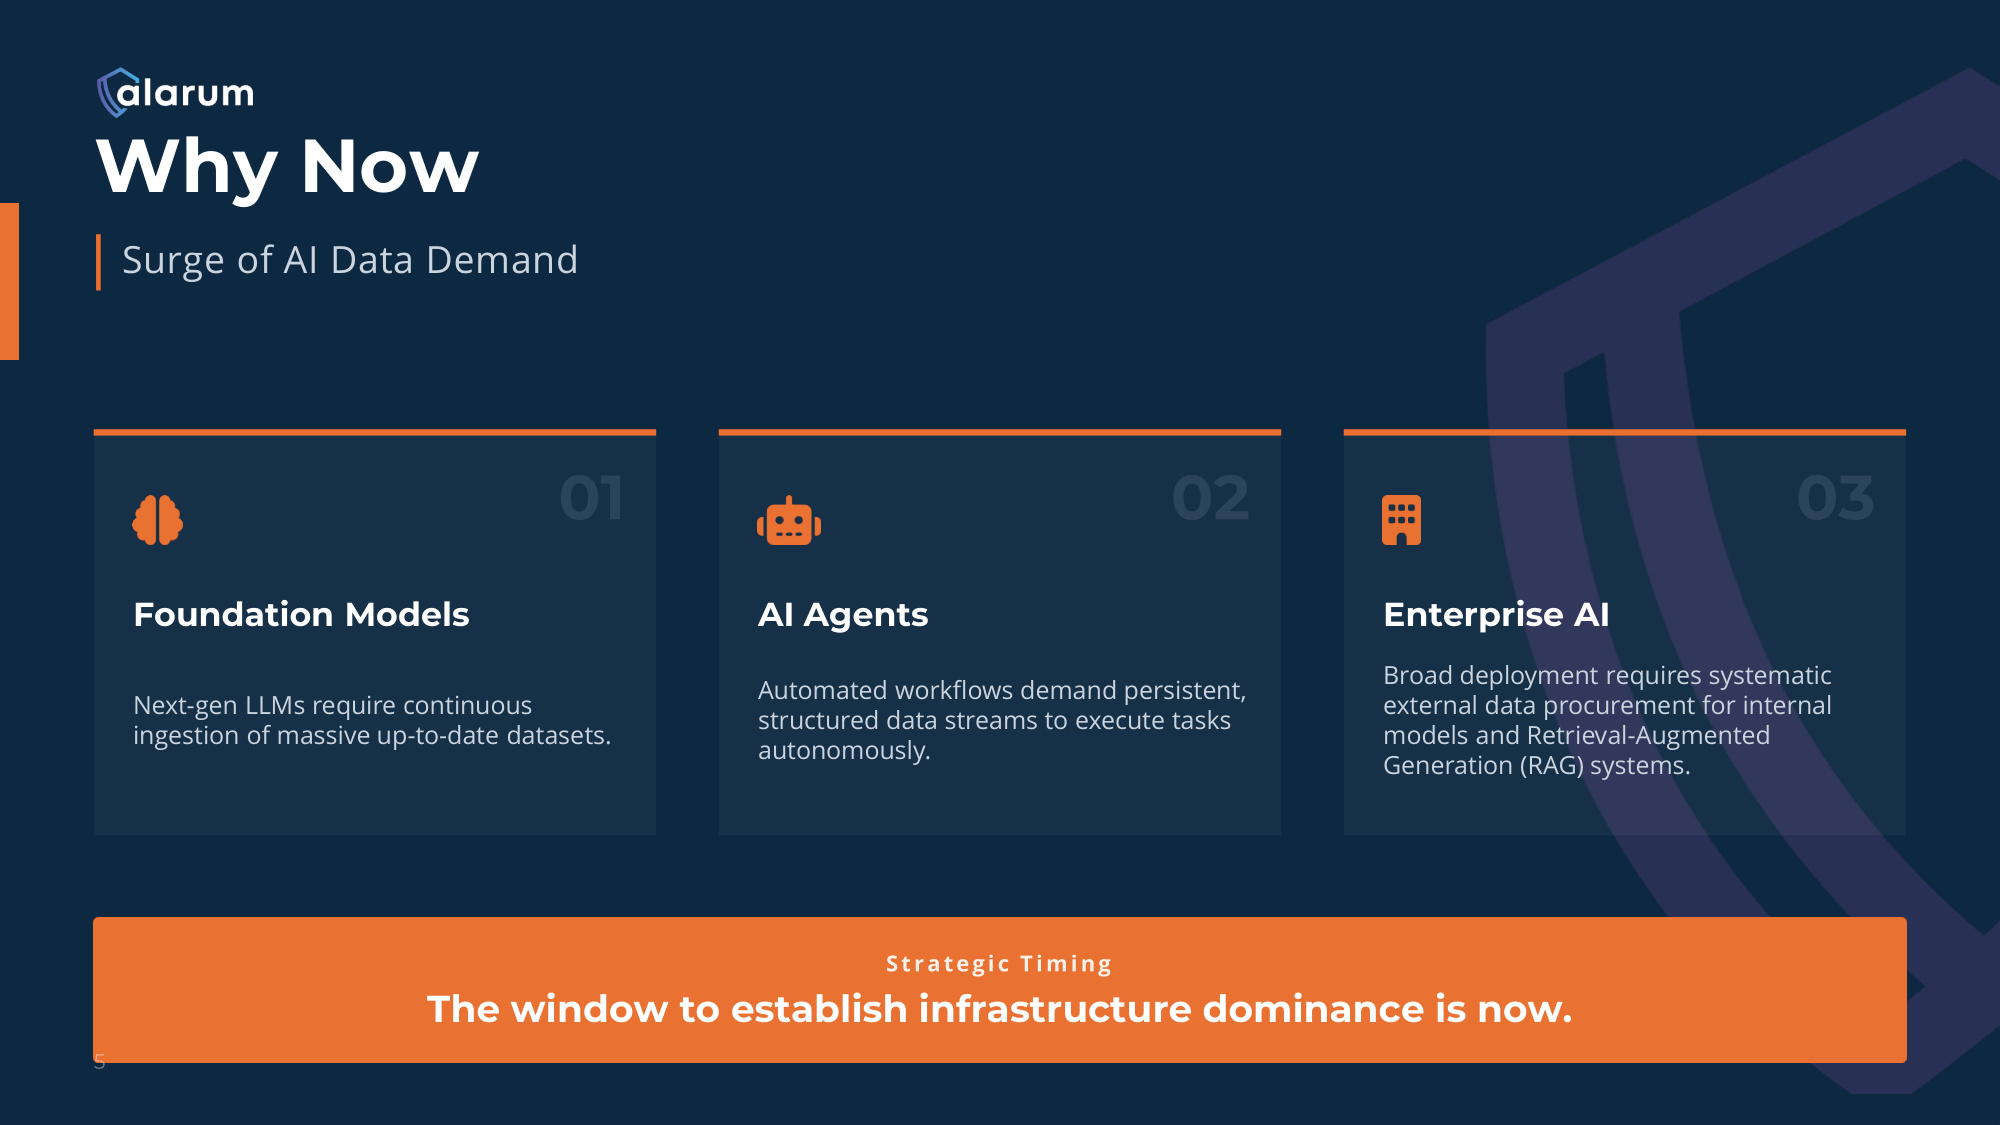
Why Now Surge of AI Data Demand Foundation Models Next-gen LLMs require continuous ingestion of massive up-to-date datasets. AI Agents Automated workflows demand persistent, structured data streams to execute tasks autonomously. Enterprise AI Broad deployment requires systematic external data procurement for internal models and Retrieval-Augmented Generation (RAG) systems. The window to establish infrastructure dominance is now.
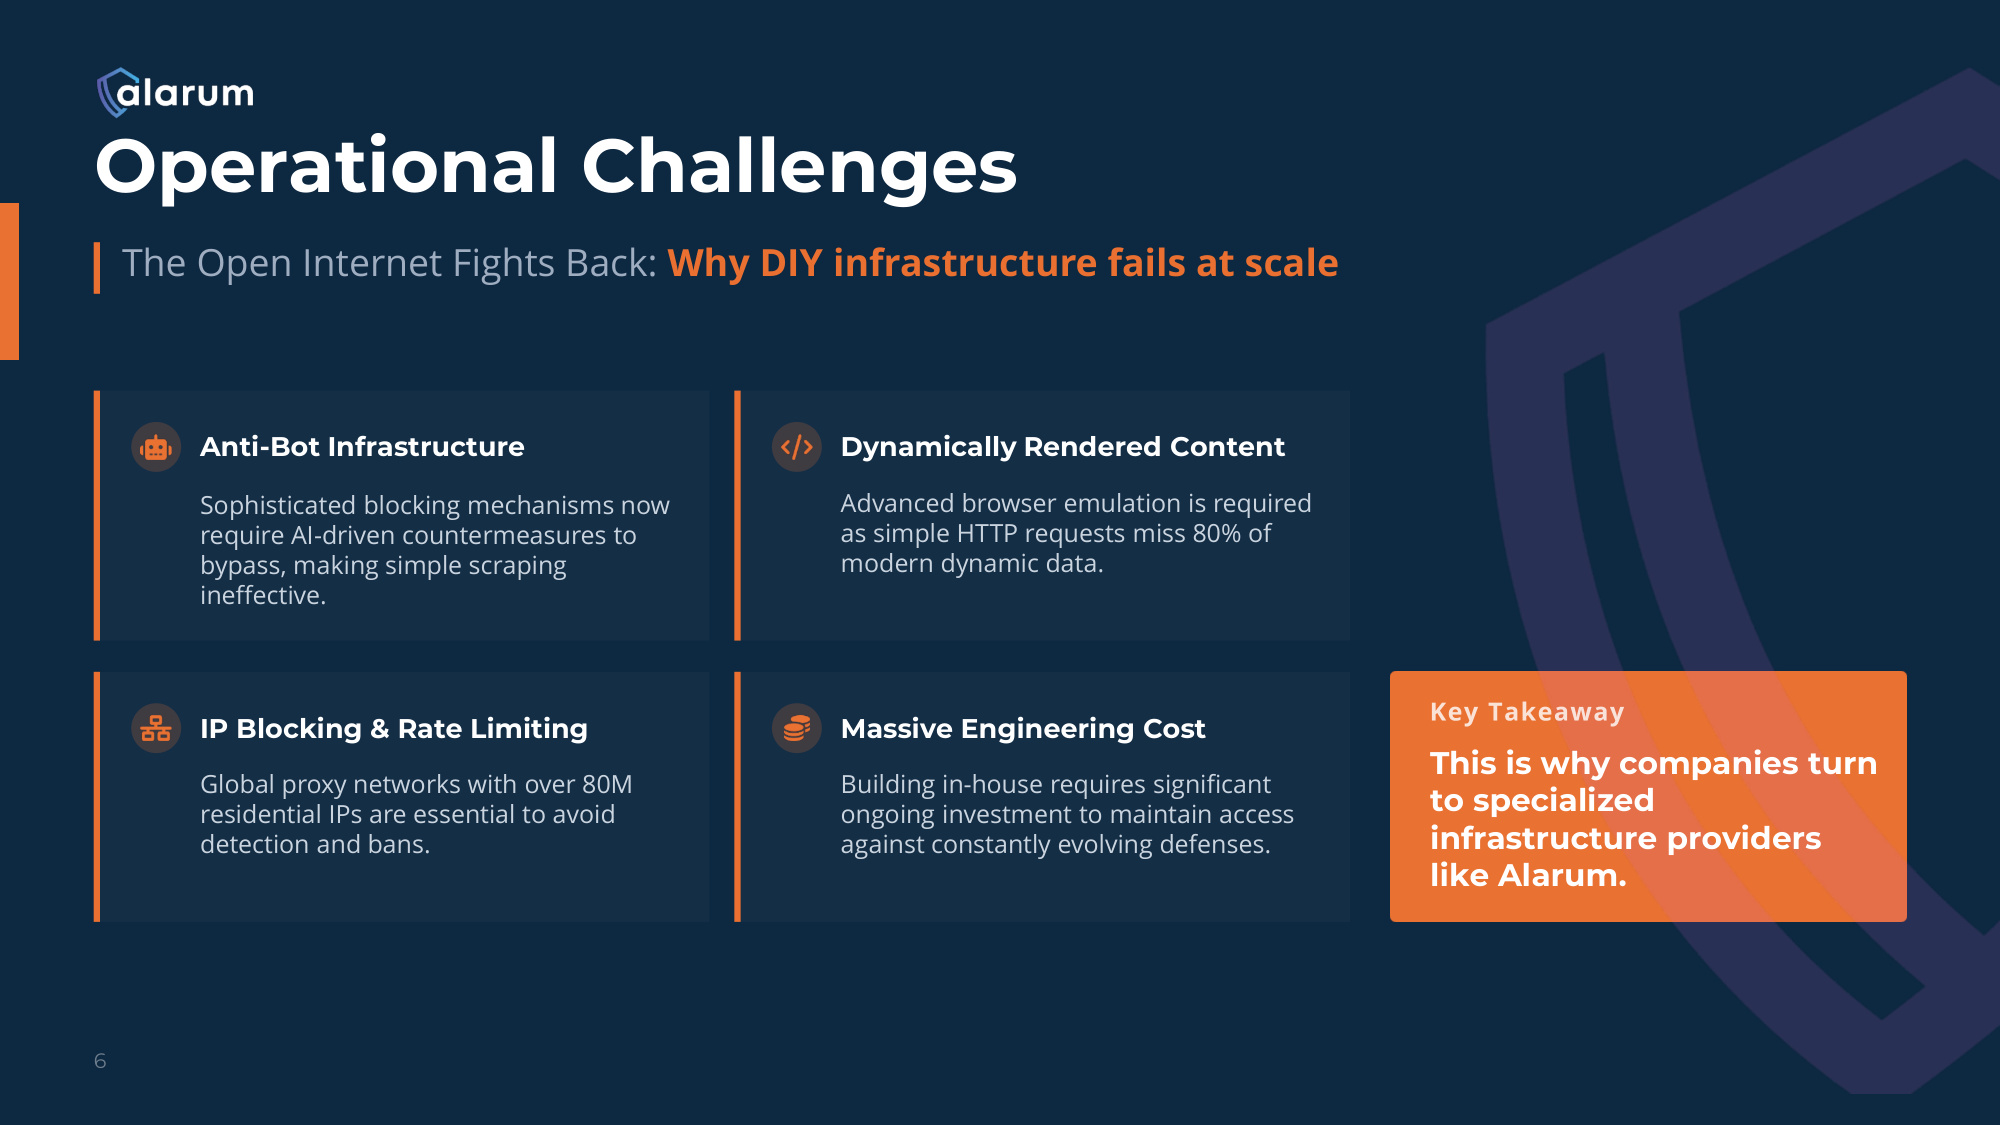
Operational Challenges The Open Internet Fights Back: Why DIY infrastructure fails at scale Anti-Bot Infrastructure Sophisticated blocking mechanisms now require AI-driven countermeasures to bypass, making simple scraping ineffective. Dynamically Rendered Content Advanced browser emulation is required as simple HTTP requests miss 80% of modern dynamic data. IP Blocking & Rate Limiting Global proxy networks with over 80M residential IPs are essential to avoid detection and bans. Massive Engineering Cost Building in-house requires significant ongoing investment to maintain access against constantly evolving defenses. This is why companies turn to specialized infrastructure providers like Alarum.
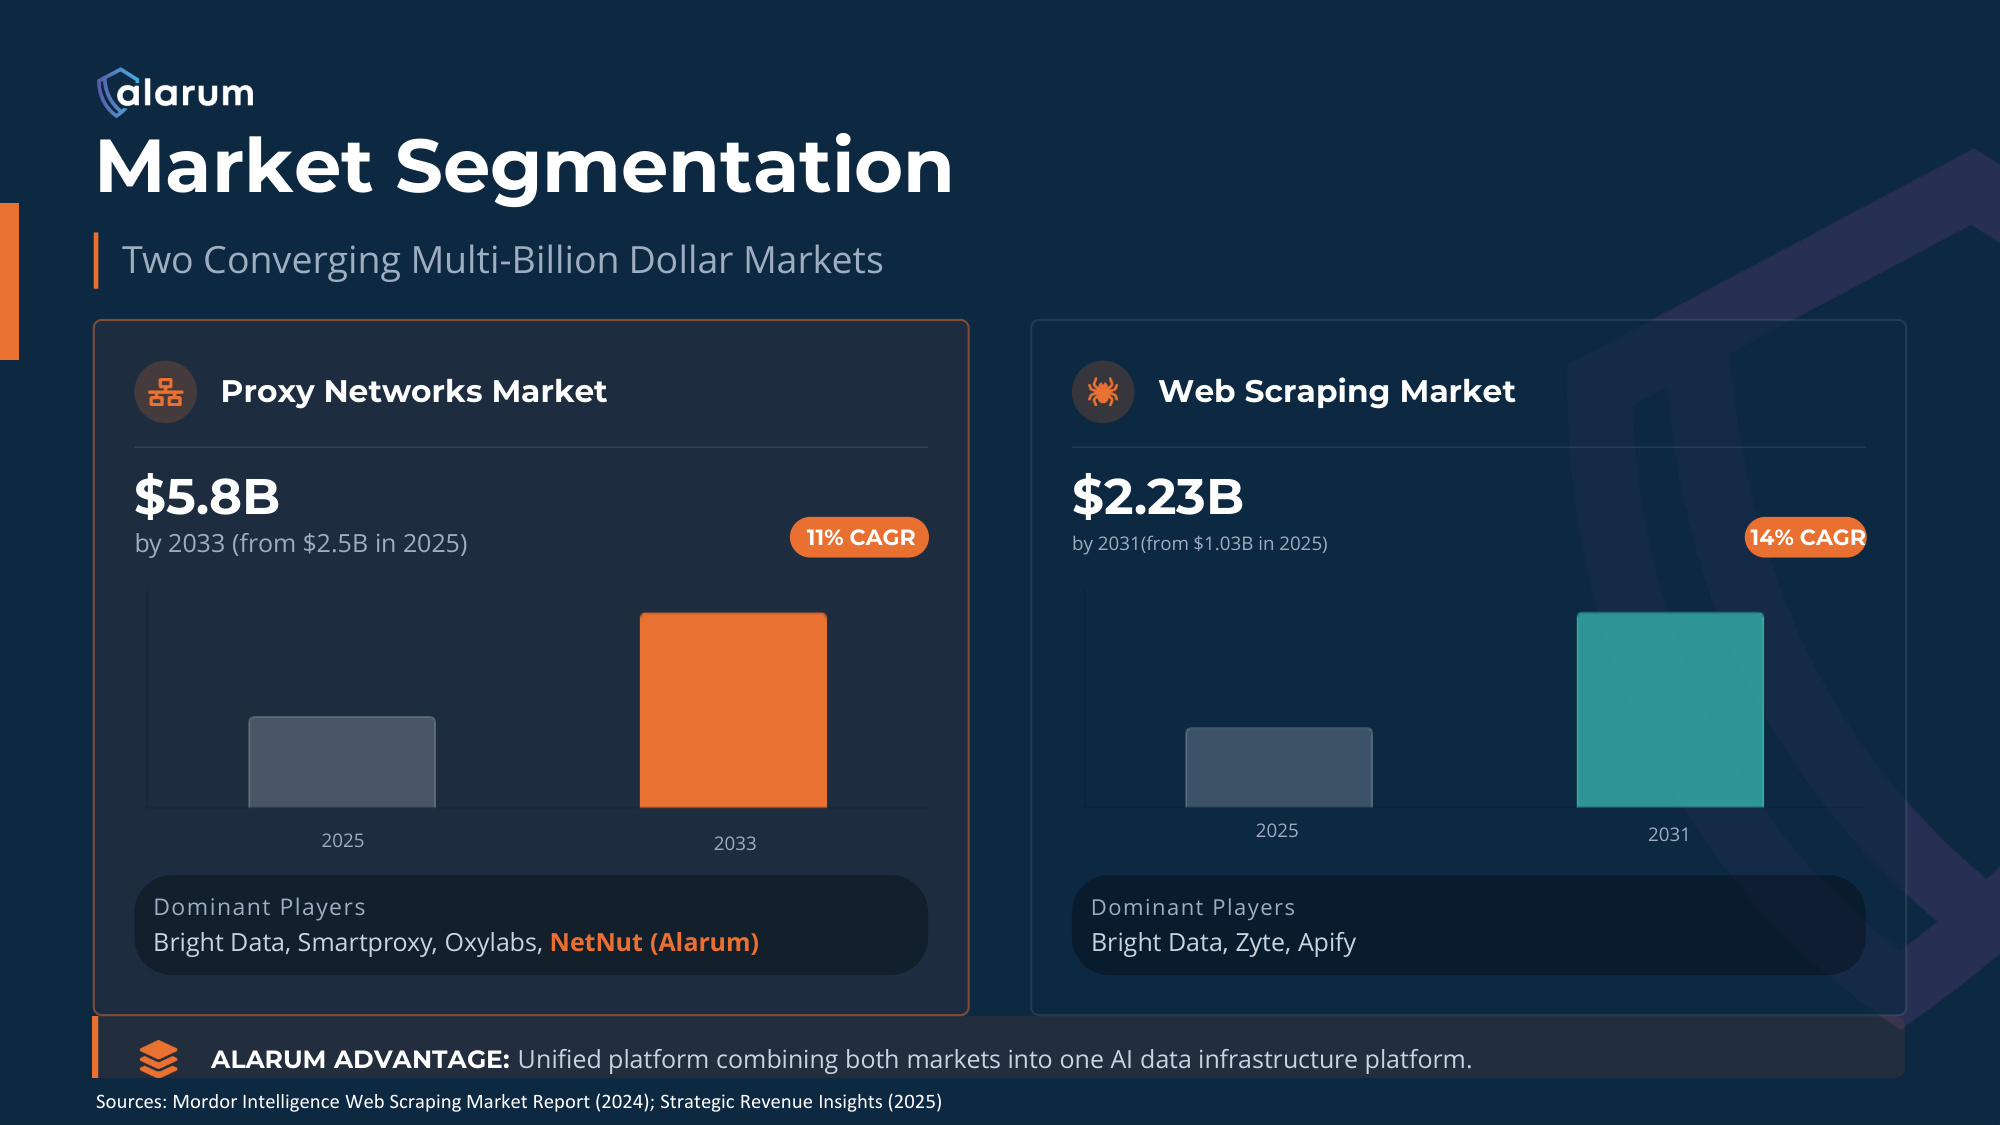
Market Segmentation Two Converging Multi-Billion Dollar Markets ALARUM ADVANTAGE: Unified platform combining both markets into one AI data infrastructure platform. Proxy Networks Market $5.8B by 2033 (from $2.5B in 2025) 11% CAGR Dominant Players Bright Data, Smartproxy, Oxylabs, NetNut (Alarum) Web Scraping Market $2.23B by 2031(from $1.03B in 2025) 14% CAGR Dominant Players Bright Data, Zyte, Apify Sources: Mordor Intelligence Web Scraping Market Report (2024); Strategic Revenue Insights (2025) 2025 2031 2025 2033
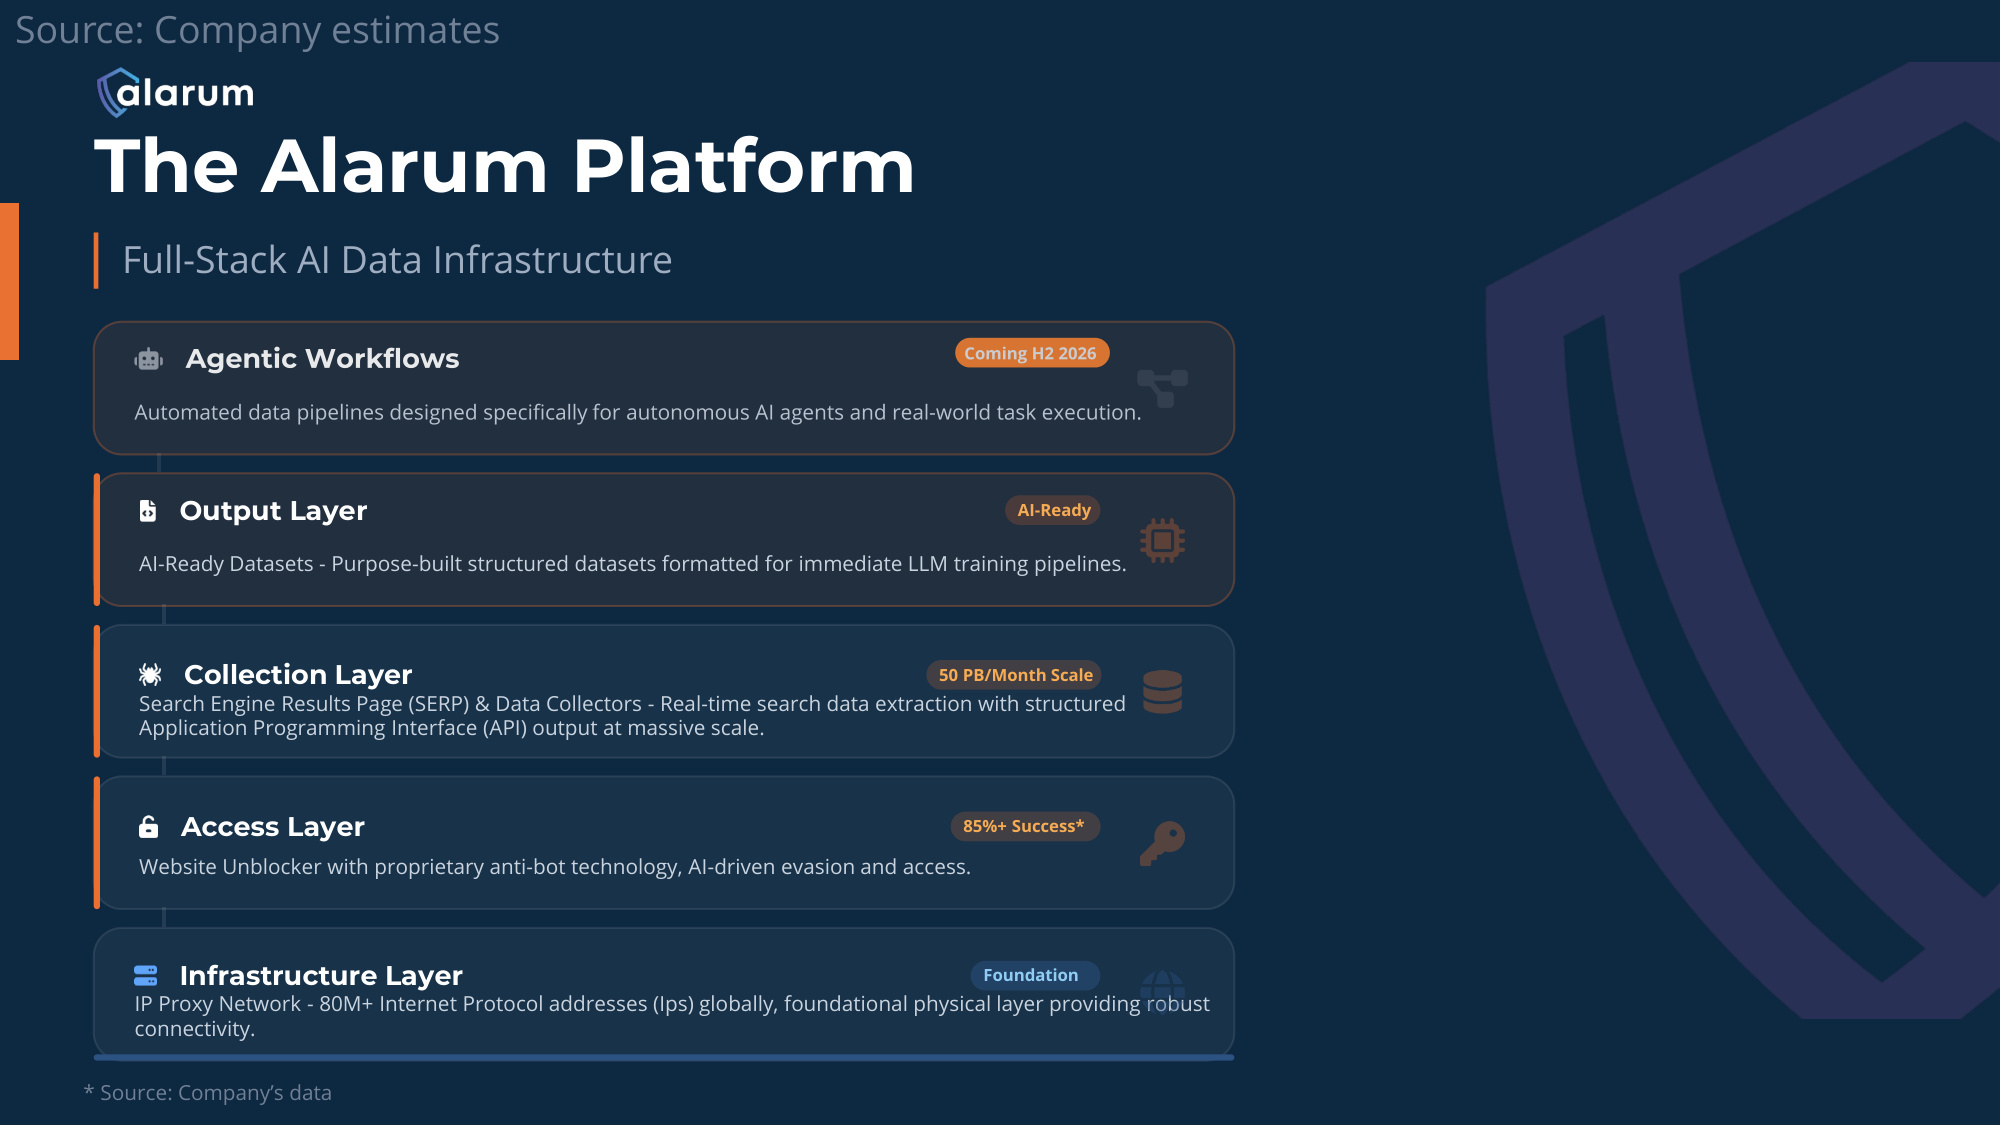
Source: Company estimates The Alarum Platform Full-Stack AI Data Infrastructure Infrastructure Layer Foundation IP Proxy Network - 80M+ Internet Protocol addresses (Ips) globally, foundational physical layer providing robust connectivity. Access Layer 85%+ Success* Website Unblocker with proprietary anti-bot technology, AI-driven evasion and access. Collection Layer 50 PB/Month Scale Search Engine Results Page (SERP) & Data Collectors - Real-time search data extraction with structured Application Programming Interface (API) output at massive scale. Output Layer AI-Ready AI-Ready Datasets - Purpose-built structured datasets formatted for immediate LLM training pipelines. * Source: Company's data
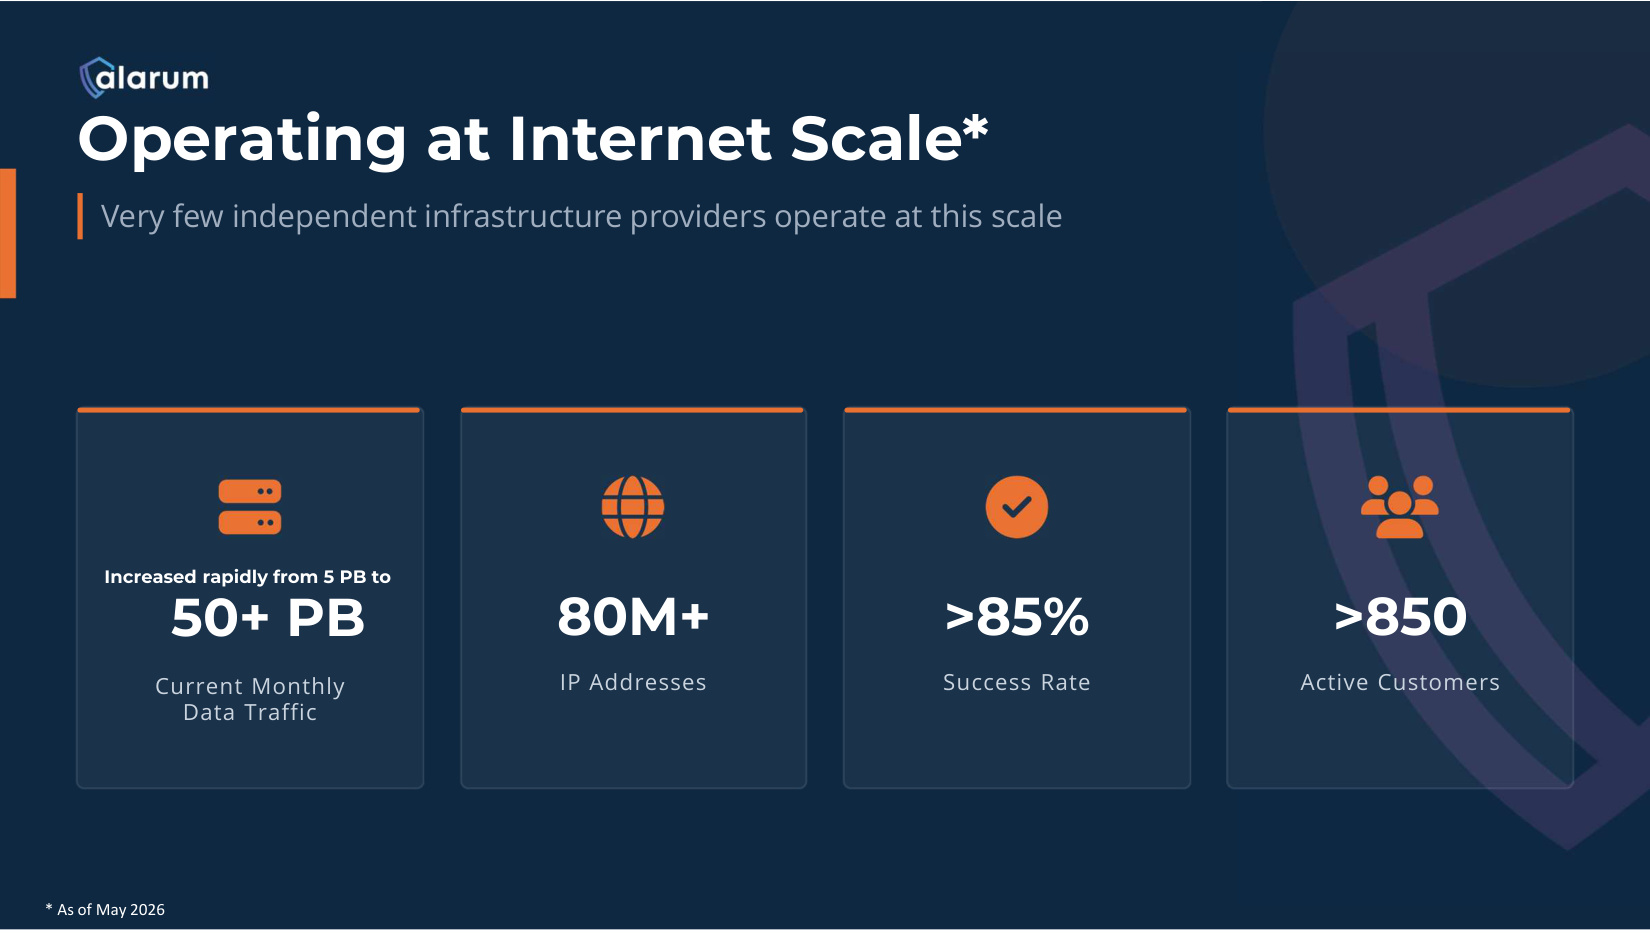
Operating at Internet Scale* Very few independent infrastructure providers operate at this scale 50+ PB Current Monthly Data Traffic 80M+ IP Addresses >85% Success Rate >850 Active Customers Increased rapidly from 5 PB to * As of May 2026
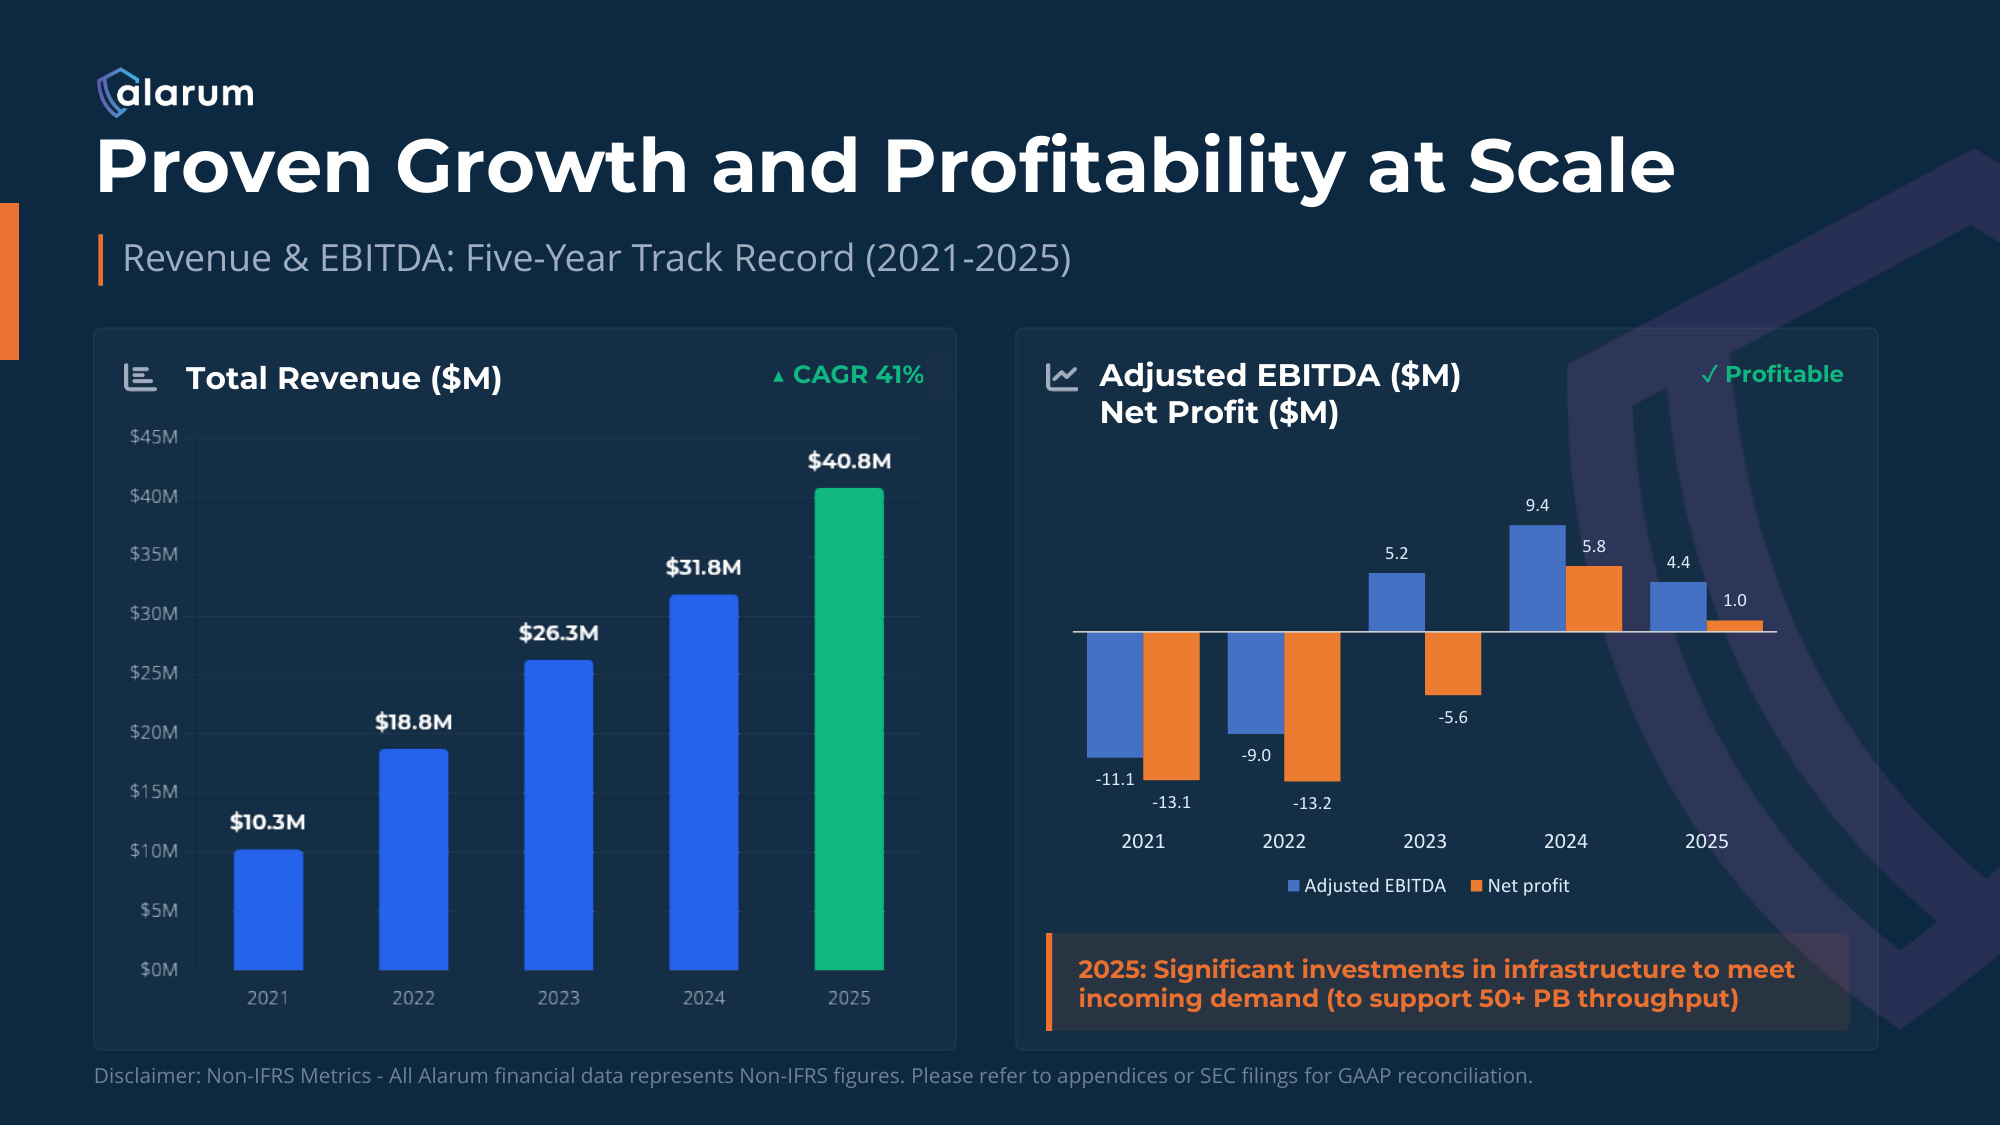
Revenue & EBITDA: Five-Year Track Record (2021-2025) Total Revenue ($M) ▲CAGR 41%* Adjusted EBITDA ($M) Net Profit ($M) ✓Profitable 2025: Significant investments in infrastructure to meet incoming demand (to support 50+ PB throughput) Proven Growth and Profitability at Scale Disclaimer: Non-IFRS Metrics - All Alarum financial data represents Non-IFRS figures. Please refer to appendices or SEC filings for GAAP reconciliation. -11.1 -9.0 5.2 9.4 4.4 -13.1 -13.2 -5.6 5.8 1.0 2021 2022 2023 2024 2025 Adjusted EBITDA Net profit
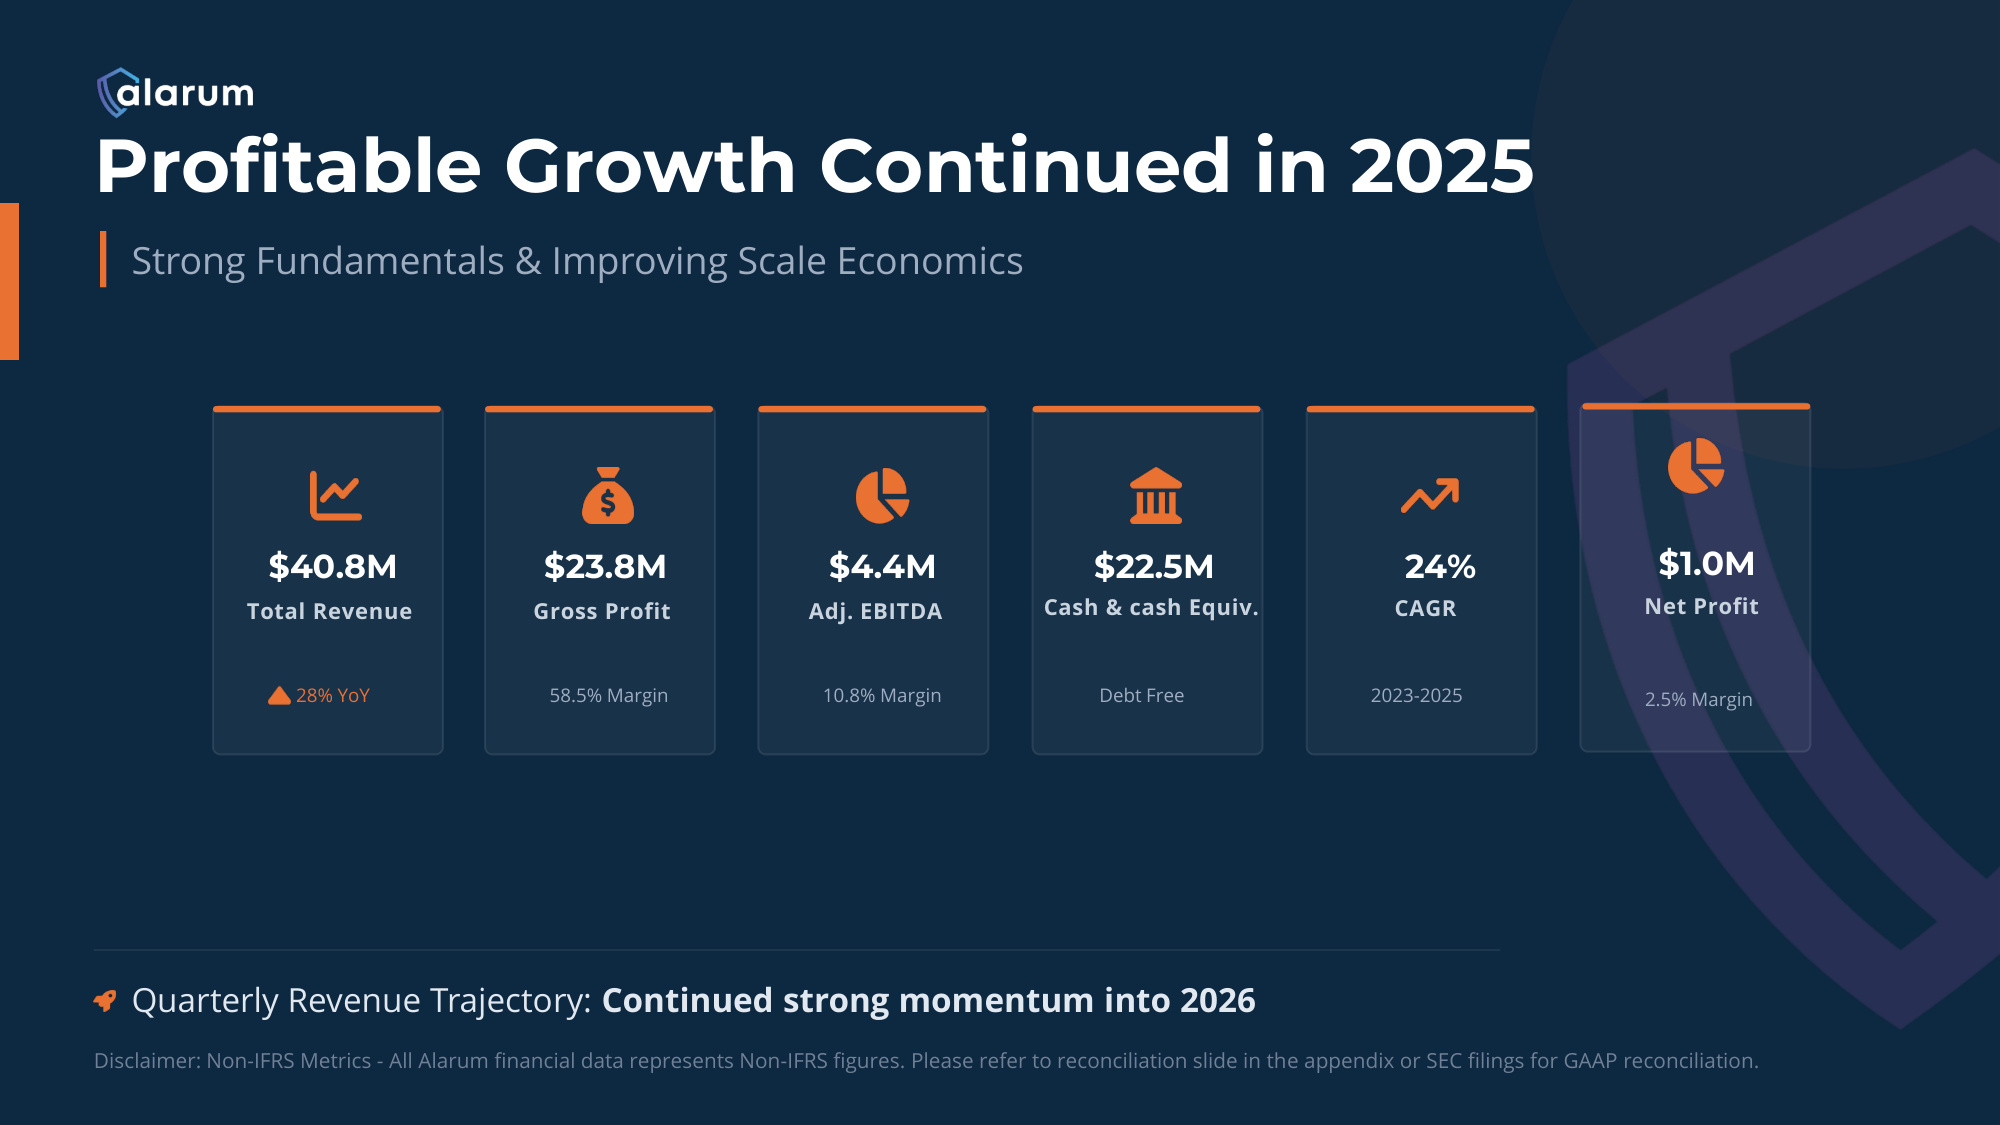
Strong Fundamentals & Improving Scale Economics Quarterly Revenue Trajectory: Continued strong momentum into 2026 Disclaimer: Non-IFRS Metrics - All Alarum financial data represents Non-IFRS figures. Please refer to reconciliation slide in the appendix or SEC filings for GAAP reconciliation. $40.8M Total Revenue 28% YoY $23.8M Gross Profit 58.5% Margin $4.4M Adj. EBITDA 10.8% Margin $22.5M Cash & cash Equiv. Debt Free 24% CAGR 2023-2025 Profitable Growth Continued in 2025 $1.0M Net Profit 2.5% Margin
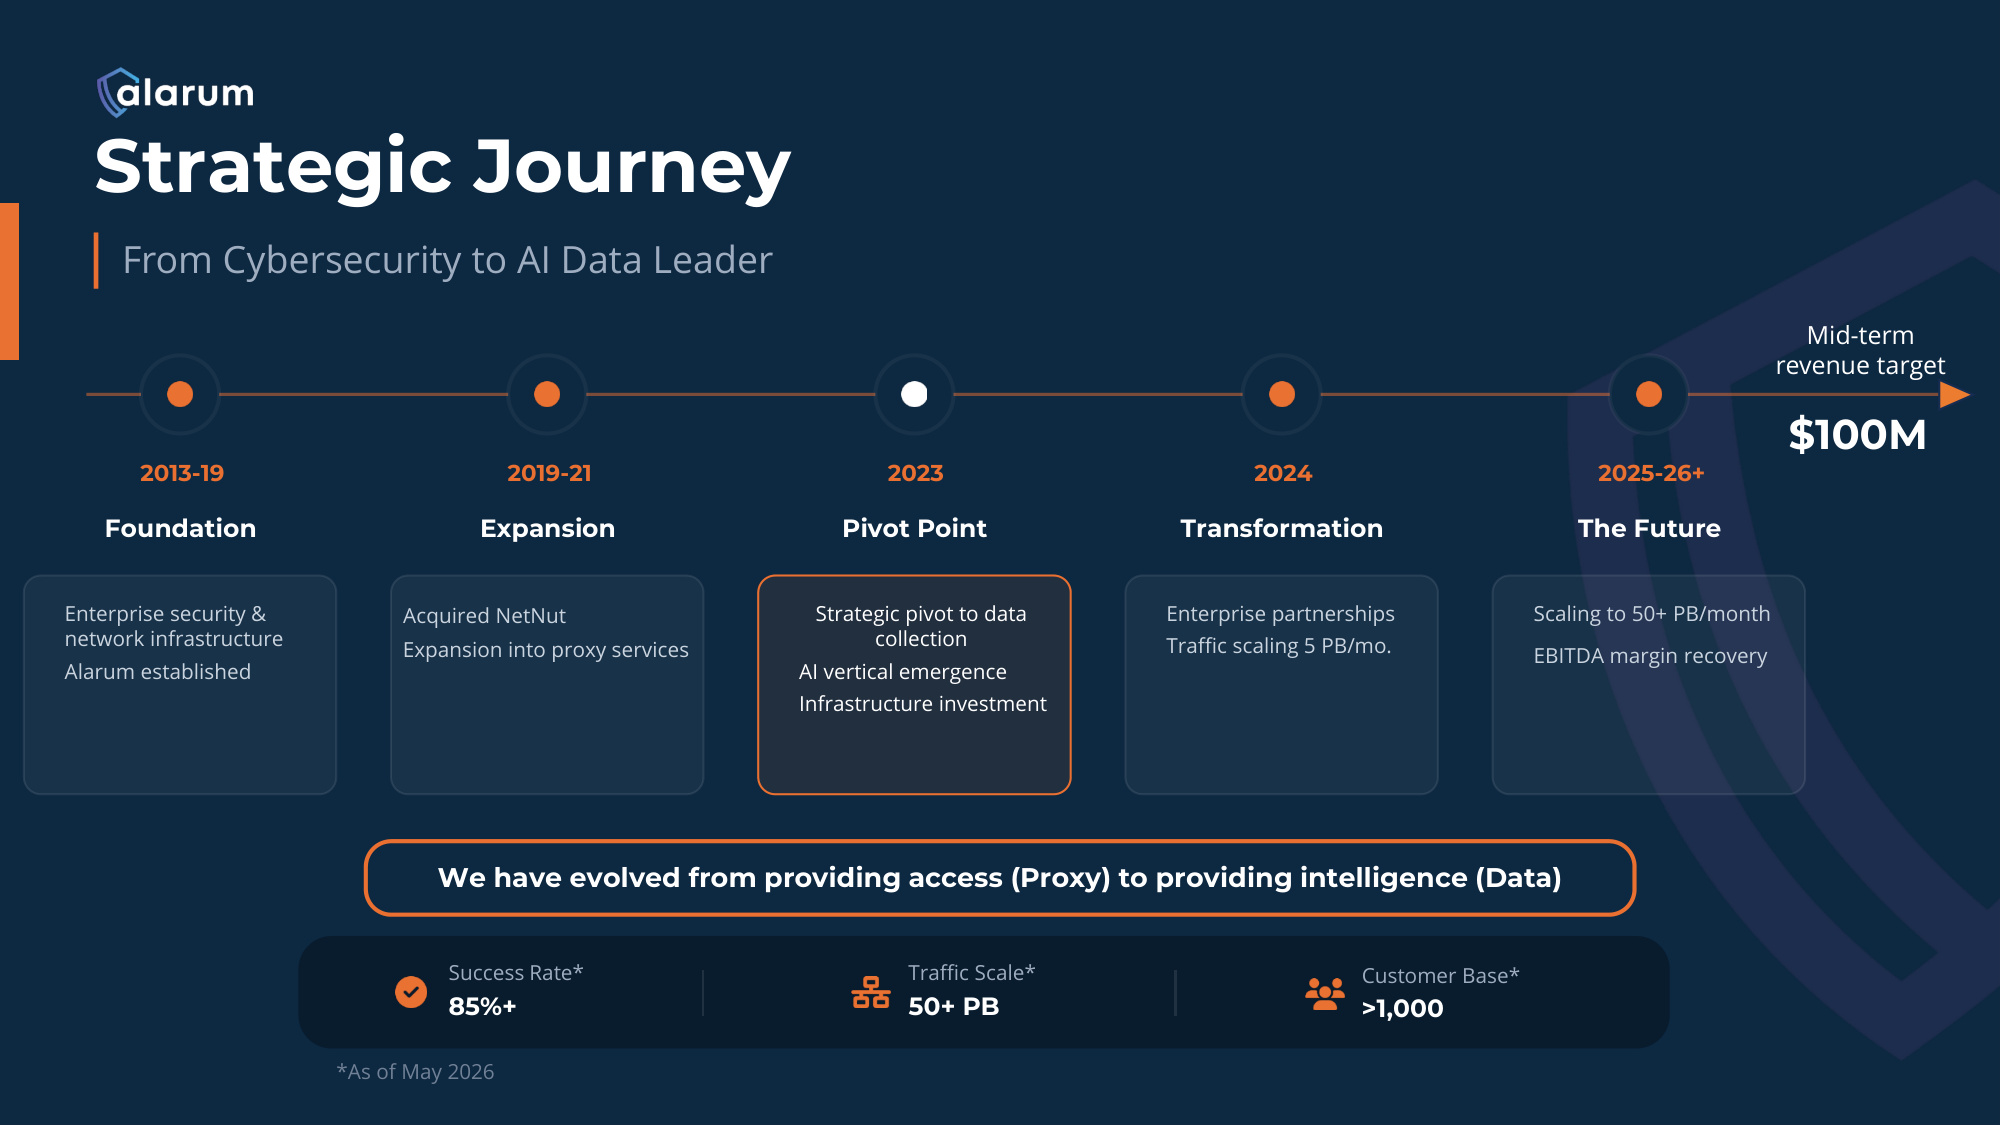
Strategic Journey From Cybersecurity to AI Data Leader 2013-19 Foundation Enterprise security & network infrastructure Alarum established 2019-21 Expansion Acquired NetNut Expansion into proxy services 2023 Pivot Point Strategic pivot to data collection AI vertical emergence Infrastructure investment 2024 Transformation Enterprise partnerships Traffic scaling 5 PB/mo. 2025-26+ The Future Scaling to 50+ PB/month EBITDA margin recovery We have evolved from providing access (Proxy) to providing intelligence (Data) Success Rate* 85%+ Traffic Scale* 50+ PB Customer Base* >1,000 $100M Mid-term revenue target *As of May 2026
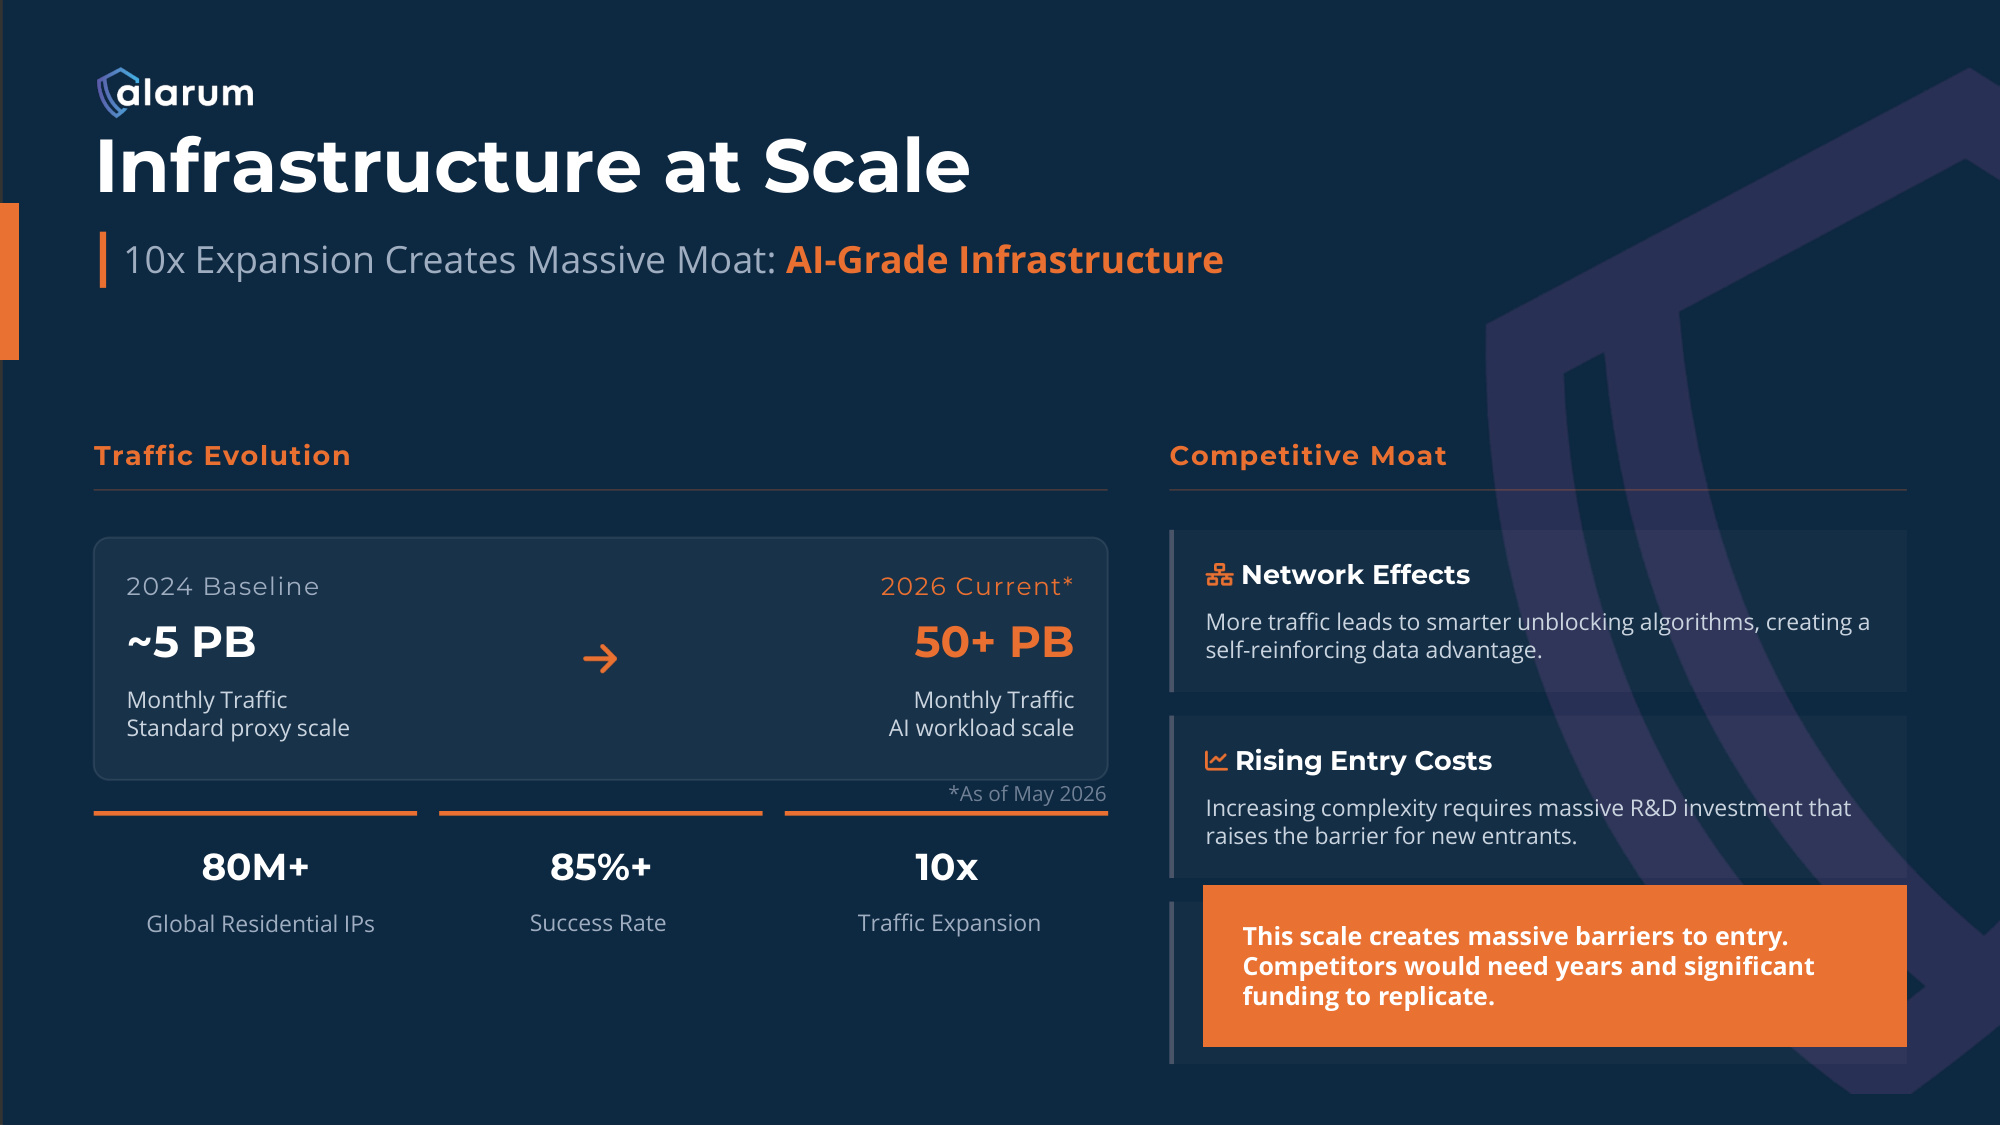
Traffic Evolution 2024 Baseline ~5 PB Monthly Traffic Standard proxy scale 2026 Current* 50+ PB Monthly Traffic AI workload scale 80M+ 85%+ 10x Global Residential IPs Success Rate Traffic Expansion Competitive Moat Network Effects More traffic leads to smarter unblocking algorithms, creating a self-reinforcing data advantage. Rising Entry Costs Increasing complexity requires massive R&D investment that raises the barrier for new entrants. Scale Advantage Smaller competitors struggle to maintain performance and reliability at Petabyte scale. This scale creates massive barriers to entry. Competitors would need years and significant funding to replicate. 10x Expansion Creates Massive Moat: AI-Grade Infrastructure Infrastructure at Scale *As of May 2026
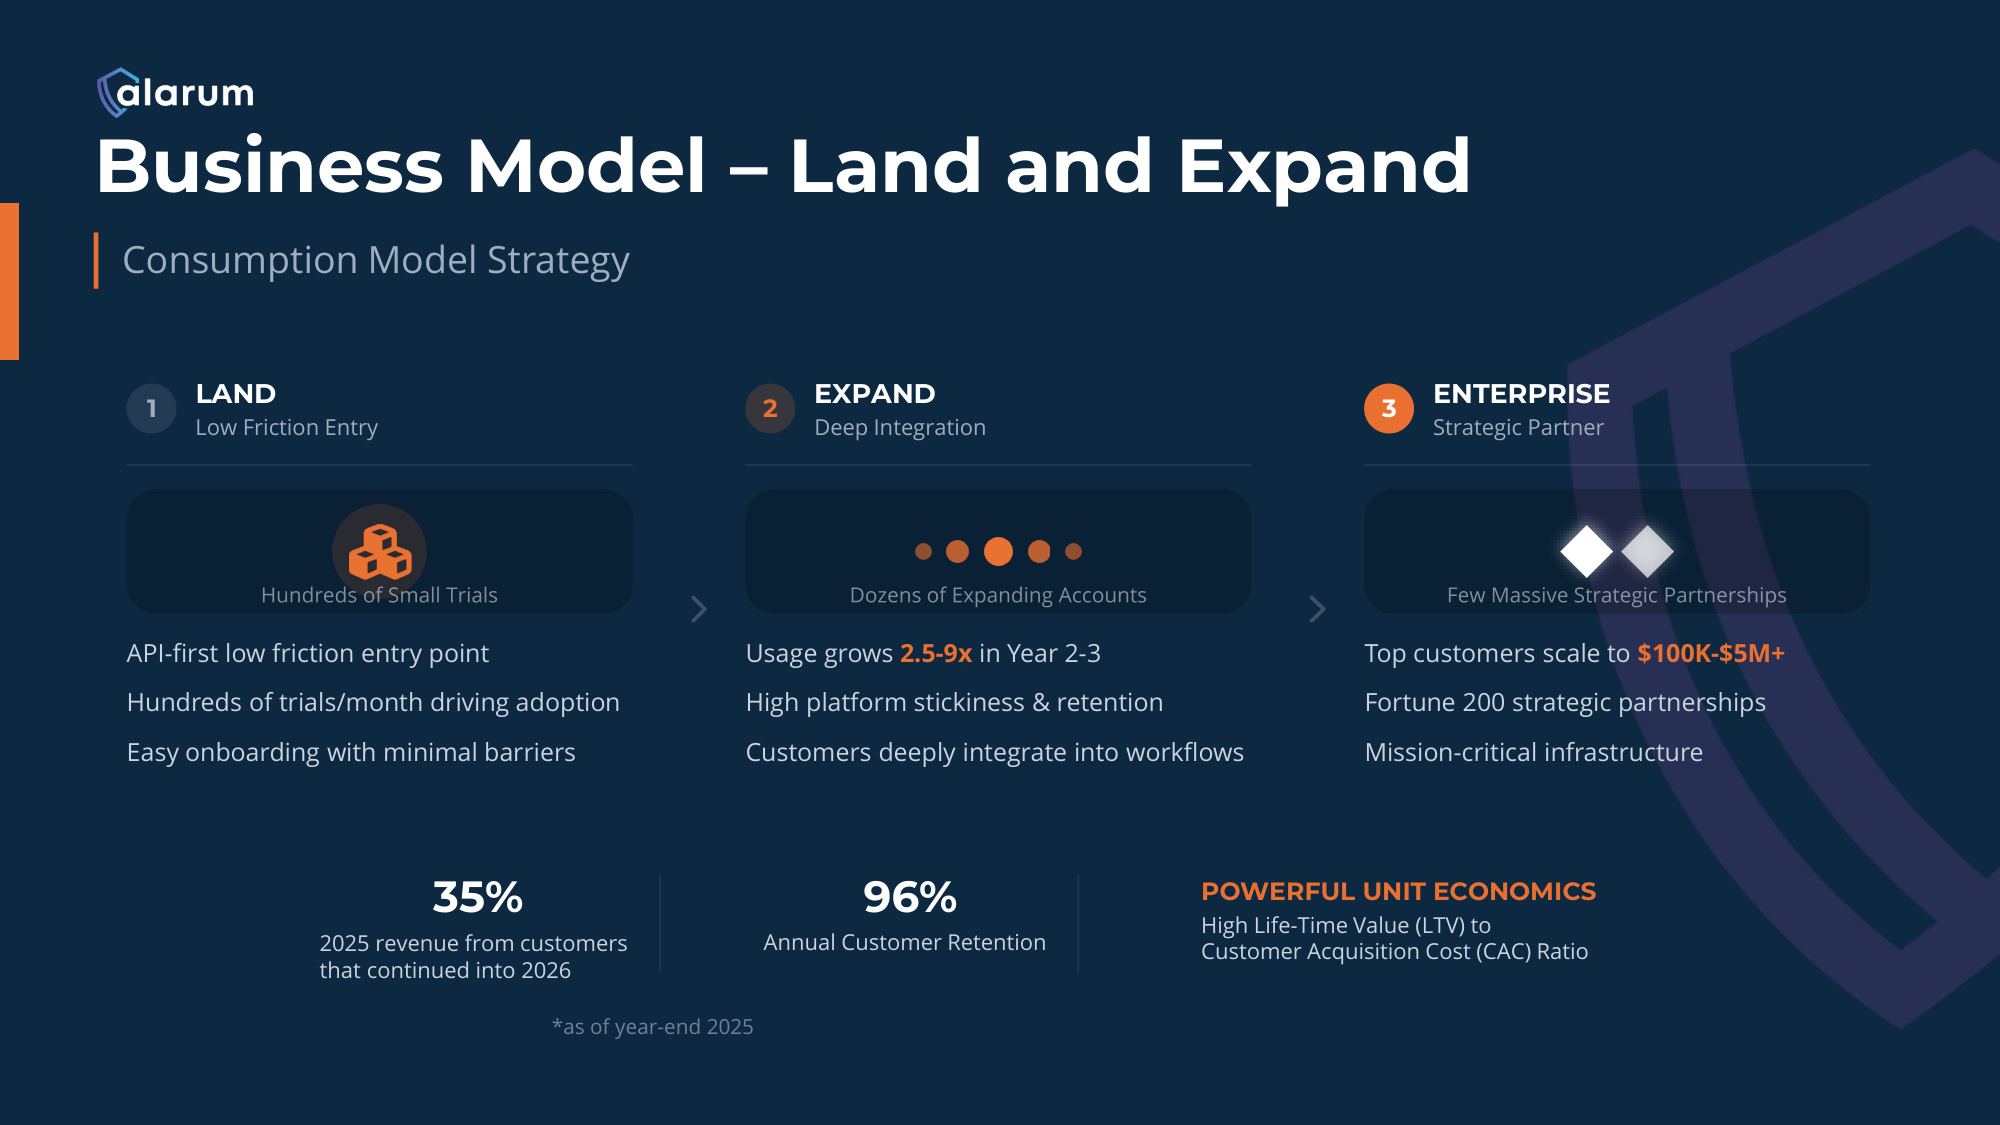
Consumption Model Strategy 1 LAND Low Friction Entry API-first low friction entry point Hundreds of trials/month driving adoption Easy onboarding with minimal barriers 2 EXPAND Deep Integration Usage grows 2.5-9x in Year 2-3 High platform stickiness & retention Customers deeply integrate into workflows 3 ENTERPRISE Strategic Partner Top customers scale to $100K-$5M+ Fortune 200 strategic partnerships Mission-critical infrastructure 35% 2025 revenue from customers that continued into 2026 96% Annual Customer Retention POWERFUL UNIT ECONOMICS High Life-Time Value (LTV) to Customer Acquisition Cost (CAC) Ratio Business Model – Land and Expand *as of year-end 2025
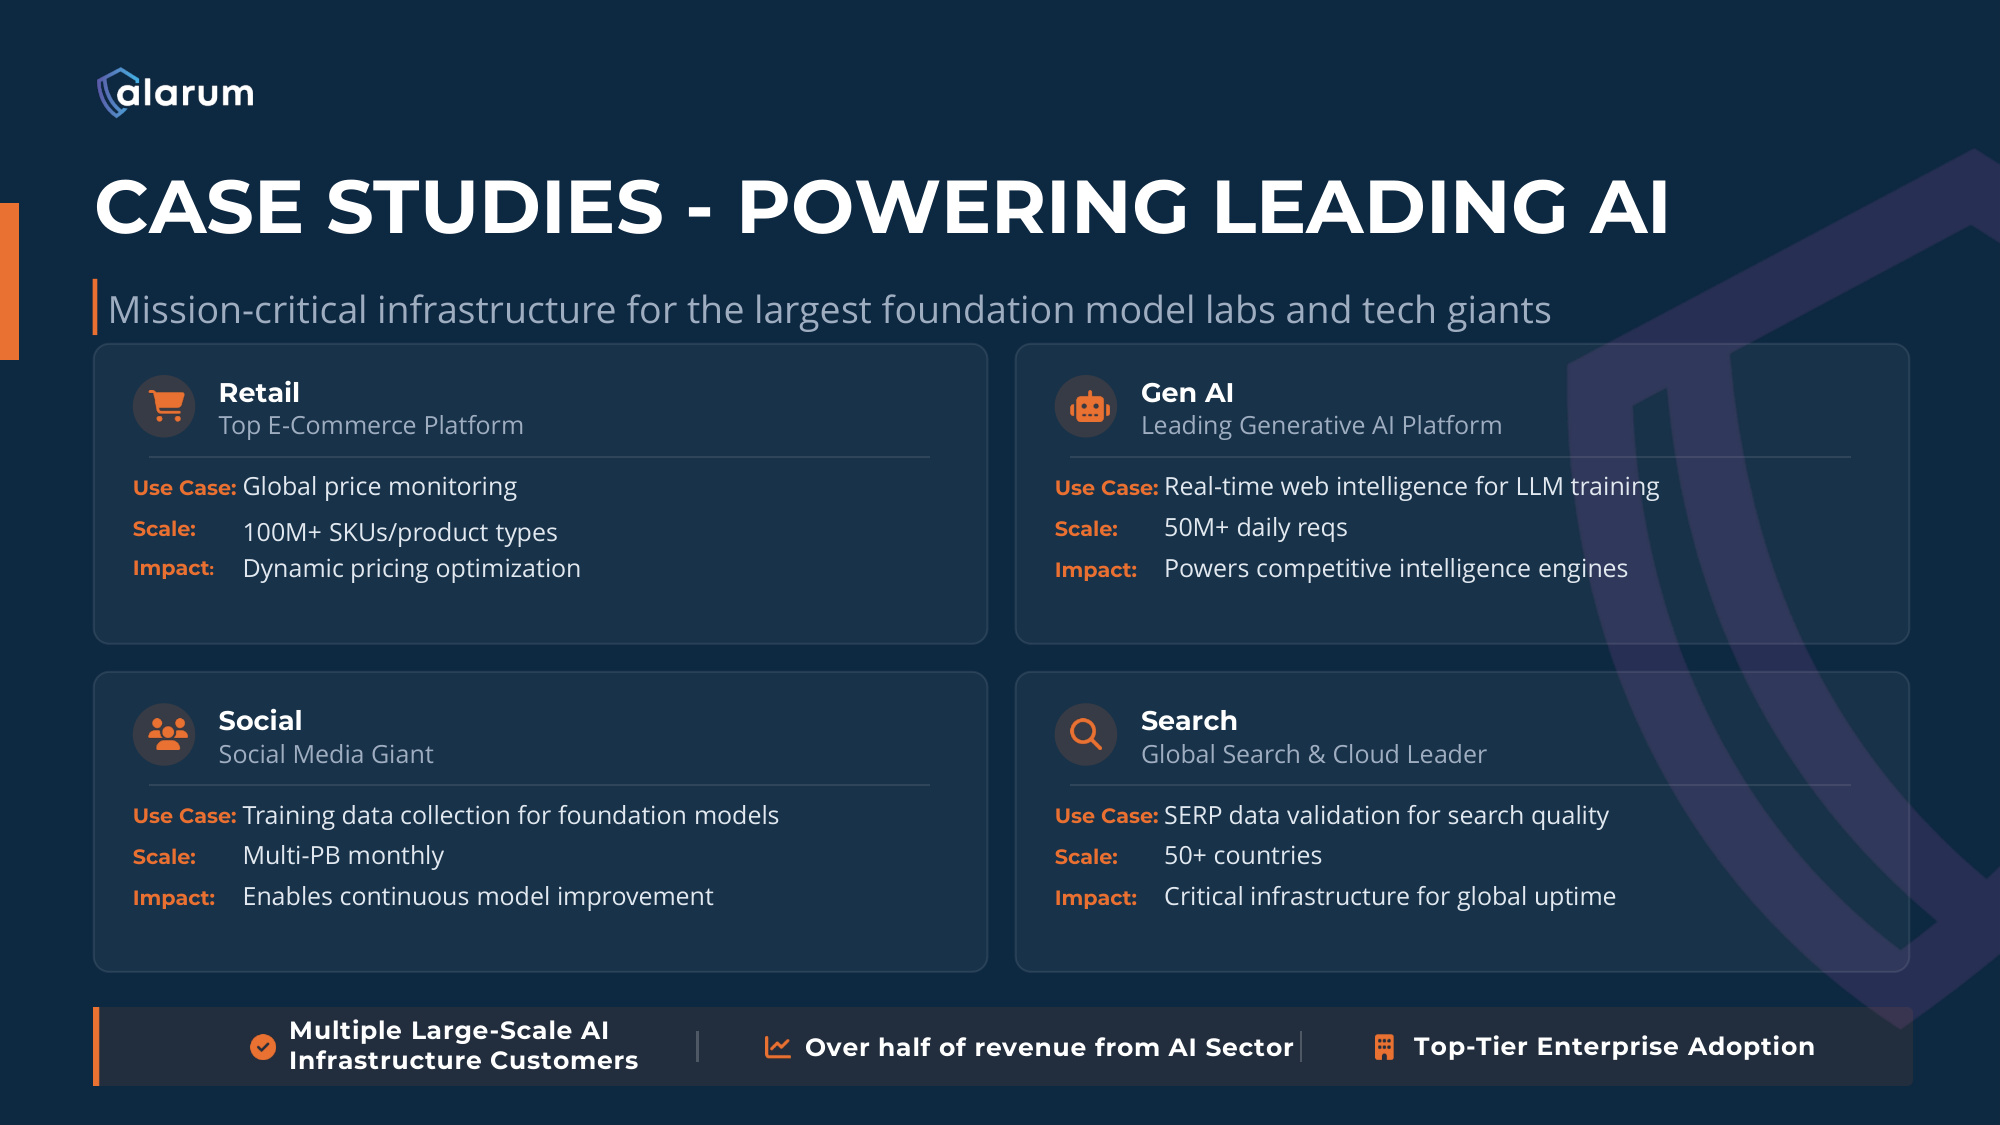
CASE STUDIES - POWERING LEADING AI Mission-critical infrastructure for the largest foundation model labs and tech giants Retail Top E-Commerce Platform Use Case: Global price monitoring Scale: 100M+ SKUs/product types Impact: Dynamic pricing optimization Gen AI Leading Generative AI Platform Use Case: Real-time web intelligence for LLM training Scale: 50M+ daily reqs Impact: Powers competitive intelligence engines Social Social Media Giant Use Case: Training data collection for foundation models Scale: Multi-PB monthly Impact: Enables continuous model improvement Search Global Search & Cloud Leader Use Case: SERP data validation for search quality Scale: 50+ countries Impact: Critical infrastructure for global uptime Multiple Large-Scale AI Infrastructure Customers Over half of revenue from AI Sector Top-Tier Enterprise Adoption
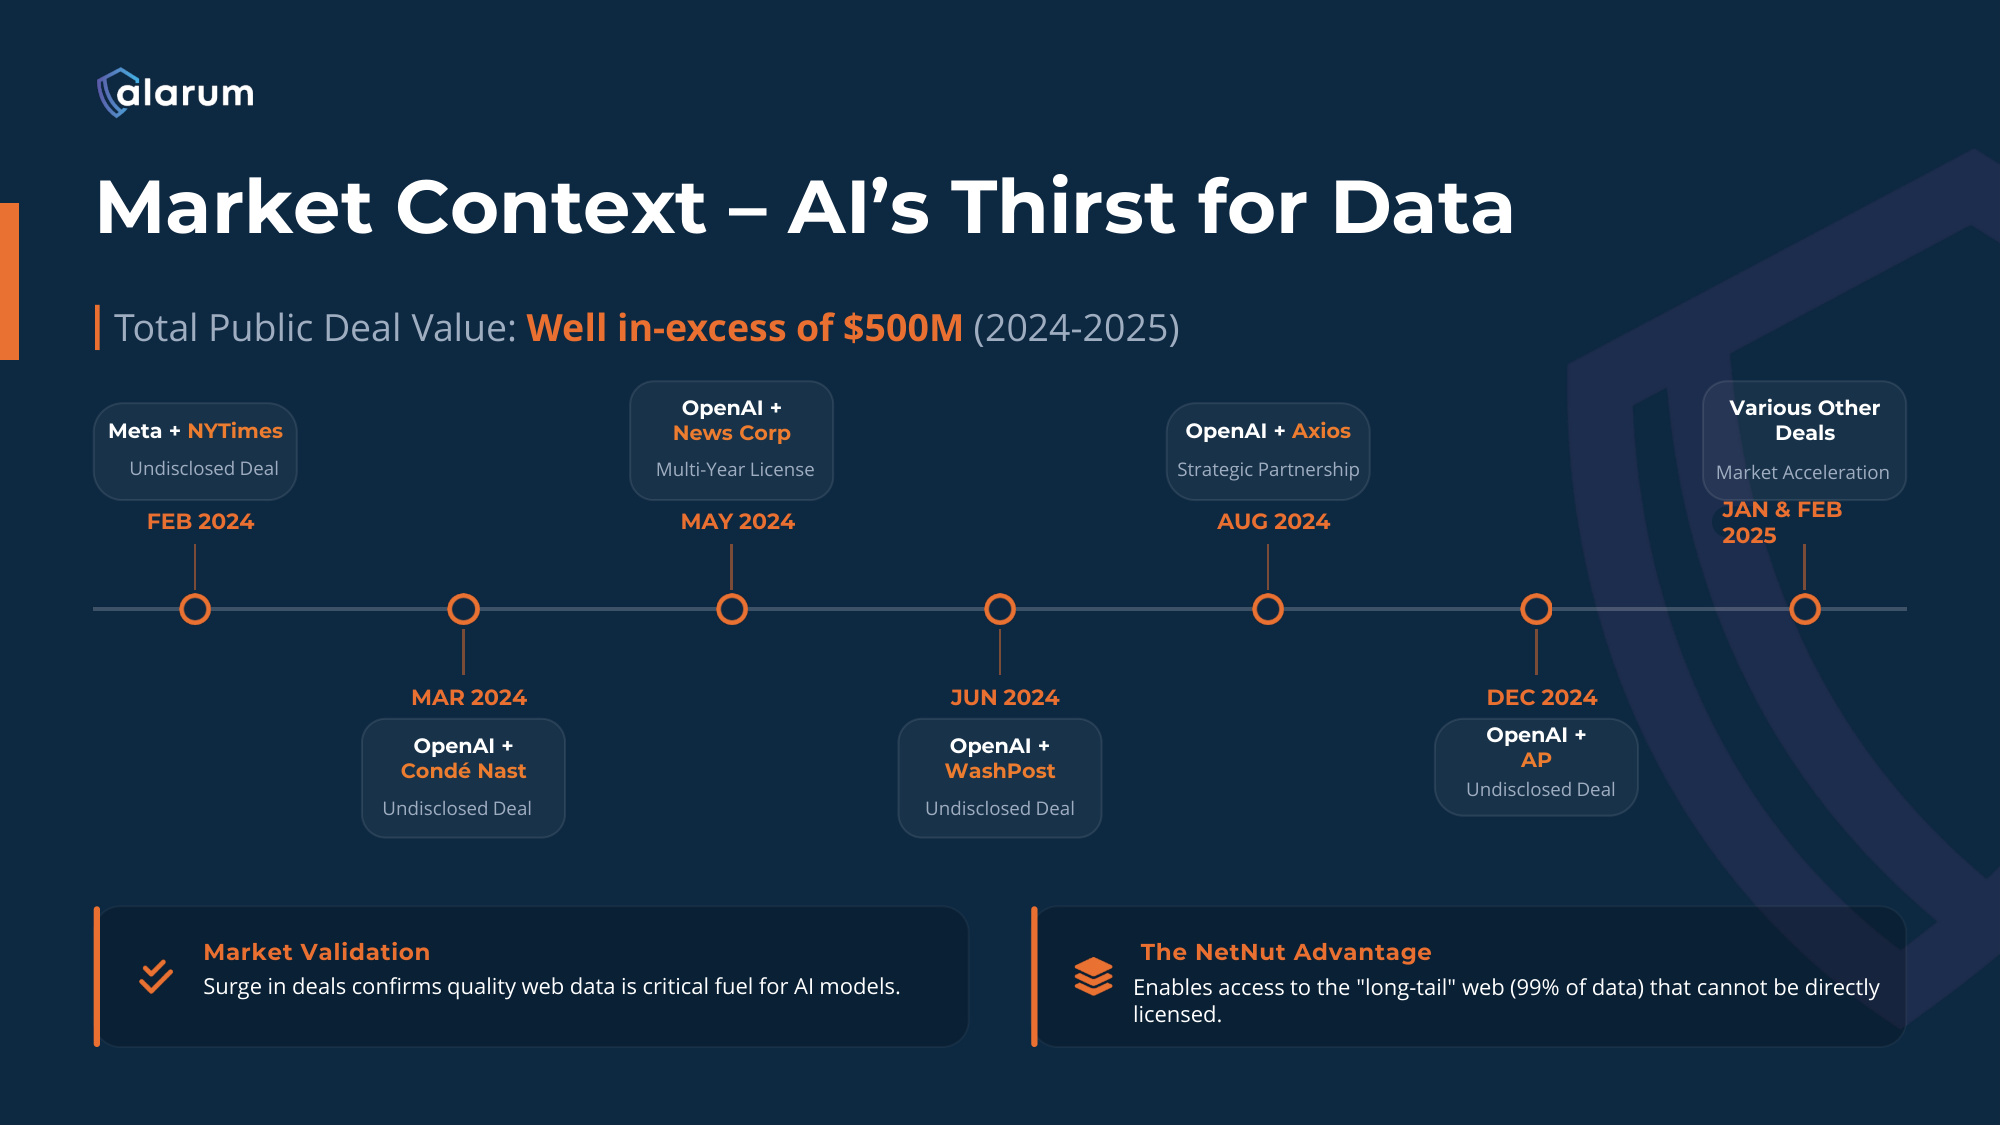
Market Context – AI's Thirst for Data Total Public Deal Value: Well in-excess of $500M (2024-2025) Meta + NYTimes Undisclosed Deal FEB 2024 MAR 2024 OpenAI + Condé Nast Undisclosed Deal OpenAI + News Corp Multi-Year License MAY 2024 JUN 2024 OpenAI + WashPost Undisclosed Deal OpenAI + Axios Strategic Partnership AUG 2024 DEC 2024 OpenAI + AP Undisclosed Deal Various Other Deals Market Acceleration JAN & FEB 2025 Market Validation Surge in deals confirms quality web data is critical fuel for AI models. The NetNut Advantage Enables access to the "long-tail" web (99% of data) that cannot be directly licensed.
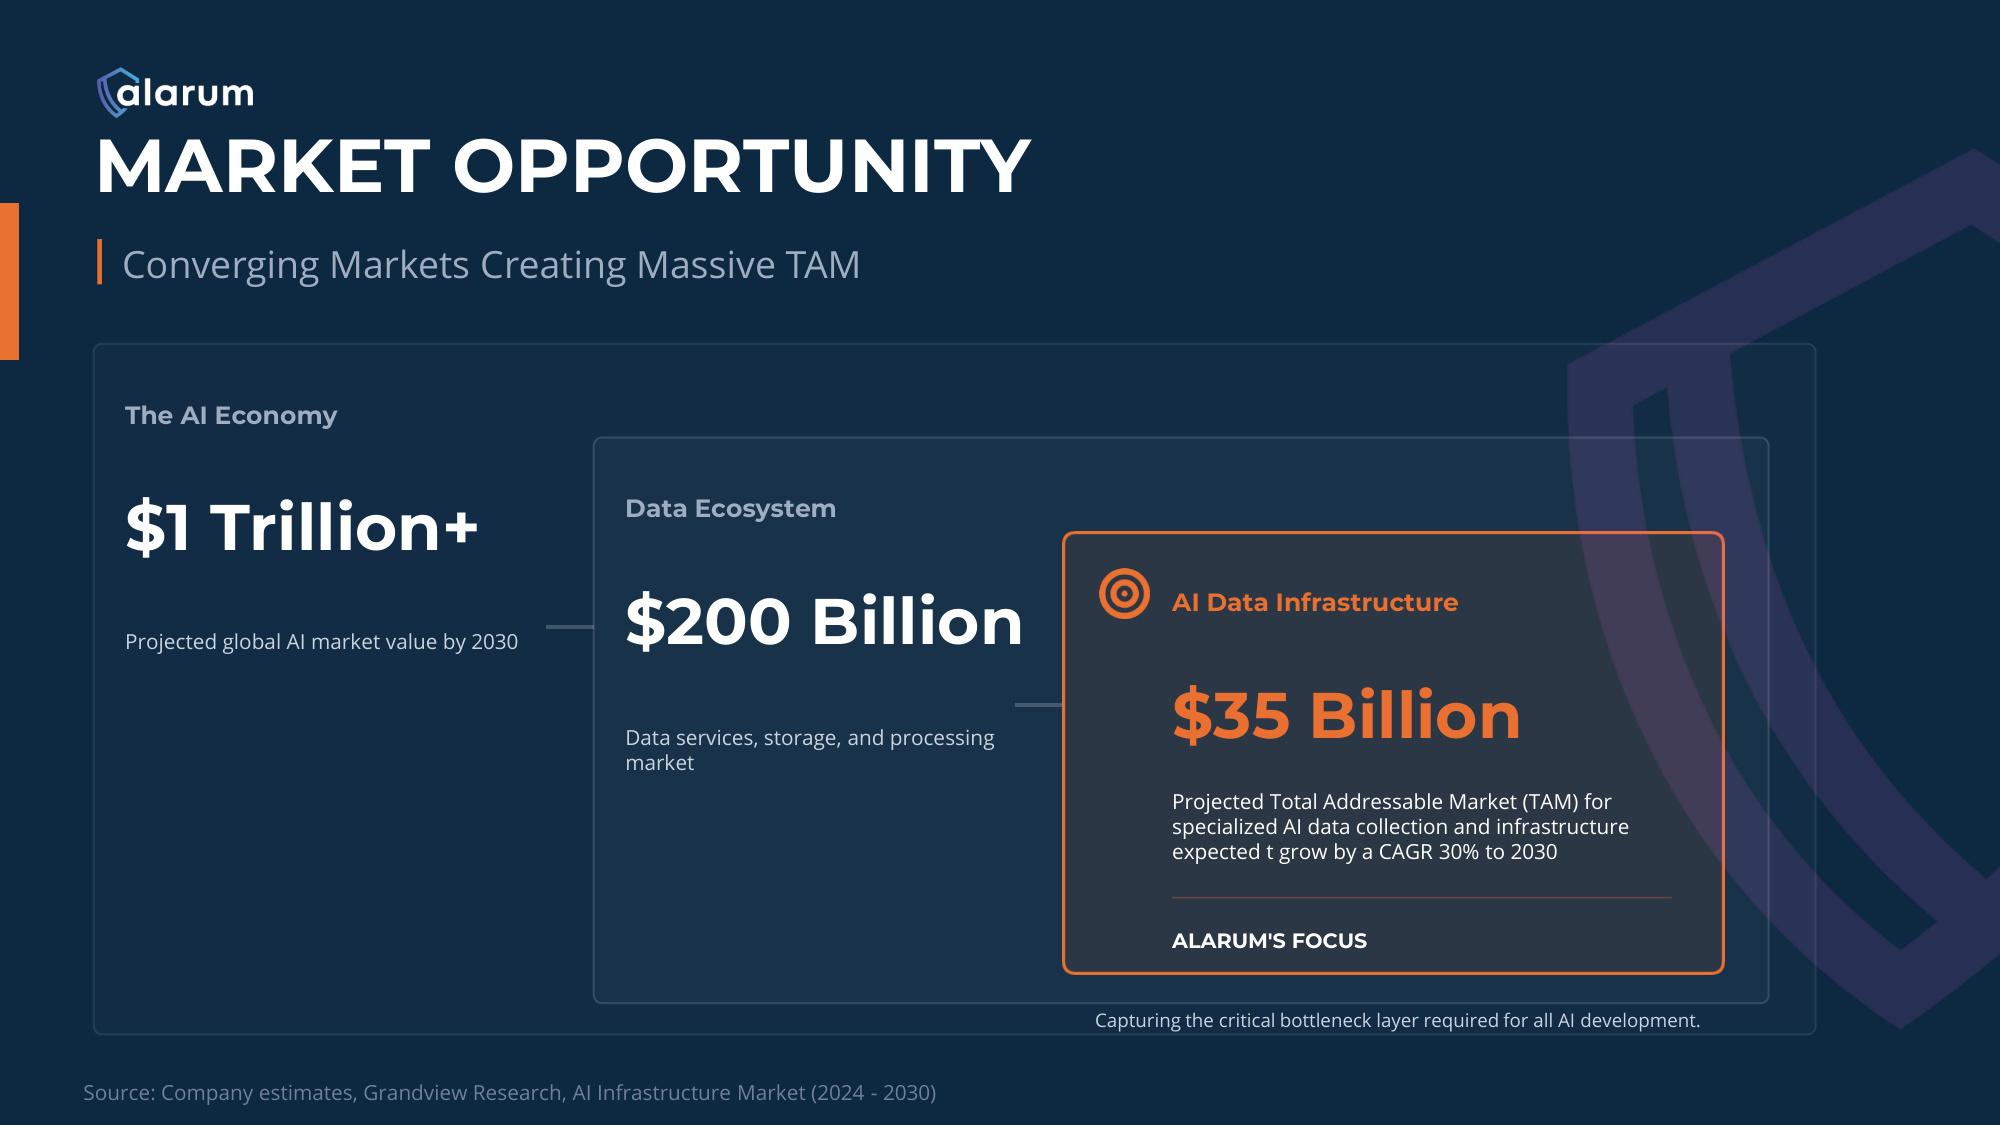
The AI Economy $1 Trillion+ Projected global AI market value by 2030 Data Ecosystem $200 Billion Data services, storage, and processing market AI Data Infrastructure $35 Billion Projected Total Addressable Market (TAM) for specialized AI data collection and infrastructure expected t grow by a CAGR 30% to 2030 ALARUM'S FOCUS Capturing the critical bottleneck layer required for all AI development. MARKET OPPORTUNITY Converging Markets Creating Massive TAM Source: Company estimates, Grandview Research, AI Infrastructure Market (2024 - 2030)
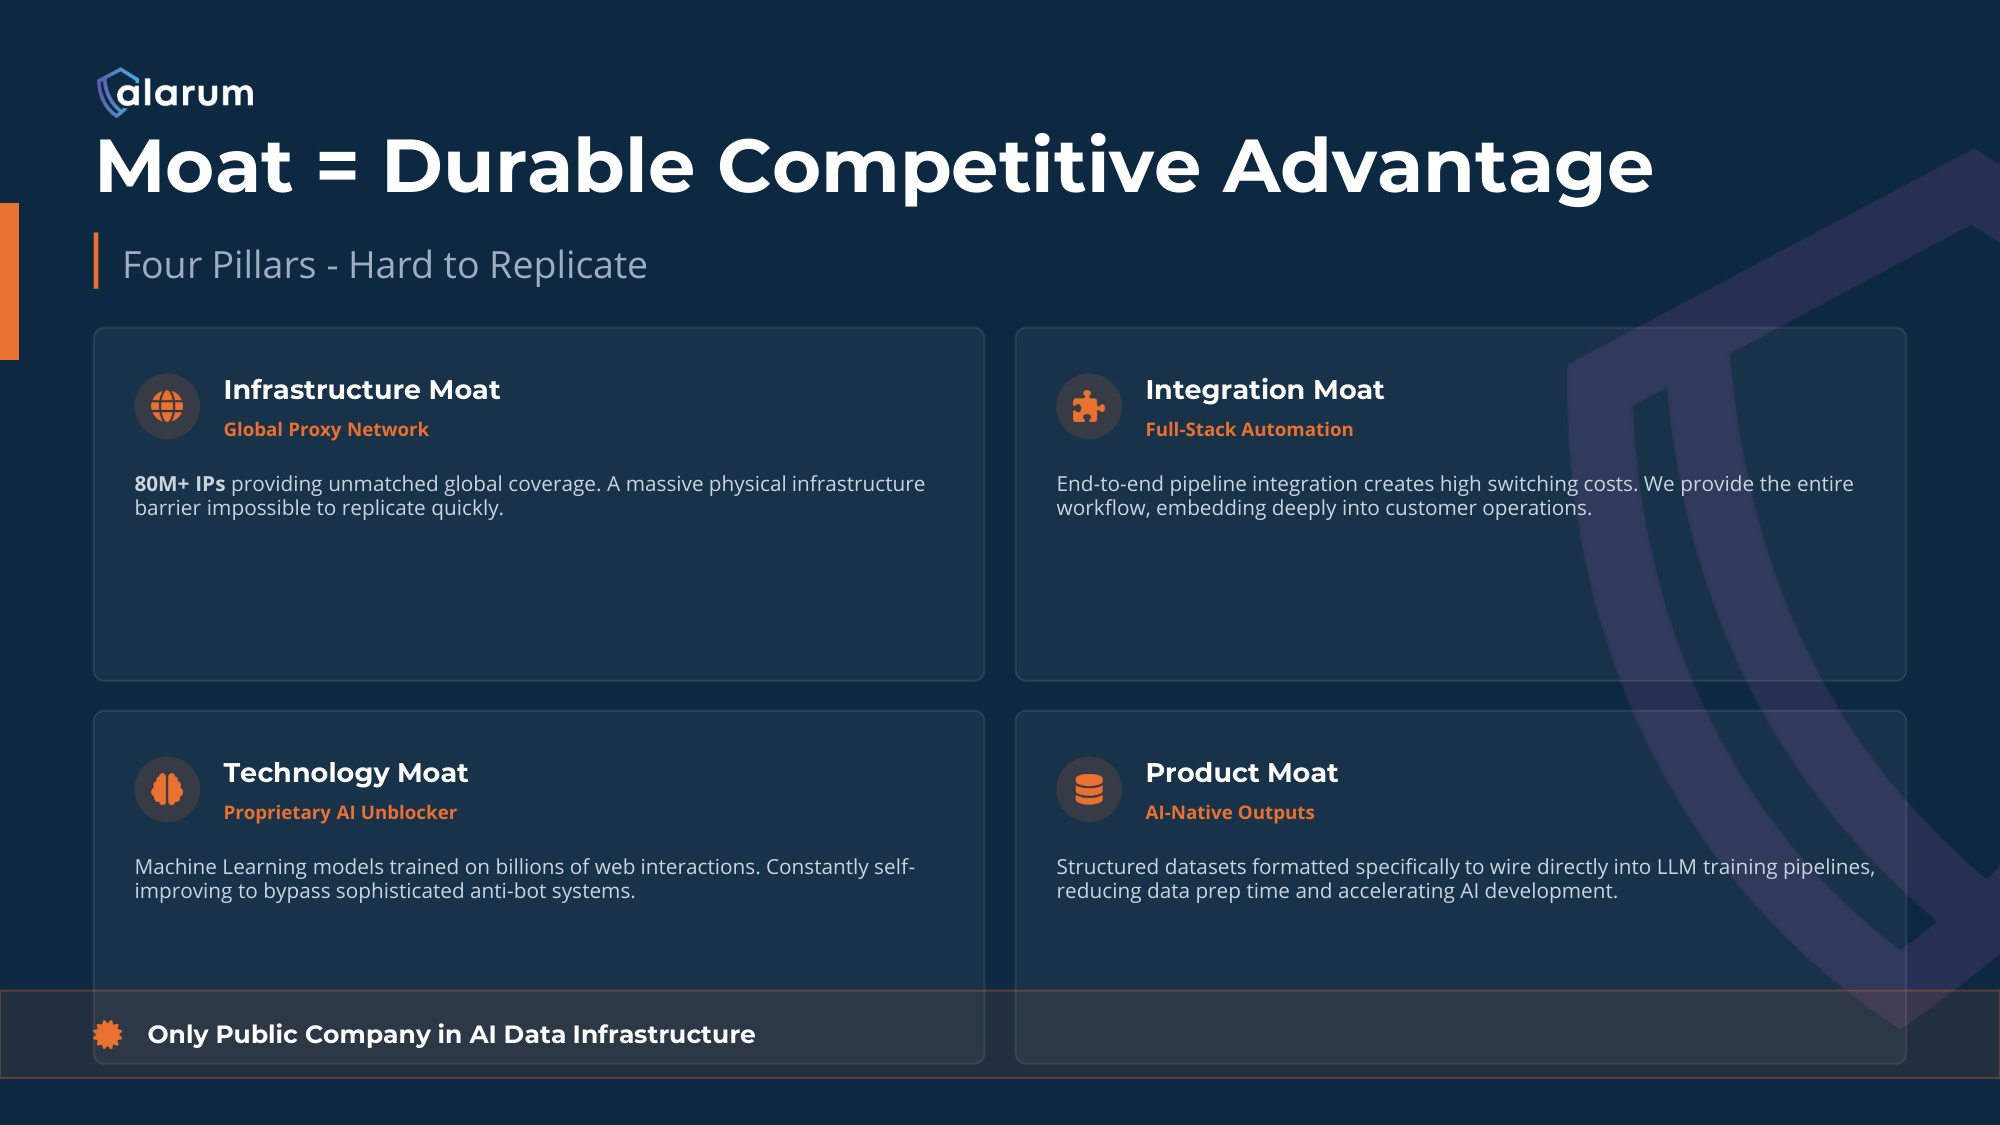
Moat = Durable Competitive Advantage Four Pillars - Hard to Replicate Infrastructure Moat Global Proxy Network 80M+ IPs providing unmatched global coverage. A massive physical infrastructure barrier impossible to replicate quickly. Integration Moat Full-Stack Automation End-to-end pipeline integration creates high switching costs. We provide the entire workflow, embedding deeply into customer operations. Technology Moat Proprietary AI Unblocker Machine Learning models trained on billions of web interactions. Constantly self- improving to bypass sophisticated anti-bot systems. Product Moat AI-Native Outputs Structured datasets formatted specifically to wire directly into LLM training pipelines, reducing data prep time and accelerating AI development. Only Public Company in AI Data Infrastructure
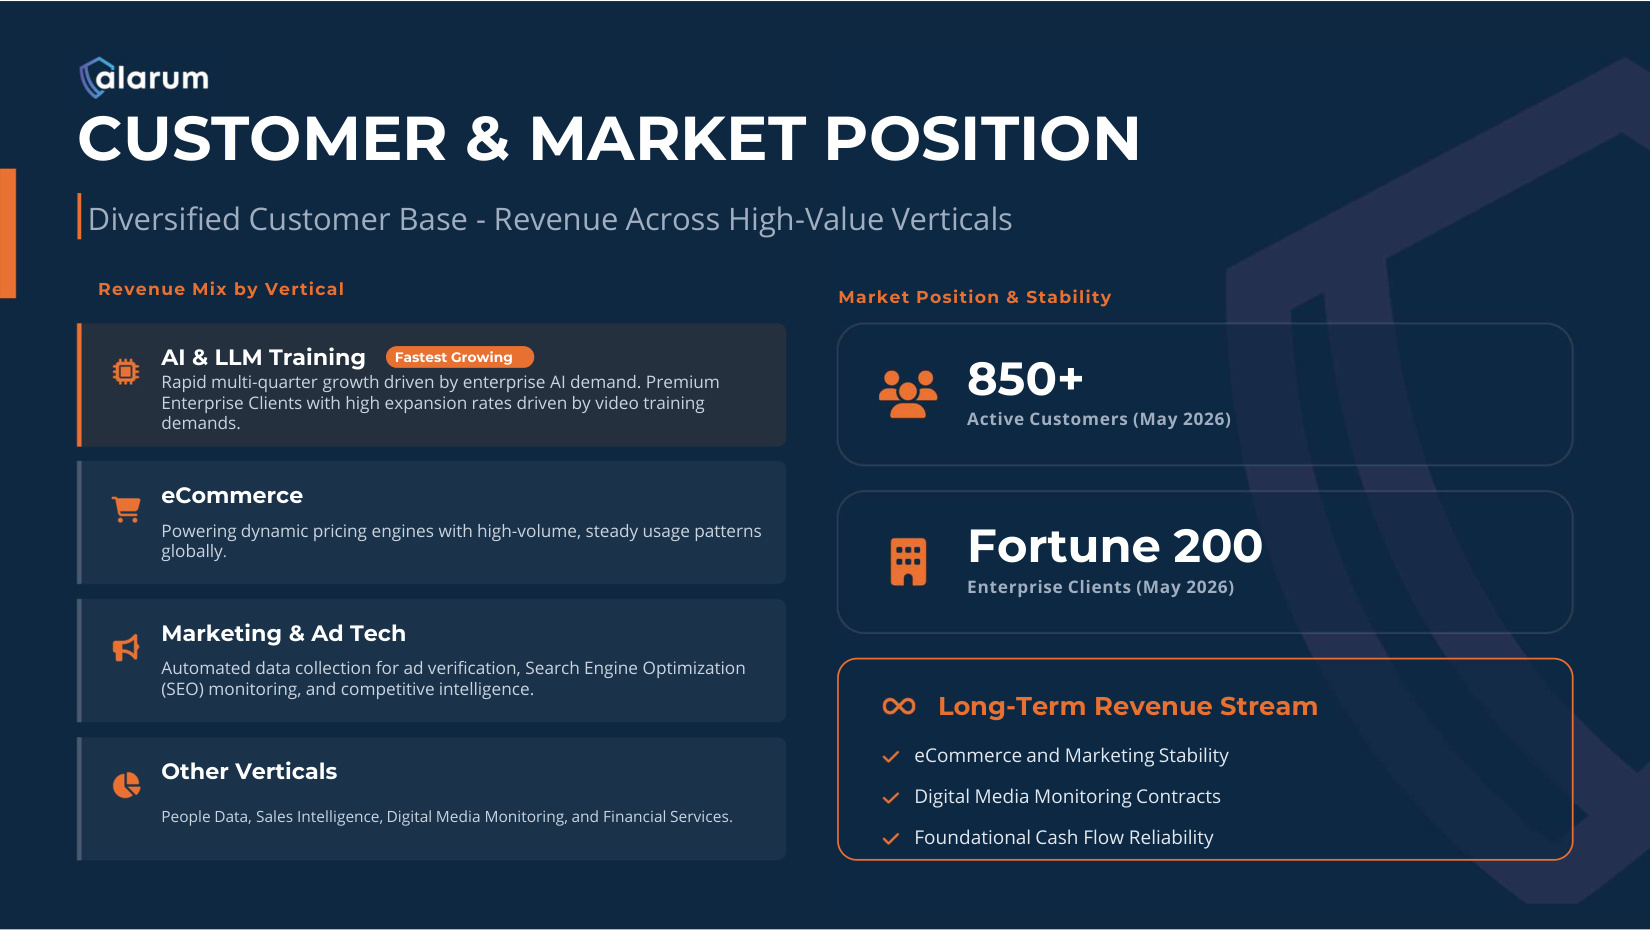
Revenue Mix by Vertical AI & LLM Training Fastest Growing Rapid multi-quarter growth driven by enterprise AI demand. Premium Enterprise Clients with high expansion rates driven by video training demands. eCommerce Powering dynamic pricing engines with high-volume, steady usage patterns globally. Marketing & Ad Tech Automated data collection for ad verification, Search Engine Optimization (SEO) monitoring, and competitive intelligence. Other Verticals People Data, Sales Intelligence, Digital Media Monitoring, and Financial Services. Market Position & Stability 850+ Active Customers (May 2026) Fortune 200 Enterprise Clients (May 2026) Long-Term Revenue Stream eCommerce and Marketing Stability Digital Media Monitoring Contracts Foundational Cash Flow Reliability CUSTOMER & MARKET POSITION Diversified Customer Base - Revenue Across High-Value Verticals
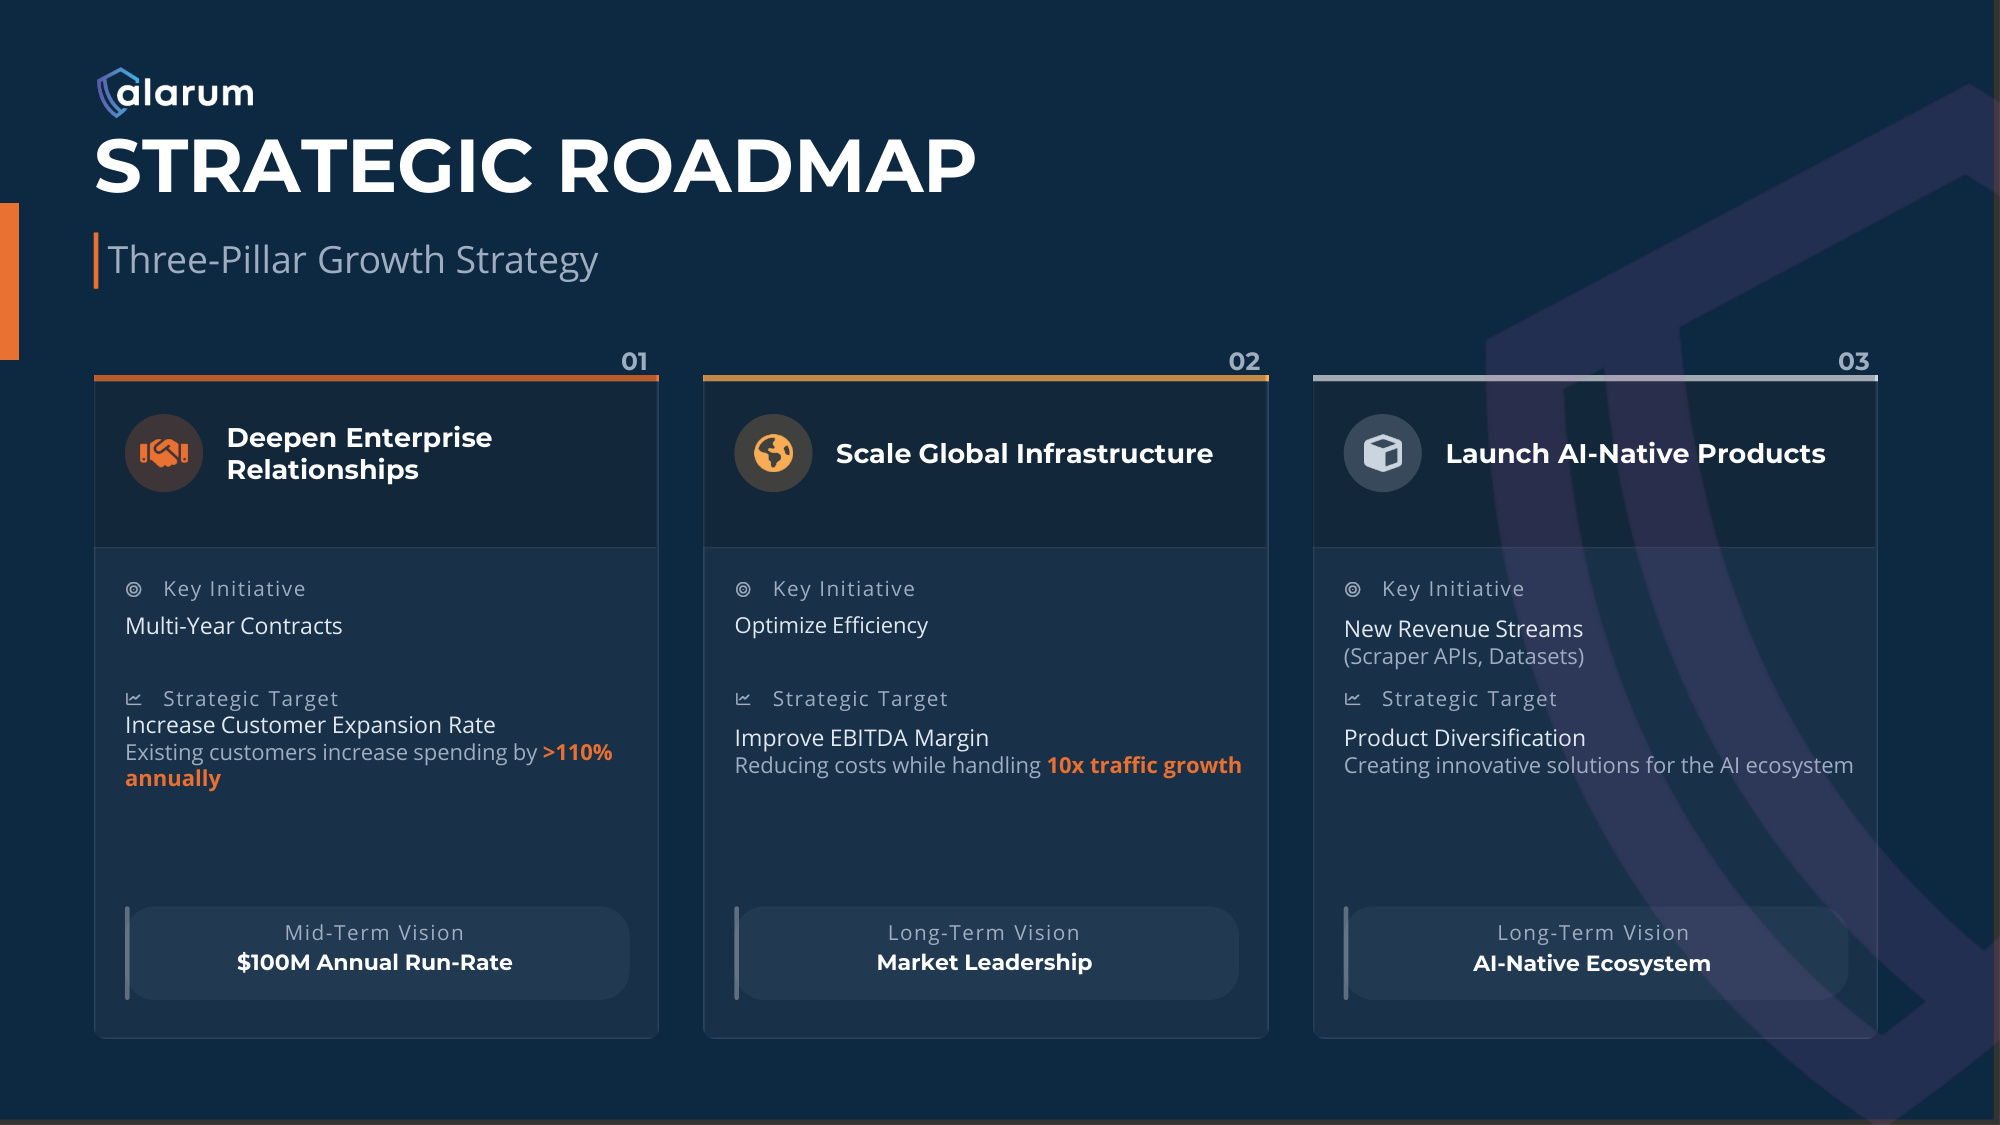
STRATEGIC ROADMAP Three-Pillar Growth Strategy 01 Deepen Enterprise Relationships Key Initiative Multi-Year Contracts Strategic Target Increase Customer Expansion Rate Existing customers increase spending by >110% annually Mid-Term Vision $100M Annual Run-Rate 02 Scale Global Infrastructure Key Initiative Optimize Efficiency Strategic Target Improve EBITDA Margin Reducing costs while handling 10x traffic growth Long-Term Vision Market Leadership 03 Launch AI-Native Products Key Initiative New Revenue Streams (Scraper APIs, Datasets) Strategic Target Product Diversification Creating innovative solutions for the AI ecosystem Long-Term Vision AI-Native Ecosystem
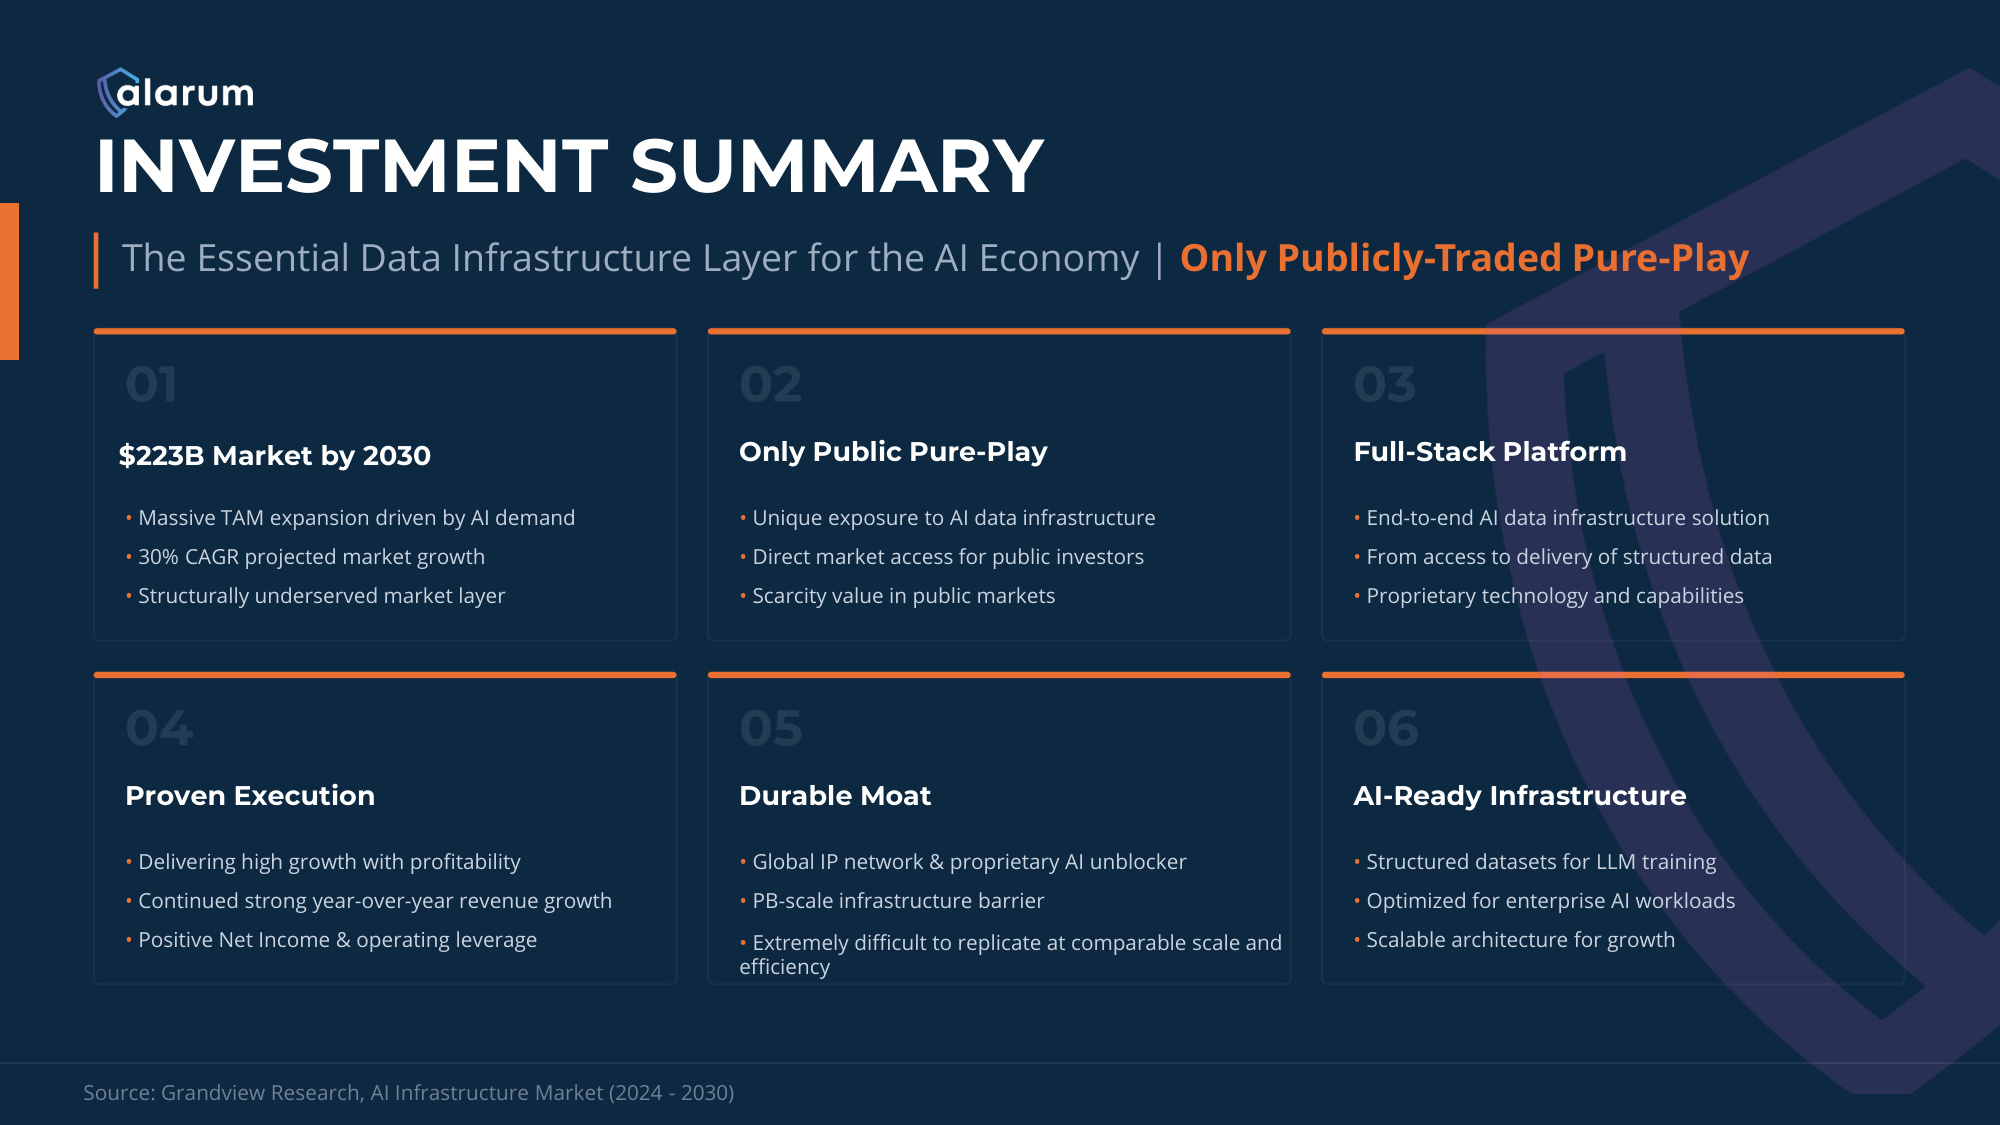
INVESTMENT SUMMARY The Essential Data Infrastructure Layer for the AI Economy | Only Publicly-Traded Pure-Play $223B Market by 2030 • Massive TAM expansion driven by AI demand • 30% CAGR projected market growth • Structurally underserved market layer Only Public Pure-Play • Unique exposure to AI data infrastructure • Direct market access for public investors • Scarcity value in public markets Full-Stack Platform • End-to-end AI data infrastructure solution • From access to delivery of structured data • Proprietary technology and capabilities Proven Execution • Delivering high growth with profitability • Continued strong year-over-year revenue growth • Positive Net Income & operating leverage Durable Moat • Global IP network & proprietary AI unblocker • PB-scale infrastructure barrier • Extremely difficult to replicate at comparable scale and efficiency AI-Ready Infrastructure • Structured datasets for LLM training • Optimized for enterprise AI workloads • Scalable architecture for growth Source: Grandview Research, AI Infrastructure Market (2024 - 2030)
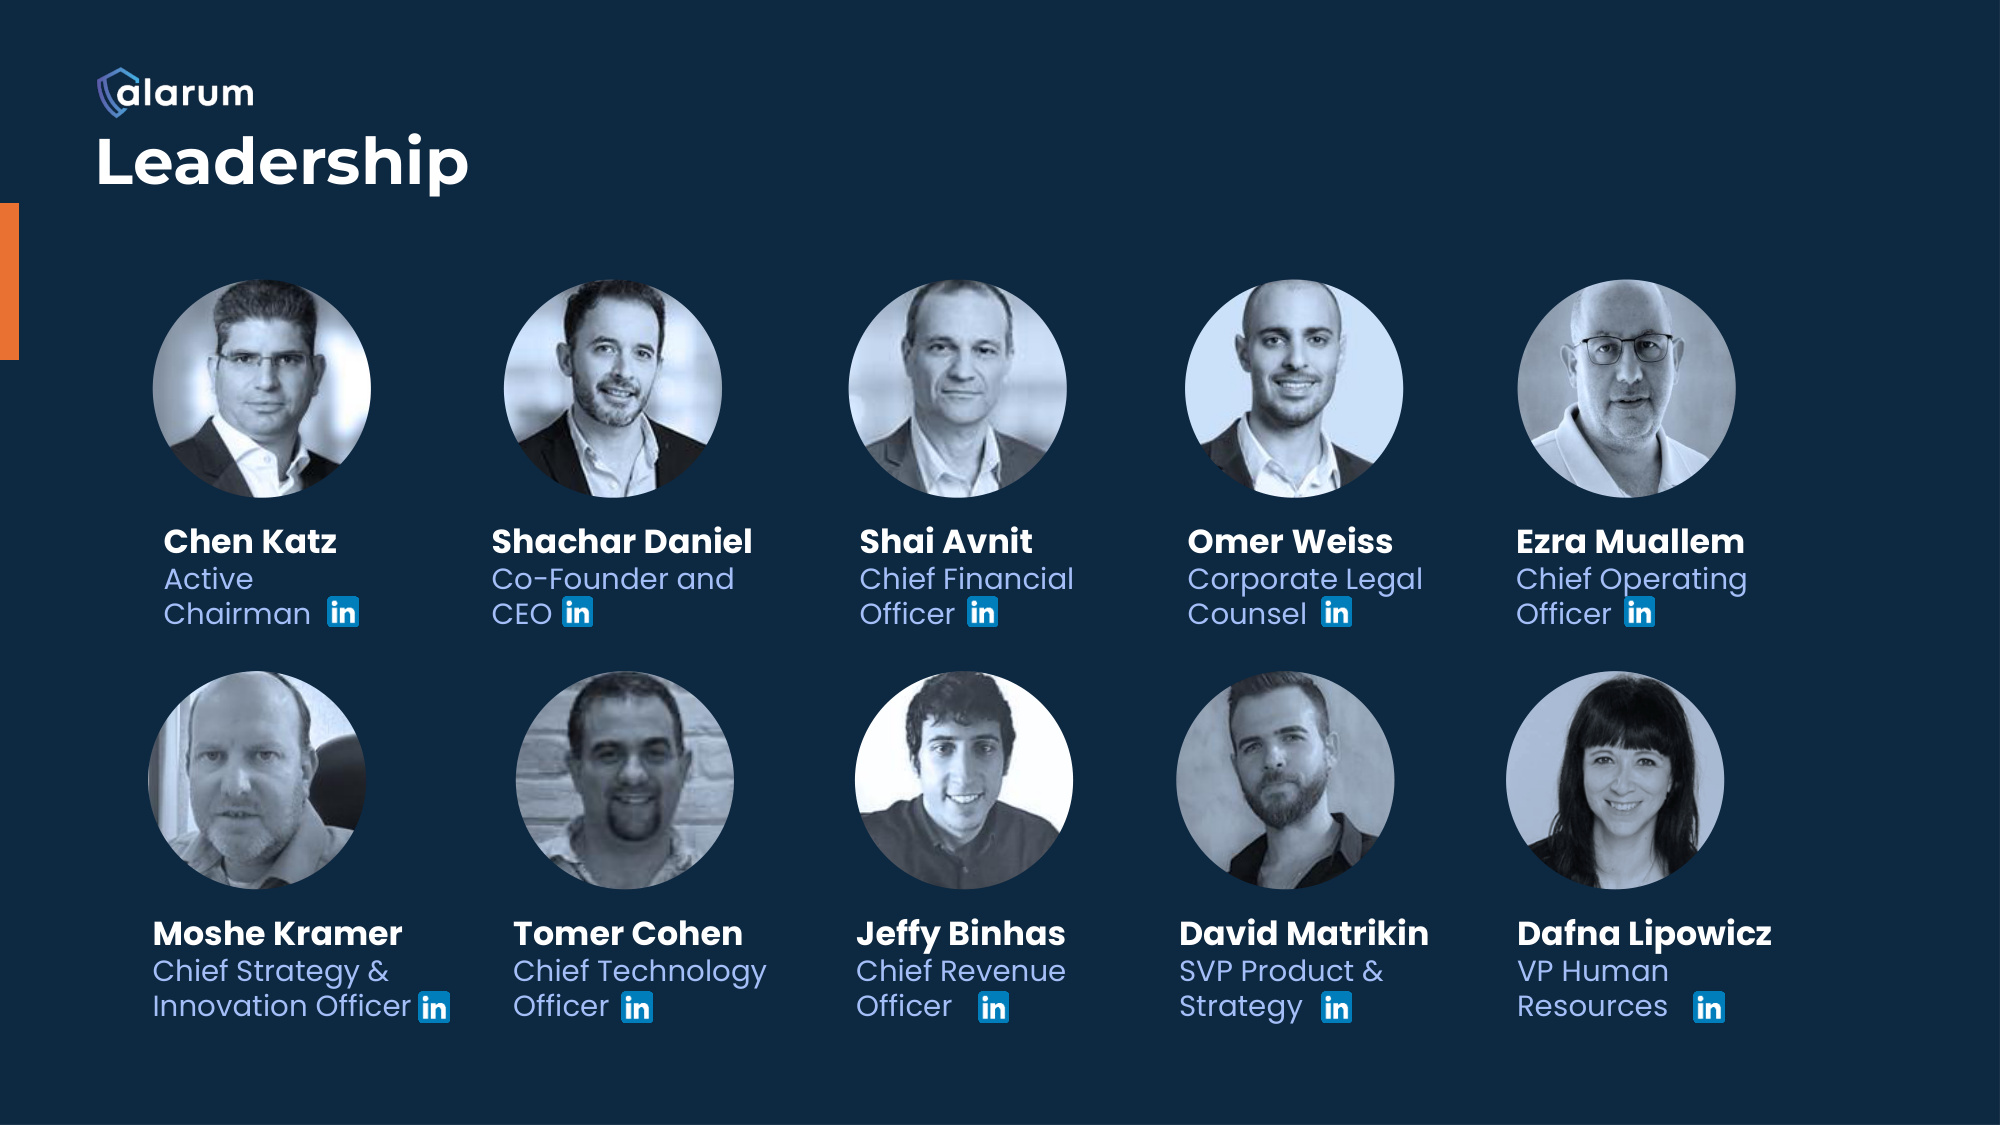
Leadership Chen Katz Active Chairman Shachar Daniel Co-Founder and CEO Shai Avnit Chief Financial Officer Omer Weiss Corporate Legal Counsel Ezra Muallem Chief Operating Officer Moshe Kramer Chief Strategy & Innovation Officer Tomer Cohen Chief Technology Officer Jeffy Binhas Chief Revenue Officer David Matrikin SVP Product & Strategy Dafna Lipowicz VP Human Resources
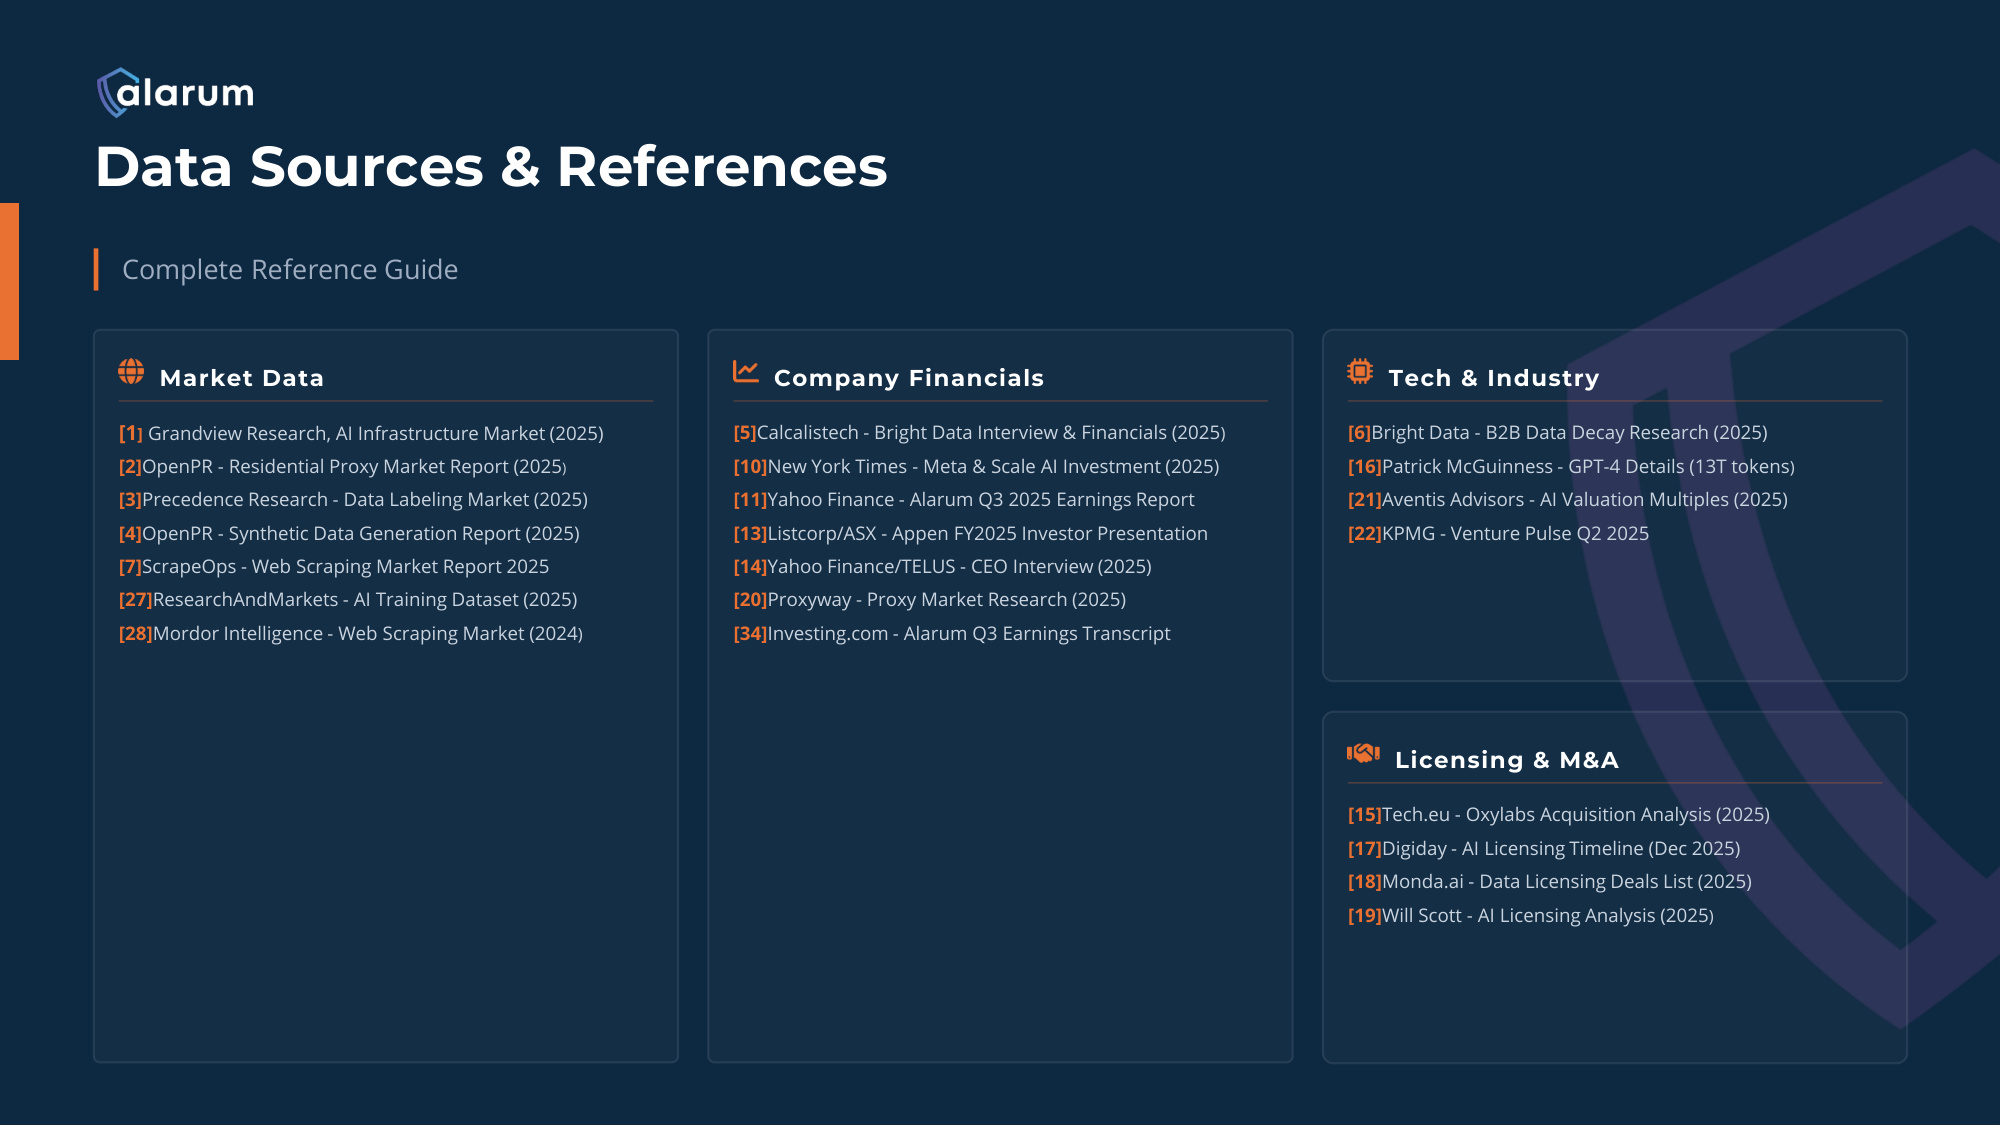
Data Sources & References Complete Reference Guide Market Data [1] Grandview Research, AI Infrastructure Market (2025) [2]OpenPR - Residential Proxy Market Report (2025) [3]Precedence Research - Data Labeling Market (2025) [4]OpenPR - Synthetic Data Generation Report (2025) [7]ScrapeOps - Web Scraping Market Report 2025 [27]ResearchAndMarkets - AI Training Dataset (2025) [28]Mordor Intelligence - Web Scraping Market (2024) Company Financials [5]Calcalistech - Bright Data Interview & Financials (2025) [10]New York Times - Meta & Scale AI Investment (2025) [11]Yahoo Finance - Alarum Q3 2025 Earnings Report [13]Listcorp/ASX - Appen FY2025 Investor Presentation [14]Yahoo Finance/TELUS - CEO Interview (2025) [20]Proxyway - Proxy Market Research (2025) [34]Investing.com - Alarum Q3 Earnings Transcript Tech & Industry [6]Bright Data - B2B Data Decay Research (2025) [16]Patrick McGuinness - GPT-4 Details (13T tokens) [21]Aventis Advisors - AI Valuation Multiples (2025) [22]KPMG - Venture Pulse Q2 2025 Licensing & M&A [15]Tech.eu - Oxylabs Acquisition Analysis (2025) [17]Digiday - AI Licensing Timeline (Dec 2025) [18]Monda.ai - Data Licensing Deals List (2025) [19]Will Scott - AI Licensing Analysis (2025)
Thank You For Your Time and Attention Company Alarum Technologies Ltd. Stock Ticker NASDAQ & TASE: ALAR Website www.alarum.io Email investors@alarum.io The Data Layer for the AI Future
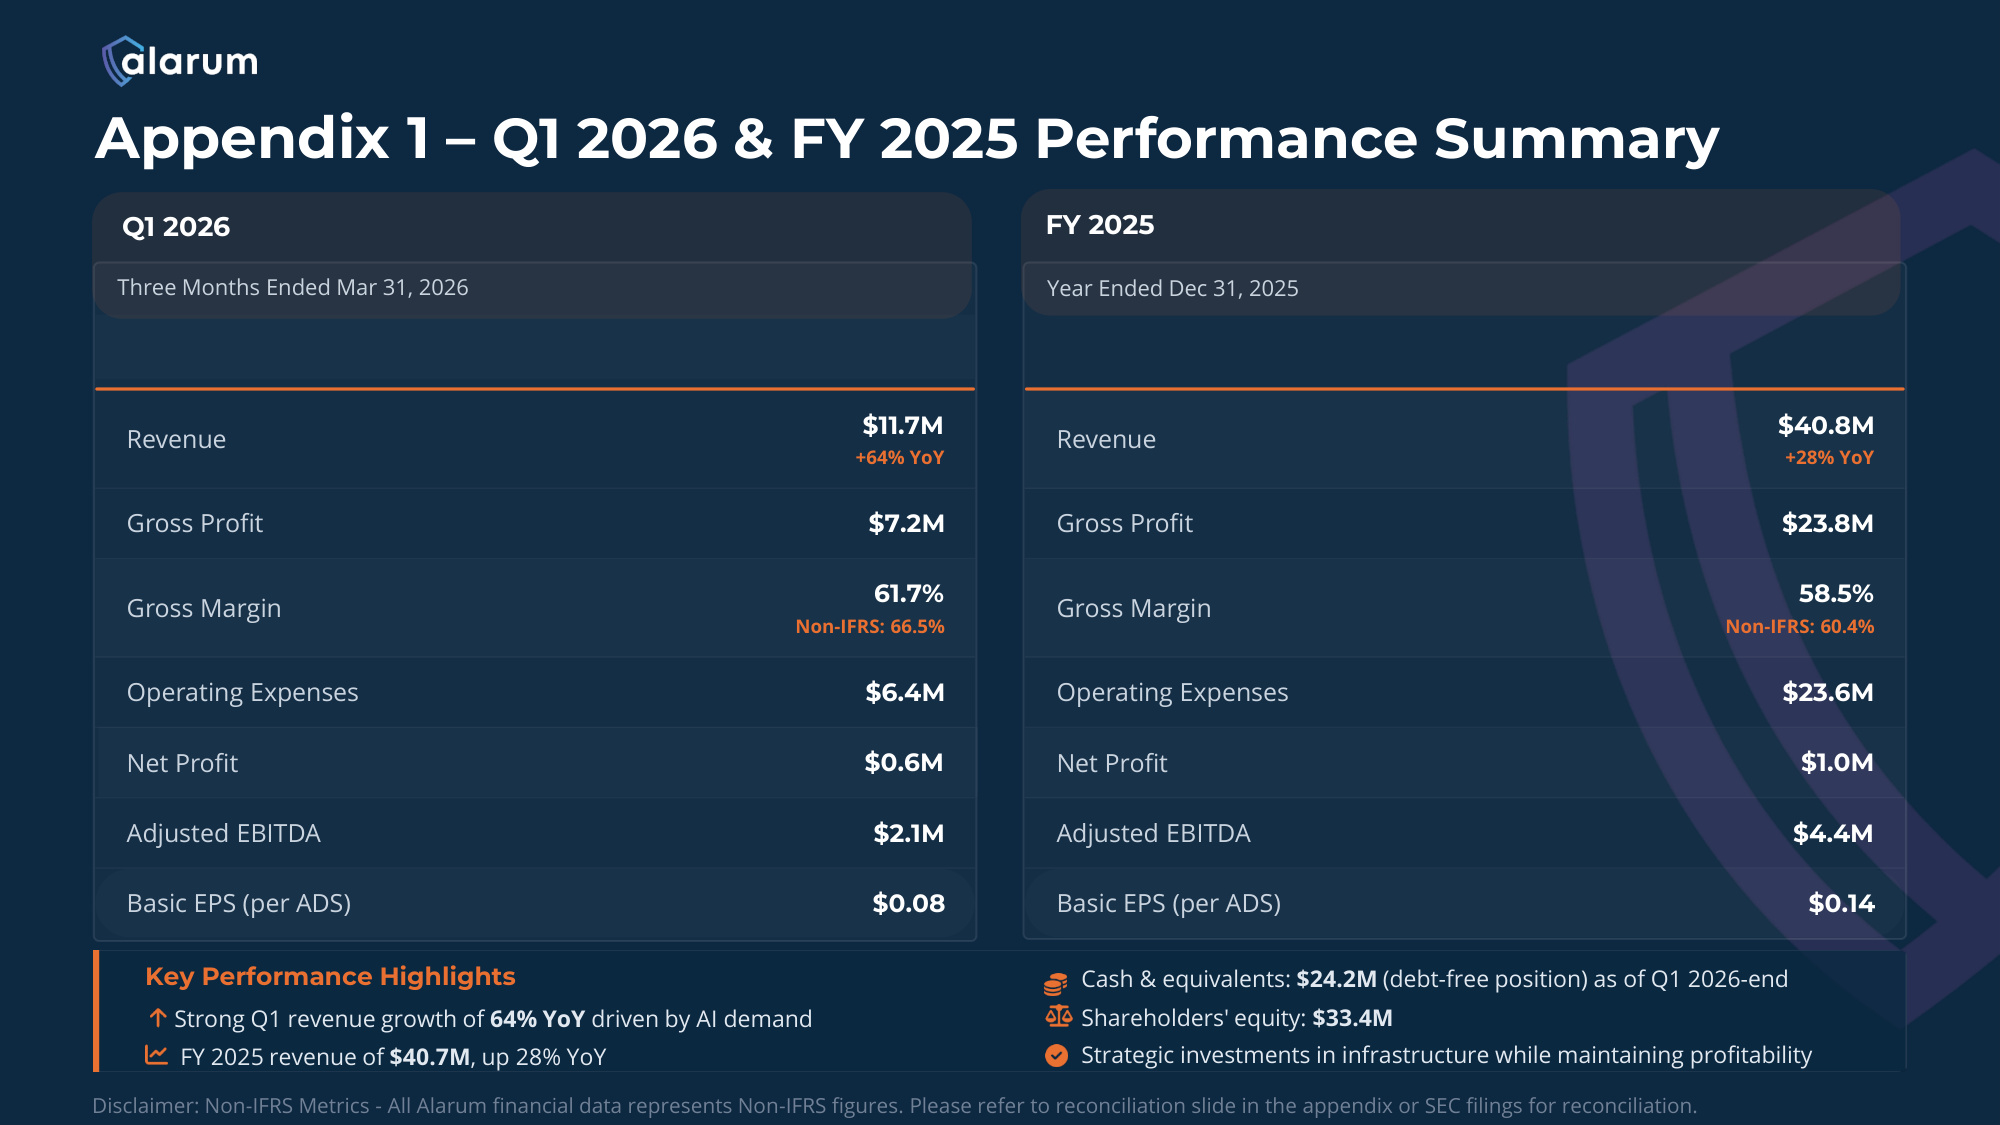
Appendix 1 – Q1 2026 & FY 2025 Performance Summary Q1 2026 Three Months Ended Mar 31, 2026 Revenue $11.7M +64% YoY Gross Profit $7.2M Gross Margin 61.7% Non-IFRS: 66.5% Operating Expenses $6.4M Net Profit $0.6M Adjusted EBITDA $2.1M Basic EPS (per ADS) $0.08 FY 2025 Year Ended Dec 31, 2025 Revenue $40.8M +28% YoY Gross Profit $23.8M Gross Margin 58.5% Non-IFRS: 60.4% Operating Expenses $23.6M Net Profit $1.0M Adjusted EBITDA $4.4M Basic EPS (per ADS) $0.14 Key Performance Highlights Strong Q1 revenue growth of 64% YoY driven by AI demand Cash & equivalents: $24.2M (debt-free position) as of Q1 2026-end FY 2025 revenue of $40.7M, up 28% YoY Shareholders' equity: $33.4M Strategic investments in infrastructure while maintaining profitability Disclaimer: Non-IFRS Metrics - All Alarum financial data represents Non-IFRS figures. Please refer to reconciliation slide in the appendix or SEC filings for reconciliation.
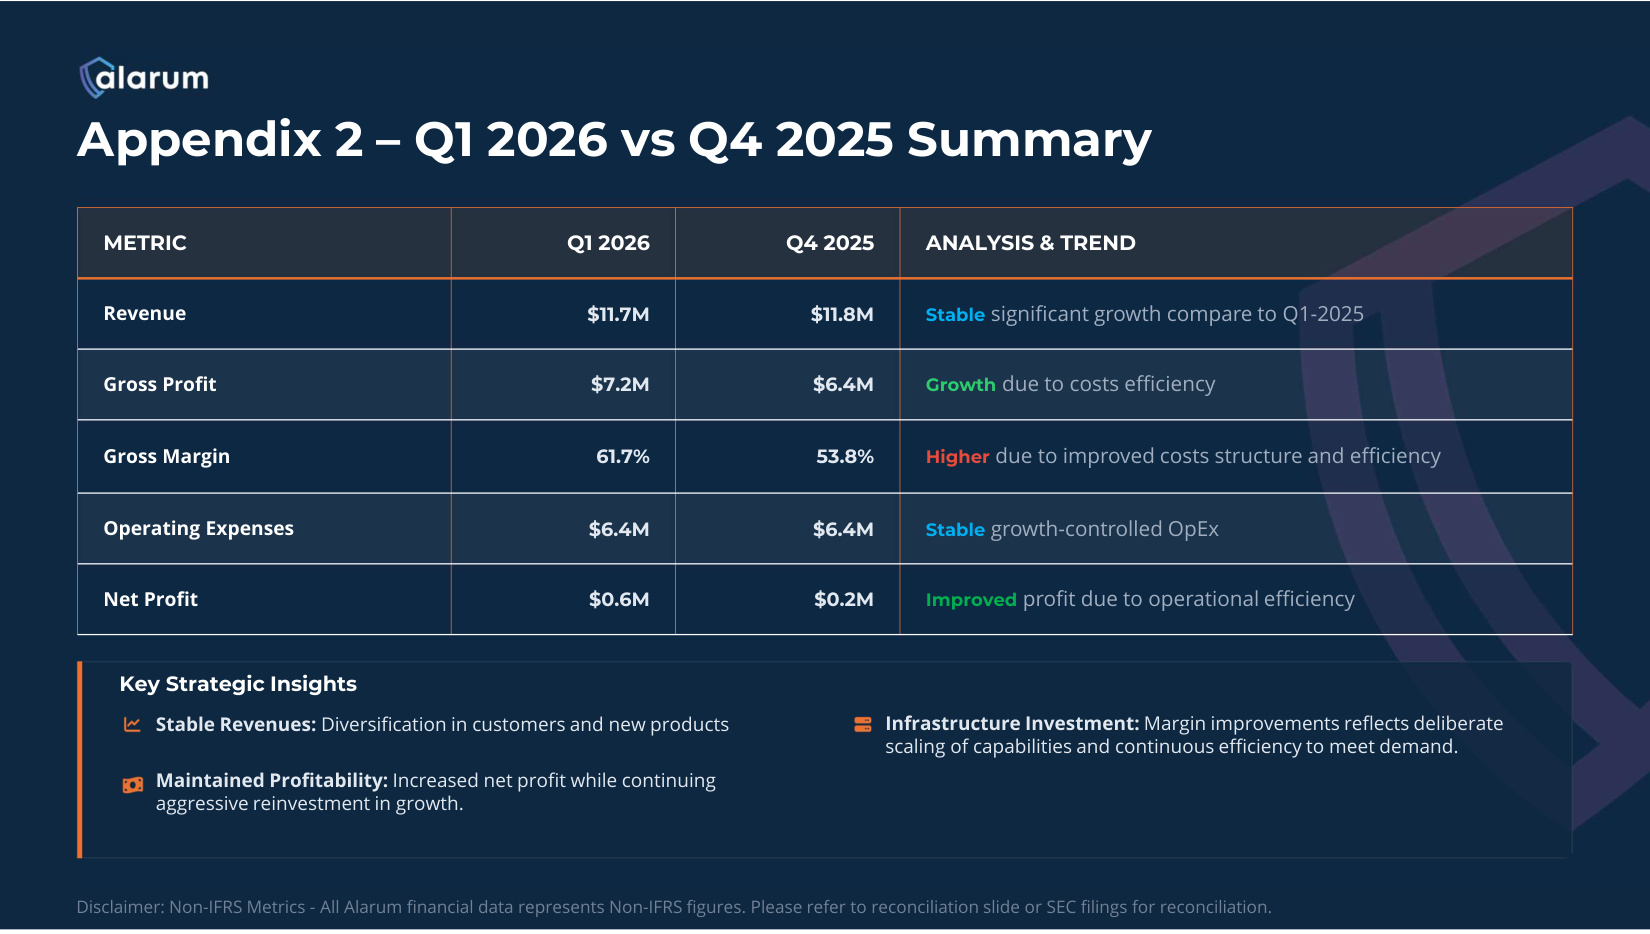
ANALYSIS & TREND Q4 2025 Q1 2026 METRIC Stable significant growth compare to Q1-2025 $11.8M $11.7M Revenue Growth due to costs efficiency $6.4M $7.2M Gross Profit Higher due to improved costs structure and efficiency 53.8% 61.7% Gross Margin Stable growth-controlled OpEx $6.4M $6.4M Operating Expenses Improved profit due to operational efficiency $0.2M $0.6M Net Profit Key Strategic Insights Stable Revenues: Diversification in customers and new products Infrastructure Investment: Margin improvements reflects deliberate scaling of capabilities and continuous efficiency to meet demand. Maintained Profitability: Increased net profit while continuing aggressive reinvestment in growth. Appendix 2 – Q1 2026 vs Q4 2025 Summary Disclaimer: Non-IFRS Metrics - All Alarum financial data represents Non-IFRS figures. Please refer to reconciliation slide or SEC filings for reconciliation.
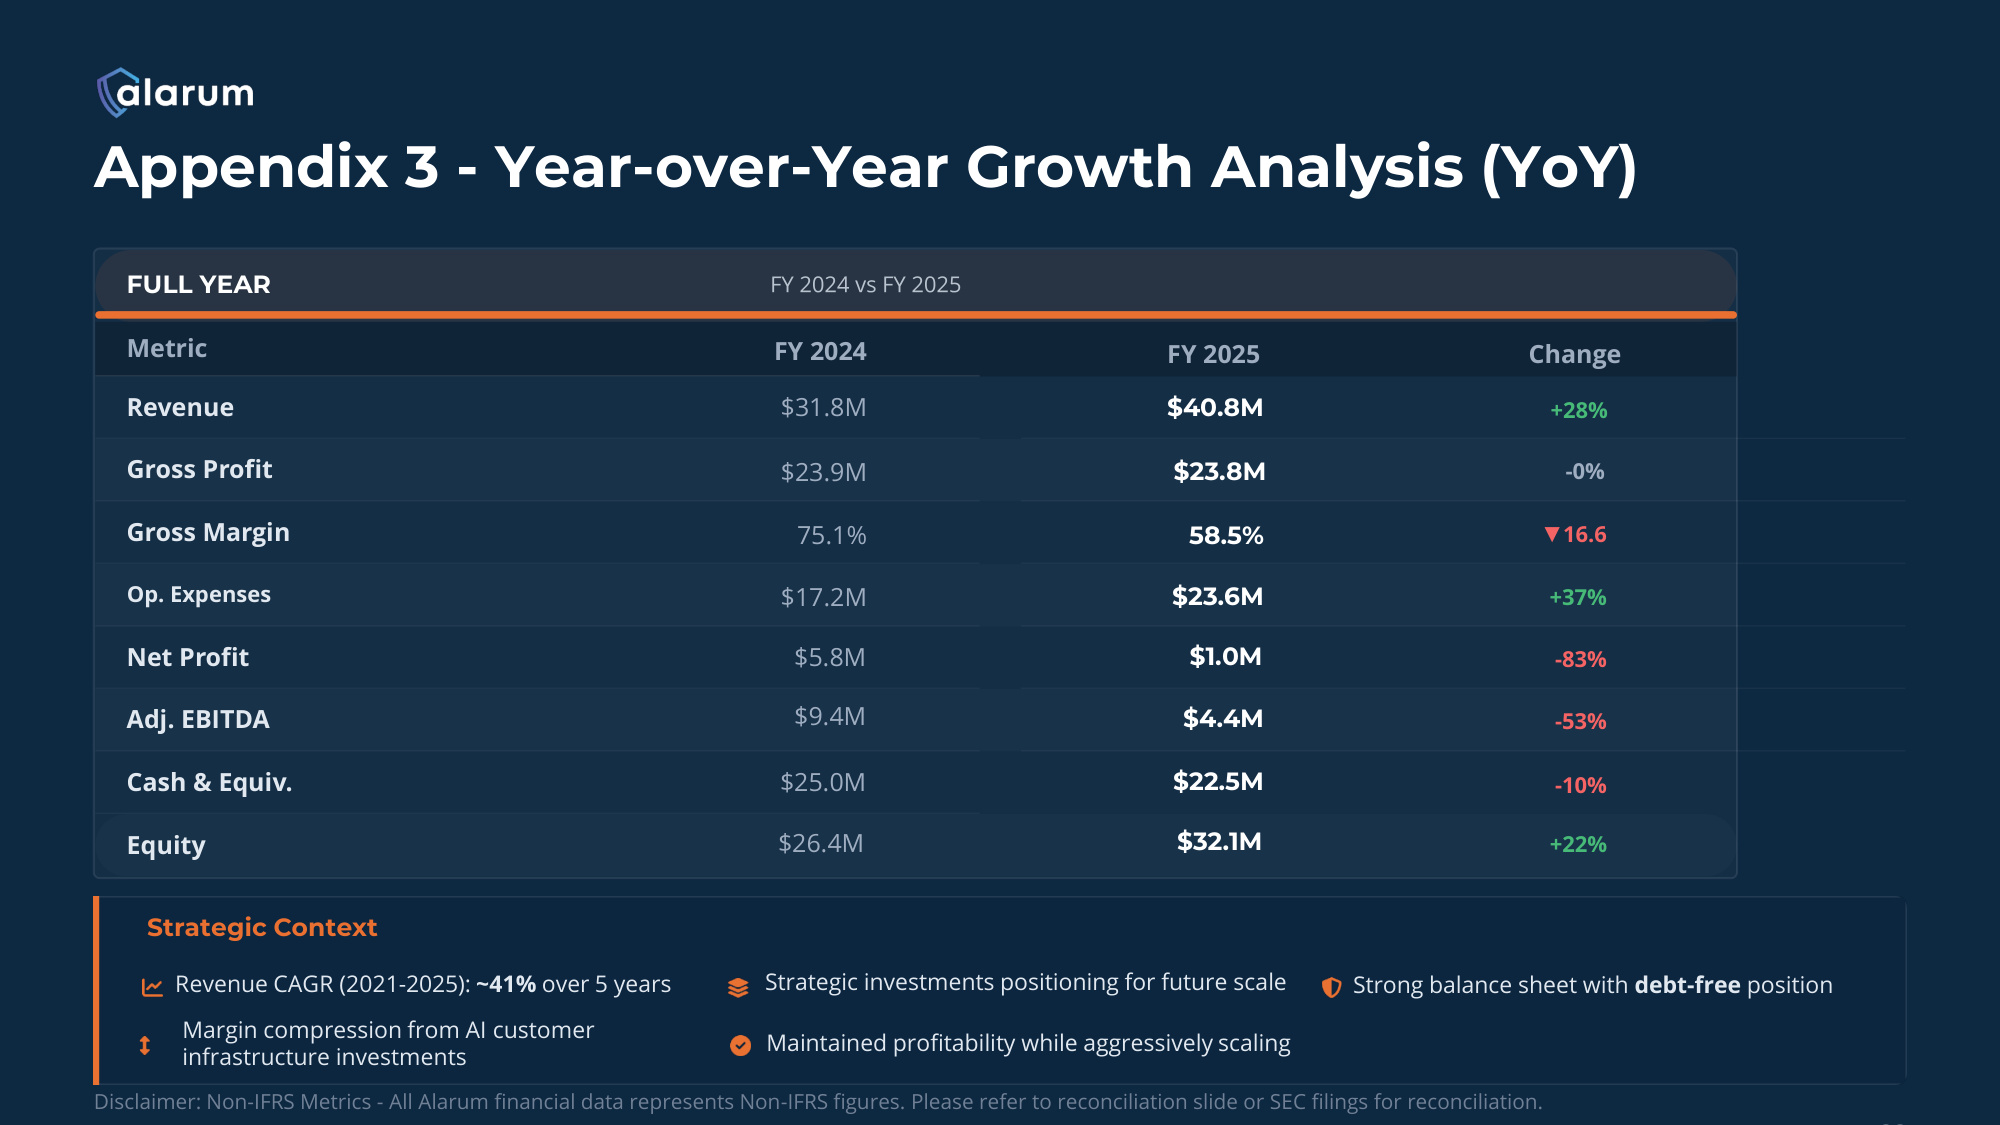
FULL YEAR Metric FY 2024 Revenue $31.8M $40.8M +28% Gross Profit $23.9M $23.8M -0% Gross Margin 75.1% 58.5% ▼16.6 Op. Expenses $17.2M $23.6M +37% Net Profit $5.8M $1.0M -83% Adj. EBITDA $9.4M $4.4M -53% Cash & Equiv. $25.0M $22.5M -10% Equity $26.4M $32.1M +22% Strategic Context Revenue CAGR (2021-2025): ~41% over 5 years Strategic investments positioning for future scale Strong balance sheet with debt-free position Margin compression from AI customer infrastructure investments Maintained profitability while aggressively scaling Appendix 3 - Year-over-Year Growth Analysis (YoY) Disclaimer: Non-IFRS Metrics - All Alarum financial data represents Non-IFRS figures. Please refer to reconciliation slide or SEC filings for reconciliation. FY 2025 Change
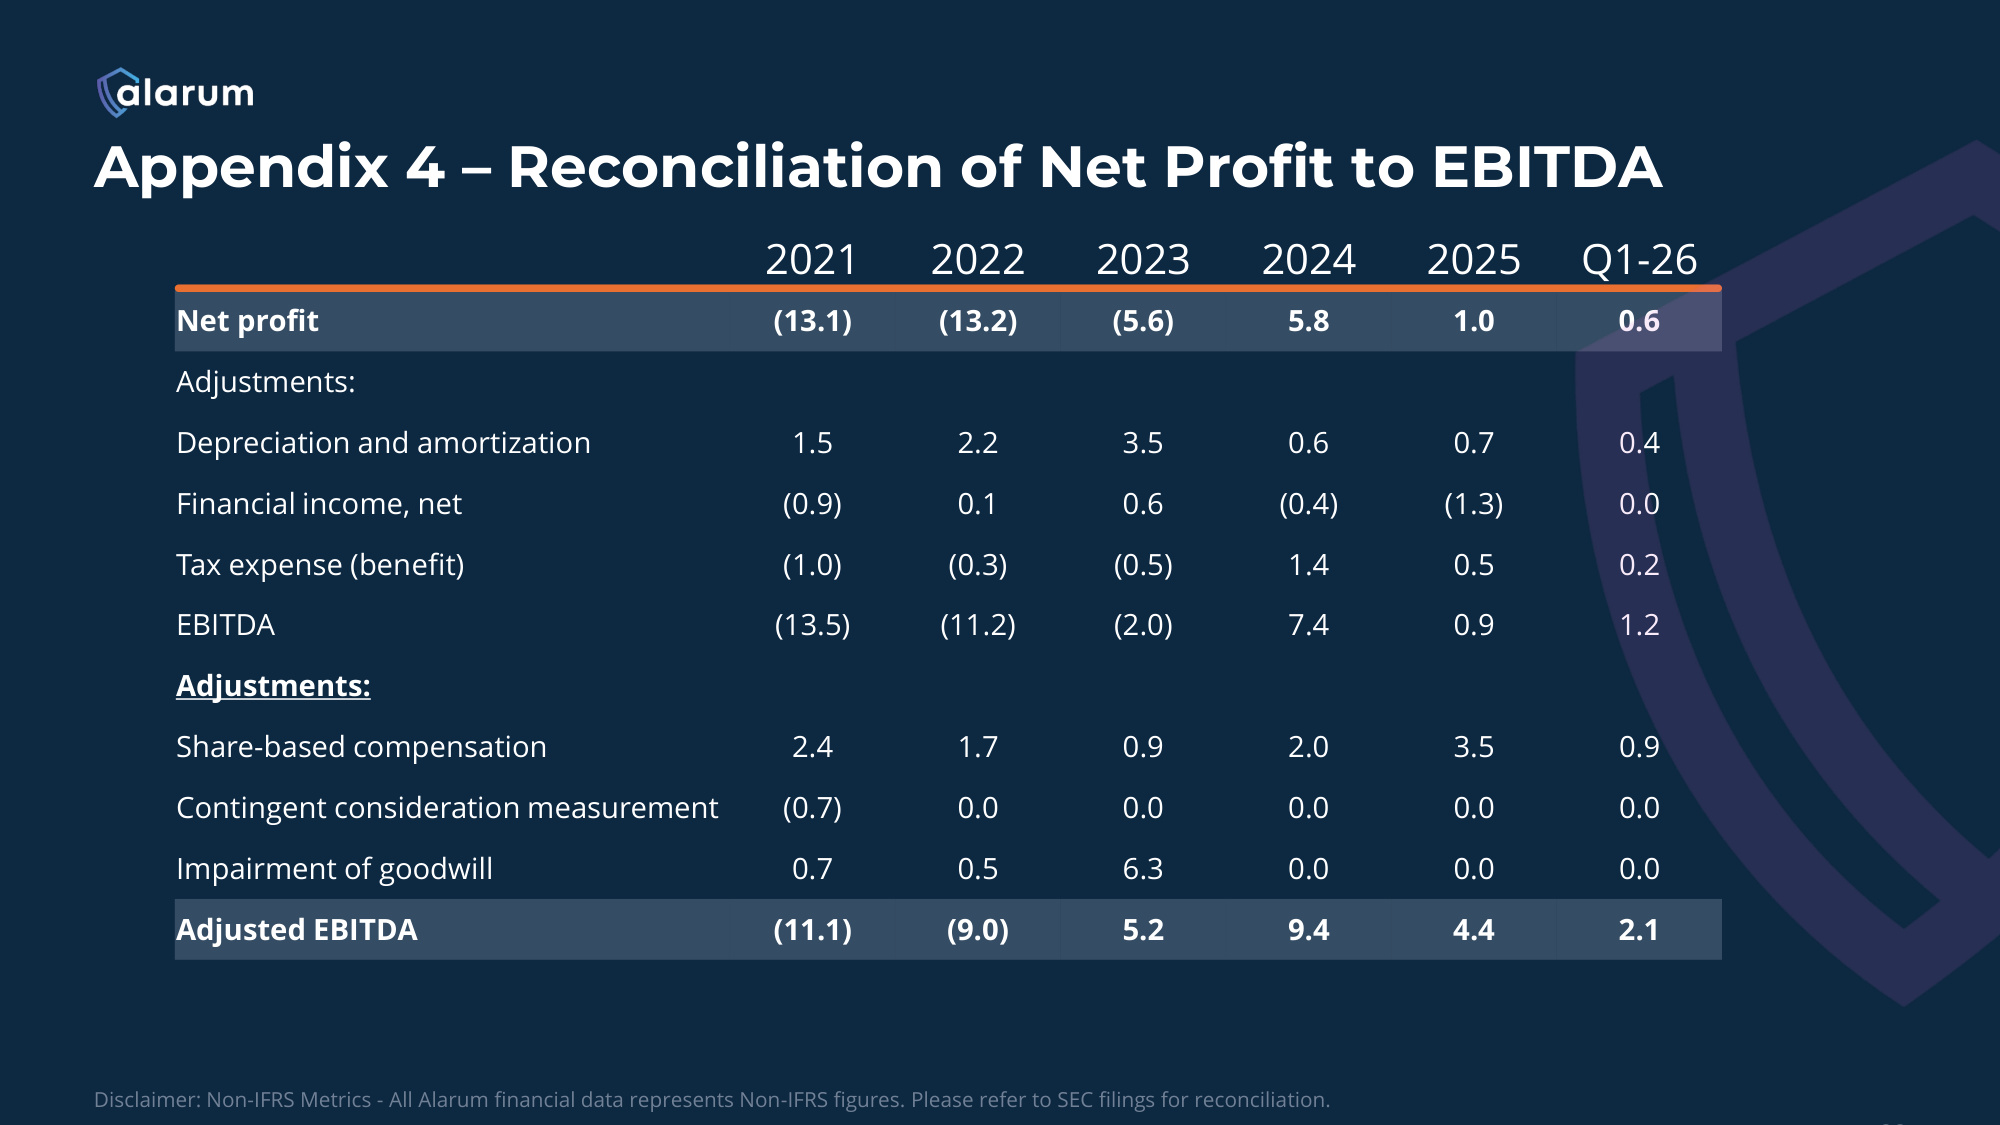
Appendix 4 – Reconciliation of Net Profit to EBITDA Disclaimer: Non-IFRS Metrics - All Alarum financial data represents Non-IFRS figures. Please refer to SEC filings for reconciliation. 2021 2022 2023 2024 2025 Q1-26 Net profit (13.1) (13.2) (5.6) 5.8 1.0 0.6 Adjustments: Depreciation and amortization 1.5 2.2 3.5 0.6 0.7 0.4 Financial income, net (0.9) 0.1 0.6 (0.4) (1.3) 0.0 Tax expense (benefit) (1.0) (0.3) (0.5) 1.4 0.5 0.2 EBITDA (13.5) (11.2) (2.0) 7.4 0.9 1.2 Adjustments: Share-based compensation 2.4 1.7 0.9 2.0 3.5 0.9 Contingent consideration measurement (0.7) 0.0 0.0 0.0 0.0 0.0 Impairment of goodwill 0.7 0.5 6.3 0.0 0.0 0.0 Adjusted EBITDA (11.1) (9.0) 5.2 9.4 4.4 2.1