.2

.2
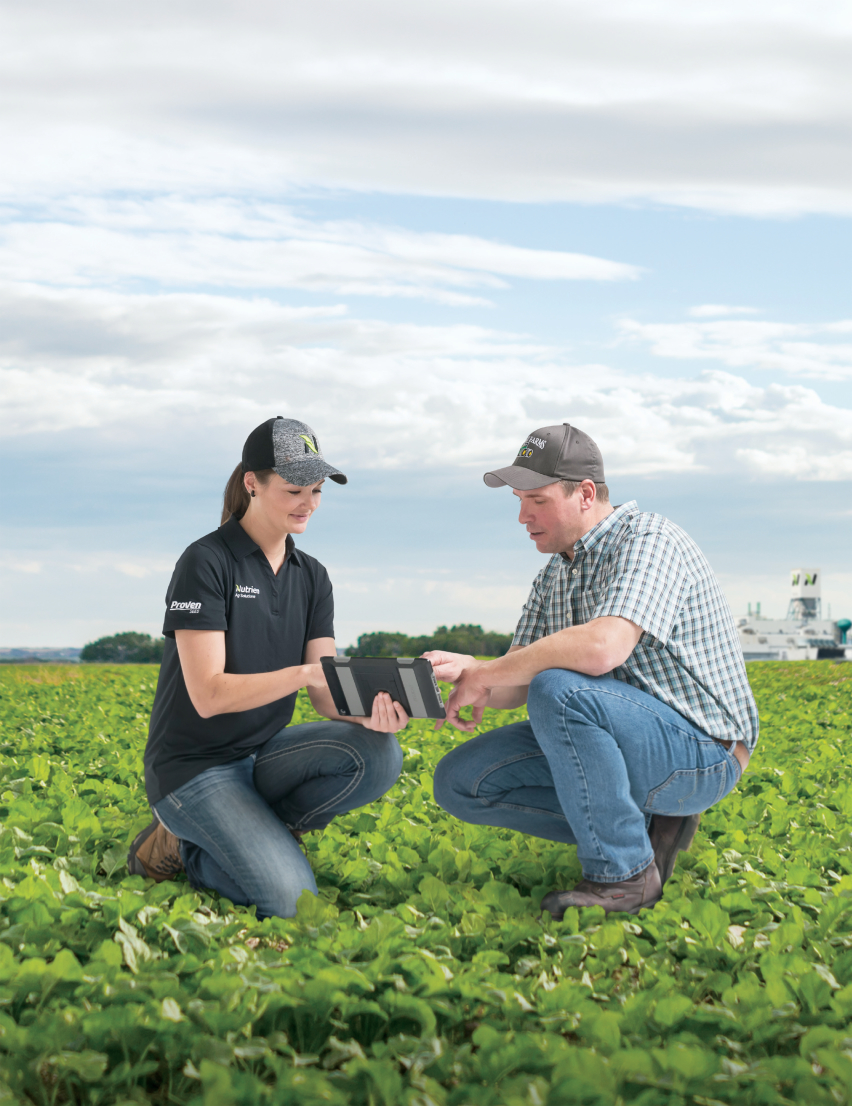
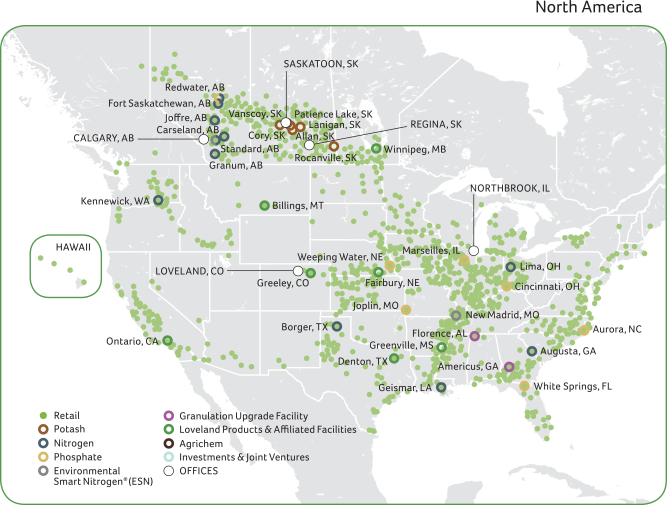
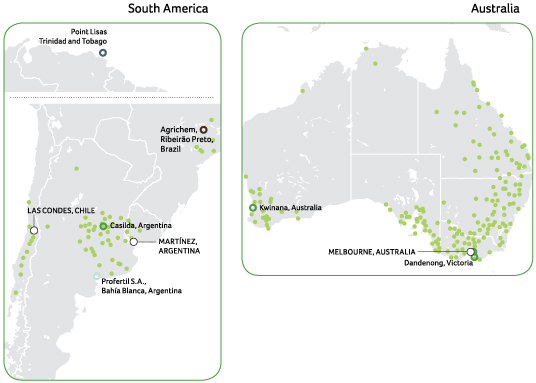
Nutrien’s Global Footprint
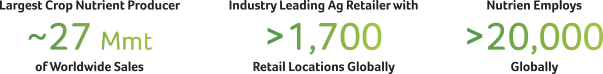
This is Nutrien. A global agriculture company with operations and investments in 14 countries. Our integrated platform combines the world’s premier Ag Retail network with some of the highest quality, lowest cost production assets. With this position, we are able to efficiently supply crop inputs and services to major growing regions of the world.
| NUTRIEN 2018 | 10 | ANNUAL REPORT |
MANAGEMENT'S DISCUSSION AND ANALYSIS
| NUTRIEN 2018 | 11 | ANNUAL REPORT |
Delivering Value
It begins with our people and our portfolio of assets. We have more than 20,000 employees worldwide helping grow our world from the ground up. To enable the global achievement of Nutrien’s strategy, we must attract, develop and engage employees who live our values and principles.
Strategic Road Map
| Basic Beliefs | Strategy and Risk | Governance |
|
Key external and internal factors that inform our strategic choices |
___ > |
Integrated approach that considers risk throughout our strategic planning activities |
___ > |
Process and oversight to ensure we deliver sustained value to all stakeholders | ||||
| Learn more on page 13 | Learn more on pages 14-28 | Learn more on page 29 | ||
| NUTRIEN 2018 | 12 | ANNUAL REPORT |
MANAGEMENT'S DISCUSSION AND ANALYSIS
Basic Beliefs Provide Foundation
for Our Strategic Choices
Our strategic process starts with a view of the core drivers for our business: how these factors will shape the future of our industry and how we are positioned to create value for our stakeholders today and in the future.
Basic Beliefs

|

|

|

|

| ||||||||||||
| Ag markets will remain cyclical with favorable long-term demand drivers. | Innovation and technology development must focus on adding value for the grower. | Integrating production and distribution provides efficiencies and market access. | Leading sustainability practices will create competitive advantages and make a global difference. | Talent acquisition and people development are critical to sustaining long- term success. | ||||||||||||
|
|
|
| ||||||||||||||
| We have a unique opportunity to benefit from recovering agriculture and fertilizer markets and generate superior returns through the cycle. |
We have the resources and relationship with the grower to best develop innovative products and solutions. |
The scale of our production and distribution footprint is unmatched in the ag space, providing the opportunity to generate significant cost savings across our supply chain. |
Sustainability is integrated across our value chain to reduce our environmental footprint and make a meaningful contribution to society and the economy. |
Fostering our purpose driven culture will create a long-term competitive advantage. | ||||||||||||
| NUTRIEN 2018 | 13 | ANNUAL REPORT |
Our Strategic Approach
Our vision is to be the leading global integrated Ag solutions provider
Our Strategy
How We Compete
|
Build a Unique Relationship with the Grower |
Create the Best Channel to the Customer |
Own Leading Production Assets & Proprietary Offerings |
Our Key Actions
|
Focus on Sustainability & Safety
|
Drive Integration & Optimization |
Strategically Allocate Capital |
Invest in Growth & Innovation |
Engage Employees |
| NUTRIEN 2018 | 14 | ANNUAL REPORT |
MANAGEMENT'S DISCUSSION AND ANALYSIS
Our Strategy = Channel + Content
Our relationship with the grower, channel to the customer, and extensive product and service offering provide Nutrien with very distinct and valuable competitive advantages—this is how we and our customers succeed on a daily basis.
How We Compete
| NUTRIEN 2018 | 15 | ANNUAL REPORT |
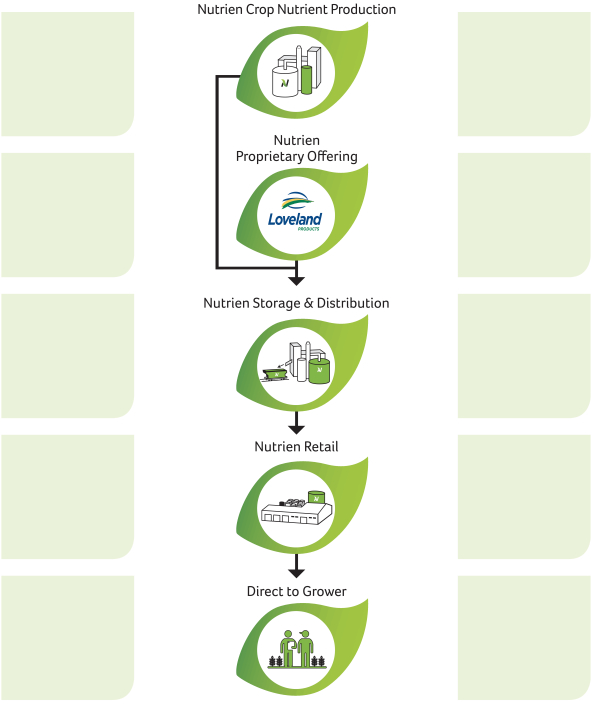
Our Integrated Platform Provides Advantages
We leverage our extensive distribution system to efficiently move our crop nutrients and proprietary products to our world-class retail network. Providing products
and solutions direct to the grower strengthens our partnership with our customer.
| NUTRIEN 2018 | 16 | ANNUAL REPORT |
MANAGEMENT'S DISCUSSION AND ANALYSIS
Creating Value through Our Key Actions
Nutrien’s key actions drive each and every employee’s deliverables on a daily basis. We set priorities for each of these areas to ensure we can define and measure our performance. Our strategy and performance are supported by governance oversight and risk management by our leaders and Board of Directors.
is foundational to everything we do
18-19
Drive Integration & Optimization
to unlock potential and improve existing asset base
20-21
Strategically Allocate Capital
to maximize long-term shareholder returns
22-23
to identify and pursue long-term value-enhancing opportunities
24-25
to ensure we can deliver on our priorities
26-27
| NUTRIEN 2018 | 17 | ANNUAL REPORT |

Feeding a growing population is one of the world’s greatest opportunities and one of its greatest challenges. Nutrien is well positioned to make meaningful contributions to many of the United Nations Sustainable Development Goals (SDGs), most notably Goal 2: “End hunger, achieve food security and improved nutrition and promote sustainable agriculture”.
In 2018, we began the development of a new Nutrien sustainability strategy to advance resilient agricultural practices and strengthen sustainable food production. Through innovative solutions, we aim to balance environmental, social and economic factors in our business and across our value chain.
In 2018, we built on the following core foundations:
| NUTRIEN 2018 | 18 | ANNUAL REPORT |
MANAGEMENT'S DISCUSSION AND ANALYSIS

| Sustainability Priorities
|
||||
| • Sustainable Agriculture: Lead the next wave of innovation and sustainability in agriculture. |
• Environmental Footprint: Protect the planet and minimize our environmental impact. |
• Diversity and Inclusion: Champion diversity and inclusive growth in the agriculture industry. |
2018 was a year of stakeholder engagement, process alignment and strategic planning. We are working on targets and initiatives to improve our social, economic and environmental impact. Details, including more about our priorities, will be available in Nutrien’s first sustainability report in 2019.
|
Find out more at nutrien.com/sustainability |
2018 Performance
|
$17M |
0.07 |
0.34 |
>600K | |||
| Invested in Communities |
Total Environmental Incidents Frequency* |
Lost-Time Injury Frequency* |
Students Reached Through Ag Education | |||
* Frequency based for every 200,000 hours worked.
| NUTRIEN 2018 | 19 | ANNUAL REPORT |
Drive Integration & Optimization
Delivering sustained value to all our stakeholders requires a constant focus on being a low-cost supplier to the markets we serve. Integrating and optimizing our extensive production and distribution channel ensures that our customers receive top quality products and services in a reliable and timely manner.
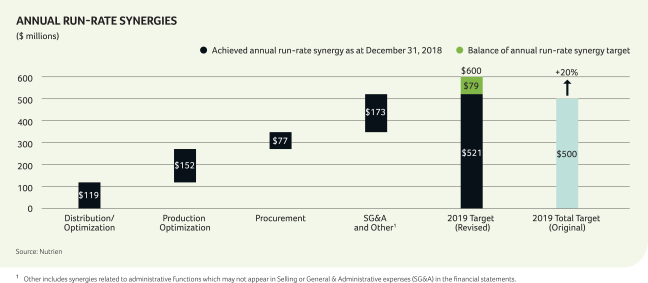
Drive Integration
At the onset of the Merger, we committed to delivering $500 million in annual run-rate synergies by the end of 2019. We were able to accelerate the rate of synergy capture and achieve this target within the first 12 months after the Merger. We also raised our target to $600 million by the end of 2019. The increased synergy target is indicative of the tremendous value that has been created by combining the two legacy companies.
| NUTRIEN 2018 | 20 | ANNUAL REPORT |
MANAGEMENT'S DISCUSSION AND ANALYSIS

| Integration and Optimization Priorities | ||||
| • Realize $600 million run-rate synergy target by the end of 2019 and drive further integration opportunities across the organization in the near and long term. |
• Continue to improve capacity utilization and reduce cash costs across our nutrient production assets. |
• Deliver higher year-over-year normalized comparable store sales and EBITDA margin in our Retail operations. | ||
Optimization
Our focus extends beyond the synergies realized through the Merger. Optimizing our organizational cost structure is also about operational excellence and defining what matters to our bottom line and what we can control. By focusing on these and other factors, Nutrien expects to reduce the cost to produce and sell our products and services, and thereby deliver industry leading results.
2018 Performance
|
$60 |
$72 |
92% |
10% | |||
| Potash Cash Cost per Tonne |
Urea Controllable per Tonne |
Ammonia Operating Rate (excludes Trinidad and Joffre) |
Retail | |||
| NUTRIEN 2018 | 21 | ANNUAL REPORT |
MANAGEMENT'S DISCUSSION AND ANALYSIS

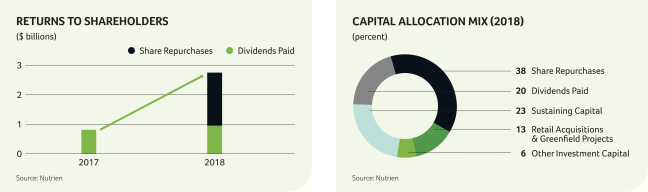
| Capital Allocation Priorities | ||||
| • Continue to invest in Nutrien earnings growth, predominantly in Retail. |
• Provide a stable and growing dividend in a targeted range of 40-60 percent of free cash flow after sustaining capital through the cycle. |
• Maintain investment-grade credit rating. | ||
2018 Performance
|
58% |
$2.8B |
1.6x |
$1.1B | |||
| of Capital Deployment to Dividends and Share Repurchases |
in Dividends and Share Repurchases |
Adjusted Net Debt / Adjusted EBITDA Ratio |
in Sustaining Capital | |||
| NUTRIEN 2018 | 23 | ANNUAL REPORT |

Growth and Innovation Priorities
| • Continue to grow US and Australian Retail footprint and develop Retail network in Brazil. |
• Enhance our digital omni-channel offering and our proprietary crop input product technologies.
|
• Evaluate nitrogen brownfield projects in North America. |
Investing in growth and innovation is intended to support not only continual earnings progression, but the long-term viability of our company and benefit all our stakeholders. We remain committed to prudently identifying and pursuing long-term, value-enhancing opportunities while executing on them in a timely manner.
Growth
| NUTRIEN 2018 | 24 | ANNUAL REPORT |
MANAGEMENT'S DISCUSSION AND ANALYSIS

Innovation
2018 Performance
|
~$400M |
AGRICHEM |
120 |
>50% | |||||||||
| of Expected Annual Revenue Acquired
(related to purchased retail locations) |
Crop Protection Acquisition in Brazil |
New Product Launches and Registrations | of Customer Sales Linked to | |||||||||
| NUTRIEN 2018 | 25 | ANNUAL REPORT |
Nutrien’s People Strategy is to attract, develop and engage skilled employees who live our values and principles. In 2018, we focused on establishing our foundational people program to enable the continued growth of the business and infuse Nutrien’s purpose driven culture into the organization.
| NUTRIEN 2018 | 26 | ANNUAL REPORT |
MANAGEMENT'S DISCUSSION AND ANALYSIS

Employee Engagement Priorities
| • Achieve progress toward our diversity priority of increasing the representation of women in senior leadership to 20 percent or more by 2022.
|
• Become more representative of our local markets in our employment of protected groups and visible minorities. |
• Maintain at least 92 percent acceptance rate of all Nutrien employment offers, increasing to 95 percent acceptance by 2023. |
• Maintain an annual voluntary resignation rate, globally, below 9.5 percent. |
• By 2023, achieve an employee engagement survey score of no less than 75 percent. |
Our Purpose

2018 Performance
|
17%
of Senior Leaders are Women |
92%
Acceptance Rate of all Nutrien Employment Offers |
<1.5%
Voluntary Resignation Rate of Senior Leaders |
85%
of North American Senior Leaders Trained in Leading | |||
| NUTRIEN 2018 | 27 | ANNUAL REPORT |
Our Integrated Approach to Strategy & Risk
Enterprise Risk Management at Nutrien is integrated into our strategic and business planning activities, with a focus on managing our key business risks and facilitating informed risk taking. By fostering a risk-aware culture in decision making at all levels of the Company, Nutrien is positioned to better manage risk and identify opportunities to enhance value.

| NUTRIEN 2018 | 28 | ANNUAL REPORT |
MANAGEMENT'S DISCUSSION AND ANALYSIS
Corporate governance at Nutrien is key to long-term success and ensuring that our basic beliefs, strategy and enterprise risk management, are aligned and carried out with a view to acting in the best interests of all our stakeholders and are consistent with our core values. Our Board of Directors is comprised of directors with a vast array of relevant experience and education, skills and leadership that is applied in the strategic decision-making process.

| NUTRIEN 2018 | 29 | ANNUAL REPORT |
Operating Segment Performance & Outlook
We report our results in four operating segments:
Retail, Potash, Nitrogen and Phosphate and Sulfate.
| • | Our reporting structure reflects how we manage our business. |
| • | EBITDA is the primary profit measure used to evaluate performance and allocate resources in all operating segments. |
| • | Net sales (sales revenues less freight, transportation and distribution expenses) is the primary revenue measure used in planning and forecasting in the Potash, Nitrogen and Phosphate and Sulfate operating segments. |
| 31-37 | Retail | |
| 38-43 | Potash | |
| 44-49 | Nitrogen | |
| 50-55 | Phosphate & Sulfate | |

Retail Operating Environment
Overview
Competitive Landscape
Key Success Factors
| NUTRIEN 2018 | 32 | ANNUAL REPORT |
MANAGEMENT'S DISCUSSION AND ANALYSIS
Our Business
| Products & Services | Purpose for the Grower | |||||
| Crop Nutrients | Crop nutrients are the essential fertilizers of potash, nitrogen, phosphate, sulfates and micronutrients that allow plants to grow and provide meaningful nutrition to our planet. | |||||
| Crop Protection Products | Crop protection products are a broad spectrum of herbicides, fungicides, insecticides and adjuvants products that help growers minimize yield losses from weeds, diseases and insects. | |||||
| Seed | We provide the seed and seed-related information and analysis our customers require. We sell seed brands from top global suppliers as well as our proprietary seed products that include licensed traits best suited for the grower’s specific geography. |
|||||
| Merchandise | Merchandise includes a variety of products in Australia and Canada, including most notably fencing, feed supplements, livestock-related animal health products, storage and irrigation equipment. It also includes the fuel and equipment businesses in Canada. | |||||
| Service and Other |
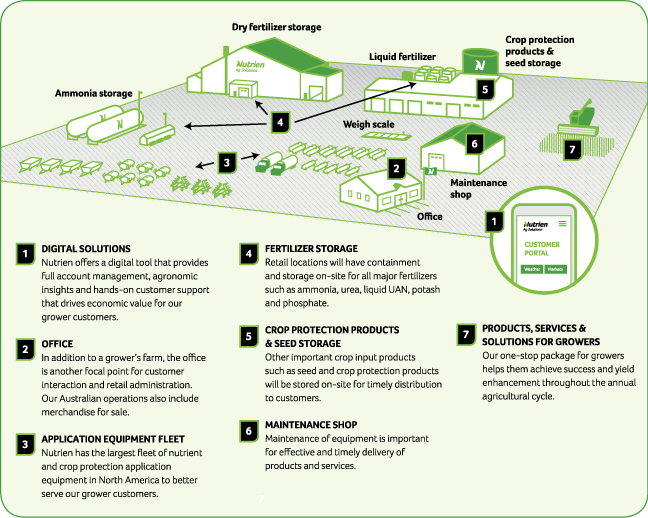
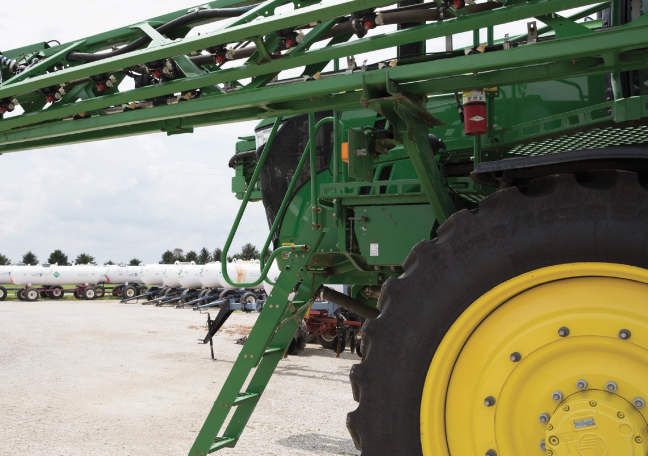
This includes services, such as product application, soil and leaf testing, crop scouting and precision agriculture services under our ECHELON® platform and financial services. We maintain a large fleet of application equipment and other rolling stock to ensure timely and optimal applications of both nutrients and crop protection products in a safe and effective manner for our growers.
|
|||||

| NUTRIEN 2018 | 33 | ANNUAL REPORT |
Standard Retail Facility Operations
| NUTRIEN 2018 | 34 | ANNUAL REPORT |
MANAGEMENT'S DISCUSSION AND ANALYSIS
| NUTRIEN 2018 | 35 | ANNUAL REPORT |
Retail Financial Performance
| Dollars (millions) | Gross Margin Dollars (millions) | Gross Margin (percentage) | ||||||||||||||||||||||||||||||||||||||||||||||||||||||||||||||||||
| Nutrien | Nutrien | % | PCS | % | Nutrien | Nutrien | % | PCS | % | Nutrien | Nutrien | PCS | ||||||||||||||||||||||||||||||||||||||||||||||||||||||||
| 2018 | 2017 | Change | 2017 | Change | 2018 | 2017 | Change | 2017 | Change | 2018 | 2017 | 2017 | ||||||||||||||||||||||||||||||||||||||||||||||||||||||||
| Sales |
||||||||||||||||||||||||||||||||||||||||||||||||||||||||||||||||||||
| Crop nutrients 1,2 |
$ | 4,577 | $ | 4,121 | 11 | $ | – | n/m | $ | 923 | $ | 848 | 9 | $ | – | n/m | 20 | 21 | – | |||||||||||||||||||||||||||||||||||||||||||||||||
| Crop protection products |
4,862 | 4,937 | (2 | ) | – | n/m | 1,155 | 1,185 | (3 | ) | – | n/m | 24 | 24 | – | |||||||||||||||||||||||||||||||||||||||||||||||||||||
| Seed |
1,687 | 1,628 | 4 | – | n/m | 333 | 325 | 2 | – | n/m | 20 | 20 | – | |||||||||||||||||||||||||||||||||||||||||||||||||||||||
| Merchandise |
734 | 683 | 7 | – | n/m | 103 | 106 | (3 | ) | – | n/m | 14 | 16 | – | ||||||||||||||||||||||||||||||||||||||||||||||||||||||
| Services and other |
810 | 734 | 10 | – | n/m | 521 | 482 | 8 | – | n/m | 64 | 66 | – | |||||||||||||||||||||||||||||||||||||||||||||||||||||||
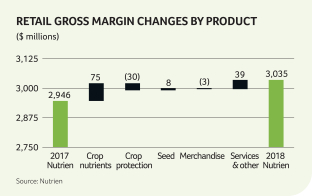
| 12,670 | 12,103 | 5 | – | n/m | $ | 3,035 | $ | 2,946 | 3 | $ | – | n/m | ||||||||||||||||||||||||||||||||||||||||||||||||||||||||
| Cost of goods sold |
(9,635 | ) | (9,157 | ) | 5 | – | n/m |
|
|
| ||||||||||||||||||||||||||||||||||||||||||||||||||||||||||
| Gross margin |
3,035 | 2,946 | 3 | – | n/m | |||||||||||||||||||||||||||||||||||||||||||||||||||||||||||||||
| Expenses 3 |
(2,328 | ) | (2,090 | ) | 11 | – | n/m | |||||||||||||||||||||||||||||||||||||||||||||||||||||||||||||
| EBIT |
707 | 856 | (17 | ) | – | n/m | ||||||||||||||||||||||||||||||||||||||||||||||||||||||||||||||
| Depreciation and amortization |
499 | 289 | 73 | – | n/m | |||||||||||||||||||||||||||||||||||||||||||||||||||||||||||||||
| EBITDA |
$ | 1,206 | $ | 1,145 | 5 | $ | – | n/m | ||||||||||||||||||||||||||||||||||||||||||||||||||||||||||||
|
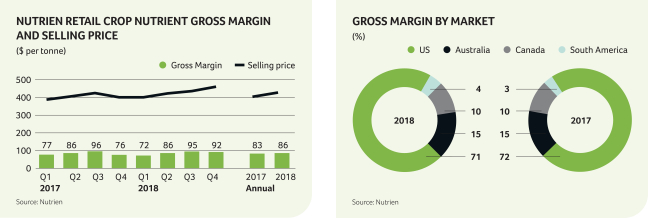
1 Sales tonnes were 10,689,000 tonnes (2017 (Nutrien) – 10,202,000 tonnes), average per tonne prices were $428 (2017 (Nutrien) – $404) and average margin per tonne was $86 (2017 (Nutrien) – $83). 2 Includes intersegment sales. See note 4 to the financial statements. 3 Includes selling expenses of $2,303 million (2017 (Nutrien) – $2,007 million). |
| |||||||||||||||||||||||||||||||||||||||||||||||||||||||||||||||||||
The most significant contributors to the change in EBITDA were as follows (direction of arrows refers to impact on EBITDA and ● means no impact):
| 2018 vs 2017 (Nutrien) | 2018 vs 2017 (PotashCorp) | |||||
|
Sales volumes |

|
Crop nutrient volumes were up across all geographic locations with much of the increase coming from Australia and North America acquisitions. | PotashCorp did not have Retail operations prior to the Merger. | |||
|
|
Crop protection volumes decreased mainly due to adverse weather in North America and Australia. | |||||
|
|
Strong cotton seed volumes in the US more than offset lower seed volumes in Australia caused by dry weather. |
|||||
|
|
Merchandise sales increased in Canada primarily due to higher fuel sales and in Australia primarily due to increased animal health volumes. |
|||||
|
|
Services and other sales increased primarily due to higher livestock sales and wool commissions in Australia.
|
|||||
| Sales prices |
|
Crop nutrients prices were higher in all geographic locations consistent with higher global benchmark prices. | ||||
| Gross margin |
|
Crop nutrient gross margin was higher primarily due to increased volumes in all geographic locations. Gross margin percentage was flat due to the increase in selling prices being offset by rising costs. | ||||
| Selling expenses |
|
Expenses were up due to higher depreciation and amortization discussed below and increased payroll from acquisitions. | ||||
| Depreciation and amortization |
● |
Expense was higher primarily due to the PPA adjustments as a result of the Merger and from recently acquired businesses. |
| NUTRIEN 2018 | 36 | ANNUAL REPORT |
MANAGEMENT'S DISCUSSION AND ANALYSIS
SELECTED RETAIL FINANCIAL PERFORMANCE MEASURES
| Nutrien 2018 |
Nutrien 2017 1 |
% Change |
PCS 2017 | |||||||||||||||||||
| Comparable store sales |
1 | % | 0 | % | n/m | n/a | ||||||||||||||||
| Normalized comparable store sales |
(1 | %) | 2 | % | n/m | n/a | ||||||||||||||||
| Average working capital to sales |
21 | % | 17 | % | 26 | n/a | ||||||||||||||||
| Cash operating coverage ratio |
59 | % | 60 | % | (2 | ) | n/a | |||||||||||||||
| 1 | 2017 average working capital to sales and cash operating coverage ratio are from Agrium’s 2017 Annual Report. |
n/a = not available
Normalized comparable store sales decreased due primarily to US and Australia weather-related impacts to fertilizer and crop protection sales volumes more than offsetting sales volume growth in Canada and South America.
| NUTRIEN 2018 | 37 | ANNUAL REPORT |
MANAGEMENT'S DISCUSSION AND ANALYSIS

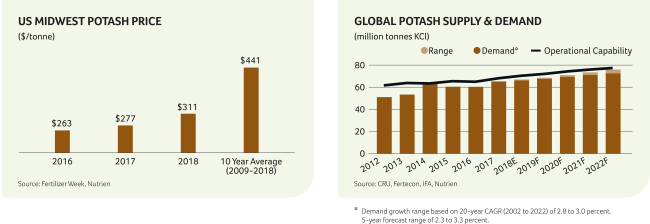
Potash Operating Environment
Overview
Competitive Landscape
Key Success Factors
| NUTRIEN 2018 | 39 | ANNUAL REPORT |
Our Business
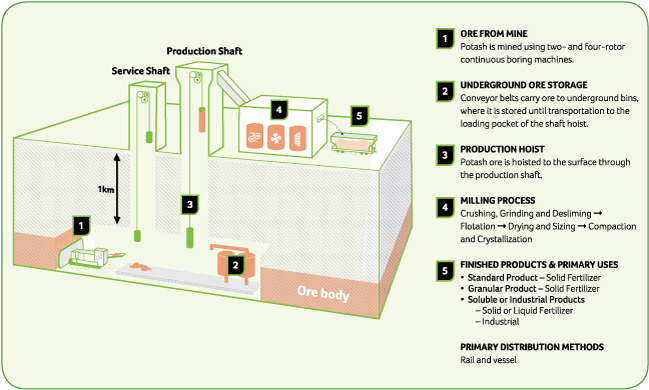
Potash Production Process
| NUTRIEN 2018 | 40 | ANNUAL REPORT |
MANAGEMENT'S DISCUSSION AND ANALYSIS
| NUTRIEN 2018 | 41 | ANNUAL REPORT |
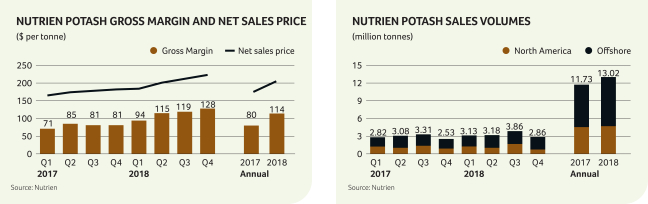
Potash Financial Performance
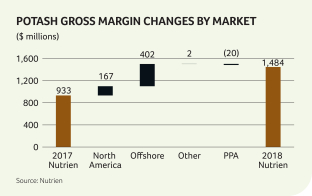
The most significant contributors to the change in EBITDA were as follows (direction of arrows refers to impact on EBITDA and ● means no impact):
| 2018 vs 2017 (Nutrien) | 2018 vs 2017 (PotashCorp) | |||||||
| Volumes |
|
Offshore volumes were higher due to increased demand and a higher Canpotex allocation.
|

|
Offshore volumes were higher due to increased demand and a higher Canpotex allocation.
| ||||
|
|
North America volumes were up primarily due to increased intercompany sales to Retail and lower imports. |
|
North America volumes were up primarily due to lower imports. | |||||
|
|
Volumes were also higher as a result of the Merger, specifically the addition of the Vanscoy Potash mine and intercompany sales to Retail. | |||||||
| Net sales prices
|
|
Selling prices were higher due to increased prices in all major spot markets due to strong demand. |
|
Selling prices were higher due to increased prices in all major spot markets due to strong demand.
| ||||
| Cost per tonne |
|
Costs decreased due to our portfolio optimization and results from our cost reduction strategy more than offsetting increased depreciation related to PPA adjustments as a result of the Merger. |
|
Costs increased due to the addition of Agrium’s operations and higher depreciation on the related PPA adjustments as a result of the Merger. |
| NUTRIEN 2018 | 42 | ANNUAL REPORT |
MANAGEMENT'S DISCUSSION AND ANALYSIS
| 2018 vs 2017 (Nutrien) | 2018 vs 2017 (PotashCorp) | |||||||
| Impairment of property, plant and equipment |
|
A non-cash impairment of property, plant and equipment was recorded as a result of the decision to safely shut down our New Brunswick operations due to the operations no longer being part of our medium or long-term strategic plans. See note 16 to the financial statements. |
|
A non-cash impairment of property, plant and equipment was recorded as a result of the decision to safely shut down our New Brunswick operations due to the operations no longer being part of our medium or long-term strategic plans. See note 16 to the financial statements. | ||||
| Provincial mining and other taxes |
|
Under Saskatchewan provincial legislation, we are subject to resource taxes, including the potash production tax and the resource surcharge. Provincial mining and other taxes increased primarily due to stronger potash prices. |
|
Provincial mining and other taxes increased primarily due to stronger potash prices. | ||||
| Depreciation and amortization |
● |
Expenses were higher due to PPA adjustments as a result of the Merger and increased sales volumes. |
● |
Expenses were higher due to the addition of the Vanscoy Potash mine, increased sales volumes and PPA adjustments as a result of the Merger. |
CANPOTEX SALES BY MARKET
| (percentage of sales volumes) | Nutrien 2018 |
Nutrien 2017 |
% Change |
|||||||||||||||||
| Latin America |
33 | 30 | 10 | |||||||||||||||||
| Other Asian markets 1 |
31 | 33 | (6 | ) | ||||||||||||||||
| China |
18 | 18 | – | |||||||||||||||||
| India |
10 | 12 | (17 | ) | ||||||||||||||||
| Other markets |
8 | 7 | 14 | |||||||||||||||||
| 1 | All Asian markets except China and India. |
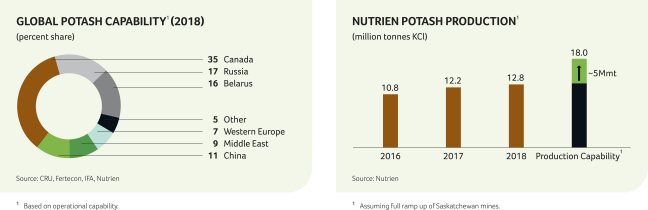
POTASH PRODUCTION
| NUTRIEN 2018 | 43 | ANNUAL REPORT |
MANAGEMENT'S DISCUSSION AND ANALYSIS

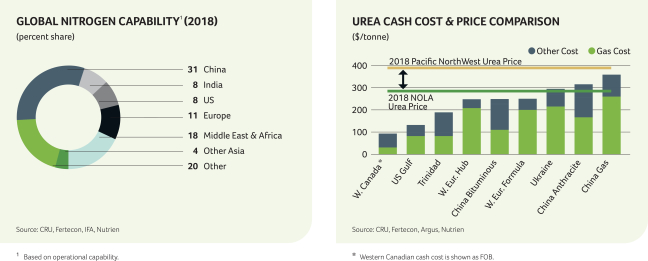
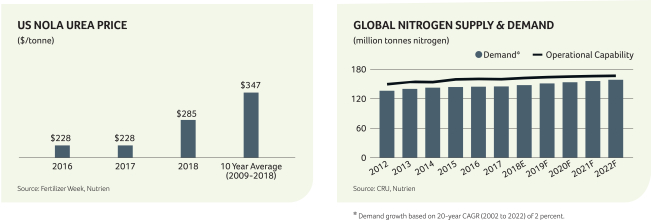
Nitrogen Operating Environment
Overview
Competitive Landscape
Key Success Factors
| NUTRIEN 2018 | 45 | ANNUAL REPORT |
Our Business
Nitrogen Production Process
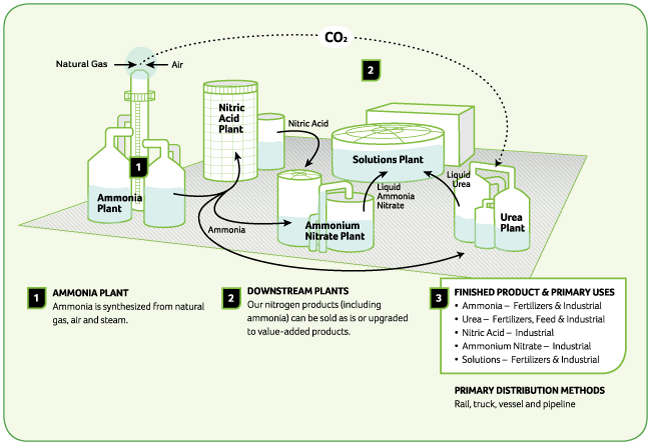
| NUTRIEN 2018 | 46 | ANNUAL REPORT |
MANAGEMENT'S DISCUSSION AND ANALYSIS
| NUTRIEN 2018 | 47 | ANNUAL REPORT |
Nitrogen Financial Performance
| Dollars (millions) | Tonnes (thousands) | Average per Tonne | ||||||||||||||||||||||||||||||||||||||||||||||||||||||||||||||||||||||||
| Nutrien 2018 |
Nutrien 2017 |
% Change |
PCS 2017 |
% Change |
Nutrien 2018 |
Nutrien 2017 |
% Change |
PCS 2017 |
% Change |
Nutrien 2018 |
Nutrien 2017 |
% Change |
PCS 2017 |
% Change |
||||||||||||||||||||||||||||||||||||||||||||||||||||||||||||
| Manufactured product 1 |
||||||||||||||||||||||||||||||||||||||||||||||||||||||||||||||||||||||||||
| Net sales |
||||||||||||||||||||||||||||||||||||||||||||||||||||||||||||||||||||||||||
| Ammonia |
$ | 903 | $ | 911 | (1 | ) | $ | 584 | 55 | 3,330 | 3,404 | (2 | ) | 2,205 | 51 | $ | 271 | $ | 267 | 1 | $ | 265 | 2 | |||||||||||||||||||||||||||||||||||||||||||||||||||
| Urea |
895 | 672 | 33 | 302 | 196 | 3,003 | 2,641 | 14 | 1,166 | 158 | $ | 298 | $ | 254 | 17 | $ | 259 | 15 | ||||||||||||||||||||||||||||||||||||||||||||||||||||||||
| Solutions and nitrates |
644 | 594 | 8 | 421 | 53 | 3,925 | 3,808 | 3 | 2,946 | 33 | $ | 164 | $ | 156 | 5 | $ | 143 | 15 | ||||||||||||||||||||||||||||||||||||||||||||||||||||||||
| 2,442 | 2,177 | 12 | 1,307 | 87 | 10,258 | 9,853 | 4 | 6,317 | 62 | $ | 238 | $ | 221 | 8 | $ | 207 | 15 | |||||||||||||||||||||||||||||||||||||||||||||||||||||||||
| Cost of goods sold |
(1,729 | ) | (1,670 | ) | 4 | (1,066 | ) | 62 | $ | (168 | ) | $ | (170 | ) | (1 | ) | $ | (169 | ) | (1 | ) | |||||||||||||||||||||||||||||||||||||||||||||||||||||
| Gross margin |
713 | 507 | 41 | 241 | 196 | $ | 70 | $ | 51 | 37 | $ | 38 | 84 | |||||||||||||||||||||||||||||||||||||||||||||||||||||||||||||
| Other 2 |
67 | 48 | 40 | 15 | 347 | Depreciation and amortization |
|
$ | 42 | $ | 30 | 40 | $ | 32 | 31 | |||||||||||||||||||||||||||||||||||||||||||||||||||||||||||
| Gross margin |
780 | 555 | 41 | 256 | 205 | Gross margin excluding depreciation and amortization |
|
$ | 112 | $ | 81 | 38 | $ | 70 | 60 | |||||||||||||||||||||||||||||||||||||||||||||||||||||||||||
| Expenses |
(47 | ) | (34 | ) | 38 | (21 | ) | 124 | ||||||||||||||||||||||||||||||||||||||||||||||||||||||||||||||||||
| EBIT |
733 | 521 | 41 | 235 | 212 |
|
| |||||||||||||||||||||||||||||||||||||||||||||||||||||||||||||||||||
| Depreciation and amortization |
429 | 291 | 47 | 203 | 111 | |||||||||||||||||||||||||||||||||||||||||||||||||||||||||||||||||||||
| EBITDA |
$ | 1,162 | $ | 812 | 43 | $ | 438 | 165 | ||||||||||||||||||||||||||||||||||||||||||||||||||||||||||||||||||
| 1 Includes intersegment sales. See note 4 to the financial statements. 2 Includes other nitrogen and purchased products and is comprised of net sales of $417 million (2017 (Nutrien) – $462 million, 2017 (PotashCorp) – $33 million) less cost of goods sold of $350 million (2017 (Nutrien) – $414 million, 2017 (PotashCorp) – $18 million). |
| |||||||||||||||||||||||||||||||||||||||||||||||||||||||||||||||||||||||||
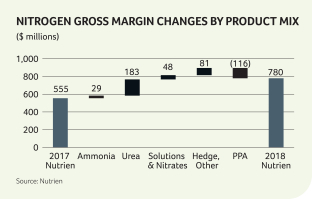
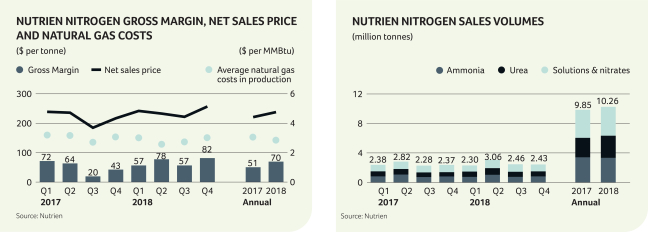
The most significant contributors to the change in EBITDA were as follows (direction of arrows refers to impact on EBITDA and ● means no impact):
| 2018 vs 2017 (Nutrien) | 2018 vs 2017 (PotashCorp) | |||||||
|
Volumes |
|
Total sales volumes were up in 2018 due to higher reliability/utilization rates at our facilities, and higher production of upgraded products such as urea and UAN solutions, partly due to the continued ramp up at our Borger urea facility. |
|
Volumes increased primarily as a result of the Merger. | ||||
|
|
Ammonia sales volumes were lower due primarily to increased production of upgraded nitrogen products, limiting excess ammonia available for sale. | |||||||
|
Net sales prices |
|
Our average price increased for all manufactured product categories, reflecting the impact of higher fertilizer benchmarks supported by tight supply and continued demand growth. |
|
Our average price for all manufactured product categories was higher, reflecting the impact of higher fertilizer benchmarks supported by tight supply and continued demand growth. | ||||
|
|
Realized prices in parts of our industrial portfolio (mainly ammonia and nitrates) were lower given lower natural gas prices in Canada. |
| NUTRIEN 2018 | 48 | ANNUAL REPORT |
MANAGEMENT'S DISCUSSION AND ANALYSIS
| 2018 vs 2017 (Nutrien) | 2018 vs 2017 (PotashCorp) | |||||||
|
Cost per tonne |
|
Costs decreased due to lower natural gas costs, higher utilization and from realized synergies, which more than offset higher depreciation and amortization related to PPA adjustments as a result of the Merger. |
|
Costs decreased due to lower natural gas costs (discussed below) and higher operating rates more than offsetting higher depreciation and amortization related to PPA adjustments as a result of the Merger. | ||||
|
|
Average natural gas costs, including our hedge position, decreased 7 percent, principally as a result of lower AECO index prices and a reduced realized impact from gas derivatives, partly offset by higher gas costs in Trinidad (contract prices indexed primarily to Tampa ammonia prices). |
|
Average natural gas costs, including our hedge position, decreased 17 percent due to the relatively lower-cost gas available at our Alberta facilities acquired in the Merger, partially offset by higher gas costs in Trinidad (contract prices indexed primarily to Tampa ammonia prices). | |||||
| Expenses | ● | There were no significant changes between 2017 and 2018. |
|
Expenses were higher in 2018 due to the addition of Agrium’s operations in the Merger. | ||||
|
Depreciation and amortization |
● |
Expense was higher in 2018 due to higher volumes and the PPA adjustments as a result of the Merger. |
● |
Expense was higher in 2018 due to higher volumes and the PPA adjustments as a result of the Merger. |
| Sales Tonnes (thousands) | Average Net Sales Price per Tonne | |||||||||||||||||||||||||||||||
| Nutrien 2018 |
Nutrien 2017 |
PCS 2017 |
Nutrien 2018 |
Nutrien 2017 |
PCS 2017 |
|||||||||||||||||||||||||||
| Fertilizer |
5,340 | 5,093 | 2,564 | $ | 254 | $ | 226 | $ | 215 | |||||||||||||||||||||||
| Industrial and feed |
4,918 | 4,760 | 3,753 | $ | 220 | $ | 215 | $ | 201 | |||||||||||||||||||||||
| 10,258 | 9,853 | 6,317 | $ | 238 | $ | 221 | $ | 207 | ||||||||||||||||||||||||
NITROGEN PRODUCTION
| Ammonia 1 | Urea 2 | |||||||||||||||||||||||||||||||
| Annual Capacity 3 |
Production | Annual Capacity 3 |
Production | |||||||||||||||||||||||||||||
| (million tonnes product) | Nutrien 2018 | Nutrien 2017 | Nutrien 2018 | Nutrien 2017 | ||||||||||||||||||||||||||||
| Trinidad Nitrogen |
2.2 | 1.88 | 1.94 | 0.7 | 0.58 | 0.55 | ||||||||||||||||||||||||||
| Redwater Nitrogen |
0.9 | 0.88 | 0.80 | 0.7 | 0.73 | 0.53 | ||||||||||||||||||||||||||
| Augusta Nitrogen |
0.8 | 0.72 | 0.60 | 0.5 | 0.52 | 0.45 | ||||||||||||||||||||||||||
| Lima Nitrogen |
0.8 | 0.67 | 0.65 | 0.4 | 0.46 | 0.44 | ||||||||||||||||||||||||||
| Carseland Nitrogen |
0.5 | 0.52 | 0.46 | 0.7 | 0.68 | 0.51 | ||||||||||||||||||||||||||
| Joffre Nitrogen |
0.5 | 0.47 | 0.31 | – | – | – | ||||||||||||||||||||||||||
| Geismar Nitrogen |
0.5 | 0.44 | 0.47 | 0.4 | 0.26 | 0.23 | ||||||||||||||||||||||||||
| Fort Saskatchewan Nitrogen |
0.4 | 0.40 | 0.46 | 0.4 | 0.37 | 0.43 | ||||||||||||||||||||||||||
| Borger Nitrogen |
0.5 | 0.39 | 0.31 | 0.6 | 0.42 | 0.23 | ||||||||||||||||||||||||||
| Total |
7.1 | 6.37 | 6.00 | 4.4 | 4.02 | 3.37 | ||||||||||||||||||||||||||
| 1 | All figures are shown on a gross production basis. |
| 2 | Reflects capacity and production of urea liquor prior to final product upgrade. Urea liquor is used in the production of solid urea, UAN and DEF. |
| 3 | Annual capacity estimates include allowances for normal outages and planned maintenance shutdowns. |
| NUTRIEN 2018 | 49 | ANNUAL REPORT |
MANAGEMENT'S DISCUSSION AND ANALYSIS

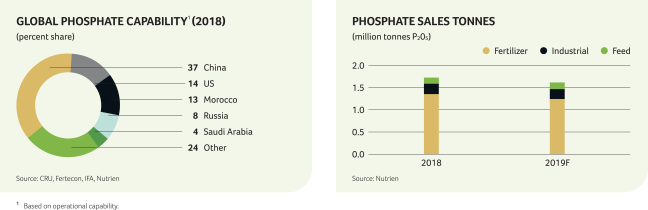
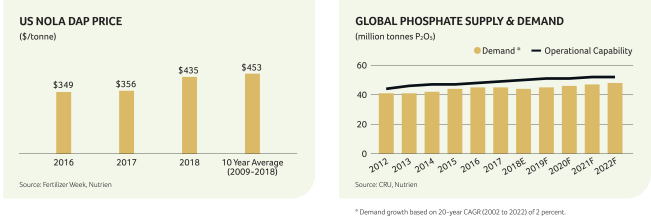
Phosphate Operating Environment
Overview
Competitive Landscape
Key Success Factors
| NUTRIEN 2018 | 51 | ANNUAL REPORT |
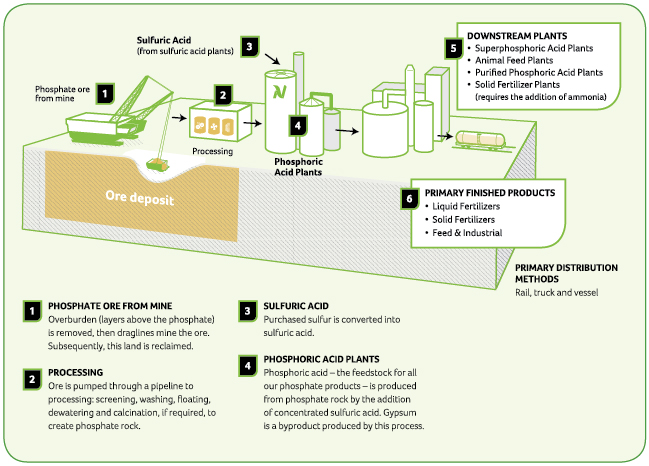
Our Business
Phosphate Production Process
| NUTRIEN 2018 | 52 | ANNUAL REPORT |
MANAGEMENT'S DISCUSSION AND ANALYSIS
| NUTRIEN 2018 | 53 | ANNUAL REPORT |
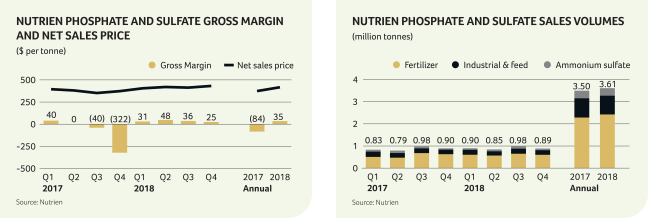
Phosphate & Sulfate Financial Performance
| Dollars (millions) | Tonnes (thousands) | Average per Tonne | ||||||||||||||||||||||||||||||||||||||||||||||||||||||||||||||||||||||||||
| Nutrien 2018 |
Nutrien 2017 |
% Change |
PCS 2017 |
% Change |
Nutrien 2018 |
Nutrien 2017 |
% Change |
PCS 2017 |
% Change |
Nutrien 2018 |
Nutrien 2017 |
% Change |
PCS 2017 |
% Change |
||||||||||||||||||||||||||||||||||||||||||||||||||||||||||||||
| Manufactured product 1 |
||||||||||||||||||||||||||||||||||||||||||||||||||||||||||||||||||||||||||||
| Net sales |
||||||||||||||||||||||||||||||||||||||||||||||||||||||||||||||||||||||||||||
| Fertilizer |
$ | 995 | $ | 800 | 24 | $ | 609 | 63 | 2,425 | 2,285 | 6 | 1,809 | 34 | $ | 410 | $ | 350 | 17 | $ | 337 | 22 | |||||||||||||||||||||||||||||||||||||||||||||||||||||||
| Industrial and feed |
424 | 423 | – | 494 | (14 | ) | 847 | 868 | (2 | ) | 1,002 | (15 | ) | $ | 500 | $ | 487 | 3 | $ | 493 | 1 | |||||||||||||||||||||||||||||||||||||||||||||||||||||||
| Ammonium sulfate |
85 | 81 | 5 | – | n/m | 340 | 345 | (1 | ) | – | n/m | $ | 250 | $ | 235 | 6 | – | n/m | ||||||||||||||||||||||||||||||||||||||||||||||||||||||||||
| 1,504 | 1,304 | 15 | 1,103 | 36 | 3,612 | 3,498 | 3 | 2,811 | 28 | $ | 416 | $ | 373 | 12 | $ | 393 | 6 | |||||||||||||||||||||||||||||||||||||||||||||||||||||||||||
| Cost of goods sold |
(1,377 | ) | (1,601 | ) 2 | (14 | ) | (1,471 | ) | (6 | ) | $ | (381 | ) | $ | (457 | ) | (17 | ) | $ | (523 | ) | (27 | ) | |||||||||||||||||||||||||||||||||||||||||||||||||||||
| Gross margin |
127 | (297 | ) | n/m | (368 | ) | n/m | $ | 35 | $ | (84 | ) | n/m | $ | (130 | ) | n/m | |||||||||||||||||||||||||||||||||||||||||||||||||||||||||||
| Other 3 |
1 | 5 | (80 | ) | 2 | (50 | ) | Depreciation and amortization |
$ | 57 | $ | 68 | (16 | ) | $ | 78 | (27 | ) | ||||||||||||||||||||||||||||||||||||||||||||||||||||||||||
| Gross margin |
128 | (292 | ) | n/m | (366 | ) | n/m |
|
Gross margin excluding
|
|
|
|
|
|
|
|
$ | 92 | $ | (16 | ) | n/m | $ | (52 | ) | n/m | ||||||||||||||||||||||||||||||||||||||||||||||||||
| Expenses |
(26 | ) | (23 | ) | 13 | (14 | ) | 86 | ||||||||||||||||||||||||||||||||||||||||||||||||||||||||||||||||||||
| EBIT |
102 | (315 | ) | n/m | (380 | ) | n/m |
|
|
| ||||||||||||||||||||||||||||||||||||||||||||||||||||||||||||||||||
| Depreciation and amortization |
206 | 240 | (14 | ) | 220 | (6 | ) | |||||||||||||||||||||||||||||||||||||||||||||||||||||||||||||||||||||
| EBITDA |
$ | 308 | $ | (75 | ) | n/m | $ | (160 | ) | n/m | ||||||||||||||||||||||||||||||||||||||||||||||||||||||||||||||||||
| 1 Includes intersegment sales. See note 4 to the financial statements. 2 Includes a non-cash impairment of property, plant and equipment of $305 million. 3 Includes other phosphate and purchased products and is comprised of net sales of $163 million (2017 (Nutrien) – $53 million, 2017 (PotashCorp) – $8 million) less cost of goods sold of $162 million (2017 (Nutrien) – $48 million, 2017 (PotashCorp) – $6 million). n/m = not meaningful |
|
|||||||||||||||||||||||||||||||||||||||||||||||||||||||||||||||||||||||||||
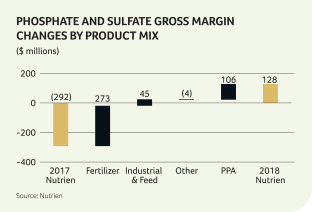
The most significant contributors to the change in EBITDA were as follows (direction of arrows refers to impact on EBITDA and ● means no impact):
| 2018 vs 2017 (Nutrien) | 2018 vs 2017 (PotashCorp) | |||||||||
| Volumes
|
|
Volumes were up due to strong fertilizer demand and increased production levels at our phosphate facilities. |
|
|
|
Volumes increased primarily as a result of the Merger. | ||||
|
|
|
|
Industrial volumes decreased primarily due to the decision to close our small phosphate facility at Geismar. | |||||||
| Net sales prices |
|
Our average realized fertilizer price was up due to strong demand and higher global sulfur benchmark prices. |
|
|
|
Our average realized fertilizer price was up due to strong demand and higher global sulfur benchmark prices. | ||||
| Cost per tonne |
|
Industrial and feed costs were lower in 2018 than in 2017 due to the non-cash impairment of feed assets at Aurora in 2017. |
|
|
|
Industrial and feed costs were lower in 2018 than in 2017 due to the non-cash impairment of feed assets at Aurora in 2017. | ||||
|
|
Fertilizer costs were lower in 2018 than in 2017 due to the non-cash impairment of White Springs assets due to sustained negative performance and the write-off of other assets that were no longer used in 2017, more than offsetting higher sulfur costs in 2018. |
|
|
|
Fertilizer costs were lower in 2018 than in 2017 due to the non-cash impairment of White Springs assets due to sustained negative performance and the write-off of other assets that were no longer used in 2017, more than offsetting higher sulfur costs in 2018. | |||||
| NUTRIEN 2018 | 54 | ANNUAL REPORT |
MANAGEMENT'S DISCUSSION AND ANALYSIS
| 2018 vs 2017 (Nutrien) | 2018 vs 2017 (PotashCorp) | |||||||
| Depreciation and amortization |
● |
Expense was lower in 2018 primarily due to lower depreciable asset balances at our US facilities as a result of the non-cash impairments recorded in the latter half of 2017 and the impact of the PPA adjustments as a result of the Merger. The decrease was partially offset by an increase in depreciation at our Redwater facility due to a change in the assets’ estimated useful lives. |
PHOSPHATE PRODUCTION
| Phosphate Rock | Phosphoric Acid (P2O5) | Liquid Products | Solid Fertilizer Products | |||||||||||||||||||||||||||||||||||||||||||||||||||||||||||||||||||||
| Annual
|
Nutrien Production |
Annual
|
Nutrien Production |
Annual
|
Nutrien Production |
Annual
|
Nutrien Production |
|||||||||||||||||||||||||||||||||||||||||||||||||||||||||||||||||
| (million tonnes) | 2018 | 2017 | 2018 | 2017 | 2018 | 2017 | 2018 | 2017 | ||||||||||||||||||||||||||||||||||||||||||||||||||||||||||||||||
| Aurora Phosphate |
5.4 | 4.03 | 4.78 | 1.2 | 1.08 | 1.03 | 2.7 | 2 | 2.10 | 2.04 | 0.8 | 0.82 | 0.79 | |||||||||||||||||||||||||||||||||||||||||||||||||||||||||||
| White Springs Phosphate |
2.0 | 1 | 1.85 | 1.55 | 0.5 | 0.47 | 0.42 | 0.7 | 3 | 0.62 | 0.57 | 0.8 | 4 | 0.17 | 0.13 | |||||||||||||||||||||||||||||||||||||||||||||||||||||||||
| Redwater Phosphate |
– | – | – | 0.3 | 0.30 | 0.25 | – | – | – | 0.7 | 0.57 | 0.46 | ||||||||||||||||||||||||||||||||||||||||||||||||||||||||||||
| Total |
7.4 | 5.88 | 6.33 | 2.0 | 1.85 | 1.70 | ||||||||||||||||||||||||||||||||||||||||||||||||||||||||||||||||||
| 1 | Revised capacity estimates based on review of mining operations completed in 2017. Prior capacity was 3.6 million tonnes. |
| 2 | A substantial portion is consumed internally in the production of downstream products. The balance is exported to phosphate fertilizer producers or sold domestically to dealers who custom-mix liquid fertilizer. Capacity comprised of 2.0 million tonnes merchant grade acid and 0.7 million tonnes superphosphoric acid. |
| 3 | Represents annual superphosphoric acid capacity. A substantial portion is consumed internally in the production of downstream products. The balance is exported to phosphate fertilizer producers and sold domestically to dealers who custom-mix liquid fertilizer. |
| 4 | The second MAP train was restarted at the end of 2018 which added 0.4 million tonnes of annual capacity. |
In addition to the production above, annual capacity (in millions of tonnes) for phosphate feed, ammonium sulfate and purified acid was 0.7, 0.4 and 0.3, respectively. 2018 production was 0.29, 0.36 and 0.23, respectively, and 2017 production was 0.28, 0.31 and 0.23, respectively.
| NUTRIEN 2018 | 55 | ANNUAL REPORT |
Key Risks

| 1. Long-Term Agriculture Changes
|
Associated Key Actions
| |
| Description |
Risk Management Approach | |
| Farm and industry consolidation, shifting grower demographics, agriculture productivity and development, changes in consumer food preferences, technological innovation and digital business models, and climate change, among other factors, could impact our strategy, demand for our products or financial performance. |
Our integrated platform and diversified earnings portfolio of crop inputs and services are designed to respond and adapt to changes in agriculture. We are proactive in the development and use of new agricultural products and practices and recently launched our integrated digital platform. We believe our teams have strong industry knowledge and direct customer relationships across the value chain, providing unique insights on trends and developments in the agriculture industry. | |
| 2. Shifting Global Dynamics
|
Associated Key Actions
| |
| Description |
Risk Management Approach | |
| Changes in global macro-economic conditions, including trade tariffs and/or other trade restrictions and increased price competition, or a significant change in agriculture production or consumption trends, could lead to a low crop price environment and reduced demand for our products, or increased prices for, or decreased availability of, raw materials necessary to produce our products. | Our diversified portfolio of agricultural products, services and solutions, combined with our global footprint, is designed to enable us to respond to changing economic conditions and dynamics.
We have a favorable cost-to-service position and flexibility to make operational changes across our portfolio to minimize the impact of changing market dynamics. In addition, we engage in market development, education, training and customer relations initiatives to support demand growth. | |
 Sustainability & Safety
 |
 Drive Integration & Optimization
 |
 Strategically Allocate Capital
 |
 Invest in Growth & Innovation
 |
 Engage Employees
 |
| NUTRIEN 2018 | 56 | ANNUAL REPORT |
MANAGEMENT'S DISCUSSION AND ANALYSIS
| 3. Political, Economic and Social Instability
|
Associated Key Actions
| |
| Description |
Risk Management Approach | |
| Political, economic and social instability may affect our business in the jurisdictions in which we operate. Among other things, restrictions on monetary distributions, forced divestitures or changes to or nullification of existing agreements, mining permits or leases could result. Instability in political or regulatory regimes could also affect our ability to transact business and could impact our sales and operating results, our reputation or the value of our assets. | We have an active engagement strategy with governments, regulators and other stakeholders in the countries where we operate or plan to operate, and we assess our capital investments and project decisions against political, country and other related risk factors to ensure our exposure is controlled. Dedicated teams regularly monitor political, economic, and social developments and global trends that may impact us. | |
| 4. Changing Regulations
|
Associated Key Actions
| |
| Description |
Risk Management Approach | |
| Changing laws, regulations and government policies affecting our operations, including health and safety, environmental and climate change pressures, could affect our ability to produce or sell certain products, reduce efficiency, increase our raw material, energy, transportation or compliance costs, or require us to make capital improvements to our operations, all of which could impact our financial performance or reputation. | We have an active engagement strategy with governments and regulators to stay informed of emerging issues and participate in regulatory developments affecting our business. We are also active members in various industry associations that address proposed changes to laws and regulations impacting the agriculture industry. Where regulations are subject to change, we evaluate the potential implications and strive to adapt as necessary. | |
| 5. Cybersecurity Threats
|
Associated Key Actions
| |
| Description |
Risk Management Approach | |
| Cyberattacks or breaches of our systems, including our digital platform or exposure to potential computer viruses, could lead to disruptions to our operations, loss of data, or the unintended disclosure of confidential information or property damage resulting in business disruptions, reputational damage, personal injury, and third-party claims, which could impact our operations, financial performance or reputation. |
We maintain an enhanced focus on cybersecurity, including continuous monitoring of key systems for abnormal and elevated risk behavior in conjunction with our cybersecurity strategy, policy and framework.
Threat and risk assessments are completed for all new information technology systems, and our cybersecurity incident response processes are backstopped by external response capability. | |
| 6. Capital Allocation
|
Associated Key Actions
| |
| Description |
Risk Management Approach | |
| Our inability to deploy capital or to effectively execute on opportunities, whether due to market conditions, lack of options or otherwise, or our decisions to deploy capital in a manner that is inconsistent with strategic priorities, could impact our returns, operations, reputation or access to capital. |
We allocate capital in a disciplined manner that is consistent with our strategic priorities focused on creating the greatest long-term value while ensuring sufficient capital is allocated to safety and asset preservation. We employ a governance process for all capital allocation decisions and incorporate risk-related factors, including execution risk, in those decisions.
See page 23 of this report for more information on our capital allocation priorities. | |
|
Sustainability & Safety |
Drive Integration & Optimization |
Strategically Allocate Capital |
Invest in Growth & Innovation |
Engage Employees |
| NUTRIEN 2018 | 57 | ANNUAL REPORT |
| 7. Talent and Organizational Structure
|
Associated Key Actions
| |
| Description |
Risk Management Approach | |
| An inability to attract, develop, or retain skilled employees, or establish the right organizational structure or culture, could impact productivity, reliability, safety performance, costs or our reputation. |
We strategically map critical talent in anticipation of future needs, seeking to hire talent at the right time and with the right fit for our culture and purpose. Our succession planning proactively identifies critical roles in the organization and links to internal top talent. Our incentive programs are competitive and support our purpose driven culture with performance expectations encouraging inclusion and a desire to add greater diversity to our workforce.
See page 26 of this report for Nutrien’s People Strategy. | |
| 8. Retail Business Model
|
Associated Key Actions
| |
| Description |
Risk Management Approach | |
| Digital innovations, increasing research and development activity and new technology in the agriculture market, among other factors, could alter the competitive environment, which could impact our Retail operations and financial performance. |
Our full-service offering and investment in technology, including our integrated digital platform, is intended to position our Retail business as a leader in agricultural solutions for growers. We are actively involved in the ag technology innovation space through external investments and partnerships, which supports access to early stage technology. Further, we seek to maintain strong relationships with industry partners, positioning Nutrien Ag Solutions as a key part of the ag value chain for both suppliers and growers.
Our dedicated in-house product innovation teams continue to invest in enhancing our digital platform and e-commerce capabilities through focused research and development and acquisition.
See page 25 of this report for more information on innovation. | |
|
Sustainability & Safety |
Drive Integration & Optimization |
Strategically Allocate Capital |
Invest in Growth & Innovation |
Engage Employees |
| NUTRIEN 2018 | 58 | ANNUAL REPORT |
| Dollars (millions) unless otherwise noted | Nutrien 2018 |
Nutrien 2017 |
PCS 2017 |
PCS 2016 |
||||||||||||||||||||
| Sales |
$ | 19,636 | $ | 18,169 | $ | 4,547 | $ | 4,456 | ||||||||||||||||
| Net (loss) earnings from continuing operations |
(31 | ) | 656 | 154 | 199 | |||||||||||||||||||
| Basic net (loss) earnings per share from continuing operations |
(0.05 | ) | n/a | 0.18 | 0.24 | |||||||||||||||||||
| Diluted net (loss) earnings per share from continuing operations |
(0.05 | ) | n/a | 0.18 | 0.24 | |||||||||||||||||||
| Net earnings from continuing and discontinued operations |
3,573 | n/a | 327 | 323 | ||||||||||||||||||||
| Basic net earnings per share from continuing and discontinued operations |
5.72 | n/a | 0.39 | 0.39 | ||||||||||||||||||||
| Diluted net earnings per share from continuing and discontinued operations |
5.72 | n/a | 0.39 | 0.38 | ||||||||||||||||||||
| Total assets |
45,502 | 34,940 | 16,998 | 17,255 | ||||||||||||||||||||
| Total non-current financial liabilities |
7,616 | n/a | 3,746 | 3,763 | ||||||||||||||||||||
| Dividends declared per share |
2.06 | n/a | 0.40 | 0.70 | ||||||||||||||||||||
n/a = Information was not prepared on a combined historical basis.
| 2018 vs 2017 (Nutrien) | 2018 vs 2017 (PotashCorp) | 2017 vs 2016 (PotashCorp) | ||||
| Sales |
Sales increased due to higher potash, urea and phosphate fertilizer prices, as well as higher potash sales volumes and increased retail sales due to recent acquisitions. | Sales increased primarily due to the addition of Agrium’s operations in the Merger. Sales also increased due to Retail acquisitions, higher potash sales volumes and increases in potash, urea and phosphate fertilizer prices. | Sales increased slightly due to increases in potash sales volumes and net sales prices being partially offset by decreases in nitrogen and phosphate net sales prices. | |||
| Earnings and earnings per share from continuing operations | There was a loss from continuing operations in 2018 compared to earnings in 2017 primarily due to a non-cash impairment of property, plant and equipment in the Potash segment of $1,809 million in 2018 more than offsetting the impact of higher gross margin in all operating segments. | There was a loss from continuing operations in 2018 compared to earnings in 2017 primarily due to a non-cash impairment of property, plant and equipment in the Potash segment of $1,809 million in 2018 more than offsetting the impact of the addition of Agrium’s operations in the Merger and higher gross margin in all operating segments. | Net earnings from continuing operations (and related per share amounts) decreased slightly due to increased non-cash impairments of property, plant and equipment and increased Merger and related costs, which were partially offset by an income tax recovery in 2017 compared to income tax expense in 2016. | |||
| Earnings and earnings per share from continuing and discontinued operations | 2017 information was not prepared on a combined historical basis. | Net earnings, and the related per share amounts, were higher in 2018 due to the gains on sale of our investments presented as discontinued operations, the addition of Agrium’s operations in the Merger and higher gross margin in all operating segments more than offsetting the non-cash impairment of property, plant and equipment in the Potash segment. | Net earnings (and related per share amounts) were flat due to the decrease in net earnings from continuing operations being offset by an increase in earnings from discontinued operations consisting primarily of the earnings of equity-accounted investees SQM and APC. | |||
| Assets and non-current financial liabilities | Assets increased primarily due to the fair value adjustments to legacy Agrium assets as a result of the PPA in the Merger. Combined historical non-current financial liability information was not prepared. | Assets and financial liabilities increased primarily due to the addition of Agrium’s assets and liabilities, including related PPA adjustments, acquired in the Merger. | There were no significant changes. |
| NUTRIEN 2018 | 60 | ANNUAL REPORT |
MANAGEMENT'S DISCUSSION AND ANALYSIS
Nutrien 2018 EBITDA Compared to Nutrien 2017 EBITDA
| Dollars (millions) except per share amounts, excluding depreciation and amortization |
EBITDA | Changes in EBITDA |
Earnings per share impact |
|||||||||||||
| EBITDA December 31, 2017 |
$ | 2,412 | ||||||||||||||
| RETAIL |
||||||||||||||||
| Increases in Retail selling expenses |
|
|
|
$ | (86 | ) | $ | (0.10 | ) | |||||||
| Increase in Retail crop nutrient gross margin |
|
|
|
75 | 0.09 | |||||||||||
| POTASH |
||||||||||||||||
| Non-cash impairment of property, plant and equipment in Potash in 2018 |
|
|
|
(1,809 | ) | (2.11 | ) | |||||||||
| Increases in Potash prices |
|
|
|
389 | 0.45 | |||||||||||
| Increases in Potash sales volumes |
|
|
|
110 | 0.13 | |||||||||||
| Decreases in Potash cost of goods sold (COGS) |
|
|
|
109 | 0.13 | |||||||||||
| Increase in Potash provincial mining and other taxes |
|
|
|
(85 | ) | (0.10 | ) | |||||||||
| NITROGEN |
||||||||||||||||
| Increases in Nitrogen prices |
|
|
|
181 | 0.22 | |||||||||||
| Decreases in Nitrogen COGS |
|
|
|
143 | 0.18 | |||||||||||
| PHOSPHATE AND SULFATE |
||||||||||||||||
| Decreases in Phosphate and Sulfate COGS due primarily to the 2017 non-cash impairment 1 |
|
|
|
228 | 0.28 | |||||||||||
| Increases in Phosphate and Sulfate prices |
|
|
|
156 | 0.19 | |||||||||||
| OTHERS |
||||||||||||||||
| Decreases in Others segment other income due primarily to the defined benefit plans curtailment gain |
|
|
|
151 | 0.19 | |||||||||||
| ALL OTHER CHANGES |
||||||||||||||||
| Other changes |
|
|
|
32 | 0.04 | |||||||||||
| EBITDA December 31, 2018 |
$ 2,006 | |||||||||||||||
| 1 | Includes a non-cash impairment of property, plant and equipment of $305 million. See note 16 to the financial statements. |
| NUTRIEN 2018 | 61 | ANNUAL REPORT |
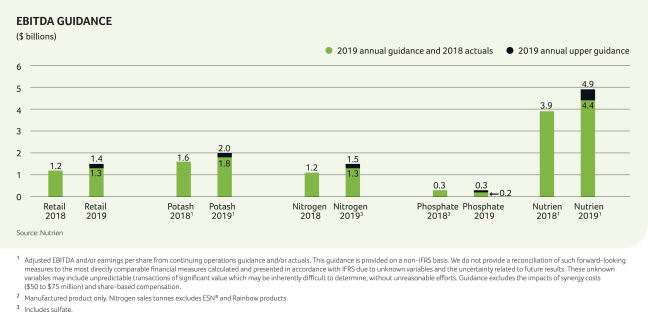
2019 Guidance
| 2019 Guidance Ranges | ||||||||
| Dollars (billions) unless otherwise noted | Low | High | ||||||
| Adjusted net earnings per share 1 |
$ | 2.80 | $ | 3.20 | ||||
| Adjusted EBITDA 1 |
$ | 4.4 | $ | 4.9 | ||||
| Retail EBITDA |
$ | 1.3 | $ | 1.4 | ||||
| Potash EBITDA |
$ | 1.8 | $ | 2.0 | ||||
| Nitrogen EBITDA |
$ | 1.3 | $ | 1.5 | ||||
| Phosphate EBITDA |
$ | 0.2 | $ | 0.3 | ||||
| Potash sales tonnes (millions) 2 |
13.0 | 13.4 | ||||||
| Nitrogen sales tonnes (millions) 2 |
10.6 | 11.0 | ||||||
| Depreciation and amortization |
$ | 1.8 | $ | 1.9 | ||||
| Integration and synergy costs (millions) |
$ | 50 | $ | 75 | ||||
| Effective tax rate on continuing operations |
24% | 26% | ||||||
| Sustaining capital expenditures |
$ | 1.0 | $ | 1.1 | ||||
2019 Sensitivities
| NUTRIEN 2018 | 62 | ANNUAL REPORT |
MANAGEMENT'S DISCUSSION AND ANALYSIS
Others Segment Financial Performance
“Others” is a non-operating segment comprising corporate and administrative functions that provide support and governance to our operating business units. No sales are made in this segment.
| Nutrien | Nutrien | % | PCS 1 | % | ||||||||||||||||||||||||
| Dollars (millions), except percentage amounts | 2018 | 2017 | Change | 2017 | Change | |||||||||||||||||||||||
| Selling expenses |
$ | 22 | $ | 15 | 47 | $ | (2 | ) | n/m | |||||||||||||||||||
| General and administrative expenses |
(400 | ) | (377 | ) | 6 | (170 | ) | 135 | ||||||||||||||||||||
| Provincial mining and other taxes |
(2 | ) | – | n/m | – | n/m | ||||||||||||||||||||||
| Other expenses |
(106 | ) | (256 | ) | (59 | ) | (99 | ) | 7 | |||||||||||||||||||
| Loss before finance costs and income taxes |
(486 | ) | (618 | ) | (21 | ) | (271 | ) | 79 | |||||||||||||||||||
| Depreciation and amortization |
54 | 56 | (4 | ) | 37 | 46 | ||||||||||||||||||||||
| EBITDA |
$ | (432 | ) | $ | (562 | ) | (23 | ) | $ | (234 | ) | 85 | ||||||||||||||||
| 1 | Certain amounts have been reclassified to conform to the current period’s presentation as described in note 33 to the financial statements. |
| n/m | = not meaningful |
| 2018 vs 2017 (Nutrien) | 2018 vs 2017 (PotashCorp) | |||
| EBITDA |
EBITDA increased primarily due to the impact of the defined benefit plans curtailment gain included in other expenses (see note 28 to the financial statements). | EBITDA decreased primarily due to the addition of Agrium’s operations more than offsetting the impact of a defined benefit plans curtailment gain in other expenses (see note 28 to the financial statements). |
Expenses & Income Below Gross Margin
| Nutrien | Nutrien | % | PCS 1 | % | ||||||||||||||||||||||||
| Dollars (millions), except percentage amounts | 2018 | 2017 | Change | 2017 | Change | |||||||||||||||||||||||
| Selling expenses 2 |
$ | (2,337 | ) | $ | (2,043 | ) | 14 | $ | (29 | ) | n/m | |||||||||||||||||
| General and administrative expenses 3 |
(539 | ) | (503 | ) | 7 | (185 | ) | 191 | ||||||||||||||||||||
| Provincial mining and other taxes 4 |
(250 | ) | (159 | ) | 57 | (146 | ) | 71 | ||||||||||||||||||||
| Impairment of property, plant and equipment 5 |
(1,809 | ) | – | n/m | – | n/m | ||||||||||||||||||||||
| Other expenses |
(43 | ) | (255 | ) | (83 | ) | (125 | ) | (66 | ) | ||||||||||||||||||
| Finance costs |
(538 | ) | (515 | ) | 4 | (238 | ) | 126 | ||||||||||||||||||||
| Income tax recovery (expense) |
93 | (20 | ) | n/m | 183 | (49 | ) | |||||||||||||||||||||
| Net earnings from discontinued operations |
3,604 | n/a | n/m | 173 | n/m | |||||||||||||||||||||||
| 1 | Certain amounts have been reclassified to conform to the current period’s presentation as described in note 33 to the financial statements. |
| 2 | Expenses are primarily in the Retail segment. See page 36 for analysis. |
| 3 | Expenses are primarily in the Others segment. See above for analysis. |
| 4 | Expenses are primarily in the Potash segment. See page 43 for analysis. |
| 5 | Impairment was in the Potash segment. See page 43 for analysis. |
| n/m | = not meaningful |
| n/a | = not available |
| NUTRIEN 2018 | 63 | ANNUAL REPORT |
The most significant contributors to the change in expenses and income below gross margin results were as follows:
| 2018 vs 2017 (Nutrien) | 2018 vs 2017 (PotashCorp) | |||
|
Other (Expenses) Income |
Other expenses decreased primarily due to a defined benefit plans curtailment gain (see note 28 to the financial statements) in 2018 (none in 2017) and foreign exchange gains in 2018 (losses in 2017). | Other expenses decreased as a defined benefit plans curtailment gain (see note 28 to the financial statements) in 2018 (none in 2017) more than offset the increase in Merger and related costs. | ||
| There were no significant changes to finance costs. | Finance costs increased primarily as a result of the Merger. See note 8 to the financial statements for a breakdown of these costs. |
|
Finance Costs |
WEIGHTED AVERAGE DEBT BALANCES & RATES
|
|||||||||||||
| Dollars (millions), except percentage amounts | Nutrien 2018 | Nutrien 2017 | PCS 2017 | |||||||||||
| Short-term balance 1 |
$ | 2,933 | $ | 1,525 | $ | 381 | ||||||||
| Short-term rate 1,2 |
3.3% | 2.4% | 1.3% | |||||||||||
| Long-term balance |
$ | 8,175 | $ | 8,641 | $ | 4,229 | ||||||||
| Long-term rate |
4.8% | 4.7% | 4.7% | |||||||||||
| 1 | North American weighted average short-term debt balances were $2,719 (2017 (Nutrien) – $1,345, 2017 (PotashCorp) – $381) and rates were 2.5% (2017 (Nutrien) – 1.5%, 2017 (PotashCorp) – 1.3%). |
| 2 | Rates were higher in 2018 due to increases in benchmark interest rates. |
| Income Tax Recovery (Expense) | A loss from continuing operations was realized for accounting purposes in 2018 compared to earnings from continuing operations in 2017. As a result, a tax recovery was recorded in 2018 compared to a tax expense in 2017. The 2017 tax expense included a net discrete recovery of $178 as a result of a federal income tax rate decrease pursuant to US tax reform legislation.
See note 9 to the financial statements for further information on income tax recovery (expense). |
A loss from continuing operations was realized for accounting purposes in 2018 and 2017. The 2017 tax recovery included a discrete recovery of $187 as a result of a federal income tax rate decrease pursuant to US tax reform legislation.
See note 9 to the financial statements for further information on income tax recovery (expense). |
|
EFFECTIVE TAX RATES & DISCRETE ITEMS
|
| |||||||||||
| Dollars (millions), except percentage amounts | Nutrien 2018 | Nutrien 2017 1 | PCS 2017 1 | |||||||||
| Actual effective tax rate on ordinary earnings |
72% | 29% | (7)% | |||||||||
| Actual effective tax rate including discrete items |
75% | 3% | n/m | |||||||||
| Discrete tax adjustments that impacted the rate |
$ | 4 | $ 176 | $ | 185 | |||||||
| 1 | Rates have been adjusted as a result of our equity interests in SQM, APC and ICL being classified as discontinued in 2017. |
| n/m | = not meaningful |
|
Net Earnings From Discontinued Operations |
Combined historical Nutrien information was not prepared for discontinued operations. | Net earnings from discontinued operations were higher in 2018 primarily due to the gains on sale of our equity investments in SQM and APC, and dividends from SQM and APC, exceeding the equity earnings and dividend income from these investments in 2017 (equity accounting for these investments ceased when the investments were classified as held for sale). This was partially offset by an increase in income tax expense. |
Other Comprehensive (Loss) Income
Other comprehensive (loss) income in 2018 was a $302 million loss compared to $176 million income for 2017 Nutrien and $96 million income for 2017 PotashCorp due primarily to a loss on translation of our net operations in Canada and Australia (gain for 2017 Nutrien) and a fair value loss on our investment in Sinofert (Gain for 2017 Nutrien and 2017 PotashCorp).
| NUTRIEN 2018 | 64 | ANNUAL REPORT |
MANAGEMENT'S DISCUSSION AND ANALYSIS
Balance Sheet Analysis
The most significant contributors to the changes in our balance sheet are analyzed below (direction of arrows refers to increase or decrease in financial condition and ● means no impact). All impacts for balance sheet line items are after the opening balance sheet impacts of the Merger, which includes fair value adjustments in relation to the Merger (if any).
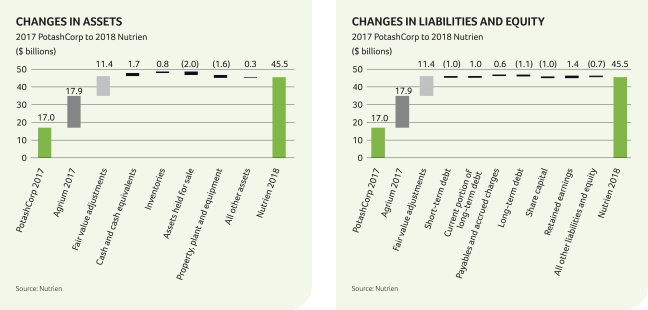
Total assets and liabilities increased primarily as a result of the Merger and fair value adjustments described in note 3 to the financial statements. Total equity increased primarily as a result of the issuance of Nutrien shares in the Merger. The analysis below explains the further changes after these adjustments.
| Assets | Liabilities | |||||||||||||
|
|
For information regarding changes in cash and cash equivalents, refer to the “Sources and Uses of Cash” section on page 67 and the consolidated statements of cash flows in our financial statements. |
|
Short-term debt decreased due to repayments upon receipt of cash proceeds from the sale of our held for sale equity investments.
Current portion of long-term debt increased and long-term debt decreased due to the 6.75 percent notes due January 15, 2019 and 6.5 percent notes due May 15, 2019 becoming due within one year. | |||||||||||
|
|
Inventory increased primarily due to lower than expected Retail crop protection sales caused by adverse weather in North America and earlier than average seasonal inventory purchases in Retail. |
●
| ||||||||||||
|
|
Assets held for sale were lower due to the sale of our equity interests in SQM, APC and ICL as discussed in note 10 to the financial statements. |
|
Payables and accrued charges increased due to a higher dividend payable, accelerated seasonal Retail inventory purchases, higher customer prepayments and the timing of cash payments. | |||||||||||
|
|
Property, plant and equipment were primarily impacted by a non-cash impairment loss relating to our New Brunswick Potash operations as described in note 16 to the financial statements. |
|||||||||||||
| Equity | ||||||||||||||
|
|
Share capital was reduced by share repurchases.
| |||||||||||||
|
|
Retained earnings was higher primarily as a result of net earnings exceeding the impact of share repurchases and dividends declared. | |||||||||||||
As at December 31, 2018, $NIL (December 31, 2017 (Nutrien) – $104 million, (PotashCorp) – $104 million) of our cash and cash equivalents was held in certain foreign subsidiaries that could be subject to taxes upon repatriation.
| NUTRIEN 2018 | 65 | ANNUAL REPORT |
Sources & Uses of Liquidity
Liquidity risk arises from our general funding needs and in the management of our assets, liabilities and capital structure. We manage liquidity risk to maintain sufficient liquid financial resources to fund our financial position and meet our commitments and obligations in a cost-effective manner. Our 2018 significant liquidity sources are listed below along with our expected ongoing primary uses of liquidity. Proceeds from the sale of investments are not expected to be a significant liquidity source in 2019 now that the required Merger-related divestitures have been completed.
| Liquidity sources:
|
Primary uses:
| |
| • Cash from operations |
• Operational expenses | |
| • Investments sale proceeds 1 |
• Seasonal working capital requirements | |
| • Commercial paper issuances |
• Sustaining and investing capital 2 | |
| • Credit facility drawdowns |
• Business acquisitions and investments 3 | |
| • Accounts receivable securitization borrowings |
• Dividends 4 and interest | |
| • Debt capital markets |
• Debt securities principal payments | |
| • Share repurchases 5 |
| 1 | In 2018, we closed sales on our equity interests in SQM, ICL and APC for net proceeds of approximately $5.3 billion. |
| 2 | See graph below for forecast 2019 and actual 2018 capital expenditures to sustain operations and for investing (excluding business acquisitions and investments in equity-accounted investees). Amounts are based on a forecast exchange rate of 1.32 Canadian Dollars per US Dollar. |
| 3 | In 2018, we acquired 53 retail locations in North America and Australia, in addition to companies operating within the digital agriculture, proprietary products and agricultural services businesses (note 3 and note 21 to the financial statements). On February 5, 2019, we announced the planned acquisition of Actagro, LLC, a developer, manufacturer and marketer of environmentally sustainable soil and plant health products and technologies for approximately $340 million. Closing of the transaction is subject to US regulatory approval and is expected to be completed in the first half of 2019. |
| 4 | We target a stable and growing dividend that represents 40 to 60 percent of free cash flow after sustaining capital through the agricultural cycle. In November 2018, we increased our dividend from $0.40 per share to $0.43 per share. |
| 5 | During 2018, 36,332,197 common shares were repurchased for cancellation at a cost of $1,852 million with an average price per share of $50.97. In the fourth quarter of 2018, the Board of Directors approved an increase to the existing share repurchase program, raising the maximum number of shares that can be repurchased by February 22, 2019 to 50,363,686 common shares, representing approximately 8% of our outstanding common shares. On February 20, 2019, the Board of Directors approved the renewal of the share repurchase program of up to 5 percent of our outstanding common shares over a one-year period through a normal course issuer bid. As of February 20, 2019, an additional 5,933,135 common shares were repurchased at a cost of $297 million and an average price per share of $50.10. |
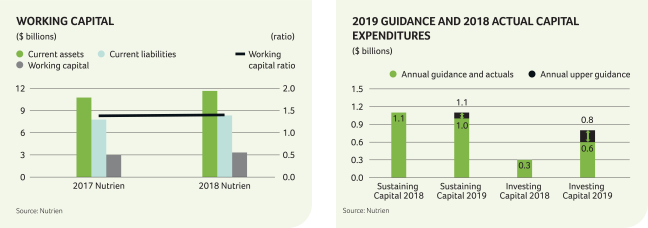
We believe that internally generated cash flow, supplemented by available borrowings under our existing financing sources, if necessary, will be sufficient to meet our anticipated capital expenditures and other cash requirements for at least the next 12 months. At this time, we do not reasonably expect any presently known trend or uncertainty to affect our ability to access our historical sources of liquidity. We had positive working capital of $3.33 billion and a working capital ratio of 1.40 at December 31, 2018 and an adjusted net debt to adjusted EBITDA ratio of 1.64.
| NUTRIEN 2018 | 66 | ANNUAL REPORT |
MANAGEMENT'S DISCUSSION AND ANALYSIS
Sources and Uses of Cash
Our cash flows from operating, investing and financing activities are summarized in the following table:
| Dollars (millions), except percentage amounts | Nutrien 2018 |
Nutrien 2017 |
% Change |
PCS 2017 |
% Change |
|||||||||||||||||||||||
| Cash provided by operating activities |
$ | 2,052 | $ | 2,568 | (20 | ) | $ | 1,225 | 68 | |||||||||||||||||||
| Cash provided by (used in) investing activities |
3,887 | (1,594 | ) | n/m | (652 | ) | n/m | |||||||||||||||||||||
| Cash used in financing activities |
(3,705 | ) | (824 | ) | 350 | (489 | ) | 658 | ||||||||||||||||||||
| Effect of exchange rate changes on cash and cash equivalents |
(36 | ) | (12 | ) | 200 | – | n/m | |||||||||||||||||||||
| Increase in cash and cash equivalents |
$ | 2,198 | $ | 138 | n/m | $ | 84 | n/m | ||||||||||||||||||||
n/m = not meaningful
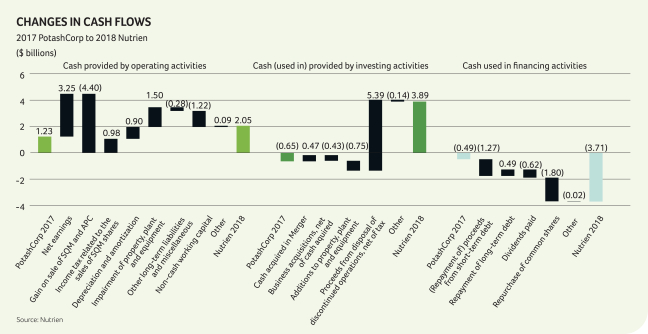
The most significant contributors to the changes in cash flows were as follows:
| 2018 vs 2017 (Nutrien) | 2018 vs 2017 (PotashCorp) | |||
| Cash Provided by Operating Activities was impacted by: | • Higher net earnings in 2018 than in 2017.
• Significant changes in non-cash adjustments were due to the gain on disposal of SQM and APC net of tax in 2018 ($NIL – 2017), higher depreciation and amortization, and higher impairment of property, plant and equipment.
• Non-cash working capital was impacted primarily by cash outflows for payables and accrued charges (inflows in 2017) and inventories (lower outflows in 2017) more than offsetting inflows from prepaid expenses and other current assets (outflows in 2017). |
• Higher net earnings in 2018 than in 2017.
• Significant changes in non-cash adjustments were due to the gain on disposal of SQM and APC net of tax in 2018 ($NIL – 2017), higher depreciation and amortization, and higher impairment of property, plant and equipment.
• Non-cash working capital was impacted primarily by cash outflows for payables and accrued charges (inflows in 2017) and inventories (lower outflows in 2017) more than offsetting inflows from prepaid expenses and other current assets (outflows in 2017).
|
| NUTRIEN 2018 | 67 | ANNUAL REPORT |
| 2018 vs 2017 (Nutrien) | 2018 vs 2017 (PotashCorp) | |||
| Cash Provided by (Used in) Investing Activities was impacted by: | • Higher net cash outlays for business acquisitions (net of cash acquired) in 2018 compared to 2017.
• Cash proceeds received from the disposals of our discontinued operations in SQM, ICL and APC in 2018. |
• Cash acquired in the Merger in 2018.
• Higher net cash outlays for business combinations (net of cash acquired) in 2018 compared to 2017.
• Higher cash additions to property, plant and equipment in 2018 than in 2017 due primarily to the addition of Agrium’s Retail operations in the Merger.
• Cash proceeds received from the disposals of our discontinued operations in SQM, ICL and APC in 2018. | ||
| Cash Used in Financing Activities was impacted by: | • A net repayment of commercial paper in 2018 compared to net proceeds in 2017.
• Lower cash repayments of long-term debt in 2018.
• Cash outlays for share repurchases under the NCIB in 2018 (none in 2017). |
• A net repayment of commercial paper in 2018 compared to net proceeds in 2017.
• Lower cash repayments of long-term debt in 2018.
• Higher cash dividends paid in 2018 than in 2017.
• Cash outlays for share repurchases under the NCIB in 2018 (none in 2017). |
Cash Requirements
The following aggregated information about our contractual obligations and other commitments summarizes certain of our liquidity and capital resource requirements as at December 31, 2018. The information presented in the table below does not include planned (but not legally committed) capital expenditures or potential share repurchases.
| Payments Due by Period | ||||||||||||||||||||||||
| Dollars (millions) at December 31, 2018 | Total | Within 1 Year | 1 to 3 Years | 3 to 5 Years | Over 5 Years | |||||||||||||||||||
| Long-term debt obligations |
Notes 23, 26 | $ | 8,175 | $ | 1,000 | $ | 500 | $ 1,000 | $ | 5,675 | ||||||||||||||
| Estimated interest payments on long-term debt obligations |
Note 26 | 4,543 | 341 | 612 | 576 | 3,014 | ||||||||||||||||||
| Operating leases |
Note 26 | 1,087 | 216 | 316 | 212 | 343 | ||||||||||||||||||
| Purchase commitments1 |
Note 26 | 3,396 | 1,364 | 949 | 945 | 138 | ||||||||||||||||||
| Capital commitments |
Note 26 | 57 | 37 | 18 | 2 | – | ||||||||||||||||||
| Other commitments |
Note 26 | 318 | 114 | 123 | 61 | 20 | ||||||||||||||||||
| Asset retirement obligations and environmental costs 2 |
Note 20 | 3,051 | 206 | 290 | 332 | 2,223 | ||||||||||||||||||
| Other long-term liabilities 3 |
Notes 9, 13, 28 | 3,468 | 119 | 99 | 93 | 3,157 | ||||||||||||||||||
| Total |
$ | 24,095 | $ | 3,397 | $ | 2,907 | $ 3,221 | $ | 14,570 | |||||||||||||||
| 1 | In 2018, we entered into a new long-term natural gas purchase agreement in Trinidad, which will commence January 1, 2019 and is set to expire December 31, 2023. The contract provides for prices that vary primarily with ammonia market prices, and annual escalating floor prices. The commitments included in the table are based on floor prices and minimum purchase quantities. |
| 2 | Commitments associated with our asset retirement obligations are the estimated cash outflows and are expected to occur over the next 480 years for phosphate (with the majority taking place over the next 80 years) and between 50 and 430 years for Potash. Potash cash flows are estimated for the first year of decommissioning for operating sites and for all years for permanently shut down sites. Environmental costs consist of restoration obligations, which are expected to occur through 2048. |
| 3 | Other long-term liabilities consist primarily of pension and other post-retirement benefits, derivative instruments, income taxes and deferred income taxes. Deferred income tax liabilities may vary according to changes in tax laws, tax rates and our operating results. Since it is impractical to determine whether there will be a cash impact in any particular year, all deferred income tax liabilities have been reflected as other long-term liabilities in the Over 5 Years category. |
| NUTRIEN 2018 | 68 | ANNUAL REPORT |
MANAGEMENT'S DISCUSSION AND ANALYSIS
Capital Structure & Management
We manage our capital structure with a focus on maintaining a strong balance sheet, enabling a strong investment-grade credit rating.
Principal Debt Instruments
We use a combination of cash generated from operations and short-term and long-term debt to finance our operations. We have the following short-term debt instruments available:
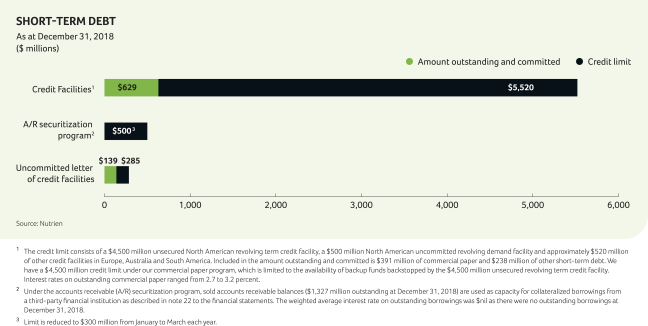
Our long-term debt consists primarily of notes with the following maturities and interest rates:
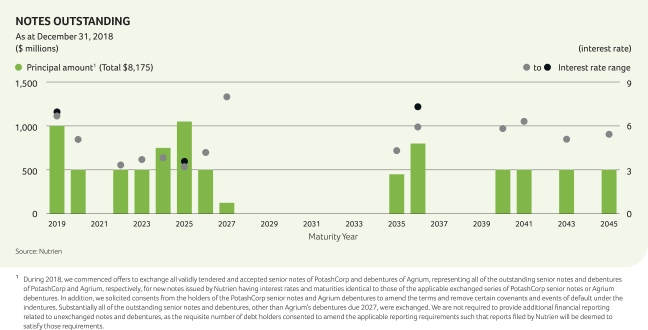
| NUTRIEN 2018 | 69 | ANNUAL REPORT |
DEBT COVENANTS
Our credit facilities have financial tests and other covenants with which we must comply at each quarter-end. Non-compliance with any such covenants could result in accelerated payment of amounts borrowed and termination of lenders’ further funding obligations under the credit facilities. We were in compliance with all covenants as at December 31, 2018.
The accompanying table summarizes the limits and results of certain covenants.
| DEBT COVENANTS AT DECEMBER 31 | Limit | 2018 | ||||||||||
|
Debt-to-capital ratio 1 |
£ | 0.65 | 0.28 | |||||||||
| 1 | This debt covenant is a non-IFRS financial measure and is calculated as the sum of short-term debt, long-term debt (including current portion), finance lease obligations and financial letters of credit divided by the sum of those amounts, non-controlling interests and shareholders’ equity. The ratio of our short-term debt and long-term debt (including current portion) to our short-term debt, long-term debt (including current portion) and shareholders’ equity, which is the nearest comparable IFRS measure, is 0.27. |
CREDIT RATINGS
Our ability to access reasonably priced debt in the capital markets is dependent, in part, on the quality of our credit ratings. We continue to maintain investment-grade credit ratings for our long-term debt. A downgrade of the credit rating of our long-term debt could increase the interest rates applicable to borrowings under our credit facilities.
Commercial paper markets are normally a source of same-day cash for us. Our access to the US commercial paper market primarily depends on maintaining our current short-term credit ratings as well as general conditions in the money markets.
|
Long-Term Debt Rating (Outlook) |
Short-Term Debt Rating |
|||||||
| December 31, 2018 | December 31, 2018 | |||||||
| Moody’s |
Baa2 (stable) | P-2 | ||||||
| S&P |
BBB (stable) | A-2 | ||||||
A security rating is not a recommendation to buy, sell or hold securities. Such ratings may be subject to revision or withdrawal at any time by the respective credit rating agency and each rating should be evaluated independently of any other rating.
OUTSTANDING SHARE DATA
| December 31, 2018 | ||||
| Common shares 1 |
602,630,027 | |||
| Options to purchase common shares |
9,044,237 | |||
| Share-settled performance share units |
65,850 | |||
| 1 | Common shares issued and outstanding as at February 20, 2019. |
For more information on our capital structure and management, see note 25 to the financial statements.
For more information on our short-term debt and long-term debt, see notes 22 and 23 to the financial statements.
| NUTRIEN 2018 | 70 | ANNUAL REPORT |
MANAGEMENT'S DISCUSSION AND ANALYSIS
Off-Balance Sheet Arrangements
Principal off-balance sheet activities include:
| • | Operating leases and long-term contracts containing fixed price and/or volume components (disclosed on page 68 under Cash Requirements). As of January 1, 2019, we adopted the new accounting standard for leases as described in note 32 to the financial statements. We anticipate approximately $1 billion of leases being brought on the balance sheet as “right of use assets” and an equal amount recognized for lease obligations. The expected impact on net earnings is minimal based on leases currently outstanding as the adoption of the standard is expected to result in a decrease in lease expenses of $225 million (COGS of $145 million and selling expenses and general and administrative expenses of $80 million), an increase in depreciation and amortization of $190 million (COGS of $130 million and selling expenses and general and administrative expenses of $60 million) and an increase in finance costs of $30 million. The expected impact on EBITDA is an increase of $225 million. |
| • | Agreement to reimburse losses of Canpotex (see note 31 to the financial statements). |
| • | Issuance of guarantee contracts (see note 27 to the financial statements). |
| • | Certain non-financial derivatives that were entered into and continued to be held for the purpose of the receipt or delivery of a non-financial item in accordance with expected purchase, sale or usage requirements. Other derivatives are included on our balance sheet at fair value. |
We do not reasonably expect any presently known trend or uncertainty to affect our ability to continue using these arrangements.
Related Party Transactions
Refer to note 30 to the financial statements for information on related party transactions.
Market Risks Associated with Financial Instruments
Market risk is the potential for loss from adverse changes in the market value of financial instruments. The level of market risk to which we are exposed varies depending on the composition of our derivative instrument portfolio, as well as current and expected market conditions. See note 13 to the financial statements for information on our financial instruments’ risks and risk management.
Critical Accounting Estimates
We prepare our financial statements in accordance with IFRS, which requires us to make judgments, assumptions and estimates in applying accounting policies. Critical accounting estimates are those which are highly uncertain at the time they are made or where different estimates would be reasonably likely to have a material impact on our financial condition or results of operations.
| Critical Accounting Estimate | Financial Statement Note Reference 1 |
Primary Segment(s) Impacted | ||
|
Business combinations |
Note 3 |
All segments were impacted as all assets acquired, and liabilities assumed, from Agrium in the Merger were required to be measured at fair value. | ||
|
Goodwill impairment |
Note 17 and Note 32 |
The Retail, Potash, Nitrogen and Phosphate and Sulfate segments have goodwill allocated to them that could be subject to impairment. | ||
|
Long-lived asset impairment |
Note 16 and Note 32 |
The Potash and Phosphate and Sulfate segments have had impairments recorded, which could be subject to reversal. Further, all segments could be subject to impairment in the event there is an impairment trigger. | ||
|
Income taxes |
Note 9 and Note 31 |
Income taxes are not allocated to segments, therefore no segments are impacted by these estimates. | ||
|
Asset retirement obligations and accrued environmental costs |
Note 20 |
The Potash and Phosphate and Sulfate segments have these liabilities associated with their mining operations (Others segment has asset retirement obligations associated with non-operational mines) which have a high degree of estimation uncertainty for future costs and estimated timelines. |
| 1 | Included in the notes are a description of the estimate and the methodology for calculating (when applicable) key areas of judgment related to the estimate, changes to the estimate (if any) and sensitivity analysis (when available and would provide material information to investors). |
We have discussed the development, selection and application of our key accounting policies, and the critical accounting estimates and assumptions they involve, with the audit committee of the Board.
Recent Accounting Changes
Refer to note 32 to the financial statements.
| NUTRIEN 2018 | 71 | ANNUAL REPORT |
| Dollars (millions) except as otherwise noted |
Nutrien 2018 | PCS 2017 1 |
||||||||||||||||||||||||||||||||||||||||||
| Q1 | Q2 | Q3 | Q4 | Total | Q1 | Q2 | Q3 | Q4 | Total | |||||||||||||||||||||||||||||||||||
| Sales |
$ | 3,695 | $ | 8,145 | $ | 4,034 | $ | 3,762 | $ | 19,636 | $ | 1,112 | $ | 1,120 | $ | 1,234 | $ | 1,081 | $ | 4,547 | ||||||||||||||||||||||||
| Gross margin |
847 | 2,131 | 1,155 | 1,259 | 5,392 | 273 | 260 | 233 | (72 | ) | 694 | |||||||||||||||||||||||||||||||||
| Earnings (loss) before finance costs and income taxes |
76 | 1,151 | (1,359 | ) | 546 | 414 | 175 | 149 | 100 | (215 | ) | 209 | ||||||||||||||||||||||||||||||||
| Net (loss) earnings from continuing operations |
(1 | ) | 741 | (1,067 | ) | 296 | (31 | ) | 106 | 152 | 16 | (120 | ) | 154 | ||||||||||||||||||||||||||||||
| Net earnings from discontinued operations |
– | 675 | 23 | 2,906 | 3,604 | 43 | 49 | 37 | 44 | 173 | ||||||||||||||||||||||||||||||||||
| Net (loss) earnings 2 |
(1 | ) | 1,416 | (1,044 | ) | 3,202 | 3,573 | 149 | 201 | 53 | (76 | ) | 327 | |||||||||||||||||||||||||||||||
| EBITDA |
487 | 1,507 | (932 | ) | 944 | 2,006 | 347 | 317 | 280 | (43 | ) | 901 | ||||||||||||||||||||||||||||||||
| Basic net (loss) earnings per share from continuing operations |
– | 1.18 | (1.74 | ) | 0.48 | (0.05 | ) | 0.13 | 0.18 | 0.02 | (0.14 | ) | 0.18 | |||||||||||||||||||||||||||||||
| Diluted net (loss) earnings per share from continuing operations |
– | 1.17 | (1.74 | ) | 0.48 | (0.05 | ) | 0.13 | 0.18 | 0.02 | (0.14 | ) | 0.18 | |||||||||||||||||||||||||||||||
| Basic net (loss) earnings per share 2 |
– | 2.25 | (1.70 | ) | 5.23 | 5.72 | 0.18 | 0.24 | 0.06 | (0.09 | ) | 0.39 | ||||||||||||||||||||||||||||||||
| Diluted net (loss) earnings per share 2 |
– | 2.24 | (1.70 | ) | 5.22 | 5.72 | 0.18 | 0.24 | 0.06 | (0.09 | ) | 0.39 | ||||||||||||||||||||||||||||||||
| Other comprehensive (loss) income |
(70 | ) | (105 | ) | 1 | (128 | ) | (302 | ) | 39 | 69 | 42 | (54 | ) | 96 | |||||||||||||||||||||||||||||
| Cash (used in) provided by operating activities |
(340 | ) | 601 | (177 | ) | 1,968 | 2,052 | 223 | 328 | 293 | 381 | 1,225 | ||||||||||||||||||||||||||||||||
| 1 | Certain amounts have been reclassified to conform with Nutrien’s new method of presentation and certain fourth quarter amounts have been reclassified as a result of discontinued operations discussed in note 10 of the financial statements. |
| 2 | From continuing and discontinued operations. |
The agricultural products business is seasonal. Crop input sales are primarily concentrated in the spring and fall application seasons. Crop nutrient inventories are normally accumulated leading up to each application season. Our cash collections generally occur after the application season is complete, and our customer prepayments are concentrated in December and January. Feed and industrial sales are more evenly distributed throughout the year. Beginning in 2018, earnings were impacted by the operations acquired in the Merger. In the third quarter of 2018, earnings were impacted by a $1.8 billion non-cash impairment to property, plant and equipment in the Potash segment as discussed in note 16 to the financial statements. In the fourth quarter of 2017, earnings were impacted by a $276 million non-cash impairment to property, plant and equipment in the Phosphate and Sulfate segment.
| Dollars (millions) |
Nutrien 2018 | Nutrien 2017 | ||||||||||||||||||||||||||||||||||||||||||
| Q1 | Q2 | Q3 | Q4 | Total | Q1 | Q2 | Q3 | Q4 | Total | |||||||||||||||||||||||||||||||||||
| Sales |
$ | 3,695 | $ | 8,145 | $ | 4,034 | $ | 3,762 | $ | 19,636 | $ | 3,737 | $ | 7,348 | $ | 3,586 | $ | 3,498 | $ | 18,169 | ||||||||||||||||||||||||
| Gross margin |
847 | 2,131 | 1,155 | 1,259 | 5,392 | 838 | 1,791 | 793 | 729 | 4,151 | ||||||||||||||||||||||||||||||||||
| Earnings (loss) before finance costs and income taxes |
76 | 1,151 | (1,359 | ) | 546 | 414 | 222 | 995 | 74 | (100 | ) | 1,191 | ||||||||||||||||||||||||||||||||
| Net (loss) earnings from continuing operations |
(1 | ) | 741 | (1,067 | ) | 296 | (31 | ) | 97 | 705 | (53 | ) | (93 | ) | 656 | |||||||||||||||||||||||||||||
| EBITDA |
487 | 1,507 | (932 | ) | 944 | 2,006 | 521 | 1,306 | 375 | 210 | 2,412 | |||||||||||||||||||||||||||||||||
| NUTRIEN 2018 | 72 | ANNUAL REPORT |
MANAGEMENT'S DISCUSSION AND ANALYSIS
Fourth Quarter Financial Performance
| Sales | Gross Margin | |||||||||||||||||||||||||||||||||||||||||||||||
| Dollars (millions) Three months ended December 31 |
Nutrien 2018 |
Nutrien 2017 |
% Change |
PCS 2017 |
% Change |
Nutrien 2018 |
Nutrien 2017 |
% Change |
PCS 2017 |
% Change |
||||||||||||||||||||||||||||||||||||||
| RETAIL |
||||||||||||||||||||||||||||||||||||||||||||||||
| Crop nutrients |
$ | 917 | $ | 890 | 3 | $ | – | n/m | $ | 184 | $ | 168 | 10 | $ | – | n/m | ||||||||||||||||||||||||||||||||
| Crop protection products |
644 | 712 | (10 | ) | – | n/m | 270 | 327 | (17 | ) | – | n/m | ||||||||||||||||||||||||||||||||||||
| Seed |
103 | 107 | (4 | ) | – | n/m | 56 | 51 | 10 | – | n/m | |||||||||||||||||||||||||||||||||||||
| Merchandise |
179 | 187 | (4 | ) | – | n/m | 27 | 28 | (4 | ) | – | n/m | ||||||||||||||||||||||||||||||||||||
| Services and other |
211 | 193 | 9 | – | n/m | 125 | 121 | 3 | – | n/m | ||||||||||||||||||||||||||||||||||||||
| Total |
$ | 2,054 | $ | 2,089 | (2 | ) | $ | – | n/m | $ | 662 | $ | 695 | (5 | ) | $ | – | n/m | ||||||||||||||||||||||||||||||
| Manufactured Product Sales Tonnes (thousands) | Manufactured Product Average Net Price per MT | |||||||||||||||||||||||||||||||||||||||||||||||
| Dollars (millions) Three months ended December 31 |
Nutrien 2018 |
Nutrien 2017 |
% Change |
PCS 2017 |
% Change |
Nutrien 2018 |
Nutrien 2017 |
% Change |
PCS 2017 |
% Change |
||||||||||||||||||||||||||||||||||||||
| POTASH |
||||||||||||||||||||||||||||||||||||||||||||||||
| North America |
731 | 896 | (18 | ) | 568 | 29 | $ | 242 | $ | 207 | 17 | $ | 214 | 13 | ||||||||||||||||||||||||||||||||||
| Offshore |
2,126 | 1,631 | 30 | 1,340 | 59 | $ | 216 | $ | 168 | 29 | $ | 169 | 28 | |||||||||||||||||||||||||||||||||||
| Sales |
2,857 | 2,527 | 13 | 1,908 | 50 | $ | 223 | $ | 182 | 23 | $ | 182 | 23 | |||||||||||||||||||||||||||||||||||
| Cost of Goods Sold |
$ | (95 | ) | $ | (101 | ) | (6 | ) | $ | (96 | ) | (1 | ) | |||||||||||||||||||||||||||||||||||
| Gross Margin |
$ | 128 | $ | 81 | 58 | $ | 86 | 49 | ||||||||||||||||||||||||||||||||||||||||
| NITROGEN |
||||||||||||||||||||||||||||||||||||||||||||||||
| Ammonia |
808 | 801 | 1 | 505 | 60 | $ | 290 | $ | 256 | 13 | $ | 270 | 7 | |||||||||||||||||||||||||||||||||||
| Urea |
687 | 583 | 18 | 283 | 143 | $ | 337 | $ | 272 | 24 | $ | 288 | 17 | |||||||||||||||||||||||||||||||||||
| Solutions and nitrates |
939 | 986 | (5 | ) | 795 | 18 | $ | 169 | $ | 151 | 12 | $ | 138 | 22 | ||||||||||||||||||||||||||||||||||
| Sales |
2,434 | 2,370 | 3 | 1,583 | 54 | $ | 257 | $ | 217 | 18 | $ | 207 | 24 | |||||||||||||||||||||||||||||||||||
| Cost of Goods Sold |
$ | (175 | ) | $ | (174 | ) | 1 | $ | (167 | ) | 5 | |||||||||||||||||||||||||||||||||||||
| Gross Margin |
$ | 82 | $ | 43 | 91 | $ | 40 | 105 | ||||||||||||||||||||||||||||||||||||||||
| PHOSPHATE AND SULFATE |
||||||||||||||||||||||||||||||||||||||||||||||||
| Fertilizer |
601 | 629 | (4 | ) | 534 | 13 | $ | 423 | $ | 348 | 22 | $ | 342 | 24 | ||||||||||||||||||||||||||||||||||
| Industrial and feed |
207 | 205 | 1 | 239 | (13 | ) | $ | 513 | $ | 485 | 6 | $ | 483 | 6 | ||||||||||||||||||||||||||||||||||
| Sulfate |
77 | 61 | 26 | – | n/m | $ | 267 | $ | 236 | 13 | $ | – | n/m | |||||||||||||||||||||||||||||||||||
| Sales |
885 | 895 | (1 | ) | 773 | 14 | $ | 431 | $ | 372 | 16 | $ | 385 | 12 | ||||||||||||||||||||||||||||||||||
| Cost of Goods Sold |
$ | (406 | ) | $ | (694 | ) | (41 | ) | $ | (782 | ) | (48 | ) | |||||||||||||||||||||||||||||||||||
| Gross Margin |
$ | 25 | $ | (322 | ) | n/m | $ | (397 | ) | n/m | ||||||||||||||||||||||||||||||||||||||
n/m = not meaningful
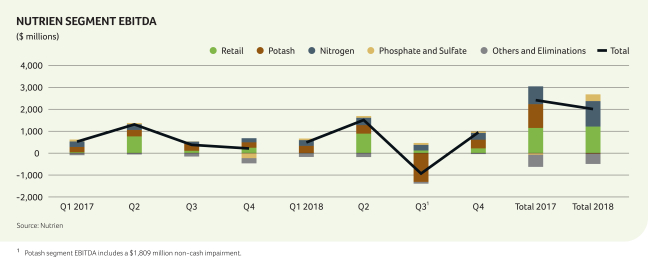
| NUTRIEN 2018 | 73 | ANNUAL REPORT |
Highlights of our 2018 fourth quarter compared to the 2017 combined historical Nutrien fourth quarter results and the 2017 PotashCorp fourth quarter results were as follows (direction of arrows refers to impact on comprehensive income and ● means no impact):
| Q4 2018 vs Q4 2017 (Nutrien) | Q4 2018 vs Q4 2017 (PotashCorp) | |||||||||
| Retail
|
|
|
|
Sales volumes for crop nutrients and crop protection were impacted by a shortened application season in the US caused by adverse weather.
|
|
PotashCorp did not have Retail operations prior to the Merger. | ||||
|
|
|
|
Gross margin for crop nutrients was higher due to strong fertilizer prices more than offsetting lower sales volumes. |
|||||||
|
Potash |
|
|
|
Sales volumes were up due to strong demand in offshore markets more than offsetting lower North America sales due to adverse weather that postponed fall application.
|
|
Sales volumes were up due to the addition of the Vanscoy Potash mine in the Merger and strong offshore demand. | ||||
|
|
|
|
Sales prices were up due to strong global demand and tight supply.
|
|
Sales prices were up due to strong global demand and tight supply. | |||||
|
|
|
|
Costs per tonne were lower due to realized synergies and mine optimization. |
● |
Costs per tonne were flat due to realized synergies and mine optimization offsetting the addition of Agrium’s operations, higher depreciation on the related PPA adjustments, and shutdowns at certain mines occurring in the fourth quarter in 2018 and in the third quarter in 2017. | |||||
| Nitrogen |
|
●
|
|
Sales volumes were higher due to improved production rates and stable fall ammonia application in Canada.
Sales prices were up due to tight global supply and higher global feedstock costs.
Costs per tonne were flat due to higher production volumes and synergy realizations being offset by higher depreciation and amortization from the PPA adjustments. |
|
Sales volumes increased primarily as a result of the Merger.
Sales prices were up due to tight global supply , stable demand and higher global feedstock costs.
Costs per tonne were higher due to higher depreciation and amortization from the PPA adjustments more than offsetting lower average natural gas costs from plants acquired in the Merger.
| ||||
| Phosphate and Sulfate
|
|
● |
|
Sales volumes were flat as higher ammonium sulfate sales offset lower dry fertilizer sales caused by the shortened application in the US.
|
|
Sales volumes increased primarily as a result of the Merger.
Sales prices were up due to higher sulfur and ammonia input costs and a more balanced global supply and demand.
Costs per tonne were down significantly as the impact of higher sulfur and ammonia input costs were more than offset by the non-cash impairment in the prior year. | ||||
|
|
Sales prices were up due to higher sulfur and ammonia input costs and a more balanced global supply and demand.
| |||||||||
|
|
Costs per tonne were down significantly as the impact of higher sulfur and ammonia input costs were more than offset by the non-cash impairment in the prior year. | |||||||||
|
Expenses and income below gross margin
|
|
|
|
Selling costs in Retail increased due to acquisitions and increased depreciation related to PPA adjustments.
General and administrative costs decreased due primarily to a share-based payment recovery in 2018 compared to share based payment expenses in 2017.
Other expenses decreased (Other income in 2018) primarily due to lower Merger and related costs. |
|
Expenses increased primarily due to the acquisition of Agrium’s operations in the Merger. | ||||
|
|
Selling costs also increased due to Retail acquisitions and increased depreciation related to PPA adjustments from the Merger. | |||||||||
|
|
Other expenses decreased (Other income in 2018) primarily due to lower Merger and related costs. | |||||||||
|
Income tax expense (recovery) |
|
|
|
We realized earnings from continuing operations for the three months ended December 31, 2018 compared to a loss from continuing operations for the same period in 2017. Significantly higher earnings were realized in high tax rate jurisdictions in the fourth quarter of 2018 compared to the same period in 2017. Discrete tax recoveries were $4 million in the fourth quarter of 2018 compared to $109 million in the fourth quarter of 2017. |
|
We realized earnings from continuing operations for the three months ended December 31, 2018 compared to a loss from continuing operations for the same period in 2017. Significantly higher earnings were realized in high tax rate jurisdictions in the fourth quarter of 2018 compared to the same period in 2017. Discrete tax recoveries were $4 million in the fourth quarter of 2018 compared to $118 million in the fourth quarter of 2017. | ||||
|
Net earnings from discontinued operations |
Combined historical Nutrien information was not prepared for discontinued operations. |
|
Net earnings from discontinued operations were higher primarily due to the gains on sale of our equity investments in SQM and APC. | |||||||
|
Other comprehensive loss (OCI) |
|
|
|
Other comprehensive loss increased primarily due to a loss on translation of net operations in Canada and Australia due to weaker foreign currencies that were acquired in the Merger and an actuarial loss on defined benefit plans in 2018 (compared to a gain in 2017) more than offsetting a decreased fair value loss on our investments measured at fair value through OCI. (2018 included a loss on Sinofert; 2017 included losses on Sinofert and ICL) |
|
Other comprehensive loss increased primarily due to a loss on translation of net operations in Canada and Australia due to weaker foreign currencies that were acquired in the Merger and an actuarial loss on defined benefit plans in 2018 (compared to a gain in 2017) more than offsetting a decreased fair value loss on our investments measured at fair value through OCI. (2018 included a loss on Sinofert; 2017 included losses on Sinofert and ICL) | ||||
| NUTRIEN 2018 | 74 | ANNUAL REPORT |
MANAGEMENT'S DISCUSSION AND ANALYSIS
Disclosure Controls and Procedures
We maintain disclosure controls and procedures designed to provide reasonable assurance that information required to be disclosed by Nutrien in its annual filings, interim filings (as these terms are defined in National Instrument 52-109 – Certification of Disclosure (NI 52-109) in Issuers’ Annual and Interim Filings) and other reports filed or submitted by us under securities legislation is recorded, processed, summarized and reported within the required time periods. Our Chief Executive Officer and Chief Financial Officer, after evaluating the effectiveness of our disclosure controls and procedures as of the end of the period covered by the annual filings, being December 31, 2018, have concluded that, as of such date, our disclosure controls and procedures were effective in providing reasonable assurance that information required to be disclosed by Nutrien in its annual filings, interim filings or other reports filed or submitted by it under securities legislation is (a) recorded, processed, summarized and reported within the time periods specified in the securities legislation, and (b) accumulated and communicated to management, including our Chief Executive Officer and Chief Financial Officer, as appropriate, to allow timely decisions regarding required disclosure.
There are inherent limitations to the effectiveness of any system of disclosure controls and procedures, including the possibility of human error and the circumvention or overriding of the controls and procedures. Accordingly, even effective disclosure controls and procedures can only provide reasonable assurance of achieving their control objectives.
Internal Controls Over Financial Reporting
Management is responsible for establishing and maintaining adequate internal control over financial reporting, as defined in Rules 13a-15(f) and 15d-15(f) under the Securities Exchange Act of 1934, as amended, and NI 52-109. Internal control over financial reporting is designed to provide reasonable assurance regarding the reliability of financial reporting and preparation of financial statements for external purposes in accordance with IFRS.
On January 1, 2018, PotashCorp and Agrium combined their businesses in a transaction by way of a plan of arrangement by becoming wholly owned subsidiaries of a new parent company named Nutrien. For the year ended December 31, 2018, the Company has designed internal control over financial reporting for Nutrien, while maintaining the internal control over financial reporting for its subsidiaries, PotashCorp and Agrium.
Under the supervision and with the participation of our management, including our Chief Executive Officer and Chief Financial Officer, we conducted an evaluation of the design and effectiveness of our internal control over financial reporting as of the end of the fiscal year covered by this report based on the framework issued by the Committee of Sponsoring Organizations of the Treadway Commission (COSO) in Internal Control – Integrated Framework (2013). There was no change in our internal control over financial reporting in 2018 that has materially affected, or is reasonably likely to materially affect, our internal control over financial reporting. Based on this evaluation, our Chief Executive Officer and Chief Financial Officer concluded that, as at December 31, 2018, Nutrien Ltd. did maintain effective internal control over financial reporting.
The effectiveness of the Company’s internal control over financial reporting as at December 31, 2018 was audited by KPMG LLP, as reflected in their report, which is included in this 2018 Annual Report included on page 91.
| NUTRIEN 2018 | 75 | ANNUAL REPORT |
This 2018 Annual Report, including the “Outlook” section of “Management’s Discussion & Analysis of Financial Condition and Results of Operations,” contains and incorporates by reference “forward-looking statements” or “forward-looking information” (within the meaning of the US Private Securities Litigation Reform Act of 1995, and other US federal securities laws and applicable Canadian securities laws) (collectively, “forward-looking statements”) that relate to future events or our future financial performance. These statements can be identified by expressions of belief, expectation or intention, as well as those statements that are not historical fact. These statements often contain words such as “should”, “could”, “expect”, “may”, “anticipate”, “forecast”, “believe”, “intend”, “estimates”, “plans” and similar expressions. These statements are based on certain factors and assumptions as set forth in this Annual Report, including with respect to: foreign exchange rates, expected synergies, expected growth, results of operations, performance, business prospects and opportunities, and effective tax rates. While the Company considers these factors and assumptions to be reasonable based on information currently available, they may prove to be incorrect. Forward-looking statements are subject to risks and uncertainties that are difficult to predict. The results or events set forth in forward-looking statements may differ materially from actual results or events. Several factors could cause actual results or events to differ materially from those expressed in forward-looking statements, including, but not limited to, the following: a number of matters relating to the Merger, including the failure to realize the anticipated benefits of the Merger; the risk that our credit ratings may be downgraded or there may be adverse conditions in the credit markets; any significant impairment of the carrying amount of certain of our assets; variations from our assumptions with respect to foreign exchange rates, expected growth, results of operations, performance, business prospects and opportunities, and effective tax rates; fluctuations in supply and demand in the fertilizer, sulfur and petrochemical markets; changes in competitive pressures, including pricing pressures; risks and uncertainties related to any operating and workforce changes made in response to our industry and the markets we serve, including mine and inventory shutdowns; adverse or uncertain economic conditions and changes in credit and financial markets; economic and political uncertainty around the world; changes in capital markets; the results of sales contract negotiations; unexpected or adverse weather conditions; changes in foreign currency and exchange rates; risks related to reputational loss; the occurrence of a major safety incident; inadequate insurance coverage for a significant liability; inability to obtain relevant permits for our operations; catastrophic events or malicious acts, including terrorism; certain complications that may arise in our mining process, including water inflows; risks and uncertainties related to our international operations and assets; our ownership of non-controlling equity interests in other companies; our prospects to reinvest capital in strategic opportunities and acquisitions; risks associated with natural gas and other hedging activities; security risks related to our information technology systems; imprecision in mineral resource and reserve estimates; costs and availability of transportation and distribution for our raw materials and products, including railcars and ocean freight; changes in, and the effects of, government policies and regulations; earnings and the decisions of taxing authorities which could affect our effective tax rates; increases in the price or reduced availability of the raw materials that we use; our ability to attract, develop, engage and retain skilled employees; strikes or other forms of work stoppage or slowdowns; rates of return on, and the risks associated with, our investments and capital expenditures; timing and impact of capital expenditures; the impact of further innovation; adverse developments in new and pending legal proceedings or government investigations; and violations of our governance and compliance policies. Forward-looking statements are based on certain assumptions and analyses made by us in light of our experience and perception of historical trends, current conditions and expected future developments as well as other factors we believe are appropriate in the circumstances. Readers are cautioned not to place undue reliance on the forward-looking statements which involve known and unknown risks and uncertainties that may cause our actual results, performance or achievements to be materially different from any future results, performance or achievements expressed or implied by such forward-looking statements. These risks and uncertainties and additional risks and uncertainties can be found in our Annual Information Form for the year ended December 31, 2018 and in our filings with the SEC and the Canadian provincial securities commissions. The purpose of our expected adjusted earnings per share, adjusted EBITDA and EBITDA by segment guidance range is to assist readers in understanding our expected and targeted financial results, and this information may not be appropriate for other purposes. Forward-looking statements in or incorporated into this report are given only as at the date of this report or the document incorporated into this report and the Company disclaims any obligation to update or revise any forward-looking statements, whether as a result of new information, future events or otherwise, except as required by law.
| NUTRIEN 2018 | 76 | ANNUAL REPORT |
MANAGEMENT'S DISCUSSION AND ANALYSIS
Non-IFRS Financial Measures
We use both IFRS and certain non-IFRS measures to assess performance. Non-IFRS measures are a numerical measure of a company’s performance, that either excludes or includes amounts that are not normally excluded or included in the most directly comparable measures calculated and presented in accordance with IFRS. In evaluating these measures, investors should consider that the methodology applied in calculating such measures may differ among companies and analysts.
Management believes the non-IFRS measures provide transparent and useful supplemental information to investors in order that they may evaluate our financial performance using the same measures as management. These non-IFRS financial measures should not be considered as a substitute for, nor superior to, measures of financial performance prepared in accordance with IFRS.
The following section outlines our non-IFRS financial measures, their definitions, why management uses each measure and contains reconciliations to the most directly comparable IFRS measures.
COMBINED HISTORICAL RESULTS OF POTASHCORP AND AGRIUM FOR THE YEAR ENDED DECEMBER 31, 2017
The combined historical information below may differ from the Nutrien pro forma earnings and balance sheet presented in the Business Acquisition Report dated February 20, 2017 (BAR) as the pro forma information presented therein required certain adjustments under applicable securities laws and accounting standards that we believe does not provide as useful a measure as the combined historical financial information. The primary differences in the statement of earnings were that pro forma finance costs were reduced by the amortization of the change in carrying amount of Agrium’s debt resulting from the PPA adjustments and the pro forma other expenses were adjusted to remove any Merger-related costs. There were no comparable adjustments in the combined historical financial information. The primary differences in the balance sheet were the pro forma adjustments for the estimated proceeds from the sale of SQM, APC, ICL and Agrium’s Conda Idaho phosphate production facility and adjacent phosphate mineral rights at December 31, 2017, while there was no adjustment in the combined historical financial information, and the PPA adjustments in the pro forma information was largely allocated to goodwill as fewer provisional fair value adjustments were known at the time of its preparation.
Most directly comparable IFRS financial measure: As the continuing reporting entity under IFRS, the audited annual financial statements of PotashCorp for the year ended December 31, 2017 are the IFRS comparative figures.
Definition: The combined historical results for Nutrien were calculated by adding the historical IFRS financial statements prepared by PotashCorp and Agrium and then eliminating intercompany transactions and reclassifying line items to conform with our financial statement presentation. This combined historical information does not include, among other things, estimated cost synergies, adjustments related to restructuring or integration activities, adjustments related to the PPA and the impact of discontinued operations.
Why we use the measure and why it is useful to investors: It provides a measure of what the combined results may have been had the Merger been completed on January 1, 2017. Information prepared includes a combined historical balance sheet, combined historical EBITDA by segment and in total, combined historical summary cash flow information and a combined historical summary other comprehensive income.
| NUTRIEN COMBINED HISTORICAL SUMMARY CASH FLOW INFORMATION FOR THE YEAR ENDED DECEMBER 31, 2017
|
| |||||||||||||||
| Dollars (millions) | Historical PotashCorp |
Historical Agrium | Adjustments 1 | Nutrien | ||||||||||||
| Cash provided by operating activities |
$ | 1,225 | $ | 1,319 | $ | 24 | 1 | $ | 2,568 | |||||||
| Cash used in investing activities |
(652 | ) | (922 | ) | (20 | ) 1 | (1,594 | ) | ||||||||
| Cash used in financing activities |
(489 | ) | (335 | ) | – | (824 | ) | |||||||||
| Effect of exchange rate changes on cash and cash equivalents | – | (12 | ) | – | (12 | ) | ||||||||||
| Increase in cash and cash equivalents | $ | 84 | $ | 50 | $ | 4 | $ | 138 | ||||||||
| 1 | To reclassify legacy Agrium cash used in discontinued operations to match Nutrien’s method of presentation. |
| NUTRIEN COMBINED HISTORICAL SUMMARY OTHER COMPREHENSIVE INCOME FOR THE YEAR ENDED DECEMBER 31, 2017
|
| |||||||||||
| Dollars (millions) |
Historical |
Historical |
Nutrien |
|||||||||
| Other comprehensive income | $ | 96 | $ | 80 | $ | 176 | ||||||
| NUTRIEN 2018 | 77 | ANNUAL REPORT |
| NUTRIEN COMBINED HISTORICAL BALANCE SHEET AS AT DECEMBER 31, 2017
|
| |||||||||||||||
| Dollars (millions) | Historical PotashCorp |
Historical Agrium |
Adjustments 1 | Nutrien | ||||||||||||
| ASSETS |
||||||||||||||||
| Current assets |
||||||||||||||||
| Cash and cash equivalents |
$ | 116 | $ | 466 | $ | – | $ | 582 | ||||||||
| Receivables |
489 | 2,406 | 18 | 2 | 2,913 | |||||||||||
| Income tax receivables |
– | 18 | (18 | ) 2 | – | |||||||||||
| Inventories |
788 | 3,321 | – | 4,109 | ||||||||||||
| Prepaid expenses and other current assets |
72 | 1,004 | 120 | 3 | 1,196 | |||||||||||
| Other current assets |
– | 120 | (120 | ) 3 | – | |||||||||||
| 1,465 | 7,335 | – | 8,800 | |||||||||||||
| Assets held for sale |
1,858 | 105 | – | 1,963 | ||||||||||||
| 3,323 | 7,440 | – | 10,763 | |||||||||||||
| Non-current assets |
||||||||||||||||
| Property, plant and equipment |
12,971 | 7,091 | – | 20,062 | ||||||||||||
| Goodwill |
– | 2,228 | 97 | 4 | 2,325 | |||||||||||
| Other intangible assets |
166 | 518 | (97 | ) 4 | 587 | |||||||||||
| Investments |
30 | 522 | 262 | 5 | 814 | |||||||||||
| Available for sale investments |
262 | – | (262 | ) 5 | – | |||||||||||
| Deferred income tax assets |
– | 85 | (85 | ) 6 | – | |||||||||||
| Other assets |
246 | 58 | 85 | 6 | 389 | |||||||||||
| TOTAL ASSETS |
$ | 16,998 | $ | 17,942 | $ | – | $ | 34,940 | ||||||||
| LIABILITIES |
||||||||||||||||
| Current liabilities |
||||||||||||||||
| Short-term debt |
$ | 730 | $ | 867 | $ | – | 7 | $ | 1,597 | |||||||
| Payables and accrued charges |
807 | 5,206 | 119 | 8, 9, 10 | 6,132 | |||||||||||
| Income taxes payable |
– | 27 | (27 | ) 8 | – | |||||||||||
| Current portion of long-term debt |
– | 11 | – | 7 | 11 | |||||||||||
| Current portion of derivative instrument liabilities |
29 | – | (29 | ) 9 | – | |||||||||||
| Current portion of other provisions |
– | 63 | (63 | ) 10 | – | |||||||||||
| Deferred income tax liabilities on assets held for sale |
36 | – | – | 36 | ||||||||||||
| 1,602 | 6,174 | – | 7,776 | |||||||||||||
| Non-current liabilities |
||||||||||||||||
| Long-term debt |
3,711 | 4,397 | – | 8,108 | ||||||||||||
| Deferred income tax liabilities |
2,205 | 473 | – | 2,678 | ||||||||||||
| Pension and other post-retirement benefit liabilities |
440 | 142 | – | 582 | ||||||||||||
| Asset retirement obligations and accrued environmental costs |
651 | 522 | – | 1,173 | ||||||||||||
| Derivative instrument liabilities |
35 | – | (35 | ) 11 | – | |||||||||||
| Other non-current liabilities |
51 | 106 | 42 | 11, 12 | 199 | |||||||||||
| TOTAL LIABILITIES |
8,695 | 11,814 | 7 | 20,516 | ||||||||||||
| SHAREHOLDERS’ EQUITY |
||||||||||||||||
| Share capital |
1,806 | 1,776 | – | 3,582 | ||||||||||||
| Contributed surplus |
230 | – | – | 230 | ||||||||||||
| Accumulated other comprehensive income (loss) |
25 | (1,116 | ) | – | (1,091 | ) | ||||||||||
| Retained earnings |
6,242 | 5,461 | – | 11,703 | ||||||||||||
| 8,303 | 6,121 | – | 14,424 | |||||||||||||
| Non-controlling interests |
– | 7 | (7 | ) 12 | – | |||||||||||
| TOTAL SHAREHOLDERS’ EQUITY |
8,303 | 6,128 | (7 | ) | 14,424 | |||||||||||
| TOTAL LIABILITIES AND SHAREHOLDERS’ EQUITY |
$ | 16,998 | $ | 17,942 | $ | – | $ | 34,940 | ||||||||
| NUTRIEN 2018 | 78 | ANNUAL REPORT |
MANAGEMENT'S DISCUSSION AND ANALYSIS
NUTRIEN COMBINED HISTORICAL EARNINGS FROM CONTINUING OPERATIONS AND EBITDA FOR THE YEAR ENDED DECEMBER 31, 2017
| Dollars (millions) | Retail | Potash | Nitrogen | Phosphate and Sulfate |
Others | Eliminations | Nutrien | |||||||||||||||||||||
| SALES |
$ | 12,103 | $ | 2,391 | $ | 2,986 | $ | 1,561 | $ | – | $ | (872 | ) | $ | 18,169 | |||||||||||||
| Freight, transportation and distribution |
– | (334 | ) | (347 | ) | (204 | ) | – | (885 | ) | ||||||||||||||||||
| Cost of goods sold |
(9,157 | ) | (1,124 | ) | (2,084 | ) | (1,649 | ) | – | 881 | (13,133 | ) | ||||||||||||||||
| GROSS MARGIN |
2,946 | 933 | 555 | (292 | ) | – | 9 | 4,151 | ||||||||||||||||||||
| Selling expenses |
(2,007 | ) | (12 | ) | (31 | ) | (8 | ) | 15 | – | (2,043 | ) | ||||||||||||||||
| General and administrative expenses |
(100 | ) | (5 | ) | (13 | ) | (8 | ) | (377 | ) | – | (503 | ) | |||||||||||||||
| Provincial mining and other taxes |
– | (159 | ) | – | – | – | – | (159 | ) | |||||||||||||||||||
| Earnings of equity-accounted investees |
9 | 1 | 35 | – | 1 | – | 46 | |||||||||||||||||||||
| Other income (expenses) |
8 | (20 | ) | (25 | ) | (7 | ) | (257 | ) | – | (301 | ) | ||||||||||||||||
| EARNINGS (LOSS) BEFORE FINANCE COSTS AND INCOME TAXES |
856 | 738 | 521 | (315 | ) | (618 | ) | 9 | 1,191 | |||||||||||||||||||
| Finance costs |
– | – | – | – | (515 | ) | – | (515 | ) | |||||||||||||||||||
| EARNINGS (LOSS) BEFORE INCOME TAXES |
856 | 738 | 521 | (315 | ) | (1,133 | ) | 9 | 676 | |||||||||||||||||||
| Income taxes |
– | – | – | – | (20 | ) | – | (20 | ) | |||||||||||||||||||
| NET EARNINGS (LOSS) FROM CONTINUING OPERATIONS |
$ | 856 | $ | 738 | $ | 521 | $ | (315 | ) | $ | (1,153 | ) | $ | 9 | $ | 656 | ||||||||||||
| Finance costs |
– | – | – | – | 515 | – | 515 | |||||||||||||||||||||
| Income taxes |
– | – | – | – | 20 | – | 20 | |||||||||||||||||||||
| Depreciation and amortization |
289 | 345 | 291 | 240 | 56 | – | 1,221 | |||||||||||||||||||||
| EBITDA |
$ | 1,145 | $ | 1,083 | $ | 812 | $ | (75 | ) | $ | (562 | ) | $ | 9 | $ | 2,412 | ||||||||||||
| EBITDA RECONCILIATION TO HISTORICAL | Nutrien | |||||||||||||||||||||||||||
| PotashCorp |
$ | 901 | ||||||||||||||||||||||||||
| Agrium |
1,546 | |||||||||||||||||||||||||||
| Combined EBITDA |
2,447 | |||||||||||||||||||||||||||
| Adjustments: |
||||||||||||||||||||||||||||
| Allocate Retail finance costs |
(34 | ) | ||||||||||||||||||||||||||
| Other |
(1 | ) | ||||||||||||||||||||||||||
| NUTRIEN EBITDA |
$ | 2,412 | ||||||||||||||||||||||||||
NUTRIEN COMBINED HISTORICAL RETAIL SEGMENT EBITDA FOR THE YEAR ENDED DECEMBER 31, 2017
| Dollars (millions) | Historical PotashCorp |
Historical Agrium |
Adjustments | Nutrien | ||||||||||||
| SALES |
||||||||||||||||
| External |
$ | – | $ | 12,056 | $ | – | $ | 12,056 | ||||||||
| Intersegment |
– | 47 | – | 47 | ||||||||||||
| TOTAL SALES |
– | 12,103 | – | 12,103 | ||||||||||||
| Cost of goods sold |
– | (9,157 | ) | – | (9,157 | ) | ||||||||||
| GROSS MARGIN |
– | 2,946 | – | 2,946 | ||||||||||||
| Selling expenses |
– | (2,007 | ) | – | (2,007 | ) | ||||||||||
| General and administrative expenses |
– | (100 | ) | – | (100 | ) | ||||||||||
| Earnings of equity-accounted investees |
– | 9 | – | 9 | ||||||||||||
| Other income (expenses) |
– | 42 | (34 | ) 1 | 8 | |||||||||||
| EARNINGS BEFORE FINANCE COSTS AND INCOME TAXES |
– | 890 | (34 | ) | 856 | |||||||||||
| Depreciation and amortization |
– | 289 | – | 289 | ||||||||||||
| EBITDA |
$ | – | $ | 1,179 | $ | (34 | ) | $ | 1,145 | |||||||
| 1 | Finance costs associated with Retail operations will be allocated to the Retail segment, and will be presented in other income (expenses). |
| NUTRIEN 2018 | 79 | ANNUAL REPORT |
| NUTRIEN COMBINED HISTORICAL POTASH SEGMENT EBITDA FOR THE YEAR ENDED DECEMBER 31, 2017
|
| |||||||||||||||
| Dollars (millions) | Historical PotashCorp |
Historical Agrium |
Adjustments | Nutrien | ||||||||||||
| SALES |
||||||||||||||||
| External |
$ | 1,868 | $ | 386 | $ | 4 | $ | 2,258 | ||||||||
| Intersegment |
– | 133 | – | 133 | ||||||||||||
| TOTAL SALES |
1,868 | 519 | 4 | 2,391 | ||||||||||||
| Freight, transportation and distribution |
(235 | ) | – | (99 | ) 1 | (334 | ) | |||||||||
| Cost of goods sold |
(848 | ) | (390 | ) | 114 | 1, 4 | (1,124 | ) | ||||||||
| GROSS MARGIN |
785 | 129 | 19 | 933 | ||||||||||||
| Selling expenses |
– | (5 | ) | (7 | ) 4 | (12 | ) | |||||||||
| General and administrative expenses |
– | (6 | ) | 1 | 3, 4 | (5 | ) | |||||||||
| Provincial mining and other taxes |
(151 | ) | – | (8 | ) 2, 4 | (159 | ) | |||||||||
| Earnings of equity-accounted investees |
– | – | 1 | 4 | 1 | |||||||||||
| Other expenses |
– | (13 | ) | (7 | ) 2, 4 | (20 | ) | |||||||||
| EARNINGS BEFORE FINANCE COSTS AND INCOME TAXES |
634 | 105 | (1 | ) | 738 | |||||||||||
| Depreciation and amortization |
232 | 113 | – | 345 | ||||||||||||
| EBITDA |
$ | 866 | $ | 218 | $ | (1 | ) | $ | 1,083 | |||||||
| 1 | To separately present legacy Agrium direct and indirect freight costs. |
| 2 | To separately present legacy Agrium provincial mining taxes. |
| 3 | To reclassify legacy Agrium costs related to business support functions to Others. |
| 4 | To allocate legacy PotashCorp all Others segment selling and administrative expenses to segment. |
NUTRIEN COMBINED HISTORICAL NITROGEN SEGMENT EBITDA FOR THE YEAR ENDED DECEMBER 31, 2017
| Dollars (millions) | Historical PotashCorp |
Historical Agrium |
Adjustments | Nutrien | ||||||||||||
| SALES |
||||||||||||||||
| External |
$ | 1,395 | $ | 755 | $ | 387 | 2 | $ | 2,537 | |||||||
| Intersegment |
74 | 254 | 121 | 2, 4 | 449 | |||||||||||
| TOTAL SALES |
1,469 | 1,009 | 508 | 2,986 | ||||||||||||
| Freight, transportation and distribution |
(129 | ) | – | (218 | ) 1 | (347 | ) | |||||||||
| Cost of goods sold |
(1,046 | ) | (757 | ) | (243 | ) 1, 2, 4 | (2,046 | ) | ||||||||
| Cost of intersegment purchases |
(38 | ) | – | – | (38 | ) | ||||||||||
| GROSS MARGIN |
256 | 252 | 47 | 555 | ||||||||||||
| Selling expenses |
– | (12 | ) | (19 | ) 2, 5 | (31 | ) | |||||||||
| General and administrative expenses |
– | (13 | ) | – | 2, 3, 5 | (13 | ) | |||||||||
| Earnings of equity-accounted investees |
– | – | 35 | 2, 5 | 35 | |||||||||||
| Other expenses |
– | (18 | ) | (7 | ) 2, 5 | (25 | ) | |||||||||
| EARNINGS BEFORE FINANCE COSTS AND INCOME TAXES |
256 | 209 | 56 | 521 | ||||||||||||
| Depreciation and amortization |
203 | 79 | 9 | 2, 4 | 291 | |||||||||||
| EBITDA |
$ | 459 | $ | 288 | $ | 65 | $ | 812 | ||||||||
| 1 | To separately present legacy Agrium direct and indirect freight costs. |
| 2 | To reclassify legacy wholesale other Agrium segment between Nitrogen and Phosphate and Sulfate. |
| 3 | To reclassify legacy Agrium costs related to business support functions to Others. |
| 4 | To record profit on legacy Agrium transfers of ammonia to Phosphate and Sulfate segment not previously recorded. |
| 5 | To allocate legacy PotashCorp all Others segment selling and administrative expenses to segment. |
| NUTRIEN 2018 | 80 | ANNUAL REPORT |
MANAGEMENT'S DISCUSSION AND ANALYSIS
NUTRIEN COMBINED HISTORICAL PHOSPHATE AND SULFATE SEGMENT EBITDA FOR THE YEAR ENDED DECEMBER 31, 2017
| Dollars (millions) | Historical PotashCorp |
Historical Agrium |
Adjustments | Nutrien | ||||||||||||
| SALES |
||||||||||||||||
| External |
$ | 1,284 | $ | 115 | $ | (18 | ) 2, 5 | $ | 1,381 | |||||||
| Intersegment |
– | 122 | 58 | 2 | 180 | |||||||||||
| TOTAL SALES |
1,284 | 237 | 40 | 1,561 | ||||||||||||
| Freight, transportation and distribution |
(173 | ) | – | (31 | ) 1, 5 | (204 | ) | |||||||||
| Cost of goods sold |
(1,441 | ) | (228 | ) | 56 | 1, 2, 3, 5 | (1,613 | ) | ||||||||
| Cost of intersegment purchases |
(36 | ) | – | – | (36 | ) | ||||||||||
| GROSS MARGIN |
(366 | ) | 9 | 65 | (292 | ) | ||||||||||
| Selling expenses |
– | (2 | ) | (6 | ) 4 | (8 | ) | |||||||||
| General and administrative expenses |
– | – | (8 | ) 2, 4 | (8 | ) | ||||||||||
| Other expenses |
– | (3 | ) | (4 | ) 2, 4 | (7 | ) | |||||||||
| (LOSS) EARNINGS BEFORE FINANCE COSTS AND INCOME TAXES |
(366 | ) | 4 | 47 | (315 | ) | ||||||||||
| Depreciation and amortization |
220 | 17 | 3 | 2, 3 | 240 | |||||||||||
| EBITDA |
$ | (146 | ) | $ | 21 | $ | 50 | $ | (75 | ) | ||||||
NUTRIEN COMBINED HISTORICAL OTHERS SEGMENT AND ELIMINATIONS EBITDA FOR THE YEAR ENDED DECEMBER 31, 2017
| Dollars (millions) | Historical PotashCorp |
Historical Agrium |
Adjustments | Nutrien | ||||||||||||
| SALES |
||||||||||||||||
| Intersegment |
$ | – | $ | (696 | ) | $ | (176 | ) 1, 2, 9 | $ | (872 | ) | |||||
| TOTAL SALES |
– | (696 | ) | (176 | ) | (872 | ) | |||||||||
| Cost of goods sold |
– | 705 | 176 | 1, 2, 9 | 881 | |||||||||||
| GROSS MARGIN |
– | 9 | – | 9 | ||||||||||||
| Selling and administrative expenses |
(214 | ) | – | 214 | 10 | – | ||||||||||
| Selling expenses |
– | 17 | (2 | ) 10 | 15 | |||||||||||
| General and administrative expenses |
– | (121 | ) | (256 | ) 4, 5, 10 | (377 | ) | |||||||||
| Share-based payments |
– | (69 | ) | 69 | 4 | – | ||||||||||
| Earnings of equity-accounted investees |
121 | – | (120 | ) 7, 10 | 1 | |||||||||||
| Other expenses |
(90 | ) | (127 | ) | (40 | ) 8, 10, 11 | (257 | ) | ||||||||
| LOSS BEFORE FINANCE COSTS AND INCOME TAXES |
(183 | ) | (291 | ) | (135 | ) | (609 | ) | ||||||||
| Finance costs |
(238 | ) | (101 | ) | (176 | ) 3, 6 | (515 | ) | ||||||||
| Finance costs related to long-term debt |
– | (210 | ) | 210 | 6 | – | ||||||||||
| LOSS BEFORE INCOME TAXES |
(421 | ) | (602 | ) | (101 | ) | (1,124 | ) | ||||||||
| Income tax recovery (expense) |
180 | (203 | ) | 3 | 7 | (20 | ) | |||||||||
| NET LOSS FROM CONTINUING OPERATIONS |
(241 | ) | (805 | ) | (98 | ) | (1,144 | ) | ||||||||
| Finance costs |
238 | 101 | 176 | 3, 6 | 515 | |||||||||||
| Finance costs related to long-term debt |
– | 210 | (210 | ) 6 | – | |||||||||||
| Income tax (recovery) expense |
(180 | ) | 203 | (3 | ) 7 | 20 | ||||||||||
| Depreciation and amortization |
37 | 19 | – | 56 | ||||||||||||
| EBITDA |
$ | (146 | ) | $ | (272 | ) | $ | (135 | ) | $ | (553 | ) | ||||
| NUTRIEN 2018 | 81 | ANNUAL REPORT |
EBITDA, ADJUSTED EBITDA AND POTASH ADJUSTED EBITDA
Most Directly Comparable IFRS financial measure: Net earnings (loss) from continuing operations.
Definition: EBITDA is calculated as net earnings (loss) from continuing operations before finance costs, income taxes and depreciation and amortization. Adjusted EBITDA is calculated as net earnings (loss) from continuing operations before finance costs, income taxes and depreciation and amortization, impairment, Merger and related costs, share-based compensation and defined benefit plans curtailment gain.
Why we use the measure and why it is useful to investors: As a valuation measurement it excludes the effects of items that primarily reflect the impact of long-term investment and financing decisions, rather than the performance of our day-to-day operations, and as a measure of our ability to service debt and to meet other payment obligations.
| Dollars (millions) | Nutrien 2018 | Nutrien 2017 1 | ||||||||||||||
| Net (loss) earnings from continuing operations |
$ | (31 | ) | $ | 656 | |||||||||||
| Finance costs |
538 | 515 | ||||||||||||||
| Income tax (recovery) expense |
(93 | ) | 20 | |||||||||||||
| Depreciation and amortization |
1,592 | 1,221 | ||||||||||||||
| EBITDA |
2,006 | 2,412 | ||||||||||||||
| Impairment of property, plant and equipment |
1,809 | 305 | ||||||||||||||
| Merger and related costs |
170 | 178 | ||||||||||||||
| Share-based compensation |
116 | 92 | ||||||||||||||
| Defined benefit plans curtailment gain |
(157 | ) | – | |||||||||||||
| Adjusted EBITDA |
$ | 3,944 | $ | 2,987 | ||||||||||||
| Nutrien 2018 |
Nutrien 2017 | |||||||||||||||
| Potash EBITDA |
$ | (203 | ) | $ | 1,083 | |||||||||||
| Impairment of property, plant and equipment |
1,809 | – | ||||||||||||||
| Potash adjusted EBITDA |
$ | 1,606 | $ | 1,083 | ||||||||||||
| 1 | Amount presented is the combined historical financial results of PotashCorp and Agrium. |
ADJUSTED NET EARNINGS (AND THE RELATED PER SHARE AMOUNTS)
Most Directly Comparable IFRS financial measure: Net (loss) earnings from continuing operations and net (loss) earnings per share.
Definition: Net loss from continuing operations before purchase price allocation, impairment, Merger and related costs, share-based compensation, defined benefit plans curtailment gain and dividend income from discontinued operations net of tax.
Why we use the measure and why it is useful to investors: Focuses on the performance of our day-to-day operations excluding the effects of non-operating items.
| 2018 | ||||||||||||
| Dollars (millions), except per share amounts | Increases (Decreases) |
Post-Tax |
Per Share | |||||||||
| Net loss from continuing operations |
$ | (31 | ) | $ | (0.05 | ) | ||||||
| Adjustments: |
||||||||||||
| Purchase price allocation |
$ | 211 | 161 | 0.26 | ||||||||
| Impairment of property, plant and equipment |
1,809 | 1,320 | 2.11 | |||||||||
| Merger and related costs |
170 | 130 | 0.21 | |||||||||
| Share-based compensation |
116 | 89 | 0.14 | |||||||||
| Defined benefit plans curtailment gain |
(157 | ) | (120 | ) | (0.19 | ) | ||||||
| Dividend income of SQM and APC |
156 | 130 | 0.21 | |||||||||
| Adjusted net earnings |
$ | 1,679 | $ | 2.69 | ||||||||
GROSS MARGIN EXCLUDING DEPRECIATION AND AMORTIZATION PER TONNE
Most Directly Comparable IFRS financial measure: Gross margin per tonne.
Definition: Gross margin less depreciation and amortization per tonne. (Reconciliations are provided on pages 42, 48 and 54.)
Why we use the measure and why it is useful to investors: Focuses on the performance of our day-to-day operations, which excludes the effects of items that primarily reflect the impact of long-term investment and financing decisions.
| NUTRIEN 2018 | 82 | ANNUAL REPORT |
MANAGEMENT'S DISCUSSION AND ANALYSIS
FREE CASH FLOW
Most Directly Comparable IFRS financial measure: Cash provided by operating activities.
Definition: Cash provided by operating activities less sustaining capital expenditures, cash provided by operating activities from discontinued operations and changes in non-cash operating working capital. Sustaining capital expenditures include the cost of replacements and betterments for our facilities.
Why we use the measure and why it is useful to investors: For evaluation of liquidity and financial strength, and as a component of employee remuneration calculations. It is also useful as an indicator of our ability to service debt, meet other payment obligations and make strategic investments. Free cash flow does not represent residual cash flow available for discretionary expenditures.
| Dollars (millions) | 2018 Nutrien | 2017 Nutrien 1 | ||||||||||||||
| Cash provided by operating activities |
$ | 2,052 | $ | 2,568 | ||||||||||||
| Cash provided by operating activities from discontinued operations |
(130 | ) | (200 | ) | ||||||||||||
| Sustaining capital expenditures |
(1,085 | ) | (1,018 | ) | ||||||||||||
| Changes in non-cash operating working capital |
1,138 | (57 | ) | |||||||||||||
| Free cash flow |
$ | 1,975 | $ | 1,293 | ||||||||||||
| 1 | Amount presented is the combined historical financial results of PotashCorp and Agrium. |
POTASH CASH COPM
Most Directly Comparable IFRS financial measure: Cost of goods sold (COGS).
Definition: Potash COGS for the period excluding depreciation and amortization expense and inventory and other adjustments divided by the production tonnes for the period.
Why we use the measure and why it is useful to investors: To assess operational performance. Cash COPM excludes the effects of production from other periods and long-term investment decisions, supporting a focus on the performance of our day-to-day operations.
| Dollars (millions), except per tonne amounts | 2018 Nutrien | 2017 Nutrien 1 | ||||||||||||||
| Total COGS – Potash |
$ | 1,183 | $ | 1,124 | ||||||||||||
| Change in inventory |
(5 | ) | 36 | |||||||||||||
| Other adjustments |
(14 | ) | 20 | |||||||||||||
| COPM |
$ | 1,164 | $ | 1,180 | ||||||||||||
| Depreciation and amortization included in COPM |
(391 | ) | (378 | ) | ||||||||||||
| Cash COPM |
$ | 773 | $ | 802 | ||||||||||||
| Production tonnes (tonnes - thousands) |
12,842 | 12,224 | ||||||||||||||
| Potash cash COPM per tonne |
$ | 60 | $ | 66 | ||||||||||||
| 1 | Amount presented is the combined historical financial results of PotashCorp and Agrium. |
UREA CONTROLLABLE CASH COPM
Most directly comparable IFRS financial measure: COGS.
Definition: Urea COGS for the Nitrogen segment excluding depreciation and amortization expense, cash COGS for products excluding urea, inventory and other adjustments and urea natural gas and steam costs, divided by the urea production tonnes for the period.
Why we use the measure and why it is useful to investors: To assess operational performance. Cash COPM excludes the effects of production from other periods and long-term investment decisions, supporting a focus on the performance of our day-to-day operations.
| Dollars (millions), except per tonne amounts | 2018 Nutrien | 2017 Nutrien 1 | ||||||||||||||
| Total COGS – Nitrogen |
$ | 2,079 | $ | 2,084 | ||||||||||||
| Nitrogen depreciation and amortization |
(429 | ) | (291 | ) | ||||||||||||
| Cash COGS for products other than urea |
(1,251 | ) | (1,421 | ) | ||||||||||||
| Urea |
||||||||||||||||
| Total cash COGS |
$ | 399 | $ | 372 | ||||||||||||
| Change in inventory and other adjustments |
70 | 52 | ||||||||||||||
| Total cash COPM |
$ | 469 | $ | 424 | ||||||||||||
| Natural gas and steam costs |
(221 | ) | (205 | ) | ||||||||||||
| Controllable cash COPM |
$ | 248 | $ | 219 | ||||||||||||
| Production (tonnes - thousands) |
3,422 | 2,891 | ||||||||||||||
| Urea controllable cash COPM per tonne |
$ | 72 | $ | 76 | ||||||||||||
| 1 | Amount presented is the combined historical financial results of PotashCorp and Agrium. |
| NUTRIEN 2018 | 83 | ANNUAL REPORT |
RETAIL NORMALIZED COMPARABLE STORE SALES
Most directly comparable IFRS financial measure: Retail sales from comparable base as a component of total Retail sales.
Definition: Retail normalized comparable store sales is determined by adjusting prior year comparable store sales for published potash, nitrogen and phosphate benchmark prices and foreign exchange rates used in the current year. We retain sales of closed locations in the comparable base if the closed location is in close proximity to an existing location, unless we plan to exit the market area or are unable to economically or logistically serve it. We do not adjust for temporary closures, expansions or renovations of stores.
Why we use the measure and why it is useful to investors: Evaluate sales growth by adjusting for fluctuations in commodity prices and foreign exchange rates. Included are locations owned by us for more than 12 months.
| Dollars (millions), except percentage amounts | 2018 Nutrien | 2017 Nutrien 1 | ||||||||||||||
| Sales from comparable base |
||||||||||||||||
| Current period |
$ | 12,253 | $ | 11,782 | ||||||||||||
| Prior period |
12,103 | 11,766 | ||||||||||||||
| Comparable store sales (%) |
1% | 0% | ||||||||||||||
| Prior period normalized for benchmark prices and foreign exchange rates |
12,363 | 11,509 | ||||||||||||||
| Normalized comparable store sales (%) |
(1% | ) | 2% | |||||||||||||
| 1 | Amount presented is the combined historical financial results of PotashCorp and Agrium. |
RETAIL AVERAGE WORKING CAPITAL TO SALES
Most directly comparable IFRS financial measure: (Current assets minus current liabilities for Retail) divided by Retail sales.
Definition: Retail average working capital divided by sales for the last four rolling quarters.
Why we use the measure and why it is useful to investors: To evaluate operational efficiency. A lower or higher percentage represents increased or decreased efficiency, respectively.
| Rolling four quarters ended December 31, 2018 | ||||||||||||||||||||
| Dollars (millions), except percentage amounts | Q1 2018 | Q2 2018 | Q3 2018 | Q4 2018 | Average/Total | |||||||||||||||
| Working capital |
$ | 1,781 | $ | 3,170 | $ | 3,633 | $ | 2,312 | $ | 2,724 | ||||||||||
| Sales |
2,099 | 6,342 | 2,175 | 2,054 | 12,670 | |||||||||||||||
| Average working capital to sales |
21% | |||||||||||||||||||
RETAIL CASH OPERATING COVERAGE RATIO
Most directly comparable IFRS financial measure: Retail expenses below gross margin as a percentage of Retail gross margin.
Definition: Retail gross margin less depreciation and amortization, EBIT and Merger-related adjustments, divided by Retail gross margin excluding depreciation and amortization expense in cost of goods sold.
Why we use the measure and why it is useful to investors: To understand the costs and underlying economics of our Retail operations and to assess our Retail operating performance and ability to generate free cash flow.
| Rolling four quarters ended December 31, 2018 | ||||||||||||||||||||
| Dollars (millions), except percentage amounts | Q1 2018 | Q2 2018 | Q3 2018 | Q4 2018 | Total | |||||||||||||||
| Gross margin |
$ | 408 | $ | 1,432 | $ | 533 | $ | 662 | $ | 3,035 | ||||||||||
| Depreciation and amortization in cost of goods sold |
2 | 2 | 1 | 2 | 7 | |||||||||||||||
| Gross margin excluding depreciation and amortization |
$ | 410 | $ | 1,434 | $ | 534 | $ | 664 | $ | 3,042 | ||||||||||
| EBIT |
(133 | ) | 764 | (6 | ) | 82 | 707 | |||||||||||||
| Depreciation and amortization |
123 | 122 | 122 | 132 | 499 | |||||||||||||||
| Merger-related adjustments 1 |
14 | 12 | 6 | 8 | 40 | |||||||||||||||
| Operating expenses excluding depreciation and amortization |
||||||||||||||||||||
| and Merger-related adjustments |
$ | 406 | $ | 536 | $ | 412 | $ | 442 | $ | 1,796 | ||||||||||
| 1 Adjusted for the impact of Merger-related presentation adjustments. |
|
|||||||||||||||||||
| Cash operating coverage ratio (%) |
59% | |||||||||||||||||||
ADJUSTED NET DEBT
Most directly comparable IFRS financial measure: Long-term debt.
Definition: Long-term debt less net unamortized fair value adjustments plus short-term debt and current portion of long-term debt.
Why we use the measure and why it is useful to investors: As a component of adjusted net debt to adjusted EBITDA, it is used to evaluate our ability to pay our debts. See note 25 to the financial statements for a reconciliation of adjusted net debt.
| NUTRIEN 2018 | 84 | ANNUAL REPORT |
MANAGEMENT'S DISCUSSION AND ANALYSIS
| Community Investment |
Represents cash disbursements, matching of employee gifts and in-kind contributions of equipment, goods and services and employee volunteerism (on corporate time). | |
| Compound Annual Growth Rate (CAGR) |
CAGR is the rate of return that would be required for an investment to grow from its beginning balance to its ending balance assuming the profits were reinvested at the end of each year of the investment’s lifespan. | |
| Environmental Incidents |
Number of incidents includes release quantities that exceed the US Comprehensive Environmental Response, Compensation, and Liability Act (CERCLA) limits, in Potash facilities any release that exceeds Saskatchewan Release Limits (based on the Saskatchewan Environmental Code), non-compliance incidents that exceed $10 thousand in costs to reach compliance or enforcement actions with fines exceeding $1 thousand. | |
| Employee Turnover Rate |
The number of permanent employees who left the Company (due to deaths and voluntary and involuntary terminations, and excluding retirements and announced workforce reductions) as a percentage of average total employees during the year. Retirements and terminations of temporary employees are excluded. | |
| Investing Capital |
Capital for significant expansions of current operations or to create cost savings (synergies), including capitalized interest. Investing capital excludes capital outlays for business acquisitions and equity-accounted investees. | |
| Net Sales |
Sales minus freight, transportation and distribution expenses. | |
| Lost-Time Injury Frequency |
Total lost-time injuries for every 200,000 hours worked for all Nutrien employees, contractors and others on site. Calculated as the total lost-time injuries multiplied by 200,000 hours worked divided by the actual number of hours worked. | |
| Merger |
The merger of equals transaction between PotashCorp and Agrium completed effective January 1, 2018, pursuant to which PotashCorp and Agrium combined their businesses pursuant to a statutory plan of arrangement under the Canada Business Corporations Act and became wholly owned subsidiaries of Nutrien Ltd. | |
| Purchase Price Allocation (PPA) |
The allocation of the purchase price in a business combination to the fair values of assets acquired and liabilities assumed. The PPA adjustments impacted net earnings primarily through increased depreciation and amortization and decreased finance costs. | |
| Sustaining Capital |
Sustaining capital expenditures are required to sustain operations at existing levels and include major repairs and maintenance and plant turnarounds. | |
| Taxes and Royalties |
Includes tax and royalty amounts on an accrual basis calculated as: current income tax expense from continuing and discontinued operations minus investment tax credits and realized excess tax benefit related to share-based compensation plus potash production tax, resource surcharge, royalties, municipal taxes and other miscellaneous taxes. | |
| Total Recordable Injury Frequency |
Total recordable injuries for every 200,000 hours worked for all Nutrien employees, contractors and others on site. Calculated as the total recordable injuries multiplied by 200,000 hours worked divided by the actual number of hours worked. | |
| Total Shareholder Return |
Return on investment in Nutrien shares from the time the investment is made based on two components: (1) growth in share price and (2) return from reinvested dividend income on the shares. | |
| Working Capital Ratio |
Current assets divided by current liabilities. | |
| NUTRIEN 2018 | 87 | ANNUAL REPORT |