.3


.3
| P | Includes Accounting Policies |
| E | Includes Accounting Estimates and Judgments |
Management’s Responsibility
Management’s Responsibility for Financial Reporting
|
|

| |
| Chuck Magro President and Chief Executive Officer February 20, 2019 |
Pedro Farah Chief Financial Officer February 20, 2019 |
| NUTRIEN 2018 | 90 | ANNUAL REPORT |
FINANCIAL STATEMENTS AND NOTES
Report of Independent
Registered Public Accounting Firm – 2018
To the Shareholders and the Board of Directors of Nutrien Ltd.
| NUTRIEN 2018 | 91 | ANNUAL REPORT |
Report of Independent
Registered Public Accounting Firm – 2018
To the Shareholders and the Board of Directors of Nutrien Ltd.
| NUTRIEN 2018 | 92 | ANNUAL REPORT |
FINANCIAL STATEMENTS AND NOTES
Report of Independent
Registered Public Accounting Firm – 2017
To the Shareholders and the Board of Directors of Potash Corporation of Saskatchewan Inc.
| NUTRIEN 2018 | 93 | ANNUAL REPORT |
IN MILLIONS OF US DOLLARS EXCEPT AS OTHERWISE NOTED
Consolidated Financial Statements
Consolidated Statements of Earnings
| For the years ended December 31 | 2018 | 2017 | ||||||||||||
| (Note 33) | ||||||||||||||
| SALES |
Note 4 | $ | 19,636 | $ | 4,547 | |||||||||
| Freight, transportation and distribution |
Note 5 | (864 | ) | (537 | ) | |||||||||
| Cost of goods sold |
Note 5 | (13,380 | ) | (3,316 | ) | |||||||||
| GROSS MARGIN |
5,392 | 694 | ||||||||||||
| Selling expenses |
Note 5 | (2,337 | ) | (29 | ) | |||||||||
| General and administrative expenses |
Note 5 | (539 | ) | (185 | ) | |||||||||
| Provincial mining and other taxes |
Note 6 | (250 | ) | (146 | ) | |||||||||
| Impairment of property, plant and equipment |
Note 16 | (1,809 | ) | – | ||||||||||
| Other expenses |
Note 7 | (43 | ) | (125 | ) | |||||||||
| EARNINGS BEFORE FINANCE COSTS AND INCOME TAXES |
414 | 209 | ||||||||||||
| Finance costs |
Note 8 | (538 | ) | (238 | ) | |||||||||
| LOSS BEFORE INCOME TAXES |
(124 | ) | (29 | ) | ||||||||||
| Income tax recovery |
Note 9 | 93 | 183 | |||||||||||
| NET (LOSS) EARNINGS FROM CONTINUING OPERATIONS |
(31 | ) | 154 | |||||||||||
| Net earnings from discontinued operations |
Note 10 | 3,604 | 173 | |||||||||||
| NET EARNINGS |
$ | 3,573 | $ | 327 | ||||||||||
| NET (LOSS) EARNINGS PER SHARE FROM CONTINUING OPERATIONS |
Note 11 | |||||||||||||
| Basic |
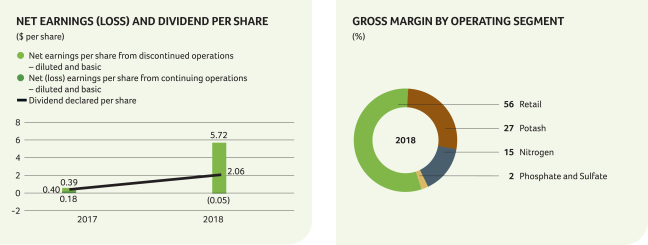
$ | (0.05 | ) | $ | 0.18 | |||||||||
| Diluted |
$ | (0.05 | ) | $ | 0.18 | |||||||||
| NET EARNINGS PER SHARE FROM DISCONTINUED OPERATIONS |
Note 11 | |||||||||||||
| Basic |
$ | 5.77 | $ | 0.21 | ||||||||||
| Diluted |
$ | 5.77 | $ | 0.21 | ||||||||||
| NET EARNINGS PER SHARE FROM CONTINUING AND DISCONTINUED OPERATIONS |
Note 11 | |||||||||||||
| Basic |
$ | 5.72 | $ | 0.39 | ||||||||||
| Diluted |
$ | 5.72 | $ | 0.39 | ||||||||||
| Weighted average shares outstanding for basic earnings per share (“EPS”) |
Note 11 | 624,900,000 | 840,079,000 | |||||||||||
| Weighted average shares outstanding for diluted EPS |
Note 11 | 624,900,000 | 840,316,000 | |||||||||||
(See Notes to the Consolidated Financial Statements)
2018 HIGHLIGHTS
| • | Merger of Potash Corporation of Saskatchewan Inc. (“PotashCorp”) and Agrium Inc. (“Agrium”) occurred on January 1, 2018. As a result, the 2017 figures throughout are the financial results of PotashCorp only, the accounting acquirer. |
| NUTRIEN 2018 | 94 | ANNUAL REPORT |
FINANCIAL STATEMENTS AND NOTES
IN MILLIONS OF US DOLLARS EXCEPT AS OTHERWISE NOTED
Consolidated Statements of Comprehensive Income
| For the years ended December 31 (net of related income taxes) | 2018 | 2017 | ||||||||||||||
| (Note 33) | ||||||||||||||||
| NET EARNINGS |
$ | 3,573 | $ | 327 | ||||||||||||
| Other comprehensive (loss) income |
||||||||||||||||
| Items that will not be reclassified to net earnings: |
||||||||||||||||
| Net actuarial gain on defined benefit plans |
54 | 46 | ||||||||||||||
| Net fair value (loss) gain on investments 1 |
(99 | ) | 30 | |||||||||||||
| Items that have been or may be subsequently reclassified to net earnings: |
||||||||||||||||
| Loss on currency translation of foreign operations |
(249 | ) | – | |||||||||||||
| Other |
(8 | ) | 20 | |||||||||||||
| OTHER COMPREHENSIVE (LOSS) INCOME |
(302 | ) | 96 | |||||||||||||
| COMPREHENSIVE INCOME |
$ | 3,271 | $ | 423 | ||||||||||||
| 1 | As at December 31, 2018 and 2017, financial instruments measured at fair value through other comprehensive income (“FVTOCI”) are comprised of shares in Sinofert Holdings Limited (“Sinofert”) and other. The Company’s investment in Israel Chemicals Ltd. (“ICL”) was classified as held for sale at December 31, 2017 and the divestiture of all equity interests in ICL was completed on January 24, 2018. |
(See Notes to the Consolidated Financial Statements)
| NUTRIEN 2018 | 95 | ANNUAL REPORT |
IN MILLIONS OF US DOLLARS EXCEPT AS OTHERWISE NOTED
Consolidated Statements of Cash Flows
| For the years ended December 31 | 2018 | 2017 | ||||||||||||||||
| OPERATING ACTIVITIES |
||||||||||||||||||
| Net earnings |
$ | 3,573 | $ | 327 | ||||||||||||||
| Adjustments to reconcile net earnings to cash provided by operating activities |
Note 12 | (383 | ) | 826 | ||||||||||||||
| Changes in non-cash operating working capital |
Note 12 | (1,138 | ) | 72 | ||||||||||||||
| CASH PROVIDED BY OPERATING ACTIVITIES |
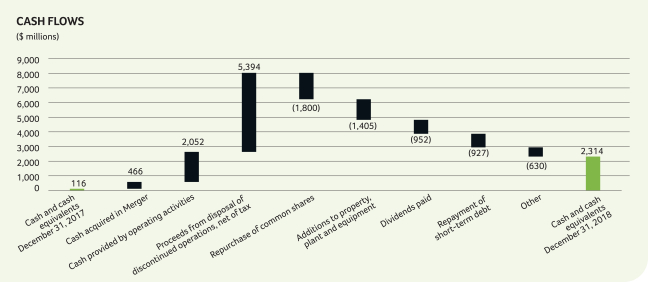
2,052 | 1,225 | ||||||||||||||||
| INVESTING ACTIVITIES |
||||||||||||||||||
| Cash acquired in Merger |
Note 3 | 466 | – | |||||||||||||||
| Business acquisitions, net of cash acquired |
Note 3 | (433 | ) | – | ||||||||||||||
| Additions to property, plant and equipment |
Note 16 | (1,405 | ) | (651 | ) | |||||||||||||
| Proceeds from disposal of discontinued operations, net of tax |
Note 10 | 5,394 | – | |||||||||||||||
| Purchase of investments |
(135 | ) | – | |||||||||||||||
| Other |
– | (1 | ) | |||||||||||||||
| CASH PROVIDED BY (USED IN) INVESTING ACTIVITIES |
3,887 | (652 | ) | |||||||||||||||
| FINANCING ACTIVITIES |
||||||||||||||||||
| Finance costs on long-term debt |
(21 | ) | (1 | ) | ||||||||||||||
| (Repayment of) proceeds from short-term debt |
Note 22 | (927 | ) | 341 | ||||||||||||||
| Repayment of long-term debt |
Note 23 | (12 | ) | (500 | ) | |||||||||||||
| Dividends paid |
Note 24 | (952 | ) | (330 | ) | |||||||||||||
| Repurchase of common shares |
Note 24 | (1,800 | ) | – | ||||||||||||||
| Issuance of common shares |
Note 24 | 7 | 1 | |||||||||||||||
| CASH USED IN FINANCING ACTIVITIES |
(3,705 | ) | (489 | ) | ||||||||||||||
| EFFECT OF EXCHANGE RATE CHANGES ON CASH AND CASH EQUIVALENTS |
(36 | ) | – | |||||||||||||||
| INCREASE IN CASH AND CASH EQUIVALENTS |
2,198 | 84 | ||||||||||||||||
| CASH AND CASH EQUIVALENTS, BEGINNING OF YEAR |
116 | 32 | ||||||||||||||||
| CASH AND CASH EQUIVALENTS, END OF YEAR |
$ | 2,314 | $ | 116 | ||||||||||||||
| Cash and cash equivalents comprised of: |
||||||||||||||||||
| Cash |
$ | 1,506 | $ | 14 | ||||||||||||||
| Short-term investments |
808 | 102 | ||||||||||||||||
| $ | 2,314 | $ | 116 | |||||||||||||||
(See Notes to the Consolidated Financial Statements)
2018 HIGHLIGHTS
The graph below represents the significant changes in Nutrien’s cash flows in 2018.
| NUTRIEN 2018 | 96 | ANNUAL REPORT |
FINANCIAL STATEMENTS AND NOTES
IN MILLIONS OF US DOLLARS EXCEPT AS OTHERWISE NOTED
Consolidated Statements of Changes
in Shareholders’ Equity
| Accumulated Other Comprehensive (Loss) Income (“AOCI”) | ||||||||||||||||||||||||||||||||||||
| Share Capital |
Contributed Surplus |
Net Fair Loss on |
Net Actuarial Gain on Defined Benefit Plans 3 |
Loss on Currency Translation of Foreign Operations |
Other | Total AOCI |
Retained Earnings |
Total Equity 4 |
||||||||||||||||||||||||||||
| (Note 33) | (Note 33) | |||||||||||||||||||||||||||||||||||
| BALANCE – DECEMBER 31, 2016 |
$ | 1,798 | $ | 222 | $ | 43 | $ | – | $ | (2 | ) | $ (66 | ) | $ | (25 | ) | $ | 6,204 | $ | 8,199 | ||||||||||||||||
| Net earnings |
– | – | – | – | – | – | – | 327 | 327 | |||||||||||||||||||||||||||
| Other comprehensive income |
– | – | 30 | 46 | – | 20 | 96 | – | 96 | |||||||||||||||||||||||||||
| Dividends declared |
– | – | – | – | – | – | – | (335 | ) | (335 | ) | |||||||||||||||||||||||||
| Effect of share-based compensation including issuance of common shares |
2 | 8 | – | – | – | – | – | – | 10 | |||||||||||||||||||||||||||
| Shares issued for dividend reinvestment plan |
6 | – | – | – | – | – | – | – | 6 | |||||||||||||||||||||||||||
| Transfer of net actuarial gain on defined benefit plans |
– | – | – | (46 | ) | – | – | (46 | ) | 46 | – | |||||||||||||||||||||||||
| BALANCE – DECEMBER 31, 2017 |
$ | 1,806 | $ | 230 | $ | 73 | $ | – | $ | (2 | ) | $ | (46 | ) | $ | 25 | $ | 6,242 | $ | 8,303 | ||||||||||||||||
| Merger impact (Notes 3 and 11) |
15,898 | 7 | – | – | – | – | – | (1 | ) | 15,904 | ||||||||||||||||||||||||||
| Net earnings |
– | – | – | – | – | – | – | 3,573 | 3,573 | |||||||||||||||||||||||||||
| Other comprehensive (loss) income |
– | – | (99 | ) | 54 | (249 | ) | (8 | ) | (302 | ) | – | (302 | ) | ||||||||||||||||||||||
| Shares repurchased (Note 24) |
(998 | ) | (23 | ) | – | – | – | – | – | (831 | ) | (1,852 | ) | |||||||||||||||||||||||
| Dividends declared |
– | – | – | – | – | – | – | (1,273 | ) | (1,273 | ) | |||||||||||||||||||||||||
| Effect of share-based compensation including issuance of common shares |
34 | 17 | – | – | – | – | – | – | 51 | |||||||||||||||||||||||||||
| Transfer of net actuarial gain on defined benefit plans |
– | – | – | (54 | ) | – | – | (54 | ) | 54 | – | |||||||||||||||||||||||||
| Transfer of net loss on sale of investment |
– | – | 19 | – | – | – | 19 | (19 | ) | – | ||||||||||||||||||||||||||
| Transfer of net loss on cash flow hedges |
– | – | – | – | – | 21 | 21 | – | 21 | |||||||||||||||||||||||||||
| BALANCE – DECEMBER 31, 2018 |
$ | 16,740 | $ | 231 | $ | (7 | ) | $ | – | $ (251 | ) | $ | (33 | ) | $ | (291 | ) | $ | 7,745 | $ | 24,425 | |||||||||||||||
| 1 | The Company adopted IFRS 9 “Financial Instruments” in 2018 and reclassified available-for-sale investments as financial instruments measured at FVTOCI. |
| 2 | The Company divested its equity interests in the investment in ICL on January 24, 2018. The loss on sale of ICL of $(19) was transferred to retained earnings in 2018. The cumulative net unrealized gain at December 31, 2017 was $4. |
| 3 | Any amounts incurred during a period were closed out to retained earnings at each period-end. Therefore, no balance exists at the beginning or end of period. |
| 4 | All equity transactions were attributable to common shareholders. |
(See Notes to the Consolidated Financial Statements)
| NUTRIEN 2018 | 97 | ANNUAL REPORT |
FINANCIAL STATEMENTS AND NOTES
IN MILLIONS OF US DOLLARS EXCEPT AS OTHERWISE NOTED
|
|
DESCRIPTION OF BUSINESS
|
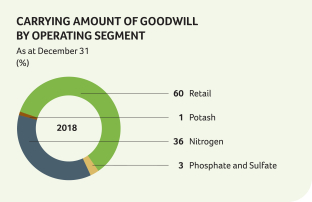
Nutrien Ltd. is an integrated ag solutions provider and plays a critical role in helping growers around the globe increase food production in a sustainable manner. The Company’s Retail segment supplies key products and services directly to growers – including crop nutrients, crop protection and seed, as well as agronomic and application services. The Company produces the three essential nutrients – potash, nitrogen and phosphate – required to help farmers grow healthier, more abundant crops.
| NUTRIEN 2018 | 99 | ANNUAL REPORT |
IN MILLIONS OF US DOLLARS EXCEPT AS OTHERWISE NOTED
|
|
BASIS OF PRESENTATION
|
|
|
BUSINESS COMBINATIONS
|
The Company’s business combinations include the Merger between PotashCorp and Agrium and the acquisition of Retail businesses, including farm centers in North America and Australia, digital agriculture, proprietary products and agricultural services. Assets acquired and liabilities assumed are measured at fair value.
| Accounting Policies | Accounting Estimates and Judgments | |||
| • The acquisition method is followed.
• Consideration is measured at the aggregate of the fair values of assets transferred, liabilities incurred or assumed, and equity instruments issued in exchange for control of the acquiree at the acquisition date.
• The acquisition date is the date the Company obtains control over the acquiree.
• Identifiable assets acquired and liabilities assumed are generally measured at fair value.
• Acquisition-related costs are recognized in net earnings as incurred.
• The excess of total consideration for each acquisition plus non-controlling interest in the acquiree, over the fair value of the identifiable net assets acquired, is recorded as goodwill. |
• Purchase price allocation involves judgment in identifying assets acquired and liabilities assumed and estimation of their fair values.
• Judgment is required to determine which entity is the acquirer in a merger of equals. In identifying PotashCorp as the acquirer, the companies considered the voting rights of all equity instruments, the intended corporate governance structure of the combined company, the intended composition of senior management of the combined company and the size of each of the companies. In assessing the size of each of the companies, the companies evaluated various metrics. No single factor was the sole determinant in the overall conclusion that PotashCorp is the acquirer for accounting purposes; rather, all factors were considered in arriving at the conclusion. |
| NUTRIEN 2018 | 100 | ANNUAL REPORT |
FINANCIAL STATEMENTS AND NOTES
IN MILLIONS OF US DOLLARS EXCEPT AS OTHERWISE NOTED
NOTE 3 BUSINESS COMBINATIONS CONTINUED
| NUTRIEN 2018 | 101 | ANNUAL REPORT |
IN MILLIONS OF US DOLLARS EXCEPT AS OTHERWISE NOTED
NOTE 3 BUSINESS COMBINATIONS CONTINUED
| NUTRIEN 2018 | 102 | ANNUAL REPORT |
FINANCIAL STATEMENTS AND NOTES
IN MILLIONS OF US DOLLARS EXCEPT AS OTHERWISE NOTED
|
|
SEGMENT INFORMATION
|
The Company has four reportable operating segments: Retail, Potash, Nitrogen, and Phosphate and Sulfate. The Retail segment distributes crop nutrients, crop protection products, seed and merchandise, and provides services directly to growers through a network of farm centers in North and South America and Australia. The Potash, Nitrogen, and Phosphate and Sulfate segments are differentiated by the chemical nutrient contained in the products that each produces.
| Accounting Policies | Accounting Estimates and Judgments | |||
| Operating Segments Prior to the Merger, the Company identified the Chief Executive Officer as the Chief Operating Decision Maker (“CODM”) under IFRS and used gross margin to measure the segments’ profit or loss. The operating segments were limited to the following: Potash, Nitrogen and Phosphate. The changes in the structure of the Company’s internal organization as a result of the Merger caused the composition of the operating segments to change as well as who the Company identified to be the CODM.
Post-Merger, the Company identified the Executive Leadership Team (“ELT”), comprised of officers at the Executive Vice President level and above, as the CODM. The CODM uses net (loss) earnings before finance costs, income taxes, and depreciation and amortization (“EBITDA”) to measure performance and allocate resources to the operating segments. The CODM believes EBITDA to be an important measure as it excludes the effects of items that primarily reflect the impact of long-term investment and financing decisions, rather than the performance of the Company’s day-to-day operations.
In 2019, the Company’s CODM reassessed product groupings and decided to evaluate the performance of sulfate products as part of the Nitrogen segment, rather than the Phosphate and Sulfate segment; therefore, future comparative figures will be restated for the change in the composition of the segments, which will result in an increase in the Nitrogen segment and a decrease in the Phosphate and Sulfate segment. For the year ended December 31, 2018, this change will be approximately $121, $42, and $69 in sales, gross margin and EBITDA, respectively. |
Operating Segments Judgment is used in determining the composition of the reportable segments based on factors including risks and returns, internal organization, and internal reports reviewed by the CODM.
Certain expenses are allocated across segments based on an appropriate basis such as production capacities or historical trends. |
| Revenue The Company recognizes revenue when it transfers control over a good or service to a customer.
|
Revenue For product sales which contain volume rebates, revenue is recognized to the extent that it is highly probable that significant reversals will not occur using the most likely method and accumulated experience.
Returns and incentives are estimated based on historical and forecasted data, contractual terms and current conditions. Due to the nature of goods and services sold, any single estimate would have only a negligible impact on revenue recognition. | |||||||
| Retail | Potash, Nitrogen, and Phosphate and Sulfate | |||||||
| Transfer of control for the sale of goods | ||||||||
| At the point in time when the product is:
• purchased at the Company’s Retail farm center or
• delivered and accepted by customers at their premises |
At the point in time when the product is:
• loaded for shipping or
• delivered to the customer | |||||||
| Transfer of control for services | ||||||||
| When the promised service is rendered | When the promised service is rendered | |||||||
| Retail Sales revenue consists primarily of:
• Crop nutrients – sales of dry and liquid macronutrient products which include nitrogen, potash and phosphate, proprietary liquid micronutrient products and nutrient application services;
• Crop protection products – sales of various third-party supplier and proprietary products designed to maintain crop quality and manage plant diseases, weeds, and other pests; |
| NUTRIEN 2018 | 103 | ANNUAL REPORT |
IN MILLIONS OF US DOLLARS EXCEPT AS OTHERWISE NOTED
NOTE 4 SEGMENT INFORMATION CONTINUED
| Accounting Policies | Accounting Estimates and Judgments | |||
|
• Seed – various third-party supplier seed brands and proprietary seed product lines;
• Merchandise – sales of fencing, feed supplements, livestock-related animal health products, storage and irrigation equipment, and other products; and
• Services and other revenues – sales of product application, soil and leaf testing, crop scouting and precision agriculture services, financial services and livestock marketing.
Provisions for returns, trade discounts and rebates are deducted from sales revenue.
Potash, Nitrogen, and Phosphate and Sulfate
The Company manufactures and sells potash, nitrogen, and phosphate and sulfate products. While agriculture is the Company’s primary market, it also produces products for animal nutrition and industrial uses.
The Company’s sales revenue is recorded and measured based on the “freight on board” mine, plant, warehouse or terminal price specified in the contract (except for certain vessel sales or specific product sales that are shipped and recorded on a delivered basis), which reflects the consideration the Company expects to be entitled to in exchange for the goods or services, net of any variable consideration (e.g., any trade discounts or estimated volume rebates). Where volume rebates are provided for in customer contracts, the Company estimates revenue at the earlier of the most likely amount of consideration expected to be received or when the consideration becomes fixed. The Company’s customer contracts may provide certain product quality specification guarantees but do not generally provide for refunds or returns.
Sales prices are based on North American and International benchmark market prices which are variable and subject to global supply and demand, and competitive factors. |
| Potash | Nitrogen | Phosphate and Sulfate | ||||||||
| Products | • North American – primarily granular • Offshore (International) – primarily granular and standard |
• Ammonia, urea, urea ammonium nitrate, and industrial grade ammonium nitrate |
• Solid fertilizer, liquid fertilizer, industrial products and feed products |
|||||||
| Sales prices impacted by | • North American prices referenced at delivered prices (including transportation and distribution costs)
• International prices referenced at the mine site (excluding transportation and distribution costs) |
• Global energy costs and supply |
• Global ammonia and sulfur costs and supply |
|||||||
| Other The Company does not provide general warranties. Intersegment sales are made under terms that approximate market value. Transportation costs are generally recovered from the customer through sales pricing.
Seasonality in the Company’s business results from increased demand for products during planting season. Crop input sales are generally higher in spring and fall crop input application seasons. Crop nutrient inventories are normally accumulated leading up to each application season. The Company’s cash collections generally occur after the application season is complete while customer prepayments are concentrated in December and January. |
| NUTRIEN 2018 | 104 | ANNUAL REPORT |
FINANCIAL STATEMENTS AND NOTES
IN MILLIONS OF US DOLLARS EXCEPT AS OTHERWISE NOTED
NOTE 4 SEGMENT INFORMATION CONTINUED
Supporting Information
Financial information on each of these segments is summarized in the following tables:
| 2018 | Retail | Potash | Nitrogen | Phosphate and Sulfate |
Others | Eliminations | Consolidated | |||||||||||||||||||||
| Sales – third party |
$ | 12,620 | $ | 2,796 | $ | 2,651 | $ | 1,569 | $ | – | $ | – | $ | 19,636 | ||||||||||||||
| – intersegment |
50 | 220 | 566 | 328 | – | (1,164 | ) | – | ||||||||||||||||||||
| Sales – total |
12,670 | 3,016 | 3,217 | 1,897 | – | (1,164 | ) | 19,636 | ||||||||||||||||||||
| Freight, transportation and distribution |
– | (349 | ) | (358 | ) | (230 | ) | – | 73 | (864 | ) | |||||||||||||||||
| Net sales |
12,670 | 2,667 | 2,859 | 1,667 | – | (1,091 | ) | |||||||||||||||||||||
| Cost of goods sold |
(9,635 | ) | (1,183 | ) | (2,079 | ) | (1,539 | ) | – | 1,056 | (13,380 | ) | ||||||||||||||||
| Gross margin |
3,035 | 1,484 | 780 | 128 | – | (35 | ) | 5,392 | ||||||||||||||||||||
| Selling expenses |
(2,303 | ) | (14 | ) | (32 | ) | (10 | ) | 22 | – | (2,337 | ) | ||||||||||||||||
| General and administrative expenses |
(100 | ) | (10 | ) | (20 | ) | (9 | ) | (400 | ) | – | (539 | ) | |||||||||||||||
| Provincial mining and other taxes |
– | (244 | ) | (3 | ) | (1 | ) | (2 | ) | – | (250 | ) | ||||||||||||||||
| Impairment of property, plant and equipment (Note 16) |
– | (1,809 | ) | – | – | – | – | (1,809 | ) | |||||||||||||||||||
| Other income (expenses) |
75 | (14 | ) | 8 | (6 | ) | (106 | ) | – | (43 | ) | |||||||||||||||||
| Earnings (loss) before finance costs and income taxes |
707 | (607 | ) | 733 | 102 | (486 | ) | (35 | ) | 414 | ||||||||||||||||||
| Depreciation and amortization |
499 | 404 | 429 | 206 | 54 | – | 1,592 | |||||||||||||||||||||
| EBITDA 1 |
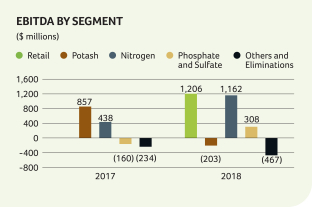
$ | 1,206 | $ | (203 | ) | $ | 1,162 | $ | 308 | $ | (432 | ) | $ | (35 | ) | $ | 2,006 | |||||||||||
| Assets 2 |
$ | 17,964 | $ | 11,710 | $ | 10,009 | $ | 2,783 | $ | 3,678 | $ | (642 | ) | $ | 45,502 | |||||||||||||
| 1 | EBITDA is a non-IFRS measure calculated as net (loss) earnings from continuing operations before finance costs, income taxes, and depreciation and amortization. Nutrien uses EBITDA as a supplemental measure. Generally, this measure is a numerical measure of a company’s performance, that either excludes or includes amounts that are not normally excluded or included in the most directly comparable measure calculated and presented in accordance with IFRS. In evaluating this measure, investors should consider that the methodology applied in calculating this measure may differ among companies and analysts. The Company uses both IFRS and certain non-IFRS measures to assess performance. Management believes the non-IFRS measures provide useful supplemental information to investors in order that they may evaluate Nutrien’s financial performance using the same measures as management. Management believes that, as a result, the investor is afforded greater transparency in assessing the financial performance of the Company. This non-IFRS financial measure should not be considered as a substitute for, nor superior to, measures of financial performance prepared in accordance with IFRS. |
| 2 | Included in the Nitrogen and Retail segments are $428 and $208 relating to equity-accounted investees, respectively, as described in Note 21. |
| NUTRIEN 2018 | 105 | ANNUAL REPORT |
IN MILLIONS OF US DOLLARS EXCEPT AS OTHERWISE NOTED
NOTE 4 SEGMENT INFORMATION CONTINUED
| 2017 | Potash | Nitrogen | Phosphate and Sulfate |
Others | Eliminations | Consolidated | ||||||||||||||||||
| Sales – third party |
$ | 1,868 | $ | 1,395 | $ | 1,284 | $ | – | $ | – | $ | 4,547 | ||||||||||||
| – intersegment |
– | 74 | – | – | (74 | ) | – | |||||||||||||||||
| Sales – total |
1,868 | 1,469 | 1,284 | – | (74 | ) | 4,547 | |||||||||||||||||
| Freight, transportation and distribution |
(235 | ) | (129 | ) | (173 | ) | – | – | (537 | ) | ||||||||||||||
| Net sales |
1,633 | 1,340 | 1,111 | – | (74 | ) | ||||||||||||||||||
| Cost of goods sold 1 |
(829 | ) | (1,084 | ) | (1,477 | ) | – | 74 | (3,316 | ) | ||||||||||||||
| Gross margin |
804 | 256 | (366 | ) | – | – | 694 | |||||||||||||||||
| Selling expenses |
(7 | ) | (14 | ) | (6 | ) | (2 | ) | – | (29 | ) | |||||||||||||
| General and administrative expenses |
(7 | ) | (4 | ) | (4 | ) | (170 | ) | – | (185 | ) | |||||||||||||
| Provincial mining and other taxes |
(146 | ) | – | – | – | – | (146 | ) | ||||||||||||||||
| Other expenses |
(19 | ) | (3 | ) | (4 | ) | (99 | ) | – | (125 | ) | |||||||||||||
| Earnings (loss) before finance costs and |
625 | 235 | (380 | ) | (271 | ) | – | 209 | ||||||||||||||||
| Depreciation and amortization |
232 | 203 | 220 | 37 | – | 692 | ||||||||||||||||||
| EBITDA |
$ | 857 | $ | 438 | $ | (160 | ) | $ | (234 | ) | $ | – | $ | 901 | ||||||||||
| Assets 2 |
$ | 9,756 | $ | 2,577 | $ | 1,938 | $ | 2,727 | $ | – | $ | 16,998 | ||||||||||||
| 1 | Included in the Phosphate and Sulfate segment is $305 of impairment of property, plant and equipment as described in Note 16. |
| 2 | Included in the total assets relating to the Others segment is $1,858 relating to the investments held for sale as described in Note 10. |
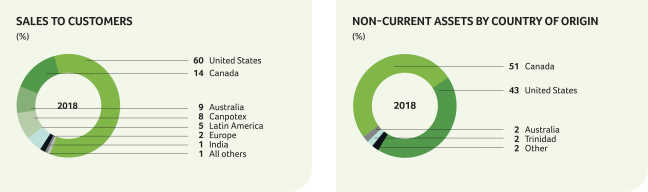
Financial information by geographic area is summarized in the following tables:
| Country of Origin | ||||||||||||||||||||||||
| 2018 | United States | Canada | Australia | Trinidad | Other | Consolidated | ||||||||||||||||||
| Sales to customers outside the Company |
||||||||||||||||||||||||
| United States |
$ | 10,488 | $ | 1,249 | $ | – | $ | 153 | $ | 1 | $ | 11,891 | ||||||||||||
| Canada |
208 | 2,582 | – | – | – | 2,790 | ||||||||||||||||||
| Australia |
2 | – | 1,679 | – | – | 1,681 | ||||||||||||||||||
| Canpotex 1 |
– | 1,657 | – | – | – | 1,657 | ||||||||||||||||||
| Mexico |
70 | – | – | 15 | – | 85 | ||||||||||||||||||
| Trinidad |
9 | – | – | 181 | – | 190 | ||||||||||||||||||
| Argentina |
9 | – | – | – | 378 | 387 | ||||||||||||||||||
| Brazil |
38 | – | – | – | 74 | 112 | ||||||||||||||||||
| Colombia |
9 | – | – | 42 | – | 51 | ||||||||||||||||||
| Other Latin America |
20 | – | – | 59 | 92 | 171 | ||||||||||||||||||
| India |
151 | – | – | – | – | 151 | ||||||||||||||||||
| Europe |
11 | 58 | 67 | 93 | 83 | 312 | ||||||||||||||||||
| Other |
22 | – | 100 | 32 | 4 | 158 | ||||||||||||||||||
| $ | 11,037 | $ | 5,546 | $ | 1,846 | $ | 575 | $ | 632 | $ | 19,636 | |||||||||||||
| Non-current assets 2 |
$ | 14,501 | $ | 17,100 | $ | 607 | $ | 570 | $ | 621 | $ | 33,399 | ||||||||||||
| 1 | As described in Note 1, Canpotex executed offshore marketing, sales and distribution functions for certain of the Company’s products. Canpotex’s 2018 sales volumes were made to: Latin America 33%, China 18%, India 10%, Other Asian markets 31%, other markets 8% (Note 30). |
| 2 | Includes non-current assets other than financial instruments, deferred tax assets and post-employment benefit assets. |
| NUTRIEN 2018 | 106 | ANNUAL REPORT |
FINANCIAL STATEMENTS AND NOTES
IN MILLIONS OF US DOLLARS EXCEPT AS OTHERWISE NOTED
NOTE 4 SEGMENT INFORMATION CONTINUED
| Country of Origin | ||||||||||||||||||||
| 2017 | United States | Canada | Trinidad |
Other | Consolidated | |||||||||||||||
| Sales to customers outside the Company |
||||||||||||||||||||
| United States |
$ | 1,657 | $ | 784 | $ | 274 | $ | – | $ | 2,715 | ||||||||||
| Canada |
194 | 95 | – | – | 289 | |||||||||||||||
| Canpotex 1 |
– | 988 | – | – | 988 | |||||||||||||||
| Mexico |
76 | – | 9 | – | 85 | |||||||||||||||
| Trinidad |
– | – | 132 | – | 132 | |||||||||||||||
| Brazil |
26 | 1 | – | – | 27 | |||||||||||||||
| Colombia |
12 | – | 36 | – | 48 | |||||||||||||||
| Other Latin America |
26 | – | 42 | – | 68 | |||||||||||||||
| India |
97 | – | 7 | – | 104 | |||||||||||||||
| Other |
10 | – | 81 | – | 91 | |||||||||||||||
| $ | 2,098 | $ | 1,868 | $ | 581 | $ | – | $ | 4,547 | |||||||||||
| Non-current assets 2 |
$ | 3,259 | $ | 9,501 | $ | 554 | $ | 6 | $ | 13,320 | ||||||||||
| 1 | Canpotex’s 2017 sales volumes were made to: Latin America 30%, China 18%, India 12%, Other Asian markets 33%, other markets 7% (Note 30). |
| 2 | Includes non-current assets other than financial instruments, deferred tax assets and post-employment benefit assets. |
The Company disaggregated revenue from contracts with customers by product line or geographic location for each reportable segment to show how the nature, amount, timing and uncertainty of revenue and cash flows are affected by economic factors.
| NUTRIEN 2018 | 107 | ANNUAL REPORT |
IN MILLIONS OF US DOLLARS EXCEPT AS OTHERWISE NOTED
|
|
NATURE OF EXPENSES
|
Accounting Policies
Cost of goods sold represents the cost of purchasing products for resale and costs primarily incurred at, and charged to, producing facilities.
The primary components of selling and general and administrative expenses are compensation, other employee costs, depreciation and amortization, other operating leases, and fleet fuel, repairs and maintenance.
Supporting Information
Expenses by nature were comprised of:
| Cost of Goods Sold | Other | Total | ||||||||||||||||||||||||||||||||||||||
| 2018 | 2017 | 2018 | 2017 | 2018 | 2017 | |||||||||||||||||||||||||||||||||||
| (Note 33) | (Note 33) | (Note 33) | ||||||||||||||||||||||||||||||||||||||
| Purchased and produced raw materials and product for resale 1 |
$ | 11,145 | $ | 1,724 | $ | – | $ | – | $ | 11,145 | $ | 1,724 | ||||||||||||||||||||||||||||
| Depreciation and amortization |
1,038 | 655 | 554 | 37 | 1,592 | 692 | ||||||||||||||||||||||||||||||||||
| Employee costs 2 |
713 | 563 | 1,236 | 113 | 1,949 | 676 | ||||||||||||||||||||||||||||||||||
| Freight (direct and indirect) |
303 | – | 631 | 372 | 934 | 372 | ||||||||||||||||||||||||||||||||||
| Impairment of property, plant and equipment (Note 16) |
– | 305 | – | – | – | 305 | ||||||||||||||||||||||||||||||||||
| Offsite warehouse costs 3 |
– | – | 69 | 47 | 69 | 47 | ||||||||||||||||||||||||||||||||||
| Railcar and vessel costs 3 |
– | – | 131 | 102 | 131 | 102 | ||||||||||||||||||||||||||||||||||
| Merger and related costs |
– | – | 170 | 84 | 170 | 84 | ||||||||||||||||||||||||||||||||||
| Other operating leases |
38 | – | 110 | – | 148 | – | ||||||||||||||||||||||||||||||||||
| Fleet fuel, repairs and maintenance |
– | – | 183 | – | 183 | – | ||||||||||||||||||||||||||||||||||
| Other |
143 | 69 | 699 | 121 | 842 | 190 | ||||||||||||||||||||||||||||||||||
| Total |
$ | 13,380 | $ | 3,316 | $ | 3,783 | $ | 876 | $ | 17,163 | $ | 4,192 | ||||||||||||||||||||||||||||
| Expenses included in: |
||||||||||||||||||||||||||||||||||||||||
| Freight, transportation and distribution |
|
$ | 864 | $ | 537 | |||||||||||||||||||||||||||||||||||
| Cost of goods sold |
13,380 | 3,316 | ||||||||||||||||||||||||||||||||||||||
| Selling expenses |
2,337 | 29 | ||||||||||||||||||||||||||||||||||||||
| General and administrative expenses |
539 | 185 | ||||||||||||||||||||||||||||||||||||||
| Other expenses |
43 | 125 | ||||||||||||||||||||||||||||||||||||||
| 1 | Significant expenses include: contract services, supplies, energy, fuel, purchases of raw material (natural gas – feedstock, sulfur, ammonia and reagents) and product for resale (crop nutrients and protection products, and seed). |
| 2 | Includes employee benefits and share-based compensation. In 2018, employee costs also include a $157 gain on curtailment of defined benefit pension and other post-retirement benefit plans (“Defined Benefit Plans Curtailment Gain”) as described in Note 28. |
| 3 | Includes expenses relating to operating leases. |
| NUTRIEN 2018 | 108 | ANNUAL REPORT |
FINANCIAL STATEMENTS AND NOTES
IN MILLIONS OF US DOLLARS EXCEPT AS OTHERWISE NOTED
|
|
PROVINCIAL MINING AND OTHER TAXES
|
Under Saskatchewan provincial legislation, the Company is subject to resource taxes, including the potash production tax and the resource surcharge.
| 2018 | 2017 | |||||||
| (Note 33) | ||||||||
| Saskatchewan potash production tax |
$ 160 | $ 95 | ||||||
| Saskatchewan resource surcharge and other |
90 | 51 | ||||||
| $ 250 | $ 146 | |||||||
|
|
OTHER EXPENSES
|
| 2018 | 2017 | |||||||||||
| (Note 33) | ||||||||||||
| Merger and related costs |
$ (170) | $ (84) | ||||||||||
| Defined Benefit Plans Curtailment Gain (Note 28) |
157 | – | ||||||||||
| Foreign exchange gain (loss) |
10 | (21) | ||||||||||
| Other expenses |
(40) | (20) | ||||||||||
| $ (43) | $ (125) | |||||||||||
|
|
FINANCE COSTS
|
| 2018 | 2017 | |||||||||||
| Interest expense |
||||||||||||
| Short-term debt |
$ 129 | $ 9 | ||||||||||
| Long-term debt |
372 | 206 | ||||||||||
| Unwinding of discount on asset retirement obligations (Note 20) |
51 | 17 | ||||||||||
| Interest on net defined benefit pension and other post-retirement plan obligations (Note 28) |
15 | 19 | ||||||||||
| Borrowing costs capitalized to property, plant and equipment |
(12) | (11) | ||||||||||
| Interest income |
(17) | (2) | ||||||||||
| $ 538 | $ 238 | |||||||||||
Borrowing costs capitalized to property, plant and equipment in 2018 were calculated by applying an average capitalization rate of 4.4 percent (2017 – 4.4 percent) to expenditures on qualifying assets.
See Note 12 for interest paid.
| NUTRIEN 2018 | 109 | ANNUAL REPORT |
IN MILLIONS OF US DOLLARS EXCEPT AS OTHERWISE NOTED
|
|
INCOME TAXES
|
This note explains the Company’s income tax recovery and tax-related balances within the consolidated financial statements. The deferred tax section provides information on expected future tax payments.
| Accounting Policies | Accounting Estimates and Judgments | |||||
| The Company operates in a specialized industry and in several tax jurisdictions. As a result, its income is subject to various rates of taxation. Taxation on items recognized in the consolidated statements of earnings, other comprehensive income (“OCI”) or contributed surplus is recognized in the same location as those items.
Taxation on (loss) earnings is comprised of current and deferred income tax.
|
Estimates and judgments to determine the Company’s taxes are impacted by:
• the breadth of the Company’s operations; and
• global complexity of tax regulations.
The final taxes paid, and potential adjustments to tax assets and liabilities, are dependent upon many factors including:
• negotiations with taxation authorities in various jurisdictions;
• outcomes of tax litigation; and
• resolution of disputes arising from federal, provincial, state and local tax audits.
Estimates and judgments are used to recognize the amount of deferred tax assets, which:
• includes the probability that future taxable profit will be available to use deductible temporary differences, and could be reduced if projected earnings are not achieved or increased if earnings previously not projected become probable. | |||||
| Current income tax is: |
Deferred income tax is: | |||||
|
• the expected tax payable on the taxable earnings for the year;
• calculated using rates enacted or substantively enacted at the dates of the consolidated balance sheets in the countries where the Company’s subsidiaries, held for sale investees and equity-accounted investees operate and generate taxable earnings; and
• inclusive of any adjustment to income tax payable or recoverable in respect of previous years. |
• recognized using the liability method;
• based on temporary differences between financial statements’ carrying amounts of assets and liabilities and their respective income tax bases; and
• determined using tax rates that have been enacted or substantively enacted by the dates of the consolidated balance sheets and are expected to apply when the related deferred income tax asset is realized or the deferred income tax liability is settled. |
|||||
|
Uncertain income tax positions are accounted for using the standards applicable to current income tax liabilities and assets, i.e., both liabilities and assets are recorded when probable and measured at the amount expected to be paid to (recovered from) the taxation authorities using the Company’s best estimate of the amount.
Deferred income tax is not accounted for:
• with respect to investments in subsidiaries and equity-accounted investees where the Company is able to control the reversal of the temporary difference and that difference is not expected to reverse in the foreseeable future; and
• if arising from initial recognition of an asset or liability in a transaction, other than a business combination, that at the time of the transaction affects neither accounting nor taxable profit or loss.
The realized and unrealized excess tax benefits from share-based payment arrangements are recognized in contributed surplus as current and deferred tax, respectively.
Deferred income tax assets are reviewed at each balance sheet date and amended to the extent that it is no longer probable that the related tax benefit will be realized.
Income tax assets and liabilities are offset when:
|
||||||
| For current income taxes, the Company has: | For deferred income taxes: | |||||
|
• a legally enforceable right to offset the recognized amounts 1 ; and
• the intention to settle on a net basis or realize the asset and settle the liability simultaneously. |
• the Company has a legally enforceable right to set off current tax assets against current tax liabilities; and
• they relate to income taxes levied by the same taxation authority on either: 1) the same taxable entity; or 2) different taxable entities intending to settle current tax liabilities and assets on a net basis, or realize assets and settle liabilities simultaneously in each future period. 2 |
|||||
|
1 For income taxes levied by the same taxation authority and the authority permits the Company to make or receive a single net payment or receipt. 2 In which significant amounts of deferred tax liabilities or assets expected are to be settled or recovered. |
||||||
| NUTRIEN 2018 | 110 | ANNUAL REPORT |
FINANCIAL STATEMENTS AND NOTES
IN MILLIONS OF US DOLLARS EXCEPT AS OTHERWISE NOTED
NOTE 9 INCOME TAXES CONTINUED
Supporting Information
Income Tax Balances
Income tax balances within the consolidated balance sheets as at December 31 were comprised of the following:
| Income Tax Assets (Liabilities) | Balance Sheet Location | 2018 | 2017 | |||||||||||||||
| Current income tax assets |
||||||||||||||||||
| Current |
Receivables (Note 14) | $ | 248 | $ | 24 | |||||||||||||
| Long-term |
Other assets (Note 18) | 36 | 64 | |||||||||||||||
| Deferred income tax assets |
Other assets (Note 18) | 216 | 18 | |||||||||||||||
| Total income tax assets |
$ | 500 | $ | 106 | ||||||||||||||
| Current income tax liabilities |
||||||||||||||||||
| Current |
Payables and accrued charges (Note 19) | $ | (47 | ) | $ | (16 | ) | |||||||||||
| Non-current |
Other non-current liabilities | (64 | ) | (43 | ) | |||||||||||||
| Deferred income tax liabilities |
Deferred income tax liabilities | (2,907 | ) | (2,205 | ) | |||||||||||||
| Total income tax liabilities |
$ | (3,018 | ) | $ | (2,264 | ) | ||||||||||||
| NUTRIEN 2018 | 111 | ANNUAL REPORT |
IN MILLIONS OF US DOLLARS EXCEPT AS OTHERWISE NOTED
NOTE 9 INCOME TAXES CONTINUED
Deferred Income Taxes
In respect of each type of temporary difference, unused tax loss and unused tax credit, the amounts of deferred tax assets and liabilities recognized in the consolidated balance sheets as at December 31 and the amount of the deferred tax recovery (expense) recognized in net (loss) earnings from continuing operations were:
| Deferred Income Tax Assets (Liabilities) |
Deferred Income Tax Recovery (Expense) Recognized in Net Earnings |
|||||||||||||||||||||||
| 2018 | 2017 | 2018 | 2017 | |||||||||||||||||||||
| Deferred income tax assets |
||||||||||||||||||||||||
| Asset retirement obligations and accrued environmental costs |
$ 412 | $ 120 | $ | (11 | ) | $ | (56 | ) | ||||||||||||||||
| Tax loss and other carryforwards |
261 | 13 | 198 | (105 | ) | |||||||||||||||||||
| Pension and other post-retirement benefit liabilities |
130 | 124 | (44 | ) | (22 | ) | ||||||||||||||||||
| Long-term debt |
110 | – | (10 | ) | – | |||||||||||||||||||
| Receivables |
58 | – | 3 | – | ||||||||||||||||||||
| Inventories |
54 | 4 | 13 | (2 | ) | |||||||||||||||||||
| Derivatives |
17 | 13 | (15 | ) | – | |||||||||||||||||||
| Other assets |
57 | 11 | (18 | ) | (11 | ) | ||||||||||||||||||
| Deferred income tax liabilities |
||||||||||||||||||||||||
| Property, plant and equipment |
(3,218 | ) | (2,441 | ) | 132 | 472 | ||||||||||||||||||
| Goodwill and other intangible assets |
(546 | ) | (17 | ) | 31 | – | ||||||||||||||||||
| Other liabilities |
(26 | ) | (14 | ) | (6 | ) | (3 | ) | ||||||||||||||||
| $ (2,691 | ) | $ (2,187 | ) | $ | 273 | $ | 273 | |||||||||||||||||
| NUTRIEN 2018 | 112 | ANNUAL REPORT |
FINANCIAL STATEMENTS AND NOTES
IN MILLIONS OF US DOLLARS EXCEPT AS OTHERWISE NOTED
|
|
DISCONTINUED OPERATIONS
|
Held for Sale and Discontinued Operations
| Accounting Policies | Accounting Estimates and Judgments | |||
| The Company classifies assets and liabilities as held for sale if it is highly probable that the carrying value will be recovered through a sale transaction within one year rather than through continuing use.
Discontinued operations represent a component of the Company’s business that either has been disposed of, or is classified as held for sale, and represents a separate major line of business or geographic area of operations or is a part of a single coordinated plan to dispose of a separate major line of business or geographical area of operations.
The Company’s significant policies include:
• cessation of equity accounting for associates and joint ventures at the date the investments were classified as held for sale;
• measurement of assets at the lower of carrying amount and fair value less costs to sell, with the exception of financial assets measured at FVTOCI;
• unrealized gains and losses on remeasurement of investments measured at FVTOCI are recorded, net of related income taxes, to OCI;
• dividends received are recorded on the consolidated statements of earnings; and
• the comparative statements of earnings and OCI are restated as if the operation had been discontinued from the start of the comparative year. |
Expected cost to sell the investments requires estimation, which is based on several factors such as historical trends of similar types of investments sold, the percentage of investments held relative to the total shares in circulation and the type of the investment.
Judgment involves determining:
• whether the highly probable standard is met and the date when equity accounting ceases; and
• if the business component for sale or disposal meets the criteria of a discontinued operation. |
The Company’s investments in SQM, ICL and APC were classified as held for sale and as discontinued operations in December 2017, due to regulatory requirements to dispose of these investments in connection with the Merger.
As of December 31, 2018, the Company completed all required divestitures and retained no residual interests as outlined below:
| For the year ended December 31, 2018 | Proceeds 1 | Gain (Loss) on Sale |
Gain (Loss) on Taxes |
AOCI | Net Earnings and Retained Earnings |
|||||||||||||||
| Shares in SQM |
$ | 5,126 | $ | 4,278 | $ | 3,366 | $ | – | $ | 3,366 | ||||||||||
| Shares in ICL |
685 | (19 | ) | (19 | ) | (19 | ) | – | ||||||||||||
| Shares in APC |
501 | 121 | 126 | – | 126 | |||||||||||||||
| Conda Phosphate operations |
98 | – | – | – | – | |||||||||||||||
| Total Sale |
$ | 6,410 | $ | 4,380 | $ | 3,473 | $ | (19 | ) | $ | 3,492 | |||||||||
| 1 | Proceeds are net of commissions. |
| NUTRIEN 2018 | 113 | ANNUAL REPORT |
IN MILLIONS OF US DOLLARS EXCEPT AS OTHERWISE NOTED
NOTE 10 DISCONTINUED OPERATIONS CONTINUED
Supporting Information
Cash flows from discontinued operations for the year ended December 31 were as follows:
| 2018 | 2017 | |||||||||||||||
| Cash provided by operating activities |
||||||||||||||||
| Dividends from discontinued operations |
$ | 156 | $ | 176 | ||||||||||||
| Income tax related to the disposal of discontinued operations |
(26 | ) | – | |||||||||||||
| Dividends from discontinued operations, net of tax |
$ | 130 | $ | 176 | ||||||||||||
| Cash provided by investing activities |
||||||||||||||||
| Proceeds from disposal of discontinued operations 1 |
$ | 6,371 | $ | – | ||||||||||||
| Income tax related to the disposal of discontinued operations |
(977 | ) | – | |||||||||||||
| Proceeds from disposal of discontinued operations, net of tax |
$ | 5,394 | $ | – | ||||||||||||
| 1 | Excludes a receivable of $39 to be collected in 2019. |
|
|
NET EARNINGS PER SHARE
|
Basic net earnings per share provides a measure of the interests of each ordinary common share in the Company’s performance over the year. Diluted net earnings per share adjusts basic net earnings per share for the effects of all dilutive potential common shares.
| 2018 1 | 2017 | |||||||||||||||
| WEIGHTED AVERAGE NUMBER OF COMMON SHARES |
624,900,000 | 840,079,000 | ||||||||||||||
| Dilutive effect of stock options 2 |
– | 3 | 199,000 | |||||||||||||
| Dilutive effect of share-settled performance share units (“PSUs”) 4 |
– | 3 | 38,000 | |||||||||||||
| Weighted average number of diluted common shares |
624,900,000 | 840,316,000 | ||||||||||||||
| 1 | The number of shares, stock options and share-settled PSUs reflect the Merger. Refer to Note 3 for details. |
| 2 | Diluted effect of stock options assumes exercise of all stock options with exercise prices at or below the average market price for the year would increase the denominator, and the denominator would be decreased by the number of shares that the Company could have repurchased if it had assumed proceeds from the exercise of stock options to repurchase them on the open market at the average share price for the year. |
| 3 | The diluted weighted average share calculations excluded an additional 658,000 stock options and 137,000 equity-settled PSUs due to their anti-dilutive effect. |
| 4 | Diluted effect of PSUs assumes the denominator would be increased by the total of the additional share-settled PSUs that could be issued if vesting criteria are achieved. |
| NUTRIEN 2018 | 114 | ANNUAL REPORT |
FINANCIAL STATEMENTS AND NOTES
IN MILLIONS OF US DOLLARS EXCEPT AS OTHERWISE NOTED
NOTE 11 NET EARNINGS PER SHARE CONTINUED
Options excluded from the calculation of diluted net earnings per share due to the option exercise prices being greater than the average market price of common shares were as follows:
| 2018 | 2017 | |||||||||||||||
| Number of options excluded |
5,721,656 | 12,304,351 | ||||||||||||||
| Performance option plan years fully excluded |
2009-2015 | 2008-2015, 2017 | ||||||||||||||
| Stock option plan years fully excluded |
2015, 2018 | – | ||||||||||||||
|
|
CONSOLIDATED STATEMENTS OF CASH FLOWS
|
Accounting Policy
Highly liquid investments with a maturity of three months or less from the date of purchase are considered to be cash equivalents.
Supporting Information
| For the years ended December 31 | 2018 | 2017 | ||||||||||||
| (Note 33 | ) | |||||||||||||
| RECONCILIATION OF CASH PROVIDED BY OPERATING ACTIVITIES |
||||||||||||||
| Net earnings |
$ | 3,573 | $ | 327 | ||||||||||
| Adjustments to reconcile net earnings to cash provided by operating activities |
||||||||||||||
| Gain on sale of investments in SQM and APC |
(4,399 | ) | – | |||||||||||
| Income tax related to the sale of the investment in SQM |
977 | – | ||||||||||||
| Depreciation and amortization |
1,592 | 692 | ||||||||||||
| Impairment of property, plant and equipment (Note 16) |
1,809 | 305 | ||||||||||||
| Share-based compensation (Note 29) |
116 | 11 | ||||||||||||
| Recovery of deferred income tax |
(290 | ) | (273 | ) | ||||||||||
| Other long-term liabilities and miscellaneous |
(188 | ) | 91 | |||||||||||
| Subtotal of adjustments
|
|
(383
|
)
|
|
826
|
| ||||||||
| CHANGES IN NON-CASH OPERATING WORKING CAPITAL |
||||||||||||||
| Receivables |
(153 | ) | 47 | |||||||||||
| Inventories |
(887 | ) | (10 | ) | ||||||||||
| Prepaid expenses and other current assets |
561 | (13 | ) | |||||||||||
| Payables and accrued charges |
(659 | ) | 48 | |||||||||||
| Subtotal of changes in non-cash operating working capital |
(1,138 | ) | 72 | |||||||||||
| CASH PROVIDED BY OPERATING ACTIVITIES
|
$
|
2,052
|
|
$
|
1,225
|
| ||||||||
| SUPPLEMENTAL CASH FLOWS DISCLOSURES |
||||||||||||||
| Interest paid |
$ | 507 | $ | 198 | ||||||||||
| Income taxes paid |
$ | 1,155 | $ | 83 | ||||||||||
| NUTRIEN 2018 | 115 | ANNUAL REPORT |
IN MILLIONS OF US DOLLARS EXCEPT AS OTHERWISE NOTED
NOTE 12 CONSOLIDATED STATEMENTS OF CASH FLOWS CONTINUED
The following is a summary of changes in liabilities arising from financing activities:
|
Short-Term Debt and Current Portion of Long-Term Debt 1 |
Long-Term Debt | Total | ||||||||||
| Balance – December 31, 2017 |
$ | 730 | $ | 3,711 | $ | 4,441 | ||||||
| Debt acquired in Merger (Note 3) |
878 | 4,930 | 5,808 | |||||||||
| Cash flows 1 |
(927 | ) | (12 | ) | (939 | ) | ||||||
| Reclassifications |
1,023 | (1,023 | ) | – | ||||||||
| Foreign currency translation and other non-cash changes |
(72 | ) | (15 | ) | (87 | ) | ||||||
| Balance – December 31, 2018 |
$ | 1,632 | $ | 7,591 | $ | 9,223 | ||||||
| Balance – December 31, 2016 |
$ | 884 | $ | 3,707 | $ | 4,591 | ||||||
| Cash flows 1 |
(159 | ) | (1 | ) | (160 | ) | ||||||
| Non-cash changes |
5 | 5 | 10 | |||||||||
| Balance – December 31, 2017 |
$ | 730 | $ | 3,711 | $ | 4,441 | ||||||
| 1 | Cash inflows and cash outflows arising from short-term debt transactions are presented on a net basis. |
|
|
FINANCIAL INSTRUMENTS AND RELATED RISK MANAGEMENT
|
Outlined below are the Company’s financial instruments, related risk management objectives, policies and exposure, sensitivity and monitoring strategies to financial risks.
| Accounting Policies | Accounting Estimates and Judgments | |||
| Financial instruments are classified and measured as follows: |
Judgment is required to determine whether the right to offset is legally enforceable. | |||
| Fair Value Through Profit or Loss (“FVTPL”) |
FVTOCI | Financial Assets and Liabilities at Amortized Cost 1 |
For derivatives or embedded derivatives, the most significant area of judgment is whether the contract can be settled net. This is one of the criteria used to determine whether a contract for a nonfinancial asset is considered a derivative and accounted for as such. Judgment is also applied in determining whether an embedded derivative is closely related to the host contract, in which case bifurcation and separate accounting are not necessary. | |||||
| Instrument type |
Cash and cash equivalents and derivatives | Equity investments not held for trading | Receivables, short-term debt, payables and accrued charges, long-term debt, other long-term debt instruments | |||||
| Measurement | Fair value | Fair value | Amortized cost | |||||
| Fair value gains and losses | Profit or loss | OCI 2 | – | |||||
| Interest and dividends | Profit or loss | Profit or loss | Profit or loss: effective interest rate | |||||
| Impairment of assets | – | – | Profit or loss | |||||
| Foreign exchange | Profit or loss | OCI | Profit or loss | |||||
| Transaction costs | Profit or loss | OCI | Included in cost of instrument | |||||
| 1 Amortized cost is applied if the objective of the business model for the instrument or group of instruments is to hold the asset to collect the contractual cash flows and the contractual terms give rise on specified dates to cash flows that are solely payments of principal and interest. 2 For equity investments not held for trading, the Company may make an irrevocable election at initial recognition to recognize changes in fair value through OCI rather than profit or loss. The Company made this election for its investments in ICL, Sinofert and certain equity investments as the investments are held for strategic purposes. |
||||||||
| NUTRIEN 2018 | 116 | ANNUAL REPORT |
FINANCIAL STATEMENTS AND NOTES
IN MILLIONS OF US DOLLARS EXCEPT AS OTHERWISE NOTED
NOTE 13 FINANCIAL INSTRUMENTS AND RELATED RISK MANAGEMENT CONTINUED
| Accounting Policies | Accounting Estimates and Judgments | |||
| Financial instruments are recognized at trade date when the Company commits to purchase or sell the asset. Financial assets are derecognized when the rights to receive cash flows from the investments have expired or the Company has transferred them, and all the risks and rewards of ownership have been substantially transferred.
Derivatives are used to lock in commodity prices and exchange rates. For designated and qualified cash flow hedges:
• the effective portion of the change in the fair value of the derivative is accumulated in OCI;
• when the hedged forecast transaction occurs, the related gain or loss is removed from AOCI and included in the cost of inventory;
• the hedging gain or loss included in the cost of inventory is recognized in earnings when the product containing the hedged item is sold or becomes impaired; and
• the ineffective portions of hedges are recorded in net earnings in the current period.
The Company also assesses whether the natural gas derivatives used in hedging transactions are expected to be or were highly effective, both at the hedge’s inception and on an ongoing basis, in offsetting changes in fair values of hedged items. Hedge effectiveness related to the Company’s New York Mercantile Exchange (“NYMEX”) natural gas hedges is assessed on a prospective and retrospective basis using regression analyses. The Company’s Alberta Energy Company (“AECO”) natural gas hedges are assessed using a qualitative assessment. Potential sources of ineffectiveness are changes in timing of forecast transactions, changes in volume delivered or changes in credit risk of the Company or the counterparty.
Financial assets and financial liabilities are offset and the net amount is presented in the consolidated balance sheets when the Company:
• currently has a legally enforceable right to offset the recognized amounts; and
• intends either to settle on a net basis, or to realize the assets and settle the liabilities simultaneously.
See Note 32 for discussion related to the policies, estimates and judgments for fair value measurements. |
Credit risk is managed through policies applicable to the following assets:
| Acceptable Minimum Counterparty Credit Ratings |
Exposure Thresholds by Counterparty |
Daily Counterparty Settlement Based on Prescribed Credit Thresholds |
Counterparties to Contracts are Investment-Grade Quality |
|||||||||||||
| Cash and Cash Equivalents |
X | X | ||||||||||||||
| Natural Gas Derivatives |
X | X | X | |||||||||||||
| Foreign Currency Derivatives |
X | |||||||||||||||
| NUTRIEN 2018 | 117 | ANNUAL REPORT |
IN MILLIONS OF US DOLLARS EXCEPT AS OTHERWISE NOTED
NOTE 13 FINANCIAL INSTRUMENTS AND RELATED RISK MANAGEMENT CONTINUED
The following maturity analysis of the Company’s financial liabilities and gross settled derivative contracts (for which the cash flows are settled simultaneously) is based on the expected undiscounted contractual cash flows from the date of the consolidated balance sheets to the contractual maturity date.
| 2018 | Carrying Amount of Liability as at December 31 |
Contractual Cash Flows |
Within 1 Year |
1 to 3 Years | 3 to 5 Years | Over 5 Years | ||||||||||||||||||||||||||||||||||||||||||
| Short-term debt 1 |
$ | 629 | $ | 629 | $ | 629 | $ | – | $ | – | $ | – | ||||||||||||||||||||||||||||||||||||
| Payables and accrued charges 2 |
4,695 | 4,695 | 4,695 | – | – | – | ||||||||||||||||||||||||||||||||||||||||||
| Current portion of long-term debt and Long-term debt1 |
8,594 | 12,818 | 1,362 | 1,121 | 1,583 | 8,752 | ||||||||||||||||||||||||||||||||||||||||||
| Derivatives |
71 | 72 | 44 | 19 | 9 | – | ||||||||||||||||||||||||||||||||||||||||||
| $ | 13,989 | $ | 18,214 | $ | 6,730 | $ | 1,140 | $ | 1,592 | $ | 8,752 | |||||||||||||||||||||||||||||||||||||
| 1 | Contractual cash flows include contractual interest payments related to debt obligations. Interest rates on variable rate debt are based on prevailing rates as at December 31, 2018. Disclosures regarding offsetting of certain debt obligations are provided below. |
| 2 | Excludes non-financial liabilities and includes trade payables of approximately $500 paid in January 2019 through an arrangement whereby a supplier sold the right to receive payment to a financial institution. |
| NUTRIEN 2018 | 118 | ANNUAL REPORT |
FINANCIAL STATEMENTS AND NOTES
IN MILLIONS OF US DOLLARS EXCEPT AS OTHERWISE NOTED
NOTE 13 FINANCIAL INSTRUMENTS AND RELATED RISK MANAGEMENT CONTINUED
Market Risk
Market risks, where financial instrument fair values can fluctuate due to changes in market prices, include foreign exchange risk, interest rate risk and price risk (related to commodity and equity securities).
Foreign Exchange Risk
To manage foreign exchange risk (primarily related to Canadian operating and capital expenditures, certain subsidiaries denominated in currencies other than the functional currency of an operation, taxes and dividends), the Company may enter into foreign currency derivatives. Treasury risk management policies allow such exposures to be hedged within certain prescribed limits for both forecast operating and capital expenditures. The risk management policy is to manage the earnings impact that could occur from a reasonably possible strengthening or weakening of the US dollar. The foreign currency derivatives are not currently designated as hedging instruments for accounting purposes. The Company had no material exposure to foreign exchange risk that could affect the Company’s net earnings as at December 31, 2018 and 2017.
Interest Rate Risk
Fair Value
Estimated fair values for financial instruments are designed to approximate amounts for which the instruments could be exchanged in a current arm’s-length transaction between knowledgeable, willing parties. The valuation policies and procedures for financial reporting purposes are determined by the Company’s finance department.
Financial instruments included in the consolidated balance sheets are measured either at fair value or amortized cost. The tables below explain the valuation methods used to determine the fair value of each financial instrument and its associated level in the fair value hierarchy.
| Financial Instruments Measured at Fair Value | Fair Value Method | |
| Cash and cash equivalents | Carrying amount (approximation to fair value assumed due to short-term nature) | |
| Equity securities | Closing bid price of the common shares as at the balance sheet date | |
| Debt securities | Closing bid price of the debt (Level 2) as at the balance sheet date | |
| Foreign currency derivatives not traded in an active market | Quoted forward exchange rates (Level 2) as at the balance sheet date | |
| NUTRIEN 2018 | 119 | ANNUAL REPORT |
IN MILLIONS OF US DOLLARS EXCEPT AS OTHERWISE NOTED
NOTE 13 FINANCIAL INSTRUMENTS AND RELATED RISK MANAGEMENT CONTINUED
| Financial Instruments Measured at Fair Value | Fair Value Method | |
| Foreign exchange forward contracts, swaps and options and natural gas swaps not traded in an active market | A discounted cash flow model 1
Market comparison 2 | |
| 1 | Inputs included contractual cash flows based on prices for natural gas futures contracts, fixed prices and notional volumes specified by the swap contracts, the time value of money, liquidity risk, the Company’s own credit risk (related to instruments in a liability position) and counterparty credit risk (related to instruments in an asset position). Futures contract prices used as inputs in the model were supported by prices quoted in an active market and therefore categorized in Level 2. |
| 2 | Inputs include current market and contractual prices, forward pricing curves, quoted forward prices, basis differentials, volatility factors and interest rates and therefore categorized in Level 2. |
| Financial Instruments Measured at Amortized Cost | Fair Value Method | |
| Receivables, short-term debt and payables and accrued charges | Carrying amount (approximation to fair value assumed due to short-term nature) | |
| Long-term debt | Quoted market prices (Level 1 or 2 depending on the market liquidity of the debt) | |
| Other long-term debt instruments | Carrying amount | |
The following table presents the Company’s fair value hierarchy for financial assets and financial liabilities carried at fair value on a recurring basis or measured at amortized costs:
| Fair Value Measurements at Reporting Dates Using: |
||||||||||||
| 2018 | Carrying Amount of Asset (Liability) as at December 31 |
Quoted Prices in for Identical Assets |
Significant Other Inputs (Level 2) 1 |
|||||||||
| Financial instruments measured at fair value on a recurring basis |
||||||||||||
| Derivative instrument assets |
$ | 5 | $ | – | $ | 5 | ||||||
| Other current financial assets – marketable securities 2 |
97 | 12 | 85 | |||||||||
| Investments at FVTOCI 3 |
186 | 186 | – | |||||||||
| Derivative instrument liabilities |
(71 | ) | – | (71 | ) | |||||||
| Financial instruments measured at amortized cost |
||||||||||||
| Cash and cash equivalents |
$ | 2,314 | $ | – | $ | 2,314 | ||||||
| Current portion of long-term debt |
||||||||||||
| Senior notes and debentures 4 |
(995 | ) | – | (1,009 | ) | |||||||
| Fixed and floating rate debt |
(8 | ) | – | (8 | ) | |||||||
| Long-term debt |
||||||||||||
| Senior notes and debentures 4 |
(7,569 | ) | (1,004 | ) | (6,177 | ) | ||||||
| Fixed and floating rate debt |
(22 | ) | – | (22 | ) | |||||||
|
2017 |
||||||||||||
| Derivative instrument assets |
||||||||||||
| Natural gas derivatives |
$ | 9 | $ | – | $ | 9 | ||||||
| Investments at FVTOCI 3 |
970 | 970 | – | |||||||||
| Derivative instrument liabilities |
||||||||||||
| Natural gas derivatives |
(64 | ) | – | (64 | ) | |||||||
| Long-term debt |
||||||||||||
| Senior notes 4 |
(3,707 | ) | (490 | ) | (3,555 | ) | ||||||
| 1 | During the period ended December 31, 2018, there were no transfers between Level 1 and Level 2 for financial instruments measured at fair value. The Company’s policy is to recognize transfers at the end of the reporting period. |
| 2 | Marketable securities consist of equity and fixed income securities. The Company determines the fair value of equity securities based on the bid price of identical instruments in active markets. The Company values fixed income securities using quoted prices of instruments with similar terms and credit risk. |
| 3 | Investments at FVTOCI are comprised of shares in Sinofert and other (Note 21) (2017 – ICL, Sinofert and other). The Company’s investment in ICL was sold during 2018 (Note 10). |
| 4 | Carrying amount of liability includes net unamortized debt issue costs. |
| NUTRIEN 2018 | 120 | ANNUAL REPORT |
FINANCIAL STATEMENTS AND NOTES
IN MILLIONS OF US DOLLARS EXCEPT AS OTHERWISE NOTED
NOTE 13 FINANCIAL INSTRUMENTS AND RELATED RISK MANAGEMENT CONTINUED
| 2018 | 2017 | |||||||||||||||||||||||||||||||||||||||||||
| Financial assets (liabilities) | Gross | Offset | Net Presented |
Gross | Offset | Net Presented |
||||||||||||||||||||||||||||||||||||||
| Derivative instrument assets |
||||||||||||||||||||||||||||||||||||||||||||
| Natural gas derivatives 1 |
$ | 31 | $ | (27 | ) | $ | 4 | $ | 11 | $ | (2 | ) | $ | 9 | ||||||||||||||||||||||||||||||
| Derivative instrument liabilities |
||||||||||||||||||||||||||||||||||||||||||||
| Natural gas derivatives 2 |
(92 | ) | 26 | (66 | ) | (74 | ) | 10 | (64 | ) | ||||||||||||||||||||||||||||||||||
| Other long-term debt instruments 3 |
(150 | ) | 150 | – | (150 | ) | 150 | – | ||||||||||||||||||||||||||||||||||||
| $ | (211 | ) | $ | 149 | $ | (62 | ) | $ | (213 | ) | $ | 158 | $ | (55 | ) | |||||||||||||||||||||||||||||
| 1 | Cash margin deposits of $NIL (2017 – $(1)) were held related to legally enforceable master netting arrangements. |
| 2 | Cash margin deposits of $18 (2017 – $38) were placed with counterparties related to legally enforceable master netting arrangements. |
| 3 | Back-to-back loan arrangements that are not subject to any financial test covenants but are subject to certain customary covenants and events of default, including, for other long-term debt, an event of default for non-payment or other debt in excess of $25. Non-compliance with such covenants could result in accelerated payment of the related debt. The Company was in compliance with these covenants as at December 31, 2018. |
Natural gas derivatives outstanding:
| 2018 | 2017 | |||||||||||||||||||||||||||||||||||||||
| Notional 1 | Maturities | Average Price 2 |
Fair Value of Assets (Liabilities) |
Notional 1 | Maturities | Average Contract Price 2 |
Fair Value of Assets (Liabilities) |
|||||||||||||||||||||||||||||||||
| Natural gas |
||||||||||||||||||||||||||||||||||||||||
| NYMEX swaps |
22 | 2019 – 2022 | $ | 4.26 | $ | (35 | ) | 27 | 2018 – 2022 | $ | 4.89 | $ | (54 | ) | ||||||||||||||||||||||||||
| AECO swaps 3 |
26 | 2019 | $ | 1.92 | $ | (25 | ) | – | – | – | $ | – | ||||||||||||||||||||||||||||
| 1 | In millions of British thermal units (“MMBtu”). |
| 2 | US dollars per MMBtu. |
| 3 | AECO swaps are only included in 2018 as a result of the Merger as described in Note 3. |
|
|
RECEIVABLES
|
Trade accounts receivable mainly consist of amounts owed to Nutrien by its customers, the largest individual customer being the related party, Canpotex.
| Accounting Policies | Accounting Estimates and Judgments | |||
| Trade accounts receivable are recognized initially at fair value and subsequently measured at amortized cost less provision for impairment of trade accounts receivable. When a trade account receivable is uncollectible, it is written off against the provision. Subsequent recoveries of amounts previously written off are credited to the consolidated statements of earnings.
Vendors may offer various incentives to purchase products for resale. Vendor rebates and prepay discounts are accounted for as a reduction of the prices of the suppliers’ products. Rebates based on the amount of materials purchased reduce cost of goods sold as inventory is sold. Rebates are offset based on sales volumes to cost of goods sold if the rebate has been earned based on sales volumes of products.
Rebates that are probable and can be reasonably estimated are accrued. Rebates that are not probable or estimable are accrued when certain milestones are achieved. Rebates not covered by binding agreements or published vendor programs are accrued when conclusive documentation of right of receipt is obtained. |
Determining when amounts are deemed uncollectible requires judgment.
Estimation of rebates can be complex in nature as vendor arrangements are diverse. The amount of the accrual is determined by analyzing and reviewing historical trends to apply negotiated rates to estimated and actual purchase volumes. Estimated amounts accrued throughout the year could also be impacted if actual purchase volumes differ from projected volumes. |
| NUTRIEN 2018 | 121 | ANNUAL REPORT |
IN MILLIONS OF US DOLLARS EXCEPT AS OTHERWISE NOTED
NOTE 14 RECEIVABLES CONTINUED
Supporting Information
| December 31, 2018 | December 31, 2017 | |||||||||||||||
| Trade accounts – third parties |
$ | 2,628 | $ | 314 | ||||||||||||
| – Canpotex (Note 30) |
208 | 82 | ||||||||||||||
| Less provisions for impairment of trade accounts receivable |
(90 | ) | (6 | ) | ||||||||||||
| 2,746 | 390 | |||||||||||||||
| Rebates |
169 | – | ||||||||||||||
| Income taxes (Note 9) |
248 | 24 | ||||||||||||||
| Other non-trade accounts |
179 | 75 | ||||||||||||||
| $ | 3,342 | $ | 489 | |||||||||||||
|
|
INVENTORIES
|
Inventories consist of Retail inventory (crop nutrients, crop protection products, seed and merchandise products) and products from the Potash, Nitrogen, and Phosphate and Sulfate segments in varying stages of the production process.
| Accounting Policies | Accounting Estimates and Judgments | |||||
| Inventories are valued monthly at the lower of cost and net realizable value. Costs are allocated to inventory using the weighted average cost method and include: direct acquisition costs, direct costs related to units of production and a systematic allocation of fixed and variable production overhead, as applicable.
Net realizable value is based on: |
Judgment is used to allocate production overhead to inventories and to determine net realizable value, including the appropriate measure and inputs of a combination of interrelated demand and supply variables. | |||||
| For products purchased for resale, finished products, intermediate products and raw materials |
For materials and supplies |
|||||
| • selling price of the finished product (in ordinary course of business);
• less the estimated costs of completion; and
• less the estimated costs to make the sale. |
• replacement cost. |
|||||
| A writedown is recognized if carrying amount exceeds net realizable value and may be reversed if the circumstances which caused it no longer exist. |
||||||
| NUTRIEN 2018 | 122 | ANNUAL REPORT |
FINANCIAL STATEMENTS AND NOTES
IN MILLIONS OF US DOLLARS EXCEPT AS OTHERWISE NOTED
|
|
PROPERTY, PLANT AND EQUIPMENT
|
The majority of the Company’s tangible assets are the buildings, machinery and equipment used to produce or distribute its products and render its services. These assets are depreciated over their estimated useful lives.
| Accounting Policies | Accounting Estimates and Judgments | |||||||||||
| Property, plant and equipment (which include certain mine development costs, pre-stripping costs and assets under construction) are carried at cost less accumulated depreciation and any recognized impairment loss.
Cost includes all expenditures directly attributable to bringing the asset to the location and installing it in working condition for its intended use, including:
• additions to, and betterments and renewals of, existing assets;
• borrowing costs incurred during construction using a capitalization rate based on the weighted average interest rate of the Company’s outstanding debt; and
• a reduction for income derived from the asset during construction.
Each component of an item of property, plant and equipment with a cost that is significant in relation to the item’s total cost is depreciated separately. When the cost of replacing part of an item of property, plant and equipment is capitalized, the carrying amount of the replaced part is derecognized. The cost of major inspections and overhauls is capitalized and depreciated over the period until the next major inspection or overhaul. Maintenance and repair expenditures that do not improve or extend productive life are expensed in the period incurred.
Environmental costs related to current operations are also capitalized if:
• property life is extended;
• capacity is increased;
• contamination from future operations is mitigated or prevented; or
• related to legal or constructive asset retirement obligations.
|
Judgment involves determining:
• costs, including income or expenses derived from an asset under construction, that are eligible for capitalization;
• timing to cease cost capitalization, generally when the asset is capable of operating in the manner intended by management, but also considering the circumstances and the industry in which the asset is to be operated, normally predetermined by management with reference to such factors as productive capacity;
• the appropriate level of componentization (for individual components for which different depreciation methods or rates are appropriate);
• repairs and maintenance that qualify as major inspections and overhauls; and
• useful life over which such costs should be depreciated.
Certain property, plant and equipment directly related to the Potash, Nitrogen, and Phosphate and Sulfate segments are depreciated using the units-of-production method based on the shorter of estimates of reserves or service lives. Pre-stripping costs are depreciated on a units-of-production basis over the ore mined from the mineable acreage stripped. Land is not depreciated. The remaining assets are depreciated on a straight-line basis.
The following estimated useful lives have been applied to the majority of property, plant and equipment assets as at December 31, 2018: |
| ||||||||||
| Useful Life Range (years) |
Weighted Average Useful Life (years) 1 |
|||||||||||
| Land improvements |
5 to 80 | 35 | ||||||||||
| Buildings and improvements |
2 to 60 | 38 | ||||||||||
| Machinery and equipment |
1 to 80 | 25 | ||||||||||
|
1 Weighted by carrying amount as at December 31, 2018. |
| |||||||||||
|
Estimated useful lives, expected patterns of consumption, depreciation method and residual values are reviewed at least annually with the effect of any changes in estimate being accounted for on a prospective basis.
Uncertainties are inherent in estimating reserve quantities, particularly as they relate to assumptions regarding future prices, the geology of the Company’s mines, the mining methods used, and the related costs incurred to develop and mine its reserves. Changes in these assumptions could result in material adjustments to reserve estimates, which could result in impairments or changes to depreciation expense in future periods.
|
| |||||||||||
Accounting policies, estimates and judgments related to impairment of long-lived assets are described in Note 32.
| NUTRIEN 2018 | 123 | ANNUAL REPORT |
IN MILLIONS OF US DOLLARS EXCEPT AS OTHERWISE NOTED
NOTE 16 PROPERTY, PLANT AND EQUIPMENT CONTINUED
Supporting Information
| Land and Improvements |
Buildings and Improvements |
Machinery and Equipment |
Mine Development Costs |
Assets Under Construction |
Total | |||||||||||||||||||
| Carrying amount – December 31, 2017 |
$ | 612 | $ | 4,184 | $ | 6,744 | $ | 979 | $ | 452 | $ | 12,971 | ||||||||||||
| Merger impact (Note 3) |
396 | 2,695 | 4,042 | – | 326 | 7,459 | ||||||||||||||||||
| Other acquisitions |
10 | 31 | 66 | – | – | 107 | ||||||||||||||||||
| Additions |
41 | 61 | 327 | 42 | 975 | 1,446 | ||||||||||||||||||
| Disposals |
(3 | ) | (14 | ) | (30 | ) | – | – | (47 | ) | ||||||||||||||
| Transfers |
10 | 30 | 538 | 18 | (596 | ) | – | |||||||||||||||||
| Foreign currency translation |
(9 | ) | (16 | ) | (15 | ) | – | (7 | ) | (47 | ) | |||||||||||||
| Other adjustments |
– | 44 | (6 | ) | 10 | (7 | ) | 41 | ||||||||||||||||
| Depreciation |
(33 | ) | (195 | ) | (1,032 | ) | (65 | ) | – | (1,325 | ) | |||||||||||||
| Impairment |
(6 | ) | (776 | ) | (752 | ) | (275 | ) | – | (1,809 | ) | |||||||||||||
| Carrying amount – December 31, 2018 |
$ | 1,018 | $ | 6,044 | $ | 9,882 | $ | 709 | $ | 1,143 | $ | 18,796 | ||||||||||||
| Balance as at December 31, 2018 comprised of: |
||||||||||||||||||||||||
| Cost |
$ | 1,294 | $ | 7,617 | $ | 16,806 | $ | 1,954 | $ | 1,143 | $ | 28,814 | ||||||||||||
| Accumulated depreciation |
(276 | ) | (1,573 | ) | (6,924 | ) | (1,245 | ) | – | (10,018 | ) | |||||||||||||
| Carrying amount |
$ | 1,018 | $ | 6,044 | $ | 9,882 | $ | 709 | $ | 1,143 | $ | 18,796 | ||||||||||||
| Carrying amount – December 31, 2016 |
$ | 618 | $ | 4,212 | $ | 6,859 | $ | 1,027 | $ | 602 | $ | 13,318 | ||||||||||||
| Additions |
– | – | 9 | 88 | 528 | 625 | ||||||||||||||||||
| Transfers |
63 | 71 | 521 | (21 | ) | (634 | ) | – | ||||||||||||||||
| Other adjustments |
– | – | 5 | 15 | – | 20 | ||||||||||||||||||
| Depreciation |
(19 | ) | (83 | ) | (487 | ) | (98 | ) | – | (687 | ) | |||||||||||||
| Impairment |
(50 | ) | (16 | ) | (163 | ) | (32 | ) | (44 | ) | (305 | ) | ||||||||||||
| Carrying amount – December 31, 2017 |
$ | 612 | $ | 4,184 | $ | 6,744 | $ | 979 | $ | 452 | $ | 12,971 | ||||||||||||
| Balance as at December 31, 2017 comprised of: |
||||||||||||||||||||||||
| Cost |
$ | 868 | $ | 4,837 | $ | 12,000 | $ | 1,985 | $ | 452 | $ | 20,142 | ||||||||||||
| Accumulated depreciation |
(256 | ) | (653 | ) | (5,256 | ) | (1,006 | ) | – | (7,171 | ) | |||||||||||||
| Carrying amount |
$ | 612 | $ | 4,184 | $ | 6,744 | $ | 979 | $ | 452 | $ | 12,971 | ||||||||||||
| NUTRIEN 2018 | 124 | ANNUAL REPORT |
FINANCIAL STATEMENTS AND NOTES
IN MILLIONS OF US DOLLARS EXCEPT AS OTHERWISE NOTED
NOTE 16 PROPERTY, PLANT AND EQUIPMENT CONTINUED
|
|
GOODWILL AND OTHER INTANGIBLE ASSETS
|
Intangible assets, including goodwill, are identifiable, represent future economic benefits and are controlled by the Company. Goodwill is not amortized but is subject to annual impairment review.
| Accounting Policies | Accounting Estimates and Judgments | |||
| Goodwill is carried at cost, is not amortized, and represents the excess of the cost of an acquisition over the fair value of the Company’s share of the net identifiable assets of the acquired subsidiary at the date of acquisition.
An intangible asset is recognized when it is:
• reliably measurable;
• identifiable (separable or arises from contractual rights);
• probable that expected future economic benefits will flow to the Company; and
• controllable by the Company.
Amortization is recognized in net earnings as an expense related to the function of the intangible asset.
The following expenses are not recognized as an asset:
• costs to maintain software programs; and
• development costs that do not meet the capitalization criteria.
|
Goodwill is allocated to CGUs or groups of CGUs for impairment testing based on the level at which it is monitored by management, and not at a level higher than an operating segment. The allocation is made to those CGUs or groups of CGUs expected to benefit from the business combination in which the goodwill arose.
Judgment is applied in determining when expenditures are eligible for capitalization as intangible assets.
Estimation is applied to determine expected useful lives used in the straight-line amortization of intangible assets with finite lives.
|
| NUTRIEN 2018 | 125 | ANNUAL REPORT |
IN MILLIONS OF US DOLLARS EXCEPT AS OTHERWISE NOTED
NOTE 17 GOODWILL AND OTHER INTANGIBLE ASSETS CONTINUED
Supporting Information
Following is a reconciliation of intangible assets:
| Goodwill |
Customer Relationships 2 |
Technology | Trade Names |
Other | Total Other Intangibles |
|||||||||||||||||||
| Carrying amount – December 31, 2017 |
$ | 97 | $ | – | $ | – | $ | – | $ | 69 | $ | 69 | ||||||||||||
| Merger impact (Note 3) |
11,185 | 1,708 | 44 | 122 | 474 | 2,348 | ||||||||||||||||||
| Other acquisitions (Note 3) |
197 | 1 | – | – | 7 | 8 | ||||||||||||||||||
| Additions |
– | – | 79 | – | 19 | 98 | ||||||||||||||||||
| Disposals |
– | – | – | – | (27 | ) | (27 | ) | ||||||||||||||||
| Foreign currency translation |
(48 | ) | (20 | ) | 1 | (4 | ) | (6 | ) | (29 | ) | |||||||||||||
| Amortization 1 |
– | (135 | ) | (7 | ) | (28 | ) | (87 | ) | (257 | ) | |||||||||||||
| Carrying amount – December 31, 2018 |
$ | 11,431 | $ | 1,554 | $ | 117 | $ | 90 | $ | 449 | $ | 2,210 | ||||||||||||
| Balance as at December 31, 2018 |
||||||||||||||||||||||||
| Cost |
$ | 11,438 | $ | 1,691 | $ | 124 | $ | 118 | $ | 586 | $ | 2,519 | ||||||||||||
| Accumulated amortization |
(7 | ) | (137 | ) | (7 | ) | (28 | ) | (137 | ) | (309 | ) | ||||||||||||
| Carrying amount |
$ | 11,431 | $ | 1,554 | $ | 117 | $ | 90 | $ | 449 | $ | 2,210 | ||||||||||||
| Carrying amount – December 31, 2016 |
$ | 97 | $ | – | $ | – | $ | – | $ | 83 | $ | 83 | ||||||||||||
| Additions |
– | – | – | – | 1 | 1 | ||||||||||||||||||
| Amortization 1 |
– | – | – | – | (15 | ) | (15 | ) | ||||||||||||||||
| Carrying amount – December 31, 2017 |
$ | 97 | $ | – | $ | – | $ | – | $ | 69 | $ | 69 | ||||||||||||
| Balance as at December 31, 2017 |
||||||||||||||||||||||||
| Cost |
$ | 104 | $ | – | $ | – | $ | – | $ | 123 | $ | 123 | ||||||||||||
| Accumulated amortization |
(7 | ) | – | – | – | (54 | ) | (54 | ) | |||||||||||||||
| Carrying amount |
$ | 97 | $ | – | $ | – | $ | – | $ | 69 | $ | 69 | ||||||||||||
| 1 | Amortization of $225 was included in selling expenses during the year ended December 31, 2018 (2017 – $NIL). |
| 2 | The remaining amortization period of customer relationships at December 31, 2018, was approximately 8 years. |
| NUTRIEN 2018 | 126 | ANNUAL REPORT |
FINANCIAL STATEMENTS AND NOTES
IN MILLIONS OF US DOLLARS EXCEPT AS OTHERWISE NOTED
|
|
OTHER ASSETS
|
Other assets as at December 31 were comprised of:
| 2018 | 2017 | |||||||||||||||
| Deferred income tax assets (Note 9) |
$ | 216 | $ | 18 | ||||||||||||
| Ammonia catalysts – net of accumulated amortization of $79 (2017 – $61) |
81 | 42 | ||||||||||||||
| Long-term income tax receivable (Note 9) |
36 | 64 | ||||||||||||||
| Accrued pension benefit asset (Note 28) |
27 | 24 | ||||||||||||||
| Other – net of accumulated amortization of $38 (2017 – $35) |
165 | 98 | ||||||||||||||
| $ | 525 | $ | 246 | |||||||||||||
|
|
PAYABLES AND ACCRUED CHARGES
|
Trade and other payables and accrued charges mainly consist of amounts owed to suppliers and prepayments made by customers planning to purchase the Company’s products for the upcoming growing season.
Payables and accrued charges as at December 31 were comprised of:
| 2018 | 2017 | |||||||||||||||
| Trade accounts |
$ | 3,053 | $ | 255 | ||||||||||||
| Customer prepayments |
1,625 | – | ||||||||||||||
| Dividends |
526 | 84 | ||||||||||||||
| Accrued compensation |
425 | 98 | ||||||||||||||
| Current portion of asset retirement obligations and accrued environmental costs (Note 20) |
156 | 72 | ||||||||||||||
| Accrued interest |
105 | 33 | ||||||||||||||
| Current portion of share-based compensation (Note 29) |
87 | 13 | ||||||||||||||
| Current portion of derivatives |
45 | 29 | ||||||||||||||
| Income taxes (Note 9) |
47 | 16 | ||||||||||||||
| Current portion of pension and other post-retirement benefits (Note 28) |
13 | 35 | ||||||||||||||
| Other payables and other accrued charges |
621 | 201 | ||||||||||||||
| $ | 6,703 | $ | 836 | |||||||||||||
| NUTRIEN 2018 | 127 | ANNUAL REPORT |
IN MILLIONS OF US DOLLARS EXCEPT AS OTHERWISE NOTED
|
|
ASSET RETIREMENT OBLIGATIONS AND ACCRUED ENVIRONMENTAL COSTS
|
A provision is an estimated liability with uncertainty over the timing or amount that will be paid. The most significant asset retirement and environmental remediation provisions relate to costs to restore potash and phosphate sites to their original, or another specified, condition.
| Accounting Policies | Accounting Estimates and Judgments | |||
| Provisions are:
• recognized for present legal or constructive obligations arising from past events where a future outflow of resources is probable, provided that amount can be reliably estimated;
• measured at the present value of the cash flow expected to be required to settle the obligation; and
• reviewed at the end of each reporting period for any changes, including the discount rate, foreign exchange rate and amount or timing of the underlying cash flows, and adjusted against the carrying amount of the provision and any related asset; otherwise, it is recognized in net earnings.
A gain or loss may be incurred upon settlement of the liability.
As a result of the Merger, the Company recognized contingent liabilities, which represents additional environmental costs that are present obligations of the Company although cash outflows of resources are not probable. These contingent liabilities are subsequently measured at the higher of the amount initially recognized and the best estimate of the expenditures to be incurred.
Asset retirement obligations and accrued environmental costs include:
• reclamation and restoration costs at the Company’s potash and phosphate mining operations, including management of materials generated by mining and mineral processing, such as various mine tailings and gypsum;
• land reclamation and revegetation programs;
• decommissioning of underground and surface operating facilities;
• general cleanup activities aimed at returning the areas to an environmentally acceptable condition; and
• post-closure care and maintenance. |
Estimates for provisions take into account:
• most provisions will not be settled for a number of years;
• environmental laws and regulations and interpretations by regulatory authorities could change or circumstances affecting the Company’s operations could change, either of which could result in significant changes to current plans; and
• the nature, extent and timing of current and proposed reclamation and closure techniques in view of present environmental laws and regulations.
It is reasonably possible that the ultimate costs could change in the future and that changes to these estimates could have a material effect on the Company’s financial statements.
The Company uses appropriate technical resources, including outside consultants, to develop specific site closure and post-closure plans in accordance with the requirements of the various jurisdictions in which it operates. Other than certain land reclamation programs, settlement of the obligations is typically correlated with mine life estimates. |
The pre-tax risk-free discount rate and expected cash flow payments for asset retirement obligations and accrued environmental costs at December 31, 2018 were as follows:
| Asset Retirement Obligations | Accrued Environmental Costs | |||||||||||||||||||
| Risk-Free Rate (%) 1 |
Cash Flow Payments |
Risk-Free Rate (%) 1 |
Cash Flow Payments (years) |
|||||||||||||||||
| Potash sites |
3.64 – 5.00 | 52 – 430 | n/a | n/a | ||||||||||||||||
| Phosphate sites |
1.60 – 5.43 | 1 – 483 | 2.08 – 4.27 | 1 – 30 | ||||||||||||||||
| Other |
1.22 – 6.50 | 1 – 49 | 2.05 – 4.27 | 1 – 30 | ||||||||||||||||
| 1 | Risk-free discount rates reflect current market assessments of the time value of money and the risks specific to the timing and jurisdiction of the obligation. |
| 2 | Time frame in which payments are expected to principally occur from December 31, 2018, with the majority of phosphate payments taking place over the next 80 years. Changes in years can result from changes to the mine life and/or changes in the rate of tailing volumes. |
n/a = not applicable
| NUTRIEN 2018 | 128 | ANNUAL REPORT |
FINANCIAL STATEMENTS AND NOTES
IN MILLIONS OF US DOLLARS EXCEPT AS OTHERWISE NOTED
NOTE 20 ASSET RETIREMENT OBLIGATIONS AND ACCRUED ENVIRONMENTAL COSTS CONTINUED
Sensitivity of asset retirement obligations and accrued environmental costs to changes in the discount rate on the recorded liability as at December 31, 2018 was as follows:
| Discount Rate | ||||||||||||||||
| Undiscounted Cash Flows |
Discounted Cash Flows |
+0.5% | -0.5% | |||||||||||||
| Asset retirement obligations |
$ | (88) | $ | 88 | ||||||||||||
| Potash sites |
$ | 675 | 1 | $ | 130 | |||||||||||
| Phosphate sites |
1,636 | 1,125 | ||||||||||||||
| Other |
101 | 40 | ||||||||||||||
| Accrued environmental costs |
(12) | 15 | ||||||||||||||
| Phosphate sites |
321 | 246 | ||||||||||||||
| Other |
318 | 288 | ||||||||||||||
| 1 | Represents total undiscounted cash flows in the first year of decommissioning for operating sites and cash flows for all years for sites that were or would be permanently shut down. For operating sites, excludes subsequent years of tailings dissolution, fine tails capping, tailings management area reclamation, post reclamation activities and monitoring, and final decommissioning, which are estimated to take an additional 90-375 years. |
Supporting Information
Following is a reconciliation of asset retirement and environmental restoration obligations:
| Asset Retirement Obligations |
Accrued Environmental Costs |
Total | ||||||||||||||
| Balance – December 31, 2017 |
$ | 702 | $ | 21 | $ | 723 | ||||||||||
| Merger impact 1 |
608 | 525 | 1,133 | |||||||||||||
| Recorded in earnings |
64 | 12 | 76 | |||||||||||||
| Capitalized to property, plant and equipment |
9 | – | 9 | |||||||||||||
| Settled during the year |
(57 | ) | (12 | ) | (69 | ) | ||||||||||
| Foreign currency translation |
(31 | ) | (12 | ) | (43 | ) | ||||||||||
| Balance – December 31, 2018 |
$ | 1,295 | $ | 534 | $ | 1,829 | ||||||||||
| Balance as at December 31, 2018 comprised of: |
||||||||||||||||
| Current liabilities |
||||||||||||||||
| Payables and accrued charges (Note 19) |
$ | 122 | $ | 34 | $ | 156 | ||||||||||
| Non-current liabilities |
||||||||||||||||
| Asset retirement obligations and accrued environmental costs |
$ | 1,173 | $ | 500 | $ | 1,673 | ||||||||||
| 1 | Asset retirement obligations of $201 and accrued environmental costs of $376 represent contingent liabilities recognized as a result of the Merger. Refer to Note 3. |
| NUTRIEN 2018 | 129 | ANNUAL REPORT |
IN MILLIONS OF US DOLLARS EXCEPT AS OTHERWISE NOTED
|
|
INVESTMENTS
|
Nutrien holds interests in associates and joint ventures, the most significant being Canpotex, MOPCO, Profertil and Agrichem. The Company’s most significant investment accounted for as FVTOCI is Sinofert.
| Accounting Policies | Accounting Estimates and Judgments | |||||||
|
Investments in Equity-Accounted Investees
Investments in which the Company exercises significant influence (but does not control) or has joint control (as joint ventures) are accounted for using the equity method. Significant influence is the power to participate in the financial and operating policy decisions of the investee, commonly referred to as associates.
The Company’s significant policies include:
|
Investments in Equity-Accounted Investees and Investments at FVTOCI
Judgment is necessary in determining:
• when significant influence exists; and
• if objective evidence of impairment exists for equity-accounted investees and, if so, the amount of impairment. | |||||||
| Significant Policy | Statement of Comprehensive Income |
Investment | ||||||
| Proportionate share of net earnings (loss) adjusted for any fair value adjustments at acquisition date and differences in accounting policies | Net earnings (loss) | Increase (decrease) | ||||||
| Gain (loss) on disposal | Net earnings (loss) | Increase (decrease) | ||||||
| Proportionate share of post-acquisitions movements in OCI (loss) | OCI (loss) | Increase (decrease) | ||||||
| Impairment (loss) reversal 1 | Net earnings (loss) | Increase (decrease) | ||||||
| Dividends received | – | (Decrease) | ||||||
|
1 An impairment test is performed when there is objective evidence of impairment, such as significant adverse changes in the environment in which the equity-accounted investee operates or a significant or prolonged decline in the fair value of the investment below its carrying amount.
Investments at FVTOCI
The fair value of investments designated as FVTOCI is recorded in the consolidated balance sheets, with unrealized gains and losses, net of related income taxes, recorded in AOCI.
The Company’s significant policies include:
• the cost of investments sold is based on the weighted average method; and
• realized gains and losses on these investments remain in OCI, but the cumulative balance can be transferred to another equity reserve, such as retained earnings. |
||||||||
| NUTRIEN 2018 | 130 | ANNUAL REPORT |
FINANCIAL STATEMENTS AND NOTES
IN MILLIONS OF US DOLLARS EXCEPT AS OTHERWISE NOTED
NOTE 21 INVESTMENTS CONTINUED
Supporting Information
Equity-accounted investees and investments at FVTOCI as at December 31 were comprised of:
| Proportion of Ownership Interest and Voting Rights Held |
Carrying Amount | |||||||||||||||||||||||
| Name | Principal Activity | Principal Place of Business and Incorporation |
2018 | 2017 | 2018 | 2017 | ||||||||||||||||||
| EQUITY-ACCOUNTED |
||||||||||||||||||||||||
| MOPCO 1 |
Nitrogen Producer | Egypt | 26 | % | – | %3 | $ | 236 | $ | – | ||||||||||||||
| Profertil |
Nitrogen Producer | Argentina | 50 | % | – | %3 | 192 | – | ||||||||||||||||
| Canpotex |
Marketing & Logistics | Canada | 50 | %2 | 33 | % | – | – | ||||||||||||||||
| Agrichem 4 |
Fertilizer Producer & Marketer | Brazil | 80 | % | – | % | 103 | – | ||||||||||||||||
| Other associates and joint ventures |
161 | 30 | ||||||||||||||||||||||
| Total equity-accounted investees |
$ | 692 | $ | 30 | ||||||||||||||||||||
| INVESTMENTS |
||||||||||||||||||||||||
| Sinofert 5 |
Fertilizer Supplier & Distributor | China/Bermuda | 22 | % | 22 | % | $ | 180 | $ | 258 | ||||||||||||||
| Other |
– | % | – | % | 6 | 4 | ||||||||||||||||||
| Total investments at FVTOCI |
$ | 186 | $ | 262 | ||||||||||||||||||||
| 1 | The Company has representation on the MOPCO Board of Directors providing significant influence over MOPCO. The Company recorded its share of MOPCO’s earnings on a one-quarter lag, adjusted for any material transactions for the current quarter, as the financial statements of MOPCO are not available on the date of issuance of the Company’s financial statements. Future conditions, including those related to MOPCO in Egypt, which has been subject to political instability and civil unrest, may restrict the Company’s ability to obtain dividends from MOPCO. The Company is also exposed to currency risk related to fluctuations in the Egyptian pound against the US dollar. |
| 2 | Upon closing of the Merger on January 1, 2018 as described in Note 3, the classification of the investment changed from an associate to a joint venture. |
| 3 | Investments in MOPCO and Profertil were acquired as part of the Merger as described in Note 3. |
| 4 | As contractually agreed, the Company has joint control with the other shareholder of Agrichem. Subsequent to 2018, the Company acquired the remaining interest in Agrichem making it a wholly owned subsidiary that will be consolidated. |
| 5 | The Company’s 22 percent ownership of Sinofert does not constitute significant influence as the Company does not have any representation on the Board of Directors of Sinofert. The Company elected for this investment to be accounted for as FVTOCI. |
Additional financial information of the Company’s proportionate interest in equity-accounted investees for the years ended December 31 was as follows:
| Associates | Joint Ventures | |||||||||||||||||||||||
| 2018 | 2017 | 2018 | 2017 | |||||||||||||||||||||
| Earnings from continuing operations and net earnings |
$ | 24 | $ | – | $ | 16 | $ | 9 | ||||||||||||||||
| Other comprehensive income |
– | – | – | – | ||||||||||||||||||||
| Total comprehensive income |
$ | 24 | $ | – | $ | 16 | $ | 9 | ||||||||||||||||
| NUTRIEN 2018 | 131 | ANNUAL REPORT |
IN MILLIONS OF US DOLLARS EXCEPT AS OTHERWISE NOTED
|
|
SHORT-TERM DEBT
|
The Company uses its $4.5 billion commercial paper program for its short-term cash requirements. The commercial paper program is backstopped by an unsecured revolving term credit facility. Short-term facilities are renegotiated periodically.
Short-term debt as at December 31 was comprised of:
| 2018 | 2017 | |||||||
| Commercial paper |
$ 391 | $ 730 | ||||||
| Other credit facilities 1 |
238 | – | ||||||
| $ 629 | $ 730 | |||||||
| 1 | Credit facilities are unsecured and consist of US dollar-denominated debt of $153, euro-denominated debt of $22 and debt of $63 in other currency denominations. |
|
|
LONG-TERM DEBT
|
The Company’s sources of borrowing for funding purposes are primarily senior notes, debentures and long-term credit facilities. The Company has access to the capital markets through its base shelf prospectus.
| Accounting Policy |
| Issue costs of long-term debt obligations are capitalized to long-term obligations and are amortized to expense over the term of the related liability using the effective interest method. |
| NUTRIEN 2018 | 132 | ANNUAL REPORT |
FINANCIAL STATEMENTS AND NOTES
IN MILLIONS OF US DOLLARS EXCEPT AS OTHERWISE NOTED
NOTE 23 LONG-TERM DEBT CONTINUED
Supporting Information
Long-term debt as at December 31 was comprised of:
| Rate of Interest | Maturity | 2018 | 2017 | |||||||||||||||||||
| Senior notes 1 |
||||||||||||||||||||||
| Notes issued 2009 |
6.500% | May 15, 2019 | $ | 500 | $ | 500 | ||||||||||||||||
| Notes issued 2009 |
4.875% | March 30, 2020 | 500 | 500 | ||||||||||||||||||
| Notes issued 2014 |
3.625% | March 15, 2024 | 750 | 750 | ||||||||||||||||||
| Notes issued 2015 |
3.000% | April 1, 2025 | 500 | 500 | ||||||||||||||||||
| Notes issued 2016 |
4.000% | December 15, 2026 | 500 | 500 | ||||||||||||||||||
| Notes issued 2006 |
5.875% | December 1, 2036 | 500 | 500 | ||||||||||||||||||
| Notes issued 2010 |
5.625% | December 1, 2040 | 500 | 500 | ||||||||||||||||||
| Debentures 1 |
||||||||||||||||||||||
| Debentures issued 2008 |
6.750% | January 15, 2019 | 500 | – | ||||||||||||||||||
| Debentures issued 2012 |
3.150% | October 1, 2022 | 500 | – | ||||||||||||||||||
| Debentures issued 2013 |
3.500% | June 1, 2023 | 500 | – | ||||||||||||||||||
| Debentures issued 2015 |
3.375% | March 15, 2025 | 550 | – | ||||||||||||||||||
| Debentures issued 1997 |
7.800% | February 1, 2027 | 125 | – | ||||||||||||||||||
| Debentures issued 2015 |
4.125% | March 15, 2035 | 450 | – | ||||||||||||||||||
| Debentures issued 2006 |
7.125% | May 23, 2036 | 300 | – | ||||||||||||||||||
| Debentures issued 2010 |
6.125% | January 15, 2041 | 500 | – | ||||||||||||||||||
| Debentures issued 2013 |
4.900% | June 1, 2043 | 500 | – | ||||||||||||||||||
| Debentures issued 2014 |
5.250% | January 15, 2045 | 500 | – | ||||||||||||||||||
| Other |
30 | – | ||||||||||||||||||||
| 8,205 | 3,750 | |||||||||||||||||||||
| Add net unamortized fair value adjustments 2 |
444 | – | ||||||||||||||||||||
| Less net unamortized debt issue costs |
(55 | ) | (43 | ) | ||||||||||||||||||
| 8,594 | 3,707 | |||||||||||||||||||||
| Less current maturities |
(1,008 | ) | – | |||||||||||||||||||
| Less current portion of net unamortized fair value adjustments 2 |
(1 | ) | – | |||||||||||||||||||
| Add current portion of net unamortized debt issue costs |
6 | 4 | ||||||||||||||||||||
| (1,003 | ) | 4 | ||||||||||||||||||||
| $ | 7,591 | $ | 3,711 | |||||||||||||||||||
| 1 | Each series of senior notes and debentures is unsecured and has no sinking fund requirements prior to maturity. Each series is redeemable and has various provisions that allow redemption prior to maturity, at the Company’s option, at specified prices. |
| 2 | Associated with the Merger on January 1, 2018. |
| NUTRIEN 2018 | 133 | ANNUAL REPORT |
IN MILLIONS OF US DOLLARS EXCEPT AS OTHERWISE NOTED
NOTE 23 LONG-TERM DEBT CONTINUED
The debt exchange is accounted for as a modification of debt without substantial modification of terms as the financial terms of the Nutrien Notes were identical to senior notes and debentures and there is no substantial difference between the present value of cash flows under the Nutrien Notes compared to the notes and debentures. Accordingly, there is no gain or loss on the exchange. The transaction costs from the debt exchange of $19 were recorded to the carrying amount of the long-term debt and will be amortized over the life of the Nutrien Notes.
Details of the Company’s credit facility was as follows:
| 2018 | 2017 | |||||||
| Credit facility |
$4,500 – maturity April 10, 2023 1 | $3,250 – maturity May 31, 2021 $250 – maturity May 31, 2020 | ||||||
| Borrowings outstanding |
$ NIL | $ NIL | ||||||
| Commercial paper outstanding, backstopped by the credit facility (Note 22) |
$ 391 | $ 730 | ||||||
| 1 | Subject to extensions, at the request of Nutrien, which shall not exceed five years. |
During 2018, the Company replaced the legacy $3,500 unsecured revolving credit facility and the legacy $2,500 multi-jurisdictional unsecured revolving credit facility with a new Nutrien $4,500 unsecured revolving term credit facility (“Nutrien Credit Facility”). Principal covenants and events of default under the Nutrien Credit Facility include a debt to capital ratio of less than or equal to 0.65:1 and other customary events of default and covenant provisions. Non-compliance with such covenants could result in accelerated repayment and/or termination of the credit facility. The Company was in compliance with all covenants as at December 31, 2018.
|
|
SHARE CAPITAL
|
Authorized
The Company is authorized to issue an unlimited number of common shares without par value and an unlimited number of preferred shares. The common shares are not redeemable or convertible. The preferred shares may be issued in one or more series with rights and conditions to be determined by the Board of Directors. No preferred shares have been issued.
Issued
| Number of Common Shares (Pre-Merger) |
Number of Common Shares (Post-Merger) |
Consideration | ||||||||||
| Balance – December 31, 2017 (Pre-Merger) |
840,223,041 | |||||||||||
| Conversion ratio |
0.40 | |||||||||||
| PotashCorp shares converted to Nutrien shares |
336,089,216 | $ | 1,806 | |||||||||
| Agrium shares – December 31, 2017 (Pre-Merger) |
138,165,765 | |||||||||||
| Conversion ratio |
2.23 | |||||||||||
| Agrium shares converted to Nutrien shares |
308,109,656 | 15,898 | ||||||||||
| Fractional shares cancelled 1 |
(1,399 | ) | – | |||||||||
| Balance – January 1, 2018 (Post-Merger) |
644,197,473 | 17,704 | ||||||||||
| Issued under option plans and share-settled plans |
670,201 | 34 | ||||||||||
| Repurchased |
(36,332,197 | ) | (998 | ) | ||||||||
| Balance – December 31, 2018 |
608,535,477 | $ | 16,740 | |||||||||
| 1 | No fractional shares of Nutrien were issued. Each PotashCorp shareholder and Agrium shareholder that would otherwise have been entitled to receive a fraction of a Nutrien share received, in lieu thereof, a cash amount, without interest, determined by reference to the volume weighted average trading price of Nutrien shares on the Toronto Stock Exchange on the first five trading days on which such shares traded on such exchange following January 2, 2018. |
Share Repurchase Program
On February 20, 2018, the Company’s Board of Directors approved a share repurchase program of up to 5 percent of the Company’s outstanding common shares over a one-year period through a normal course issuer bid. On December 14, 2018, the normal course issuer bid was increased to permit the repurchase of up to 8 percent of the Company’s outstanding common shares. Purchases of common shares commenced on February 23, 2018 and will expire on the earlier of February 22, 2019, the date on which the Company has acquired the maximum number of common shares allowable or the date on which the Company determines not to make any further repurchases.
| NUTRIEN 2018 | 134 | ANNUAL REPORT |
FINANCIAL STATEMENTS AND NOTES
IN MILLIONS OF US DOLLARS EXCEPT AS OTHERWISE NOTED
NOTE 24 SHARE CAPITAL CONTINUED
On February 20, 2019, the Company’s Board of Directors approved the renewal of the share repurchase program of up to 5 percent of the Company’s outstanding common shares over a one-year period through a normal course issuer bid.
Purchases under the normal course issuer bid will be made through open market purchases at market price as well as by other means as may be permitted by applicable securities regulatory authorities, including private agreements.
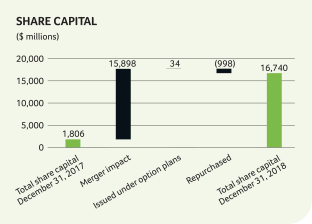
|
|
CAPITAL MANAGEMENT
|
The objective of Nutrien’s capital allocation policy is to balance between the return of capital to shareholders, improvement in the efficiency of the Company’s existing assets, and delivery on the Company’s growth opportunities, while maintaining a strong balance sheet and flexible capital structure to optimize the cost of capital at an acceptable level of risk. Nutrien’s goal is to pay a stable and growing dividend with a target payout that represents 40 to 60 percent of free cash flow after sustaining capital through the agricultural cycle.
| NUTRIEN 2018 | 135 | ANNUAL REPORT |
IN MILLIONS OF US DOLLARS EXCEPT AS OTHERWISE NOTED
NOTE 25 CAPITAL MANAGEMENT CONTINUED
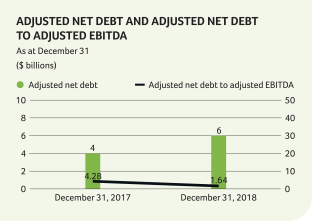
| NUTRIEN 2018 | 136 | ANNUAL REPORT |
FINANCIAL STATEMENTS AND NOTES
IN MILLIONS OF US DOLLARS EXCEPT AS OTHERWISE NOTED
|
|
COMMITMENTS
|
A commitment is an agreement that is enforceable and legally binding to make a payment in the future for the purchase of goods or services. These amounts are not recorded in the consolidated balance sheets since the Company has not yet received the goods or services from the supplier. The amounts below are what the Company is committed to pay based on current expected contract prices.
| Accounting Policies | Accounting Estimates and Judgments | |||
| Leases entered into are classified as either finance or operating leases. Leases that transfer substantially all of the risks and rewards of ownership of property to the Company are accounted for as finance leases. They are capitalized at the commencement of the lease at the lower of the fair value of the leased property and the present value of the minimum lease payments. Property acquired under a finance lease is depreciated over the shorter of the period of expected use on the same basis as other similar property, plant and equipment and the lease term.
Leases in which a significant portion of the risks and rewards of ownership are retained by the lessor are classified as operating leases. Rental payments under operating leases are expensed in net earnings on a straight-line basis over the period of the lease.
Refer to Note 32 for details pertaining to the impact of the adoption of IFRS 16 in 2019. |
Judgment is required in considering a number of factors to ensure that leases to which the Company is party are classified appropriately as operating or financing. Such factors include whether the lease term is for the major part of the asset’s economic life and whether the present value of minimum lease payments amounts to substantially all of the fair value of the leased asset.
As at December 31, 2018, substantially all of the leases to which the Company is party have been classified as operating leases. |
| Supporting Information |
| NUTRIEN 2018 | 137 | ANNUAL REPORT |
IN MILLIONS OF US DOLLARS EXCEPT AS OTHERWISE NOTED
NOTE 26 COMMITMENTS CONTINUED
Minimum future commitments under these contractual arrangements were as follows at December 31, 2018:
| Operating Leases |
Long-term debt, Principal and Estimated Interest |
Purchase Commitments |
Capital Commitments |
Other Commitments |
Total | |||||||||||||||||||
| Within 1 year |
$ | 216 | $ | 1,341 | $ | 1,364 | $ | 37 | $ | 114 | $ | 3,072 | ||||||||||||
| 1 to 3 years |
316 | 1,112 | 949 | 18 | 123 | 2,518 | ||||||||||||||||||
| 3 to 5 years |
212 | 1,576 | 945 | 2 | 61 | 2,796 | ||||||||||||||||||
| Over 5 years |
343 | 8,689 | 138 | – | 20 | 9,190 | ||||||||||||||||||
| Total |
$ | 1,087 | $ | 12,718 | $ | 3,396 | $ | 57 | $ | 318 | $ | 17,576 | ||||||||||||
|
|
GUARANTEES
|
| NUTRIEN 2018 | 138 | ANNUAL REPORT |
FINANCIAL STATEMENTS AND NOTES
IN MILLIONS OF US DOLLARS EXCEPT AS OTHERWISE NOTED
|
|
PENSION AND OTHER POST-RETIREMENT BENEFITS
|
The Company offers pension and other post-retirement benefits to qualified employees: defined benefit pension plans; defined contribution pension plans; and health, disability, dental and life insurance (referred to as other defined benefit) plans. Substantially all employees participate in at least one of these plans.
| Accounting Policies | Accounting Estimates and Judgments | |||
| For employee retirement and other defined benefit plans:
• accrued liabilities are recorded net of plan assets;
• costs including current and past service costs, gains or losses on curtailments and settlements, and remeasurements are actuarially determined on a regular basis using the projected unit credit method; and
• past service cost is recognized in net earnings at the earlier of when i) a plan amendment or curtailment occurs; or ii) related restructuring costs or termination benefits are recognized.
Remeasurements, recognized directly in OCI in the period they occur, are comprised of actuarial gains and losses, return on plan assets (excluding amounts included in net interest) and the effect of the asset ceiling (if applicable).
When a plan amendment occurs before a settlement, the Company recognizes past service cost before any gain or loss on settlement.
Defined contribution plan costs are recognized in net earnings for services rendered by employees during the period. |
Estimates and judgments are required to determine discount rates, health care cost trend rates, projected salary increases, retirement age, longevity and termination rates. These assumptions are determined by management and are reviewed annually by the Company’s independent actuaries.
The Company’s discount rate assumption is impacted by:
• the weighted average interest rate at which each pension and other post-retirement plan liability could be effectively settled at the measurement date;
• country specific rates; and
• the use of a yield curve approach. 1 | |||
|
1 Based on the respective plans’ demographics, expected future pension benefits and medical claims, payments are measured and discounted to determine the present value of the expected future cash flows. The cash flows are discounted using yields on high-quality AA-rated non-callable bonds with cash flows of similar timing where there is a deep market for such bonds. Where the Company does not believe there is a deep market for such bonds (such as for terms in excess of 10 years in Canada), the cash flows are discounted using a yield curve derived from yields on provincial bonds rated AA or better to which a spread adjustment is added to reflect the additional risk of corporate bonds. |
The significant assumptions used to determine the benefit obligations and expense for the Company’s significant plans as at and for the year ended December 31 were as follows:
| Pension | Other | |||||||||||||||||||||||
| 2018 | 2017 | 2018 | 2017 | |||||||||||||||||||||
| Assumptions used to determine the benefit obligations 1 : |
||||||||||||||||||||||||
| Discount rate, % |
4.22 | 3.65 | 4.17 | 3.65 | ||||||||||||||||||||
| Rate of increase in compensation levels, % |
4.75 | 5.00 | n/a | n/a | ||||||||||||||||||||
| Medical cost trend rate – assumed, % |
n/a | n/a | 6.10 – 4.50 | 2 | 5.60 – 4.50 | 2 | ||||||||||||||||||
| Medical cost trend rate – year reaches ultimate trend rate |
n/a | n/a | 2037 | 2037 | ||||||||||||||||||||
| Mortality assumptions 3 |
||||||||||||||||||||||||
| Life expectancy at 65 for a male member currently at age 65 |
20.6 | 20.7 | 20.4 | 20.0 | ||||||||||||||||||||
| Life expectancy at 65 for a female member currently at age 65 |
22.8 | 22.7 | 22.8 | 22.4 | ||||||||||||||||||||
| Average remaining service period of active employees (years) |
9.7 | 9.0 | 5.1 | 12.2 | ||||||||||||||||||||
| Average duration of the defined benefit obligations 4 (years) |
13.7 | 15.7 | 15.1 | 19.0 | ||||||||||||||||||||
| 1 | The current year’s expense is determined using the assumptions that existed at the end of the previous year. |
| 2 | The Company assumed a graded medical cost trend rate starting at 6.10 percent in 2018, moving to 4.50 percent by 2037 (2017 – starting at 5.60 percent, moving to 4.50 percent by 2037). |
| 3 | Based on actuarial advice in accordance with the latest available published tables, adjusted where appropriate to reflect future longevity improvements for each country. |
| 4 | Weighted average length of the underlying cash flows. |
n/a = not applicable
| NUTRIEN 2018 | 139 | ANNUAL REPORT |
IN MILLIONS OF US DOLLARS EXCEPT AS OTHERWISE NOTED
NOTE 28 PENSION AND OTHER POST-RETIREMENT BENEFITS CONTINUED
Of the most significant assumptions, a change in discount rates has the greatest potential impact on the Company’s pension and other post-retirement benefit plans, with sensitivity to change as follows:
| 2018 | 2017 | |||||||||||||||||||||||||||||||||
| Change in Assumption |
Benefit Obligations |
Expense in Income Before Income Taxes |
Benefit Obligations |
Expense in Income Before Income Taxes |
||||||||||||||||||||||||||||||
| As reported |
$ | 1,797 | $ | (87 | ) | $ | 1,831 | $ | 75 | |||||||||||||||||||||||||
| Discount rate |
1.0 percentage point $ | 271 | 24 | 326 | 20 | |||||||||||||||||||||||||||||
| 1.0 percentage point # | (218 | ) | (22 | ) | (251 | ) | (18 | ) | ||||||||||||||||||||||||||
Supporting Information
Description of Defined Benefit Pension Plans
The Company sponsors defined benefit pension plans as follows:
| Plan Type | Contributions | |||
| United States |
• non-contributory;
• guaranteed annual pension payments for life;
• benefits generally depend on years of service and compensation level in the final years leading up to age 65;
• benefits available starting at age 55 at a reduced rate; and
• plans provide for maximum pensionable salary and maximum annual benefit limits.
|
• made to meet or exceed minimum funding requirements of the Employee Retirement Income Security Act of 1974 (“ERISA”) and associated Internal Revenue Service regulations and procedures.
| ||
| Canada |
• made to meet or exceed minimum funding requirements based on provincial statutory requirements and associated federal taxation rules. | |||
| Supplemental Plans in US and Canada for Senior Management | • non-contributory;
• unfunded; and
• supplementary pension benefits. |
• provided for by charges to earnings sufficient to meet the projected benefit obligations; and
• payments to plans are made as plan payments to retirees occur. | ||
The Company’s defined benefit pension plans discussed above are funded with separate funds that are legally separated from the Company and administered through an employee benefits or management committee in each country, which is composed of employees of the Company. The employee benefits or management committee is required by law to act in the best interests of the plan participants and, in the US and Canada, is responsible for the governance of the plans, including setting certain policies (e.g., investment and contribution) of the funds. The current investment policy for each country’s plans generally does not include any asset/liability matching strategies or currency hedging strategies. Plan assets held in trusts are governed by local regulations and practice in each country, as is the nature of the relationship between the Company and the trustees and their composition.
| NUTRIEN 2018 | 140 | ANNUAL REPORT |
FINANCIAL STATEMENTS AND NOTES
IN MILLIONS OF US DOLLARS EXCEPT AS OTHERWISE NOTED
NOTE 28 PENSION AND OTHER POST-RETIREMENT BENEFITS CONTINUED
Financial Information
Movements in the pension and other post-retirement benefit assets (liabilities)
| Obligation | Plan Assets | Net | ||||||||||
| Balance – December 31, 2017 |
$ | (1,831 | ) | $ | 1,380 | $ | (451 | ) | ||||
| Merger impact 1 |
(347 | ) | 205 | (142 | ) | |||||||
| Components of defined benefit expense recognized in earnings |
||||||||||||
| Current service cost for benefits earned during the year |
(67 | ) | – | (67 | ) | |||||||
| Interest (expense) income |
(77 | ) | 62 | (15 | ) | |||||||
| Past service cost, including curtailment gains and settlements 2 |
157 | – | 157 | |||||||||
| Foreign exchange rate changes and other |
39 | (27 | ) | 12 | ||||||||
| Subtotal of components of defined benefit expense recognized in earnings |
52 | 35 | 87 | |||||||||
| Remeasurements of the net defined benefit liability recognized in OCI during the year |
||||||||||||
| Actuarial gain arising from: |
||||||||||||
| Changes in financial assumptions |
210 | – | 210 | |||||||||
| Changes in demographic assumptions |
11 | – | 11 | |||||||||
| Loss on plan assets (excluding amounts included in net interest) |
– | (149 | ) | (149 | ) | |||||||
| Subtotal of remeasurements |
221 | (149 | ) | 72 | ||||||||
| Cash flows |
||||||||||||
| Contributions by plan participants |
(6 | ) | 6 | – | ||||||||
| Employer contributions |
– | 53 | 53 | |||||||||
| Benefits paid |
114 | (114 | ) | – | ||||||||
| Subtotal of cash flows |
108 | (55 | ) | 53 | ||||||||
| Balance – December 31, 2018 3 |
$ | (1,797 | ) | $ | 1,416 | $ | (381 | ) | ||||
| Balance comprised of: |
||||||||||||
| Non-current assets |
||||||||||||
| Other assets (Note 18) |
$ | 27 | ||||||||||
| Current liabilities |
||||||||||||
| Payables and accrued charges (Note 19) |
$ | (13) | ||||||||||
| Non-current liabilities |
||||||||||||
| Pension and other post-retirement benefit liabilities |
$ | (395) | ||||||||||
| 1 | The Company acquired Agrium’s pension and other post-retirement benefit obligations, representing the fair values at the acquisition date as described in Note 3. |
| 2 | In 2018, as part of the Company’s continuous assessment of its operations, participation in certain company defined benefit pension and other post-retirement benefit plans was suspended and/or discontinued effective January 1, 2020 based on age and years of service. As a result, the Company recognized a Merger-related Defined Benefit Plans Curtailment Gain of $157. |
| 3 | Obligations arising from funded and unfunded pension plans are $(1,466) and $(331), respectively. Other post-retirement benefit plans have no plan assets and are unfunded. |
| NUTRIEN 2018 | 141 | ANNUAL REPORT |
IN MILLIONS OF US DOLLARS EXCEPT AS OTHERWISE NOTED
NOTE 28 PENSION AND OTHER POST-RETIREMENT BENEFITS CONTINUED
| Obligation | Plan Assets | Net | ||||||||||
| Balance – December 31, 2016 |
$ | (1,698 | ) | $ | 1,246 | $ | (452 | ) | ||||
| Components of defined benefit expense recognized in earnings |
(131 | ) | 56 | (75 | ) | |||||||
| Remeasurements of the net defined benefit liability recognized in OCI during the year |
(57 | ) | 123 | 66 | ||||||||
| Cash flows |
55 | (45 | ) | 10 | ||||||||
| Balance – December 31, 2017 1 |
$ | (1,831 | ) | $ | 1,380 | $ | (451 | ) | ||||
| Balance comprised of: |
||||||||||||
| Non-current assets |
||||||||||||
| Other assets (Note 18) |
$ | 24 | ||||||||||
| Current liabilities |
||||||||||||
| Payables and accrued charges (Note 19) |
$ | (35 | ) | |||||||||
| Non-current liabilities |
||||||||||||
| Pension and other post-retirement benefit liabilities |
$ | (440 | ) | |||||||||
| 1 | Obligations arising from funded and unfunded pension plans are $(1,445) and $(386), respectively. Other post-retirement benefit plans have no plan assets and are unfunded. |
Plan Assets
The fair value of plan assets of the Company’s defined benefit pension plans, by asset category, was as follows as at December 31:
| 2018 | 2017 | |||||||||||||||||||||||||||||||
| Quoted Prices in Active Markets for Identical Assets (Level 1) |
Other (Level 2 & 3) |
Total | Quoted Prices in Active Markets for Identical Assets (Level 1) |
Other (Level 2 & 3) |
Total | |||||||||||||||||||||||||||
| Cash and cash equivalents |
$ | 6 | $ | 54 | $ | 60 | $ | 13 | $ | 33 | $ | 46 | ||||||||||||||||||||
| Equity securities and equity funds |
||||||||||||||||||||||||||||||||
| US |
454 | 65 | 519 | 565 | 2 | 567 | ||||||||||||||||||||||||||
| International |
175 | 65 | 240 | 151 | 29 | 180 | ||||||||||||||||||||||||||
| Debt securities 1 |
187 | 329 | 516 | 190 | 244 | 434 | ||||||||||||||||||||||||||
| International balanced fund |
– | 97 | 97 | – | 173 | 173 | ||||||||||||||||||||||||||
| Other |
(25 | ) | 9 | (16 | ) | (20 | ) | – | (20 | ) | ||||||||||||||||||||||
| Total pension plan assets |
$ | 797 | $ | 619 | $ | 1,416 | $ | 899 | $ | 481 | $ | 1,380 | ||||||||||||||||||||
| 1 | Debt securities included US securities of 52 percent (2017 – 62 percent), International securities of 31 percent (2017 – 18 percent) and Mortgage-backed securities of 17 percent (2017 – 20 percent). |
Letters of credit secured certain of the Canadian unfunded defined benefit plan liabilities as at December 31, 2018.
The Company expects to contribute approximately $97 to all pension and post-retirement plans during 2019. Total contributions recognized as expense under all defined contribution plans for 2018 was $75 (2017 – $19).
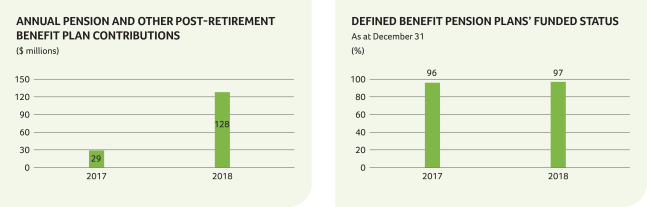
| NUTRIEN 2018 | 142 | ANNUAL REPORT |
FINANCIAL STATEMENTS AND NOTES
IN MILLIONS OF US DOLLARS EXCEPT AS OTHERWISE NOTED
|
|
SHARE-BASED COMPENSATION
|
The Company has share-based compensation plans for eligible employees and directors as part of their remuneration package, including Stock Options, PSUs, Restricted Share Units (“RSUs”) and Deferred Share Units (“DSUs”). In addition, in connection with the completion of the Merger, the Company assumed the legacy compensation plans and outstanding awards of PotashCorp and Agrium, which include Stock Options, PSUs, RSUs and Stock Appreciation Rights (“SARs”).
| Accounting Policies | Accounting Estimates and Judgments | |||
| The accounting for share-based compensation plans is fair value-based.
The grant date is the date the Company and the employee have a shared understanding of the terms and conditions of the arrangement, at which time the Company confers on the employee the right to cash equity instruments, provided the specified vesting conditions, if any, are met.
For those awards with performance conditions that determine the number of options or units to which employees will be entitled, measurement of compensation cost is based on the Company’s best estimate of the outcome of the performance conditions.
For plans settled through the issuance of equity:
• fair value for stock options is determined on grant date using the Black-Scholes-Merton option-pricing model;
• fair value for PSUs is determined on grant date by projecting the outcome of performance conditions;
• compensation expense is recorded over the period the plans vest (corresponding increase to contributed surplus);
• forfeitures are estimated throughout the vesting period based on past experience and future expectations, and adjusted upon actual vesting; and
• when exercised, the proceeds and amounts recorded in contributed surplus are recorded in share capital.
For plans settled in cash:
• a liability is recorded based on the fair value of the awards each period;
• expense accrues from the grant date over the vesting period; and
• fluctuations in fair value of the award and related compensation expense are recognized in the period the fluctuation occurs.
|
Judgment involves determining:
• the grant date; and
• the fair value of share-based compensation awards at the grant date.
Estimation involves determining:
• stock option-pricing model assumptions as described in the weighted average assumptions table below;
• forfeiture rate for options granted;
• projected outcome of performance conditions for PSUs, including the relative ranking of the Company’s total shareholder return, including expected dividends, compared with a specified peer group using a Monte Carlo simulation option-pricing model and the outcome of the Company’s synergies relative to the target; and
• the number of dividend equivalent units expected to be earned.
PSUs vest based on the achievement of performance conditions over a three-year performance cycle. Changes to vesting assumptions may change based on non-market vesting conditions at the end of each reporting period.
RSUs are not subject to performance conditions and vest at the end of the three-year vesting period.
Changes to vesting assumptions are reflected in earnings immediately for compensation cost already recognized. |
| NUTRIEN 2018 | 143 | ANNUAL REPORT |
IN MILLIONS OF US DOLLARS EXCEPT AS OTHERWISE NOTED
NOTE 29 SHARE-BASED COMPENSATION CONTINUED
Supporting Information
During the year ended December 31, 2018, the Company issued stock options under its 2018 stock option plan, PSUs and RSUs under its 2018 PSU/RSU plan and DSUs under its 2018 DSU plan, in each case to eligible employees and directors. In 2018, the outstanding legacy share-based compensation plans of PotashCorp and Agrium were also assumed by, and settled in or with reference to shares of, Nutrien on the basis of the exchange ratios described in Note 3.
As at December 31, 2018, the Company had the following awards available to be granted under the 2018 stock option plan, the 2018 PSU/RSU plan and the 2018 DSU plan:
| Plan Features | ||||||||||
| Form of Payment | Eligibility | Granted | Vesting Period | Maximum Term | Settlement | |||||
| Stock Options |
Officers and eligible employees | Annually | 25% per year over four years |
10 years | Shares | |||||
| PSUs 1 |
Officers and other eligible employees | Annually | On third anniversary of grant date |
n/a | Cash | |||||
| RSUs 2 |
Eligible employees | Annually | On third anniversary of grant date |
n/a | Cash | |||||
| DSUs |
Non-executive directors |
At the discretion of the Board of Directors |
Fully vest upon grant |
n/a | In cash on director’s departure from Board of Directors | |||||
| 1 | PSUs granted vest based on total shareholder return over a three-year performance cycle, compared to average total shareholder return of a peer group of companies over the same period. The value of each PSU granted is based on the average closing price of the Company’s common shares on the NYSE during the last month of the three-year cycle. |
| 2 | RSUs granted are not subject to performance conditions and vest at the end of the three-year period. |
| n/a | = not applicable |
In addition, as at December 31, 2018, the Company had the following awards outstanding under one or more assumed legacy plans of PotashCorp and/or Agrium under which no new awards will be granted:
| Plan Features | ||||||
| Form of Payment | Vesting Period | Maximum Term | Settlement | |||
| Stock Options |
25% per year over four years 1 On third anniversary of grant date 2 |
10 years | Shares | |||
| PSUs 3,4 |
On third anniversary of grant date | n/a | Cash /Shares | |||
| RSUs 5 |
On third anniversary of grant date | n/a | Cash | |||
| SARs 6 |
25% per year over four years | 10 years | Cash | |||
| 1 | Under the assumed legacy Agrium stock option plan. |
| 2 | Under the assumed legacy PotashCorp long-term incentive plan and performance option plans. |
| 3 | Under the assumed legacy PotashCorp long-term incentive plan, PSUs granted in 2017 and 2016 were comprised of three tranches, with each tranche vesting based on achievement of a combination of performance metrics over separate performance periods ranging from one to three years and such PSUs will be settled in shares for grantees who are subject to the Company’s share ownership guidelines and in cash for all other grantees. |
| 4 | Under the assumed legacy Agrium long-term incentive plan, PSUs granted in 2017 and 2016 vest over a three-year performance cycle based on the achievement of performance metrics and will be settled in cash. |
| 5 | Under the assumed legacy Agrium long-term incentive plan, RSUs granted in 2017 and 2016 are not subject to performance conditions, vest at the end of the three-year period and will be settled in cash. |
| 6 | Under the assumed legacy Agrium SARs plan, effective January 1, 2015, tandem stock appreciation rights (“TSARs”) were no longer issued to eligible officers and employees. TSARs granted in Canada prior to January 1, 2015 have similar terms and vesting conditions to SARs and also provide the holder with the ability to choose between (a) receiving the price of the Company’s shares on the date of exercise in excess of the exercise price of the right and (b) receiving common shares by paying the exercise price of the right. The Company’s past experience and future expectation is that substantially all option holders will elect to exercise their options as a SAR, surrendering their options and receiving settlement in cash. TSARs are included with the SARs disclosure. |
| n/a | = not applicable |
| NUTRIEN 2018 | 144 | ANNUAL REPORT |
FINANCIAL STATEMENTS AND NOTES
IN MILLIONS OF US DOLLARS EXCEPT AS OTHERWISE NOTED
NOTE 29 SHARE-BASED COMPENSATION CONTINUED
The weighted average fair value of stock options granted was estimated as of the date of the grant using the Black-Scholes-Merton option-pricing model. The weighted average grant date fair value of stock options per unit granted in 2018 was $9.71. The weighted average assumptions for both legacy companies by year of grant that impacted current year results are as follows:
| Year of Grant | ||||||||||
| Assumptions | Based On | 2018 | 2017 1 | |||||||
| Exercise price per option |
Quoted market closing price 2 | $ | 44.50 | $ | 46.47 | |||||
| Expected annual dividend yield |
Annualized dividend rate 3 | 3.58% | 2.93% | |||||||
| Expected volatility |
Historical volatility 4 | 29% | 28% | |||||||
| Risk-free interest rate |
Zero-coupon government issues 5 | 2.79% | 1.95% | |||||||
| Average expected life of options |
Historical experience | 7.5 years | 6.2 years | |||||||
| 1 | The weighted average assumptions used by both legacy companies were presented due to the multi-year impact on share-based compensation expense. |
| 2 | Of common shares on the last trading day immediately preceding the date of the grant. |
| 3 | As of the date of grant. |
| 4 | Of the Company’s stock over a period commensurate with the expected life of the option. |
| 5 | Implied yield available on equivalent remaining term at the time of the grant. |
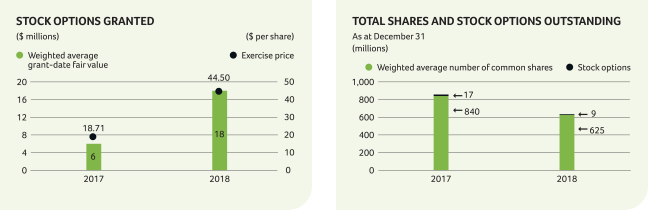
| ||
The exercise price is not less than the quoted market closing price of the Company’s common shares on the last trading day immediately preceding the date of the grant, and an option’s maximum term is 10 years. In general, options granted under assumed legacy PotashCorp performance option plans vested according to a schedule based on legacy PotashCorp’s three-year average excess consolidated cash flow return on investment over the weighted average cost of capital.
A summary of the status of the stock option plans as at December 31, 2018 and 2017 and changes during the years ending on those dates is as follows:
| Number of Shares Subject to Option | Weighted Average Exercise Price | |||||||||||||||||||||||||||||||
| 2018 (Pre-Merger) |
2018 (Post-Merger) |
2017 | 2018 (Pre-Merger) |
2018 (Post-Merger) |
2017 | |||||||||||||||||||||||||||
| PotashCorp outstanding, beginning of year |
17,170,654 | 19,470,014 | $ | 32.24 | $ | 31.15 | ||||||||||||||||||||||||||
| PotashCorp shares converted to Nutrien shares (Conversion ratio 0.40) |
6,868,262 | $ | 80.60 | |||||||||||||||||||||||||||||
| Agrium outstanding shares—beginning of year |
1,380,868 | 100.08 | ||||||||||||||||||||||||||||||
| Agrium shares converted to Nutrien shares (Conversion ratio 2.23) |
3,079,321 | 44.88 | ||||||||||||||||||||||||||||||
| Balance – beginning of year |
9,947,583 | 19,470,014 | $ | 69.54 | $ | 31.15 | ||||||||||||||||||||||||||
| Granted |
1,875,162 | 1,482,829 | 44.50 | 18.71 | ||||||||||||||||||||||||||||
| Exercised |
(647,331 | ) | (22,100 | ) | 42.86 | 17.78 | ||||||||||||||||||||||||||
| Forfeited or cancelled |
(1,793,077 | ) | (1,221,314 | ) | 82.84 | 34.55 | ||||||||||||||||||||||||||
| Expired |
(338,100 | ) | (2,538,775 | ) | 154.94 | 20.06 | ||||||||||||||||||||||||||
| Outstanding, end of year |
9,044,237 | 17,170,654 | $ | 58.41 | $ | 32.24 | ||||||||||||||||||||||||||
The aggregate grant-date fair value of all stock options granted during 2018 was $18. The average share price during 2018 was $51.80 per share.
| NUTRIEN 2018 | 145 | ANNUAL REPORT |
IN MILLIONS OF US DOLLARS EXCEPT AS OTHERWISE NOTED
NOTE 29 SHARE-BASED COMPENSATION CONTINUED
The following table summarizes information about stock options outstanding as at December 31, 2018 with expiry dates ranging from May 2019 to February 2028:
| Options Outstanding | Options Exercisable | |||||||||||||||||||
| Range of Exercise Prices | Number | Weighted Remaining |
Weighted Exercise |
Number | Weighted Exercise |
|||||||||||||||
| $ 37.00 to $ 41.00 |
2,064,621 | 7 | $ | 38.59 | 966,606 | $ | 38.22 | |||||||||||||
| $ 44.00 to $ 52.00 |
3,996,110 | 8 | 46.88 | 1,542,489 | 48.75 | |||||||||||||||
| $ 64.00 to $ 75.00 |
834,091 | 4 | 71.57 | 834,091 | 71.57 | |||||||||||||||
| $ 80.00 to $ 88.00 |
959,275 | 4 | 82.30 | 959,275 | 82.30 | |||||||||||||||
| $ 91.00 to $110.00 |
1,040,300 | 4 | 99.04 | 1,040,300 | 99.04 | |||||||||||||||
| $130.00 to $131.00 |
149,840 | 2 | 130.78 | 149,840 | 130.78 | |||||||||||||||
| 9,044,237 | 7 | $ | 58.41 | 5,492,601 | $ | 68.01 | ||||||||||||||
Other Plans
The Company offers its 2018 DSU plan to non-employee directors, which allows each to choose to receive, in the form of DSUs, all or a percentage of the director’s fees, which would otherwise be payable in cash. Each DSU fully vests upon award but is distributed only when the director has ceased to be a member of the Board. Vested units are settled in cash based on the common share price at that time. As at December 31, 2018, the total number of DSUs held by participating directors was 456,848.
|
|
RELATED PARTY TRANSACTIONS
|
The Company has a number of related parties with the most significant being Canpotex, key management personnel and post-employment benefit plans.
| Accounting Policies | Supporting Information | |||
|
A person or entity is considered a related party if it is:
• an associate or joint venture of Nutrien;
• a member of key management personnel, consisting of the Company’s directors and executives as disclosed in the Company’s 2018 Annual Information Form;
• a post-employment benefit plan for the benefit of Nutrien employees; or
• a person that has significant influence over Nutrien. |
Sale of Goods The Company sells potash from its Canadian mines for use outside Canada and the US exclusively to Canpotex. Sales are at prevailing market prices and are settled on normal trade terms. Sales to Canpotex for the year ended December 31, 2018 were $1,657 (2017 – $988). Canpotex’s proportionate sales volumes by geographic area are shown in Note 4.
The receivable outstanding from Canpotex is shown in Note 14 and arose from sale transactions described above. It is unsecured and bears no interest. There are no provisions held against this receivable. |
| NUTRIEN 2018 | 146 | ANNUAL REPORT |
FINANCIAL STATEMENTS AND NOTES
IN MILLIONS OF US DOLLARS EXCEPT AS OTHERWISE NOTED
NOTE 30 RELATED PARTY TRANSACTIONS CONTINUED
Key Management Personnel Compensation
Compensation to key management personnel was comprised of:
| 2018 | 2017 | |||||||
| Salaries and other short-term benefits |
$ | 19 | $ | 14 | ||||
| Share-based compensation |
53 | 9 | ||||||
| Post-employment benefits |
3 | 3 | ||||||
| Termination benefits 1 |
23 | – | ||||||
| $ | 98 | $ | 26 | |||||
| 1 | Primarily includes costs incurred with respect to departure of five key management personnel in 2018 following completion of the Merger. |
Transactions with Post-Employment Benefit Plans
Disclosures related to the Company’s post-employment benefit plans are shown in Note 28.
|
|
CONTINGENCIES AND OTHER MATTERS
|
Contingent liabilities, which are not recognized in the consolidated financial statements but may be disclosed, are possible obligations as a result of uncertain future events outside the control of the Company, or present obligations not recognized because the amount cannot be sufficiently measured or payment is not probable.
| Accounting Policies | Accounting Estimates and Judgments | |||
| Generally, a contingent liability arises from past events and is:
• a possible obligation whose existence will be confirmed only by one or more uncertain future events or non-events outside the control of the Company; or
• a present obligation not recognized because it is not probable an outflow of resources will be required to settle the obligation, or a reliable estimate of the amount cannot be made.
Contingent liabilities are not recognized in the financial statements but are disclosed unless the possibility of an outflow of resources embodying economic benefits is remote. Where the Company is jointly and severally liable for an obligation, the part of the obligation that is expected to be met by other parties is treated as a contingent liability. |
The following judgments are required to determine the Company’s exposure to possible losses and gains related to environmental matters and other various claims and lawsuits pending:
• prediction of the outcome of uncertain events (i.e., being virtually certain, probable, remote or undeterminable);
• determination of whether recognition or disclosure in the consolidated financial statements is required; and
• estimation of potential financial effects.
Where no amounts are recognized, such amounts are contingent and disclosure may be appropriate. While the amount disclosed in the consolidated financial statements may not be material, the potential for large liabilities exists and, therefore, these estimates could have a material impact on the Company’s consolidated financial statements. |
Supporting Information
| NUTRIEN 2018 | 147 | ANNUAL REPORT |
IN MILLIONS OF US DOLLARS EXCEPT AS OTHERWISE NOTED
NOTE 31 CONTINGENCIES AND OTHER MATTERS CONTINUED
| NUTRIEN 2018 | 148 | ANNUAL REPORT |
FINANCIAL STATEMENTS AND NOTES
IN MILLIONS OF US DOLLARS EXCEPT AS OTHERWISE NOTED
|
|
ACCOUNTING POLICIES, ESTIMATES AND JUDGMENTS
|
Accounting Policies, Estimates and Judgments
The following table discusses the significant accounting policies, estimates, judgments and assumptions, in addition to those disclosed elsewhere in these consolidated financial statements, that the Company has adopted and made and how they affect the amounts reported in the consolidated financial statements. Certain of the Company’s policies involve accounting estimates and judgments because they require the Company to make subjective or complex judgments about matters that are inherently uncertain and because of the likelihood that materially different amounts could be reported under different conditions or using different assumptions.
| Topic | Accounting Policies | Accounting Estimates and Judgments | ||||||
| Principles of Consolidation | These consolidated financial statements include the accounts of the Company and entities controlled by it (its subsidiaries). Control is achieved by having each of:
• power over the investee to direct the relevant activities of the investee;
• exposure, or rights, to variable returns from involvement with the investee; and
• the ability for the Company to use its power over the investee to affect the amount of the Company’s returns. |
Judgment involves:
• assessing control, including if the Company has the power to direct the relevant activities of the investee; and
• determining the relevant activities and which party controls them. | ||||||
| The existence and effect of potential voting rights that are currently exercisable or convertible are considered when assessing whether the Company controls another entity.
Subsidiaries are fully consolidated from the date on which control is transferred to the Company. They are deconsolidated from the date that control ceases.
|
Consideration is given to:
• voting rights;
• the relative size and dispersion of the voting rights held by other shareholders;
• the extent of participation by those shareholders in appointing key management personnel or board members;
• the right to direct the investee to enter into transactions for the Company’s benefit; and
• the exposure, or rights, to variability of returns from the Company’s involvement with the investee. | |||||||
| Principal (wholly owned) Operating Subsidiaries: |
Location | Principal Activity | ||||||
| • Potash Corporation of Saskatchewan Inc. |
Canada | Mining and/or processing of crop nutrient products and corporate functions | ||||||
| • Agrium Inc. |
Canada | Manufacturer and distributor of crop nutrients and corporate functions | ||||||
| • Agrium Canada Partnership |
Canada | Manufacturer and distributor of crop nutrients | ||||||
| • Agrium Potash Ltd. |
Canada | Manufacturer and distributor of crop nutrients | ||||||
| • Agrium U.S. Inc. |
United States | Manufacturer and distributor of crop nutrients | ||||||
| • Nutrien Ag Solutions Argentina S.A. (Argentina) |
Argentina | Crop input retailer | ||||||
| • Cominco Fertilizer Partnership |
United States | Manufacturer and distributor of crop nutrients | ||||||
| • Nutrien Ag Solutions, Inc. |
United States | Crop input retailer | ||||||
| • Nutrien Ag Solutions (Canada) Inc. |
Canada | Crop input retailer | ||||||
| • Landmark Operations Ltd. |
Australia | Crop input retailer | ||||||
| • Loveland Products, Inc. |
United States | Crop input developer and retailer | ||||||
| • PCS Sales (Canada), Inc. |
Canada | Marketing and sales of the Company’s products | ||||||
| • PCS Sales (USA), Inc. |
United States | Marketing and sales of the Company’s products | ||||||
| • PCS Phosphate Company, Inc. – PCS Purified Phosphates |
United States | Mining and/or processing of phosphate products in the states of North Carolina, Illinois, Missouri and Nebraska | ||||||
| NUTRIEN 2018 | 149 | ANNUAL REPORT |
IN MILLIONS OF US DOLLARS EXCEPT AS OTHERWISE NOTED
| Topic | Accounting Policies | Accounting Estimates and Judgments | ||||||
| • PCS Nitrogen Fertilizer, L.P. |
United States | Production of nitrogen products in the states of Georgia and Louisiana, and of phosphate products in the state of Louisiana | ||||||
| • PCS Nitrogen Ohio, L.P. |
United States | Production of nitrogen products in the state of Ohio | ||||||
| • PCS Nitrogen Trinidad Limited |
Trinidad | Production of nitrogen products in Trinidad | ||||||
| • White Springs Agricultural Chemicals, Inc. (“White Springs”) |
United States | Mining and processing of phosphate products in the state of Florida | ||||||
| Intercompany balances and transactions are eliminated on consolidation. | ||||||||
| Long-Lived Asset Impairment | At the end of each reporting period, the Company reviews conditions to determine whether there is any indication that an impairment exists that could potentially impact the carrying amounts of both its long-lived assets to be held and used and its identifiable intangible assets with finite lives. When such indicators exist, impairment testing is performed. Regardless, goodwill is tested at least annually (in the fourth quarter).
To assess impairment, assets are grouped at the smallest levels for which there are separately identifiable cash inflows that are largely independent of the cash inflows from other assets or groups of assets (this can be at the asset or CGU level).
Where impairment indicators exist for the asset or CGU:
• the recoverable amount is estimated (the higher of FVLCD and value in use);
• to assess value in use, the estimated future cash flows are discounted to their present value (using a pre-tax discount rate that reflects current market assessments of the time value of money and the risks specific to the asset or CGU for which the estimates of future cash flows have not been adjusted);
• the impairment loss is the amount by which the carrying amount exceeds its recoverable amount; and
• the impairment loss is allocated first to reduce the carrying amount of any related goodwill and then pro rata to each asset in the unit (on the basis of the carrying amount).
Non-financial assets, other than goodwill, that previously suffered an impairment loss are reviewed at each reporting date for possible reversal of the impairment. |
Judgment involves:
• identifying the appropriate asset or CGU;
• determining the appropriate discount rate for assessing value in use; and
• making assumptions about future sales, margins and market conditions over the long-term life of the assets or CGUs.
The Company cannot predict if an event that triggers impairment will occur, when it will occur or how it will affect reported asset amounts. Asset impairment amounts previously recorded could be affected if different assumptions were used or if market and other conditions change. Such changes could result in non-cash charges materially affecting the Company’s consolidated financial statements.
Impairments were recognized during 2018 and 2017 as shown in Note 16. | ||||||
| NUTRIEN 2018 | 150 | ANNUAL REPORT |
NOTE 32 ACCOUNTING POLICIES, ESTIMATES AND JUDGMENTS CONTINUED
FINANCIAL STATEMENTS AND NOTES
IN MILLIONS OF US DOLLARS EXCEPT AS OTHERWISE NOTED
NOTE 32 ACCOUNTING POLICIES, ESTIMATES AND JUDGMENTS CONTINUED
| Topic | Accounting Policies | Accounting Estimates and Judgments | ||||||
| Fair Value Measurements | Fair value is the price that would be received to sell an asset or paid to transfer a liability in an orderly transaction between market participants at the measurement date, regardless of whether that price is directly observable or estimated using another valuation technique.
Fair value measurements are categorized into levels based on the degree to which inputs are observable and their significance:
|
Fair value estimates:
• are at a point-in-time and may change in subsequent reporting periods due to market conditions or other factors;
• can be determined using multiple methods, which can cause values (or a range of reasonable values) to differ; and
• may require assumptions about costs/prices over time, discount and inflation rates, defaults and other relevant variables.
Determination of the level hierarchy is based on the Company’s assessment of the lowest level input that is significant to the fair value measurement and is subject to estimation and judgment. | ||||||
| Level 1 | Level 2 | Level 3 | ||||||
| Unadjusted quoted prices (in active markets accessible at the measurement date for identical assets or liabilities). | Quoted prices (in markets that are not active or based on inputs that are observable for substantially the full term of the asset or liability). | Prices or valuation techniques that require inputs that are both unobservable and significant to the overall measurement. | ||||||
| Restructuring Charges | Plant shutdowns, sales of business units or other corporate restructurings may trigger restructuring costs. Incremental costs for employee termination, contract termination and other exit costs are recognized as a liability and an expense when:
• a detailed formal plan for restructuring has been demonstrably committed to;
• withdrawal is without realistic possibility; and
• a reliable estimate can be made. |
Restructuring activities are complex, can take several months to complete and usually involve reassessing estimates throughout the process. | ||||||
| Foreign Currency Transactions | Items included in the consolidated financial statements of the Company and each of its subsidiaries are measured using the currency of the primary economic environment in which the individual entity operates (“the functional currency”).
Foreign exchange gains and losses resulting from the settlement of foreign currency transactions, and from the translation at period-end exchange rates of monetary assets and liabilities denominated in foreign currencies, are recognized and presented in the consolidated statements of earnings within other expenses, as applicable, in the period in which they arise.
Translation differences from non-monetary assets and liabilities carried at fair value are recognized as part of changes in fair value. Translation differences on non-monetary financial assets such as investments in equity securities classified as FVTOCI are included in OCI. Non-monetary assets measured at historical cost are translated at the average monthly exchange rate prevailing at the time of the transaction, unless the exchange rate in effect on the date that the transaction occurred is available and it is apparent that such rate is a more suitable measurement. |
The consolidated financial statements are presented in US dollars, which was determined to be the functional currency of the Company and the majority of its subsidiaries. | ||||||
| NUTRIEN 2018 | 151 | ANNUAL REPORT |
IN MILLIONS OF US DOLLARS EXCEPT AS OTHERWISE NOTED
NOTE 32 ACCOUNTING POLICIES, ESTIMATES AND JUDGMENTS CONTINUED
Standards, Amendments and Interpretations Effective and Applied
The International Accounting Standards Board (“IASB”) and IFRS Interpretations Committee (“IFRIC”) have issued certain standards and amendments or interpretations to existing standards that were effective and applied by the Company. The standards disclosed below had a material impact or disclosure impact to the Company’s consolidated financial statements.
| Standard | Description | Impact | ||
| IFRS 15, Revenue from Contracts With Customers | Issued to provide guidance on the recognition of revenue from contracts with customers, including multiple-element arrangements and transactions not previously addressed comprehensively, and enhance disclosures about revenue. | Adopted using the modified retrospective method effective January 1, 2018, with required disclosures included in Note 4. No cumulative adjustment is required to the opening balance of retained earnings.
The Company elected to use the practical expedient related to the adjustment of the promised consideration for the effects of a significant financing component as the expected period between when control over a promised good or service is transferred and when the customer pays for that good or service is less than 12 months.
The Company sells certain retail products to end-customers with a right of return. Therefore, a refund liability and a right to the returned goods (included in inventory) are now recognized separately for the products expected to be returned. | ||
| IFRS 9, Financial Instruments | Issued to replace International Accounting Standards (“IAS”) 39, providing guidance on the classification, measurement and disclosure of financial instruments and introducing a new hedge accounting model. | On adoption of IFRS 9, in accordance with transitional provisions, the Company has not restated prior periods but has reclassified the financial assets held at January 1, 2018, retrospectively, based on the new classification requirements and the characteristics of each financial instrument at the transition date. For financial liabilities, IFRS 9 retains most of the IAS 39 requirements. The Company did not designate any financial liabilities at fair value through profit or loss; therefore, the adoption of IFRS 9 did not impact the Company’s accounting policies for financial liabilities. Refer to Note 13 for details.
In addition, there was no change in the classification of the derivative instruments. The Company adopted the new general hedge accounting model under IFRS 9. This requires the Company to ensure that the hedge accounting relationships are aligned with its risk management objective and strategy and to apply a more qualitative and forward-looking approach to assess hedge effectiveness. The Company also reclassified realized cash flow hedges as a basis adjustment to finished goods inventory, recorded directly through accumulated other comprehensive income (net of income taxes). |
| Financial Instrument | Category under IAS 39 | Category under IFRS 9 | ||
| Financial assets |
||||
| Cash and cash equivalents |
FVTPL | FVTPL | ||
| Receivables |
Loans and receivables | Amortized cost | ||
| Derivatives |
FVTPL | FVTPL | ||
| Derivatives designated as hedges |
FV – hedging instrument |
FV – hedging instrument | ||
| Prepaid expenses and other current assets – marketable securities |
FVTPL | FVTPL | ||
| Investments – equity securities |
Available-for-sale | FVTOCI | ||
| Investments – equity securities |
FVTPL | FVTPL | ||
| Financial liabilities |
||||
| Short-term and long-term debt |
Amortized cost | Amortized cost | ||
| Payables and accrued charges, excluding derivatives |
Amortized cost | Amortized cost |
IFRS 9 replaces the incurred loss model in IAS 39 with an expected credit loss model. This applies to financial assets measured at amortized cost. Under IFRS 9, credit losses are recognized earlier than under IAS 39. This change did not have a material impact to the Company’s receivables.
| NUTRIEN 2018 | 152 | ANNUAL REPORT |
FINANCIAL STATEMENTS AND NOTES
IN MILLIONS OF US DOLLARS EXCEPT AS OTHERWISE NOTED
NOTE 32 ACCOUNTING POLICIES, ESTIMATES AND JUDGMENTS CONTINUED
Standards, Amendments and Interpretations Not Yet Effective and Not Applied
The IASB and IFRIC have issued the following standards, amendments or interpretations to existing standards that were not yet effective and not applied as at December 31, 2018.
| Standard | Description | Expected Impact | Effective Date 1 | |||||||
| IFRS 16, Leases | Issued to supersede IAS 17 and related
ROU assets represent the right to use |
The Company has substantially completed its
Compared with the existing accounting for
The Company’s assessment will not result in
The adoption will result in an increase to |
January 1, 2019, applied using the modified retrospective method (which in the Company’s case results in prospective application) measuring the ROU asset equal to the lease liability, and using the Company’s incremental borrowing rate to determine the present value of future lease payments. The Company has chosen to apply practical expedients, including recognition exemptions for short-term and low- value leases, and to grandfather the lease definition on transition. | |||||||
| 1 | Effective date for annual periods beginning on or after the stated date. |
| The following amended standards and interpretations are not expected to have a material impact on the Company’s consolidated financial statements: | The following amended standards and interpretations are being reviewed by the Company to determine the potential impact on the Company’s consolidated financial statements: | |
|
• IFRIC 23, Uncertainty Over Income Tax Treatments |
• Conceptual Framework for Financial Reporting | |
|
• Amendments to IAS 28, Long-term Interests in Associates and Joint Ventures |
• IFRS 17, Insurance Contracts
• Amendments to IAS 1 and IAS 8, Definition of Material | |
|
• Amendments to IAS 19, Employee Benefits | ||
|
• Amendments to IFRS 3, Business Combinations |
||
|
• Amendments to IAS 12, Income Taxes |
||
|
• Amendments to IAS 23, Borrowing Costs |
| NUTRIEN 2018 | 153 | ANNUAL REPORT |
IN MILLIONS OF US DOLLARS EXCEPT AS OTHERWISE NOTED
|
|
COMPARATIVE FIGURES
|
As described in Note 1, the comparative figures are PotashCorp only. To conform with Nutrien’s new method of presentation, comparative figures were reclassified and additional 2017 information was provided, with no impact to net earnings, total assets and liabilities, and cash provided by operating activities.
The following additional information is retrospectively included in the 2017 comparatives to conform with current year presentation:
| • | Note 4 Segment Information, the first table on page 106 contains an analysis by segment of selling expenses, general and administrative expenses, other operating expenses and EBITDA. |
| • | Note 25 Capital Management includes a line item for EBITDA and adjusted EBITDA was revised to conform with Nutrien’s definition. |
Refer to Notes 4, 5, 6, 7, 12 and 25 for further information specific to this additional information and the reclassifications within the tables.
| NUTRIEN 2018 | 154 | ANNUAL REPORT |