.3
2019 Annual Audited
Financial Statements
.3
2019 Annual Audited
Financial Statements

Statements
| 76 | ||||||||
| 77 | ||||||||
| 77 | ||||||||
| 78 | ||||||||
| 79 | ||||||||
| 80 | ||||||||
| 81 | Note 1 |
|||||||
| 81 | Note 2 |
|||||||
| P,E | 82 | Note 3 |
||||||
| P,E | 86 | Note 4 |
||||||
| 90 | Note 5 |
|||||||
| P,E | 90 | Note 6 |
||||||
| 92 | Note 7 |
|||||||
| 93 | Note 8 |
|||||||
| P,E | 93 | Note 9 |
||||||
| P | 97 | Note 10 |
||||||
| 97 | Note 11 |
|||||||
| P | 98 | Note 12 |
||||||
| P,E | 103 | Note 13 |
||||||
| P,E | 104 | Note 14 |
||||||
| P,E | 105 | Note 15 |
||||||
| P,E | 109 | Note 16 |
||||||
| P,E | 111 | Note 17 |
||||||
| 113 | Note 18 |
|||||||
| 113 | Note 19 |
|||||||
| 114 | Note 20 |
|||||||
| 115 | Note 21 |
|||||||
| 116 | Note 22 |
|||||||
| P,E | 116 | Note 23 |
||||||
| P,E |
121 | Note 24 |
Asset Retirement Obligations and Accrued Environmental Costs | |||||
| 123 | Note 25 |
|||||||
| 124 | Note 26 |
|||||||
| 125 | Note 27 |
|||||||
| P | 126 | Note 28 |
||||||
| 127 | Note 29 |
|||||||
| E | 127 | Note 30 |
||||||
| P,E | 129 | Note 31 |
||||||
| P | Includes Accounting Policies |
| E | Includes Accounting Estimates and Judgments |

| Overview | Management’s Discussion & Analysis | Two Year Highlights | Financial Statements |
Other Information |
Management’s
Responsibility
Management’s Responsibility for Financial Reporting
| 72 | Nutrien Annual Report 2019 |
| Overview | Management’s Discussion & Analysis | Two Year Highlights | Financial Statements |
Other Information |
Report of Independent
Registered Public
Accounting Firm
To the Shareholders and Board of Directors of Nutrien Ltd.
| In millions of US dollars except as otherwise noted | Nutrien Annual Report 2019 | 73 |
| Overview | Management’s Discussion & Analysis | Two Year Highlights | Financial Statements |
Other Information |
Report of Independent
Registered Public
Accounting Firm
To the Shareholders and Board of Directors of Nutrien Ltd.
| 74 | Nutrien Annual Report 2019 | In millions of US dollars except as otherwise noted |
| Overview | Management’s Discussion & Analysis | Two Year Highlights | Financial Statements |
Other Information |
| In millions of US dollars except as otherwise noted | Nutrien Annual Report 2019 | 75 |
| Overview | Management’s Discussion & Analysis | Two Year Highlights | Financial Statements |
Other Information |
Consolidated Financial Statements
Consolidated Statements of Earnings
| For the years ended December 31 |
Note | 2019 | 2018 | |||||||||
| Note 2 | ||||||||||||
| Sales | 3 | 20,023 | 19,636 | |||||||||
| Freight, transportation and distribution | 5 | 768 | 864 | |||||||||
| Cost of goods sold | 5 | 13,814 | 13,380 | |||||||||
|
|
|
|
|
|
|
|
||||||
| Gross Margin | 5,441 | 5,392 | ||||||||||
| Selling expenses | 5 | 2,505 | 2,337 | |||||||||
| General and administrative expenses | 5 | 404 | 423 | |||||||||
| Provincial mining and other taxes | 5 | 292 | 250 | |||||||||
| Share-based compensation | 6 | 104 | 116 | |||||||||
| Impairment of assets | 15, 16 | 120 | 1,809 | |||||||||
| Other expenses | 7 | 154 | 43 | |||||||||
|
|
|
|
|
|
|
|
||||||
| Earnings Before Finance Costs and Income Taxes | 1,862 | 414 | ||||||||||
| Finance costs | 8 | 554 | 538 | |||||||||
|
|
|
|
|
|
|
|
||||||
| Earnings (Loss) Before Income Taxes | 1,308 | (124) | ||||||||||
| Income tax expense (recovery) | 9 | 316 | (93) | |||||||||
|
|
|
|
|
|
|
|
||||||
| Net Earnings (Loss) from Continuing Operations | 992 | (31) | ||||||||||
| Net earnings from discontinued operations | 10 | – | 3,604 | |||||||||
|
|
|
|
|
|
|
|
||||||
| Net Earnings | 992 | 3,573 | ||||||||||
|
|
|
|
|
|
|
|
||||||
| Net Earnings (Loss) per share from Continuing Operations | 11 | |||||||||||
| Basic | 1.70 | (0.05) | ||||||||||
| Diluted | 1.70 | (0.05) | ||||||||||
|
|
|
|
|
|
|
|
||||||
| Net Earnings per share from Discontinued Operations | 11 | |||||||||||
| Basic | – | 5.77 | ||||||||||
| Diluted | – | 5.77 | ||||||||||
|
|
|
|
|
|
|
|
||||||
| Net Earnings per share (“EPS”) | 11 | |||||||||||
| Basic | 1.70 | 5.72 | ||||||||||
| Diluted | 1.70 | 5.72 | ||||||||||
|
|
|
|
|
|
|
|
||||||
| Weighted average shares outstanding for basic EPS | 11 | 582,269,000 | 624,900,000 | |||||||||
| Weighted average shares outstanding for diluted EPS | 11 | 583,102,000 | 624,900,000 | |||||||||
|
|
|
|
|
|
|
|
||||||
Consolidated Statements of Comprehensive Income
| For the years ended December 31 (net of related income taxes) |
2019 | 2018 | ||||||
| Net Earnings | 992 | 3,573 | ||||||
| Other comprehensive income (loss) | ||||||||
| Items that will not be reclassified to net earnings: |
||||||||
| Net actuarial gain on defined benefit plans |
7 | 54 | ||||||
| Net fair value loss on investments |
(25) | (99) | ||||||
| Items that have been or may be subsequently reclassified to net earnings: |
||||||||
| Gain (loss) on currency translation of foreign operations |
47 | (249) | ||||||
| Other |
7 | (8) | ||||||
|
|
|
|
|
|
||||
| Other Comprehensive Income (Loss) | 36 | (302) | ||||||
|
|
|
|
|
|
||||
| Comprehensive Income | 1,028 | 3,271 | ||||||
|
|
|
|
|
|
||||
(See Notes to the Consolidated Financial Statements)
| In millions of US dollars except as otherwise noted | Nutrien Annual Report 2019 | 77 |
| Overview | Management’s Discussion & Analysis | Two Year Highlights | Financial Statements |
Other Information |
Consolidated Statements of Cash Flows
| For the years ended December 31 |
Note | 2019 | 2018 | |||||||||
| Note 2 | ||||||||||||
| Operating Activities | ||||||||||||
| Net earnings | 992 | 3,573 | ||||||||||
| Adjustments for: | ||||||||||||
| Depreciation and amortization |
1,799 | 1,592 | ||||||||||
| Share-based compensation |
6 | 104 | 116 | |||||||||
| Impairment of assets |
15, 16 | 120 | 1,809 | |||||||||
| Provision for (recovery of) deferred income tax |
177 | (290) | ||||||||||
| Gain on sale of investments in Sociedad Quimica y Minera de Chile S.A. (“SQM”) and Arab Potash Company (“APC”) |
– | (4,399) | ||||||||||
| Income tax related to the sale of the investment in SQM |
– | 977 | ||||||||||
| Other long-term liabilities and miscellaneous |
(17) | (188) | ||||||||||
|
|
|
|
|
|
|
|
||||||
| Cash from operations before working capital changes | 3,175 | 3,190 | ||||||||||
| Changes in non-cash operating working capital: | ||||||||||||
| Receivables |
(64) | (153) | ||||||||||
| Inventories |
190 | (887) | ||||||||||
| Prepaid expenses and other current assets |
(238) | 561 | ||||||||||
| Payables and accrued charges |
602 | (659) | ||||||||||
|
|
|
|
|
|
|
|
||||||
| Cash Provided by Operating Activities | 3,665 | 2,052 | ||||||||||
|
|
|
|
|
|
|
|
||||||
| Investing Activities | ||||||||||||
| Additions to property, plant and equipment | 15 | (1,728) | (1,405) | |||||||||
| Additions to intangible assets | 16 | (163) | (102) | |||||||||
| Business acquisitions, net of cash acquired | 4 | (911) | (433) | |||||||||
| Proceeds from disposal of discontinued operations, net of tax | 10 | 55 | 5,394 | |||||||||
| Purchase of investments | (198) | (135) | ||||||||||
| Cash acquired in Merger | 4 | – | 466 | |||||||||
| Other | 147 | 102 | ||||||||||
|
|
|
|
|
|
|
|
||||||
| Cash (Used in) Provided by Investing Activities | (2,798) | 3,887 | ||||||||||
|
|
|
|
|
|
|
|
||||||
| Financing Activities | ||||||||||||
| Transaction costs on long-term debt | (29) | (21) | ||||||||||
| Proceeds from (repayment of) short-term debt, net | 19 | 216 | (927) | |||||||||
| Proceeds from long-term debt | 20 | 1,510 | – | |||||||||
| Repayment of long-term debt | 20 | (1,010) | (12) | |||||||||
| Repayment of principal portion of lease liabilities | 20 | (234) | – | |||||||||
| Dividends paid | 25 | (1,022) | (952) | |||||||||
| Repurchase of common shares | 25 | (1,930) | (1,800) | |||||||||
| Issuance of common shares | 25 | 20 | 7 | |||||||||
|
|
|
|
|
|
|
|
||||||
| Cash Used in Financing Activities | (2,479) | (3,705) | ||||||||||
|
|
|
|
|
|
|
|
||||||
| Effect of Exchange Rate Changes on Cash and Cash Equivalents | (31) | (36) | ||||||||||
|
|
|
|
|
|
|
|
||||||
| (Decrease) Increase in Cash and Cash Equivalents | (1,643) | 2,198 | ||||||||||
| Cash and Cash Equivalents – Beginning of Year | 2,314 | 116 | ||||||||||
|
|
|
|
|
|
|
|
||||||
| Cash and Cash Equivalents – End of Year | 671 | 2,314 | ||||||||||
|
|
|
|
|
|
|
|
||||||
| Cash and cash equivalents 1 comprised of: | ||||||||||||
| Cash | 532 | 1,506 | ||||||||||
| Short-term investments | 139 | 808 | ||||||||||
|
|
|
|
|
|
|
|
||||||
| 671 | 2,314 | |||||||||||
|
|
|
|
|
|
|
|
||||||
| Supplemental Cash Flows Information | ||||||||||||
| Interest paid | 505 | 507 | ||||||||||
| Income taxes paid | 29 | 1,155 | ||||||||||
| Total cash outflow for leases | 345 | – | ||||||||||
|
|
|
|
|
|
|
|
||||||
| 1 | Highly liquid investments with a maturity of three months or less from the date of purchase are considered to be cash equivalents. |
(See Notes to the Consolidated Financial Statements)
| 78 | Nutrien Annual Report 2019 | In millions of US dollars except as otherwise noted |
| Overview | Management’s Discussion & Analysis | Two Year Highlights | Financial Statements |
Other Information |
Consolidated Statements of Changes in
Shareholders’ Equity
| Share Capital |
Contributed Surplus |
Accumulated Other Comprehensive (Loss) Income (“AOCI”) |
Retained Earnings |
Total Equity 2 |
||||||||||||||||||||||||||||||||
|
|
Net Fair Value Gain (Loss) on Investments |
Net Actuarial Gain on Defined Benefit Plans 1 |
Loss on Currency Translation of Foreign Operations |
Other | Total AOCI |
|||||||||||||||||||||||||||||||
| Balance – |
1,806 | 230 | 73 | – | (2) | (46) | 25 | 6,242 | 8,303 | |||||||||||||||||||||||||||
| Merger impact (Note 4) |
15,898 | 7 | – | – | – | – | – | (1) | 15,904 | |||||||||||||||||||||||||||
| Net earnings |
– | – | – | – | – | – | – | 3,573 | 3,573 | |||||||||||||||||||||||||||
| Other comprehensive (loss) income |
– | – | (99) | 54 | (249) | (8) | (302) | – | (302) | |||||||||||||||||||||||||||
| Shares repurchased (Note 25) |
(998) | (23) | – | – | – | – | – | (831) | (1,852) | |||||||||||||||||||||||||||
| Dividends declared |
– | – | – | – | – | – | – | (1,273) | (1,273) | |||||||||||||||||||||||||||
| Effect of share-based compensation including issuance of common shares |
34 | 17 | – | – | – | – | – | – | 51 | |||||||||||||||||||||||||||
| Transfer of net actuarial gain on defined benefit plans |
– | – | – | (54) | – | – | (54) | 54 | – | |||||||||||||||||||||||||||
| Transfer of net loss on sale of investment |
– | – | 19 | – | – | – | 19 | (19) | – | |||||||||||||||||||||||||||
| Transfer of net loss on cash flow hedges |
– | – | – | – | – | 21 | 21 | – | 21 | |||||||||||||||||||||||||||
|
|
|
|
|
|
|
|
|
|
|
|
|
|
|
|
|
|
|
|
||||||||||||||||||
| Balance – |
16,740 | 231 | (7) | – | (251) | (33) | (291) | 7,745 | 24,425 | |||||||||||||||||||||||||||
|
|
|
|
|
|
|
|
|
|
|
|
|
|
|
|
|
|
|
|
||||||||||||||||||
| Net earnings |
– | – | – | – | – | – | – | 992 | 992 | |||||||||||||||||||||||||||
| Other comprehensive (loss) income |
– | – | (25) | 7 | 47 | 7 | 36 | – | 36 | |||||||||||||||||||||||||||
| Shares repurchased (Note 25) |
(992) | – | – | – | – | – | – | (886) | (1,878) | |||||||||||||||||||||||||||
| Dividends declared |
– | – | – | – | – | – | – | (754) | (754) | |||||||||||||||||||||||||||
| Effect of share-based compensation including issuance of common shares |
23 | 17 | – | – | – | – | – | – | 40 | |||||||||||||||||||||||||||
| Transfer of net actuarial gain on defined benefit plans |
– | – | – | (7) | – | – | (7) | 7 | – | |||||||||||||||||||||||||||
| Transfer of net loss on sale of investment |
– | – | 3 | – | – | – | 3 | (3) | – | |||||||||||||||||||||||||||
| Transfer of net loss on cash flow hedges |
– | – | – | – | – | 8 | 8 | – | 8 | |||||||||||||||||||||||||||
|
|
|
|
|
|
|
|
|
|
|
|
|
|
|
|
|
|
|
|
||||||||||||||||||
| Balance – |
15,771 | 248 | (29) | – | (204) | (18) | (251) | 7,101 | 22,869 | |||||||||||||||||||||||||||
|
|
|
|
|
|
|
|
|
|
|
|
|
|
|
|
|
|
|
|
||||||||||||||||||
| 1 | Any amounts incurred during a period were closed out to retained earnings at each period-end. Therefore, no balance exists at the beginning or end of period. |
| 2 | All equity transactions were attributable to common shareholders. |
(See Notes to the Consolidated Financial Statements)
| In millions of US dollars except as otherwise noted | Nutrien Annual Report 2019 | 79 |
| Overview | Management’s Discussion & Analysis | Two Year Highlights | Financial Statements |
Other Information |
| As at December 31 |
Note | 2019 | 2018 | |||||||||
| Assets | ||||||||||||
| Current assets | ||||||||||||
| Cash and cash equivalents |
671 | 2,314 | ||||||||||
| Receivables |
13 | 3,542 | 3,342 | |||||||||
| Inventories |
14 | 4,975 | 4,917 | |||||||||
| Prepaid expenses and other current assets |
1,477 | 1,089 | ||||||||||
|
|
|
|
|
|
|
|
||||||
| 10,665 | 11,662 | |||||||||||
| Non-current assets | ||||||||||||
| Property, plant and equipment |
15 | 20,335 | 18,796 | |||||||||
| Goodwill |
16 | 11,986 | 11,431 | |||||||||
| Other intangible assets |
16 | 2,428 | 2,210 | |||||||||
| Investments |
17 | 821 | 878 | |||||||||
| Other assets |
18 | 564 | 525 | |||||||||
|
|
|
|
|
|
|
|
||||||
| Total Assets | 46,799 | 45,502 | ||||||||||
|
|
|
|
|
|
|
|
||||||
| Liabilities | ||||||||||||
| Current liabilities | ||||||||||||
| Short-term debt |
19 | 976 | 629 | |||||||||
| Current portion of long-term debt |
20 | 502 | 995 | |||||||||
| Current portion of lease liabilities |
21 | 214 | 8 | |||||||||
| Payables and accrued charges |
22 | 7,437 | 6,703 | |||||||||
|
|
|
|
|
|
|
|
||||||
| 9,129 | 8,335 | |||||||||||
| Non-current liabilities | ||||||||||||
| Long-term debt |
20 | 8,553 | 7,579 | |||||||||
| Lease liabilities |
21 | 859 | 12 | |||||||||
| Deferred income tax liabilities |
9 | 3,145 | 2,907 | |||||||||
| Pension and other post-retirement benefit liabilities |
23 | 433 | 395 | |||||||||
| Asset retirement obligations and accrued environmental costs |
24 | 1,650 | 1,673 | |||||||||
| Other non-current liabilities |
161 | 176 | ||||||||||
|
|
|
|
|
|
|
|
||||||
| Total Liabilities | 23,930 | 21,077 | ||||||||||
|
|
|
|
|
|
|
|
||||||
| Shareholders’ Equity | ||||||||||||
| Share capital |
25 | 15,771 | 16,740 | |||||||||
| Contributed surplus |
248 | 231 | ||||||||||
| Accumulated other comprehensive loss |
(251) | (291) | ||||||||||
| Retained earnings |
7,101 | 7,745 | ||||||||||
|
|
|
|
|
|
|
|
||||||
| Total Shareholders’ Equity | 22,869 | 24,425 | ||||||||||
|
|
|
|
|
|
|
|
||||||
| Total Liabilities and Shareholders’ Equity | 46,799 | 45,502 | ||||||||||
|
|
|
|
|
|
|
|
||||||
| (See Notes to the Consolidated Financial Statements) | ||||||||||||
| Approved by the Board of Directors,
|
||||||||||||

|

|
|||||
| Director | Director |
| 80 | Nutrien Annual Report 2019 | In millions of US dollars except as otherwise noted |
| Overview | Management’s Discussion & Analysis | Two Year Highlights | Financial Statements |
Other Information |
Note 1 Description of Business
Nutrien Ltd. (collectively with its subsidiaries, “Nutrien”, “we”, “us”, “our” or “the Company”) is the world’s largest provider of crop inputs and services. Nutrien plays a critical role in helping growers around the globe increase food production in a sustainable manner.
| In millions of US dollars except as otherwise noted | Nutrien Annual Report 2019 | 81 |
| Overview | Management’s Discussion & Analysis | Two Year Highlights | Financial Statements |
Other Information |
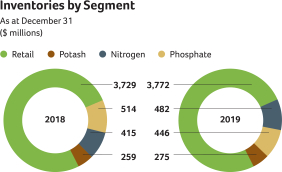
The Company has four reportable operating segments: Retail, Potash, Nitrogen and Phosphate. The Retail segment distributes crop nutrients, crop protection products, seed and merchandise, and provides services directly to growers through a network of farm centers in North and South America and Australia. The Potash, Nitrogen and Phosphate segments are differentiated by the chemical nutrient contained in the products that each produces.
Accounting Policies, Estimates and Judgments
Operating Segments
Revenue
We recognize revenue when we transfer control over a good or service to a customer.
| Transfer of Control for |
Retail |
Potash, Nitrogen and Phosphate | ||
| Sale of Goods |
At the point in time when the product is
• purchased at our Retail farm center or
• delivered and accepted by customers at their premises. |
At the point in time when the product is
• loaded for shipping or
• delivered to the customer. | ||
|
|
|
| ||
| Services |
Over time as the promised service is rendered. | Over time as the promised service is rendered. | ||
|
|
|
|
For transactions in which we act as an agent rather than the principal, revenue is recognized net of any commissions earned. The relating commissions are recognized as the sales occurred or as unconditional contracts are signed.
Retail
Retail revenue is generated primarily from sales of the following:
|
|
| |
| Crop nutrients |
Dry and liquid macronutrient products including potash, nitrogen and phosphate, proprietary liquid micronutrient products and nutrient application services. | |
|
|
| |
| Crop protection products |
Various third-party supplier and proprietary products designed to maintain crop quality and manage plant diseases, weeds, and other pests. | |
|
|
| |
| Seed |
Various third-party supplier seed brands and proprietary seed product lines. | |
|
|
| |
| Merchandise |
Fencing, feed supplements, livestock-related animal health products, storage and irrigation equipment, and other products. | |
|
|
| |
| Services and other revenues |
Product application, soil and leaf testing, crop scouting and precision agriculture services, water services, financial services and livestock marketing. | |
|
|
|
Provisions for returns, trade discounts and rebates are deducted from sales revenue.
| 82 | Nutrien Annual Report 2019 | In millions of US dollars except as otherwise noted |
| Overview | Management’s Discussion & Analysis | Two Year Highlights | Financial Statements |
Other Information |
Note 3 Segment Information Continued
Potash, Nitrogen and Phosphate
|
|
Potash |
Nitrogen |
Phosphate | |||
| Products |
• North American – primarily granular
• Offshore (international) – primarily granular and standard |
• Ammonia, urea, urea ammonium nitrate, industrial grade ammonium nitrate and ammonium sulfate |
• Solid fertilizer, liquid fertilizer, industrial products and feed products | |||
|
|
|
|
| |||
| Sales prices impacted by |
• North American prices referenced at delivered prices (including transportation and distribution costs)
• International prices referenced at the mine site (excluding transportation and distribution costs) |
• Global energy costs and supply |
• Global prices and supplies of ammonia and sulfur | |||
|
|
|
|
|
Other
| In millions of US dollars except as otherwise noted | Nutrien Annual Report 2019 | 83 |
| Overview | Management’s Discussion & Analysis | Two Year Highlights | Financial Statements |
Other Information |
Note 3 Segment Information Continued
Supporting Information
Financial information on each of these segments is summarized in the following tables:
| 2019 |
Retail | Potash | Nitrogen | Phosphate | Corporate and Others |
Eliminations | Consolidated | |||||||||||||||||||||||
| Sales | – third party |
13,183 | 2,702 | 2,608 | 1,397 | 133 | – | 20,023 | ||||||||||||||||||||||
| – intersegment |
38 | 207 | 612 | 203 | – | (1,060) | – | |||||||||||||||||||||||
|
|
|
|
|
|
|
|
|
|
|
|
|
|
|
|
||||||||||||||||
| Sales | – total |
13,221 | 2,909 | 3,220 | 1,600 | 133 | (1,060) | 20,023 | ||||||||||||||||||||||
| Freight, transportation and distribution | – | 305 | 372 | 232 | – | (141) | 768 | |||||||||||||||||||||||
|
|
|
|
|
|
|
|
|
|
|
|
|
|
|
|
||||||||||||||||
| Net sales | 13,221 | 2,604 | 2,848 | 1,368 | 133 | (919) | 19,255 | |||||||||||||||||||||||
| Cost of goods sold | 9,981 | 1,103 | 2,148 | 1,373 | 133 | (924) | 13,814 | |||||||||||||||||||||||
|
|
|
|
|
|
|
|
|
|
|
|
|
|
|
|
||||||||||||||||
| Gross margin | 3,240 | 1,501 | 700 | (5) | – | 5 | 5,441 | |||||||||||||||||||||||
| Selling expenses | 2,484 | 9 | 25 | 5 | (18) | – | 2,505 | |||||||||||||||||||||||
| General and administrative expenses | 112 | 6 | 15 | 7 | 264 | – | 404 | |||||||||||||||||||||||
| Provincial mining and other taxes | – | 287 | 2 | 1 | 2 | – | 292 | |||||||||||||||||||||||
| Share-based compensation expense | – | – | – | – | 104 | – | 104 | |||||||||||||||||||||||
| Impairment of assets (Note 15 and 16) | – | – | – | – | 120 | – | 120 | |||||||||||||||||||||||
| Other expenses (income) | 8 | (4 | ) | (46) | 25 | 171 | – | 154 | ||||||||||||||||||||||
|
|
|
|
|
|
|
|
|
|
|
|
|
|
|
|
||||||||||||||||
| Earnings (loss) before finance costs |
636 | 1,203 | 704 | (43) | (643) | 5 | 1,862 | |||||||||||||||||||||||
| Depreciation and amortization | 595 | 390 | 535 | 237 | 42 | – | 1,799 | |||||||||||||||||||||||
|
|
|
|
|
|
|
|
|
|
|
|
|
|
|
|
||||||||||||||||
| EBITDA | 1,231 | 1,593 | 1,239 | 194 | (601) | 5 | 3,661 | |||||||||||||||||||||||
|
|
|
|
|
|
|
|
|
|
|
|
|
|
|
|
||||||||||||||||
| Assets 1 | 19,990 | 11,696 | 10,991 | 2,198 | 2,129 | (205) | 46,799 | |||||||||||||||||||||||
|
|
|
|
|
|
|
|
|
|
|
|
|
|
|
|
||||||||||||||||
| 1 | Included in the Retail and Nitrogen segments are $126 and $482, respectively, relating to equity-accounted investees as described in Note 17. |
| 2018 |
Retail | Potash | Nitrogen 1 | Phosphate 1 | Corporate and Others |
Eliminations | Consolidated | |||||||||||||||||||||||
| Sales | – third party |
12,470 | 2,796 | 2,712 | 1,508 | 150 | – | 19,636 | ||||||||||||||||||||||
| – intersegment |
50 | 220 | 626 | 268 | – | (1,164) | – | |||||||||||||||||||||||
|
|
|
|
|
|
|
|
|
|
|
|
|
|
|
|
||||||||||||||||
| Sales | – total |
12,520 | 3,016 | 3,338 | 1,776 | 150 | (1,164) | 19,636 | ||||||||||||||||||||||
| Freight, transportation and distribution | – | 349 | 373 | 215 | – | (73) | 864 | |||||||||||||||||||||||
|
|
|
|
|
|
|
|
|
|
|
|
|
|
|
|
||||||||||||||||
| Net sales | 12,520 | 2,667 | 2,965 | 1,561 | 150 | (1,091) | 18,772 | |||||||||||||||||||||||
| Cost of goods sold | 9,485 | 1,183 | 2,145 | 1,473 | 150 | (1,056) | 13,380 | |||||||||||||||||||||||
|
|
|
|
|
|
|
|
|
|
|
|
|
|
|
|
||||||||||||||||
| Gross margin | 3,035 | 1,484 | 820 | 88 | – | (35) | 5,392 | |||||||||||||||||||||||
| Selling expenses | 2,303 | 14 | 32 | 10 | (22) | – | 2,337 | |||||||||||||||||||||||
| General and administrative expenses | 100 | 10 | 20 | 9 | 284 | – | 423 | |||||||||||||||||||||||
| Provincial mining and other taxes | – | 244 | 3 | 1 | 2 | – | 250 | |||||||||||||||||||||||
| Share-based compensation expense | – | – | – | – | 116 | – | 116 | |||||||||||||||||||||||
| Impairment of assets (Note 15) | – | 1,809 | – | – | – | – | 1,809 | |||||||||||||||||||||||
| Other (income) expenses | (75 | ) | 14 | (8) | 6 | 106 | – | 43 | ||||||||||||||||||||||
|
|
|
|
|
|
|
|
|
|
|
|
|
|
|
|
||||||||||||||||
| Earnings (loss) before finance costs |
707 | (607 | ) | 773 | 62 | (486) | (35) | 414 | ||||||||||||||||||||||
| Depreciation and amortization | 499 | 404 | 442 | 193 | 54 | – | 1,592 | |||||||||||||||||||||||
|
|
|
|
|
|
|
|
|
|
|
|
|
|
|
|
||||||||||||||||
| EBITDA | 1,206 | (203 | ) | 1,215 | 255 | (432) | (35) | 2,006 | ||||||||||||||||||||||
|
|
|
|
|
|
|
|
|
|
|
|
|
|
|
|
||||||||||||||||
| Assets 2 | 17,964 | 11,710 | 10,386 | 2,406 | 3,678 | (642) | 45,502 | |||||||||||||||||||||||
|
|
|
|
|
|
|
|
|
|
|
|
|
|
|
|
||||||||||||||||
| 1 | Comparative figures have been restated to reflect the change in the sulfate product grouping from Phosphate and Sulfate to Nitrogen. |
| 2 | Included in the Retail and Nitrogen segments are $208 and $428, respectively, relating to equity-accounted investees as described in Note 17. |
| 84 | Nutrien Annual Report 2019 | In millions of US dollars except as otherwise noted |
| Overview | Management’s Discussion & Analysis | Two Year Highlights | Financial Statements |
Other Information |
Note 3 Segment Information Continued
Financial information by geographic area is summarized in the following tables:
| Sales – Third Party |
2019 | 2018 | ||||||
| United States | 12,522 | 11,891 | ||||||
| Canada | 2,504 | 2,790 | ||||||
| Australia | 1,955 | 1,681 | ||||||
| Canpotex 1 | 1,625 | 1,657 | ||||||
| Trinidad | 113 | 190 | ||||||
| Argentina | 388 | 387 | ||||||
| Europe | 210 | 312 | ||||||
| Other | 706 | 728 | ||||||
|
|
|
|
|
|
||||
| 20,023 | 19,636 | |||||||
|
|
|
|
|
|
||||
| 1 | As described in Note 1, Canpotex executed offshore marketing, sales and distribution functions for certain of our products. Canpotex’s 2019 sales volumes were made to: Latin America 31 percent, China 22 percent, India 10 percent, Other Asian markets 27 percent, Other markets 10 percent (2018 – Latin America 33 percent, China 18 percent, India 10 percent, Other Asian markets 31 percent, Other markets 8 percent) (Note 29). |
| Non-Current Assets 1 |
2019 | 2018 | ||||||
| United States | 15,685 | 14,501 | ||||||
| Canada | 17,503 | 17,100 | ||||||
| Australia | 1,172 | 607 | ||||||
| Trinidad | 691 | 570 | ||||||
| Other | 639 | 621 | ||||||
|
|
|
|
|
|
||||
| 35,690 | 33,399 | |||||||
|
|
|
|
|
|
||||
| 1 | Excludes financial instruments (other than equity-accounted investees), deferred tax assets and post-employment benefit assets. |
We disaggregated revenue from contracts with customers by product line or geographic location for each reportable segment to show how the nature, amount, timing and uncertainty of revenue and cash flows are affected by economic factors. Sales reported under our Corporate and Others segment primarily relates to our non-core Canadian business.
|
|
2019 | 2018 | ||||||
| Retail sales by product line | ||||||||
| Crop nutrients |
4,989 | 4,577 | ||||||
| Crop protection products |
4,983 | 4,862 | ||||||
| Seed |
1,712 | 1,687 | ||||||
| Merchandise |
598 | 584 | ||||||
| Services and other |
939 | 810 | ||||||
|
|
|
|
|
|
||||
| 13,221 | 12,520 | |||||||
|
|
|
|
|
|
||||
| In millions of US dollars except as otherwise noted | Nutrien Annual Report 2019 | 85 |
| Overview | Management’s Discussion & Analysis | Two Year Highlights | Financial Statements |
Other Information |
Note 3 Segment Information Continued
|
|
2019 | 2018 | ||||||
| Potash sales by geography | ||||||||
| Manufactured product |
||||||||
| North America |
1,283 | 1,356 | ||||||
| Offshore 1 |
1,625 | 1,657 | ||||||
| Other potash and purchased products |
1 | 3 | ||||||
|
|
|
|
|
|
||||
| 2,909 | 3,016 | |||||||
|
|
|
|
|
|
||||
| Nitrogen sales by product line 2 | ||||||||
| Manufactured product |
||||||||
| Ammonia |
884 | 1,061 | ||||||
| Urea |
1,019 | 979 | ||||||
| Solutions, nitrates and sulfates |
812 | 825 | ||||||
| Other nitrogen and purchased products |
505 | 473 | ||||||
|
|
|
|
|
|
||||
| 3,220 | 3,338 | |||||||
|
|
|
|
|
|
||||
| Phosphate sales by product line 2 | ||||||||
| Manufactured product |
||||||||
| Fertilizer |
944 | 1,141 | ||||||
| Industrial and feed |
475 | 469 | ||||||
| Other phosphate and purchased products |
181 | 166 | ||||||
|
|
|
|
|
|
||||
| 1,600 | 1,776 | |||||||
|
|
|
|
|
|
||||
| 1 | Relates to Canpotex. |
| 2 | Comparative figures have been restated to reflect the change in the sulfate product grouping from Phosphate and Sulfate to Nitrogen. |
The Company’s business combinations include the merger between Potash Corporation of Saskatchewan Inc. (“PotashCorp”) and Agrium Inc. (“Agrium”) (the “Merger”), the acquisition of Retail businesses, including Ruralco Holdings Limited (“Ruralco”), and various digital agriculture, proprietary products and agricultural services.
Accounting Policies, Estimates and Judgments
| 86 | Nutrien Annual Report 2019 | In millions of US dollars except as otherwise noted |
| Overview | Management’s Discussion & Analysis | Two Year Highlights | Financial Statements |
Other Information |
Note 4 Business Combinations Continued
| Asset |
Ruralco |
Merger |
Other |
Valuation Technique and Judgments Applied | ||||
| Property, plant and equipment |
X | X | X | Market approach for land and certain types of personal property: sales comparison that measures the value of an asset through an analysis of sales and offerings of comparable assets.
Replacement costs for all other depreciable property, plant and equipment: measures the value of an asset by estimating the costs to acquire or construct comparable assets and adjusts for age and condition of the asset. | ||||
|
|
|
|
|
| ||||
| Other intangible assets |
X | X | X | Income approach – multi-period excess earnings method: measures the value of an asset based on the present value of the incremental after-tax cash flows attributable to the asset after deducting contributory asset charges (“CACs”). Allocation of CACs is a matter of judgment and based on the nature of the acquired businesses’ operations and historical trends.
We considered several factors in determining the fair value of customer relationships, such as customers’ relationships with the acquired company and its employees, the segmentation of customers, historical customer attrition rates and revenue growth. Segmenting customers is a matter of judgment and includes factors such as the size of the customer and customer behavior patterns. | ||||
|
|
|
|
|
| ||||
| Long-term debt |
X | Comparable debt instruments with similar maturities, adjusted where necessary to the acquired company’s credit spread, based on information published by financial institutions. | ||||||
|
|
|
|
|
| ||||
| Asset retirement obligations and accrued environmental costs |
X | Decision-tree approach of future costs and a risk premium to capture the compensation sought by risk-averse market participants for bearing the uncertainty inherent in the cash flows of the liability. We expect asset retirement obligations for phosphate sites to be paid over the next 68 years, while we expect asset retirement obligations for potash and nitrogen sites to be paid subsequently.
We expect accrued environmental costs – discounted using a credit adjusted risk-free rate – to be paid over the next 30 years. | ||||||
|
|
|
|
|
|
| In millions of US dollars except as otherwise noted | Nutrien Annual Report 2019 | 87 |
| Overview | Management’s Discussion & Analysis | Two Year Highlights | Financial Statements |
Other Information |
Note 4 Business Combinations Continued
Supporting Information
|
|
Ruralco |
Merger |
Other Acquisitions | |||
| Acquisition date |
September 30, 2019 | January 1, 2018 | Various | |||
|
|
|
|
| |||
| Purchase price, net of cash and cash equivalents acquired |
$330
On the acquisition date, we acquired 100% of the Ruralco stock that was issued and outstanding.
Also included in the total consideration, net of cash and cash equivalents acquired, is the impact of $18 relating to a foreign exchange hedge loss which we designated a cash flow hedge.
Transaction costs are recorded in acquisition and integration related costs in other expenses. |
$16,010
We determined the purchase price based on the number of Agrium shares outstanding
On the acquisition date, shareholders of PotashCorp received 0.400 common shares of Nutrien for each PotashCorp share held, and shareholders of Agrium received 2.230 common shares of Nutrien for each Agrium share held.
Merger and related costs are included in other expenses. |
2019 – $581, net of $100 previously held equity-accounted interest in Agrichem. We acquired the remaining 20 percent interest in Agrichem in the first nine months of 2019, making Agrichem a wholly owned consolidated subsidiary of the Company.
(2018 – $433) | |||
|
|
|
|
| |||
| Goodwill and expected benefits of the acquisition |
$202 |
$11,185, none of which is deductible for income tax purposes. |
$341 (2018 – $197) | |||
|
|
|
| ||||
| The expected benefits of the acquisitions resulting in goodwill include:
• synergies from expected reduction in operating costs;
• wider distribution channel for selling products of acquired businesses;
• a larger assembled workforce;
• potential increase in customer base;
• enhanced ability to innovate;
• production and expense optimization, including procurement savings (specific to Merger); and
• closer proximity of nitrogen operations to sources of low-cost natural gas (specific to Merger). | ||||||
|
|
|
|
| |||
| Description |
An agriservices business in Australia with approximately 250 operating locations. |
A major global producer and distributor of agricultural products, services and solutions. |
68 Retail locations in North and South America and Australia, including companies operating in the proprietary products business, such as Actagro, LLC, a developer, manufacturer and marketer of environmentally sustainable soil and plant health products and technologies (2018 – 53 Retail locations in North America and Australia and companies operating within the digital agriculture, proprietary products and agricultural services businesses). | |||
|
|
|
|
| |||
| 88 | Nutrien Annual Report 2019 | In millions of US dollars except as otherwise noted |
| Overview | Management’s Discussion & Analysis | Two Year Highlights | Financial Statements |
Other Information |
Note 4 Business Combinations Continued
We allocated the following values to the acquired assets and assumed liabilities based upon fair values at their respective acquisition date:
| 2019 | 2018 | |||||||||||||||||||||||
| Ruralco (Estimate) | ||||||||||||||||||||||||
|
|
Preliminary 1 | Adjustments 2 | Revised Fair Value |
Other Acquisitions 3 |
Merger (Final) |
Other Acquisitions 3 |
||||||||||||||||||
| Cash and cash equivalents |
– | – | – | – | 466 | – | ||||||||||||||||||
| Receivables |
250 | 39 | 289 | 4 | 68 | 2,600 | 4 | 20 | ||||||||||||||||
| Inventories |
116 | 1 | 117 | 145 | 3,303 | 146 | ||||||||||||||||||
| Prepaid expenses and other current assets |
11 | (3 | ) | 8 | 38 | 1,124 | 2 | |||||||||||||||||
| Property, plant and equipment |
70 | 66 | 136 | 115 | 7,459 | 107 | ||||||||||||||||||
| Goodwill |
272 | (70 | ) | 202 | 341 | 11,185 | 197 | |||||||||||||||||
| Other intangible assets |
55 | 110 | 165 | 179 | 2,348 | 8 | ||||||||||||||||||
| Investments |
15 | – | 15 | – | 528 | 11 | ||||||||||||||||||
| Other assets |
16 | – | 16 | 5 | 2 | 293 | 5 | 3 | ||||||||||||||||
|
|
|
|
|
|
|
|
|
|
|
|
|
|
||||||||||||
| Total assets |
805 | 143 | 948 | 888 | 29,306 | 494 | ||||||||||||||||||
|
|
|
|
|
|
|
|
|
|
|
|
|
|
||||||||||||
| Short-term debt |
112 | – | 112 | 25 | 867 | – | ||||||||||||||||||
| Payables and accrued charges |
299 | 46 | 345 | 156 | 5,239 | 52 | ||||||||||||||||||
| Long-term debt, including current portion |
– | – | – | 11 | 4,941 | – | ||||||||||||||||||
| Lease liabilities, including current portion |
44 | 66 | 110 | 1 | – | – | ||||||||||||||||||
| Deferred income tax liabilities |
7 | 31 | 38 | 7 | 934 | – | ||||||||||||||||||
| Pension and other post-retirement benefit liabilities |
– | – | – | – | 142 | – | ||||||||||||||||||
| Asset retirement obligations and accrued environmental costs |
– | – | – | – | 1,094 | – | ||||||||||||||||||
| Other non-current liabilities |
13 | – | 13 | 7 | 79 | 9 | ||||||||||||||||||
|
|
|
|
|
|
|
|
|
|
|
|
|
|
||||||||||||
| Total liabilities |
475 | 143 | 618 | 207 | 13,296 | 61 | ||||||||||||||||||
|
|
|
|
|
|
|
|
|
|
|
|
|
|
||||||||||||
| Total consideration |
330 | – | 330 | 681 | 16,010 | 433 | ||||||||||||||||||
| Previously held equity-accounted interest in Agrichem |
– | – | – | 100 | – | – | ||||||||||||||||||
|
|
|
|
|
|
|
|
|
|
|
|
|
|
||||||||||||
| Total consideration, net of cash and cash equivalents acquired |
330 | – | 330 | 581 | 16,010 | 433 | ||||||||||||||||||
|
|
|
|
|
|
|
|
|
|
|
|
|
|
||||||||||||
| 1 | Preliminary value as previously reported in our third quarter 2019 unaudited financial statements. The purchase price allocation is not final as we continue to obtain and verify information required to determine the fair value of certain assets and liabilities and the amount of deferred income taxes arising on their recognition. We estimated the preliminary purchase price allocation as of the date of the acquisition based on information that was available and continue to adjust those estimates as new information that existed at the date of acquisition becomes available. We expect to finalize the amounts recognized when we obtain the information necessary to complete the analysis, and in any event, not later than September 30, 2020. |
| 2 | We recorded adjustments to the preliminary fair value to reflect facts and circumstances in existence as of the date of acquisition. These adjustments primarily related to changes in the preliminary valuation assumptions, including refinement of intangible assets. All measurement period adjustments were offset against goodwill. |
| 3 | This represents preliminary fair values. For certain acquisitions, we finalized the purchase price with no material change to the fair values disclosed in prior periods. |
| 4 | Includes receivables from customers with gross contractual amounts of $247, of which $5 are considered to be uncollectible relating to Ruralco (2018 – $2,247 and $80 respectively relating to the Merger). |
| 5 | Includes deferred income tax assets of $14 relating to Ruralco (2018 – $158 relating to the Merger). |
Financial Information Related to the Acquired Operations
| 2019 Proforma 1 | Ruralco | Other Acquisitions | ||||||
| Sales |
1,090 | 480 | ||||||
| EBITDA |
50 | 40 | ||||||
|
|
|
|
|
|
||||
| 1 Estimated annual sales and EBITDA if acquisitions occurred at the beginning of the year. Net earnings before income taxes is not available. |
| |||||||
| In millions of US dollars except as otherwise noted | Nutrien Annual Report 2019 | 89 |
| Overview | Management’s Discussion & Analysis | Two Year Highlights | Financial Statements |
Other Information |
Note 4 Business Combinations Continued
| 2019 Actuals | 2018 Actuals | |||||||||||||||
| From date of acquisition |
Ruralco | Other Acquisitions | Merger | Other Acquisitions | ||||||||||||
| Sales | 249 | 312 | 14,551 | 213 | ||||||||||||
| Net earnings (loss) before income taxes | (2 | ) | (1 | ) | 546 | 10 | ||||||||||
|
|
|
|
|
|
|
|
|
|
||||||||
|
|
2019 | 2018 | ||||||
| Purchased and produced raw materials and product for resale 1 | 11,335 | 10,881 | ||||||
| Depreciation and amortization | 1,799 | 1,592 | ||||||
| Employee costs 2 | 2,268 | 1,949 | ||||||
| Freight | 845 | 934 | ||||||
| Impairment of assets (Note 15 and 16) | 120 | 1,809 | ||||||
| Provincial mining and other taxes 3 | 292 | 250 | ||||||
| Offsite warehouse costs 4 | 51 | 68 | ||||||
| Railcar and vessel costs 4 | 5 | 128 | ||||||
| Merger and related costs | 82 | 170 | ||||||
| Acquisition and integration related costs | 16 | – | ||||||
| Contract services | 504 | 469 | ||||||
| Lease expense 5 | 66 | 148 | ||||||
| Fleet fuel, repairs and maintenance | 202 | 183 | ||||||
| Other | 576 | 641 | ||||||
|
|
|
|
|
|
||||
| Total cost of goods sold and expenses | 18,161 | 19,222 | ||||||
|
|
|
|
|
|
||||
| 1 | Significant expenses include: supplies, energy, fuel, purchases of raw material (natural gas – feedstock, sulfur, ammonia and reagents) and product for resale (crop nutrients and protection products, and seed). |
| 2 | Includes employee benefits and share–based compensation. In 2018, employee costs also include a $157 gain on curtailment of defined benefit pension and other post-retirement benefit plans (“Defined Benefit Plans Curtailment Gain”) as described in Note 23. |
| 3 | Includes $190 and $102 (2018 – $160 and $90) relating to Saskatchewan potash production tax and Saskatchewan resource surcharge and other, respectively, as required under Saskatchewan provincial legislation. |
| 4 | Includes expenses relating to operating leases in 2018. |
| 5 | In 2019, includes lease expense relating to short-term leases, leases of low-value and variable lease payments. |
Note 6 Share-Based Compensation
We have share-based compensation plans (including those assumed from PotashCorp and Agrium) for eligible employees and directors as part of their remuneration package, including Stock Options, Performance Share Units (“PSUs”), Restricted Share Units (“RSUs”) and Deferred Share Units (“DSUs”).
Accounting Policies, Estimates and Judgments
| 90 | Nutrien Annual Report 2019 | In millions of US dollars except as otherwise noted |
| Overview | Management’s Discussion & Analysis | Two Year Highlights | Financial Statements |
Other Information |
Note 6 Share-Based Compensation Continued
Supporting Information
The following summarizes the Nutrien share-based compensation plans, under which we have awards available to be granted, and the assumed legacy plans of PotashCorp and Agrium, under which no awards will be granted.
| Plan Features |
Stock Options |
PSUs |
RSUs |
DSUs |
SARs/TSARs 4 | |||||
| Eligibility |
Officers and eligible employees |
Officers and eligible employees |
Eligible employees |
Non-executive directors |
Awards no longer granted; legacy awards only | |||||
|
|
|
|
|
|
| |||||
| Granted |
Annually |
Annually |
Annually |
At the discretion of the Board of Directors |
Awards no longer granted; legacy awards only | |||||
|
|
|
|
|
|
| |||||
| Vesting Period |
25% per year over four years 1 |
On third anniversary of grant date based on total shareholder return over a three-year performance cycle, compared to average total shareholder return of a peer group of companies over the same period |
On third anniversary of grant date and are not subject to performance conditions |
Fully vest upon grant |
25% per year over four years | |||||
|
|
|
|
|
|
| |||||
| Maximum Term |
10 years |
Not applicable |
Not applicable |
Not applicable |
10 years | |||||
|
|
|
|
|
|
| |||||
| Settlement |
Shares |
Cash / Shares 2 |
Cash |
Cash 3 |
Cash | |||||
|
|
|
|
|
|
|
| 1 | Under the assumed legacy PotashCorp long-term incentive and performance option plan, stock options vest on the third anniversary of the grant date. |
| 2 | Under the assumed legacy PotashCorp long-term incentive plan, PSUs will be settled in shares for grantees who are subject to our share ownership guidelines and in cash for all other grantees. |
| 3 | Based on the common share price at the time of the director’s departure from the Board of Directors. |
| 4 | Under the assumed legacy Agrium stock appreciation rights (“SARs”) plan, holders of tandem stock appreciation rights (“TSARs”) have the ability to choose between (a) receiving in cash the price of our shares on the date of exercise in excess of the exercise price of the right or (b) receiving common shares by paying the exercise price of the right. Our past experience and future expectation is that substantially all TSAR holders will elect to choose the first option. |
The weighted average fair value of stock options granted was estimated as of the date of the grant using the Black-Scholes-Merton option-pricing model. The weighted average grant date fair value of stock options per unit granted in 2019 was $11.27 (2018 – $9.71). The weighted average assumptions by year of grant that impacted current year results are as follows:
| Year of Grant | ||||||||||
| Assumptions |
Based On |
2019 | 2018 | |||||||
| Exercise price per option | Quoted market closing price 1 |
53.54 | 44.50 | |||||||
| Expected annual dividend yield (%) | Annualized dividend rate 2 |
3.22 | 3.58 | |||||||
| Expected volatility (%) | Historical volatility 3 |
27 | 29 | |||||||
| Risk-free interest rate (%) | Zero-coupon government issues 4 |
2.55 | 2.79 | |||||||
| Average expected life of options (years) | Historical experience |
7.5 | 7.5 | |||||||
|
|
|
|
|
|
|
|||||
| 1 | Of common shares on the last trading day immediately preceding the date of the grant. |
| 2 | As of the date of grant. |
| 3 | Of the Company’s share over a period commensurate with the expected life of the option. |
| 4 | Implied yield available on equivalent remaining term at the time of the grant. |
| In millions of US dollars except as otherwise noted | Nutrien Annual Report 2019 | 91 |
| Overview | Management’s Discussion & Analysis | Two Year Highlights | Financial Statements |
Other Information |
Note 6 Share-Based Compensation Continued
A summary of the status of our stock option plans as at December 31, 2019 and 2018 and changes during the years ending on those dates is as follows:
| Number of Shares Subject to Option | Weighted Average Exercise Price | |||||||||||||||
|
|
2019 | 2018 | 2019 | 2018 | ||||||||||||
| Balance – beginning of year | 9,044,237 | 9,947,583 | 58.41 | 69.54 | ||||||||||||
| Granted | 1,376,533 | 1,875,162 | 53.54 | 44.50 | ||||||||||||
| Exercised | (451,574 | ) | (647,331 | ) | 42.73 | 42.86 | ||||||||||
| Forfeited or cancelled | (502,016 | ) | (1,793,077 | ) | 86.53 | 82.84 | ||||||||||
| Expired | (275,700 | ) | (338,100 | ) | 76.59 | 154.94 | ||||||||||
|
|
|
|
|
|
||||||||||||
| Outstanding – end of year | 9,191,480 | 9,044,237 | 56.88 | 58.41 | ||||||||||||
|
|
|
|
|
|
|
|
|
|
||||||||
The aggregate grant-date fair value of all stock options granted during 2019 was $16. The average share price during 2019 was $50.91 per share.
The following table summarizes information about our stock options outstanding as at December 31, 2019 with expiry dates ranging from May 2020 to February 2029:
| Options Outstanding | Options Exercisable | |||||||||||||||||||
| Range of Exercise Prices |
Number | Weighted Average Remaining Life in Years |
Weighted Average Exercise Price |
Number | Weighted Average Exercise Price |
|||||||||||||||
| $37.84 to $40.23 | 1,345,235 | 6 | 38.21 | 1,170,022 | 38.26 | |||||||||||||||
| $40.24 to $45.40 | 1,934,844 | 7 | 43.61 | 1,067,346 | 42.88 | |||||||||||||||
| $45.41 to $49.51 | 1,371,872 | 7 | 46.46 | 788,169 | 46.38 | |||||||||||||||
| $49.52 to $52.75 | 912,183 | 5 | 51.96 | 912,183 | 51.96 | |||||||||||||||
| $52.76 to $77.62 | 1,814,520 | 8 | 58.58 | 574,542 | 69.47 | |||||||||||||||
| $77.63 to $130.78 | 1,812,826 | 3 | 93.56 | 1,812,826 | 93.56 | |||||||||||||||
|
|
|
|
|
|
|
|
|
|
|
|
||||||||||
| 9,191,480 | 6 | 56.88 | 6,325,088 | 60.71 | ||||||||||||||||
|
|
|
|
|
|
|
|
|
|
|
|
||||||||||
Information for all employee and Director share-based compensation plans is summarized below:
| Compensation Expense (Recovery) | ||||||||||||||||
|
|
Units Granted in 2019 |
Units Outstanding as at December 31, 2019 |
2019 | 2018 | ||||||||||||
| Stock Options | 1,376,533 | 9,191,480 | 19 | 23 | ||||||||||||
| PSUs | 719,330 | 1,834,984 | 65 | 83 | ||||||||||||
| RSUs | 425,082 | 986,756 | 18 | 14 | ||||||||||||
| DSUs | 50,958 | 434,093 | 2 | – | ||||||||||||
| SARs | – | 1,750,169 | – | (4 | ) | |||||||||||
|
|
|
|
|
|
|
|
|
|
||||||||
| 104 | 116 | |||||||||||||||
|
|
|
|
|
|
||||||||||||
|
|
2019 | 2018 | ||||||
| Merger and related costs | 82 | 170 | ||||||
| Acquisition and integration related costs | 16 | – | ||||||
| Foreign exchange loss (gain), net of related derivatives | 42 | (10 | ) | |||||
| Earnings of equity-accounted investees | (66 | ) | (40 | ) | ||||
| Bad debts | 24 | 26 | ||||||
| Defined Benefit Plans Curtailment Gain (Note 23) | – | (157 | ) | |||||
| Other expenses | 56 | 54 | ||||||
|
|
|
|
|
|
||||
| 154 | 43 | |||||||
|
|
|
|
|
|
||||
| 92 | Nutrien Annual Report 2019 | In millions of US dollars except as otherwise noted |
| Overview | Management’s Discussion & Analysis | Two Year Highlights | Financial Statements |
Other Information |
|
|
2019 | 2018 | ||||||
| Interest expense | ||||||||
| Short-term debt |
87 | 129 | ||||||
| Long-term debt |
387 | 372 | ||||||
| Lease liabilities (Note 21) |
34 | – | ||||||
| Unwinding of discount on asset retirement obligations (Note 24) | 54 | 51 | ||||||
| Interest on net defined benefit pension and other post-retirement plan obligations (Note 23) | 15 | 15 | ||||||
| Borrowing costs capitalized to property, plant and equipment | (18 | ) | (12 | ) | ||||
| Interest income | (5 | ) | (17 | ) | ||||
|
|
|
|
|
|
||||
| 554 | 538 | |||||||
|
|
|
|
|
|
||||
Borrowing costs capitalized to property, plant and equipment in 2019 were calculated by applying an average capitalization rate of 4.6 percent (2018 – 4.4 percent) to expenditures on qualifying assets.
Accounting Policies, Estimates and Judgments
We operate in a specialized industry and in several tax jurisdictions. As a result, our earnings are subject to various rates of taxation. Taxation on items recognized in the consolidated statements of earnings, other comprehensive income (“OCI”) or contributed surplus is recognized in the same location as those items.
Taxation on earnings (loss) is comprised of current and deferred income tax.
| Current income tax is |
Deferred income tax is | |
| • the expected tax payable on the taxable earnings for the year,
• calculated using rates enacted or substantively enacted at the dates of the consolidated balance sheets in the countries where our subsidiaries and equity-accounted investees operate and generate taxable earnings, and
• inclusive of any adjustment to income tax payable or recoverable in respect of previous years.
|
• recognized using the liability method,
• based on temporary differences between carrying amounts of assets and liabilities and their respective income tax bases, and
• determined using tax rates that have been enacted or substantively enacted by the dates of the consolidated balance sheets and are expected to apply when the related deferred income tax asset is realized or the deferred income tax liability is settled.
| |
|
|
|
| In millions of US dollars except as otherwise noted | Nutrien Annual Report 2019 | 93 |
| Overview | Management’s Discussion & Analysis | Two Year Highlights | Financial Statements |
Other Information |
Note 9 Income Taxes Continued
Income tax assets and liabilities are offset when
| Current income taxes |
Deferred income taxes | |
| • we have a legally enforceable right to offset the recognized amounts 1, and
• the intention to settle on a net basis or realize the asset and settle the liability simultaneously. |
• we have a legally enforceable right to set off current tax assets against current tax liabilities, and
• they relate to income taxes levied by the same taxation authority on either: 1) the same taxable entity; or 2) different taxable entities intending to settle current tax liabilities and assets on a net basis, or realize assets and settle liabilities simultaneously in each future period. 2 | |
|
|
|
| 1 | For income taxes levied by the same taxation authority and the authority permits us to make or receive a single net payment or receipt. |
| 2 | In which significant amounts of deferred tax liabilities or assets expected are to be settled or recovered. |
Supporting Information
Income Taxes included in Net Earnings (Loss) from Continuing Operations
The provision for income taxes differs from the amount that would have resulted from applying the Canadian statutory income tax rates to earnings (loss) before income taxes as follows:
|
|
2019 | 2018 | ||||||
| Earnings (loss) before income taxes | ||||||||
| Canada |
765 | (1,195 | ) | |||||
| United States |
315 | 619 | ||||||
| Australia |
27 | 96 | ||||||
| Trinidad |
(28 | ) | 98 | |||||
| Other |
229 | 258 | ||||||
|
|
|
|
|
|
||||
| 1,308 | (124 | ) | ||||||
|
|
|
|
|
|
||||
| Canadian federal and provincial statutory income tax rate (%) | 27 | 27 | ||||||
|
|
|
|
|
|
||||
| Income tax at statutory rates | 353 | (33 | ) | |||||
| Adjusted for the effect of: | ||||||||
| Impact of foreign tax rates |
(45 | ) | (58 | ) | ||||
| Non-taxable income |
(19 | ) | (10 | ) | ||||
| Production-related deductions |
(17 | ) | (15 | ) | ||||
| Foreign accrual property income |
18 | 15 | ||||||
| Impact of tax rate changes |
16 | – | ||||||
| Other |
10 | 8 | ||||||
|
|
|
|
|
|
||||
| Income tax expense (recovery) included in net earnings (loss) from continuing operations | 316 | (93 | ) | |||||
|
|
|
|
|
|
||||
| 94 | Nutrien Annual Report 2019 | In millions of US dollars except as otherwise noted |
| Overview | Management’s Discussion & Analysis | Two Year Highlights | Financial Statements |
Other Information |
Note 9 Income Taxes Continued
Total income tax expense (recovery), included in net earnings (loss) from continuing operations, was comprised of the following:
| 2019 | 2018 | |||||||
|
|
|
|
|
|
||||
| Current income tax | ||||||||
| Tax expense for current year |
161 | 195 | ||||||
| Adjustments in respect of prior years |
(22 | ) | (15 | ) | ||||
|
|
|
|
|
|
||||
| Total current income tax expense | 139 | 180 | ||||||
|
|
|
|
|
|
||||
| Deferred income tax | ||||||||
| Origination and reversal of temporary differences |
152 | (283 | ) | |||||
| Adjustments in respect of prior years |
9 | 12 | ||||||
| Impact of tax rate changes |
16 | – | ||||||
| Other |
– | (2 | ) | |||||
|
|
|
|
|
|
||||
| Total deferred income tax expense (recovery) | 177 | (273 | ) | |||||
|
|
|
|
|
|
||||
| Income tax expense (recovery) included in net earnings (loss) from continuing operations | 316 | (93 | ) | |||||
|
|
|
|
|
|
||||
Income Tax Balances
Income tax balances within the consolidated balance sheets as at December 31 were comprised of the following:
| Income Tax Assets and Liabilities |
Balance Sheet Location |
2019 | 2018 | |||||||
| Current income tax assets | ||||||||||
| Current |
Receivables (Note 13) |
104 | 248 | |||||||
| Long-term |
Other assets (Note 18) |
36 | 36 | |||||||
| Deferred income tax assets | Other assets (Note 18) |
249 | 216 | |||||||
|
|
|
|
|
|
|
|||||
| Total income tax assets | 389 | 500 | ||||||||
|
|
|
|
|
|
|
|||||
| Current income tax liabilities | ||||||||||
| Current |
Payables and accrued charges (Note 22) |
43 | 47 | |||||||
| Non-current |
Other non-current liabilities |
44 | 64 | |||||||
| Deferred income tax liabilities | Deferred income tax liabilities |
3,145 | 2,907 | |||||||
|
|
|
|
|
|
|
|||||
| Total income tax liabilities | 3,232 | 3,018 | ||||||||
|
|
|
|
|
|
|
|||||
| In millions of US dollars except as otherwise noted | Nutrien Annual Report 2019 | 95 |
| Overview | Management’s Discussion & Analysis | Two Year Highlights | Financial Statements |
Other Information |
Note 9 Income Taxes Continued
Deferred Income Taxes
In respect of each type of temporary difference, unused tax loss and unused tax credit, the amounts of deferred tax assets and liabilities recognized in the consolidated balance sheets as at December 31 and the amount of the deferred tax expense (recovery) recognized in net earnings (loss) from continuing operations were:
| Deferred Income Tax (Assets) Liabilities |
Deferred Income Tax Expense (Recovery) Recognized in Net Earnings (Loss) |
|||||||||||||||
|
|
2019 | 2018 | 2019 | 2018 | ||||||||||||
| Deferred income tax assets | ||||||||||||||||
| Asset retirement obligations and accrued environmental costs |
(387 | ) | (412 | ) | 25 | 11 | ||||||||||
| Tax loss and other carryforwards |
(270 | ) | (261 | ) | (9 | ) | (198 | ) | ||||||||
| Pension and other post-retirement benefit liabilities |
(145 | ) | (130 | ) | (13 | ) | 44 | |||||||||
| Long-term debt |
(107 | ) | (110 | ) | 3 | 10 | ||||||||||
| Lease liabilities |
(227 | ) | – | 55 | – | |||||||||||
| Receivables |
(51 | ) | (58 | ) | 7 | (3 | ) | |||||||||
| Inventories |
(59 | ) | (54 | ) | (5 | ) | (13 | ) | ||||||||
| Derivatives |
(9 | ) | (17 | ) | 5 | 15 | ||||||||||
| Other assets |
(61 | ) | (57 | ) | 4 | 18 | ||||||||||
| Deferred income tax liabilities | ||||||||||||||||
| Property, plant and equipment |
3,647 | 3,218 | 147 | (132 | ) | |||||||||||
| Goodwill and other intangible assets |
523 | 546 | (58 | ) | (31 | ) | ||||||||||
| Other liabilities |
42 | 26 | 16 | 6 | ||||||||||||
|
|
|
|
|
|
|
|
|
|
||||||||
| 2,896 | 2,691 | 177 | (273 | ) | ||||||||||||
|
|
|
|
|
|
|
|
|
|
||||||||
Reconciliation of net deferred income tax liabilities:
|
|
2019 | 2018 | ||||||
| Balance – beginning of year | 2,691 | 2,187 | ||||||
| Merger and acquisitions (Note 4) | 29 | 776 | ||||||
| Income tax expense (recovery) recognized in net earnings (loss) from continuing operations | 177 | (273 | ) | |||||
| Income tax expense (recovery) recognized in net earnings (loss) from discontinued operations | – | (17 | ) | |||||
| Income tax charge recognized in OCI | 2 | 22 | ||||||
| Other | (3 | ) | (4 | ) | ||||
|
|
|
|
|
|
||||
| Balance – end of year | 2,896 | 2,691 | ||||||
|
|
|
|
|
|
||||
Amounts and expiry dates of unused tax losses and unused tax credits as at December 31, 2019 were:
|
|
Amount | Expiry Date | ||||||
| Unused operating losses | 1,027 | 2020 - Indefinite | ||||||
| Unused capital losses | 829 | Indefinite | ||||||
| Unused investment tax credits | 38 | 2020 - 2038 | ||||||
|
|
|
|
|
|
||||
| 96 | Nutrien Annual Report 2019 | In millions of US dollars except as otherwise noted |
| Overview | Management’s Discussion & Analysis | Two Year Highlights | Financial Statements |
Other Information |
Note 10 Discontinued Operations
Accounting Policies
Supporting Information
In 2018, our investments in SQM, Israel Chemicals Ltd. (“ICL”) and APC were presented as discontinued operations due to regulatory requirements to dispose of these investments in connection with the Merger.
As of December 31, 2018, we completed all required divestitures and retained no residual interests as outlined below:
| For the year ended December 31, 2018 |
Proceeds 1 | Gain (Loss) on Sale |
Gain (Loss) on Sale Net of Income Taxes |
AOCI | Net Earnings and Retained Earnings |
|||||||||||||||
| Shares in SQM | 5,126 | 4,278 | 3,366 | – | 3,366 | |||||||||||||||
| Shares in ICL | 685 | (19 | ) | (19 | ) | (19 | ) | – | ||||||||||||
| Shares in APC | 501 | 121 | 126 | – | 126 | |||||||||||||||
| Conda Phosphate operations | 98 | – | – | – | – | |||||||||||||||
|
|
|
|
|
|
|
|
|
|
|
|
||||||||||
| Total sale | 6,410 | 2 | 4,380 | 3,473 | (19 | ) | 3,492 | |||||||||||||
|
|
|
|
|
|
|
|
|
|
|
|
||||||||||
| 1 | Proceeds are net of commissions. |
| 2 | Proceeds of $39 were collected in 2019. |
Net earnings from discontinued operations for the year ended December 31 were as follows:
|
|
2018 | |||
| Gain on disposal of investments in SQM and APC | 4,399 | |||
| Dividend income of SQM, APC and ICL 1 | 156 | |||
| Income tax expense 2 | (951 | ) | ||
|
|
|
|
||
| Net earnings from discontinued operations | 3,604 | |||
|
|
|
|
||
| 1 | Dividend income is included in cash provided by operating activities on the consolidated statements of cash flows, net of tax of $26. |
| 2 | For 2018, income tax expense is comprised of $(912) relating to the disposals of SQM shares, including the repatriation of the net proceeds, and $(39) relating to earnings from discontinued operations ($(18) for the planned repatriation of the remaining excess cash available in Chile, $(26) for the repatriation of dividend income received from SQM and $5 relating to APC). |
Note 11 Net Earnings Per share
|
|
2019 | 2018 | ||||||
| Weighted average number of common shares | 582,269,000 | 624,900,000 | ||||||
| Dilutive effect of stock options | 777,000 | – | 1 | |||||
| Dilutive effect of share-settled PSUs | 56,000 | – | 1 | |||||
|
|
|
|
|
|
||||
| Weighted average number of diluted common shares | 583,102,000 | 624,900,000 | ||||||
|
|
|
|
|
|
||||
| 1 | The diluted weighted average share calculations excluded an additional 658,000 stock options and 137,000 equity-settled PSUs due to their anti-dilutive effect. |
| In millions of US dollars except as otherwise noted | Nutrien Annual Report 2019 | 97 |
| Overview | Management’s Discussion & Analysis | Two Year Highlights | Financial Statements |
Other Information |
Note 11 Net Earnings Per share Continued
Options excluded from the calculation of diluted net earnings per share due to the option exercise prices being greater than the average market price of common shares were as follows:
|
|
2019 | 2018 | ||||||
| Number of options excluded | 4,539,529 | 5,721,656 | ||||||
| Performance option plan years fully excluded | 2010 – 2015 | 2009 – 2015 | ||||||
| Stock option plan years fully excluded | 2015, 2019 | 2015, 2018 | ||||||
|
|
|
|
|
|
||||
Note 12 Financial Instruments and Related Risk Management
Accounting Policies
Financial instruments are classified and measured as follows:
|
|
Fair Value Through Profit
or Loss |
Fair Value Through Other |
Financial Assets and Liabilities
at | |||
| Instrument type |
Cash and cash equivalents and derivatives |
Equity investments not held for trading |
Receivables, short-term debt, payables and accrued charges, long-term debt, other long-term debt instruments | |||
|
|
|
|
| |||
| Measurement |
Fair value |
Fair value |
Amortized cost | |||
|
|
|
|
| |||
| Fair value gains and losses |
Profit or loss |
OCI 2 |
– | |||
|
|
|
|
| |||
| Interest and dividends |
Profit or loss |
Profit or loss |
Profit or loss: effective interest rate | |||
|
|
|
|
| |||
| Impairment of assets |
– |
– |
Profit or loss | |||
|
|
|
|
| |||
| Foreign exchange |
Profit or loss |
OCI |
Profit or loss | |||
|
|
|
|
| |||
| Transaction costs |
Profit or loss |
OCI |
Included in cost of instrument | |||
|
|
|
|
|
| 1 | Amortized cost is applied if the objective of the business model for the instrument or group of instruments is to hold the asset to collect the contractual cash flows and the contractual terms give rise on specified dates to cash flows that are solely payments of principal and interest. |
| 2 | For equity investments not held for trading, we may make an irrevocable election at initial recognition to recognize changes in fair value through OCI rather than profit or loss. |
| 98 | Nutrien Annual Report 2019 | In millions of US dollars except as otherwise noted |
| Overview | Management’s Discussion & Analysis | Two Year Highlights | Financial Statements |
Other Information |
Note 12 Financial Instruments and Related Risk Management Continued
Supporting Information
Credit Risk
Our exposure to credit risk on our cash and cash equivalents, receivables (excluding taxes) and derivative instrument assets is the carrying amount of each instrument on the consolidated balance sheets.
Maximum exposure to credit risk as at December 31:
|
|
2019 | 2018 | ||||||
| Cash and cash equivalents |
671 | 2,314 | ||||||
| Receivables 1 |
3,438 | 3,094 | ||||||
| Other current assets – derivatives |
5 | 5 | ||||||
|
|
|
|
|
|
||||
| 4,114 | 5,413 | |||||||
|
|
|
|
|
|
||||
| 1 | Excluding income tax receivable. |
Credit risk is managed through policies applicable to the following assets:
|
|
Acceptable Minimum Counterparty Credit Ratings |
Exposure Thresholds by Counterparty |
Daily Counterparty Settlement Based on Prescribed Credit Thresholds |
Counterparties to Contracts are Investment-Grade Quality |
||||||
| Cash and Cash Equivalents |
X | X | ||||||||
| Natural Gas Derivatives |
X | X | X | |||||||
| Foreign Currency Derivatives |
X | |||||||||
|
|
|
|
|
|
|
|||||
| In millions of US dollars except as otherwise noted | Nutrien Annual Report 2019 | 99 |
| Overview | Management’s Discussion & Analysis | Two Year Highlights | Financial Statements |
Other Information |
Note 12 Financial Instruments and Related Risk Management Continued
The table below outlines our available credit facilities as at December 31, 2019:
|
|
Total Amount |
Amount Outstanding and Committed |
Amount Available |
|||||||||
| Unsecured revolving term credit facility 1 |
4,500 | 650 | 3,850 | |||||||||
| Uncommitted revolving demand facility |
500 | – | 500 | |||||||||
| Other credit facilities |
820 | 326 | 494 | |||||||||
|
|
|
|
|
|
|
|
||||||
| 1 | The unsecured revolving term credit facility matures April 10, 2023, subject to extension at the request of Nutrien provided that the resulting maturity date shall not exceed five years from the date of request. |
The following maturity analysis of our financial liabilities and gross settled derivative contracts (for which the cash flows are settled simultaneously) is based on the expected undiscounted contractual cash flows from the date of the consolidated balance sheets to the contractual maturity date.
| 2019 | Carrying Amount of Liability as at December 31 |
Contractual Cash Flows |
Within 1 Year |
1 to 3 Years |
3 to 5 Years |
Over 5 Years |
||||||||||||||||||
| Short-term debt 1 |
976 | 976 | 976 | – | – | – | ||||||||||||||||||
| Payables and accrued charges 2 |
5,264 | 5,264 | 5,264 | – | – | – | ||||||||||||||||||
| Long-term debt, including current portion 1 |
9,055 | 14,392 | 894 | 1,268 | 1,923 | 10,307 | ||||||||||||||||||
| Lease liabilities, including current portion 1 |
1,073 | 1,302 | 249 | 364 | 234 | 455 | ||||||||||||||||||
| Derivatives |
33 | 33 | 14 | 10 | 9 | – | ||||||||||||||||||
|
|
|
|
|
|
|
|
|
|
|
|
|
|
||||||||||||
| 16,401 | 21,967 | 7,397 | 1,642 | 2,166 | 10,762 | |||||||||||||||||||
|
|
|
|
|
|
|
|
|
|
|
|
|
|
||||||||||||
| 1 | Contractual cash flows include contractual interest payments related to debt obligations and lease liabilities. Interest rates on variable rate debt are based on prevailing rates as at December 31, 2019. |
| 2 | Excludes non-financial liabilities and includes trade payables of approximately $1.4 billion paid in January and February 2020 through an arrangement whereby a supplier sold the right to receive payment to a financial institution. |
| 100 | Nutrien Annual Report 2019 | In millions of US dollars except as otherwise noted |
| Overview | Management’s Discussion & Analysis | Two Year Highlights | Financial Statements |
Other Information |
Note 12 Financial Instruments and Related Risk Management Continued
The following table presents the significant foreign currency derivatives that existed at December 31:
| 2019 | 2018 | |||||||||||||||||||||||
| Sell/buy |
Notional | Maturities | Average contract rate |
Notional | Maturities | Average contract rate |
||||||||||||||||||
| Forwards | ||||||||||||||||||||||||
| USD/CDN |
337 | 2020 | 1.3096 | 502 | 2019 | 1.3583 | ||||||||||||||||||
| CDN/USD |
120 | 2020 | 1.3138 | 205 | 2019 | 1.3636 | ||||||||||||||||||
| USD/AUD 1 |
78 | 2020 | 1.4593 | 40 | 2019 | 1.3777 | ||||||||||||||||||
| AUD/USD |
47 | 2020 | 1.4563 | 48 | 2019 | 1.3816 | ||||||||||||||||||
|
|
|
|
|
|
|
|
|
|
|
|
|
|
||||||||||||
| 1 | Australian Dollar |
| In millions of US dollars except as otherwise noted | Nutrien Annual Report 2019 | 101 |
| Overview | Management’s Discussion & Analysis | Two Year Highlights | Financial Statements |
Other Information |
Note 12 Financial Instruments and Related Risk Management Continued
Financial instruments included in the consolidated balance sheets are measured either at fair value or amortized cost. The tables below explain the valuation methods used to determine the fair value of each financial instrument and its associated level in the fair value hierarchy.
| Financial Instruments Measured at Fair Value |
Fair Value Method | |
| Cash and cash equivalents |
Carrying amount (approximation to fair value assumed due to short-term nature) | |
|
|
| |
| Equity securities |
Closing bid price of the common shares as at the balance sheet date | |
|
|
| |
| Debt securities |
Closing bid price of the debt or other instruments with similar terms and credit risk (Level 2) as at the balance sheet date | |
|
|
| |
| Foreign currency derivatives not traded in an active market |
Quoted forward exchange rates (Level 2) as at the balance sheet date | |
|
|
| |
| Foreign exchange forward contracts, swaps and options and natural gas swaps not traded in an active market |
A discounted cash flow model 1 Market comparison 2 | |
|
|
|
| 1 | Inputs included contractual cash flows based on prices for natural gas futures contracts, fixed prices and notional volumes specified by the swap contracts, the time value of money, liquidity risk, our own credit risk (related to instruments in a liability position) and counterparty credit risk (related to instruments in an asset position). Futures contract prices used as inputs in the model were supported by prices quoted in an active market and therefore categorized in Level 2. |
| 2 | Inputs include current market and contractual prices, forward pricing curves, quoted forward prices, basis differentials, volatility factors and interest rates and therefore categorized in Level 2. Market comparison was used for the 2018 AECO natural gas hedges. |
| Financial Instruments Measured at Amortized Cost |
Fair Value Method | |
| Receivables, short-term debt and payables and accrued charges |
Carrying amount (approximation to fair value assumed due to short-term nature) | |
|
|
| |
| Long-term debt |
Quoted market prices (Level 1 or 2 depending on the market liquidity of the debt) | |
|
|
| |
| Other long-term debt instruments |
Carrying amount | |
|
|
|
The following table presents our fair value hierarchy for financial assets and financial liabilities carried at fair value on a recurring basis or measured at amortized cost:
| 2019 | 2018 | |||||||||||||||||||||||
| Financial instruments measured at |
Carrying Amount |
Level 1 1 | Level 2 1 | Carrying Amount |
Level 1 1 | Level 2 1 | ||||||||||||||||||
| Fair value on a recurring basis | ||||||||||||||||||||||||
| Cash and cash equivalents |
671 | – | 671 | 2,314 | – | 2,314 | ||||||||||||||||||
| Derivative instrument assets |
5 | – | 5 | 5 | – | 5 | ||||||||||||||||||
| Other current financial assets – marketable securities 2 |
193 | 27 | 166 | 97 | 12 | 85 | ||||||||||||||||||
| Investments at FVTOCI (Note 17) |
161 | 161 | – | 186 | 186 | – | ||||||||||||||||||
| Derivative instrument liabilities |
(33 | ) | – | (33 | ) | (71 | ) | – | (71 | ) | ||||||||||||||
| Amortized cost | ||||||||||||||||||||||||
| Current portion of long-term debt |
||||||||||||||||||||||||
| Notes and debentures |
(494 | ) | – | (503 | ) | (995 | ) | – | (1,009 | ) | ||||||||||||||
| Fixed and floating rate debt |
(8 | ) | – | (8 | ) | (8 | ) | – | (8 | ) | ||||||||||||||
| Long-term debt |
||||||||||||||||||||||||
| Notes and debentures |
(8,528 | ) | (1,726 | ) | (7,440 | ) | (7,569 | ) | (1,004 | ) | (6,177 | ) | ||||||||||||
| Fixed and floating rate debt |
(25 | ) | – | (25 | ) | (22 | ) | – | (22 | ) | ||||||||||||||
|
|
|
|
|
|
|
|
|
|
|
|
|
|
||||||||||||
| 1 | Financial instruments included in Level 1 are measured using quoted prices in active markets for identical assets or liabilities, while those classified as Level 2 are measured using significant other observable inputs. During 2019 and 2018, there were no transfers between Level 1 and Level 2 for financial instruments measured at fair value on a recurring basis. Our policy is to recognize transfers at the end of the reporting period. |
| 2 | Marketable securities consist of equity and fixed income securities. |
| 102 | Nutrien Annual Report 2019 | In millions of US dollars except as otherwise noted |
| Overview | Management’s Discussion & Analysis | Two Year Highlights | Financial Statements |
Other Information |
Note 12 Financial Instruments and Related Risk Management Continued
| 2019 | 2018 | |||||||||||||||||||||||
| Financial assets (liabilities) |
Gross | Offset | Net Amounts Presented |
Gross | Offset | Net Amounts Presented |
||||||||||||||||||
| Derivative instrument assets | ||||||||||||||||||||||||
| Natural gas derivatives |
– | – | – | 31 | (27 | ) | 4 | |||||||||||||||||
| Derivative instrument liabilities | ||||||||||||||||||||||||
| Natural gas derivatives 1 |
(30 | ) | – | (30 | ) | (92 | ) | 26 | (66 | ) | ||||||||||||||
| Other long-term debt instruments 2 | (150 | ) | 150 | – | (150 | ) | 150 | – | ||||||||||||||||
|
|
|
|
|
|
|
|
|
|
|
|
|
|
||||||||||||
| (180 | ) | 150 | (30 | ) | (211 | ) | 149 | (62 | ) | |||||||||||||||
|
|
|
|
|
|
|
|
|
|
|
|
|
|
||||||||||||
| 1 | Cash margin deposits of $17 (2018 – $18) were placed with counterparties related to legally enforceable master netting arrangements. |
| 2 | Back-to-back loan arrangements that are not subject to any financial test covenants but are subject to certain customary covenants and events of default. We were in compliance with these covenants as at December 31, 2019. |
Natural gas derivatives outstanding:
| 2019 | 2018 | |||||||||||||||||||||||||||||||
|
|
Notional 1 | Maturities | Average Contract Price 2 |
Fair Value of Assets (Liabilities) |
Notional 1 | Maturities | Average Contract Price 2 |
Fair Value of Assets (Liabilities) |
||||||||||||||||||||||||
| NYMEX swaps | 16 | 2020 – 2022 | 4.26 | (30 | ) | 22 | 2019 – 2022 | 4.26 | (35 | ) | ||||||||||||||||||||||
| AECO swaps | – | n/a | – | – | 26 | 2019 | 1.92 | (25 | ) | |||||||||||||||||||||||
|
|
|
|
|
|
|
|
|
|
|
|
|
|
|
|
|
|
||||||||||||||||
| 1 | In millions of British thermal units (“MMBtu”). |
| 2 | US dollars per MMBtu. |
n/a = not applicable
Accounting Policies, Estimates and Judgments
| In millions of US dollars except as otherwise noted | Nutrien Annual Report 2019 | 103 |
| Overview | Management’s Discussion & Analysis | Two Year Highlights | Financial Statements |
Other Information |
Note 13 Receivables Continued
Supporting Information
|
|
2019 | 2018 | ||||||||
| Receivables from customers | – third parties |
2,936 | 2,628 | |||||||
| – Canpotex (Note 29) |
194 | 208 | ||||||||
| Less allowance for expected credit losses of receivables from customers | (83 | ) | (90 | ) | ||||||
|
|
|
|
|
|
||||||
| 3,047 | 2,746 | |||||||||
| Rebates | 190 | 169 | ||||||||
| Income taxes (Note 9) | 104 | 248 | ||||||||
| Other receivables | 201 | 179 | ||||||||
|
|
|
|
|
|
||||||
| 3,542 | 3,342 | |||||||||
|
|
|
|
|
|
||||||
Accounting Policies, Estimates and Judgments
Inventories are valued monthly at the lower of cost and net realizable value. Costs are allocated to inventory using the weighted average cost method and include: direct acquisition costs, direct costs related to units of production and a systematic allocation of fixed and variable production overhead, as applicable.
Net realizable value is based on
| Products and raw materials |
Materials and supplies | |
| • selling price of the finished product (in ordinary course of business) less the estimated costs of completion and estimated costs to make the sale. |
• replacement cost. | |
|
|
|
A writedown is recognized if the carrying amount exceeds net realizable value and may be reversed if the circumstances which caused it no longer exist.
Various factors impact our estimates of net realizable value, including inventory levels, forecasted prices of key production inputs, global nutrient capacities, and crop price trends.
Supporting Information
| 104 | Nutrien Annual Report 2019 | In millions of US dollars except as otherwise noted |
| Overview | Management’s Discussion & Analysis | Two Year Highlights | Financial Statements |
Other Information |
Note 15 Property, Plant and Equipment
The majority of our tangible assets are the buildings, machinery and equipment used to produce or distribute our products and render our services.
Accounting Policies, Estimates and Judgments
| In millions of US dollars except as otherwise noted | Nutrien Annual Report 2019 | 105 |
| Overview | Management’s Discussion & Analysis | Two Year Highlights | Financial Statements |
Other Information |
Note 15 Property, Plant and Equipment Continued
Leased Property, Plant and Equipment
| 106 | Nutrien Annual Report 2019 | In millions of US dollars except as otherwise noted |
| Overview | Management’s Discussion & Analysis | Two Year Highlights | Financial Statements |
Other Information |
Note 15 Property, Plant and Equipment Continued
Supporting Information
|
|
Land and Improvements |
Buildings and Improvements |
Machinery and Equipment |
Mine Development Costs |
Assets Under Construction |
Total | ||||||||||||||||||
| Useful life range (years) | 3 – 80 | 1 – 60 | 1 – 80 | n/a | n/a | |||||||||||||||||||
|
|
|
|
|
|
|
|
|
|
|
|
|
|
||||||||||||
| Carrying amount – December 31, 2018 | 1,018 | 6,044 | 9,882 | 709 | 1,143 | 18,796 | ||||||||||||||||||
| ROU assets recognized on adoption of IFRS 16 |
48 | 307 | 704 | – | – | 1,059 | ||||||||||||||||||
| Acquisitions (Note 4) | 17 | 136 | 61 | – | 37 | 251 | ||||||||||||||||||
| Additions | 14 | 30 | 225 | – | 1,487 | 1,756 | ||||||||||||||||||
| Additions – ROU | – | 22 | 177 | – | – | 199 | ||||||||||||||||||
| Disposals | (3 | ) | (5 | ) | (84 | ) | – | – | (92 | ) | ||||||||||||||
| Transfers | 108 | 145 | 932 | 110 | (1,295 | ) | – | |||||||||||||||||
| Foreign currency translation and other | (4 | ) | (37 | ) | (14 | ) | 5 | 6 | (44 | ) | ||||||||||||||
| Depreciation | (36 | ) | (187 | ) | (1,004 | ) | (77 | ) | – | (1,304 | ) | |||||||||||||
| Depreciation – ROU | (2 | ) | (46 | ) | (186 | ) | – | – | (234 | ) | ||||||||||||||
| Impairment | – | – | (52 | ) | – | – | (52 | ) | ||||||||||||||||
|
|
|
|
|
|
|
|
|
|
|
|
|
|
||||||||||||
| Carrying amount – December 31, 2019 | 1,160 | 6,409 | 10,641 | 747 | 1,378 | 20,335 | ||||||||||||||||||
|
|
|
|
|
|
|
|
|
|
|
|
|
|
||||||||||||
| Balance – December 31, 2019 comprised of: | ||||||||||||||||||||||||
| Cost |
1,474 | 8,207 | 18,548 | 2,068 | 1,378 | 31,675 | ||||||||||||||||||
| Accumulated depreciation and impairments |
(314 | ) | (1,798 | ) | (7,907 | ) | (1,321 | ) | – | (11,340 | ) | |||||||||||||
|
|
|
|
|
|
|
|
|
|
|
|
|
|
||||||||||||
| Carrying amount – December 31, 2019 | 1,160 | 6,409 | 10,641 | 747 | 1,378 | 20,335 | ||||||||||||||||||
|
|
|
|
|
|
|
|
|
|
|
|
|
|
||||||||||||
| Balance – December 31, 2019 comprised of: | ||||||||||||||||||||||||
| Owned property, plant and equipment |
1,117 | 6,065 | 9,973 | 747 | 1,378 | 19,280 | ||||||||||||||||||
| ROU assets |
43 | 344 | 668 | – | – | 1,055 | ||||||||||||||||||
|
|
|
|
|
|
|
|
|
|
|
|
|
|
||||||||||||
| Carrying amount – December 31, 2019 | 1,160 | 6,409 | 10,641 | 747 | 1,378 | 20,335 | ||||||||||||||||||
|
|
|
|
|
|
|
|
|
|
|
|
|
|
||||||||||||
| Carrying amount – December 31, 2017 | 612 | 4,184 | 6,744 | 979 | 452 | 12,971 | ||||||||||||||||||
| Merger impact (Note 4) | 396 | 2,695 | 4,042 | – | 326 | 7,459 | ||||||||||||||||||
| Other acquisitions | 10 | 31 | 66 | – | – | 107 | ||||||||||||||||||
| Additions | 41 | 61 | 327 | 42 | 975 | 1,446 | ||||||||||||||||||
| Disposals | (3 | ) | (14 | ) | (30 | ) | – | – | (47 | ) | ||||||||||||||
| Transfers | 10 | 30 | 538 | 18 | (596 | ) | – | |||||||||||||||||
| Foreign currency translation and other | (9 | ) | 28 | (21 | ) | 10 | (14 | ) | (6 | ) | ||||||||||||||
| Depreciation | (33 | ) | (195 | ) | (1,032 | ) | (65 | ) | – | (1,325 | ) | |||||||||||||
| Impairment | (6 | ) | (776 | ) | (752 | ) | (275 | ) | – | (1,809 | ) | |||||||||||||
|
|
|
|
|
|
|
|
|
|
|
|
|
|
||||||||||||
| Carrying amount – December 31, 2018 | 1,018 | 6,044 | 9,882 | 709 | 1,143 | 18,796 | ||||||||||||||||||
|
|
|
|
|
|
|
|
|
|
|
|
|
|
||||||||||||
| Balance – December 31, 2018 comprised of: | ||||||||||||||||||||||||
| Cost |
1,294 | 7,617 | 16,806 | 1,954 | 1,143 | 28,814 | ||||||||||||||||||
| Accumulated depreciation and impairments |
(276 | ) | (1,573 | ) | (6,924 | ) | (1,245 | ) | – | (10,018 | ) | |||||||||||||
|
|
|
|
|
|
|
|
|
|
|
|
|
|
||||||||||||
| Carrying amount – December 31, 2018 | 1,018 | 6,044 | 9,882 | 709 | 1,143 | 18,796 | ||||||||||||||||||
|
|
|
|
|
|
|
|
|
|
|
|
|
|
||||||||||||
| In millions of US dollars except as otherwise noted | Nutrien Annual Report 2019 | 107 |
| Overview | Management’s Discussion & Analysis | Two Year Highlights | Financial Statements |
Other Information |
Note 15 Property, Plant and Equipment Continued
Depreciation of property, plant and equipment was included in the following:
|
|
2019 | 2018 | ||||||
| Freight, transportation and distribution | 137 | 15 | ||||||
| Cost of goods sold | 1,008 | 1,016 | ||||||
| Selling expenses | 344 | 259 | ||||||
| General and administrative expenses | 40 | 35 | ||||||
|
|
|
|
|
|
||||
| 1,529 | 1,325 | |||||||
| Depreciation recorded in inventory | 161 | 108 | ||||||
|
|
|
|
|
|
||||
| 1,690 | 1,433 | |||||||
|
|
|
|
|
|
||||
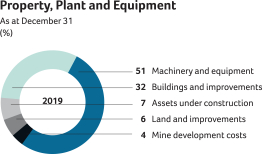
| 108 | Nutrien Annual Report 2019 | In millions of US dollars except as otherwise noted |
| Overview | Management’s Discussion & Analysis | Two Year Highlights | Financial Statements |
Other Information |
Note 16 Goodwill and Other Intangible Assets
Accounting Policies, Estimates and Judgments
Supporting Information
| Other Intangibles | ||||||||||||||||||||||||
|
|
Goodwill | Customer Relationships 2 |
Technology | Trade Names |
Other | Total | ||||||||||||||||||
| Useful life range (years) | n/a | 3 – 15 | 3 – 30 | 10 – 20 | 3 | 1 – 20 | ||||||||||||||||||
|
|
|
|
|
|
|
|
|
|
|
|
|
|
||||||||||||
| Carrying amount – December 31, 2018 | 11,431 | 1,554 | 117 | 90 | 449 | 2,210 | ||||||||||||||||||
| Acquisitions (Note 4) | 543 | 173 | 43 | 13 | 115 | 344 | ||||||||||||||||||
| Additions – internally developed | – | – | 197 | – | 2 | 199 | ||||||||||||||||||
| Foreign currency translation and other | 12 | 2 | 9 | 18 | (25 | ) | 4 | |||||||||||||||||
| Impairment | – | – | – | (35 | ) | (33 | ) | (68 | ) | |||||||||||||||
| Amortization 1 | – | (145 | ) | (15 | ) | (24 | ) | (77 | ) | (261 | ) | |||||||||||||
|
|
|
|
|
|
|
|
|
|
|
|
|
|
||||||||||||
| Carrying amount – December 31, 2019 | 11,986 | 1,584 | 351 | 62 | 431 | 2,428 | ||||||||||||||||||
|
|
|
|
|
|
|
|
|
|
|
|
|
|
||||||||||||
| Balance – December 31, 2019 comprised of: |
|
|||||||||||||||||||||||
| Cost |
11,993 | 1,906 | 429 | 92 | 597 | 3,024 | ||||||||||||||||||
| Accumulated amortization and impairment |
(7 | ) | (322 | ) | (78 | ) | (30 | ) | (166 | ) | (596 | ) | ||||||||||||
|
|
|
|
|
|
|
|
|
|
|
|
|
|
||||||||||||
| Carrying amount – December 31, 2019 | 11,986 | 1,584 | 351 | 62 | 431 | 2,428 | ||||||||||||||||||
|
|
|
|
|
|
|
|
|
|
|
|
|
|
||||||||||||
| Carrying amount – December 31, 2017 | 97 | – | – | – | 69 | 69 | ||||||||||||||||||
| Merger impact (Note 4) | 11,185 | 1,708 | 44 | 122 | 474 | 2,348 | ||||||||||||||||||
| Other acquisitions (Note 4) | 197 | 1 | – | – | 7 | 8 | ||||||||||||||||||
| Additions – internally developed | – | – | 79 | – | 19 | 98 | ||||||||||||||||||
| Disposals | – | – | – | – | (27 | ) | (27 | ) | ||||||||||||||||
| Foreign currency translation and other | (48 | ) | (20 | ) | 1 | (4 | ) | (6 | ) | (29 | ) | |||||||||||||
| Amortization 1 | – | (135 | ) | (7 | ) | (28 | ) | (87 | ) | (257 | ) | |||||||||||||
|
|
|
|
|
|
|
|
|
|
|
|
|
|
||||||||||||
| Carrying amount – December 31, 2018 | 11,431 | 1,554 | 117 | 90 | 449 | 2,210 | ||||||||||||||||||
|
|
|
|
|
|
|
|
|
|
|
|
|
|
||||||||||||
| Balance – December 31, 2018 comprised of: |
|
|||||||||||||||||||||||
| Cost |
11,438 | 1,691 | 124 | 118 | 586 | 2,519 | ||||||||||||||||||
| Accumulated amortization |
(7 | ) | (137 | ) | (7 | ) | (28 | ) | (137 | ) | (309 | ) | ||||||||||||
|
|
|
|
|
|
|
|
|
|
|
|
|
|
||||||||||||
| Carrying amount – December 31, 2018 | 11,431 | 1,554 | 117 | 90 | 449 | 2,210 | ||||||||||||||||||
|
|
|
|
|
|
|
|
|
|
|
|
|
|
||||||||||||
| 1 | Amortization of $234 was included in selling expenses during the year ended December 31, 2019 (2018 – $225). |
| 2 | The remaining amortization period of customer relationships at December 31, 2019, was approximately 7 years. |
| 3 | Certain trade names have indefinite useful lives as there are no regulatory, legal, contractual, cooperative, economic or other factors that limit their useful lives. |
| In millions of US dollars except as otherwise noted | Nutrien Annual Report 2019 | 109 |
| Overview | Management’s Discussion & Analysis | Two Year Highlights | Financial Statements |
Other Information |
Note 16 Goodwill and Other Intangible Assets Continued
Goodwill Impairment Testing
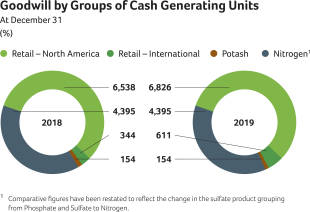
For each group of CGUs, terminal growth rates and discount rates used were as follows:
|
|
Terminal Growth Rate (%) | Discount Rate (%) | ||||||
| Retail – North America | 2.5 | 7.0 | ||||||
| Retail – International 1 | 2.0 | 7.5 - 15.0 | ||||||
| Potash | 2.5 | 8.0 | ||||||
| Nitrogen | 2.0 | 9.0 | ||||||
|
|
|
|
|
|
||||
| 1 | The discount rates reflect the country risk premium and size for our international groups of CGUs. |
| 110 | Nutrien Annual Report 2019 | In millions of US dollars except as otherwise noted |
| Overview | Management’s Discussion & Analysis | Two Year Highlights | Financial Statements |
Other Information |
Note 16 Goodwill and Other Intangible Assets Continued
The Retail – North America group of CGUs recoverable amount exceeds its carrying amount by $794 which is 6% of the recoverable amount. As a result of the Merger, the non-cash fair value adjustment to the Retail — North America goodwill was $4,284. Goodwill is more susceptible to impairment risk if business operating results or economic conditions deteriorate and we do not meet our forecasts. A reduction in the terminal growth rate, an increase in the discount rate or a decrease in forecasted cash flows could cause material impairment in the future. The following table indicates the percentage by which key assumptions would need to change individually for the estimated Retail — North America recoverable amount to be equal to the carrying amount:
| Key Assumptions |
Change Required for Carrying Amount to Equal Recoverable Amount (%) |
Value Used in Impairment Model |
||||||
| Terminal growth rate | (0.3) | 2.5 | % | |||||
| Forecasted EBITDA over forecast period | (4.1) | 6,128 | ||||||
| Discount rate | 0.2 | 7.0 | % | |||||
|
|
|
|
|
|
||||
We hold interests in associates and joint ventures, the most significant being Canpotex, MOPCO and Profertil. Our most significant investment accounted for as FVTOCI is Sinofert.
Accounting Policies, Estimates and Judgments
| In millions of US dollars except as otherwise noted | Nutrien Annual Report 2019 | 111 |
| Overview | Management’s Discussion & Analysis | Two Year Highlights | Financial Statements |
Other Information |
Note 17 Investments Continued
Supporting Information
Equity-accounted investees and investments at FVTOCI as at December 31 were comprised of:
| Principal Activity | Principal Place of Business and Incorporation |
Proportion of Ownership Interest and Voting Rights Held (%) |
Carrying Amount | |||||||||||||||||||||
| Name |
2019 | 2018 | 2019 | 2018 | ||||||||||||||||||||
| Equity-accounted investees |
|
|||||||||||||||||||||||
| MOPCO | Nitrogen Producer | Egypt | 26 | 26 | 270 | 236 | ||||||||||||||||||
| Profertil | Nitrogen Producer | Argentina | 50 | 50 | 212 | 192 | ||||||||||||||||||
| Canpotex | Marketing and Logistics | Canada | 50 | 50 | – | – | ||||||||||||||||||
| Agrichem 1 | Fertilizer Producer and Marketer | Brazil | 100 | 80 | – | 103 | ||||||||||||||||||
| Other associates and joint ventures |
|
178 | 161 | |||||||||||||||||||||
|
|
|
|
|
|
|
|
|
|
|
|
||||||||||||||
| Total equity-accounted investees |
|
660 | 692 | |||||||||||||||||||||
|
|
|
|
|
|
|
|
||||||||||||||||||
| Investments at FVTOCI |
|
|||||||||||||||||||||||
| Sinofert | Fertilizer Supplier and Distributor | China/Bermuda | 22 | 22 | 161 | 180 | ||||||||||||||||||
| Other | – | – | – | 6 | ||||||||||||||||||||
|
|
|
|
|
|
|
|
|
|
|
|
|
|
||||||||||||
| Total investments at FVTOCI |
|
161 | 186 | |||||||||||||||||||||
|
|
|
|
|
|
|
|
||||||||||||||||||
| 1 | During 2019, we acquired the remaining 20 percent interest in Agrichem making it a wholly owned consolidated subsidiary, as described in Note 4, and as a result ceased equity accounting. Prior to this acquisition, we had joint control with the other shareholder of Agrichem. |
Future conditions, including those related to MOPCO and Profertil, are subject to variability due to political instability and civil unrest. We are exposed to foreign exchange risk related to fluctuations in the Egyptian pound and Argentine peso against the US dollar. This may also restrict our ability to obtain dividends from Profertil.
Additional financial information on our proportionate interest in equity-accounted investees for the years ended December 31 was as follows:
| Associates | Joint Ventures | |||||||||||||||
|
|
2019 | 2018 | 2019 | 2018 | ||||||||||||
| Earnings from continuing operations and net earnings | 34 | 24 | 32 | 16 | ||||||||||||
| Other comprehensive income | 6 | – | – | – | ||||||||||||
|
|
|
|
|
|
|
|
|
|
||||||||
| Total comprehensive income | 40 | 24 | 32 | 16 | ||||||||||||
|
|
|
|
|
|
|
|
|
|
||||||||
| 112 | Nutrien Annual Report 2019 | In millions of US dollars except as otherwise noted |
| Overview | Management’s Discussion & Analysis | Two Year Highlights | Financial Statements |
Other Information |
Other assets as at December 31 were comprised of:
|
|
2019 | 2018 | ||||||
| Deferred income tax assets (Note 9) | 249 | 216 | ||||||
| Ammonia catalysts – net of accumulated amortization of $71 (2018 – $79) | 89 | 81 | ||||||
| Long-term income tax receivable (Note 9) | 36 | 36 | ||||||
| Accrued pension benefit asset (Note 23) | 25 | 27 | ||||||
| Other – net of accumulated amortization of $41 (2018 – $38) | 165 | 165 | ||||||
|
|
|
|
|
|
||||
| 564 | 525 | |||||||
|
|
|
|
|
|
||||
We use our $4.5 billion commercial paper program for our short-term cash requirements. The commercial paper program is backstopped by the $4.5 billion unsecured revolving term credit facility (“Nutrien Credit Facility”). Short-term facilities are renegotiated periodically.
Short-term debt as at December 31 was comprised of:
|
|
Rate of Interest (%) | 2019 | 2018 | |||||||||
| Commercial paper | 2.0 – 2.1 | 650 | 391 | |||||||||
| Other credit facilities 1 | 0.8 – 10.4 | 326 | 238 | |||||||||
|
|
|
|
|
|
|
|
||||||
| 976 | 629 | |||||||||||
|
|
|
|
|
|
|
|
||||||
| 1 | Credit facilities are unsecured and consist of South American facilities with debt of $149 (2018 – $216) and interest rates ranging from 3.00 percent to 10.38 percent, Australia facilities with debt of $157 (2018 – $Nil) and interest rates ranging from 0.75 percent to 2.09 percent, and Other facilities with debt of $20 (2018 – $22) and interest rates ranging from 1.64 percent to 2.50 percent. |
| In millions of US dollars except as otherwise noted | Nutrien Annual Report 2019 | 113 |
| Overview | Management’s Discussion & Analysis | Two Year Highlights | Financial Statements |
Other Information |
We source our borrowings for funding purposes primarily through notes, debentures and long-term credit facilities. We have access to the capital markets through our base shelf prospectus.
Supporting Information
Long-term debt as at December 31 was comprised of:
|
|
Rate of Interest (%) | Maturity | 2019 | 2018 | ||||||||||||
| Notes 1 | ||||||||||||||||
| 6.750 | January 15, 2019 | – | 500 | |||||||||||||
| 6.500 | May 15, 2019 | – | 500 | |||||||||||||
| 4.875 | March 30, 2020 | 500 | 500 | |||||||||||||
| 3.150 | October 1, 2022 | 500 | 500 | |||||||||||||
| 3.500 | June 1, 2023 | 500 | 500 | |||||||||||||
| 3.625 | March 15, 2024 | 750 | 750 | |||||||||||||
| 3.375 | March 15, 2025 | 550 | 550 | |||||||||||||
| 3.000 | April 1, 2025 | 500 | 500 | |||||||||||||
| 4.000 | December 15, 2026 | 500 | 500 | |||||||||||||
| 4.200 | April 1, 2029 | 750 | – | |||||||||||||
| 4.125 | March 15, 2035 | 450 | 450 | |||||||||||||
| 7.125 | May 23, 2036 | 300 | 300 | |||||||||||||
| 5.875 | December 1, 2036 | 500 | 500 | |||||||||||||
| 5.625 | December 1, 2040 | 500 | 500 | |||||||||||||
| 6.125 | January 15, 2041 | 500 | 500 | |||||||||||||
| 4.900 | June 1, 2043 | 500 | 500 | |||||||||||||
| 5.250 | January 15, 2045 | 500 | 500 | |||||||||||||
| 5.000 | April 1, 2049 | 750 | – | |||||||||||||
| Debentures 1 |
7.800 | February 1, 2027 | 125 | 125 | ||||||||||||
| Other | 33 | 10 | ||||||||||||||
|
|
|
|
|
|
|
|
|
|
||||||||
| 8,708 | 8,185 | |||||||||||||||
| Add net unamortized fair value adjustments |
|
424 | 444 | |||||||||||||
| Less net unamortized debt issue costs |
|
(77) | (55) | |||||||||||||
|
|
|
|
|
|
|
|
|
|
||||||||
| 9,055 | 8,574 | |||||||||||||||
| Less current maturities |
|
(508) | (1,000) | |||||||||||||
| Less current portion of net unamortized fair |
|
– | (1) | |||||||||||||
| Add current portion of net unamortized debt issue costs |
|
6 | 6 | |||||||||||||
|
|
|
|
|
|
|
|
|
|
||||||||
| (502) | (995) | |||||||||||||||
|
|
|
|
|
|
|
|
|
|
||||||||
| 8,553 | 7,579 | |||||||||||||||
|
|
|
|
|
|
|
|
|
|
||||||||
| 1 | Each series of notes and debentures is unsecured and has no sinking fund requirements prior to maturity. Each series is redeemable and has various provisions that allow redemption prior to maturity, at our option, at specified prices. |
We are subject to certain customary covenants including limitation on liens, merger and change of control covenants, and customary events of default. We were in compliance with these covenants as at December 31, 2019.
| 114 | Nutrien Annual Report 2019 | In millions of US dollars except as otherwise noted |
| Overview | Management’s Discussion & Analysis | Two Year Highlights | Financial Statements |
Other Information |
Note 20 Long-Term Debt Continued
The following is a summary of changes in liabilities arising from financing activities:
|
|
Short-Term Debt and Current Portion of Long-Term Debt 1 |
Current Portion of Lease Liabilities |
Long-Term Debt |
Lease Liabilities |
Total | |||||||||||||||
| Balance – December 31, 2018 | 1,624 | 8 | 7,579 | 12 | 9,223 | |||||||||||||||
| Adoption of IFRS 16 (Note 15) | – | 196 | – | 863 | 1,059 | |||||||||||||||
| Debt acquired (Note 4) | 145 | 20 | 3 | 91 | 259 | |||||||||||||||
| Cash flows 1 | (794 | ) | (184 | ) | 1,461 | 75 | 558 | |||||||||||||
| Reclassifications | 500 | 178 | (500 | ) | (178 | ) | – | |||||||||||||
| Foreign currency translation and other non-cash changes |
3 | (4 | ) | 10 | (4 | ) | 5 | |||||||||||||
|
|
|
|
|
|
|
|
|
|
|
|
||||||||||
| Balance – December 31, 2019 | 1,478 | 214 | 8,553 | 859 | 11,104 | |||||||||||||||
|
|
|
|
|
|
|
|
|
|
|
|
||||||||||
| Balance – December 31, 2017 | 730 | – | 3,711 | – | 4,441 | |||||||||||||||
| Debt acquired in Merger (Note 4) | 870 | 8 | 4,918 | 12 | 5,808 | |||||||||||||||
| Cash flows 1 | (927 | ) | – | (12 | ) | – | (939) | |||||||||||||
| Reclassifications | 1,023 | – | (1,023 | ) | – | – | ||||||||||||||
| Foreign currency translation and other non-cash changes |
(72 | ) | – | (15 | ) | – | (87) | |||||||||||||
|
|
|
|
|
|
|
|
|
|
|
|
||||||||||
| Balance – December 31, 2018 | 1,624 | 8 | 7,579 | 12 | 9,223 | |||||||||||||||
|
|
|
|
|
|
|
|
|
|
|
|
||||||||||
| 1 | Cash inflows and cash outflows are presented on a net basis. |
We adopted IFRS 16, “Leases” as of January 1, 2019. See Note 15 and 31 for the respective accounting policies, estimates and judgments.
|
|
Rate of Interest (%) | 2019 | 2018 | |||||||||
| Lease liabilities | 3.35 | 859 | 12 | |||||||||
| Current portion of lease liabilities | 3.06 | 214 | 8 | |||||||||
|
|
|
|
|
|
|
|
||||||
| Total | 1,073 | 20 | ||||||||||
|
|
|
|
|
|
|
|
||||||
| In millions of US dollars except as otherwise noted | Nutrien Annual Report 2019 | 115 |
| Overview | Management’s Discussion & Analysis | Two Year Highlights | Financial Statements |
Other Information |
Note 22 Payables and Accrued Charges
Payables and accrued charges consist primarily of amounts we owe to suppliers and prepayments made by customers planning to purchase our products for the upcoming growing season.
Payables and accrued charges as at December 31 were comprised of:
|
|
2019 | 2018 | ||||||
| Trade accounts | 4,016 | 3,053 | ||||||
| Customer prepayments | 1,693 | 1,625 | ||||||
| Dividends | 258 | 526 | ||||||
| Accrued compensation | 434 | 425 | ||||||
| Current portion of asset retirement obligations and accrued environmental costs (Note 24) | 148 | 156 | ||||||
| Accrued interest | 103 | 105 | ||||||
| Current portion of share-based compensation (Note 6) | 118 | 87 | ||||||
| Current portion of derivatives | 13 | 45 | ||||||
| Income taxes (Note 9) | 43 | 47 | ||||||
| Current portion of pension and other post-retirement benefits (Note 23) | 15 | 13 | ||||||
| Other payables and other accrued charges | 596 | 621 | ||||||
|
|
|
|
|
|
||||
| 7,437 | 6,703 | |||||||
|
|
|
|
|
|
||||
Note 23 Pension and Other Post-Retirement Benefits
We offer the following pension and other post-retirement benefits to qualified employees: defined benefit pension plans; defined contribution pension plans; and health, disability, dental and life insurance (referred to as other defined benefit) plans. Substantially all our employees participate in at least one of these plans.
Accounting Policies, Estimates and Judgments
| 116 | Nutrien Annual Report 2019 | In millions of US dollars except as otherwise noted |
| Overview | Management’s Discussion & Analysis | Two Year Highlights | Financial Statements |
Other Information |
Note 23 Pension and Other Post-Retirement Benefits Continued
Supporting Information
The significant assumptions used to determine the benefit obligations and expense for our significant plans as at and for the year ended December 31 were as follows:
| Pension | Other | |||||||||||||||
|
|
2019 | 2018 | 2019 | 2018 | ||||||||||||
| Assumptions used to determine the benefit obligations 1: | ||||||||||||||||
| Discount rate (%) |
3.35 | 4.22 | 3.20 | 4.17 | ||||||||||||
| Rate of increase in compensation levels (%) |
4.66 | 4.75 | n/a | n/a | ||||||||||||
| Medical cost trend rate – assumed (%) |
n/a | n/a | 4.50 – 6.10 | 2 | 4.50 – 6.10 | 2 | ||||||||||
| Medical cost trend rate – year reaches ultimate trend rate |
n/a | n/a | 2037 | 2037 | ||||||||||||
| Mortality assumptions (years) 3 |
||||||||||||||||
| Life expectancy at 65 for a male member currently at age 65 |
20.5 | 20.6 | 20.3 | 20.4 | ||||||||||||
| Life expectancy at 65 for a female member currently at age 65 |
22.7 | 22.8 | 22.9 | 22.8 | ||||||||||||
| Average duration of the defined benefit obligations 4 (years) |
14.61 | 13.7 | 15.8 | 15.1 | ||||||||||||
|
|
|
|
|
|
|
|
|
|
||||||||
| 1 | The current year’s expense is determined using the assumptions that existed at the end of the previous year. |
| 2 | We assumed a graded medical cost trend rate starting at 6.10 percent in 2019, moving to 4.50 percent by 2037 (2018 – starting at 6.10 percent, moving to 4.50 percent by 2037). |
| 3 | Based on actuarial advice in accordance with the latest available published tables, adjusted where appropriate to reflect future longevity improvements for each country. |
| 4 | Weighted average length of the underlying cash flows. |
| n/a | = not applicable |
Of the most significant assumptions, a change in discount rates has the greatest potential impact on our pension and other post-retirement benefit plans, with sensitivity to change as follows:
| 2019 | 2018 | |||||||||||||||||
|
|
Change in Assumption |
Benefit Obligations |
Expense in Earnings Before Income Taxes |
Benefit Obligations |
Recovery in Loss Before Income Taxes |
|||||||||||||
| As reported | 2,044 | 71 | 1,797 | (87) | ||||||||||||||
|
|
|
|
|
|
|
|
|
|
|
|||||||||
| Discount rate | 1.0 percentage point decrease |
335 | 9 | 271 | 24 | |||||||||||||
| 1.0 percentage point increase |
(268) | (11 | ) | (218) | (22) | |||||||||||||
|
|
|
|
|
|
|
|
|
|
|
|||||||||
| In millions of US dollars except as otherwise noted | Nutrien Annual Report 2019 | 117 |
| Overview | Management’s Discussion & Analysis | Two Year Highlights | Financial Statements |
Other Information |
Note 23 Pension and Other Post-Retirement Benefits Continued
Description of Defined Benefit Pension Plans
We sponsor defined benefit pension plans as follows:
|
|
Plan Type |
Contributions | ||
| United States |
• non-contributory,
• guaranteed annual pension payments for life,
• benefits generally depend on years of service and compensation level in the final years leading up to age 65, |
• made to meet or exceed minimum funding requirements of the Employee Retirement Income Security Act of 1974 and associated Internal Revenue Service regulations and procedures. | ||
|
|
| |||
| Canada |
• benefits available starting at age 55 at a reduced rate, and
• plans provide for maximum pensionable salary and maximum annual benefit limits. |
• made to meet or exceed minimum funding requirements based on provincial statutory requirements and associated federal taxation rules. | ||
|
|
|
| ||
| Supplemental Plans in US and Canada for Senior Management |
• non-contributory,
• unfunded, and
• supplementary pension benefits. |
• provided for by charges to earnings sufficient to meet the projected benefit obligations, and
• payments to plans are made as plan payments to retirees occur. | ||
|
|
|
|
| 118 | Nutrien Annual Report 2019 | In millions of US dollars except as otherwise noted |
| Overview | Management’s Discussion & Analysis | Two Year Highlights | Financial Statements |
Other Information |
Note 23 Pension and Other Post-Retirement Benefits Continued
Description of Other Post-Retirement Plans
Risks
The defined benefit pension and other post-retirement plans expose us to broadly similar actuarial risks. The most significant risks include investment risk and interest rate risk as discussed below. Other risks include longevity risk and salary risk.
|
|
| |
| Investment Risk |
A deficit will be created if plan assets underperform the discount rate used in the defined benefit obligation valuation. To mitigate investment risk, we employ: | |
| • a total return on investment approach whereby a diversified mix of equities and fixed income investments is used to maximize long-term return for a prudent level of risk; and
• risk tolerance established through careful consideration of plan liabilities, plan funded status and corporate financial condition. | ||
| Other assets such as private equity and hedge funds are not used at this time. Our policy is not to invest in commodities, precious metals, mineral rights, bullions, or collectibles. Investment risk is measured and monitored on an ongoing basis through quarterly investment portfolio reviews, annual liability measurements and periodic asset/liability studies. | ||
|
|
| |
| Interest Rate Risk |
A decrease in bond interest rates will increase the pension liability; however, this is generally expected to be partially offset by an increase in the return on the plan’s debt investments. | |
|
|
|
| In millions of US dollars except as otherwise noted | Nutrien Annual Report 2019 | 119 |
| Overview | Management’s Discussion & Analysis | Two Year Highlights | Financial Statements |
Other Information |
Note 23 Pension and Other Post-Retirement Benefits Continued
Financial Information
Movements in the pension and other post-retirement benefit assets (liabilities)
| 2019 | 2018 | |||||||||||||||||||||||
|
|
Obligation | Plan Assets |
Net | Obligation | Plan Assets |
Net | ||||||||||||||||||
| Balance – beginning of year | (1,797) | 1,416 | (381) | (1,831) | 1,380 | (451) | ||||||||||||||||||
| Merger impact 1 | – | – | – | (347) | 205 | (142) | ||||||||||||||||||
| Components of defined benefit expense recognized in earnings | ||||||||||||||||||||||||
| Current service cost for benefits earned during the year |
(40) | – | (40) | (67) | – | (67) | ||||||||||||||||||
| Interest (expense) income |
(74) | 59 | (15) | (77) | 62 | (15) | ||||||||||||||||||
| Past service cost, including curtailment gains and settlements 2 |
– | – | – | 157 | – | 157 | ||||||||||||||||||
| Foreign exchange rate changes and other |
(29) | 13 | (16) | 39 | (27) | 12 | ||||||||||||||||||
|
|
|
|
|
|
|
|
|
|
|
|
|
|
||||||||||||
| Subtotal of components of defined benefit (expense) recovery recognized in earnings |
(143) | 72 | (71) | 52 | 35 | 87 | ||||||||||||||||||
|
|
|
|
|
|
|
|
|
|
|
|
|
|
||||||||||||
| Remeasurements of the net defined benefit liability recognized in OCI during the year |
||||||||||||||||||||||||
| Actuarial gain arising from: |
||||||||||||||||||||||||
| Changes in financial assumptions |
(199) | – | (199) | 210 | – | 210 | ||||||||||||||||||
| Changes in demographic assumptions |
14 | – | 14 | 11 | – | 11 | ||||||||||||||||||
| Loss on plan assets (excluding amounts included in net interest) |
– | 193 | 193 | – | (149) | (149) | ||||||||||||||||||
|
|
|
|
|
|
|
|
|
|
|
|
|
|
||||||||||||
| Subtotal of remeasurements | (185) | 193 | 8 | 221 | (149) | 72 | ||||||||||||||||||
|
|
|
|
|
|
|
|
|
|
|
|
|
|
||||||||||||
| Cash flows | ||||||||||||||||||||||||
| Contributions by plan participants |
(5) | 5 | – | (6) | 6 | – | ||||||||||||||||||
| Employer contributions |
– | 21 | 21 | – | 53 | 53 | ||||||||||||||||||
| Benefits paid |
86 | (86) | – | 114 | (114) | – | ||||||||||||||||||
|
|
|
|
|
|
|
|
|
|
|
|
|
|
||||||||||||
| Subtotal of cash flows | 81 | (60) | 21 | 108 | (55) | 53 | ||||||||||||||||||
|
|
|
|
|
|
|
|
|
|
|
|
|
|
||||||||||||
| Balance – end of year 3 | (2,044) | 1,621 | (423) | (1,797) | 1,416 | (381) | ||||||||||||||||||
|
|
|
|
|
|
|
|
|
|
|
|
|
|
||||||||||||
| Balance comprised of: | ||||||||||||||||||||||||
| Non-current assets |
||||||||||||||||||||||||
| Other assets (Note 18) |
25 | 27 | ||||||||||||||||||||||
| Current liabilities |
||||||||||||||||||||||||
| Payables and accrued charges (Note 22) |
(15) | (13) | ||||||||||||||||||||||
| Non-current liabilities |
||||||||||||||||||||||||
| Pension and other post-retirement benefit liabilities |
(433) | (395) | ||||||||||||||||||||||
|
|
|
|
|
|
|
|
|
|
|
|
|
|
||||||||||||
| 1 | We acquired Agrium’s pension and other post-retirement benefit obligations, representing the fair values at the acquisition date as described in Note 4. |
| 2 | In 2018, as part of our continuous assessment of our operations, participation (based on age and years of service) in certain company defined benefit pension and other post-retirement benefit plans was suspended and/or discontinued effective January 1, 2020. As a result, we recognized a Merger-related Defined Benefit Plans Curtailment Gain of $157. |
| 3 | Obligations arising from funded and unfunded pension plans are $(1,652) and $(392), respectively (2018 – $(1,466) and $(331)). Other post-retirement benefit plans have no plan assets and are unfunded. |
| 120 | Nutrien Annual Report 2019 | In millions of US dollars except as otherwise noted |
| Overview | Management’s Discussion & Analysis | Two Year Highlights | Financial Statements |
Other Information |
Note 23 Pension and Other Post-Retirement Benefits Continued
Plan Assets
As at December 31, the fair value of plan assets of our defined benefit pension plans, by asset category, were as follows:
| 2019 | 2018 | |||||||||||||||||||||||
|
|
Quoted Prices in Active Markets for Identical Assets |
Other 1 | Total | Quoted Prices in Active Markets for Identical Assets |
Other | Total | ||||||||||||||||||
| Cash and cash equivalents | 8 | 112 | 120 | 6 | 54 | 60 | ||||||||||||||||||
| Equity securities and equity funds | ||||||||||||||||||||||||
| US |
1 | 571 | 572 | 454 | 65 | 519 | ||||||||||||||||||
| International |
35 | 62 | 97 | 175 | 65 | 240 | ||||||||||||||||||
| Debt securities 2 | – | 698 | 698 | 187 | 329 | 516 | ||||||||||||||||||
| International balanced fund | – | 112 | 112 | – | 97 | 97 | ||||||||||||||||||
| Other | – | 22 | 22 | (25) | 9 | (16 | ) | |||||||||||||||||
|
|
|
|
|
|
|
|
|
|
|
|
|
|
||||||||||||
| Total pension plan assets | 44 | 1,577 | 1,621 | 797 | 619 | 1,416 | ||||||||||||||||||
|
|
|
|
|
|
|
|
|
|
|
|
|
|
||||||||||||
| 1 | Approximately 60% of the Other plan assets are held in funds whose fair values are estimated as a practical expedient using their net asset value per share. The redemption frequency of these funds is immediate and no notice period is required. |
| 2 | Debt securities included US securities of 82 percent (2018 – 52 percent), International securities of 18 percent (2018 – 31 percent) and Mortgage-backed securities of Nil percent (2018 – 17 percent). |
Letters of credit secured certain of our Canadian unfunded defined benefit plan liabilities as at December 31, 2019.
We expect to contribute approximately $95 to all pension and post-retirement plans during 2020. Total contributions recognized as expense under all defined contribution plans for 2019 was $88 (2018 – $75).
Note 24 Asset Retirement Obligations and Accrued Environmental Costs
A provision is an estimated liability with uncertainty over the timing or amount that will be paid. The most significant asset retirement and environmental remediation provisions relate to costs to restore potash and phosphate sites to their original, or another specified, condition.
Accounting Policies, Estimates and Judgments
| In millions of US dollars except as otherwise noted | Nutrien Annual Report 2019 | 121 |
| Overview | Management’s Discussion & Analysis | Two Year Highlights | Financial Statements |
Other Information |
Note 24 Asset Retirement Obligations and Accrued Environmental Costs Continued
Supporting Information
The pre-tax risk-free discount rate, expected cash flow payments and sensitivity to changes in the discount rate on the recorded liability for asset retirement obligations and accrued environmental costs at December 31, 2019 were as follows:
| Discount Rate | ||||||||||||||||||||||||
|
|
Risk-Free Rate (%) 1 |
Cash Flow Payments (years) 2 |
Undiscounted Cash Flows |
Discounted Cash Flows |
+0.5% | -0.5% | ||||||||||||||||||
| Asset retirement obligations | (81 | ) | 87 | |||||||||||||||||||||
| Retail |
2.08 – 2.81 | 1 – 30 | 11 | 10 | ||||||||||||||||||||
| Potash |
5.00 | 40 – 442 | 650 3 | 70 | ||||||||||||||||||||
| Phosphate |
2.93 – 3.19 | 1 – 81 | 853 | 495 | ||||||||||||||||||||
| Corporate and Other 4,5 |
1.22 – 6.50 | 1 – 483 | 864 | 675 | ||||||||||||||||||||
| Accrued environmental costs | (14 | ) | 17 | |||||||||||||||||||||
| Retail |
1.92 – 4.27 | 1 – 30 | 77 | 72 | ||||||||||||||||||||
| Corporate and Other |
1.47 – 3.02 | 1 – 28 | 563 | 467 | ||||||||||||||||||||
|
|
|
|
|
|
|
|
|
|
|
|
|
|
||||||||||||
| 1 | Risk-free discount rates reflect current market assessments of the time value of money and the risks specific to the timing and jurisdiction of the obligation. |
| 2 | Time frame in which payments are expected to principally occur from December 31, 2019. Changes in years can result from changes to the mine life and/or changes in the rate of tailing volumes. |
| 3 | Represents total undiscounted cash flows in the first year of decommissioning. This excludes subsequent years of tailings dissolution, fine tails capping, tailings management area reclamation, post reclamation activities and monitoring, and final decommissioning, which are estimated to take an additional 92 to 401 years. |
| 4 | For nitrogen sites, we have not recorded any asset retirement obligations because no significant asset retirement obligations have been identified or there is no reasonable basis for estimating a date or range of dates of cessation of operations. We considered the historical performance of our facilities as well as our planned maintenance, major upgrades and replacements which can extend the useful lives of our facilities indefinitely. |
| 5 | Includes certain potash and phosphate sites that are non-operating sites, with the majority of phosphate site payments taking place over the next 81 years. |
Following is a reconciliation of asset retirement obligations and accrued environmental costs:
|
|
Asset Retirement Obligations |
Accrued Environmental Costs |
Total | |||||||||
| Balance – December 31, 2018 | 1,295 | 534 | 1,829 | |||||||||
| Recorded in earnings | 39 | 17 | 56 | |||||||||
| Capitalized to property, plant and equipment | 5 | – | 5 | |||||||||
| Settled during the year | (103) | (16) | (119) | |||||||||
| Foreign currency translation and other | 18 | 9 | 27 | |||||||||
|
|
|
|
|
|
|
|
||||||
| Balance – December 31, 2019 | 1,254 | 544 | 1,798 | |||||||||
|
|
|
|
|
|
|
|
||||||
| Balance – December 31, 2019 comprised of: | ||||||||||||
| Current liabilities |
||||||||||||
| Payables and accrued charges (Note 22) |
123 | 25 | 148 | |||||||||
| Non-current liabilities |
||||||||||||
| Asset retirement obligations and accrued environmental costs |
1,131 | 519 | 1,650 | |||||||||
|
|
|
|
|
|
|
|
||||||
| 122 | Nutrien Annual Report 2019 | In millions of US dollars except as otherwise noted |
| Overview | Management’s Discussion & Analysis | Two Year Highlights | Financial Statements |
Other Information |
Note 24 Asset Retirement Obligations and Accrued Environmental Costs Continued
Authorized
We are authorized to issue an unlimited number of common shares without par value and an unlimited number of preferred shares. The common shares are not redeemable or convertible. The preferred shares may be issued in one or more series with rights and conditions to be determined by the Board of Directors.
Issued
|
|
Number of Common Shares | Share Capital | ||||||
| Balance – December 31, 2018 | 608,535,477 | 16,740 | ||||||
| Issued under option plans and share-settled plans | 474,655 | 23 | ||||||
| Repurchased | (36,067,323) | (992) | ||||||
|
|
|
|
|
|
||||
| Balance – December 31, 2019 | 572,942,809 | 15,771 | ||||||
|
|
|
|
|
|
||||
Share repurchase programs
|
|
Board of Directors Approval | Expiry | Maximum Shares for Repurchase | |||||
| 2018 Normal Course Issuer Bid 1 | February 20, 2018 | February 22, 2019 | 50,363,686 | |||||
| 2019 Normal Course Issuer Bid 2 | February 20, 2019 | February 26, 2020 | 42,164,420 | |||||
|
|
|
|
|
|
||||
| 1 | On December 14, 2018, the normal course issuer bid was increased to permit the repurchase of up to approximately 8 percent of our outstanding common shares for cancellation. |
| 2 | On December 2, 2019, the normal course issuer bid was increased to permit the repurchase of up to 7 percent of our outstanding common shares for cancellation. Purchases of common shares can expire earlier than the date above if the maximum number of common shares allowable is acquired earlier or we otherwise decide not to make any further repurchases. |
Purchases under the normal course issuer bids were, or may be, made through open market purchases at market prices as well as by other means permitted by applicable securities regulatory authorities, including private agreements.
The following table summarizes our share repurchases:
|
|
2019 | 2018 | ||||||
| Common shares repurchased for cancellation | 36,067,323 | 36,332,197 | ||||||
| Average price per share | 52.07 | 50.97 | ||||||
| Total cost | 1,878 | 1,852 | ||||||
|
|
|
|
|
|
||||
As of February 19, 2020, an additional 2,214,780 common shares were repurchased for cancellation at a cost of $95 and an average price per share of $42.84.
Dividends declared
Dividends declared for the years ended December 31 were as follows:
|
|
2019 |
|
2018 | |||||||
| Declared |
Per Share | Declared |
Per Share | |||||||
| May 10, 2019 | 0.43 | February 20, 2018 |
0.40 | |||||||
| July 30, 2019 | 0.45 | May 23, 2018 |
0.40 | |||||||
| December 13, 2019 | 0.45 | July 19, 2018 |
0.40 | |||||||
| November 5, 2018 |
0.43 | |||||||||
| December 14, 2018 |
0.43 | |||||||||
|
|
|
|
|
|
|
|||||
| 1.33 | 2.06 | |||||||||
|
|
|
|
|
|
|
|||||
Subsequent to year-end, our Board of Directors declared a quarterly dividend of $0.45 per share payable on April 16, 2020 to shareholders of record on March 31, 2020. The total estimated dividend to be paid is $257.
| In millions of US dollars except as otherwise noted | Nutrien Annual Report 2019 | 123 |
| Overview | Management’s Discussion & Analysis | Two Year Highlights | Financial Statements |
Other Information |
The objective of our capital allocation policy is to balance the return of capital to our shareholders, improvements in the efficiency of our existing assets, and delivery on our growth opportunities, while maintaining a strong balance sheet and flexible capital structure to optimize the cost of capital at an acceptable level of risk. Our goal is to pay a stable and growing dividend with a target payout that represents 40 to 60 percent of free cash flow after sustaining capital through the agricultural cycle.
Adjusted net debt and adjusted shareholders’ equity are included as components of our capital structure. The calculation of adjusted net debt, adjusted shareholders’ equity and adjusted capital are set out in the following table:
|
|
2019 | 2018 | ||||||
| Short-term debt | 976 | 629 | ||||||
| Current portion of long-term debt | 502 | 995 | ||||||
| Current portion of lease liabilities | 214 | 8 | ||||||
| Long-term debt | 8,553 | 7,579 | ||||||
| Lease liabilities | 859 | 12 | ||||||
|
|
|
|
|
|
||||
| Total debt | 11,104 | 9,223 | ||||||
| Cash and cash equivalents | (671) | (2,314) | ||||||
|
|
|
|
|
|
||||
| Net debt | 10,433 | 6,909 | ||||||
| Unamortized fair value adjustments | (424) | (444) | ||||||
|
|
|
|
|
|
||||
| Adjusted net debt | 10,009 | 6,465 | ||||||
|
|
|
|
|
|
||||
| Total shareholders’ equity | 22,869 | 24,425 | ||||||
| Accumulated other comprehensive loss | 251 | 291 | ||||||
|
|
|
|
|
|
||||
| Adjusted shareholders’ equity | 23,120 | 24,716 | ||||||
|
|
|
|
|
|
||||
| Adjusted capital | 33,129 | 31,181 | ||||||
|
|
|
|
|
|
||||
We monitor the following ratios:
|
|
2019 | 2018 | ||||||
| Adjusted net debt to adjusted EBITDA | 2.5 | 1.6 | ||||||
| Adjusted EBITDA to adjusted finance costs | 8.0 | 8.1 | ||||||
| Adjusted net debt to adjusted capital (%) | 30.2 | 20.7 | ||||||
|
|
|
|
|
|
||||
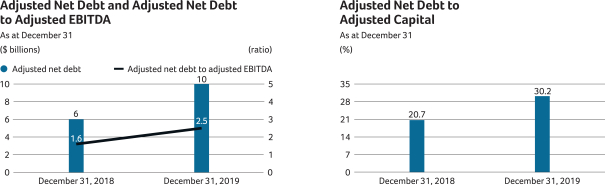
| 124 | Nutrien Annual Report 2019 | In millions of US dollars except as otherwise noted |
| Overview | Management’s Discussion & Analysis | Two Year Highlights | Financial Statements |
Other Information |
Note 26 Capital Management Continued
Other components of ratios above are calculated as follows:
|
|
2019 | 2018 | ||||||
| Net earnings (loss) from continuing operations | 992 | (31) | ||||||
| Finance costs | 554 | 538 | ||||||
| Income tax expense (recovery) | 316 | (93) | ||||||
| Depreciation and amortization | 1,799 | 1,592 | ||||||
|
|
|
|
|
|
||||
| EBITDA | 3,661 | 2,006 | ||||||
| Impairment of assets | 120 | 1,809 | ||||||
| Merger and related costs | 82 | 170 | ||||||
| Acquisition and integration related costs | 16 | – | ||||||
| Share-based compensation | 104 | 116 | ||||||
| Foreign exchange loss (gain), net of derivatives | 42 | (10) | ||||||
| Defined Benefit Plans Curtailment Gain | – | (157) | ||||||
|
|
|
|
|
|
||||
| Adjusted EBITDA | 4,025 | 3,934 | ||||||
|
|
|
|
|
|
||||
|
|
2019 | 2018 | ||||||
| Finance costs | 554 | 538 | ||||||
| Unwinding of discount on asset retirement obligations | (54) | (51) | ||||||
| Borrowing costs capitalized to property, plant and equipment | 18 | 12 | ||||||
| Interest on net defined benefit pension and other post-retirement plan obligations | (15) | (15) | ||||||
|
|
|
|
|
|
||||
| Adjusted finance costs | 503 | 484 | ||||||
|
|
|
|
|
|
||||
A commitment is a legally binding and enforceable agreement to purchase goods or services in the future. The amounts below reflect our commitments based on current expected contract prices.
Refer to Note 31 for details pertaining to the impact of the adoption of IFRS 16 in 2019 and Note 15 for the discussion related to the accounting policies, estimates and judgments.
Supporting Information
Minimum future commitments under these contractual arrangements were as follows at December 31, 2019:
|
|
Lease Liabilities 1 |
Long-Term Debt 1 |
Purchase Commitments |
Capital Commitments |
Other Commitments |
Total | ||||||||||||||||||
| Within 1 year | 249 | 894 | 877 | 43 | 118 | 2,181 | ||||||||||||||||||
| 1 to 3 years | 364 | 1,268 | 766 | 7 | 137 | 2,542 | ||||||||||||||||||
| 3 to 5 years | 234 | 1,923 | 438 | – | 58 | 2,653 | ||||||||||||||||||
| Over 5 years | 455 | 10,307 | 209 | – | 124 | 11,095 | ||||||||||||||||||
|
|
|
|
|
|
|
|
|
|
|
|
|
|
||||||||||||
| Total | 1,302 | 14,392 | 2,290 | 50 | 437 | 18,471 | ||||||||||||||||||
|
|
|
|
|
|
|
|
|
|
|
|
|
|
||||||||||||
| 1 | Includes principal portion and estimated interest. |
| In millions of US dollars except as otherwise noted | Nutrien Annual Report 2019 | 125 |
| Overview | Management’s Discussion & Analysis | Two Year Highlights | Financial Statements |
Other Information |
Note 29 Related Party Transactions
We transact with a number of related parties, the most significant being with our associates and joint ventures, key management personnel and post-employment benefit plans.
Supporting Information
Key Management Personnel Compensation
Compensation to key management personnel was comprised of:
|
|
2019 | 2018 | ||||||
| Salaries and other short-term benefits | 15 | 19 | ||||||
| Share-based compensation | 31 | 53 | ||||||
| Post-employment benefits | 3 | 3 | ||||||
| Termination benefits | 12 | 23 | ||||||
|
|
|
|
|
|
||||
| 61 | 98 | |||||||
|
|
|
|
|
|
||||
Transactions with Post-Employment Benefit Plans
Disclosures related to our post-employment benefit plans are shown in Note 23.
Note 30 Contingencies and Other Matters
Contingent liabilities, which are not recognized in the consolidated financial statements but may be disclosed, are possible obligations as a result of uncertain future events outside of our control, or present obligations not recognized because the amount cannot be sufficiently measured or payment is not probable.
Accounting Estimates and Judgments
| In millions of US dollars except as otherwise noted | Nutrien Annual Report 2019 | 127 |
| Overview | Management’s Discussion & Analysis | Two Year Highlights | Financial Statements |
Other Information |
Note 30 Contingencies and Other Matters Continued
Supporting Information
| 128 | Nutrien Annual Report 2019 | In millions of US dollars except as otherwise noted |
| Overview | Management’s Discussion & Analysis | Two Year Highlights | Financial Statements |
Other Information |
Note 30 Contingencies and Other Matters Continued
Note 31 Accounting Policies, Estimates and Judgments
Accounting Policies, Estimates and Judgments
The following table discusses the significant accounting policies, estimates, judgments and assumptions, in addition to those disclosed elsewhere in these consolidated financial statements, that we have adopted and made and how they affect the amounts reported in the consolidated financial statements. Certain of our policies involve accounting estimates and judgments because they require us to make subjective or complex judgments about matters that are inherently uncertain and because of the likelihood that materially different amounts could be reported under different conditions or using different assumptions.
| Topic |
Accounting Policies |
Accounting Estimates and Judgments | ||||
| Principles of Consolidation |
These consolidated financial statements include the accounts of the Company and entities we control. We have control if we have:
• power over the investee to direct its relevant activities;
• exposure, or rights, to variable returns from involvement with the investee; and
• the ability to use our power over the investee to affect the amount of our returns. |
Judgment involves:
• assessing control, including if we have the power to direct the relevant activities of the investee; and
• determining the relevant activities and the party that controls them.
Consideration is given to:
• voting rights;
• the relative size and dispersion of the voting rights held by other shareholders;
• the extent of participation by those shareholders in appointing key management personnel or board members;
• the right to direct the investee to enter into transactions for our benefit; and
• the exposure, or rights, to variability of returns from the Company’s involvement with the investee. | ||||
|
The existence and effect of potential voting rights that are currently exercisable or convertible are considered when assessing whether we control another entity.
Subsidiaries are fully consolidated from the date on which control is transferred to the Company. They are deconsolidated from the date that control ceases. | ||||||
|
|
|
| ||||
| In millions of US dollars except as otherwise noted | Nutrien Annual Report 2019 | 129 |
| Overview | Management’s Discussion & Analysis | Two Year Highlights | Financial Statements |
Other Information |
Note 31 Accounting Policies, Estimates and Judgments Continued
| Topic |
Accounting Policies |
Accounting Estimates and Judgments | ||||
| Principles of Consolidation (continued) |
Principal (wholly owned) Operating Subsidiaries: |
Location |
Principal Activity | |||
|
|
|
| ||||
| Potash Corporation of |
Canada |
Mining and/or processing of crop nutrient products and corporate functions | ||||
| Agrium Inc. |
Canada |
Manufacturer and distributor of crop nutrients and corporate functions | ||||
| Agrium Canada Partnership |
Canada |
Manufacturer and distributor of crop nutrients | ||||
| Agrium Potash Ltd. |
Canada |
Manufacturer and distributor of crop nutrients | ||||
| Agrium U.S. Inc. |
United States |
Manufacturer and distributor of crop nutrients | ||||
| Cominco Fertilizer Partnership |
United States |
Manufacturer and distributor of crop nutrients | ||||
| Landmark Operations Ltd. |
Australia |
Crop input retailer | ||||
| Nutrien Ag Solutions (Canada) Inc. |
Canada |
Crop input retailer | ||||
| Nutrien Ag Solutions, Inc. |
United States |
Crop input retailer | ||||
| PCS Nitrogen Fertilizer, LP |
United States |
Production of nitrogen products in the United States | ||||
| PCS Nitrogen Trinidad Limited |
Trinidad |
Production of nitrogen products in Trinidad | ||||
| PCS Phosphate Company, Inc. |
United States |
Mining and/or processing of phosphate products | ||||
| Phosphate Holding Company, Inc. |
United States |
Mining and/or processing of phosphate products and production of nitrogen products in the United States | ||||
|
Intercompany balances and transactions are eliminated on consolidation. | ||||||
|
|
|
| ||||
| Long-Lived Asset Impairment |
To assess impairment, assets are grouped at the smallest levels for which there are separately identifiable cash inflows that are largely independent of the cash inflows from other assets or groups of assets (this can be at the asset or CGU level).
At the end of each reporting period, we review conditions to determine whether there is any indication that an impairment exists that could potentially impact the carrying amounts of both our long-lived assets (including property, plant and equipment, and investments) to be held and used and our identifiable intangible assets and goodwill. When such indicators exist, impairment testing is performed. Regardless, goodwill is tested at least annually (in the fourth quarter).
Where impairment indicators exist for the asset or CGU:
• the recoverable amount is estimated (the higher of FVLCD and value in use);
• to assess value in use, the estimated future cash flows are discounted to their present value (using a pre-tax discount rate that reflects current market assessments of the time value of money and the risks specific to the asset or CGU for which the estimates of future cash flows have not been adjusted);
• the impairment loss is the amount by which the carrying amount exceeds its recoverable amount; and |
Estimates and judgment involves:
• identifying the appropriate asset or CGU;
• determining the appropriate discount rate for assessing the recoverable amount; and
• making assumptions about future sales, market conditions, terminal growth rates and cash flow forecasts over the long-term life of the assets or CGUs.
We cannot predict if an event that triggers impairment will occur, when it will occur or how it will affect reported asset amounts. Asset impairment amounts previously recorded could be affected if different assumptions were used or if market and other conditions change. Such changes could result in non-cash charges materially affecting our consolidated financial statements.
Impairments were recognized during 2019 and 2018 as shown in Note 15 and Note 16.
At December 31, 2019, we reviewed our Phosphate CGUs for impairment triggers. For our Aurora CGU, we used judgment in assessing possible indicators of impairment including expected mine life, supply and demand variables and expected benchmark prices. Based on our assessment, there were no impairment triggers. For our White Springs CGU, we identified an impairment trigger due to deteriorating price expectations and the expected remaining mine life. We completed an impairment analysis and determined that there was no impairment in excess of the $250 impairment loss previously recorded at December 31, 2017. | ||||
|
|
|
| ||||
| 130 | Nutrien Annual Report 2019 | In millions of US dollars except as otherwise noted |
| Overview | Management’s Discussion & Analysis | Two Year Highlights | Financial Statements |
Other Information |
Note 31 Accounting Policies, Estimates and Judgments Continued
| Topic |
Accounting Policies |
Accounting Estimates and Judgments |
||||||||||
| Long-Lived Asset Impairment (continued) |
• the impairment loss is allocated first to reduce the carrying amount of any related goodwill and then pro rata to each asset in the unit (on the basis of the carrying amount).
Non-financial assets, other than goodwill, that previously suffered an impairment loss are reviewed at each reporting date for possible reversal of the impairment. |
The following table highlights for White Springs CGU sensitivities to the recoverable amount which could result in additional impairment losses or reversals of previously recorded losses:
|
| |||||||||
| Key Assumptions |
Potential Change (percent) |
Increase (Decrease) to Recoverable Amount |
||||||||||
| Sales prices |
±1.0 | ±20 | ||||||||||
| Forecasted EBITDA over forecast period |
±5.0 | ±20 | ||||||||||
| Discount rate |
±0.5 | ±10 | ||||||||||
|
|
|
|
|
|
||||||||
|
|
|
|
||||||||||
| Fair Value Measurements |
Fair value measurements are categorized into levels based on the degree to which inputs are observable and their significance:
• Level 1 – Unadjusted quoted prices (in active markets accessible at the measurement date for identical assets or liabilities).
• Level 2 – Quoted prices (in markets that are not active or based on inputs that are observable for substantially the full term of the asset or liability).
• Level 3 – Prices or valuation techniques that require inputs that are both unobservable and significant to the overall measurement. |
Fair value estimates:
• are at a point-in-time and may change in subsequent reporting periods due to market conditions or other factors;
• can be determined using multiple methods, which can cause values (or a range of reasonable values) to differ; and
• may require assumptions about costs/prices over time, discount and inflation rates, defaults and other relevant variables.
Determination of the level hierarchy is based on our assessment of the lowest level input that is significant to the fair value measurement and is subject to estimation and judgment. | ||||
|
|
|
| ||||
| Restructuring Charges |
Plant shutdowns, sales of business units or other corporate restructurings may trigger restructuring charges. Incremental costs for employee termination, contract termination and other exit costs are recognized as a liability and an expense when:
• a detailed formal plan for restructuring has been demonstrably committed to;
• withdrawal is without realistic possibility; and
• a reliable estimate can be made. |
Restructuring activities are complex, can take several months to complete and usually involve reassessing estimates throughout the process. | ||||
|
|
|
| ||||
| Foreign Currency Transactions |
Items included in our consolidated financial statements and those of our subsidiaries are measured using the currency of the primary economic environment in which the individual entity operates (the “functional currency”).
|
The consolidated financial statements are presented in US dollars, which was determined to be the functional currency of the Company and the majority of our subsidiaries. In determining the functional currency of our operations, we primarily considered the currency that determines the pricing of transactions rather than focusing on the currency in which transactions are denominated. | ||||
|
|
|
| ||||
| In millions of US dollars except as otherwise noted | Nutrien Annual Report 2019 | 131 |
| Overview | Management’s Discussion & Analysis | Two Year Highlights | Financial Statements |
Other Information |
Note 31 Accounting Policies, Estimates and Judgments Continued
| Topic |
Accounting Policies |
Accounting Estimates and Judgments | ||||
| Foreign Currency Transactions (continued) |
Foreign exchange gains and losses resulting from the settlement of foreign currency transactions, and from the translation at period-end of monetary assets and liabilities denominated in foreign currencies, are recognized and presented in the consolidated statements of earnings within other expenses, as applicable, in the period in which they arise.
Translation differences from non-monetary assets and liabilities carried at fair value are recognized changes in fair value. Translation differences on non-monetary financial assets such as investments in equity securities classified as FVTOCI are included in OCI. Non-monetary assets measured at historical cost are translated at the average monthly exchange rate prevailing at the time of the transaction, unless the exchange rate in effect on the date of the transaction is available and it is apparent that such rate is a more suitable measurement. |
|||||
|
|
|
| ||||
Standards, Amendments and Interpretations Effective and Applied
The International Accounting Standards Board (“IASB”) and IFRS Interpretations Committee (“IFRIC”) have issued certain standards and amendments or interpretations to existing standards that were effective and we have applied. The standards disclosed below had a material impact or disclosure impact on our consolidated financial statements.
| Standard |
Description |
Impact | ||
| IFRS 16, Leases |
Issued to supersede IAS 17 and related standards, we are required to apply a new model for lessee accounting under which all leases will be recorded as a ROU asset on the balance sheet and a corresponding lease liability. Lease costs will be recognized in the income statement over the lease term as depreciation of the ROU asset and finance charges on the lease liability.
ROU assets represent the right to use an asset for the lease term, and lease liabilities represent the obligation to make lease payments arising from a lease. ROU assets and liabilities are recognized at commencement of a lease based on the present value of lease payments over the lease term. The standard requires capitalizing the lease payments and expected residual value guarantees over the initial non-cancellable period plus periods covered by renewal, purchase and termination options where such are reasonably certain of exercise. The standard requires capitalization using the interest rate implicit in the lease at commencement, or if the implicit rate is not available, an incremental borrowing rate, adjusted for term, security, asset value, and the borrower’s economic environment. |
We adopted IFRS 16 effective January 1, 2019, using the modified retrospective method, which in our case resulted in prospective application as there was no impact to opening retained earnings on transition. Under this method of adoption, we measured the ROU asset equal to the lease liability and used our incremental borrowing rate to determine the present value of future lease payments. We have chosen to apply practical expedients, including the use of a single discount rate for a portfolio of leases with reasonably similar characteristics, reliance on previous assessments as to whether lease contracts are onerous, exclusion of initial direct costs in measuring ROU assets at the date of initial application, the election not to separate non-lease components and instead to account for lease and non-lease components as a single arrangement, recognition exemptions for short-term and low-value leases, use of hindsight in assessing lease terms and grandfathering of the lease definition on transition.
Until January 1, 2019, substantially all of our leases were classified as operating leases under IAS 17, “Leases”, with payments expensed on a straight-line basis over the lease term. | ||
|
|
|
|
| 132 | Nutrien Annual Report 2019 | In millions of US dollars except as otherwise noted |
| Overview | Management’s Discussion & Analysis | Two Year Highlights | Financial Statements |
Other Information |
Note 31 Accounting Policies, Estimates and Judgments Continued
IFRS 16, Leases (continued)
The following table summarizes the impact of adopting IFRS 16 on the consolidated financial statements:
|
|
December 31, 2018 |
IFRS 16 Adjustment |
January 1, 2019 | |||||||||
| Property, plant and equipment – ROU assets 1 | 46 | 1,059 | 1,105 | |||||||||
| Lease liabilities, including current portion | 20 | 1,059 | 1,079 | |||||||||
|
|
|
|
|
|
|
|
||||||
| Undiscounted operating lease commitments at December 31, 2018 | 1,087 | |||||||||||
| Operating lease commitments that did not qualify as leases under IFRS 16 | (150) | |||||||||||
| Extension options reasonably certain to be exercised | 297 | |||||||||||
| Effect of discounting using the incremental borrowing rate at January 1, 2019 2 | (175) | |||||||||||
|
|
|
|
|
|
|
|
||||||
| Discounted operating lease commitments at January 1, 2019 2 | 1,059 | |||||||||||
| Finance lease liabilities at December 31, 2018 | 20 | |||||||||||
|
|
|
|
|
|
|
|
||||||
| Total lease liabilities at January 1, 2019 | 1,079 | |||||||||||
|
|
|
|
|
|
|
|
||||||
| 1 | Balances as at December 31, 2018 reflect finance leases that were included in property, plant and equipment. |
| 2 | When measuring lease liabilities, we discounted lease payments using our incremental borrowing rate at January 1, 2019. The weighted average rate applied was 3.52 percent. |
Refer to Note 15 and Note 21 for additional information relating the adoption of IFRS 16.
We have adopted the following amended standards and interpretations with no material impact on our consolidated financial statements:
Standards, Amendments and Interpretations Not Yet Effective and Not Applied
| In millions of US dollars except as otherwise noted | Nutrien Annual Report 2019 | 133 |


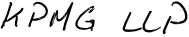
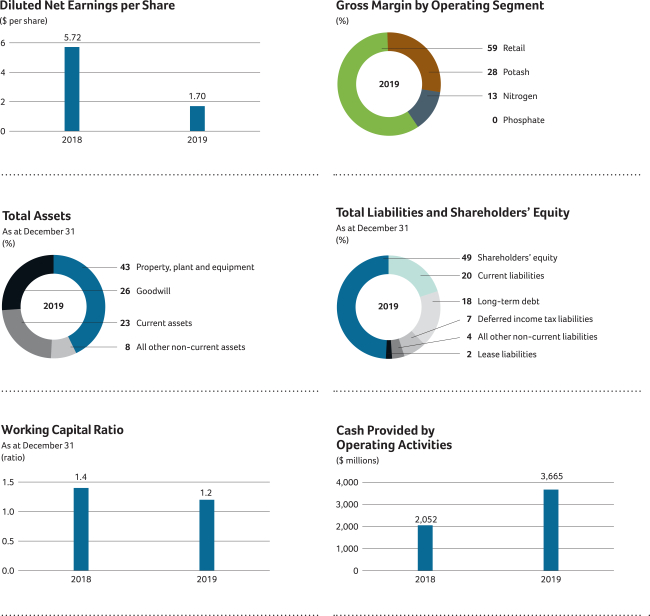
 Find out more at nutrien.com