Nutrien Annual Report 2021 |
In millions of US dollars unless otherwise noted
2021 AT A GLANCE
|
|
|
|
|
|
|
|
|
Nutrien Annual Report 2021 |
.3
FINANCIAL STATEMENTS & NOTES
| Management’s Responsibility |
72 | |
| Reports of Independent Registered Public Accounting Firm |
73 | |
| 2021 At a Glance |
76 | |
| Consolidated Statements of Earnings |
77 | |
| Consolidated Statements of Comprehensive Income |
77 | |
| Consolidated Statements of Cash Flows |
78 | |
| Consolidated Statements of Changes in Shareholders’ Equity |
79 | |
| Consolidated Balance Sheets |
80 | |
| Notes to the Consolidated Financial Statements |
| |
| Note 1 |
Description Of Business |
81 |
| Note 2 |
Basis Of Presentation |
81 |
| Note 3 |
Segment Information |
82 |
| Note 4 |
Nature Of Expenses |
85 |
| Note 5 |
Share-Based Compensation |
86 |
| Note 6 |
Other Expenses (Income) |
88 |
| Note 7 |
Finance Costs |
88 |
| Note 8 |
Income Taxes |
89 |
| Note 9 |
Net Earnings Per Share |
91 |
| Note 10 |
Financial Instruments And Related Risk Management |
92 |
| Note 11 |
Receivables |
96 |
| Note 12 |
Inventories |
97 |
| Note 13 |
Property, Plant And Equipment |
97 |
| Note 14 |
Goodwill And Other Intangible Assets |
100 |
| Note 15 |
Investments |
102 |
| Note 16 |
Other Assets |
102 |
| Note 17 |
Short-Term Debt |
103 |
| Note 18 |
Long-Term Debt |
104 |
| Note 19 |
Lease Liabilities |
106 |
| Note 20 |
Payables And Accrued Charges |
106 |
| Note 21 |
Pension And Other Post-Retirement Benefits |
107 |
| Note 22 |
Asset Retirement Obligations And Accrued Environmental Costs |
110 |
| Note 23 |
Share Capital |
111 |
| Note 24 |
Capital Management |
113 |
| Note 25 |
Business Combinations |
114 |
| Note 26 |
Commitments |
116 |
| Note 27 |
Guarantees |
117 |
| Note 28 |
Related Party Transactions |
117 |
| Note 29 |
Contingencies And Other Matters |
118 |
| Note 30 |
Accounting Policies, Estimates And Judgments |
120 |
Nutrien Annual Report 2021 | 72
MANAGEMENT’S RESPONSIBILITY
Management’s Responsibility for Financial Reporting
Management’s Report on the Consolidated Financial Statements
The accompanying consolidated financial statements and related financial information are the responsibility of the management of Nutrien Ltd. (the “Company”). They have been prepared in accordance with International Financial Reporting Standards (“IFRS”) as issued by the International Accounting Standards Board and include amounts based on estimates and judgments. Financial information included elsewhere in this report is consistent with the consolidated financial statements.
The consolidated financial statements are approved by the Board of Directors on the recommendation of the audit committee. The audit committee, appointed by the Board of Directors, is composed entirely of independent directors. The audit committee discusses and analyzes the Company’s condensed consolidated financial statements and Management’s Discussion and Analysis (“MD&A”) with management before such information is approved by the committee and submitted to securities commissions or other regulatory authorities. The audit committee and management also analyze the annual consolidated financial statements and MD&A prior to their approval by the Board of Directors.
The audit committee’s duties also include reviewing critical accounting policies and significant estimates and judgments underlying the consolidated financial statements as presented by management and approving the fees of our independent registered public accounting firm.
Our independent registered public accounting firm, KPMG LLP, performs an audit of the consolidated financial statements, the results of which are reflected in their Report of Independent Registered Public Accounting Firm for 2021. KPMG LLP has full and independent access to the audit committee to discuss their audit and related matters.
Management’s Annual Report on Internal Control over Financial Reporting
Management is responsible for establishing and maintaining adequate internal control over financial reporting, as defined in Rules 13a-15(f) and 15d-15(f) of the Securities Exchange Act of 1934, as amended, and National Instrument 52-109 – Certification of Disclosure in Issuers’ Annual and Interim Filings . Internal control over financial reporting is designed to provide reasonable assurance regarding the reliability of financial reporting and preparation of financial statements for external purposes in accordance with IFRS.
Under our supervision and with the participation of management, the Company conducted an evaluation of the design and effectiveness of our internal control over financial reporting as of the end of the fiscal year covered by this report, based on the framework issued by the Committee of Sponsoring Organizations of the Treadway Commission in Internal Control – Integrated Framework (2013). Based on this evaluation, management concluded that, as of December 31, 2021, the Company did maintain effective internal control over financial reporting.
The effectiveness of the Company’s internal control over financial reporting as at December 31, 2021 has been audited by KPMG LLP, as reflected in their Report of Independent Registered Public Accounting Firm for 2021.
|
/s/ Ken Seitz
Ken Seitz Interim President and Chief Executive Officer February 17, 2022 |
/s/ Pedro Farah
Pedro Farah Executive Vice President and Chief Financial Officer February 17, 2022 |
Nutrien Annual Report 2021 | 73
REPORT OF INDEPENDENT REGISTERED PUBLIC ACCOUNTING FIRM
To the Shareholders and Board of Directors of Nutrien Ltd.
Opinion on Internal Control Over Financial Reporting
We have audited Nutrien Ltd. and subsidiaries’ (the “Company”) internal control over financial reporting as of December 31, 2021, based on criteria established in Internal Control – Integrated Framework (2013) issued by the Committee of Sponsoring Organizations of the Treadway Commission. In our opinion, the Company maintained, in all material respects, effective internal control over financial reporting as of December 31, 2021, based on criteria established in Internal Control – Integrated Framework (2013) issued by the Committee of Sponsoring Organizations of the Treadway Commission.
We also have audited, in accordance with the standards of the Public Company Accounting Oversight Board (United States) (“PCAOB”), the consolidated balance sheets of the Company as of December 31, 2021 and 2020, the related consolidated statements of earnings, comprehensive income, cash flows, and changes in shareholders’ equity for the years then ended, and the related notes (collectively, the “consolidated financial statements”), and our report dated February 17, 2022 expressed an unqualified opinion on those consolidated financial statements.
Basis for Opinion
The Company’s management is responsible for maintaining effective internal control over financial reporting and for its assessment of the effectiveness of internal control over financial reporting, included in the accompanying Management’s Annual Report on Internal Control over Financial Reporting. Our responsibility is to express an opinion on the Company’s internal control over financial reporting based on our audit. We are a public accounting firm registered with the PCAOB and are required to be independent with respect to the Company in accordance with the US federal securities laws and the applicable rules and regulations of the Securities and Exchange Commission and the PCAOB.
We conducted our audit in accordance with the standards of the PCAOB. Those standards require that we plan and perform the audit to obtain reasonable assurance about whether effective internal control over financial reporting was maintained in all material respects. Our audit of internal control over financial reporting included obtaining an understanding of internal control over financial reporting, assessing the risk that a material weakness exists, and testing and evaluating the design and operating effectiveness of internal control based on the assessed risk. Our audit also included performing such other procedures as we considered necessary in the circumstances. We believe that our audit provides a reasonable basis for our opinion.
Definition and Limitations of Internal Control Over Financial Reporting
A company’s internal control over financial reporting is a process designed to provide reasonable assurance regarding the reliability of financial reporting and the preparation of financial statements for external purposes in accordance with generally accepted accounting principles. A company’s internal control over financial reporting includes those policies and procedures that (1) pertain to the maintenance of records that, in reasonable detail, accurately and fairly reflect the transactions and dispositions of the assets of the company; (2) provide reasonable assurance that transactions are recorded as necessary to permit preparation of financial statements in accordance with generally accepted accounting principles, and that receipts and expenditures of the company are being made only in accordance with authorizations of management and directors of the company; and (3) provide reasonable assurance regarding prevention or timely detection of unauthorized acquisition, use, or disposition of the company’s assets that could have a material effect on the financial statements.
Because of its inherent limitations, internal control over financial reporting may not prevent or detect misstatements. Also, projections of any evaluation of effectiveness to future periods are subject to the risk that controls may become inadequate because of changes in conditions, or that the degree of compliance with the policies or procedures may deteriorate.
/s/ KPMG LLP
Chartered Professional Accountants
Calgary, Canada
February 17, 2022
Nutrien Annual Report 2021 | 74
REPORT OF INDEPENDENT REGISTERED PUBLIC ACCOUNTING FIRM
To the Shareholders and Board of Directors of Nutrien Ltd.
Opinion on the Consolidated Financial Statements
We have audited the accompanying consolidated balance sheets of Nutrien Ltd. and subsidiaries (the “Company”) as of December 31, 2021 and 2020, the related consolidated statements of earnings, comprehensive income, cash flows, and changes in shareholders’ equity for the years then ended, and the related notes (collectively, the “consolidated financial statements”). In our opinion, the consolidated financial statements present fairly, in all material respects, the financial position of the Company as of December 31, 2021 and 2020, and its financial performance and its cash flows for the years then ended, in conformity with International Financial Reporting Standards as issued by the International Accounting Standards Board.
We also have audited, in accordance with the standards of the Public Company Accounting Oversight Board (United States) (“PCAOB”), the Company’s internal control over financial reporting as of December 31, 2021, based on criteria established in Internal Control – Integrated Framework (2013) issued by the Committee of Sponsoring Organizations of the Treadway Commission, and our report dated February 17, 2022 expressed an unqualified opinion on the effectiveness of the Company’s internal control over financial reporting.
Basis for Opinion
These consolidated financial statements are the responsibility of the Company’s management. Our responsibility is to express an opinion on these consolidated financial statements based on our audits. We are a public accounting firm registered with the PCAOB and are required to be independent with respect to the Company in accordance with the US federal securities laws and the applicable rules and regulations of the Securities and Exchange Commission and the PCAOB.
We conducted our audits in accordance with the standards of the PCAOB. Those standards require that we plan and perform the audit to obtain reasonable assurance about whether the consolidated financial statements are free of material misstatement, whether due to error or fraud. Our audits included performing procedures to assess the risks of material misstatement of the consolidated financial statements, whether due to error or fraud, and performing procedures that respond to those risks. Such procedures included examining, on a test basis, evidence regarding the amounts and disclosures in the consolidated financial statements. Our audits also included evaluating the accounting principles used and significant estimates made by management, as well as evaluating the overall presentation of the consolidated financial statements. We believe that our audits provide a reasonable basis for our opinion.
Critical Audit Matters
The critical audit matters communicated below are matters arising from the current period audit of the consolidated financial statements that were communicated or required to be communicated to the audit committee and that: (1) relate to accounts or disclosures that are material to the consolidated financial statements and (2) involved our especially challenging, subjective, or complex judgments. The communication of critical audit matters does not alter in any way our opinion on the consolidated financial statements, taken as a whole, and we are not, by communicating the critical audit matters below, providing separate opinions on the critical audit matters or on the accounts or disclosures to which they relate.
Nutrien Annual Report 2021 | 75
Goodwill Impairment Assessment of the Retail North America Group of Cash-Generating Units
As discussed in Note 14 to the consolidated financial statements, the carrying amount of goodwill as of December 31, 2021 was $12,220 million, of which $6,898 million of goodwill has been allocated to the Retail North America group of cash-generating units (“Retail North America CGU”). The Retail North America CGU is tested for impairment annually, and whenever events or changes in circumstances may indicate the carrying amount, including goodwill, exceeds its estimated recoverable amount. The calculation of the recoverable amount of the Retail North America CGU involved estimates including forecasted earnings before tax, interest, depreciation and amortization (“EBITDA”), terminal growth rate and the discount rate.
We identified the calculation of the recoverable amount of goodwill for the Retail North America CGU as a critical audit matter. A high degree of auditor judgment was required to evaluate the Company’s forecasted EBITDA, terminal growth rate and discount rate used to calculate the recoverable amount of the Retail North America CGU. Minor changes to these assumptions could have had a significant effect on the Company’s calculation of the recoverable amount of the Retail North America CGU. Additionally, the audit effort associated with this estimate required specialized skills and knowledge.
The following are the primary procedures we performed to address this critical audit matter. We evaluated the design and tested the operating effectiveness of certain internal controls related to the calculation of the recoverable amount of goodwill for the Retail North America CGU. This included controls related to the determination of forecasted EBITDA, terminal growth rate and the discount rate. We evaluated the Company’s forecasted EBITDA for the Retail North America CGU by comparing to historical results and forecasted planted acreage in the United States. We evaluated the terminal growth rate by comparing to the historical growth of the Retail North America CGU and to market information, including forecasted inflation and forecasted gross domestic product in the United States. We evaluated the Company’s historical forecasts of EBITDA by comparing to actual results to assess the Company’s ability to accurately forecast. In addition, we involved valuation professionals with specialized skills and knowledge, who assisted in:
/s/ KPMG LLP
Chartered Professional Accountants
We have served as the Company’s auditor since 2018.
Calgary, Canada
February 17, 2022
Nutrien Annual Report 2021 | 76
In millions of US dollars unless otherwise noted
Nutrien Annual Report 2021 |
In millions of US dollars unless otherwise noted
2021 AT A GLANCE
|
|
|
|
|
|
|
|
|
Nutrien Annual Report 2021 | 77
In millions of US dollars unless otherwise noted
CONSOLIDATED FINANCIAL STATEMENTS
CONSOLIDATED STATEMENTS OF EARNINGS
| For the years ended December 31 |
Note |
2021 |
|
2020 |
| SALES |
3 |
|
|
|
| Freight, transportation and distribution |
4 |
|
|
|
| Cost of goods sold |
4, 12 |
|
|
|
| GROSS MARGIN |
|
|
|
|
| Selling expenses |
4 |
|
|
|
| General and administrative expenses |
4 |
|
|
|
| Provincial mining taxes |
4 |
|
|
|
| Share-based compensation |
5 |
|
|
|
| Impairment of assets |
13, 14 |
|
|
|
| Other expenses (income) |
6 |
|
|
( |
| EARNINGS BEFORE FINANCE COSTS AND INCOME TAXES |
|
|
|
|
| Finance costs |
7 |
|
|
|
| EARNINGS BEFORE INCOME TAXES |
|
|
|
|
| Income tax expense (recovery) |
8 |
|
|
( |
| NET EARNINGS |
|
|
|
|
| Attributable to |
|
|
|
|
| Equity holders of Nutrien |
|
|
|
|
| Non-controlling interest |
|
|
|
|
| NET EARNINGS |
|
|
|
|
|
|
|
|
|
|
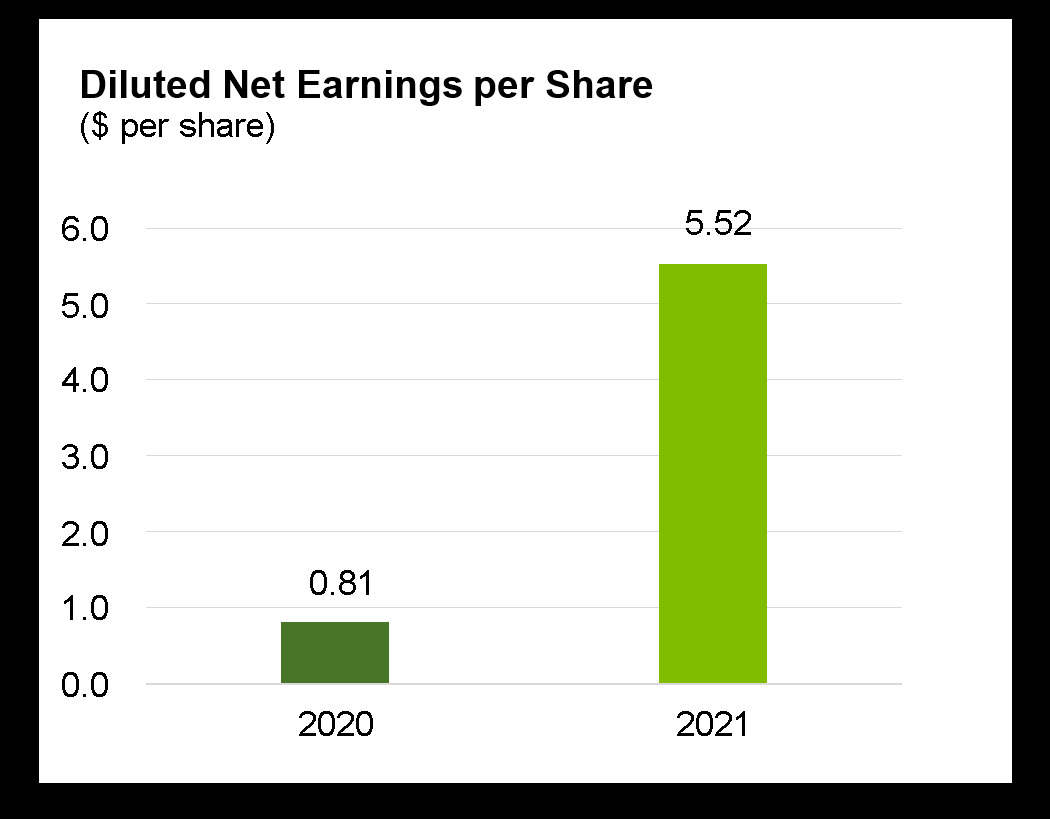
| NET EARNINGS PER SHARE ATTRIBUTABLE TO EQUITY HOLDERS OF NUTRIEN ("EPS") |
9 |
|
|
|
| Basic |
|
|
|
|
| Diluted |
|
|
|
|
| Weighted average shares outstanding for basic EPS |
9 |
|
|
|
| Weighted average shares outstanding for diluted EPS |
9 |
|
|
|
|
|
|
|
|
|
CONSOLIDATED STATEMENTS OF COMPREHENSIVE INCOME
| For the years ended December 31 (net of related income taxes) |
Note |
2021 |
|
2020 |
| NET EARNINGS |
|
|
|
|
| Other comprehensive income |
|
|
|
|
| Items that will not be reclassified to net earnings: |
|
|
|
|
| Net actuarial gain on defined benefit plans |
21 |
|
|
|
| Net fair value gain (loss) on investments |
15 |
|
|
( |
| Items that have been or may be subsequently reclassified to net earnings: |
|
|
|
|
| (Loss) gain on currency translation of foreign operations |
|
( |
|
|
| Other |
|
|
|
( |
| OTHER COMPREHENSIVE INCOME |
|
|
|
|
| COMPREHENSIVE INCOME |
|
|
|
|
| Attributable to |
|
|
|
|
| Equity holders of Nutrien |
|
|
|
|
| Non-controlling interest |
|
|
|
|
| COMPREHENSIVE INCOME |
|
|
|
|
|
|
|
|
|
|
|
|
|
|
|
|
| (See Notes to the Consolidated Financial Statements) |
|
|
|
|
Nutrien Annual Report 2021 | 78
In millions of US dollars unless otherwise noted
CONSOLIDATED STATEMENTS OF CASH FLOWS
| For the years ended December 31 |
Note |
2021 |
|
2020 |
|
|
|
|
|
|
| OPERATING ACTIVITIES |
|
|
|
|
| Net earnings |
|
|
|
|
| Adjustments for: |
|
|
|
|
| Depreciation and amortization |
|
|
|
|
| Share-based compensation expense |
5 |
|
|
|
| Impairment of assets |
13 |
|
|
|
| Loss on early extinguishment of debt |
|
|
|
|
| Net gain on disposal of investment in Misr Fertilizers Production Company S.A.E. ("MOPCO") |
6 |
|
|
( |
| Recovery of deferred income tax |
|
( |
|
( |
| Cloud computing transition adjustment |
6 |
|
|
|
| Other long-term assets, liabilities and miscellaneous |
16 |
|
|
( |
| Cash from operations before working capital changes |
|
|
|
|
| Changes in non-cash operating working capital: |
|
|
|
|
| Receivables |
|
( |
|
|
| Inventories |
|
( |
|
|
| Prepaid expenses and other current assets |
|
( |
|
( |
| Payables and accrued charges |
|
|
|
|
| CASH PROVIDED BY OPERATING ACTIVITIES |
|
|
|
|
| INVESTING ACTIVITIES |
|
|
|
|
| Capital expenditures 1 |
13, 14 |
( |
|
( |
| Business acquisitions, net of cash acquired |
25 |
( |
|
( |
| Proceeds from disposal of investment in MOPCO |
6 |
|
|
|
| Other |
|
|
|
|
| CASH USED IN INVESTING ACTIVITIES |
|
( |
|
( |
| FINANCING ACTIVITIES |
|
|
|
|
| Transaction costs related to debt |
|
( |
|
( |
| Proceeds from (repayment of) short-term debt, net |
17 |
|
|
( |
| Proceeds from long-term debt |
18 |
|
|
|
| Repayment of long-term debt |
18 |
( |
|
( |
| Repayment of principal portion of lease liabilities |
18, 19 |
( |
|
( |
| Dividends paid to Nutrien's shareholders |
23 |
( |
|
( |
| Repurchase of common shares |
23 |
( |
|
( |
| Issuance of common shares |
23 |
|
|
|
| Other |
|
( |
|
|
| CASH USED IN FINANCING ACTIVITIES |
|
( |
|
( |
| EFFECT OF EXCHANGE RATE CHANGES ON CASH AND CASH EQUIVALENTS |
|
( |
|
|
| (DECREASE) INCREASE IN CASH AND CASH EQUIVALENTS |
|
( |
|
|
| CASH AND CASH EQUIVALENTS – BEGINNING OF YEAR |
|
|
|
|
| CASH AND CASH EQUIVALENTS – END OF YEAR |
|
|
|
|
| Cash and cash equivalents comprised of: |
|
|
|
|
| Cash |
|
|
|
|
| Short-term investments |
|
|
|
|
|
|
|
|
|
|
| SUPPLEMENTAL CASH FLOWS INFORMATION |
|
|
|
|
| Interest paid |
|
|
|
|
| Income taxes paid |
|
|
|
|
| Total cash outflow for leases |
|
|
|
|
1 Includes additions to property, plant and equipment and intangible assets of $ 1,676 and $ 107 (2020 – $ 1,423 and $ 126 ), respectively.
(See Notes to the Consolidated Financial Statements)
Nutrien Annual Report 2021 | 79
In millions of US dollars unless otherwise noted
CONSOLIDATED STATEMENTS OF CHANGES IN SHAREHOLDERS’ EQUITY
|
|
|
|
|
|
|
|
Accumulated Other Comprehensive |
|
|
|
|
|
|
| |||||
|
|
|
|
|
|
|
|
(Loss) Income ("AOCI") |
|
|
|
|
|
|
| |||||
|
|
|
|
|
|
|
|
Loss on |
|
|
|
|
|
|
|
Equity |
|
|
|
|
|
|
|
|
|
|
|
|
Currency |
|
|
|
|
|
|
|
Holders |
|
Non- |
|
|
|
|
Number of |
|
|
|
|
|
Translation |
|
|
|
|
|
|
|
of |
|
Controlling |
|
|
|
|
Common |
|
Share |
Contributed |
|
of Foreign |
|
|
|
Total |
|
Retained |
|
Nutrien |
|
Interest |
|
Total | |
|
|
Shares |
|
Capital |
|
Surplus |
|
Operations |
|
Other |
|
AOCI |
|
Earnings |
|
(Note 2) |
|
(Note 2) |
|
Equity |
| BALANCE – DECEMBER 31, 2019 |
|
|
|
|
|
|
( |
|
( |
|
( |
|
|
|
|
|
|
|
|
| Net earnings |
|
|
|
|
|
|
|
|
|
|
|
|
|
|
|
|
|
|
|
| Other comprehensive income |
|
|
|
|
|
|
|
|
|
|
|
|
|
|
|
|
|
|
|
| Shares repurchased (Note 23) |
( |
|
( |
|
( |
|
|
|
|
|
|
|
|
|
( |
|
|
|
( |
| Dividends declared (Note 23) |
|
|
|
|
|
|
|
|
|
|
|
|
( |
|
( |
|
|
|
( |
| Effect of share-based compensation including issuance of common shares |
|
|
|
|
|
|
|
|
|
|
|
|
|
|
|
|
|
|
|
| Transfer of net loss on cash flow hedges |
|
|
|
|
|
|
|
|
|
|
|
|
|
|
|
|
|
|
|
| Transfer of net actuarial gain on defined benefit plans |
|
|
|
|
|
|
|
|
( |
|
( |
|
|
|
|
|
|
|
|
| BALANCE – DECEMBER 31, 2020 |
|
|
|
|
|
|
( |
|
( |
|
( |
|
|
|
|
|
|
|
|
| Net earnings |
|
|
|
|
|
|
|
|
|
|
|
|
|
|
|
|
|
|
|
| Other comprehensive (loss) income |
|
|
|
|
|
|
( |
|
|
|
|
|
|
|
|
|
( |
|
|
| Shares repurchased (Note 23) |
( |
|
( |
|
( |
|
|
|
|
|
|
|
( |
|
( |
|
|
|
( |
| Dividends declared (Note 23) |
|
|
|
|
|
|
|
|
|
|
|
|
( |
|
( |
|
|
|
( |
| Non-controlling interest transactions |
|
|
|
|
|
|
|
|
|
|
|
|
|
|
|
|
( |
|
( |
| Effect of share-based compensation including issuance of common shares |
|
|
|
|
( |
|
|
|
|
|
|
|
|
|
|
|
|
|
|
| Transfer of net gain on cash flow hedges |
|
|
|
|
|
|
|
|
( |
|
( |
|
|
|
( |
|
|
|
( |
| Transfer of net actuarial gain on defined benefit plans |
|
|
|
|
|
|
|
|
( |
|
( |
|
|
|
|
|
|
|
|
| Share cancellation (Note 23) |
( |
|
|
|
|
|
|
|
|
|
|
|
|
|
|
|
|
|
|
| BALANCE – DECEMBER 31, 2021 |
|
|
|
|
|
|
( |
|
|
|
( |
|
|
|
|
|
|
|
|
|
|
|
|
|
|
|
|
|
|
|
|
|
|
|
|
|
|
|
|
|
| (See Notes to the Consolidated Financial Statements) | |||||||||||||||||||
Nutrien Annual Report 2021 | 80
In millions of US dollars unless otherwise noted
CONSOLIDATED BALANCE SHEETS
| As at December 31 |
Note |
2021 |
|
2020 |
|
|
|
|
|
Note 2 |
| ASSETS |
|
|
|
|
| Current assets |
|
|
|
|
| Cash and cash equivalents |
|
|
|
|
| Receivables |
11 |
|
|
|
| Inventories |
12 |
|
|
|
| Prepaid expenses and other current assets |
|
|
|
|
|
|
|
|
|
|
| Non-current assets |
|
|
|
|
| Property, plant and equipment |
13 |
|
|
|
| Goodwill |
14 |
|
|
|
| Other intangible assets |
14 |
|
|
|
| Investments |
15 |
|
|
|
| Other assets |
16 |
|
|
|
| TOTAL ASSETS |
|
|
|
|
| LIABILITIES |
|
|
|
|
| Current liabilities |
|
|
|
|
| Short-term debt |
17 |
|
|
|
| Current portion of long-term debt |
18 |
|
|
|
| Current portion of lease liabilities |
19 |
|
|
|
| Payables and accrued charges |
20 |
|
|
|
|
|
|
|
|
|
| Non-current liabilities |
|
|
|
|
| Long-term debt |
18 |
|
|
|
| Lease liabilities |
19 |
|
|
|
| Deferred income tax liabilities |
8 |
|
|
|
| Pension and other post-retirement benefit liabilities |
21 |
|
|
|
| Asset retirement obligations and accrued environmental costs |
22 |
|
|
|
| Other non-current liabilities |
|
|
|
|
| TOTAL LIABILITIES |
|
|
|
|
| SHAREHOLDERS’ EQUITY |
|
|
|
|
| Share capital |
23 |
|
|
|
| Contributed surplus |
|
|
|
|
| Accumulated other comprehensive loss |
|
( |
|
( |
| Retained earnings |
|
|
|
|
| Equity holders of Nutrien |
|
|
|
|
| Non-controlling interest |
|
|
|
|
| TOTAL SHAREHOLDERS’ EQUITY |
|
|
|
|
| TOTAL LIABILITIES AND SHAREHOLDERS’ EQUITY |
|
|
|
|
|
|
|
|
|
|
| (See Notes to the Consolidated Financial Statements) | ||||
Approved by the Board of Directors,
| /s/ Maura Clark
Director |
/s/ Christopher Burley
Director |
Nutrien Annual Report 2021 | 81
In millions of US dollars unless otherwise noted
NOTE 1 DESCRIPTION OF BUSINESS
Nutrien Ltd. (collectively with its subsidiaries, “Nutrien”, “we”, “us”, “our” or “the Company”) is the world’s largest provider of crop inputs and services. Nutrien plays a critical role in helping growers around the globe increase food production in a sustainable manner.
The Company is a corporation organized under the laws of Canada with its registered head office located at Suite 1700, 211 19th Street East, Saskatoon, Saskatchewan, Canada, S7K 5R6. As at December 31, 2021, the Company had assets as follows:
| Segment |
Description |
| Nutrien Ag Solutions (“Retail”) |
|
| Potash |
|
| Nitrogen |
|
| Phosphate |
|
| |
|
NOTE 2 BASIS OF PRESENTATION
We prepared these consolidated financial statements in accordance with International Financial Reporting Standards (“IFRS”) as issued by the International Accounting Standards Board (“IASB”). We have consistently applied the same accounting policies throughout all periods presented, as if these policies had always been in effect, with the exception of the accounting standards adopted effective January 1, 2021, as disclosed in Note 30.
Certain immaterial 2020 figures have been reclassified in the consolidated statements of changes in shareholders’ equity and consolidated balance sheets.
These consolidated financial statements were authorized for issue by the Board of Directors on February 17, 2022.
Sensitivity analyses included throughout the notes should be used with caution as the changes are hypothetical and not reflective of future performance. The sensitivities have been calculated independently of changes in other key variables. Changes in one factor may result in changes in another, which could increase or reduce certain sensitivities. We prepared these consolidated financial statements under the historical cost basis, except for items that IFRS requires to be measured at fair value. Details of our accounting policies are primarily disclosed in Note 30. Reference to n/a indicates information is not applicable.
Nutrien Annual Report 2021 | 82
In millions of US dollars unless otherwise noted
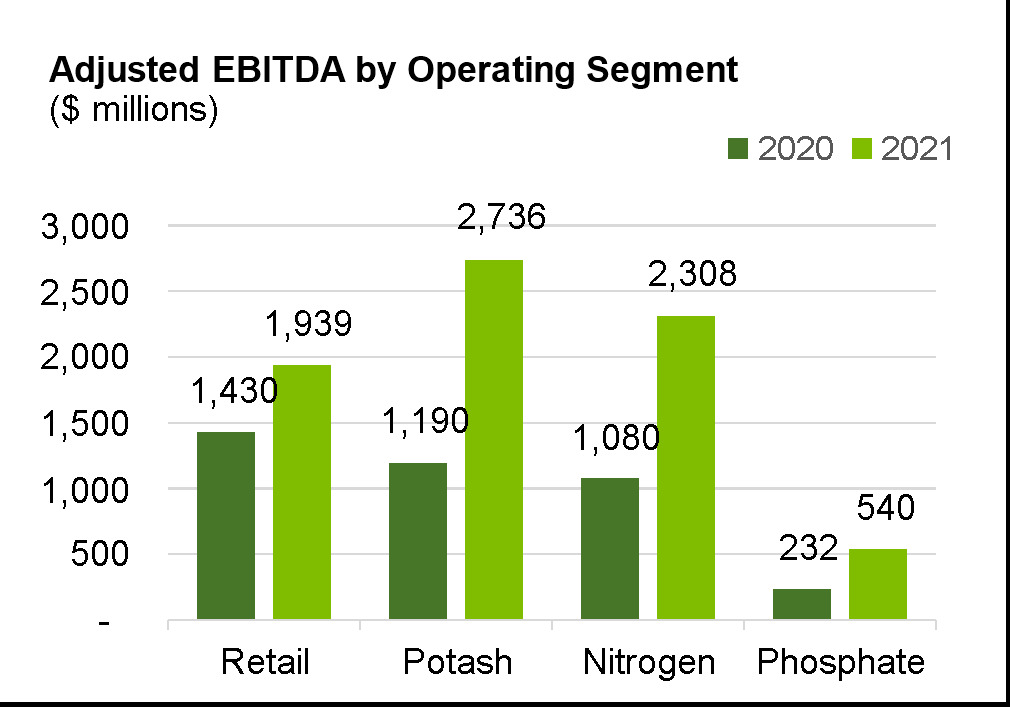
NOTE 3 SEGMENT INFORMATION
The Company has four reportable operating segments: Nutrien Ag Solutions (“Retail”), Potash, Nitrogen and Phosphate. The Retail segment distributes crop nutrients, crop protection products, seed and merchandise, and it provides services directly to growers through a network of farm centers in North America, South America and Australia. The Potash, Nitrogen and Phosphate segments are differentiated by the chemical nutrient contained in the products that each produces.
The Executive Leadership Team (“ELT”), comprised of officers at the Executive Vice President level and above, is the Chief Operating Decision Maker (“CODM”). The CODM uses adjusted net earnings (loss) before finance costs, income taxes, and depreciation and amortization (“adjusted EBITDA”) to measure performance and allocate resources to the operating segments. The CODM considers adjusted EBITDA to be a meaningful measure because it is not impacted by long-term investment and financing decisions, but rather focuses on the performance of our day-to-day operations. In addition, it excludes the impact of impairments and other costs that are centrally managed by our corporate function.
We determine the composition of the reportable segments based on factors including risks and returns, internal organization, and internal reports reviewed by the CODM. We allocate certain expenses across segments based on reasonable considerations such as production capacities or historical trends.
|
|
|
|
|
|
|
|
|
|
|
Corporate |
|
|
|
|
| 2021 |
|
Retail |
|
Potash |
|
Nitrogen |
|
Phosphate |
|
and Others |
|
Eliminations |
|
Consolidated |
| Sales |
– third party |
|
|
|
|
|
|
|
|
|
|
|
|
|
|
|
– intersegment |
|
|
|
|
|
|
|
|
|
|
( |
|
|
| Sales |
– total |
|
|
|
|
|
|
|
|
|
|
( |
|
|
| Freight, transportation and distribution |
|
|
|
|
|
|
|
|
|
|
( |
|
| |
| Net sales |
|
|
|
|
|
|
|
|
|
|
( |
|
| |
| Cost of goods sold |
|
|
|
|
|
|
|
|
|
|
( |
|
| |
| Gross margin |
|
|
|
|
|
|
|
|
|
|
( |
|
| |
| Selling expenses |
|
|
|
|
|
|
|
|
( |
|
|
|
| |
| General and administrative expenses |
|
|
|
|
|
|
|
|
|
|
|
|
| |
| Provincial mining taxes |
|
|
|
|
|
|
|
|
|
|
|
|
| |
| Share-based compensation expense |
|
|
|
|
|
|
|
|
|
|
|
|
| |
| Impairment of assets (Note 13) |
|
|
|
|
|
|
|
|
|
|
|
|
| |
| Other expenses (income) |
|
|
|
|
( |
|
|
|
|
|
|
|
| |
| Earnings (loss) before finance costs and income taxes |
|
|
|
|
|
|
|
|
( |
|
( |
|
| |
| Depreciation and amortization |
|
|
|
|
|
|
|
|
|
|
|
|
| |
| EBITDA 1 |
|
|
|
|
|
|
|
|
( |
|
( |
|
| |
| Integration and restructuring related costs |
|
|
|
|
|
|
|
|
|
|
|
|
| |
| Share-based compensation expense |
|
|
|
|
|
|
|
|
|
|
|
|
| |
| Impairment of assets (Note 13) |
|
|
|
|
|
|
|
|
|
|
|
|
| |
| COVID-19 coronavirus pandemic ("COVID-19") related expenses |
|
|
|
|
|
|
|
|
|
|
|
|
| |
| Foreign exchange loss, net of related derivatives |
|
|
|
|
|
|
|
|
|
|
|
|
| |
| Cloud computing transition adjustment (Note 6) |
|
|
|
|
|
|
|
|
|
|
|
|
| |
| Adjusted EBITDA |
|
|
|
|
|
|
|
|
( |
|
( |
|
| |
| Assets |
|
|
|
|
|
|
|
|
|
|
( |
|
| |
Nutrien Annual Report 2021 | 83
In millions of US dollars unless otherwise noted
|
|
|
|
|
|
|
|
|
|
|
Corporate |
|
|
|
|
| 2020 |
|
Retail |
|
Potash |
|
Nitrogen |
Phosphate |
|
and Others |
|
Eliminations |
|
Consolidated | |
| Sales |
– third party |
|
|
|
|
|
|
|
|
|
1 |
|
|
|
|
|
– intersegment |
|
|
|
|
|
|
|
|
|
|
( |
|
|
| Sales |
– total |
|
|
|
|
|
|
|
|
|
|
( |
|
|
| Freight, transportation and distribution |
|
|
|
|
|
|
|
|
|
|
( |
|
| |
| Net sales |
|
|
|
|
|
|
|
|
|
|
( |
|
| |
| Cost of goods sold |
|
|
|
|
|
|
|
|
|
|
( |
|
| |
| Gross margin |
|
|
|
|
|
|
|
|
|
|
|
|
| |
| Selling expenses |
|
|
|
|
|
|
|
|
( |
|
|
|
| |
| General and administrative expenses |
|
|
|
|
|
|
|
|
|
|
|
|
| |
| Provincial mining taxes |
|
|
|
|
|
|
|
|
|
|
|
|
| |
| Share-based compensation expense |
|
|
|
|
|
|
|
|
|
|
|
|
| |
| Impairment of assets (Note 13) |
|
|
|
|
|
|
|
|
|
|
|
|
| |
| Other expenses (income) |
|
|
|
|
( |
|
|
|
|
|
|
|
( | |
| Earnings (loss) before finance costs and income taxes |
|
|
|
|
|
|
( |
|
( |
|
|
|
| |
| Depreciation and amortization |
|
|
|
|
|
|
|
|
|
|
|
|
| |
| EBITDA |
|
|
|
|
|
|
( |
|
( |
|
|
|
| |
| Integration and restructuring related costs |
|
|
|
|
|
|
|
|
|
|
|
|
| |
| Share-based compensation expense |
|
|
|
|
|
|
|
|
|
|
|
|
| |
| Impairment of assets (Note 13) |
|
|
|
|
|
|
|
|
|
|
|
|
| |
| COVID-19 related expenses |
|
|
|
|
|
|
|
|
|
|
|
|
| |
| Foreign exchange loss, net of related derivatives |
|
|
|
|
|
|
|
|
|
|
|
|
| |
| Loss on disposal of business |
|
|
|
|
|
|
|
|
|
|
|
|
| |
| Net gain on disposal of investment in MOPCO (Note 6) |
|
|
|
|
( |
|
|
|
|
|
|
|
( | |
| Adjusted EBITDA |
|
|
|
|
|
|
|
|
( |
|
|
|
| |
| Assets 2 |
|
|
|
|
|
|
|
|
|
|
( |
|
| |
1 Primarily relates to our non-core Canadian business, which was sold in 2020.
2 In 2021, we reassessed the appropriate segment wherein certain assets related to transportation, distribution and logistics should be categorized. After our evaluation
was complete, we determined the assets should be categorized in the Potash, Nitrogen and Phosphate segments.
Our Retail segment primarily generates revenue from sales of the following:
| Crop nutrients |
Dry and liquid macronutrient products including potash, nitrogen and phosphate, proprietary liquid micronutrient products, and nutrient application services. |
| Crop protection products |
Various third-party supplier and proprietary products designed to maintain crop quality and manage plant diseases, weeds and other pests. |
| Seed |
Various third-party supplier seed brands and proprietary seed product lines. |
| Merchandise |
Fencing, feed supplements, livestock-related animal health products, storage and irrigation equipment, and other products. |
| Nutrien Financial |
Financing solutions provided to Retail branches and customers in support of Nutrien’s agricultural product and service sales. |
| Services and other revenues |
Product application, soil and leaf testing, crop scouting and precision agriculture services, and water services. |
Nutrien Annual Report 2021 | 84
In millions of US dollars unless otherwise noted
|
|
Products |
Sales prices impacted by |
| Potash |
|
|
| Nitrogen |
|
|
| Phosphate |
|
|
|
|
2021 |
|
2020 |
| Retail sales by product line |
|
|
|
| Crop nutrients |
|
|
|
| Crop protection products |
|
|
|
| Seed |
|
|
|
| Merchandise |
|
|
|
| Nutrien Financial |
|
|
|
| Services and other |
|
|
|
| Nutrien Financial elimination 1 |
( |
|
( |
|
|
|
|
|
| Potash sales by geography |
|
|
|
| Manufactured product |
|
|
|
| North America |
|
|
|
| Offshore 2 |
|
|
|
|
|
|
|
|
| Nitrogen sales by product line |
|
|
|
| Manufactured product |
|
|
|
| Ammonia |
|
|
|
| Urea |
|
|
|
| Solutions, nitrates and sulfates |
|
|
|
| Other nitrogen and purchased products |
|
|
|
|
|
|
|
|
| Phosphate sales by product line |
|
|
|
| Manufactured product |
|
|
|
| Fertilizer |
|
|
|
| Industrial and feed |
|
|
|
| Other phosphate and purchased products |
|
|
|
|
|
|
|
|
1 Represents elimination for the interest and service fees charged by Nutrien Financial to Retail branches.
Nutrien Annual Report 2021 | 85
In millions of US dollars unless otherwise noted
|
|
Sales - Third Party 1 |
|
Non-Current Assets 2 | ||||
|
|
2021 |
|
2020 |
|
2021 |
|
2020 |
| United States |
|
|
|
|
|
|
|
| Canada |
|
|
|
|
|
|
|
| Australia |
|
|
|
|
|
|
|
| Canpotex (Note 28) |
|
|
|
|
|
|
|
| Trinidad |
|
|
|
|
|
|
|
| Brazil |
|
|
|
|
|
|
|
| Other |
|
3 |
|
3 |
|
|
|
|
|
|
|
|
|
|
|
|
1 Sales by location of customers.
2 Excludes financial instruments (other than equity-accounted investees), deferred tax assets and post-employment benefit assets.
3 Other third-party sales primarily relate to Argentina of $
| Canpotex Sales by market (%) |
2021 |
|
2020 |
| Latin America |
|
|
|
| China |
|
|
|
| India |
|
|
|
| Other Asian markets |
|
|
|
| Other markets |
|
|
|
NOTE 4 NATURE OF EXPENSES
|
|
2021 |
|
2020 |
| Purchased and produced raw materials and product for resale 1 |
|
|
|
| Depreciation and amortization |
|
|
|
| Employee costs 2 |
|
|
|
| Freight |
|
|
|
| Impairment of assets (Note 13) |
|
|
|
| Provincial mining taxes 3 |
|
|
|
| Integration and restructuring related costs |
|
|
|
| Contract services |
|
|
|
| Lease expense 4 |
|
|
|
| Fleet fuel, repairs and maintenance |
|
|
|
| COVID-19 related expenses (Note 6) |
|
|
|
| Cloud computing transition adjustment (Note 6) |
|
|
|
| Net gain on disposal of investment in MOPCO (Note 6) |
|
|
( |
| Other |
|
|
|
| Total cost of goods sold and expenses |
|
|
|
1 Significant expenses include: supplies, energy, fuel, purchases of raw material (natural gas – feedstock, sulfur, ammonia and reagents) and product for resale (crop nutrients and protection products, and seed).
2 Includes salaries and wages, employee benefits, and share-based compensation.
3 Includes Saskatchewan potash production tax, and Saskatchewan resource surcharge of $
4 Includes lease expense relating to short-term leases, leases of low value and variable lease payments.
Nutrien Annual Report 2021 | 86
In millions of US dollars unless otherwise noted
NOTE 5 SHARE-BASED COMPENSATION
We have share-based compensation plans for eligible employees and directors as part of their remuneration package, including Stock Options, Performance Share Units (“PSUs”), Restricted Share Units (“RSUs”) and Deferred Share Units (“DSUs”).
| Plans |
|
Eligibility |
|
Granted |
|
Vesting Period |
|
Maximum Term |
|
Settlement |
| Stock Options |
|
|
|
|
|
|
|
|
|
|
| PSUs |
|
|
|
|
|
|
|
|
|
|
| RSUs |
|
|
|
|
|
|
|
|
|
|
| DSUs |
|
|
|
|
|
|
|
|
|
|
| Stock Appreciation Rights ("SARs") / Tandem Stock Appreciation Rights ("TSARs") 3 |
|
|
|
|
|
|
|
|
|
|
1 Stock options may also be settled by cash settlement or, if approved by the Company, by a broker-assisted "cashless exercise" arrangement or a “net exercise” arrangement.
2 Directors can redeem their DSUs for cash only when they leave the Board of Directors for an amount equal to the market value of the common shares at the time of redemption or as mandated by the Nutrien DSU Plan.
3 Holders of TSARs have the ability to choose between (a) receiving in cash the price of our shares on the date of exercise in excess of the exercise price of the right or (b) receiving common shares by paying the exercise price of the right. Our past experience and future expectation is that substantially all TSAR holders will elect to choose the first option.
The weighted average fair value of stock options granted was estimated as of the date of the grant using the Black-Scholes-Merton option-pricing model. The weighted average grant date fair value of stock options per unit granted in 2021 was $
|
|
|
Year of Grant | ||
| Assumptions |
Based On |
2021 |
|
2020 |
| Exercise price per option |
Quoted market closing price of common shares on the last trading day immediately preceding the date of the grant |
|
|
|
| Expected annual dividend yield (%) |
Annualized dividend rate as of the date of the grant |
|
|
|
| Expected volatility (%) |
Historical volatility of Nutrien's shares over a period commensurate with the expected life of the grant |
|
|
|
| Risk-free interest rate (%) |
Zero-coupon government issues implied yield available on equivalent remaining term at the time of the grant |
|
|
|
| Average expected life of options (years) |
Historical experience |
|
|
|
Nutrien Annual Report 2021 | 87
In millions of US dollars unless otherwise noted
|
|
Number of Shares Subject to Option |
|
Weighted Average Exercise Price | ||||
|
|
2021 |
|
2020 |
|
2021 |
|
2020 |
| Outstanding – beginning of year |
|
|
|
|
|
|
|
| Granted |
|
|
|
|
|
|
|
| Exercised |
( |
|
( |
|
|
|
|
| Forfeited or cancelled |
( |
|
( |
|
|
|
|
| Expired |
( |
|
( |
|
|
|
|
| Outstanding – end of year |
|
|
|
|
|
|
|
The aggregate grant date fair value of all stock options granted in 2021 was $
The following table summarizes information about our stock options outstanding as at December 31, 2021, with expiry dates ranging from May 2022 to February 2031:
|
|
Options Outstanding |
|
Options Exercisable | ||||||
|
|
|
|
Weighted |
|
Weighted |
|
|
|
Weighted |
|
|
|
|
Average |
|
Average |
|
|
|
Average |
|
|
|
|
Remaining |
|
Exercise |
|
|
|
Exercise |
| Range of Exercise Prices |
Number |
|
Life in Years |
|
Price |
|
Number |
|
Price |
| $37.84 to $41.77 |
|
|
|
|
|
|
|
|
|
| $41.78 to $43.36 |
|
|
|
|
|
|
|
|
|
| $43.37 to $50.22 |
|
|
|
|
|
|
|
|
|
| $50.23 to $55.08 |
|
|
|
|
|
|
|
|
|
| $55.09 to $67.05 |
|
|
|
|
|
|
|
1 |
|
| $67.06 to $109.45 |
|
|
|
|
|
|
|
|
|
|
|
|
|
|
|
|
|
|
|
|
1 Options granted in this range of exercise prices have not yet met the vesting period.
|
|
Units Granted |
|
Units Outstanding |
|
Compensation Expense | ||
|
|
in 2021 |
|
as at December 31, 2021 |
|
2021 |
|
2020 |
| Stock Options |
|
|
|
|
|
|
|
| PSUs |
|
|
|
|
|
|
|
| RSUs |
|
|
|
|
|
|
|
| DSUs |
|
|
|
|
|
|
|
| SARs/TSARs |
|
|
|
|
|
|
|
| |
|
|
|
|
|
|
|
Nutrien Annual Report 2021 | 88
In millions of US dollars unless otherwise noted
NOTE 6 OTHER EXPENSES (INCOME)
|
|
2021 |
|
2020 |
| Integration and restructuring related costs |
|
|
|
| Foreign exchange loss, net of related derivatives |
|
|
|
| Earnings of equity-accounted investees |
( |
|
( |
| Bad debt expense |
|
|
|
| COVID-19 related expenses (Note 30) |
|
|
|
| Cloud computing transition adjustment |
|
|
|
| Loss on disposal of business |
|
|
|
| Net gain on disposal of investment in MOPCO |
|
|
( |
| Other expenses |
|
|
|
| |
|
|
|
In 2021, the IFRS Interpretations Committee published a final agenda decision that clarified how to recognize certain configuration and customization expenditures related to cloud computing with retrospective application. Costs that do not meet the capitalization criteria should be expensed as incurred. We changed our accounting policy to align with the interpretation and previously capitalized costs that no longer qualify for capitalization were expensed in the current period since they were not material.
NOTE 7 FINANCE COSTS
|
|
2021 |
|
2020 |
| Interest expense |
|
|
|
| Short-term debt |
|
|
|
| Long-term debt |
|
|
|
| Lease liabilities (Note 19) |
|
|
|
| COVID-19 related |
|
|
|
| Loss on early extinguishment of debt (Note 18) |
|
|
|
| Unwinding of discount on asset retirement obligations (Note 22) |
( |
|
|
| Interest on net defined benefit pension and other post-retirement plan obligations (Note 21) |
|
|
|
| Borrowing costs capitalized to property, plant and equipment |
( |
|
( |
| Interest income |
( |
|
( |
|
|
|
|
|
Nutrien Annual Report 2021 | 89
In millions of US dollars unless otherwise noted
NOTE 8 INCOME TAXES
Income Taxes Included in Net Earnings
We operate in a specialized industry and in several tax jurisdictions; as a result, our earnings are subject to various rates of taxation.
|
|
2021 |
|
2020 |
| Current income tax |
|
|
|
| Tax expense (recovery) for current year |
|
|
( |
| Adjustments in respect of prior years |
( |
|
( |
| Total current income tax expense (recovery) |
|
|
( |
| Deferred income tax |
|
|
|
| Origination and reversal of temporary differences |
( |
|
|
| Adjustments in respect of prior years |
|
|
( |
| Change in recognition of tax losses and deductible temporary differences |
( |
|
( |
| Impact of tax rate changes |
( |
|
( |
| Total deferred income tax recovery |
( |
|
( |
| Income tax expense (recovery) included in net earnings |
|
|
( |
The provision for income taxes differs from the amount that would have resulted from applying the Canadian statutory income tax rates to earnings (loss) before income taxes as follows:
|
|
2021 |
|
2020 |
| Earnings (loss) before income taxes |
|
|
|
| Canada |
|
|
|
| United States |
|
|
( |
| Trinidad |
|
|
( |
| Australia |
|
|
|
| Other |
|
|
|
|
|
|
|
|
| Canadian federal and provincial statutory income tax rate (%) |
|
|
|
| Income tax at statutory rates |
|
|
|
| Adjusted for the effect of: |
|
|
|
| Impact of foreign tax rates |
( |
|
( |
| Production-related deductions |
( |
|
( |
| Non-taxable income |
( |
|
( |
| Change in recognition of tax losses and deductible temporary differences |
( |
|
( |
| Recovery of prior year taxes due to US legislative changes |
( |
|
( |
| Non-deductible expenses |
|
|
|
| Foreign accrual property income |
|
|
|
| Other |
|
|
|
| Income tax expense (recovery) included in net earnings |
|
|
( |
Nutrien Annual Report 2021 | 90
In millions of US dollars unless otherwise noted
Deferred Income Taxes
In respect of each type of temporary difference, unused tax loss and unused tax credit, the amounts of deferred tax assets and liabilities recognized in the consolidated balance sheets as at December 31 and the amount of the deferred tax (recovery) expense recognized in net earnings were:
|
|
|
|
|
|
Deferred Income Tax (Recovery) | ||
|
|
Deferred Income Tax (Assets) |
|
Expense Recognized | ||||
|
|
Liabilities |
|
in Net Earnings | ||||
|
|
2021 |
|
2020 |
|
2021 |
|
2020 |
| Deferred income tax assets |
|
|
|
|
|
|
|
| Asset retirement obligations and accrued environmental costs |
( |
|
( |
|
|
|
|
| Tax loss and other carryforwards |
( |
|
( |
|
|
|
( |
| Pension and other post-retirement benefit liabilities |
( |
|
( |
|
( |
|
( |
| Lease liabilities |
( |
|
( |
|
|
|
|
| Long-term debt |
( |
|
( |
|
( |
|
|
| Inventories |
( |
|
( |
|
( |
|
|
| Receivables |
( |
|
( |
|
|
|
|
| Payables and accrued charges |
( |
|
|
|
( |
|
|
| Other assets |
( |
|
( |
|
|
|
|
| Deferred income tax liabilities |
|
|
|
|
|
|
|
| Property, plant and equipment |
|
|
|
|
|
|
( |
| Goodwill and other intangible assets |
|
|
|
|
( |
|
( |
| Payables and accrued charges |
|
|
|
|
( |
|
|
| Other liabilities |
|
|
|
|
|
|
( |
| |
|
|
|
|
|
|
|
Reconciliation of net deferred income tax liabilities:
|
|
2021 |
|
2020 |
| Balance – beginning of year |
|
|
|
| Income tax recovery recognized in net earnings |
( |
|
( |
| Income tax charge recognized in other comprehensive income ("OCI") |
|
|
|
| Other |
( |
|
|
| |
|
|
|
Amounts and expiry dates of unused tax losses and unused tax credits as at December 31, 2021, were:
|
|
Amount |
|
Expiry Date |
| Unused federal operating losses |
|
|
|
| Unused federal capital losses |
|
|
|
| Unused investment tax credits |
|
|
|
The unused tax losses and credits with no expiry dates can be carried forward indefinitely.
Nutrien Annual Report 2021 | 91
In millions of US dollars unless otherwise noted
As at December 31, 2021, we had $
We have determined that it is probable that all recognized deferred tax assets will be realized through a combination of future reversals of temporary differences and taxable income.
We did not recognize deferred tax liabilities related to temporary differences associated with investments in subsidiaries and equity-accounted investees amounting to $
NOTE 9 NET EARNINGS PER SHARE
|
|
2021 |
|
2020 |
| Weighted average number of common shares |
|
|
|
| Dilutive effect of stock options |
|
|
|
| |
|
|
|
Options excluded from the calculation of diluted net earnings per share due to the option exercise prices being greater than the average market price of common shares were as follows:
|
|
2021 |
|
2020 |
| Number of options excluded |
|
|
|
| Performance option plan years fully excluded 1 |
|
|
|
| Stock option plan years fully excluded |
|
|
|
| |
|
|
|
Nutrien Annual Report 2021 | 92
In millions of US dollars unless otherwise noted
NOTE 10 FINANCIAL INSTRUMENTS AND RELATED RISK MANAGEMENT
Our ELT, along with the Board of Directors (including Board of Directors committees), is responsible for monitoring our risk exposures and managing our policies to address these risks. Our strategic and risk management processes are integrated to ensure we understand the benefit from the relationship between strategy, risk and value creation. Outlined below are our risk management strategies we have developed to mitigate the financial market risks that we are exposed to.
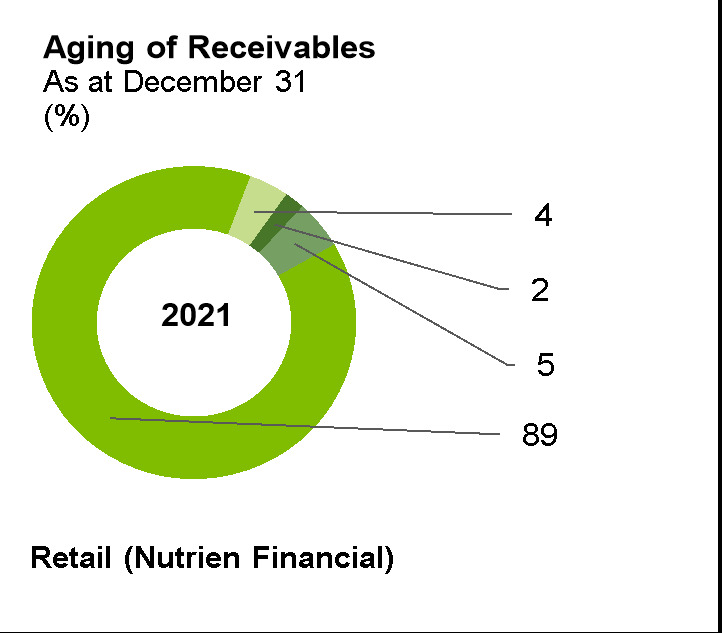
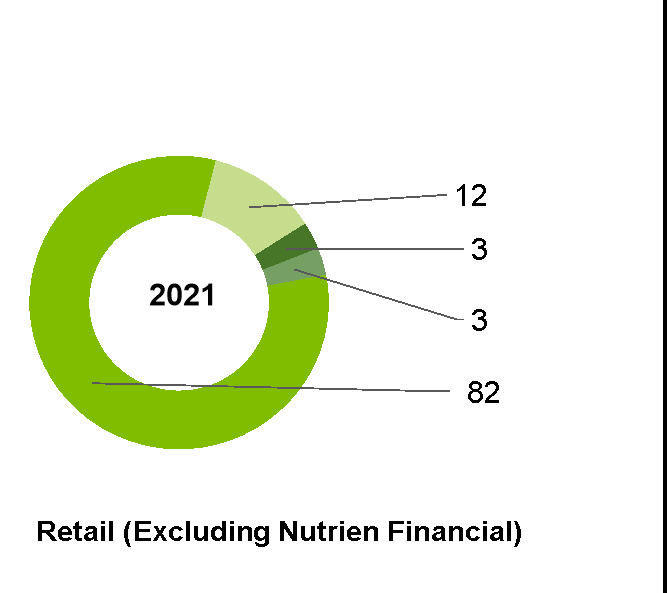
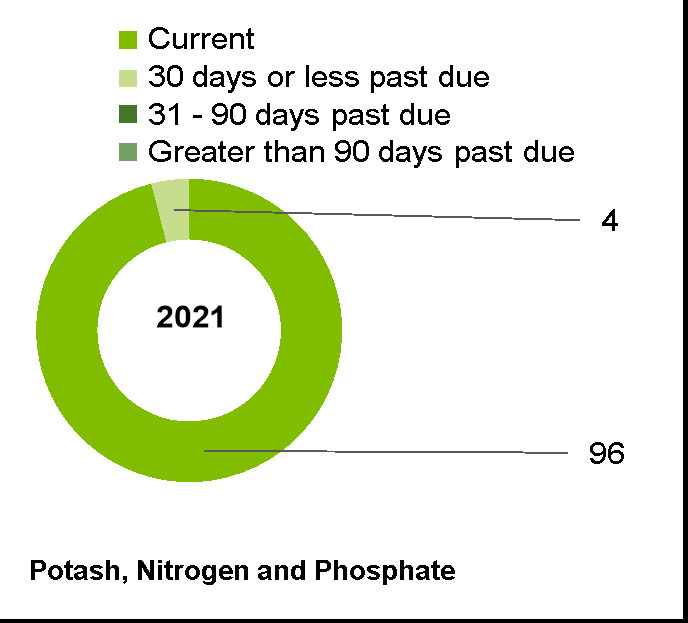
| Credit Risk |
Risk Management Strategies |
| Receivables from customers |
|
| Cash and cash equivalents and other receivables |
|
|
|
|
|
Nutrien Annual Report 2021 | 93
In millions of US dollars unless otherwise noted
Maximum exposure to credit risk as at December 31:
|
|
2021 |
|
2020 |
| Cash and cash equivalents |
|
|
|
| Receivables (excluding income tax receivable) |
|
|
|
|
|
|
|
|
| Risk |
Risk Management Strategies |
| Liquidity |
Refer to Note 17 for our available credit facilities. |
The following maturity analysis of our financial liabilities and gross settled derivative contracts (for which the cash flows are settled simultaneously) is based on the expected undiscounted contractual cash flows from the date of the consolidated balance sheets to the contractual maturity date.
|
|
Carrying Amount |
|
Contractual |
|
|
|
|
|
|
|
|
|
|
of Liability as at |
|
Cash |
|
Within |
|
1 to 3 |
|
3 to 5 |
|
Over 5 |
| 2021 |
December 31 |
|
Flows |
|
1 Year |
|
Years |
|
Years |
|
Years |
| Short-term debt 1 |
|
|
|
|
|
|
|
|
|
|
|
| Payables and accrued charges 2 |
|
|
|
|
|
|
|
|
|
|
|
| Long-term debt, including current portion 1 |
|
|
|
|
|
|
|
|
|
|
|
| Lease liabilities, including current portion 1 |
|
|
|
|
|
|
|
|
|
|
|
| Derivatives |
|
|
|
|
|
|
|
|
|
|
|
|
|
|
|
|
|
|
|
|
|
|
|
|
1 Contractual cash flows include contractual interest payments related to debt obligations and lease liabilities. Interest rates on debt with variable rates are based on the prevailing rates as at December 31, 2021.
2 Excludes non-financial liabilities and includes payables of approximately $
| Foreign Exchange Risk |
Risk Management Strategies |
| |
|
Nutrien Annual Report 2021 | 94
In millions of US dollars unless otherwise noted
The fair value of our net foreign exchange currency derivative assets (liabilities) at December 31, 2021 was $
|
|
2021 |
|
2020 | ||||||||
|
|
|
|
|
|
Average |
|
|
|
|
|
Average |
|
|
|
|
|
|
contract |
|
|
|
|
|
contract |
| Sell/buy |
Notional |
|
Maturities |
|
rate |
|
Notional |
|
Maturities |
|
rate |
| Derivatives not designated as hedges |
|
|
|
|
|
| |||||
| Forwards |
|
|
|
|
|
|
|
|
|
|
|
| USD/CAD 1 |
|
|
|
|
|
|
|
|
|
|
|
| CAD/USD |
|
|
|
|
|
|
|
|
|
|
|
| USD/AUD 2 |
|
|
|
|
|
|
|
|
|
|
|
| AUD/USD |
|
|
|
|
|
|
|
|
|
|
|
| BRL 3 /USD |
|
|
|
|
|
|
|
|
|
|
|
| Options |
|
|
|
|
|
|
|
|
|
|
|
| USD/CAD - buy USD puts |
|
|
|
|
|
|
|
|
|
|
|
| USD/CAD - sell USD calls |
|
|
|
|
|
|
|
|
|
|
|
| AUD/USD - buy USD calls |
|
|
|
|
|
|
|
|
|
|
|
| AUD/USD - sell USD puts |
|
|
|
|
|
|
|
|
|
|
|
| Derivatives designated as hedges |
|
|
|
|
|
| |||||
| Forwards |
|
|
|
|
|
|
|
|
|
|
|
| USD/CAD |
|
|
|
|
|
|
|
|
|
|
|
1 Canadian dollars
2 Australian dollars
3 Brazilian real
| Market Risks |
Type |
Risk Management Strategies |
|
| Interest rate |
Short-term and long-term debt |
|
We do not believe we have material exposure to interest or price risk on our financial instruments as at December 31, 2021 and 2020. |
| Price |
Natural gas derivative instruments |
| |
| Price |
Investment at fair value |
|
Nutrien Annual Report 2021 | 95
In millions of US dollars unless otherwise noted
Fair Value
Financial instruments included in the consolidated balance sheets are measured either at fair value or amortized cost. The following tables explain the valuation methods used to determine the fair value of each financial instrument and its associated level in the fair value hierarchy.
| Financial Instruments at Fair Value |
Fair Value Method |
| Cash and cash equivalents |
Carrying amount (approximation to fair value assumed due to short-term nature) |
| Equity securities |
Closing bid price of the common shares as at the balance sheet date |
| Debt securities |
Closing bid price of the debt or other instruments with similar terms and credit risk (Level 2) as at the balance sheet date |
| Foreign currency derivatives not traded in an active market |
Quoted forward exchange rates (Level 2) as at the balance sheet date |
| Foreign exchange forward contracts, swaps and options and natural gas swaps not traded in an active market |
Based on a discounted cash flow model. Inputs included contractual cash flows based on prices for natural gas futures contracts, fixed prices and notional volumes specified by the swap contracts, the time value of money, liquidity risk, our own credit risk (related to instruments in a liability position) and counterparty credit risk (related to instruments in an asset position). Futures contract prices used as inputs in the model were supported by prices quoted in an active market and therefore categorized in Level 2. |
| Financial Instruments at Amortized Cost |
Fair Value Method |
| Receivables, short-term debt and payables and accrued charges |
Carrying amount (approximation to fair value assumed due to short-term nature) |
| Long-term debt |
Quoted market prices (Level 1 or 2 depending on the market liquidity of the debt) |
| Other long-term debt instruments |
Carrying amount |
The following table presents our fair value hierarchy for financial instruments carried at fair value on a recurring basis or measured at amortized cost and require fair value disclosure:
|
|
2021 |
|
2020 | ||||||||||
|
|
Carrying |
|
|
|
|
|
|
|
Carrying |
|
|
|
|
| Financial assets (liabilities) measured at |
Amount |
|
Level 1 |
|
Level 2 |
|
Level 3 |
|
Amount |
|
Level 1 |
|
Level 2 |
| Fair value on a recurring basis 1 |
|
|
|
|
|
|
|
|
|
|
|
|
|
| Cash and cash equivalents |
|
|
|
|
|
|
|
|
|
|
|
|
|
| Derivative instrument assets |
|
|
|
|
|
|
|
|
|
|
|
|
|
| Other current financial assets – marketable securities 2 |
|
|
|
|
|
|
|
|
|
|
|
|
|
| Investments at fair value through other comprehensive income ("FVTOCI") (Note 15) |
|
|
|
|
|
|
|
|
|
|
|
|
|
| Derivative instrument liabilities |
( |
|
|
|
( |
|
|
|
( |
|
|
|
( |
| Amortized cost |
|
|
|
|
|
|
|
|
|
|
|
|
|
| Current portion of long-term debt |
|
|
|
|
|
|
|
|
|
|
|
|
|
| Notes and debentures |
( |
|
( |
|
|
|
|
|
|
|
|
|
|
| Fixed and floating rate debt |
( |
|
|
|
( |
|
|
|
( |
|
|
|
( |
| Long-term debt |
|
|
|
|
|
|
|
|
|
|
|
|
|
| Notes and debentures |
( |
|
( |
|
( |
|
|
|
( |
|
( |
|
( |
| Fixed and floating rate debt |
( |
|
|
|
( |
|
|
|
( |
|
|
|
( |
1 During 2021 and 2020, there were no transfers between levelling for financial instruments measured at fair value on a recurring basis. Our policy is to recognize transfers at the end of the reporting period.
2 Marketable securities consist of equity and fixed income securities.
Nutrien Annual Report 2021 | 96
In millions of US dollars unless otherwise noted
NOTE 11 RECEIVABLES
|
|
|
Segment |
2021 |
|
2020 |
| Receivables from customers |
|
|
|
| |
| Third parties |
Retail (Nutrien Financial) 1 |
|
|
| |
|
|
|
Retail |
|
|
|
|
|
|
Potash, Nitrogen, Phosphate |
|
|
|
| Related party - Canpotex |
Potash (Note 28) |
|
|
| |
| Less allowance for expected credit losses of receivables from customers |
|
( |
|
( | |
|
|
|
|
|
|
|
| Rebates |
|
|
| ||
| Income taxes (Note 8) |
|
|
| ||
| Other receivables |
|
|
| ||
|
|
|
|
|
|
|
1 Includes $
Qualifying receivables from customers financed by Nutrien Financial represents high-quality receivables from customers that have been rated very low to low risk of default among Retail’s receivables from customers.
Nutrien Annual Report 2021 | 97
In millions of US dollars unless otherwise noted
NOTE 12 INVENTORIES
|
|
2021 |
|
2020 |
| Product purchased for resale |
|
|
|
| Finished products |
|
|
|
| Intermediate products |
|
|
|
| Raw materials |
|
|
|
| Materials and supplies |
|
|
|
|
|
|
|
|
|
| |||
Inventories expensed to cost of goods sold during the year were $
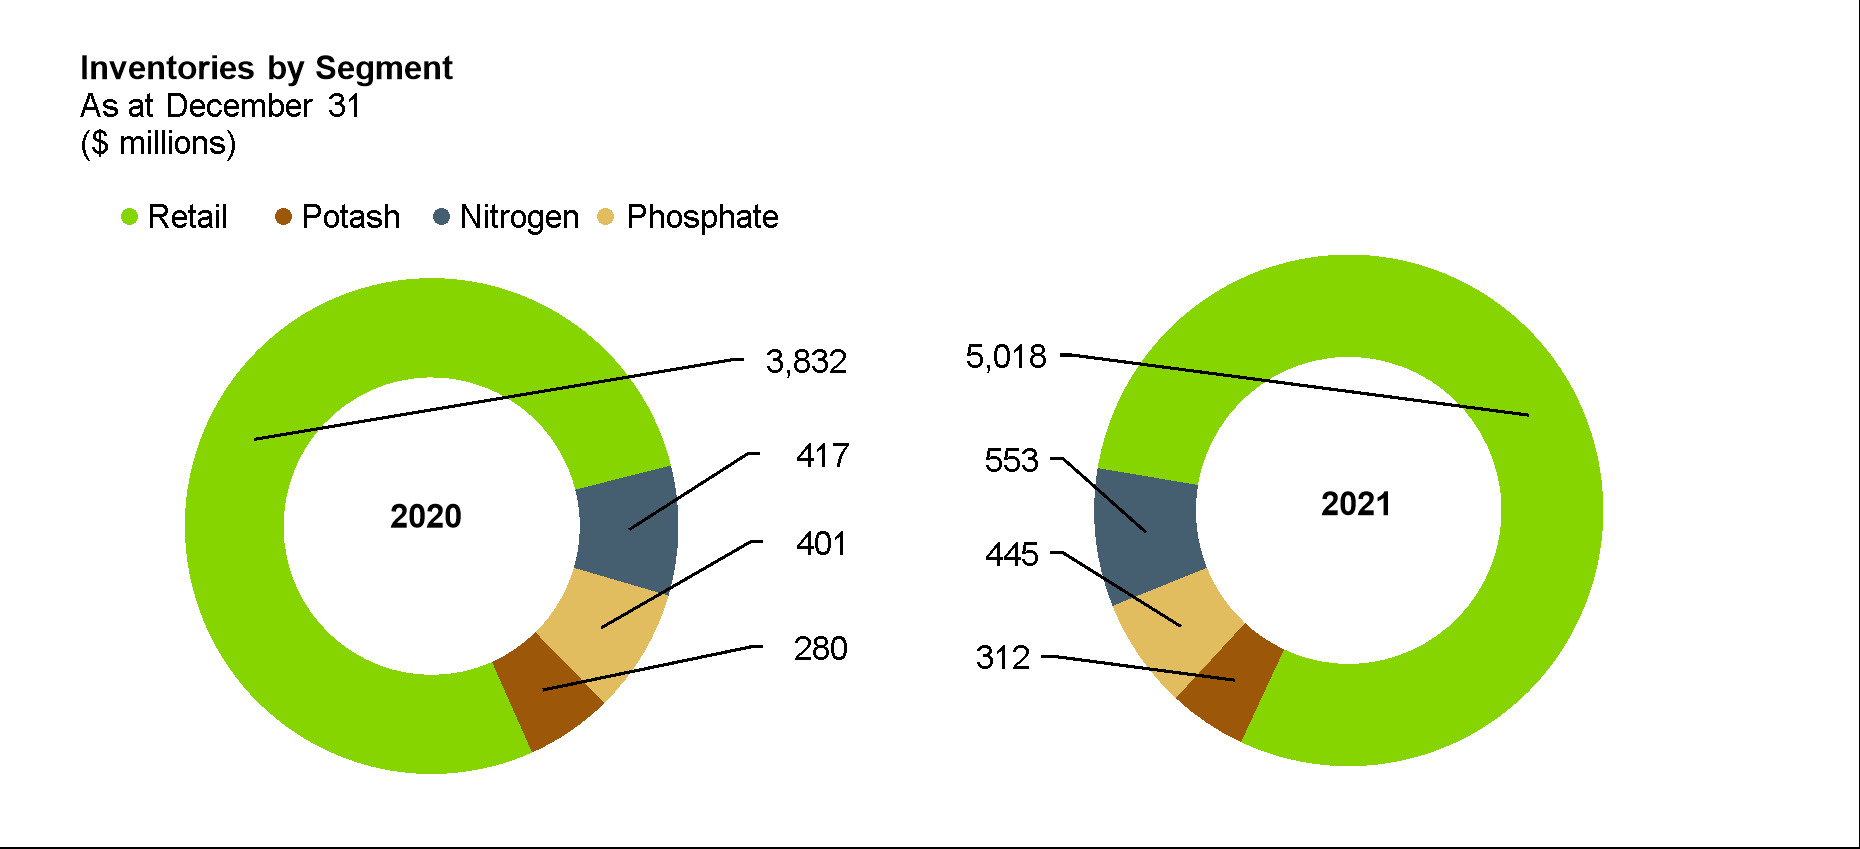
NOTE 13 PROPERTY, PLANT AND EQUIPMENT
The majority of our tangible assets are buildings, machinery and equipment used to produce or distribute our products and render our services. Right-of-use (“ROU”) assets primarily include railcars, marine vessels, real estate and mobile equipment.
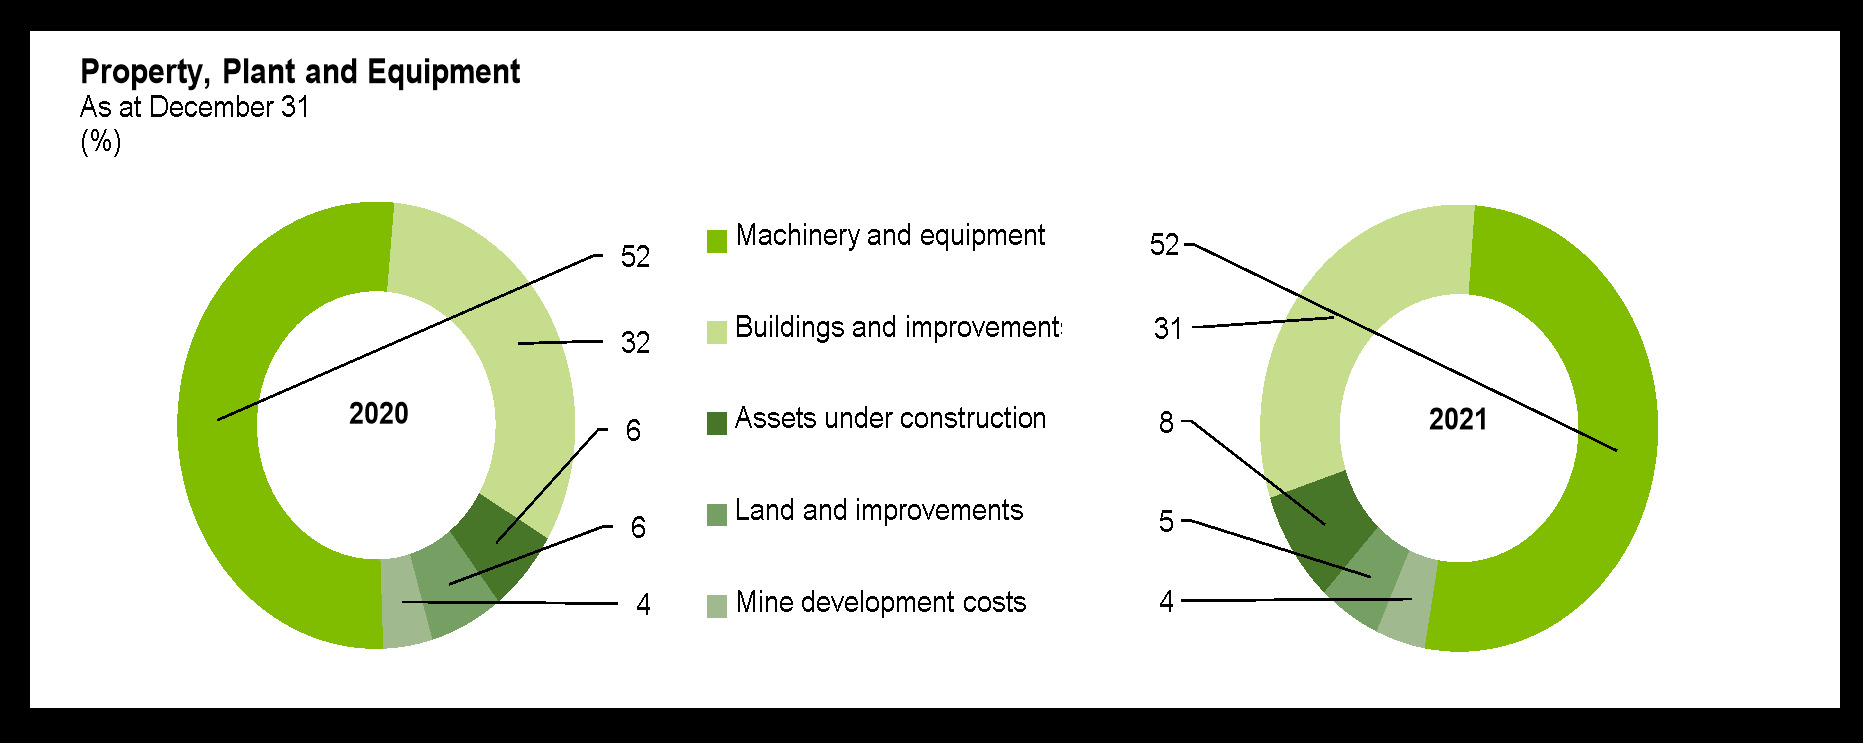
Nutrien Annual Report 2021 | 98
In millions of US dollars unless otherwise noted
|
|
|
|
|
|
Machinery |
|
Mine |
|
|
|
|
|
|
Land and |
|
Buildings and |
|
and |
Development |
Assets Under |
|
| ||
| Improvements |
Improvements |
|
Equipment |
|
Costs |
|
Construction |
|
Total | ||
| Useful life range (years) |
|
|
|
|
|
|
|
|
n/a |
|
|
| Carrying amount – December 31, 2020 |
|
|
|
|
|
|
|
|
|
|
|
| Acquisitions (Note 25) |
|
|
|
|
|
|
|
|
|
|
|
| Additions |
|
|
|
|
|
|
|
|
|
|
|
| Additions – ROU assets |
|
|
|
|
|
|
|
|
|
|
|
| Disposals |
( |
|
( |
|
( |
|
|
|
( |
|
( |
| Transfers |
|
|
|
|
|
|
|
|
( |
|
|
| Foreign currency translation and other |
|
|
( |
|
( |
|
|
|
( |
|
( |
| Depreciation |
( |
|
( |
|
( |
|
( |
|
|
|
( |
| Depreciation – ROU assets |
( |
|
( |
|
( |
|
|
|
|
|
( |
| Impairment |
|
|
|
|
( |
|
|
|
( |
|
( |
| Carrying amount – December 31, 2021 |
|
|
|
|
|
|
|
|
|
|
|
| Balance – December 31, 2021 comprised of: |
|
|
|
|
|
|
|
|
|
| |
| Cost |
|
|
|
|
|
|
|
|
|
|
|
| Accumulated depreciation and |
|
|
|
|
|
|
|
|
|
|
|
| impairments |
( |
|
( |
|
( |
|
( |
|
|
|
( |
| Carrying amount – December 31, 2021 |
|
|
|
|
|
|
|
|
|
|
|
| Balance – December 31, 2021 comprised of: |
|
|
|
|
|
|
|
|
|
| |
| Owned property, plant and equipment |
|
|
|
|
|
|
|
|
|
|
|
| ROU assets |
|
|
|
|
|
|
|
|
|
|
|
| Carrying amount – December 31, 2021 |
|
|
|
|
|
|
|
|
|
|
|
| Carrying amount – December 31, 2019 |
|
|
|
|
|
|
|
|
|
|
|
| Acquisitions (Note 25) |
|
|
|
|
|
|
|
|
|
|
|
| Additions |
|
|
|
|
|
|
|
|
|
|
|
| Additions – ROU assets |
|
|
|
|
|
|
|
|
|
|
|
| Disposals |
( |
|
( |
|
( |
|
|
|
|
|
( |
| Transfers |
|
|
|
|
|
|
|
|
( |
|
|
| Foreign currency translation and other |
( |
|
|
|
|
|
|
|
( |
|
|
| Depreciation |
( |
|
( |
|
( |
|
( |
|
|
|
( |
| Depreciation – ROU assets |
( |
|
( |
|
( |
|
|
|
|
|
( |
| Impairment |
( |
|
( |
|
( |
|
( |
|
( |
|
( |
| Carrying amount – December 31, 2020 |
|
|
|
|
|
|
|
|
|
|
|
| Balance – December 31, 2020 comprised of: |
|
|
|
|
|
|
|
|
|
| |
| Cost |
|
|
|
|
|
|
|
|
|
|
|
| Accumulated depreciation and |
|
|
|
|
|
|
|
|
|
|
|
| impairments |
( |
|
( |
|
( |
|
( |
|
|
|
( |
| Carrying amount – December 31, 2020 |
|
|
|
|
|
|
|
|
|
|
|
| Balance – December 31, 2020 comprised of: |
|
|
|
|
|
|
|
|
|
| |
| Owned property, plant and equipment |
|
|
|
|
|
|
|
|
|
|
|
| ROU assets |
|
|
|
|
|
|
|
|
|
|
|
| |
|
|
|
|
|
|
|
|
|
|
|
Nutrien Annual Report 2021 | 99
In millions of US dollars unless otherwise noted
Depreciation of property, plant and equipment was included in the following:
|
|
2021 |
|
2020 |
| Freight, transportation and distribution |
|
|
|
| Cost of goods sold |
|
|
|
| Selling expenses |
|
|
|
| General and administrative expenses |
|
|
|
| Depreciation recorded in earnings |
|
|
|
| Depreciation recorded in inventory |
|
|
|
Impairment
In 2020, we recorded the following impairments:
| Cash-generating units ("CGUs") |
|
Aurora |
|
White Springs |
| Segment |
|
| ||
| Impairment indicator |
|
| ||
| Pre-tax impairment loss ($) |
|
|
|
|
| Pre-tax recoverable amount ($) |
|
n/a |
|
|
| Post-tax recoverable amount ($) |
|
|
|
n/a |
| Valuation technique |
|
|
|
|
| Key assumptions |
|
|
|
|
| End of mine life (proven and probable reserves) (year) |
|
|
|
|
| Pre-tax discount rate (%) |
|
n/a |
|
|
| Post-tax discount rate (%) |
|
|
|
|
Nutrien Annual Report 2021 | 100
In millions of US dollars unless otherwise noted
NOTE 14 GOODWILL AND OTHER INTANGIBLE ASSETS
|
|
|
|
Other Intangibles | ||||||||
|
|
|
|
Customer |
|
|
|
Trade |
|
|
|
|
|
|
Goodwill |
|
Relationships 2 |
|
Technology |
|
Names |
|
Other |
|
Total |
| Useful life range (years) |
n/a |
|
|
|
|
|
|
|
|
|
|
| Carrying amount – December 31, 2020 |
|
|
|
|
|
|
|
|
|
|
|
| Acquisitions (Note 25) |
|
|
|
|
|
|
|
|
|
|
|
| Additions – internally developed |
|
|
|
|
|
|
|
|
|
|
|
| Foreign currency translation and other |
( |
|
( |
|
|
|
( |
|
|
|
|
| Disposals |
( |
|
|
|
|
|
|
|
|
|
|
| Cloud computing transition adjustment (Note 6) |
|
|
|
|
( |
|
|
|
|
|
( |
| Amortization 1 |
|
|
( |
|
( |
|
( |
|
( |
|
( |
| Carrying amount – December 31, 2021 |
|
|
|
|
|
|
|
|
|
|
|
| Balance – December 31, 2021 comprised of: |
|
|
|
|
|
|
|
|
|
| |
| Cost |
|
|
|
|
|
|
|
|
|
|
|
| Accumulated amortization and impairment |
( |
|
( |
|
( |
|
( |
|
( |
|
( |
| Carrying amount – December 31, 2021 |
|
|
|
|
|
|
|
|
|
|
|
| Carrying amount – December 31, 2019 |
|
|
|
|
|
|
|
|
|
|
|
| Acquisitions (Note 25) |
|
|
|
|
|
|
|
|
|
|
|
| Additions – internally developed |
|
|
|
|
|
|
|
|
|
|
|
| Foreign currency translation and other |
|
|
|
|
|
|
|
|
( |
|
|
| Disposals |
|
|
|
|
( |
|
|
|
|
|
( |
| Amortization 1 |
|
|
( |
|
( |
|
( |
|
( |
|
( |
| Carrying amount – December 31, 2020 |
|
|
|
|
|
|
|
|
|
|
|
| Balance – December 31, 2020 comprised of: |
|
|
|
|
|
|
|
|
|
| |
| Cost |
|
|
|
|
|
|
|
|
|
|
|
| Accumulated amortization and impairment |
( |
|
( |
|
( |
|
( |
|
( |
|
( |
| Carrying amount – December 31, 2020 |
|
|
|
|
|
|
|
|
|
|
|
1 Amortization of $
2 The average remaining amortization period of customer relationships as at December 31, 2021, was approximately
3 Certain trade names have indefinite useful lives as there are no regulatory, legal, contractual, cooperative, economic or other factors that limit their useful lives.
Nutrien Annual Report 2021 | 101
In millions of US dollars unless otherwise noted
Goodwill Impairment Testing
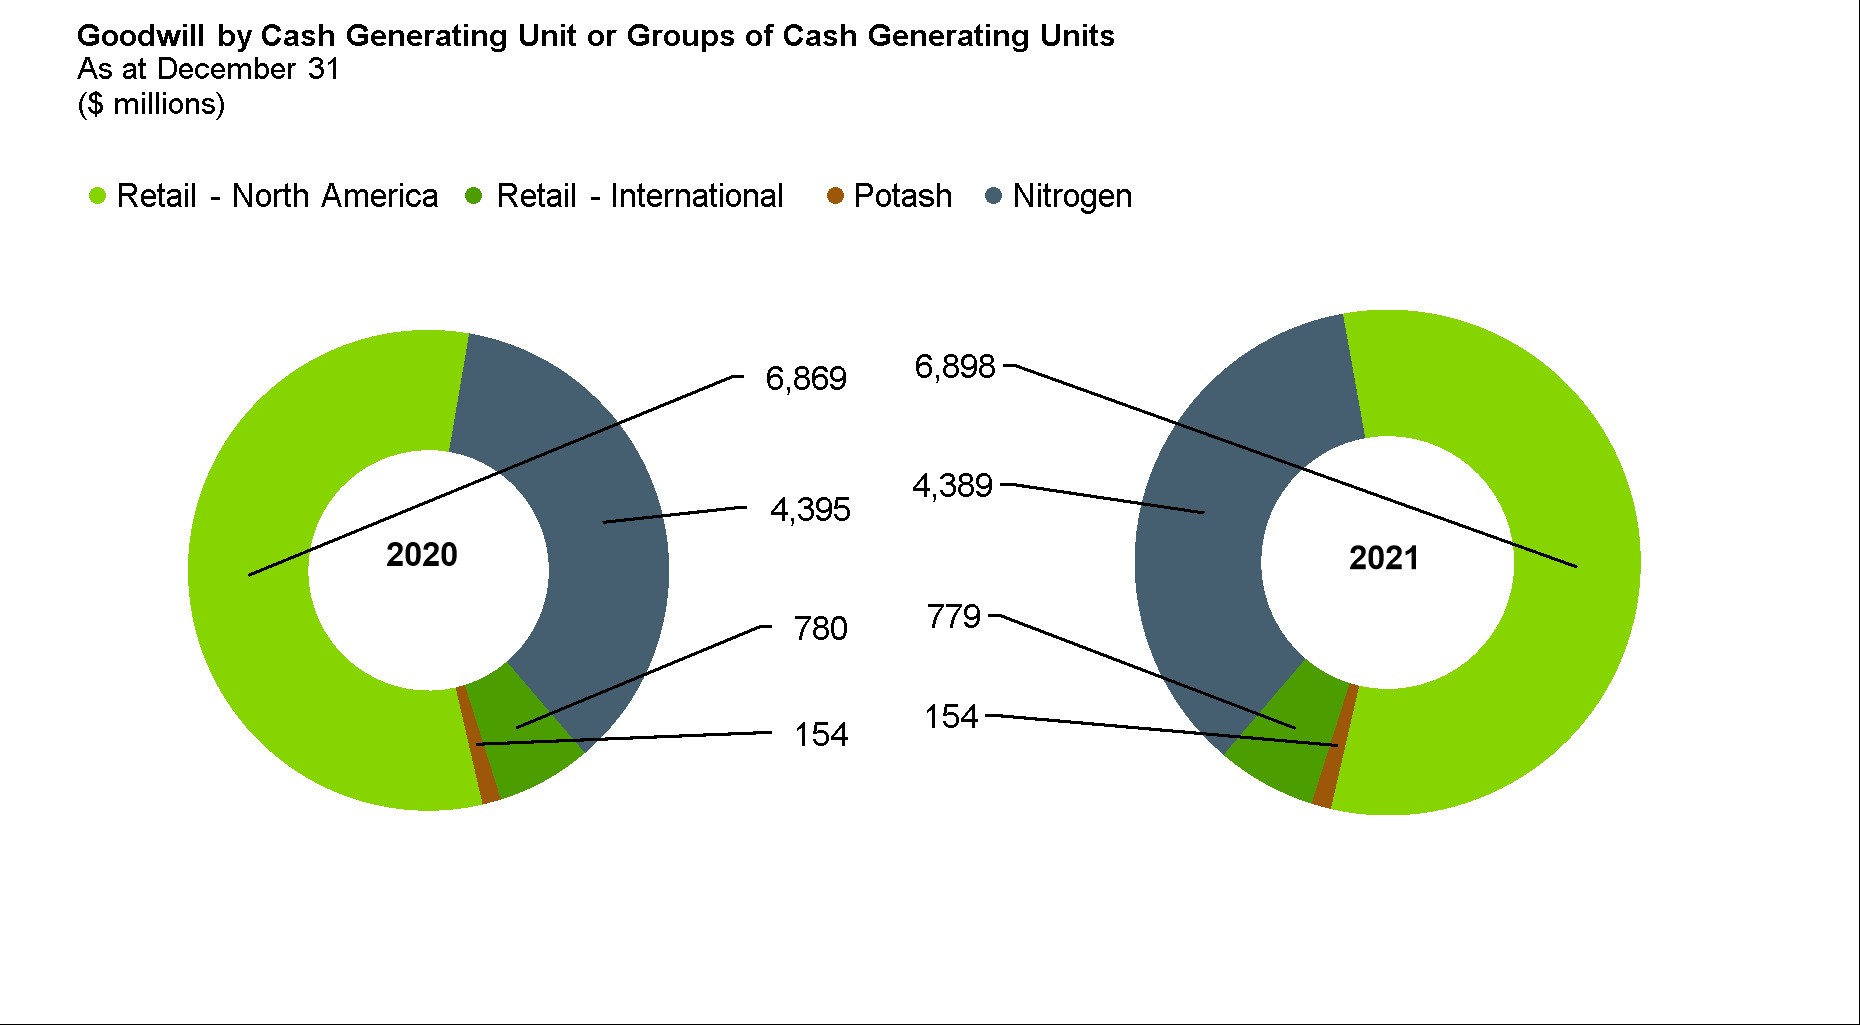
We performed our annual impairment test on goodwill and did not identify any impairment; however, the recoverable amount for Retail – North America did not substantially exceed its carrying amount. In testing for impairment of goodwill, we calculate the recoverable amount for a CGU or groups of CGUs containing goodwill. We used the FVLCD methodology based on after-tax discounted cash flows (five-year projections and a terminal year thereafter) and incorporated assumptions an independent market participant would apply including considerations related to climate-change initiatives. We adjusted discount rates for each CGU or group of CGUs for the risk associated with achieving our forecasts (five-year projections) and for the country risk premium in which we expect to generate cash flows. FVLCD is a Level 3 measurement. We use our market capitalization and comparative market multiples to corroborate discounted cash flow results.
The key assumptions with the greatest influence on the calculation of the recoverable amounts are the discount rates, terminal growth rates and cash flow forecasts. The key forecast assumptions were based on historical data and estimates of future results from internal sources as well as industry and market trends.
|
|
Terminal Growth Rate (%) |
|
Discount Rate (%) | ||||||||||
|
|
2021 |
|
2020 |
|
2021 |
|
2020 | ||||||
| Retail – North America |
|
|
|
|
|
|
|
|
|
|
|
|
|
| Retail – International 1 |
|
- |
|
|
|
|
|
- |
|
|
|
- |
|
| Potash |
|
|
|
|
|
|
|
|
|
|
|
|
|
| Nitrogen |
|
|
|
|
|
|
|
|
|
|
|
|
|
1 The discount rates reflect the country risk premium and size for our international groups of CGUs.
The Retail – North America group of CGUs recoverable amount exceeds its carrying amount by $
|
|
Change Required for |
|
| |
|
|
Carrying Amount to Equal |
|
Value Used in Impairment | |
| Key Assumptions |
Recoverable Amount |
|
Model | |
| Terminal growth rate (%) |
|
percentage point decrease |
|
|
| Forecasted EBITDA over forecast period (in billions of US dollars) |
|
percent decrease |
|
|
| Discount rate (%) |
|
percentage point increase |
|
|
Nutrien Annual Report 2021 | 102
In millions of US dollars unless otherwise noted
NOTE 15 INVESTMENTS
|
|
|
|
Principal Place |
|
Proportion of Ownership Interest |
|
|
|
| ||
|
|
|
|
of Business and |
|
and Voting Rights Held (%) |
|
Carrying Amount | ||||
| Name |
Principal Activity |
|
Incorporation |
|
2021 |
|
2020 |
|
2021 |
|
2020 |
| Equity-accounted investees |
|
|
|
|
|
|
|
|
|
| |
| Profertil |
|
|
|
|
|
|
|
|
|
|
|
| Canpotex |
|
|
|
|
|
|
|
|
|
|
|
| Other associates and joint ventures |
|
|
|
|
|
|
|
|
|
| |
| Total equity-accounted investees |
|
|
|
|
|
|
|
|
|
| |
| Investments at FVTOCI |
|
|
|
|
|
|
|
|
|
| |
| Sinofert |
|
|
|
|
|
|
|
|
|
|
|
| Other |
|
|
|
|
|
|
|
|
|
|
|
| Total investments at FVTOCI |
|
|
|
|
|
|
|
|
|
| |
| Total investments |
|
|
|
|
|
|
|
|
|
| |
We continuously assess our ability to exercise significant influence or joint control over our investments. Our
NOTE 16 OTHER ASSETS
|
|
2021 |
|
2020 |
| Deferred income tax assets (Note 8) |
|
|
|
| Ammonia catalysts – net of accumulated amortization of $85 (2020 – $76) |
|
|
|
| Long-term income tax receivable (Note 8) |
|
|
|
| Accrued pension benefit assets (Note 21) |
|
|
|
| Other |
|
|
|
| |
|
|
|
Nutrien Annual Report 2021 | 103
In millions of US dollars unless otherwise noted
Nutrien Annual Report 2021 |
In millions of US dollars unless otherwise noted
NOTE 17 SHORT-TERM DEBT
We use our $4.5 billion commercial paper program for our short-term cash requirements. The commercial paper program is backstopped by the $4.5 billion unsecured revolving term credit facility (“Nutrien Credit Facility”). Credit facilities are renegotiated periodically.
|
|
Rate of Interest (%) |
|
2021 |
|
2020 | ||
| Other credit facilities 1 |
|
- |
|
|
|
|
|
| Commercial paper 2 |
|
- |
|
|
|
|
|
| Other short-term debt |
|
|
|
|
|
|
|
|
|
|
|
|
|
|
|
|
1 Credit facilities are unsecured and consist of South American facilities with debt of $
2 The amount available under the commercial paper program is limited to the availability of backup funds under the Nutrien Credit Facility and excess cash invested in highly liquid securities
| Credit facilities |
|
Total Facility Limit as at December 31, 2021 |
|
Total Facility Limit as at December 31, 2020 |
| Nutrien Credit Facility 1 |
|
|
|
|
| Uncommitted revolving demand facility |
|
|
|
|
| Other credit facilities 2 |
|
|
|
|
1 In 2021, we extended the maturity date from April 10, 2023 to June 4, 2026, subject to extension at the request of Nutrien provided that the resulting maturity date shall not exceed five years from the date of request.
2 Total facility limit amounts include some facilities with maturities in excess of one year.
Principal covenants and events of default under the Nutrien Credit Facility include a debt to capital ratio (refer to Note 24) and other customary events of default and covenant provisions. Non-compliance with such covenants could result in accelerated repayment and/or termination of the credit facility. We were in compliance with all covenants as at December 31, 2021.
Nutrien Annual Report 2021 | 104
In millions of US dollars unless otherwise noted
NOTE 18 LONG-TERM DEBT
We source our borrowings for funding purposes primarily through notes, debentures and long-term credit facilities. We have access to the capital markets through our base shelf prospectus.
|
|
Rate of Interest (%) |
|
Maturity |
|
2021 |
|
2020 | ||
| Notes 1 |
|
|
|
|
|
|
|
|
|
|
|
|
|
|
|
|
|
|
|
|
|
|
|
|
|
|
|
|
|
|
|
|
|
|
|
|
|
|
|
|
|
|
|
|
|
|
|
|
|
|
|
|
|
|
|
|
|
|
|
|
|
|
|
|
|
|
|
|
|
|
|
|
|
|
|
|
|
|
|
|
|
|
|
|
|
|
|
|
|
|
|
|
|
|
|
|
|
|
|
|
|
|
|
|
|
|
|
|
|
|
|
|
|
|
|
|
|
|
|
|
|
|
|
|
|
|
|
|
|
|
|
|
|
|
|
|
|
|
|
|
|
|
|
|
|
|
|
|
|
|
|
|
|
|
|
|
|
|
|
|
|
|
|
|
|
|
|
|
|
|
|
|
|
|
|
|
|
|
|
|
|
|
|
|
|
|
|
|
|
|
|
|
|
|
|
|
|
|
|
|
|
|
|
|
|
|
|
| Debentures 1 |
|
|
|
|
|
|
|
|
|
| Other credit facilities 2 |
|
|
Various |
|
Various |
|
|
|
|
|
|
|
|
|
|
|
|
|
|
|
| Add net unamortized fair value adjustments |
|
|
|
| |||||
| Less net unamortized debt issue costs |
|
( |
|
( | |||||
|
|
|
|
|
|
|
|
|
|
|
| Less current maturities |
|
( |
|
( | |||||
|
|
|
|
|
|
|
|
|
|
|
1 Each series of notes and debentures is unsecured and has no sinking fund requirements prior to maturity. Each series is redeemable and has various provisions that allow redemption prior to maturity, at our option, at specified prices.
2 Other credit facilities are unsecured and consist of South American facilities with debt of $
Nutrien Annual Report 2021 | 105
In millions of US dollars unless otherwise noted
In 2021, we redeemed the entire outstanding principal amount of these notes in accordance with the optional redemption provisions provided in the indenture governing these notes:
|
|
Rate of interest (%) |
|
Maturity |
|
Redeemed |
| Notes |
|
|
|
|
|
| Notes |
|
|
|
|
|
| Notes |
|
|
|
|
|
| Principal amount |
|
|
|
|
|
| Add net unamortized fair value adjustments |
|
| |||
| Less net unamortized debt issue costs |
|
( | |||
| Carrying amount |
|
|
|
|
|
We also completed a cash tender offer to purchase the following debentures and notes, up to a maximum aggregate purchase price of $
|
|
Rate of interest (%) |
|
Maturity |
|
Redeemed |
| Debentures |
|
|
|
|
|
| Notes |
|
|
|
|
|
| Notes |
|
|
|
|
|
| Notes |
|
|
|
|
|
| Principal amount |
|
|
|
|
|
| Add net unamortized fair value adjustments |
|
| |||
| Carrying amount |
|
|
|
|
|
The redemption and cash tender offers were funded by using cash on hand and proceeds from the issuance of commercial paper. The total cash spend, including accrued interest, was $
We are subject to certain customary covenants including limitation on liens, merger and change of control covenants, and customary events of default. As calculated in Note 24, we were in compliance with these covenants as at December 31, 2021.
|
|
Short-Term |
|
Long-Term |
|
Lease |
|
|
|
|
Debt |
|
Debt |
|
Liabilities |
|
Total |
| Balance – December 31, 2020 |
|
|
|
|
|
|
|
| Cash flows (cash inflows and outflows presented on a net basis) |
|
|
( |
|
( |
|
( |
| Loss on early extinguishment of debt |
|
|
|
|
|
|
|
| Additions and other adjustments to ROU assets |
|
|
|
|
|
|
|
| Foreign currency translation and other non-cash changes |
|
|
( |
|
( |
|
|
| Balance – December 31, 2021 |
|
|
|
|
|
|
|
| Balance – December 31, 2019 |
|
|
|
|
|
|
|
| Cash flows (cash inflows and outflows presented on a net basis) |
( |
|
|
|
( |
|
( |
| Additions and other adjustments to ROU assets |
|
|
|
|
|
|
|
| Foreign currency translation and other non-cash changes |
|
|
( |
|
|
|
|
| Balance – December 31, 2020 |
|
|
|
|
|
|
|
Nutrien Annual Report 2021 | 106
In millions of US dollars unless otherwise noted
NOTE 19 LEASE LIABILITIES
|
|
Average Rate of Interest (%) |
|
2021 |
|
2020 |
| Lease liabilities - non-current |
|
|
|
|
|
| Current portion of lease liabilities |
|
|
|
|
|
| |
|
|
|
|
|
NOTE 20 PAYABLES AND ACCRUED CHARGES
Payables and accrued charges consist primarily of amounts we owe to suppliers and prepayments made by customers planning to purchase our products for the upcoming growing season.
|
|
2021 |
|
2020 |
| Trade and other payables |
|
|
|
| Customer prepayments |
|
|
|
| Dividends |
|
|
|
| Accrued compensation |
|
|
|
| Current portion of asset retirement obligations and accrued environmental costs (Note 22) |
|
|
|
| Accrued interest |
|
|
|
| Current portion of share-based compensation (Note 5) |
|
|
|
| Current portion of derivatives |
|
|
|
| Income taxes (Note 8) |
|
|
|
| Current portion of pension and other post-retirement benefits (Note 21) |
|
|
|
| Other accrued charges and others |
|
|
|
| |
|
|
|
Nutrien Annual Report 2021 | 107
In millions of US dollars unless otherwise noted
NOTE 21 PENSION AND OTHER POST-RETIREMENT BENEFITS
We offer the following pension and other post-retirement benefits to qualified employees: defined benefit pension plans; defined contribution pension plans; and health, disability, dental and life insurance (referred to as other defined benefit) plans. Substantially all our employees participate in at least one of these plans.
Description of Defined Benefit Pension Plans
|
|
Plan Type |
Contributions |
| United States |
|
|
| Canada |
| |
| Supplemental Plans in US and Canada for Senior Management |
|
|
Our defined benefit pension plans are funded with separate funds that are legally separated from the Company and administered through an employee benefits or management committee in each country, which is composed of our employees. The employee benefits or management committee is required by law to act in the best interests of the plan participants and, in the US and Canada, is responsible for the governance of the plans, including setting certain policies (e.g., investment and contribution) of the funds. The current investment policy for each country’s plans generally does not include any asset/liability matching strategies or currency hedging strategies. Plan assets held in trusts are governed by local regulations and practices in each country, as is the nature of the relationship between the Company and the trustees and their composition.
Description of Other Post-Retirement Plans
We provide health care plans for certain eligible retired employees in the US, Canada and Trinidad. Eligibility for these benefits is generally based on a combination of age and years of service at retirement. Certain terms of the plans include:
We provide non-contributory life insurance plans for certain retired employees who meet specific age and service eligibility requirements.
Nutrien Annual Report 2021 | 108
In millions of US dollars unless otherwise noted
Risks
The defined benefit pension and other post-retirement plans expose us to broadly similar actuarial risks. The most significant risks include investment risk and interest rate risk as discussed below. Other risks include longevity risk and salary risk.
| Investment Risk |
A deficit will be created if plan assets underperform the discount rate used in the defined benefit obligation valuation. To mitigate investment risk, we employ:
Other assets such as private equity and hedge funds are not used at this time. Our policy is not to invest in commodities, precious metals, mineral rights, bullions or collectibles. Investment risk is measured and monitored on an ongoing basis through quarterly investment portfolio reviews, annual liability measurements and periodic asset/liability studies. |
| Interest Rate Risk |
A decrease in bond interest rates will increase the pension liability; however, this is generally expected to be partially offset by an increase in the return on the plan’s debt investments. |
Financial Information
|
|
2021 |
|
2020 | ||||||||
|
|
|
|
Plan |
|
|
|
|
|
Plan |
|
|
|
|
Obligation |
|
Assets |
|
Net |
|
Obligation |
|
Assets |
|
Net |
| Balance – beginning of year |
( |
|
|
|
( |
|
( |
|
|
|
( |
| Components of defined benefit expense recognized in earnings |
|
|
|
|
|
|
|
|
|
|
|
| Current service cost for benefits earned during the year |
( |
|
|
|
( |
|
( |
|
|
|
( |
| Interest (expense) income |
( |
|
|
|
( |
|
( |
|
|
|
( |
| Past service cost, including curtailment gains and settlements 1 |
( |
|
|
|
( |
|
|
|
( |
|
|
| Foreign exchange rate changes and other |
( |
|
( |
|
( |
|
( |
|
( |
|
( |
| Subtotal of components of defined benefit expense (recovery) recognized in earnings |
( |
|
|
|
( |
|
|
|
( |
|
( |
| Remeasurements of the net defined benefit liability recognized in OCI during the year |
|
|
|
|
|
|
|
| |||
| Actuarial gain arising from: |
|
|
|
|
|
|
|
|
|
|
|
| Changes in financial assumptions |
|
|
|
|
|
|
( |
|
|
|
( |
| Changes in demographic assumptions |
|
|
|
|
|
|
|
|
|
|
|
| Gain on plan assets (excluding amounts included in net interest) |
|
|
|
|
|
|
|
|
|
|
|
| Subtotal of remeasurements |
|
|
|
|
|
|
( |
|
|
|
|
| Cash flows |
|
|
|
|
|
|
|
|
|
|
|
| Contributions by plan participants |
( |
|
|
|
|
|
( |
|
|
|
|
| Employer contributions |
|
|
|
|
|
|
|
|
|
|
|
| Benefits paid |
|
|
( |
|
|
|
|
|
( |
|
|
| Subtotal of cash flows |
|
|
( |
|
|
|
|
|
( |
|
|
| Balance – end of year 2 |
( |
|
|
|
( |
|
( |
|
|
|
( |
| Balance comprised of: |
|
|
|
|
|
|
|
|
|
|
|
| Non-current assets |
|
|
|
|
|
|
|
|
|
|
|
| Other assets (Note 16) |
|
|
|
|
|
|
|
|
|
|
|
| Current liabilities |
|
|
|
|
|
|
|
|
|
|
|
| Payables and accrued charges (Note 20) |
|
|
|
|
( |
|
|
|
|
|
( |
| Non-current liabilities |
|
|
|
|
|
|
|
|
|
|
|
| Pension and other post-retirement benefit liabilities |
|
|
|
|
( |
|
|
|
|
|
( |
1 During 2020, we transferred certain pension plan obligations to an insurance company.
2 Obligations arising from funded and unfunded pension plans are $
Nutrien Annual Report 2021 | 109
In millions of US dollars unless otherwise noted
Plan Assets
As at December 31, the fair value of plan assets of our defined benefit pension plans, by asset category, were as follows:
|
|
2021 |
|
2020 | ||||||||
|
|
Quoted Prices |
|
|
|
|
|
Quoted Prices |
|
|
|
|
|
|
in Active |
|
|
|
|
|
in Active |
|
|
|
|
|
|
Markets for |
|
|
|
|
|
Markets for |
|
|
|
|
|
|
Identical Assets |
|
Other 1 |
|
Total |
|
Identical Assets |
|
Other 1 |
|
Total |
| Cash and cash equivalents |
|
|
|
|
|
|
|
|
|
|
|
| Equity securities and equity funds |
|
|
|
|
|
|
|
|
|
|
|
| US 2 |
|
|
|
|
|
|
|
|
|
|
|
| International |
|
|
|
|
|
|
|
|
|
|
|
| Debt securities 2, 3 |
|
|
|
|
|
|
|
|
|
|
|
| Other 2 |
|
|
|
|
|
|
|
|
|
|
|
| Total pension plan assets |
|
|
|
|
|
|
|
|
|
|
|
1 Approximately
2 Certain funds have been reclassified for the year ended December 31, 2020.
3 Debt securities included US securities of
We use letters of credit or surety bonds to secure certain Canadian unfunded defined benefit plan liabilities as at December 31, 2021.
We expect to contribute approximately $
We used the following significant assumptions to determine the benefit obligations and expense for our significant plans as at and for the year ended December 31. These assumptions are determined by management and are reviewed annually by our independent actuaries.
|
|
Pension |
|
Other | ||||||||
|
|
2021 |
|
2020 |
|
|
|
2021 |
|
|
|
2020 |
| Assumptions used to determine the benefit obligations 1 : |
|
|
|
|
|
|
|
|
|
|
|
| Discount rate (%) |
|
|
|
|
|
|
|
|
|
|
|
| Rate of increase in compensation levels (%) |
|
|
|
|
|
|
n/a |
|
|
|
n/a |
| Medical cost trend rate – assumed (%) 2 |
n/a |
|
n/a |
|
|
- |
|
|
|
- |
|
| Medical cost trend rate – year reaches ultimate trend rate |
n/a |
|
n/a |
|
|
|
|
|
|
|
|
| Mortality assumptions (years) 3 |
|
|
|
|
|
|
|
|
|
|
|
| Life expectancy at 65 for a male member currently at age 65 |
|
|
|
|
|
|
|
|
|
|
|
| Life expectancy at 65 for a female member currently at age 65 |
|
|
|
|
|
|
|
|
|
|
|
| Average remaining service period of active employees (years) |
‐ |
|
‐ |
|
|
|
‐ |
|
|
|
‐ |
| Average duration of the defined benefit obligations (years) 4 |
|
|
|
|
|
|
|
|
|
|
|
1 The current year’s expense is determined using the assumptions that existed at the end of the previous year.
2 We assumed a graded medical cost trend rate starting at
3 Based on actuarial advice in accordance with the latest available published tables, adjusted where appropriate to reflect future longevity improvements for each country.
4 Weighted average length of the underlying cash flows.
Nutrien Annual Report 2021 | 110
In millions of US dollars unless otherwise noted
Of the most significant assumptions, a change in discount rates has the greatest potential impact on our pension and other post-retirement benefit plans, with sensitivity to change as follows:
|
|
|
2021 |
|
2020 | ||||
|
|
|
|
|
Expense in |
|
|
|
Expense in |
|
|
|
Benefit |
|
Earnings Before |
|
Benefit |
|
Earnings Before |
|
|
Change in Assumption |
Obligations |
|
Income Taxes |
|
Obligations |
|
Income Taxes |
| As reported |
|
|
|
|
|
|
|
|
| Discount rate |
1.0 percentage point decrease |
|
|
|
|
|
|
|
| |
|
|
|
|
|
|
|
|
NOTE 22 ASSET RETIREMENT OBLIGATIONS AND ACCRUED ENVIRONMENTAL COSTS
A provision is an estimated liability with uncertainty over the timing or amount that will be paid. The most significant asset retirement and environmental remediation provisions relate to costs to restore potash and phosphate sites to their original, or another specified, condition.
The pre-tax risk-free discount rate, expected cash flow payments and sensitivity to changes in the discount rate on the recorded liability for asset retirement obligations and accrued environmental costs as at December 31, 2021, were as follows:
|
|
|
Cash Flow |
|
Discounted |
|
Discount Rate | ||
|
|
|
Payments (years) 1 |
|
Cash Flows 2,3 |
|
+0.5% |
|
-0.5% |
| Asset retirement obligations |
|
|
|
|
|
( |
|
|
| Retail |
|
|
|
|
|
|
|
|
| Potash |
|
|
|
|
|
|
|
|
| Phosphate |
|
|
|
|
|
|
|
|
| Corporate and other 4,5 |
|
|
|
|
|
|
|
|
| Accrued environmental costs |
|
|
|
|
|
( |
|
|
| Retail |
|
|
|
|
|
|
|
|
| Corporate and other |
|
|
|
|
|
|
|
|
| Total |
|
|
|
|
|
|
|
|
1 Time frame in which payments are expected to principally occur from December 31, 2021. Adjustments to the years can result from changes to the mine life and/or changes in the rate of tailings volumes.
2 Risk-free discount rates used to discount cash flows reflect current market assessments of the time value of money and the risks specific to the timing and jurisdiction of the obligation. Risk-free rates range from
3 Total undiscounted cash flows are $
4 For nitrogen sites, we have not recorded any asset retirement obligations as no significant asset retirement obligations have been identified or there is no reasonable basis for estimating a date or range of dates of cessation of operations. We considered the historical performance of our facilities as well as our planned maintenance, major upgrades and replacements, which can extend the useful lives of our facilities indefinitely.
5 Includes certain potash and phosphate sites that are non-operating sites, with the majority of phosphate site payments taking place over the next
Nutrien Annual Report 2021 | 111
In millions of US dollars unless otherwise noted
|
|
Asset |
|
Accrued |
|
|
|
|
Retirement |
|
Environmental |
|
|
|
|
Obligations |
|
Costs |
|
Total |
| Balance – December 31, 2020 |
|
|
|
|
|
| Disposals |
|
|
( |
|
( |
| Additional provisions |
|
|
|
|
|
| Change in estimates |
|
|
( |
|
|
| Settlements |
( |
|
( |
|
( |
| Accretion |
|
|
( |
|
( |
| Foreign currency translation and other |
( |
|
|
|
|
| Balance – December 31, 2021 |
|
|
|
|
|
| Balance – December 31, 2021 comprised of: |
|
|
|
|
|
| Current liabilities |
|
|
|
|
|
| Payables and accrued charges (Note 20) |
|
|
|
|
|
| Non-current liabilities |
|
|
|
|
|
| Asset retirement obligations and accrued environmental costs |
|
|
|
|
|
NOTE 23 SHARE CAPITAL
Authorized
We are authorized to issue an unlimited number of common shares without par value and an unlimited number of preferred shares. The common shares are not redeemable or convertible. The preferred shares may be issued in one or more series with rights and conditions to be determined by the Board of Directors.
Issued
|
|
Number of Common Shares |
|
Share Capital |
| Balance – December 31, 2020 |
|
|
|
| Issued under option plans and share-settled plans |
|
|
|
| Repurchased |
( |
|
( |
| Shares cancellation |
( |
|
|
| |
|
|
|
Nutrien Annual Report 2021 | 112
In millions of US dollars unless otherwise noted
Share Repurchase Programs
|
|
|
|
|
|
Maximum |
|
Maximum |
|
Number of |
|
|
Commencement |
|
|
|
Shares for |
|
Shares for |
|
Shares |
|
|
Date |
|
Expiry |
|
Repurchase |
|
Repurchase (%) |
|
Repurchased |
| 2019 Normal Course Issuer Bid |
|
|
|
|
|
|
|
|
|
| 2020 Normal Course Issuer Bid |
|
|
|
|
|
|
|
|
|
| 2021 Normal Course Issuer Bid 1 |
|
|
|
|
|
|
|
|
|
| 2022 Normal Course Issuer Bid 2 |
|
|
|
|
|
|
|
|
|
1 The 2021 normal course issuer bid will expire earlier than the date above if we acquire the maximum number of common shares allowable or otherwise decide not to make any further repurchases. As of February 15, 2022, an additional
2 On February 16, 2022, our Board of Directors approved a share repurchase program, which is subject to the acceptance by the Toronto Stock Exchange. The 2022 normal course issuer bid will expire earlier than the date above if we acquire the maximum number of common shares allowable or otherwise decide not to make any further repurchases.
Purchases under the normal course issuer bids were, or may be, made through open market purchases at market prices as well as by other means permitted by applicable securities regulatory authorities, including private agreements.
| Summary of share repurchases |
2021 |
|
2020 |
| Number of common shares repurchased for cancellation |
|
|
|
| Average price per share (US dollars) |
|
|
|
| Total cost |
|
|
|
Dividends Declared
|
|
2021 |
|
|
2020 |
| Declared |
Per Share |
|
Declared |
Per Share |
| |
|
|
|
|
| |
|
|
|
|
| |
|
|
|
|
| |
|
|
|
|
|
|
|
|
|
|
On February 16, 2022, our Board of Directors declared an increase to our quarterly dividend to $
Share Cancellation
During 2021, we cancelled
Nutrien Annual Report 2021 | 113
In millions of US dollars unless otherwise noted
NOTE 24 CAPITAL MANAGEMENT
Our capital allocation policy prioritizes safe and reliable operations, a healthy balance sheet, a sustainable dividend to shareholders and a strategy to allocate remaining cash flow that maximizes shareholder value.
We include total debt, adjusted total debt, adjusted net debt and adjusted shareholders’ equity as components of our capital structure. We monitor our capital structure and, based on changes in economic conditions, may adjust the structure by adjusting the amount of dividends paid to shareholders, repurchasing shares, issuing new shares, issuing new debt or retiring existing debt.
We use a combination of short-term and long-term debt to finance our operations. We typically pay floating rates of interest on short-term debt and credit facilities, and fixed rates on notes and debentures.
We monitor the following measures to evaluate our ability to service debt, make strategic investments and ensure we are in compliance with our debt covenants:
|
|
2021 |
|
2020 |
| Adjusted net debt to adjusted EBITDA |
|
|
|
| Adjusted EBITDA to adjusted finance costs |
|
|
|
| Debt to capital (calculated as adjusted total debt to adjusted capital) (Limit: 0.65 : 1.00) |
|
|
|
|
|
Adjusted EBITDA is calculated in Note 3, while the calculation of the remaining components included in the above ratios are set out in the following tables:
|
|
2021 |
|
2020 |
| Short-term debt |
|
|
|
| Current portion of long-term debt |
|
|
|
| Current portion of lease liabilities |
|
|
|
| Long-term debt |
|
|
|
| Lease liabilities |
|
|
|
| Total debt |
|
|
|
| Letters of credit - financial |
|
|
|
| |
|
|
|
Nutrien Annual Report 2021 | 114
In millions of US dollars unless otherwise noted
|
|
2021 |
|
2020 |
| Total debt |
|
|
|
| Cash and cash equivalents |
( |
|
( |
| Unamortized fair value adjustments |
( |
|
( |
| Adjusted net debt |
|
|
|
|
|
2021 |
|
2020 |
| Total shareholders' equity |
|
|
|
| Adjusted total debt |
|
|
|
| Adjusted capital 1 |
|
|
|
1 Restated to reflect 2021 calculation.
|
|
2021 |
|
2020 |
| Finance costs |
|
|
|
| Unwinding of discount on asset retirement obligations |
|
|
( |
| Borrowing costs capitalized to property, plant and equipment |
|
|
|
| Interest on net defined benefit pension and other post-retirement plan obligations |
( |
|
( |
| Loss on early extinguishment of debt |
( |
|
|
| Adjusted finance costs |
|
|
|
In 2020, we filed a base shelf prospectus in Canada and the US qualifying the issuance of up to $
NOTE 25 BUSINESS COMBINATIONS
The Company’s business combinations include various digital agriculture, proprietary products and agricultural services.
|
|
Individually Immaterial Acquisitions |
| Acquisition date |
Various |
| Purchase price, net of cash and cash equivalents acquired |
$
|
| Goodwill and expected benefits of the acquisition |
$ The expected benefits of the acquisitions resulting in goodwill include:
|
| Description |
2021 – |
Nutrien Annual Report 2021 | 115
In millions of US dollars unless otherwise noted
We allocated the following values to the acquired assets and assumed liabilities based upon fair values at their respective acquisition date. The information below represents preliminary fair values. For certain acquisitions, we finalized the purchase price with no material change to the fair values disclosed in prior periods. Refer to Note 30 for details of our valuation technique and judgments applied.
|
|
|
2021 |
|
2020 |
| Receivables |
|
|
|
|
| Inventories |
|
|
|
|
| Prepaid expenses and other current assets |
|
|
|
|
| Property, plant and equipment |
|
|
|
|
| Goodwill |
|
|
|
|
| Other intangible assets |
|
|
|
|
| Other non-current assets |
|
|
|
|
| Total assets |
|
|
|
|
| Short-term debt |
|
|
|
|
| Payables and accrued charges |
|
|
|
|
| Long-term debt, including current portion |
|
|
|
|
| Lease liabilities, including current portion |
|
|
|
|
| Other non-current liabilities |
|
|
|
|
| Total liabilities |
|
|
|
|
| Total consideration, net of cash and cash equivalents acquired |
|
|
|
|
Financial Information Related to the Acquired Operations
| 2021 Proforma (estimated as if acquisitions occurred at the beginning of the year) |
|
|
| Sales |
|
|
| Earnings before finance costs and income taxes |
|
|
| From date of acquisition |
2021 Actuals |
|
2020 Actuals |
| Sales |
|
|
|
| Earnings before finance costs and income taxes |
|
|
|
Nutrien Annual Report 2021 | 116
In millions of US dollars unless otherwise noted
NOTE 26 COMMITMENTS
A commitment is a legally binding and enforceable agreement to purchase goods or services in the future. The amounts below reflect our commitments based on current expected contract prices.
As at December 31, 2021, minimum future commitments under our contractual arrangements were as follows:
|
|
Principal Portion and |
|
|
|
|
|
|
|
| ||
|
|
Estimated Interest |
|
|
|
|
|
|
|
| ||
|
|
Lease |
|
Long-Term |
|
Purchase |
|
Capital |
|
Other |
|
|
|
|
Liabilities |
|
Debt |
|
Commitments |
|
Commitments |
|
Commitments |
|
Total |
| Within 1 year |
|
|
|
|
|
|
|
|
|
|
|
| 1 to 3 years |
|
|
|
|
|
|
|
|
|
|
|
| 3 to 5 years |
|
|
|
|
|
|
|
|
|
|
|
| Over 5 years |
|
|
|
|
|
|
|
|
|
|
|
| Total |
|
|
|
|
|
|
|
|
|
|
|
Purchase Commitments
We have a long-term natural gas purchase agreement in Trinidad that expires on December 31, 2023. The contract provides for prices that vary primarily with ammonia market prices and annual escalating floor prices. The commitments included in the foregoing table are based on floor prices and minimum purchase quantities.
Profertil has various gas contracts denominated in US dollars that expire in 2022 and 2023 and account for virtually all of Profertil’s gas requirements. YPF S.A., our joint venture partner in Profertil, supplies approximately 70 percent of the gas under these contracts.
The Carseland facility has a power co-generation agreement, expiring on December 31, 2026 , which provides 60 megawatt-hours of power per hour. The price for the power is based on a fixed charge adjusted for inflation and a variable charge based on the cost of natural gas provided to the facility for power generation.
Agreements for the purchase of sulfur for use in production of phosphoric acid provide for specified purchase quantities and prices based on market rates at the time of delivery. Commitments included in the foregoing table are based on expected contract prices.
As part of the agreement to sell the Conda Phosphate operations (“CPO”), we entered into long-term strategic supply and offtake agreements that extend to 2023. Under the terms of the supply and offtake agreements, we will supply 100 percent of the ammonia requirements of CPO and purchase 100 percent of the monoammonium phosphate (“MAP”) product produced at CPO. The MAP production is estimated at
Other Commitments
Nutrien Annual Report 2021 | 117
In millions of US dollars unless otherwise noted
NOTE 27 GUARANTEES
In the normal course of business, we provide indemnification agreements to counterparties in transactions such as purchase and sale contracts, service agreements, director/officer contracts, and leasing transactions. The terms of these indemnification agreements
NOTE 28 RELATED PARTY TRANSACTIONS
We transact with a number of related parties, the most significant being with our associates and joint ventures, key management personnel, and post-employment benefit plans.
Sale of Goods
We sell potash outside Canada and the US exclusively through Canpotex. Canpotex sells potash to buyers in export markets pursuant to term and spot contracts at agreed upon prices. Our total revenue is recognized at the amount received from Canpotex representing proceeds from their sale of potash, less net costs of Canpotex. Sales to Canpotex are shown in Note 3. The receivable outstanding from Canpotex is shown in Note 11 and arose from sale transactions described above. It is unsecured and bears no interest. There are no provisions held against this receivable.
Key Management Personnel Compensation and Transactions with Post-Employment Benefit Plans
|
|
2021 |
|
2020 |
| Salaries and other short-term benefits |
|
|
|
| Share-based compensation |
|
|
|
| Post-employment benefits |
|
|
|
| Termination benefits |
|
|
|
| |
|
|
|
Nutrien Annual Report 2021 | 118
In millions of US dollars unless otherwise noted
NOTE 29 CONTINGENCIES AND OTHER MATTERS
Contingent liabilities, which are not recognized in the consolidated financial statements but may be disclosed, are possible obligations as a result of uncertain future events outside of our control or present obligations not recognized because the amount cannot be sufficiently measured or payment is not probable.
Accounting Estimates and Judgments
The following judgments are required to determine our exposure to possible losses and gains related to environmental matters and other various claims and lawsuits pending:
Supporting Information
Canpotex
Nutrien is a shareholder in Canpotex, which markets Canadian potash outside of Canada and the US. Should any operating losses or other liabilities be incurred by Canpotex, the shareholders have contractually agreed to reimburse it in proportion to each shareholder’s productive capacity. Through December 31, 2021, we are not aware of any operating losses or other liabilities.
Mining Risk
The risk of underground water inflows and other underground risks is insured on a limited basis, subject to insurance market availability. Through December 31, 2021, we are not aware of any material losses or other liabilities that we have not accrued for.
Environmental Remediation, Legal and Other Matters
We are engaged in ongoing site assessment and/or remediation activities at a number of facilities and sites. Anticipated costs associated with these matters are added to accrued environmental costs in the manner described in Note 22.
We have established provisions for environmental site assessment and/or remediation matters to the extent that we consider expenses associated with those matters likely to be incurred. Except for the uncertainties described below, we do not believe that our future obligations with respect to these matters are reasonably likely to have a material adverse effect on our consolidated financial statements.
Nutrien Annual Report 2021 | 119
In millions of US dollars unless otherwise noted
Legal matters with significant uncertainties include the following:
In addition, various other claims and lawsuits are pending against the Company in the ordinary course of business. While it is not possible to determine the ultimate outcome of such actions at this time, and inherent uncertainties exist in predicting such outcomes, we believe that the ultimate resolution of such actions is not reasonably likely to have a material adverse effect on our consolidated financial statements.
The breadth of our operations and the global complexity of tax regulations require assessments of uncertainties and judgments in estimating the taxes we will ultimately pay. The final taxes paid are dependent upon many factors, including negotiations with taxing authorities in various jurisdictions, outcomes of tax litigation, and resolution of disputes arising from federal, provincial, state and local tax audits. The resolution of these uncertainties and the associated final taxes may result in adjustments to our tax assets and tax liabilities.
Nutrien Annual Report 2021 | 120
In millions of US dollars unless otherwise noted
NOTE 30 ACCOUNTING POLICIES, ESTIMATES AND JUDGMENTS
The following discusses the significant accounting policies, estimates, judgments and assumptions that we have adopted and applied and how they affect the amounts reported in the consolidated financial statements. Certain of our policies involve accounting estimates and judgments because they require us to make subjective or complex judgments about matters that are inherently uncertain and because of the likelihood that materially different amounts could be reported under different conditions or using different assumptions.
Basis of Consolidation
These consolidated financial statements include the accounts of the Company and entities we control.
| Principal (wholly owned) Operating Subsidiaries |
Location |
Principal Activity |
| Potash Corporation of Saskatchewan Inc. |
Canada |
Mining and/or processing of crop nutrients and corporate functions |
| Agrium Inc. |
Canada |
Manufacturer and distributor of crop nutrients and corporate functions |
| Agrium Canada Partnership |
Canada |
Manufacturer and distributor of crop nutrients |
| Agrium Potash Ltd. |
Canada | |
| Agrium U.S. Inc. |
US | |
| Cominco Fertilizer Partnership |
US | |
| Loveland Products Inc. |
US | |
| Nutrien Ag Solutions Argentina S.A |
Argentina |
|
| Nutrien Ag Solutions (Canada) Inc. |
Canada |
Crop input retailer |
| Nutrien Ag Solutions, Inc. |
US | |
| Nutrien Ag Solutions Limited |
Australia | |
| PCS Nitrogen Fertilizer, LP |
US |
Production of nitrogen products in the US |
| PCS Nitrogen Ohio LP |
US |
Production of nitrogen products in the state of Ohio |
| PCS Sales (USA) Inc. |
US |
Marketing and sales of the Company’s products |
| PCS Nitrogen Trinidad Limited |
Trinidad |
Production of nitrogen products in Trinidad |
| PCS Phosphate Company, Inc. |
US |
Mining and/or processing of phosphate products |
| |
|
|
COVID-19
Nutrien Annual Report 2021 | 121
In millions of US dollars unless otherwise noted
Climate Change
Foreign Currency Transactions
The consolidated financial statements are presented in US dollars, which we determined to be the functional currency of the Company and the majority of our subsidiaries. In determining the functional currency of our operations, we primarily considered the currency that determines the pricing of transactions rather than focusing on the currency in which transactions are denominated.
Assets and liabilities in foreign operations are translated using the period-end rate, while the income and expenses are translated using the average monthly exchange rate. Equity of the foreign operation is translated using the historical rate at the time of the acquisition. Exchange gains and losses resulting from translation are recognized in other comprehensive income and accumulated in a separate reserve within equity. The cumulative amount is reclassified to profit or loss when the foreign operation is disposed of.
Revenue
We recognize revenue when we transfer control over a good or service to a customer.
| Transfer of Control for Sale of Goods |
Transfer of Control for Sale of Services |
| At the point in time when the product is
|
Over time as the promised service is rendered |
Judgment is used to determine whether we are acting as principal or agent by evaluating who:
For transactions in which we act as an agent rather than the principal, revenue is recognized net of any commissions earned. The related commissions are recognized as the sales occur or as unconditional contracts are signed.
We recognize profits on sales to Canpotex when there is a transfer of control, either at the time the product is loaded for shipping or delivered, depending on the terms of the contract. Sales are recognized using a provisional price at the time control is transferred to Canpotex, with the final pricing determined upon Canpotex’s final sale to a third party (generally between one to three months from date of sale to Canpotex).
Nutrien Annual Report 2021 | 122
In millions of US dollars unless otherwise noted
Our sales revenue relating to our Potash, Nitrogen and Phosphate segments is generally recorded and measured based on the “freight on board” mine, plant, warehouse or terminal price specified in the contract (except for certain vessel sales or specific product sales that are shipped and recorded on a delivered basis), which reflects the consideration we expect to be entitled to in exchange for the goods or services, net of any variable consideration (e.g., any trade discounts or estimated volume rebates). Our customer contracts may provide certain product quality specification guarantees but do not generally provide for refunds or returns. Sales prices are based on North American and international benchmark market prices, which are subject to global supply and demand, and other market factors.
For our Retail segment, we do not provide general warranties; however, our customer contracts may provide certain product quality specification guarantees. Returns and incentives are estimated based on historical and forecasted data, contractual terms, and current conditions.
Transportation costs are generally recovered from the customer through sales pricing. Where customer contracts include volume rebates, we estimate revenue at the earlier of when the most likely amount of consideration we expect to receive has been determined or when it is highly probable that a significant reversal will not occur.
Due to the nature of goods and services sold, any single estimate would have only a negligible impact on revenue.
As the expected period between when control over a promised good or service is transferred and when the customer pays for that good or service is generally less than 12 months, we apply the practical expedient as provided in IFRS 15, “Revenue from Contracts with Customers,” and do not adjust the promised amount of consideration for the effects of financing.
Intersegment sales are made under terms that approximate market value.
Share-Based Compensation
For awards with performance conditions that determine the number of options or units to which employees are entitled, measurement of compensation cost is based on our best estimate of the outcome of the performance conditions. Changes to vesting assumptions are reflected in earnings immediately for compensation cost already recognized.
| For Plans Settled Through the Issuance of Equity |
For Plans Settled Through Cash |
|
|
Estimation involves determining:
Nutrien Annual Report 2021 | 123
In millions of US dollars unless otherwise noted
Income Taxes
Taxation on earnings (loss) is comprised of current and deferred income tax. Taxation is recognized in the statements of earnings unless it relates to items recognized either in OCI or directly in shareholders’ equity.
| Current Income Tax |
Deferred Income Tax |
|
|
| Current and deferred income tax assets and liabilities are offset only if certain criteria are met. | |
| The realized and unrealized excess tax benefits from share-based compensation arrangements are recognized in contributed surplus as current and deferred tax, respectively. | |
The final taxes paid, and potential adjustments to tax assets and liabilities, are dependent upon many factors including
Deferred income tax is not accounted for
Deferred tax assets are
Financial Instruments
Financial assets are measured at fair value (either through OCI or through profit or loss) or amortized cost depending on the objective of the business model for managing the instrument or group of instruments and the contractual terms of the cash flows.
For equity investments not held for trading, we may make an irrevocable election at initial recognition to recognize changes in fair value through OCI rather than profit or loss.
Nutrien Annual Report 2021 | 124
In millions of US dollars unless otherwise noted
Financial instruments are classified and measured as follows:
| Fair Value Classification |
Fair Value Through Profit or Loss |
FVTOCI |
Amortized Cost |
| Instrument type |
Cash and cash equivalents, derivatives, and certain equity investments not held for trading |
Certain equity investments not held for trading which an irrevocable election was made |
Receivables, short-term debt, payables and accrued charges, long-term debt, lease liabilities, other long-term debt instruments |
| Fair value gains and losses |
Profit or loss |
OCI |
– |
| Interest and dividends |
Profit or loss |
Profit or loss |
Profit or loss: effective interest rate |
| Impairment of assets |
– |
– |
Profit or loss |
| Foreign exchange |
Profit or loss |
OCI |
Profit or loss |
| Transaction costs |
Profit or loss |
OCI |
Included in cost of instrument |
Financial instruments are recognized at trade date when we commit to purchase or sell the asset. Financial assets are derecognized when the rights to receive cash flow from the investments have expired or we have transferred the rights to receive cash flow and all the risks and rewards of ownership have also been substantially transferred.
Derivatives are used to lock in commodity prices, interest rates and exchange rates. For designated and qualified cash flow hedges
We assess whether our derivatives hedging transactions are expected to be or were highly effective, both at the hedge’s inception and on an ongoing basis, in offsetting changes in fair values of hedged items.
| Hedging Transaction |
Measurement of Ineffectiveness |
Potential Sources of Ineffectiveness |
| New York Mercantile Exchange (“NYMEX”) natural gas hedges |
Assessed on a prospective and retrospective basis using regression analyses |
Changes in:
|
| Foreign exchange and interest rate |
Comparison of the cumulative changes in fair value and the cumulative change in the fair value of a hypothetical derivative with terms based on the hedged forecast cash flows |
Changes in:
|
Financial assets and financial liabilities are offset, and the net amount is presented in the consolidated balance sheets when we
Fair Value Measurements
Estimated fair values for financial instruments are designed to approximate amounts for which the instruments could be exchanged in a current arm’s-length transaction between knowledgeable, willing parties. The valuation policies and procedures for financial reporting purposes are determined by our finance department.
Nutrien Annual Report 2021 | 125
In millions of US dollars unless otherwise noted
Fair value measurements are categorized into different levels within a fair value hierarchy based on the degree to which the lowest level inputs are observable and their significance:
| Level 1 |
Level 2 |
Level 3 |
| Unadjusted quoted prices (in active markets accessible at the measurement date for identical assets or liabilities) |
Quoted prices (in markets that are not active or based on inputs that are observable for substantially the full term of the asset or liability) |
Prices or valuation techniques that require inputs that are both unobservable and significant to the overall measurement |
Fair value estimates
Cash and Cash Equivalents
Receivables
Receivables from customers are recognized initially at fair value and subsequently measured at amortized cost less allowance for expected credit losses of receivables from customers.
Vendors may offer various incentives to purchase products for resale. Vendor rebates and prepay discounts are accounted for as a reduction of the prices of the suppliers’ products. Rebates based on the amount of materials purchased reduce cost of goods sold as inventory is sold. Rebates earned based on sales volumes of products are offset to cost of goods sold.
Rebates that are probable and can be reasonably estimated are accrued. Rebates that are not probable or estimable are accrued when certain milestones are achieved.
Inventories
Inventories are valued monthly at the lower of cost and net realizable value. Costs are allocated to inventory using the weighted average cost method.
Net realizable value is based on
| Products and Raw Materials |
Materials and Supplies |
|
|
Nutrien Annual Report 2021 | 126
In millions of US dollars unless otherwise noted
Property, Plant and Equipment
|
|
Owned |
Right-of-Use (leased) |
| Measurement |
|
|
| Depreciation method |
|
|
|
|
Estimated useful lives, expected patterns of consumption, depreciation method and residual values are reviewed at least annually. | |
| Judgment/practical expedients |
Judgment is required in determining
|
Judgment is required to determine whether a contract or arrangement includes a lease and if it is reasonably certain that an extension option will be exercised. We seek to maximize operational flexibility in managing our leasing activities by including extension options when negotiating new leases. Extension options are exercisable at our option and not by the lessors. In determining if a renewal period should be included in the lease term, we consider all relevant factors that create an economic incentive for us to exercise a renewal, including
Estimation is used to determine the useful lives of ROU assets, the lease term and the appropriate discount rate applied to the lease payments to calculate the lease liability.
|
Nutrien Annual Report 2021 | 127
In millions of US dollars unless otherwise noted
|
|
Owned |
Right-of-Use (leased) |
|
|
Uncertainties are inherent in estimating reserve quantities, particularly as they relate to assumptions regarding future prices, the geology of our mines, the mining methods used, and the related costs incurred to develop and mine reserves. Changes in these assumptions could result in material adjustments to reserve estimates, which could result in impairments or changes to depreciation expense in future periods. |
We have chosen to
|
| Other |
Not applicable. |
Lease agreements do not contain significant covenants; however, leased assets may be used as security for lease liabilities and other borrowings. |
Goodwill and Other Intangible Assets
Goodwill is carried at cost, is not amortized, and represents the excess of the cost of an acquisition over the fair value of the Company’s share of the net identifiable assets of the acquired subsidiary at the date of acquisition. Goodwill is allocated to a CGU or group of CGUs for impairment testing based on the level at which it is monitored by management, and not at a level higher than an operating segment. The allocation is made to the CGU or group of CGUs expected to benefit from the business combination in which the goodwill arose.
Impairment of Long-Lived Assets
To assess impairment, assets are grouped at the smallest levels for which there are separately identifiable cash inflows that are largely independent of the cash inflows from other assets or groups of assets (this can be at the asset or CGU level).
At the end of each reporting period, we review conditions to determine whether there is any indication that an impairment exists that could potentially impact the carrying amounts of both our long-lived assets to be held and used (including property, plant and equipment, and investments), and our goodwill and other intangible assets. When such indicators exist, impairment testing is performed. Regardless, goodwill is tested at least annually (in the fourth quarter).
We review, at each reporting period, for possible reversal of the impairment for non-financial assets, other than goodwill.
Estimates and judgment involves
Nutrien Annual Report 2021 | 128
In millions of US dollars unless otherwise noted
Pension and Other Post-Retirement Benefits
Employee retirement and other defined benefit plans costs, including current and past service costs, gains or losses on curtailments and settlements, and remeasurements, are actuarially determined on a regular basis using the projected unit credit method.
When a plan amendment occurs before a settlement, we recognize past service cost before any gain or loss on settlement.
Our discount rate assumptions are impacted by:
Net actuarial gains or loss incurred during the period for defined benefit plans are closed out to retained earnings at each period-end.
Asset Retirement Obligations and Accrued Environmental Costs
Asset retirement obligations and accrued environmental costs include:
We consider the following factors as we estimate our provisions:
It is reasonably possible that the ultimate costs could change in the future and that changes to these estimates could have a material effect on our consolidated financial statements. We review our estimates for any changes in assumptions at the end of each reporting period.
Nutrien Annual Report 2021 | 129
In millions of US dollars unless otherwise noted
Restructuring Charges
Business Combinations
Purchase price allocation involves judgment in identifying assets acquired and liabilities assumed, and estimation of their fair values. Key assumptions include discount rates and revenue growth rates specific to the acquired assets or liabilities assumed. We performed a thorough review of all internal and external sources of information available on circumstances that existed at the acquisition date. We also engaged independent valuation experts on certain acquisitions to assist in determining the fair value of certain assets acquired and liabilities assumed and related deferred income tax impacts. To determine fair values, we generally use the following valuation techniques:
| Account |
Valuation Technique and Judgments Applied |
| Property, plant and equipment |
Market approach for land and certain types of personal property: sales comparison that measures the value of an asset through an analysis of sales and offerings of comparable assets.
Replacement costs for all other depreciable property, plant and equipment: measures the value of an asset by estimating the costs to acquire or construct comparable assets and adjusts for age and condition of the asset. |
| Other intangible assets |
Income approach – multi-period excess earnings method: measures the value of an asset based on the present value of the incremental after-tax cash flows attributable to the asset after deducting contributory asset charges (“CACs”). Allocation of CACs is a matter of judgment and based on the nature of the acquired businesses’ operations and historical trends.
We considered several factors in determining the fair value of customer relationships, such as customers’ relationships with the acquired company and its employees, the segmentation of customers, historical customer attrition rates, and revenue growth. |
| Other provisions and contingent liabilities |
Decision-tree approach of future costs and a risk premium to capture the compensation sought by risk-averse market participants for bearing the uncertainty inherent in the cash flows of the liability. |
For each business combination, we elect to measure the non-controlling interest in the acquired entity either at fair value or at the proportionate share of the acquiree’s identifiable net assets. Foreign exchange hedge gains or losses which we designated a cash flow hedge are included in the consideration. The gain or loss from the cash flow hedge is deferred in OCI and subsequently recorded as an adjustment to goodwill when the business combination occurs.
Standards, Amendments and Interpretations Effective and Applied
The IASB and IFRS Interpretations Committee (“IFRIC”) have issued certain standards and amendments or interpretations to existing standards that were effective, and we have applied.
In 2021, we have adopted the following amended standards and interpretations with no material impact on our consolidated financial statements:
Nutrien Annual Report 2021 | 130
In millions of US dollars unless otherwise noted
Standards, Amendments and Interpretations Not Yet Effective and Not Applied
The IASB and IFRIC have issued the following standards, amendments or interpretations to existing standards that were not yet effective and not applied as at December 31, 2021.
The following amended standards will be adopted in 2022 and are not expected to have a material impact on our consolidated financial statements:
The following amended standards are being reviewed to determine the potential impact on our consolidated financial statements: