.2

| 2025 | ||
| MANAGEMENT’S | ||
| DISCUSSION AND | ||
| ANALYSIS | ||
.2
| 2025 | ||
| MANAGEMENT’S | ||
| DISCUSSION AND | ||
| ANALYSIS | ||
|
|
Overview | MD&A | Five-year highlights | Financial statements and notes | ||||||||||
|
|
Management’s discussion and analysis
MANAGEMENT’S DISCUSSION AND ANALYSIS
The following management’s discussion and analysis (“MD&A”) is the responsibility of management and is dated as of February 19, 2026.
The Board of Directors (“Board”) of Nutrien carries out its responsibility for review of this disclosure principally through its Audit Committee, comprised exclusively of independent directors. The Audit Committee reviews and, prior to its publication, recommends approval of this disclosure to the Board. The Board has approved this disclosure. The term “Nutrien” refers to Nutrien Ltd. and the terms “we”, “us”, “our”, “Nutrien” and “the Company” refer to Nutrien and, as applicable, Nutrien and its direct and indirect subsidiaries on a consolidated basis. This MD&A should be read together with the Company’s audited consolidated financial statements for the year ended December 31, 2025 (“consolidated financial statements”).
The generally accepted accounting principles (“GAAP”) we use are International Financial Reporting Standards (“IFRS”) as issued by the International Accounting Standards Board, unless otherwise stated.
This MD&A contains certain non-GAAP financial measures and ratios, which do not have a standard meaning under IFRS and, therefore, may not be comparable to similar measures presented by other issuers. Such non-GAAP financial measures and ratios include:
| • |
Adjusted EBITDA |
| • |
Adjusted net earnings and adjusted net earnings per share |
| • |
Effective tax rate on adjusted net earnings guidance |
| • |
Free cash flow |
| • |
Gross margin excluding depreciation and amortization per tonne – manufactured product |
| • |
Potash controllable cash cost of product manufactured per tonne |
| • |
Ammonia controllable cash cost of product manufactured per tonne |
| • |
Retail average working capital to sales and Retail average working capital to sales excluding Nutrien Financial |
| • |
Nutrien Financial adjusted net interest margin |
| • |
Retail cash operating coverage ratio |
| • |
Return on invested capital (“ROIC”) |
| • |
Adjusted net debt |
For definitions, further information and reconciliations of these measures to the most directly comparable measures under IFRS, see the “Non-GAAP financial measures” and “Other financial measures” sections.
This MD&A also contains forward-looking information and forward-looking statements. See the “Forward-Looking Statements” section.
All references to per share amounts pertain to diluted net earnings per share. Financial data in this MD&A is stated in millions of US dollars, which is the functional currency of Nutrien and the majority of its subsidiaries, unless otherwise noted. Information that is not meaningful is indicated by n/m. Information that is not applicable is indicated by n/a. See the “Other financial measures” and “Terms and Definitions” sections for certain definitions, abbreviations, measures and terms used in this MD&A.
Additional information relating to Nutrien (which, except as otherwise noted, is not incorporated by reference herein), including our Annual Information Form for the year ended December 31, 2025, can be found on SEDAR+ at sedarplus.ca and on EDGAR at sec.gov. The Company is a foreign private issuer under the rules and regulations of the US Securities and Exchange Commission (the “SEC”).
The information contained on or accessible from our website or any other website is not incorporated by reference into this MD&A or any other report or document we file with or furnish to applicable Canadian or US securities regulatory authorities.
| 6 Nutrien Annual Report 2025 | ||||
45

| Overview |
MD&A | Five-year highlights | Financial statements and notes |
| ||||||||||
|
|
Our approach to annual reporting
| 8 OUR COMPANY |
16 MARKET |
|||||||||||
| Outlines who we are as a company, where we operate, and our competitive advantages. Describes our strategy, how we delivered in 2025 and our focus going forward.
15 2026 Focus |
Describes factors and trends that influence the environment we operate in.
18 Market overview and fundamentals
|
|||||||||||
| 22 GOVERNANCE |
30 OUR OUTLOOK AND RESULTS |
|||||||||||
| Explains our core corporate governance principles and risk management process and outlines the key enterprise risks that may impact our performance and future operations.
23 Board and executive leadership
For more information on our corporate governance practices, see
For a more detailed discussion of our key enterprise risks and other risks that may have a material effect on us, refer to our 2025 Annual Information Form. |
Provides a review of our operating segments, including market outlook, 2026 guidance and highlights of our overall financial performance.
33 2026 Guidance and sensitivities
34 Operating segments and results
44 Financial results and capital management
56 Appendices |
|||||||||||
Nutrien Annual Report 2025 7

| Overview | MD&A | Five-year highlights | Financial statements and notes |
| ||||||||||
|
|
Our Company profile and
strategy
Nutrien is a leading global provider of crop inputs and services. We operate a world-class network of production, distribution and ag retail facilities that positions us to efficiently serve farmers. Our vision is to be the leading global agricultural solutions provider, delivering superior shareholder value through safe and sustainable operations. To achieve this vision, our strategy is anchored in three priorities: simplify and focus, operational excellence and a disciplined and intentional approach to capital allocation. This strategy is designed to create low-risk, structural free cash flow growth by leveraging our core competencies and to deliver reliable, growing cash returns to shareholders.
Nutrien Annual Report 2025 9


|
Overview | MD&A | Five-year highlights | Financial statements and notes |
| Global profile
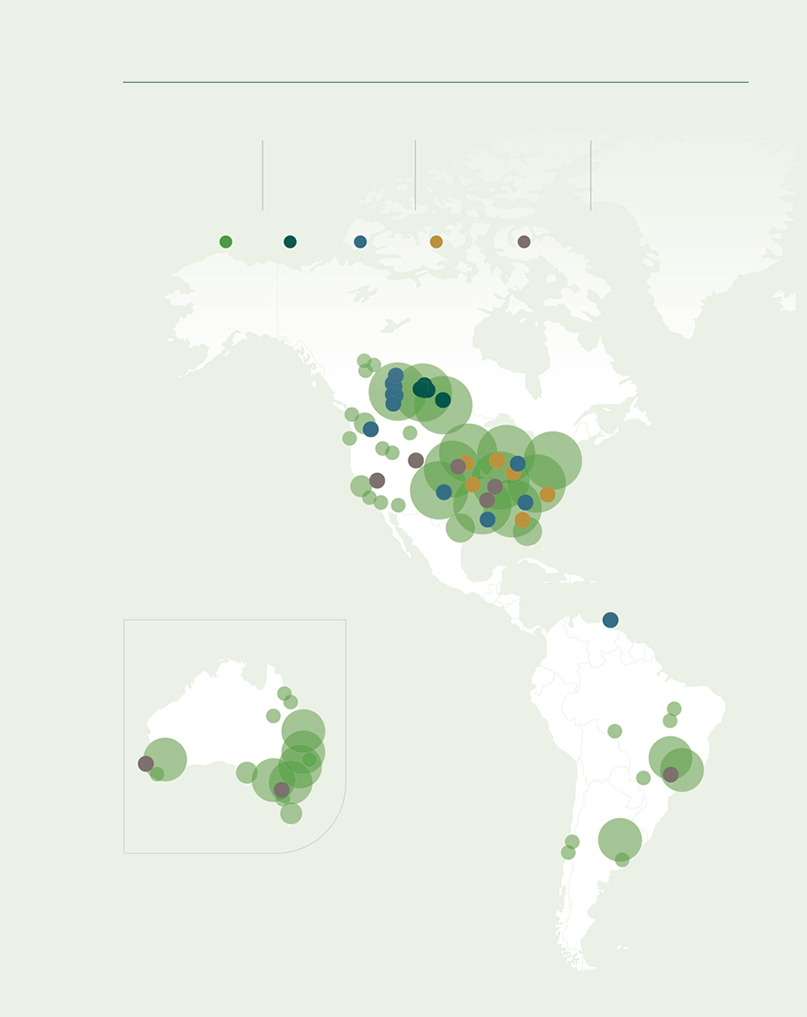
Our upstream fertilizer manufacturing assets are primarily located in North America, with access to high-quality resources, lower-cost inputs and an extensive midstream distribution network to efficiently supply our customers. Our downstream Retail business serves farmers in key agricultural markets in North America, Australia and South America.
SCALE AND ADVANTAGED POSITION ACROSS THE AG VALUE CHAIN |
| #1 | #1 | #2 | ||||
| Global ag retailer | Global potash producer | North American nitrogen producer |
||||
| UNIQUE AND DIVERSE RELATIONSHIP WITH THE FARMER | ||||||
| >50 | >4,200 | >600,000 | ||||
| countries served by our products and services |
crop consultants | customer accounts | ||||
|
PROVEN FINANCIAL STRENGTH AND STABILITY
| ||||||
| World-class assets | High-quality earnings | Strong balance sheet and | ||||
| and market access | through the cycle | track record of returns | ||||
| 10 Nutrien Annual Report 2025 | ||||||
| Overview | MD&A | Five-year highlights | Financial statements and notes |
|
|
Global profile
| >1,800 |
6 | 12 | 6 | |||||
| Retail locations |
Potash mines | Nitrogen facilities | Phosphate facilities |
| Retail | Potash | Nitrogen | Phosphate | Proprietary products |
Australia
Nutrien Annual Report 2025 11
|
|
Overview | MD&A | Five-year highlights | Financial statements and notes | ||||||||||
|
|
Nutrien’s advantage
Our leading position across the ag value chain offers key competitive advantages and differentiation from our competitors. We focus on driving efficiencies across our network, enhancing our relationships with farmers, and strengthening our financial position and resilience.
|
|
|
|||
| SCALE AND ADVANTAGED POSITION ACROSS THE AG VALUE CHAIN
Our global reach provides competitive advantages to support higher upstream sales of manufactured fertilizer and proprietary products, drive supply chain efficiencies, optimize transportation and logistics and efficiently supply our customers. | ||||
|
|
UNIQUE AND DIVERSE RELATIONSHIP WITH THE FARMER
The farmer is at the heart of everything we do and our connection with our customers is unlike any other. Together we are working to improve on-farm productivity and foster innovation to address the demands of a growing global population. | |||
|
|
PROVEN FINANCIAL STRENGTH AND STABILITY
Our business is diversified, which enhances our earnings profile. Our downstream Retail business provides greater stability to our earnings base and counter-cyclical cash flow, while our low-cost upstream fertilizer production assets are positioned to generate significant cash flow, providing the ability to invest in our business and consistently return cash to our shareholders. |
| 12 Nutrien Annual Report 2025 | ||||
| Overview | MD&A | Five-year highlights | Financial statements and notes |
| ||||||||||
|
|
Nutrien’s strategy
Our strategy is centered on three priorities that span our upstream, midstream and downstream businesses.
|
|
||||
| SIMPLIFY AND FOCUS
Simplify our approach to focus on business activities that are core to our long-term vision and explore opportunities to exit non-core activities.
| ||||
|
|
OPERATIONAL EXCELLENCE
Enhance safety, increase operational efficiency and asset utilization, maximize cost savings and improve the quality of earnings. | |||
|
|
DISCIPLINED AND INTENTIONAL CAPITAL ALLOCATION
Optimize the sources and uses of our cash and prioritize sustaining safe and reliable operations, maintaining a strong and flexible balance sheet, strategically investing in our business and increasing cash returns to shareholders. |
| Nutrien Annual Report 2025 13 | ||||
|
|
Overview | MD&A | Five-year highlights | Financial statements and notes | ||||||||||
|
|
2025 Delivery
We delivered significant progress on our strategic priorities and 2026 performance targets.
| SIMPLIFY AND FOCUS
~$900M of total gross proceeds from asset divestitures since the fourth quarter of 2024
~$200M annual cost savings target surpassed through centralization of functions and retail optimizations
Controlled shutdown of Trinidad facility and ceased production at New Madrid upgrade facility
Initiated strategic review of Phosphate business |
OPERATIONAL EXCELLENCE
49% potash ore tonnes mined using automation – more than double 2023 level
92% ammonia operating rate1 – achieved through reliability improvements
Achieved Brazil margin-improvement plan despite challenging market conditions
87% Phosphate P2O5 operating rate for second half of 2025 – improving reliability and cost stewardship |
DISCIPLINED AND INTENTIONAL CAPITAL ALLOCATION
$1.6B in cash returns to shareholders – increase facilitated by ratable buyback program
$2.0B in capital expenditures, driven by risk-orientated approach to capital optimization, continuous improvement initiatives and a focus on leveraging existing assets to deliver organic growth
1.8x adjusted net debt to adjusted EBITDA2 – strengthening our balance sheet |
| 1 | Operating rate represents production volumes divided by production capacity (excluding Joffre and Trinidad facilities). |
| 2 | This is a capital management measure that includes non-GAAP components. See the “Non-GAAP financial measures” and “Other financial measures” sections. |
| 14 Nutrien Annual Report 2025 | ||||
| Overview | MD&A | Five-year highlights | Financial statements and notes |
| ||||||||||
|
|
2026 Focus
We are determined to build on our momentum and deliver stronger performance.
In 2026, we will continue driving the priorities that support structural free cash flow growth:
| • | With streamlined leadership and disciplined organization, we are lowering costs, increasing production through reliability and debottlenecks and enhancing margins by optimizing our midstream and retail network. |
| • | We are improving the resilience and efficiency of our portfolio, all while identifying additional opportunities to increase profitability. |
Enhance safety performance
| • | Safety is a core value – reinforce standards, strengthen accountability and continue building required capabilities to improve safety performance across our operations. |
Grow free cash flow
| • | Deliver upstream fertilizer sales volume growth from our low-cost North American asset base and increase Retail adjusted EBITDA through targeted growth initiatives. |
| • | Strengthen our midstream capabilities, including evaluation of west coast port facility. |
| • | Assess further growth pathways that leverage asset quality and inter-asset synergies to improve margins and reduce costs. |
Reliably increase cash returns to shareholders
| • | Maintain ratable share repurchases that align with free cash flow per share growth and reliable dividend per share increase. |
| • | Continue positioning the balance sheet as a strategic asset. |
Optimize portfolio
| • | Strengthen our world-class asset base, which is a competitive differentiator. |
| • | Complete the strategic review of alternatives for our Phosphate business, assess options for our Trinidad operations and evaluate each component of our Brazilian business to determine the optimal way to participate in the long-term growth in this market. |
| • | Progress optimizing capital on our highest-quality assets and resilient earnings streams. |
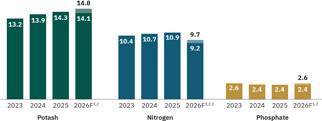
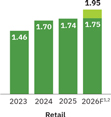
| GROWING FREE CASH FLOW INTO 2026 |
| Upstream manufactured sales volumes guidance
(million tonnes) |
Downstream adjusted EBITDA guidance
($ billions)
| |
|
|
1 Guidance provided in our news release dated February 18, 2026.
2 See the “Forward-looking statements” section.
3 Guidance assumes no production from Trinidad and New Madrid facilities in 2026.
| Nutrien Annual Report 2025 15 | ||||
|
|
Overview | MD&A | Five-year highlights | Financial statements and notes | ||||||||||
|
|
Market environment
ENVIRONMENT
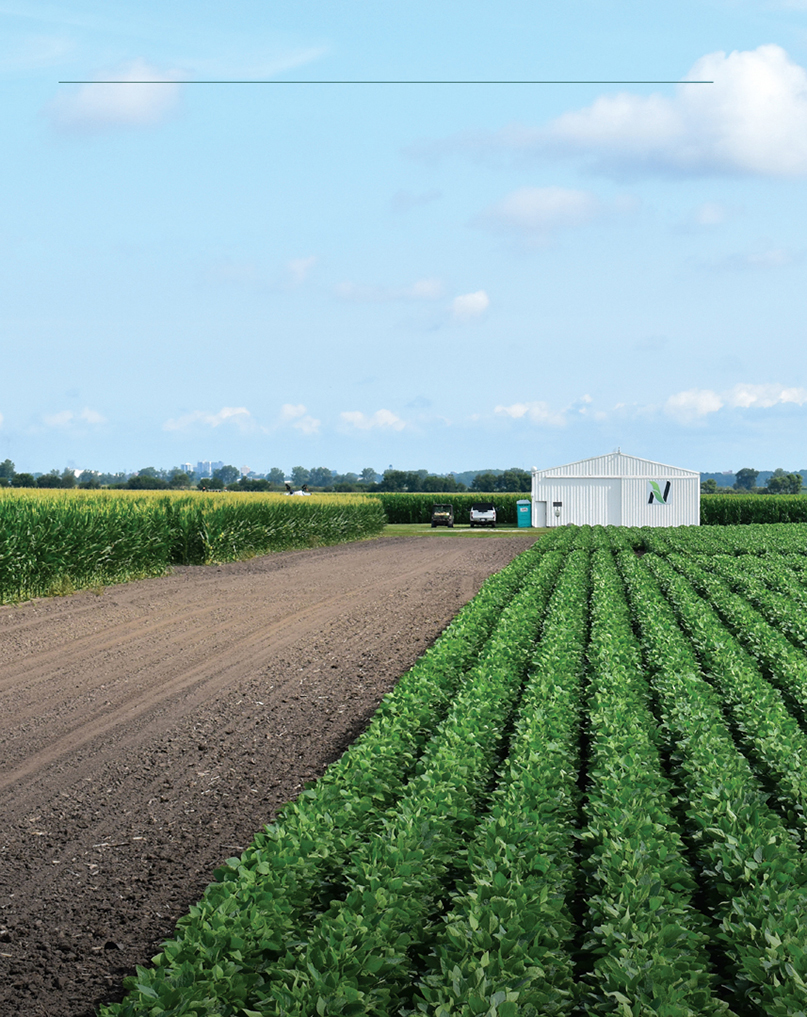
We operate in a rapidly changing world and must anticipate and adapt to our market environment. We seek to understand global markets and broader trends that influence and shape our operational landscape. This understanding helps us to seize new opportunities as they emerge and better identify the risks that could impact our ability to deliver on our strategy.
16 Nutrien Annual Report 2025
| Overview | MD&A | Five-year highlights | Financial statements and notes |
| ||||||||||
|
|
Market environment
Nutrien Annual Report 2025 17
|
|
Overview | MD&A | Five-year highlights | Financial statements and notes | ||||||||||
|
|
Market overview and fundamentals
MARKET OVERVIEW AND FUNDAMENTALS
| Rising global food demand
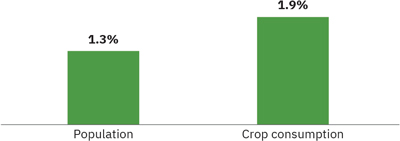
From 2000 to 2025, global food consumption growth outpaced population growth. This increase was driven largely by higher per-capita consumption of animal products, fruits, and oils, particularly in emerging economies where rising incomes and urbanization reshape diets. Looking ahead, as global population continues to rise, arable land per capita is expected to decline. These dynamics underscore the mounting challenge of food security, creating long-term opportunities for farmers and input providers to meet escalating demand amid geopolitical volatility that continues to influence trade flows and commodity pricing. |
Growth in global population vs. crop consumption1,2 (2000–2025 CAGR)
| |
| Driving the need for farming improvements
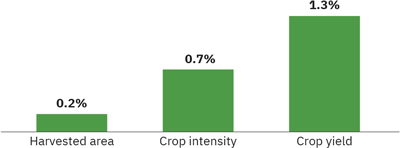
To meet rising consumption, farming practices that include crop inputs, technology and agronomy have evolved significantly, enabling farmers to produce more from finite land. Crop yield, measured as output per unit of land, has been a major contributor to aggregate production growth. Crop intensity, measured as higher rotation of crops each year, has also contributed. Lastly, increases in cropping area have played an important role in meeting historical food consumption growth; however, availability of arable land will limit future growth. This trend underscores the importance of productivity gains as crucial to meet the needs of a growing population. |
Crop growth drivers (2000–2025 CAGR)
| |
| Supported by critical role of crop inputs for growers
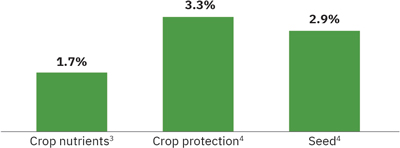
Modern agriculture relies on a tightly integrated set of inputs that include balanced crop nutrition, crop protection, improved seed genetics and agronomy advancements. Collectively, these advancements support yield across seasons by enhancing plant resilience against pests, weeds and environmental stress.
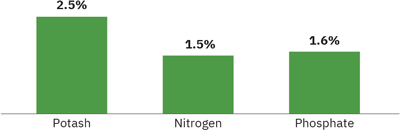
Potash, nitrogen and phosphate are essential to crop production and a cornerstone of agricultural output. Each nutrient plays a distinct role: potash supports water uptake and efficiency of other nutrients, nitrogen improves crop yield and quality and phosphate aids root development. |
Growth in key crop inputs (2000–2024 CAGR)
| |
| Together, they enable farmers to improve crop intensity and achieve higher yields. Looking ahead, fertilizer demand is expected to grow steadily – as global food, feed and fuel demand grows, the need for crop inputs and agronomic services remains a key growth engine for the agricultural supply chain.
1 Global data excludes China. 2 Crop consumption data includes grains, oilseeds, pulses, roots and tubers. 3 Based on annual figures represented on a tonnes basis. 4 Reported data is calculated on the basis of size of global market in $ billions. |
Growth in crop nutrients (2000–2024 CAGR)
Source: Nutrien estimates based on CRU, IFA, IHS, FAO STAT, S&P, USDA | |
| 18 Nutrien Annual Report 2025 | ||||
| Overview | MD&A | Five-year highlights | Financial statements and notes |
| ||||||||||
|
|
Market overview and fundamentals
| Agriculture and retail markets | ||
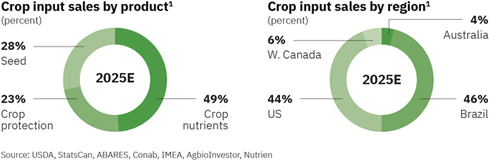
| $127B
2025 crop input sales1 |
| |
| Crop nutrients | ||
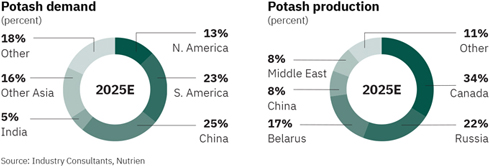
| ~74.5Mmt
2025 global potash (KCl) demand |
| |
| ~167Mmt
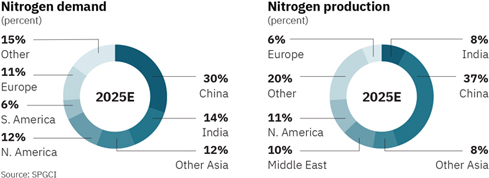
2025 global nitrogen (N) demand |
| |
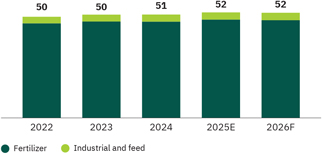
| ~52Mmt
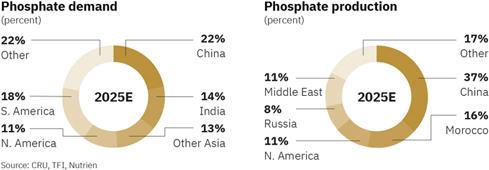
2025 global phosphate (P2O5) demand |
| |
| 1 | Represents total market sales of seed, fertilizer and crop protection products in the US, Canada, Australia and Brazil. |
| Nutrien Annual Report 2025 19 | ||||
|
|
Overview | MD&A | Five-year highlights | Financial statements and notes | ||||||||||
|
|
Market overview and fundamentals
The agriculture retail industry is highly fragmented in most of the major markets in which we operate, and is primarily composed of small and medium-sized competitors. Scale, reliability of supply and the ability to provide innovative products and solutions, including digital offerings, are increasingly important to farmers.
In North America, the primary crops grown include corn, soybeans, wheat, canola and cotton. It is a more mature market, with farmers who are leveraging advanced agriculture tools and are willing and able to invest in high-value products and services. In Australia, our customers require a full suite of crop production inputs and solutions for livestock, water and irrigation services given the more mixed nature of farm operations. Brazil is one of the world’s largest and fastest-growing agriculture markets. It is currently the largest soybean producer and the third largest producer of corn and cotton globally.
Our Proprietary products differentiate our crop input offerings and deliver stronger agronomic outcomes, while contributing to an improved margin profile. We also provide flexible financing solutions aligned with growers’ seasonal cash-flow needs, helping them obtain essential crop inputs and supporting our product and service sales.
Agricultural and retail markets are influenced by short and long-term factors ranging from acreage and crop yield, to crop prices and grower cash margins, to government incentives and trade-flows. Global grains ending stocks-to-use ratio is a key indicator to understand supply tightness and explains price trends for key crops.
Potash strengthens root systems, supporting water uptake and drought and disease tolerance, and increases the efficiency of other nutrients. Potash demand growth is driven by increasing nutrient requirements of higher-yielding crops and improving soil fertility practices, particularly in emerging markets where potash has been historically under-applied and crop yields lag.
High-quality potash reserves in significant quantities are limited to a small number of countries. Canada has the largest known global potash capacity, accounting for approximately 40 percent of the total. Another 35 percent of the world’s potash production capacity is held by Russia and Belarus, making them the next major exporting countries after Canada.
Building new production capacity requires significant capital and time to bring online. The expected cost for a greenfield project, including infrastructure, is over $2,300 per tonne and requires a minimum of 10 years.1 Brownfield projects have a significant per-tonne capital cost advantage over greenfield projects.
Most major potash-consuming countries in Asia and Latin America have limited production capability and rely on imports to meet their needs. Trade typically accounts for approximately three-quarters of demand for potash, resulting in a globally diversified marketplace.
Inflation in operating and logistics costs has increased the short run marginal cost of potash supply and higher capital costs have also impacted the long-run marginal cost.
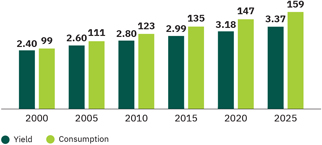
| Yield vs. nutrient consumption2
(tonnes/hectare, million tonnes) |
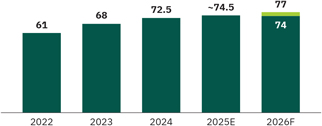
Global potash demand
(million tonnes KCl) | |||
|
| |||
| Source: USDA, IFA, CRU, Nutrien | Source: IFA, Argus, CRU, SPGCI, Nutrien | |||
| 1 | KCl conventional potash mine of 3 million tonnes in Saskatchewan, Canada. Cost includes rail, utility systems, port facilities and, if applicable, cost of deposit. |
| 2 | Global data excludes China. |
| 20 Nutrien Annual Report 2025 | ||||
| Overview | MD&A | Five-year highlights | Financial statements and notes |
| ||||||||||
|
|
Market overview and fundamentals
Nitrogen
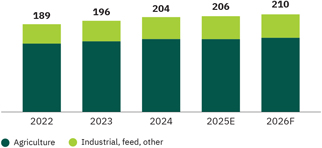
Nitrogen is an essential crop nutrient and is a fundamental building block of plant proteins that improves both crop yield and quality. The necessity of nitrogen for crop yield supports a strong and growing demand for nitrogen fertilizers. Additionally, nitrogen is used as an input in many industrial processes, both as a chemical feedstock and as an inert process gas.
Production of nitrogen products is the most geographically diverse of the three primary crop nutrients due to the widespread availability of hydrogen sources. Access to reliable and competitively priced energy feedstock supply, commonly natural gas, is an important driver of profitability. Geopolitical events continue to create additional volatility in certain global energy markets. North American nitrogen producers currently have an advantaged cost position due to the relatively low price of natural gas compared to competitors in Europe and Asia.
The US is the third largest nitrogen-producing country and remains one of the largest importers of nitrogen products. China and India are the largest consumers of nitrogen fertilizer, accounting for approximately 45 percent of the world’s consumption.
Phosphate
Phosphorus is essential to all living things and is key to energy reactions in plants, particularly photosynthesis, and is vital to plant growth. Additionally, phosphate is used as an input in animal feed, food ingredients and industrial processes.
Phosphate rock is found in significant quantity and quality in only a handful of geographic locations, with only 11 major phosphate-producing countries. Due to the concentration of deposits, the majority of recent capacity additions have come from existing producers in North Africa, the Middle East and China.
China is the world’s largest producer of phosphate, and its trade policy has a major impact on the global market. To illustrate, in 2025, Chinese DAP/MAP exports were down approximately 40 percent, compared to normal historical levels as a result of export restrictions that prioritized domestic use.
India and Brazil are the largest importers of phosphate fertilizers, with limited domestic production. In more mature markets like North America, we have seen continued demand growth for phosphate fertilizers that incorporate secondary nutrients and micronutrients like Nutrien’s MAP+MST product.
| Global ammonia demand
(million tonnes NH3) |
Global P2 O5 demand
(million tonnes P2O5) | |||
|
| |||
| Source: SPGCI, CRU, Argus, Nutrien | Source: CRU, TFI, Industry Consultants, Nutrien | |||
| Nutrien Annual Report 2025 21 | ||||

|
|
Overview | MD&A | Five-year highlights | Financial statements and notes | ||||||||||
|
|
Governance and key enterprise risks
GOVERNANCE AND
KEY ENTERPRISE RISKS
We embed strong corporate governance systems and principles across our business to ensure the interests of shareholders and other stakeholders remain central to our decision making. Our governance supports value preservation and long-term value creation by ensuring that our key enterprise risks and opportunities are appropriately identified and addressed. Nutrien’s corporate governance structure includes policies and processes that clearly define the respective roles of the Board and the Executive Leadership Team (“ELT”). Our Board provides oversight of corporate strategy execution and risk management.
22 Nutrien Annual Report 2025

| Overview |
MD&A | Five-year highlights | Financial statements and notes |
| ||||||||||
|
|
Governance and key enterprise risks
BOARD OF DIRECTORS

|

|

|

|

|

| |||||
| Russell Girling |
Ken Seitz |
Christopher Burley |
Maura Clark |
Michael Hennigan |
Miranda Hubbs | |||||
| Chair |
President and Chief |
Director |
Director |
Director |
Director | |||||
| Executive Officer |
||||||||||

|

|

|

|

|

| |||||
| Raj Kushwaha |
Julie Lagacy |
Consuelo Madere |
Keith Martell |
Aaron Regent |
Nelson L.C. Silva | |||||
| Director |
Director |
Director |
Director |
Director |
Director | |||||
EXECUTIVE LEADERSHIP TEAM

|

|

|

|

|

| |||||
| Ken Seitz |
Noralee Bradley |
Andrew Kelemen |
Chris Reynolds |
Mark Thompson |
Sarah Walters | |||||
| President and Chief |
Executive Vice |
Executive Vice |
Executive Vice |
Executive Vice |
Executive Vice | |||||
| Executive Officer |
President, External |
President, Corporate |
President, Global Sales |
President and Chief |
President, IT and | |||||
| Affairs, Chief Legal |
Development and |
Financial Officer |
Chief People Officer | |||||||
| Officer and Corporate |
Chief Strategy Officer |
|||||||||
| Secretary |
||||||||||
Nutrien Annual Report 2025 23
|
|
Overview | MD&A | Five-year highlights | Financial statements and notes | ||||||||||
|
|
Risk governance
Risk management is an integral part of doing business and our Board is responsible for overseeing the execution and alignment of Nutrien’s corporate strategy and risk management processes.
Nutrien’s ELT has the responsibility of ensuring the Company’s principal risks are being appropriately identified, assessed and addressed. Management keeps the Board and each of the Board committees regularly apprised of risks and developments relevant to their mandates.
Responsibility and accountability for risk management are embedded in all levels of our organization, and we strive to integrate risk management into key decision-making processes and strategies. By proactively assessing risk across our organization, we aim to effectively manage the risks that could have an impact on our ability to achieve our strategic objectives and deliver long-term value.
Role of the Board committees
While the Board as a whole oversees our strategy and risk management processes, each Board committee has oversight over business topics and certain risk areas relevant to their committee mandate. More information can be found in Nutrien’s Board and Board committee charters on our website at nutrien.com.
| Board/Board Committee
|
Oversight includes the following business topics or risk areas
| |||
| Board of Directors |
Corporate strategy |
Risk management | ||
| Oversight of safety, health, environmental and security matters |
Human resources and compensation | |||
| Corporate governance and compliance | ||||
| Safety Committee |
Health and safety risks |
Environmental risks | ||
| Crisis and emergency response management |
Process safety and operational integrity | |||
| Incident reporting and response |
Regulatory and compliance risk | |||
| Safety culture and performance | ||||
| Audit Committee |
Accounting and financial reporting |
Whistleblower, ethics and compliance | ||
| Internal controls and disclosure controls |
Financial risk management | |||
| Internal audit |
External audit | |||
| Corporate Governance & |
Corporate governance |
Board evaluations | ||
| Nominating Committee |
Board composition |
Activities that maintain or enhance the ability to create value over the long term (including oversight of climate-related risks) | ||
| Director compensation | ||||
| Director orientation and continuing education | ||||
| Stakeholder and Indigenous relations |
Cybersecurity, artificial intelligence (“AI”) and | |||
| data governance | ||||
| Related-party transactions | ||||
| Human Resources & |
Executive compensation |
Human capital management, including the Company’s Indigenous Strategy as it relates to Indigenous employment and human resources | ||
| Compensation Committee |
Incentive plan design and performance metrics | |||
| Succession planning | ||||
| Talent management and leadership |
Learning and development | |||
| development |
||||
| 24 Nutrien Annual Report 2025 | ||||
| Overview | MD&A | Five-year highlights | Financial statements and notes |
| ||||||||||
|
|
Risk management process
Risk management is embedded in our strategy and business processes to support informed decision making and responsible stewardship of resources. Our centralized Enterprise Risk Management program is guided by a global risk management framework. The framework promotes consistent and integrated application of risk management principles and practices across our organization.
Nutrien’s operating segments and corporate functions use our global risk management framework to identify, assess and develop mitigation actions for risks that may affect their strategy, operations or future performance. Annually, we conduct a top-down enterprise risk assessment alongside a bottom-up risk assessment, resulting in a consolidated view of our risk profile.
Management evaluates risk holistically to understand Nutrien’s overall risk landscape and the interconnections among risks. A comprehensive view of enterprise risks is evaluated by our ELT and senior leaders, and our key enterprise risks are presented to the Board at least annually.

| Nutrien Annual Report 2025 25 | ||||
|
|
Overview | MD&A | Five-year highlights | Financial statements and notes | ||||||||||
|
|
Key enterprise risks
We characterize a key enterprise risk as an individual risk, or combination of risks, that could materially affect our ability to achieve our strategic objectives, deliver shareholder value or maintain operational and financial stability. Our key enterprise risks presented below represent our most significant exposures; however, we continue to be exposed to other important general business, financial and operational risks.
| 1 | COMPETITION AND MACROECONOMIC CONDITIONS |
| Description
Changes in global macroeconomic conditions and market dynamics – including tariffs, trade or export restrictions, market volatility, geopolitical events, increased price competition or new competitors or major shifts in agriculture production or consumption – could lead to a sustained environment of reduced demand for our products, create lower or more volatile commodity prices or increase costs and thereby negatively affect our short- and long-term profitability. |
Risk management approach
We operate across the ag value chain with a favorable cost structure and a diversified portfolio of products and services that help minimize the impact of changing market conditions. Additionally, we maintain a strong and flexible balance sheet and pursue a clearly identified strategy that aims to enhance key advantages of our core business and drive operational excellence.
See page 18 of this report for more information on our market environment. |
| 2 | CHANGING REGULATIONS |
| Description
Changes in laws, regulations or government policies – including those relating to the environment, climate change, data privacy, health and safety, taxes and royalties, or from pressure on lawmakers and regulators to address concerns related to fertilizer and food prices – can affect how we operate. New requirements may limit our ability to produce or sell certain products, reduce our efficiency, increase costs for materials, energy, transportation or compliance or require upgrades to our facilities. These and other factors could impact our strategy, operations, financial results or reputation. |
Risk management approach
We maintain regular engagement with governments, regulators and key industry associations through our Government & External Affairs Team. This helps us to stay informed about policy and regulatory developments, anticipate their impacts and work with industry partners to support outcomes that enable our long-term success. We also use cross-functional compliance programs and internal reviews to assess potential impacts and ensure our operations and products meet evolving requirements. |
| 26 Nutrien Annual Report 2025 | ||||
| Overview | MD&A | Five-year highlights | Financial statements and notes |
| ||||||||||
|
|
Key enterprise risks
| 3 | POLITICAL, ECONOMIC AND SOCIAL INSTABILITY |
| Description
Nutrien operates a global business with significant operations in Canada and the US and additional operations in Australia, South America, Trinidad and parts of Europe. Operating internationally exposes us to political, economic and social instability that can affect how we do business.
These risks include, but are not limited to, restrictions on moving money out of certain countries, inflation or government actions aimed at controlling inflation, currency exchange rate fluctuations between the US dollar and foreign currencies, labor disruptions, competitive restrictions and changes to or loss of important agreements or permits. We may also be affected by tariffs, sanctions, embargoes, trade barriers, exchange controls,forced divestitures or broad geopolitical events such as military conflict. Shifts in political or regulatory environments can disrupt our operations or ability to do business, affect the value of our assets and impact our financial performance. |
Risk management approach
Our Government & External Affairs Team engages regularly with governments, regulators, industry associations and other stakeholders in the regions where we operate or plan to operate. We factor political and country-specific risks into our capital investment and project decisions and limit our exposure in jurisdictions where we believe the risk is too high. We also monitor global political and regulatory developments and trends to understand potential impacts on our business. |
| 4 | AGRICULTURAL CHANGES AND TRENDS |
| Description
The agricultural landscape is impacted by factors such as ongoing farm and industry consolidation, shifts in farmer demographics, new technologies, evolving sustainability practices, changing government programs and policies, trade disputes and trade tariffs, climate impacts and broader social trends. Many of these factors vary by region and can affect long-term demand for our products and services and as a result may adversely affect our strategy and our financial performance. |
Risk management approach
Our downstream Retail network gives us direct insight into what farmers need, allowing us to anticipate emerging trends early and respond quickly. We focus on delivering solutions that help farmers manage challenges, including offering financing solutions through Nutrien Financial, expanding our portfolio of proprietary products and investing in digital tools, agronomic expertise and technologies that improve productivity and on-farm decision making. |
| Nutrien Annual Report 2025 27 | ||||
|
|
Overview | MD&A | Five-year highlights | Financial statements and notes | ||||||||||
|
|
Key enterprise risks
| 5 | SUPPLY CHAIN DISRUPTION |
| Description
Our ability to produce and deliver products depends on reliable inbound and outbound supply chains. Disruptions can affect our access to key materials or limit our ability, as well as the ability of third parties we depend on, to transport products to customers on time. Geopolitical conflicts, regulatory changes, sanctions, tariffs, labor disputes, pandemics and extreme weather events can create supply chain challenges and delays and/or limit our future ability to sell or distribute our products when needed. These challenges can negatively affect our business and financial performance. |
Risk management approach
Our scale and advantaged position across the ag value chain provides us the flexibility to optimize our operations and distribution network in response to supply chain disruptions. We have an extensive and diverse transportation and storage network that helps us navigate logistical challenges. We also maintain a diverse supplier base that we regularly review to ensure we have reliable access to critical feedstocks and materials for our operations. |
| 6 | CYBERSECURITY THREATS |
| Description
Nutrien relies on information technology, operational control systems and third-party or cloud-based platforms to run our business. As our dependence on these systems grows, so does our exposure to increasingly sophisticated cyber threats, including those driven by AI. Cybersecurity risks can include attacks on information technology and infrastructure by hackers, ransomware, viruses, unauthorized access to confidential or personal information, disruptions to computer control systems and broader business or supply chain interruptions. A cyber incident could lead to operational downtime, higher security or insurance costs, reputational harm, legal or third-party claims and other impacts that could negatively affect our business and financial performance. |
Risk management approach
Our Global Information Management and Cyber Security Team, supported by third-party specialists, oversees our network security and helps coordinate incident response when needed. We promote strong cybersecurity awareness across the Company through our cybersecurity policies, controls and best practices. All new information technology systems undergo threat and risk assessments, and our incident response processes are reinforced by external support. We also run regular phishing simulations and targeted cybersecurity and incident response training to help reduce vulnerabilities. |
| 7 | SAFETY, HEALTH AND ENVIRONMENT |
| Description
Our operations involve safety, health and environmental risks inherent in mining, manufacturing and the transportation, storage and distribution of our products. These risks can lead to injuries or fatalities and may affect air quality, biodiversity, water resources or local ecosystems near our sites. Any such incident could disrupt our operations and have a negative impact on our financial performance and reputation. |
Risk management approach
We follow regulatory, industry and internal safety, health and environmental standards, supported by strong governance and oversight. We have structured systems to prevent and respond to incidents, and we conduct regular security and vulnerability assessments. Across our operations, we maintain crisis communication and emergency response programs, along with environmental monitoring and controls, including independent reviews of key containment structures. |
| 28 Nutrien Annual Report 2025 | ||||
| Overview | MD&A | Five-year highlights | Financial statements and notes |
| ||||||||||
|
|
Key enterprise risks
| 8 | TALENT AND ORGANIZATIONAL CULTURE |
| Description
Our ability to attract, develop and retain skilled employees, as well as maintain the programs, structure and culture that support them, is essential to our growth and performance. Increasing competition for talent, particularly in certain regions or for specialized roles, can create challenges in hiring or retaining employees and increase costs and reduce productivity. Our investment in training also makes our employees valuable to competitors. If we are unable to sustain an engaging workplace or retain the talent needed to support our operations and future growth, our operations and financial performance could be negatively affected. |
Risk management approach
Our Talent Attraction and Sourcing Team works to build a diverse, skilled workforce, while our development programs support employee growth and engagement. We use a structured succession process to identify critical roles and strengthen our internal and external talent pipelines. Our compensation and incentive programs are competitive, performance-based and aligned with our purpose-driven culture. |
| 9 | CAPITAL REDEPLOYMENT |
| Description
We may be unable to deploy capital to efficiently achieve sustained growth, effectively execute on opportunities or meet stakeholder expectations. This risk may arise from market conditions, limited investment opportunities or other factors. Additionally, deploying capital in a manner that is inconsistent with our strategic priorities could negatively impact our returns, operations, reputation, access to or cost of capital or result in potential asset impairments. |
Risk management approach
Our capital allocation is guided by a disciplined framework and supported by Nutrien’s diversified earnings base. We focus on sustaining safe and reliable operations, preserving balance sheet strength and flexibility, deploying capital to strategic investments and providing meaningful returns to our shareholders. Additionally, our centralized Enterprise Capital Team helps to ensure consistent project evaluation and an enterprise-wide view of capital project decisions. |
| 10 | STAKEHOLDER SUPPORT |
| Description
Nutrien’s reputation and stakeholder relationships are critical to our ability to operate and execute our strategy and can be affected by actual or perceived actions across our business and supply chain. Any erosion of trust could impair our ability to execute on our business plans. It could also negatively impact our ability to produce or sell our products, lead to reputational and financial losses or negatively impact our access to or cost of capital or trigger shareholder action. |
Risk management approach
Our Investor Relations and Government & External Affairs teams regularly engage with key stakeholders to identify their concerns and convey the long-term value proposition of our business. We are active in industry associations, implement our community relations and investment initiatives across our operations and have a focused Indigenous Relations engagement strategy. Our overarching strategy is designed to address and support the areas most important to our stakeholders. |
| Nutrien Annual Report 2025 29 | ||||
|
|
Overview | MD&A | Five-year highlights | Financial statements and notes | ||||||||||
|
|
Our outlook and results
RESULTS
Nutrien has four reportable operating segments: Retail, Potash, Nitrogen and Phosphate. The downstream Retail segment distributes crop nutrients, crop protection products, seed and merchandise and provides services, including financing, directly to farmers through a network of retail locations in North America, Australia and South America. The upstream Potash, Nitrogen and Phosphate segments are differentiated by the chemical nutrient contained in the products that each produces.
30 Nutrien Annual Report 2025
| Overview |
MD&A | Five-year highlights | Financial statements and notes |
| ||||||||||
|
|
Our outlook and results
Adjusted EBITDA is the primary profit measure used to evaluate the segments’ performance as it excludes the impact of non-cash impairments and impairment reversals and other costs that are centrally managed by our corporate function. Refer to Note 3 to the consolidated financial statements for details.
Net sales (sales less freight, transportation and distribution expenses) is the primary measure used in planning and forecasting in the Potash, Nitrogen and Phosphate operating segments.
Nutrien Annual Report 2025 31
|
|
Overview | MD&A | Five-year highlights | Financial statements and notes | ||||||||||
|
|
Market outlook
Agriculture and retail markets
| • | Higher global grain and oilseed production in 2025 increased stocks-to-use ratios towards historical average levels and led to significant nutrient removal from the soil. Strong demand for food, feed and biofuel uses is expected to drive continued need for higher global crop production and related crop inputs. |
| • | We expect total US crop acres in 2026 to be consistent with 2025 levels and project corn plantings of 94 to 96 million acres and soybean plantings of 84 to 86 million acres. This acreage outlook, combined with a compressed fertilizer application season in the fall of 2025, is expected to support increased crop input demand in the first half of 2026. |
| • | In Brazil, soybean production is expected to set another record in 2026, with harvest currently underway, and we anticipate a 3 to 5 percent increase in safrinha corn plantings. Growth in planted area is expected to support crop input demand; however, weaker affordability is expected to result in just-in-time purchases and a continued shift to lower analysis nitrogen and phosphate products. |
| • | In Australia, improved weather compared to the first half of 2025 is expected to support crop input demand and strong livestock prices to support sales of Retail products and services. |
Crop nutrient markets
| • | Global potash shipments increased to approximately 74.5 million tonnes in 2025, primarily driven by strong demand in Southeast Asia. We expect a fourth consecutive year of growth in 2026, with total global potash shipments ranging between 74 and 77 million tonnes. Demand is supported by the need to replenish soil nutrients following a record crop, favorable relative affordability and low inventory levels in key markets such as China and Brazil. We anticipate relatively tight fundamentals throughout 2026, as trend line demand growth is testing existing global operating and supply chain capabilities. |
| • | Global nitrogen demand is expected to grow in line with historical rates, driven by increasing use in agricultural growth markets such as Asia and Latin America. Global ammonia markets remain tight due to project delays and plant outages. Global urea markets have strengthened in the first quarter of 2026 due to strong seasonal demand from India, North America and Brazil and geopolitical uncertainties impacting supply. |
| • | Global phosphate markets eased in the fourth quarter of 2025 due to lower demand related to weaker affordability relative to potash and nitrogen. Phosphate markets have strengthened in the first quarter of 2026 due to Chinese export restrictions and elevated input costs. |

| 32 Nutrien Annual Report 2025 | ||||
| Overview | MD&A | Five-year highlights | Financial statements and notes |
| ||||||||||
|
|
2026 Guidance and sensitivities
|
|
2026 Guidance ranges1,2 as of
February 18, 2026
|
|
||||||||||
| ($ billions, except as otherwise noted)
|
|
Low
|
|
|
High
|
|
|
2025 Actual
|
| |||
|
Retail adjusted EBITDA |
|
1.75 |
|
|
1.95 |
|
|
1.74 |
| |||
| Potash sales volumes (million tonnes)3 |
14.1 | 14.8 | 14.25 | |||||||||
| Nitrogen sales volumes (million tonnes)3 |
9.2 | 9.7 | 10.89 | |||||||||
| Phosphate sales volumes (million tonnes)3 |
2.4 | 2.6 | 2.36 | |||||||||
| Depreciation and amortization |
2.4 | 2.5 | 2.4 | |||||||||
| Finance costs |
0.65 | 0.75 | 0.7 | |||||||||
| Effective tax rate on adjusted net earnings (%)4 |
24.0 | 26.0 | 24.9 | |||||||||
| Capital expenditures5 |
2.0 | 2.1 | 2.0 | |||||||||
| 1 | Guidance provided in our news release dated February 18, 2026. |
| 2 | See the “Forward-looking statements” section. |
| 3 | Manufactured product only. |
| 4 | This is a non-GAAP financial measure. See the “Non-GAAP financial measures” section. |
| 5 | Comprised of sustaining capital expenditures, investing capital expenditures and mine development and pre-stripping capital expenditures, which are supplementary financial measures. See the “Other financial measures” section. |
2026 SENSITIVITIES
|
|
Effect on1
|
| ||||||
| ($ millions, except EPS amounts)
|
|
Adjusted EBITDA
|
|
|
Adjusted EPS
|
4
| ||
| $25 per tonne change in potash net selling prices |
± 280 | ± 0.45 | ||||||
| $25 per tonne change in ammonia net selling prices2 |
± 35 | ± 0.05 | ||||||
| $25 per tonne change in urea and ESN® net selling prices |
± 65 | ± 0.10 | ||||||
| $25 per tonne change in solutions, nitrates and sulfates net selling prices |
± 135 | ± 0.20 | ||||||
| $1 per MMBtu change in NYMEX natural gas price3 |
± 180 | ± 0.30 | ||||||
| 1 | See the “Forward-looking statements” section. |
| 2 | Excludes Trinidad. |
| 3 | Nitrogen related impact. |
| 4 | Based on shares outstanding as at December 31, 2025. |
| Nutrien Annual Report 2025 33 | ||||
|
|
Overview | MD&A | Five-year highlights | Financial statements and notes | ||||||||||
|
|
Results
2025 RETAIL OPERATING SEGMENT AND RESULTS
Our Retail network of over 1,800 locations provides the reach and flexibility to reliably serve our grower customers. We offer a comprehensive portfolio of value-added products, including crop nutrients, crop protection products, seed and merchandise, and provide services, including financing. Over 4,200 crop consultants support our customers with crop planning, seed selection, soil sampling, variable-rate fertilizer application and crop monitoring.
We own and operate eight formulation facilities focused on manufacturing proprietary crop nutrient and crop protection products. As a leading provider of crop nutritionals, including biostimulants, our portfolio includes approximately 1,700 innovative proprietary crop nutrient, crop protection and seed products. Our proprietary offering generates higher margins for Nutrien and enhances crop production efficiency and profitability for farmers.
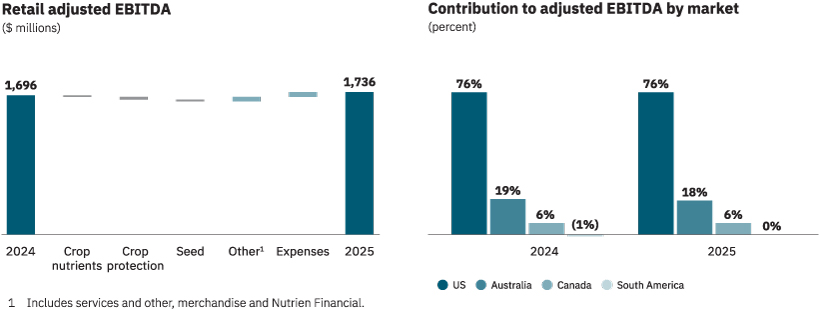
Retail adjusted EBITDA increased to $1.74 billion in 2025 due to lower operating expenses from our cost savings initiatives, stronger proprietary products gross margin and disciplined execution of our Brazil margin-improvement plan. We continue to simplify our business and deliver earnings growth through proven organic initiatives.
| ($ millions, except as otherwise noted) | 2025 | 2024 | % Change | |||||||||
| Sales |
17,620 | 17,832 | (1 | ) | ||||||||
| Cost of goods sold |
13,017 | 13,211 | (1 | ) | ||||||||
| Gross margin |
4,603 | 4,621 | – | |||||||||
| Adjusted EBITDA1 |
1,736 | 1,696 | 2 | |||||||||
| 1 | See Note 3 to the consolidated financial statements. |
| Sales | Gross margin | |||||||||||||||
| ($ millions) | 2025 | 2024 | 2025 | 2024 | ||||||||||||
| Crop nutrients |
7,285 | 7,211 | 1,424 | 1,444 | ||||||||||||
| Crop protection products |
6,105 | 6,313 | 1,590 | 1,622 | ||||||||||||
| Seed |
2,128 | 2,235 | 408 | 431 | ||||||||||||
| Services and other |
944 | 918 | 750 | 716 | ||||||||||||
| Merchandise |
875 | 897 | 148 | 150 | ||||||||||||
| Nutrien Financial |
376 | 361 | 376 | 361 | ||||||||||||
| Nutrien Financial elimination1 |
(93 | ) | (103 | ) | (93 | ) | (103 | ) | ||||||||
| Total |
17,620 | 17,832 | 4,603 | 4,621 | ||||||||||||
| 1 | Represents elimination of the interest and service fees charged by Nutrien Financial to Retail branches. |
Supplemental data
| Gross margin | % of product line1 | |||||||||||||||
| ($ millions, except as otherwise noted) | 2025 | 2024 | 2025 | 2024 | ||||||||||||
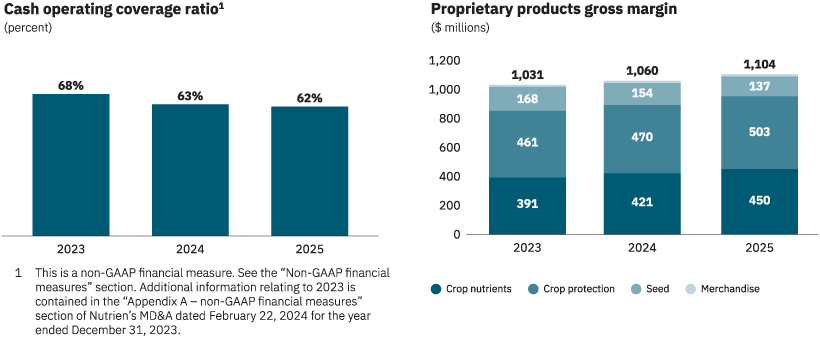
| Proprietary products |
||||||||||||||||
| Crop nutrients |
450 | 421 | 32 | 29 | ||||||||||||
| Crop protection products |
503 | 470 | 32 | 29 | ||||||||||||
| Seed |
137 | 154 | 34 | 36 | ||||||||||||
| Merchandise |
14 | 15 | 9 | 10 | ||||||||||||
| Total |
1,104 | 1,060 | 24 | 23 | ||||||||||||
| 1 | Represents percentage of proprietary product margins over total product line gross margin. |
34 Nutrien Annual Report 2025
| Overview | MD&A | Five-year highlights | Financial statements and notes |
| ||||||||||
|
|
Results
| Sales volumes (tonnes – thousands) |
Gross margin / tonne (dollars) |
|||||||||||||||
|
|
2025 | 2024 | 2025 | 2024 | ||||||||||||
| Crop nutrients |
||||||||||||||||
| North America |
8,502 | 8,547 | 143 | 142 | ||||||||||||
| International |
3,358 | 3,715 | 61 | 62 | ||||||||||||
| Total |
11,860 | 12,262 | 120 | 118 | ||||||||||||
|
|
2025 versus 2024 | |
| Crop nutrients |
Sales increased due to higher selling prices, and gross margin was impacted by product mix shifts in North America and reduced demand in the fourth quarter. International crop nutrient sales volumes were lower mainly due to strategic actions in South America. | |
| Crop protection products |
Sales and gross margin were lower due to product mix shifts in North America and dry conditions in Australia, partially offset by higher proprietary products gross margin. | |
| Seed |
Sales and gross margin were lower due to weather related impacts in the Southern US leading to fewer planted acres, which impacted proprietary products gross margin. | |
Nutrien Annual Report 2025 35
|
|
Overview | MD&A | Five-year highlights | Financial statements and notes | ||||||||||
|
|
Results
Selected financial performance measures
| (percentages) | 2025 | 2024 | ||||||
| Retail adjusted EBITDA margin1 |
9.9 | 9.5 | ||||||
| Cash operating coverage ratio2 |
62 | 63 | ||||||
| Average working capital to sales2 |
22 | 20 | ||||||
| Average working capital to sales excluding Nutrien Financial2 |
1 | – | ||||||
| Nutrien Financial adjusted net interest margin2 |
5.4 | 5.3 | ||||||
| 1 | This is a supplementary financial measure. See the “Other financial measures” section. |
| 2 | This is a non-GAAP financial measure. See the “Non-GAAP financial measures” section. |
Nutrien Financial
We offer flexible financing solutions to our customers in support of Nutrien’s agricultural product and service sales. Qualifying Retail customers in the US and Australia are offered extended payment terms, typically up to one year, to facilitate the alignment of farmer crop cycles with cash flows. Nutrien Financial revenues are primarily earned through interest from farmers.
We hold a significant portion of receivables from customers that have historically experienced a low-default rate. We manage our credit portfolio based on a combination of review of customer credit metrics, past experience with the customer and exposure to any single customer. Nutrien Financial, which is our wholly owned finance captive, monitors and services the portfolio of our high-quality receivables from customers that have the lowest risk of default among Retail’s receivables from customers. We monitor the results of this portfolio of receivables separately because we calculate the cost of capital attributable to the high-quality receivables from customers differently from our other receivables. Specifically, we assume a debt-to-equity ratio of 9:1 in funding Nutrien Financial receivables, based on the underlying credit quality of the assets.
Nutrien Financial relies on corporate capital for funding. For 2025, we estimated the deemed interest expense using an average borrowing rate of 5.0 percent (2024 — 5.6 percent) applied to the notional debt required to fund the portfolio of receivables from customers monitored and serviced by Nutrien Financial. The balance of our Retail receivables (outside of Nutrien Financial) is subject to marginally higher credit risk.
| As at December 31 | ||||||||||||||||||||||||||||||||
| ($ millions) | Current | |
<31 Days past due |
|
|
31–90 Days past due |
|
|
>90 Days past due |
|
|
Gross receivables |
|
Allowance1 | |
2025 Net receivables |
|
|
2024 Net receivables |
| ||||||||||||
| North America |
1,831 | 260 | 110 | 181 | 2,382 | (50 | ) | 2,332 | 2,178 | |||||||||||||||||||||||
| International |
647 | 82 | 21 | 31 | 781 | (7 | ) | 774 | 699 | |||||||||||||||||||||||
| Nutrien Financial receivables |
2,478 | 342 | 131 | 212 | 3,163 | (57 | ) | 3,106 | 2,877 | |||||||||||||||||||||||
| 1 | Bad debt expense on the above receivables for 2025 was $46 million (2024 – $55 million) in the Retail segment. |
36 Nutrien Annual Report 2025
| Overview | MD&A | Five-year highlights | Financial statements and notes |
| ||||||||||
|
|
Results
2025 POTASH OPERATING SEGMENT AND RESULTS
We operate six low-cost potash mines in Saskatchewan, located within a world-class potash deposit and in a stable geopolitical environment, which helps minimize supply risk for our customers. We produce multiple grades of potash and our flexible network provides the operational flexibility to optimize value.
Our extensive North American transportation and distribution network includes approximately 5,600 owned or leased railcars serviced by multiple railway providers. Through Canpotex – our joint venture potash export, sales and marketing company – we have access to four primary North American marine terminals and other facilities as needed to export potash to customers in over 40 countries around the world.
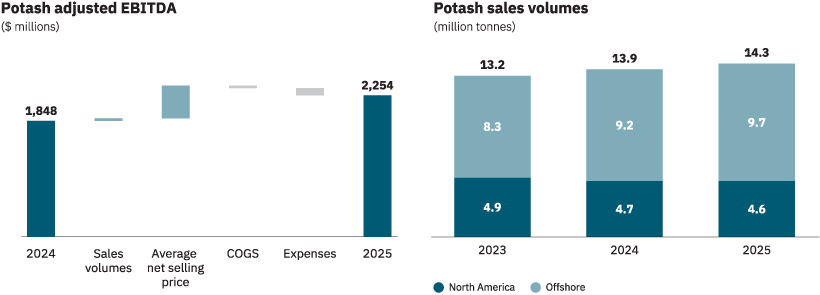
Potash adjusted EBITDA increased to $2.25 billion in 2025 due to higher net selling prices and record sales volumes, supported by strong potash affordability and underlying consumption growth in key offshore markets, and partially offset by higher provincial mining taxes. We delivered a potash controllable cash cost of product manufactured2 per tonne of $58. We mined 49 percent of our potash ore tonnes using automation, further strengthening our low-cost advantage.
| ($ millions, except as otherwise noted) | 2025 | 2024 | % Change | |||||||||
| Net sales |
3,593 | 2,989 | 20 | |||||||||
| Cost of goods sold |
1,581 | 1,448 | 9 | |||||||||
| Gross margin |
2,012 | 1,541 | 31 | |||||||||
| Adjusted EBITDA1 |
2,254 | 1,848 | 22 | |||||||||
|
Manufactured product
|
||||||||||||
| ($ per tonne, except as otherwise noted) |
|
2025 | 2024 | |||||||||
| Sales volumes (tonnes – thousands) |
||||||||||||
| North America |
4,638 | 4,672 | ||||||||||
| Offshore |
|
|
|
9,615 | 9,214 | |||||||
| Total sales volumes |
|
|
|
14,253 | 13,886 | |||||||
| Net selling price |
||||||||||||
| North America |
286 | 285 | ||||||||||
| Offshore |
|
|
|
235 | 180 | |||||||
| Average net selling price |
252 | 215 | ||||||||||
| Cost of goods sold |
|
|
|
111 | 104 | |||||||
| Gross margin |
141 | 111 | ||||||||||
| Depreciation and amortization |
|
|
|
46 | 44 | |||||||
| Gross margin excluding depreciation and amortization2 |
|
|
|
187 | 155 | |||||||
| 1 | See Note 3 to the consolidated financial statements. |
| 2 | This is a non-GAAP financial measure. See the “Non-GAAP financial measures” section. |
Nutrien Annual Report 2025 37
|
|
Overview | MD&A | Five-year highlights | Financial statements and notes | ||||||||||
|
|
Results
Supplemental data
|
|
|
2025 | 2024 | |||||||||
| Potash controllable cash cost of product manufactured per tonne1 |
|
|
|
58 | 54 | |||||||
| Canpotex sales by market (percentage of sales volumes)2 |
||||||||||||
| Latin America |
39 | 40 | ||||||||||
| Other Asian markets3 |
29 | 28 | ||||||||||
| China |
11 | 13 | ||||||||||
| India |
6 | 7 | ||||||||||
| Other markets |
|
|
|
15 | 12 | |||||||
| Total |
|
|
|
100 | 100 | |||||||
| 1 | This is a non-GAAP financial measure. See the “Non-GAAP financial measures” section. |
| 2 | See Note 26 to the consolidated financial statements. |
| 3 | All Asian markets except China and India. |
|
|
2025 versus 2024 | |
| Sales volumes |
Higher offshore sales volumes were supported by strong potash affordability and underlying consumption growth in key offshore markets. North America sales volumes were consistent with the prior year. | |
| Net selling price per tonne |
Increased due to higher global benchmark prices. | |
| Cost of goods sold per tonne |
Increased primarily due to higher royalties, maintenance costs and depreciation. | |
Potash production
| Operational capability2 | Production | |||||||||||||||||||||||||||||||||||||||||
| (million tonnes KCl) |
|
|
|
|
|
Nameplate capacity1 | 20263 | 2025 |
|
2025 | 2024 | |||||||||||||||||||||||||||||||
| Rocanville |
6.5 | 4.5 | 5.0 | 4.64 | 5.02 | |||||||||||||||||||||||||||||||||||||
| Allan |
4.0 | 3.1 | 2.7 | 2.51 | 2.40 | |||||||||||||||||||||||||||||||||||||
| Lanigan |
3.8 | 3.5 | 3.2 | 3.43 | 3.40 | |||||||||||||||||||||||||||||||||||||
| Vanscoy |
3.0 | 1.1 | 1.1 | 1.08 | 1.03 | |||||||||||||||||||||||||||||||||||||
| Cory |
3.0 | 2.2 | 2.1 | 2.09 | 2.11 | |||||||||||||||||||||||||||||||||||||
| Patience Lake |
0.3 | 0.3 | 0.3 | 0.22 | 0.25 | |||||||||||||||||||||||||||||||||||||
| Total |
20.6 | 14.7 | 14.4 | 13.97 | 14.21 | |||||||||||||||||||||||||||||||||||||
| 1 | Represents estimates of capacity as at December 31, 2025. Estimates based on capacity as per design specifications or Canpotex entitlements once determined. In the case of Patience Lake, estimate reflects current operational capability. Estimates for all other mine facilities do not necessarily represent operational capability. |
| 2 | Estimated annual achievable production based on expected staffing and operational readiness (estimated at the beginning of the year, and may vary during the year, and year to year, including between our mine facilities). Estimate does not include inventory-related shutdowns and unplanned downtime. |
| 3 | See the “Forward-Looking Statements” section. |
38 Nutrien Annual Report 2025
| Overview | MD&A | Five-year highlights | Financial statements and notes |
| ||||||||||
|
|
Results
2025 NITROGEN OPERATING SEGMENT AND RESULTS
We produce and upgrade nitrogen at 11 strategically located facilities in Canada and the US, in addition to our facility in Trinidad. Our North American operations, which account for approximately 85 percent of our nitrogen sales volumes, have access to some of the lowest-cost natural gas in the world and are well positioned to serve agriculture and industrial markets.
We produce a diverse portfolio of nitrogen products and have flexibility to optimize product mix in changing market conditions. Our transportation and distribution network leverages truck, rail, pipeline, barge and marine vessels. We utilize established CCUS infrastructure in Alberta and Louisiana to reduce GHG emissions. Over the last five years, we captured and sold an annual average of 1 million tonnes of CO2, with approximately 40 percent permanently sequestered via enhanced oil recovery.
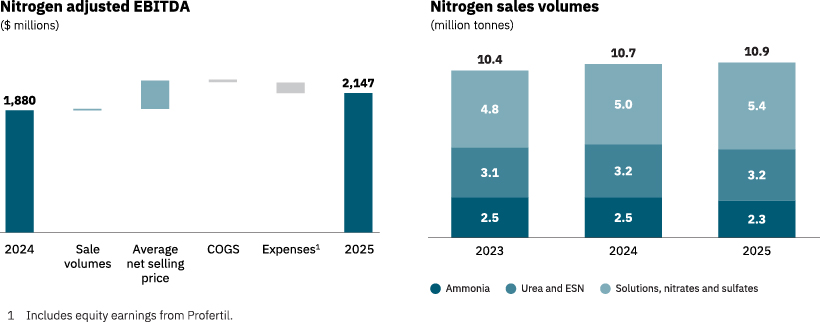
Nitrogen adjusted EBITDA increased to $2.15 billion in 2025 due to higher net selling prices, partially offset by lower equity earnings from Profertil. Adjusted EBITDA for the full year of 2024 benefitted from insurance recoveries. Total ammonia production increased in 2025, supported by a four-percentage-point improvement in ammonia operating rate (excludes Trinidad and Joffre) as we advanced reliability initiatives across our North American plants and completed low-cost debottlenecks at Redwater and Geismar. In the fourth quarter of 2025, we completed a controlled shutdown of our Trinidad Nitrogen facility due to uncertainty with respect to port access and a lack of reliable and economic gas supply that has reduced the free cash flow contribution of the Trinidad Nitrogen operations over an extended period of time.
| ($ millions, except as otherwise noted) | 2025 | 2024 | ¹ | % Change | ||||||||
| Net sales |
4,187 | 3,576 | 17 | |||||||||
| Cost of goods sold |
2,580 | 2,374 | 9 | |||||||||
| Gross margin |
1,607 | 1,202 | 34 | |||||||||
| Adjusted EBITDA2 |
2,147 | 1,880 | 14 | |||||||||
|
1 Comparative figures have been reclassified for our Purchase for Resale business from Nitrogen to the Corporate and Others segment. See Note 3 to the consolidated financial statements. 2 See Note 3 to the consolidated financial statements. |
| |||||||||||
|
Manufactured product
|
||||||||||||
| ($ per tonne, except as otherwise noted) |
|
2025 | 2024 | |||||||||
| Sales volumes (tonnes – thousands) |
||||||||||||
| Ammonia |
2,420 | 2,483 | ||||||||||
| Urea and ESN® |
3,099 | 3,188 | ||||||||||
| Solutions, nitrates and sulfates |
|
|
|
5,369 | 5,023 | |||||||
| Total sales volumes |
|
|
|
10,888 | 10,694 | |||||||
| Net selling price |
||||||||||||
| Ammonia |
422 | 410 | ||||||||||
| Urea and ESN® |
490 | 421 | ||||||||||
| Solutions, nitrates and sulfates |
|
|
|
268 | 221 | |||||||
| Average net selling price |
365 | 324 | ||||||||||
| Cost of goods sold |
|
|
|
219 | 213 | |||||||
| Gross margin |
146 | 111 | ||||||||||
| Depreciation and amortization |
|
|
|
57 | 55 | |||||||
| Gross margin excluding depreciation and amortization1 |
|
|
|
203 | 166 | |||||||
|
1 This is a non-GAAP financial measure. See the “Non-GAAP financial measures” section. |
||||||||||||
Supplemental data
|
|
|
2025 | 2024 | |||||||
| Ammonia controllable cash cost of product manufactured per tonne1 |
58 | 61 | ||||||||
| Sales volumes (tonnes – thousands) |
||||||||||
| Fertilizer |
6,425 | 6,259 | ||||||||
| Industrial and feed |
4,463 | 4,435 | ||||||||
| Ammonia operating rate2 (%) |
92 | 88 | ||||||||
| Natural gas costs ($ per MMBtu) |
||||||||||
| Overall natural gas cost excluding realized derivative impact |
3.53 | 3.15 | ||||||||
| Realized derivative impact |
|
– | 0.09 | |||||||
| Overall natural gas cost |
|
3.53 | 3.24 | |||||||
|
1 This is a non-GAAP financial measure. See the “Non-GAAP financial measures” section. 2 Excludes Trinidad and Joffre. |
| |||||||||
Nutrien Annual Report 2025 39
|
|
Overview | MD&A | Five-year highlights | Financial statements and notes | ||||||||||
|
|
Results
|
|
2025 versus 2024 | |
| Sales volumes |
Increased due to higher production from reliability improvements and low-cost debottlenecks that increased the availability of upgraded products. | |
| Net selling price per tonne |
Higher for all major nitrogen products due to stronger benchmark prices. | |
| Cost of goods sold per tonne |
Increased due to higher natural gas costs, mainly driven by Henry Hub benchmark. | |
Nitrogen production
| Ammonia1 | Urea2 | |||||||||||||||||||||||
| (million tonnes, except as otherwise noted) | |
Annual capacity3 |
|
Production | |
Annual capacity3 |
|
Production | ||||||||||||||||
| 2025 | 2024 | 2025 | 2024 | |||||||||||||||||||||
| Trinidad4 |
2.2 | 1.18 | 1.27 | 0.7 | 0.54 | 0.47 | ||||||||||||||||||
| Redwater |
1.0 | 0.73 | 0.86 | 0.7 | 0.53 | 0.70 | ||||||||||||||||||
| Augusta |
0.8 | 0.74 | 0.68 | 0.6 | 0.58 | 0.52 | ||||||||||||||||||
| Lima |
0.7 | 0.76 | 0.59 | 0.5 | 0.53 | 0.46 | ||||||||||||||||||
| Geismar |
0.6 | 0.61 | 0.58 | 0.4 | 0.43 | 0.38 | ||||||||||||||||||
| Carseland |
0.5 | 0.53 | 0.46 | 0.7 | 0.73 | 0.65 | ||||||||||||||||||
| Fort Saskatchewan |
0.5 | 0.47 | 0.44 | 0.4 | 0.42 | 0.40 | ||||||||||||||||||
| Borger |
0.5 | 0.29 | 0.35 | 0.6 | 0.38 | 0.42 | ||||||||||||||||||
| Joffre |
0.5 | 0.39 | 0.38 | – | – | – | ||||||||||||||||||
| Total |
7.3 | 5.71 | 5.61 | 4.6 | 4.14 | 4.00 | ||||||||||||||||||
| Adjusted total5 |
|
|
|
4.13 | 3.96 |
|
|
|
|
|
|
|
|
| ||||||||||
| 1 | All figures are shown on a gross production basis. |
| 2 | Reflects capacity and production of urea liquor prior to final product upgrade. Urea liquor is used in the production of solid urea, UAN and DEF. |
| 3 | Annual capacity estimates include allowances for normal operating plant conditions. |
| 4 | In 2024 and 2025, Trinidad production was restricted due to natural gas curtailments. On October 23, 2025, we completed a controlled shutdown of our Trinidad facility due to uncertainty with respect to port access and a lack of reliable and economic gas supply. |
| 5 | Excludes Trinidad and Joffre. |
40 Nutrien Annual Report 2025
| Overview | MD&A | Five-year highlights | Financial statements and notes |
| ||||||||||
|
|
Results
2025 PHOSPHATE OPERATING SEGMENT AND RESULTS
Nutrien has two large integrated phosphate production facilities and four regional product upgrade sites in the US. Our high-quality phosphate rock enables production of a diverse mix of phosphate products, including solid and liquid fertilizers, feed and industrial acids. We are the largest producer of purified phosphoric acid in North America and sell the majority of our product in this market, benefiting from our extensive distribution network and customer relationships.
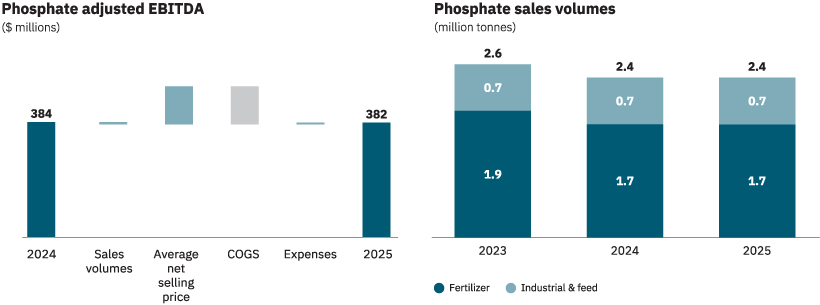
Phosphate adjusted EBITDA slightly decreased to $382 million in 2025 due to higher sulfur input costs and lower sales volumes, partially offset by higher net selling prices. In the third quarter of 2025, we initiated a review of strategic alternatives for our Phosphate business, which could include reconfiguring operations, strategic partnerships or a potential sale, and we intend to solidify the optimal path in 2026.
| ($ millions, except as otherwise noted) | 2025 | 2024 | % Change | |||||||||
| Net sales |
1,734 | 1,657 | 5 | |||||||||
| Cost of goods sold |
1,590 | 1,510 | 5 | |||||||||
| Gross margin |
144 | 147 | (2 | ) | ||||||||
| Adjusted EBITDA1 |
382 | 384 | (1 | ) | ||||||||
| 1 | See Note 3 to the consolidated financial statements. |
Manufactured product
| ($ per tonne, except as otherwise noted) | 2025 | 2024 | ||||||
| Sales volumes (tonnes – thousands) |
||||||||
| Fertilizer |
1,646 | 1,751 | ||||||
| Industrial and feed |
717 | 683 | ||||||
| Total sales volumes |
2,363 | 2,434 | ||||||
| Net selling price |
||||||||
| Fertilizer |
677 | 612 | ||||||
| Industrial and feed |
835 | 822 | ||||||
| Average net selling price |
725 | 671 | ||||||
| Cost of goods sold |
657 | 603 | ||||||
| Gross margin |
68 | 68 | ||||||
| Depreciation and amortization |
121 | 119 | ||||||
| Gross margin excluding depreciation and amortization1 |
189 | 187 | ||||||
| 1 | This is a non-GAAP financial measure. See the “Non-GAAP financial measures” section. |
|
|
2025 versus 2024 | |
| Sales volumes |
Lower due to lower production volumes in the first quarter of 2025. | |
| Net selling price |
Increased due to the strength of fertilizer benchmark prices. | |
| Cost of goods sold per tonne |
Increased primarily due to higher sulfur input costs. | |
Nutrien Annual Report 2025 41
|
|
Overview | MD&A | Five-year highlights | Financial statements and notes | ||||||||||
|
|
Results
Phosphate production
| Phosphate rock | Phosphoric acid (P2O5) | Liquid products | Solid fertilizer products | |||||||||||||||||||||||||||||||||||||||||||||
| (million tonnes, except as otherwise noted) |
Annual capacity |
Production | Annual capacity |
Production | Annual capacity |
Production | Annual capacity |
Production | ||||||||||||||||||||||||||||||||||||||||
| 2025 | 2024 | 2025 | 2024 | 2025 | 2024 | 2025 | 2024 | |||||||||||||||||||||||||||||||||||||||||
| Aurora |
5.4 | 4.66 | 3.99 | 1.2 | 1.00 | 0.97 | 2.7 | 1 | 2.10 | 2.05 | 0.9 | 0.72 | 0.76 | |||||||||||||||||||||||||||||||||||
| White Springs |
2.0 | 1.39 | 1.19 | 0.5 | 0.36 | 0.36 | 0.7 | 2 | 0.31 | 0.29 | 0.8 | 0.29 | 0.31 | |||||||||||||||||||||||||||||||||||
| Total |
7.4 | 6.05 | 5.18 | 1.7 | 1.36 | 1.33 | 3.4 | 2.41 | 2.34 | 1.7 | 1.01 | 1.07 | ||||||||||||||||||||||||||||||||||||
| P2O5 operating rate (%) |
|
|
|
|
|
|
|
|
|
|
|
|
80 | 78 |
|
|
|
|
|
|
|
|
|
|
|
|
|
|
|
|
|
| ||||||||||||||||
| 1 | A substantial portion is consumed internally in the production of downstream products. The balance is exported to phosphate fertilizer producers or sold domestically to dealers who custom-mix liquid fertilizer. Capacity is composed of 2.0 million tonnes MGA and 0.7 million tonnes SPA. |
| 2 | Represents annual SPA capacity. A substantial portion is consumed internally in the production of downstream products. The balance is exported to phosphate fertilizer producers or sold domestically to dealers who custom-mix liquid fertilizer. |
In addition to the production above, annual capacity for phosphate feed and purified acid was 0.7 and 0.3 million tonnes, respectively. Production in 2025 was 0.34 and 0.19 million tonnes, respectively, and 2024 production was 0.31 and 0.17 million tonnes, respectively.
42 Nutrien Annual Report 2025
| Overview | MD&A | Five-year highlights | Financial statements and notes |
| ||||||||||
|
|
Results
2025 CORPORATE AND OTHERS AND ELIMINATIONS
“Corporate and Others” is a non-operating segment comprising corporate and administrative functions that provide support and governance to our operating segments. It also includes gross margin related to our non-core businesses. Intersegment sales, costs of goods sold and expenses are removed from the consolidated results in Eliminations. Intersegment activities include sale of product between our segments, primarily from Potash, Nitrogen and Phosphate to our Retail segment.
| ($ millions, except as otherwise noted) | 2025 | 20241, 2 | % Change | |||||||||
| Corporate and Others |
||||||||||||
| Gross margin2 |
27 | 21 | 29 | |||||||||
| Adjusted EBITDA2 |
(427 | ) | (452 | ) | (6 | ) | ||||||
| Eliminations |
||||||||||||
| Gross margin |
(46 | ) | (2 | ) | n/m | |||||||
| Adjusted EBITDA2 |
(46 | ) | (1 | ) | n/m | |||||||
| 1 | Comparative figures have been reclassified for our Purchase for Resale business from Nitrogen to the Corporate and Others segment. |
| 2 | See Note 3 to the consolidated financial statements. |
FINANCE COSTS, INCOME TAXES AND OTHER COMPREHENSIVE INCOME (LOSS)
| ($ millions, except as otherwise noted) | 2025 | 2024 | % Change | |||||||||
| Finance costs |
687 | 720 | (5 | ) | ||||||||
| Income tax expense |
752 | 436 | 72 | |||||||||
| Other comprehensive income (loss) |
224 | (234 | ) | n/m | ||||||||
|
|
2025 versus 2024 |
|
|
|||||||
| Finance costs |
Weighted average debt balances and rates
|
|||||||||
|
|
($ millions, except as otherwise noted) | 2025 | 2024 | |||||||
| Short-term debt balance | 3,170 | 3,328 | ||||||||
| Short-term debt rate (%) | 5.3 | 6.1 | ||||||||
| North American short-term debt balance | 2,800 | 2,679 | ||||||||
| North American short-term debt rate (%) | 4.6 | 5.5 | ||||||||
| Long-term debt balance | 10,025 | 9,629 | ||||||||
| Long-term debt rate (%) | 5.0 | 5.0 | ||||||||
| Lease obligations balance | 1,331 | 1,375 | ||||||||
| Lease obligations rate (%) | 4.9 | 4.6 | ||||||||
| Income tax expense |
Income tax increased mainly due to higher earnings. The decrease in the actual effective tax rate was mainly due to lower non-recognizable losses in South America compared to the same period in 2024. Refer to Note 10 to the consolidated financial statements for additional information. |
| ||||||||
| Effective tax rates and discrete items
|
||||||||||
|
|
($ millions, except as otherwise noted) | 2025 | 2024 | |||||||
| Actual effective tax rate on earnings (%) | 24 | 40 | ||||||||
| Actual effective tax rate including discrete items (%) | 25 | 38 | ||||||||
| Discrete tax adjustments that impacted the rate | 27 | (13 | ) | |||||||
| Other comprehensive income (loss) | Other comprehensive income increased mainly due to the appreciation of the Australian, Brazilian and Canadian currencies, relative to the US dollar, compared to losses in 2024. |
| ||||||||
Nutrien Annual Report 2025 43
|
|
Overview | MD&A | Five-year highlights | Financial statements and notes | ||||||||||
|
|
Results
| ($ millions, except as otherwise noted) | 2025 | 2024 | 2023 | |||||||||
| Sales |
26,885 | 25,972 | 29,056 | |||||||||
| Net earnings |
2,297 | 700 | 1,282 | |||||||||
| Basic net earnings per share (dollars) |
4.66 | 1.36 | 2.53 | |||||||||
| Diluted net earnings per share (dollars) |
4.66 | 1.36 | 2.53 | |||||||||
| Total assets |
52,301 | 51,840 | 52,749 | |||||||||
| Total non-current financial liabilities |
10,287 | 9,880 | 9,912 | |||||||||
| Dividends declared per share (dollars) |
2.18 | 2.16 | 2.12 | |||||||||
|
|
2025 versus 2024 | 2024 versus 2023 | ||
| Sales |
Sales increased primarily due to higher fertilizer net selling prices and record upstream sales volumes. | Sales decreased primarily due to lower fertilizer net selling prices, partially offset by record Potash sales volumes. | ||
| Net earnings and earnings per share |
Net earnings and earnings per share increased primarily due to higher sales (see above), and higher Retail earnings. These were partially offset by higher provincial mining taxes, as well as higher costs for royalties, maintenance, depreciation, natural gas and sulfur.
Net earnings in 2025 were positively impacted by the gain on sale of investment related to the disposal of our 50 percent equity ownership in Profertil. |
Net earnings and earnings per share decreased primarily due to lower sales (see above), partially offset by lower operational expenses due to lower input costs such as cost to purchase inventories, natural gas, royalties and provincial mining taxes.
Net earnings in 2024 were also impacted by a $220 million loss on foreign currency derivatives in Brazil.
Our impairment of assets was lower in 2024. We recorded $530 million non-cash impairments of our Retail – Brazil and Nitrogen Geismar Clean Ammonia project assets in 2024 compared to non-cash impairment of $774 million of Retail, Phosphate and Nitrogen assets recorded in 2023. | ||
| Assets and non-current financial liabilities |
Total assets increased in 2025 compared to 2024 primarily due to higher working capital assets, resulting from increased net selling prices and higher inventory balances for Retail, Nitrogen and Phosphate. See the Financial Condition section for further details.
Non-current financial liabilities increased due to the higher long-term debt balance from the issuance of new senior notes, partially offset by the repayment of senior notes upon maturity in 2025, as well as an increase in deferred income tax liabilities. |
Total assets decreased in 2024 compared to 2023 primarily due to the non-cash impairments discussed above, as well as from lower working capital assets from reduced net selling prices and lower cost of inventories.
Non-current financial liabilities increased due to the higher long-term debt balance from the issuance of new senior notes, partially offset by the repayment of senior notes upon maturity in 2024. | ||
| Dividends declared per share |
Dividends declared per share increased as we declared a higher quarterly dividend per share of $0.545 in 2025 compared to $0.54 in 2024. | Dividends declared per share increased as we declared a higher quarterly dividend per share of $0.54 in 2024 compared to $0.53 in 2023. | ||
44 Nutrien Annual Report 2025
| Overview | MD&A | Five-year highlights | Financial statements and notes |
| ||||||||||
|
|
Results
FINANCIAL CONDITION
| As at | ||||||||||||||||
| ($ millions, except as otherwise noted) | December 31, 2025 | December 31, 2024 | $ Change | % Change | ||||||||||||
| Assets |
||||||||||||||||
| Cash and cash equivalents |
701 | 853 | (152 | ) | (18 | ) | ||||||||||
| Receivables |
5,675 | 5,390 | 285 | 5 | ||||||||||||
| Inventories |
6,977 | 6,148 | 829 | 13 | ||||||||||||
| Property, plant and equipment |
22,747 | 22,604 | 143 | 1 | ||||||||||||
| Investments |
144 | 698 | (554 | ) | (79 | ) | ||||||||||
| Liabilities and Shareholders’ Equity |
||||||||||||||||
| Short-term debt |
873 | 1,534 | (661 | ) | (43 | ) | ||||||||||
| Trade, other payables and accrued liabilities |
9,309 | 9,118 | 191 | 2 | ||||||||||||
| Long-term debt, including current portion |
9,863 | 9,918 | (55 | ) | (1 | ) | ||||||||||
| Share capital |
13,519 | 13,748 | (229 | ) | (2 | ) | ||||||||||
| Retained earnings |
12,076 | 11,106 | 970 | 9 | ||||||||||||
| Assets | Liabilities | |
| Explanations for changes in Cash and cash equivalents are in the “Liquidity and Capital Resources – Sources and uses of cash” section.
Receivables increased due to higher Potash and Phosphate net selling prices, higher receivables in Australia due to the appreciation of foreign exchange rates relative to the US dollar, and greater usage of payment terms from our Retail customers. The increases were partially offset by lower income tax receivable.
Inventories increased in Retail due to higher crop nutrients input costs from global supply constraints and earlier seasonal purchases, as well as higher crop protection volumes to support anticipated 2026 demand. Nitrogen and Phosphate also saw increases due to higher volumes and higher natural gas and sulfur costs.
Property, plant and equipment increased due to capital expenditures increasing more than offsetting depreciation and disposals.
Investments decreased due to the sale of our remaining investment in Sinofert and the sale of our investment in Profertil in 2025. |
Short-term debt decreased due to lower draws on our commercial paper and repayment of credit facilities with funds from the sale of investments.
Trade, other payables and accrued liabilities increased due to Retail purchases through supplier financing in North America and timing of payments. These increases were partially offset by lower customer prepayments in North America.
Long-term debt, including the current portion, decreased due to the repayment of $1,000 million senior notes in 2025, as well as repayments of other long-term debt, partially offset by the issuance of $1,000 million senior notes during the first quarter of 2025.
Shareholders’ equity
Share capital decreased primarily from shares repurchased under our normal course issuer bid program.
Retained earnings increased as net earnings exceeded dividends declared and share repurchases in 2025. |
We do not hold material cash and cash equivalents in currencies other than the US dollar and Canadian dollar. As at December 31, 2025, we held the equivalent of approximately $273 million in other jurisdictions outside the US and Canada. We do not depend on repatriation of cash from our foreign subsidiaries to meet our liquidity and capital resource needs in North America.
Nutrien Annual Report 2025 45
|
|
Overview | MD&A | Five-year highlights | Financial statements and notes | ||||||||||
|
|
Results
LIQUIDITY AND CAPITAL RESOURCES
Sources and uses of liquidity
Liquidity risk arises from our general funding needs and in the management of our assets, liabilities and capital structure. We manage liquidity risk to maintain sufficient liquid financial resources to fund our financial position and meet our commitments and obligations in a cost-effective manner. Our primary sources of liquidity in 2025 and our expected ongoing primary uses of liquidity are listed below:
| Primary uses of liquidity | Primary sources of liquidity | |
– seasonal working capital requirements – operational expenses – capital expenditures to sustain our assets to support safe and reliable operations – high-value growth opportunities – shareholder returns through dividends and/or share repurchases – principal payments of debt securities |
– cash from operations (including customer prepayments) – commercial paper issuances – increase of credit facility limits and drawdowns – debt capital markets – supplier financing arrangements | |
We believe that our internally generated cash flow, supplemented by available borrowings under new or existing financing sources, if necessary, will be sufficient to meet our anticipated capital expenditures, planned growth and development activities, and other cash requirements for the foreseeable future. We do not reasonably expect any presently known trend or uncertainty to affect our ability to access our historical sources of liquidity.
Cash requirements
The following aggregated information about our contractual obligations and other commitments summarizes our liquidity and capital resource requirements as at December 31, 2025. Commitments reflect the estimated cash outflows for these obligations.
| Consolidated financial statements note reference |
Payments due by period | |||||||||||||||||||||
| ($ millions) | Total | Within 1 year |
1 to 3 years |
3 to 5 years |
Over 5 years |
|||||||||||||||||
| Long-term debt |
19, 24 | 9,685 | 513 | 1,670 | 1,250 | 6,252 | ||||||||||||||||
| Estimated interest payments on long-term debt |
24 | 5,792 | 482 | 833 | 699 | 3,778 | ||||||||||||||||
| Asset retirement obligations and accrued environmental costs |
22 | 3,587 | 194 | 235 | 173 | 2,985 | ||||||||||||||||
| Lease liabilities |
20, 24 | 1,283 | 346 | 408 | 203 | 326 | ||||||||||||||||
| Estimated interest payments on lease liabilities |
24 | 214 | 49 | 61 | 36 | 68 | ||||||||||||||||
| Purchase commitments |
24 | 1,278 | 1,230 | 24 | 24 | – | ||||||||||||||||
| Capital commitments |
24 | 83 | 63 | 20 | – | – | ||||||||||||||||
| Other commitments |
24 | 751 | 195 | 259 | 109 | 188 | ||||||||||||||||
| Derivatives |
5 | 8 | 8 | – | – | – | ||||||||||||||||
| Total |
|
22,681 | 3,080 | 3,510 | 2,494 | 13,597 | ||||||||||||||||
The information presented in the table above does not include planned cash outflows unless they are legally committed for capital expenditures, business acquisitions or shareholder returns, including share repurchases and dividends. In addition to the commitments included above, we have other obligations for goods and services as part of our normal operations, which may terminate on short notice, including purchase commitments for crop input products.
For information on pension and other post-retirement benefits funding, refer to Note 21 to the consolidated financial statements. Future cash requirements are subject to changes in regulations, actuarial assumptions and our expected operating results.
On February 18, 2026, our Board approved a share repurchase program of up to a maximum of 24,057,066 common shares, representing 5 percent of Nutrien’s outstanding common shares. The 2026 normal course issuer bid will commence on March 3, 2026. The share repurchase program will expire on the earlier of March 2, 2027, the date on which we have acquired the maximum number of common shares allowable or the date we determine not to make any further repurchases.
On February 18, 2026, our Board of Directors declared and increased our quarterly dividend to $0.55 per share payable on April 16, 2026, to shareholders of record on March 31, 2026. The total estimated dividend to be paid is $265 million.
46 Nutrien Annual Report 2025
| Overview | MD&A | Five-year highlights | Financial statements and notes |
| ||||||||||
|
|
Results
Sources and uses of cash
|
Cash provided by operating activities |
|
– Cash provided by operating activities increased due to stronger Potash and Nitrogen selling prices and an increase in the North American supplier financing program. | ||
|
Cash used in investing activities |
|
– Cash used in investing activities decreased due to the proceeds received on the sale of investments in Profertil and Sinofert and lower capital expenditures. | ||
|
Cash used in financing activities |
|
– Cash used in financing activities increased due to higher repayment of debt and share repurchases. | ||
Nutrien Annual Report 2025 47
|
|
Overview | MD&A | Five-year highlights | Financial statements and notes | ||||||||||
|
|
Results
CAPITAL STRUCTURE AND MANAGEMENT
We manage our capital structure with a focus on maintaining a strong balance sheet, enabling a strong investment-grade credit rating.
Principal debt instruments
As part of the normal course of business, we closely monitor our liquidity position. We use a combination of cash generated from operations and short-term and long-term debt to finance our operations. We continually evaluate various financing arrangements and may seek to engage in transactions from time to time when market and other conditions are favorable.
Capital structure (debt and equity)
| ($ millions) | December 31, 2025 | December 31, 2024 | ||||||
| Short-term debt |
873 | 1,534 | ||||||
| Current portion of long-term debt |
513 | 1,037 | ||||||
| Current portion of lease liabilities |
346 | 356 | ||||||
| Long-term debt |
9,350 | 8,881 | ||||||
| Lease liabilities |
937 | 999 | ||||||
| Shareholders’ equity |
25,365 | 24,442 | ||||||
Senior Notes and Debentures
As at December 31, 2025, our long-term debt consisted primarily of senior notes and debentures with the following maturities and interest rates:
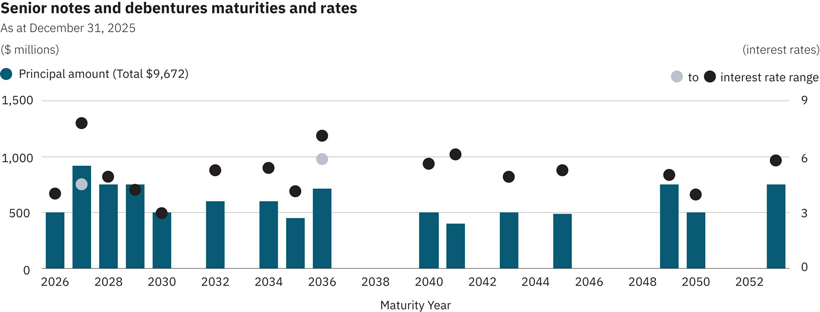
| ($ millions, except as otherwise noted) | Rate of interest (%) | Maturity | Amount | |||||||||
| Senior notes repaid in 2025 |
3.000 | April 1, 2025 | 500 | |||||||||
| Senior notes repaid in 2025 |
5.950 | November 7, 2025 | 500 | |||||||||
|
|
|
|
|
|
|
|
1,000 | |||||
| Senior notes issued in 2025 |
4.500 | March 12, 2027 | 400 | |||||||||
| Senior notes issued in 2025 |
5.250 | March 12, 2032 | 600 | |||||||||
|
|
|
|
|
|
|
|
1,000 | |||||
The senior notes issued in 2025 are unsecured, rank equally with our existing unsecured debt, and have no sinking fund requirements prior to maturity. Each series is redeemable and has various provisions for redemption prior to maturity, at our option, at specified prices.
48 Nutrien Annual Report 2025
| Overview | MD&A | Five-year highlights | Financial statements and notes |
| ||||||||||
|
|
Results
Credit facilities and other debt
We have several available credit facilities in the jurisdictions where we operate. We have a commercial paper program, which is limited to the undrawn amount under our $4,500 million unsecured revolving term credit facility. In 2025, our total facility limit decreased $250 million from a reduction in our unsecured committed revolving term facility. As at December 31, 2025, we had a $399 million outstanding balance in commercial paper. Any excess cash is invested in highly liquid securities.
As at December 31, 2025, $234 million in letters of credit were outstanding and committed, with $250 million of remaining credit available under our dedicated letter of credit facilities.
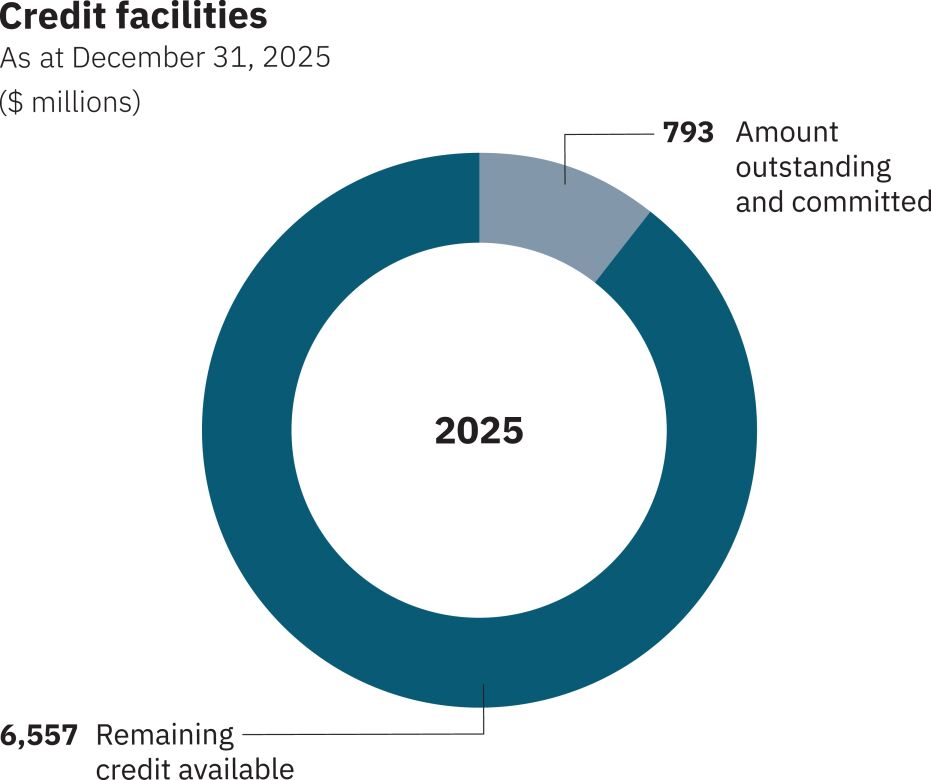
Lease obligations
We have lease obligations totaling $1,283 million (including current portion) with a weighted average effective interest rate of 4.9 percent as at December 31, 2025.
Debt covenants
Our credit facilities have financial tests and other covenants with which we must comply at each quarter-end. Non-compliance with any such covenants could result in accelerated payment of amounts borrowed and termination of lenders’ further funding obligations under the credit facilities. We were in compliance with all covenants as at December 31, 2025.
The table below summarizes the limit and result of our key financial covenant:
| As at December 31 | Limit | 2025 | ||||||
| Debt to capital ratio1 |
0.65 : 1.00 | 0.32 : 1.00 | ||||||
| 1 | Refer to Note 4 to the consolidated financial statements for the detailed calculation. |
Credit ratings
Our ability to access reasonably priced debt in the capital markets depends, in part, on the quality of our credit ratings. We continue to maintain investment-grade credit ratings for our long-term debt. A downgrade of the credit rating of our long-term debt could increase the interest rates applicable to borrowings under our credit facilities.
Commercial paper markets are generally a source of same-day cash. Our access to the US commercial paper market primarily depends on maintaining our current short-term credit ratings as well as general conditions in the money markets.
| Long-term debt rating (outlook) | Short-term debt rating | |||||||||||||||
| As at December 31 | 2025 | 2024 | 2025 | 2024 | ||||||||||||
| Moody’s |
Baa2 (stable | ) | Baa2 (stable | ) | P-2 | P-2 | ||||||||||
| S&P |
BBB (stable | ) | BBB (stable | ) | A-2 | A-2 | ||||||||||
A credit rating is not a recommendation to buy, sell or hold securities. The ratings may be subject to revision or withdrawal at any time by the respective credit rating agency and each rating should be evaluated independently of any other rating.
Moody’s stable outlook on Nutrien’s credit rating means that there is a low likelihood of a rating change over the medium term. S&P’s stable outlook on Nutrien’s credit rating means that the rating is not likely to change (generally up to two years).
Nutrien Annual Report 2025 49
|
|
Overview | MD&A | Five-year highlights | Financial statements and notes | ||||||||||
|
|
Results
Outstanding share data
|
|
As at February 17, 2026 |
| ||
| Common shares |
481,141,322 | |||
| Options to purchase common shares |
2,221,163 |
| ||
For more information on our capital structure and management, see Note 4 to the consolidated financial statements.
QUARTERLY RESULTS
|
|
2025 | 2024 | ||||||||||||||||||||||||||||||
| ($ millions, except as otherwise noted) | Q4 | Q3 | Q2 | Q1 | Q4 | Q3 | Q2 | Q1 | ||||||||||||||||||||||||
| Sales |
5,340 | 6,007 | 10,438 | 5,100 | 5,079 | 5,348 | 10,156 | 5,389 | ||||||||||||||||||||||||
| Net earnings |
580 | 469 | 1,229 | 19 | 118 | 25 | 392 | 165 | ||||||||||||||||||||||||
| Net earnings attributable to equity holders of Nutrien |
571 | 464 | 1,221 | 11 | 113 | 18 | 385 | 158 | ||||||||||||||||||||||||
| Net earnings per share attributable to equity holders of Nutrien |
||||||||||||||||||||||||||||||||
| Basic |
1.18 | 0.96 | 2.51 | 0.02 | 0.23 | 0.04 | 0.78 | 0.32 | ||||||||||||||||||||||||
| Diluted |
1.18 | 0.96 | 2.50 | 0.02 | 0.23 | 0.04 | 0.78 | 0.32 | ||||||||||||||||||||||||
Our quarterly earnings are significantly affected by the seasonality of our business, fertilizer benchmark prices, as well as by demand-supply conditions, farmer affordability and weather. See Note 28 to the consolidated financial statements.
Other material transactions or events that impacted our quarterly results included:
| Quarter |
Transaction or event | |
| 2024 Q2 |
$530 million non-cash impairment of assets comprised of a $335 million non-cash impairment of the Retail – Brazil intangible assets and property plant and equipment due to the ongoing market instability and more moderate margin expectations, and a $195 million non-cash impairment of our Nitrogen Geismar Clean Ammonia project property, plant and equipment as we decided to no longer pursue the project. Net earnings were also impacted by a $220 million loss on foreign currency derivatives in Brazil. | |
50 Nutrien Annual Report 2025
| Overview | MD&A | Five-year highlights | Financial statements and notes |
| ||||||||||
|
|
Results
FOURTH QUARTER RESULTS
| ($ millions, except as otherwise noted) Three months ended December 31 |
Sales | Gross margin | ||||||||||||||
| 2025 | 2024 | 2025 | 2024 | |||||||||||||
| Retail |
||||||||||||||||
| Crop nutrients |
1,512 | 1,528 | 288 | 294 | ||||||||||||
| Crop protection products |
931 | 948 | 324 | 351 | ||||||||||||
| Seed |
162 | 184 | 48 | 52 | ||||||||||||
| Services and other |
254 | 228 | 219 | 188 | ||||||||||||
| Merchandise |
226 | 230 | 39 | 40 | ||||||||||||
| Nutrien Financial |
82 | 77 | 82 | 77 | ||||||||||||
| Nutrien Financial elimination1 |
(23 | ) | (16 | ) | (23 | ) | (16 | ) | ||||||||
| Total |
3,144 | 3,179 | 977 | 986 | ||||||||||||
| 1 | Represents elimination for the interest and service fees charged by Nutrien Financial to Retail branches. |
Manufactured Product
| (Dollars, except as otherwise noted) Three months ended December 31 |
Sales volumes (tonnes – thousands) |
Average dollars per tonne |
||||||||||||||
| 2025 | 2024 | 2025 | 2024 | |||||||||||||
| Potash |
||||||||||||||||
| North America |
726 | 718 | 305 | 270 | ||||||||||||
| Offshore |
2,077 | 2,040 | 247 | 168 | ||||||||||||
| Sales |
2,803 | 2,758 | 262 | 194 | ||||||||||||
| Cost of goods sold |
|
|
|
|
|
|
115 | 112 | ||||||||
| Gross margin |
|
|
|
|
|
|
147 | 82 | ||||||||
| Nitrogen |
||||||||||||||||
| Ammonia |
546 | 701 | 470 | 448 | ||||||||||||
| Urea and ESN® |
656 | 888 | 505 | 403 | ||||||||||||
| Solutions, nitrates and sulfates |
1,373 | 1,325 | 272 | 213 | ||||||||||||
| Sales |
2,575 | 2,914 | 373 | 327 | ||||||||||||
| Cost of goods sold |
|
|
|
|
|
|
214 | 221 | ||||||||
| Gross margin |
|
|
|
|
|
|
159 | 106 | ||||||||
| Phosphate |
||||||||||||||||
| Fertilizer |
468 | 435 | 677 | 615 | ||||||||||||
| Industrial and feed |
186 | 173 | 875 | 812 | ||||||||||||
| Sales |
654 | 608 | 733 | 671 | ||||||||||||
| Cost of goods sold |
|
|
|
|
|
|
646 | 631 | ||||||||
| Gross margin |
|
|
|
|
|
|
87 | 40 | ||||||||
| ($ millions, except as otherwise noted) Three months ended December 31 |
|
|
2025 | 2024 | ||||||||||||
| Adjusted EBITDA |
||||||||||||||||
| Retail |
311 | 340 | ||||||||||||||
| Potash |
445 | 291 | ||||||||||||||
| Nitrogen |
521 | 471 | ||||||||||||||
| Phosphate |
107 | 86 | ||||||||||||||
| Corporate and others |
(133 | ) | (160 | ) | ||||||||||||
| Eliminations |
|
|
|
|
|
|
26 | 27 | ||||||||
| Adjusted EBITDA1 |
|
|
|
|
|
|
1,277 | 1,055 | ||||||||
| Net earnings |
|
|
|
|
|
|
580 | 118 | ||||||||
| 1 | This is a non-GAAP financial measure. See the “Non-GAAP financial measures” section. |
Nutrien Annual Report 2025 51
|
|
Overview | MD&A | Five-year highlights | Financial statements and notes | ||||||||||
|
|
Results
Highlights of our 2025 fourth quarter compared to the 2024 fourth quarter results were as follows:
|
|
Q4 2025 versus Q4 2024 | |
| Retail |
Retail adjusted EBITDA decreased as prior period benefited from income items, most notably $25 million gain on sale of land in Argentina.
Crop nutrients sales and gross margin decreased due to lower sales volumes from a weather-shortened fall application window in the US and reduced demand for phosphate, partially offset by higher proprietary products gross margin. International crop nutrient sales volumes were lower mainly due to strategic actions in South America.
Crop protection products sales and gross margin were lower due to product mix shifts in North America and dry conditions in Australia, partially offset by higher proprietary products gross margin.
Seed sales and gross margin were lower due to weather related impacts in the Southern US leading to fewer planted acres which impacted proprietary products gross margin. | |
| Potash |
Potash adjusted EBITDA increased due to higher net selling prices and higher sales volumes, partially offset by higher provincial mining taxes.
Sales volumes were higher due to higher offshore sales volumes supported by strong potash affordability and underlying consumption growth in key offshore markets. North America sales volumes were consistent with the prior year.
Net selling price per tonne increased due to higher global benchmark prices.
Cost of goods sold per tonne increased primarily due to higher royalties and maintenance costs. | |
| Nitrogen |
Nitrogen adjusted EBITDA increased due to higher net selling prices, partially offset by lower equity earnings from Profertil.
Sales volumes decreased due to the previously announced controlled shutdown of our Trinidad facility on October 23, 2025 and planned turnarounds at our North American operations.
Net selling price per tonne was higher for all major nitrogen products due to stronger benchmark prices.
Cost of goods sold per tonne decreased due to a higher percentage of sales coming from our low-cost North American nitrogen plants. | |
| Phosphate |
Phosphate adjusted EBITDA increased due to higher net selling prices and sales volumes, partially offset by higher sulfur input costs.
Sales volumes were higher due to higher production from reliability improvements and weather-related events that impacted the fourth quarter of 2024 production volumes, partially offset by reduced demand for phosphate.
Net selling price per tonne increased due to the strength of fertilizer benchmark prices.
Cost of goods sold per tonne increased primarily due to higher sulfur input costs. | |
| Other fourth quarter financial highlights |
Share-based compensation expense was higher in the fourth quarter and full year of 2025 due to an increase in the fair value of our share-based awards. The fair value of our share-based awards takes into consideration several factors, such as our share price movement, our performance relative to our peer group and our return on invested capital.
Gain on sale of investment was higher due to the sale of our 50 percent equity ownership in Profertil.
Income tax increased mainly due to higher earnings. The decrease in the actual effective tax rate is mainly due to the tax impact of the gain on sale of investment in Profertil. | |
52 Nutrien Annual Report 2025
| Overview | MD&A | Five-year highlights | Financial statements and notes |
| ||||||||||
|
|
Results
CONTROLS AND PROCEDURES
Disclosure controls and procedures
We maintain disclosure controls and procedures designed to provide reasonable assurance that information required to be disclosed by Nutrien in its annual filings, interim filings (as these terms are defined in National Instrument 52-109 – Certification of Disclosure in Issuers’ Annual and Interim Filings (“NI 52-109”)), and other reports filed or submitted by us under securities legislation is recorded, processed, summarized and reported within the required time periods. Our Chief Executive Officer and Chief Financial Officer, after evaluating the effectiveness of our disclosure controls and procedures as of the end of the period covered by the annual filings, being December 31, 2025, have concluded that, as of such date, our disclosure controls and procedures were effective in providing reasonable assurance that information required to be disclosed by Nutrien in its annual filings, interim filings, or other reports filed or submitted by it under securities legislation is (a) recorded, processed, summarized and reported within the time periods specified in the securities legislation, and (b) accumulated and communicated to management, including our Chief Executive Officer and Chief Financial Officer, as appropriate, to allow timely decisions regarding required disclosure.
There are inherent limitations to the effectiveness of any system of disclosure controls and procedures, including the possibility of human error and the circumvention or overriding of the controls and procedures. Accordingly, effective disclosure controls and procedures can only provide reasonable assurance of achieving their control objectives.
Internal control over financial reporting
Management is responsible for establishing and maintaining adequate internal control over financial reporting (“ICFR”), as defined in Rules 13a-15(f) and 15d-15(f) under the Securities Exchange Act of 1934, as amended, and NI 52-109. ICFR is designed to provide reasonable assurance regarding the reliability of financial reporting and preparation of consolidated financial statements for external purposes in accordance with IFRS. Any system of ICFR, no matter how well designed, has inherent limitations. Therefore, even those systems determined to be effective can provide only reasonable assurance with respect to financial statement preparation and presentation. The Board of Directors, through its Audit Committee, oversees management’s responsibilities for financial reporting and internal controls.
Under the supervision and with the participation of our management, including our Chief Executive Officer and Chief Financial Officer, we have designed ICFR based on the framework issued by the Committee of Sponsoring Organizations of the Treadway Commission in Internal Control – Integrated Framework (2013) and conducted an evaluation of the design and effectiveness of our ICFR as of the end of the fiscal year ended December 31, 2025. Based on this evaluation, our Chief Executive Officer and Chief Financial Officer concluded that, as at December 31, 2025, Nutrien maintained effective internal control over financial reporting. There have been no changes during the year ended December 31, 2025 that have materially affected, or are reasonably likely to materially affect, our internal control over financial reporting.
The effectiveness of the Company’s internal control over financial reporting as of December 31, 2025 has been audited by KPMG LLP, as reflected in their Report of Independent Registered Public Accounting Firm for 2025, which is included in this 2025 Annual Report.
Nutrien Annual Report 2025 53
|
|
Overview | MD&A | Five-year highlights | Financial statements and notes | ||||||||||
|
|
Results
FORWARD-LOOKING STATEMENTS
Certain statements and other information included in this document, including within the “2026 Guidance” section and the “Market outlook” sections for each segment, constitute “forward-looking information” or “forward-looking statements” (collectively, “forward-looking statements”) under applicable securities laws (such statements are often accompanied by words such as “anticipate”, “forecast”, “expect”, “believe”, “may”, “will”, “should”, “estimate”, “project”, “intend” or other similar words). All statements in this document, other than those relating to historical information or current conditions, are forward-looking statements, including, but not limited to: Nutrien’s business strategies, plans, prospects and opportunities; Nutrien’s 2026 annual guidance, including expectations regarding our Retail adjusted EBITDA, Potash sales volumes, Nitrogen sales volumes, Phosphate sales volumes, depreciation and amortization, finance costs, effective tax rate on adjusted earnings and capital expenditures; our 2026 adjusted EBITDA and adjusted earnings per share sensitivity analysis; our belief that Nutrien’s production assets are positioned to generate significant cash flow and the resulting benefits thereof; expectations regarding Nutrien’s 2026 targets, including with respect to Retail adjusted EBITDA, Potash sales volumes, Nitrogen sales volumes, annual consolidated cost savings, Potash ore tonnes mined using automation, Ammonia operating rate, Phosphate operating rate and supply chain optimization and efficiency run-rate value; Nutrien’s market outlook for 2026 and the projections and expectations related thereto; expectations regarding our capital allocation strategies, including with respect to uses of cash that prioritize safe and reliable operations, maintaining a strong and flexible balance sheet, leveraging existing assets, and returning capital to shareholders through share repurchases and dividends and investment in high-value opportunities to generate significant long-term returns; our ability to advance strategic priorities and high value growth investments; our expectations regarding our priorities for 2026, including safety, growing free cash flow, maintaining ratable share repurchases, completing strategic reviews and optimizing our existing portfolio; expectations regarding our ability to generate cash flow and return capital to our shareholders, including our expectations regarding share repurchases and stable and growing dividends; expectations that internally generated cash flow, as supplemented by new and existing financing sources, will be sufficient to meet our anticipated future cash requirements; expectations regarding performance of our operating segments in 2026; our operating segment market outlooks and our expectations for market conditions, fundamentals and trends in 2026 and beyond, including agriculture and crop nutrient markets and global energy supply, the anticipated supply and demand for our products and services, expected market, industry and growing conditions with respect to crop nutrient application rates, planted acres, farmer crop investment, crop mix, including the need to replenish soil nutrient levels, production volumes and expenses, shipments, natural gas costs and availability, consumption, prices, operating rates, the impact of seasonality, import and export volumes, tariffs, trade or export restrictions, economic sanctions and restrictions, operating rates, inventories, crop development, natural gas curtailments in Trinidad and elsewhere, and global population growth expectations; our review of strategic alternatives for our Phosphate business, including potential outcomes such as reconfiguring operations, strategic partnerships, a potential sale of all or part of the business and the possibility that no transaction or change occurs; expectations concerning future product offerings; the negotiation of sales and other contracts, including the expiry of existing contracts; acquisitions and divestitures and the anticipated benefits thereof; and expectations in connection with our ability to deliver long-term returns to shareholders.
These forward-looking statements are subject to a number of assumptions, risks and uncertainties, many of which are beyond our control, which could cause actual results to differ materially from such forward-looking statements. As such, undue reliance should not be placed on these forward-looking statements.
All of the forward-looking statements are qualified by the assumptions that are stated or inherent in such forward-looking statements, including the assumptions referred to below and elsewhere in this document. Although we believe that these assumptions are reasonable, having regard to our experience and our perception of historical trends, the assumptions set forth below are not exhaustive of the factors that may affect any of the forward-looking statements and the reader should not place undue reliance on these assumptions and such forward-looking statements. Current conditions, economic and otherwise, render assumptions, although reasonable when made, subject to greater uncertainty.
Key assumptions that have been made in relation to the operation of our business as currently planned and our ability to achieve our business objectives include, among other things, assumptions and expectations regarding our strategic priorities and targets in 2026 and beyond, and our ability to achieve them; our ability to successfully complete, integrate and realize the anticipated benefits of our already completed and future acquisitions and divestitures, and that we will be able to implement our standards, controls, procedures and policies in respect of any acquired businesses and realize the expected synergies on the anticipated timeline or at all; that future business, regulatory and industry conditions will be within the parameters expected by us, including with respect to prices, expenses, margins, demand, supply, product availability, shipments, consumption, weather conditions, supplier agreements, product distribution agreements, availability, inventory levels, exports, tariffs, including general or retaliatory tariffs, trade restrictions, international trade arrangements, crop development and cost of labor and interest, exchange and effective tax rates; assumptions with respect to global economic conditions and the accuracy of our market outlook expectations for 2025 and in the future; assumptions with respect to our ability to successfully implement our business strategies, growth and capital allocation investments and initiatives; that we will conduct
54 Nutrien Annual Report 2025
| Overview | MD&A | Five-year highlights | Financial statements and notes |
| ||||||||||
|
|
Results
our operations and achieve results of operations as anticipated; assumptions related to our assessment of recoverable amount estimates of our assets, including in relation to asset and goodwill impairments of certain of our cash generating units; potash demand growth in offshore markets and normalization of Canpotex port operations; our intention to complete share repurchases under our normal course issuer bid programs, including TSX approval, the funding of such share repurchases, existing and future market conditions, including with respect to the price of our common shares, capital allocation priorities, and compliance with respect to applicable limitations under securities laws and regulations and stock exchange policies; assumptions related to our ability to fund our dividends at the current level and at increased levels in the future; our expectations regarding the impacts, direct and indirect, of certain geopolitical conflicts on, among other things, global supply and demand, including for crop nutrients, energy and commodity prices, global interest rates, supply chains and the global macroeconomic environment, including inflation; the adequacy of our cash generated from operations and our ability to access our credit facilities or capital markets for additional sources of financing; our ability to identify suitable candidates for acquisitions and divestitures and negotiate acceptable terms; availability of investment opportunities that align with our strategic priorities and growth strategy; our ability to maintain investment grade ratings and achieve our performance targets; our ability to successfully negotiate sales and other contracts; and our ability to successfully implement new initiatives and programs. In respect of our 2026 Potash sales volume target, we have made assumptions with respect to, among other things: market conditions, fertilizer and commodity prices, supply and demand, capital availability, logistics, our ability to maintain market share and that potash operations will operate within expectations. In respect of 2026 nitrogen sales volume target, we have made assumptions with respect to, among other things: market conditions, fertilizer and commodity prices, supply and demand, capital availability, natural gas availability, timely execution of expansion projects and reliability.
Events or circumstances could cause actual results to differ materially from those in the forward-looking statements. With respect to our business generally and our ability to meet other targets, commitments, goals, strategies and related milestones and schedules disclosed in this document, such events or circumstances include, but are not limited to: failure to achieve an optimal outcome of our strategic review process for our Phosphate business; general global economic, market and business conditions; failure to achieve expected results of our business strategy, capital allocation initiatives or results of operations or targets, expected capital expenditures in 2026, delivering upstream fertilizer sales volume growth and advancing high return downstream Retail growth opportunities; failure to complete announced and future acquisitions or divestitures at all or on the expected terms and within the expected timeline; seasonality; climate change and weather conditions, and impacts from regional flooding and/or drought conditions; crop planted acreage, yield and prices; the supply and demand and price levels for our products; governmental and regulatory requirements and actions by governmental authorities, including changes in government policy (including in respect of tariffs, trade restrictions and climate change initiatives) and government ownership requirements; the potential that Nutrien may become subject to new laws or regulations that impose new requirements or require new or additional permits or approvals, and the associated effects thereof, and changes in environmental, tax, antitrust, and other laws or regulations and the interpretation thereof; trade restrictions, including the imposition of any tariffs, or other changes to international trade arrangements; the effects of current and future international trade agreements or other developments affecting the level of global trade; political or military risks, including civil unrest, actions by armed groups or conflict and malicious acts including terrorism and industrial espionage; our ability to access sufficient, cost-effective and timely transportation, distribution and storage of products (including potential rail transportation and port disruptions due to labor strikes and/or work stoppages or other similar actions); the occurrence of a major environmental or safety incident or becoming subject to legal or regulatory proceedings; innovation and cybersecurity risks related to our systems, including our costs of addressing or mitigating such risks; counterparty and sovereign risk; delays in completion of turnarounds at our major facilities or challenges related to our major facilities that are out of our control; interruptions of or constraints in availability of key inputs, including natural gas and sulfur; any significant impairment of the carrying amount of certain assets; the risk that rising interest rates and/or deteriorated business operating results may result in the further impairment of assets or goodwill attributed to certain cash generating units; risks related to reputational loss; certain complications that may arise in our mining processes; the ability to attract, engage and retain skilled employees and strikes or other forms of work stoppages; geopolitical conflicts, and their potential impact on, among other things, global market conditions and supply and demand, including for crop nutrients, energy and commodity prices, interest rates, supply chains and the global economy generally; our ability to execute on our strategies related to environmental, social and governance matters, and achieve related expectations, targets and commitments, including risks associated with disclosure thereof; and other risk factors detailed from time to time in Nutrien reports filed with the Canadian securities regulators and the SEC in the US.
The purpose of our 2026 Retail adjusted EBITDA, depreciation and amortization, finance costs, effective tax rate on adjusted earnings and capital expenditures guidance ranges are to assist readers in understanding our expected and targeted financial results, and this information may not be appropriate for other purposes.
The forward-looking statements in this document are made as of the date hereof and Nutrien disclaims any intention or obligation to update or revise any forward-looking statements in this document as a result of new information or future events, except as may be required under applicable Canadian securities legislation or applicable US federal securities laws. Any forward-looking statements contained herein are expressly qualified by this cautionary statement.
Nutrien Annual Report 2025 55
|
|
Overview | MD&A | Five-year highlights | Financial statements and notes | ||||||||||
|
|
Appendices
Non-GAAP financial measures
We use both IFRS measures and certain non-GAAP financial measures to assess performance. Non-GAAP financial measures are financial measures disclosed by the Company that: (a) depict historical or expected future financial performance, financial position or cash flow of the Company; (b) with respect to their composition, exclude amounts that are included in, or include amounts that are excluded from, the composition of the most directly comparable financial measure disclosed in the primary financial statements of the Company; (c) are not disclosed in the financial statements of the Company; and (d) are not a ratio, fraction, percentage or similar representation. Non-GAAP ratios are financial measures disclosed by the Company that are in the form of a ratio, fraction, percentage or similar representation that has a non-GAAP financial measure as one or more of its components, and that are not disclosed in the financial statements of the Company.
These non-GAAP financial measures and non-GAAP ratios are not standardized financial measures under IFRS and, therefore, are unlikely to be comparable to similar financial measures presented by other companies. Management believes these non-GAAP financial measures and non-GAAP ratios provide transparent and useful supplemental information to help investors evaluate our financial performance, financial condition and liquidity using the same measures as management. These non-GAAP financial measures and non-GAAP ratios should not be considered as a substitute for, or superior to, measures of financial performance prepared in accordance with IFRS.
The following section outlines our non-GAAP financial measures and non-GAAP ratios, their compositions, and why management uses each measure. It also includes reconciliations to the most directly comparable IFRS measures. Except as otherwise described herein, our non-GAAP financial measures and non-GAAP ratios are calculated on a consistent basis from period to period and are adjusted for specific items in each period, as applicable. As additional non-recurring or unusual items arise in the future, we generally exclude these items in our calculations.
Adjusted EBITDA (consolidated)
Most directly comparable IFRS financial measure: Net earnings (loss).
Definition: Adjusted EBITDA is calculated as net earnings (loss) before finance costs, income taxes, depreciation and amortization, share-based compensation and certain foreign exchange gain/loss (net of related derivatives). We also adjust this measure for the following other income and expenses that are excluded when management evaluates the performance of our day-to-day operations: integration and restructuring related costs, impairment or reversal of impairment of assets, gain or loss on disposal of certain businesses and investments, asset retirement obligations (“ARO”) and accrued environmental costs (“ERL”) related to our non-operating sites, and loss related to financial instruments in Argentina.
Why we use the measure and why it is useful to investors: It is not impacted by long-term investment and financing decisions, but rather focuses on the performance of our day-to-day operations. It provides a measure of our ability to service debt and to meet other payment obligations and as a component of employee remuneration calculations.
| ($ millions) | 2025 | 2024 | ||||||
| Net earnings |
2,297 | 700 | ||||||
| Finance costs |
687 | 720 | ||||||
| Income tax expense |
752 | 436 | ||||||
| Depreciation and amortization |
2,369 | 2,339 | ||||||
| EBITDA1 |
6,105 | 4,195 | ||||||
| Adjustments: |
||||||||
| Share-based compensation expense |
163 | 37 | ||||||
| Foreign exchange loss, net of related derivatives |
9 | 360 | ||||||
| ARO/ERL related expenses for non-operating sites |
2 | 151 | ||||||
| Loss related to financial instruments in Argentina |
– | 35 | ||||||
| Restructuring costs |
68 | 47 | ||||||
| Impairment of assets |
– | 530 | ||||||
| Gain on sale of investment in Profertil |
(301 | ) | – | |||||
| Adjusted EBITDA |
6,046 | 5,355 | ||||||
| 1 | EBITDA is calculated as net earnings before finance costs, income taxes, and depreciation and amortization. |
56 Nutrien Annual Report 2025
| Overview | MD&A | Five-year highlights | Financial statements and notes |
| ||||||||||
|
|
Appendices
Adjusted net earnings and adjusted net earnings per share
Most directly comparable IFRS financial measure: Net earnings (loss) and diluted net earnings (loss) per share.
Definition: Adjusted net earnings and related per share information are calculated as net earnings (loss) before share-based compensation and certain foreign exchange gain/loss (net of related derivatives), net of tax. We also adjust this measure for the following other income and expenses (net of tax) that are excluded when management evaluates the performance of our day-to-day operations: certain integration and restructuring related costs, impairment or reversal of impairment of assets, gain or loss on disposal of certain businesses and investments, gain or loss on early extinguishment of debt or on settlement of derivatives due to discontinuance of hedge accounting, ARO and accrued ERL related to our non-operating sites, loss related to financial instruments in Argentina, change in recognition of tax losses and deductible temporary differences related to impairments and certain changes to tax declarations. We generally apply the annual forecasted effective tax rate to specific adjustments during the year, and at year-end, we apply the actual effective tax rate.
Why we use the measure and why it is useful to investors: Focuses on the performance of our day-to-day operations and is used as a component of employee remuneration calculations.
| 2025 | 2024 | |||||||||||||||||||||||
| ($ millions, except as otherwise noted) | Increases (decreases) |
Post-tax | Per diluted share |
Increases (decreases) |
Post-tax | Per diluted share |
||||||||||||||||||
| Net earnings attributable to equity holders of Nutrien |
2,267 | 4.66 | 674 | 1.36 | ||||||||||||||||||||
| Adjustments: |
||||||||||||||||||||||||
| Share-based compensation expense |
163 | 123 | 0.25 | 37 | 27 | 0.05 | ||||||||||||||||||
| Foreign exchange loss, net of related derivatives |
9 | 6 | 0.03 | 360 | 346 | 0.70 | ||||||||||||||||||
| Restructuring costs |
68 | 59 | 0.12 | 47 | 38 | 0.08 | ||||||||||||||||||
| Impairment of assets |
– | – | – | 530 | 492 | 1.00 | ||||||||||||||||||
| ARO/ERL related expenses for non-operating sites |
2 | 2 | – | 151 | 106 | 0.21 | ||||||||||||||||||
| Gain on sale of investment in Profertil |
(301 | ) | (241 | ) | (0.50 | ) | – | – | – | |||||||||||||||
| Loss related to financial instruments in Argentina |
– | – | – | 35 | 35 | 0.07 | ||||||||||||||||||
|
Sub-total adjustments |
(59 | ) | (51 | ) | (0.10 | ) | 1,160 | 1,044 | 2.11 | |||||||||||||||
| Adjusted net earnings |
|
|
|
2,216 | 4.56 |
|
|
|
1,718 | 3.47 | ||||||||||||||
Nutrien Annual Report 2025 57
|
|
Overview | MD&A | Five-year highlights | Financial statements and notes | ||||||||||
|
|
Appendices
Effective tax rate on adjusted net earnings
Effective tax rate on adjusted net earnings guidance is a forward-looking non-GAAP financial measure as it includes adjusted net earnings, which is a non-GAAP financial measure. It is provided to assist readers in understanding our expected financial results. Effective tax rate on adjusted net earnings guidance excludes certain items that management is aware of that permit management to focus on the performance of our operations (see the Adjusted Net Earnings and Adjusted Net Earnings Per Share section for items generally adjusted). We do not provide a reconciliation of this forward-looking measure to the most directly comparable financial measures calculated and presented in accordance with IFRS because a meaningful or accurate calculation of reconciling items and the information is not available without unreasonable effort due to unknown variables, including the timing and amount of certain reconciling items, and the uncertainty related to future results. These unknown variables may include unpredictable transactions of significant value that may be inherently difficult to determine without unreasonable efforts. The probable significance of such unavailable information, which could be material to future results, cannot be addressed.
Effective tax rate on adjusted net earnings ratio is calculated as adjusted income tax expense divided by adjusted earnings before income taxes. We use this measure to provide the actual result for a previously disclosed forward-looking effective tax rate on adjusted net earnings guidance.
| ($ millions, except as otherwise noted) | 2025 | |||
| Earnings before income taxes |
3,049 | |||
| Adjustments1 |
(59 | ) | ||
| Adjusted earnings before income taxes |
2,990 | |||
| Income tax expense |
752 | |||
| Adjustments2 |
(8 | ) | ||
| Adjusted income tax expense |
744 | |||
| Effective tax rate on adjusted net earnings (%) |
24.9 | |||
| 1 | Calculated as sum of pre-tax adjustments noted in the Adjusted Net Earnings section. |
| 2 | Calculated as difference between the sum of pre-tax and post-tax adjustments noted in the Adjusted Net Earnings section. |
Free cash flow
Most directly comparable IFRS financial measure: Cash provided by operating activities.
Definition: Free cash flow is calculated as cash provided by operating activities less sustaining capital expenditures, mine development and pre-stripping capital expenditures, and repayment of the principal portion of lease liabilities.
Why we use the measure and why it is useful to investors: To assess our operational performance and evaluate our ability to create long-term value by funding activities that include dividend payments, investing capital, debt repayment and share repurchases.
|
|
2025 | 2024 | 2023 | |||||||||
| Cash provided by operating activities |
4,007 | 3,535 | 5,066 | |||||||||
| Sustaining capital expenditures1 |
(1,364 | ) | (1,468 | ) | (1,404 | ) | ||||||
| Mine development and pre-stripping capital expenditures1 |
(245 | ) | (256 | ) | (262 | ) | ||||||
| Repayment of principal portion of lease liabilities |
(419 | ) | (402 | ) | (375 | ) | ||||||
| Free cash flow |
1,979 | 1,409 | 3,025 | |||||||||
| 1 | These are supplementary financial measures. See the “Other financial measures” section. |
58 Nutrien Annual Report 2025
| Overview | MD&A | Five-year highlights | Financial statements and notes |
| ||||||||||
|
|
Appendices
Gross margin excluding depreciation and amortization per tonne – manufactured product
Most directly comparable IFRS financial measure: Gross margin.
Definition: Gross margin per tonne less depreciation and amortization per tonne for manufactured products. Reconciliations are provided in the “Results” section.
Why we use the measure and why it is useful to investors: Focuses on the performance of our day-to-day operations, which excludes the effects of items that primarily reflect the impact of long-term investment and financing decisions.
Potash controllable cash cost of product manufactured (“COPM”) per tonne
Most directly comparable IFRS financial measure: Cost of goods sold (“COGS”) for the Potash segment.
Definition: Total Potash COGS excluding depreciation and amortization expense included in COPM, royalties, natural gas costs and carbon taxes, change in inventory, and other adjustments, divided by potash production tonnes.
Why we use the measure and why it is useful to investors: To assess operational performance. Potash controllable cash COPM excludes the effects of production from other periods and the impacts of our long-term investment decisions, supporting a focus on the performance of our day-to-day operations. Potash controllable cash COPM also excludes royalties and natural gas costs and carbon taxes, which management does not consider controllable, as they are primarily driven by regulatory and market conditions.
| ($ millions, except as otherwise noted) | 2025 | 2024 | ||||||
| Total COGS – Potash |
1,581 | 1,448 | ||||||
| Change in inventory |
(2 | ) | 36 | |||||
| Other adjustments1 |
(27 | ) | (21 | ) | ||||
| COPM |
1,552 | 1,463 | ||||||
| Depreciation and amortization in COPM |
(606 | ) | (581 | ) | ||||
| Royalties in COPM |
(93 | ) | (79 | ) | ||||
| Natural gas costs and carbon taxes in COPM |
(42 | ) | (36 | ) | ||||
| Controllable cash COPM |
811 | 767 | ||||||
| Production tonnes (tonnes – thousands) |
13,966 | 14,205 | ||||||
| Potash controllable cash COPM per tonne |
58 | 54 | ||||||
| 1 | Other adjustments include unallocated production overhead that is recognized as part of cost of goods sold but is not included in the measurement of inventory and changes in inventory balances. |
Nutrien Annual Report 2025 59
|
|
Overview | MD&A | Five-year highlights | Financial statements and notes | ||||||||||
|
|
Appendices
Ammonia controllable cash COPM per tonne
Most directly comparable IFRS financial measure: COGS for the Nitrogen segment.
Definition: Total Nitrogen COGS excluding depreciation and amortization expense included in COGS, cash COGS for products other than ammonia, other adjustments, and natural gas and steam costs, divided by net ammonia production tonnes.
Why we use the measure and why it is useful to investors: To assess operational performance. Ammonia controllable cash COPM excludes the effects of production from other periods, the costs of natural gas and steam, and long-term investment decisions, supporting a focus on the performance of our day-to-day operations.
| ($ millions, except as otherwise noted) | 2025 | 2024¹ | ||||||
| Total Manufactured COGS – Nitrogen2 |
2,382 | 2,282 | ||||||
| Total Other COGS – Nitrogen2 |
198 | 92 | ||||||
| Total COGS – Nitrogen |
2,580 | 2,374 | ||||||
| Depreciation and amortization in COGS |
(522 | ) | (483 | ) | ||||
| Cash COGS for products other than ammonia |
(1,487 | ) | (1,287 | ) | ||||
| Ammonia |
||||||||
| Total cash COGS before other adjustments |
571 | 604 | ||||||
| Other adjustments2 |
(142 | ) | (165 | ) | ||||
| Total cash COPM |
429 | 439 | ||||||
| Natural gas and steam costs in COPM |
(296 | ) | (292 | ) | ||||
| Controllable cash COPM |
133 | 147 | ||||||
| Production tonnes (net tonnes3 – thousands) |
2,308 | 2,372 | ||||||
| Ammonia controllable cash COPM per tonne |
58 | 62 | ||||||
| 1 | Comparative figures have been reclassified for our Purchase for Resale business from Nitrogen to the Corporate and Others segment. |
| 2 | Other adjustments include unallocated production overhead that is recognized as part of cost of goods sold but is not included in the measurement of inventory and changes in inventory balances. |
| 3 | Ammonia tonnes available for sale, as not upgraded to other nitrogen products. |
Retail average working capital to sales and Retail average working capital to sales excluding Nutrien Financial
Definition: Retail average working capital divided by Retail sales for the last four rolling quarters. We also look at this metric excluding Nutrien Financial revenue and working capital.
Why we use the measure and why it is useful to investors: To evaluate operational efficiency. A lower or higher percentage
represents increased or decreased efficiency, respectively. The metric excluding Nutrien Financial shows the impact that the working
capital of Nutrien Financial has on the ratio.
| ($ millions, except as otherwise noted) | 2025 | 2024 | ||||||
| Average current assets |
11,240 | 10,981 | ||||||
| Average current liabilities |
7,309 | 7,424 | ||||||
| Average working capital |
3,931 | 3,557 | ||||||
| Average Nutrien Financial working capital |
(3,693 | ) | (3,561 | ) | ||||
| Average working capital excluding Nutrien Financial |
238 | (4 | ) | |||||
| Sales |
17,620 | 17,832 | ||||||
| Nutrien Financial revenue |
(376 | ) | (361 | ) | ||||
| Sales excluding Nutrien Financial |
17,244 | 17,471 | ||||||
| Average working capital to sales (%) |
22 | 20 | ||||||
| Average working capital to sales excluding Nutrien Financial (%) |
1 | – | ||||||
60 Nutrien Annual Report 2025
| Overview | MD&A | Five-year highlights | Financial statements and notes |
| ||||||||||
|
|
Appendices
Nutrien Financial adjusted net interest margin
Definition: Nutrien Financial revenue less deemed interest expense divided by average Nutrien Financial net receivables outstanding for the last four rolling quarters.
Why we use the measure and why it is useful to investors: Used by credit rating agencies and others to evaluate the financial performance of Nutrien Financial.
| ($ millions, except as otherwise noted) | 2025 | 2024 | ||||||
| Nutrien Financial revenue |
376 | 361 | ||||||
| Deemed interest expense1 |
(177 | ) | (174 | ) | ||||
| Net interest |
199 | 187 | ||||||
| Average Nutrien Financial net receivables |
3,693 | 3,561 | ||||||
| Nutrien Financial adjusted net interest margin (%) |
5.4 | 5.3 | ||||||
| 1 | Average borrowing rate applied to the notional debt required to fund the portfolio of receivables from customers monitored and serviced by Nutrien Financial. |
Retail cash operating coverage ratio
Definition: Retail selling, general and administrative, and other expenses (income), excluding depreciation and amortization expense, divided by Retail gross margin excluding depreciation and amortization expense in cost of goods sold, for the last four rolling quarters.
Why we use the measure and why it is useful to investors: To understand the costs and underlying economics of our Retail operations and to assess our Retail operating performance and ability to generate cash flow.
| ($ millions, except as otherwise noted) | 2025 | 2024 | ||||||
| Selling expenses |
3,306 | 3,418 | ||||||
| General and administrative expenses |
172 | 191 | ||||||
| Other expenses |
123 | 87 | ||||||
| Operating expenses |
3,601 | 3,696 | ||||||
| Depreciation and amortization in operating expenses |
(714 | ) | (751 | ) | ||||
| Operating expenses excluding depreciation and amortization |
2,887 | 2,945 | ||||||
| Gross margin |
4,603 | 4,621 | ||||||
| Depreciation and amortization in cost of goods sold |
20 | 20 | ||||||
| Gross margin excluding depreciation and amortization |
4,623 | 4,641 | ||||||
| Cash operating coverage ratio (%) |
62 | 63 | ||||||
Nutrien Annual Report 2025 61
|
|
Overview | MD&A | Five-year highlights | Financial statements and notes | ||||||||||
|
|
Appendices
Return on invested capital (“ROIC”)
Definition: ROIC is calculated as net operating profit after taxes divided by the average invested capital for the last four rolling quarters.
Net operating profit after taxes, a non-GAAP financial measure, is calculated as earnings before finance costs and income taxes, depreciation and amortization related to the fair value adjustments as a result of the Merger (the merger of equals transaction between PotashCorp and Agrium), share-based compensation, and certain foreign exchange gain/loss (net of related derivatives) and Nutrien Financial earnings before finance costs and income taxes. The most directly comparable IFRS financial measure to net operating profit after taxes is earnings before finance costs and income taxes. We also adjust this measure for the following other income and expenses that are excluded when management evaluates the performance of our day-to-day operations: integration and restructuring related costs, impairment or reversal of impairment of assets, and gain or loss on disposal of certain businesses and investments. A tax rate of 25 percent is applied on the calculated amount.
Invested capital is calculated as last four rolling quarter average of total assets less cash and cash equivalents; payables and accrued charges; Merger fair value adjustments on goodwill, intangible assets, and property, plant and equipment; and average Nutrien Financial working capital.
We exclude in our calculations the related financial information of certain acquisitions during the first year following the acquisition.
Why we use the measure and why it is useful to investors: ROIC provides useful information to evaluate how efficiently we allocate our capital and is used as a component of employee remuneration calculations.
| ($ millions, except as otherwise noted) | 2025 | 2024 | ||||||
| Earnings before finance costs and income taxes |
3,736 | 1,856 | ||||||
| Merger adjustments1 |
186 | 216 | ||||||
| Restructuring costs |
68 | 47 | ||||||
| Share-based compensation expense (recovery) |
163 | 37 | ||||||
| Impairment of assets |
– | 530 | ||||||
| ARO/ERL related expense for non-operating sites |
2 | 151 | ||||||
| Foreign exchange loss, net of related derivatives |
9 | 360 | ||||||
| Loss related to financial instruments in Argentina |
– | 35 | ||||||
| Gain on sale of investment in Profertil |
(301 | ) | – | |||||
| Nutrien Financial earnings before finance costs and income taxes |
(215 | ) | (170 | ) | ||||
| Net operating profit |
3,648 | 3,062 | ||||||
| Tax (calculated at 25%) |
912 | 766 | ||||||
| Net operating profit after tax |
2,736 | 2,296 | ||||||
| ($ millions, except as otherwise noted) | 2025 | 2024 | ||||||
| Average total assets |
52,613 | 52,579 | ||||||
| Average cash and cash equivalents |
(902 | ) | (718 | ) | ||||
| Average payables and accrued charges |
(8,488 | ) | (8,547 | ) | ||||
| Average merger adjustments1 |
(9,596 | ) | (9,628 | ) | ||||
| Average Nutrien Financial receivables |
(3,693 | ) | (3,561 | ) | ||||
| Invested capital |
29,934 | 30,125 | ||||||
|
|
|
|
|
|
|
| ||
| Return on invested capital (%) |
9 | 8 | ||||||
| 1 | Depreciation and amortization related to the fair value adjustments as a result of the Merger. |
62 Nutrien Annual Report 2025
| Overview | MD&A | Five-year highlights | Financial statements and notes |
| ||||||||||
|
|
Appendices
Other financial measures
Supplementary financial measures
Supplementary financial measures are financial measures disclosed by the Company that: (a) are, or are intended to be, disclosed on a periodic basis to depict the historical or expected future financial performance, financial position or cash flow of the Company; (b) are not disclosed in the financial statements of the Company; (c) are not non-GAAP financial measures; and (d) are not non-GAAP ratios.
Retail adjusted EBITDA margin: Retail adjusted EBITDA divided by Retail sales for the last four rolling quarters.
Sustaining capital expenditures: Represents capital expenditures that are required to sustain operations at existing levels and include major repairs and maintenance and plant turnarounds.
Investing capital expenditures: Represents capital expenditures related to significant expansions of current operations or to create cost savings (synergies). Investing capital expenditures excludes capital outlays for business acquisitions and equity-accounted investees.
Mine development and pre-stripping capital expenditures: Represents capital expenditures that are required for activities to open new areas underground and/or develop a mine or ore body to allow for future production mining and activities required to prepare and/or access the ore, i.e., removal of an overburden that allows access to the ore.
Cash used for dividends and share repurchases: Calculated as dividends paid to Nutrien’s shareholders plus repurchase of common shares as reflected in the consolidated statements of cash flows. This measure is useful as it represents return of cash to shareholders.
Capital management measures
Capital management measures are financial measures disclosed by the Company that: (a) are intended to enable an individual to evaluate the Company’s objectives, policies and processes for managing the Company’s capital; (b) are not a component of a line item disclosed in the primary financial statements of the Company; (c) are disclosed in the notes of the financial statements of the Company; and (d) are not disclosed in the primary financial statements of the Company.
The following section outlines our capital management measure, its composition and why management uses the measure.
Adjusted net debt to adjusted EBITDA: Calculated as adjusted net debt to adjusted EBITDA. Adjusted EBITDA is a non-GAAP financial measure. This ratio measures financial leverage and our ability to pay our debt.
The most directly comparable measure for adjusted net debt is total short-term and long-term debt and lease liabilities less cash and cash equivalents and is defined as the total of short-term and long-term debt plus lease liabilities less cash and cash equivalents and unamortized fair value adjustments. This measure is useful as it adjusts for the unamortized fair value adjustments that arose at the time of the Merger and is non-cash in nature.
| ($ millions, except as otherwise noted) | 2025 | 2024 | ||||||
| Short-term debt |
873 | 1,534 | ||||||
| Current portion of long-term debt |
513 | 1,037 | ||||||
| Current portion of lease liabilities |
346 | 356 | ||||||
| Long-term debt |
9,350 | 8,881 | ||||||
| Lease liabilities |
937 | 999 | ||||||
| Total debt |
12,019 | 12,807 | ||||||
| Cash and cash equivalents |
(701 | ) | (853 | ) | ||||
| Unamortized fair value adjustments |
(258 | ) | (276 | ) | ||||
| Adjusted net debt |
11,060 | 11,678 | ||||||
Nutrien Annual Report 2025 63
|
|
Overview | MD&A | Five-year highlights | Financial statements and notes | ||||||||||
|
|
Appendices
OTHER FINANCIAL INFORMATION
| Nature of financial information and consolidated financial statements note reference |
|
Description | ||
| Off-Balance Sheet Arrangements
(Notes 5, 12, 22, 25 and 27) |
|
Principal off-balance sheet activities primarily include:
– Agreement to reimburse losses of Canpotex. – Issuance of guarantee contracts. – An agency arrangement with a financial institution in relation to certain customer loans. – Certain non-financial derivatives that were entered into and continued to be held for the purpose of the receipt or delivery of a non-financial item, such as grain or natural gas, in accordance with expected purchase, sale or usage requirements. Other derivatives are included on our balance sheet at fair value.
We do not reasonably expect any presently known trend or uncertainty to affect our ability to continue using these arrangements, except as indicated above. | ||
| Related Party Transactions
(Note 26) |
|
Our main related party is Canpotex, a Canadian potash export, sales and marketing company owned in equal shares by Nutrien and another potash producer. | ||
| Financial Instruments and Other Instruments
(Note 5) |
|
Our financial instruments are subject to various risks such as credit, liquidity and market risks. As discussed in the “Governance” section, our ELT is responsible for ensuring that our principal risks, including financial risks, are being appropriately identified, assessed and addressed. | ||
Material accounting policies and Critical accounting estimates
Nutrien’s material accounting policies are described in Note 28 of the audited Consolidated Financial Statements for the year ended December 31, 2025.
Critical accounting estimates
We prepare our consolidated financial statements in accordance with IFRS, which requires us to make judgments, assumptions and estimates in applying accounting policies. Critical accounting estimates are those which are highly uncertain at the time they are made or where different estimates would be reasonably likely to have a material impact on our financial condition or results of operations. We have discussed the development, selection and application of our key accounting policies, and the critical accounting estimates and assumptions they involve, with the Audit Committee of the Board.
Refer to the notes to the consolidated financial statements for additional information on the following critical accounting estimates including methodology used for calculating our estimates (when applicable), key assumptions used, and factors considered in our estimates and judgments.
| Consolidated financial statements note reference |
|
Critical accounting estimate description | ||
| Notes 14 and 27 |
|
Long-lived asset impairments and reversals
We review our assets, at each reporting period, for conditions to determine whether there is any indication that an impairment exists that could potentially impact the carrying amount of our long-lived assets to be held and used. When such indicators exist, impairment testing is performed. We review, at each reporting period, for possible reversal of the impairment for non-financial assets, other than goodwill. | ||
64 Nutrien Annual Report 2025
| Overview | MD&A | Five-year highlights | Financial statements and notes |
| ||||||||||
|
|
Appendices
| Consolidated financial statements note reference |
|
Critical accounting estimate description | ||
| Notes 14, 15 and 27 |
|
Goodwill impairment analysis
We test our operating segments that have goodwill allocated to them when events or circumstances indicate that there could be an impairment, or at least annually on October 1. Goodwill is more susceptible to impairment risk if business operating results or economic conditions deteriorate and we anticipate not meeting our forecasts. The key assumptions with the greatest influence on the calculation of the recoverable amounts are the discount rates, terminal growth rates and forecasted EBITDA. The key forecast assumptions are based on historical data and our estimates of future results from internal sources considering industry and market information. Key assumptions in our testing models may change, and changes that could reasonably be expected to occur may cause impairment. Such change in assumptions could be driven by global supply and demand, other market factors, changes in regulations, and other future events outside our control. Refer to note 14 of the consolidated financial statements for sensitivity analysis. | ||
| Notes 22 and 27 |
Asset retirement obligations (“AROs”) and accrued environmental costs (“ERLs”) – measurement
AROs and ERLs have a high degree of estimation uncertainty for future costs and estimated remediation timelines. The Potash and Phosphate segments have AROs and ERLs associated with their mining operations while the Corporate and Others segment has these liabilities for any non-operational sites. Refer to note 22 of the consolidated financial statements for sensitivity analysis.
For the Nitrogen segment, there are no significant AROs recorded as there is no reasonable basis for estimating a date or range of dates for cessation of operations. We considered the historical performance of our facilities as well as our planned maintenance, major upgrades and replacements, which can extend the useful lives beyond the foreseeable future. | |||
Standards, amendments and interpretations effective and applied
The IASB and IFRS Interpretations Committee (“IFRIC”) have issued certain standards and amendments or interpretations to existing standards that were effective, and we have applied.
In 2025, we adopted the following standards, amendments and annual improvements with no material impact on our consolidated financial statements:
| – | Lack of Exchangeability (Amendments to IAS 21) |
Standards, amendments and interpretations not yet effective and not applied
The IASB and IFRIC have issued the following standards, amendments or interpretations to existing standards that were not yet effective and not applied as at December 31, 2025.
The following amendments will be adopted in 2026 and are not expected to have a material impact on our consolidated financial statements:
| – | Classification and Measurement of Financial Instruments (Amendments to IFRS 9 and IFRS 7), effective January 1, 2026. |
Based on our adoption work to date, we expect liabilities settled by cheque to be derecognized when the cheque is cleared and settled with the counterpart’s bank, instead of when the cheque is written. This change will affect the timing of derecognition for certain trade and other payables but is not expected to have a material impact on the consolidated financial statements.
The following standard is being reviewed to determine the potential impact on our consolidated financial statements:
| – | Presentation and Disclosure in Financial Statements (IFRS 18), effective January 1, 2027. In April 2024, the IASB issued IFRS 18, which will replace IAS 1 Presentation of Financial Statements. The new standard will require classification of income and expenses into specified categories of operating, investing and financing. The standard will also require defined subtotals including operating profit, and note disclosures including our management-defined performance measures (“MPMs”). The new standard also provides guidance on aggregation and disaggregation of disclosures. |
We will continue to assess the full impact of IFRS 18 and disclose any significant updates as our implementation progresses.
Nutrien Annual Report 2025 65
|
|
Overview | MD&A | Five-year highlights | Financial statements and notes | ||||||||||
|
|
Terms
| Terms |
| |
| AECO | Alberta Energy Company, Canada | |
| ABARES | Australian Bureau of Agricultural and Resource Economics and Sciences | |
| AgbioInvestor | AgbioInvestor, UK | |
| Argus | Argus Media group, UK | |
| Bloomberg | Bloomberg Finance L.P., USA | |
| Conab | The National Supply Company (CONAB) is a public company under the Ministry of Agriculture, Livestock and Food Supply – MAPA | |
| CME | Chicago Mercantile Exchange | |
| Croplife | Croplife Media Group, USA | |
| CRU | CRU International Ltd., UK | |
| ICE | Intercontinental Exchange | |
| IFA | International Fertilizer Association | |
| IMEA | Mato Grosso Institute of Agricultural Economics | |
| Moody’s | Moody’s Corporation (NYSE: MCO), USA | |
| NYMEX | New York Mercantile Exchange, USA | |
| NYSE | New York Stock Exchange, USA | |
| S&P | S&P Global Inc., USA | |
| SPGCI | S&P Global Commodity Insights | |
| StatsCan | Statistics Canada | |
| TFI | The Fertilizer Institute, USA | |
| TTF | Title Transfer Facility | |
| TSX | Toronto Stock Exchange, Canada | |
| USDA | United States Department of Agriculture, USA | |
| WASDE | World Agriculture Supply and Demand Estimates, USA | |
| AUD | Australian dollar | |
| BRL | Brazilian real | |
| CAD | Canadian dollar | |
| USD | United States dollar | |
| 114 Nutrien Annual Report 2025 |
| Overview | MD&A | Five-year highlights | Financial statements and notes |
| ||||||||||
|
|
Terms
| Scientific terms |
|
| ||
| Potash | KCI | potassium chloride, 60%–63.2% K2O (solid) | ||
| Nitrogen | CO2 | carbon dioxide | ||
|
|
DEF | diesel exhaust fluid | ||
|
|
ESN® | Environmentally Smart Nitrogen®, 44% nitrogen | ||
|
|
UAN | urea ammonium nitrate solution, 28%–32% N (liquid) | ||
| Phosphate | AS | ammonium sulfate (solid) | ||
|
|
DAP | diammonium phosphate, 46% P2O5 (solid) | ||
|
|
MAP | monoammonium phosphate, 52% P2O5 (solid) | ||
|
|
MGA | merchant grade acid, 54% P2O5 (liquid) | ||
|
|
MST | micronized sulfur technology, P + S | ||
|
|
P2O5 | diphosphorus pentoxide | ||
|
|
SPA | superphosphoric acid, 70% P2O5 (liquid) | ||
| Product measures |
| |||
| K2O tonne | Measures the potassium content of products having different chemical analyses | |||
| Mmt | Million metric tonnes | |||
| MMBtu | Metric million British thermal units | |||
| P2O5 tonne | Measures the phosphorus content of products having different chemical analyses | |||
| Product tonne | Standard measure of the weights of all types of potash, nitrogen and phosphate products | |||
| Nutrien Annual Report 2025 115 |
|
|
Overview | MD&A | Five-year highlights | Financial statements and notes | ||||||||||
|
|
Definitions
| Definitions |
| |
| Brownfield | New project expanding or developing an existing facility or operation. | |
| CCUS | Carbon capture, utilization and storage. Process by which CO2 produced from various industrial processes is captured and either utilized for further industrial processes or transported to a permanent storage location to prevent release into the atmosphere. | |
| Capital expenditures | Represents the sum of sustaining capital expenditures, investing capital expenditures and mine development and pre-stripping capital expenditures. See the “Other financial measures” section. | |
| Clean ammonia | Ammonia made with direct GHG emissions reduced by at least 90 percent compared to a conventional process, produced from hydrogen obtained using the next generation of ammonia production technology, such as auto-thermal reforming or water electrolysis with renewable power; this definition does not include end product use. | |
| EBITDA | Calculated as net earnings (loss) before finance costs, income taxes and depreciation and amortization. | |
| Greenfield | New project on a previously undeveloped site. | |
| Greenhouse gas (“GHG”) | Gases that contribute to the greenhouse effect and global warming by trapping heat in the atmosphere. These gases include those outlined by the Kyoto Protocol and covered under the Greenhouse Gas Protocol Accounting and Reporting Standards. They include the following seven major greenhouse gases: carbon dioxide (CO2), methane (CH4), nitrous oxide (N2O), sulfur hexafluoride (SF6), perfluorocarbons (PFCs), hydrofluorocarbons (HFCs), and nitrogen trifluoride (NF3). | |
| Latin America | South America, Central America, Caribbean and Mexico. | |
| Merger | The merger of equals transaction between PotashCorp and Agrium completed effective January 1, 2018, pursuant to which PotashCorp and Agrium combined their businesses pursuant to a statutory plan of arrangement under the Canada Business Corporations Act and became wholly owned subsidiaries of Nutrien Ltd. | |
| North America | Canada and the US. | |
| Offshore | All markets except Canada and the US. | |
| Total shareholder return | Return on investment in Nutrien shares from the time the investment is made based on two components: (1) growth in share price and (2) return from reinvested dividend income on the shares. | |
| 116 Nutrien Annual Report 2025 |