| Peak Companies Acquisition August 2025 |

| Disclaimers 2 Certain statements contained in this presentation constitute forward looking statements. The use of any of the words “anticipate”, “continue”, “estimate”, “expect”, ‘may”, “will”, “project”, “should”, ‘believe”, and similar expressions are intended to identify forward-looking statements. These statements involve known and unknown risks, uncertainties and other factors that may cause actual results or events to differ materially from those anticipated. Forward-looking statements are based on reasonable assumptions, but no assurance can be given that these expectations will prove to be correct. There are a number of important factors that could cause actual results to differ materially from those suggested or indicated by the forward-looking statements. Additional information regarding the factors that may cause actual results to differ materially from these forward-looking statements is available in our filings with the Securities and Exchange Commission, including but not limited to our Annual Report on Form 10-K for the year ended December 31, 2024 and our Quarterly Reports on Form 10-Q for subsequent periods. The reserves and associated future net revenue information set forth in this presentation are estimates only. In general, estimates of oil and natural gas reserves and the future net revenue therefrom are based upon a number of variable factors and assumptions, such as production rates, ultimate reserves recovery, timing and amount of capital expenditures, ability to transport production, marketability of oil and natural gas, royalty rates, the assumed effects of regulation by governmental agencies and future operating costs, all of which may vary materially from actual results. For those reasons, estimates of the oil and natural gas reserves attributable to any particular group of properties, as well as the classification of such reserves and estimates of future net revenues associated with such reserves prepared by different engineers (or by the same engineers at different times) may vary. Our actual reserves may be greater or less than those calculated. In addition, our actual production, revenues, development and operating expenditures will vary from estimates thereof and such variations could be material. Statements relating to "reserves" are deemed to be forward-looking statements as they involve the implied assessment, based on certain estimates and assumptions, that the reserves described exist in the quantities predicted or estimated and can be profitably produced in the future. There is no assurance that forecast price and cost assumptions will be attained and variances could be material. Proved reserves are those reserves which are most certain to be recovered. Probable reserves are those additional reserves that are less certain to be recovered than Proved reserves but which, together with Proved reserves, are as likely as not to be recovered. Undeveloped reserves are those reserves expected to be recovered from known accumulations where a significant expenditure (for example, when compared to the cost of drilling a well) is required to render them capable of production. They must fully meet the requirements of the reserves classification (Proved or Probable) to which they are assigned. The estimates of reserves and future net revenue for individual properties may not reflect the same confidence level as estimates of reserves and future net revenue for all properties due to the effects of aggregation. The estimated future net revenues contained in this presentation do not necessarily represent the fair market value of our reserves. Viewers are cautioned that the assumptions used in the preparation of such information, although considered reasonable at the time of preparation, may prove to be imprecise, and as such, undue reliance should not be placed on forward-looking statements. Our actual results, performance or achievement could differ materially from those expressed in, or implied by, these forward-looking statements, and accordingly, no assurance can be given that any of the events anticipated by the forward-looking statements will transpire or occur, or, if any of them do, what benefits that we will derive therefrom. We disclaim any intention or obligation to update or revise any forward-looking statements, whether as a result of new information, future events or otherwise. This presentation is neither an offer to sell nor a solicitation of any offer to buy any securities. This presentation does not contain all of the information necessary to make an investment decision. The contents of this presentation are based upon conditions as they exist on the date of this presentation, and, except where otherwise indicated, reflect information as at the date of this presentation. By delivering this presentation we do not undertake to update any of the information, representations, or conclusions contained herein. The information and comments provided are strictly for information purposes only, and are not to be construed in any way as invitations to purchase securities, nor distributed to others for said purpose. |
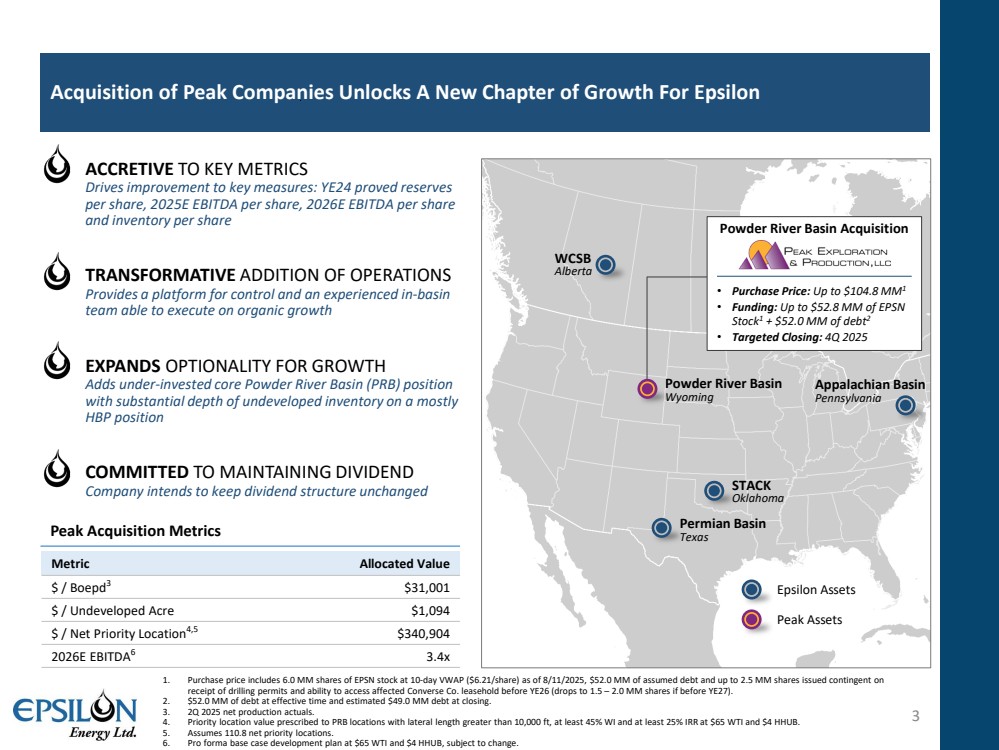
| 1. Purchase price includes 6.0 MM shares of EPSN stock at 10-day VWAP ($6.21/share) as of 8/11/2025, $52.0 MM of assumed debt and up to 2.5 MM shares issued contingent on receipt of drilling permits and ability to access affected Converse Co. leasehold before YE26 (drops to 1.5 – 2.0 MM shares if before YE27). 2. $52.0 MM of debt at effective time and estimated $49.0 MM debt at closing. 3. 2Q 2025 net production actuals. 4. Priority location value prescribed to PRB locations with lateral length greater than 10,000 ft, at least 45% WI and at least 25% IRR at $65 WTI and $4 HHUB. 5. Assumes 110.8 net priority locations. 6. Pro forma base case development plan at $65 WTI and $4 HHUB, subject to change. Acquisition of Peak Companies Unlocks A New Chapter of Growth For Epsilon 3 • ACCRETIVE TO KEY METRICS Drives improvement to key measures: YE24 proved reserves per share, 2025E EBITDA per share, 2026E EBITDA per share and inventory per share • TRANSFORMATIVE ADDITION OF OPERATIONS Provides a platform for control and an experienced in-basin team able to execute on organic growth • EXPANDS OPTIONALITY FOR GROWTH Adds under-invested core Powder River Basin (PRB) position with substantial depth of undeveloped inventory on a mostly HBP position • COMMITTED TO MAINTAINING DIVIDEND Company intends to keep dividend structure unchanged Peak Acquisition Metrics Metric Allocated Value $ / Boepd3 $31,001 $ / Undeveloped Acre $1,094 $ / Net Priority Location4,5 $340,904 2026E EBITDA6 3.4x Epsilon Assets Peak Assets WCSB Alberta Permian Basin Texas STACK Oklahoma Appalachian Basin Pennsylvania Powder River Basin Wyoming Powder River Basin Acquisition • Purchase Price: Up to $104.8 MM1 • Funding: Up to $52.8 MM of EPSN Stock1 + $52.0 MM of debt2 • Targeted Closing: 4Q 2025 |
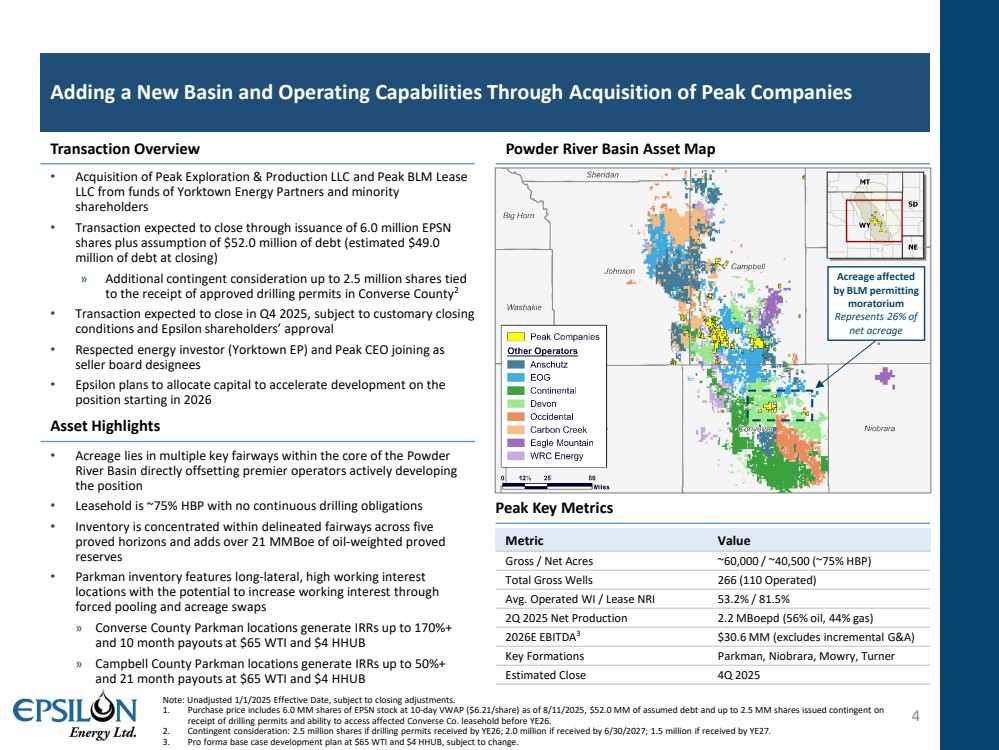
| • Acreage lies in multiple key fairways within the core of the Powder River Basin directly offsetting premier operators actively developing the position • Leasehold is ~75% HBP with no continuous drilling obligations • Inventory is concentrated within delineated fairways across five proved horizons and adds over 21 MMBoe of oil-weighted proved reserves • Parkman inventory features long-lateral, high working interest locations with the potential to increase working interest through forced pooling and acreage swaps » Converse County Parkman locations generate IRRs up to 170%+ and 10 month payouts at $65 WTI and $4 HHUB » Campbell County Parkman locations generate IRRs up to 50%+ and 21 month payouts at $65 WTI and $4 HHUB Note: Unadjusted 1/1/2025 Effective Date, subject to closing adjustments. 1. Purchase price includes 6.0 MM shares of EPSN stock at 10-day VWAP ($6.21/share) as of 8/11/2025, $52.0 MM of assumed debt and up to 2.5 MM shares issued contingent on receipt of drilling permits and ability to access affected Converse Co. leasehold before YE26. 2. Contingent consideration: 2.5 million shares if drilling permits received by YE26; 2.0 million if received by 6/30/2027; 1.5 million if received by YE27. 3. Pro forma base case development plan at $65 WTI and $4 HHUB, subject to change. Adding a New Basin and Operating Capabilities Through Acquisition of Peak Companies 4 Transaction Overview Powder River Basin Asset Map Asset Highlights • Acquisition of Peak Exploration & Production LLC and Peak BLM Lease LLC from funds of Yorktown Energy Partners and minority shareholders • Transaction expected to close through issuance of 6.0 million EPSN shares plus assumption of $52.0 million of debt (estimated $49.0 million of debt at closing) » Additional contingent consideration up to 2.5 million shares tied to the receipt of approved drilling permits in Converse County2 • Transaction expected to close in Q4 2025, subject to customary closing conditions and Epsilon shareholders’ approval • Respected energy investor (Yorktown EP) and Peak CEO joining as seller board designees • Epsilon plans to allocate capital to accelerate development on the position starting in 2026 Acreage affected by BLM permitting moratorium Represents 26% of net acreage Peak Key Metrics Metric Value Gross / Net Acres ~60,000 / ~40,500 (~75% HBP) Total Gross Wells 266 (110 Operated) Avg. Operated WI / Lease NRI 53.2% / 81.5% 2Q 2025 Net Production 2.2 MBoepd (56% oil, 44% gas) 2026E EBITDA3 $30.6 MM (excludes incremental G&A) Key Formations Parkman, Niobrara, Mowry, Turner Estimated Close 4Q 2025 |
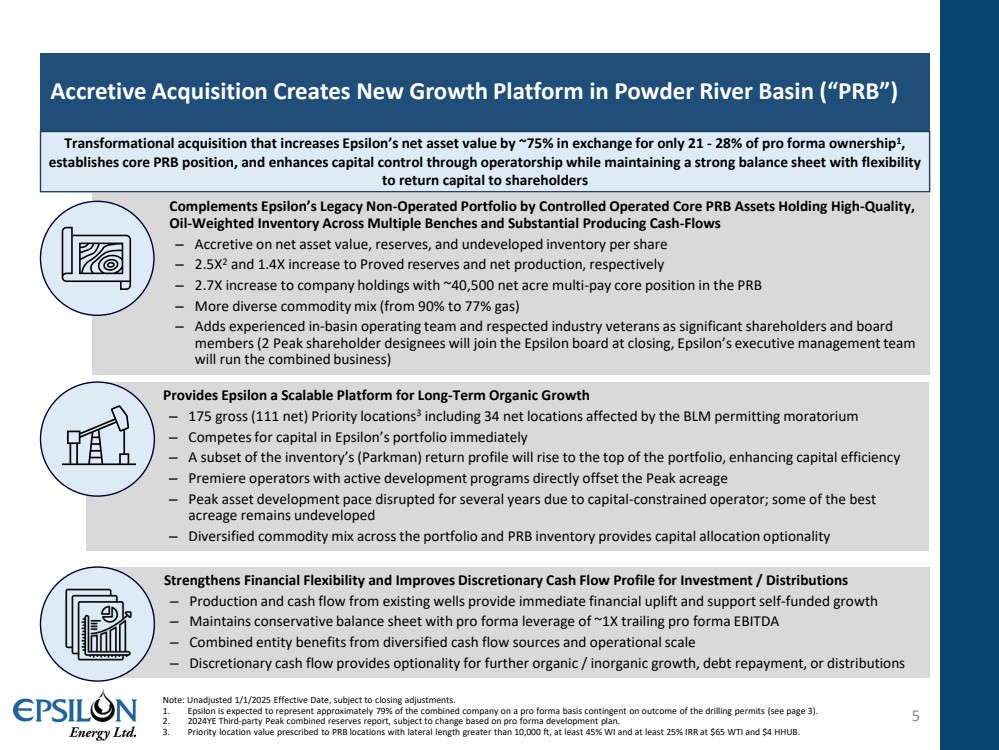
| Accretive Acquisition Creates New Growth Platform in Powder River Basin (“PRB”) 5 Provides Epsilon a Scalable Platform for Long-Term Organic Growth ‒ 175 gross (111 net) Priority locations3 including 34 net locations affected by the BLM permitting moratorium ‒ Competes for capital in Epsilon’s portfolio immediately ‒ A subset of the inventory’s (Parkman) return profile will rise to the top of the portfolio, enhancing capital efficiency ‒ Premiere operators with active development programs directly offset the Peak acreage ‒ Peak asset development pace disrupted for several years due to capital-constrained operator; some of the best acreage remains undeveloped ‒ Diversified commodity mix across the portfolio and PRB inventory provides capital allocation optionality Complements Epsilon’s Legacy Non-Operated Portfolio by Controlled Operated Core PRB Assets Holding High-Quality, Oil-Weighted Inventory Across Multiple Benches and Substantial Producing Cash-Flows ‒ Accretive on net asset value, reserves, and undeveloped inventory per share ‒ 2.5X2 and 1.4X increase to Proved reserves and net production, respectively ‒ 2.7X increase to company holdings with ~40,500 net acre multi-pay core position in the PRB ‒ More diverse commodity mix (from 90% to 77% gas) ‒ Adds experienced in-basin operating team and respected industry veterans as significant shareholders and board members (2 Peak shareholder designees will join the Epsilon board at closing, Epsilon’s executive management team will run the combined business) Strengthens Financial Flexibility and Improves Discretionary Cash Flow Profile for Investment / Distributions ‒ Production and cash flow from existing wells provide immediate financial uplift and support self-funded growth ‒ Maintains conservative balance sheet with pro forma leverage of ~1X trailing pro forma EBITDA ‒ Combined entity benefits from diversified cash flow sources and operational scale ‒ Discretionary cash flow provides optionality for further organic / inorganic growth, debt repayment, or distributions Transformational acquisition that increases Epsilon’s net asset value by ~75% in exchange for only 21 - 28% of pro forma ownership1, establishes core PRB position, and enhances capital control through operatorship while maintaining a strong balance sheet with flexibility to return capital to shareholders Note: Unadjusted 1/1/2025 Effective Date, subject to closing adjustments. 1. Epsilon is expected to represent approximately 79% of the combined company on a pro forma basis contingent on outcome of the drilling permits (see page 3). 2. 2024YE Third-party Peak combined reserves report, subject to change based on pro forma development plan. 3. Priority location value prescribed to PRB locations with lateral length greater than 10,000 ft, at least 45% WI and at least 25% IRR at $65 WTI and $4 HHUB. |
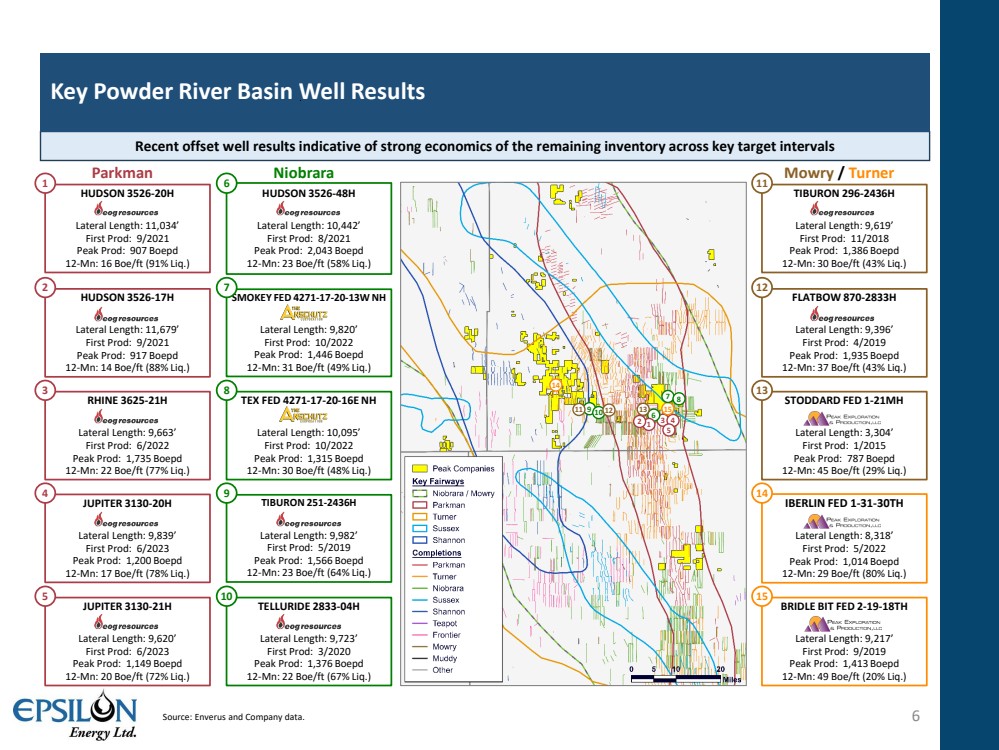
| Recent offset well results indicative of strong economics of the remaining inventory across key target intervals Key Powder River Basin Well Results Source: Enverus and Company data. 6 Parkman Niobrara Mowry / Turner 3 4 5 6 9 10 11 12 13 14 15 1 2 HUDSON 3526-20H Lateral Length: 11,034’ First Prod: 9/2021 Peak Prod: 907 Boepd 12-Mn: 16 Boe/ft (91% Liq.) 1 HUDSON 3526-48H Lateral Length: 10,442’ First Prod: 8/2021 Peak Prod: 2,043 Boepd 12-Mn: 23 Boe/ft (58% Liq.) 6 TIBURON 296-2436H Lateral Length: 9,619’ First Prod: 11/2018 Peak Prod: 1,386 Boepd 12-Mn: 30 Boe/ft (43% Liq.) 11 HUDSON 3526-17H Lateral Length: 11,679’ First Prod: 9/2021 Peak Prod: 917 Boepd 12-Mn: 14 Boe/ft (88% Liq.) 2 FLATBOW 870-2833H Lateral Length: 9,396’ First Prod: 4/2019 Peak Prod: 1,935 Boepd 12-Mn: 37 Boe/ft (43% Liq.) 12 SMOKEY FED 4271-17-20-13W NH Lateral Length: 9,820’ First Prod: 10/2022 Peak Prod: 1,446 Boepd 12-Mn: 31 Boe/ft (49% Liq.) 7 TEX FED 4271-17-20-16E NH Lateral Length: 10,095’ First Prod: 10/2022 Peak Prod: 1,315 Boepd 12-Mn: 30 Boe/ft (48% Liq.) 8 STODDARD FED 1-21MH Lateral Length: 3,304’ First Prod: 1/2015 Peak Prod: 787 Boepd 12-Mn: 45 Boe/ft (29% Liq.) 13 RHINE 3625-21H Lateral Length: 9,663’ First Prod: 6/2022 Peak Prod: 1,735 Boepd 12-Mn: 22 Boe/ft (77% Liq.) 3 IBERLIN FED 1-31-30TH Lateral Length: 8,318’ First Prod: 5/2022 Peak Prod: 1,014 Boepd 12-Mn: 29 Boe/ft (80% Liq.) 14 JUPITER 3130-20H Lateral Length: 9,839’ First Prod: 6/2023 Peak Prod: 1,200 Boepd 12-Mn: 17 Boe/ft (78% Liq.) 4 TIBURON 251-2436H Lateral Length: 9,982’ First Prod: 5/2019 Peak Prod: 1,566 Boepd 12-Mn: 23 Boe/ft (64% Liq.) 9 BRIDLE BIT FED 2-19-18TH Lateral Length: 9,217’ First Prod: 9/2019 Peak Prod: 1,413 Boepd 12-Mn: 49 Boe/ft (20% Liq.) 15 JUPITER 3130-21H Lateral Length: 9,620’ First Prod: 6/2023 Peak Prod: 1,149 Boepd 12-Mn: 20 Boe/ft (72% Liq.) 5 TELLURIDE 2833-04H Lateral Length: 9,723’ First Prod: 3/2020 Peak Prod: 1,376 Boepd 12-Mn: 22 Boe/ft (67% Liq.) 10 7 8 |
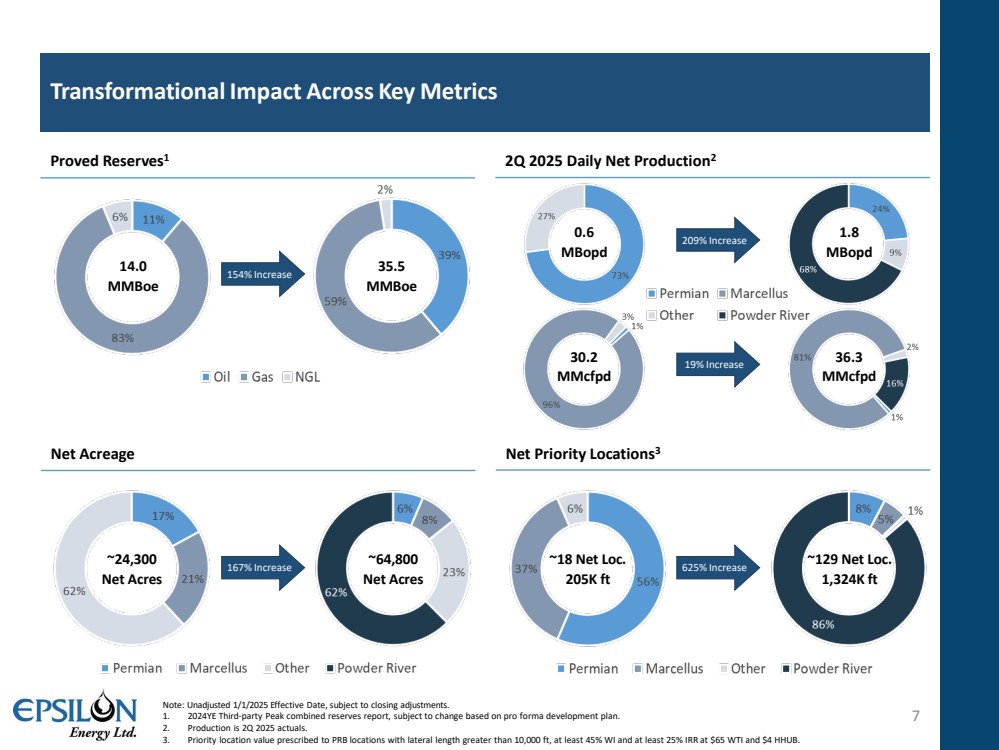
| ~18 Net Loc. 205K ft ~129 Net Loc. 1,324K ft 2Q 2025 Daily Net Production2 Net Acreage ~24,300 Net Acres ~64,800 Net Acres Net Priority Locations3 Proved Reserves1 14.0 MMBoe 35.5 MMBoe Transformational Impact Across Key Metrics 7 Note: Unadjusted 1/1/2025 Effective Date, subject to closing adjustments. 1. 2024YE Third-party Peak combined reserves report, subject to change based on pro forma development plan. 2. Production is 2Q 2025 actuals. 3. Priority location value prescribed to PRB locations with lateral length greater than 10,000 ft, at least 45% WI and at least 25% IRR at $65 WTI and $4 HHUB. 154% Increase 209% Increase 167% Increase 625% Increase 0.6 MBopd 1.8 MBopd 30.2 MMcfpd 36.3 MMcfpd 19% Increase |
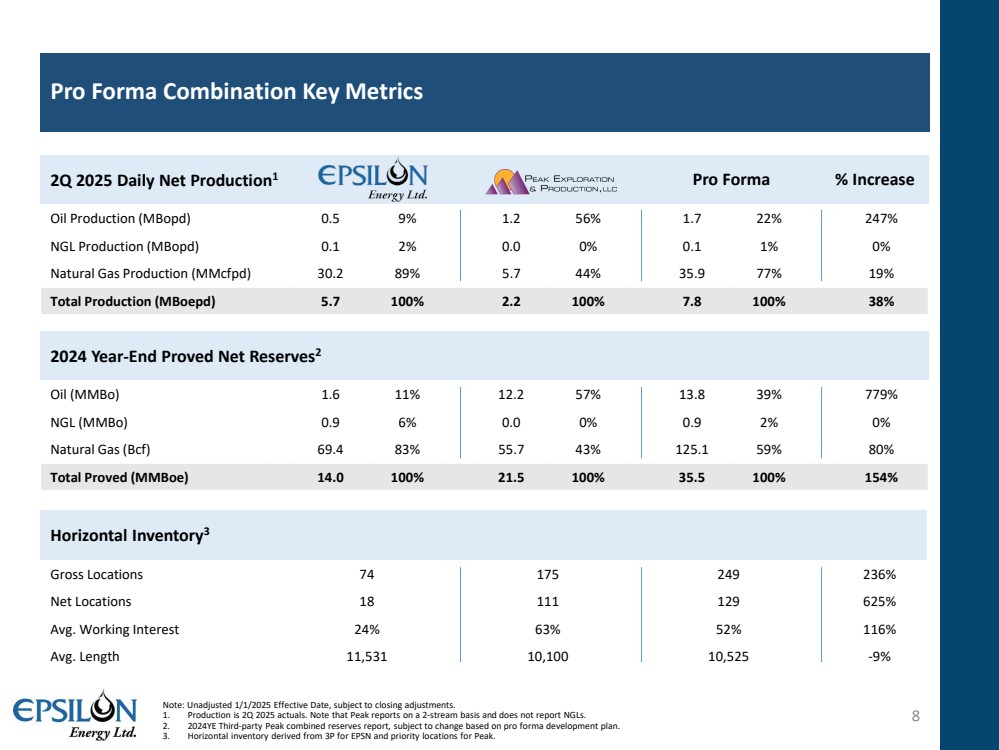
| 2024 Year-End Proved Net Reserves2 Oil (MMBo) 1.6 11% 12.2 57% 13.8 39% 779% NGL (MMBo) 0.9 6% 0.0 0% 0.9 2% 0% Natural Gas (Bcf) 69.4 83% 55.7 43% 125.1 59% 80% Total Proved (MMBoe) 14.0 100% 21.5 100% 35.5 100% 154% Pro Forma Combination Key Metrics 8 2Q 2025 Daily Net Production1 Oil Production (MBopd) 0.5 9% 1.2 56% 1.7 22% 247% NGL Production (MBopd) 0.1 2% 0.0 0% 0.1 1% 0% Natural Gas Production (MMcfpd) 30.2 89% 5.7 44% 35.9 77% 19% Total Production (MBoepd) 5.7 100% 2.2 100% 7.8 100% 38% Horizontal Inventory3 Gross Locations 74 175 249 236% Net Locations 18 111 129 625% Avg. Working Interest 24% 63% 52% 116% Avg. Length 11,531 10,100 10,525 -9% Note: Unadjusted 1/1/2025 Effective Date, subject to closing adjustments. 1. Production is 2Q 2025 actuals. Note that Peak reports on a 2-stream basis and does not report NGLs. 2. 2024YE Third-party Peak combined reserves report, subject to change based on pro forma development plan. 3. Horizontal inventory derived from 3P for EPSN and priority locations for Peak. Pro Forma % Increase |
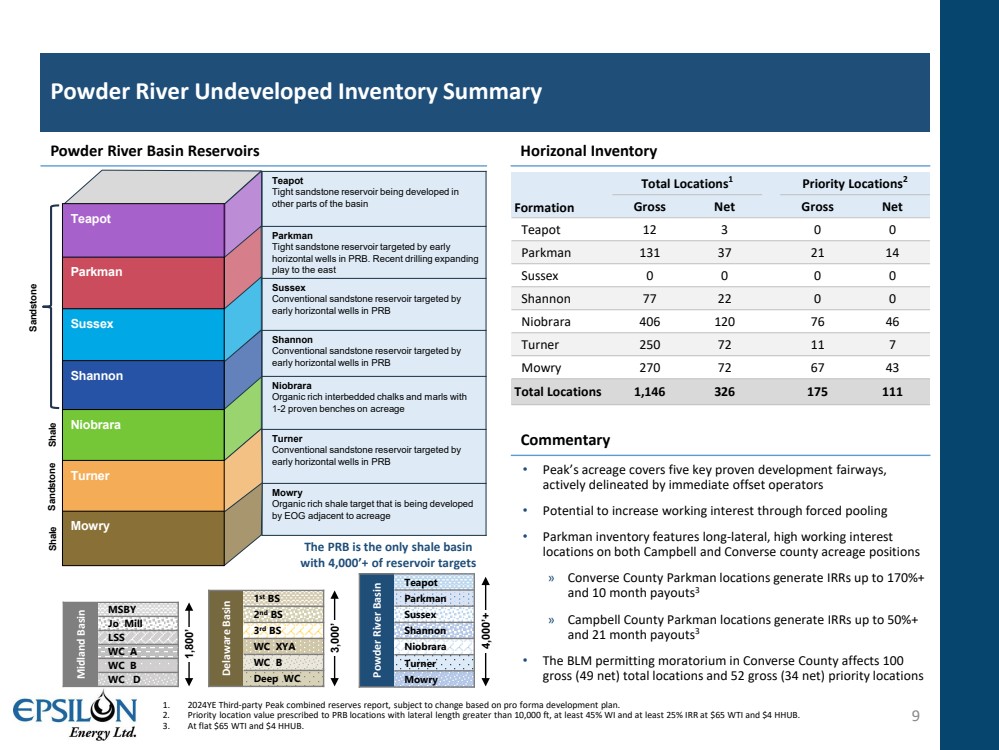
| Powder River Undeveloped Inventory Summary 9 Teapot Tight sandstone reservoir being developed in other parts of the basin Parkman Tight sandstone reservoir targeted by early horizontal wells in PRB. Recent drilling expanding play to the east Sussex Conventional sandstone reservoir targeted by early horizontal wells in PRB Shannon Conventional sandstone reservoir targeted by early horizontal wells in PRB Niobrara Organic rich interbedded chalks and marls with 1-2 proven benches on acreage Turner Conventional sandstone reservoir targeted by early horizontal wells in PRB Mowry Organic rich shale target that is being developed by EOG adjacent to acreage Formation Total Locations1 Priority Locations2 Gross Net Gross Net Teapot 12 3 0 0 Parkman 131 37 21 14 Sussex 0 0 0 0 Shannon 77 22 0 0 Niobrara 406 120 76 46 Turner 250 72 11 7 Mowry 270 72 67 43 Total Locations 1,146 326 175 111 Powder River Basin Reservoirs Horizonal Inventory 1. 2024YE Third-party Peak combined reserves report, subject to change based on pro forma development plan. 2. Priority location value prescribed to PRB locations with lateral length greater than 10,000 ft, at least 45% WI and at least 25% IRR at $65 WTI and $4 HHUB. 3. At flat $65 WTI and $4 HHUB. • Peak’s acreage covers five key proven development fairways, actively delineated by immediate offset operators • Potential to increase working interest through forced pooling • Parkman inventory features long-lateral, high working interest locations on both Campbell and Converse county acreage positions » Converse County Parkman locations generate IRRs up to 170%+ and 10 month payouts3 » Campbell County Parkman locations generate IRRs up to 50%+ and 21 month payouts3 • The BLM permitting moratorium in Converse County affects 100 gross (49 net) total locations and 52 gross (34 net) priority locations Niobrara Turner Mowry Shale Sandstone Shale Sandstone Shannon Sussex Parkman Teapot Powder River Basin Teapot Parkman Sussex Shannon Niobrara Turner Mowry Delaware Basin 1st BS 2nd BS 3rd BS WC XYA WC B Midland Basin Deep WC MSBY Jo Mill LSS WC A WC B WC D 4,000’+ 3,000’ 1,800’ The PRB is the only shale basin with 4,000’+ of reservoir targets Commentary |
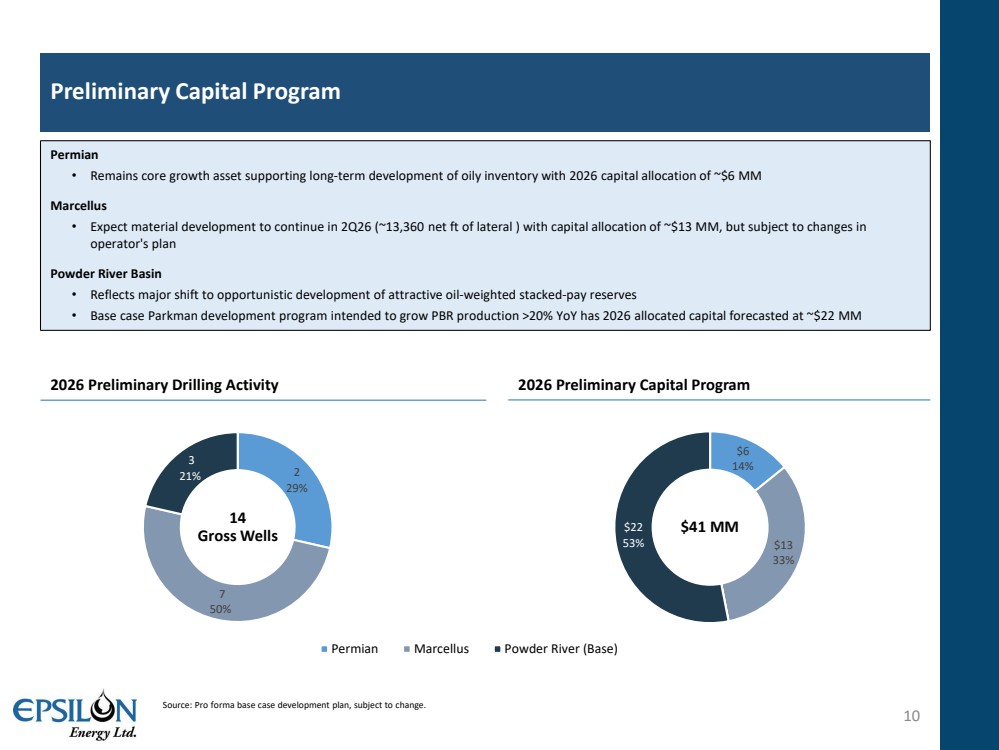
| 2 29% 7 50% 3 21% Permian Marcellus Powder River (Base) $6 14% $13 33% $22 53% 2026 Preliminary Capital Program Preliminary Capital Program 10 Permian • Remains core growth asset supporting long-term development of oily inventory with 2026 capital allocation of ~$6 MM Marcellus • Expect material development to continue in 2Q26 (~13,360 net ft of lateral ) with capital allocation of ~$13 MM, but subject to changes in operator's plan Powder River Basin • Reflects major shift to opportunistic development of attractive oil-weighted stacked-pay reserves • Base case Parkman development program intended to grow PBR production >20% YoY has 2026 allocated capital forecasted at ~$22 MM 2026 Preliminary Drilling Activity $41 MM Source: Pro forma base case development plan, subject to change. 14 Gross Wells |
| Appendix 11 |
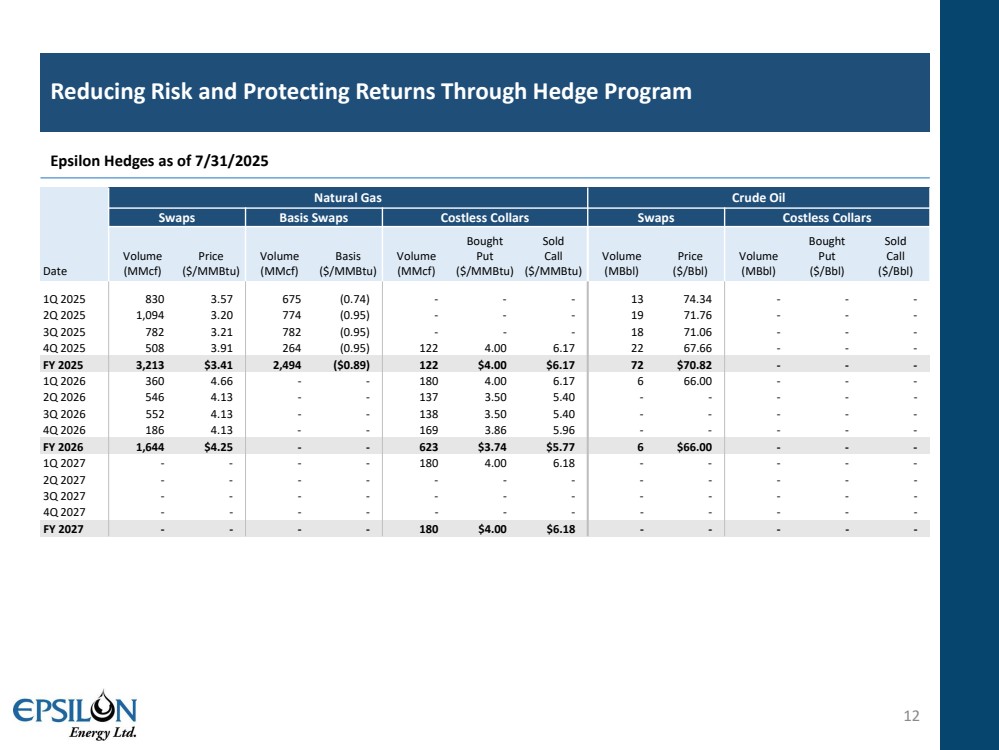
| Date Natural Gas Crude Oil Swaps Basis Swaps Costless Collars Swaps Costless Collars Volume (MMcf) Price ($/MMBtu) Volume (MMcf) Basis ($/MMBtu) Volume (MMcf) Bought Put ($/MMBtu) Sold Call ($/MMBtu) Volume (MBbl) Price ($/Bbl) Volume (MBbl) Bought Put ($/Bbl) Sold Call ($/Bbl) 1Q 2025 830 3.57 675 (0.74) - - - 13 74.34 - - - 2Q 2025 1,094 3.20 774 (0.95) - - - 19 71.76 - - - 3Q 2025 782 3.21 782 (0.95) - - - 18 71.06 - - - 4Q 2025 508 3.91 264 (0.95) 122 4.00 6.17 22 67.66 - - - FY 2025 3,213 $3.41 2,494 ($0.89) 122 $4.00 $6.17 72 $70.82 - - - 1Q 2026 360 4.66 - - 180 4.00 6.17 6 66.00 - - - 2Q 2026 546 4.13 - - 137 3.50 5.40 - - - - - 3Q 2026 552 4.13 - - 138 3.50 5.40 - - - - - 4Q 2026 186 4.13 - - 169 3.86 5.96 - - - - - FY 2026 1,644 $4.25 - - 623 $3.74 $5.77 6 $66.00 - - - 1Q 2027 - - - - 180 4.00 6.18 - - - - - 2Q 2027 - - - - - - - - - - - - 3Q 2027 - - - - - - - - - - - - 4Q 2027 - - - - - - - - - - - - FY 2027 - - - - 180 $4.00 $6.18 - - - - - Reducing Risk and Protecting Returns Through Hedge Program 12 Epsilon Hedges as of 7/31/2025 |
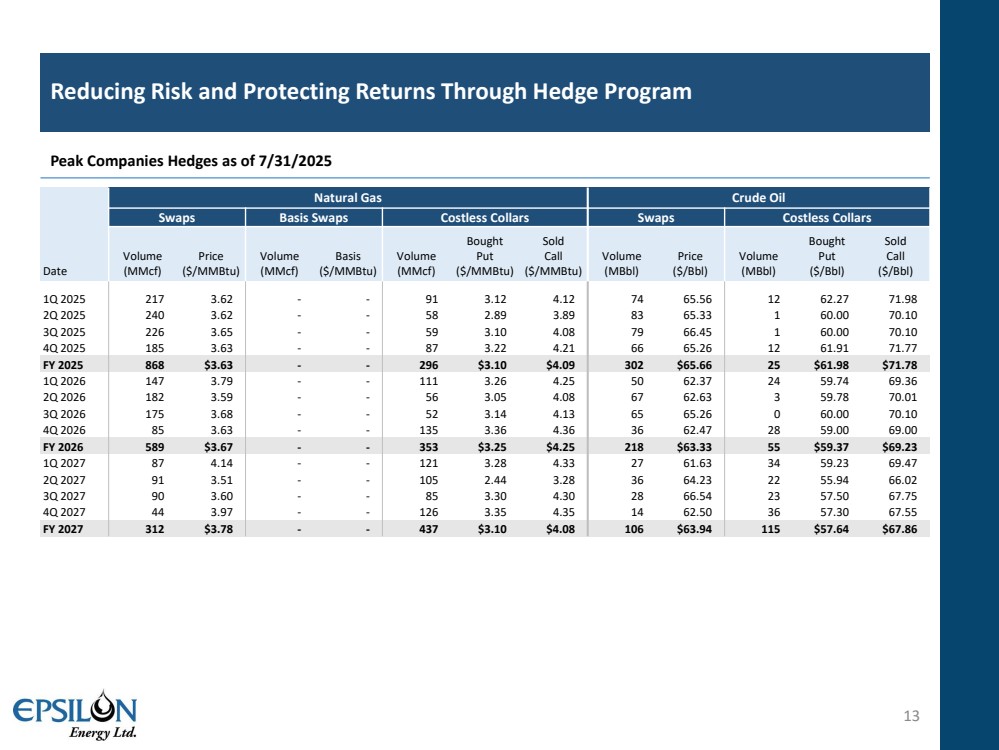
| Date Natural Gas Crude Oil Swaps Basis Swaps Costless Collars Swaps Costless Collars Volume (MMcf) Price ($/MMBtu) Volume (MMcf) Basis ($/MMBtu) Volume (MMcf) Bought Put ($/MMBtu) Sold Call ($/MMBtu) Volume (MBbl) Price ($/Bbl) Volume (MBbl) Bought Put ($/Bbl) Sold Call ($/Bbl) 1Q 2025 217 3.62 - - 91 3.12 4.12 74 65.56 12 62.27 71.98 2Q 2025 240 3.62 - - 58 2.89 3.89 83 65.33 1 60.00 70.10 3Q 2025 226 3.65 - - 59 3.10 4.08 79 66.45 1 60.00 70.10 4Q 2025 185 3.63 - - 87 3.22 4.21 66 65.26 12 61.91 71.77 FY 2025 868 $3.63 - - 296 $3.10 $4.09 302 $65.66 25 $61.98 $71.78 1Q 2026 147 3.79 - - 111 3.26 4.25 50 62.37 24 59.74 69.36 2Q 2026 182 3.59 - - 56 3.05 4.08 67 62.63 3 59.78 70.01 3Q 2026 175 3.68 - - 52 3.14 4.13 65 65.26 0 60.00 70.10 4Q 2026 85 3.63 - - 135 3.36 4.36 36 62.47 28 59.00 69.00 FY 2026 589 $3.67 - - 353 $3.25 $4.25 218 $63.33 55 $59.37 $69.23 1Q 2027 87 4.14 - - 121 3.28 4.33 27 61.63 34 59.23 69.47 2Q 2027 91 3.51 - - 105 2.44 3.28 36 64.23 22 55.94 66.02 3Q 2027 90 3.60 - - 85 3.30 4.30 28 66.54 23 57.50 67.75 4Q 2027 44 3.97 - - 126 3.35 4.35 14 62.50 36 57.30 67.55 FY 2027 312 $3.78 - - 437 $3.10 $4.08 106 $63.94 115 $57.64 $67.86 Reducing Risk and Protecting Returns Through Hedge Program 13 Peak Companies Hedges as of 7/31/2025 |
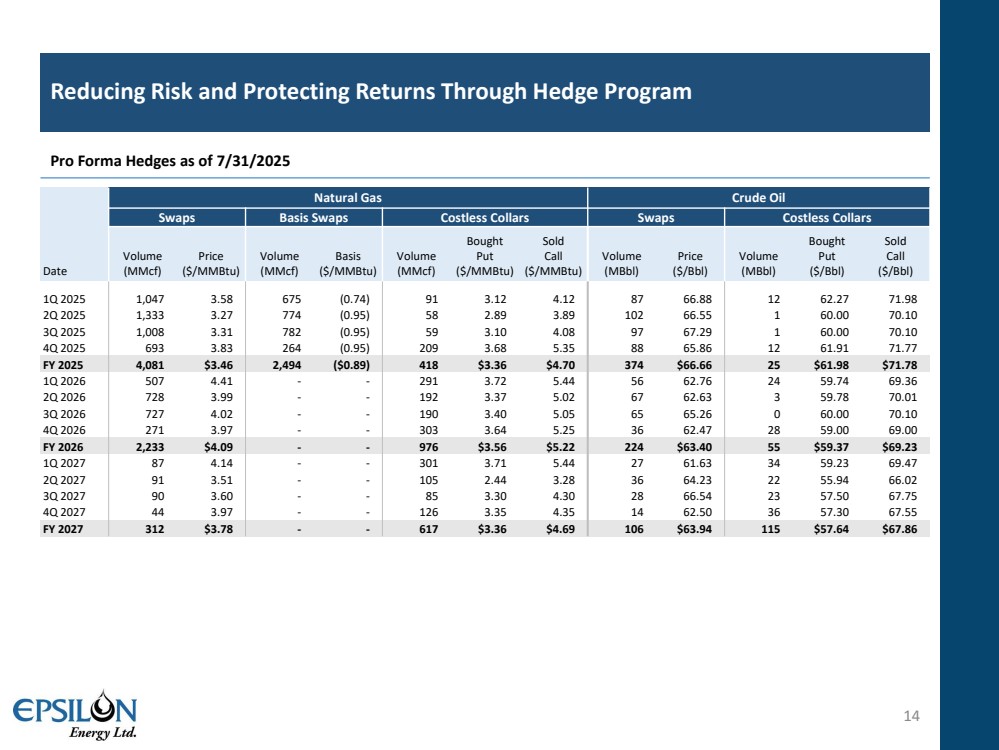
| Date Natural Gas Crude Oil Swaps Basis Swaps Costless Collars Swaps Costless Collars Volume (MMcf) Price ($/MMBtu) Volume (MMcf) Basis ($/MMBtu) Volume (MMcf) Bought Put ($/MMBtu) Sold Call ($/MMBtu) Volume (MBbl) Price ($/Bbl) Volume (MBbl) Bought Put ($/Bbl) Sold Call ($/Bbl) 1Q 2025 1,047 3.58 675 (0.74) 91 3.12 4.12 87 66.88 12 62.27 71.98 2Q 2025 1,333 3.27 774 (0.95) 58 2.89 3.89 102 66.55 1 60.00 70.10 3Q 2025 1,008 3.31 782 (0.95) 59 3.10 4.08 97 67.29 1 60.00 70.10 4Q 2025 693 3.83 264 (0.95) 209 3.68 5.35 88 65.86 12 61.91 71.77 FY 2025 4,081 $3.46 2,494 ($0.89) 418 $3.36 $4.70 374 $66.66 25 $61.98 $71.78 1Q 2026 507 4.41 - - 291 3.72 5.44 56 62.76 24 59.74 69.36 2Q 2026 728 3.99 - - 192 3.37 5.02 67 62.63 3 59.78 70.01 3Q 2026 727 4.02 - - 190 3.40 5.05 65 65.26 0 60.00 70.10 4Q 2026 271 3.97 - - 303 3.64 5.25 36 62.47 28 59.00 69.00 FY 2026 2,233 $4.09 - - 976 $3.56 $5.22 224 $63.40 55 $59.37 $69.23 1Q 2027 87 4.14 - - 301 3.71 5.44 27 61.63 34 59.23 69.47 2Q 2027 91 3.51 - - 105 2.44 3.28 36 64.23 22 55.94 66.02 3Q 2027 90 3.60 - - 85 3.30 4.30 28 66.54 23 57.50 67.75 4Q 2027 44 3.97 - - 126 3.35 4.35 14 62.50 36 57.30 67.55 FY 2027 312 $3.78 - - 617 $3.36 $4.69 106 $63.94 115 $57.64 $67.86 Reducing Risk and Protecting Returns Through Hedge Program 14 Pro Forma Hedges as of 7/31/2025 |
| Disclosures 15 Non-GAAP Financial Measures Epsilon defines Adjusted EBITDA as earnings before (1) net interest expense, (2) taxes, (3) depreciation, depletion, amortization and accretion expense, (4) impairments of natural gas and oil properties, (5) non-cash stock compensation expense, (6) gain or loss on derivative contracts net of cash received or paid on settlement, and (7) other income. Adjusted EBITDA is not a measure of financial performance as determined under U.S. GAAP and should not be considered in isolation from or as a substitute for net income or cash flow measures prepared in accordance with U.S. GAAP or as a measure of profitability or liquidity. Additionally, Adjusted EBITDA may not be comparable to other similarly titled measures of other companies. Epsilon has included Adjusted EBITDA as a supplemental disclosure because its management believes that EBITDA provides useful information regarding its ability to service debt and to fund capital expenditures. It further provides investors a helpful measure for comparing operating performance on a "normalized" or recurring basis with the performance of other companies, without giving effect to certain non-cash expenses and other items. This provides management, investors and analysts with comparative information for evaluating the Company in relation to other natural gas and oil companies providing corresponding non-U.S. GAAP financial measures or that have different financing and capital structures or tax rates. These non-U.S. GAAP financial measures should be considered in addition to, but not as a substitute for, measures for financial performance prepared in accordance with U.S. GAAP. Important Additional Information Regarding the Transactions Will Be Filed With the SEC In connection with the proposed transactions, the Company will file a proxy statement with the SEC. The definitive proxy statement will be sent to the stockholders of the Company. The Company may also file other documents with the SEC regarding the proposed transactions. INVESTORS AND SECURITY HOLDERS OF THE COMPANY ARE ADVISED TO CAREFULLY READ THE PROXY STATEMENT WHEN IT BECOMES AVAILABLE BECAUSE IT WILL CONTAIN IMPORTANT INFORMATION ABOUT THE TRANSACTIONS, THE PARTIES TO THE TRANSACTIONS AND THE RISKS ASSOCIATED WITH THE TRANSACTIONS. Investors and security holders may obtain a free copy of the proxy statement (when available) and other relevant documents filed by the Company with the SEC from the SEC’s website at www.sec.gov. Security holders and other interested parties will also be able to obtain, without charge, a copy of the proxy statement and other relevant documents (when available) by (1) directing your written request to: 500 Dallas Street, Suite 1250, Houston, Texas or (2) contacting our Investor Relations department by telephone at 281-670- 0002. Copies of the documents filed by the Company with the SEC will be available free of charge on the Company’s website at http://www.epsilonenergyltd.com. Participants in the Solicitation The Company and certain of its directors, executive officers and employees may be considered participants in the solicitation of proxies in connection with the proposed transaction. Information regarding the persons who may, under the rules of the SEC, be deemed participants in the solicitation of the stockholders of the Company in connection with the transactions, including a description of their respective direct or indirect interests, by security holdings or otherwise, will be included in the proxy statement described above when it is filed with the SEC. Additional information regarding the Company’s directors and executive officers is also included in its 2025 Proxy Statement, which was filed with the SEC on April 22, 2025. These documents are available free of charge as described above. |