Financial Supplement NASDAQ: VMD Leading th e Healthcare Industry in Home Respiratory Care November 5, 2025 1 Third Quarter 2025
Disclaimers Forward Looking Statements Certain statements contained in this Financial Supplement may constitute “forward-looking statements” within the meaning of the U.S. Private Securities Litigation Reform Act of 1995 or “forward-looking information” as such term is defined in applicable Canadian securities legislation (collectively, “forward-looking statements”). Often, but not always, forward-looking statements can be identified by the use of words such as “plans”, “expects”, “is expected”, “budget”, “potential”, “scheduled”, “estimates”, “forecasts”, “intends”, “anticipates”, “believes”, “projects”, or the negatives thereof or variations of such words and phrases or statements that certain actions, events or results “will”, “should”, “may”, “could”, “would”, “might” or “will be taken”, “occur” or “be achieved” or the negative of these terms or comparable terminology. All statements other than statements of historical fact, including those that express, or involve discussions as to, expectations, beliefs, plans, objectives, assumptions or future events or performance, including the Company's net revenue and Adjusted EBITDA guidance for 2025, and the anticipated benefits of the acquisition of Lehan’s Medical Equipment, including its expected contribution to the Company’s financial performance in the second half of 2025, are not historical facts and may be forward-looking statements and may involve estimates, assumptions and uncertainties that could cause actual results or outcomes to differ materially from those expressed in the forward-looking statements. Such statements reflect the Company's current views and intentions with respect to future events, and current information available to the Company, and are subject to certain risks, uncertainties and assumptions. Many factors could cause the actual results, performance or achievements that may be expressed or implied by such forward-looking statements to vary from those described herein should one or more of these risks or uncertainties materialize. These factors include, without limitation: the general business, market and economic conditions in the regions in which the we operate; significant capital requirements and operating risks that we may be subject to; our ability to implement business strategies and pursue business opportunities; volatility in the market price of our common shares; the state of the capital markets; the availability of funds and resources to pursue operations; inflation; reductions in reimbursement rates and audits of reimbursement claims by various governmental and private payor entities; dependence on few payors; possible new drug discoveries; dependence on key suppliers; granting of permits and licenses in a highly regulated business; competition; disruptions in or attacks (including cyber-attacks) on our information technology, internet, network access or other voice or data communications systems or services; the evolution of various types of fraud or other criminal behavior to which we are exposed; difficulty integrating newly acquired businesses; the impact of new and changes to, or application of, current laws and regulations; the overall difficult litigation and regulatory environment; increased competition; increased funding costs and market volatility due to market illiquidity and competition for funding; critical accounting estimates and changes to accounting standards, policies, and methods used by us; and the occurrence of natural and unnatural catastrophic events or health epidemics or concerns, and claims resulting from such events or concerns, as well as other general economic, market and business conditions; and other factors beyond our control; as well as those risk factors discussed or referred to in the Company’s disclosure documents filed with the U.S. Securities and Exchange Commission (the “SEC”) available on the SEC’s website at www.sec.gov, including the Company’s most recent Annual Report on Form 10-K and Quarterly Report on Form 10-Q, and with the securities regulatory authorities in certain provinces of Canada available at www.sedar.com. Should any factor affect the Company in an unexpected manner, or should assumptions underlying the forward-looking statements prove incorrect, the actual results or events may differ materially from the results or events predicted. Any such forward-looking statements are expressly qualified in their entirety by this cautionary statement. Moreover, the Company does not assume responsibility for the accuracy or completeness of such forward-looking statements. The forward-looking statements included in this Financial Supplement are made as of the date of this Financial Supplement and the Company undertakes no obligation to publicly update or revise any forward-looking statements, other than as required by applicable law. This Financial Supplement contains non-GAAP financial guidance. There is no reliable or reasonably estimable comparable GAAP measure for the Company’s non-GAAP financial guidance because the Company is not able to reliably predict the impact of certain items that typically have one or more of the following characteristics: highly variable, difficult to project, unusual in nature, significant to the results of a particular period or not indicative of future operating results. Similar charges or gains were recognized in prior periods and will likely reoccur in future periods. As a result, reconciliation of the non-GAAP financial guidance to the most directly comparable GAAP measure is not available without unreasonable effort. In addition, the Company believes such a reconciliation would imply a degree of precision and certainty that could be confusing to investors. The variability of the specified items may have a significant and unpredictable impact on the Company’s future GAAP results. Non-GAAP and Other Financial Information This presentation includes references to financial measures that are calculated and presented using methodologies other than those in accordance with generally accepted accounting principles in the United States (“GAAP”), including Adjusted EBITDA and free cash flow. Any non-GAAP financial measures presented herein are intended to supplement, and not to be considered superior to or as a substitute for, the Company’s consolidated financial statements prepared in accordance with GAAP. These non-GAAP financial measures exclude significant expense and income items required by GAAP, and are subject to inherent limitations, including the exercise of judgment by management regarding which items to exclude or include. Non-GAAP measures presented herein may not be comparable to similarly titled measures presented by other companies. A reconciliation between GAAP and non-GAAP financial information is provided below. 2 VieMed Healthcare Inc. I Supplemental Presentation
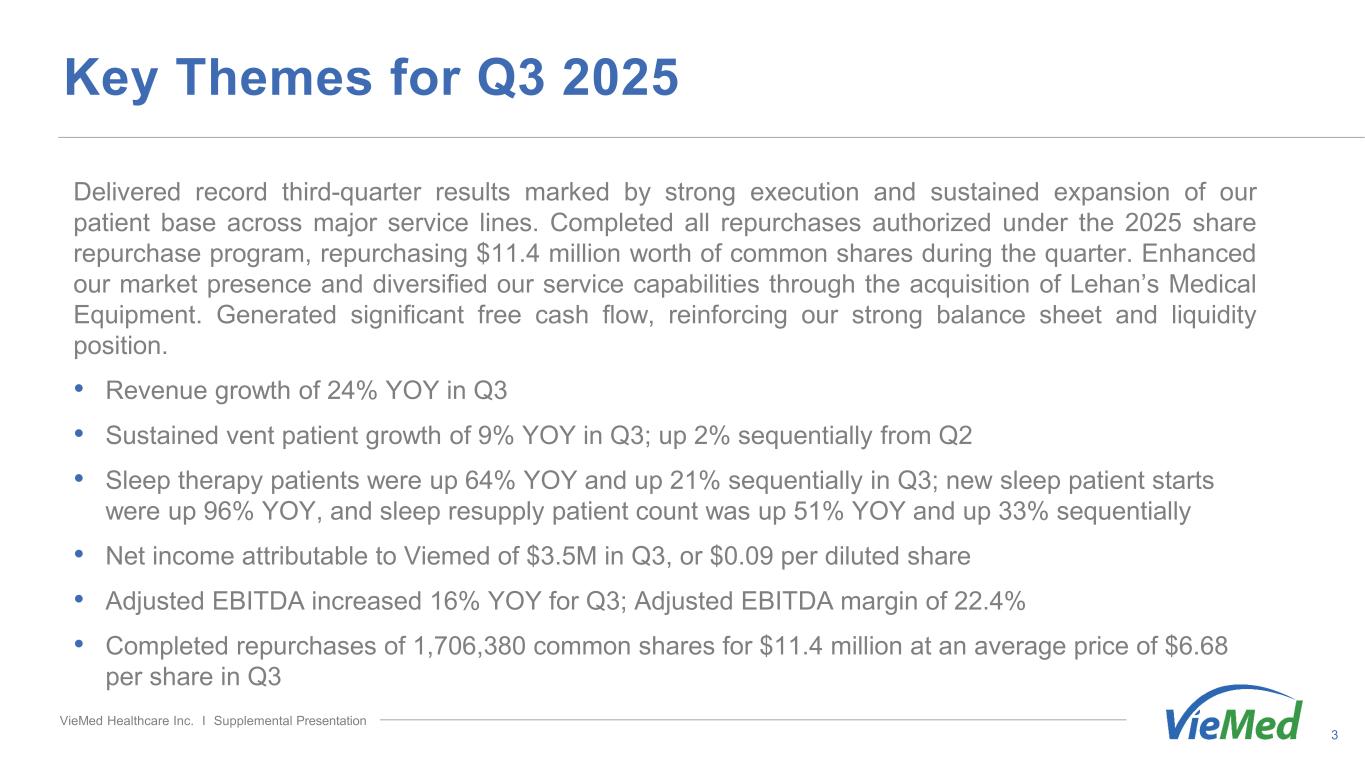
Key Themes for Q3 2025 3 Delivered record third-quarter results marked by strong execution and sustained expansion of our patient base across major service lines. Completed all repurchases authorized under the 2025 share repurchase program, repurchasing $11.4 million worth of common shares during the quarter. Enhanced our market presence and diversified our service capabilities through the acquisition of Lehan’s Medical Equipment. Generated significant free cash flow, reinforcing our strong balance sheet and liquidity position. • Revenue growth of 24% YOY in Q3 • Sustained vent patient growth of 9% YOY in Q3; up 2% sequentially from Q2 • Sleep therapy patients were up 64% YOY and up 21% sequentially in Q3; new sleep patient starts were up 96% YOY, and sleep resupply patient count was up 51% YOY and up 33% sequentially • Net income attributable to Viemed of $3.5M in Q3, or $0.09 per diluted share • Adjusted EBITDA increased 16% YOY for Q3; Adjusted EBITDA margin of 22.4% • Completed repurchases of 1,706,380 common shares for $11.4 million at an average price of $6.68 per share in Q3 VieMed Healthcare Inc. I Supplemental Presentation
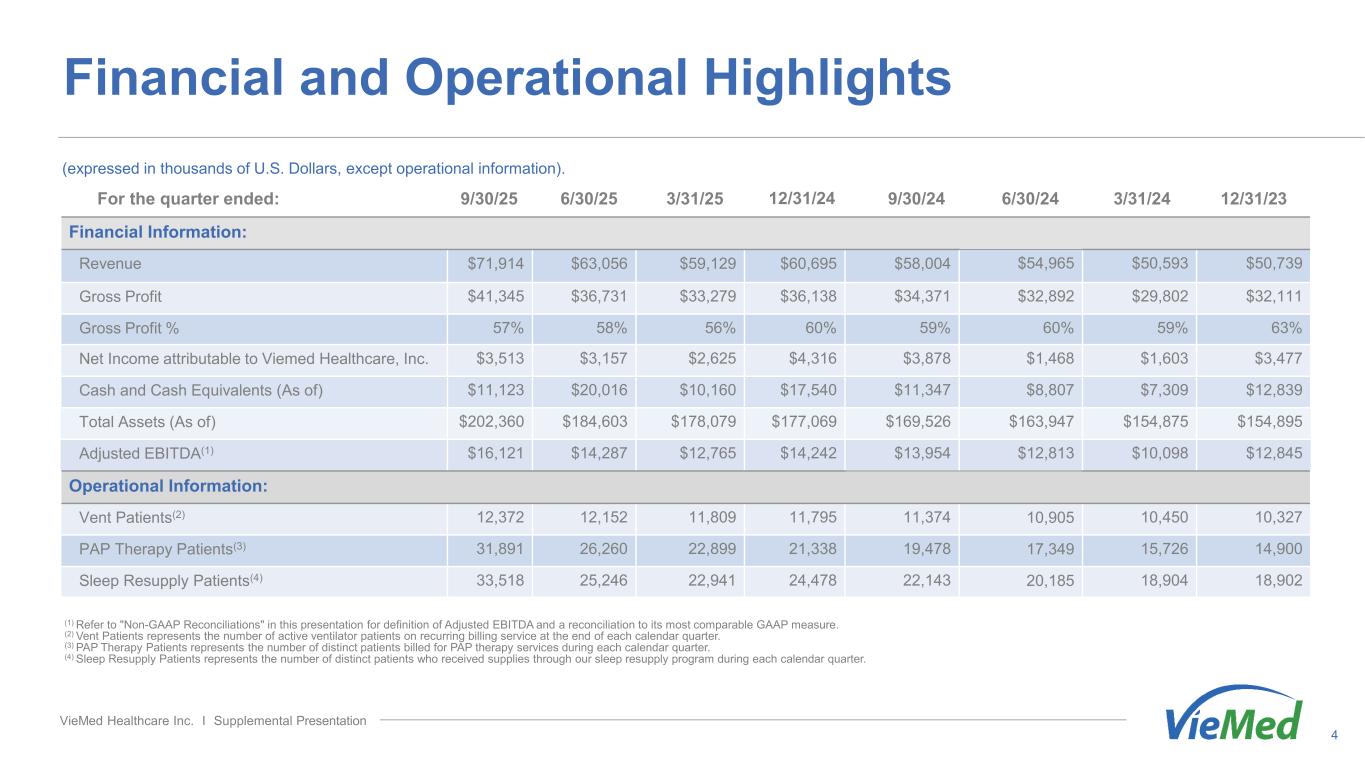
Financial and Operational Highlights 4 (expressed in thousands of U.S. Dollars, except operational information). (1) Refer to "Non-GAAP Reconciliations" in this presentation for definition of Adjusted EBITDA and a reconciliation to its most comparable GAAP measure. (2) Vent Patients represents the number of active ventilator patients on recurring billing service at the end of each calendar quarter. (3) PAP Therapy Patients represents the number of distinct patients billed for PAP therapy services during each calendar quarter. (4) Sleep Resupply Patients represents the number of distinct patients who received supplies through our sleep resupply program during each calendar quarter. For the quarter ended: 9/30/25 6/30/25 3/31/25 12/31/24 9/30/24 6/30/24 3/31/24 12/31/23 Financial Information: Revenue $71,914 $63,056 $59,129 $60,695 $58,004 $54,965 $50,593 $50,739 Gross Profit $41,345 $36,731 $33,279 $36,138 $34,371 $32,892 $29,802 $32,111 Gross Profit % 57% 58% 56% 60% 59% 60% 59% 63% Net Income attributable to Viemed Healthcare, Inc. $3,513 $3,157 $2,625 $4,316 $3,878 $1,468 $1,603 $3,477 Cash and Cash Equivalents (As of) $11,123 $20,016 $10,160 $17,540 $11,347 $8,807 $7,309 $12,839 Total Assets (As of) $202,360 $184,603 $178,079 $177,069 $169,526 $163,947 $154,875 $154,895 Adjusted EBITDA(1) $16,121 $14,287 $12,765 $14,242 $13,954 $12,813 $10,098 $12,845 Operational Information: Vent Patients(2) 12,372 12,152 11,809 11,795 11,374 10,905 10,450 10,327 PAP Therapy Patients(3) 31,891 26,260 22,899 21,338 19,478 17,349 15,726 14,900 Sleep Resupply Patients(4) 33,518 25,246 22,941 24,478 22,143 20,185 18,904 18,902 VieMed Healthcare Inc. I Supplemental Presentation
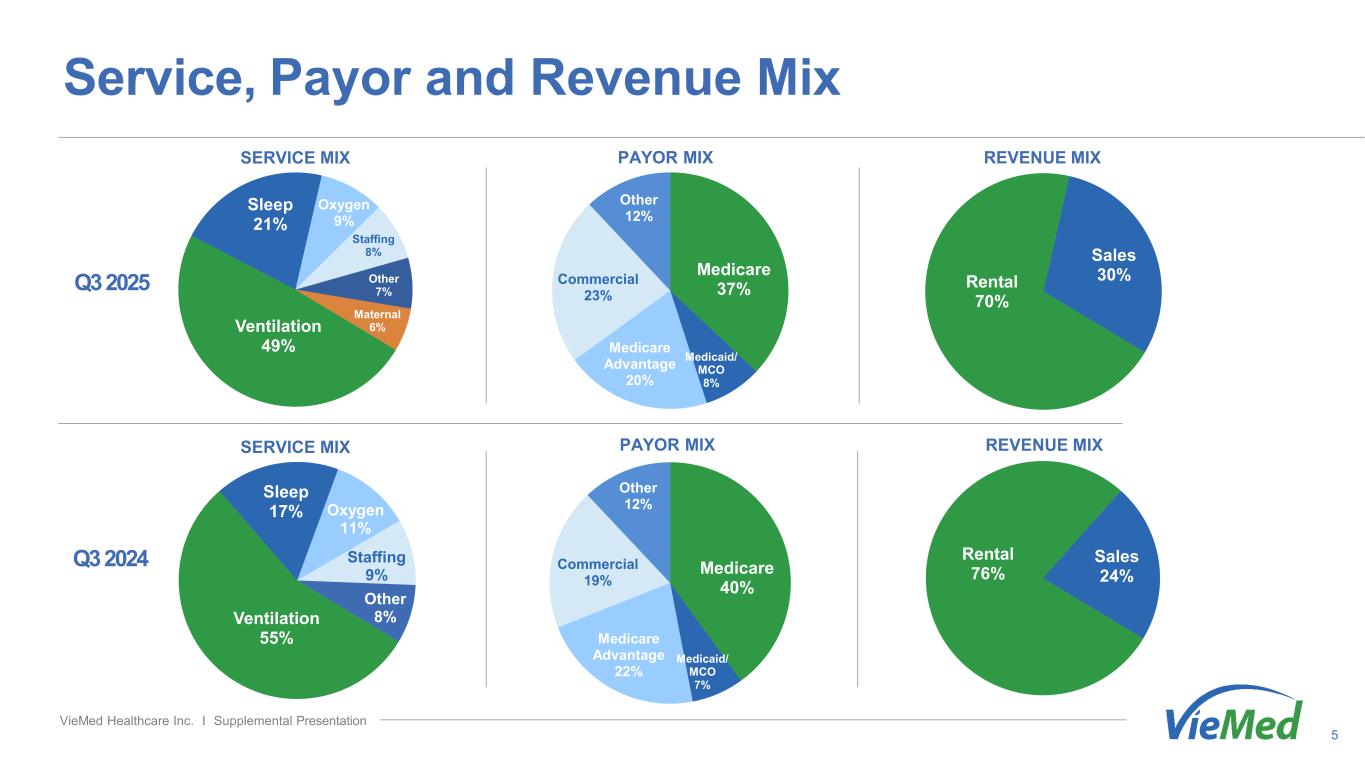
Medicare 37% Medicaid/ MCO 8% Medicare Advantage 20% Commercial 23% Other 12% Ventilation 49% Sleep 21% Oxygen 9% Staffing 8% Other 7% Maternal 6% Q3 2025 Rental 70% Sales 30% Medicare 40% Medicaid/ MCO 7% Medicare Advantage 22% Commercial 19% Other 12% Ventilation 55% Sleep 17% Oxygen 11% Staffing 9% Other 8% Q3 2024 Service, Payor and Revenue Mix 5 SERVICE MIX PAYOR MIX REVENUE MIX VieMed Healthcare Inc. I Supplemental Presentation SERVICE MIX PAYOR MIX Rental 76% Sales 24% REVENUE MIX
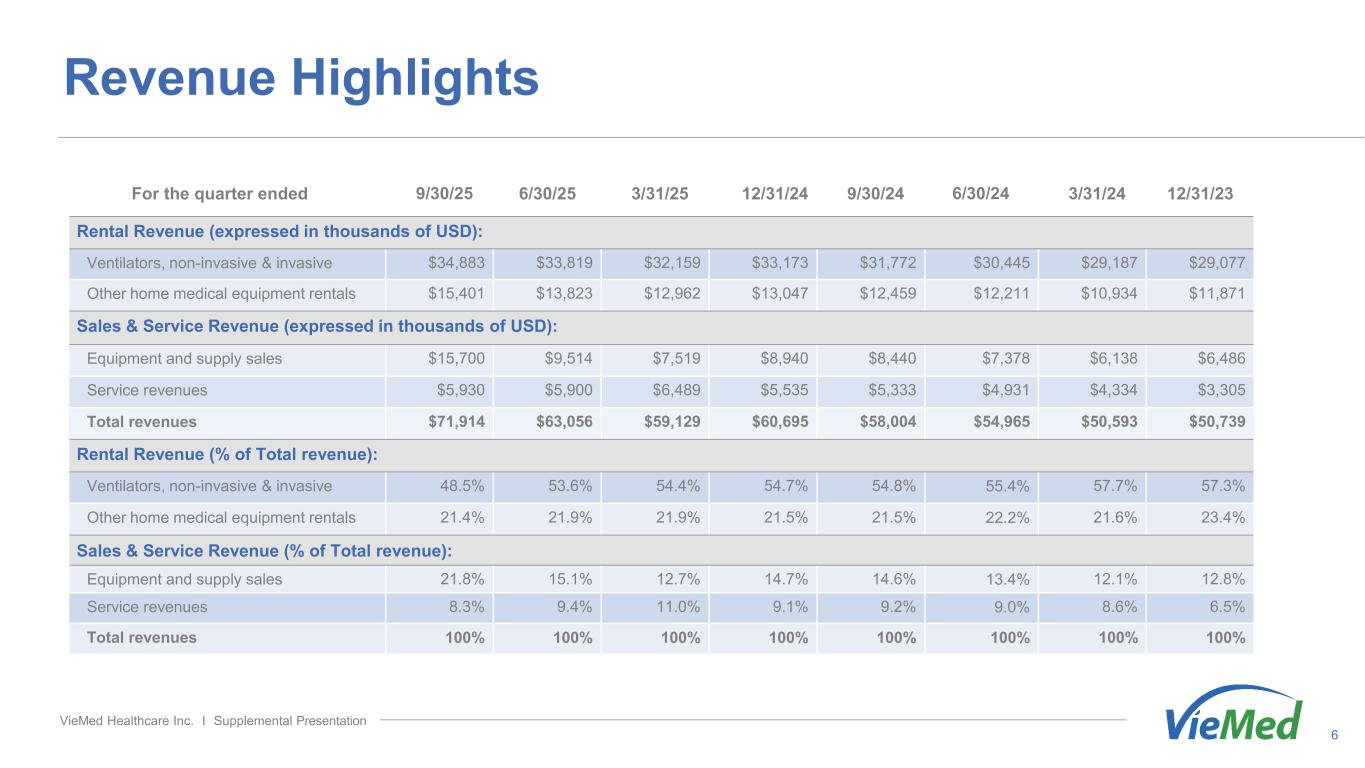
Revenue Highlights 6 For the quarter ended 9/30/25 6/30/25 3/31/25 12/31/24 9/30/24 6/30/24 3/31/24 12/31/23 Rental Revenue (expressed in thousands of USD): Ventilators, non-invasive & invasive $34,883 $33,819 $32,159 $33,173 $31,772 $30,445 $29,187 $29,077 Other home medical equipment rentals $15,401 $13,823 $12,962 $13,047 $12,459 $12,211 $10,934 $11,871 Sales & Service Revenue (expressed in thousands of USD): Equipment and supply sales $15,700 $9,514 $7,519 $8,940 $8,440 $7,378 $6,138 $6,486 Service revenues $5,930 $5,900 $6,489 $5,535 $5,333 $4,931 $4,334 $3,305 Total revenues $71,914 $63,056 $59,129 $60,695 $58,004 $54,965 $50,593 $50,739 Rental Revenue (% of Total revenue): Ventilators, non-invasive & invasive 48.5% 53.6% 54.4% 54.7% 54.8% 55.4% 57.7% 57.3% Other home medical equipment rentals 21.4% 21.9% 21.9% 21.5% 21.5% 22.2% 21.6% 23.4% Sales & Service Revenue (% of Total revenue): Equipment and supply sales 21.8% 15.1% 12.7% 14.7% 14.6% 13.4% 12.1% 12.8% Service revenues 8.3% 9.4% 11.0% 9.1% 9.2% 9.0% 8.6% 6.5% Total revenues 100% 100% 100% 100% 100% 100% 100% 100% VieMed Healthcare Inc. I Supplemental Presentation
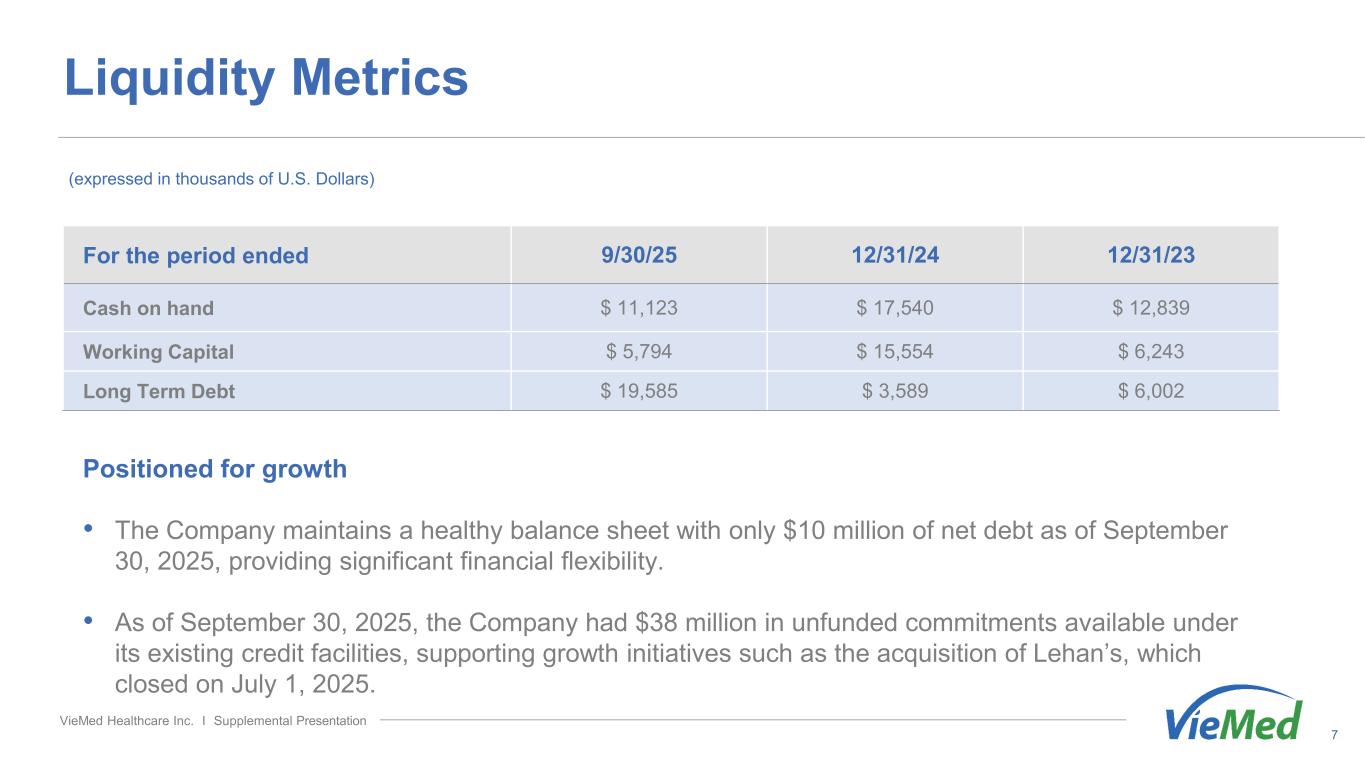
Liquidity Metrics 7 Positioned for growth • The Company maintains a healthy balance sheet with only $10 million of net debt as of September 30, 2025, providing significant financial flexibility. • As of September 30, 2025, the Company had $38 million in unfunded commitments available under its existing credit facilities, supporting growth initiatives such as the acquisition of Lehan’s, which closed on July 1, 2025. For the period ended 9/30/25 12/31/24 12/31/23 Cash on hand $ 11,123 $ 17,540 $ 12,839 Working Capital $ 5,794 $ 15,554 $ 6,243 Long Term Debt $ 19,585 $ 3,589 $ 6,002 VieMed Healthcare Inc. I Supplemental Presentation (expressed in thousands of U.S. Dollars)
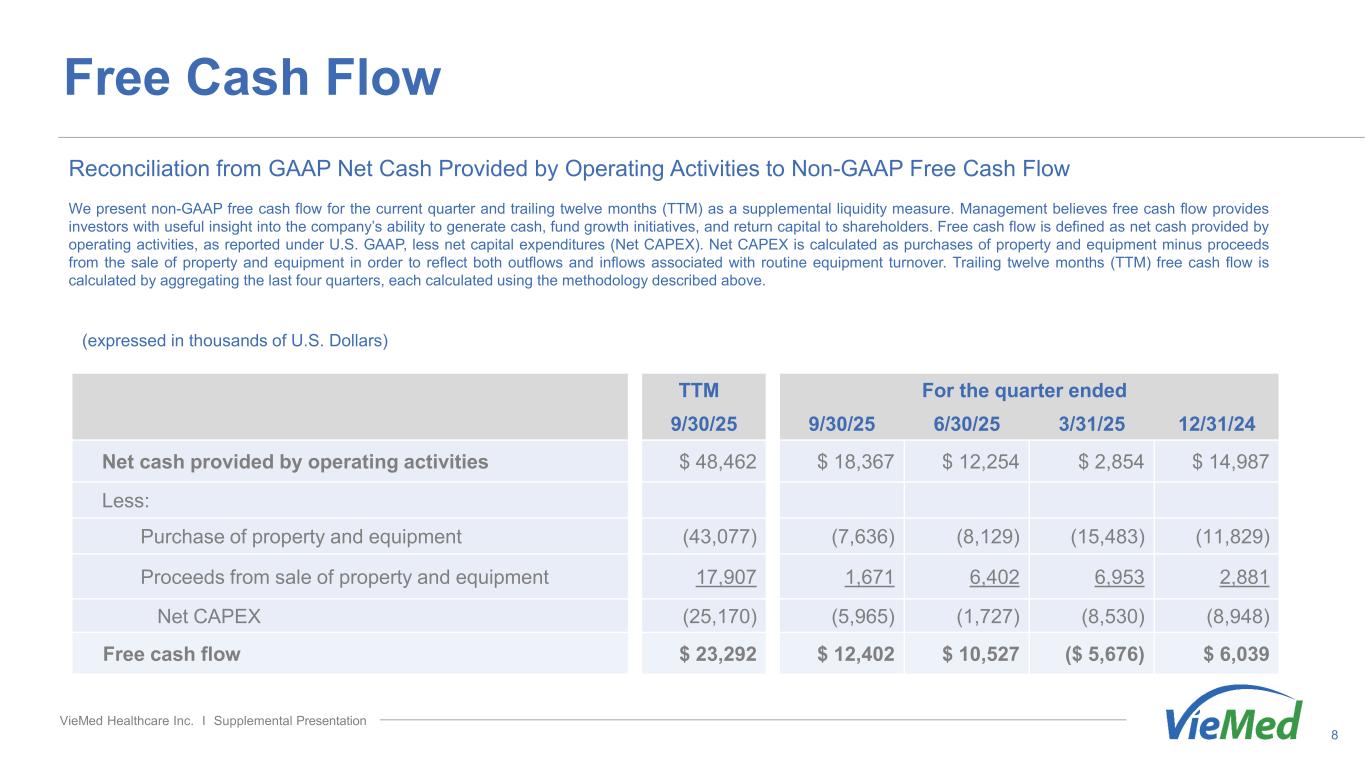
Free Cash Flow 8 TTM For the quarter ended 9/30/25 9/30/25 6/30/25 3/31/25 12/31/24 Net cash provided by operating activities $ 48,462 $ 18,367 $ 12,254 $ 2,854 $ 14,987 Less: Purchase of property and equipment (43,077) (7,636) (8,129) (15,483) (11,829) Proceeds from sale of property and equipment 17,907 1,671 6,402 6,953 2,881 Net CAPEX (25,170) (5,965) (1,727) (8,530) (8,948) Free cash flow $ 23,292 $ 12,402 $ 10,527 ($ 5,676) $ 6,039 VieMed Healthcare Inc. I Supplemental Presentation (expressed in thousands of U.S. Dollars) Reconciliation from GAAP Net Cash Provided by Operating Activities to Non-GAAP Free Cash Flow We present non-GAAP free cash flow for the current quarter and trailing twelve months (TTM) as a supplemental liquidity measure. Management believes free cash flow provides investors with useful insight into the company’s ability to generate cash, fund growth initiatives, and return capital to shareholders. Free cash flow is defined as net cash provided by operating activities, as reported under U.S. GAAP, less net capital expenditures (Net CAPEX). Net CAPEX is calculated as purchases of property and equipment minus proceeds from the sale of property and equipment in order to reflect both outflows and inflows associated with routine equipment turnover. Trailing twelve months (TTM) free cash flow is calculated by aggregating the last four quarters, each calculated using the methodology described above.
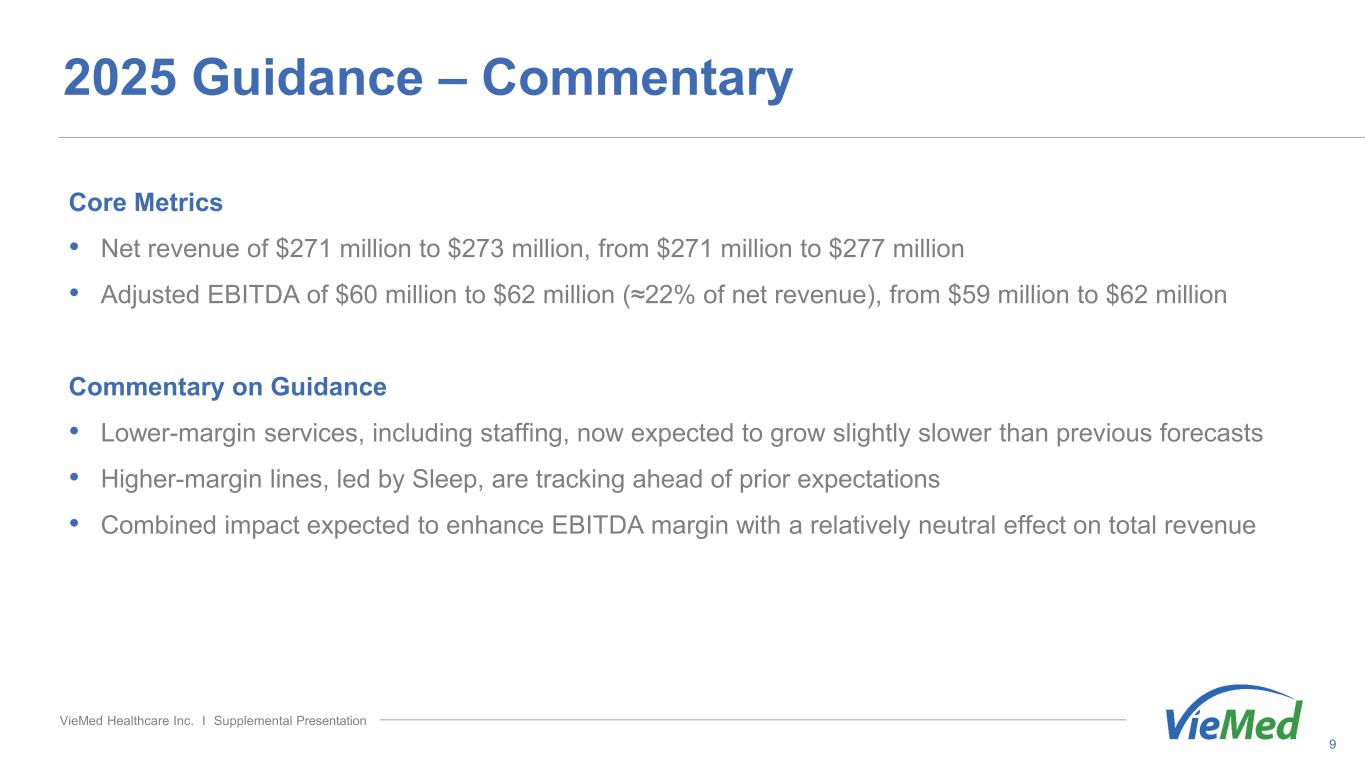
2025 Guidance – Commentary 9 Core Metrics • Net revenue of $271 million to $273 million, from $271 million to $277 million • Adjusted EBITDA of $60 million to $62 million (≈22% of net revenue), from $59 million to $62 million Commentary on Guidance • Lower-margin services, including staffing, now expected to grow slightly slower than previous forecasts • Higher-margin lines, led by Sleep, are tracking ahead of prior expectations • Combined impact expected to enhance EBITDA margin with a relatively neutral effect on total revenue VieMed Healthcare Inc. I Supplemental Presentation
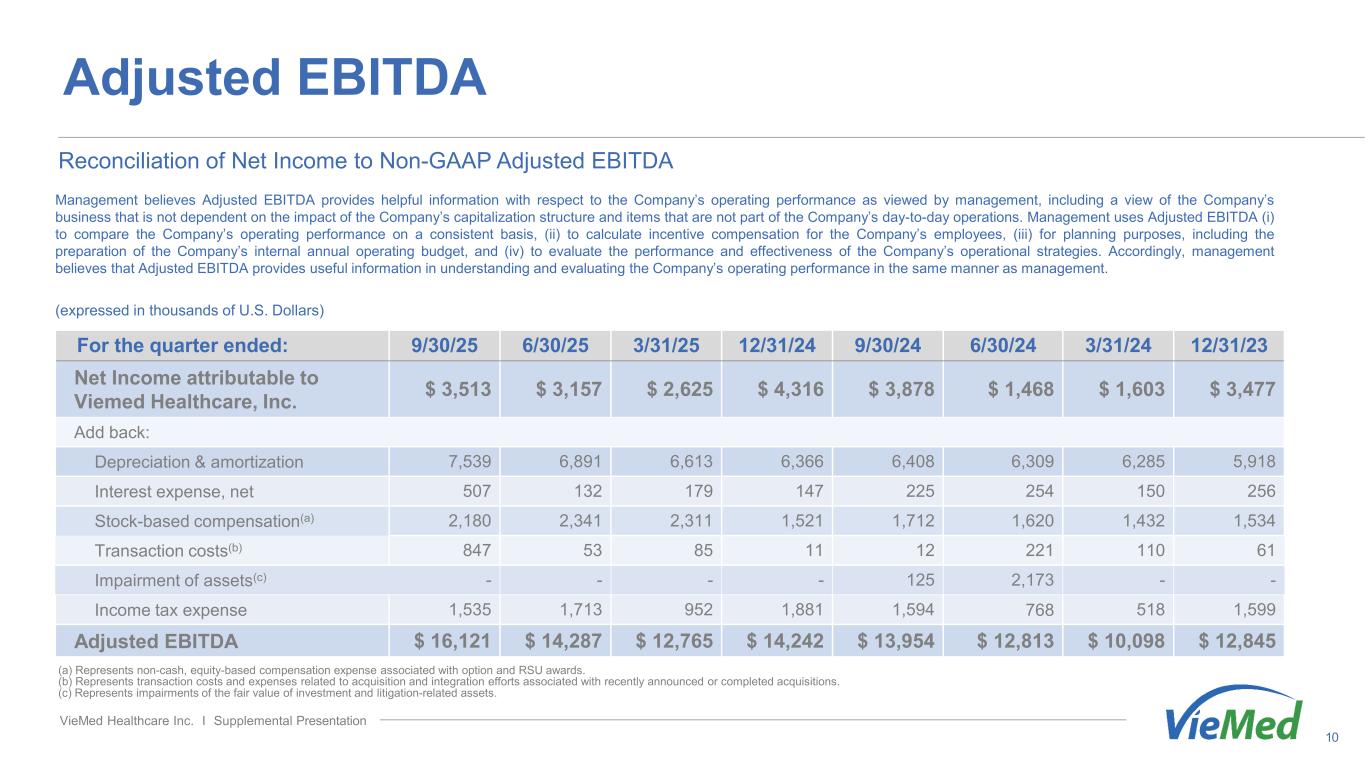
Adjusted EBITDA 10 (a) Represents non-cash, equity-based compensation expense associated with option and RSU awards. (b) Represents transaction costs and expenses related to acquisition and integration efforts associated with recently announced or completed acquisitions. (c) Represents impairments of the fair value of investment and litigation-related assets. Reconciliation of Net Income to Non-GAAP Adjusted EBITDA For the quarter ended: 9/30/25 6/30/25 3/31/25 12/31/24 9/30/24 6/30/24 3/31/24 12/31/23 Net Income attributable to Viemed Healthcare, Inc. $ 3,513 $ 3,157 $ 2,625 $ 4,316 $ 3,878 $ 1,468 $ 1,603 $ 3,477 Add back: Depreciation & amortization 7,539 6,891 6,613 6,366 6,408 6,309 6,285 5,918 Interest expense, net 507 132 179 147 225 254 150 256 Stock-based compensation(a) 2,180 2,341 2,311 1,521 1,712 1,620 1,432 1,534 Transaction costs(b) 847 53 85 11 12 221 110 61 Impairment of assets(c) - - - - 125 2,173 - - Income tax expense 1,535 1,713 952 1,881 1,594 768 518 1,599 Adjusted EBITDA $ 16,121 $ 14,287 $ 12,765 $ 14,242 $ 13,954 $ 12,813 $ 10,098 $ 12,845 VieMed Healthcare Inc. I Supplemental Presentation (expressed in thousands of U.S. Dollars) Management believes Adjusted EBITDA provides helpful information with respect to the Company’s operating performance as viewed by management, including a view of the Company’s business that is not dependent on the impact of the Company’s capitalization structure and items that are not part of the Company’s day-to-day operations. Management uses Adjusted EBITDA (i) to compare the Company’s operating performance on a consistent basis, (ii) to calculate incentive compensation for the Company’s employees, (iii) for planning purposes, including the preparation of the Company’s internal annual operating budget, and (iv) to evaluate the performance and effectiveness of the Company’s operational strategies. Accordingly, management believes that Adjusted EBITDA provides useful information in understanding and evaluating the Company’s operating performance in the same manner as management.