Leading the Healthcare Industry in Home Respiratory Care Investor Presentation: NASDAQ: VMD November 2025 VieMed Healthcare Inc. • Investor Presentation
Disclaimers VieMed Healthcare Inc. • Investor Presentation Disclaimers and Other Important Information This presentation (the “Presentation”) about Viemed Healthcare, Inc. (“Viemed” or the “Company”) is dated November 2025. It presents information in a summary form and does not purport to be complete. The data contained herein is derived from various internal and external sources. This Presentation is not intended to be relied upon as advice to investors or potential investors and does not take into account the investment objectives, financial situation or needs of any particular investor. No representation or warranty, express or implied, is made or given by or on behalf of Viemed or any of its affiliates, directors, officers or employees as to the accuracy, completeness or fairness of the information or opinions contained in this Presentation and no responsibility or liability is accepted by any person for such information or opinions. Viemed does not undertake or agree to update this Presentation or to correct any inaccuracies in, or omissions from, this Presentation that may become apparent. No person has been authorized to give any information or make any representations other than those contained in this Presentation and, if given and/or made, such information or representations must not be relied upon as having been so authorized. The contents of this Presentation are not to be construed as legal, financial or tax advice. This Presentation does not constitute an offer to sell or the solicitation of an offer to buy, nor shall there be any sale of the securities of Viemed in any jurisdiction in which such offer, solicitation or sale would be unlawful prior to registration or qualification under the securities laws of such jurisdiction. Recipients of this Presentation who are considering acquiring securities of Viemed are referred to the entire body of publicly disclosed information regarding Viemed. The information is subject to material updating, revision and further amendment, and is qualified entirely by reference to Viemed’s publicly disclosed information. Forward Looking Statements Certain statements contained in this Presentation may constitute “forward-looking statements” within the meaning of the U.S. Private Securities Litigation Reform Act of 1995 or “forward-looking information” as such term is defined in applicable Canadian securities legislation (collectively, “forward- looking statements”). Often, but not always, forward-looking statements can be identified by the use of words such as “plans”, “expects”, “is expected”, “budget”, “potential”, “scheduled”, “estimates”, “forecasts”, “intends”, “anticipates”, “believes”, “projects”, or the negatives thereof or variations of such words and phrases or statements that certain actions, events or results “will”, “should”, “may”, “could”, “would”, “might” or “will be taken”, “occur” or “be achieved” or the negative of these terms or comparable terminology. All statements other than statements of historical fact, including those that express, or involve discussions as to, expectations, beliefs, plans, objectives, assumptions or future events or performance, including the Company's net revenue and Adjusted EBITDA guidance for 2025, the Company’s growth strategy, including its plans for geographic expansion, diversification of payor and product mix, technology initiatives, and potential future acquisitions or partnerships, and the anticipated benefits and integration plans related to the acquisition of Lehan’s Medical Equipment, are not historical facts and may be forward-looking statements and may involve estimates, assumptions and uncertainties that could cause actual results or outcomes to differ materially from those expressed in the forward-looking statements. Such statements reflect Viemed's current views and intentions with respect to future events, and current information available to Viemed, and are subject to certain risks, uncertainties and assumptions. Many factors could cause the actual results, performance or achievements that may be expressed or implied by such forward-looking statements to vary from those described herein should one or more of these risks or uncertainties materialize. These factors include, without limitation: the general business, market and economic conditions in the regions in which the Company operates; significant capital requirements and operating risks that the Company may be subject to; the ability of the Company to implement business strategies and pursue business opportunities; volatility in the market price of the Company's common shares; the state of the capital markets; the availability of funds and resources to pursue operations; inflation; reductions in reimbursement rates and audits of reimbursement claims by various governmental and private payor entities; dependence on few payors; possible new drug discoveries; dependence on key suppliers; granting of permits and licenses in a highly regulated business; competition; disruptions in or attacks (including cyber-attacks) on the Company's information technology, internet, network access or other voice or data communications systems or services; the evolution of various types of fraud or other criminal behavior to which the Company is exposed; difficulty integrating newly acquired businesses; the impact of new and changes to, or application of, current laws and regulations; the overall difficult litigation and regulatory environment; increased competition; increased funding costs and market volatility due to market illiquidity and competition for funding; critical accounting estimates and changes to accounting standards, policies, and methods used by the Company; and the occurrence of natural and unnatural catastrophic events or health epidemics or concerns, and claims resulting from such events or concerns, as well as other general economic, market and business conditions; and other factors beyond our control; as well as those risk factors discussed or referred to in Viemed’s disclosure documents filed with the U.S. Securities and Exchange Commission (the “SEC”) available on the SEC’s website at www.sec.gov, including Viemed’s most recent Annual Report on Form 10-K and quarterly report on Form 10-Q, and with the securities regulatory authorities in certain provinces of Canada available at www.sedarplus.ca. Should any factor affect Viemed in an unexpected manner, or should assumptions underlying the forward-looking statements prove incorrect, the actual results or events may differ materially from the results or events predicted. Any such forward-looking statements are expressly qualified in their entirety by this cautionary statement. Moreover, Viemed does not assume responsibility for the accuracy or completeness of such forward-looking statements. The forward-looking statements included in this Presentation are made as of the date of this Presentation and Viemed undertakes no obligation to publicly update or revise any forward-looking statements, other than as required by applicable law. This Presentation contains non-GAAP financial guidance. There is no reliable or reasonably estimable comparable GAAP measure for the Company’s non-GAAP financial guidance because the Company is not able to reliably predict the impact of certain items that typically have one or more of the following characteristics: highly variable, difficult to project, unusual in nature, significant to the results of a particular period or not indicative of future operating results. Similar charges or gains were recognized in prior periods and will likely reoccur in future periods. As a result, reconciliation of the non-GAAP financial guidance to the most directly comparable GAAP measure is not available without unreasonable effort. In addition, the Company believes such a reconciliation would imply a degree of precision and certainty that could be confusing to investors. The variability of the specified items may have a significant and unpredictable impact on the Company’s future GAAP results. Market and Industry Data Industry and market data used in this Presentation is unaudited and have been obtained from third-party industry publications and sources as well as from research reports prepared for other purposes. Viemed has not independently verified the data obtained from these sources and cannot assure you of the data’s accuracy or completeness. This data is subject to change and cannot always be verified with complete certainty due to limits on the availability and reliability of raw data, the voluntary nature of the data gathering process and other limitations and uncertainties inherent in any statistical survey of market or industry data. You are cautioned not to give undue weight to such industry and market data. Non-GAAP and Other Financial Information This Presentation includes references to financial measures that are calculated and presented on the basis of methodologies other than in accordance with generally accepted accounting principles in the United States of America (“GAAP”), including the measures Adjusted EBITDA and free cash flow. A reconciliation of these non-GAAP financial measures to the nearest GAAP measures can be found in the Appendix to this Presentation. 2
A national, innovative in-home healthcare leader... National Leader in Complex Respiratory Services Providing ventilation, sleep therapy, staffing, and other complementary products and services. Innovative At- Home Healthcare High-touch and high-tech services care model drives cost reduction, increases patient satisfaction and reduces rehospitalizations. Robust Growth and Financial Performance 27% compound annual growth rate since public listing, superior financial returns and no net debt. Extensive Nationwide Reach Serving over 163,000 patients with a capex-light business model in all 50 states. VieMed Healthcare Inc. • Investor Presentation 3
...with multiple catalysts driving our growth 4 Viemed serves as a vital link between patients, providers, and payors for increased patient satisfaction, improved compliance and reduced hospitalizations We address massively underserved populations for complex respiratory care services as well as obstructive sleep apnea VieMed Healthcare Inc. • Investor Presentation Regulatory environment stressing efficiency, care in the home, transparency and compliance plays to VieMed’s strengths Organic and inorganic growth have diversified our business and product mix leading to strong financial returns and a well-positioned balance sheet
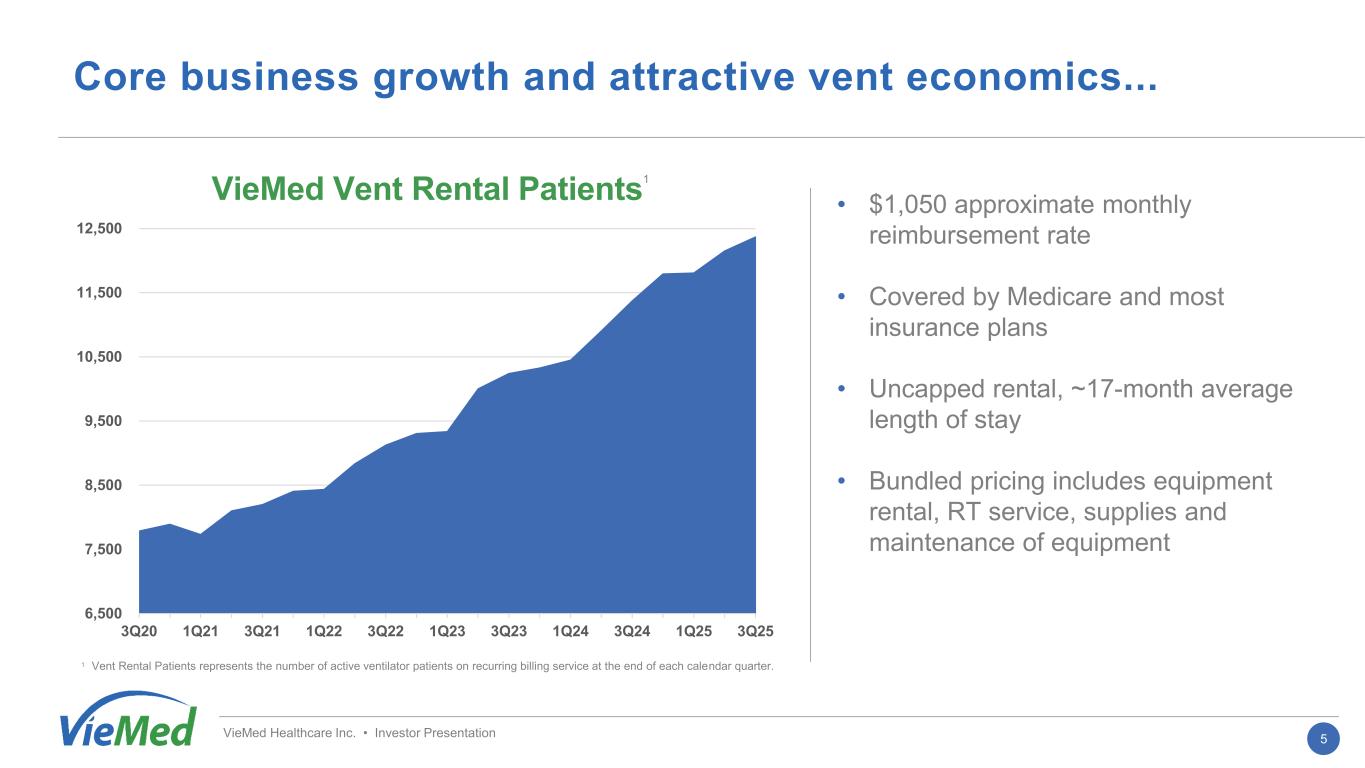
Core business growth and attractive vent economics... VieMed Healthcare Inc. • Investor Presentation VieMed Vent Rental Patients • $1,050 approximate monthly reimbursement rate • Covered by Medicare and most insurance plans • Uncapped rental, ~17-month average length of stay • Bundled pricing includes equipment rental, RT service, supplies and maintenance of equipment 6,500 7,500 8,500 9,500 10,500 11,500 12,500 3Q20 1Q21 3Q21 1Q22 3Q22 1Q23 3Q23 1Q24 3Q24 1Q25 3Q25 1 1 Vent Rental Patients represents the number of active ventilator patients on recurring billing service at the end of each calendar quarter. 5
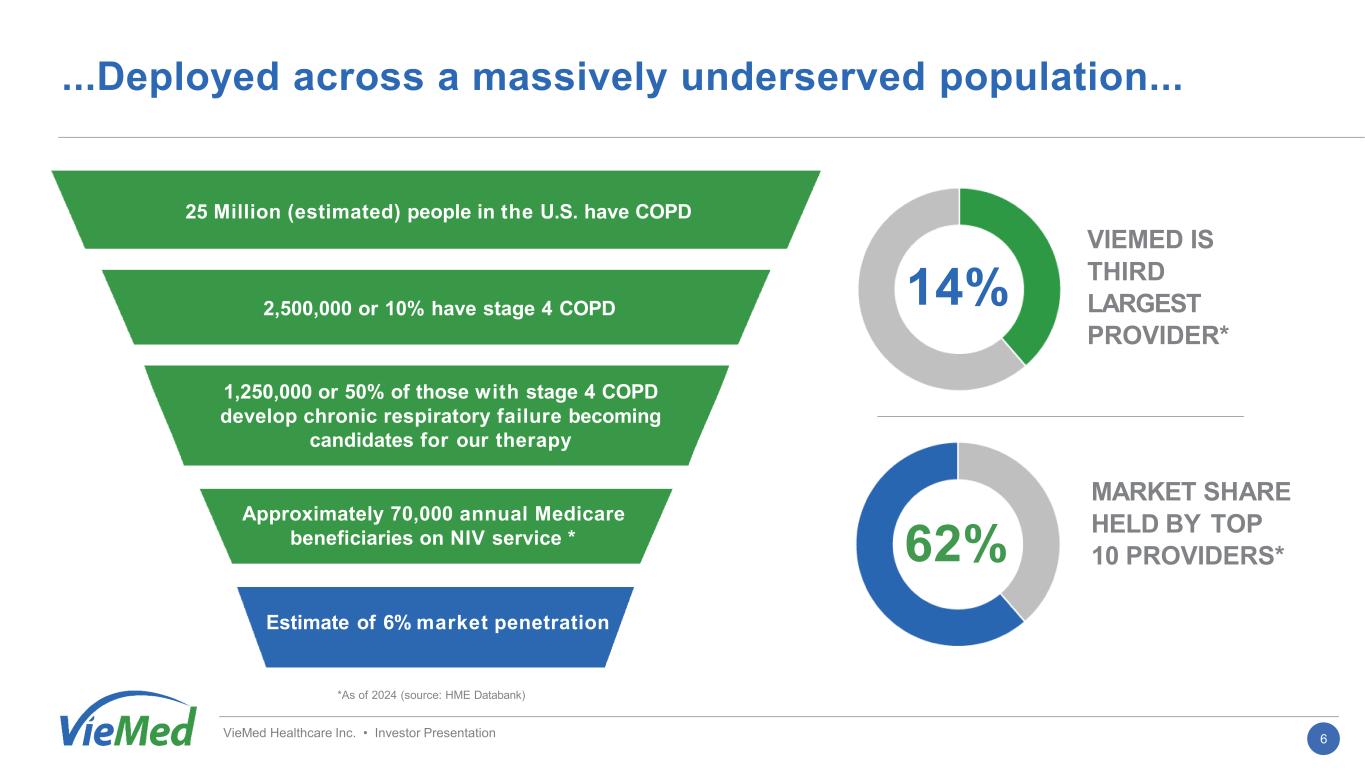
...Deployed across a massively underserved population... *As of 2024 (source: HME Databank) VieMed Healthcare Inc. • Investor Presentation 25 Million (estimated) people in the U.S. have COPD Approximately 70,000 annual Medicare beneficiaries on NIV service * Estimate of 6% market penetration 2,500,000 or 10% have stage 4 COPD 1,250,000 or 50% of those with stage 4 COPD develop chronic respiratory failure becoming candidates for our therapy VIEMED IS THIRD LARGEST PROVIDER* MARKET SHARE HELD BY TOP 10 PROVIDERS* 14% 62% 6
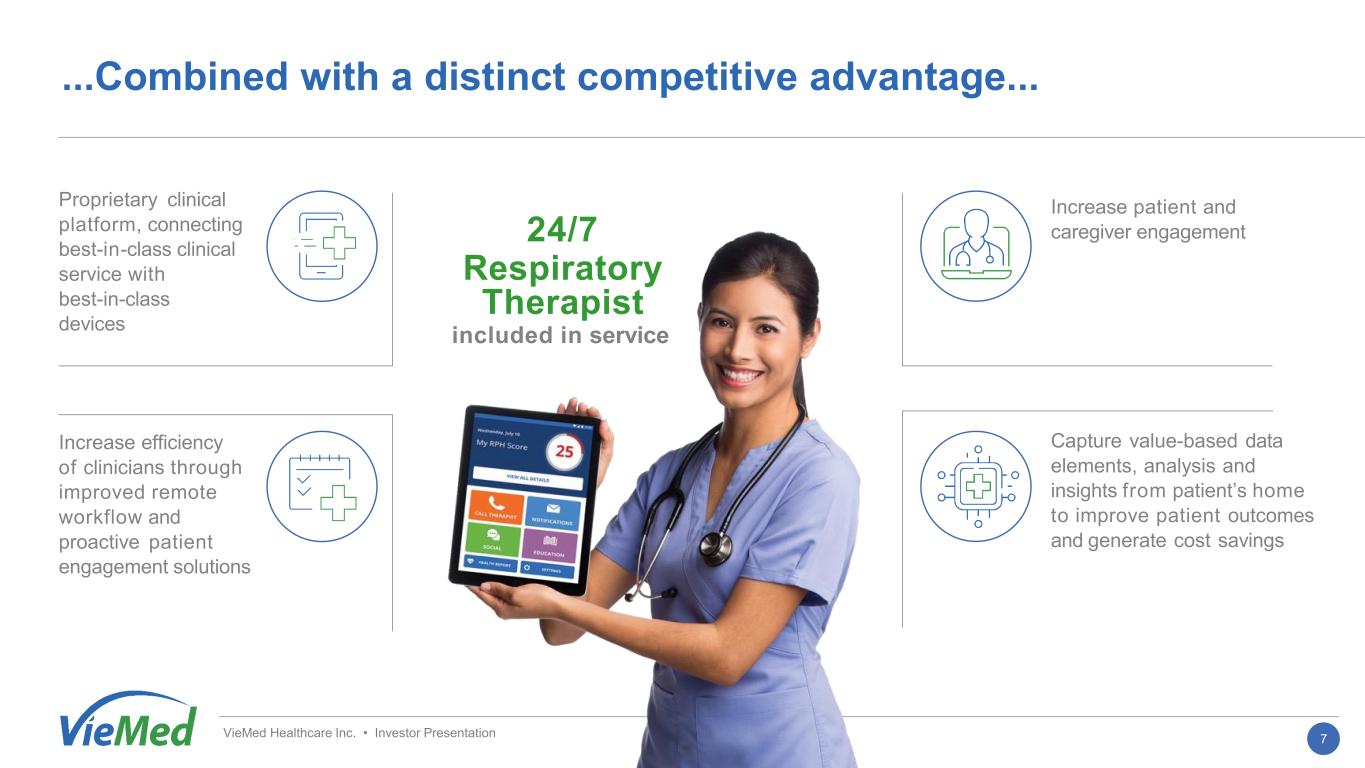
...Combined with a distinct competitive advantage... Proprietary clinical platform, connecting best-in-class clinical service with best-in-class devices Increase patient and caregiver engagement Increase efficiency of clinicians through improved remote workflow and proactive patient engagement solutions Capture value-based data elements, analysis and insights from patient’s home to improve patient outcomes and generate cost savings 24/7 Respiratory Therapist included in service VieMed Healthcare Inc. • Investor Presentation 7
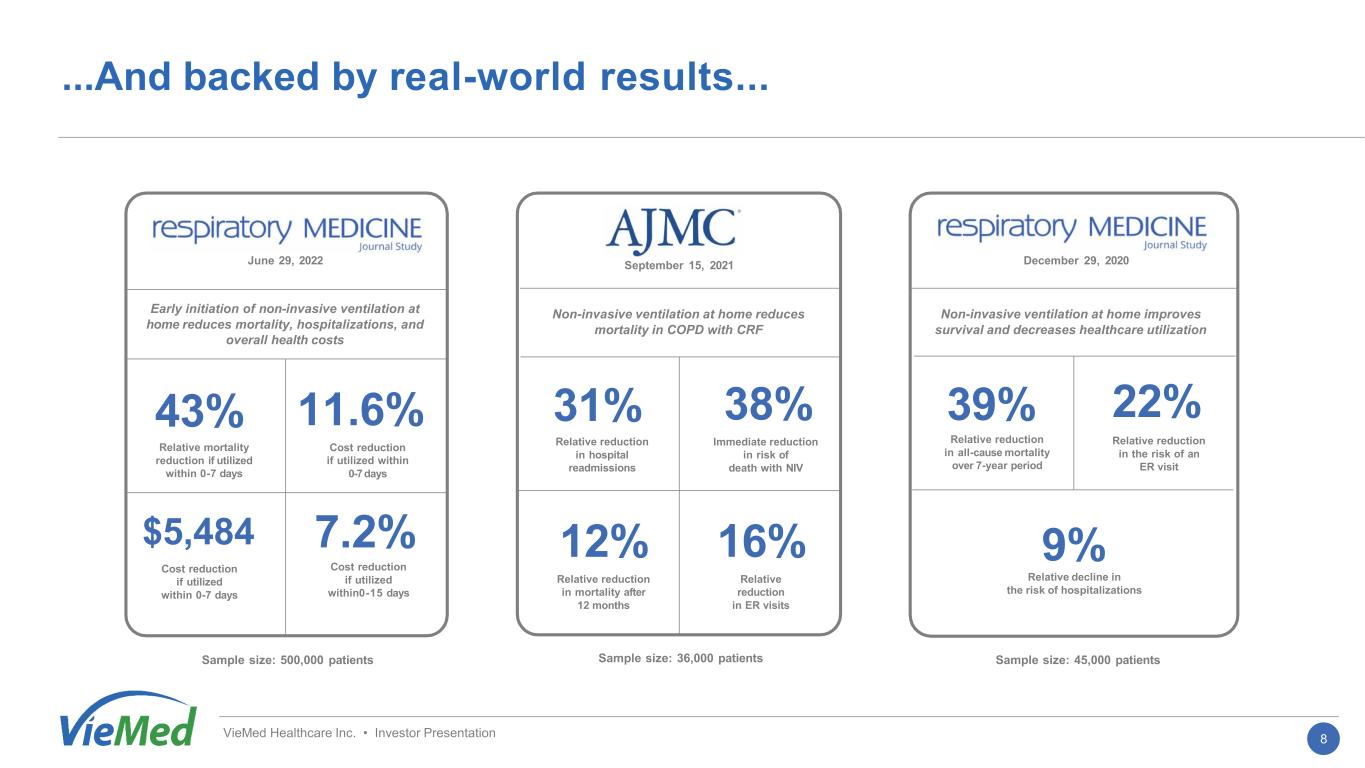
...And backed by real-world results... VieMed Healthcare Inc. • Investor Presentation Non-invasive ventilation at home reduces mortality in COPD with CRF September 15, 2021 December 29, 2020June 29, 2022 Sample size: 500,000 patients Sample size: 36,000 patients Sample size: 45,000 patients 43% Relative mortality reduction if utilized within 0-7 days 11.6% Cost reduction if utilized within 0-7 days 7.2% Cost reduction if utilized within0-15 days $5,484 Cost reduction if utilized within 0-7 days Early initiation of non-invasive ventilation at home reduces mortality, hospitalizations, and overall health costs Non-invasive ventilation at home reduces mortality in COPD with CRF 31% Relative reduction in hospital readmissions 38% Immediate reduction in risk of death with NIV 12% Relative reduction in mortality after 12 months 16% Relative reduction in ER visits Non-invasive ventilation at home improves survival and decreases healthcare utilization 39% Relative reduction in all-cause mortality over 7-year period 9% Relative decline in the risk of hospitalizations 22% Relative reduction in the risk of an ER visit 8
...Drive our organic growth engine Location selection • Based on high COPD rates • Target hospitals and facilities struggling with length of stay management and near existing service area • Leverage existing relationships and operate heavily in rural markets Unique lean deployment model • No costly retail stores • Sales reps and RTs operate out of vehicles that are monitored by GPS High service model • Certified RTs delivering a high touch service model to a non-compliant patient demographic base • Providing education and assessment to patients in their homes and through telehealth VieMed Healthcare Inc. • Investor Presentation 9
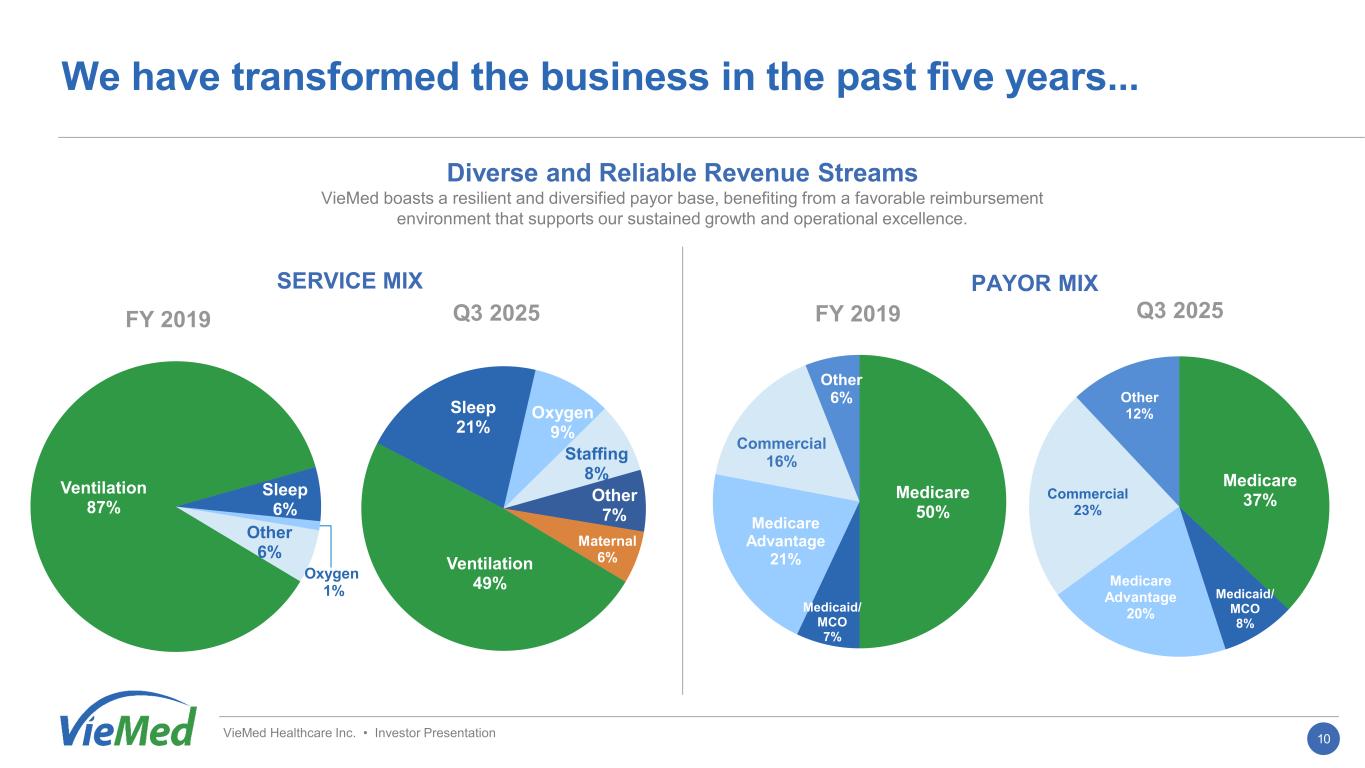
Medicare 37% Medicaid/ MCO 8% Medicare Advantage 20% Commercial 23% Other 12% Ventilation 49% Sleep 21% Oxygen 9% Staffing 8% Other 7% Maternal 6% Q1 2025 Ventilation 87% Sleep 6% Oxygen 1% Other 6% Medicare 50% Medicaid/ MCO 7% Medicare Advantage 21% Commercial 16% Other 6% We have transformed the business in the past five years... SERVICE MIX PAYOR MIX VieMed Healthcare Inc. • Investor Presentation Diverse and Reliable Revenue Streams VieMed boasts a resilient and diversified payor base, benefiting from a favorable reimbursement environment that supports our sustained growth and operational excellence. Q3 2025FY 2019 FY 2019 Q3 2025 10
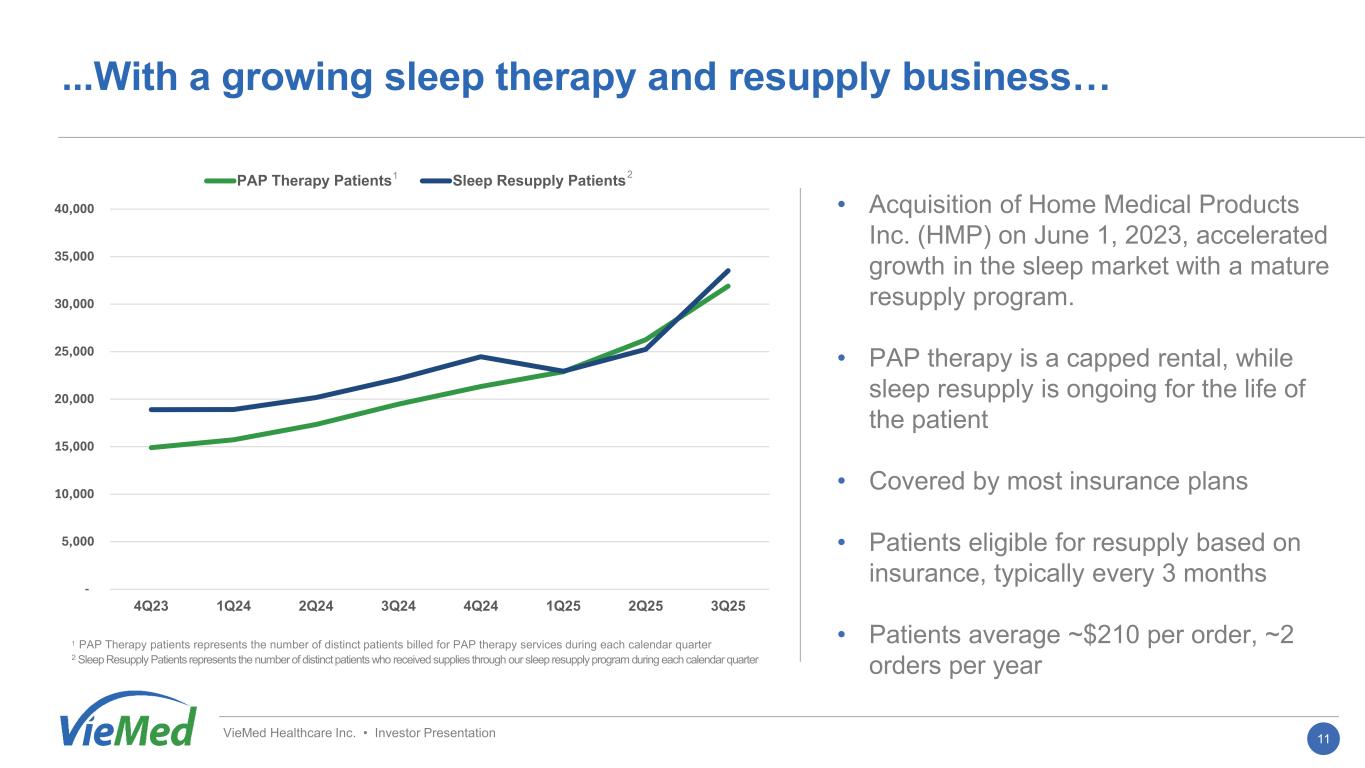
- 5,000 10,000 15,000 20,000 25,000 30,000 35,000 40,000 4Q23 1Q24 2Q24 3Q24 4Q24 1Q25 2Q25 3Q25 PAP Therapy Patients Sleep Resupply Patients VieMed Healthcare Inc. • Investor Presentation • Acquisition of Home Medical Products Inc. (HMP) on June 1, 2023, accelerated growth in the sleep market with a mature resupply program. • PAP therapy is a capped rental, while sleep resupply is ongoing for the life of the patient • Covered by most insurance plans • Patients eligible for resupply based on insurance, typically every 3 months • Patients average ~$210 per order, ~2 orders per year 1 PAP Therapy patients represents the number of distinct patients billed for PAP therapy services during each calendar quarter 2 Sleep Resupply Patients represents the number of distinct patients who received supplies through our sleep resupply program during each calendar quarter 1 2 11 ...With a growing sleep therapy and resupply business…
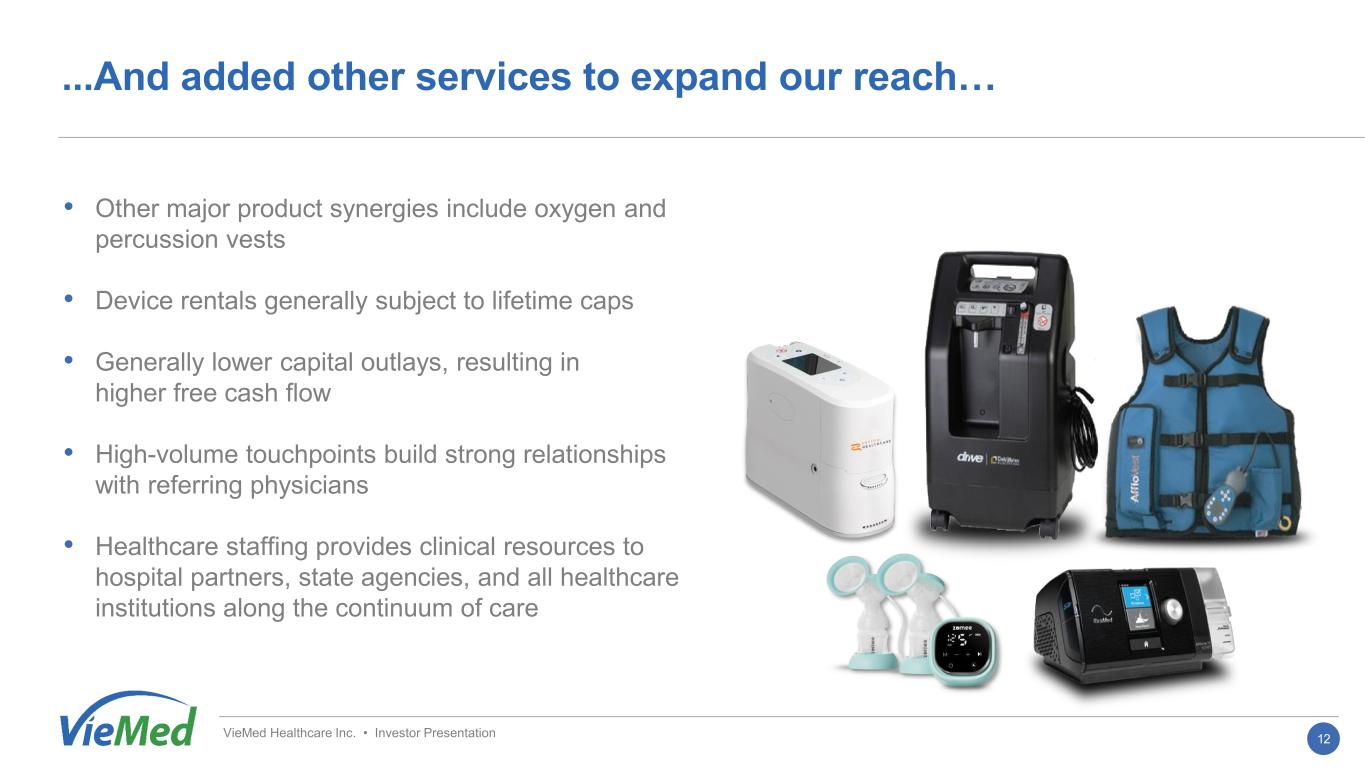
• Other major product synergies include oxygen and percussion vests • Device rentals generally subject to lifetime caps • Generally lower capital outlays, resulting in higher free cash flow • High-volume touchpoints build strong relationships with referring physicians • Healthcare staffing provides clinical resources to hospital partners, state agencies, and all healthcare institutions along the continuum of care VieMed Healthcare Inc. • Investor Presentation 12 ...And added other services to expand our reach…
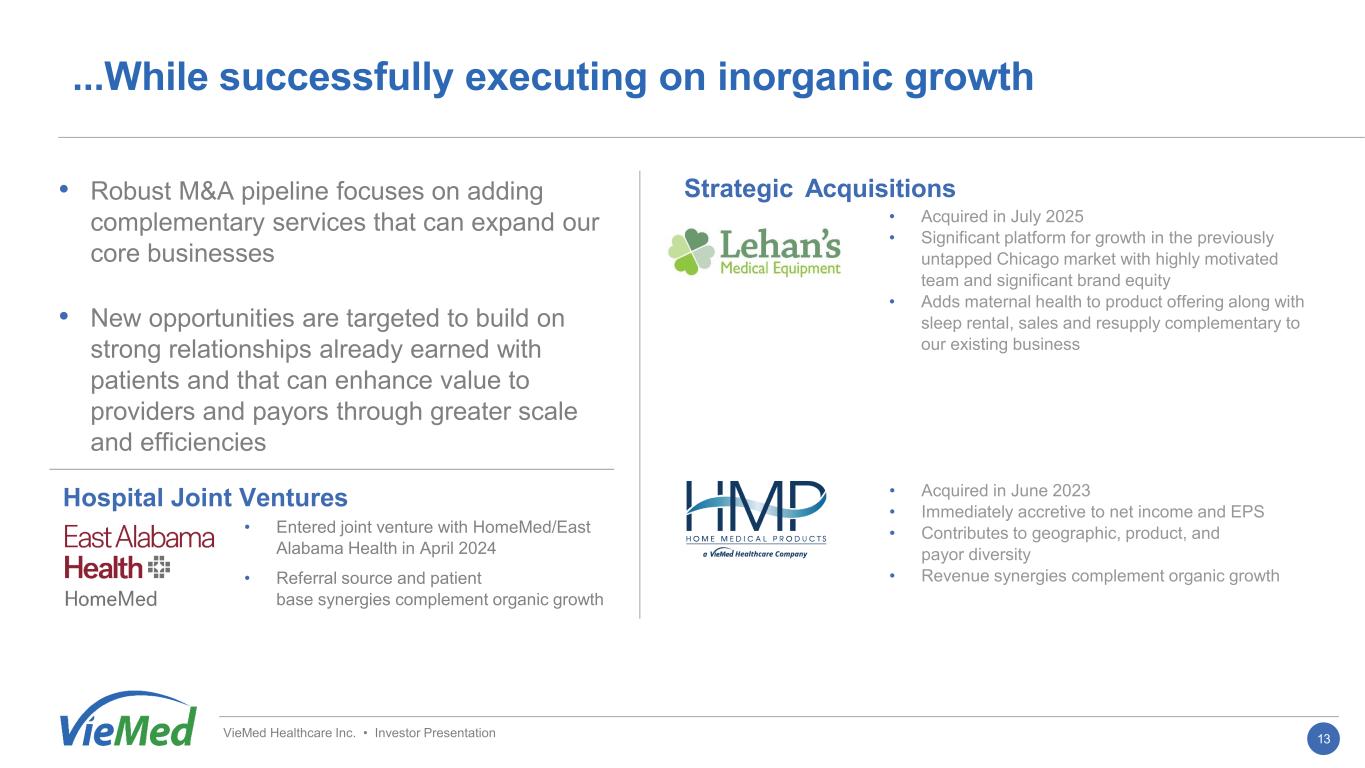
VieMed Healthcare Inc. • Investor Presentation • Robust M&A pipeline focuses on adding complementary services that can expand our core businesses • New opportunities are targeted to build on strong relationships already earned with patients and that can enhance value to providers and payors through greater scale and efficiencies • Acquired in June 2023 • Immediately accretive to net income and EPS • Contributes to geographic, product, and payor diversity • Revenue synergies complement organic growth Strategic Acquisitions Hospital Joint Ventures • Entered joint venture with HomeMed/East Alabama Health in April 2024 • Referral source and patient base synergies complement organic growth 13 ...While successfully executing on inorganic growth • Acquired in July 2025 • Significant platform for growth in the previously untapped Chicago market with highly motivated team and significant brand equity • Adds maternal health to product offering along with sleep rental, sales and resupply complementary to our existing business
VieMed Healthcare Inc. • Investor Presentation Financial Performance 14
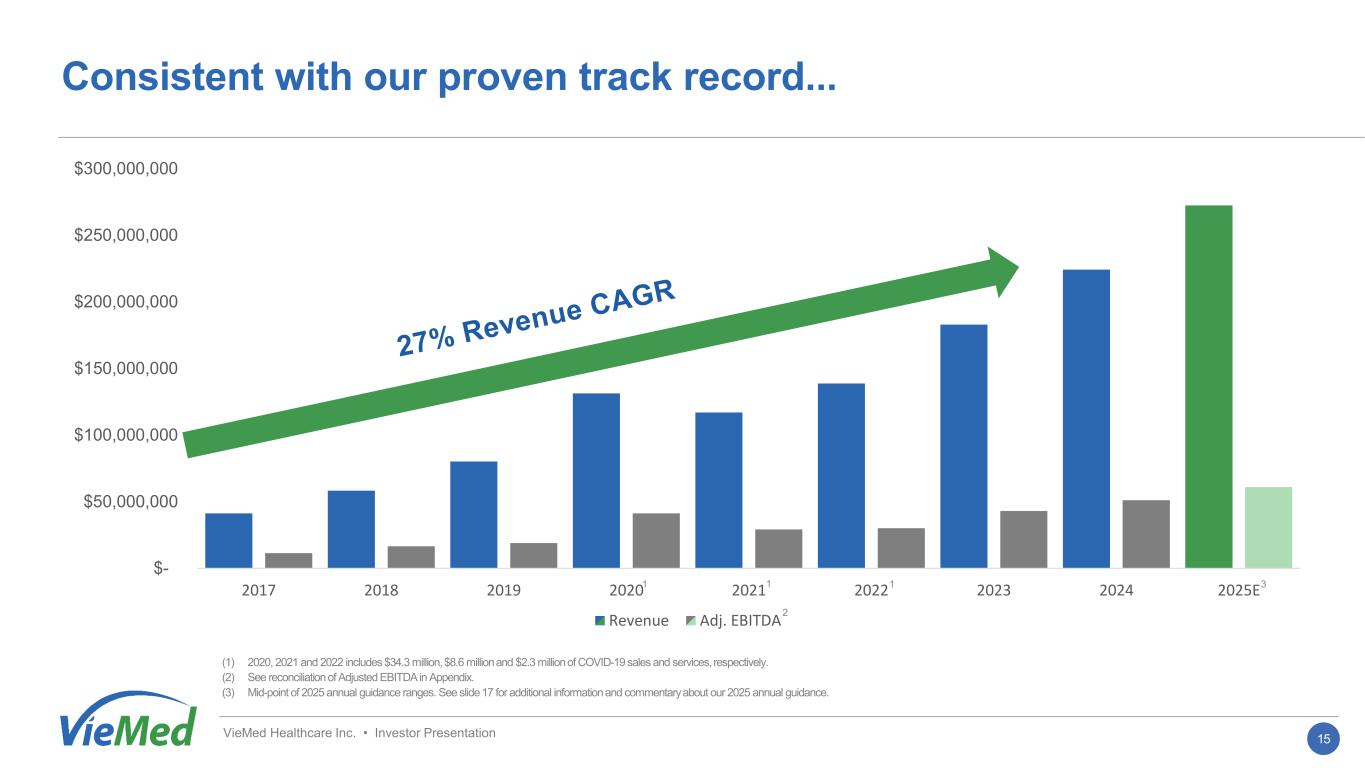
VieMed Healthcare Inc. • Investor Presentation $- $50,000,000 $100,000,000 $150,000,000 $200,000,000 $250,000,000 $300,000,000 2017 2018 2019 2020 2021 2022 2023 2024 2025E Revenue Adj. EBITDA (1) 2020, 2021 and 2022 includes $34.3 million, $8.6 million and $2.3 million of COVID-19 sales and services, respectively. (2) See reconciliation of Adjusted EBITDA in Appendix. (3) Mid-point of 2025 annual guidance ranges. See slide 17 for additional information and commentary about our 2025 annual guidance. 1 1 1 3 2 15 Consistent with our proven track record...
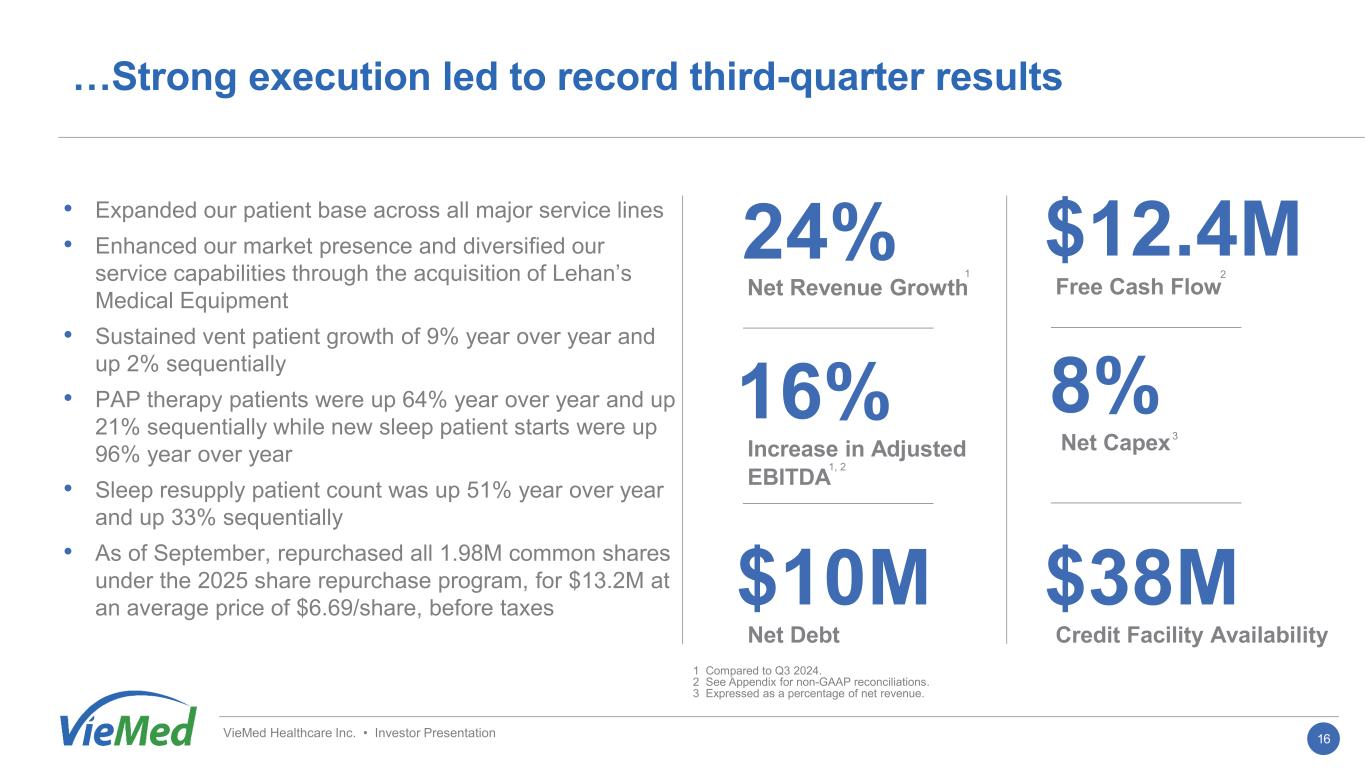
• Expanded our patient base across all major service lines • Enhanced our market presence and diversified our service capabilities through the acquisition of Lehan’s Medical Equipment • Sustained vent patient growth of 9% year over year and up 2% sequentially • PAP therapy patients were up 64% year over year and up 21% sequentially while new sleep patient starts were up 96% year over year • Sleep resupply patient count was up 51% year over year and up 33% sequentially • As of September, repurchased all 1.98M common shares under the 2025 share repurchase program, for $13.2M at an average price of $6.69/share, before taxes VieMed Healthcare Inc. • Investor Presentation 24% Net Revenue Growth 16% Increase in Adjusted EBITDA $12.4M Free Cash Flow 8% Net Capex $38M Credit Facility Availability 1 Compared to Q3 2024. 2 See Appendix for non-GAAP reconciliations. 3 Expressed as a percentage of net revenue. 1, 2 16 …Strong execution led to record third-quarter results 3 $10M Net Debt 1 2
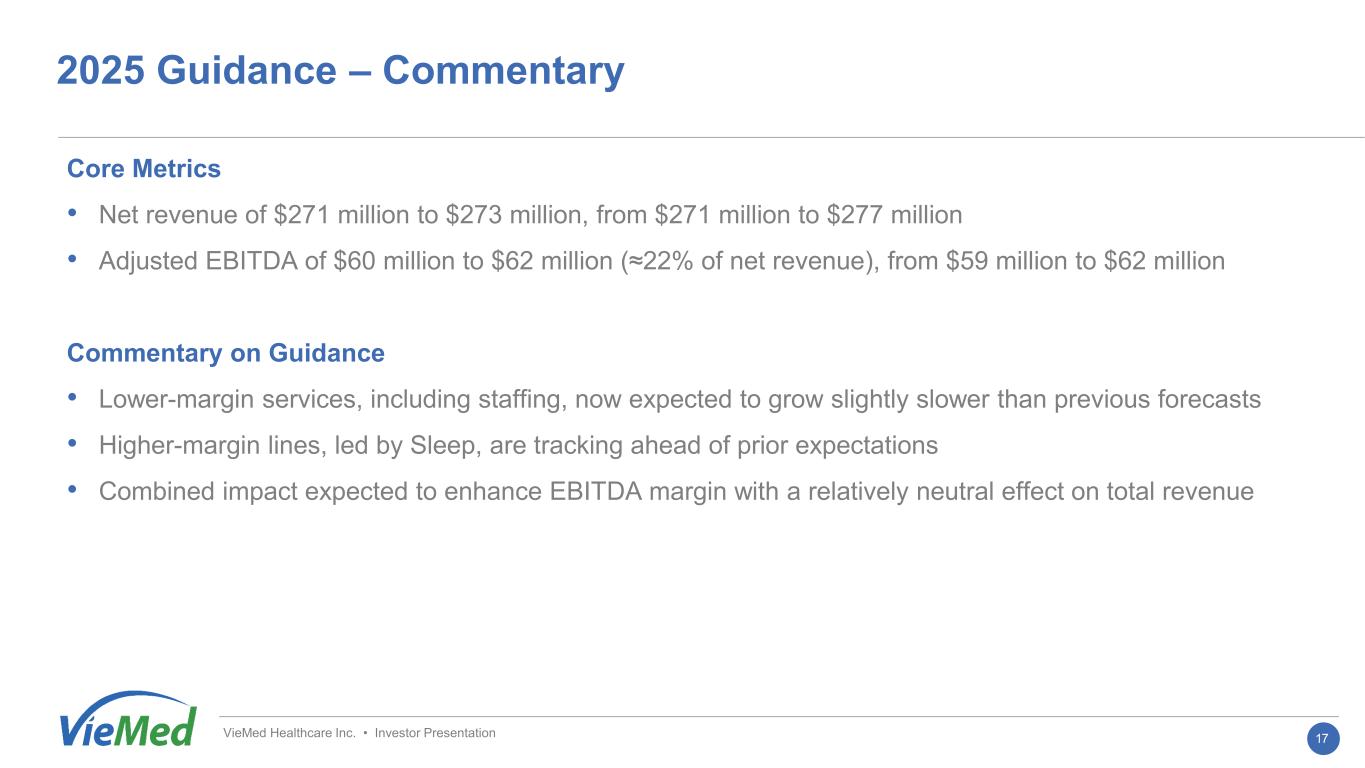
2025 Guidance – Commentary 17 Core Metrics • Net revenue of $271 million to $273 million, from $271 million to $277 million • Adjusted EBITDA of $60 million to $62 million (≈22% of net revenue), from $59 million to $62 million Commentary on Guidance • Lower-margin services, including staffing, now expected to grow slightly slower than previous forecasts • Higher-margin lines, led by Sleep, are tracking ahead of prior expectations • Combined impact expected to enhance EBITDA margin with a relatively neutral effect on total revenue VieMed Healthcare Inc. • Investor Presentation
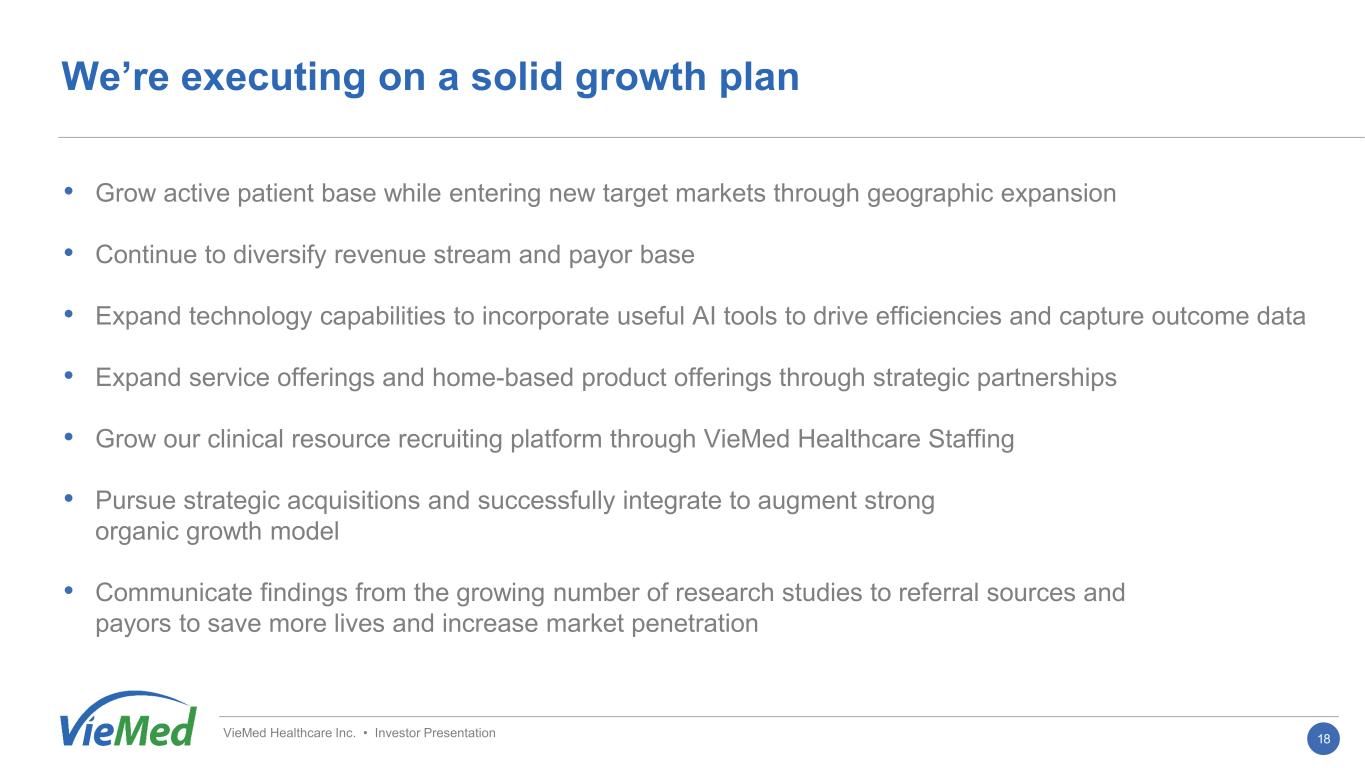
We’re executing on a solid growth plan • Grow active patient base while entering new target markets through geographic expansion • Continue to diversify revenue stream and payor base • Expand technology capabilities to incorporate useful AI tools to drive efficiencies and capture outcome data • Expand service offerings and home-based product offerings through strategic partnerships • Grow our clinical resource recruiting platform through VieMed Healthcare Staffing • Pursue strategic acquisitions and successfully integrate to augment strong organic growth model • Communicate findings from the growing number of research studies to referral sources and payors to save more lives and increase market penetration VieMed Healthcare Inc. • Investor Presentation 18

VieMed Healthcare Inc. • Investor Presentation Appendix 19
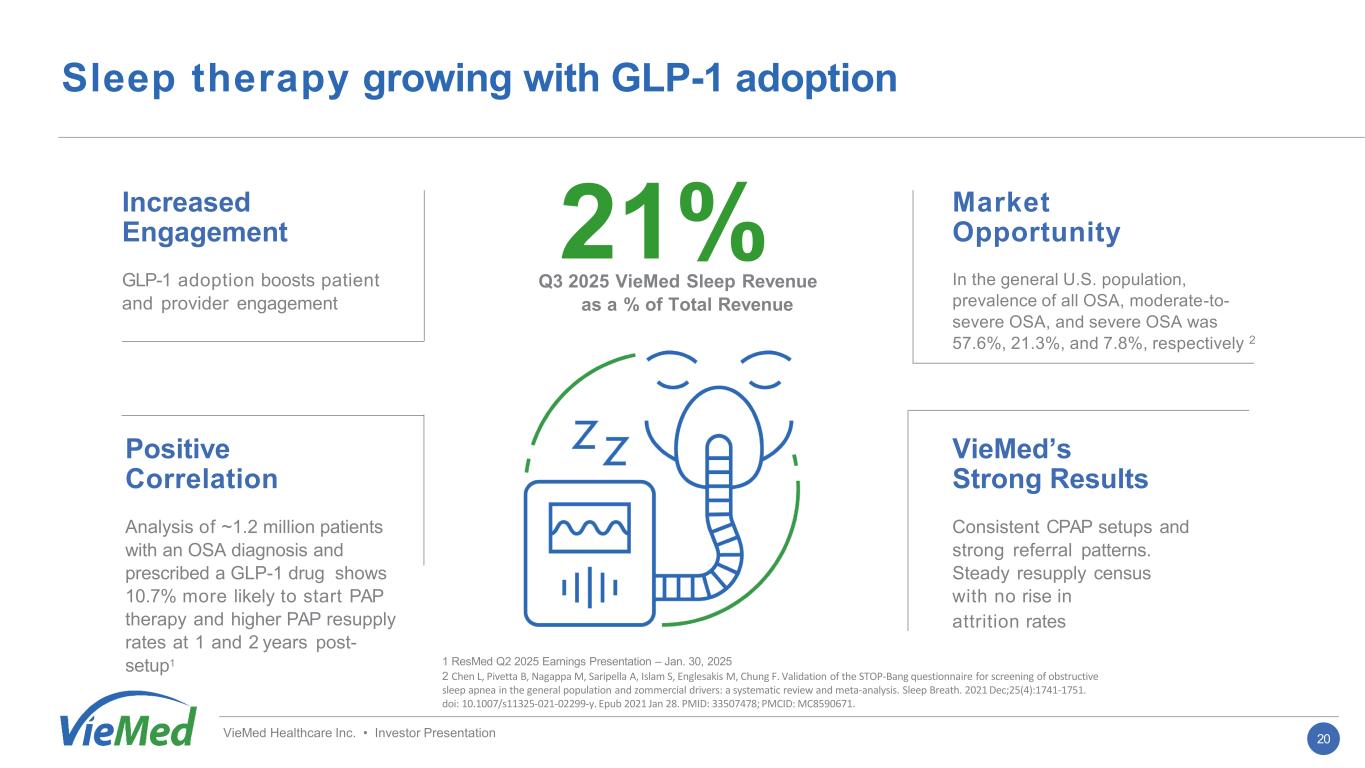
Sleep therapy growing with GLP-1 adoption Increased Engagement GLP-1 adoption boosts patient and provider engagement Market Opportunity In the general U.S. population, prevalence of all OSA, moderate-to- severe OSA, and severe OSA was 57.6%, 21.3%, and 7.8%, respectively 2 Positive Correlation Analysis of ~1.2 million patients with an OSA diagnosis and prescribed a GLP-1 drug shows 10.7% more likely to start PAP therapy and higher PAP resupply rates at 1 and 2 years post- setup1 VieMed’s Strong Results Consistent CPAP setups and strong referral patterns. Steady resupply census with no rise in attrition rates 21% Q3 2025 VieMed Sleep Revenue as a % of Total Revenue 1 ResMed Q2 2025 Earnings Presentation – Jan. 30, 2025 2 Chen L, Pivetta B, Nagappa M, Saripella A, Islam S, Englesakis M, Chung F. Validation of the STOP-Bang questionnaire for screening of obstructive sleep apnea in the general population and zommercial drivers: a systematic review and meta-analysis. Sleep Breath. 2021 Dec;25(4):1741-1751. doi: 10.1007/s11325-021-02299-y. Epub 2021 Jan 28. PMID: 33507478; PMCID: MC8590671. VieMed Healthcare Inc. • Investor Presentation 20
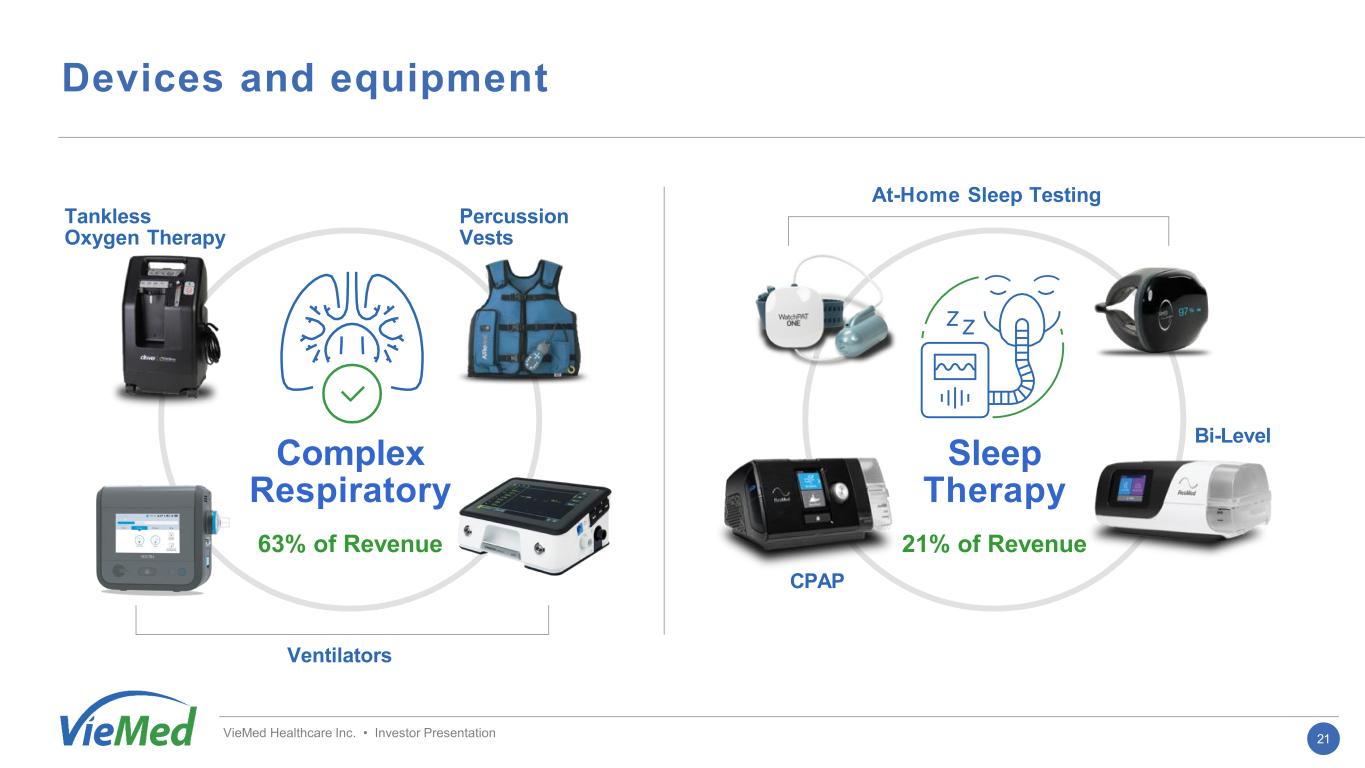
VieMed Healthcare Inc. • Investor Presentation Complex Respiratory 63% of Revenue Ventilators CPAP Bi-Level At-Home Sleep Testing Percussion Vests Tankless Oxygen Therapy Sleep Therapy 21% of Revenue 21 Devices and equipment
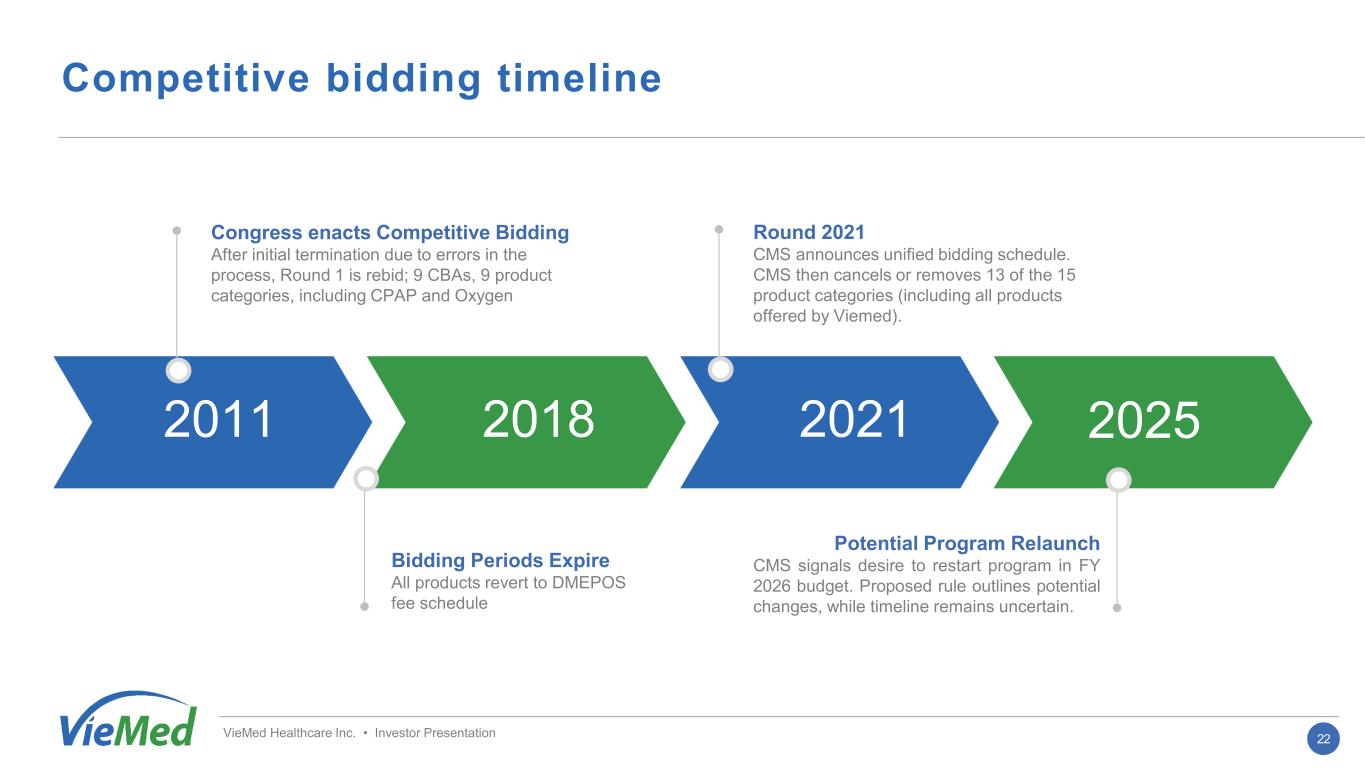
VieMed Healthcare Inc. • Investor Presentation 2011 2018 2021 2025 Congress enacts Competitive Bidding After initial termination due to errors in the process, Round 1 is rebid; 9 CBAs, 9 product categories, including CPAP and Oxygen Bidding Periods Expire All products revert to DMEPOS fee schedule Round 2021 CMS announces unified bidding schedule. CMS then cancels or removes 13 of the 15 product categories (including all products offered by Viemed). Potential Program Relaunch CMS signals desire to restart program in FY 2026 budget. Proposed rule outlines potential changes, while timeline remains uncertain. 22 Competitive bidding timeline
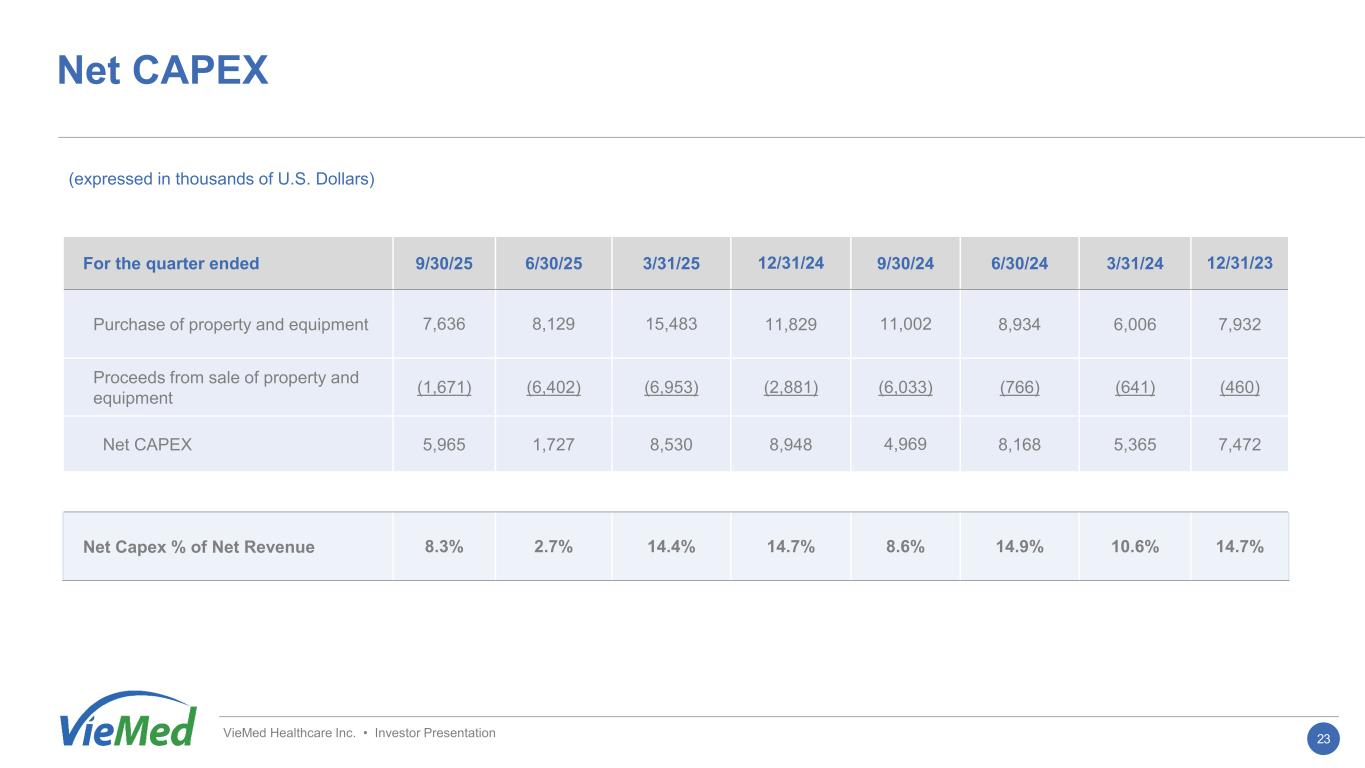
Net CAPEX 23 For the quarter ended 9/30/25 6/30/25 3/31/25 12/31/24 9/30/24 6/30/24 3/31/24 12/31/23 Purchase of property and equipment 7,636 8,129 15,483 11,829 11,002 8,934 6,006 7,932 Proceeds from sale of property and equipment (1,671) (6,402) (6,953) (2,881) (6,033) (766) (641) (460) Net CAPEX 5,965 1,727 8,530 8,948 4,969 8,168 5,365 7,472 Net Capex % of Net Revenue 8.3% 2.7% 14.4% 14.7% 8.6% 14.9% 10.6% 14.7% VieMed Healthcare Inc. • Investor Presentation (expressed in thousands of U.S. Dollars)
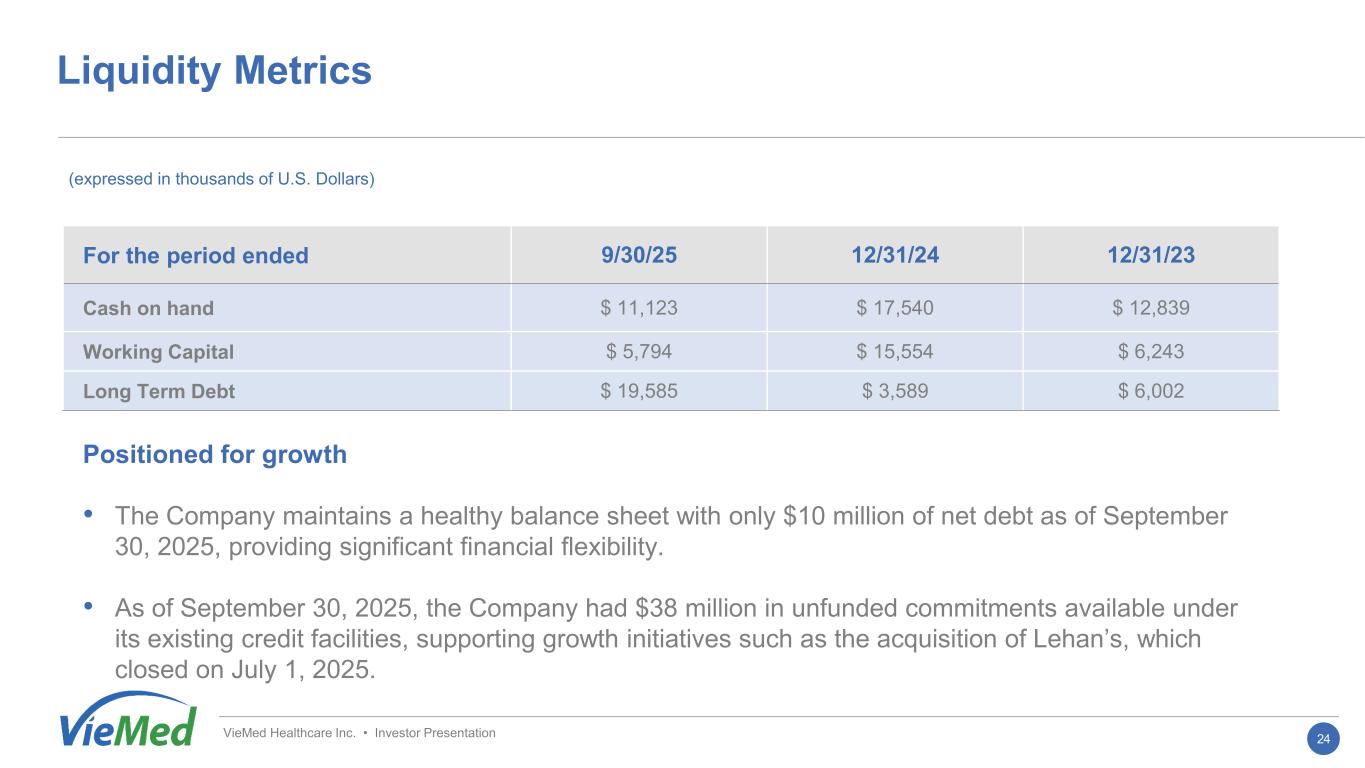
Liquidity Metrics 24 Positioned for growth • The Company maintains a healthy balance sheet with only $10 million of net debt as of September 30, 2025, providing significant financial flexibility. • As of September 30, 2025, the Company had $38 million in unfunded commitments available under its existing credit facilities, supporting growth initiatives such as the acquisition of Lehan’s, which closed on July 1, 2025. For the period ended 9/30/25 12/31/24 12/31/23 Cash on hand $ 11,123 $ 17,540 $ 12,839 Working Capital $ 5,794 $ 15,554 $ 6,243 Long Term Debt $ 19,585 $ 3,589 $ 6,002 VieMed Healthcare Inc. • Investor Presentation (expressed in thousands of U.S. Dollars)
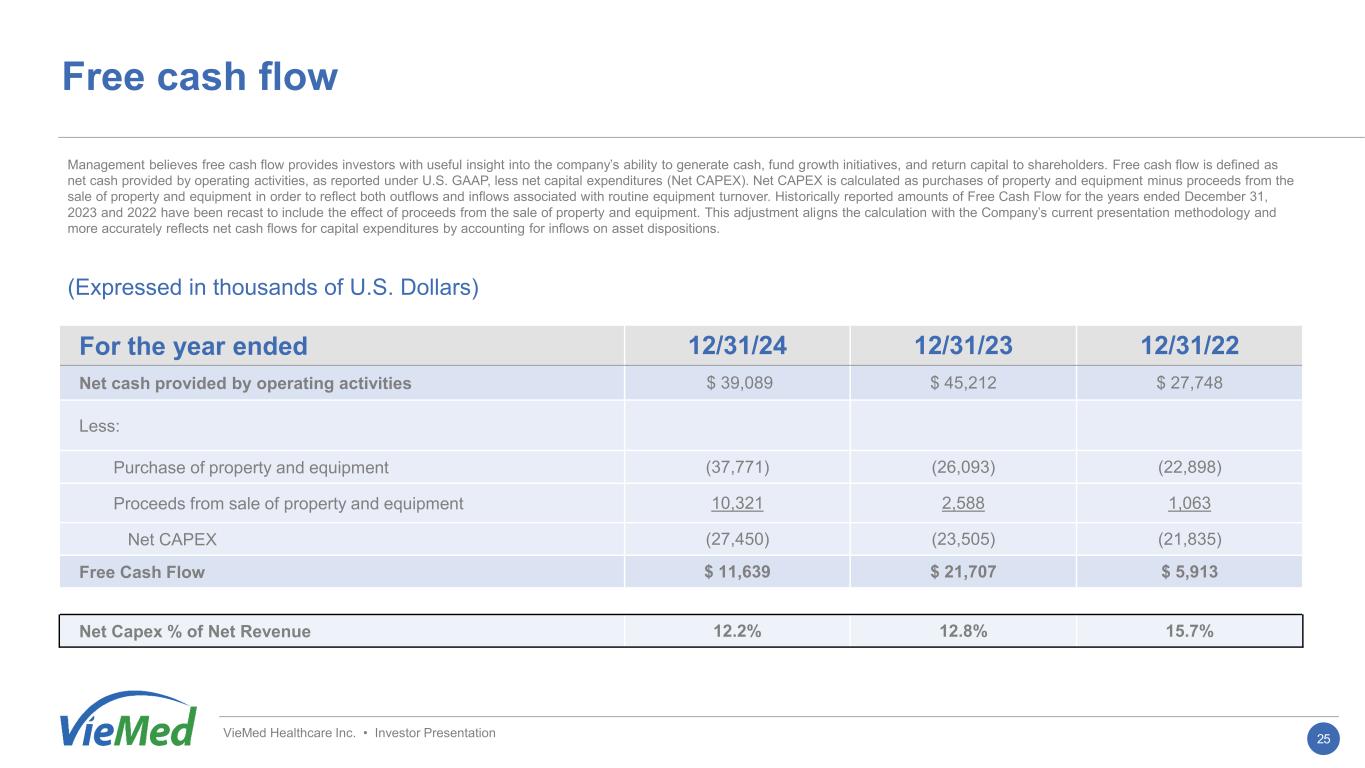
Free cash flow 25 For the year ended 12/31/24 12/31/23 12/31/22 Net cash provided by operating activities $ 39,089 $ 45,212 $ 27,748 Less: Purchase of property and equipment (37,771) (26,093) (22,898) Proceeds from sale of property and equipment 10,321 2,588 1,063 Net CAPEX (27,450) (23,505) (21,835) Free Cash Flow $ 11,639 $ 21,707 $ 5,913 Net Capex % of Net Revenue 12.2% 12.8% 15.7% VieMed Healthcare Inc. • Investor Presentation Management believes free cash flow provides investors with useful insight into the company’s ability to generate cash, fund growth initiatives, and return capital to shareholders. Free cash flow is defined as net cash provided by operating activities, as reported under U.S. GAAP, less net capital expenditures (Net CAPEX). Net CAPEX is calculated as purchases of property and equipment minus proceeds from the sale of property and equipment in order to reflect both outflows and inflows associated with routine equipment turnover. Historically reported amounts of Free Cash Flow for the years ended December 31, 2023 and 2022 have been recast to include the effect of proceeds from the sale of property and equipment. This adjustment aligns the calculation with the Company’s current presentation methodology and more accurately reflects net cash flows for capital expenditures by accounting for inflows on asset dispositions. (Expressed in thousands of U.S. Dollars)
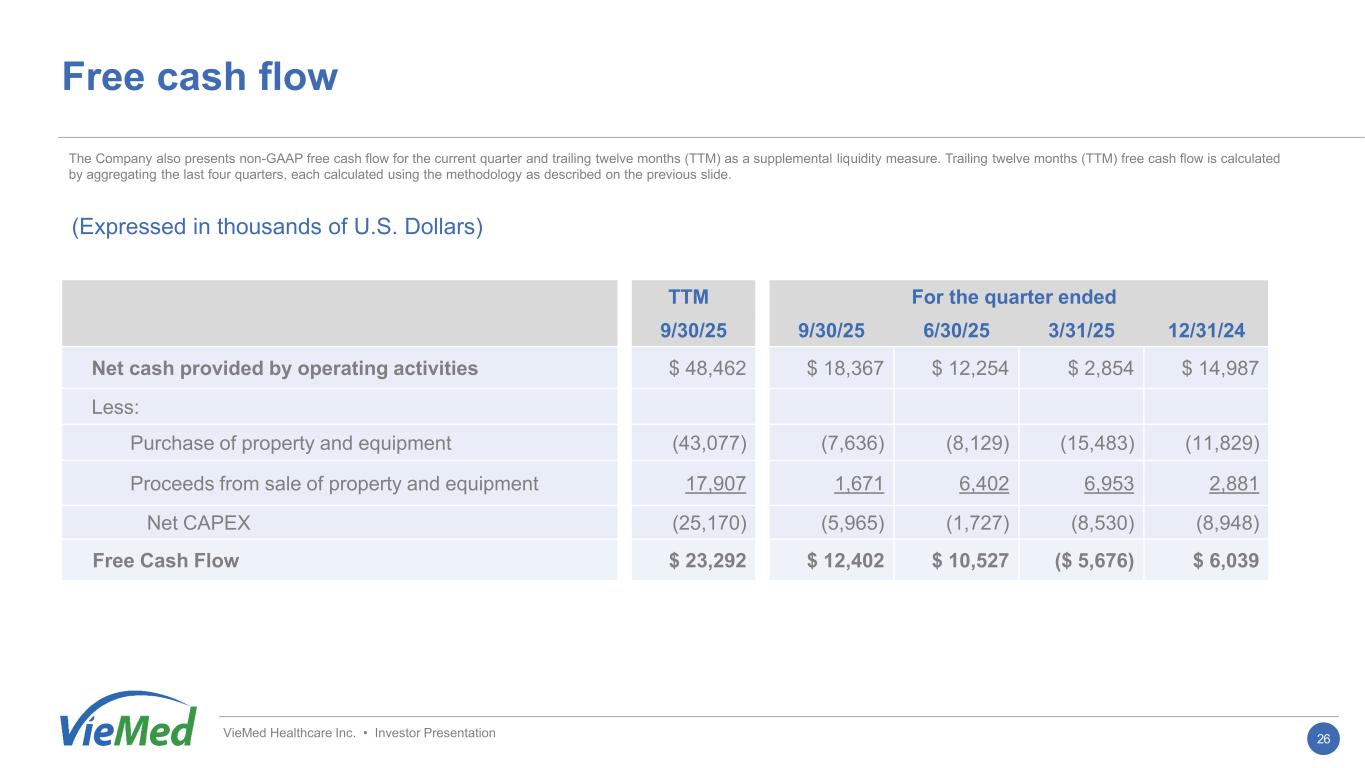
Free cash flow 26 VieMed Healthcare Inc. • Investor Presentation TTM For the quarter ended 9/30/25 9/30/25 6/30/25 3/31/25 12/31/24 Net cash provided by operating activities $ 48,462 $ 18,367 $ 12,254 $ 2,854 $ 14,987 Less: Purchase of property and equipment (43,077) (7,636) (8,129) (15,483) (11,829) Proceeds from sale of property and equipment 17,907 1,671 6,402 6,953 2,881 Net CAPEX (25,170) (5,965) (1,727) (8,530) (8,948) Free Cash Flow $ 23,292 $ 12,402 $ 10,527 ($ 5,676) $ 6,039 (Expressed in thousands of U.S. Dollars) The Company also presents non-GAAP free cash flow for the current quarter and trailing twelve months (TTM) as a supplemental liquidity measure. Trailing twelve months (TTM) free cash flow is calculated by aggregating the last four quarters, each calculated using the methodology as described on the previous slide.
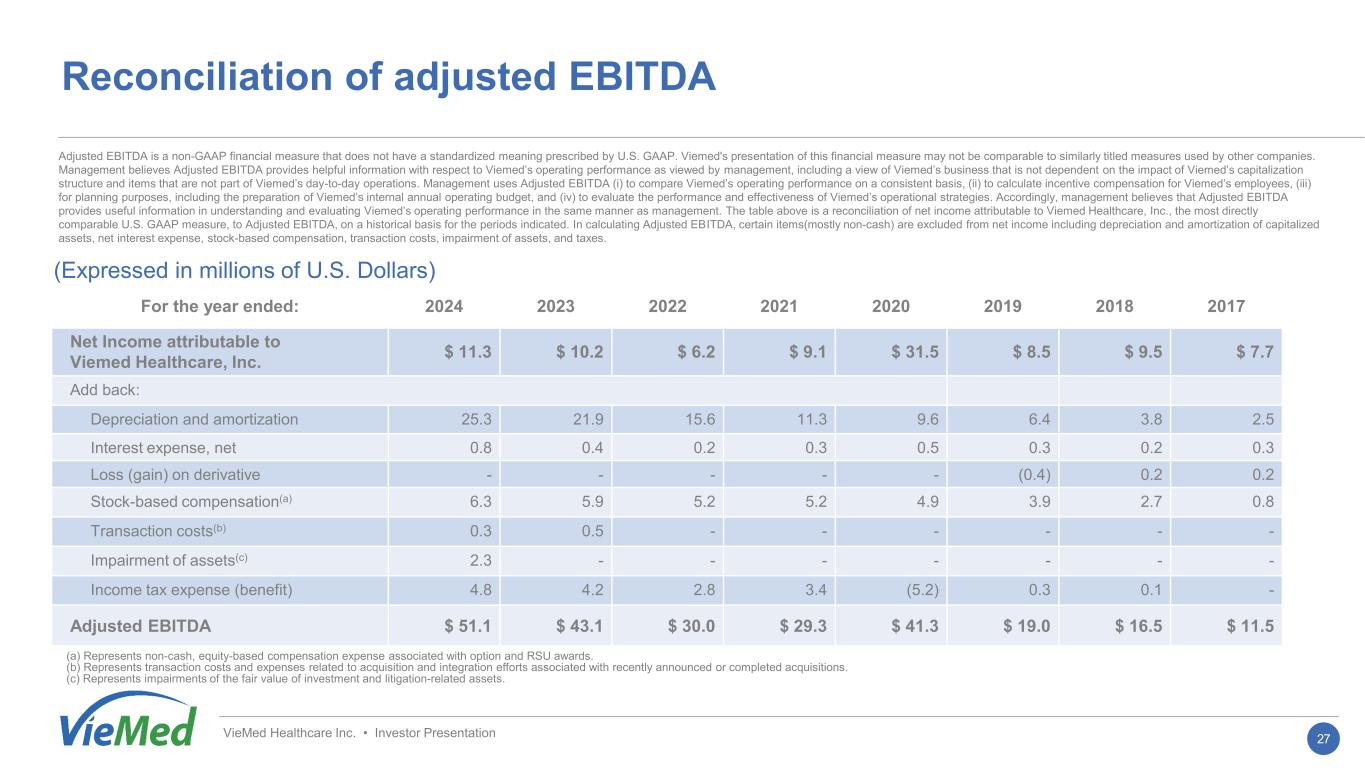
Reconciliation of adjusted EBITDA (a) Represents non-cash, equity-based compensation expense associated with option and RSU awards. (b) Represents transaction costs and expenses related to acquisition and integration efforts associated with recently announced or completed acquisitions. (c) Represents impairments of the fair value of investment and litigation-related assets. (Expressed in millions of U.S. Dollars) For the year ended: 2024 2023 2022 2021 2020 2019 2018 2017 Net Income attributable to Viemed Healthcare, Inc. $ 11.3 $ 10.2 $ 6.2 $ 9.1 $ 31.5 $ 8.5 $ 9.5 $ 7.7 Add back: Depreciation and amortization 25.3 21.9 15.6 11.3 9.6 6.4 3.8 2.5 Interest expense, net 0.8 0.4 0.2 0.3 0.5 0.3 0.2 0.3 Loss (gain) on derivative - - - - - (0.4) 0.2 0.2 Stock-based compensation(a) 6.3 5.9 5.2 5.2 4.9 3.9 2.7 0.8 Transaction costs(b) 0.3 0.5 - - - - - - Impairment of assets(c) 2.3 - - - - - - - Income tax expense (benefit) 4.8 4.2 2.8 3.4 (5.2) 0.3 0.1 - Adjusted EBITDA $ 51.1 $ 43.1 $ 30.0 $ 29.3 $ 41.3 $ 19.0 $ 16.5 $ 11.5 VieMed Healthcare Inc. • Investor Presentation Adjusted EBITDA is a non-GAAP financial measure that does not have a standardized meaning prescribed by U.S. GAAP. Viemed's presentation of this financial measure may not be comparable to similarly titled measures used by other companies. Management believes Adjusted EBITDA provides helpful information with respect to Viemed’s operating performance as viewed by management, including a view of Viemed’s business that is not dependent on the impact of Viemed’s capitalization structure and items that are not part of Viemed’s day-to-day operations. Management uses Adjusted EBITDA (i) to compare Viemed’s operating performance on a consistent basis, (ii) to calculate incentive compensation for Viemed’s employees, (iii) for planning purposes, including the preparation of Viemed’s internal annual operating budget, and (iv) to evaluate the performance and effectiveness of Viemed’s operational strategies. Accordingly, management believes that Adjusted EBITDA provides useful information in understanding and evaluating Viemed’s operating performance in the same manner as management. The table above is a reconciliation of net income attributable to Viemed Healthcare, Inc., the most directly comparable U.S. GAAP measure, to Adjusted EBITDA, on a historical basis for the periods indicated. In calculating Adjusted EBITDA, certain items(mostly non-cash) are excluded from net income including depreciation and amortization of capitalized assets, net interest expense, stock-based compensation, transaction costs, impairment of assets, and taxes. 27
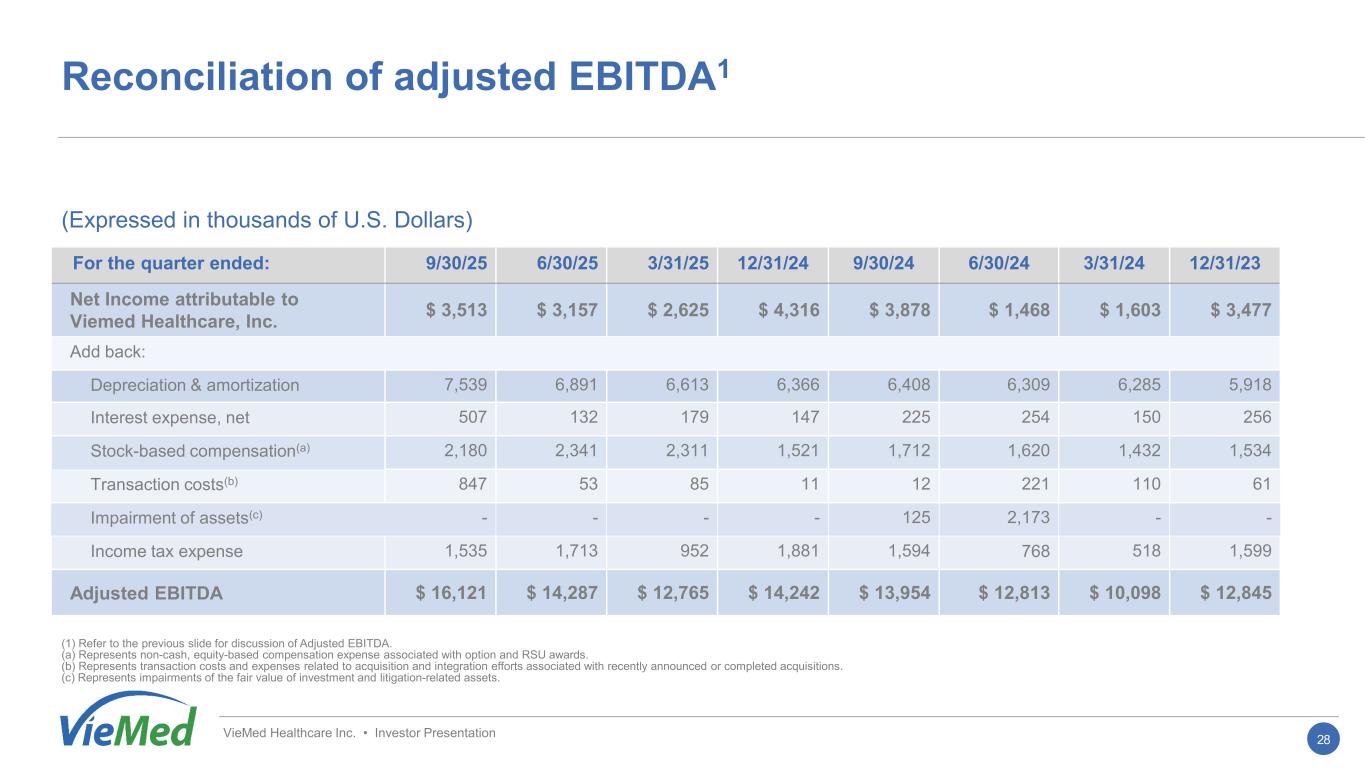
28 (1) Refer to the previous slide for discussion of Adjusted EBITDA. (a) Represents non-cash, equity-based compensation expense associated with option and RSU awards. (b) Represents transaction costs and expenses related to acquisition and integration efforts associated with recently announced or completed acquisitions. (c) Represents impairments of the fair value of investment and litigation-related assets. For the quarter ended: 9/30/25 6/30/25 3/31/25 12/31/24 9/30/24 6/30/24 3/31/24 12/31/23 Net Income attributable to Viemed Healthcare, Inc. $ 3,513 $ 3,157 $ 2,625 $ 4,316 $ 3,878 $ 1,468 $ 1,603 $ 3,477 Add back: Depreciation & amortization 7,539 6,891 6,613 6,366 6,408 6,309 6,285 5,918 Interest expense, net 507 132 179 147 225 254 150 256 Stock-based compensation(a) 2,180 2,341 2,311 1,521 1,712 1,620 1,432 1,534 Transaction costs(b) 847 53 85 11 12 221 110 61 Impairment of assets(c) - - - - 125 2,173 - - Income tax expense 1,535 1,713 952 1,881 1,594 768 518 1,599 Adjusted EBITDA $ 16,121 $ 14,287 $ 12,765 $ 14,242 $ 13,954 $ 12,813 $ 10,098 $ 12,845 VieMed Healthcare Inc. • Investor Presentation (Expressed in thousands of U.S. Dollars) Reconciliation of adjusted EBITDA1
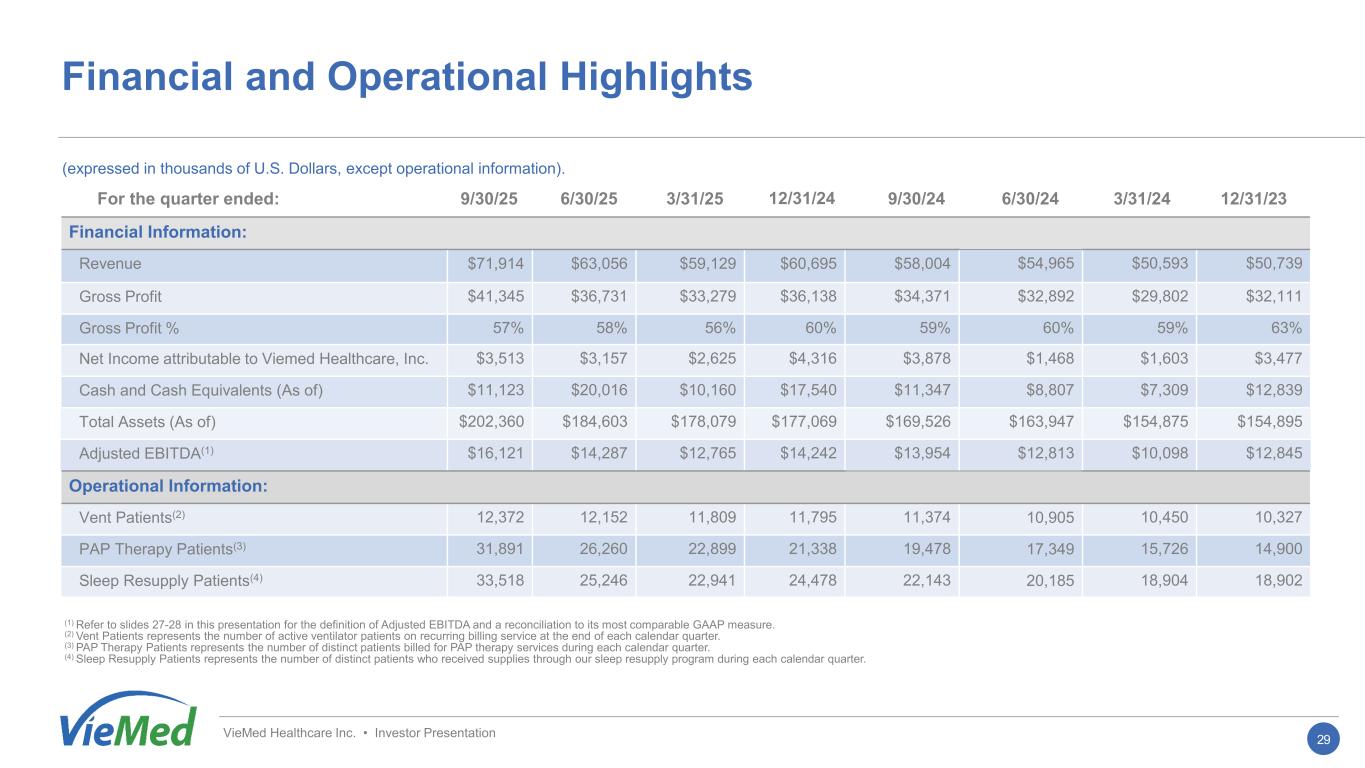
29 VieMed Healthcare Inc. • Investor Presentation Financial and Operational Highlights (expressed in thousands of U.S. Dollars, except operational information). (1) Refer to slides 27-28 in this presentation for the definition of Adjusted EBITDA and a reconciliation to its most comparable GAAP measure. (2) Vent Patients represents the number of active ventilator patients on recurring billing service at the end of each calendar quarter. (3) PAP Therapy Patients represents the number of distinct patients billed for PAP therapy services during each calendar quarter. (4) Sleep Resupply Patients represents the number of distinct patients who received supplies through our sleep resupply program during each calendar quarter. For the quarter ended: 9/30/25 6/30/25 3/31/25 12/31/24 9/30/24 6/30/24 3/31/24 12/31/23 Financial Information: Revenue $71,914 $63,056 $59,129 $60,695 $58,004 $54,965 $50,593 $50,739 Gross Profit $41,345 $36,731 $33,279 $36,138 $34,371 $32,892 $29,802 $32,111 Gross Profit % 57% 58% 56% 60% 59% 60% 59% 63% Net Income attributable to Viemed Healthcare, Inc. $3,513 $3,157 $2,625 $4,316 $3,878 $1,468 $1,603 $3,477 Cash and Cash Equivalents (As of) $11,123 $20,016 $10,160 $17,540 $11,347 $8,807 $7,309 $12,839 Total Assets (As of) $202,360 $184,603 $178,079 $177,069 $169,526 $163,947 $154,875 $154,895 Adjusted EBITDA(1) $16,121 $14,287 $12,765 $14,242 $13,954 $12,813 $10,098 $12,845 Operational Information: Vent Patients(2) 12,372 12,152 11,809 11,795 11,374 10,905 10,450 10,327 PAP Therapy Patients(3) 31,891 26,260 22,899 21,338 19,478 17,349 15,726 14,900 Sleep Resupply Patients(4) 33,518 25,246 22,941 24,478 22,143 20,185 18,904 18,902