.2
© 2026 Garrett Motion Inc.
© 2026 Garrett Motion Inc. Forward - Looking Statements This presentation, as well as statements incorporated by reference herein and related comments by our management, contain for war d - looking statements within the meaning of the U.S. federal securities laws. All statements other than statements of historical fact, including, without limitation, statements regarding our future results of operations and financial position, expectatio ns regarding the growth of the turbocharger and electric vehicle markets and other industry trends, the sufficiency of our cash and cash equivalents, anticipated sources and uses of cash, anticipated investments in our business, our business strategy, pending li tig ation, anticipated interest expense, and the plans and objectives of management for future operations and capital expenditure s, are forward - looking statements. In many cases, you can identify forward - looking statements by terms such as “aim,” “anticipate,” “appears,” “approximately,” “believe,” “continue,” “could,” “designed,” “effect,” “estimate,” “evaluate,” “expect,” “forecast ,” “goal,” “initiative,” “intend,” “may,” “objective,” “outlook,” “plan,” “potential,” “priorities,” “project,” “pursue,” “seek,” “shoul d,” “target,” “when,” “will,” “would,” or the negative of these terms or other similar expressions. In making these forward - looking statements, we rely on our current expectations and projections about possible future events and financial trends that we believe may affect our bus iness, financial condition and results of operations. We believe these judgments are reasonable, but these statements are not guarantees of any future events or financial results, and our actual results may differ materially due to a variety of import ant factors, many of which are beyond our control. These factors include, among other things, risks related to the evolving autom ot ive industry generally; our strategy and growth prospects; macroeconomic and geopolitical uncertainty; recruitment, development, and retention of qualified personnel; our supply chain; economic, political, regulatory, foreign exchange and other risks of our international operations; protection of our intellectual property rights; warranty claims, product recalls, field actions or pro duct liability actions; environmental matters and liabilities; information technology and data privacy, including cybersecuri ty and other security concerns; and our capital structure. For a further discussion of these and other risks, refer to Part I, Item 1A. “R isk Factors” of our Annual Report on Form 10 - K (the “Form 10 - K”) and subsequent documents that we file with the U.S. Securities and Exchange Commission (“SEC”) from time - to - time. You should read the Form 10 - K and the documents that we reference therein complet ely and with the understanding that our actual future results may be materially different from those envisioned by these forward - looking statements. We qualify all of our forward - looking statements by this cautionary language. These forward - looking statements speak only as of the date of this document. Except as required by applicable law, we do not plan to publicly updat e o r revise any forward - looking statements contained herein, whether as a result of any new information, future events, changed circu mstances or otherwise. In particular, certain forward - looking statements included in this presentation include, without limitati on, financial projections, budgets, forecasts, and other estimates with respect to the anticipated performance of Garrett, includ ing future sales and growth projections (collectively, the “Projections”). The Projections include statements regarding the inten t, belief, or current expectations of Garrett and members of its management team, as well as the assumptions on which such statements ar e b ased. While presented with numeric specificity, the Projections have been prepared in good faith based upon assumptions that we believe to be reasonable as of the date of this presentation, it being understood that ( i ) the Projections are as to future events and are not to be viewed as facts, (ii) the Projections are subject to significant unc ertainties and contingencies, many of which are beyond our control, and (iii) no assurance can be given that any particular Projections will be realized and that a ctu al results during the period or periods covered by any such Projections may differ significantly from the projected results a nd such differences may be material. The Projections reflect both assumptions as to certain business decisions that are subject to ch ang e and, in many respects, subjective judgment, and thus are susceptible to multiple interpretations and periodic revisions bas ed on actual experience and business developments. In addition, the Projections were not prepared in accordance with generally acce pte d accounting principles in the United States ("GAAP") or any other applicable accounting principles. Further, since certain o f the Projections cover multiple years, such information by its nature becomes more speculative with each successive year. Each vi ewer of this presentation should carry out its own due diligence in connection with the assumptions contained herein. Non - GAAP Financial Measures This presentation includes the following Non - GAAP financial measures which are not calculated in accordance with GAAP: EBIT, Adj usted EBIT, Adjusted EBIT margin, Adjusted EBITDA, Adjusted EBITDA margin, Net Leverage Ratio, Adjusted free cash flow, Adjusted free cash flow conversion, Adjusted free cash flow yield, Consolidated EBITDA, Enterprise value to Adjusted EB IT, and Enterprise value to Adjusted EBITDA. The Non - GAAP financial measures provided herein are adjusted for certain items as presented in the Appendix and may not be directly comparable to similar measures used by other companies in our industry, as oth er companies may define such measures differently. Management believes that, when considered together with reported amounts, these measures are useful to investors and management in understanding our ongoing operations and analysis of ongoin g o perating trends. Garrett believes that the Non - GAAP measures presented herein are important indicators of operating performance because they exclude the effects of certain items, therefore making them more closely reflect our operational per for mance. These metrics should be considered in addition to, and not as replacements for, the most comparable GAAP measure. For additional information with respect to our Non - GAAP financial measures, see the Appendix to this presentation and our Form 1 0 - K. Certain guidance and projections provided herein are presented on a non - GAAP basis. Garrett does not provide reconciliations of such forward - looking non - GAAP measures to GAAP measures due to the inability to predict the amount and timing of impacts outside of our control on certain items, such as non - cash gains or losses resulting from mark - to - market adjustments of derivative instruments, among others, which could be material. Reconciling such items would require unreasonab le effort. Industry Information Market data and industry information used throughout this presentation are based on management's knowledge of the industry an d t he good faith estimates of management. Management also relied, to the extent available, upon management's review of independent industry surveys, publications, public documents of our competitors, and other publicly available information pre par ed by a number of third - party sources. All of the market data and industry and competitor information used in this presentation involves a number of assumptions and limitations, and you are cautioned not to give undue weight to such estimates. Although we believe that these sources are reliable, we cannot guarantee the accuracy or completeness of this information, and we have not independently verified this information. While we believe the estimated market position, market opportunity and market si ze information included in this presentation are generally reliable, such information, which is derived in part from management' s estimates and beliefs, is inherently uncertain and imprecise. No representations or warranties are made by Garrett or any of its affiliates as to the accuracy of any such statements or projections. Projections, assumptions, and estimates of our future performance and the future performance of the industry in which we operate are necessarily subject to a high degree of uncert ain ty and risk due to a variety of factors, including those described above. These and other factors could cause results to diff er materially from those expressed in our estimates and beliefs and in the estimates prepared by independent parties. Past Performance Past performance is not a reliable indicator of future results and should not be relied upon for any reason. 2
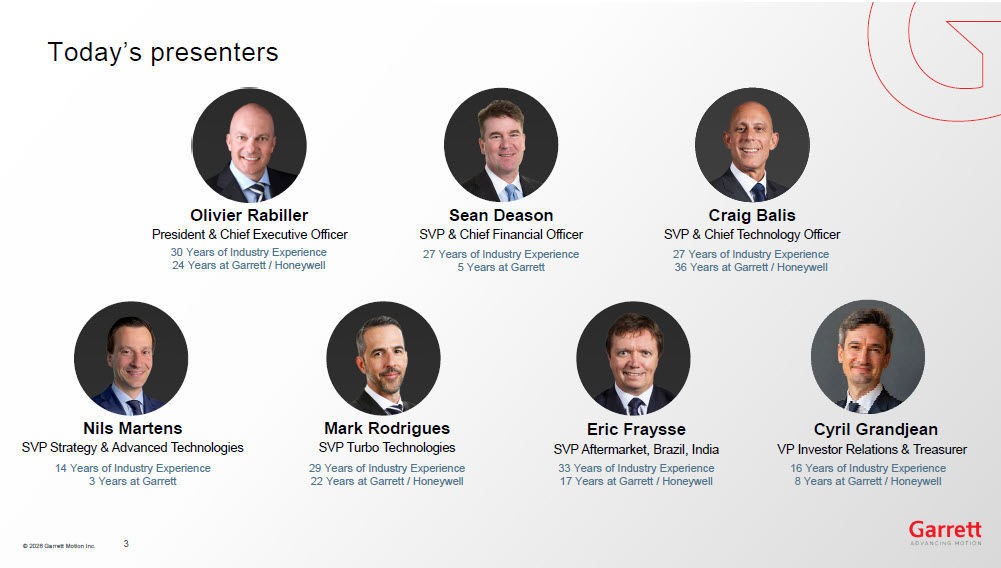
© 2026 Garrett Motion Inc. Today’s presenters President & Chief Executive Officer SVP & Chief Financial Officer SVP & Chief Technology Officer SVP Strategy & Advanced Technologies SVP Turbo Technologies SVP Aftermarket, Brazil, India Olivier Rabiller Sean Deason Craig Balis Nils Martens Mark Rodrigues Eric Fraysse 30 Years of Industry Experience 24 Years at Garrett / Honeywell 27 Years of Industry Experience 5 Years at Garrett 27 Years of Industry Experience 36 Years at Garrett / Honeywell 14 Years of Industry Experience 3 Years at Garrett 29 Years of Industry Experience 22 Years at Garrett / Honeywell 33 Years of Industry Experience 17 Years at Garrett / Honeywell VP Investor Relations & Treasurer Cyril Grandjean 16 Years of Industry Experience 8 Years at Garrett / Honeywell 3
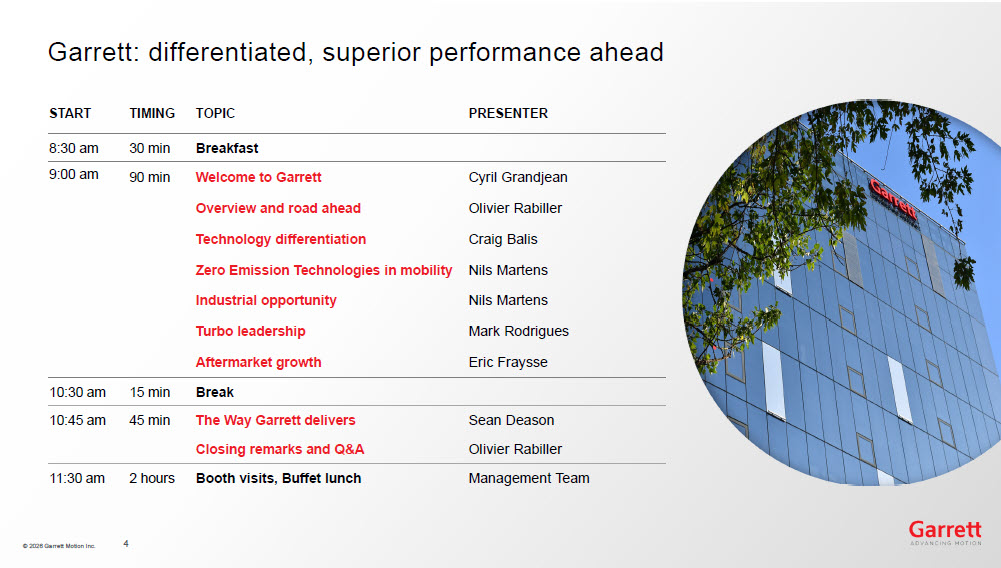
© 2026 Garrett Motion Inc. Garrett: differentiated, superior performance ahead PRESENTER TOPIC TIMING START Breakfast 30 min 8: 30 am Cyril Grandjean Welcome to Garrett 90 min 9:00 am Olivier Rabiller Overview and road ahead Craig Balis Technology differentiation Nils Martens Zero Emission Technologies in mobility Nils Martens Industrial opportunity Mark Rodrigues Turbo leadership Eric Fraysse Aftermarket growth Break 15 min 1 0 : 3 0 am Sean Deason The Way Garrett delivers 45 min 10:45 am Olivier Rabiller Closing r emarks and Q&A Management Team Booth visits, Buffet lunch 2 hours 1 1:30 a m 4

© 2026 Garrett Motion Inc. Olivier Rabiller Overview and road ahead
© 2026 Garrett Motion Inc. Garrett Mission © 2026 Garrett Motion Inc.
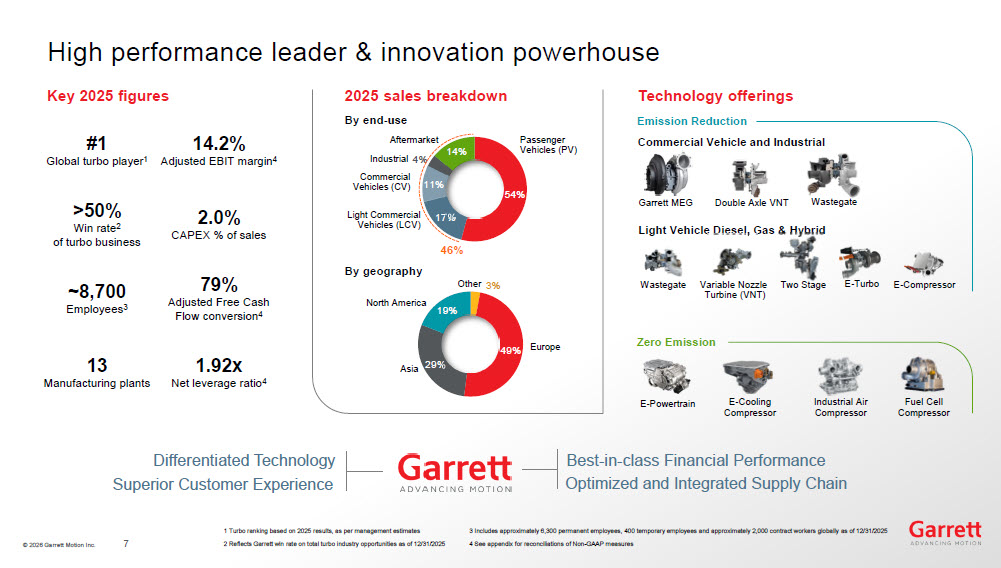
© 2026 Garrett Motion Inc. High performance leader & innovation powerhouse Key 2025 figures #1 Global turbo player 1 >50% Win rate 2 of turbo business ~8,700 Employees 3 14.2% Adjusted EBIT margin 4 79% Adjusted Free Cash Flow conversion 4 1.92x Net leverage ratio 4 2.0% CAPEX % of sales 13 Manufacturing p lants 1 Turbo ranking based on 2025 results, as per management estimates 2 Reflects Garrett win rate on total turbo industry opportunities as of 12/31/2025 3 Includes approximately 6,300 permanent employees, 400 temporary employees and approximately 2,000 contract workers globally a s o f 12/31/2025 4 See appendix for reconciliations of Non - GAAP measures 2025 sales breakdown By geography By e nd - use 49% 29% 19% 3% Other Europe Asia North America Technology offerings Light Vehicle Diesel, Gas & Hybrid Two Stage Variable Nozzle Turbine (VNT) Wastegate E - Turbo E - Compressor Commercial Vehicle and Industrial Double Axle VNT Garrett MEG Wastegate E - Cooling Compressor Fuel Cell Compressor E - Powertrain Industrial Air Compressor Zero Emission Emission Reduction 54% 17% 11% 14% 4% Passenger Vehicles (PV) Light Commercial Vehicles (LCV) Commercial Vehicles (CV) Industrial Aftermarket Differentiated Technology Superior Customer Experience Optimized and Integrated Supply Chain Best - in - class Financial Performance 4 6% 7
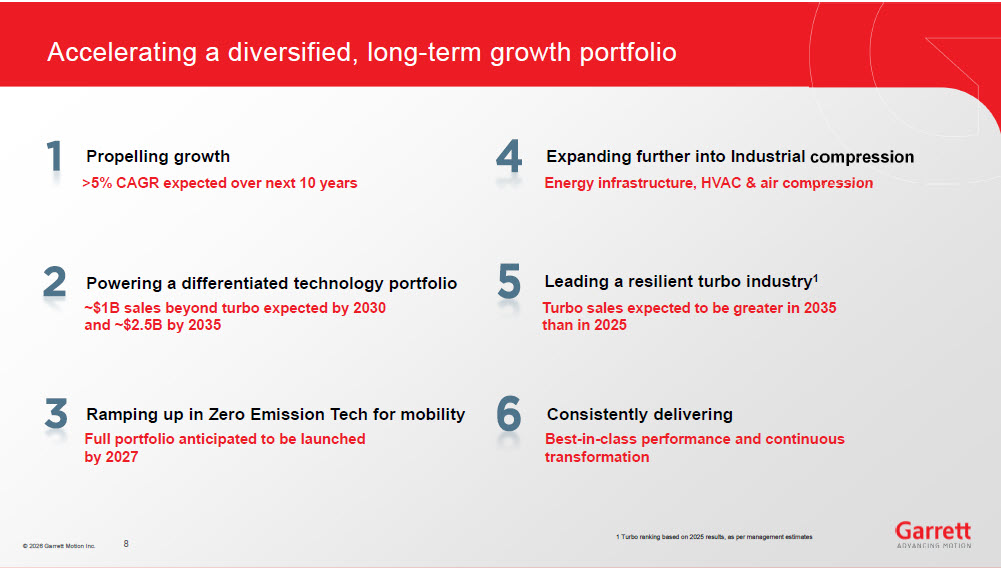
© 2026 Garrett Motion Inc. Accelerating a diversified, long - term growth portfolio Leading a resilient turbo industry 1 Ramping up in Zero Emission Tech for mobility Powering a differentiated technology portfolio Propelling growth Consistently delivering ~$1B s ales beyond t urbo expected by 2030 and ~$ 2.5 B by 2 03 5 >5% CAGR expected over next 10 years Full portfolio anticipated to be launched by 2027 Energy infrastructure, HVAC & air compression Turbo sales expected to be greater in 2035 than in 2025 Best - in - class performance and continuous transformation 1 Turbo ranking based on 2025 results, as per management estimates 8 Expanding further into Industrial compression © 2026 Garrett Motion Inc.
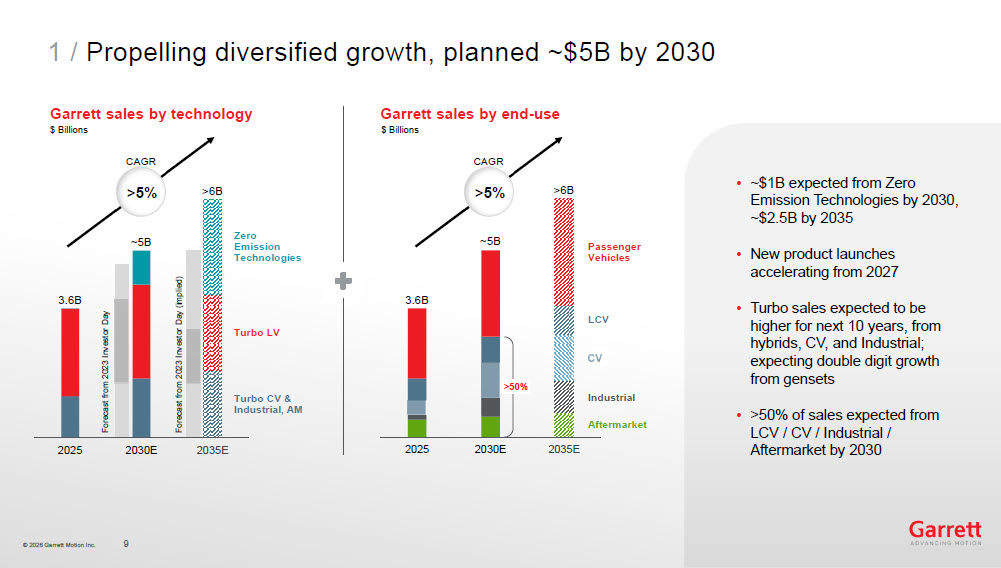
© 2026 Garrett Motion Inc. • ~ $1 B expected from Zero Emission Technologies by 2030, ~ $2.5 B by 2035 • New product launches accelerating from 2027 • Turbo sales expected to be higher for next 10 years , from hybrids, CV, and Industrial ; expecting double digit growth from gensets • >50% of sales expected from LCV / CV / Industrial / Aftermarket by 2030 Garrett sales by technology Garrett sales by end - use $ Billions $ Billions 1 / Propelling diversified growth , planned ~$5B by 2030 2025 2030 E 2035 E Passenger Vehicles LCV Industrial Aftermarket 3.6 B ~ 5 B >6 B Forecast from 2023 Investor Day Forecast from 2023 Investor Day (implied) 2025 2030 E 2035 E Turbo CV & Industrial, AM Turbo LV Zero Emission Technologies 3.6B ~ 5 B >6 B >5% >50 % >5% 9 CAGR CAGR
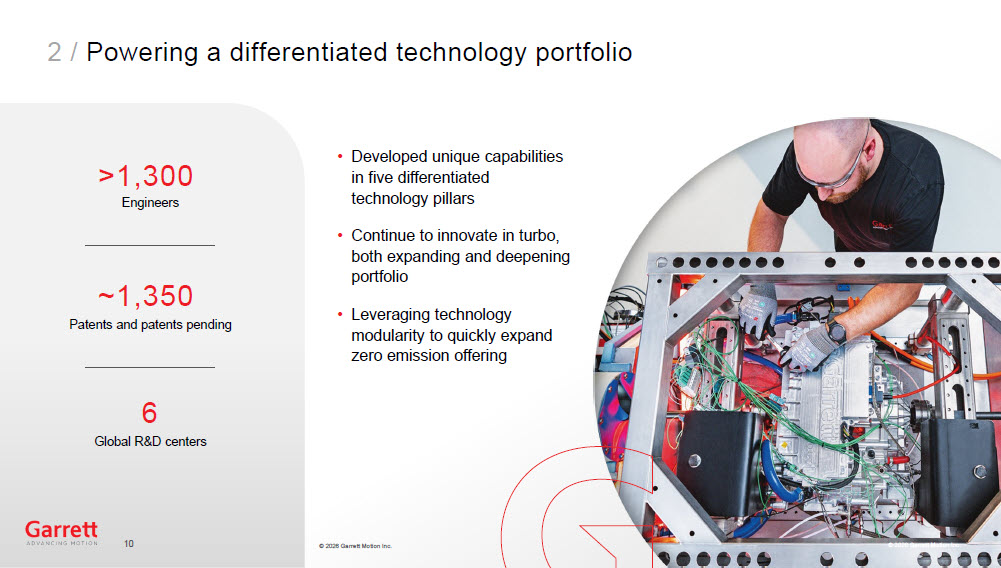
© 2026 Garrett Motion Inc. >1,300 Engineers ~1,350 Patents and patents pending Global R&D centers 6 • Develop ed unique capabilities in five differentiated technology pillars • Continue to innovate in turbo, both expanding and deepening portfolio • Leveraging technology modularity to quickly expand zero emission offering 2 / Powering a differentiated technology portfolio 10 © 2026 Garrett Motion Inc. © 2026 Garrett Motion Inc.
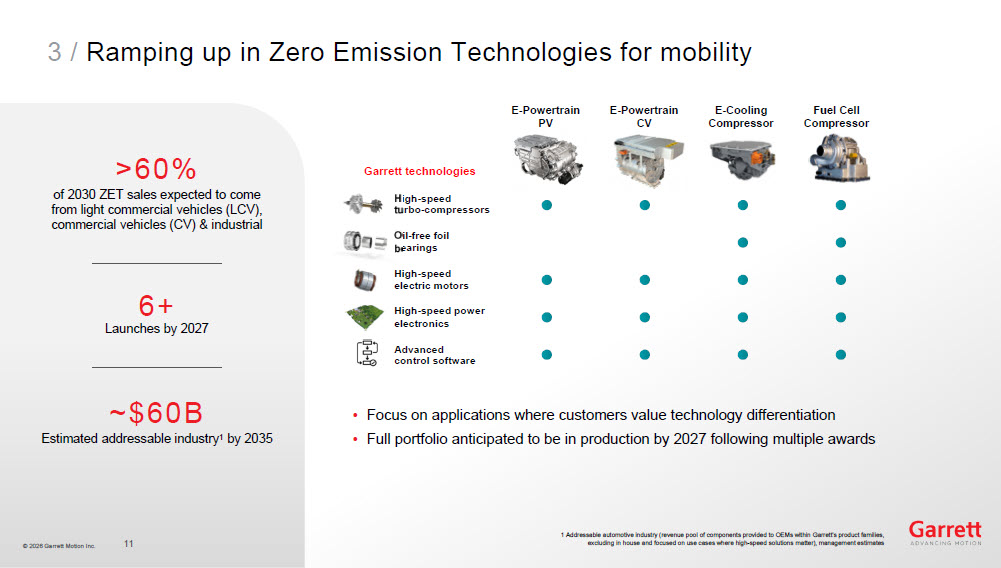
© 2026 Garrett Motion Inc. > 6 0% of 2030 ZET sales expected to come from light commercial vehicles (LCV), commercial vehicles (CV) & industrial 6+ Launches by 2027 Estimated addressable industry 1 by 2035 ~$ 60 B • Focus on applications where customers value technology differentiation • Full portfolio anticipated to be in production by 2027 following multiple awards 3 / Ramping up in Zero Emission Technologies for mobility 1 Addressable automotive industry (revenue pool of components provided to OEMs within Garrett’s product families, excluding in house and focused on use cases where high - speed solutions matter), management estimates E - Powertrain PV E - Powertrain CV E - Cooling Compressor Fuel Cell Compressor Oil - free foil bearings High - speed electric motors High - speed power electronics Advanced control software High - speed turbo - compressors Garrett technologies 11
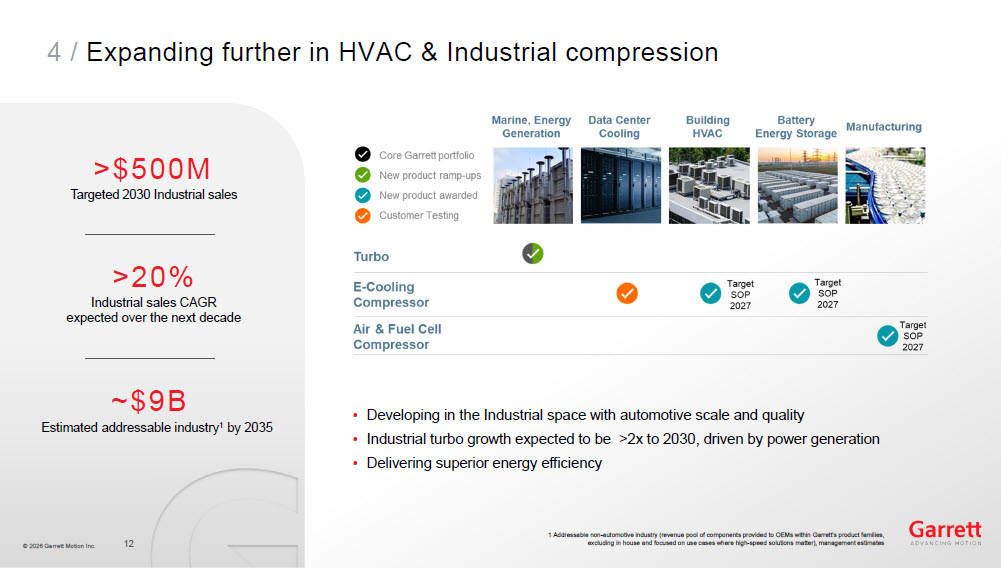
© 2026 Garrett Motion Inc. >$500M Targeted 2030 Industrial sales > 2 0 % Industrial sales CAGR expected over the next decade Estimated addressable industry 1 by 2035 ~$9B • Developing in the Industrial space with automotive scale and quality • Industrial turbo growth expected to be >2x to 2030, driven by power generation • Delivering superior energy efficiency 4 / Expanding further in HVAC & Industrial compression 1 Addressable non - automotive industry (revenue pool of components provided to OEMs within Garrett’s product families, excluding in house and focused on use cases where high - speed solutions matter), management estimates 12
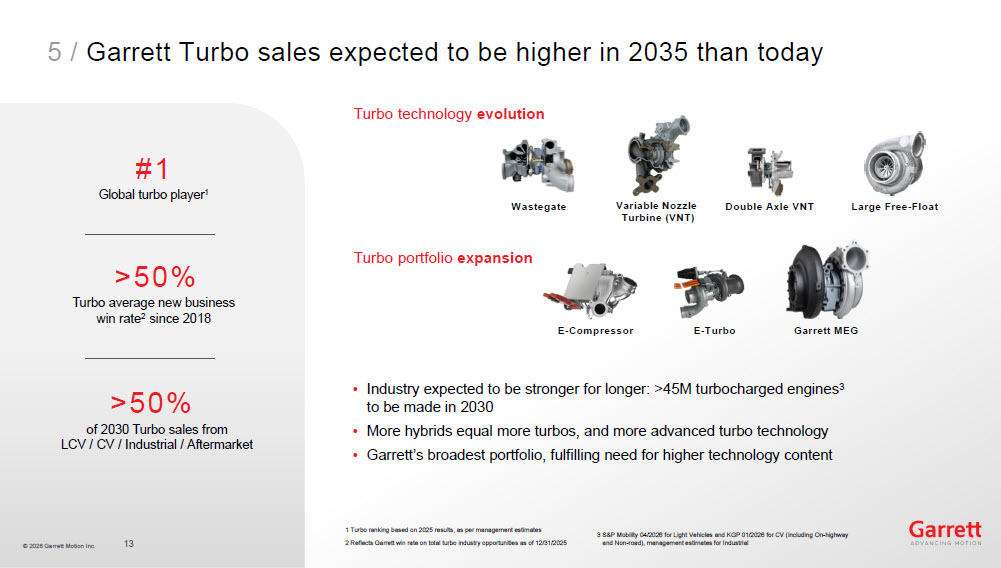
© 2026 Garrett Motion Inc. #1 Global turbo player 1 >50% Turbo average new business win rate 2 since 2018 of 2030 Turbo sales from LCV / CV / Industrial / Aftermarket >50% • Industry expected to be stronger for longer: >45M turbocharged engines 3 to be made in 2030 • More hybrids equal more turbos, and more advanced turbo technology • Garrett’s broadest portfolio, fulfilling need for higher technology content 5 / Garrett Turbo sales expected to be higher in 2035 than today 1 Turbo ranking based on 2025 results, as per management estimates 2 Reflects Garrett win rate on total turbo industry opportunities as of 12/31/2025 3 S&P Mobility 04/2026 for Light Vehicles and KGP 01/2026 for CV (including On - highway and Non - road), management estimates for Industrial Turbo technology evolution Wastegate E - Turbo Variable Nozzle Turbine (VNT) E - Compressor Turbo portfolio expansion Large Free - Float Double Axle VNT Garrett MEG 13
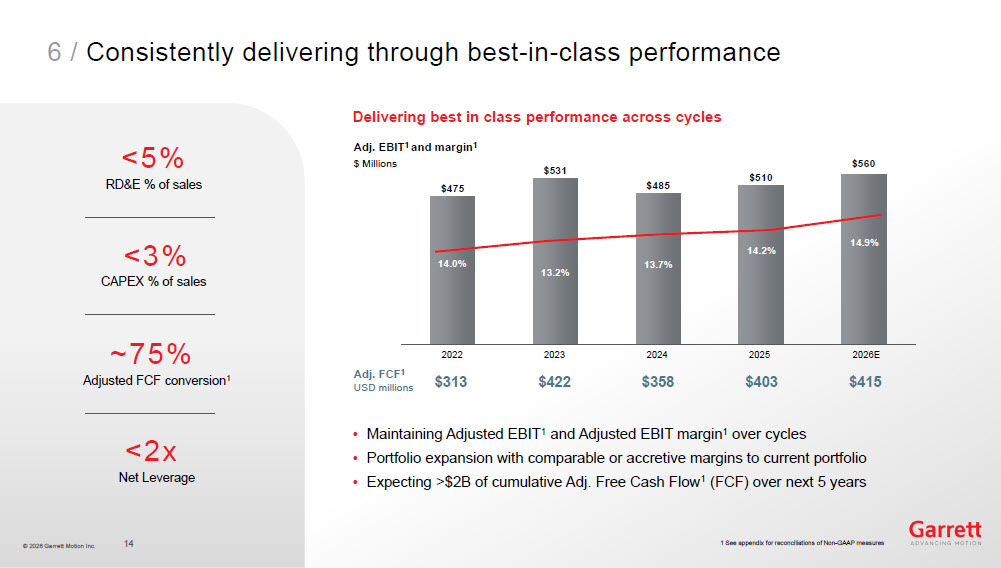
© 2026 Garrett Motion Inc. 6 / Consistently delivering through best - in - class performance • Maintaining Adjusted EBIT 1 and Adjusted EBIT margin 1 over cycles • Portfolio expansion with comparable or accretive margins to current portfolio • Expecting >$2B of cumulative Adj. Free Cash Flow 1 (FCF) over next 5 years Delivering best in class performance across cycles Adj. EBIT 1 and margin 1 $ Millions $475 $531 $485 $510 $560 2022 2023 2024 2025 2026E 14.0% 13.2% 13.7% 14.0% 14.2% 14.9% 1 See appendix for reconciliations of Non - GAAP measures <5% RD&E % of sales <3% CAPEX % of sales Adjusted FCF conversion 1 ~75% Net Leverage <2x Adj. FCF 1 USD millions $313 $422 $358 $403 $415 14
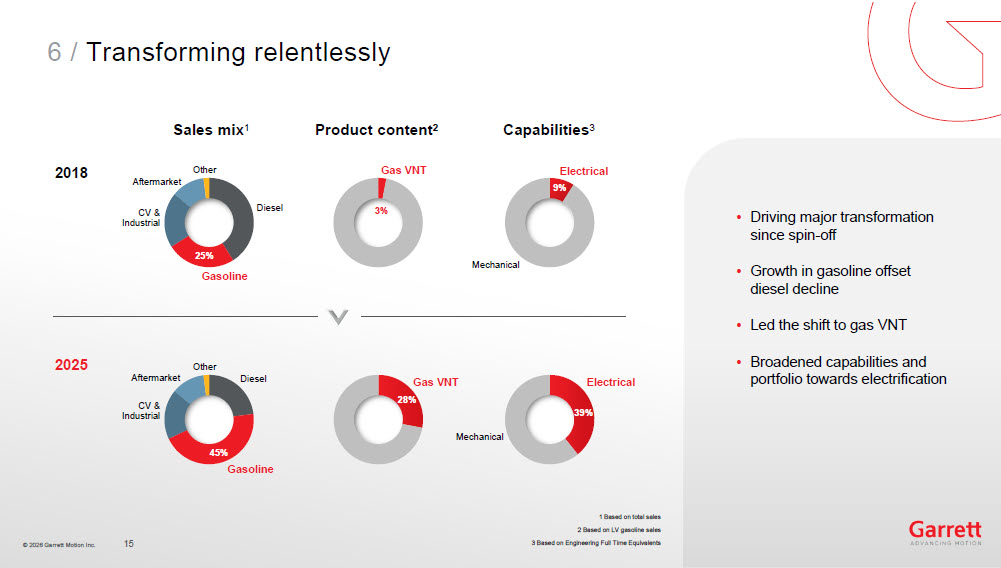
© 2026 Garrett Motion Inc. • Driving major transformation since spin - off • Growth in gasoline offset diesel decline • Led the shift to gas VNT • Broadened capabilities and portfolio towards electrification 6 / Transforming relentlessly Sales mix 1 Product content 2 Capabilities 3 1 Based on total sales 2 Based on LV gasoline sales 3 Based on Engineering Full Time Equivalents 2018 25% Diesel CV & Industrial Aftermarket Other Gasoline 3% Gas VNT 9% Mechanical Electrical 2025 45% Diesel CV & Industrial Aftermarket Other Gasoline 39% Mechanical Electrical 28% Gas VNT 15

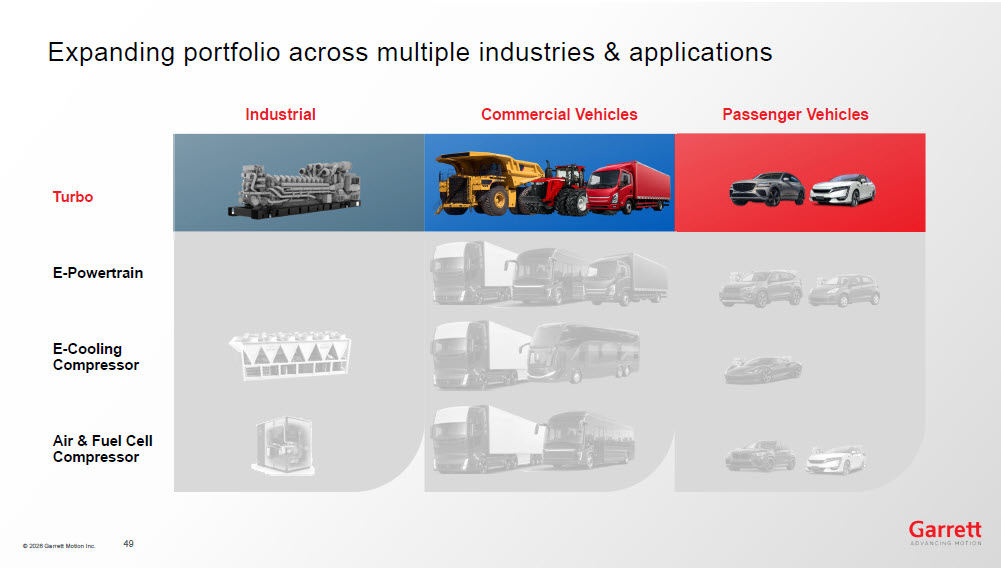
© 2026 Garrett Motion Inc. Expanding portfolio across multiple industries & applications E - Powertrain E - Cooling Compressor Air & Fuel Cell Compressor Turbo Industrial Commercial Vehicles Passenger Vehicles 16
© 2026 Garrett Motion Inc. Craig Balis Technology differentiation
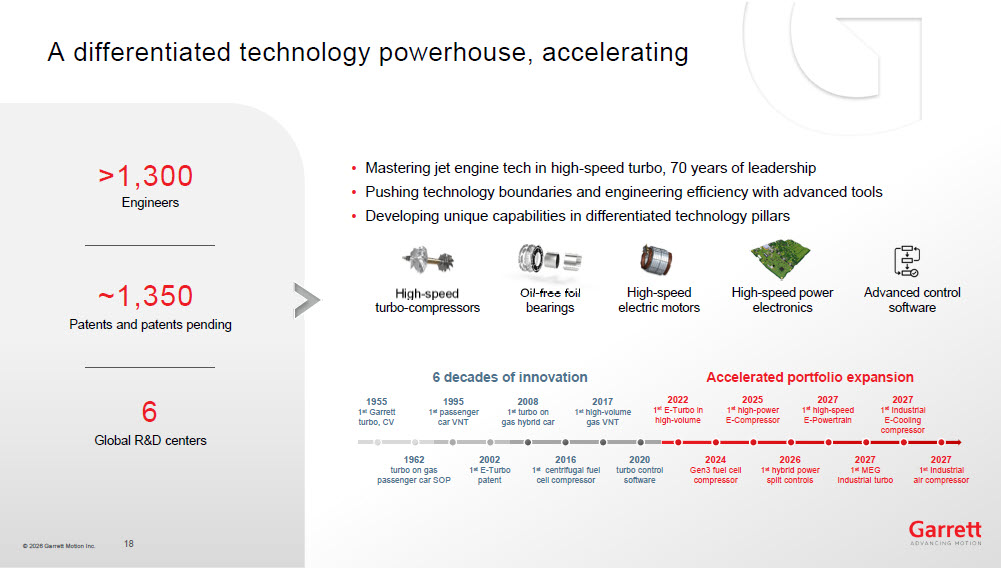
© 2026 Garrett Motion Inc. • Mastering jet engine tech in high - speed turbo, 70 years of leadership • Pushing technology boundaries and engineering efficiency with advanced tools • Developing unique capabilities in differentiated technology pillars A differentiated technology powerhouse, accelerating 18 >1,300 Engineers ~1,350 Patents and patents pending Global R&D centers 6 High - speed turbo - compressors Oil - free foil bearings Advanced control software High - speed electric motors High - speed power electronics 1962 turbo on gas passenger car SOP 2002 1 st E - Turbo patent 2016 1 st centrifugal fuel cell compressor 2020 turbo control software 2027 1 st MEG Industrial turbo 202 7 1 st Industrial air compressor 2026 1 st hybrid power split controls 2024 Gen3 fuel cell compressor 1955 1 st Garrett turbo, CV 2008 1 st turbo on gas hybrid car 2017 1 st high - volume gas VNT 2022 1 st E - Turbo in high - volume 2025 1 st high - power E - Compressor 2027 1 st high - speed E - Powertrain 2027 1 st Industrial E - Cooling compressor 1995 1 st passenger car VNT 6 decades of innovation Accelerated portfolio expansion
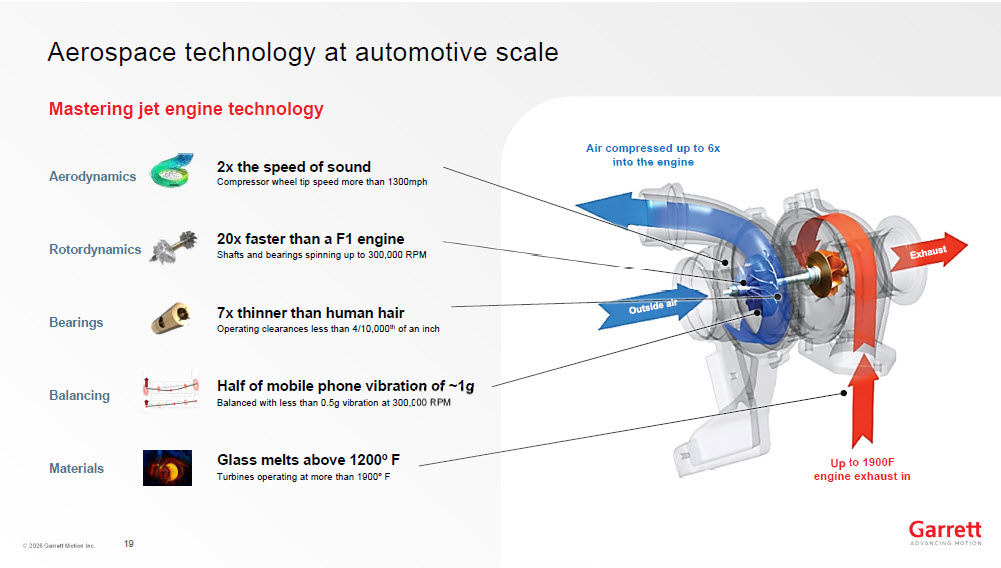
© 2026 Garrett Motion Inc. Mastering jet engine technology Aerospace technology at automotive scale 19 Rotordynamics Materials Bearings Aerodynamics Balancing Compressor wheel tip speed more than 1300mph 2x the speed of sound Shafts and bearings spinning up to 300,000 RPM 20x faster than a F1 engine Turbines operating at more than 1900º F Glass melts above 1200 º F Operating clearances less than 4/10,000 th of an inch 7x thinner than human hair Balanced with less than 0.5g vibration at 300,000 RPM Half of mobile phone vibration of ~1g Air compressed up to 6x into the engine Up to 1900F engine exhaust in
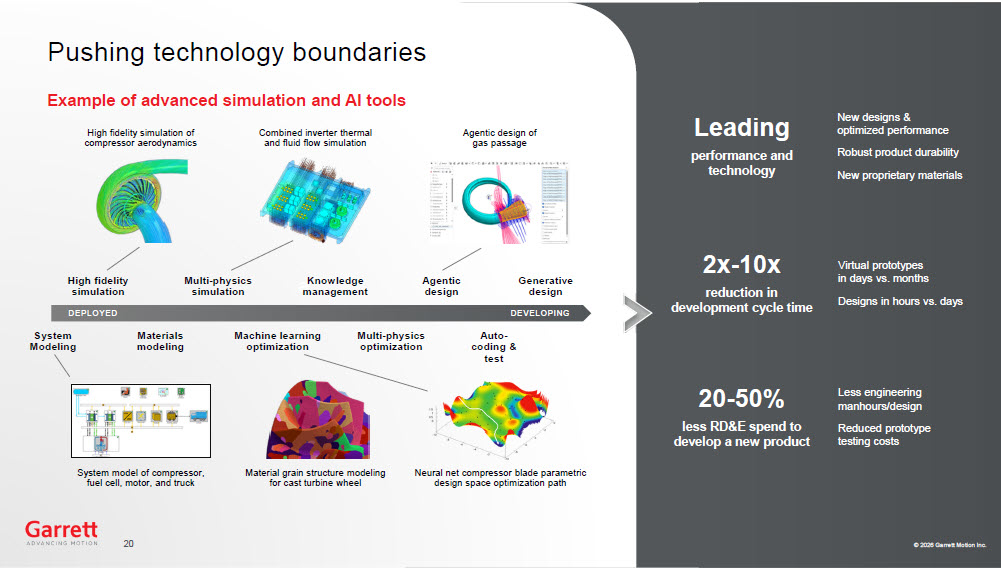
© 2026 Garrett Motion Inc. a © 2026 Garrett Motion Inc. Pushing technology boundaries Example of advanced simulation and AI tools High fidelity simulation of compressor aerodynamics Agentic design of gas passage Combined inverter thermal and fluid flow simulation DEPLOYED DEVELOPING Machine learning optimization Auto - coding & test Multi - physics optimization System Modeling Materials modeling Generative design Agentic design Multi - physics simulation High fidelity simulation Knowledge management System model of compressor, fuel cell, motor, and truck Neural net compressor blade parametric design space optimization path Material grain structure modeling for cast turbine wheel Virtual prototypes in days vs. months Designs in hours vs. days 2x - 10x reduction in development cycle time Leading performance and technology New designs & optimized performance Robust product durability New proprietary materials 20 - 50% less RD&E spend to develop a new product Less engineering manhours/design Reduced prototype testing costs 20
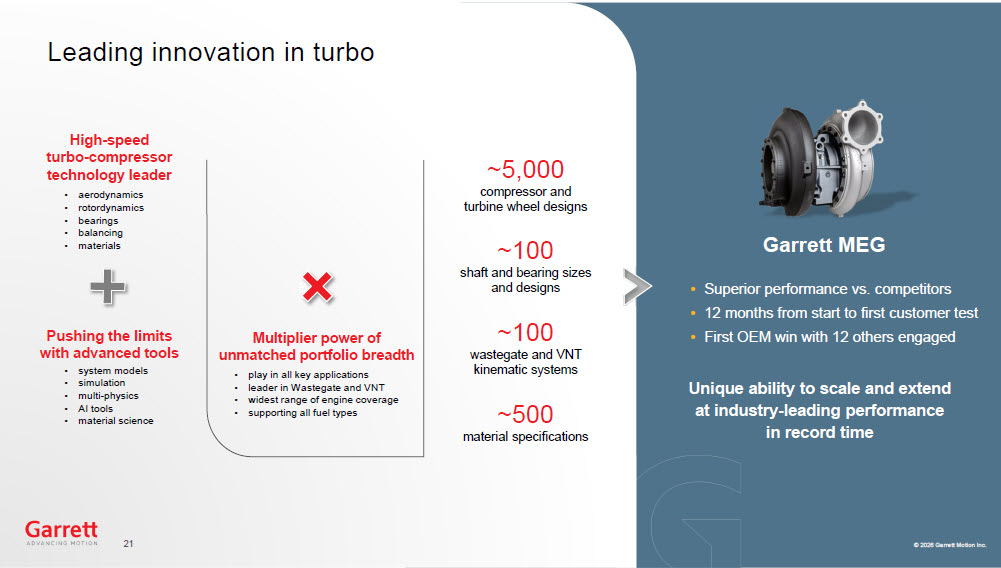
© 2026 Garrett Motion Inc. a © 2026 Garrett Motion Inc. Unique ability to scale and extend at industry - leading performance in record time ~5,000 compressor and turbine wheel designs ~100 shaft and bearing sizes and designs ~100 wastegate and VNT kinematic systems ~500 material specifications Leading innovation in turbo • Superior performance vs. competitors • 12 months from start to first customer test • First OEM win with 12 others engaged High - speed turbo - compressor technology leader • aerodynamics • rotordynamics • bearings • balancing • materials Pushing the limits with advanced tools • system models • simulation • multi - physics • AI tools • material science Multiplier power of unmatched portfolio breadth • play in all key applications • leader in Wastegate and VNT • widest range of engine coverage • supporting all fuel types 21 Garrett MEG
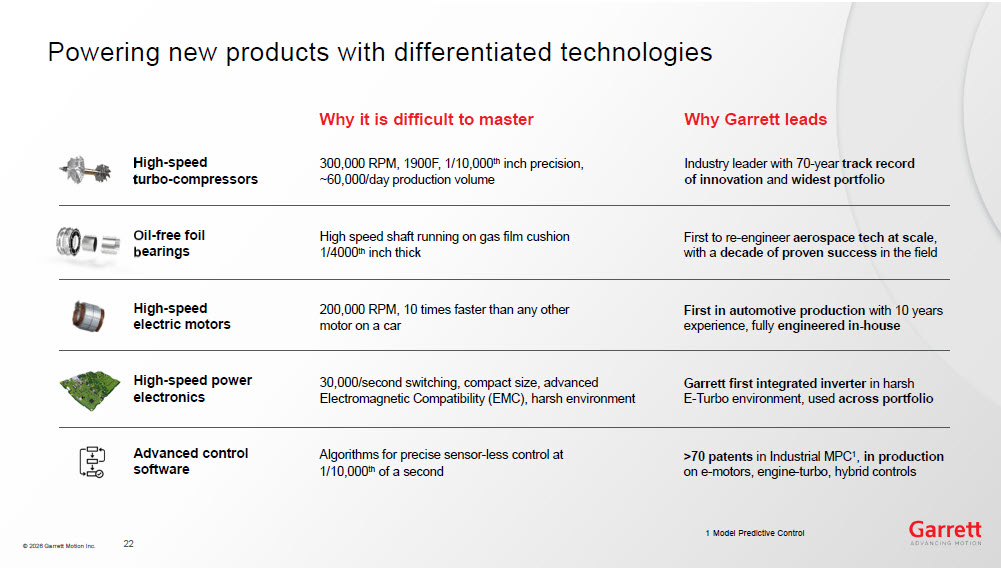
© 2026 Garrett Motion Inc. Powering new products with differentiated technologies Advanced control software High - speed turbo - compressors Oil - free foil bearings High - speed electric motors High - speed power electronics Why it is difficult to master 300,000 RPM, 1900F, 1/10,000 th inch precision, ~60,000/day production volume High speed shaft running on gas film cushion 1/4000 th inch thick 200,000 RPM, 10 times faster than any other motor on a car 30,000/second switching, compact size, advanced Electromagnetic Compatibility (EMC), harsh environment Algorithms for precise sensor - less control at 1/10,000 th of a second 22 Why Garrett leads Industry leader with 70 - year track record of innovation and widest portfolio First to re - engineer aerospace tech at scale , with a decade of proven success in the field First in automotive production with 10 years experience, fully engineered in - house Garrett f irst integrated inverter in harsh E - Turbo environment, used across portfolio >70 patents in Industrial MPC 1 , in production on e - motors, engine - turbo, hybrid controls 1 Model Predictive Control
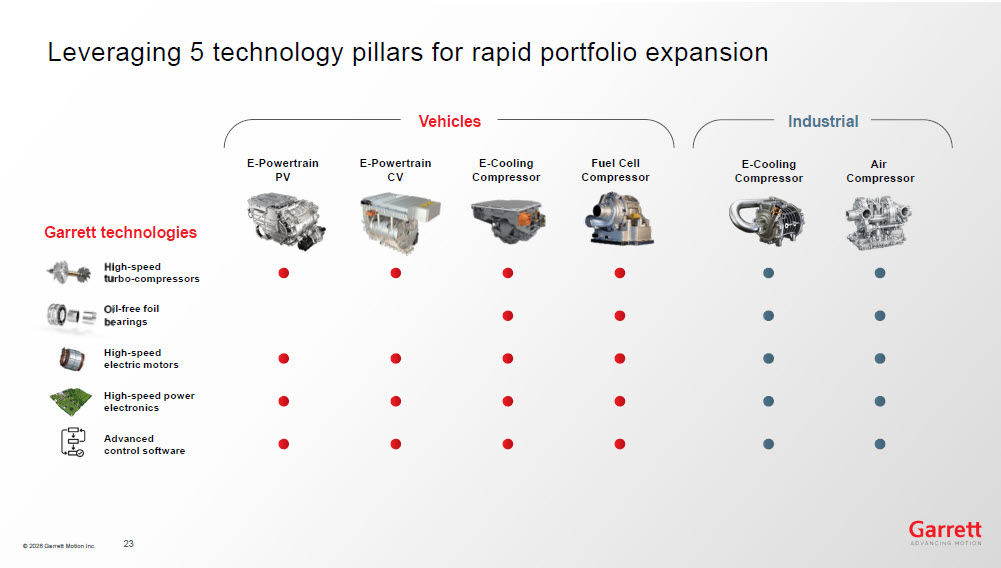
© 2026 Garrett Motion Inc. Leveraging 5 technology pillars for rapid portfolio expansion 23 Oil - free foil bearings High - speed electric motors High - speed power electronics Advanced control software High - speed turbo - compressors E - Powertrain PV E - Powertrain CV E - Cooling Compressor Fuel Cell Compressor Vehicles E - Cooling Compressor Air Compressor Industrial Garrett technologies
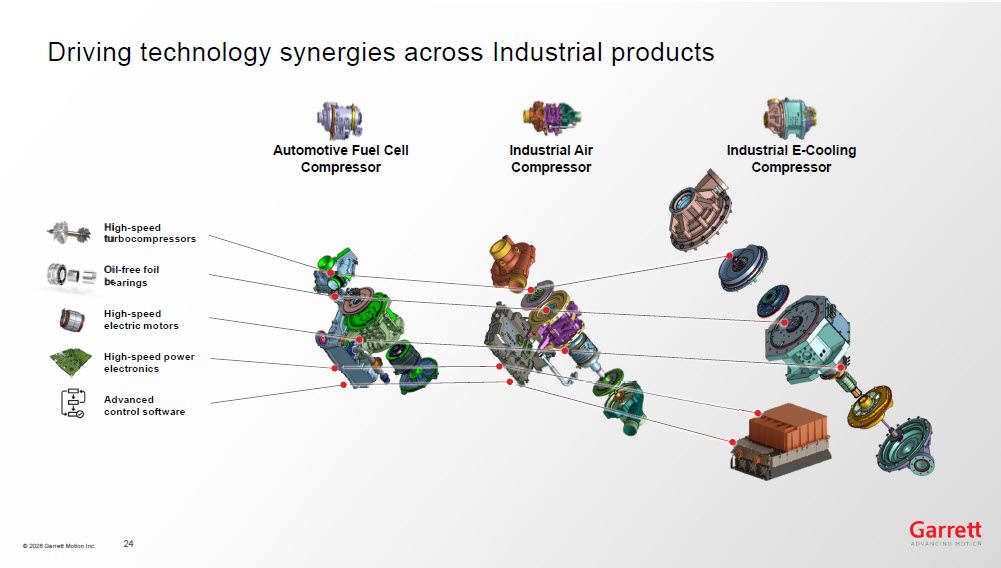
© 2026 Garrett Motion Inc. Driving technology synergies across Industrial products 24 Oil - free foil bearings High - speed electric motors High - speed power electronics Advanced control software High - speed turbocompressors Automotive Fuel Cell Compressor Industrial Air Compressor Industrial E - Cooling Compressor
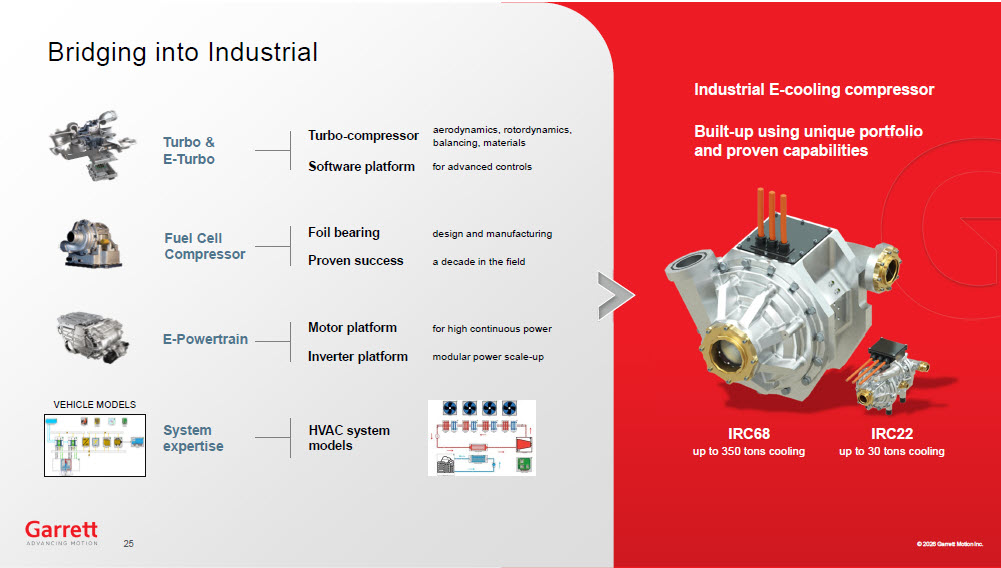
© 2026 Garrett Motion Inc. © 2026 Garrett Motion Inc. Bridging into Industrial Fuel Cell Compressor E - Powertrain Turbo & E - Turbo System expertise VEHICLE MODELS Industrial E - cooling compressor Built - up using unique portfolio and proven capabilities IRC68 up to 350 tons cooling IRC22 up to 30 tons cooling HVAC system models Turbo - compressor aerodynamics, rotordynamics, balancing, materials Software platform for advanced controls Foil bearing design and manufacturing Proven success a decade in the field Motor platform for high continuous power Inverter platform modular power scale - up 25
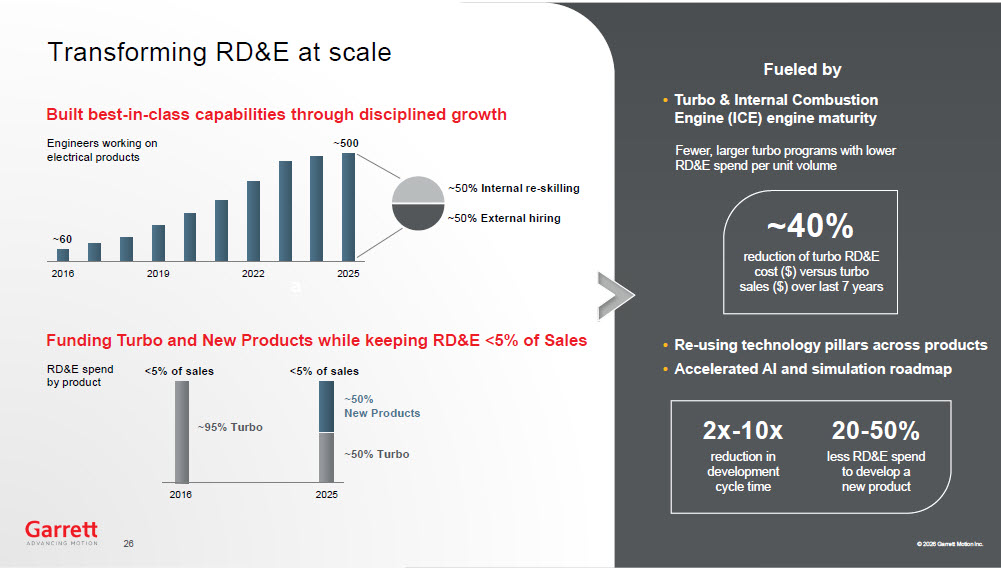
© 2026 Garrett Motion Inc. a © 2026 Garrett Motion Inc. Transforming RD&E at scale 2016 2019 2022 2025 Engineers working on electrical products ~60 ~500 ~50% Internal re - skilling ~50% External hiring Built best - in - class capabilities through disciplined growth Funding Turbo and New Products while keeping RD&E <5% of Sales RD&E spend by product ~95% Turbo ~50% Turbo ~50% New Products 2016 202 5 <5% of sales <5% of sales • Turbo & Internal Combustion Engine (ICE) engine maturity Fueled by Fewer, larger turbo programs with lower RD&E spend per unit volume • Re - using technology pillars across products • Accelerated AI and simulation roadmap reduction of turbo RD&E cost ($) versus turbo sales ($) over last 7 years ~40% reduction in development cycle time 2x - 10x less RD&E spend to develop a new product 20 - 50% 26

© 2026 Garrett Motion Inc. Nils Martens Zero Emission Technologies for mobility
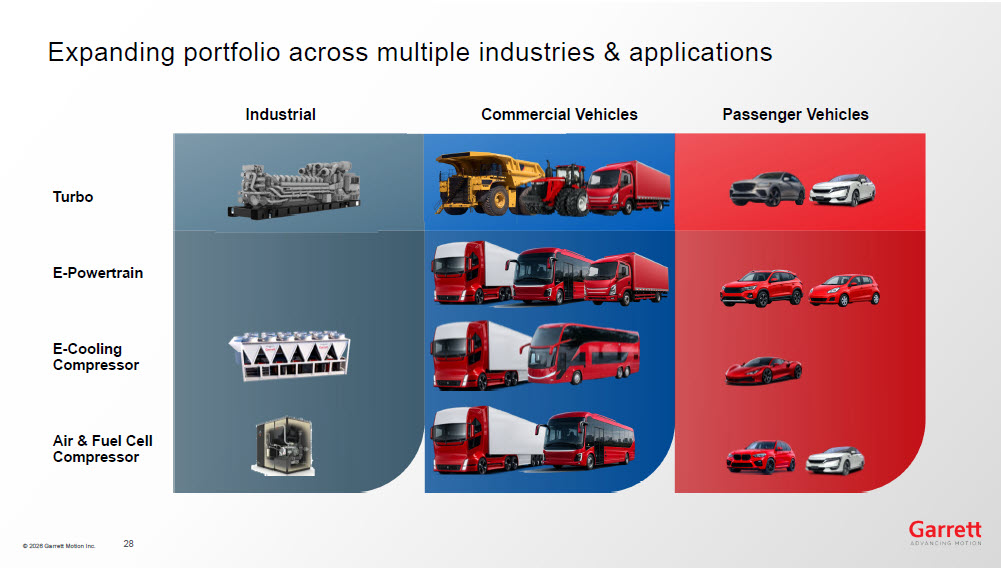
© 2026 Garrett Motion Inc. Expanding portfolio across multiple industries & applications E - Powertrain E - Cooling Compressor Air & Fuel Cell Compressor Turbo Industrial Commercial Vehicles Passenger Vehicles 28
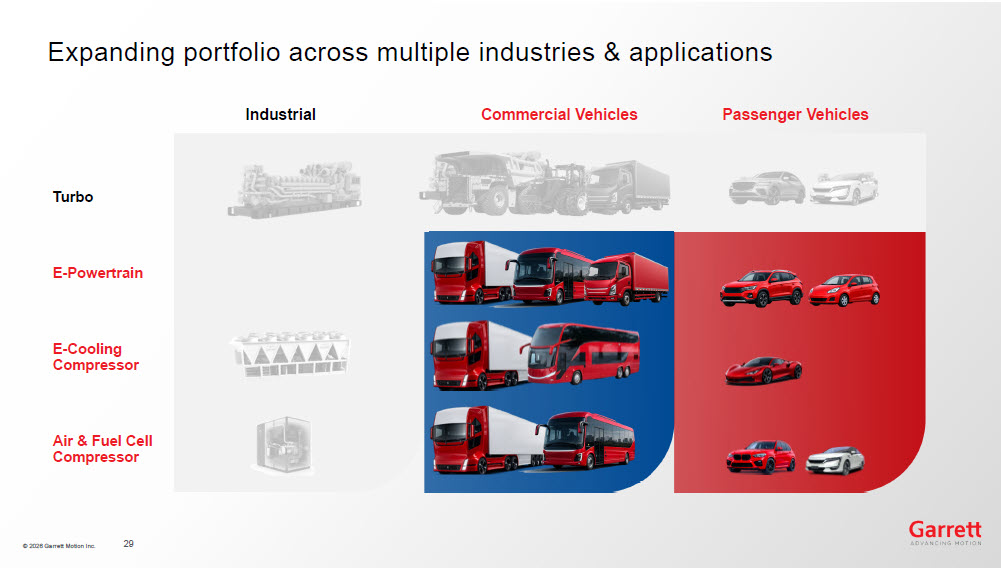
© 2026 Garrett Motion Inc. Expanding portfolio across multiple industries & applications E - Powertrain E - Cooling Compressor Air & Fuel Cell Compressor Turbo Industrial Commercial Vehicles Passenger Vehicles 29
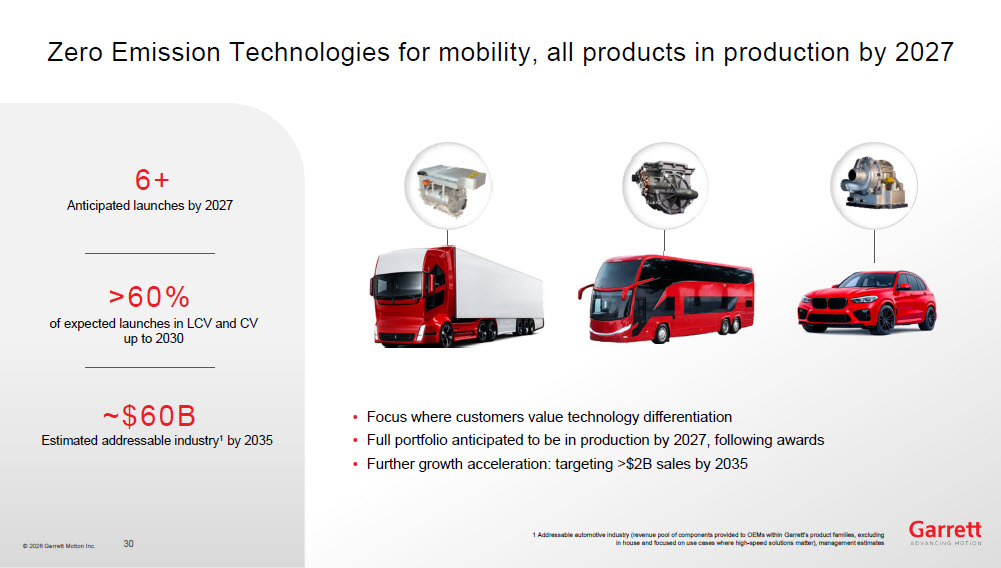
© 2026 Garrett Motion Inc. Zero Emission Technologies for mobility, all products in production by 2027 30 6+ Anticipated launches by 2027 > 6 0% of expected launches in LCV and CV up to 2030 Estimated a ddressable industry 1 by 2035 ~$ 60 B • Focus where customers value technology differentiation • Full portfolio anticipated to be in production by 2027, following awards • Further growth acceleration: targeting >$2B sales by 2035 1 Addressable automotive industry (revenue pool of components provided to OEMs within Garrett’s product families, excluding in house and focused on use cases where high - speed solutions matter), management estimates
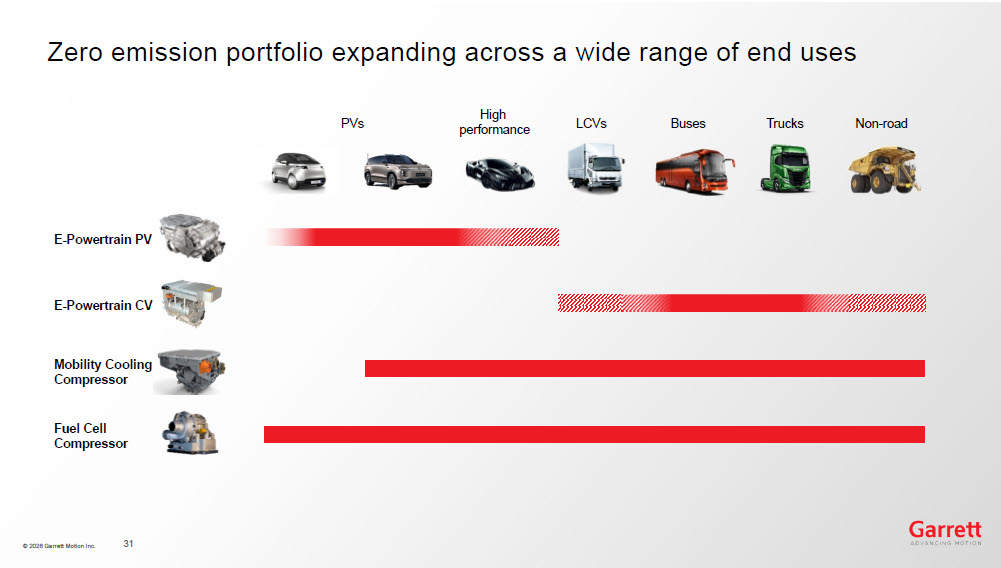
© 2026 Garrett Motion Inc. Zero emission portfolio expanding across a wide range of end uses 31 PVs High performance LCVs Trucks Non - road Buses E - Powertrain PV Fuel Cell Compressor E - P owertrain CV Mobility Cooling Compressor
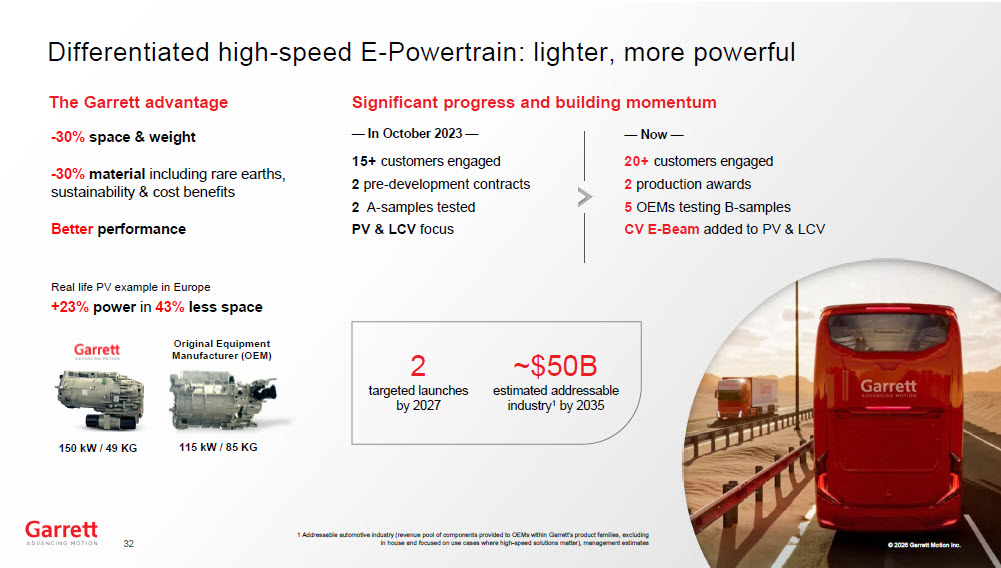
Differentiat ed high - speed E - Powertrain: lighter, more powerful 1 Addressable automotive industry (revenue pool of components provided to OEMs within Garrett’s product families, excluding in house and focused on use cases where high - speed solutions matter), management estimates - 30% space & weight - 30% material including rare earths , sustainability & cost benefits Better performance The Garrett advantage +23% power in 43% less space Real life PV example in Europe 115 kW / 85 KG Original Equipment Manufacturer (OEM) 150 kW / 49 KG 2 targeted launches by 2027 ~$ 50B estimated addressable industry 1 by 2035 — I n October 2023 — 15+ customers engaged 2 pre - development contracts 2 A - samples tested PV & LCV focus — Now — 2 0 + customers engaged 2 pr oduction awards 5 OEMs testing B - samples CV E - Beam added to PV & LCV Significant progress and building momentum 32 © 2026 Garrett Motion Inc.
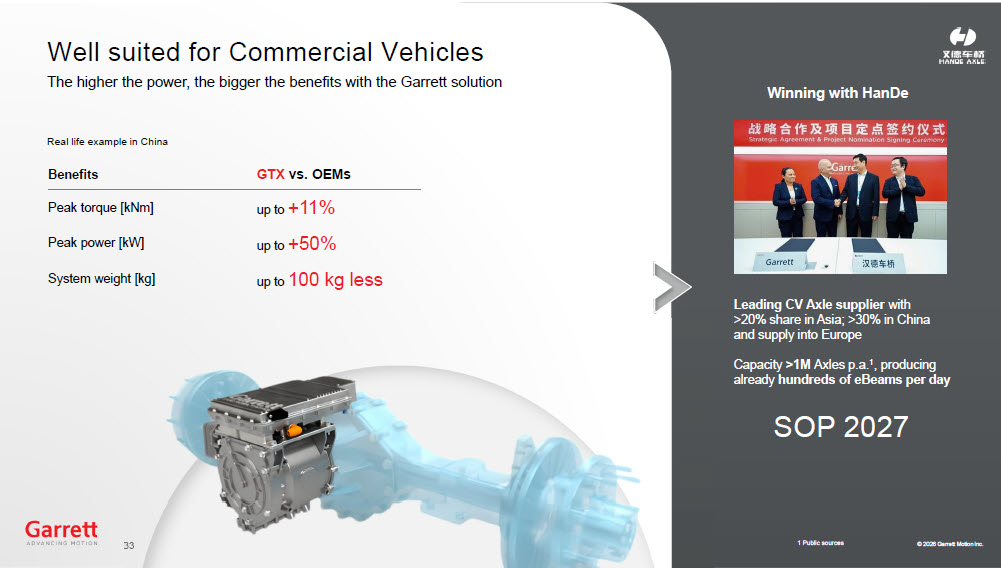
© 2026 Garrett Motion Inc. Well suited for Commercial Vehicles T he higher the power, the bigger the benefits with the Garrett solution © 2026 Garrett Motion Inc. Real life example in China GTX vs. OEMs Benefits up t o +11% Peak torque [ kNm ] up t o +50% Peak power [kW] up to 10 0 kg less System weight [kg] Winning with HanDe SOP 2027 Leading CV Axle supplier with > 2 0 % s hare in Asia; >30% in China and supply into Europe Capacity >1M Axles p.a. 1 , producing already hundreds of eBeams per day 1 Public sources 33
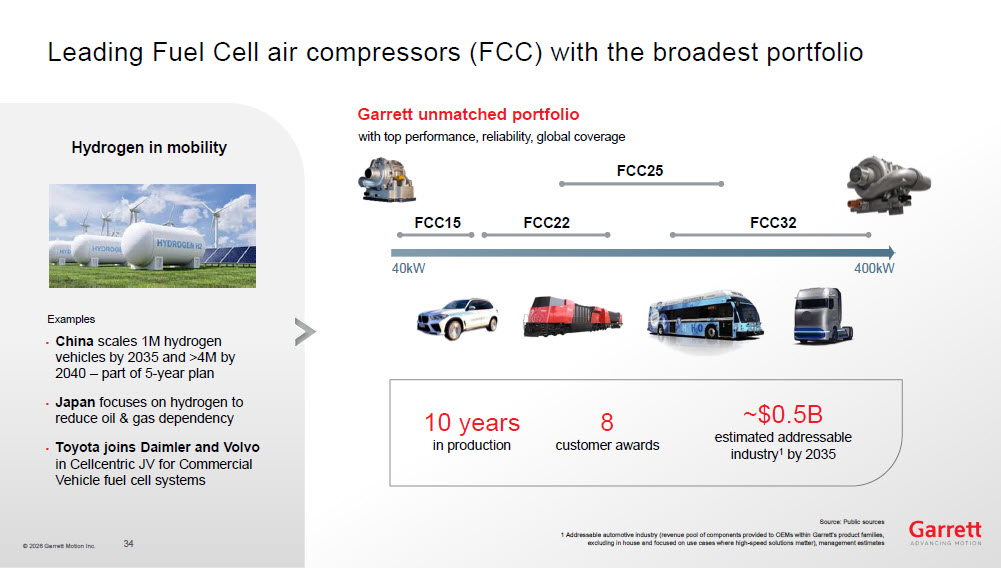
© 2026 Garrett Motion Inc. Leading Fuel Cell air compressor s (FCC) with the broadest portfolio 40kW 400kW FCC15 FCC22 FCC25 FCC32 Garrett unmatched portfolio • China scales 1M hydrogen vehicles by 2035 and >4M by 2040 – part of 5 - year plan • Japan focuses on hydrogen to reduce oil & gas dependency • Toyota joins Daimler and Volvo in Cellcentric JV for Commercial Vehicle fuel cell systems Examples Hydrogen in mobility with top performance, reliability, global coverage Source: Public sources 1 Addressable automotive industry (revenue pool of components provided to OEMs within Garrett’s product families, excluding in house and focused on use cases where high - speed solutions matter), management estimates 34 8 customer awards 10 years in production ~$0.5 B estimated addressable industry 1 by 2035
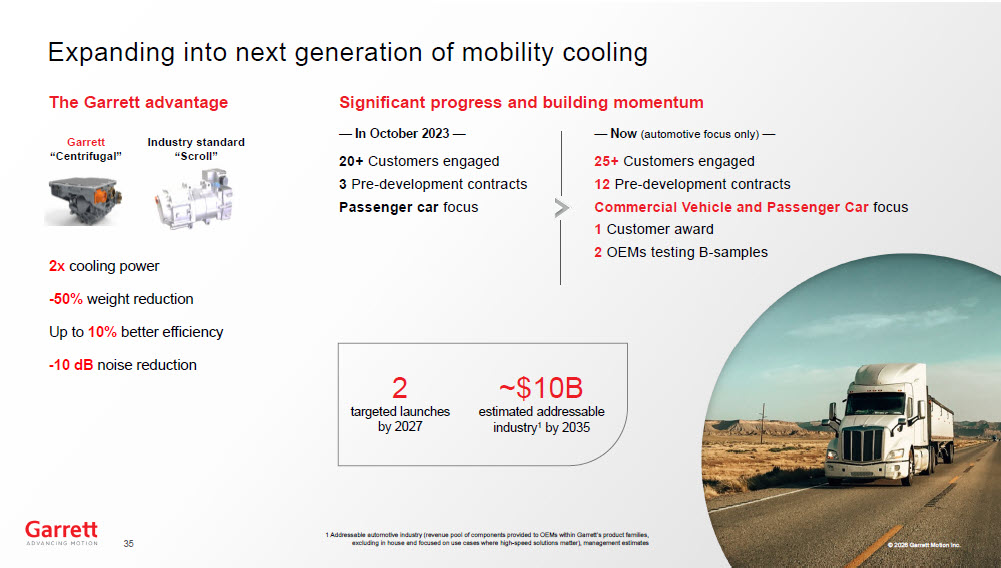
Expanding into next generation of mobility cooling 1 Addressable automotive industry (revenue pool of components provided to OEMs within Garrett’s product families, excluding in house and focused on use cases where high - speed solutions matter), management estimates 2 targeted launches by 2027 ~$ 10B estimated addressable industry 1 by 2035 — I n October 2023 — 20+ Customers engaged 3 Pre - development contracts Passenger car focus — Now (automotive focus only) — 2 5 + Customers engaged 1 2 P re - development contracts Commercial Vehi c le and Passenger Car focus 1 Customer award 2 OEMs testing B - samples Significant progress and building momentum The Garrett advantage Industry standard “Scroll” Garrett “Centrifugal” 2x cooling power - 50% weight reduction U p to 10% better efficiency - 10 dB noise reduction 35 © 2026 Garrett Motion Inc.
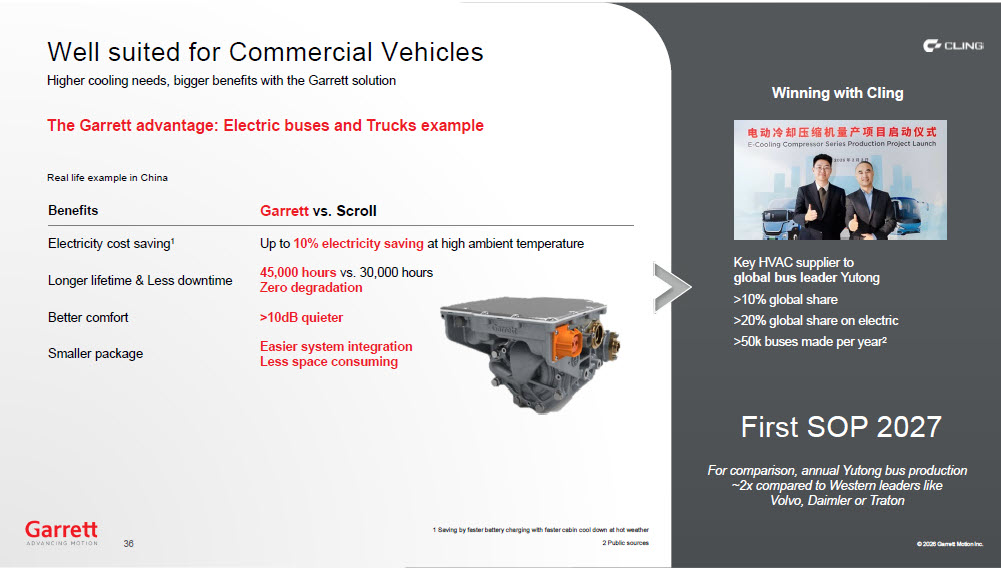
© 2026 Garrett Motion Inc. Well suited for Commercial Vehicles Higher cooling needs, bigger benefits with the Garrett solution © 2026 Garrett Motion Inc. Real life example in China Garr e tt vs. Scroll Benefits Up to 10% electricity saving at high ambient temperature Electricity cost saving 1 45 , 000 hours vs. 30 , 000 hours Zero degradation Longer lifetime & Less downtime >10dB quieter Better comfort Easier system integration Less space consuming Smaller package Winning with Cling First SOP 2027 Key HVAC supplier to global bus leader Yutong >10% global share >20% global share on electric >50k buses made per year 2 The Garrett advantage: Electric buses and Trucks example 1 Saving by faster battery charging with faster cabin cool down at hot weather 2 Public sources For comparison, annual Yutong bus production ~2x compared to Western leaders like Volvo, Daimler or Traton 36

© 2026 Garrett Motion Inc. Nils Martens Industrial opportunity
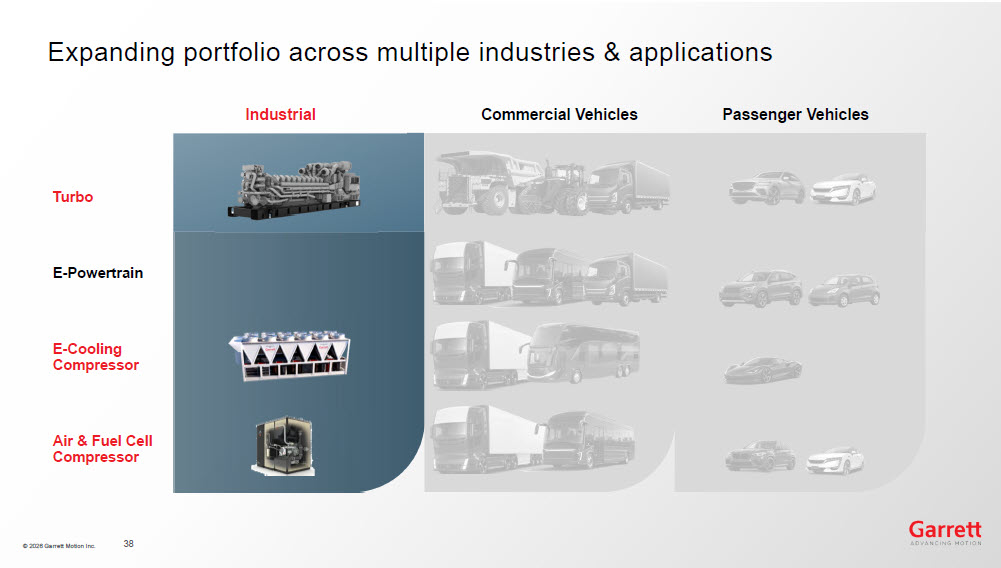
© 2026 Garrett Motion Inc. Expanding portfolio across multiple industries & applications E - Powertrain E - Cooling Compressor Air & Fuel Cell Compressor Turbo Industrial Commercial Vehicles Passenger Vehicles 38
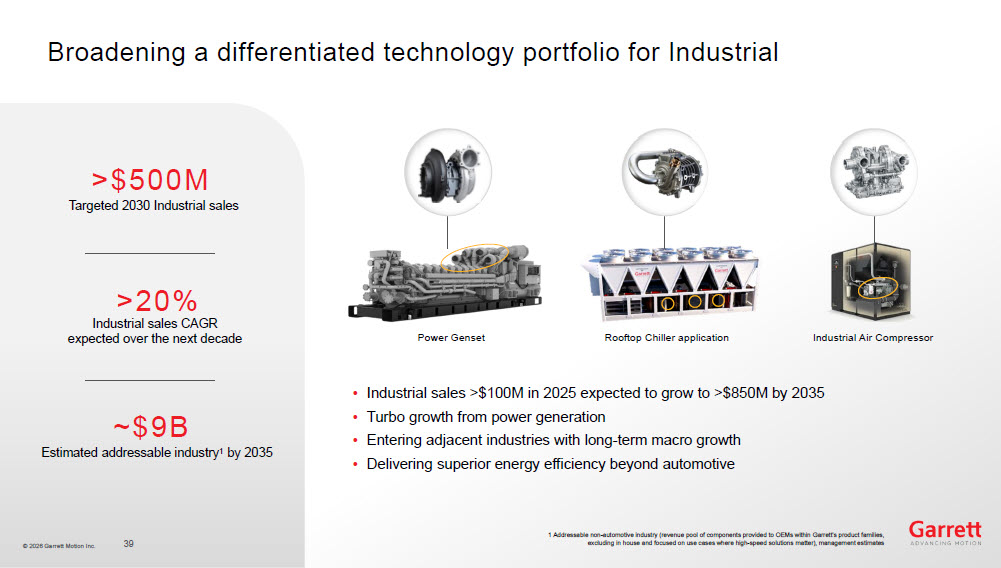
© 2026 Garrett Motion Inc. Broadening a differentiated technology portfolio for Industrial 39 >$ 50 0M Targeted 2030 Industrial sales >20% Industrial sales CAGR expected over the next decade Estimated a ddressable industry 1 by 2035 ~$9B • Industrial sales >$100M in 2025 expected to grow to >$850M by 2035 • Turbo growth from power generation • Entering adjacent industries with long - term macro growth • Delivering superior energy efficiency beyond automotive 1 Addressable non - automotive industry (revenue pool of components provided to OEMs within Garrett’s product families, excluding in house and focused on use cases where high - speed solutions matter), management estimates Power Genset Rooftop Chiller application Industrial Air Compressor
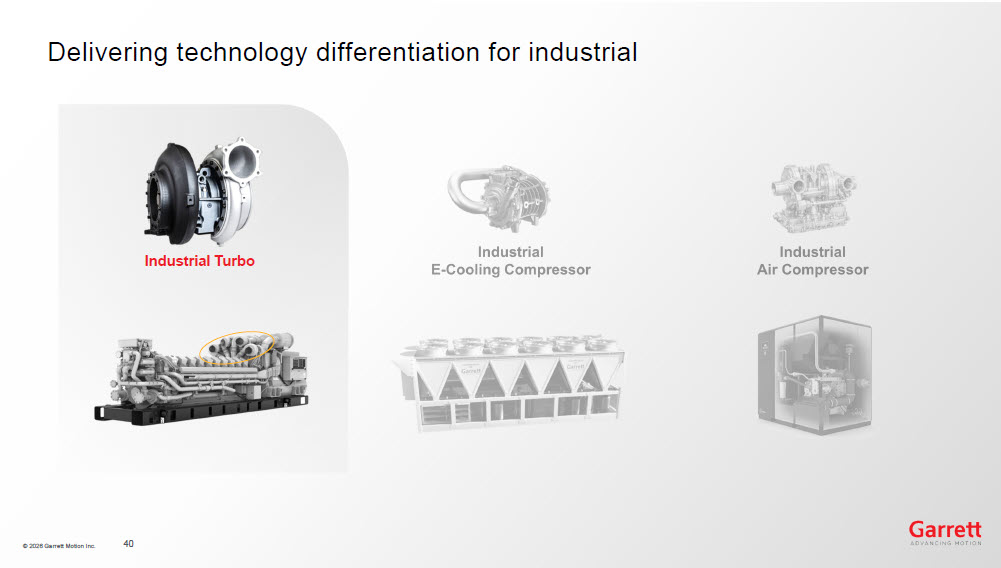
© 2026 Garrett Motion Inc. Delivering t echnology differentiation for industrial 40 Industrial Turbo
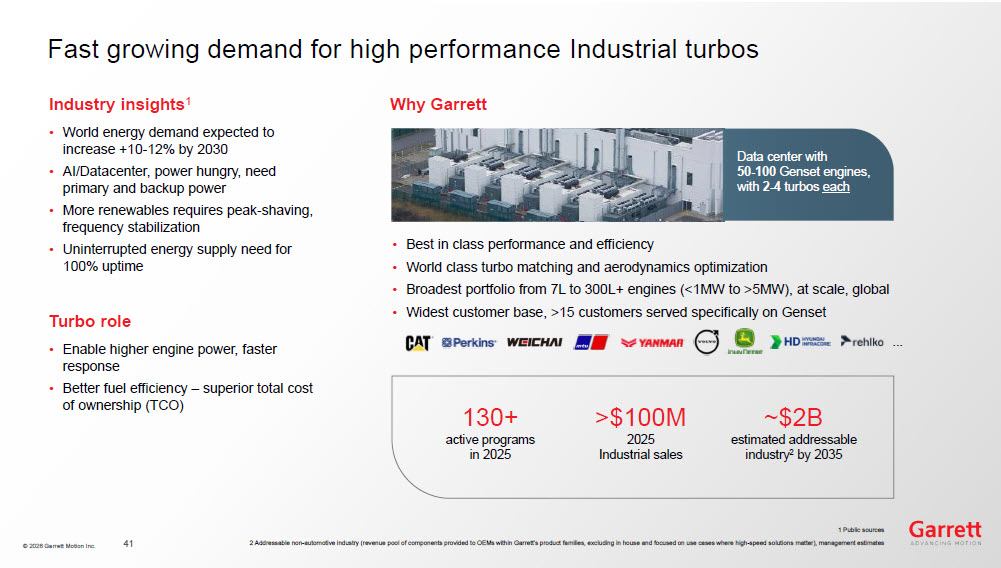
© 2026 Garrett Motion Inc. Fast g rowing demand for high performance I ndustrial turbos 41 Industry insights 1 • World energy demand expected to increase +10 - 12% by 2030 • AI/Datacenter, power hungry, need primary and backup power • More renewables requires peak - shaving, frequency stabilization • Uninterrupted energy supply need for 100% uptime Turbo role • Enable higher engine power, faster response • Better fuel efficiency – superior total cost of ownership (TCO) ... • Best in class performance and efficiency • World class turbo matching and aerodynamics optimization • Broadest portfolio from 7L to 300L+ engines (<1MW to >5MW), at scale, global • Widest customer base, >15 customers served specifically on Gen s et Why Garrett >$100 M 2025 Industrial s ales 130+ active programs in 2025 ~$2 B estimated addressable industry 2 by 2035 D ata center with 50 - 100 Gen s et engines, with 2 - 4 turbos each 1 Public sources 2 Addressable non - automotive industry (revenue pool of components provided to OEMs within Garrett’s product families, excluding in house and focused on use cases where high - speed solutions matter), management estimates
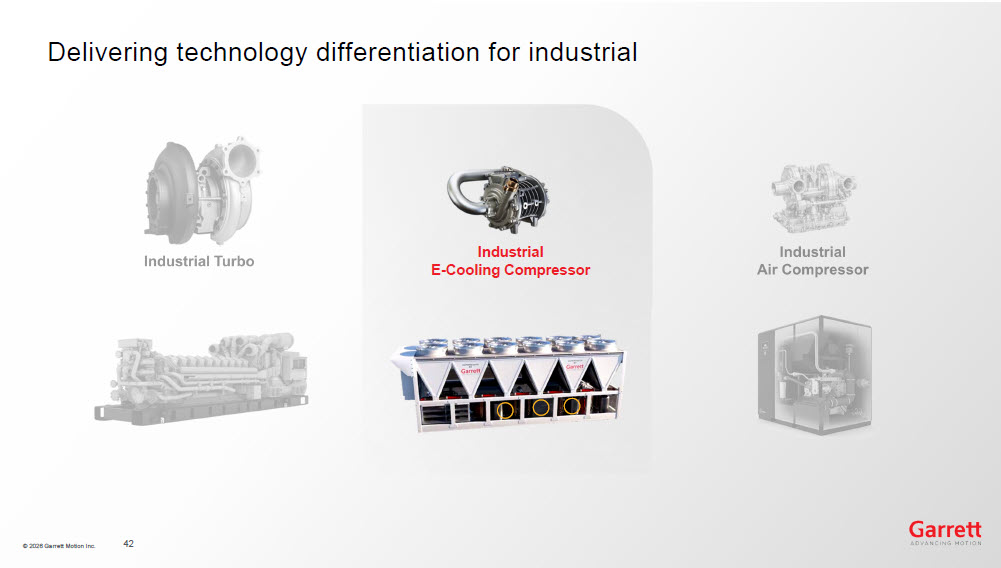
© 2026 Garrett Motion Inc. Delivering t echnology differentiation for industrial 42 Industrial E - Cooling Compressor
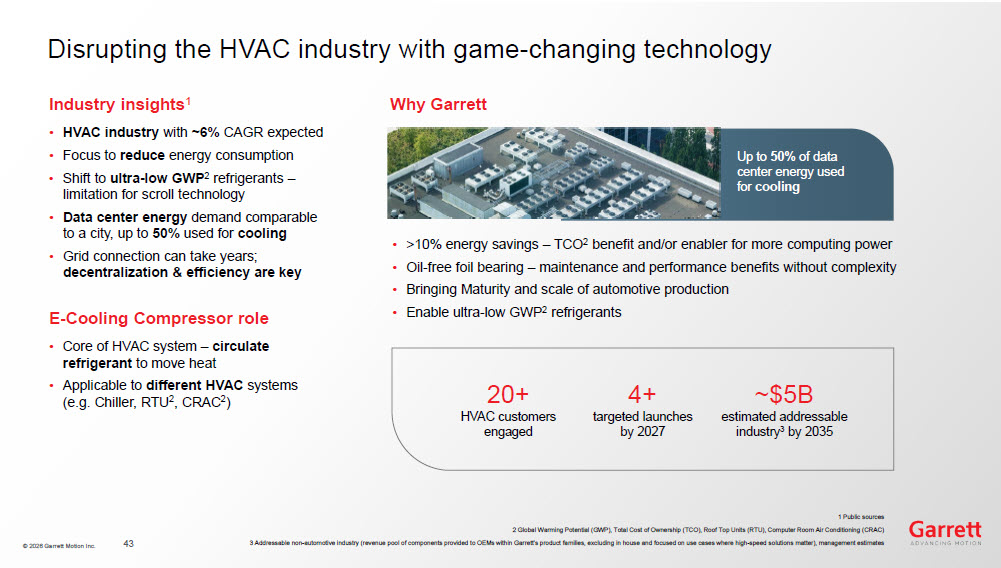
© 2026 Garrett Motion Inc. Disrupting the HVAC industry with game - changing technology 43 Industry insights 1 • HVAC industry with ~6% CAGR expected • Focus to reduce energy consumption • Shift to ultra - low GWP 2 refrigerants – limitation for scroll technology • Data center energy demand comparable to a city, up to 50% used for cooling • Grid connection can take years; decentralization & efficiency are key E - Cooling Compressor role • Core of HVAC system – circulate refrigerant to move heat • Applicable to different HVAC systems (e.g. Chiller, RTU 2 , CRAC 2 ) • >10% energy savings – TCO 2 benefit and/or enabler for more computing power • Oil - free foil bearing – maintenance and performance benefits without complexity • Bringing Maturity and scale of automotive production • Enable ultra - low GWP 2 refrigerants Why Garrett 4+ targeted launches by 2027 20 + HVAC customers engaged ~$ 5 B estimated addressable industry 3 by 2035 Up to 50% of data center energy used for cooling 1 Public sources 2 Global Warming Potential (GWP), Total Cost of Ownership (TCO), Roof Top Units (RTU), Computer Room Air Conditioning (CRAC) 3 Addressable non - automotive industry (revenue pool of components provided to OEMs within Garrett’s product families, excluding in house and focused on use cases where high - speed solutions matter), management estimates
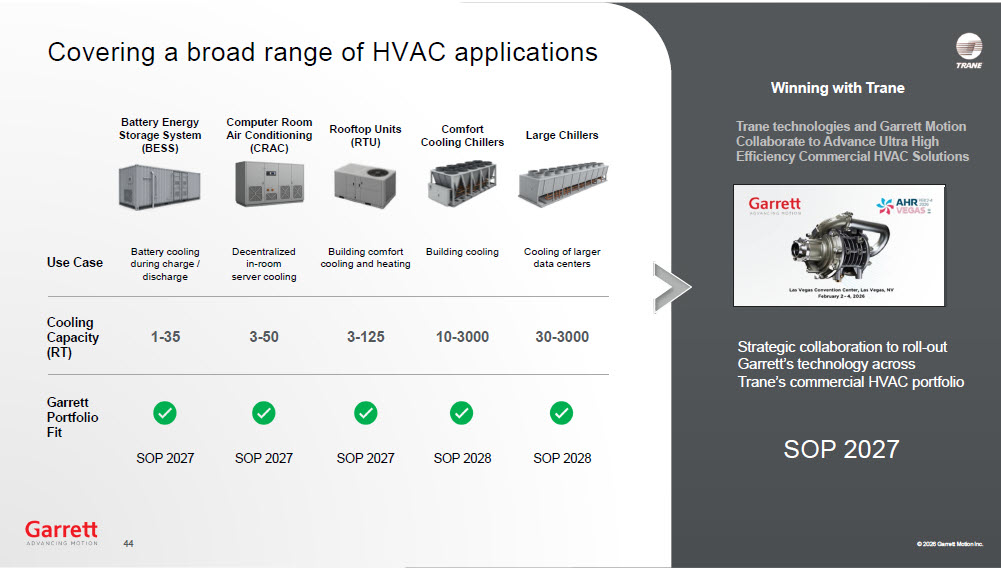
© 2026 Garrett Motion Inc. Covering a broad range of HVAC applications © 2026 Garrett Motion Inc. Winning with Trane SOP 2027 Strategic collaboration to roll - out Garrett’s technology across Trane’s commercial HVAC portfolio Rooftop Units (RTU) Comfort Cooling Chillers Large Chillers Battery Energy Storage System (BESS) Computer Room Air Conditioning (CRAC) Use Case Building comfort cooling and heating Building cooling Cooling of larger data centers Battery cooling during charge / discharge Decentralized in - room server cooling Cooling Capacity (RT) 3 - 125 10 - 3000 30 - 3000 1 - 35 3 - 50 Garrett Portfolio Fit SOP 202 7 SOP 202 8 SOP 202 8 SOP 202 7 SOP 202 7 Trane technologies and Garrett Motion Collaborate to Advance Ultra High Efficiency Commercial HVAC Solutions 44
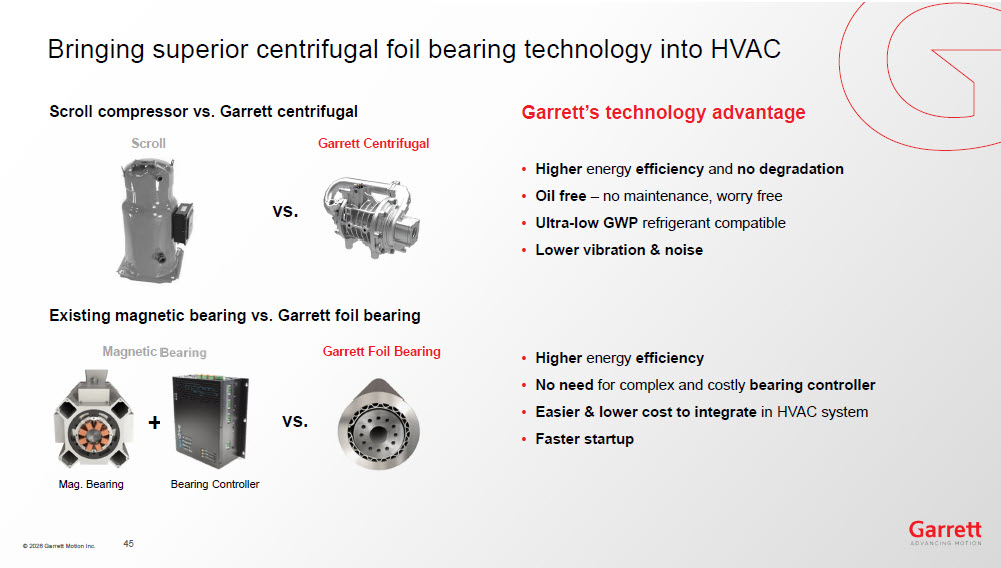
© 2026 Garrett Motion Inc. Bringing superior centrifugal foil bearing technology into HVAC 45 Scroll c ompressor vs. Garrett c entrifugal Scroll Garrett Centrifugal vs. Existing m agnetic b earing vs. Garrett f oil b earing Garrett Foil Bearing Magnetic Bearing + Bearing Controller Mag. Bearing vs. Garrett’s technology advantage • Higher energy efficiency and no degradation • Oil free – no maintenance, worry free • Ultra - low GWP refrigerant compatible • Lower vibration & noise • Higher energy efficiency • No need for complex and costly bearing controller • Easier & lower cost to integrate in HVAC system • Faster startup
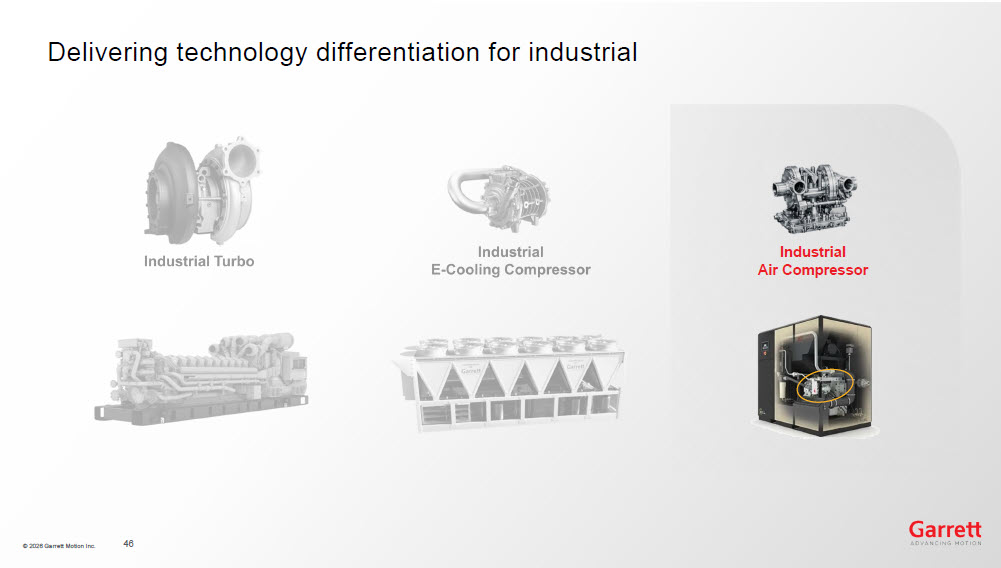
© 2026 Garrett Motion Inc. Delivering t echnology differentiation for industrial 46 Industrial Air Compressor
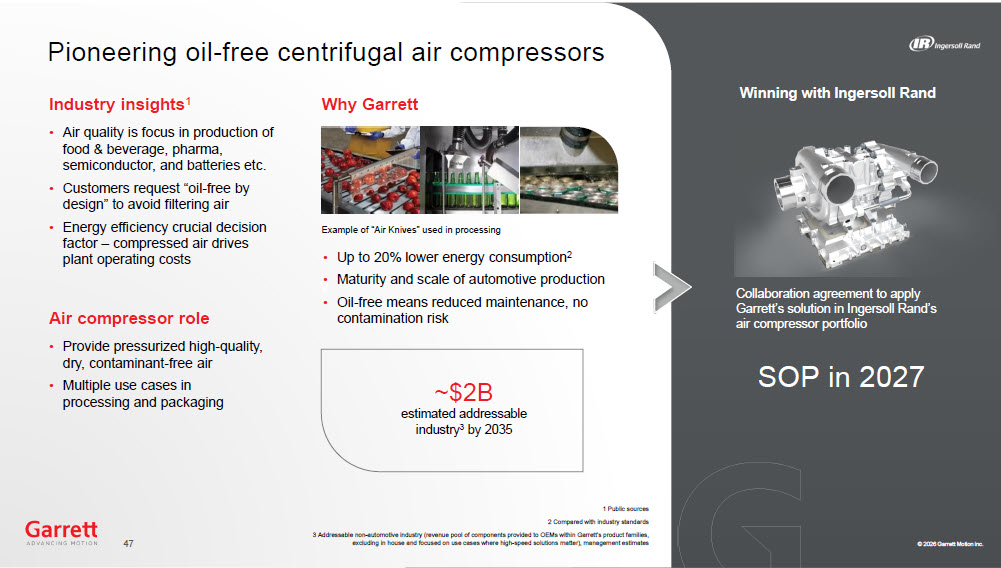
© 2026 Garrett Motion Inc. v Pioneering oil - free centrifugal air compressors © 2026 Garrett Motion inc. Winning with Ingersoll Rand SOP in 2027 Collaboration agreement to apply Garrett’s solution in Ingersoll Rand’s air compressor portfolio 1 Public sources 2 Compared with industry standards 3 Addressable non - automotive industry (revenue pool of components provided to OEMs within Garrett’s product families, excluding in house and focused on use cases where high - speed solutions matter), management estimates Industry insights 1 • Air quality is focus in production of food & beverage, pharma, semiconductor, and batteries etc. • Customers request “oil - free by design” to avoid filtering air • Energy efficiency crucial decision factor – compressed air drives plant operating costs Air compressor role • Provide pressurized high - quality, dry, contaminant - free air • Multiple use cases in processing and packaging • Up to 20% lower energy consumption 2 • Maturity and scale of automotive production • Oil - free means reduced maintenance, no contamination risk Why Garrett ~$2B estimated addressable industry 3 by 2035 Example of “ Air Kni v es ” used in processing 47
© 2026 Garrett Motion Inc. Mark Rodrigues Turbo leadership
© 2026 Garrett Motion Inc. Expanding portfolio across multiple industries & applications E - Powertrain E - Cooling Compressor Air & Fuel Cell Compressor Turbo Industrial Commercial Vehicles Passenger Vehicles 49
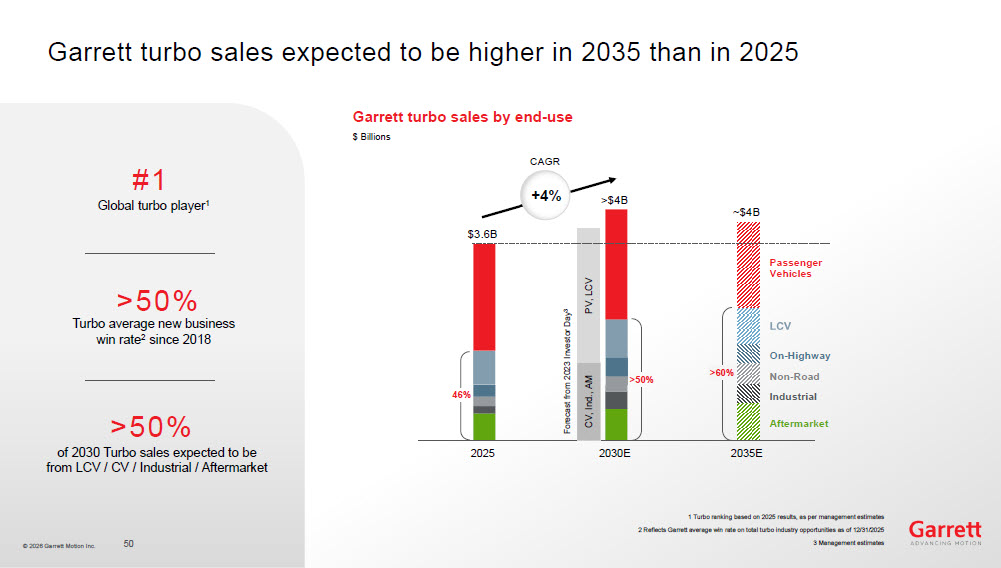
© 2026 Garrett Motion Inc. 2025 2030 E 2035 E $3. 6B >$4 B ~$4 B CAGR +4 % Garrett turbo sales expected to be higher in 2035 than in 2025 50 #1 Global turbo player 1 >50% Turbo average new business win rate 2 since 2018 of 2030 Turbo sales expected to be from LCV / CV / Industrial / Aftermarket >50% 1 Turbo ranking based on 2025 results, as per management estimates 2 Reflects Garrett average win rate on total turbo industry opportunities as of 12/31/2025 3 Management estimates Garrett turbo sales by end - use CV, Ind., AM PV, LCV Forecast from 2023 Investor Day 3 Passenger Vehicles Non - Road Industrial Aftermarket On - Highway 4 6 % >50 % >60 % $ Billions
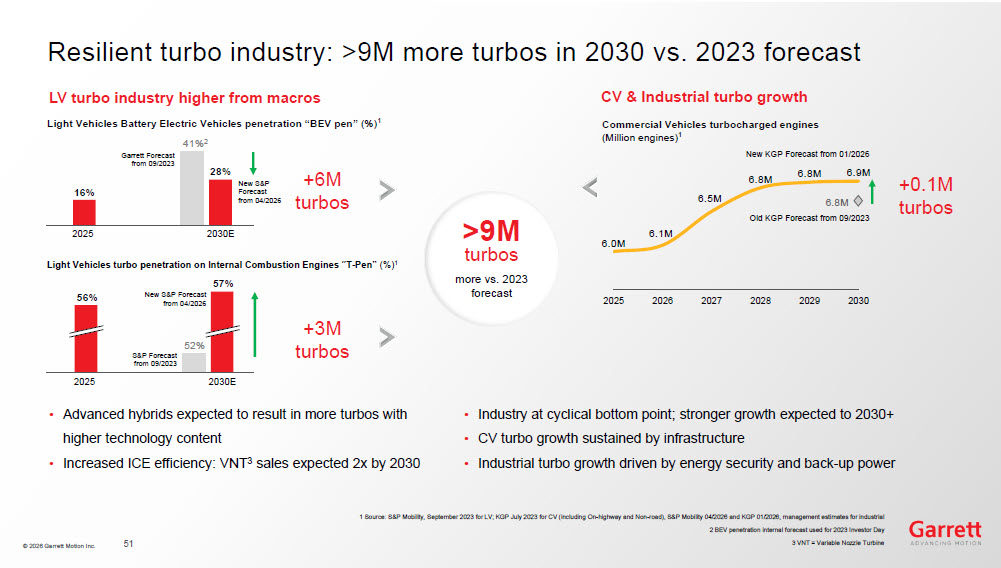
© 2026 Garrett Motion Inc. Resilient turbo industry: >9M more turbos in 2030 vs. 2023 forecast LV t urbo industry h igher from macros • Advanced hybrids expected to result in more turbos with higher technology content • Increased ICE efficiency: VNT 3 sales expected 2x by 2030 • Industry at cyclical bottom point; stronger growth expected to 2030+ • CV turbo growth sustained by infrastructure • Industrial t urbo growth driven by energy security and back - up power +3M turbos Light Vehicles Battery Electric Vehicles penetration “BEV pen” (%) 1 +6M turbos 1 Source: S&P Mobility, September 2023 for LV; KGP July 2023 for CV (including On - highway and Non - road), S&P Mobility 04/2026 and KGP 01/2026, management estimates for industrial 2 BEV penetration internal forecast used for 2023 Investor Day 3 VNT = Variable Nozzle Turbine 16% 28% 2025 2030 E N ew S&P Forecast from 04/ 2026 Ga rrett Forecast from 09/2023 41% 2 Light Vehicles turbo penetration on Internal Combustion Engines “T - Pen” (%) 1 2025 2030 E 56% 57% S&P Forecast from 09/2023 N ew S&P Forecast from 04/ 2026 52% CV & Industrial t urbo growth 6.0M 6.1M 6.5M 6.8M 6.8M 6.9M 2025 2026 2027 2028 2029 2030 Old KGP Forecast from 09/2023 6.8M New KGP Forecast from 01/ 2026 +0.1M turbos Commercial Vehicles turbocharged engines (Million engines) 1 51 >9M turbos more vs. 2023 forecast
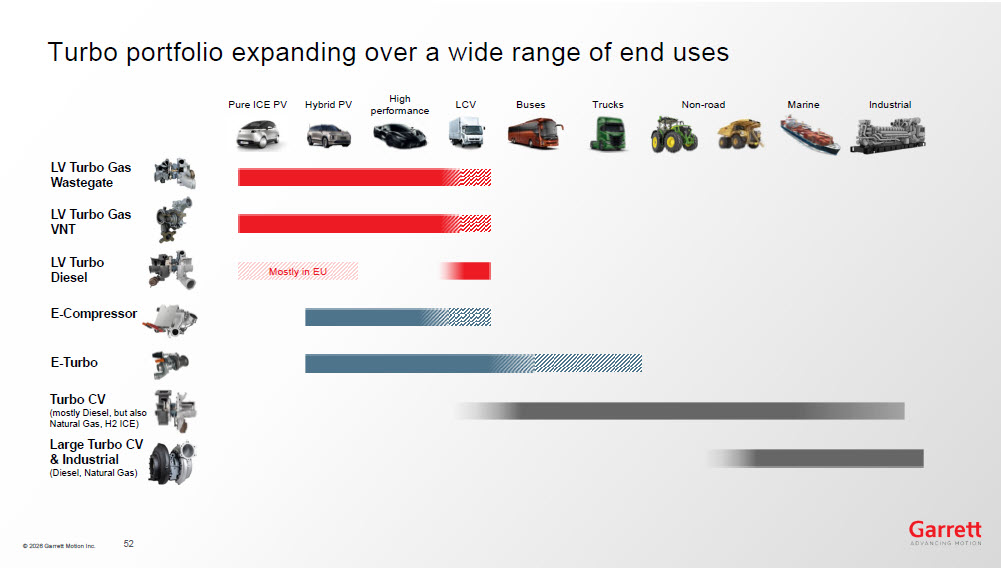
© 2026 Garrett Motion Inc. Turbo portfolio expanding over a wide range of end uses 52 M ostly in EU Pure ICE PV High performance LCV Trucks Non - road Buses Industrial Hybrid PV Marine LV Turbo Gas Waste g ate E - Compressor Turbo CV (mostly Diesel, but also Natural Gas, H2 ICE) LV Turbo Gas V NT LV Turbo Diesel E - Turbo Large Turbo CV & Industrial (Diesel, Natural Gas)
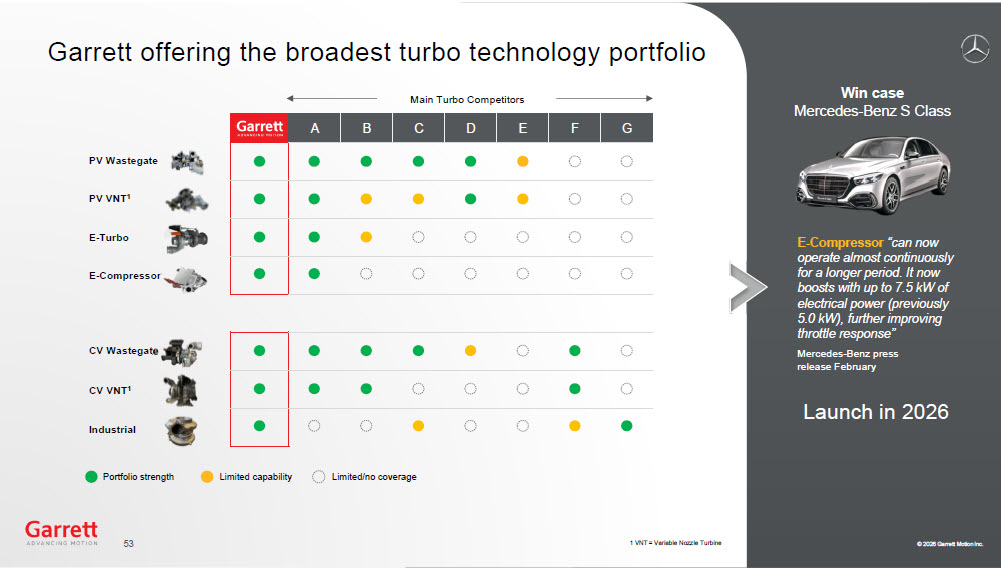
© 2026 Garrett Motion Inc. Garrett offering the broadest turbo technology portfolio © 2026 Garrett Motion Inc. Win case Mercedes - Benz S Class E - Compressor “can now operate almost continuously for a longer period. It now boosts with up to 7.5 kW of electrical power (previously 5.0 kW), further improving throttle response” Mercedes - Benz press release February 1 VNT = Variable Nozzle Turbine G F E D C B A Portfolio strength Limited capability Limited/no coverage CV Wastegate CV VNT 1 Industrial PV Wastegate E - Turbo E - Compressor PV VNT 1 Main Turbo Competitors Launch in 2026 53
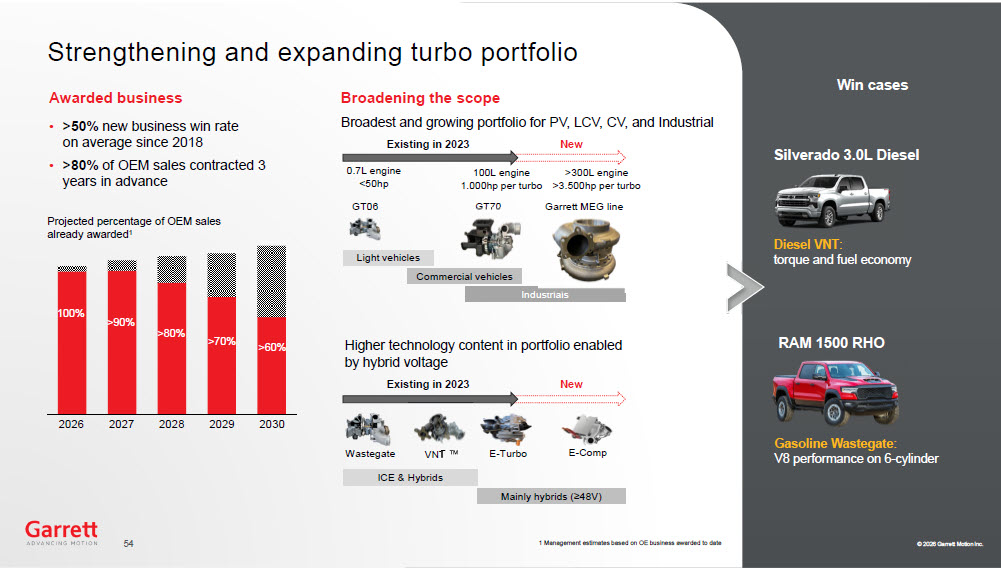
© 2026 Garrett Motion Inc. Streng th ening and expanding turbo portfolio © 2026 Garrett Motion Inc. Win case s 1 M anagement estimates based on OE business awarded to date Awarded business Broadening the scope • >50% new business win rate on average since 2018 • >80% of OEM sales contracted 3 years in advance Projected percentage of OEM sales already awarded 1 Broadest and growing portfolio for PV , LCV, CV, and Industrial Higher technology content in portfolio enabled by hybrid voltage N ew E xisting in 2023 Wastegate VNT E - Comp E - Turbo ICE & Hybrids Mainly hybrids (≥48V) N ew E xisting in 2023 1 00L engine 1.000hp per turbo >300L engine >3.500hp per turbo 0. 7 L engine <50hp Light vehicles Commercial vehicles Industrials Garrett MEG line GT 06 GT70 RAM 1500 RHO Gasoline Wastegate : V8 performance on 6 - cylinder Silverado 3.0L Diesel Diesel VNT : torque and fuel economy 54 100% 2026 >90% 2027 >80% 2028 >70% 2029 >60% 2030
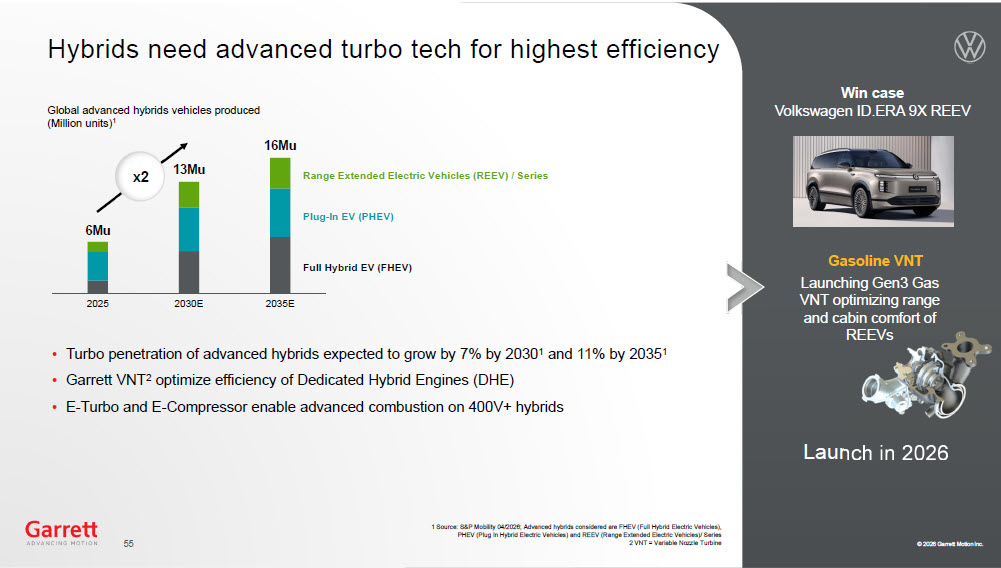
© 2026 Garrett Motion Inc. Hybrids need advanced turbo tech for highest efficiency © 2026 Garrett Motion Inc. 1 Source: S&P Mobility 04/2026; Advanced hybrids considered are FHEV (Full Hybrid Electric Vehicles), PHEV (Plug In Hybrid Electric Vehicles) and REEV (Range Extended Electric Vehicles)/ Series 2 VNT = Variable Nozzle Turbine Global advanced hybrids vehicles produced (Million units) 1 • Turbo penetration of advanced hybrids expected to grow by 7% by 2030 1 and 11% by 2035 1 • Garrett VNT 2 optimize efficiency of Dedicated Hybrid Engines (DHE) • E - Turbo and E - Compressor enable advanced combustion on 400V+ hybrids Win case Volkswagen ID.ERA 9X REEV Launch in 2026 Gasoline VNT Launching Gen3 Gas VNT optimizing range and cabin comfort of REEVs Range Extended E lectric V ehicles (REEV) / Series Plug - In EV (PHEV) Full Hybrid EV (FHEV) 2025 2030 E 2035 E 6Mu 13Mu 16Mu x2 55
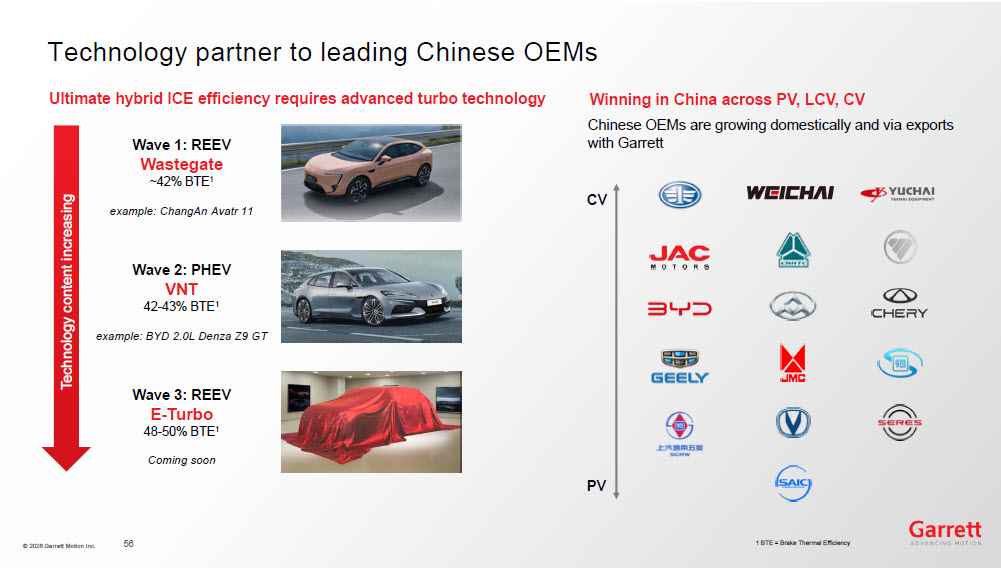
© 2026 Garrett Motion Inc. T echnology partner to leading C hinese OEMs Technology content increasing Ultimate hybrid ICE efficiency requires advanced turbo technology Wave 2: PHEV VNT 42 - 43% BTE 1 example: BYD 2.0L Denza Z9 GT Wave 3: REEV E - Turbo 48 - 50% BTE 1 Coming soon Wave 1 : RE EV Wastegate ~4 2% BTE 1 example: ChangAn Avatr 11 Chinese OEMs are growing domestically and via exports with Garrett Winning in China across PV, LCV, CV C V P V 56 1 BTE = Brake Thermal Efficiency
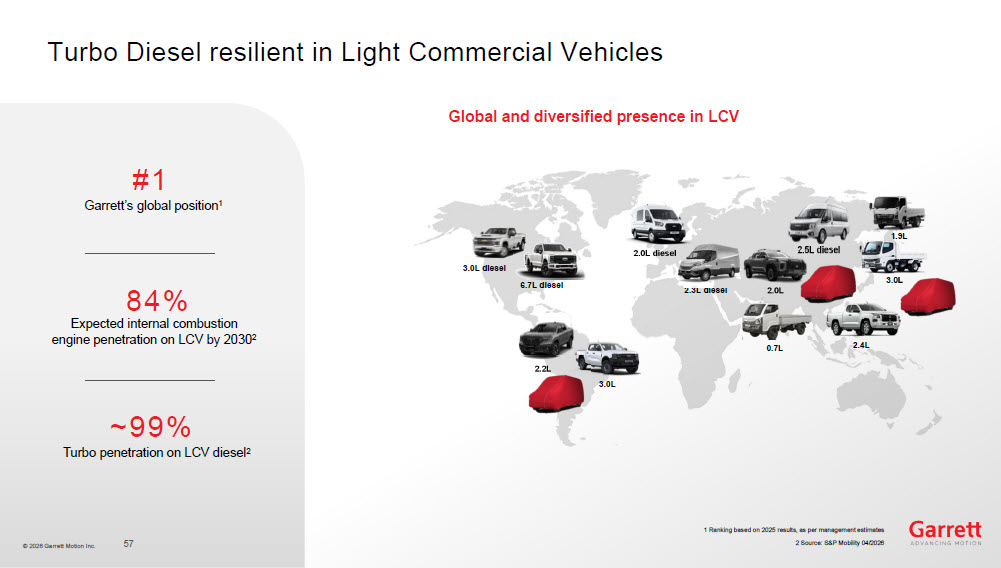
© 2026 Garrett Motion Inc. Turbo Diesel resilient in Light Commercial Vehicles 57 2.2L 3.0L diesel 2.0L diesel 2.3L diesel 3.0L 2.0L 0.7L 3.0L 6.7L diesel 2.5L diesel 1.9L 2.4L 1 Ranking based on 2025 results, as per management estimates 2 Source: S&P Mobility 04/2026 Global and diversified presence in LCV #1 Garrett’s global position 1 84% Expected internal combustion engine penetration on LCV by 2030 2 Turbo penetration on LCV diesel 2 ~99%
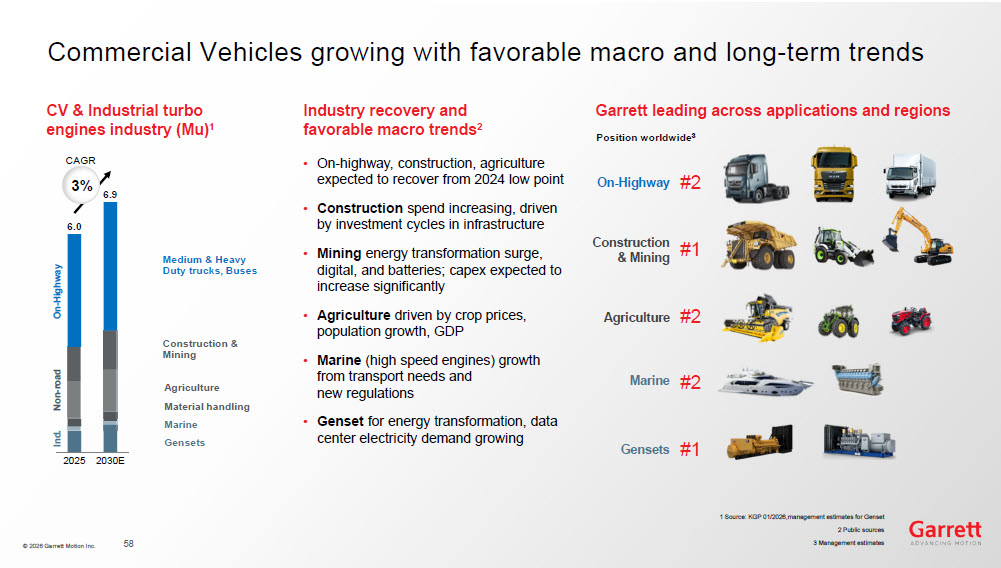
© 2026 Garrett Motion Inc. • On - highway, construction , agri culture expected to recover from 2024 low point • Construction spe n d increasing, driven by investment cycles in infrastructure • Mining energy tran s formation surge, digital , and batteries; capex expected to increase significantly • Agriculture driven by crop prices, population growth, GDP • Marine (high speed engines) growth from transport needs and new regulation s • Genset for energy tran s formation, d ata center electricity demand growing C V & Industrial t urbo engines industry (Mu) 1 Industry recovery and favorable macro trends 2 Garrett leading across applications and regions P osition worldwide 3 # 2 # 1 # 2 # 2 # 1 O n - Highway Construction & Mining Agriculture M arine Gensets Commercial Vehicles growing with favorable macro and long - term trends 2025 2030 E 6.0 6.9 O n - Highway N on - road Medium & Heavy Duty trucks, Buses Construction & Mining Agriculture Marine Gensets Material handling I nd . CAGR 3 % 1 Source: KGP 01/2026 ,management estimates for Gen s et 2 Public sources 3 Management estimates 58
© 2026 Garrett Motion Inc. Eric Fraysse Aftermarket
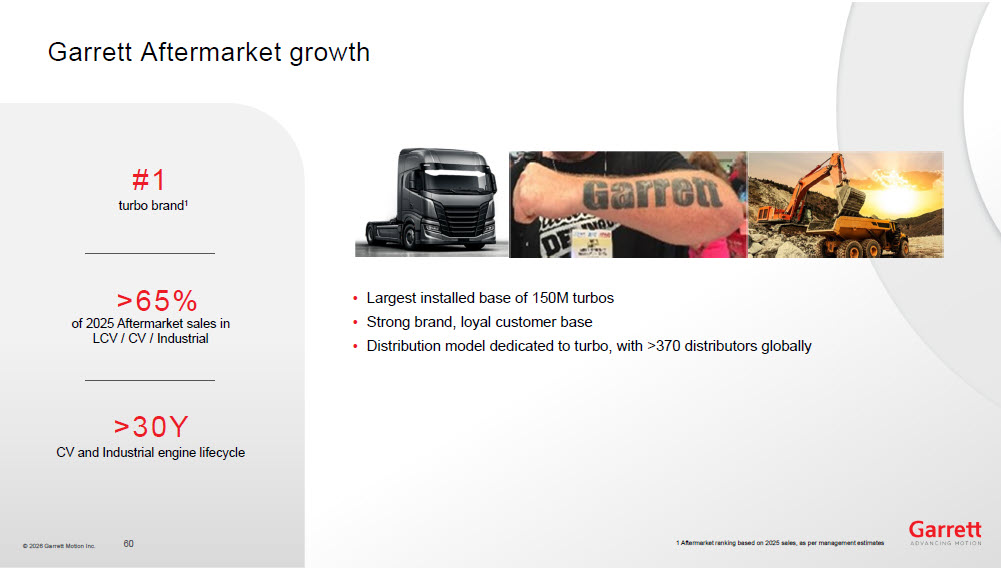
© 2026 Garrett Motion Inc. Garrett Aftermarket growth 60 #1 turbo brand 1 >65% of 2025 Aftermarket sales in LCV / CV / Industrial CV and Industrial engine lifecycle >30Y • Largest installed base of 150M turbos • Strong brand, loyal customer base • Distribution model dedicated to turbo, with > 3 7 0 distributors globally 1 Aftermarket ranking based on 2025 sales, as per management estimates
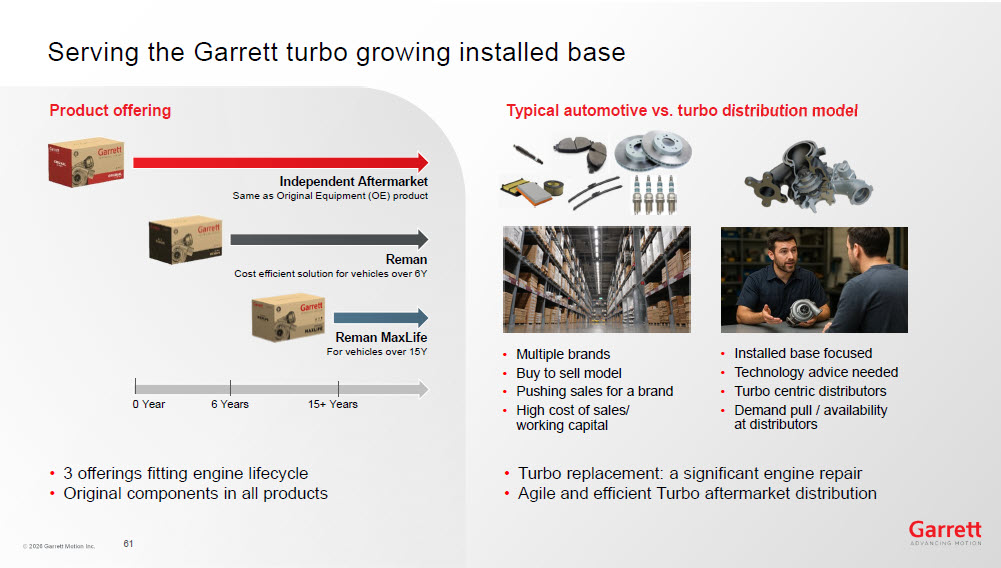
© 2026 Garrett Motion Inc. • 3 offering s fitting engine lifecycle • Original components in all products 0 Year 6 Years 15+ Years I ndependent Afterma r ket Same as O riginal E quipment (OE) p roduct Reman Cost efficient solution for vehicles over 6Y Reman MaxLife For vehicles over 15Y P roduct o ffering • Turbo replacement: a significant engine repair • Agile and efficient Turbo aftermarket distribution Typical automotive vs. turbo distribution model • Installed base focused • Technology advice needed • Turbo centric distributors • Demand pull / availability at distributors • Multiple brands • Buy to sell model • Pushing sales for a brand • High cost of sales/ working capital Serving the Garrett turbo growing installed base 61
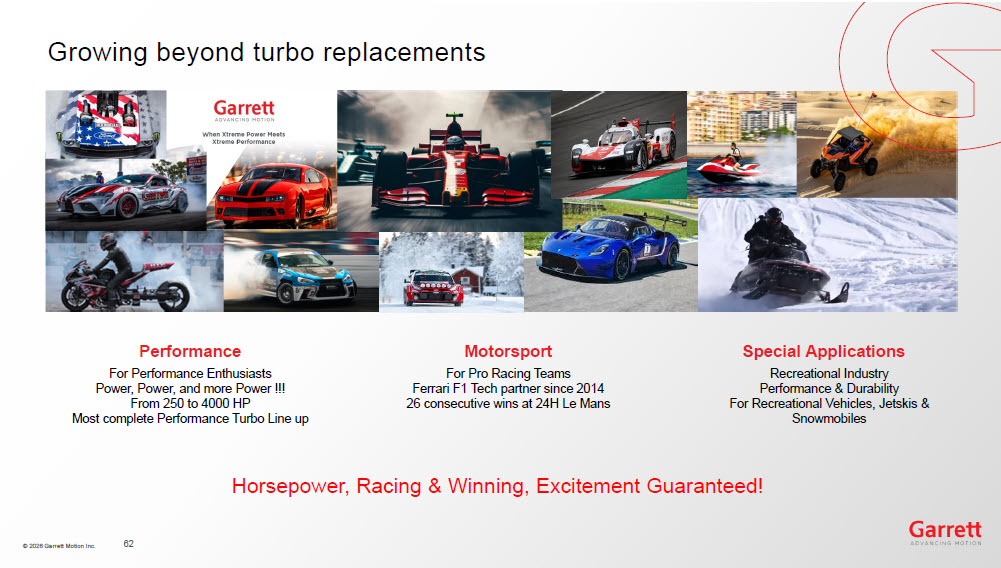
© 2026 Garrett Motion Inc. Performance Motorsport Special Applications For Performance Enthusiasts Power, Power, and more Power !!! From 250 to 4000 HP Most complete Performance Turbo Line up For Pro Racing Teams Ferrari F1 Tech partner since 2014 26 consecutive wins at 24H Le Mans Recreational Industry Performance & Durability For Recreational Vehicles, Jetskis & Snowmobiles Horsepower, Racing & W inning, Excitement Guaranteed! Growing beyond turbo replacements 62

© 2026 Garrett Motion Inc. Sean Deason The way Garrett delivers
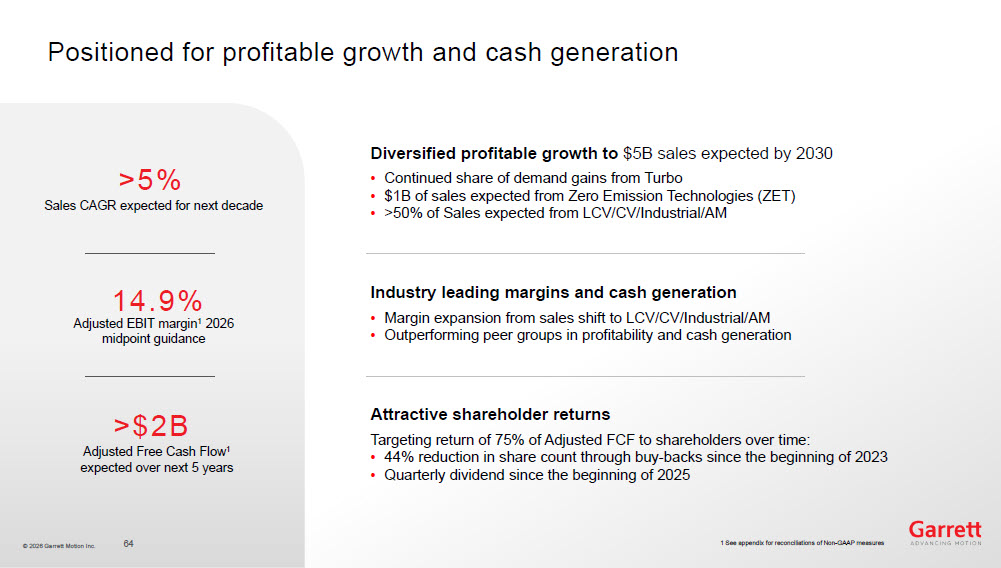
© 2026 Garrett Motion Inc. Positioned for profitable growth and cash generation 64 >5% Sales CAGR expected for next decade 14.9% Adjusted EBIT margin 1 2026 midpoint guidance Adjusted Free Cash Flow 1 expected over next 5 years >$2B 1 See appendix for reconciliations of Non - GAAP measures Diversified profitable growth to $5B sales expected by 2030 • Continued share of demand gains from Turbo • $1B of sales expected from Zero Emission Technologies (ZET) • >50% of Sales expected from LCV/ CV/Industrial/AM Industry leading margins and cash generation • Margin expansion from sales shift to LCV/ CV/Industrial/AM • Outperforming peer groups in profitability and cash generation Attractive shareholder returns Targeting return of 75% of Adjusted FCF to shareholders over time: • 44% reduction in share count through buy - backs since the beginning of 2023 • Quarterly dividend since the beginning of 2025
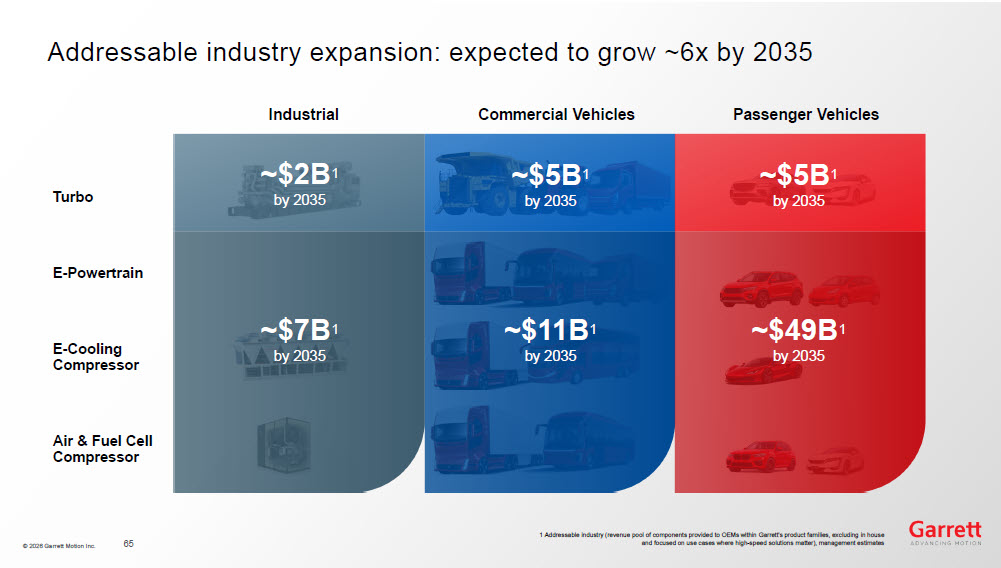
© 2026 Garrett Motion Inc. Addressable industry expansion: expected to grow ~6x by 2035 65 E - Powertrain E - Cooling Compressor Air & Fuel Cell Compressor Turbo Industrial Commercial Vehicles Passenger Vehicles 1 Addressable industry (revenue pool of components provided to OEMs within Garrett’s product families, excluding in house and focused on use cases where high - speed solutions matter), management estimates ~$49B 1 by 2035 ~$7B 1 by 2035 ~$2B 1 by 2035 ~$5B 1 by 2035 ~$5B 1 by 2035 ~$11B 1 by 2035
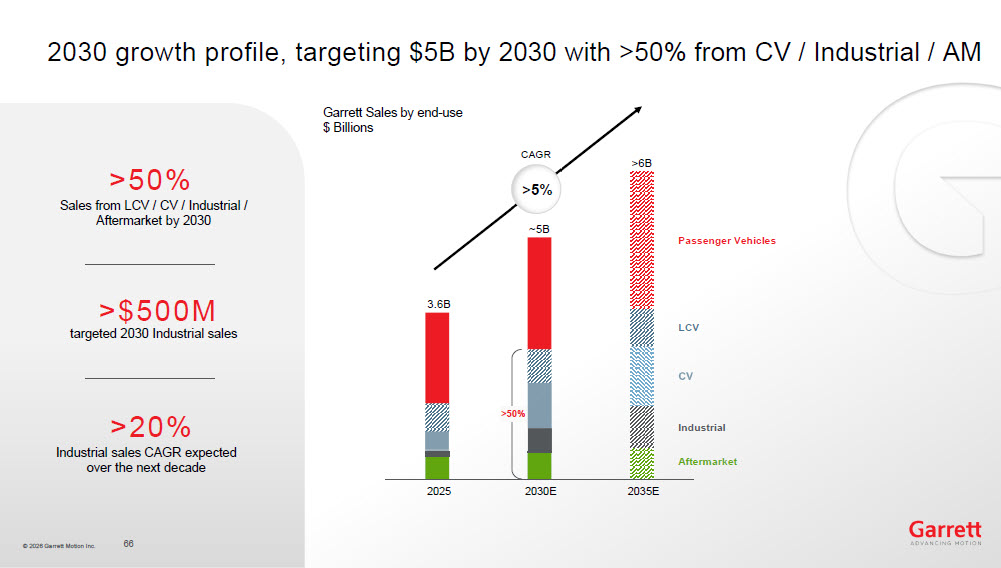
© 2026 Garrett Motion Inc. 2030 growth profile, targeting $5B by 2030 with >50% from CV / Industrial / AM Garrett Sales by end - use $ Billions >50% Sales from LCV / CV / Industrial / Aftermarket by 20 30 >$500M targeted 2030 Industrial sales Industrial sales CAGR expected over the next decade > 2 0 % >5% 2025 2030 E 2035 E 3.6 B ~ 5 B >6 B Passenger Vehicles LCV Industrial Aftermarket >50 % 66 CAGR
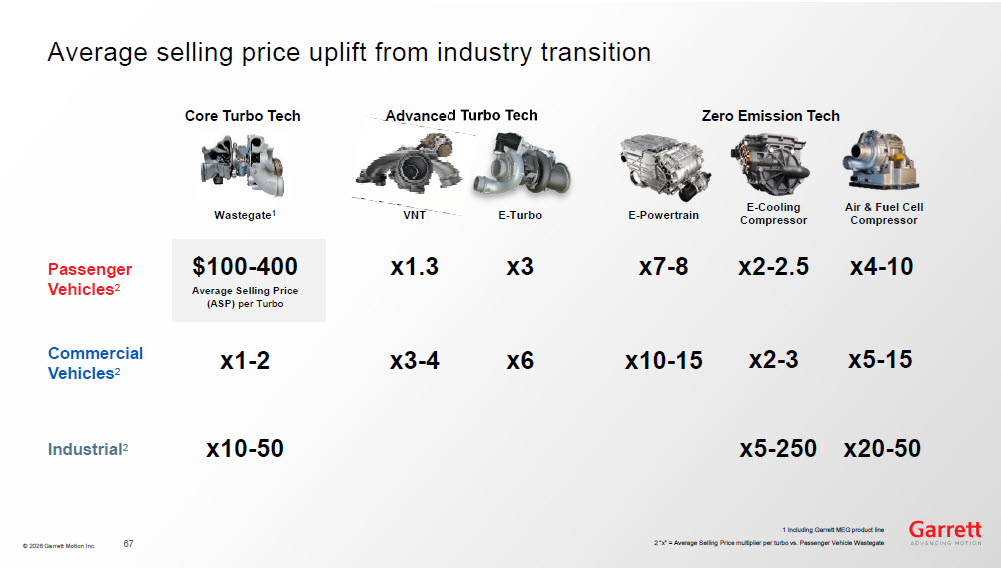
© 2026 Garrett Motion Inc. Average selling price uplift from industry transition Industrial 2 Passenger Vehicles 2 Commercial Vehicles 2 x3 x 6 x1.3 x3 - 4 Average Selling Price (ASP) per Turbo $100 - 400 x1 - 2 x1 0 - 50 x 4 - 10 x5 - 15 x 20 - 50 x7 - 8 x10 - 15 x2 - 3 x2 - 2.5 x 5 - 25 0 Advanced Turbo Tech E - Turbo VNT Wastegate 1 Core Turbo Tech Zero Emission Tech Air & Fuel Cell Compressor E - Powertrain E - Cooling Compressor 1 Including Garrett MEG product line 2 “ x ” = Average Selling Price multiplier per turbo vs. Passenger Vehicle Wastegate 67
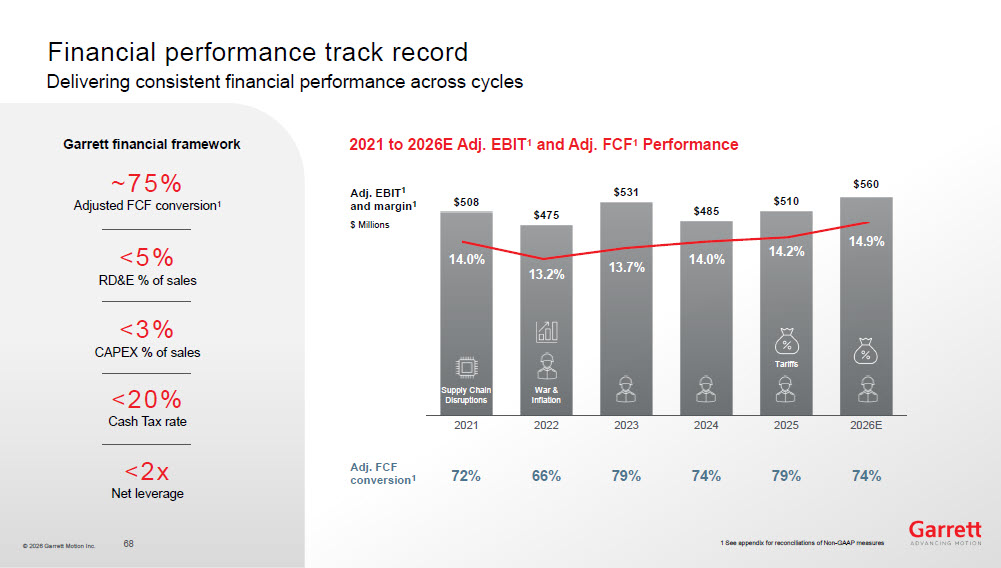
© 2026 Garrett Motion Inc. Financial performance track record ~75% Adjusted FCF conversion 1 < 5% RD&E % of sales < 3% CAPEX % of sales <20% Cash Tax rate <2x Net leverage 68 2021 to 2026E Adj. EBIT 1 and Adj. FCF 1 Performance Garrett financial framework $508 $475 $531 $485 $510 $560 2021 2022 2023 2024 2025 2026E Adj. FCF conversion 1 Adj. EBIT 1 and margin 1 $ Millions 72% 66% 79% 74% 79% 74% 14.0% 13.2% 13.7% 14.0% 14.2% 14.9% Supply Chain Disruptions War & Inflation Tariffs 1 See appendix for reconciliations of Non - GAAP measures Delivering consistent financial performance across cycles
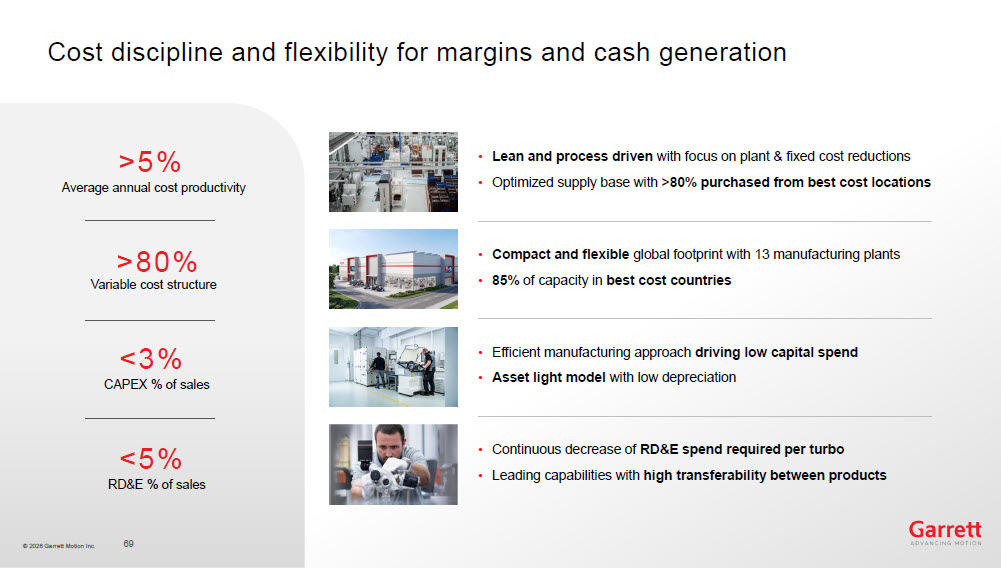
© 2026 Garrett Motion Inc. Cost discipline and flexibility for margins and cash generation 69 >5% Average annual cost productivity >80% Variable cost structure CAPEX % of sales <3% RD&E % of sales <5% • Lean and process driven with focus on plant & fixed cost reductions • Optimized supply base with >80% purchased from best cost locations • Continuous decrease of RD&E spend required per turbo • Leading capabilities with high transferability between products • Efficient manufacturing approach driving low capital spend • Asset light model with low depreciation • Compact and flexible global footprint with 13 manufacturing plants • 85% of capacity in best cost countries
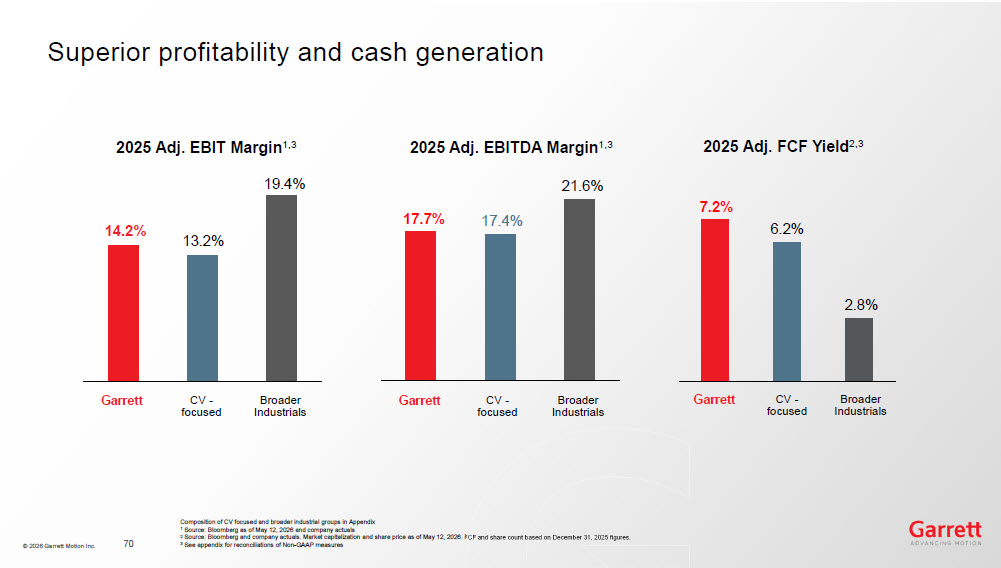
© 2026 Garrett Motion Inc. Superior profitability and cash generation 2025 Adj. EBITDA Margin 1,3 Garrett CV - focused Broader Industrials 17.7% 17.4% 21.6% 202 5 Adj. FCF Yield 2,3 Garrett CV - focused Broader Industrials 7.2% 6.2% 2.8% 70 2025 Adj. EBIT Margin 1,3 Garrett CV - focused Broader Industrials 14.2% 13.2% 19.4% Composition of CV focused and broader industrial groups in Appendix 1 Source: Bloomberg as of May 12, 2026 and company actuals 2 Source: Bloomberg and company actuals. Market capitalization and share price as of May 12, 2026. FCF and share count based on D ecember 31, 2025 figures. 3 See appendix for reconciliations of Non - GAAP measures
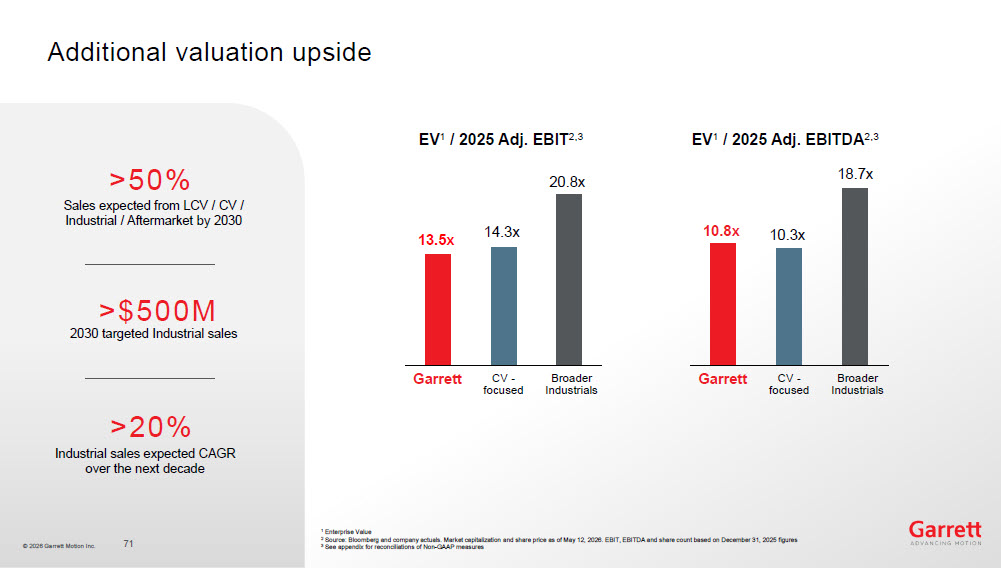
© 2026 Garrett Motion Inc. Additional valuation upside >50% Sales expected from LCV / CV / Industrial / Aftermarket by 2030 >$5 0 0M 2030 targeted Industrial sales Industrial sales expected CAGR over the next decade >20% 71 EV 1 / 2025 Adj. EBIT 2,3 13.5x 14.3x 20.8x Garrett CV - focused Broader Industrials EV 1 / 2025 Adj. EBITDA 2,3 10.8x 10.3x 18.7x Garrett CV - focused Broader Industrials 1 Enterprise Value 2 Source: Bloomberg and company actuals. Market capitalization and share price as of May 12, 2026. EBIT, EBITDA and share count b ased on December 31, 2025 figures 3 See appendix for reconciliations of Non - GAAP measures
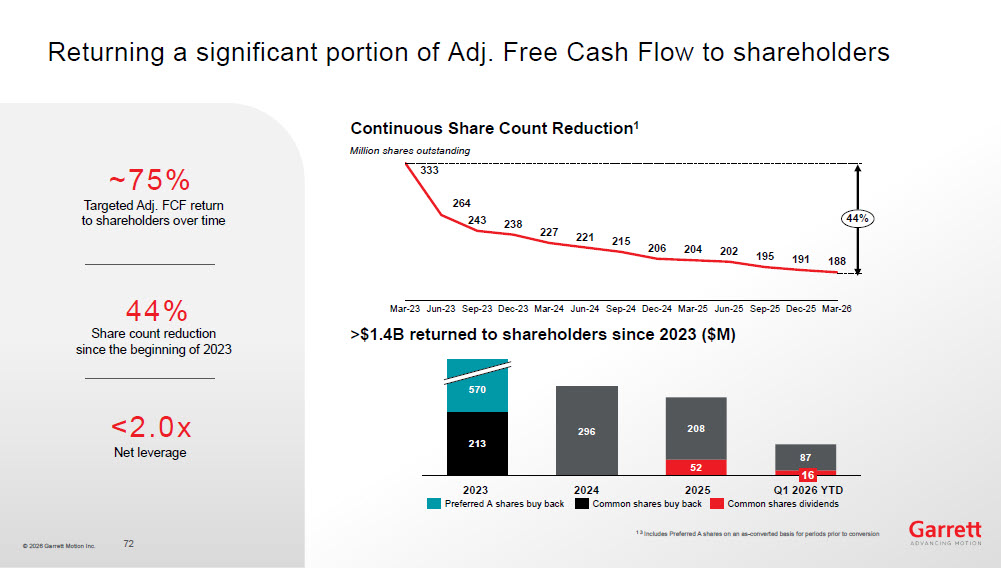
© 2026 Garrett Motion Inc. Returning a significant portion of Adj. Free Cash Flow to shareholders ~75% Targeted Adj. FCF return to shareholders over time 44% Share count reduction since the beginning of 2023 Net leverage <2.0x 72 Continuous Share Count Reduction 1 333 264 243 238 227 221 215 206 204 202 195 191 188 Mar - 23 Jun - 23 Sep - 23 Dec - 23 Mar - 24 Jun - 24 Sep - 24 Dec - 24 Mar - 25 Jun - 25 Sep - 25 Dec - 25 Mar - 26 44% Million shares outstanding >$1.4B returned to shareholders since 2023 ($M) 2023 2024 2025 Q1 2026 YTD Preferred A shares buy back Common shares buy back Common shares dividends 213 296 52 208 87 570 16 1 3 Includes Preferred A shares on an as - converted basis for periods prior to conversion

© 2026 Garrett Motion Inc. Olivier Rabiller Closing remarks
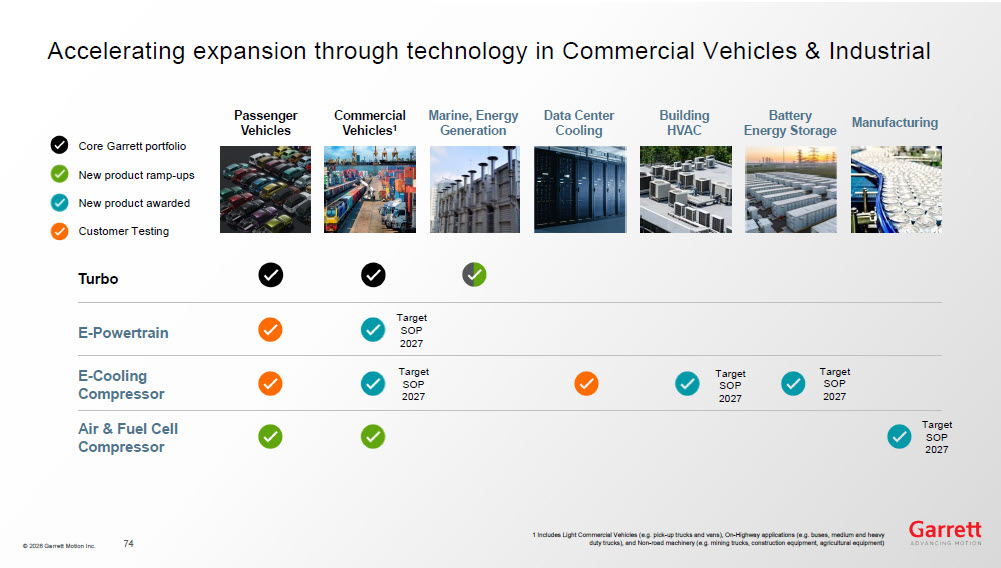
© 2026 Garrett Motion Inc. Accelerating expansion through technology in Commercial Vehicles & Industr ial New product ramp - up s New product awarded Customer Testing E - Powertrain E - Cooling Compressor Air & Fuel Cell Compress or Turbo Core Garrett portfolio Building HVAC Data Center Cooling Battery Energy Storage Manufacturing Commercial Vehicles 1 Passenger Vehicles Target SOP 2027 Marine, Energy Generation 1 Includes Light Commercial Vehicles (e.g. pick - up trucks and vans), On - Highway applications (e.g. buses, medium and heavy duty trucks), and Non - road machinery (e.g. mining trucks, construction equipment, agricultural equipment) 74 Target SOP 2027 Target SOP 2027 Target SOP 2027 Target SOP 2027

© 2026 Garrett Motion Inc. Accelerating a diversified, long - term growth portfolio Leading a resilient turbo industry 1 Ramping up in Zero Emission Tech for mobility Powering a differentiated technology portfolio Propelling growth Consistently delivering ~$1B s ales beyond t urbo expected by 2030 and ~$ 2.5 B by 2 03 5 >5% CAGR expected over next 10 years Full portfolio anticipated to be launched by 2027 Energy infrastructure, HVAC & air compression Turbo sales expected to be greater in 2035 than in 2025 Best - in - class performance and continuous transformation 1 Turbo ranking based on 2025 results, as per management estimates 75 Expanding further into Industrial compression © 2026 Garrett Motion Inc.
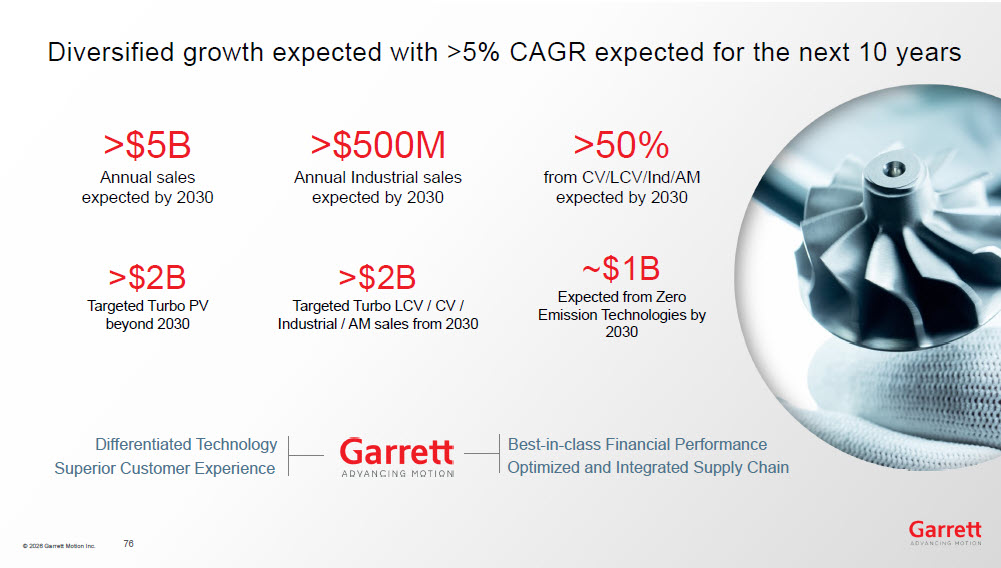
© 2026 Garrett Motion Inc. >$5B Annual sales expected by 2030 >50% from CV/LCV/Ind/AM expected by 2030 >$2B Targeted Turbo LCV / CV / Industrial / AM sales from 2030 >$2B Targeted Turbo PV beyond 2030 >$500M Annual Industrial sales expected by 2030 ~$1B Expected from Zero Emission Technologies by 2030 Diversified growth expected with >5% CAGR expected for the next 10 years 76 Differentiated Technology Superior Customer Experience Optimized and Integrated Supply Chain Best - in - class Financial Performance

© 2026 Garrett Motion Inc.

© 2026 Garrett Motion Inc. Welcome to the technology exhibit
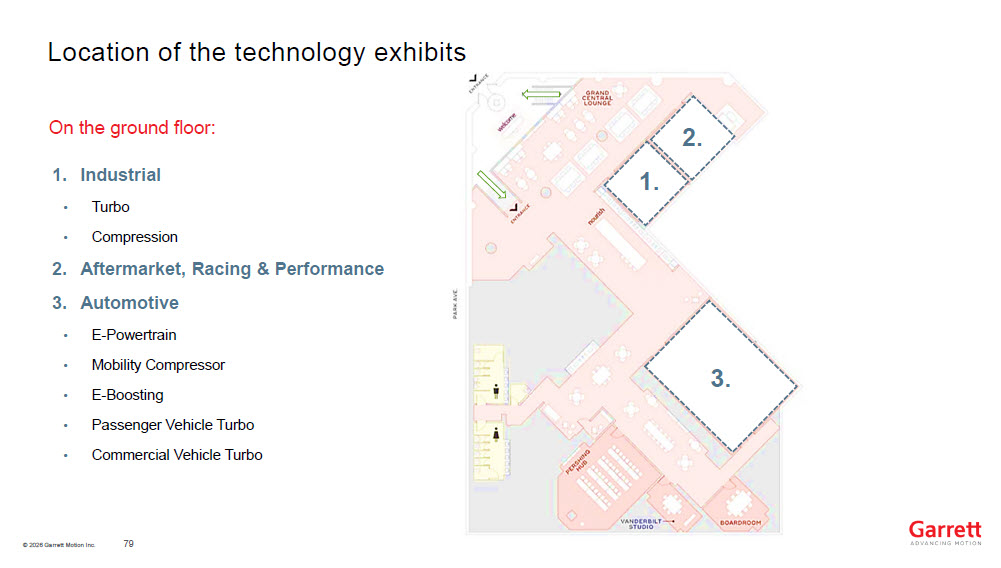
© 2026 Garrett Motion Inc. Location of the technology exhibits 1. Industrial • Turbo • Compression 2. Aftermarket, Racing & Performance 3. Automotive • E - Powertrain • Mobility Compressor • E - Boosting • Passenger Vehicle Turbo • Commercial Vehicle Turbo 2 . 3 . 1. On the ground floor: 79

© 2026 Garrett Motion Inc. Appendix 80
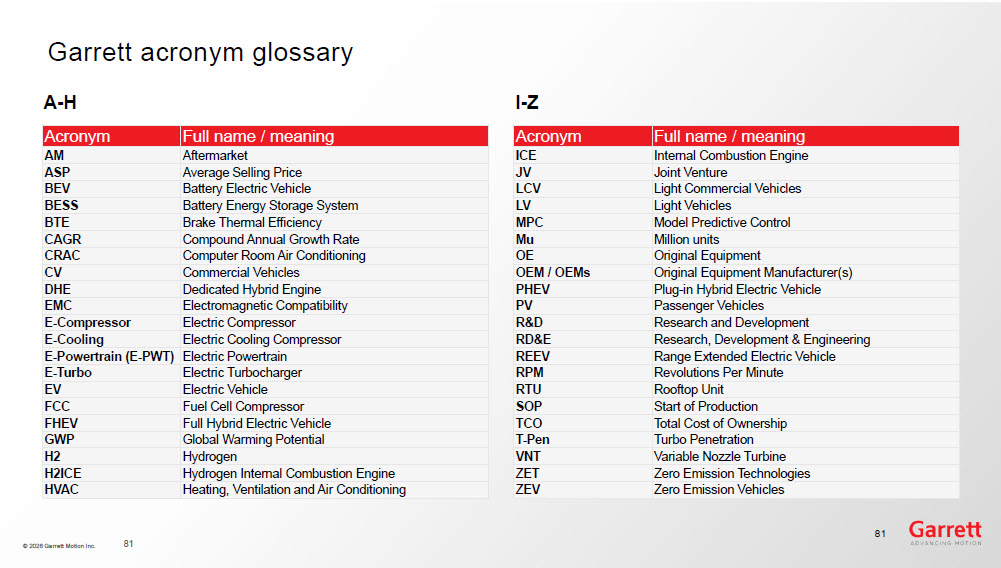
© 2026 Garrett Motion Inc. Garrett acronym glossary 81 Full name / meaning Acronym Aftermarket AM Average Selling Price ASP Battery Electric Vehicle BEV Battery Energy Storage System BESS Brake Thermal Efficiency BTE Compound Annual Growth Rate CAGR Computer Room Air Conditioning CRAC Commercial Vehicles CV Dedicated Hybrid Engine DHE Electromagnetic Compatibility EMC Electric Compressor E - Compressor Electric Cooling Compressor E - Cooling Electric Powertrain E - Powertrain (E - PWT) Electric Turbocharger E - Turbo Electric Vehicle EV Fuel Cell Compressor FCC Full Hybrid Electric Vehicle FHEV Global Warming Potential GWP Hydrogen H2 Hydrogen Internal Combustion Engine H2ICE Heating, Ventilation and Air Conditioning HVAC Full name / meaning Acronym Internal Combustion Engine ICE Joint Venture JV Light Commercial Vehicles LCV Light Vehicles LV Model Predictive Control MPC Million units Mu Original Equipment OE Original Equipment Manufacturer(s) OEM / OEMs Plug - in Hybrid Electric Vehicle PHEV Passenger Vehicles PV Research and Development R&D Research, Development & Engineering RD&E Range Extended Electric Vehicle REEV Revolutions Per Minute RPM Rooftop Unit RTU Start of Production SOP Total Cost of Ownership TCO Turbo Penetration T - Pen Variable Nozzle Turbine VNT Zero Emission Technologies ZET Zero Emission Vehicles ZEV A - H I - Z 81
© 2026 Garrett Motion Inc. Explanatory notes Charts on Slide 70 - 71: CV - focused: Allison Transmission, Cummins, Gates, Knorr Bremse, SAF - Holland Broader Industrials: Accelleron , Carrier, Johnson Controls, Lennox, SPX, Trane 82
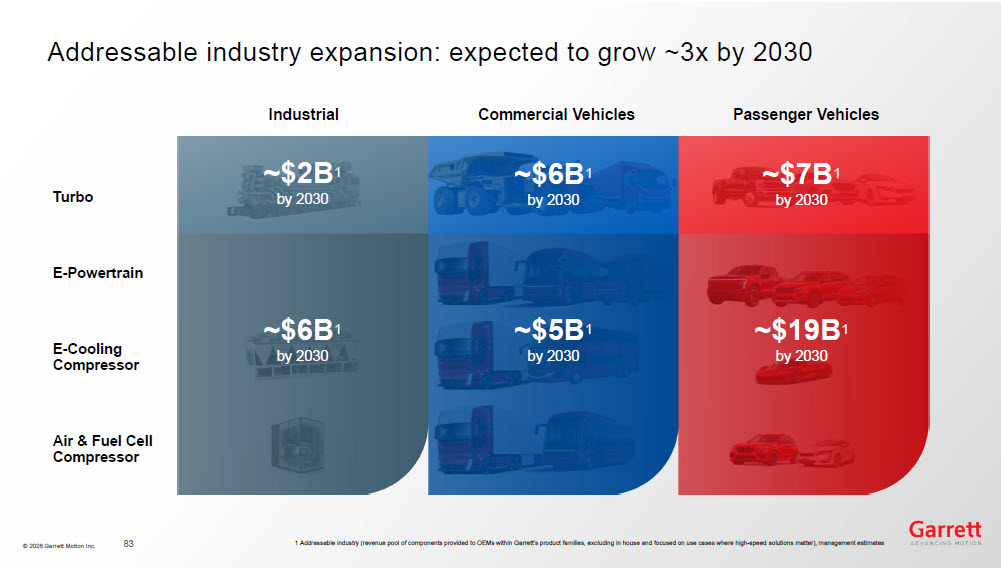
© 2026 Garrett Motion Inc. Addressable industry expansion: expected to grow ~3x by 2030 83 E - Powertrain E - Cooling Compressor Air & Fuel Cell Compressor Turbo Industrial Commercial Vehicles Passenger Vehicles 1 Addressable industry (revenue pool of components provided to OEMs within Garrett’s product families, excluding in house and f ocu sed on use cases where high - speed solutions matter), management estimates ~$ 19 B 1 by 203 0 ~$ 6 B 1 by 203 0 ~$2B 1 by 203 0 ~$ 7 B 1 by 203 0 ~$ 6 B 1 by 203 0 ~$ 5 B 1 by 203 0

© 2026 Garrett Motion Inc. Reconciliations 84
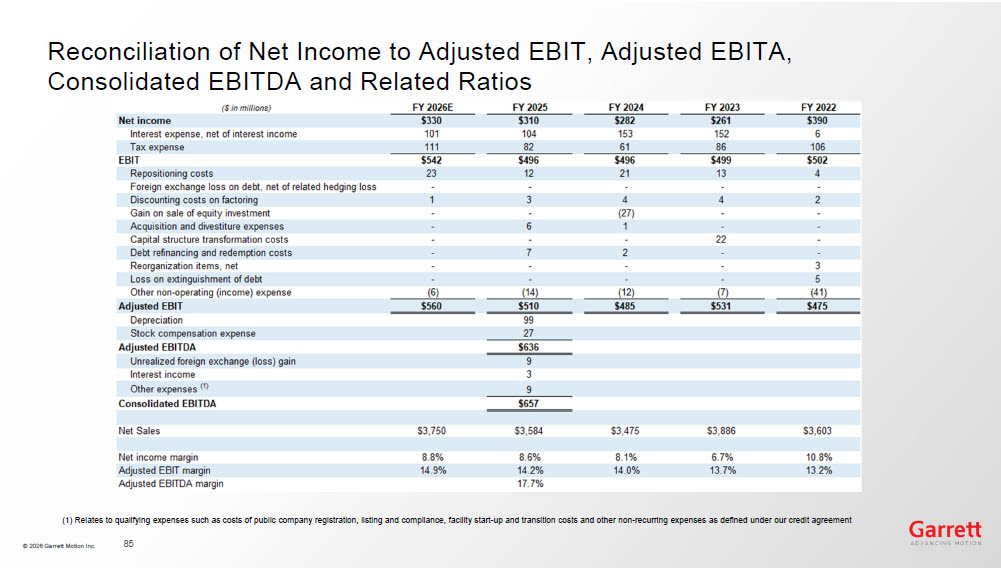
© 2026 Garrett Motion Inc. Reconciliation of Net Income to Adjusted EBIT, Adjusted EBITA, Consolidated EBITDA and Related Ratios (1) Relates to qualifying expenses such as costs of public company registration, listing and compliance, facility start - up and t ransition costs and other non - recurring expenses as defined under our credit agreement 85
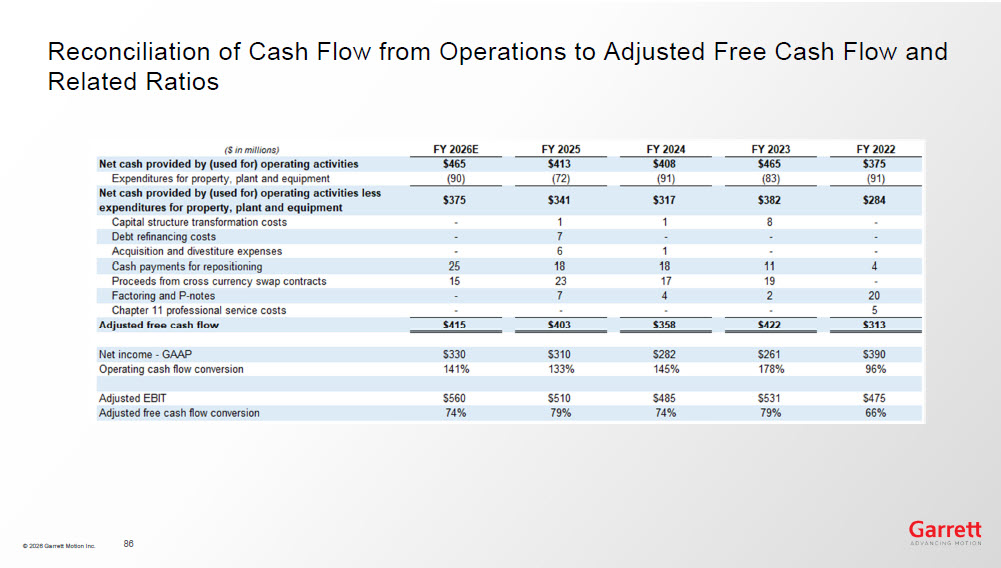
© 2026 Garrett Motion Inc. Reconciliation of Cash Flow from Operations to Adjusted Free Cash Flow and Related Ratios 86
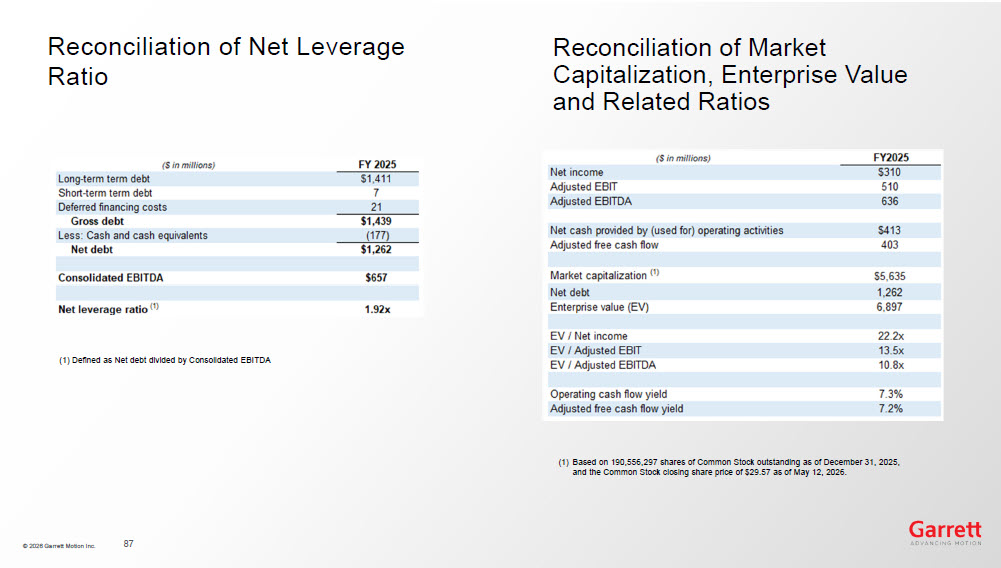
© 2026 Garrett Motion Inc. Reconciliation of Net Leverage Ratio (1) Defined as Net debt divided by Consolidated EBITDA Reconciliation of Market Capitalization, Enterprise Value and Related Ratios (1) Based on 190,556,297 shares of Common Stock outstanding as of December 31, 2025, and the Common Stock closing share price of $29.57 as of May 12, 2026. 87