NEW YORK — November 10 , 2025 — Blackstone Secured Lending Fund (NYSE: BXSL or the “Company”) today reported its third quarter 2025 results. Brad Marshall and Jonathan Bock, Co - Chief Executive Officers of Blackstone Secured Lending Fund, said, “ BXSL delivered another strong quarter, with both total investment income and net investment income reaching record levels on a dollar basis. Net investment in come per share was $0.82, exceeding our $0.77 quarterly dividend. Underlying fundamentals remained healthy with low non - accruals, support ed by a 97.5% first lien senior secured debt portfolio. New investment activity at over $1 billion achieved its highest level since t he fourth quarter of 2024, and we remain confident that BXSL is well positioned for active deployment in today’s dynamic market environment.” Blackstone Secured Lending Fund issued a full detailed presentation of its third quarter 2025 results, which can be viewed at www.bxsl.com . Dividend Declaration The Company's Board of Trustees has declared a fourth quarter 2025 dividend of $0.77 per share to shareholders of record as of December 31, 2025, payable on or about January 23, 2026 . Quarterly Investor Call Details Blackstone Secured Lending Fund will host its conference call today at 9:30 a.m. ET to discuss results. To register for the w ebc ast, please use the following link: https://event.webcasts.com/starthere.jsp?ei=1735598&tp_key=bf1794a57a Blackstone Secured Lending Fund 345 Park Avenue New York , NY 10154 T 212 583 5000 Blackstone Secured Lending Fund Reports Third Quarter 2025 Results 1
2 For those unable to listen to the live broadcast, there will be a webcast replay on the Shareholders section of BXSL’s websit e at https://ir.bxsl.com . About Blackstone Secured Lending Fund Blackstone Secured Lending Fund (NYSE: BXSL) is a specialty finance company that invests primarily in the debt of private U.S . c ompanies. As of September 30, 2025, BXSL’s fair value of investments was approximately $13.8 billion. BXSL has elected to be regulated as a business development company under the Investment Company Act of 1940, as amended. BXSL is externally managed by Blackstone Private Cr edi t Strategies LLC, an SEC - registered investment adviser that is an affiliate of Blackstone Inc. Blackstone Inc., together with its subsidiaries, is the world’s largest alternative investment firm with over $1.2 trillion of assets under management as of September 30, 2025. Forward - Looking Statements and Other Matters Certain information contained in this communication constitutes “forward - looking statements.” These forward - looking statements c an be identified by the use of forward - looking terminology, such as “outlook,” “indicator,” “believes,” “expects,” “potential,” “conti nues,” “may,” “can,” “could,” “will,” “should,” “seeks,” “approximately,” “predicts,” “intends,” “plans,” “estimates,” “anticipates”, “conf ide nt,” “conviction,” “identified” or the negative versions of these words or other comparable words thereof. These may include BXSL’s financial es tim ates and their underlying assumptions, statements about plans, statements regarding pending transactions, objectives and expectations wit h respect to future operations, statements regarding future performance, statements regarding economic and market trends and statements re garding identified but not yet closed investments. Such forward-looking statements are subject to various risks and uncertainties. Ac cor dingly, there are or will be important factors that could cause actual outcomes or results to differ materially from those indicated in suc h s tatements. BXSL believes these factors include but are not limited to those described under the section entitled “Risk Factors” in its prospe ctu s and annual report for the most recent fiscal year, and any such updated factors included in its periodic filings with the Securities and Ex change Commission (the “SEC”), which are accessible on the SEC’s website at www.sec.gov. These factors should not be construed as ex hau stive and should be read in conjunction with the other cautionary statements that are included in this document (or BXSL’s prospectus a nd other filings). Except as otherwise required by federal securities laws, BXSL undertakes no obligation to publicly update or revise an y forward - looking statements, whether as a result of new information, future developments or otherwise. Contacts Fund and Portfolio Inquiries Justin Farshidi Justin. Farshidi @blackstone.com +1 646 482 - 3823 Media Thomas Clements Thomas. Clements @blackstone.com +1 646 - 482 - 6088 Investors Stacy Wang, Head of Stakeholder Relations Blackstoneshareholderrelations@blackstone.co m
BXSL – Quarter Ended September 30, 2024 Blackstone Secured Lending Fund Third Quarter 2025 Results NOVEMBER 10, 2025 This presentation should be read in conjunction with BXSL’s latest quarterly report filed on Form 10 - Q for the period ended September 30, 2025. Numbers are approximate and may not add up due to rounding.
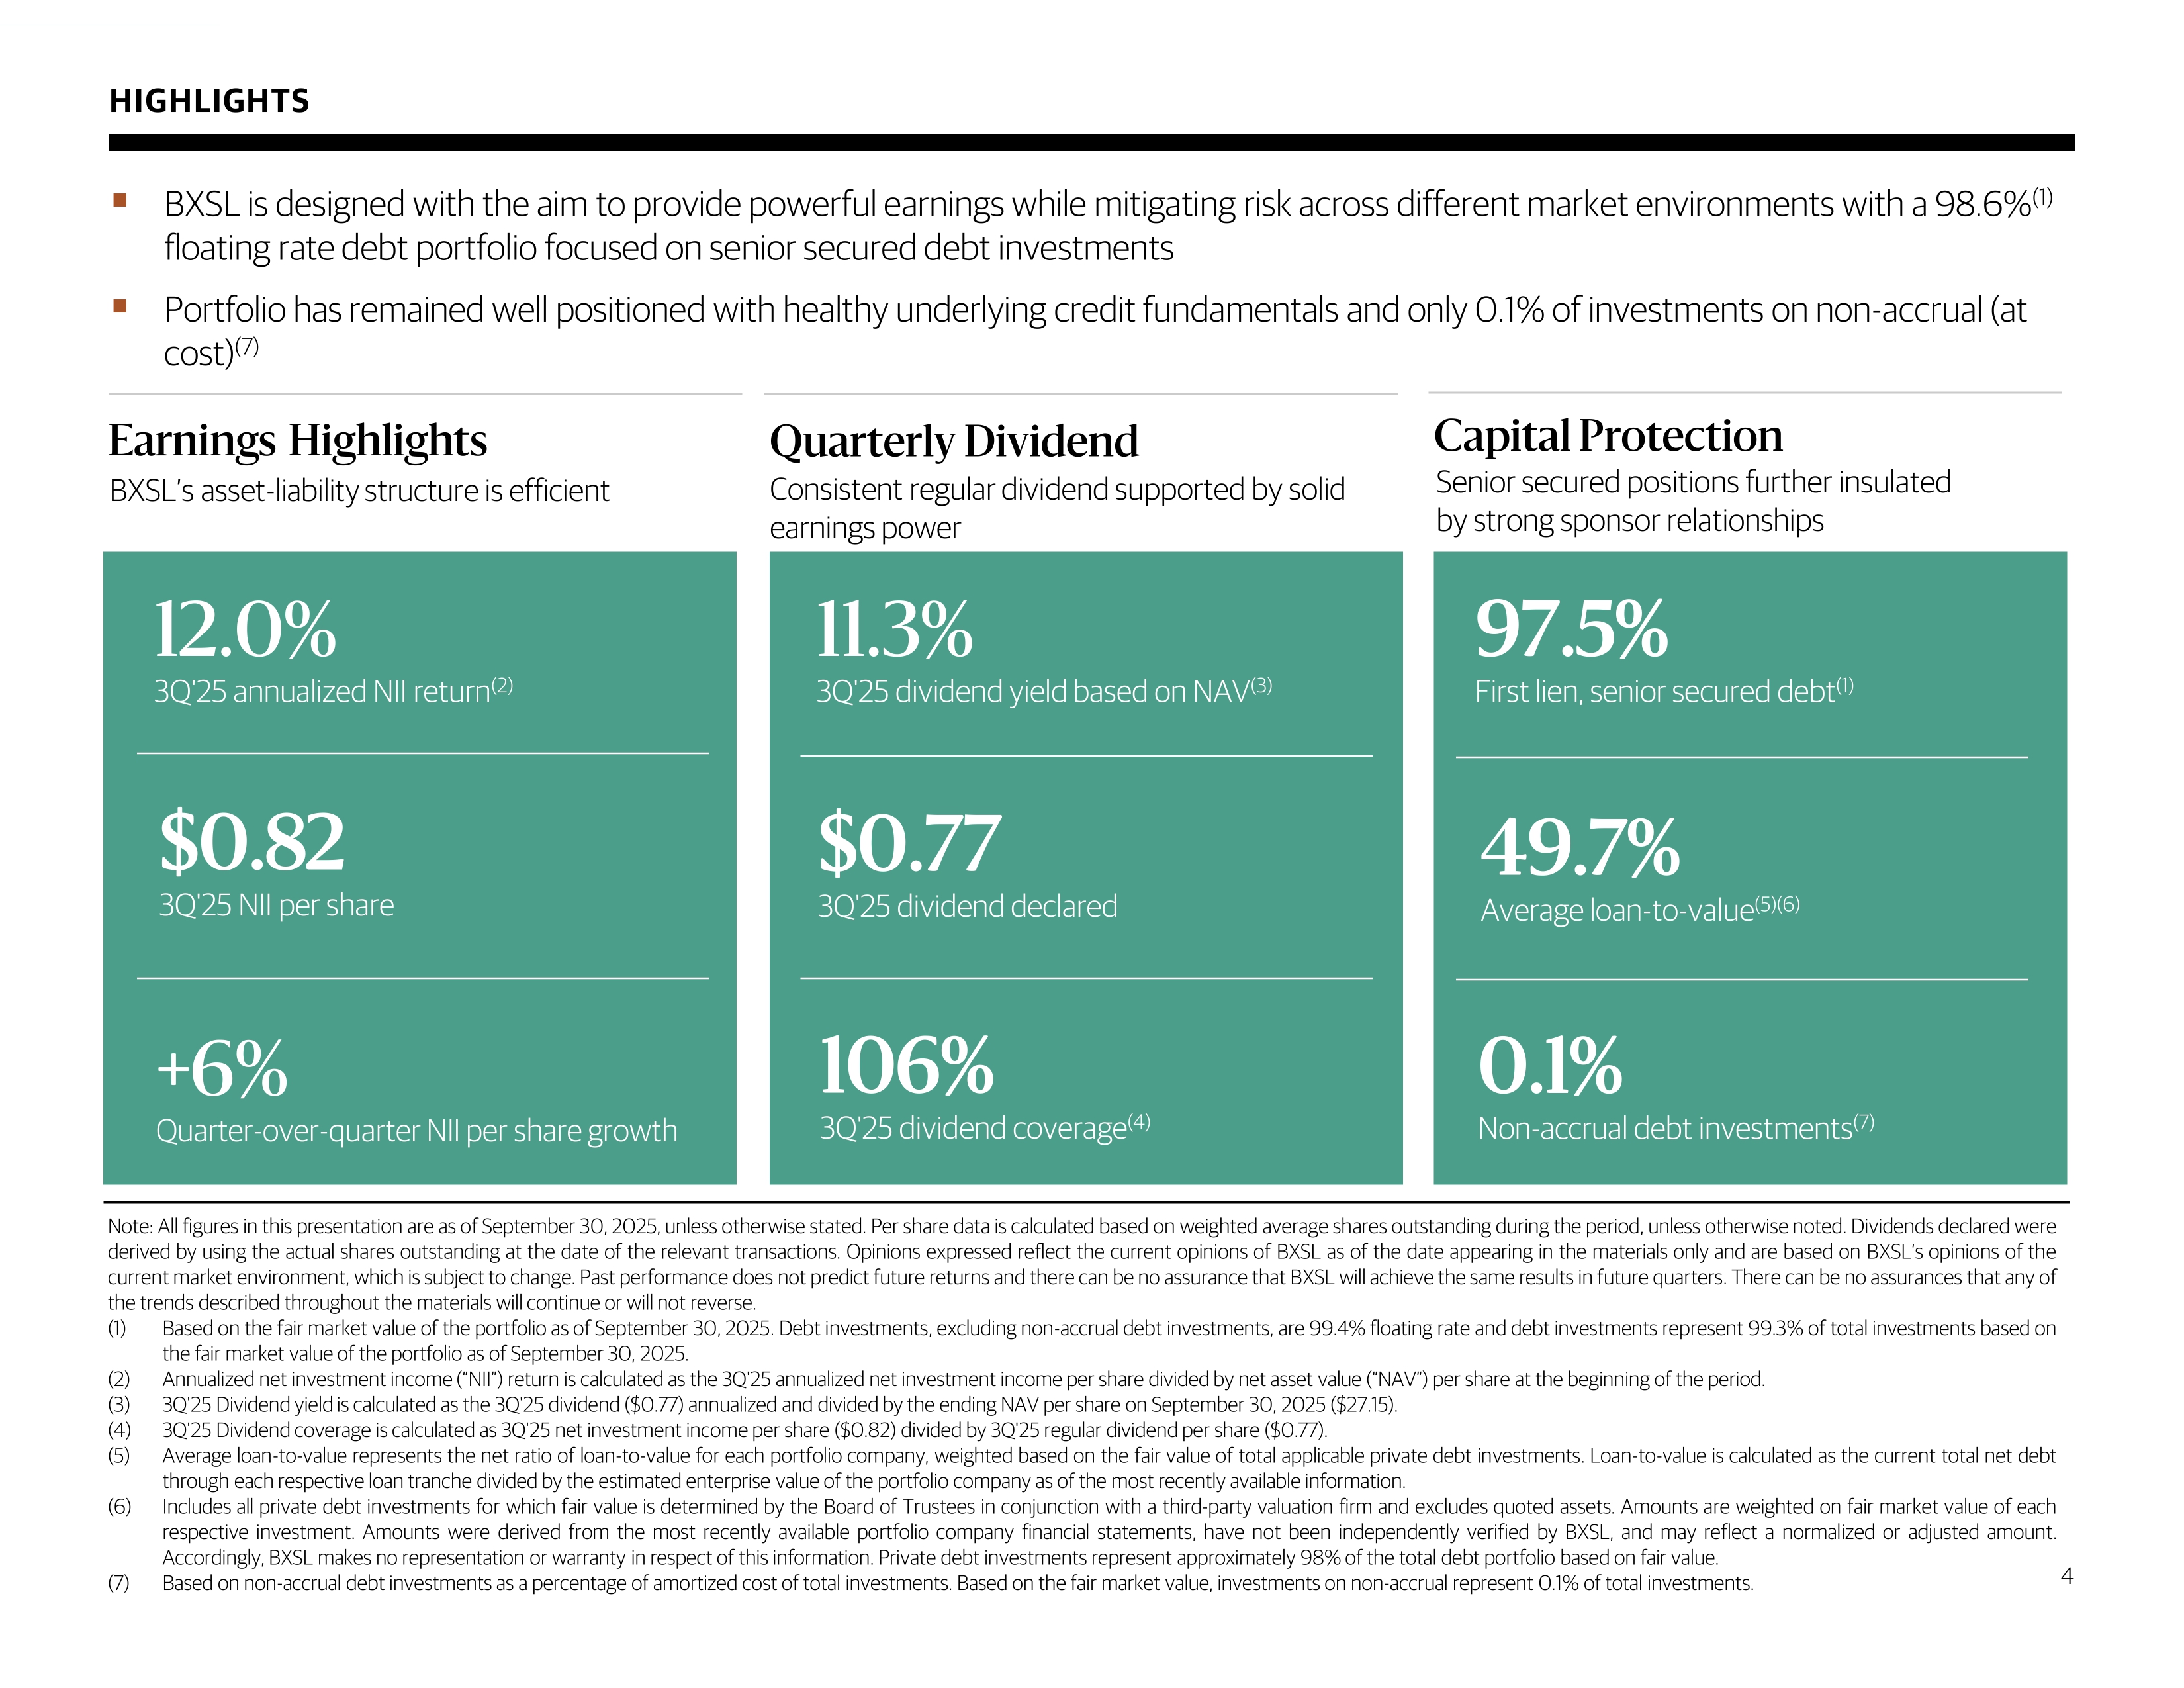
4 HIGHLIGHTS ▪ BXSL is designed with the aim to provide powerful earnings while mitigating risk across different market environments with a 98.6% ( 1) floating rate debt portfolio focused on senior secured debt investments ▪ Portfolio has remained well positioned with healthy underlying credit fundamentals and only 0.1% of investments on non - accrual (at cost) (7) Consistent, disciplined focus on low - leverage loans to strong sponsors BXSL’s asset - liability structure is efficient Note : All figures in this presentation are as of September 30 , 2025 , unless otherwise stated . Per share data is calculated based on weighted average shares outstanding during the period, unless otherwise noted . Dividends declared were derived by using the actual shares outstanding at the date of the relevant transactions . Opinions expressed reflect the current opinions of BXSL as of the date appearing in the materials only and are based on BXSL’s opinions of the current market environment, which is subject to change . Past performance does not predict future returns and there can be no assurance that BXSL will achieve the same results in future quarters . There can be no assurances that any of the trends described throughout the materials will continue or will not reverse . (1) Based on the fair market value of the portfolio as of September 30 , 2025 . Debt investments, excluding non - accrual debt investments, are 99 . 4 % floating rate and debt investments represent 99 . 3 % of total investments based on the fair market value of the portfolio as of September 30 , 2025 . (2) Annualized net investment income (“NII”) return is calculated as the 3 Q' 25 annualized net investment income per share divided by net asset value (“NAV”) per share at the beginning of the period . (3) 3 Q' 25 Dividend yield is calculated as the 3 Q' 25 dividend ( $ 0 . 77 ) annualized and divided by the ending NAV per share on September 30 , 2025 ( $ 27 . 15 ) . (4) 3 Q' 25 Dividend coverage is calculated as 3 Q' 25 net investment income per share ( $ 0 . 82 ) divided by 3 Q' 25 regular dividend per share ( $ 0 . 77 ) . (5) Average loan - to - value represents the net ratio of loan - to - value for each portfolio company, weighted based on the fair value of total applicable private debt investments . Loan - to - value is calculated as the current total net debt through each respective loan tranche divided by the estimated enterprise value of the portfolio company as of the most recently available information . (6) Includes all private debt investments for which fair value is determined by the Board of Trustees in conjunction with a third - party valuation firm and excludes quoted assets . Amounts are weighted on fair market value of each respective investment . Amounts were derived from the most recently available portfolio company financial statements, have not been independently verified by BXSL, and may reflect a normalized or adjusted amount . Accordingly, BXSL makes no representation or warranty in respect of this information . Private debt investments represent approximately 98 % of the total debt portfolio based on fair value . (7) Based on non - accrual debt investments as a percentage of amortized cost of total investments . Based on the fair market value, investments on non - accrual represent 0 . 1 % of total investments . Earnings Highlights Quarterly Dividend Consistent regular dividend supported by solid earnings power Senior secured positions further insulated by strong sponsor relationships Capital Protection 12.0% 3Q'25 annualized NII return (2) $ 0.82 3Q'25 NII per share + 6% Quarter - over - quarter NII per share growth 11.3% 3Q'25 dividend yield based on NAV (3) $ 0.77 3Q'25 dividend declared 106% 3Q'25 dividend coverage (4) 97.5% First lien, senior secured debt (1) 49.7% Average loan - to - value (5)(6) 0.1% Non - accrual debt investments (7)
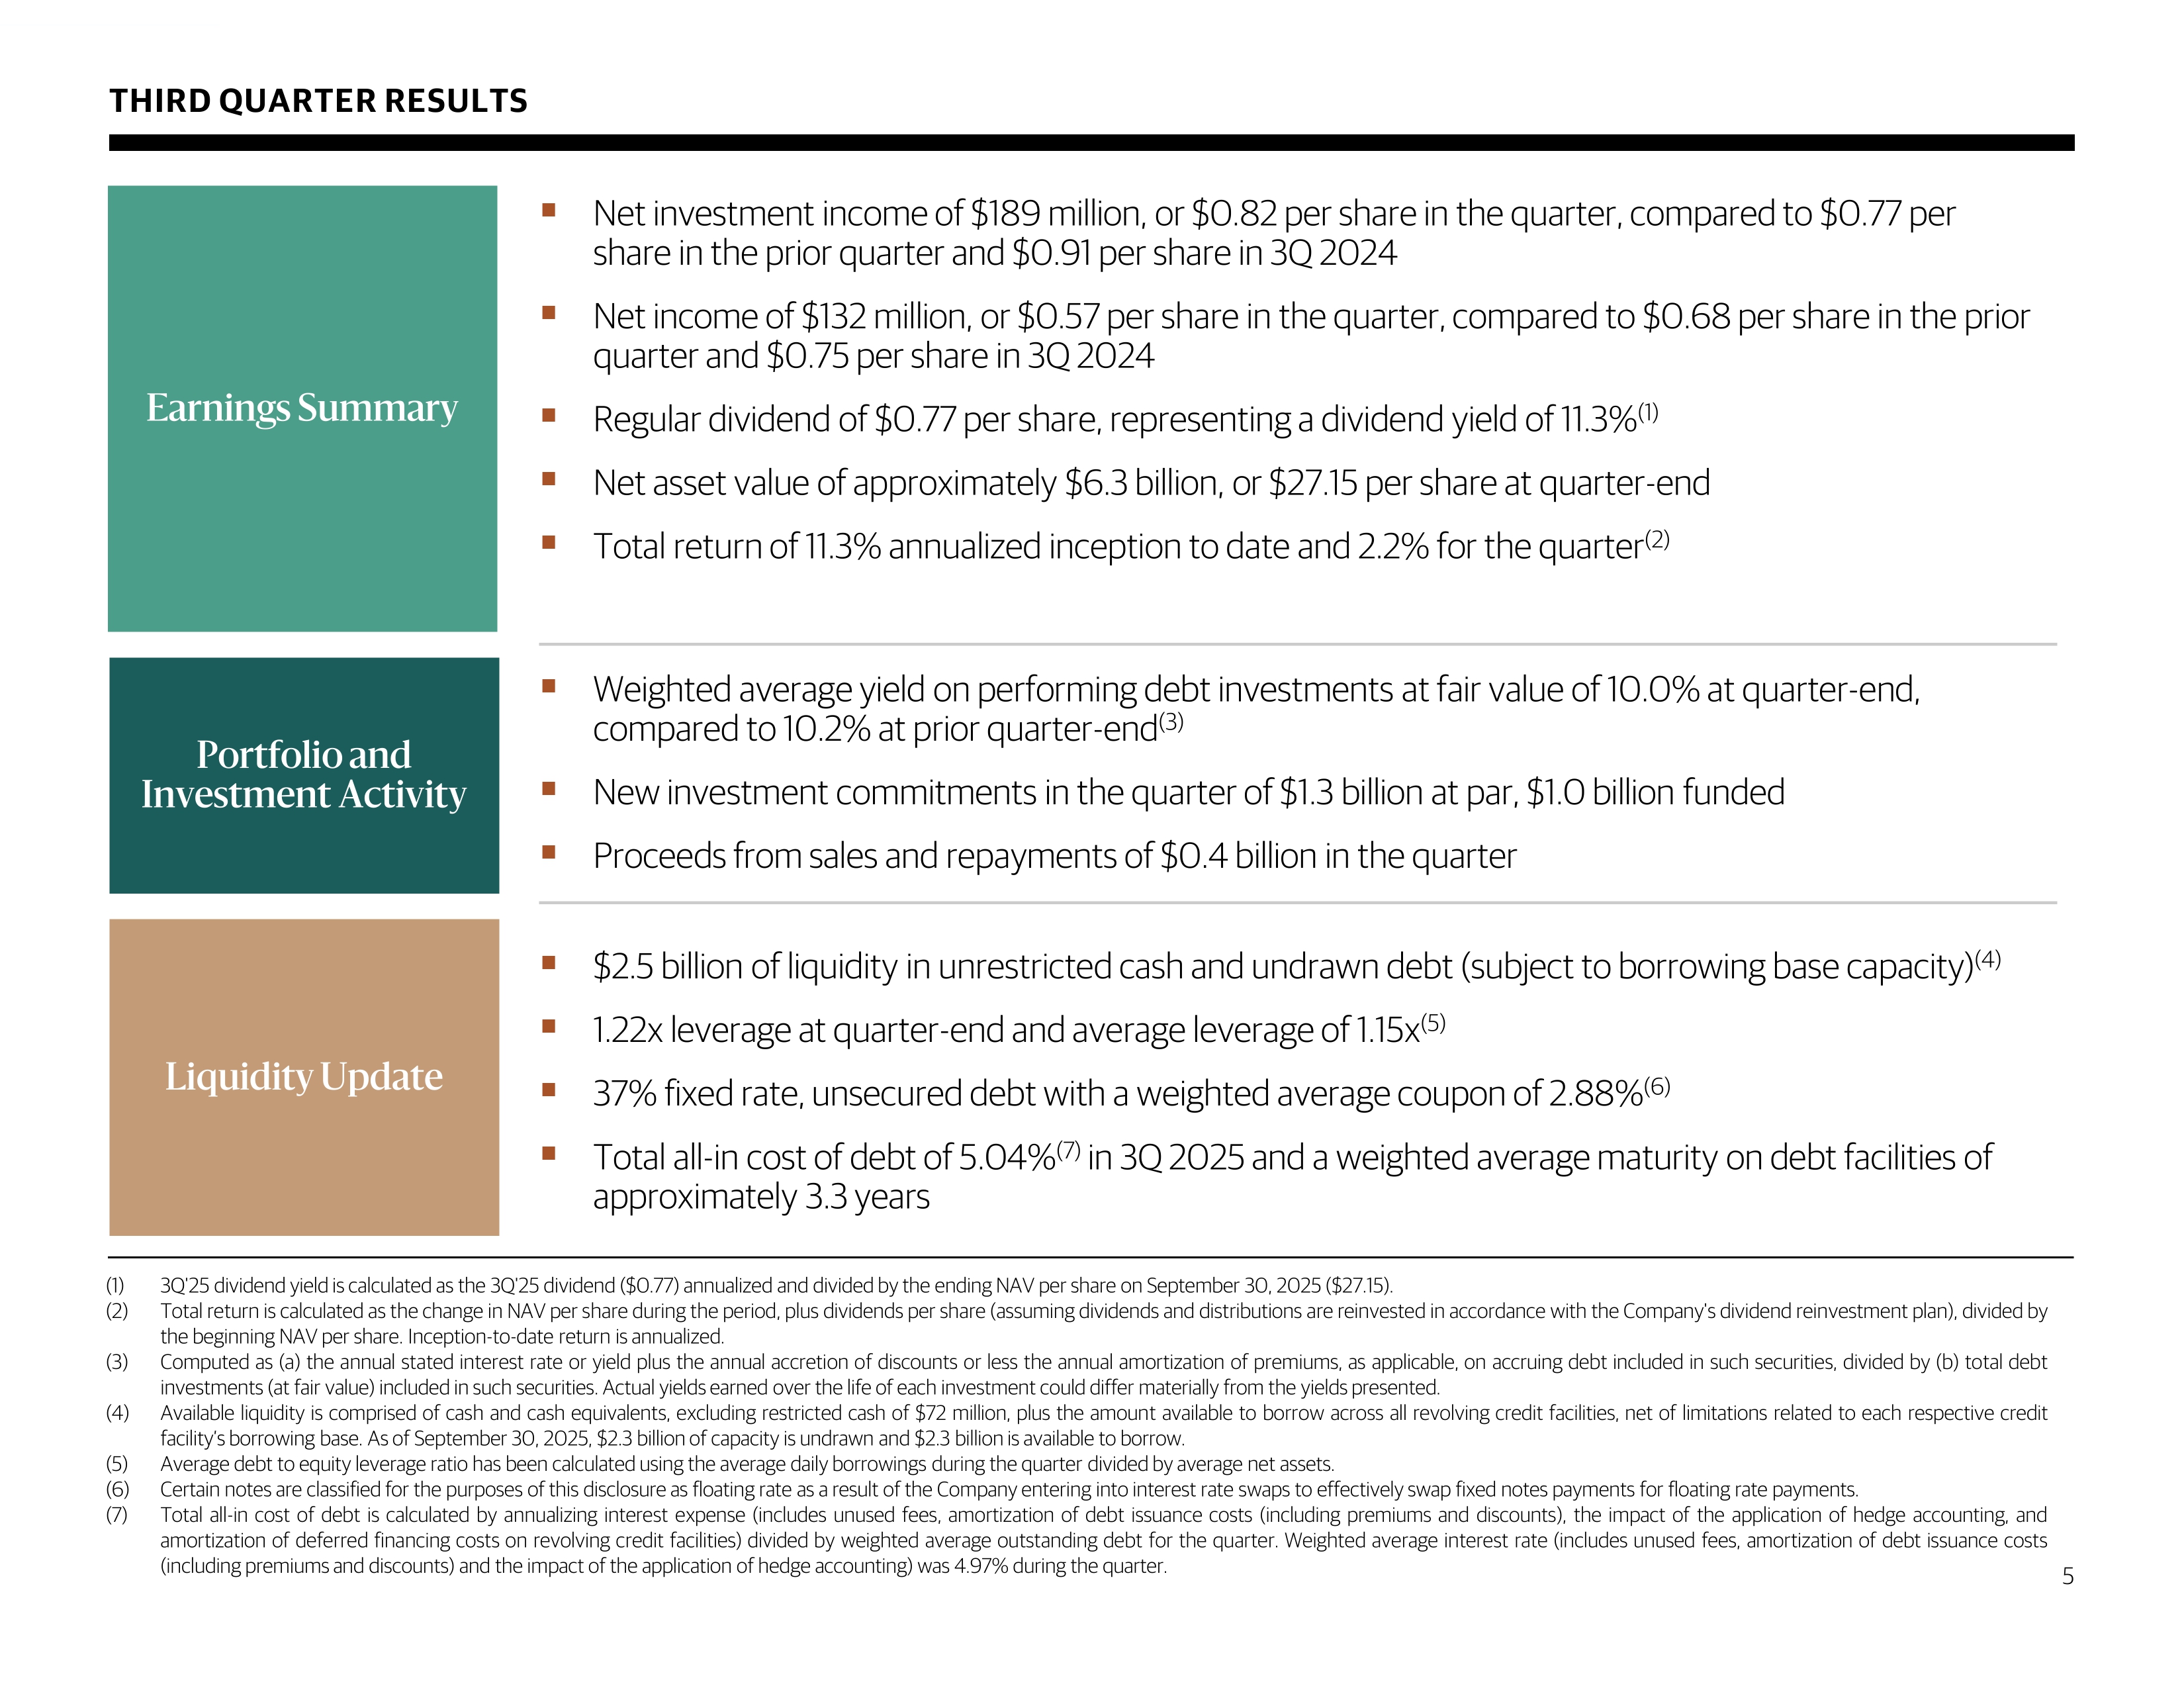
Portfolio and Investment Activity ▪ Weighted average yield on performing debt investments at fair value of 10.0% at quarter - end, compared to 10.2% at prior quarter - end (3) ▪ New investment commitments in the quarter of $ 1.3 billion at par, $ 1.0 billion funded ▪ Proceeds from sales and repayments of $ 0.4 billion in the quarter Earnings Summary ▪ Net investment income of $ 189 million , or $ 0.82 per share in the quarter, compared to $ 0.77 per share in the prior quarter and $ 0.91 per share in 3Q 2024 ▪ Net income of $ 132 million, or $ 0.57 per share in the quarter, compared to $ 0.68 per share in the prior quarter and $ 0.75 per share in 3Q 2024 ▪ Regular dividend of $ 0.77 per share, representing a dividend yield of 11.3% (1) ▪ Net asset value of approximately $ 6.3 billion, or $ 27.15 per share at quarter - end ▪ Total return of 11.3% annualized inception to date and 2.2% for the quarter (2) (1) 3 Q' 25 dividend yield is calculated as the 3 Q' 25 dividend ( $ 0 . 77 ) annualized and divided by the ending NAV per share on September 30 , 2025 ( $ 27 . 15 ) . (2) Total return is calculated as the change in NAV per share during the period, plus dividends per share (assuming dividends and distributions are reinvested in accordance with the Company's dividend reinvestment plan), divided by the beginning NAV per share . Inception - to - date return is annualized . (3) Computed as (a) the annual stated interest rate or yield plus the annual accretion of discounts or less the annual amortization of premiums, as applicable, on accruing debt included in such securities, divided by (b) total debt investments (at fair value) included in such securities . Actual yields earned over the life of each investment could differ materially from the yields presented . (4) Available liquidity is comprised of cash and cash equivalents, excluding restricted cash of $ 72 million, plus the amount available to borrow across all revolving credit facilities, net of limitations related to each respective credit facility’s borrowing base . As of September 30 , 2025 , $ 2 . 3 billion of capacity is undrawn and $ 2 . 3 billion is available to borrow . (5) Average debt to equity leverage ratio has been calculated using the average daily borrowings during the quarter divided by average net assets . (6) Certain notes are classified for the purposes of this disclosure as floating rate as a result of the Company entering into interest rate swaps to effectively swap fixed notes payments for floating rate payments . (7) Total all - in cost of debt is calculated by annualizing interest expense (includes unused fees, amortization of debt issuance costs (including premiums and discounts), the impact of the application of hedge accounting, and amortization of deferred financing costs on revolving credit facilities) divided by weighted average outstanding debt for the quarter . Weighted average interest rate (includes unused fees, amortization of debt issuance costs (including premiums and discounts) and the impact of the application of hedge accounting) was 4 . 97 % during the quarter . THIRD QUARTER RESULTS 5 Liquidity Update ▪ $ 2.5 billion of liquidity in unrestricted cash and undrawn debt (subject to borrowing base capacity) (4) ▪ 1.22x leverage at quarter - end and average leverage of 1.15x (5) ▪ 37% fixed rate, unsecured debt with a weighted average coupon of 2.88% (6) ▪ Total all - in cost of debt of 5.04% (7) in 3Q 2025 and a weighted average maturity on debt facilities of approximately 3.3 years
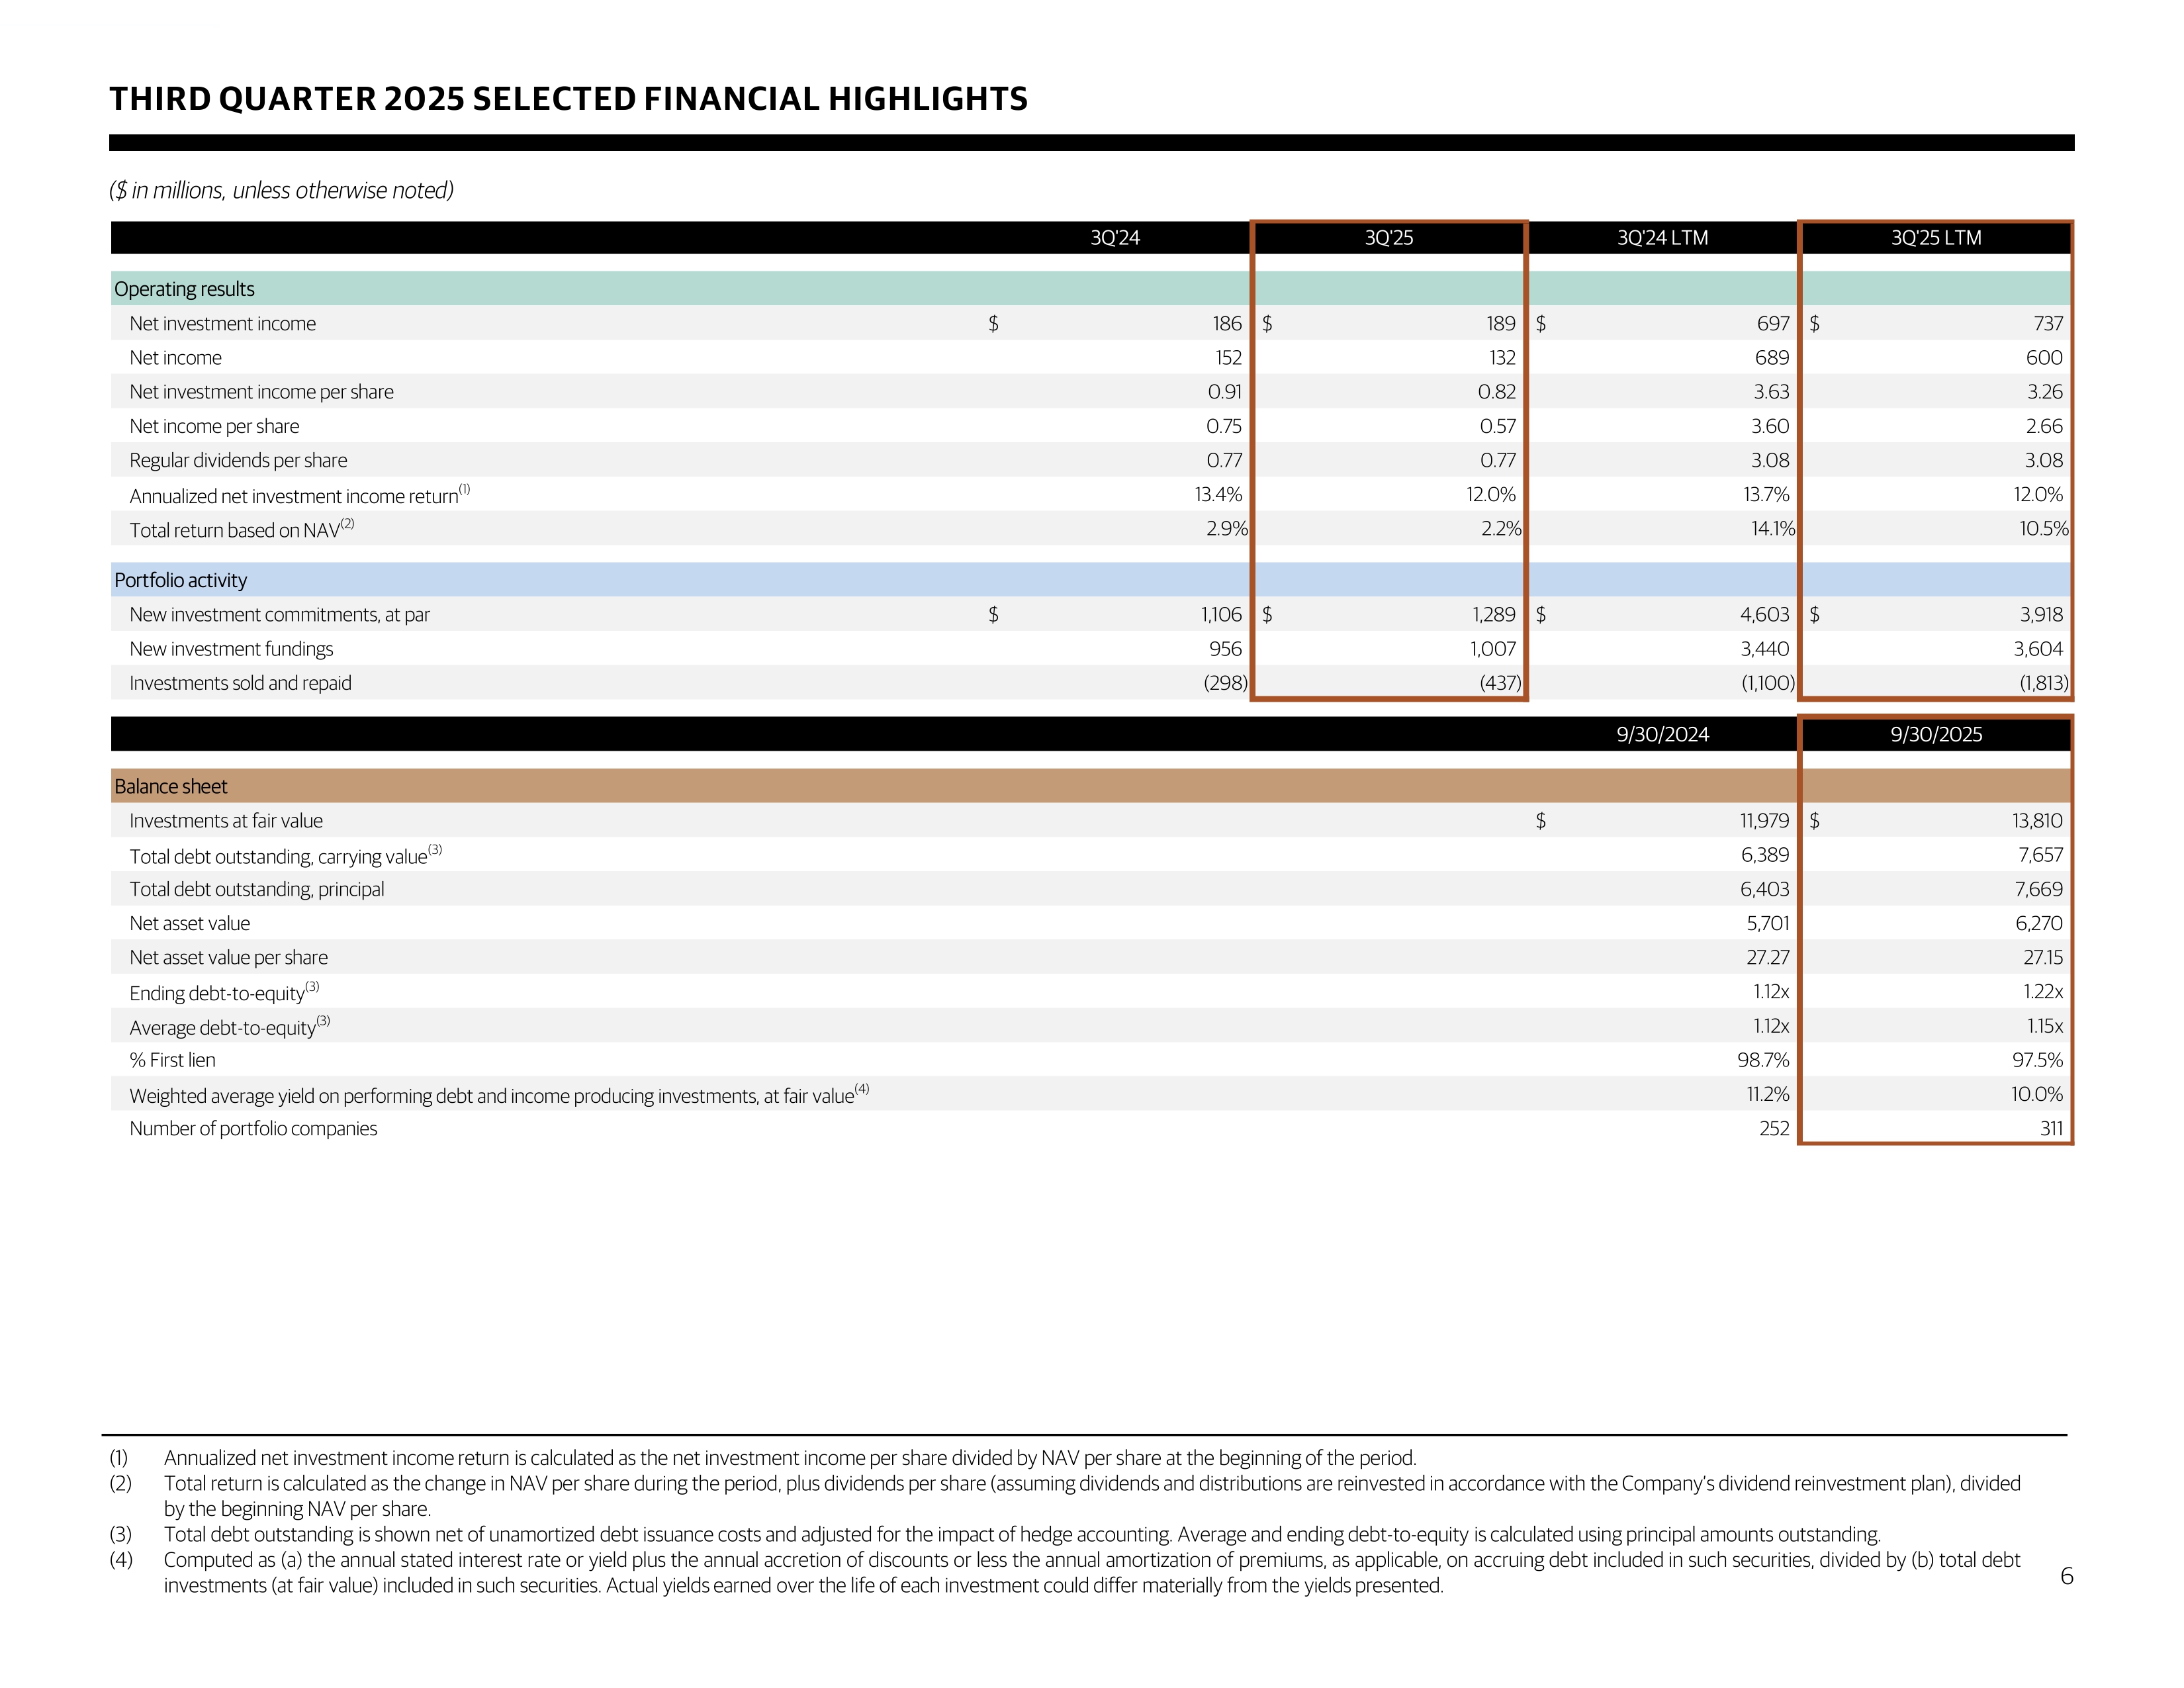
(1) Annualized net investment income return is calculated as the net investment income per share divided by NAV per share at the beginning of the period . (2) Total return is calculated as the change in NAV per share during the period, plus dividends per share (assuming dividends and distributions are reinvested in accordance with the Company’s dividend reinvestment plan), divided by the beginning NAV per share . (3) Total debt outstanding is shown net of unamortized debt issuance costs and adjusted for the impact of hedge accounting . Average and ending debt - to - equity is calculated using principal amounts outstanding . (4) Computed as (a) the annual stated interest rate or yield plus the annual accretion of discounts or less the annual amortization of premiums, as applicable, on accruing debt included in such securities, divided by (b) total debt investments (at fair value) included in such securities . Actual yields earned over the life of each investment could differ materially from the yields presented . THIRD QUARTER 2025 SELECTED FINANCIAL HIGHLIGHTS ($ in millions, unless otherwise noted) 6 3Q'24 3Q'25 3Q'24 LTM 3Q'25 LTM Operating results Net investment income 186$ 189$ 697$ 737$ Net income 152 132 689 600 Net investment income per share 0.91 0.82 3.63 3.26 Net income per share 0.75 0.57 3.60 2.66 Regular dividends per share 0.77 0.77 3.08 3.08 Annualized net investment income return (1) 13.4% 12.0% 13.7% 12.0% Total return based on NAV (2) 2.9% 2.2% 14.1% 10.5% Portfolio activity New investment commitments, at par 1,106$ 1,289$ 4,603$ 3,918$ New investment fundings 956 1,007 3,440 3,604 Investments sold and repaid (298) (437) (1,100) (1,813) 9/30/2024 9/30/2025 Balance sheet Investments at fair value 11,979$ 13,810$ Total debt outstanding, carrying value (3) 6,389 7,657 Total debt outstanding, principal 6,403 7,669 Net asset value 5,701 6,270 Net asset value per share 27.27 27.15 Ending debt-to-equity (3) 1.12x 1.22x Average debt-to-equity (3) 1.12x 1.15x % First lien 98.7% 97.5% Weighted average yield on performing debt and income producing investments, at fair value (4) 11.2% 10.0% Number of portfolio companies 252 311
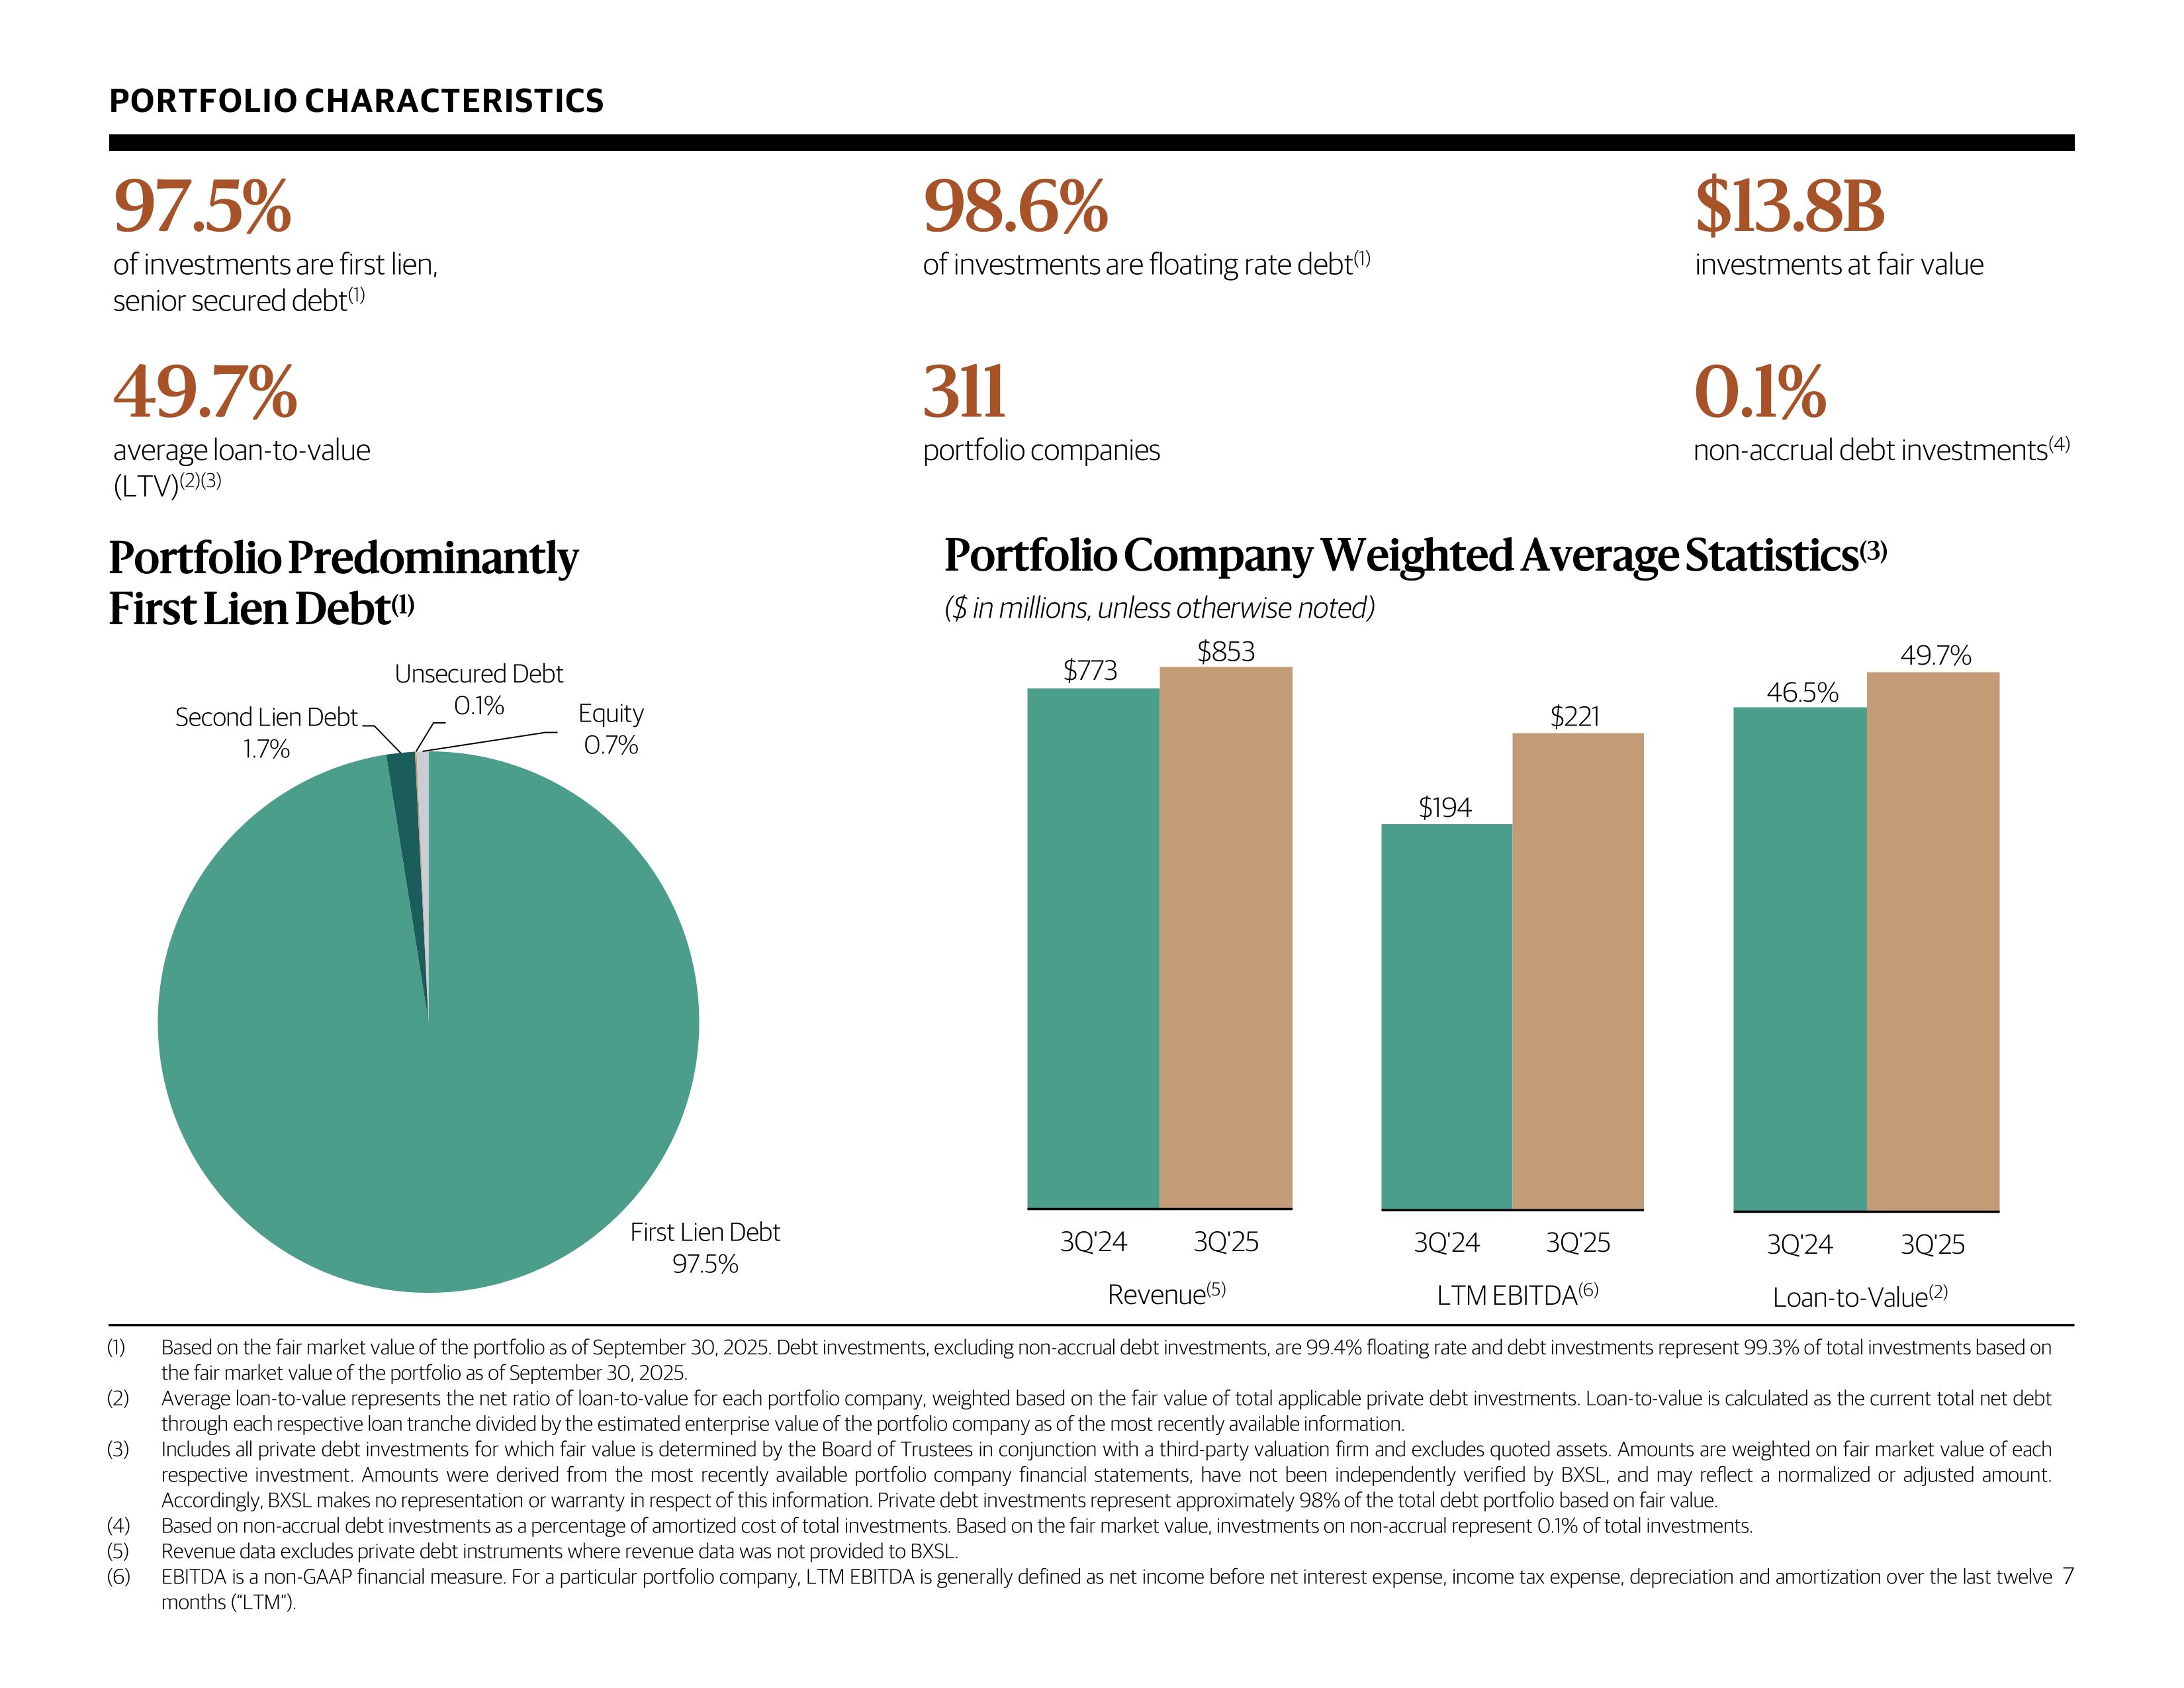
46.5% 49.7% 3Q'24 3Q'25 Loan - to - Value (2) $194 $221 3Q'24 3Q'25 LTM EBITDA (6) $773 $853 3Q'24 3Q'25 Revenue (5) PORTFOLIO CHARACTERISTICS Portfolio Predominantly First Lien Debt (1) $ 13.8 B investments at fair value 311 portfolio companies 0.1% non - accrual debt investments (4) 98.6% of investments are floating rate debt (1) 97.5% of investments are first lien, senior secured debt (1) 49.7% a verage loan - to - value (LTV) (2)(3) (1) Based on the fair market value of the portfolio as of September 30 , 2025 . Debt investments, excluding non - accrual debt investments, are 99 . 4 % floating rate and debt investments represent 99 . 3 % of total investments based on the fair market value of the portfolio as of September 30 , 2025 . (2) Average loan - to - value represents the net ratio of loan - to - value for each portfolio company, weighted based on the fair value of total applicable private debt investments . Loan - to - value is calculated as the current total net debt through each respective loan tranche divided by the estimated enterprise value of the portfolio company as of the most recently available information . (3) Includes all private debt investments for which fair value is determined by the Board of Trustees in conjunction with a third - party valuation firm and excludes quoted assets . Amounts are weighted on fair market value of each respective investment . Amounts were derived from the most recently available portfolio company financial statements, have not been independently verified by BXSL, and may reflect a normalized or adjusted amount . Accordingly, BXSL makes no representation or warranty in respect of this information . Private debt investments represent approximately 98 % of the total debt portfolio based on fair value . (4) Based on non - accrual debt investments as a percentage of amortized cost of total investments . Based on the fair market value, investments on non - accrual represent 0 . 1 % of total investments . (5) Revenue data excludes private debt instruments where revenue data was not provided to BXSL . (6) EBITDA is a non - GAAP financial measure . For a particular portfolio company, LTM EBITDA is generally defined as net income before net interest expense, income tax expense, depreciation and amortization over the last twelve months (“LTM”) . Portfolio Company Weighted Average Statistics (3) ($ in millions, unless otherwise noted) 7 First Lien Debt 97.5% Second Lien Debt 1.7% Unsecured Debt 0.1% Equity 0.7%
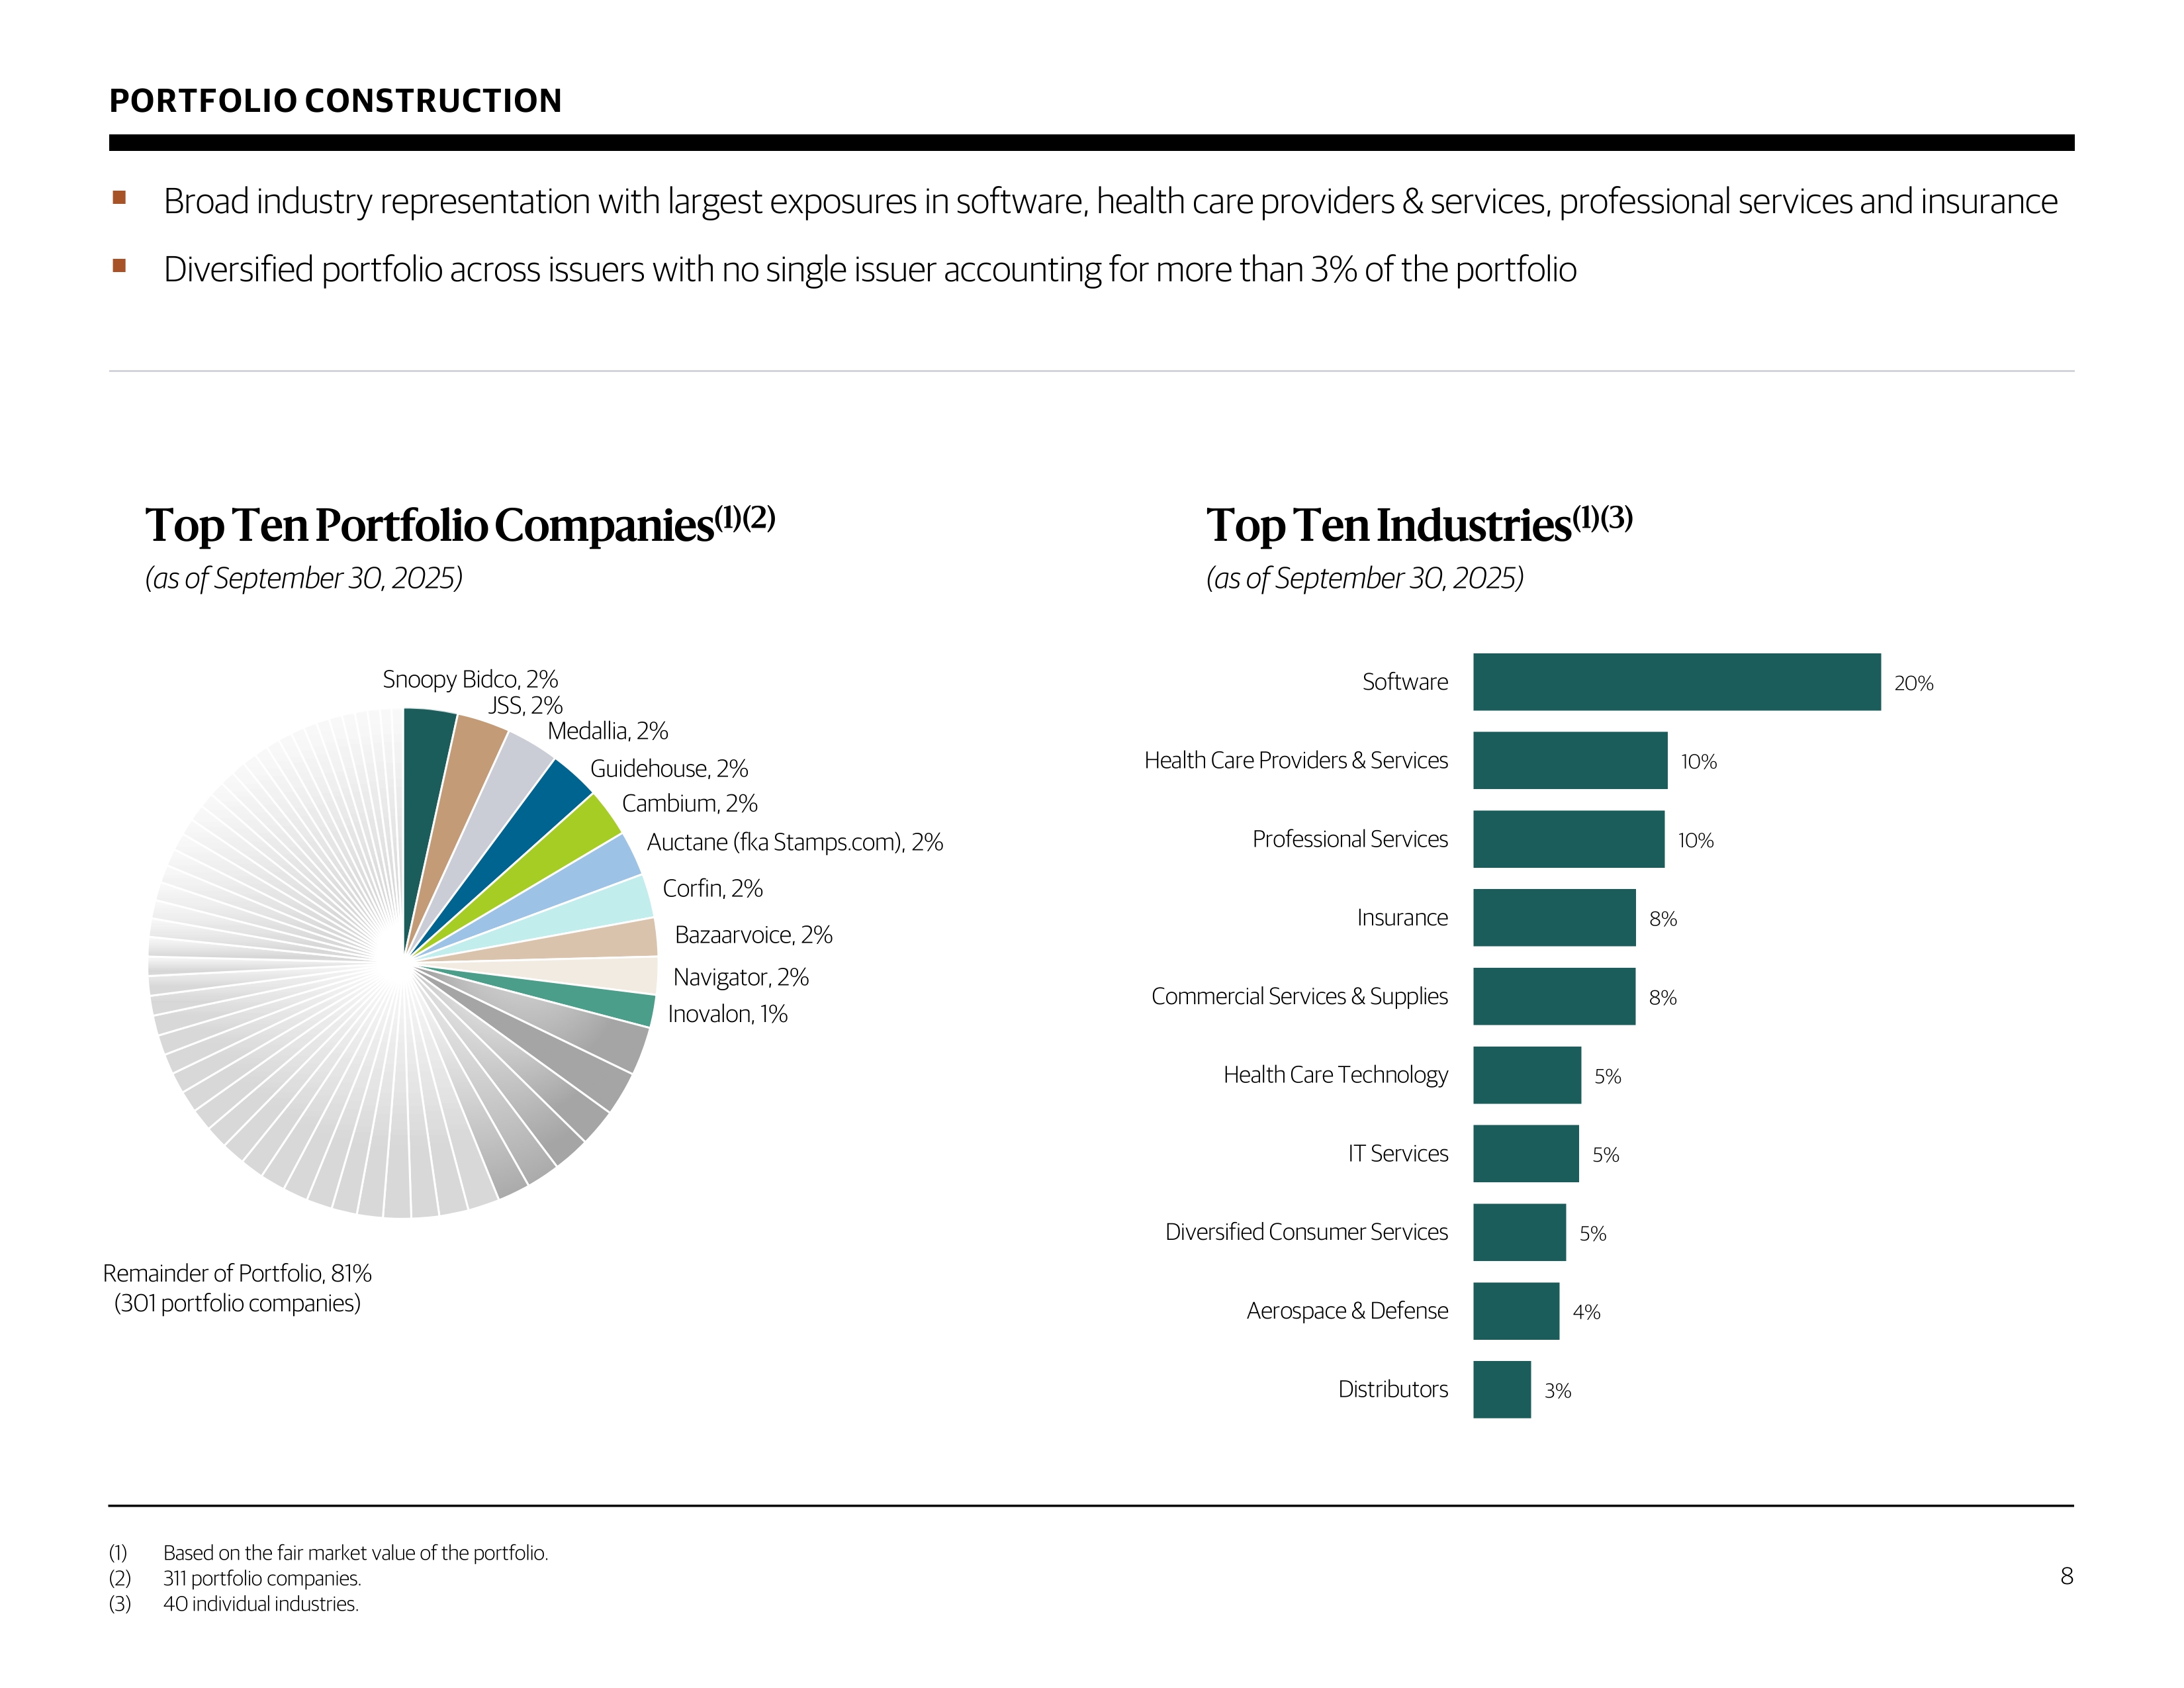
PORTFOLIO CONSTRUCTION ▪ Broad industry representation with largest exposures in software, health care providers & services, professional services and insurance ▪ Diversified portfolio across issuers with no single issuer accounting for more than 3% of the portfolio Top Ten Portfolio Companies (1)(2) (as of September 30, 2025) Top Ten Industries (1)(3) (as of September 30, 2025) 8 (1) Based on the fair market value of the portfolio. (2) 311 portfolio companies. (3) 40 individual industries. 20% 10% 10% 8% 8% 5% 5% 5% 4% 3% Software Health Care Providers & Services Professional Services Insurance Commercial Services & Supplies Health Care Technology IT Services Diversified Consumer Services Aerospace & Defense Distributors Snoopy Bidco , 2% JSS , 2% Medallia , 2% Guidehouse , 2% Cambium , 2% Auctane (fka Stamps.com) , 2% Corfin , 2% Bazaarvoice , 2% Navigator , 2% Inovalon , 1% Remainder of Portfolio, 81% (301 portfolio companies)
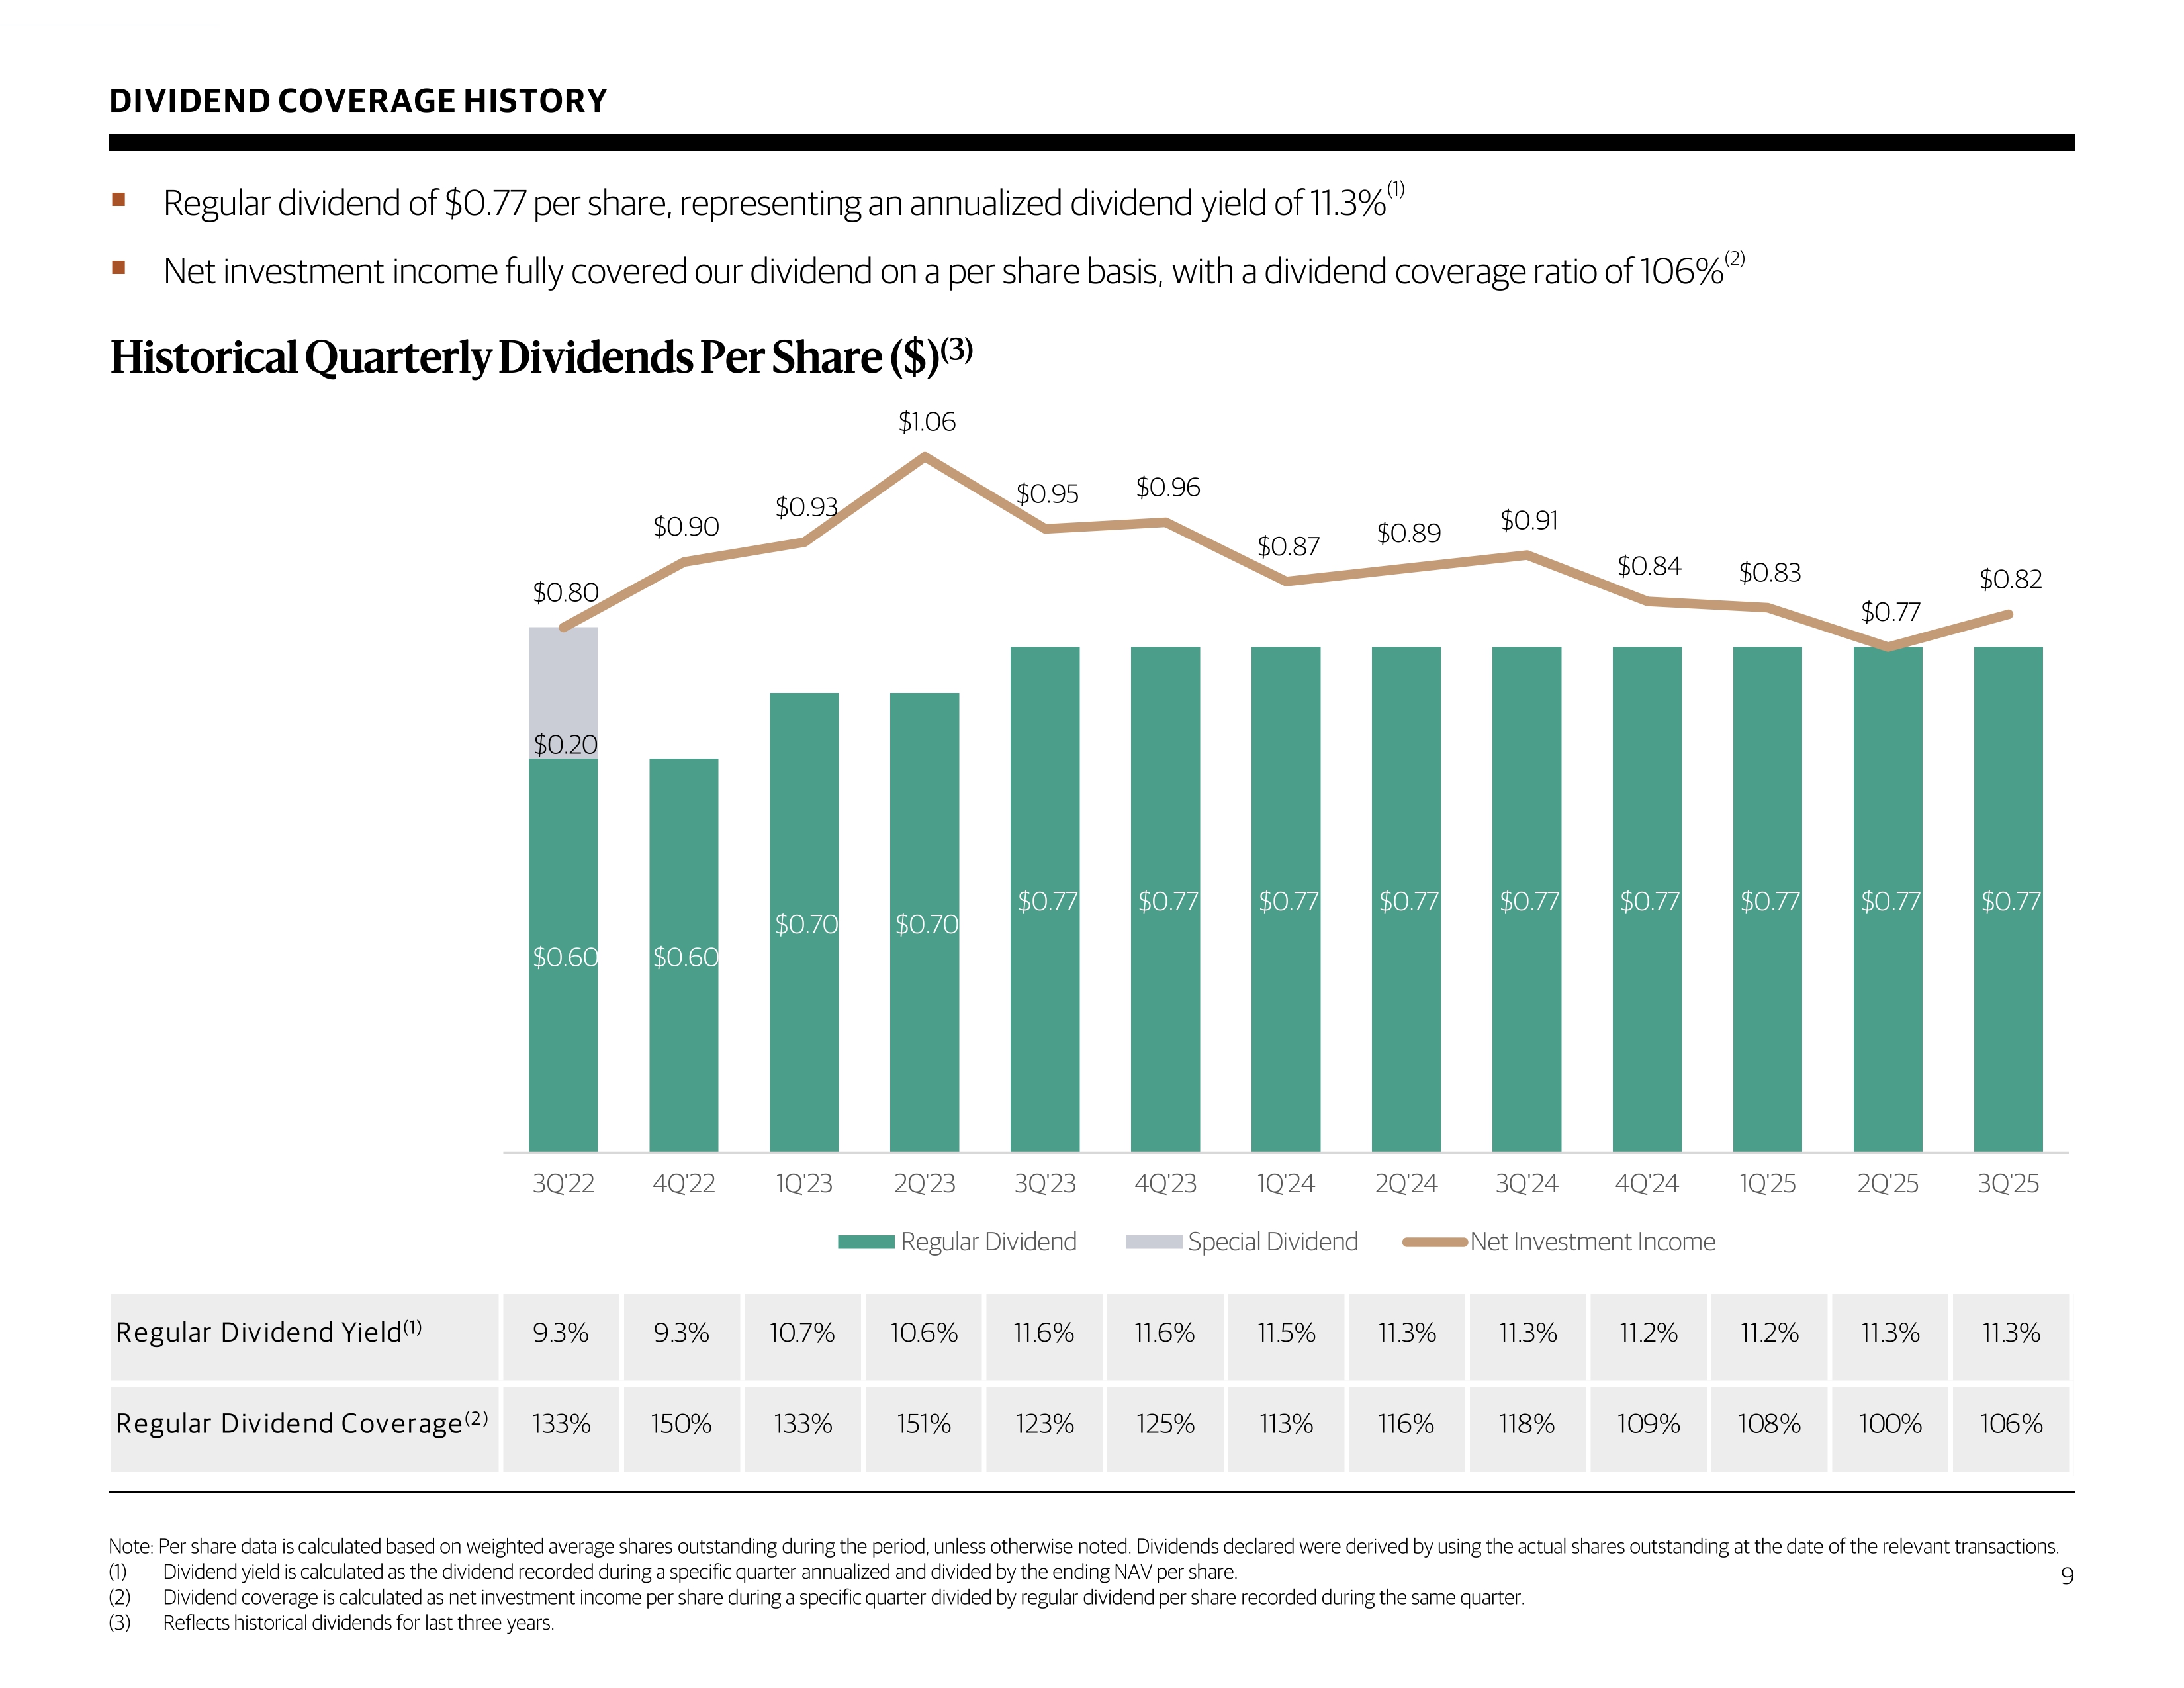
$0.60 $0.60 $0.70 $0.70 $0.77 $0.77 $0.77 $0.77 $0.77 $0.77 $0.77 $0.77 $0.77 $0.20 $0.80 $0.90 $0.93 $1.06 $0.95 $0.96 $0.87 $0.89 $0.91 $0.84 $0.83 $0.77 $0.82 3Q'22 4Q'22 1Q'23 2Q'23 3Q'23 4Q'23 1Q'24 2Q'24 3Q'24 4Q'24 1Q'25 2Q'25 3Q'25 Regular Dividend Special Dividend Net Investment Income DIVIDEND COVERAGE HISTORY ▪ Regular dividend of $ 0.77 per share, representing an annualized dividend yield of 11.3% (1) ▪ Net investment income fully covered our dividend on a per share basis, with a dividend coverage ratio of 106% (2) Historical Quarterly Dividends Per Share ($) (3) Note : Per share data is calculated based on weighted average shares outstanding during the period, unless otherwise noted . Dividends declared were derived by using the actual shares outstanding at the date of the relevant transactions . (1) Dividend yield is calculated as the dividend recorded during a specific quarter annualized and divided by the ending NAV per sha re. (2) Dividend coverage is calculated as net investment income per share during a specific quarter divided by regular dividend per sha re recorded during the same quarter. (3) Reflects historical dividends for last three years. 9 Regular Dividend Yield(1) 9.3% 9.3% 10.7% 10.6% 11.6% 11.6% 11.5% 11.3% 11.3% 11.2% 11.2% 11.3% 11.3% Regular Dividend Coverage(2) 133% 150% 133% 151% 123% 125% 113% 116% 118% 109% 108% 100% 106%
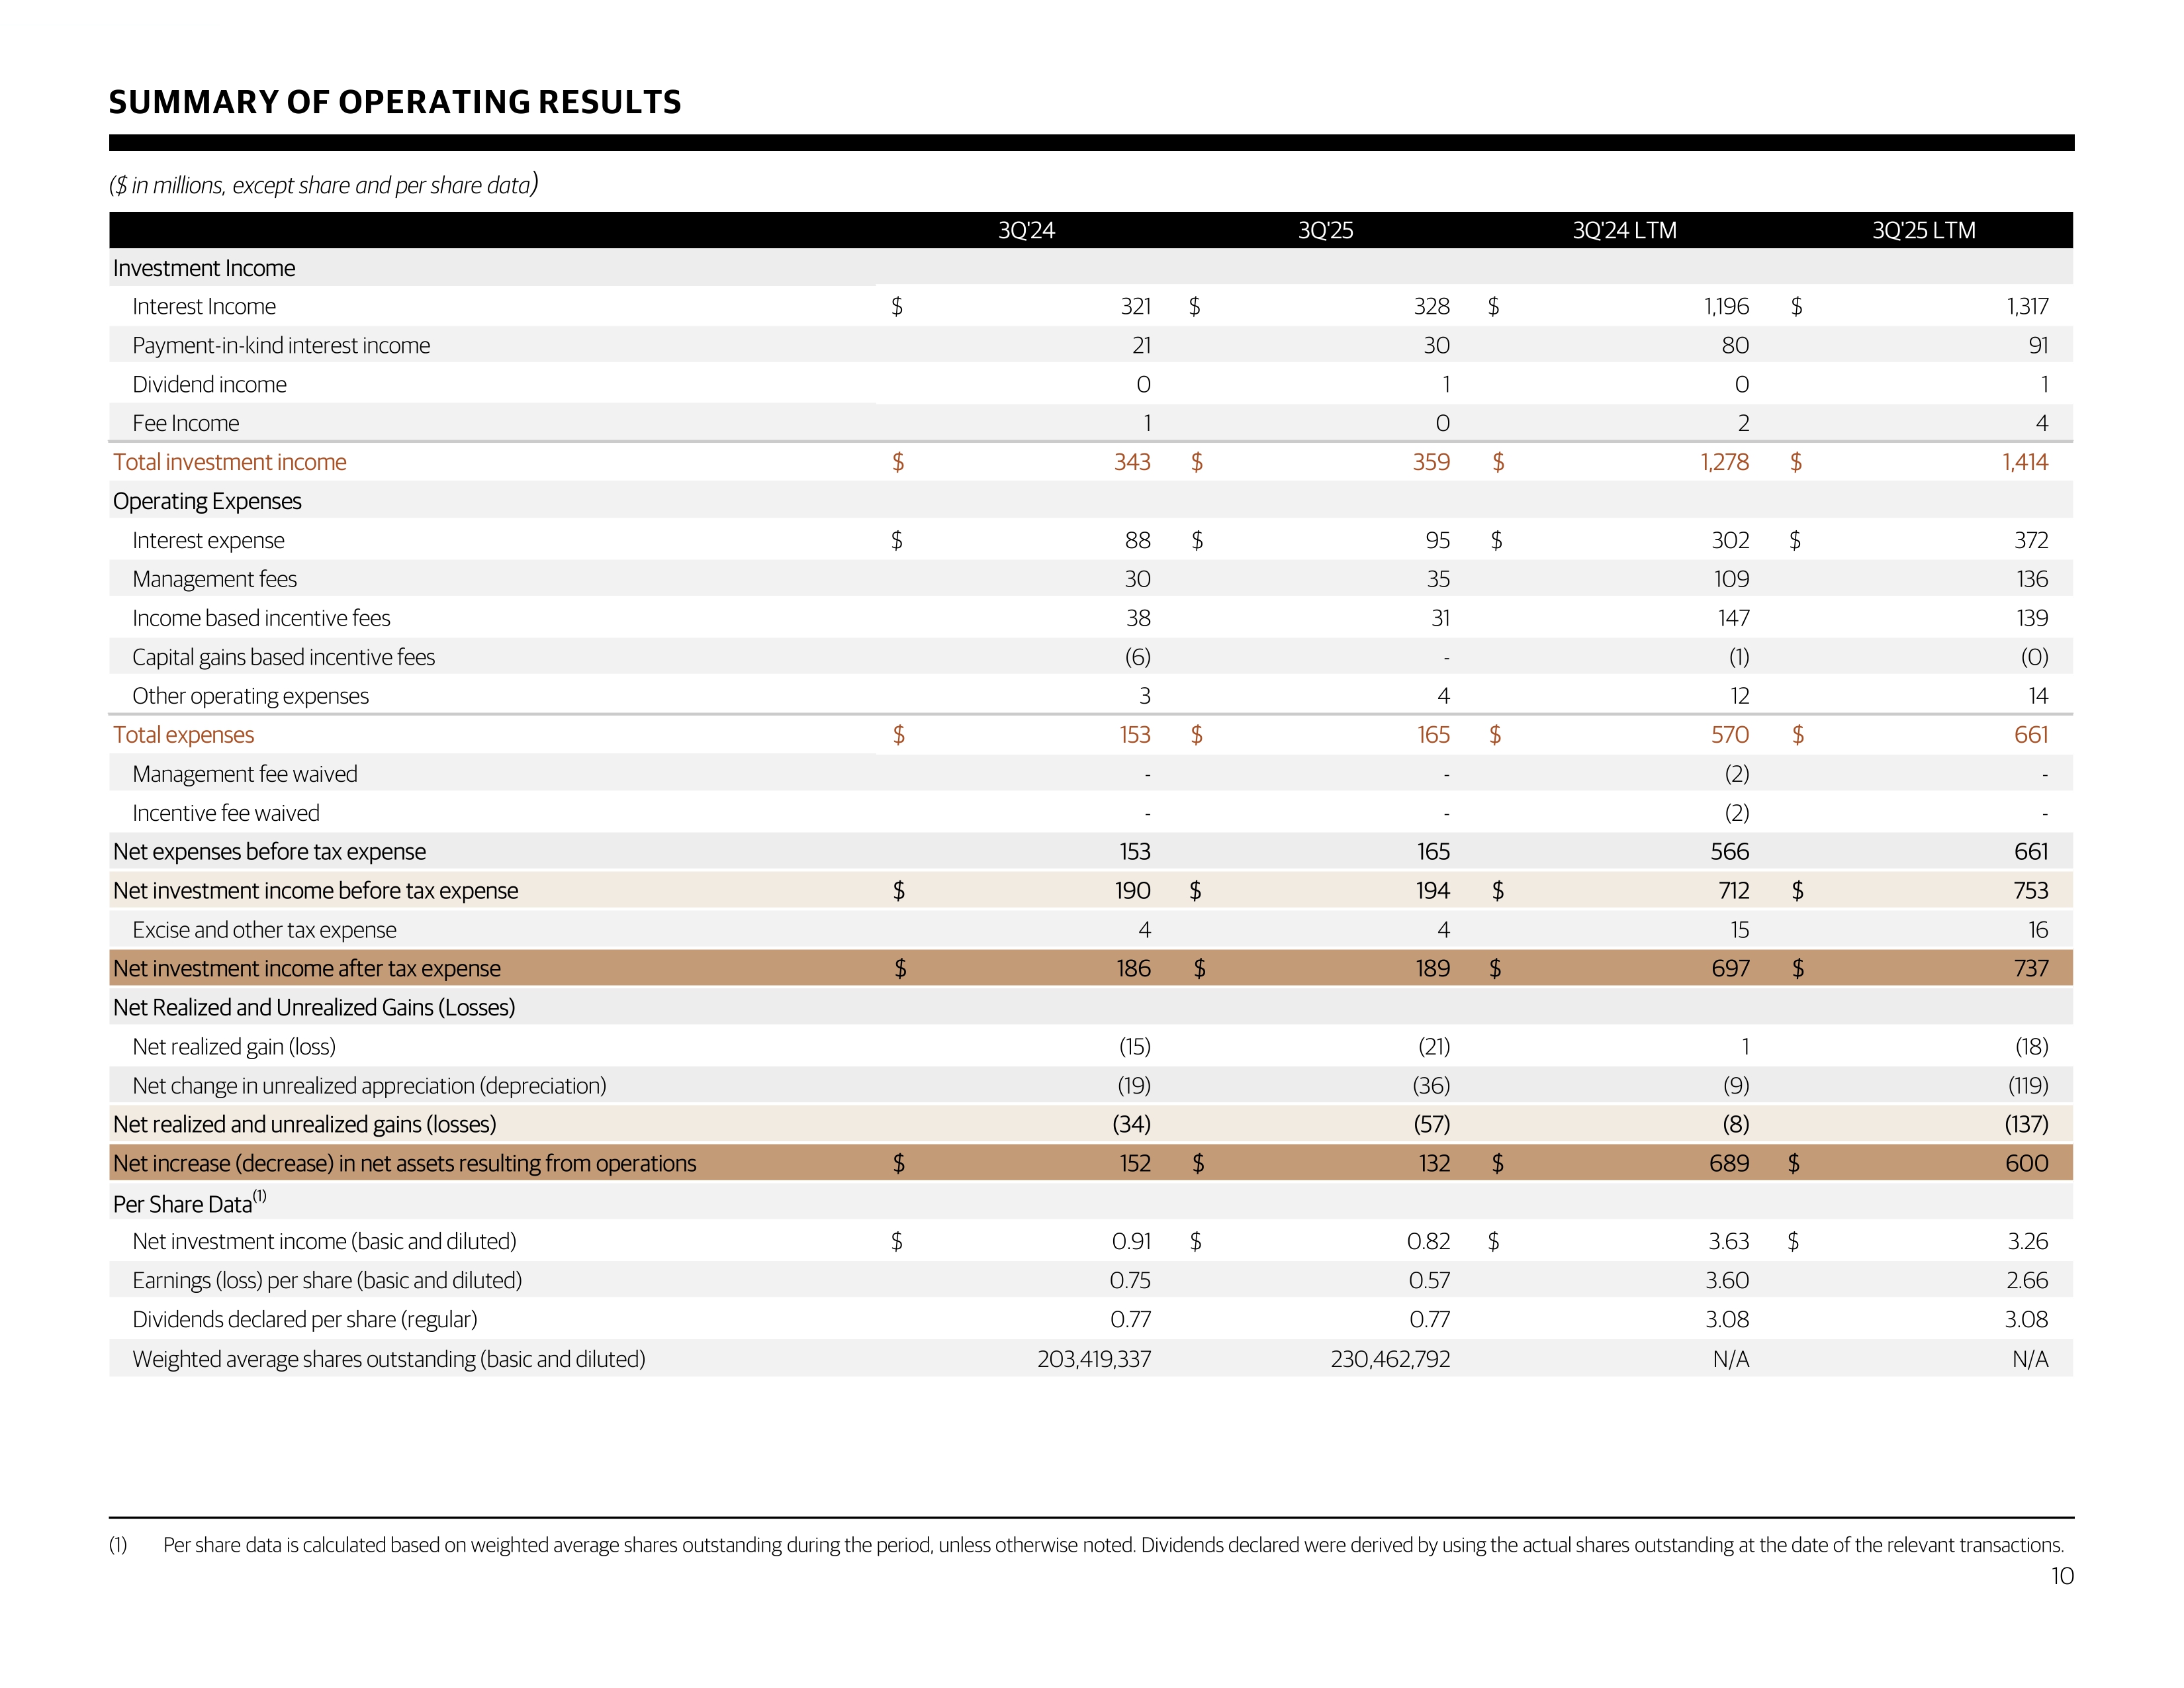
SUMMARY OF OPERATING RESULTS (1) Per share data is calculated based on weighted average shares outstanding during the period, unless otherwise noted . Dividends declared were derived by using the actual shares outstanding at the date of the relevant transactions . ($ in millions, except share and per share data ) 10 3Q'24 3Q'25 3Q'24 LTM 3Q'25 LTM Investment Income Interest Income $ 321 $ 328 $ 1,196 $ 1,317 Payment-in-kind interest income 21 30 80 91 Dividend income 0 1 0 1 Fee Income 1 0 2 4 Total investment income $ 343 $ 359 $ 1,278 $ 1,414 Operating Expenses Interest expense $ 88 $ 95 $ 302 $ 372 Management fees 30 35 109 136 Income based incentive fees 38 31 147 139 Capital gains based incentive fees (6) - (1) (0) Other operating expenses 3 4 12 14 Total expenses $ 153 $ 165 $ 570 $ 661 Management fee waived - - (2) - Incentive fee waived - - (2) - Net expenses before tax expense 153 165 566 661 Net investment income before tax expense $ 190 $ 194 $ 712 $ 753 Excise and other tax expense 4 4 15 16 Net investment income after tax expense $ 186 $ 189 $ 697 $ 737 Net Realized and Unrealized Gains (Losses) Net realized gain (loss) (15) (21) 1 (18) Net change in unrealized appreciation (depreciation) (19) (36) (9) (119) Net realized and unrealized gains (losses) (34) (57) (8) (137) Net increase (decrease) in net assets resulting from operations $ 152 $ 132 $ 689 $ 600 Per Share Data (1) Net investment income (basic and diluted) $ 0.91 $ 0.82 $ 3.63 $ 3.26 Earnings (loss) per share (basic and diluted) 0.75 0.57 3.60 2.66 Dividends declared per share (regular) 0.77 0.77 3.08 3.08 Weighted average shares outstanding (basic and diluted) 203,419,337 230,462,792 N/A N/A
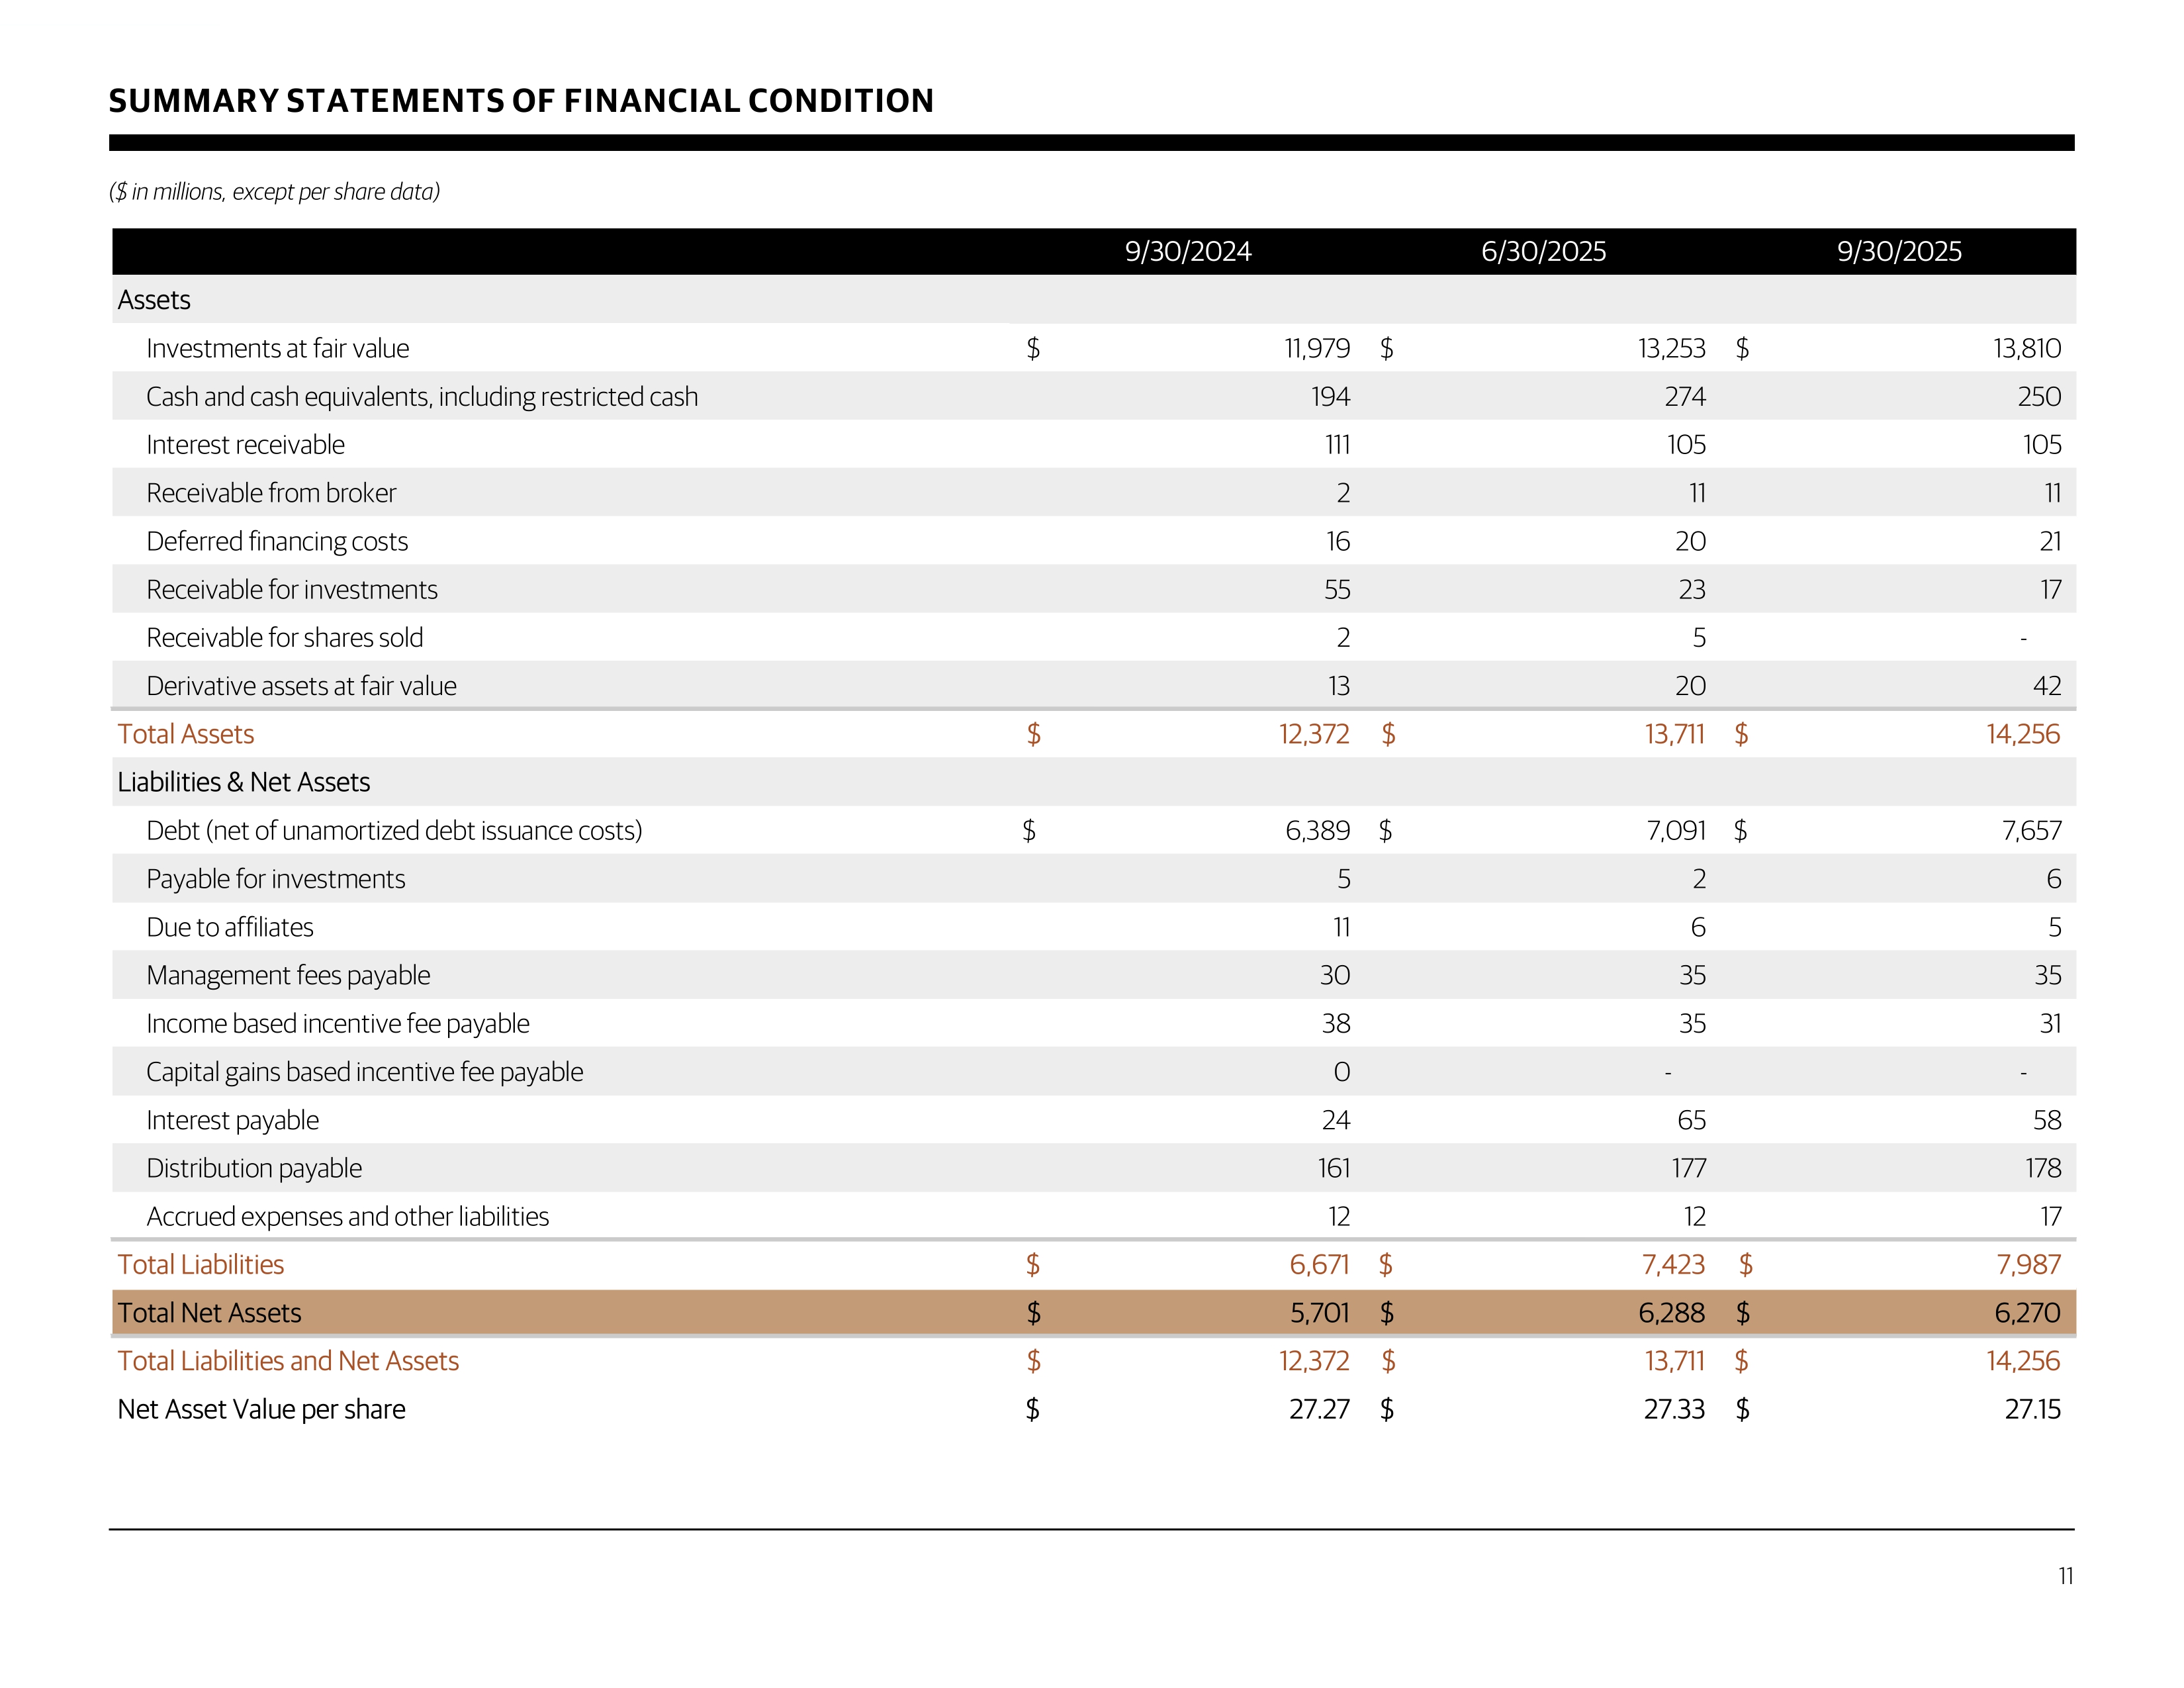
SUMMARY STATEMENTS OF FINANCIAL CONDITION ($ in millions, except per share data) 11 9/30/2024 6/30/2025 9/30/2025 Assets Investments at fair value 11,979$ 13,253$ 13,810$ Cash and cash equivalents, including restricted cash 194 274 250 Interest receivable 111 105 105 Receivable from broker 2 11 11 Deferred financing costs 16 20 21 Receivable for investments 55 23 17 Receivable for shares sold 2 5 - Derivative assets at fair value 13 20 42 Total Assets 12,372$ 13,711$ 14,256$ Liabilities & Net Assets Debt (net of unamortized debt issuance costs) 6,389$ 7,091$ 7,657$ Payable for investments 5 2 6 Due to affiliates 11 6 5 Management fees payable 30 35 35 Income based incentive fee payable 38 35 31 Capital gains based incentive fee payable 0 - - Interest payable 24 65 58 Distribution payable 161 177 178 Accrued expenses and other liabilities 12 12 17 Total Liabilities 6,671$ 7,423$ 7,987$ Total Net Assets 5,701$ 6,288$ 6,270$ Total Liabilities and Net Assets 12,372$ 13,711$ 14,256$ Net Asset Value per share 27.27$ 27.33$ 27.15$
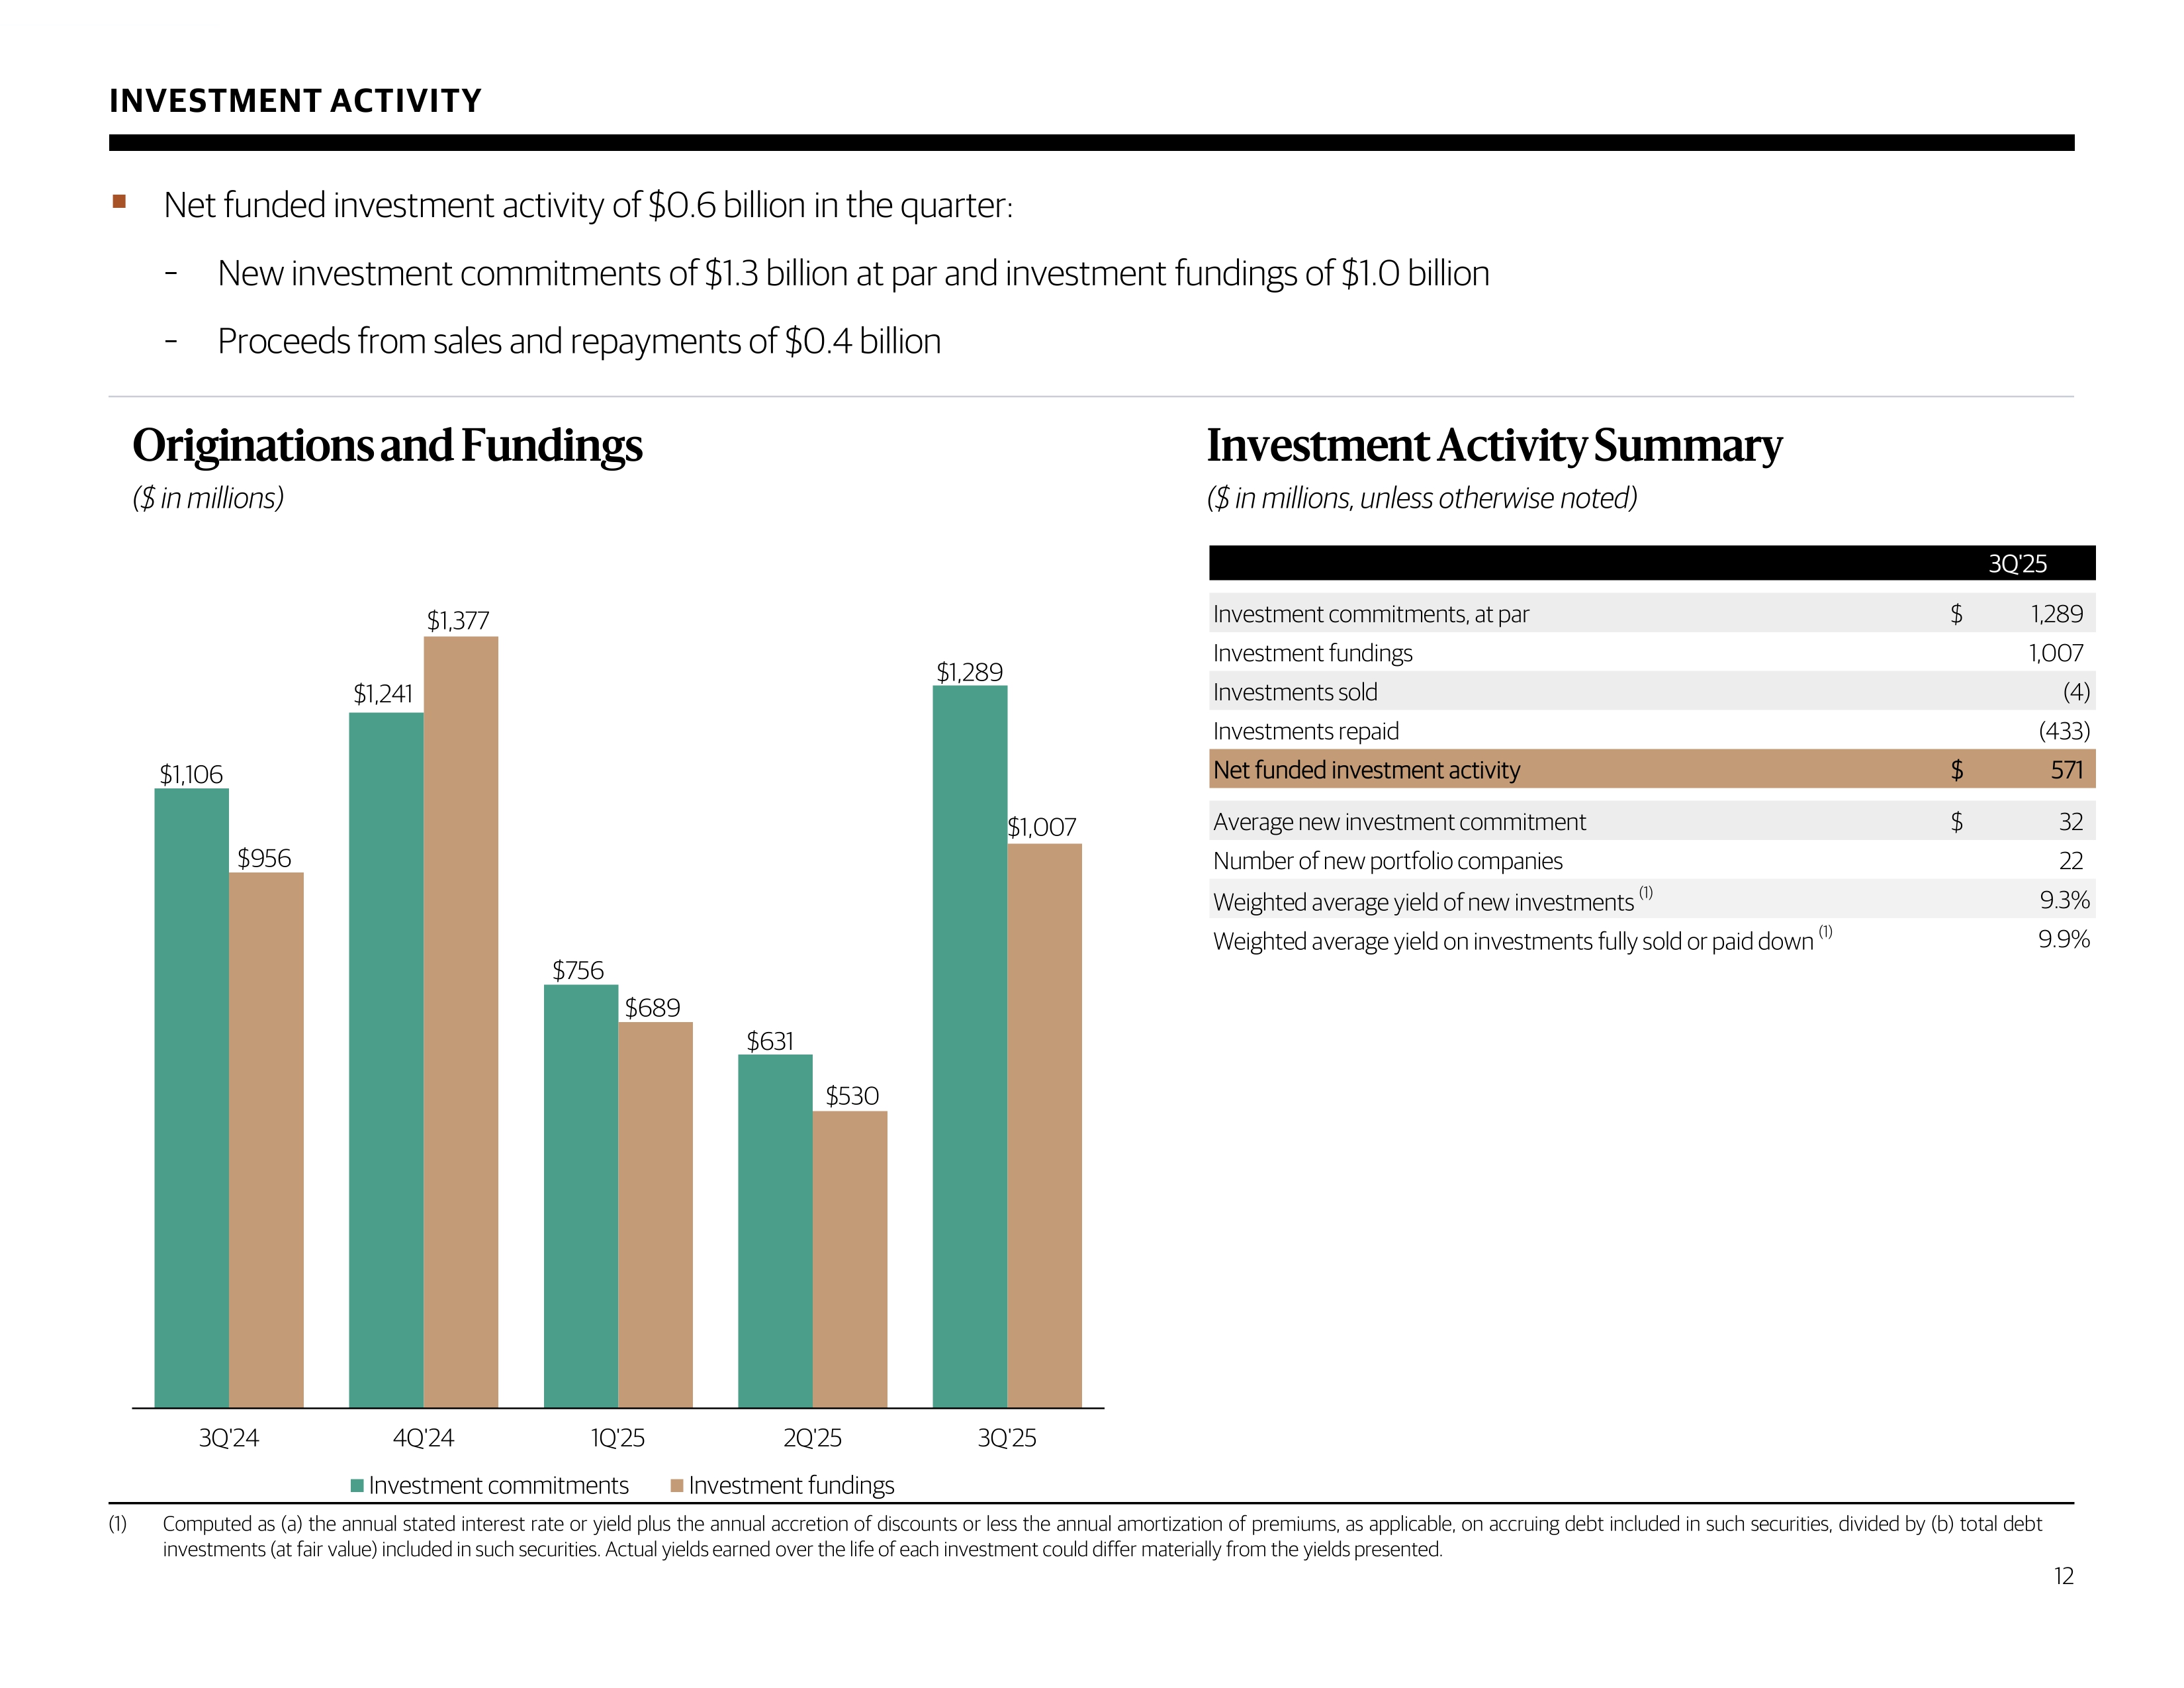
$1,106 $1,241 $756 $631 $1,289 $956 $1,377 $689 $530 $1,007 3Q'24 4Q'24 1Q'25 2Q'25 3Q'25 Investment commitments Investment fundings INVESTMENT ACTIVITY ▪ Net funded investment activity of $ 0.6 billion in the quarter: – New investment commitments of $ 1.3 billion at par and investment fundings of $ 1.0 billion – Proceeds from sales and repayments of $ 0.4 billion Originations and Fundings ($ in millions) Investment Activity Summary ($ in millions, unless otherwise noted) (1) Computed as (a) the annual stated interest rate or yield plus the annual accretion of discounts or less the annual amortization of premiums, as applicable, on accruing debt included in such securities, divided by (b) total debt investments (at fair value) included in such securities . Actual yields earned over the life of each investment could differ materially from the yields presented . 12 3Q'25 Investment commitments, at par 1,289$ Investment fundings 1,007 Investments sold (4) Investments repaid (433) Net funded investment activity 571$ Average new investment commitment 32$ Number of new portfolio companies 22 Weighted average yield of new investments (1) 9.3% Weighted average yield on investments fully sold or paid down (1) 9.9%
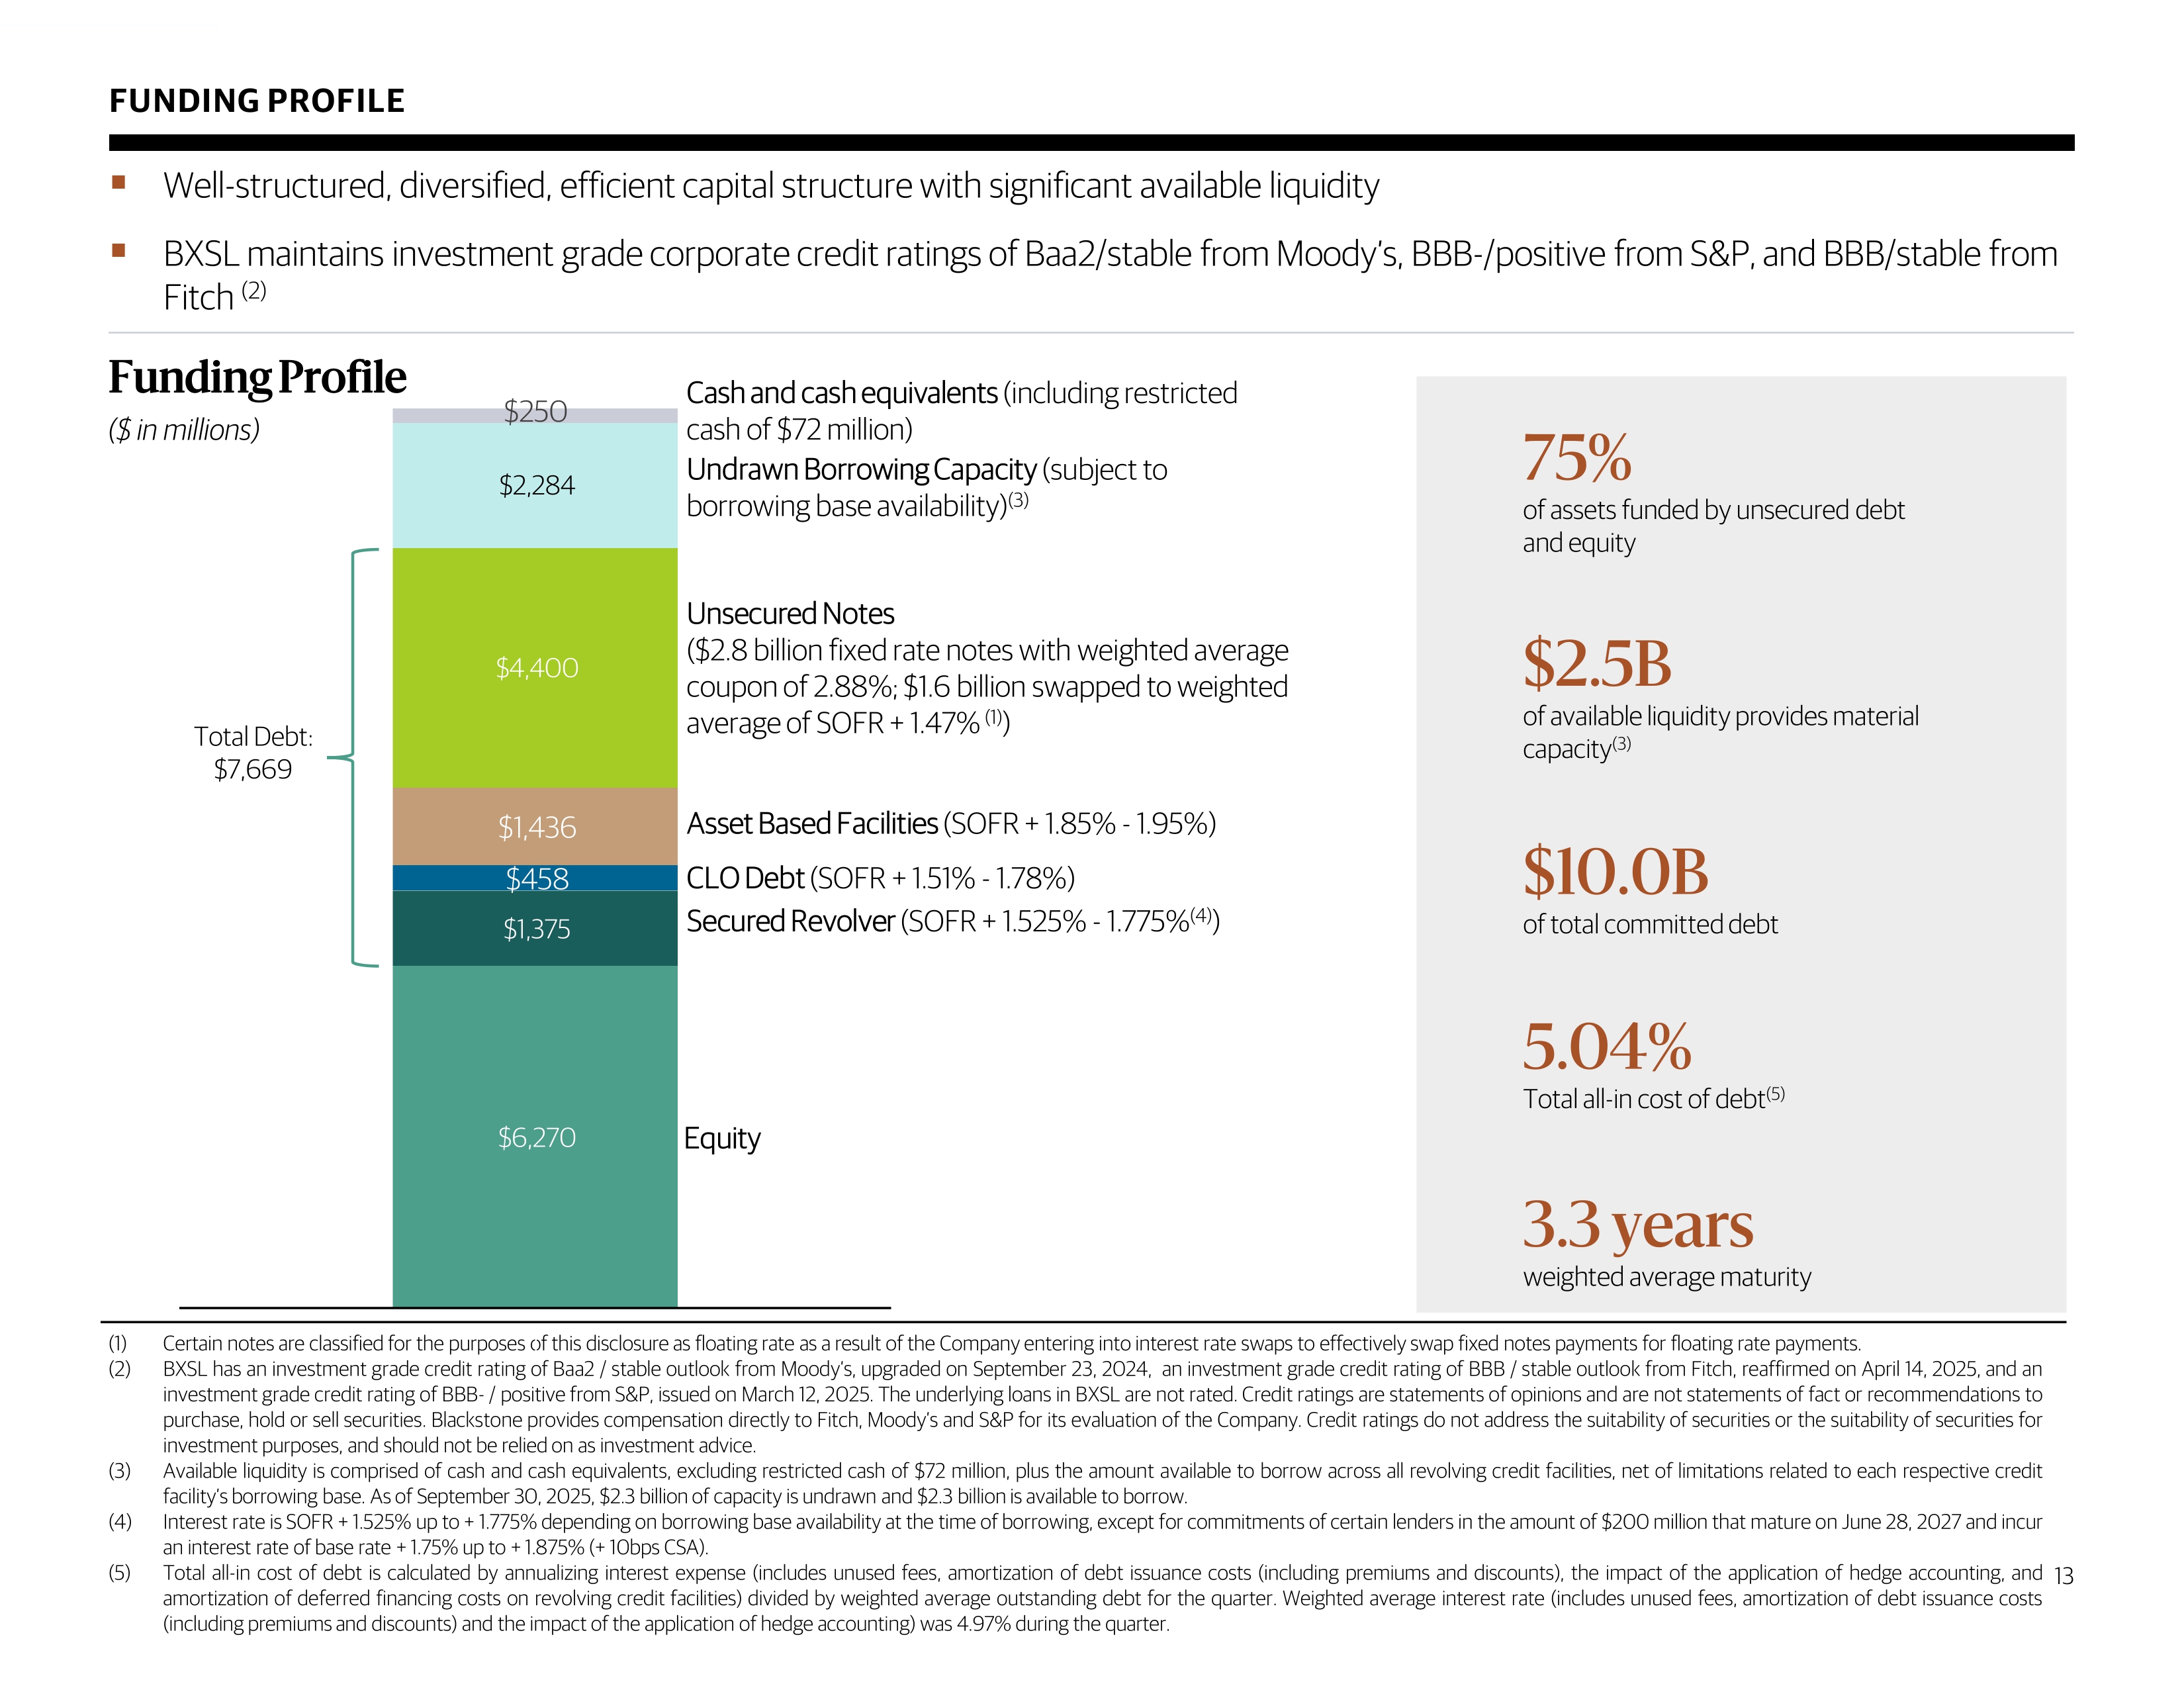
(1) Certain notes are classified for the purposes of this disclosure as floating rate as a result of the Company entering into interest rate swaps to effectively swap fixed notes payments for floating rate payments . (2) BXSL has an investment grade credit rating of Baa 2 / stable outlook from Moody’s, upgraded on September 23 , 2024 , an investment grade credit rating of BBB / stable outlook from Fitch, reaffirmed on April 14 , 2025 , and an investment grade credit rating of BBB - / positive from S&P, issued on March 12 , 2025 . The underlying loans in BXSL are not rated . Credit ratings are statements of opinions and are not statements of fact or recommendations to purchase, hold or sell securities . Blackstone provides compensation directly to Fitch, Moody’s and S&P for its evaluation of the Company . Credit ratings do not address the suitability of securities or the suitability of securities for investment purposes, and should not be relied on as investment advice . (3) Available liquidity is comprised of cash and cash equivalents, excluding restricted cash of $ 72 million, plus the amount available to borrow across all revolving credit facilities, net of limitations related to each respective credit facility’s borrowing base . As of September 30 , 2025 , $ 2 . 3 billion of capacity is undrawn and $ 2 . 3 billion is available to borrow . (4) Interest rate is SOFR + 1 . 525 % up to + 1 . 775 % depending on borrowing base availability at the time of borrowing, except for commitments of certain lenders in the amount of $ 200 million that mature on June 28 , 2027 and incur an interest rate of base rate + 1 . 75 % up to + 1 . 875 % (+ 10 bps CSA) . (5) Total all - in cost of debt is calculated by annualizing interest expense (includes unused fees, amortization of debt issuance costs (including premiums and discounts), the impact of the application of hedge accounting, and amortization of deferred financing costs on revolving credit facilities) divided by weighted average outstanding debt for the quarter . Weighted average interest rate (includes unused fees, amortization of debt issuance costs (including premiums and discounts) and the impact of the application of hedge accounting) was 4 . 97 % during the quarter . FUNDING PROFILE 75% of assets funded by unsecured debt and equity 3.3 years weighted average maturity ▪ Well - structured, diversified, efficient capital structure with significant available liquidity ▪ BXSL maintains investment grade corporate credit ratings of Baa2/stable from Moody’s, BBB - /positive from S&P, and BBB/stable from Fitch (2) 5.04% Total all - in cost of debt (5) $ 2.5 B of available liquidity provides material capacity (3) $ 10.0 B of total committed debt 13 Funding Profile ($ in millions) Secured Revolver (SOFR + 1.525% - 1.775% (4 ) ) Equity Asset Based Facilities (SOFR + 1.85% - 1.95%) Unsecured Notes ($2.8 billion fixed rate notes with weighted average coupon of 2.88%; $1.6 billion swapped to weighted average of SOFR + 1.47% (1) ) Undrawn Borrowing Capacity (subject to borrowing base availability) (3) Cash and cash equivalents (including restricted cash of $ 72 million) CLO Debt ( SOFR + 1.51% - 1.78% ) $6,270 $1,375 $458 $1,436 $4,400 $2,284 $250 1 Total Debt: $7,669

Supplemental Details 14
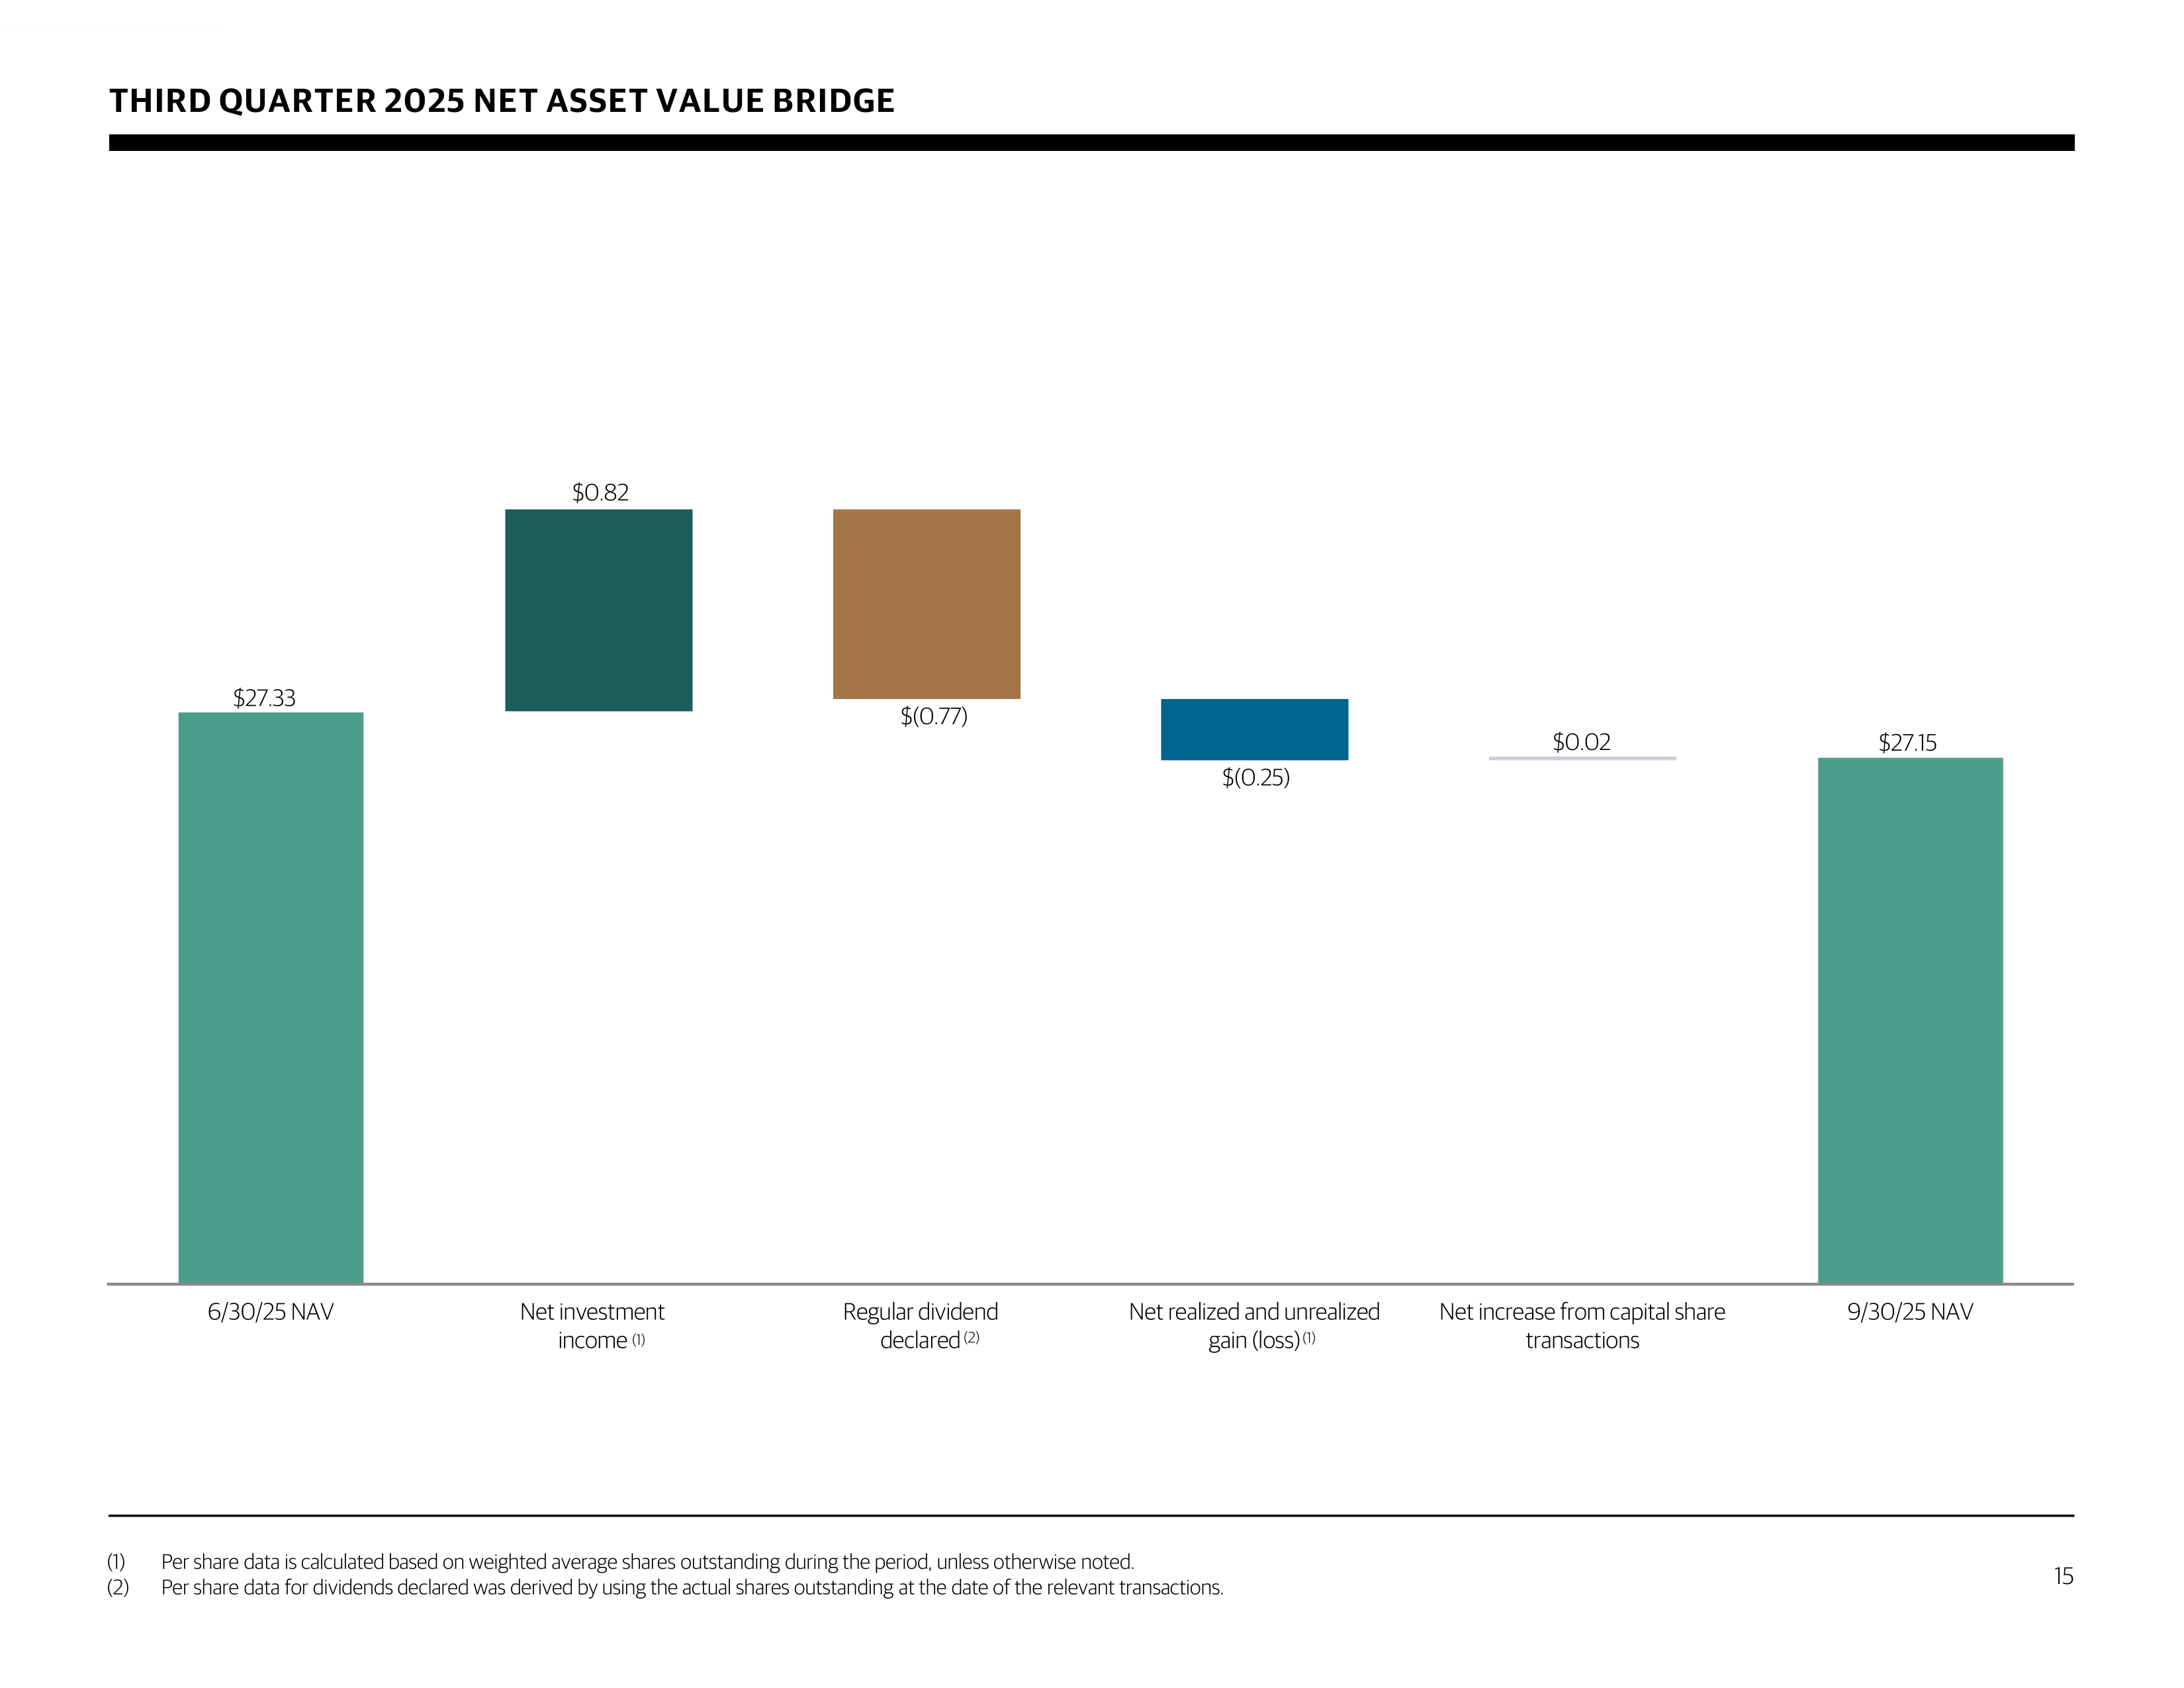
THIRD QUARTER 2025 NET ASSET VALUE BRIDGE (1) Per share data is calculated based on weighted average shares outstanding during the period, unless otherwise noted. (2) Per share data for dividends declared was derived by using the actual shares outstanding at the date of the relevant transact ion s. 15 $27.33 $27.15 $0.82 $(0.77) $(0.25) $0.02 6/30/25 NAV Net investment income Regular dividend declared Net realized and unrealized gain (loss) Net increase from capital share transactions 9/30/25 NAV (1) (2) (1)
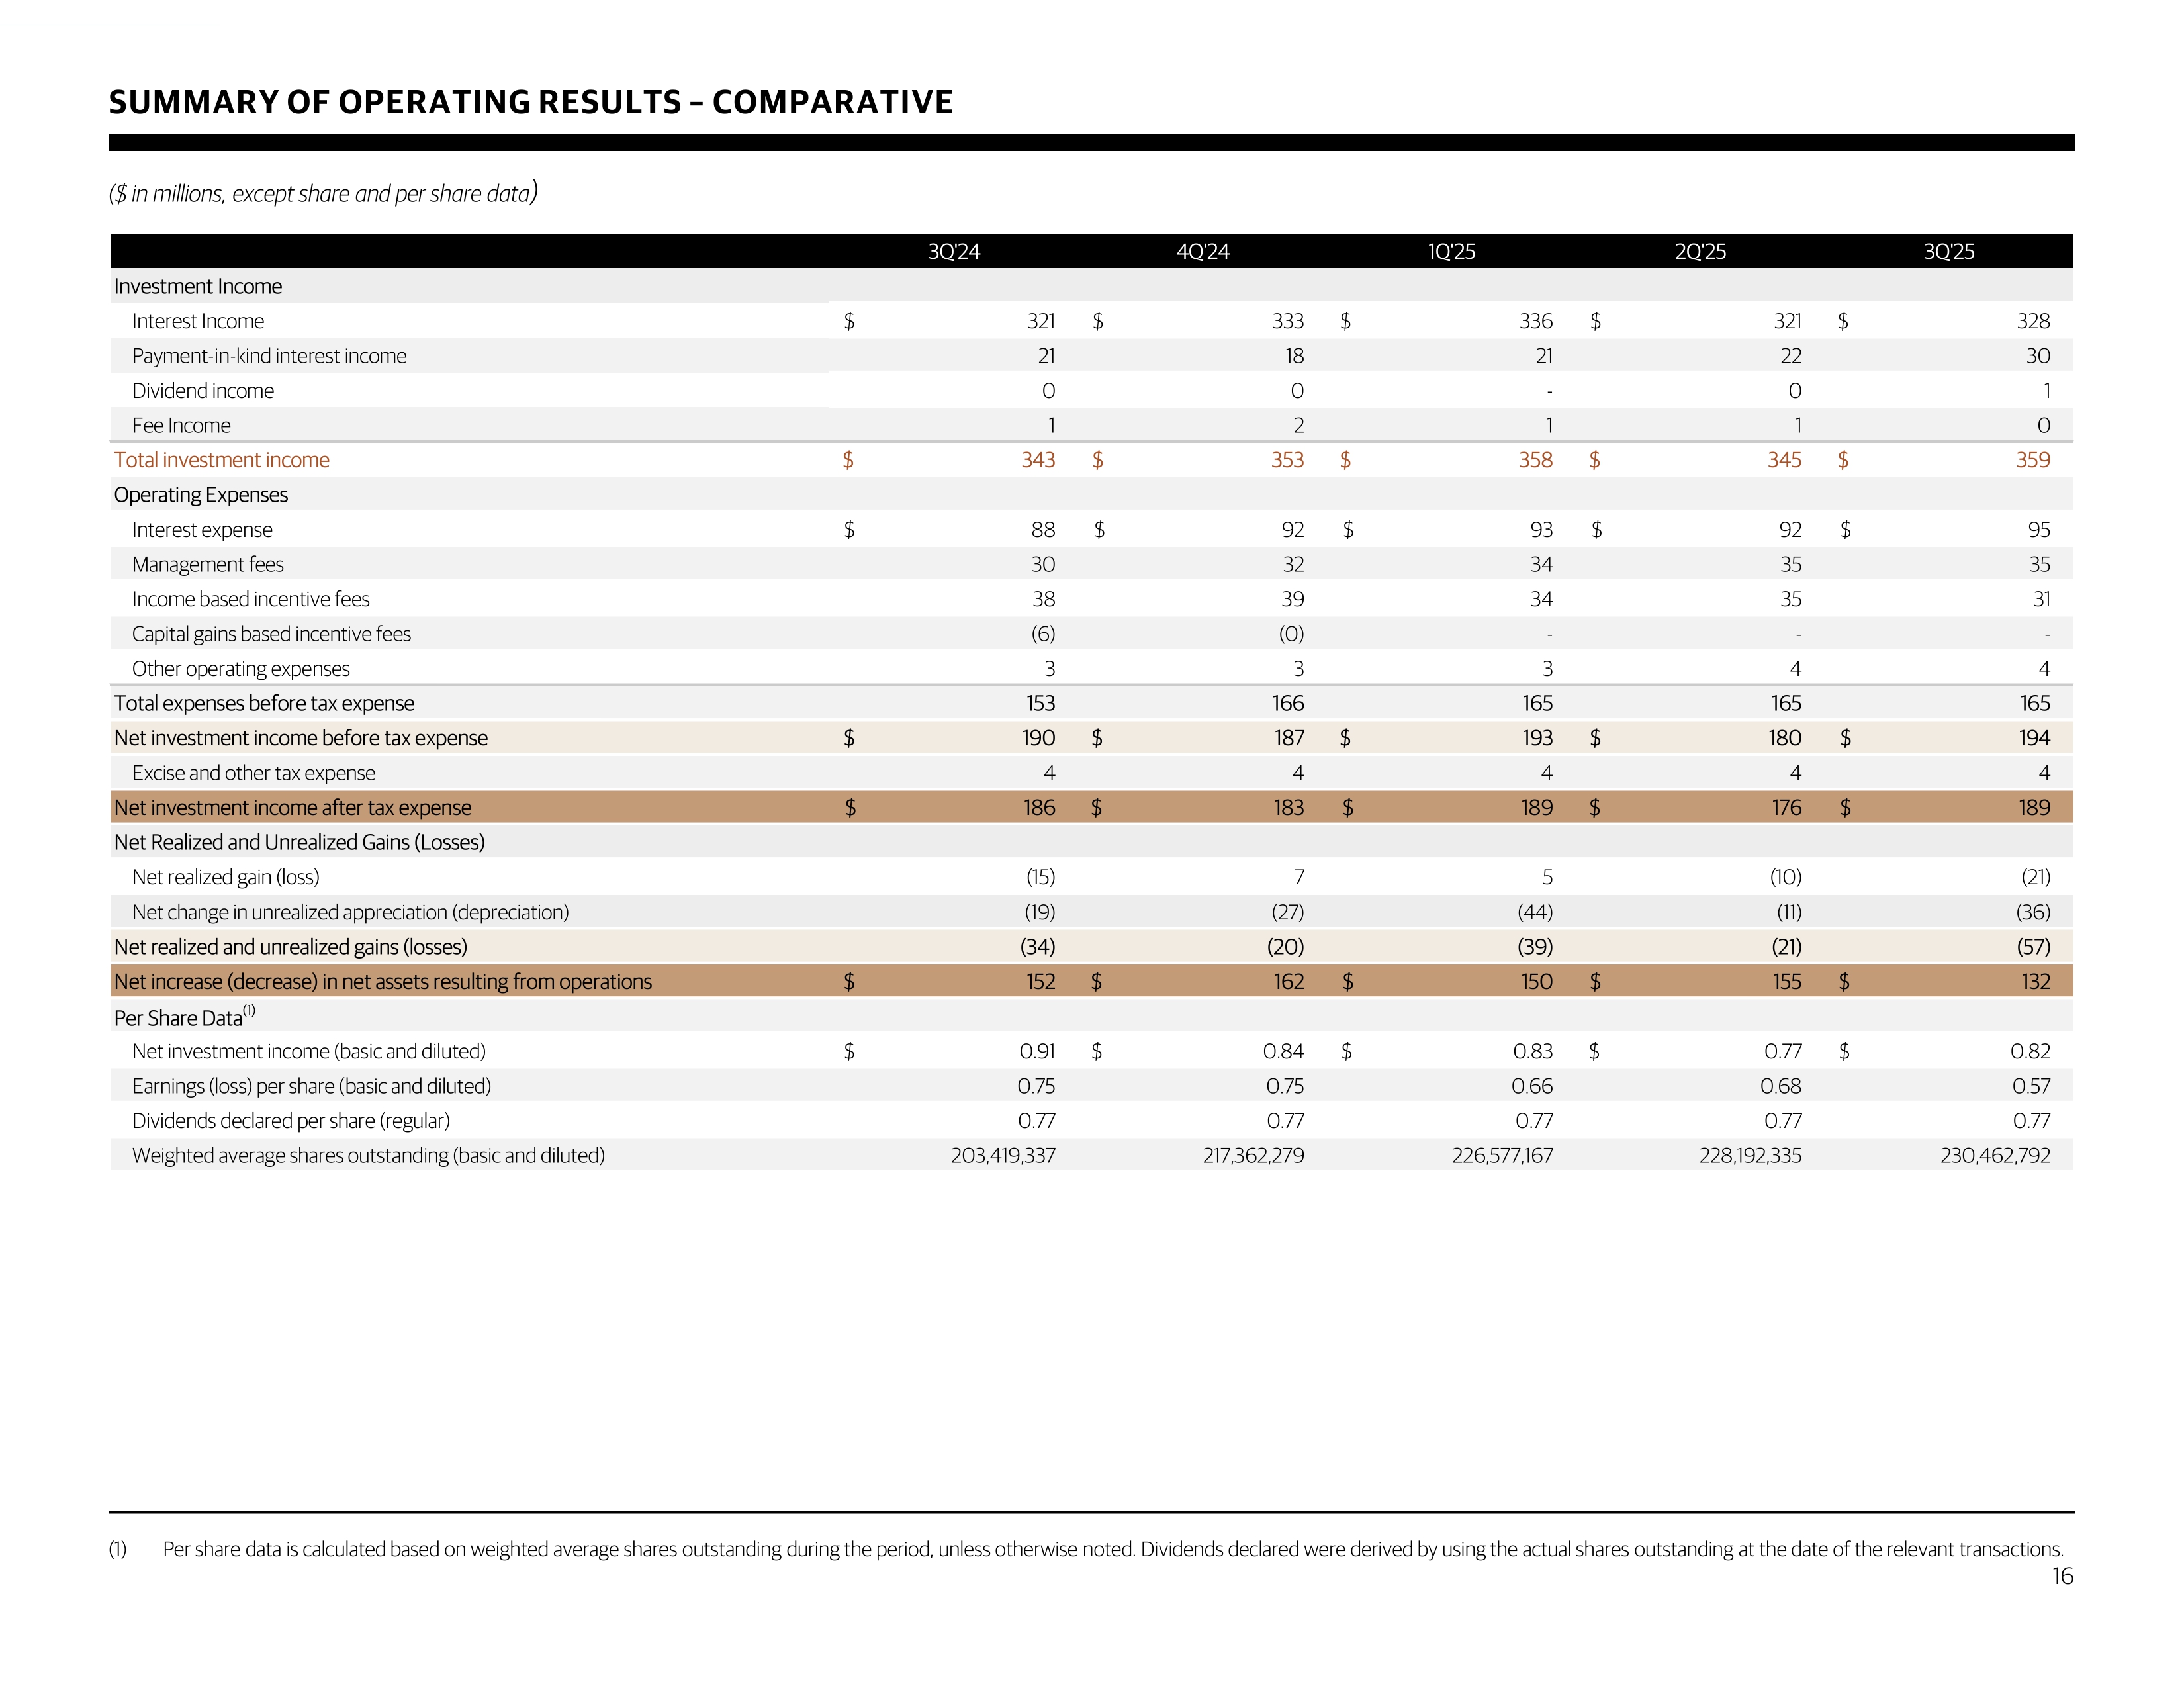
SUMMARY OF OPERATING RESULTS – COMPARATIVE (1) Per share data is calculated based on weighted average shares outstanding during the period, unless otherwise noted . Dividends declared were derived by using the actual shares outstanding at the date of the relevant transactions . ($ in millions, except share and per share data ) 16 3Q'24 4Q'24 1Q'25 2Q'25 3Q'25 Investment Income Interest Income $ 321 $ 333 $ 336 $ 321 $ 328 Payment-in-kind interest income 21 18 21 22 30 Dividend income 0 0 - 0 1 Fee Income 1 2 1 1 0 Total investment income $ 343 $ 353 $ 358 $ 345 $ 359 Operating Expenses Interest expense $ 88 $ 92 $ 93 $ 92 $ 95 Management fees 30 32 34 35 35 Income based incentive fees 38 39 34 35 31 Capital gains based incentive fees (6) (0) - - - Other operating expenses 3 3 3 4 4 Total expenses before tax expense 153 166 165 165 165 Net investment income before tax expense $ 190 $ 187 $ 193 $ 180 $ 194 Excise and other tax expense 4 4 4 4 4 Net investment income after tax expense $ 186 $ 183 $ 189 $ 176 $ 189 Net Realized and Unrealized Gains (Losses) Net realized gain (loss) (15) 7 5 (10) (21) Net change in unrealized appreciation (depreciation) (19) (27) (44) (11) (36) Net realized and unrealized gains (losses) (34) (20) (39) (21) (57) Net increase (decrease) in net assets resulting from operations $ 152 $ 162 $ 150 $ 155 $ 132 Per Share Data (1) Net investment income (basic and diluted) $ 0.91 $ 0.84 $ 0.83 $ 0.77 $ 0.82 Earnings (loss) per share (basic and diluted) 0.75 0.75 0.66 0.68 0.57 Dividends declared per share (regular) 0.77 0.77 0.77 0.77 0.77 Weighted average shares outstanding (basic and diluted) 203,419,337 217,362,279 226,577,167 228,192,335 230,462,792
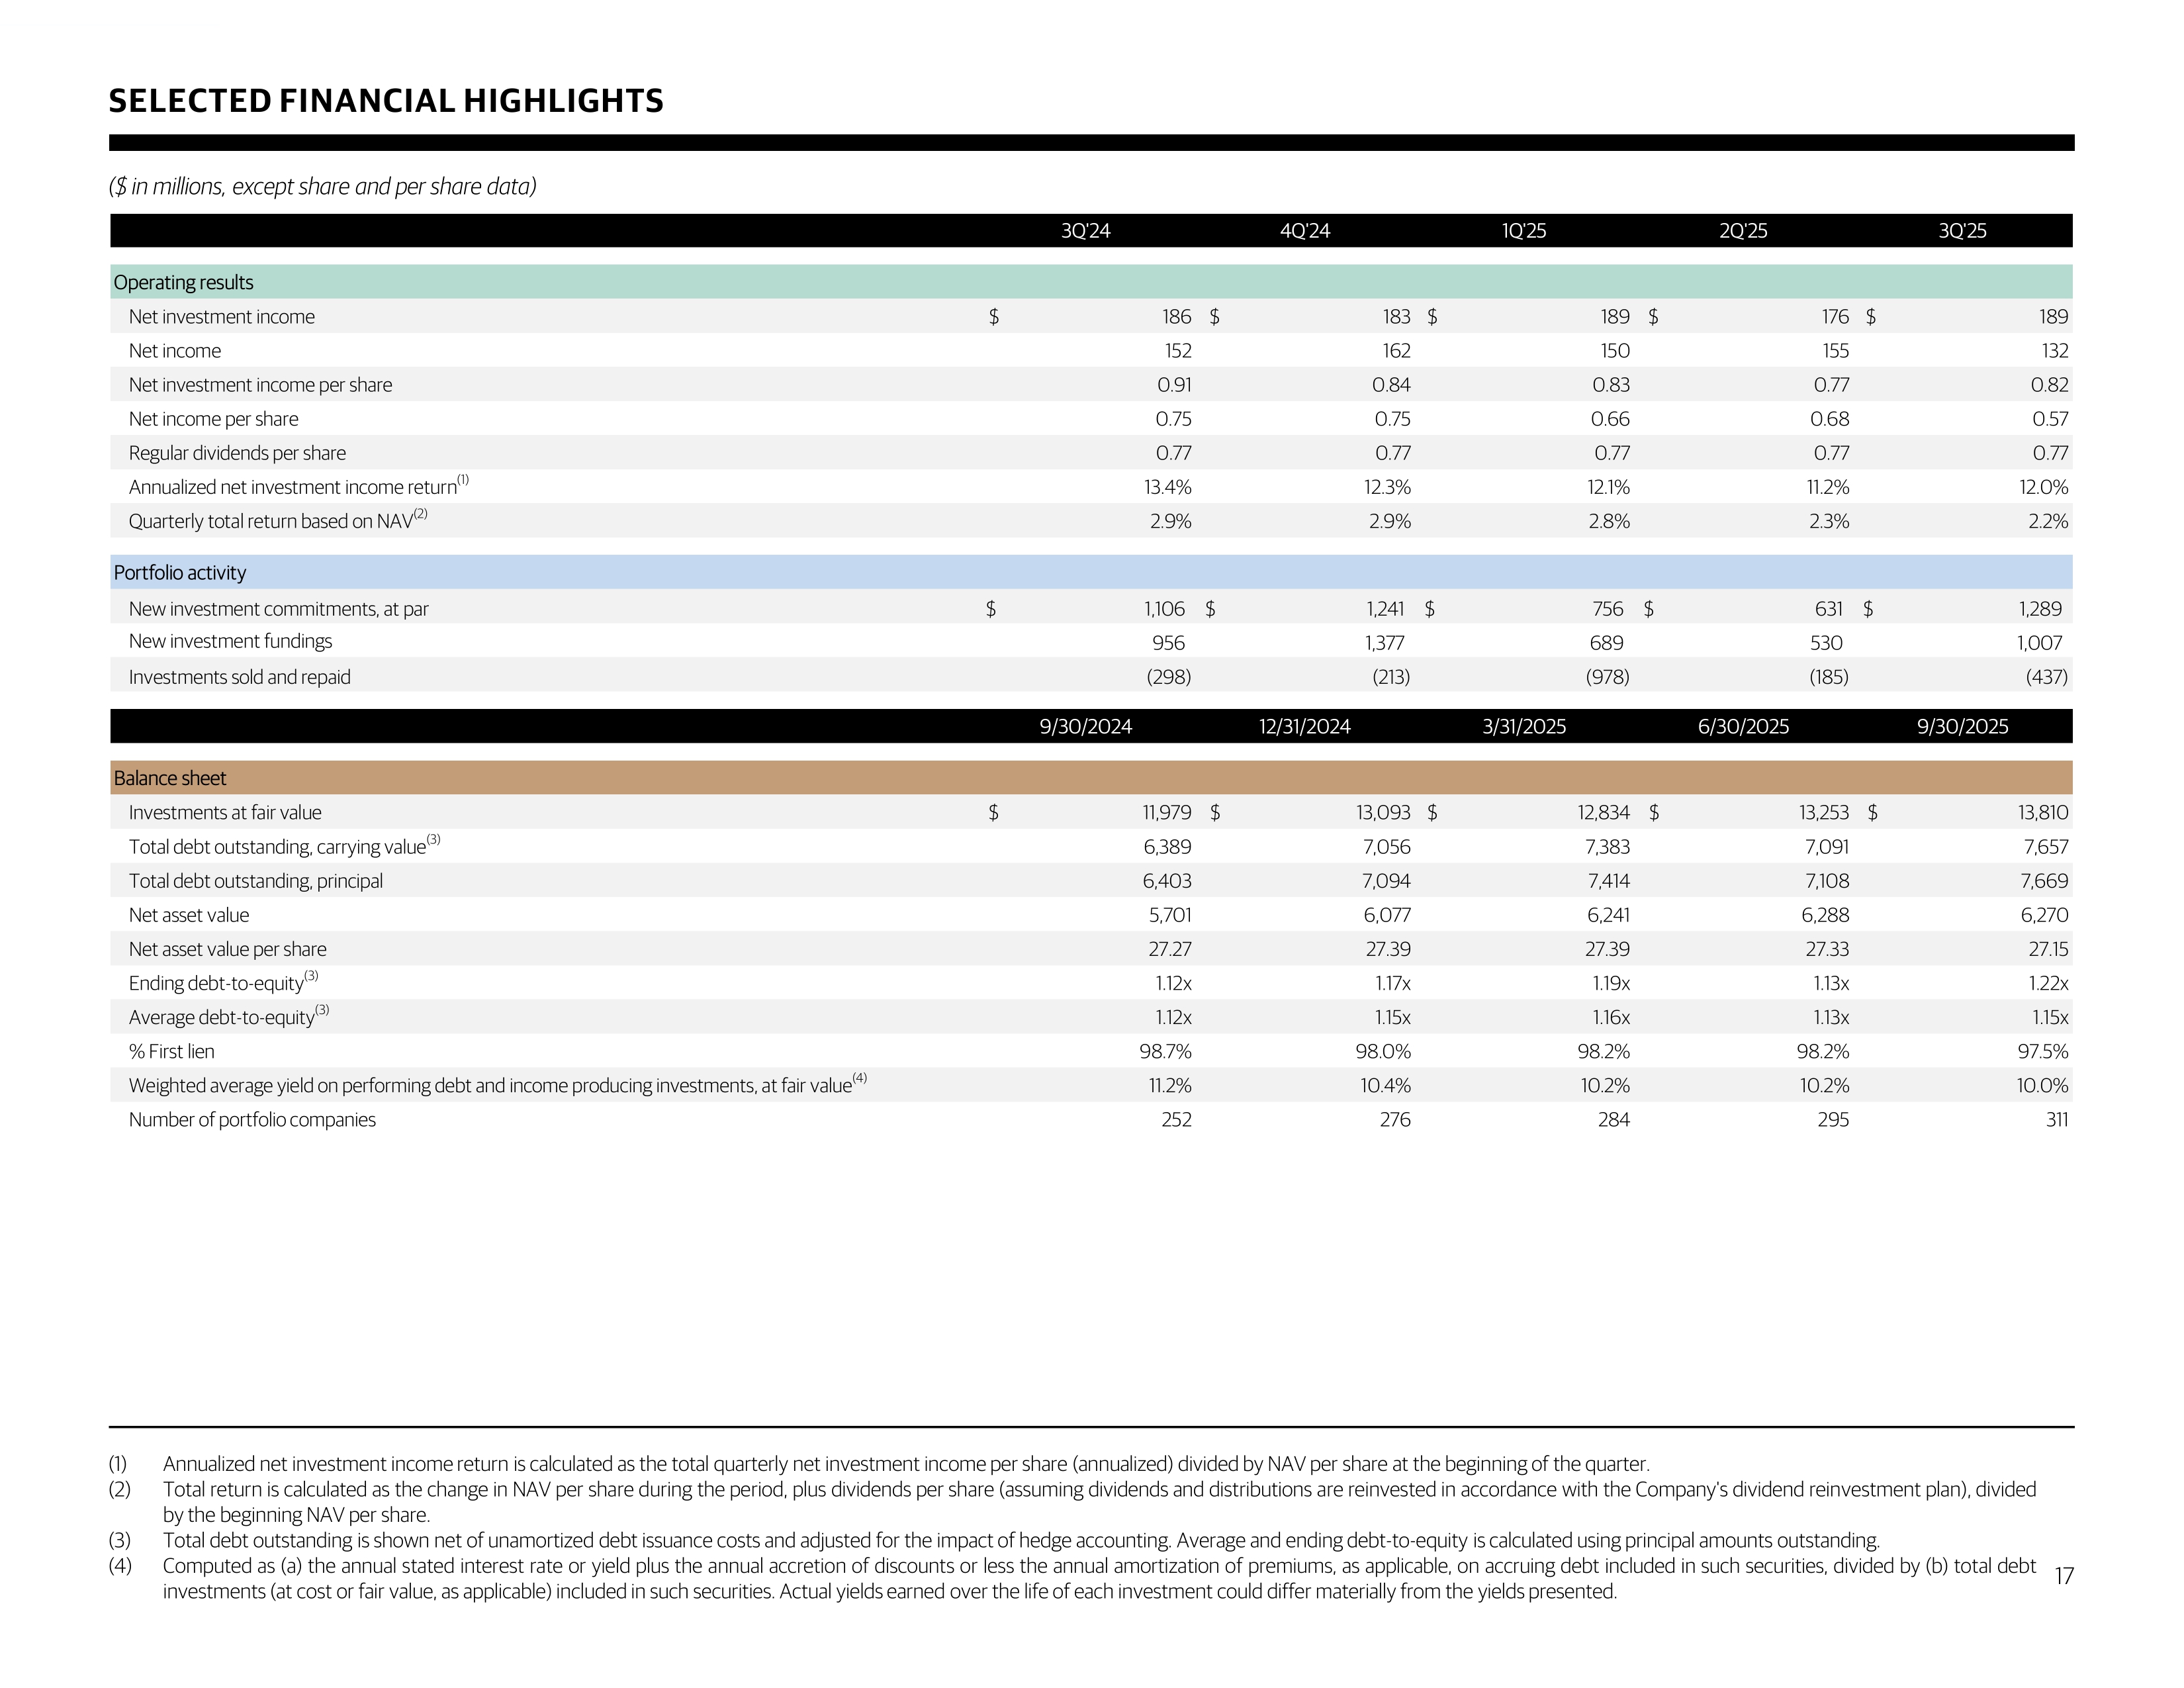
SELECTED FINANCIAL HIGHLIGHTS ($ in millions, except share and per share data) (1) Annualized net investment income return is calculated as the total quarterly net investment income per share (annualized) divided by NAV per share at the beginning of the quarter . (2) Total return is calculated as the change in NAV per share during the period, plus dividends per share (assuming dividends and distributions are reinvested in accordance with the Company's dividend reinvestment plan), divided by the beginning NAV per share . (3) Total debt outstanding is shown net of unamortized debt issuance costs and adjusted for the impact of hedge accounting . Average and ending debt - to - equity is calculated using principal amounts outstanding . (4) Computed as (a) the annual stated interest rate or yield plus the annual accretion of discounts or less the annual amortization of premiums, as applicable, on accruing debt included in such securities, divided by (b) total debt investments (at cost or fair value, as applicable) included in such securities . Actual yields earned over the life of each investment could differ materially from the yields presented . 17 3Q'24 4Q'24 1Q'25 2Q'25 3Q'25 Operating results Net investment income $ 186 $ 183 $ 189 $ 176 $ 189 Net income 152 162 150 155 132 Net investment income per share 0.91 0.84 0.83 0.77 0.82 Net income per share 0.75 0.75 0.66 0.68 0.57 Regular dividends per share 0.77 0.77 0.77 0.77 0.77 Annualized net investment income return (1) 13.4% 12.3% 12.1% 11.2% 12.0% Quarterly total return based on NAV (2) 2.9% 2.9% 2.8% 2.3% 2.2% Portfolio activity New investment commitments, at par 1,106$ 1,241$ 756$ 631$ 1,289$ New investment fundings 956 1,377 689 530 1,007 Investments sold and repaid (298) (213) (978) (185) (437) 9/30/2024 12/31/2024 3/31/2025 6/30/2025 9/30/2025 Balance sheet Investments at fair value $ 11,979 $ 13,093 $ 12,834 $ 13,253 $ 13,810 Total debt outstanding, carrying value (3) 6,389 7,056 7,383 7,091 7,657 Total debt outstanding, principal 6,403 7,094 7,414 7,108 7,669 Net asset value 5,701 6,077 6,241 6,288 6,270 Net asset value per share 27.27 27.39 27.39 27.33 27.15 Ending debt-to-equity (3) 1.12x 1.17x 1.19x 1.13x 1.22x Average debt-to-equity (3) 1.12x 1.15x 1.16x 1.13x 1.15x % First lien 98.7% 98.0% 98.2% 98.2% 97.5% Weighted average yield on performing debt and income producing investments, at fair value (4) 11.2% 10.4% 10.2% 10.2% 10.0% Number of portfolio companies 252 276 284 295 311
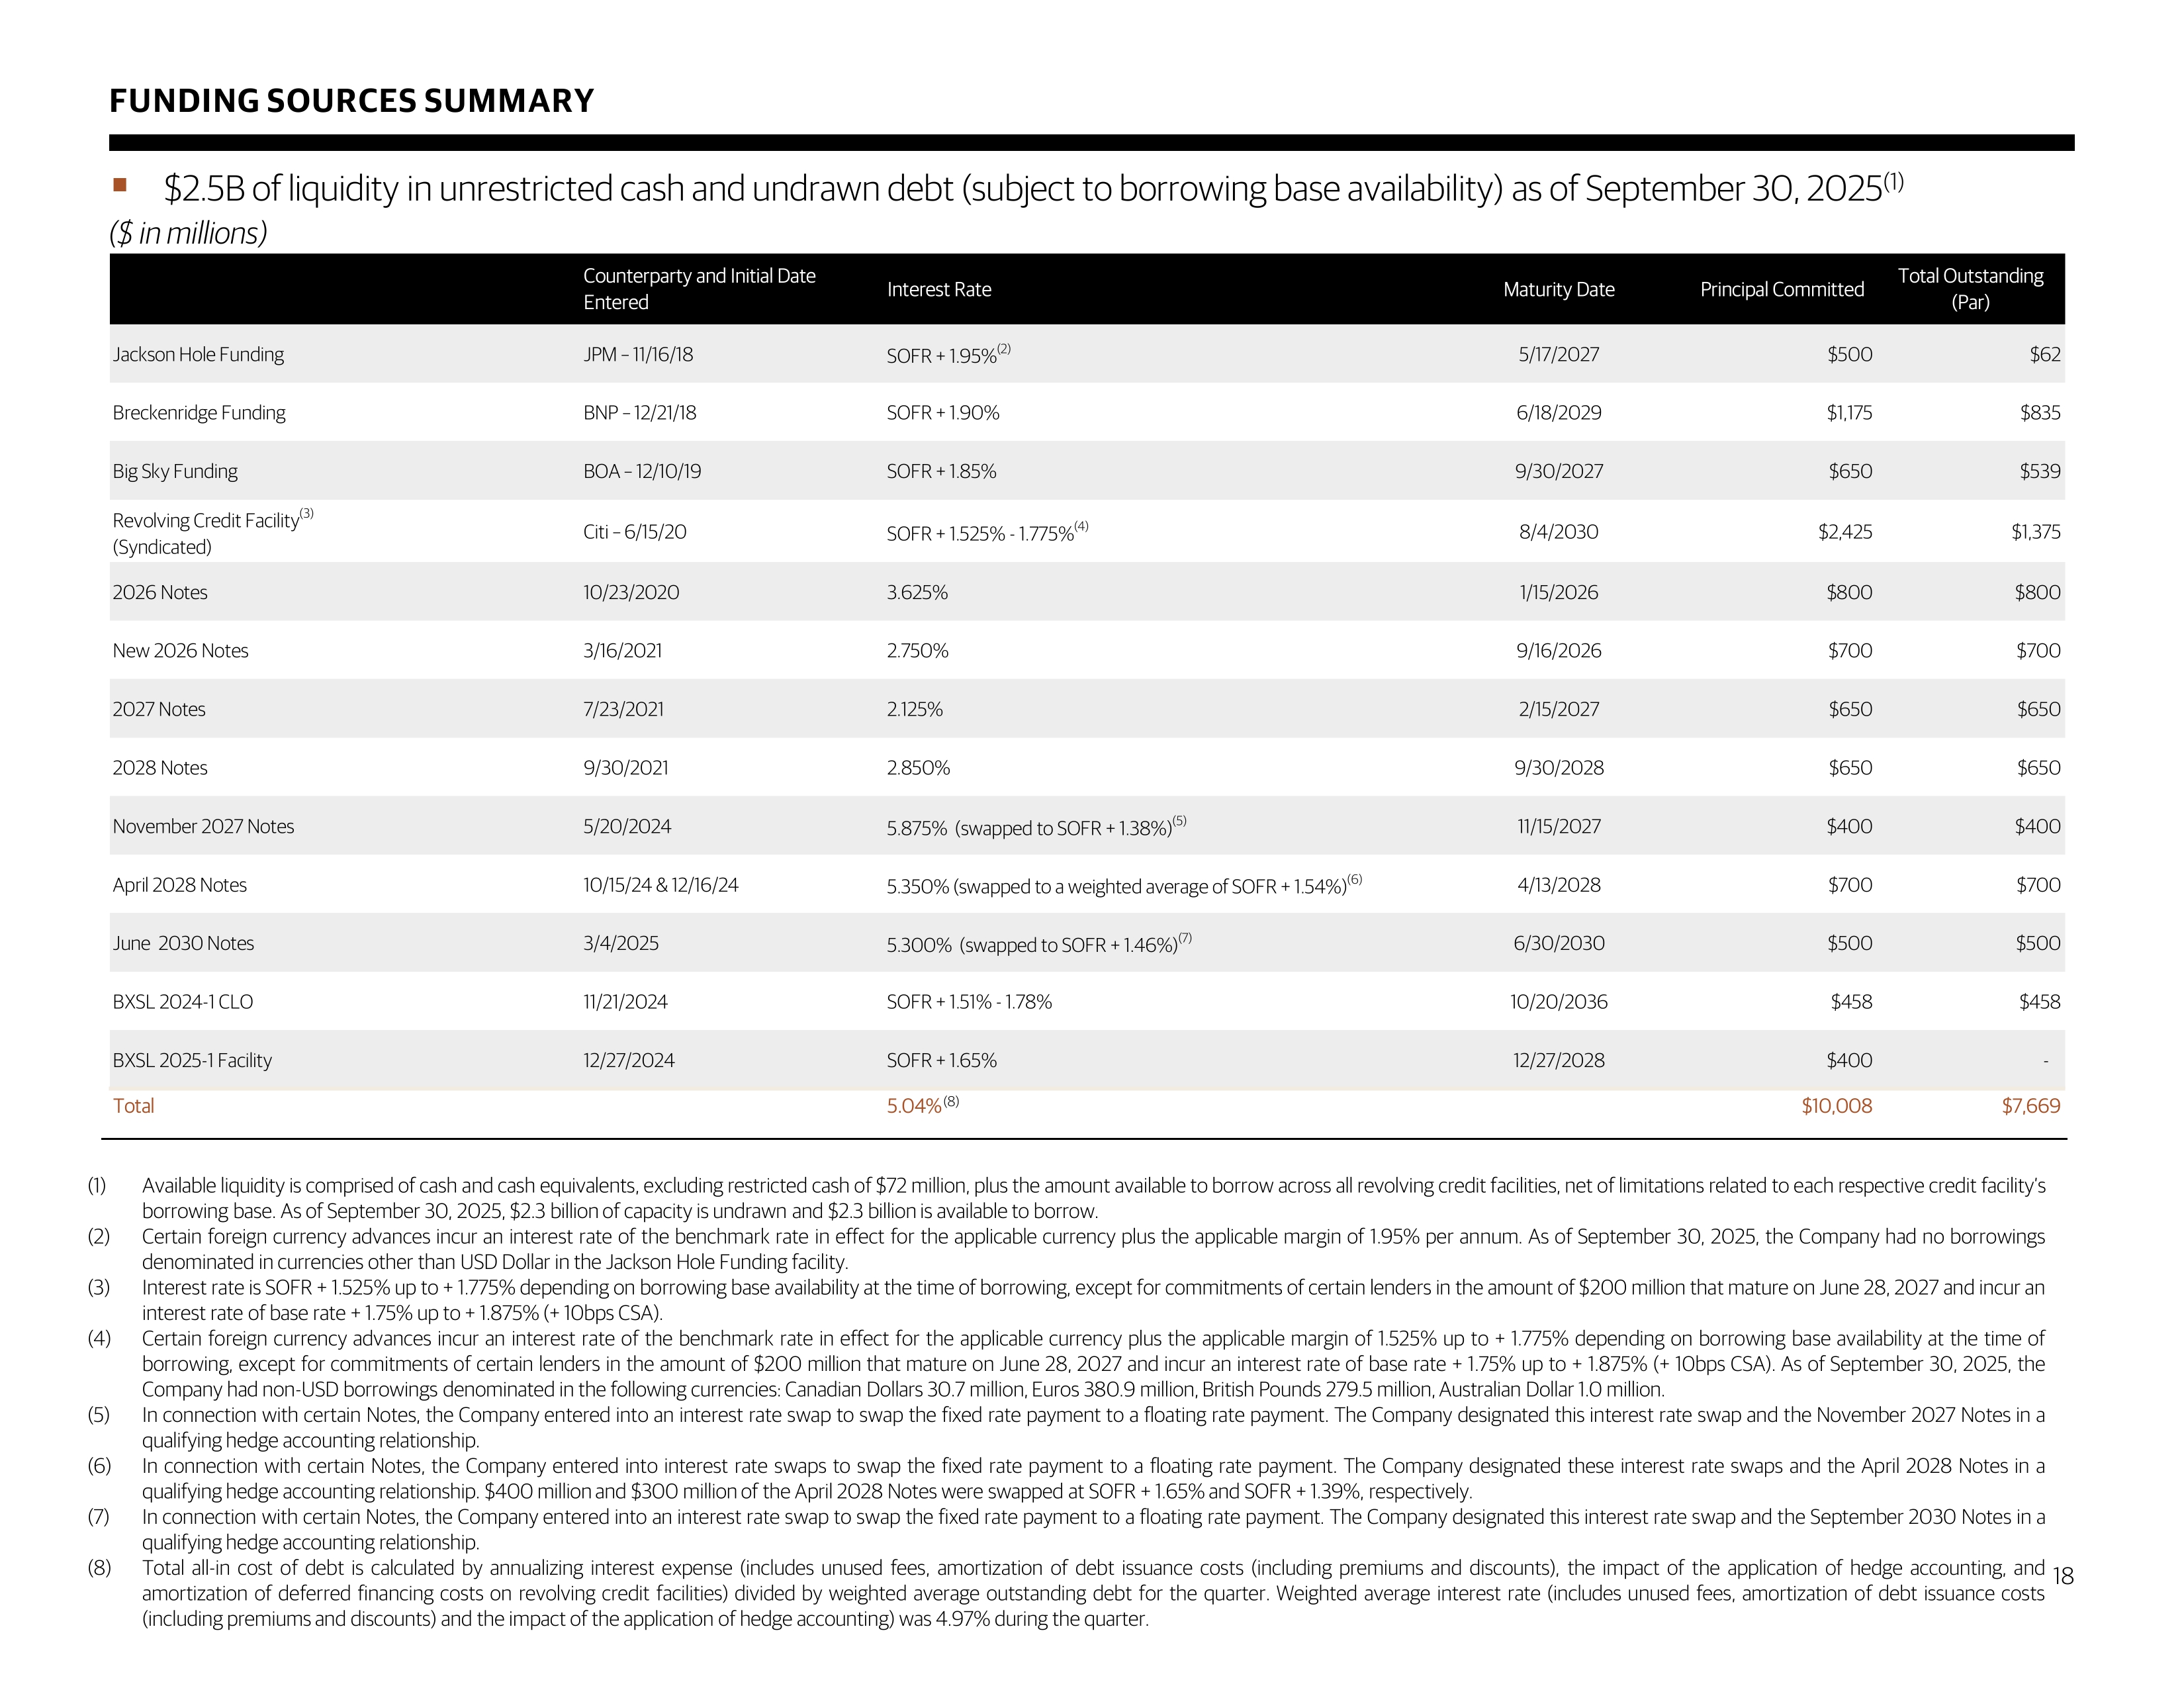
FUNDING SOURCES SUMMARY 18 ▪ $ 2.5 B of liquidity in unrestricted cash and undrawn debt (subject to borrowing base availability) as of September 30, 2025 (1) ($ in millions) (1) Available liquidity is comprised of cash and cash equivalents, excluding restricted cash of $ 72 million, plus the amount available to borrow across all revolving credit facilities, net of limitations related to each respective credit facility’s borrowing base . As of September 30 , 2025 , $ 2 . 3 billion of capacity is undrawn and $ 2 . 3 billion is available to borrow . (2) Certain foreign currency advances incur an interest rate of the benchmark rate in effect for the applicable currency plus the applicable margin of 1 . 95 % per annum . As of September 30 , 2025 , the Company had no borrowings denominated in currencies other than USD Dollar in the Jackson Hole Funding facility . (3) Interest rate is SOFR + 1 . 525 % up to + 1 . 775 % depending on borrowing base availability at the time of borrowing, except for commitments of certain lenders in the amount of $ 200 million that mature on June 28 , 2027 and incur an interest rate of base rate + 1 . 75 % up to + 1 . 875 % (+ 10 bps CSA) . (4) Certain foreign currency advances incur an interest rate of the benchmark rate in effect for the applicable currency plus the applicable margin of 1 . 525 % up to + 1 . 775 % depending on borrowing base availability at the time of borrowing, except for commitments of certain lenders in the amount of $ 200 million that mature on June 28 , 2027 and incur an interest rate of base rate + 1 . 75 % up to + 1 . 875 % (+ 10 bps CSA) . As of September 30 , 2025 , the Company had non - USD borrowings denominated in the following currencies : Canadian Dollars 30 . 7 million, Euros 380 . 9 million, British Pounds 279 . 5 million, Australian Dollar 1 . 0 million . (5) In connection with certain Notes, the Company entered into an interest rate swap to swap the fixed rate payment to a floating rate payment . The Company designated this interest rate swap and the November 2027 Notes in a qualifying hedge accounting relationship . (6) In connection with certain Notes, the Company entered into interest rate swaps to swap the fixed rate payment to a floating rate payment . The Company designated these interest rate swaps and the April 2028 Notes in a qualifying hedge accounting relationship . $ 400 million and $ 300 million of the April 2028 Notes were swapped at SOFR + 1 . 65 % and SOFR + 1 . 39 % , respectively . (7) In connection with certain Notes, the Company entered into an interest rate swap to swap the fixed rate payment to a floating rate payment . The Company designated this interest rate swap and the September 2030 Notes in a qualifying hedge accounting relationship . (8) Total all - in cost of debt is calculated by annualizing interest expense (includes unused fees, amortization of debt issuance costs (including premiums and discounts), the impact of the application of hedge accounting, and amortization of deferred financing costs on revolving credit facilities) divided by weighted average outstanding debt for the quarter . Weighted average interest rate (includes unused fees, amortization of debt issuance costs (including premiums and discounts) and the impact of the application of hedge accounting) was 4 . 97 % during the quarter . Counterparty and Initial Date Entered Interest Rate Maturity Date Principal Committed Total Outstanding (Par) Jackson Hole Funding JPM – 11/16/18 SOFR + 1.95% (2) 5/17/2027 $500 $62 Breckenridge Funding BNP – 12/21/18 SOFR + 1.90% 6/18/2029 $1,175 $835 Big Sky Funding BOA – 12/10/19 SOFR + 1.85% 9/30/2027 $650 $539 Revolving Credit Facility (3) (Syndicated) Citi – 6/15/20 SOFR + 1.525% - 1.775% (4) 8/4/2030 $2,425 $1,375 2026 Notes 10/23/2020 3.625% 1/15/2026 $800 $800 New 2026 Notes 3/16/2021 2.750% 9/16/2026 $700 $700 2027 Notes 7/23/2021 2.125% 2/15/2027 $650 $650 2028 Notes 9/30/2021 2.850% 9/30/2028 $650 $650 November 2027 Notes 5/20/2024 5.875% (swapped to SOFR + 1.38%) (5) 11/15/2027 $400 $400 April 2028 Notes 10/15/24 & 12/16/24 5.350% (swapped to a weighted average of SOFR + 1.54%) (6) 4/13/2028 $700 $700 June 2030 Notes 3/4/2025 5.300% (swapped to SOFR + 1.46%) (7) 6/30/2030 $500 $500 BXSL 2024-1 CLO 11/21/2024 SOFR + 1.51% - 1.78% 10/20/2036 $458 $458 BXSL 2025-1 Facility 12/27/2024 SOFR + 1.65% 12/27/2028 $400 - Total 5.04% $10,008 $7,669 (8)

Important Disclosure Information 19
FORWARD LOOKING STATEMENTS Certain information contained in this communication constitutes “forward - looking statements . ” These forward - looking statements can be identified by the use of forward - looking terminology, such as “outlook,” “indicator,” “believes,” “expects,” “potential,” “continues,” “may,” “can,” “could,” “will,” “should,” “seeks,” “approximately,” “predicts,” “intends,” “plans,” “estimates,” “anticipates”, “confident,” “conviction,” “identified” or the negative versions of these words or other comparable words thereof . These may include BXSL’s financial estimates and their underlying assumptions, statements about plans, statements regarding pending transactions, objectives and expectations with respect to future operations, statements regarding future performance, statements regarding economic and market trends and statements regarding identified but not yet closed investments . Such forward-looking statements are subject to various risks and uncertainties . Accordingly, there are or will be important factors that could cause actual outcomes or results to differ materially from those indicated in such statements . BXSL believes these factors include but are not limited to those described under the section entitled “Risk Factors” in its prospectus and annual report for the most recent fiscal year, and any such updated factors included in its periodic filings with the Securities and Exchange Commission (the “SEC”), which are accessible on the SEC’s website at www . sec . gov . These factors should not be construed as exhaustive and should be read in conjunction with the other cautionary statements that are included in this document (or BXSL’s prospectus and other filings) . Except as otherwise required by federal securities laws, BXSL undertakes no obligation to publicly update or revise any forward - looking statements, whether as a result of new information, future developments or otherwise . 20