J.P. Morgan Healthcare Conference Jeff Simmons President & CEO January 13, 2026
Notices and Disclaimers Forward - Looking Statements . This presentation contains forward - looking statements within the meaning of the federal securities laws, including, without limitation, statements concerning product launches and revenue from such products, our 2025 full year and fourth quarter guidance, long - term expectations, our expectations regarding debt levels, and expectations regarding our industry and our operations, performance and financial condition, and including, in particular, statements relating to our business, growth strategies, distribution strategies, product development efforts and future expenses . Forward - looking statements are based on our current expectations and assumptions regarding our business, the economy and other future conditions . Because forward - looking statements relate to the future, by their nature, they are subject to inherent uncertainties, risks and changes in circumstances that are difficult to predict . As a result, our actual results may differ materially from those contemplated by the forward - looking statements . Important risk factors that could cause actual results to differ materially from those in the forward - looking statements include regional, national or global political, economic, business, competitive, market and regulatory conditions, including but not limited to the following : operating in a highly competitive industry ; the success of our research and development (R&D), regulatory approval and licensing efforts ; the impact of disruptive innovations and advances in veterinary medical practices, animal health technologies and alternatives to animal - derived protein ; competition from generic products that may be viewed as more cost - effective ; changes in regulatory restrictions on the use of antibiotics in farm animals ; an outbreak of infectious disease carried by farm animals ; risks related to the evaluation of animals ; consolidation of our customers and distributors ; the impact of increased or decreased sales into our distribution channels resulting in fluctuations in our revenues ; our dependence on the success of our top products ; our ability to complete acquisitions and divestitures and to successfully integrate the businesses we acquire ; our ability to implement our business strategies or achieve targeted cost efficiencies and gross margin improvements ; manufacturing problems and capacity imbalances, including at our contract manufacturers ; fluctuations in inventory levels in our distribution channels ; risks related to the use of artificial intelligence in our business ; our dependence on sophisticated information technology systems and infrastructure, including the use of third - party, cloud - based technologies, and the impact of outages or breaches of the information technology systems and infrastructure we rely on ; the impact of weather conditions, including those related to climate change, and the availability of natural resources ; demand, supply and operational challenges associated with the effects of a human disease outbreak, epidemic, pandemic or other widespread public health concern ; the loss of key personnel or highly skilled employees ; adverse effects of labor disputes, strikes and/or work stoppages ; the effect of our substantial indebtedness on our business, including restrictions in our debt agreements that limit our operating flexibility and changes in our credit ratings that lead to higher borrowing expenses and restrict access to credit ; changes in interest rates that adversely affect our earnings and cash flows ; risks related to the write - down of goodwill or identifiable intangible assets ; the lack of availability or significant increases in the cost of raw materials ; risks related to foreign and domestic economic, political, legal, and business environments ; risks related to foreign currency exchange rate fluctuations ; risks related to underfunded pension plan liabilities ; our current plan not to pay dividends and restrictions on our ability to pay dividends ; the potential impact that actions by activist shareholders could have on the pursuit of our business strategies ; risks related to tax expense or exposures ; actions by regulatory bodies, including as a result of their interpretation of studies on product safety ; the possible slowing or cessation of acceptance and/or adoption of our farm animal sustainability initiatives ; the impact of increased regulation or decreased governmental financial support related to the raising, processing or consumption of farm animals ; risks related to tariffs, trade protection measures or other modifications of foreign trade policy ; the impact of litigation, regulatory investigations and other legal matters, including the risk to our reputation and the risk that our insurance policies may be insufficient to protect us from the impact of such matters ; challenges to our intellectual property rights or our alleged violation of rights of others ; misuse, off - label or counterfeiting use of our products ; unanticipated safety, quality or efficacy concerns and the impact of identified concerns associated with our products ; insufficient insurance coverage against hazards and claims ; compliance with privacy laws and security of information ; risks related to environmental, health and safety laws and regulations ; and inability to achieve goals or meet expectations of stakeholders with respect to environmental, social and governance matters . For additional information about the factors that could cause actual results to differ materially from forward - looking statements, please see the company’s latest Form 10 - K and Form 10 - Qs filed with the Securities and Exchange Commission . We undertake no duty to update forward - looking statements . Non - GAAP Financial Measures . This presentation contains non - GAAP financial measures, such as organic constant currency revenue growth, adjusted gross margin, adjusted EBITDA, adjusted EBITDA margin, and net debt leverage, which we use to assess and analyze our operational results and trends . We have not provided related GAAP financial measures for forward - looking non - GAAP financial measures because we are unable to predict with reasonable certainty and without unreasonable effort the timing and impact of certain items, such as restructuring and certain non - cash items, which could significantly impact our GAAP results . These non - GAAP measures are not, and should not be viewed as, substitutes for GAAP reported measures . 2025 Financial Information and Outlook . All references to our expected 2025 financial results and outlook are based on our 2025 guidance and outlook as provided on November 5 , 2025 and reaffirmed at our Investor Day on December 9 , 2025 . We expect to announce results for the fourth quarter and fiscal 2025 and provide an updated outlook in February 2026 .
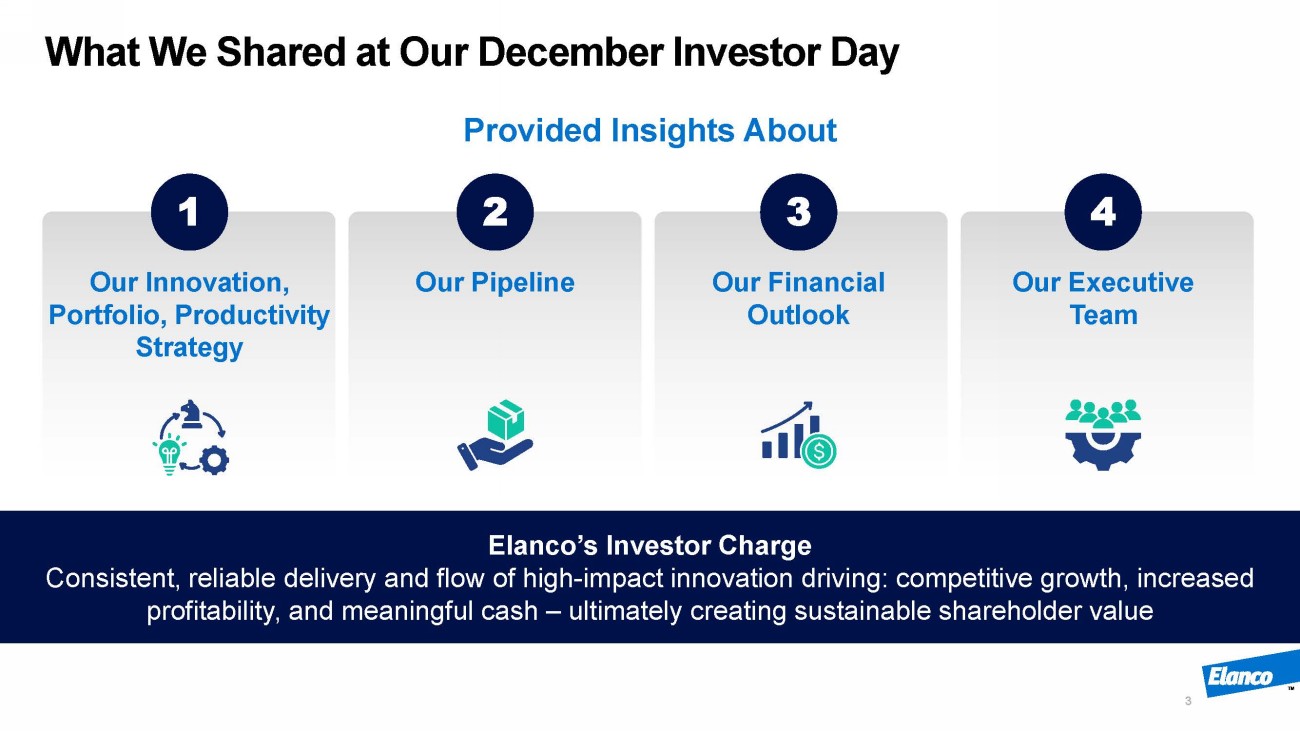
What We Shared at Our December Investor Day 3 1 2 3 4 Our Innovation, Portfolio, Productivity Strategy Our Pipeline Our Financial Outlook Our Executive Team Provided Insights About Elanco’s Investor Charge Consistent, reliable delivery and flow of high - impact innovation driving: competitive growth, increased profitability, and meaningful cash – ultimately creating sustainable shareholder value
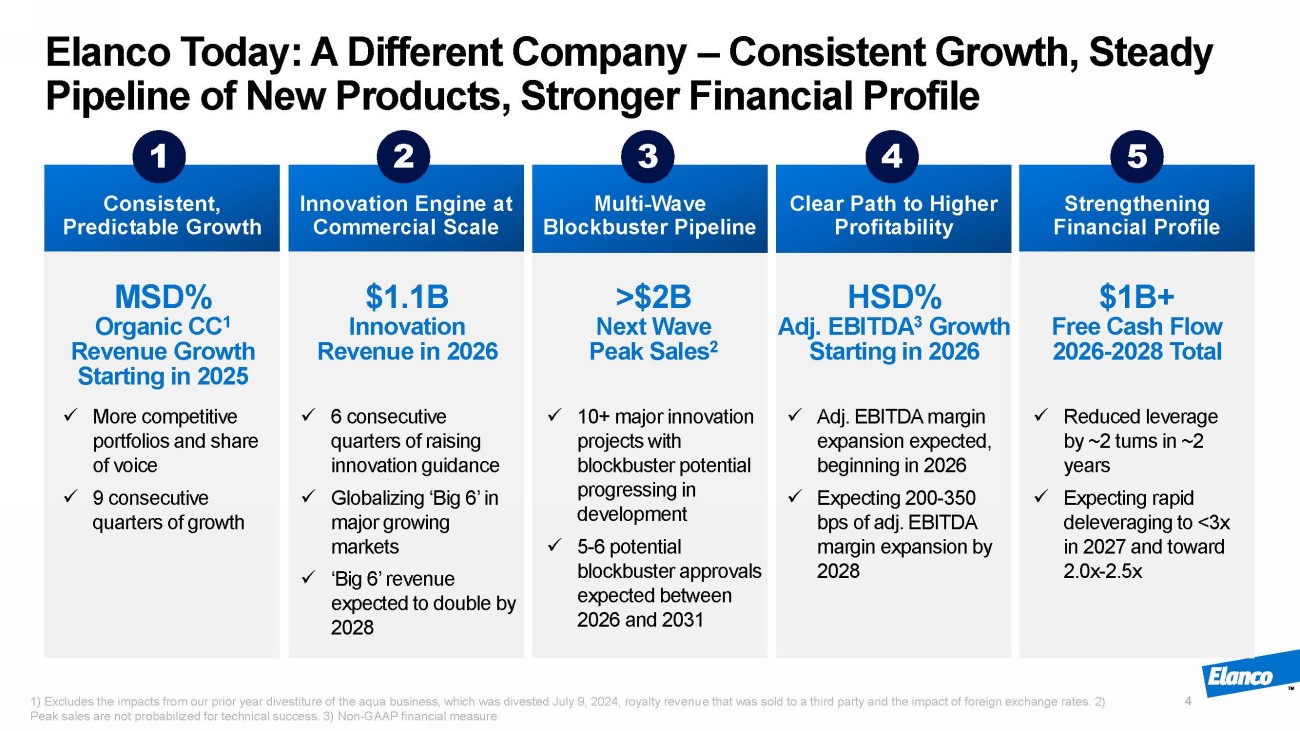
Consistent, Predictable Growth Multi - Wave Blockbuster Pipeline Strengthening Financial Profile Innovation Engine at Commercial Scale Clear Path to Higher Profitability Elanco Today: A Different Company – Consistent Growth, Steady Pipeline of New Products, Stronger Financial Profile 4 1 2 3 5 4 MSD% Organic CC 1 Revenue Growth Starting in 2025 $1.1B I nnovation Revenue in 2026 >$2B Next Wave Peak Sales 2 $1B+ Free Cash Flow 2026 - 2028 Total x More competitive portfolios and share of voice x 9 consecutive quarters of growth x 6 consecutive quarters of raising innovation guidance x Globalizing ‘Big 6’ in major growing markets x ‘ Big 6’ revenue expected to double by 2028 x 10+ major innovation projects with blockbuster potential progressing in development x 5 - 6 potential blockbuster approvals expected between 2026 and 2031 x Adj. EBITDA margin expansion expected, beginning in 2026 x Expecting 200 - 350 bps of adj. EBITDA margin expansion by 2028 x Reduced leverage by ~2 turns in ~2 years x Expecting rapid deleveraging to <3x in 2027 and toward 2.0x - 2.5x HSD% Adj. EBITDA 3 Growth Starting in 2026 1) Excludes the impacts from our prior year divestiture of the aqua business, which was divested July 9, 2024, royalty revenu e t hat was sold to a third party and the impact of foreign exchange rates. 2) Peak sales are not probabilized for technical success. 3) Non - GAAP financial measure
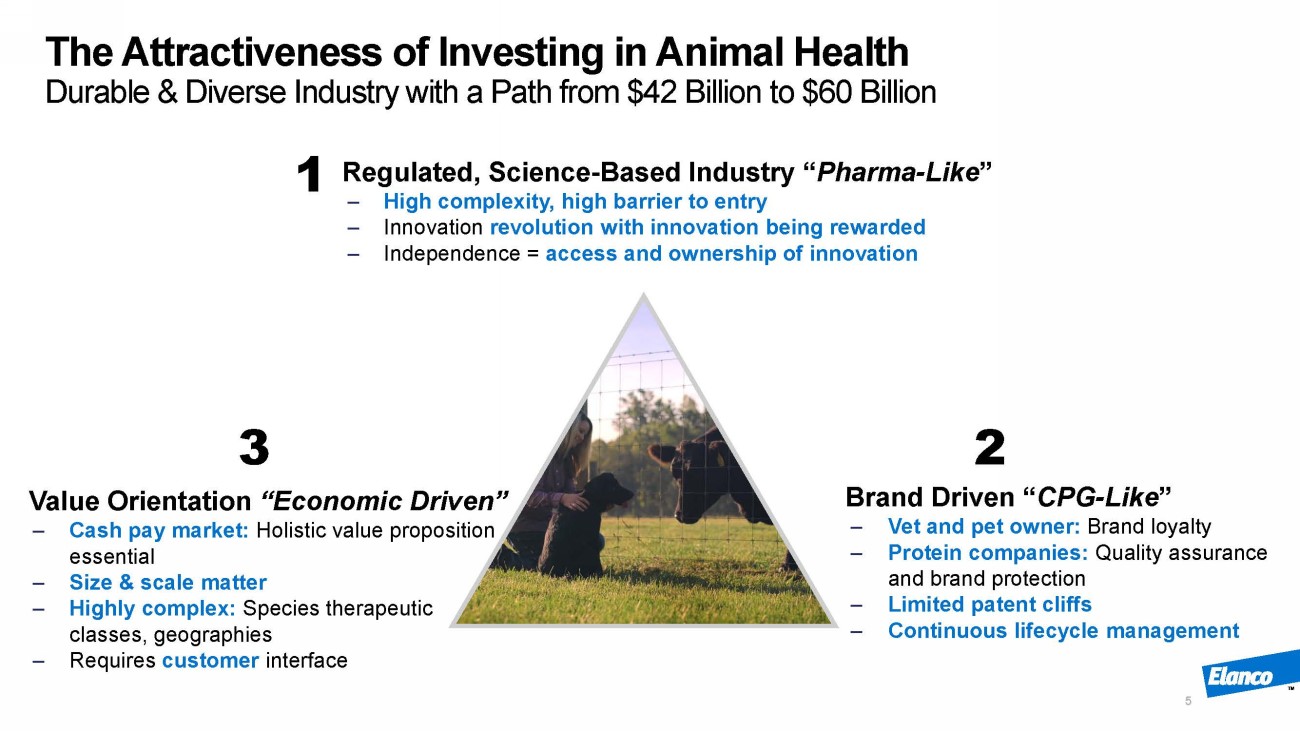
The Attractiveness of Investing in Animal Health Durable & Diverse Industry with a Path from $42 Billion to $60 Billion 5 Regulated, Science - Based Industry “ Pharma - Like ” ‒ High complexity, high barrier to entry ‒ Innovation revolution with innovation being rewarded ‒ Independence = a ccess and ownership of innovation 1 2 Brand Drive n “ CPG - Like ” ‒ Vet and pet o wner : Brand loyalty ‒ Protein companies: Quality assurance and brand protection ‒ Limited patent cliffs ‒ Continuous lifecycle m anagement Value Orientation “ Economic Driven ” ‒ Cash pay market: Holistic v alue proposition essential ‒ Size & scale m atter ‒ Highly complex: Species therapeutic classes, geographies ‒ Requires customer interface 3
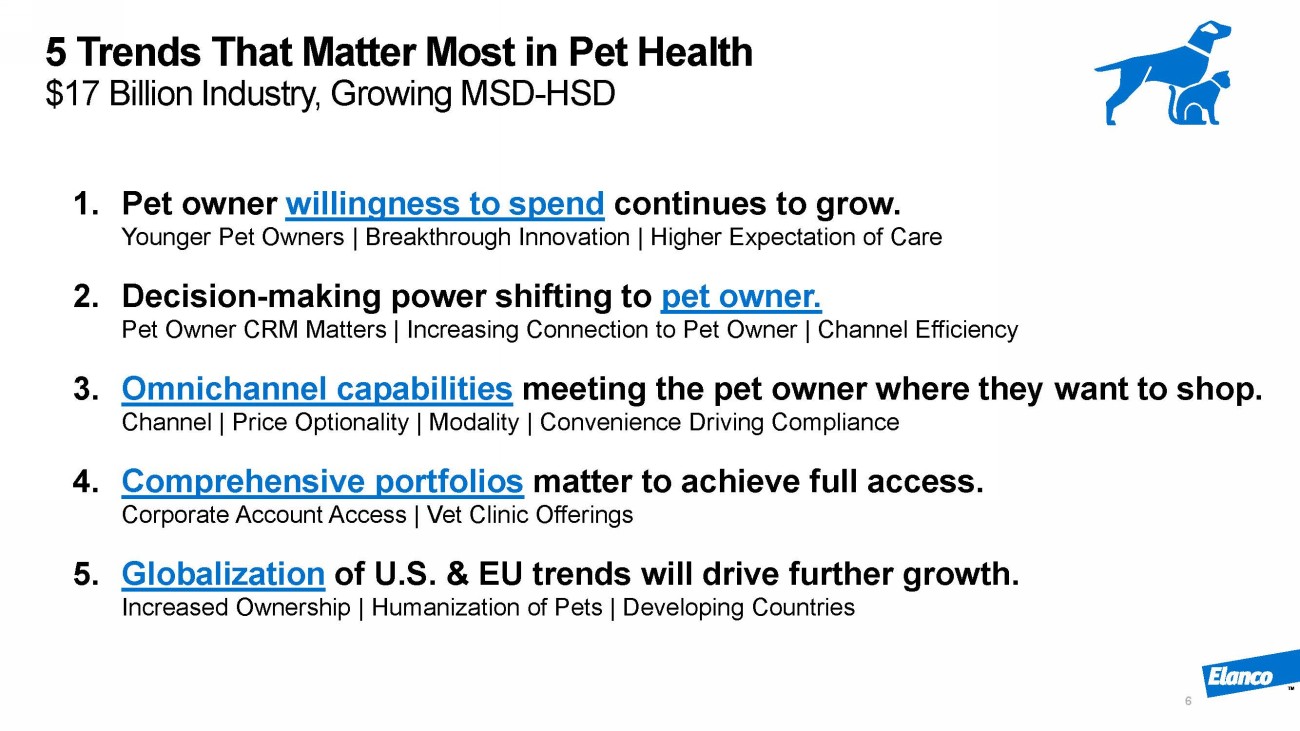
5 Trends That Matter Most in Pet Health $17 Billion Industry, Growing MSD - HSD 6 1. Pet owner willingness to spend continues to grow. Younger Pet Owners | Breakthrough Innovation | Higher Expectation of Care 2. Decision - making power shifting to pet owner. Pet Owner CRM Matters | Increasing Connection to Pet Owner | Channel Efficiency 3. Omnichannel capabilities meeting the pet owner where they want to shop. Channel | Price Optionality | Modality | Convenience Driving Compliance 4. Comprehensive portfolios matter to achieve full access. Corporate Account Access | Vet Clinic Offerings 5. Globalization of U.S. & EU trends will drive further growth. Increased Ownership | Humanization of Pets | Developing Countries
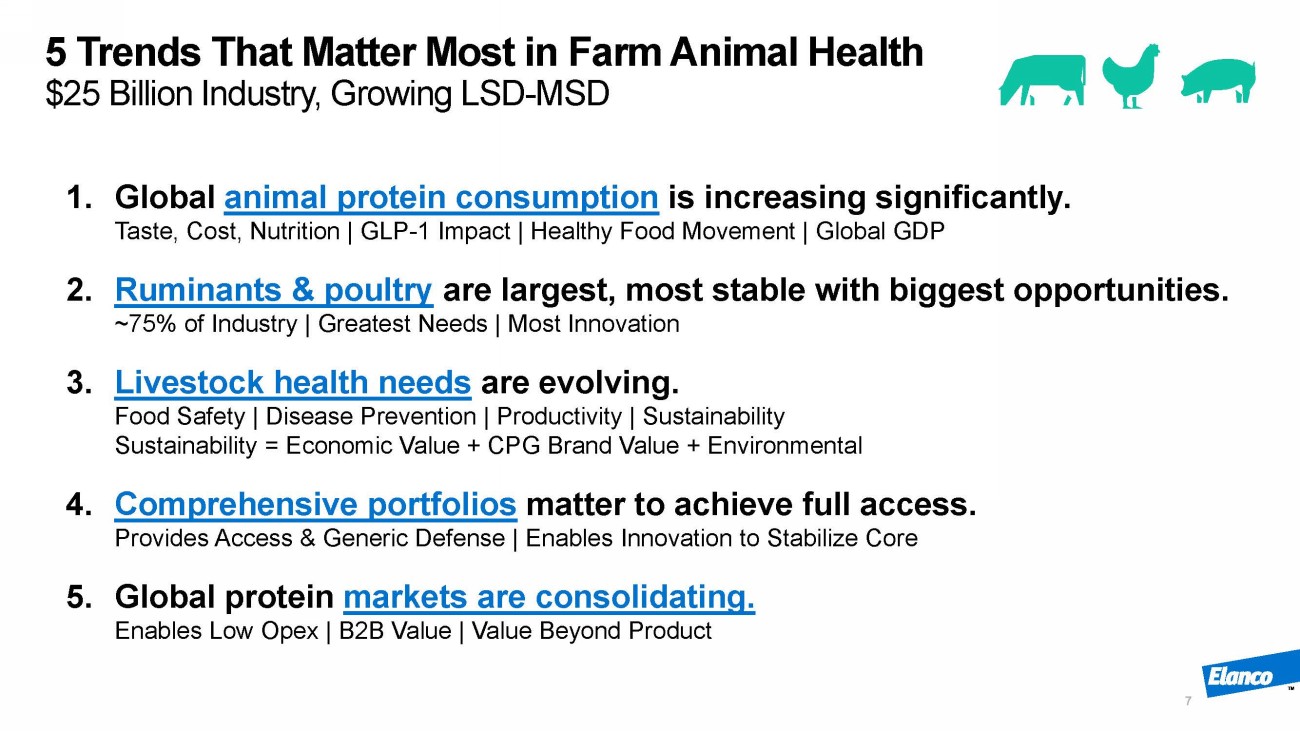
5 Trends That Matter Most in Farm Animal Health $25 Billion Industry, Growing LSD - MSD 7 1. Global animal protein consumption is increasing significantly. Taste, Cost, Nutrition | GLP - 1 Impact | Healthy Food Movement | Global GDP 2. Ruminants & poultry are largest, most stable with biggest opportunities. ~75% of Industry | Greatest Needs | Most Innovation 3. Livestock health needs are evolving. Food Safety | Disease Prevention | Productivity | Sustainability Sustainability = Economic Value + CPG Brand Value + Environmental 4. Comprehensive portfolios matter to achieve full access. Provides Access & Generic Defense | Enables Innovation to Stabilize Core 5. Global protein markets are consolidating. Enables Low Opex | B2B Value | Value Beyond Product
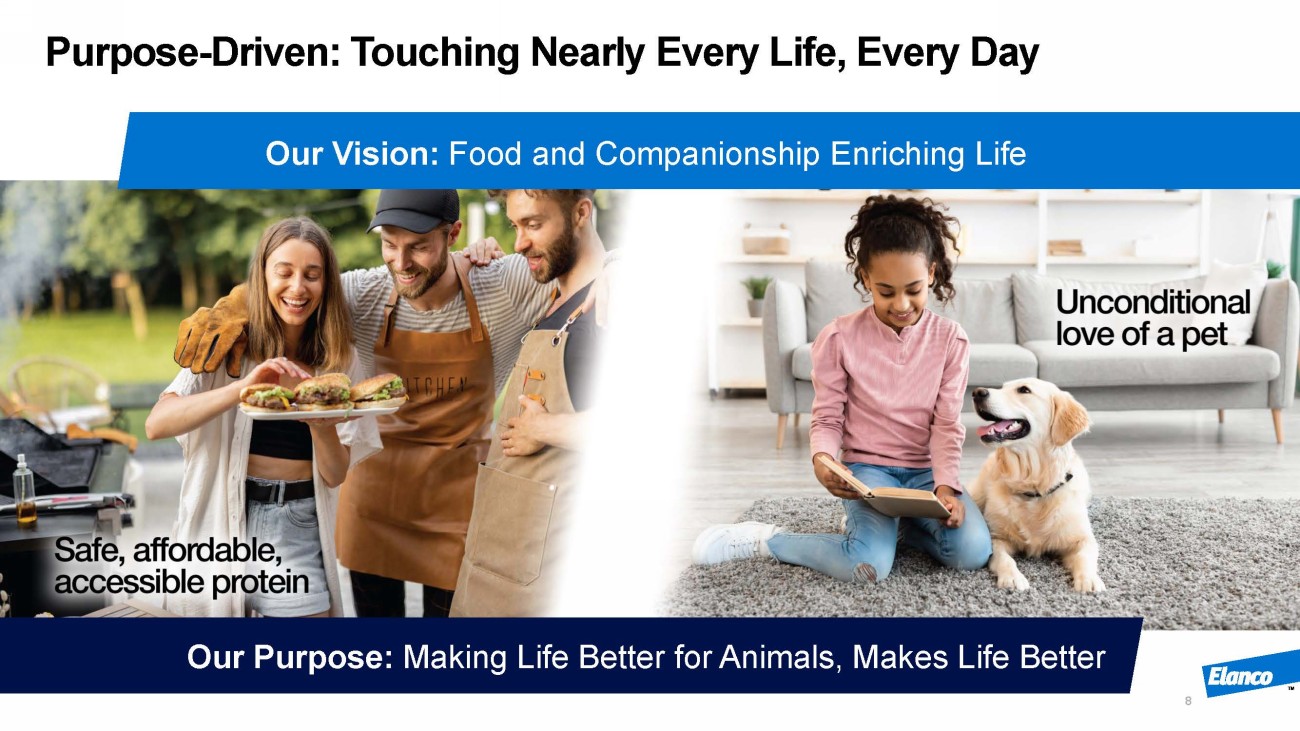
Purpose - Driven: Touching Nearly Every Life, Every Day 8 Our Vision: Food and Companionship Enriching Life Our Purpose: Making Life Better for Animals, Makes Life Better
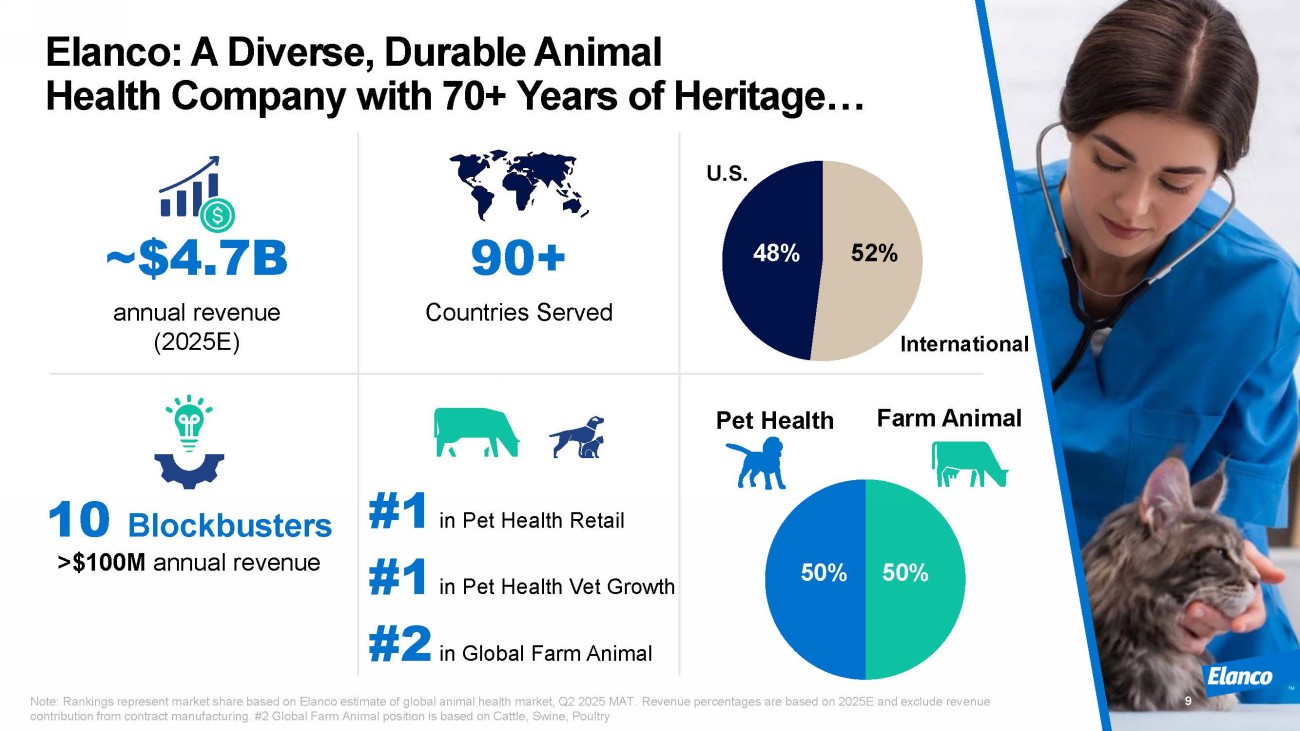
Elanco: A Diverse, Durable Animal Health Company with 70+ Years of Heritage… 9 10 Blockbusters >$100M annual revenue ~$4.7B annual revenue (2025E) 90+ Countries Served #1 in Pet Health Retail #1 in Pet Health Vet Growth #2 in Global Farm Animal 52% 48% International U.S. Pet Health Farm Animal 50% 50 % Note: Rankings represent m arket share based on Elanco estimate of global animal health market, Q2 2025 MAT. Revenue percentages are based on 2025E and exclude revenue contribution from contract manufacturing. #2 Global Farm Animal position is based on Cattle, Swine, Poultry
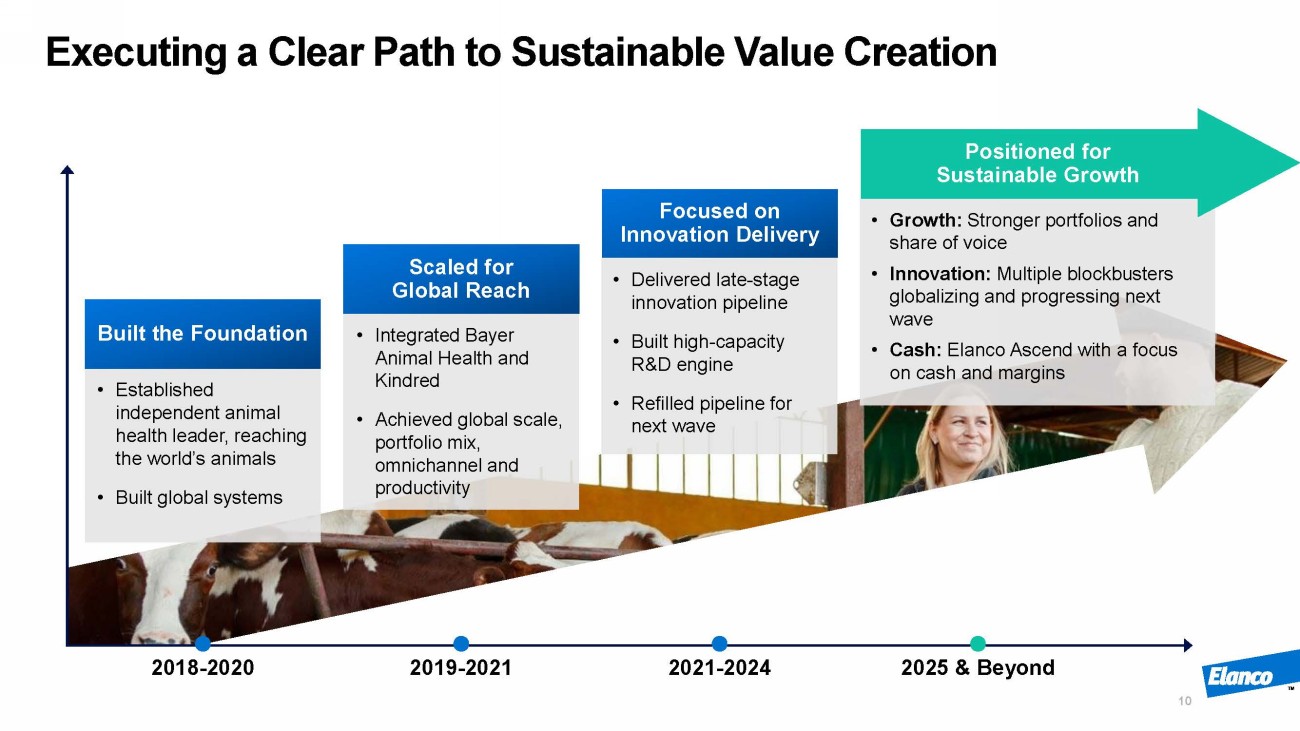
2018 - 2020 2019 - 2021 2021 - 2024 2025 & Beyond Executing a Clear Path to Sustainable Value Creation Built the Foundation • Established independent animal health leader, reaching the world’s animals • Built global systems Scaled for Global Reach • Integrated Bayer Animal Health and Kindred • Achieved global scale, portfolio mix, omnichannel and productivity Focused on Innovation Delivery • Delivered late - stage innovation pipeline • Built high - capacity R&D engine • Refilled pipeline for next wave 10 Positioned for Sustainable Growth • Growth: Stronger portfolios and share of voice • Innovation: Multiple blockbusters globalizing and progressing next wave • Cash: Elanco Ascend with a focus on cash and margins
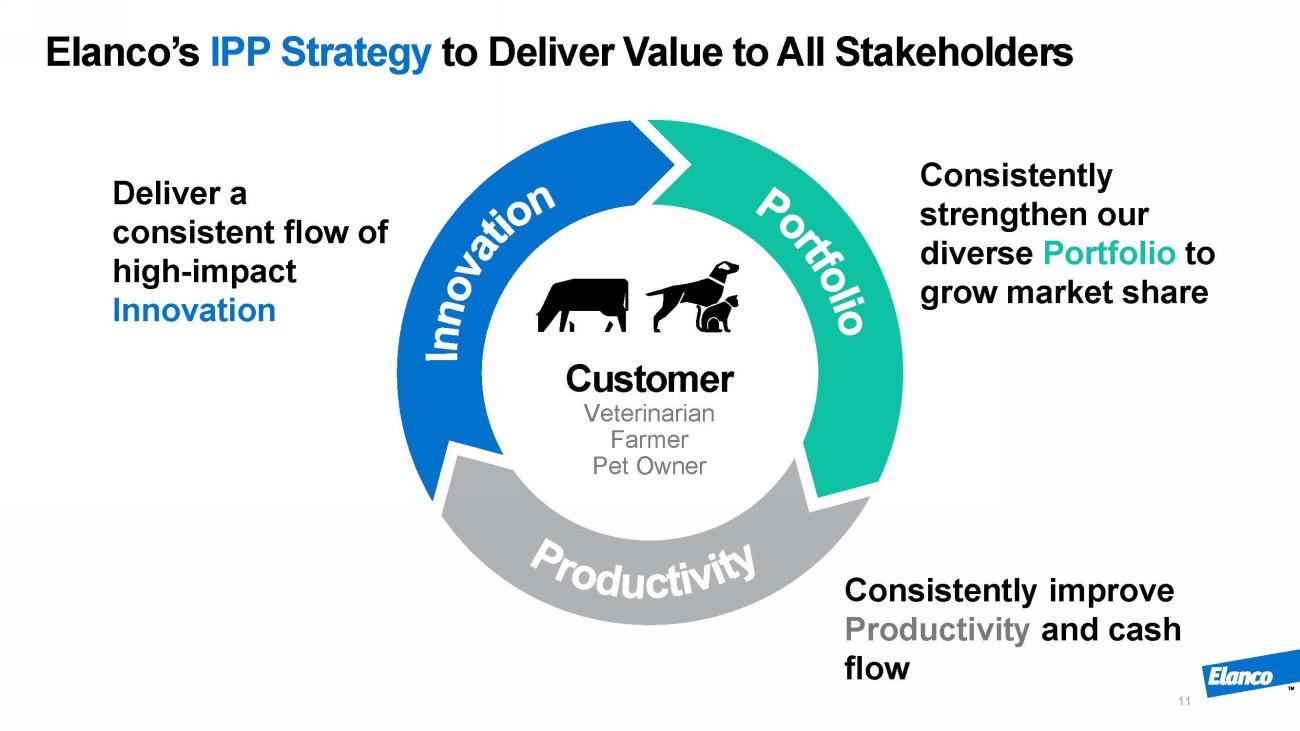
Elanco’s IPP Strategy to Deliver Value to All Stakeholders 11 Customer Veterinarian Farmer Pet Owner Deliver a consistent flow of high - impact Innovation Consistently strengthen our diverse Portfolio to grow market share Consistently i mprove Productivity and c ash flow
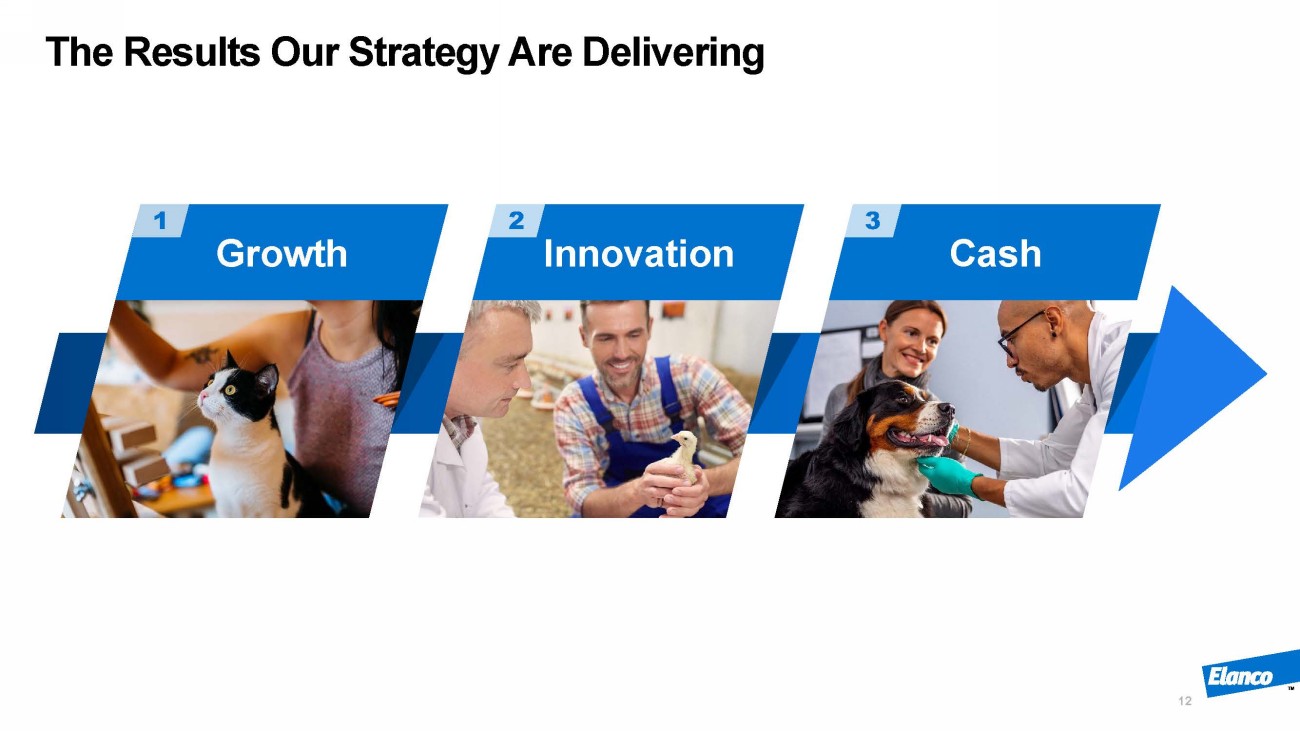
Growth Innovation Cash The Results Our Strategy Are Delivering 12 1 2 3
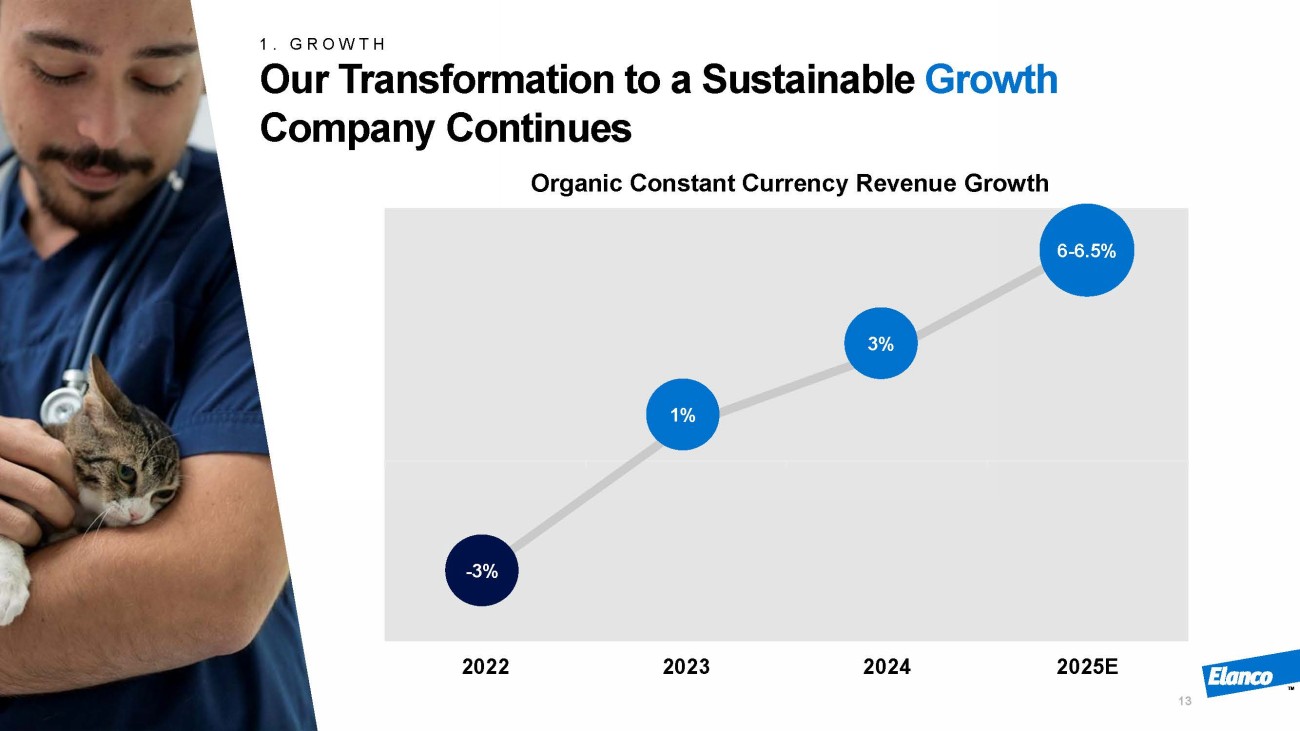
2022 2023 2024 2025E - 3% 1% 3% 6 - 6.5% 13 1. GROWTH Our Transformation to a Sustainable Growth Company Continues Organic Constant Currency Revenue Growth
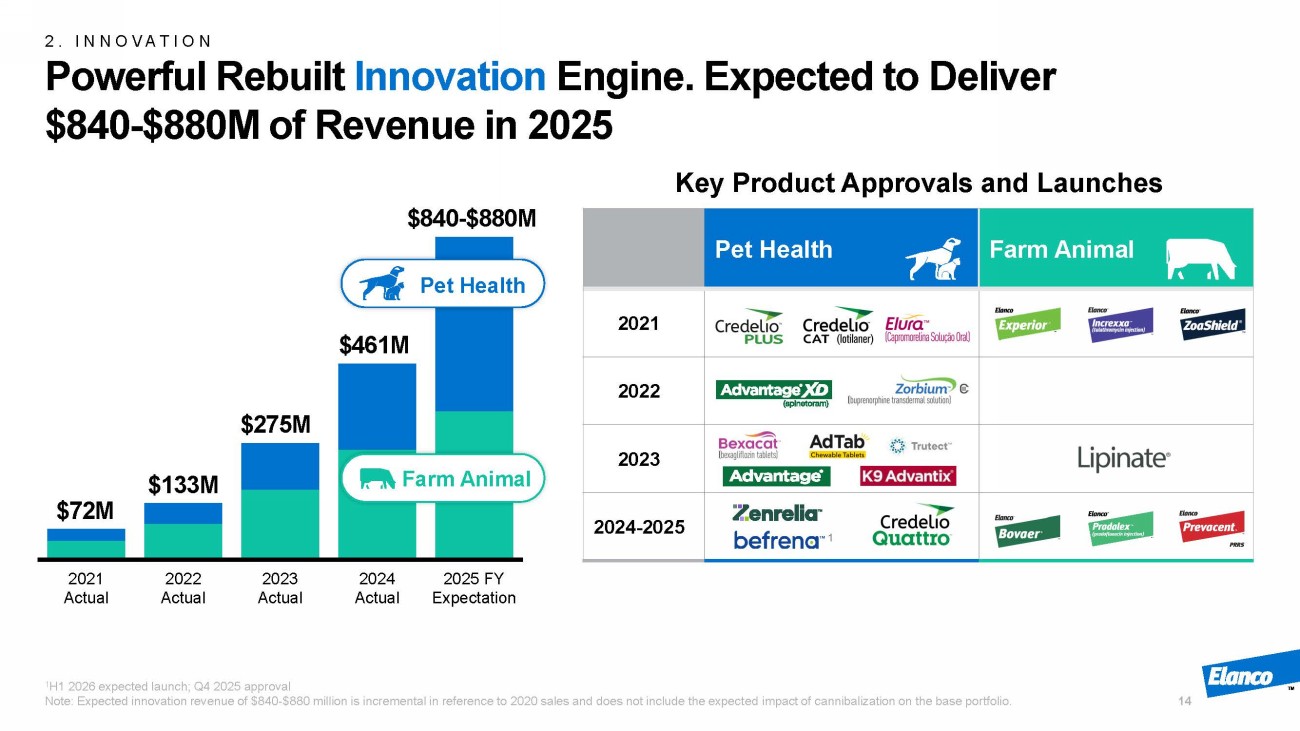
Farm Animal Pet Health 2021 2022 2023 2024 - 2025 2. INNOVATION Powerful Rebuilt Innovation Engine. Expected to Deliver $840 - $880M of Revenue in 2025 1 H1 2026 expected launch; Q4 2025 approval Note: Expected innovation revenue of $840 - $880 million is incremental in reference to 2020 sales and does not include the expect ed impact of cannibalization on the base portfolio. 14 Key Product Approvals and Launches 2021 Actual 2022 Actual 2023 Actual 2024 Actual 2025 FY Expectation $72M $133M $275M $461M $840 - $880M Pet Health Farm Animal 1
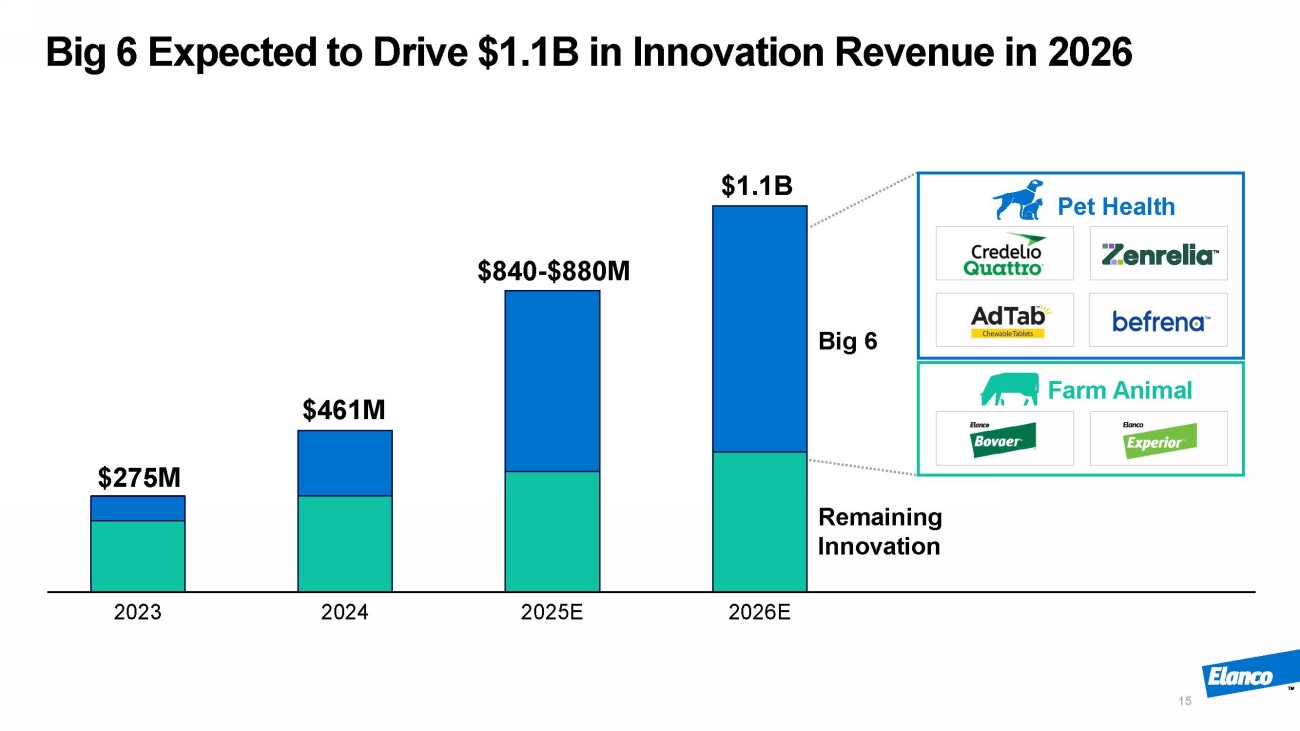
Big 6 Expected to Drive $1.1B in Innovation Revenue in 2026 15 2023 2024 2025E 2026E $275M $461M $840 - $880M $1.1B Big 6 Remaining Innovation Pet Health Farm Animal
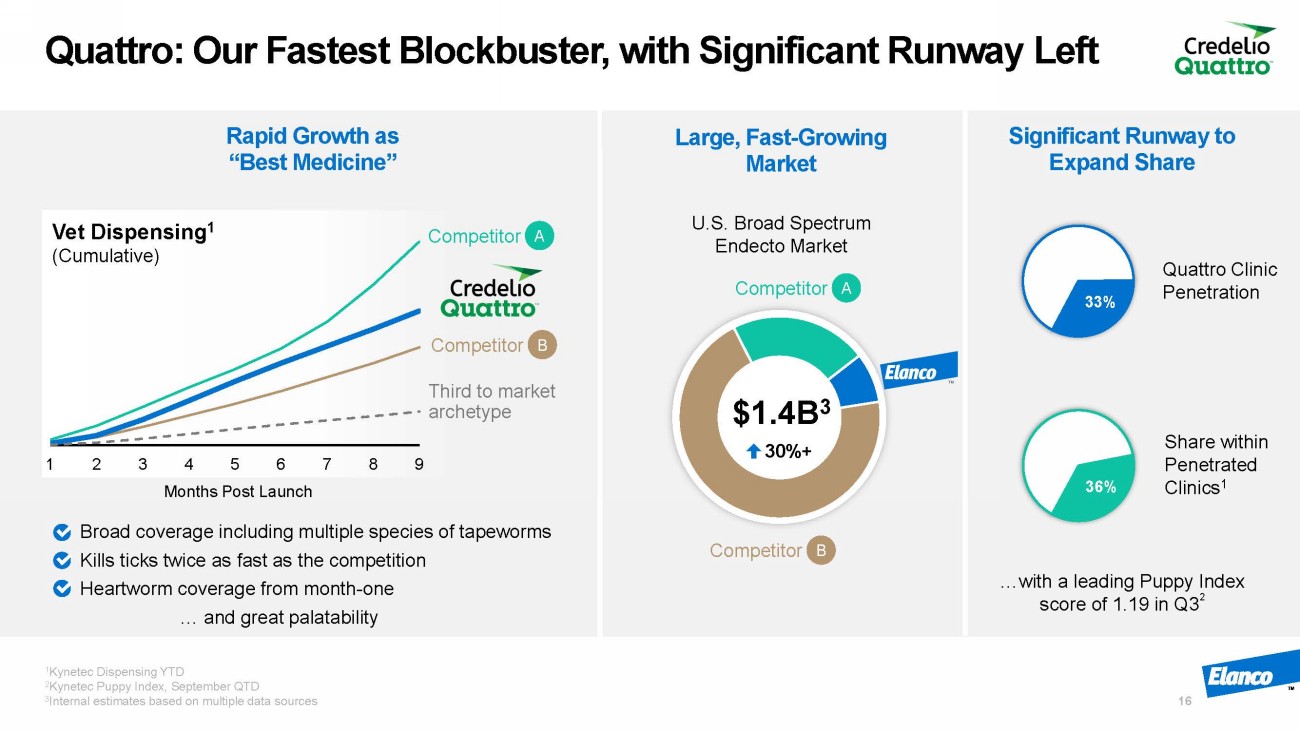
Quattro: Our Fastest Blockbuster, with Significant Runway Left 1 Kynetec Dispensing YTD 2 Kynetec Puppy Index, September QTD 3 Internal estimates based on multiple data sources 16 Rapid Growth as “Best Medicine” 1 2 3 4 5 6 7 8 9 Months Post Launch Broad coverage including multiple species of tapeworms Kills ticks twice as fast as the competition Heartworm coverage from month - one … and great palatability Vet Dispensing 1 (Cumulative) Competitor B Competitor A Significant Runway to Expand Share Large, Fast - Growing Market Competitor A Competitor B $1.4B 3 Third to market archetype U.S. Broad Spectrum Endecto Market Share within Penetrated Clinics 1 Quattro Clinic Penetration 67% 33% 36% 64% …with a leading Puppy Index score of 1.19 in Q3 2 30%+
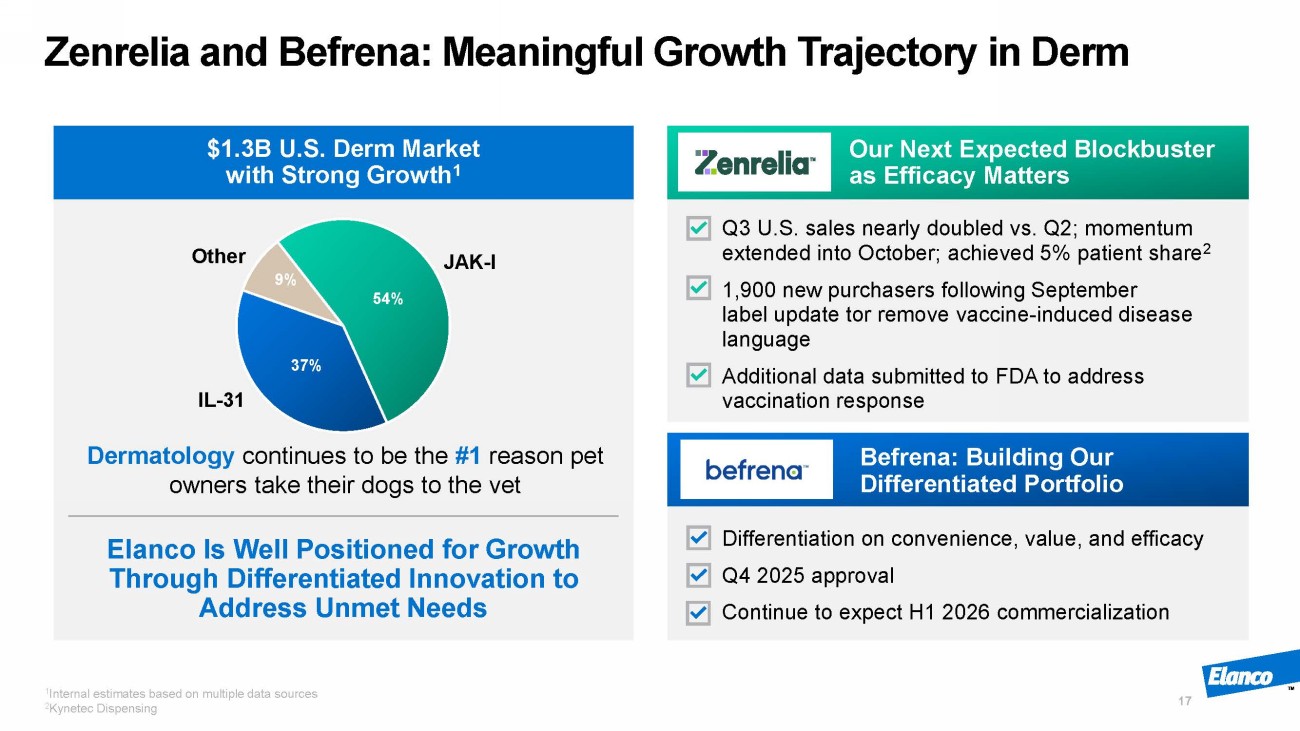
Befrena : Building Our Differentiated Portfolio Zenrelia and Befrena : Meaningful Growth Trajectory in Derm Q3 U.S. sales nearly doubled vs. Q2; momentum extended into October; achieved 5% patient share 2 1,900 new purchasers following September label update tor remove vaccine - induced disease language Additional data submitted to FDA to address vaccination response Differentiation on convenience, value, and efficacy Q4 2025 approval Continue to expect H1 2026 commercialization Elanco Is Well Positioned for Growth Through Differentiated Innovation to Address Unmet Needs Dermatology continues to be the #1 reason pet owners take their dogs to the vet $1.3B U.S. Derm Market w ith Strong Growth 1 Our Next Expected Blockbuster as Efficacy Matters 54% 37% 9% JAK - I Other IL - 31 17 1 Internal estimates based on multiple data sources 2 Kynetec Dispensing
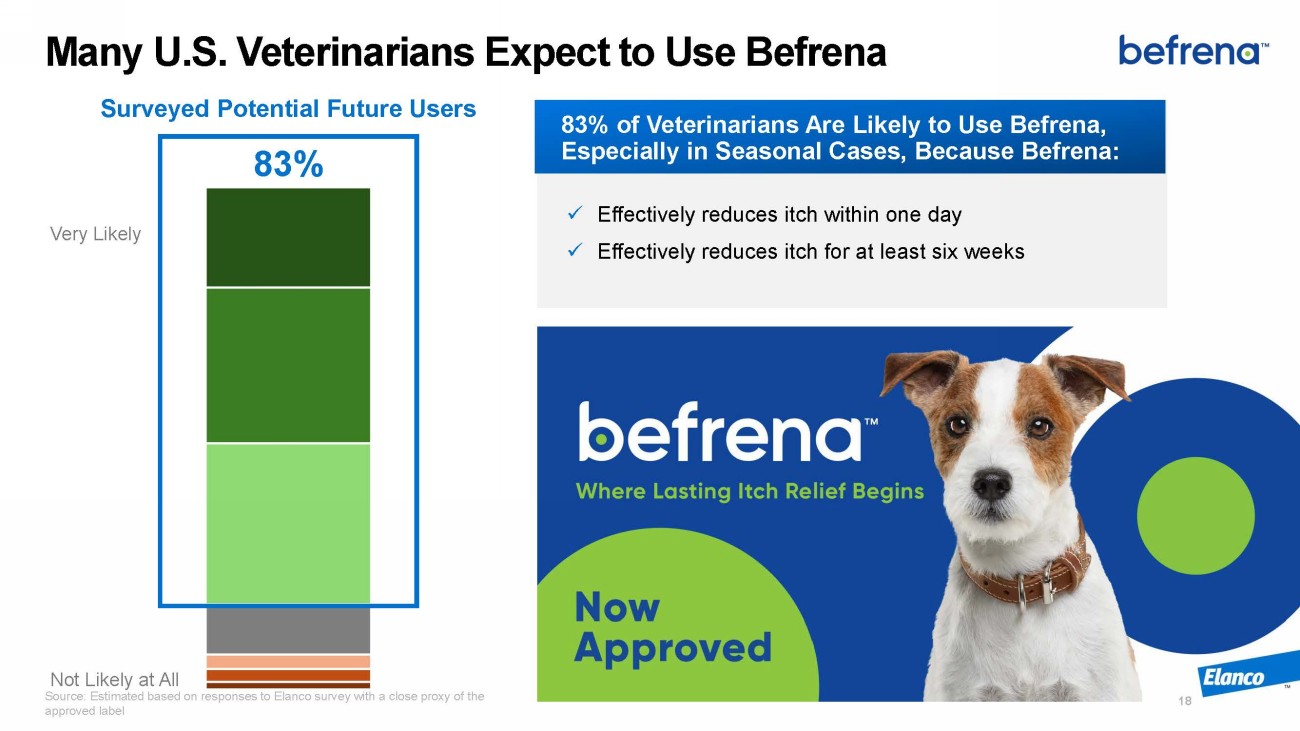
Many U.S. Veterinarians Expect to Use Befrena 83% of Veterinarians Are Likely to Use Befrena , Especially in Seasonal Cases, Because Befrena : x Effectively reduces itch within one day x Effectively reduces itch for at least six weeks Not Likely at All Very Likely 18 83% Surveyed Potential Future Users Source: Estimated based on responses to Elanco survey with a close proxy of the approved label
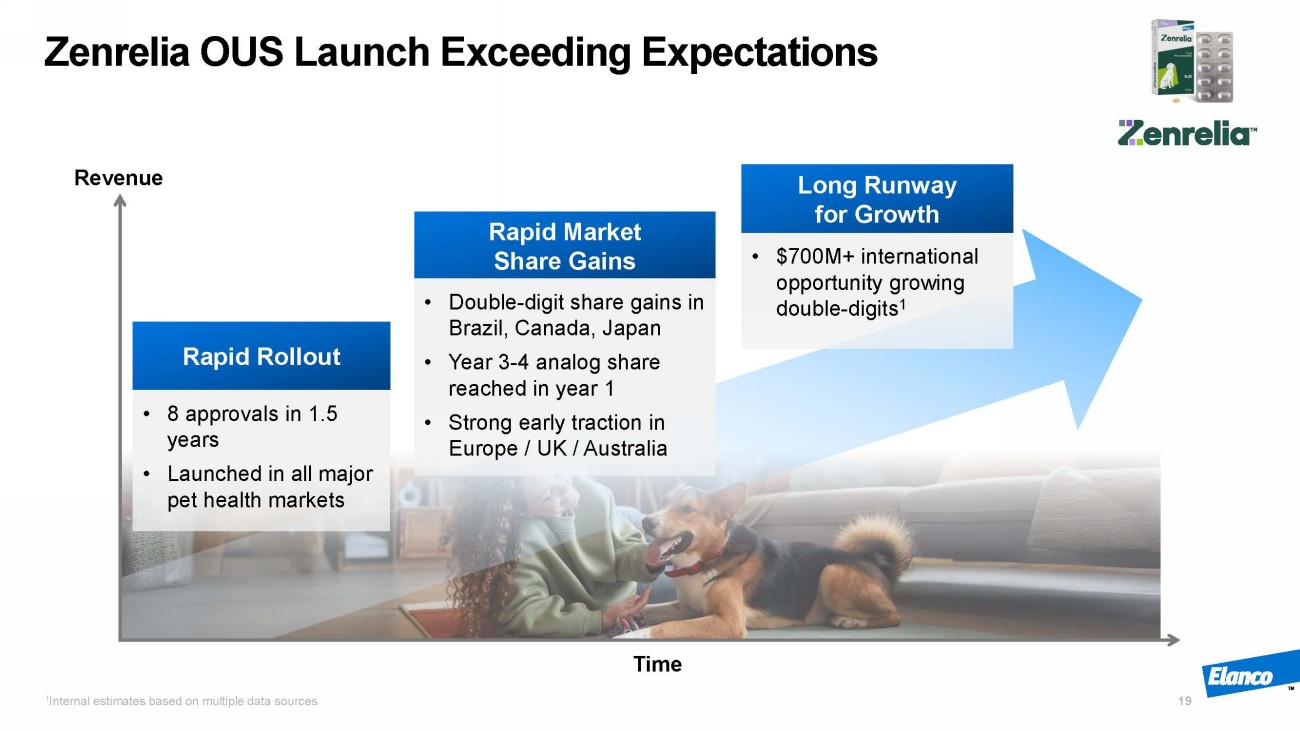
Zenrelia OUS Launch Exceeding Expectations Rapid Rollout • $700M+ international opportunity growing double - digits 1 Rapid Market Share Gains • Double - digit share gains in Brazil, Canada, Japan • Year 3 - 4 analog share reached in year 1 • Strong early traction in Europe / UK / Australia Long Runway for Growth Time Revenue • 8 approvals in 1.5 years • Launched in all major pet health markets 19 1 Internal estimates based on multiple data sources
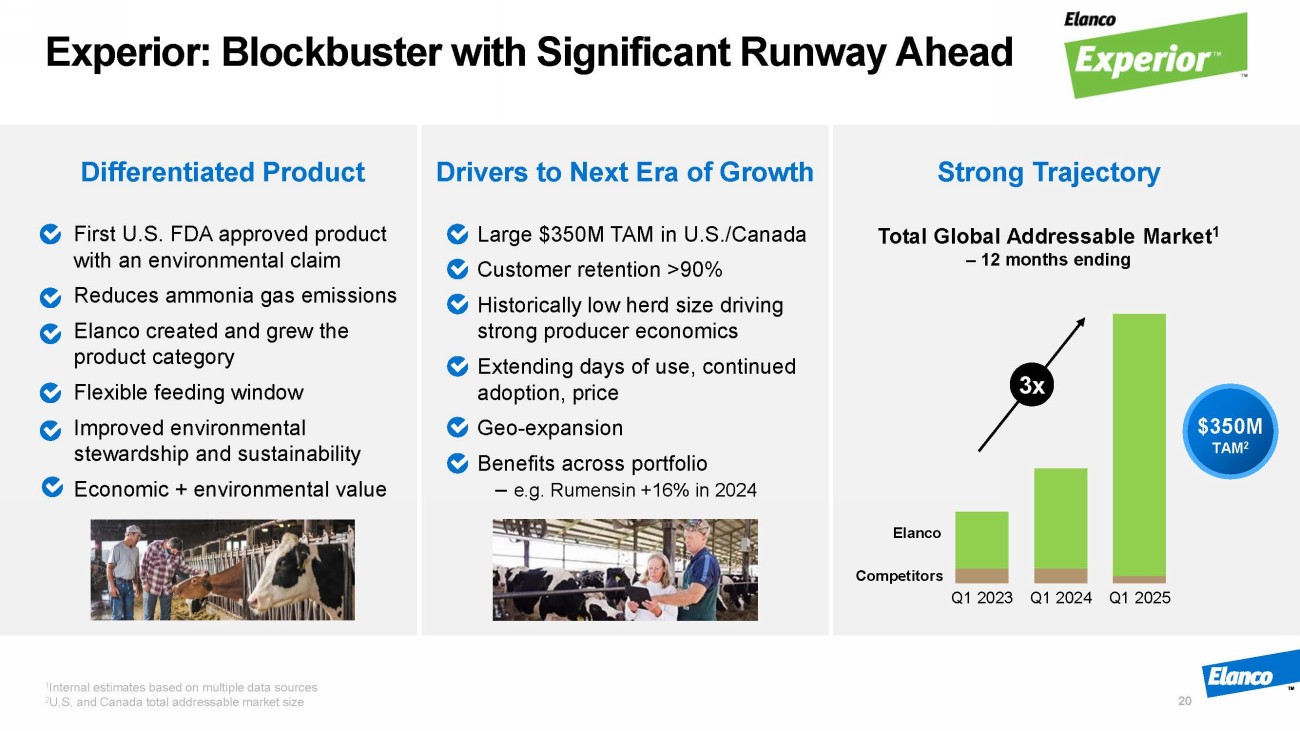
Experior: Blockbuster with Significant Runway Ahead 20 Strong Trajectory Differentiated Product Drivers to Next Era of Growth First U.S. FDA approved product with an environmental claim Reduces ammonia gas emissions Elanco created and grew the product category Flexible feeding window Improved environmental stewardship and sustainability Economic + environmental value Large $350M TAM in U.S./Canada Customer retention >90% Historically low herd size driving strong producer economics Extending days of use, continued adoption, price Geo - expansion Benefits across portfolio – e.g. Rumensin +16% in 2024 Q1 2023 Q1 2024 Q1 2025 Elanco Competitors $350M TAM 2 Total Global Addressable Market 1 – 12 months ending 3x 1 Internal estimates based on multiple data sources 2 U.S. and Canada total addressable market size
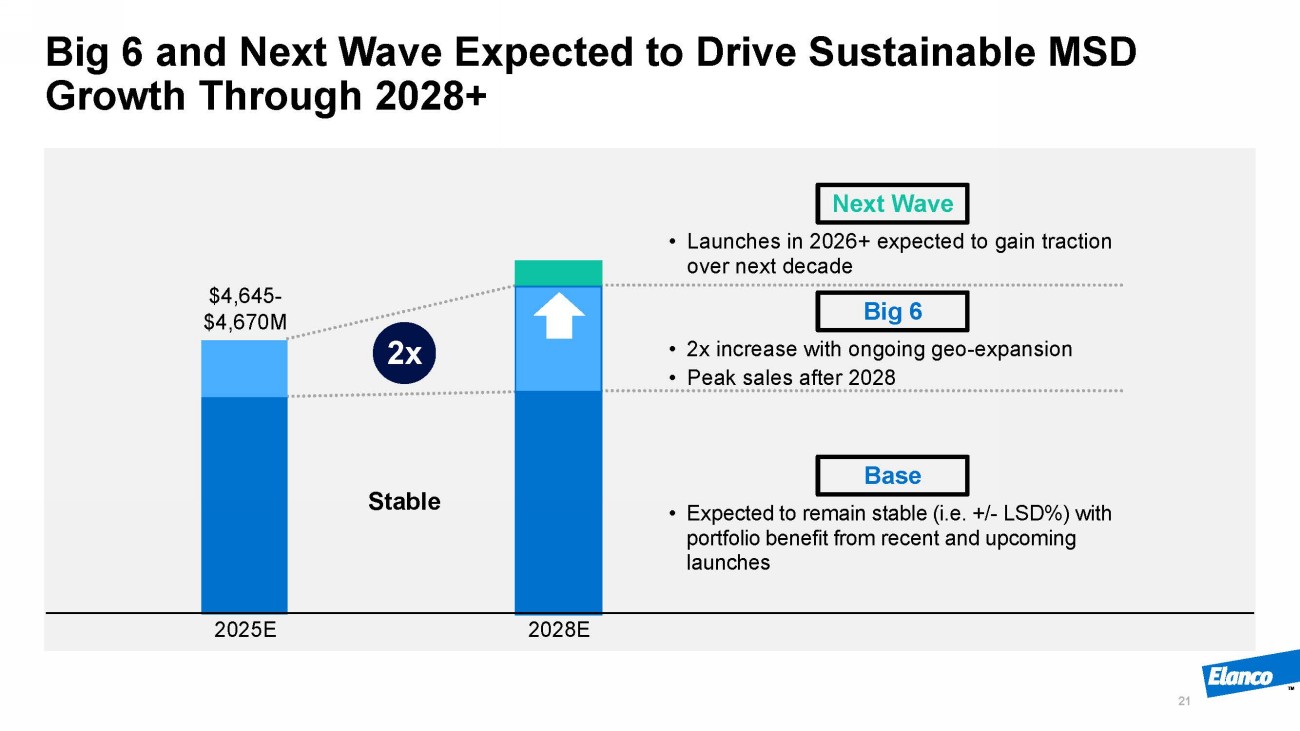
Big 6 and Next Wave Expected to Drive Sustainable MSD Growth Through 2028+ 21 2025E 2028E $4,645 - $4,670M • 2x increase with ongoing geo - expansion • Peak sales after 2028 Big 6 • Expected to remain stable (i.e. +/ - LSD%) with portfolio benefit from recent and upcoming launches Base • Launches in 2026+ expected to gain traction over next decade Next Wave 2x Stable
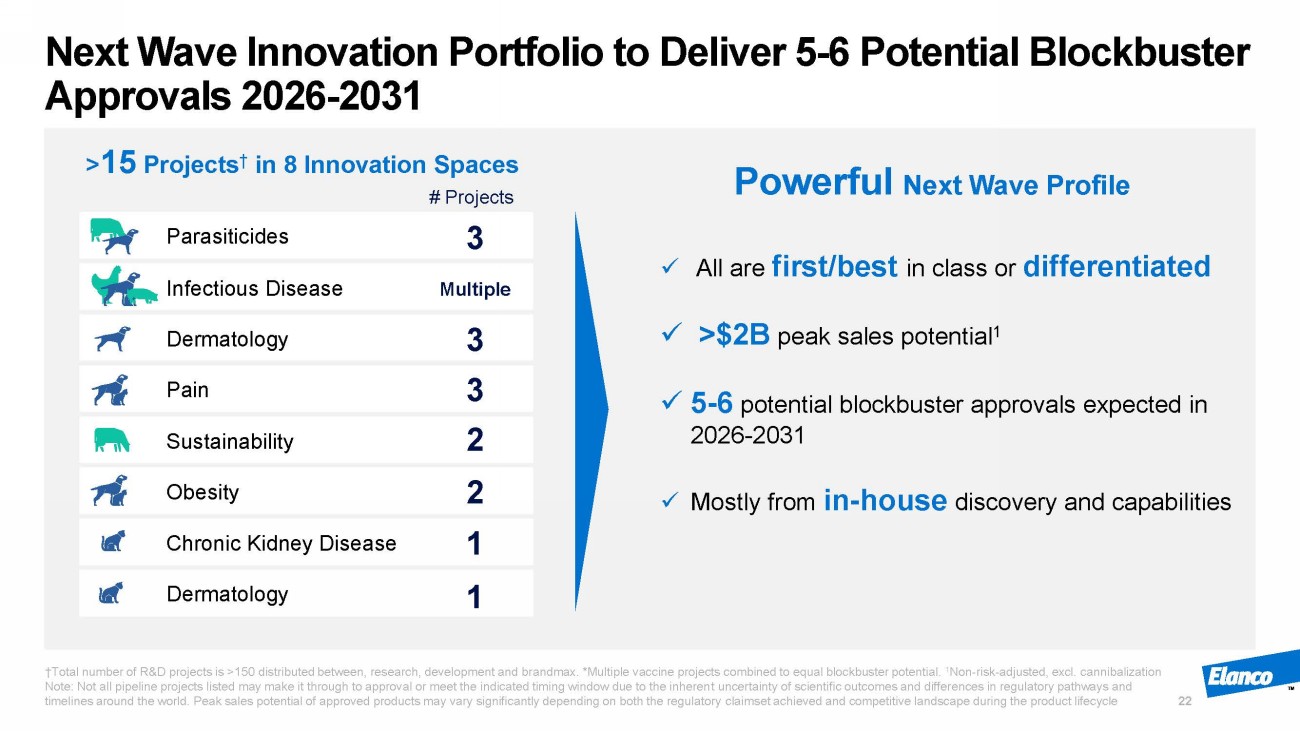
Next Wave Innovation Portfolio to Deliver 5 - 6 Potential Blockbuster Approvals 2026 - 2031 †Total number of R&D projects is >150 distributed between, research, development and brandmax . *Multiple vaccine projects combined to equal blockbuster potential. 1 Non - risk - adjusted, excl. c annibalization Note: Not all pipeline projects listed may make it through to approval or meet the indicated timing window due to the inheren t u ncertainty of scientific outcomes and differences in regulatory pathways and timelines around the world. Peak sales potential of approved products may vary significantly depending on both the regulatory claimset achieved and competitive landscape during the product lifecycle 22 Parasiticides Dermatology Sustainability Dermatology Pain Obesity Chronic Kidney Disease Infectious Disease 3 3 3 2 2 1 1 Multiple # Projects x All are first/best in class or differentiated x >$2B peak sales potential 1 x 5 - 6 potential blockbuster approvals expected in 2026 - 2031 x Mostly from in - house discovery and capabilities > 15 Projects † in 8 Innovation Spaces Powerful Next Wave Profile
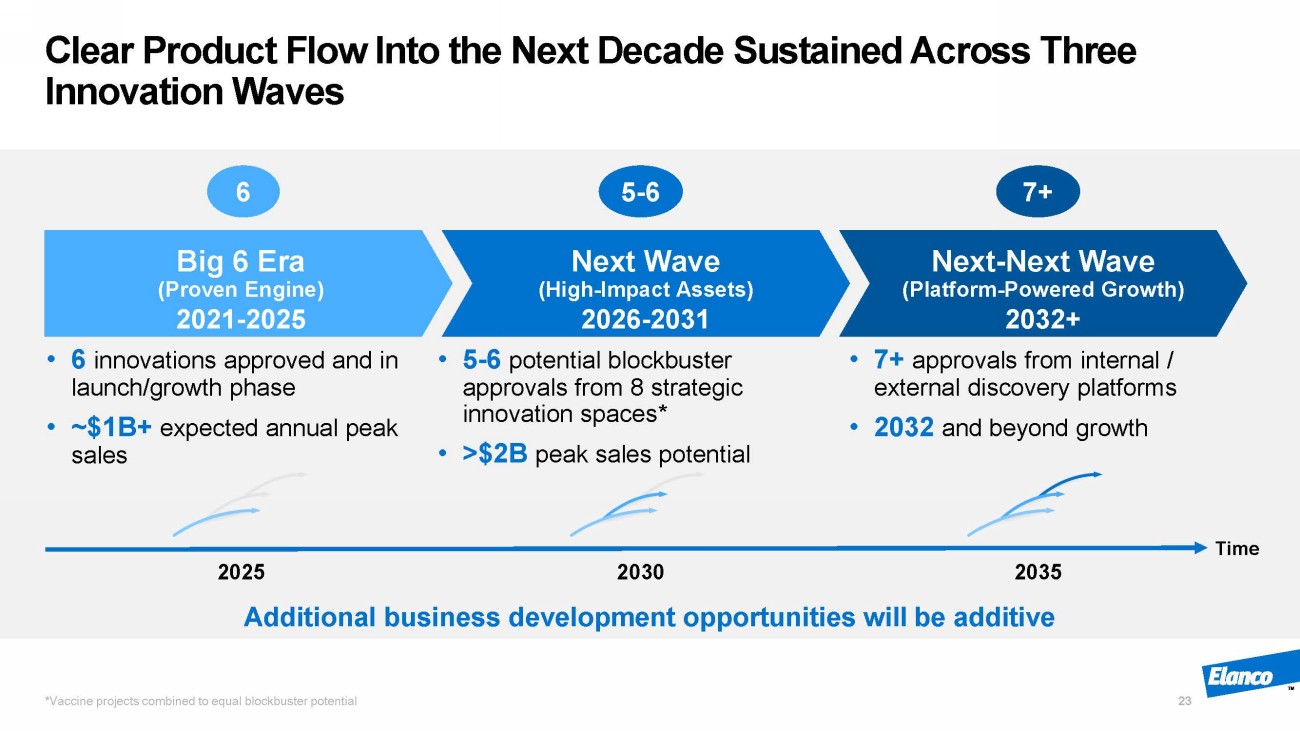
Time Clear Product Flow Into the Next Decade Sustained Across Three Innovation Waves *Vaccine projects combined to equal blockbuster potential 23 Big 6 Era (Proven Engine) Next Wave (High - Impact Assets) Next - Next Wave (Platform - Powered Growth) 2021 - 2025 2026 - 2031 2032+ • 6 innovations approved and in launch/growth phase • ~$1B+ expected annual peak sales • 5 - 6 potential blockbuster approvals from 8 strategic innovation spaces* • >$2B peak sales potential • 7+ approvals from internal / external discovery platforms • 2032 and beyond growth Additional business development opportunities will be additive 6 5 - 6 7+ 2025 2030 2035
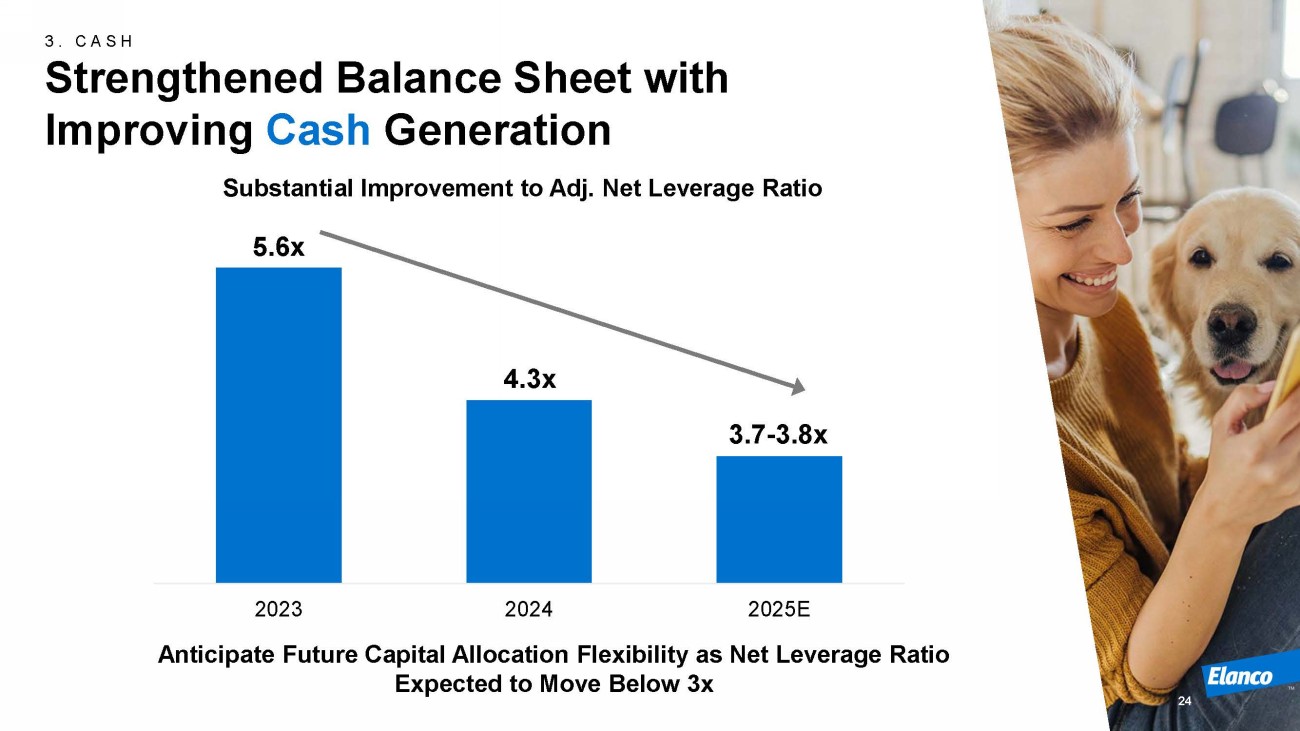
3. CASH Strengthened Balance Sheet with Improving Cash Generation Anticipate Future Capital Allocation Flexibility as Net Leverage Ratio Expected to Move Below 3x Substantial Improvement to Adj. Net Leverage Ratio 5.6 x 2023 2024 2025E 4.3x 3.7 - 3.8x 24
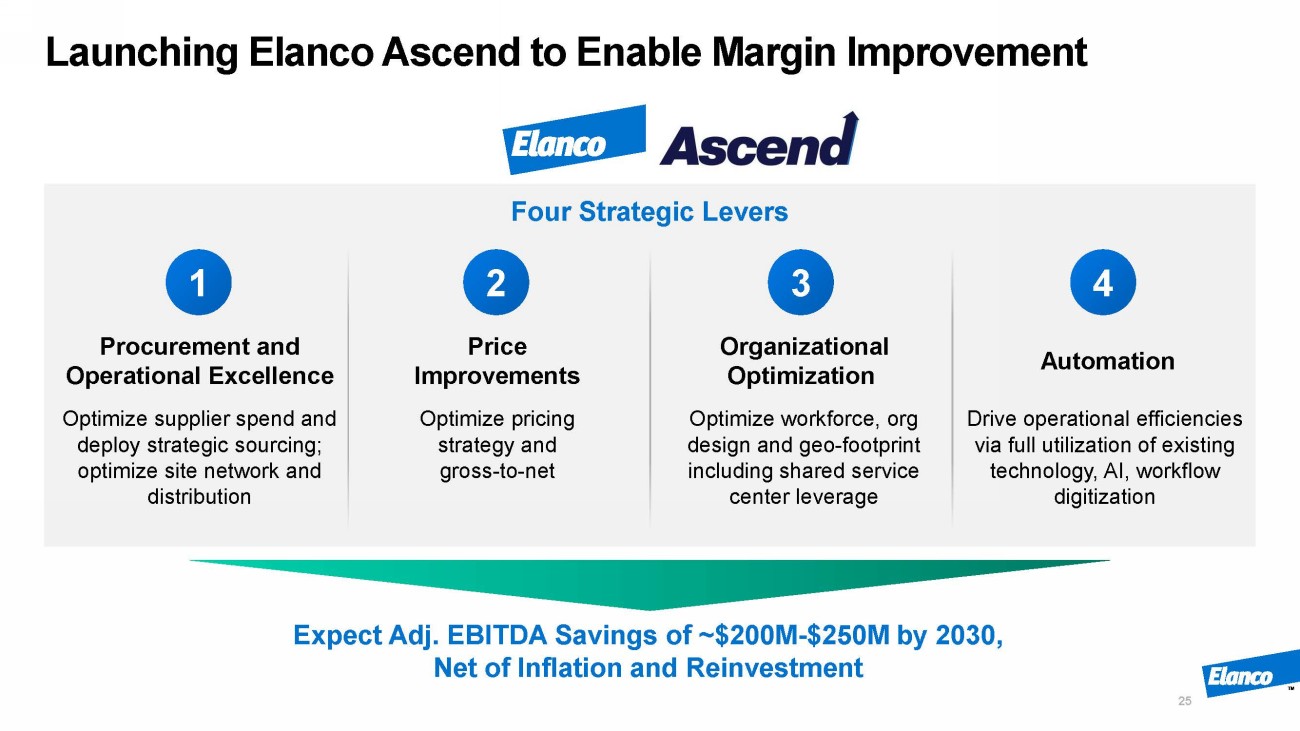
Launching Elanco Ascend to Enable Margin Improvement 25 Procurement and Operational Excellence Optimize supplier spend and deploy strategic sourcing; optimize site network and distribution Organizational Optimization Optimize workforce, org design and geo - footprint including shared service center leverage Automation Drive operational efficiencies via full utilization of existing technology, AI, workflow digitization Price Improvements Optimize pricing strategy and gross - to - net 1 2 3 4 Four Strategic Levers Expect Adj. EBITDA Savings of ~$200M - $250M by 2030, Net of Inflation and Reinvestment
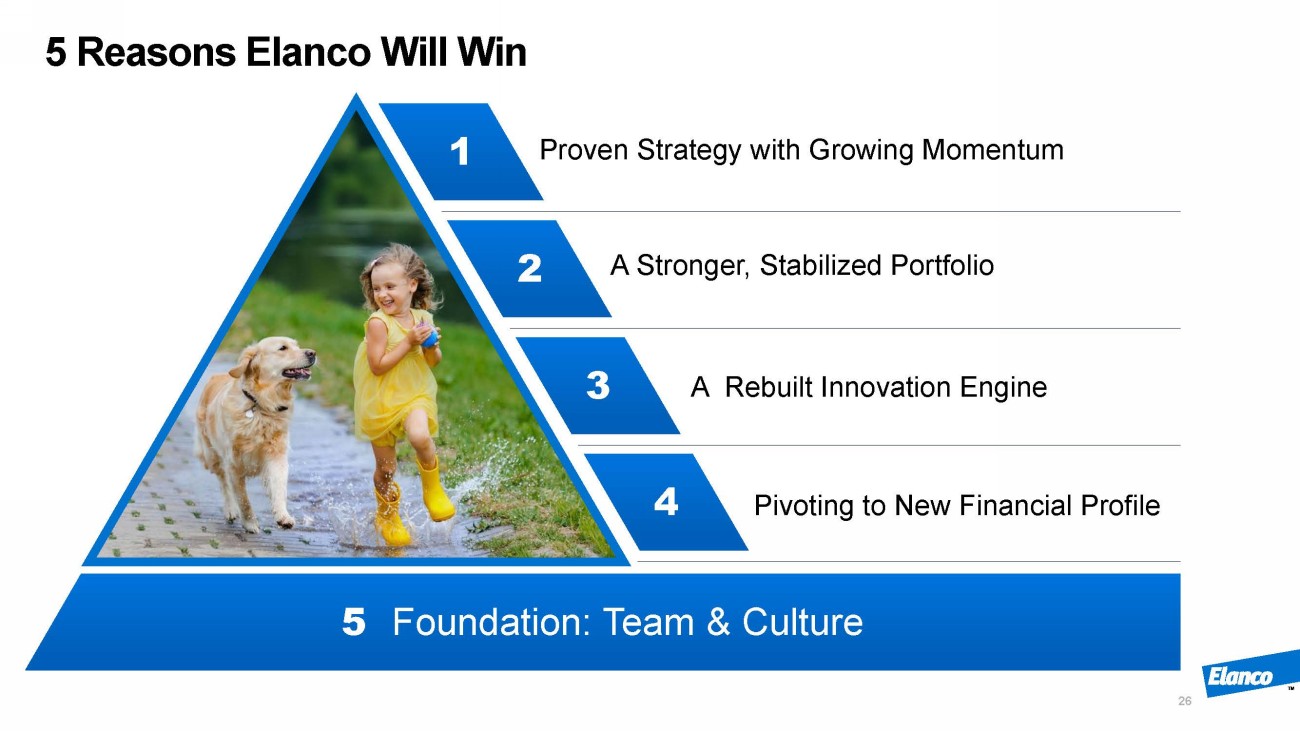
5 Reasons Elanco Will Win 26 2 1 3 Pivoting to New Financial Profile A Rebuilt Innovation Engine Proven Strategy with Growing Momentum A Stronger, Stabilized Portfolio 3 4 2 1 5 Foundation: Team & Culture
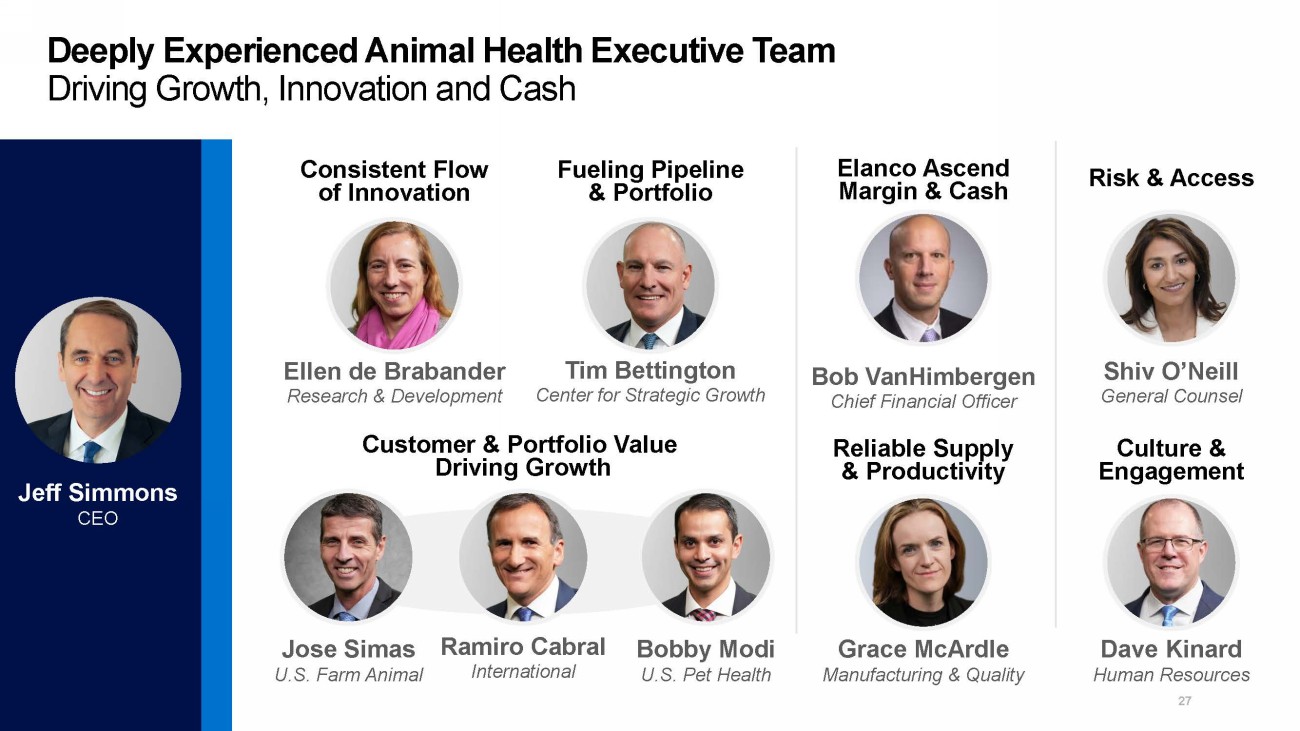
Deeply Experienced Animal Health Executive Team Driving Growth, Innovation and Cash 27 Tim Bettington Center for Strategic Growth Fueling Pipeline & Portfolio Jose Simas U.S. Farm Animal Bobby Modi U.S. Pet Health Customer & Portfolio Value Driving Growth Ramiro Cabral International Ellen de Brabander Research & Development Bob VanHimbergen Chief Financial Officer Shiv O’Neill General Counsel Grace McArdle Manufacturing & Quality Dave Kinard Human Resources Reliable Supply & Productivity Culture & Engagement Consistent Flow of Innovation Elanco Ascend Margin & Cash Risk & Access Jeff Simmons CEO
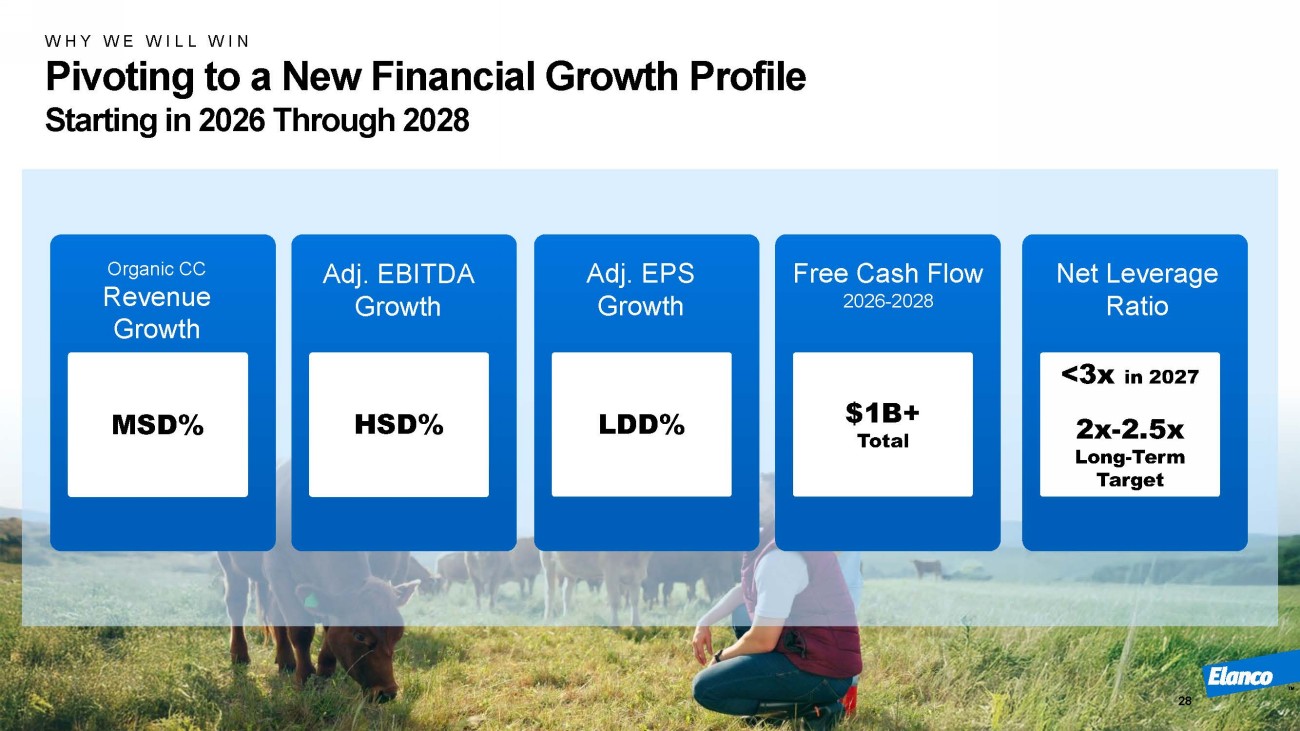
MSD% Organic CC Revenue Growth HSD% Adj. EBITDA Growth LDD% Adj. EPS Growth $1B+ Total Free Cash Flow 2026 - 2028 <3x in 2027 2x - 2.5x Long - Term Target Net Leverage Ratio WHY WE WILL WIN Pivoting to a New Financial Growth Profile Starting in 2026 Through 2028 28
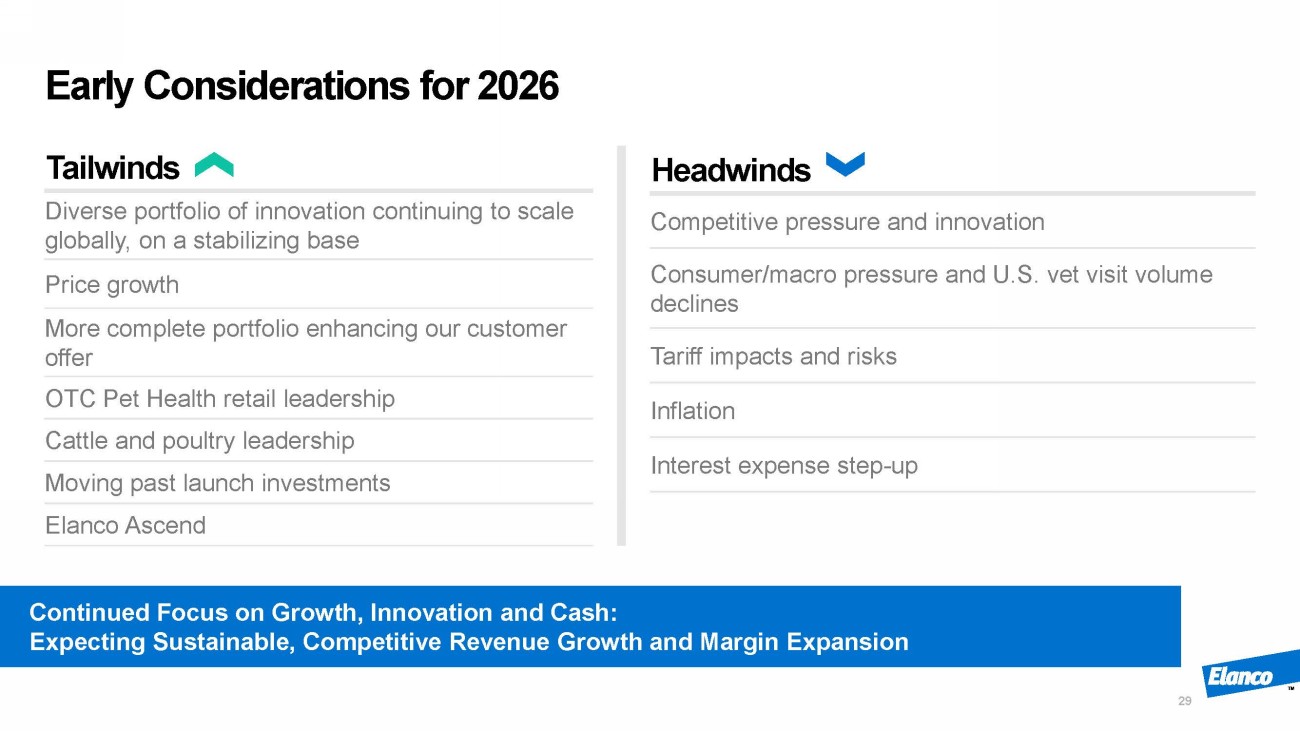
Tailwinds Diverse portfolio of innovation continuing to scale globally, on a stabilizing base Price growth More complete portfolio enhancing our customer offer OTC Pet Health retail leadership Cattle and poultry leadership Moving past launch investments Elanco Ascend Headwinds Competitive pressure and innovation Consumer/macro pressure and U.S. vet visit volume declines Tariff impacts and risks Inflation Interest expense step - up Early Considerations for 2026 Continued Focus on Growth, Innovation and Cash: Expecting Sustainable, Competitive Revenue Growth and Margin Expansion 29
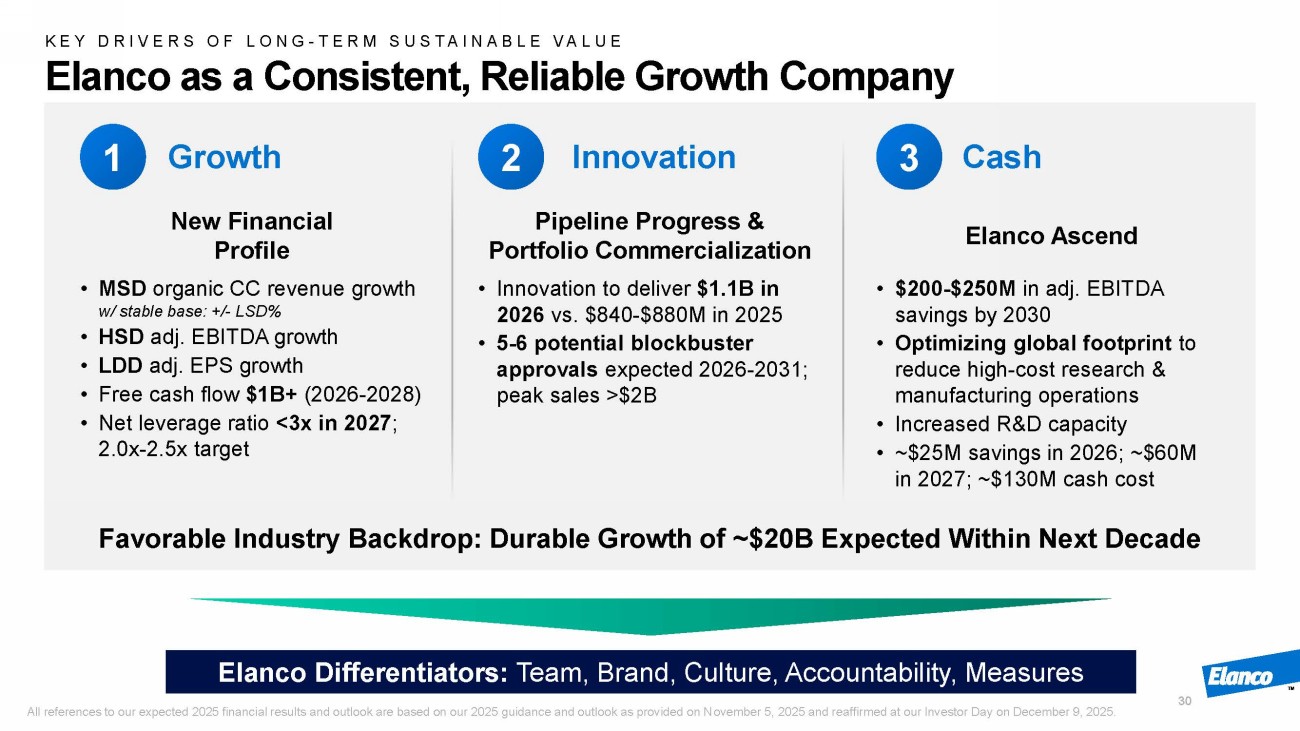
30 New Financial Profile • MSD o rganic CC r evenue growth w/ stable base: +/ - LSD% • HSD adj. EBITDA growth • LDD adj. EPS growth • Free cash flow $1B+ (2026 - 2028) • Net leverage r atio < 3x in 2027 ; 2.0x - 2.5x target Elanco Ascend • $200 - $250M in adj. EBITDA savings by 2030 • Optimizing global footprint to reduce high - cost research & manufacturing operations • Increased R&D capacity • ~$25M savings in 2026; ~$60M in 2027; ~$130M cash cost Pipeline Progress & Portfolio Commercialization • Innovation to deliver $1.1B in 2026 vs. $840 - $880M in 2025 • 5 - 6 potential blockbuster approvals expected 2026 - 2031; peak sales >$2B 1 2 3 Elanco Differentiators: Team, Brand, Culture, Accountability, Measures KEY DRIVERS OF LONG - TERM SUSTAINABLE VALUE Elanco as a Consistent, Reliable Growth Company Favorable Industry Backdrop: Durable Growth of ~$20B Expected Within Next Decade Growth Cash Innovation All references to our expected 2025 financial results and outlook are based on our 2025 guidance and outlook as provided on N ove mber 5, 2025 and reaffirmed at our Investor Day on December 9, 2025.
Q&A