
.3
1 Company Presentation May 11, 2026
2 Disclaimer Forward-Looking Statements This presentation and the related conference call contain "forward-looking statements" within the meaning of Section 27A of the Securities Act of 1933, as amended, Section 21E of the Securities Exchange Act of 1934, and the "safe harbor" provisions under the Private Securities Litigation Reform Act of 1995. All statements that address activities, events or developments that we or our management intend, expect, project, believe or anticipate will or may occur in the future are forward-looking statements. Although we believe forward-looking statements are based upon reasonable assumptions, such statements involve known and unknown risks and uncertainties, which may cause the actual results or performance of the Company to differ materially from such forward-looking statements. Such risks and uncertainties include, but are not limited to, (1) the separation, (2) expected future financial and operating performance of and future opportunities for, ADI following the separation, (3) anticipated benefits of the separation, (4) the tax treatment of the separation, (5) leadership of ADI following the separation, tax rates, tax provisions, cash flows, pension and benefit obligations and funding requirements, our liquidity position or other financial measures, (6) management's plans and strategies for future operations, including statements relating to anticipated operating performance, cost reductions, restructuring activities, new product and service developments, competitive strengths or market position, acquisitions, divestitures, strategic opportunities, securities offerings, stock repurchases, dividends and executive compensation, (7) the effects of the separation or the distribution, if consummated, on our business, (8) growth, declines and other trends in markets we sell into, including the expected impact of trade and tariff policies; new or modified laws, regulations and accounting pronouncements, (9) impact of climate-related events or transition activities; outstanding claims, legal proceedings, tax audits and assessments and other contingent liabilities, (10) foreign currency exchange rates and fluctuations in those rates, (11) impact of changes to tax laws, (12) general economic and capital markets conditions, including expected impact of inflation or interest rate changes, (13) impact of geopolitical events and other hostilities, (14) the timing of any of the foregoing, (15) assumptions underlying any of the foregoing, (16) and any other statements that address events or developments that we intend or believe will or may occur in the future and (17) the other risks described under the headings "Risk Factors" and "Cautionary Statement Concerning Forward-Looking Statements" in Resideo's Annual Report on Form 10-K for the year ended December 31, 2025 and other periodic filings Resideo makes from time to time with the Securities and Exchange Commission. Forward-looking statements are not guarantees of future performance, and actual results, developments, and business decisions may differ from those envisaged by our forward-looking statements. Except as required by law, we undertake no obligation to update such statements to reflect events or circumstances arising after the date of this presentation and we caution investors not to place undue reliance on any such forward looking statements. This presentation contains projections and other forward-looking financial information, including projected revenues, earnings, capital expenditures, and other financial metrics. These projections are based on assumptions that management believes to be reasonable as of the date of this presentation. However, the projections are inherently uncertain and are subject to significant business, economic, regulatory, and competitive risks and uncertainties that could cause actual results to differ materially from those presented. No representation or warranty, express or implied, is made as to the accuracy or completeness of these projections, and recipients of this presentation should not place undue reliance on any such projections. The Company undertakes no obligation to update or revise any projections to reflect events or circumstances arising after the date of this presentation. Basis of Presentation This presentation contains certain financial information that reflects management's estimates of the stand-alone costs, expenses, and operating results of ADI as if it were operating as a separate, independent company. Because this information is based on estimates and assumptions made by management, it is inherently uncertain, and actual results may differ materially from those presented herein. For the fiscal years ended December 31, 2023 and 2024, management has included the operating results of Snap One for the periods prior to its acquisition by ADI which was completed on June 14, 2024. Any pre-acquisition financial information has been combined with ADI's historical financial data for purposes of this presentation; however, Snap One's accounting policies, practices, and classifications may differ from those of ADI, and no pro forma financial information has been prepared in accordance with Article 11 of Regulation S-X. Accordingly, the combined financial information presented for these periods may not be directly comparable to ADI's post-acquisition reported results. In addition, for the three months period ended June 30, 2024 (which is the fiscal quarter in which the acquisition of Snap One by ADI was completed), the pre-acquisition combined financial information of Snap One included in this presentation are based on management estimates and have not been derived from Snap One's historical books and records for that period. Investors and other recipients of this presentation should consider these limitations when evaluating the financial information contained herein and should not place undue reliance on such information as a substitute for audited or reviewed financial statements prepared in accordance with generally accepted accounting principles. Use of Non-GAAP Measures This presentation includes certain "non-GAAP financial measures" as defined under the Securities Exchange Act of 1934 and in accordance with Regulation G thereunder. Management believes the use of such non-GAAP financial measures assists investors in understanding the ongoing operating performance of the Company by presenting the financial results between periods on a more comparable basis. Such non-GAAP financial measures should not be construed as an alternative to reported results determined in accordance with U.S. GAAP. Please see Appendix for further information relating to these non-GAAP financial measures and reconciliations. Market, Industry and Other Information This presentation includes market, industry and other statistical data, as well as estimates and forecasts, from internal research and third-party publications, surveys and studies. Such information involves numerous assumptions and limitations, and you should not place undue weight on these data or estimates. Information contained herein obtained from third-party sources and has not been independently verified. The Company makes no representation or warranty, express or implied, as to the accuracy or completeness of such information. This presentation is provided solely for your information in connection with your evaluation of the Company and is not intended for redistribution, publication or use by any other person. Trademarks, Service Marks and Trade Names Resideo owns or licenses the trademarks, service marks and trade names that we use in connection with the operation of our business, including our corporate names, logos and website names. This presentation may also contain trademarks, service marks, trade names and copyrights of other companies, which are the property of their respective owners. Solely for convenience, the trademarks, service marks, trade names and copyrights referred to in this presentation may be listed without the TM, SM, © and ® symbols, but we and Resideo will assert, to the fullest extent under applicable law, our rights or the rights of the applicable licensors, if any, to these trademarks, service marks, trade names and copyrights.
3 Agenda • Business & Industry Overview • Financial Overview • Appendix
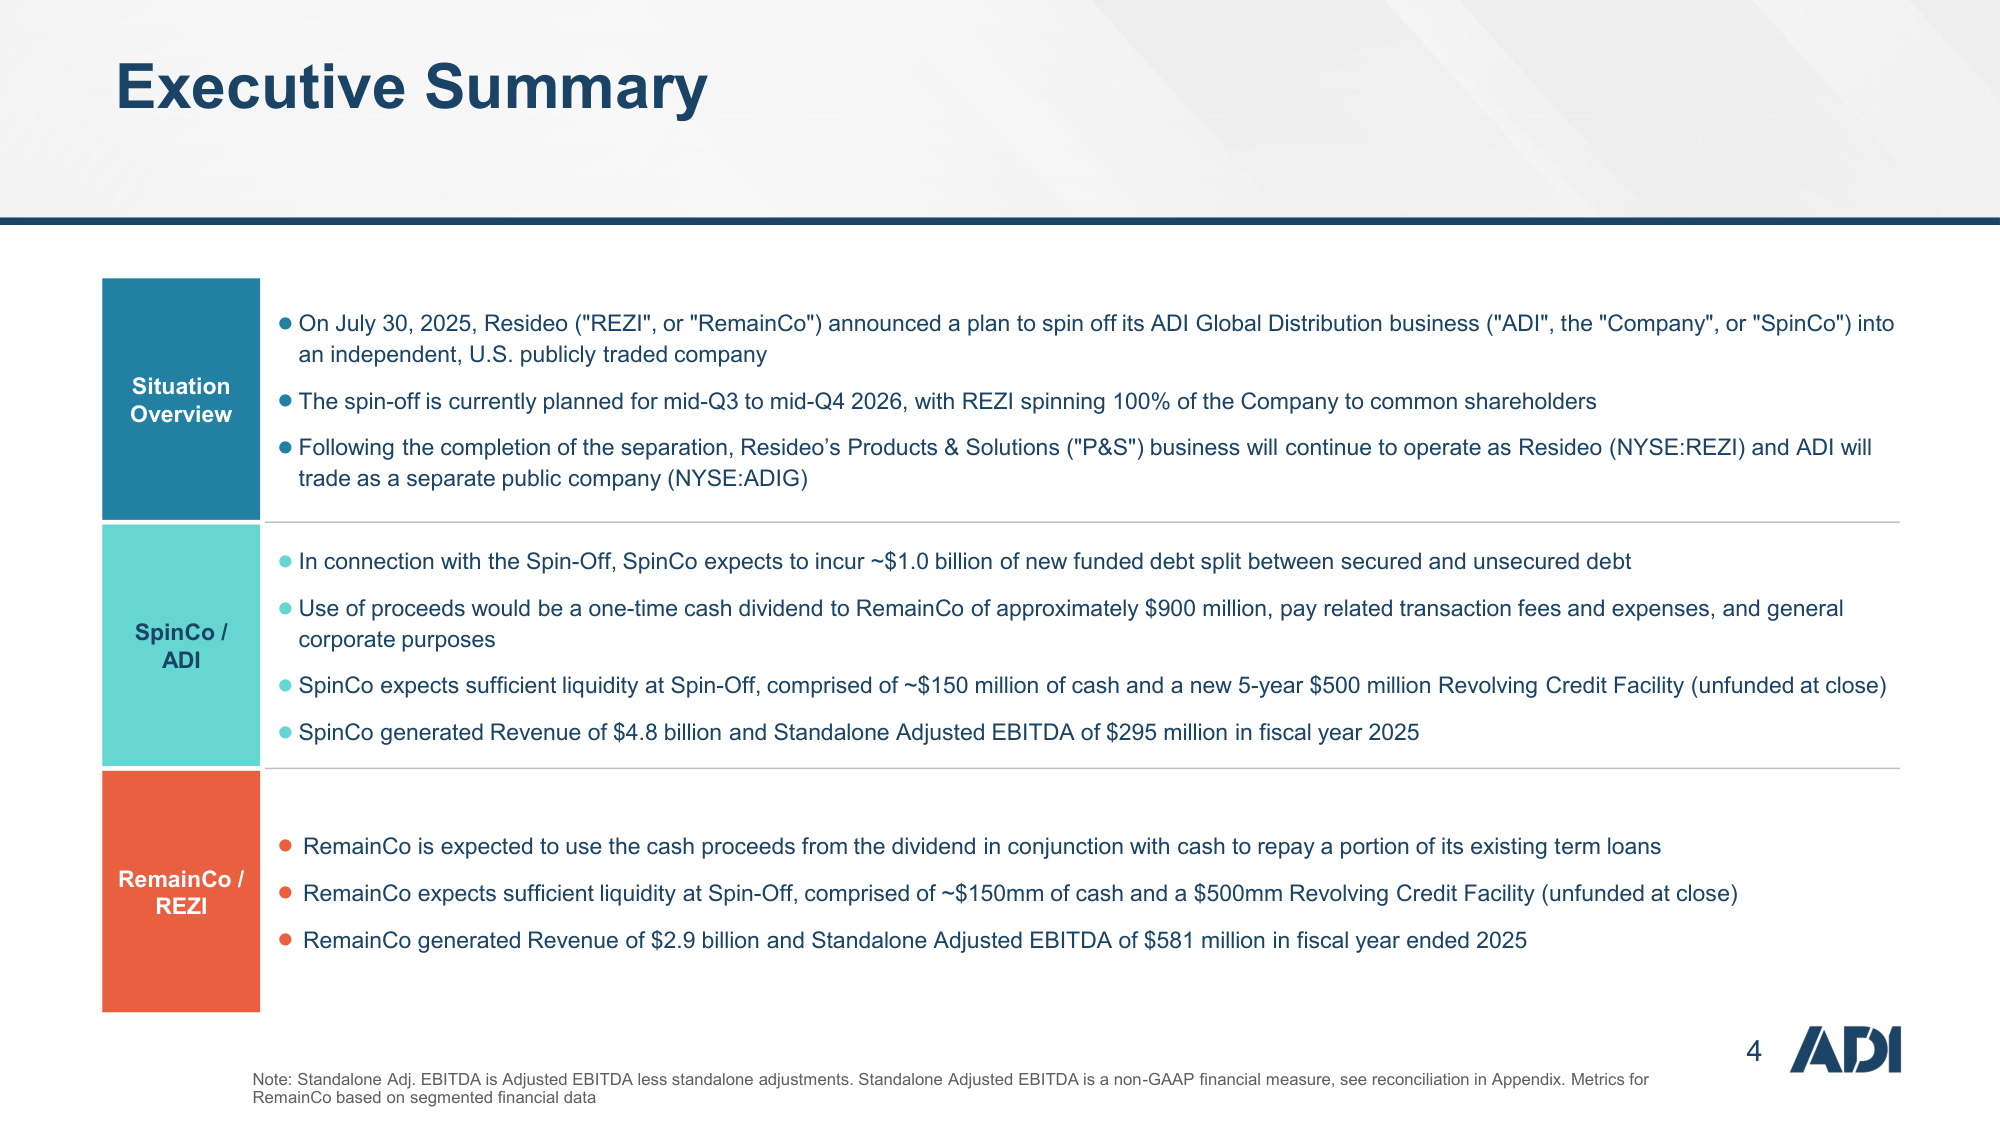
4 Situation Overview ⚫On July 30, 2025, Resideo ("REZI", or "RemainCo") announced a plan to spin off its ADI Global Distribution business ("ADI", the "Company", or "SpinCo") into an independent, U.S. publicly traded company ⚫The spin-off is currently planned for mid-Q3 to mid-Q4 2026, with REZI spinning 100% of the Company to common shareholders ⚫Following the completion of the separation, Resideo's Products & Solutions ("P&S") business will continue to operate as Resideo (NYSE:REZI) and ADI will trade as a separate public company (NYSE:ADIG) SpinCo / ADI ⚫In connection with the Spin-Off, SpinCo expects to incur ~$1.0 billion of new funded debt split between secured and unsecured debt ⚫Use of proceeds would be a one-time cash dividend to RemainCo of approximately $900 million, pay related transaction fees and expenses, and general corporate purposes ⚫SpinCo expects sufficient liquidity at Spin-Off, comprised of ~$150 million of cash and a new 5-year $500 million Revolving Credit Facility (unfunded at close) ⚫SpinCo generated Revenue of $4.8 billion and Standalone Adjusted EBITDA of $295 million in fiscal year 2025 RemainCo / REZI ⚫RemainCo is expected to use the cash proceeds from the dividend in conjunction with cash to repay a portion of its existing term loans ⚫RemainCo expects sufficient liquidity at Spin-Off, comprised of ~$150mm of cash and a $500mm Revolving Credit Facility (unfunded at close) ⚫RemainCo generated Revenue of $2.9 billion and Standalone Adjusted EBITDA of $581 million in fiscal year ended 2025 Note: Standalone Adj. EBITDA is Adjusted EBITDA less standalone adjustments. Standalone Adjusted EBITDA is a non-GAAP financial measure, see reconciliation in Appendix. Metrics for RemainCo based on segmented financial data Executive Summary

5 Business and Industry Overview
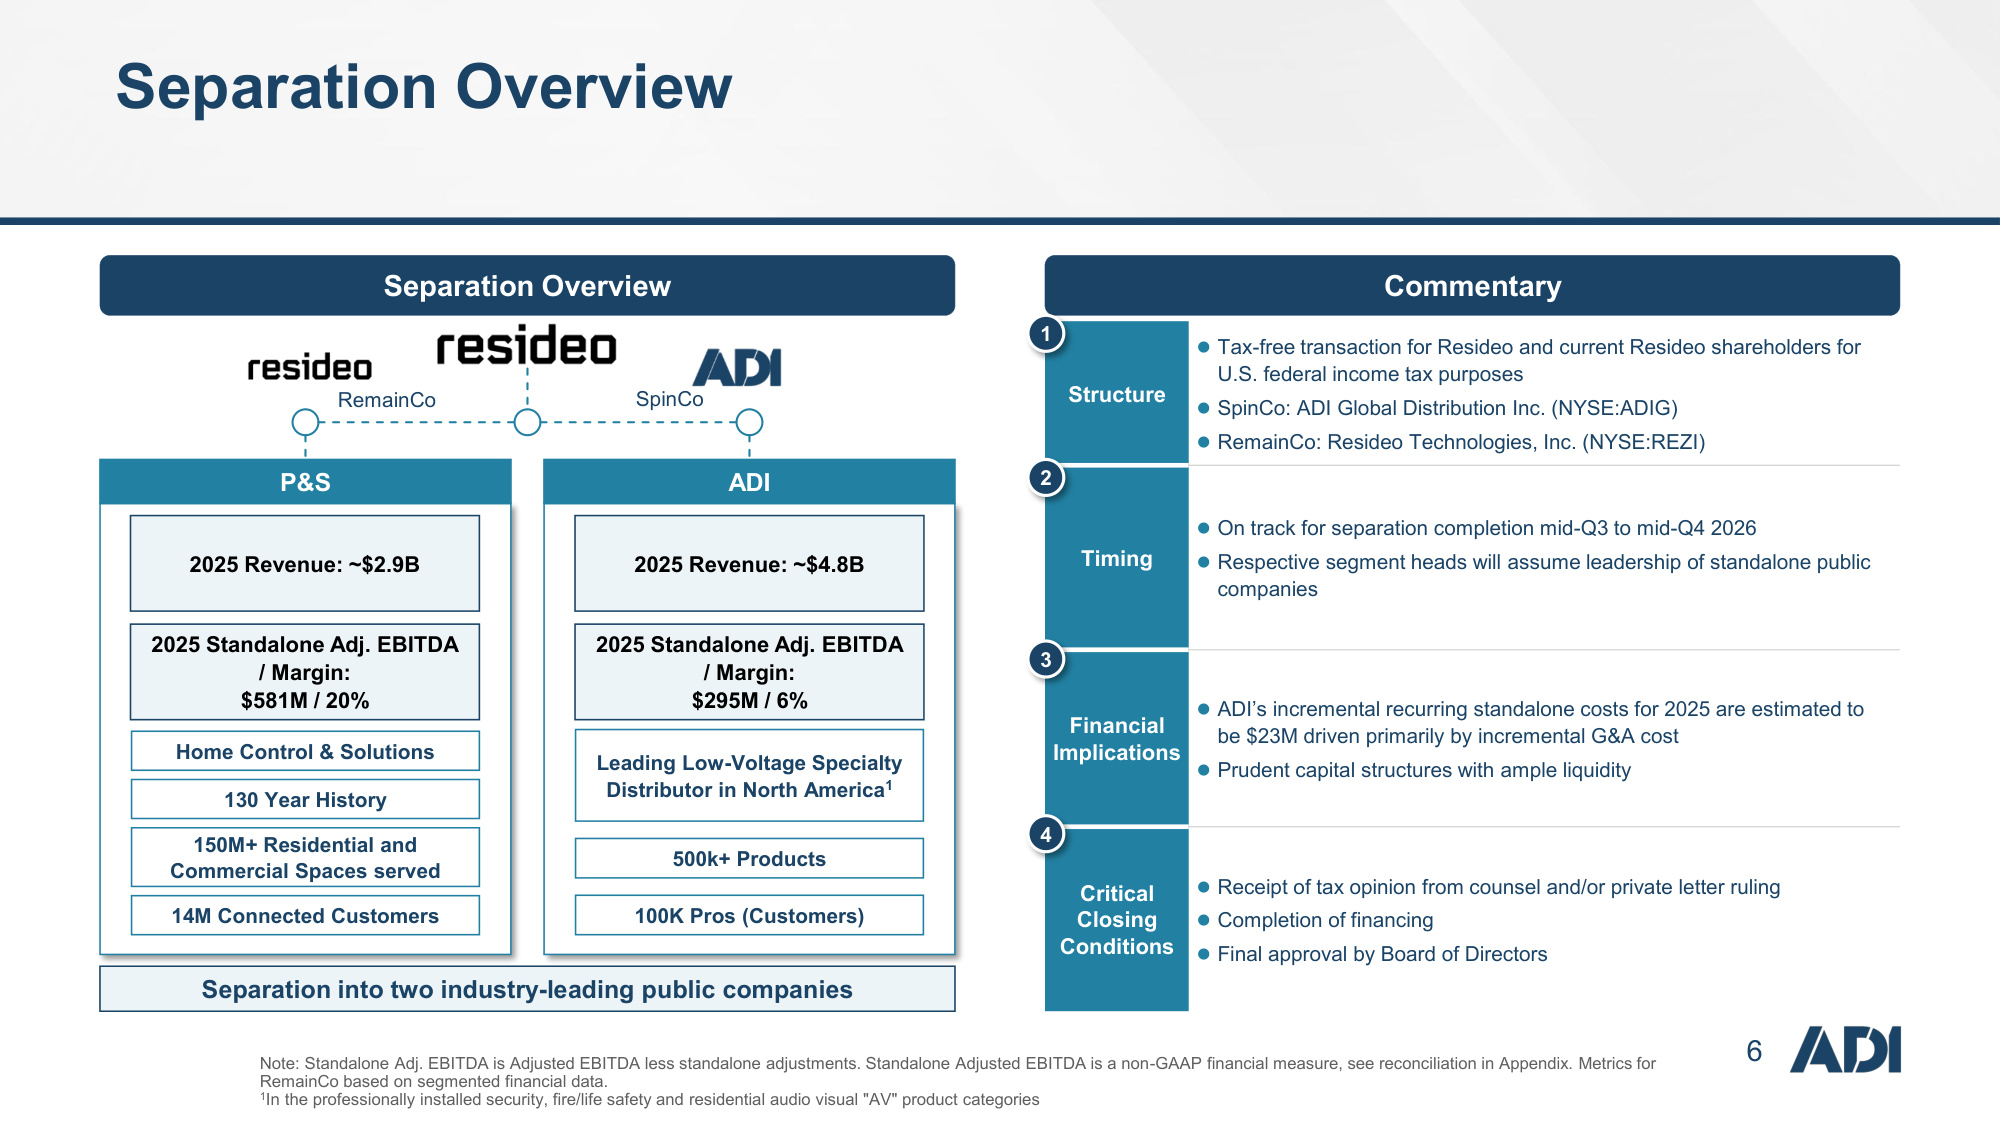
6 Separation Overview Commentary Structure ⚫Tax-free transaction for Resideo and current Resideo shareholders for U.S. federal income tax purposes ⚫SpinCo: ADI Global Distribution Inc. (NYSE:ADIG) ⚫RemainCo: Resideo Technologies, Inc. (NYSE:REZI) Timing ⚫On track for separation completion mid-Q3 to mid-Q4 2026 ⚫Respective segment heads will assume leadership of standalone public companies Financial Implications ⚫ADI's incremental recurring standalone costs for 2025 are estimated to be $23M driven primarily by incremental G&A cost ⚫Prudent capital structures with ample liquidity Critical Closing Conditions ⚫Receipt of tax opinion from counsel and/or private letter ruling ⚫Completion of financing ⚫Final approval by Board of Directors 1 2 3 4 Separation into two industry-leading public companies ADI P&S Leading Low-Voltage Specialty Distributor in North America1 500k+ Products 100K Pros (Customers) 2025 Standalone Adj. EBITDA / Margin: $295M / 6% 2025 Revenue: ~$4.8B 2025 Standalone Adj. EBITDA / Margin: $581M / 20% 2025 Revenue: ~$2.9B 14M Connected Customers Home Control & Solutions 130 Year History 150M+ Residential and Commercial Spaces served SpinCo RemainCo Note: Standalone Adj. EBITDA is Adjusted EBITDA less standalone adjustments. Standalone Adjusted EBITDA is a non-GAAP financial measure, see reconciliation in Appendix. Metrics for RemainCo based on segmented financial data. 1In the professionally installed security, fire/life safety and residential audio visual "AV" product categories Separation Overview
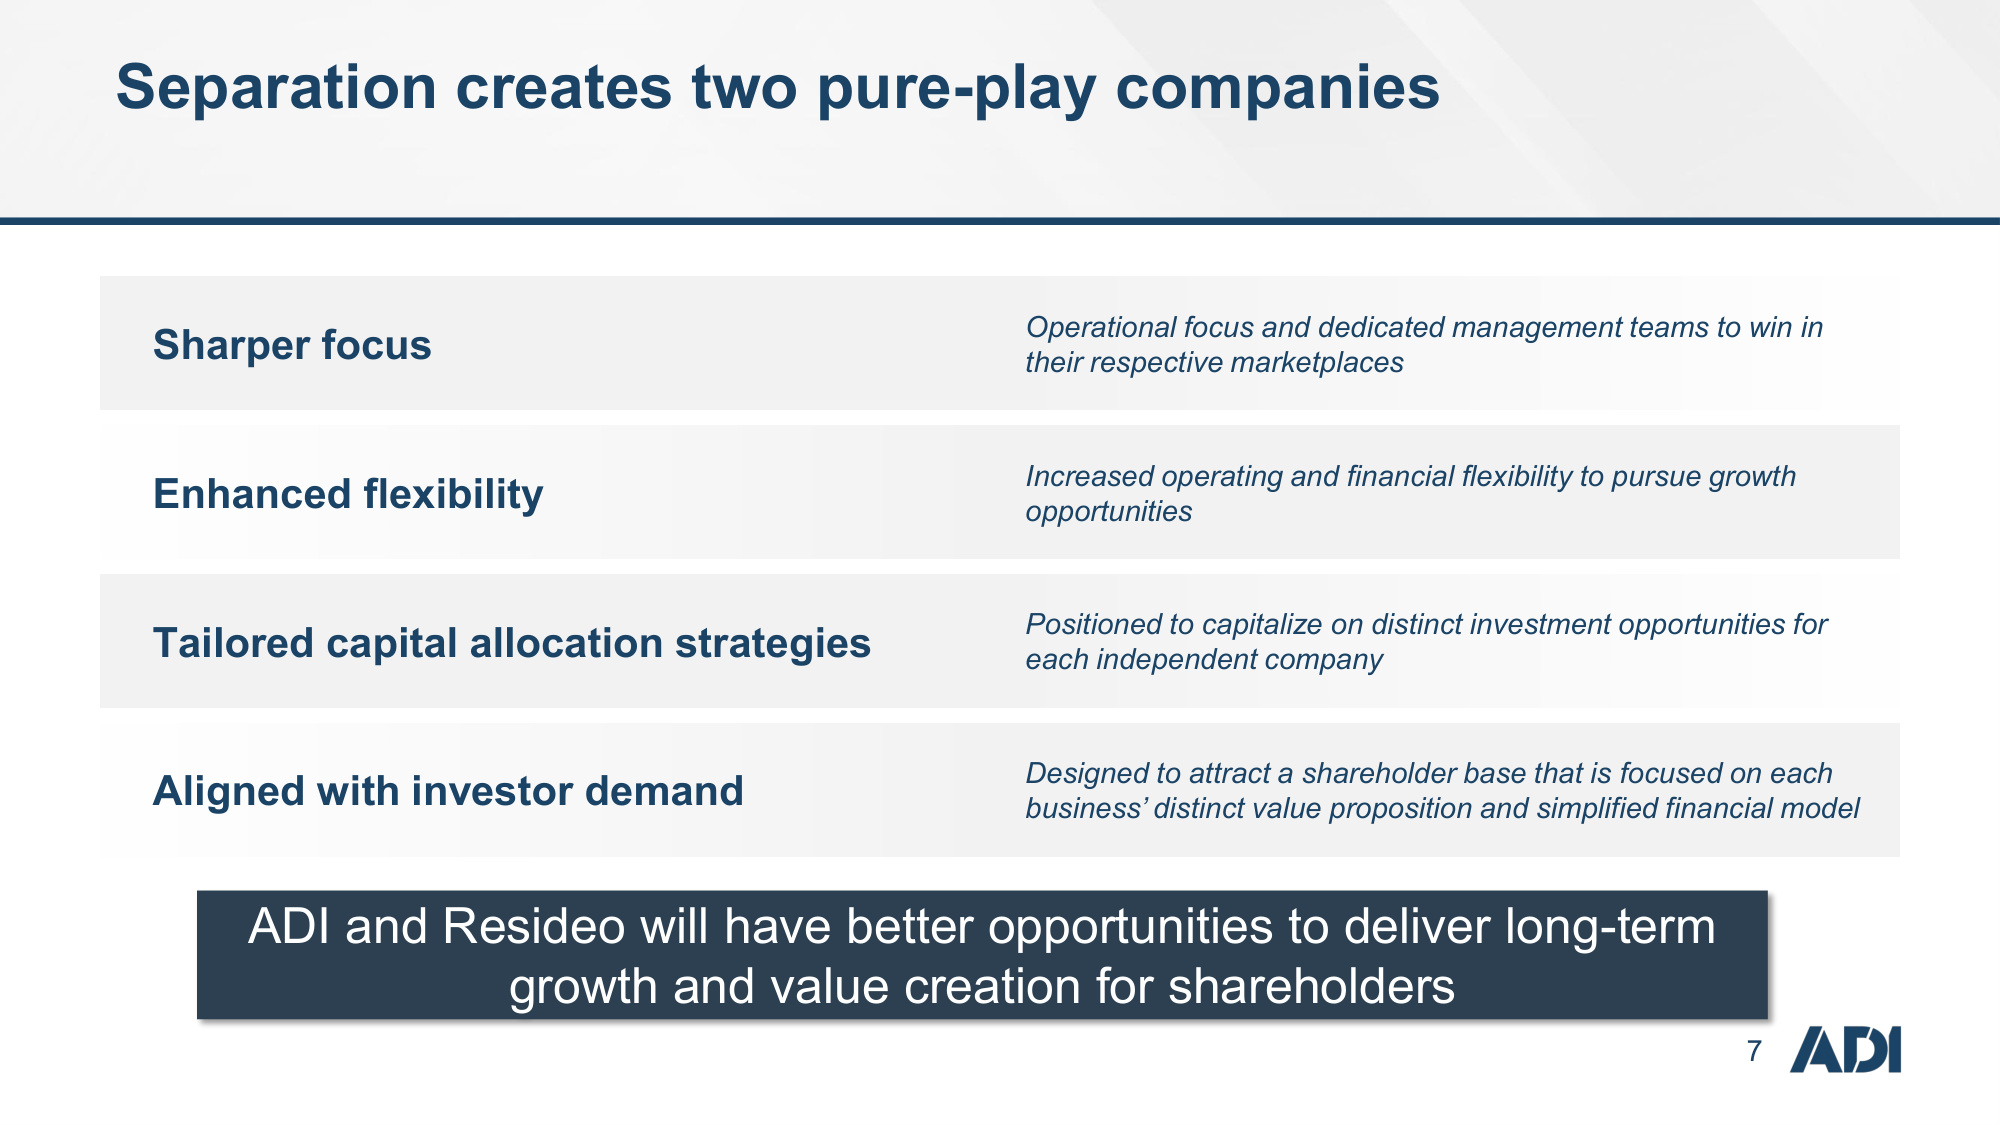
7 ADI and Resideo will have better opportunities to deliver long-term growth and value creation for shareholders Sharper focus Operational focus and dedicated management teams to win in their respective marketplaces Enhanced flexibility Increased operating and financial flexibility to pursue growth opportunities Tailored capital allocation strategies Positioned to capitalize on distinct investment opportunities for each independent company Aligned with investor demand Designed to attract a shareholder base that is focused on each business' distinct value proposition and simplified financial model Separation creates two pure-play companies
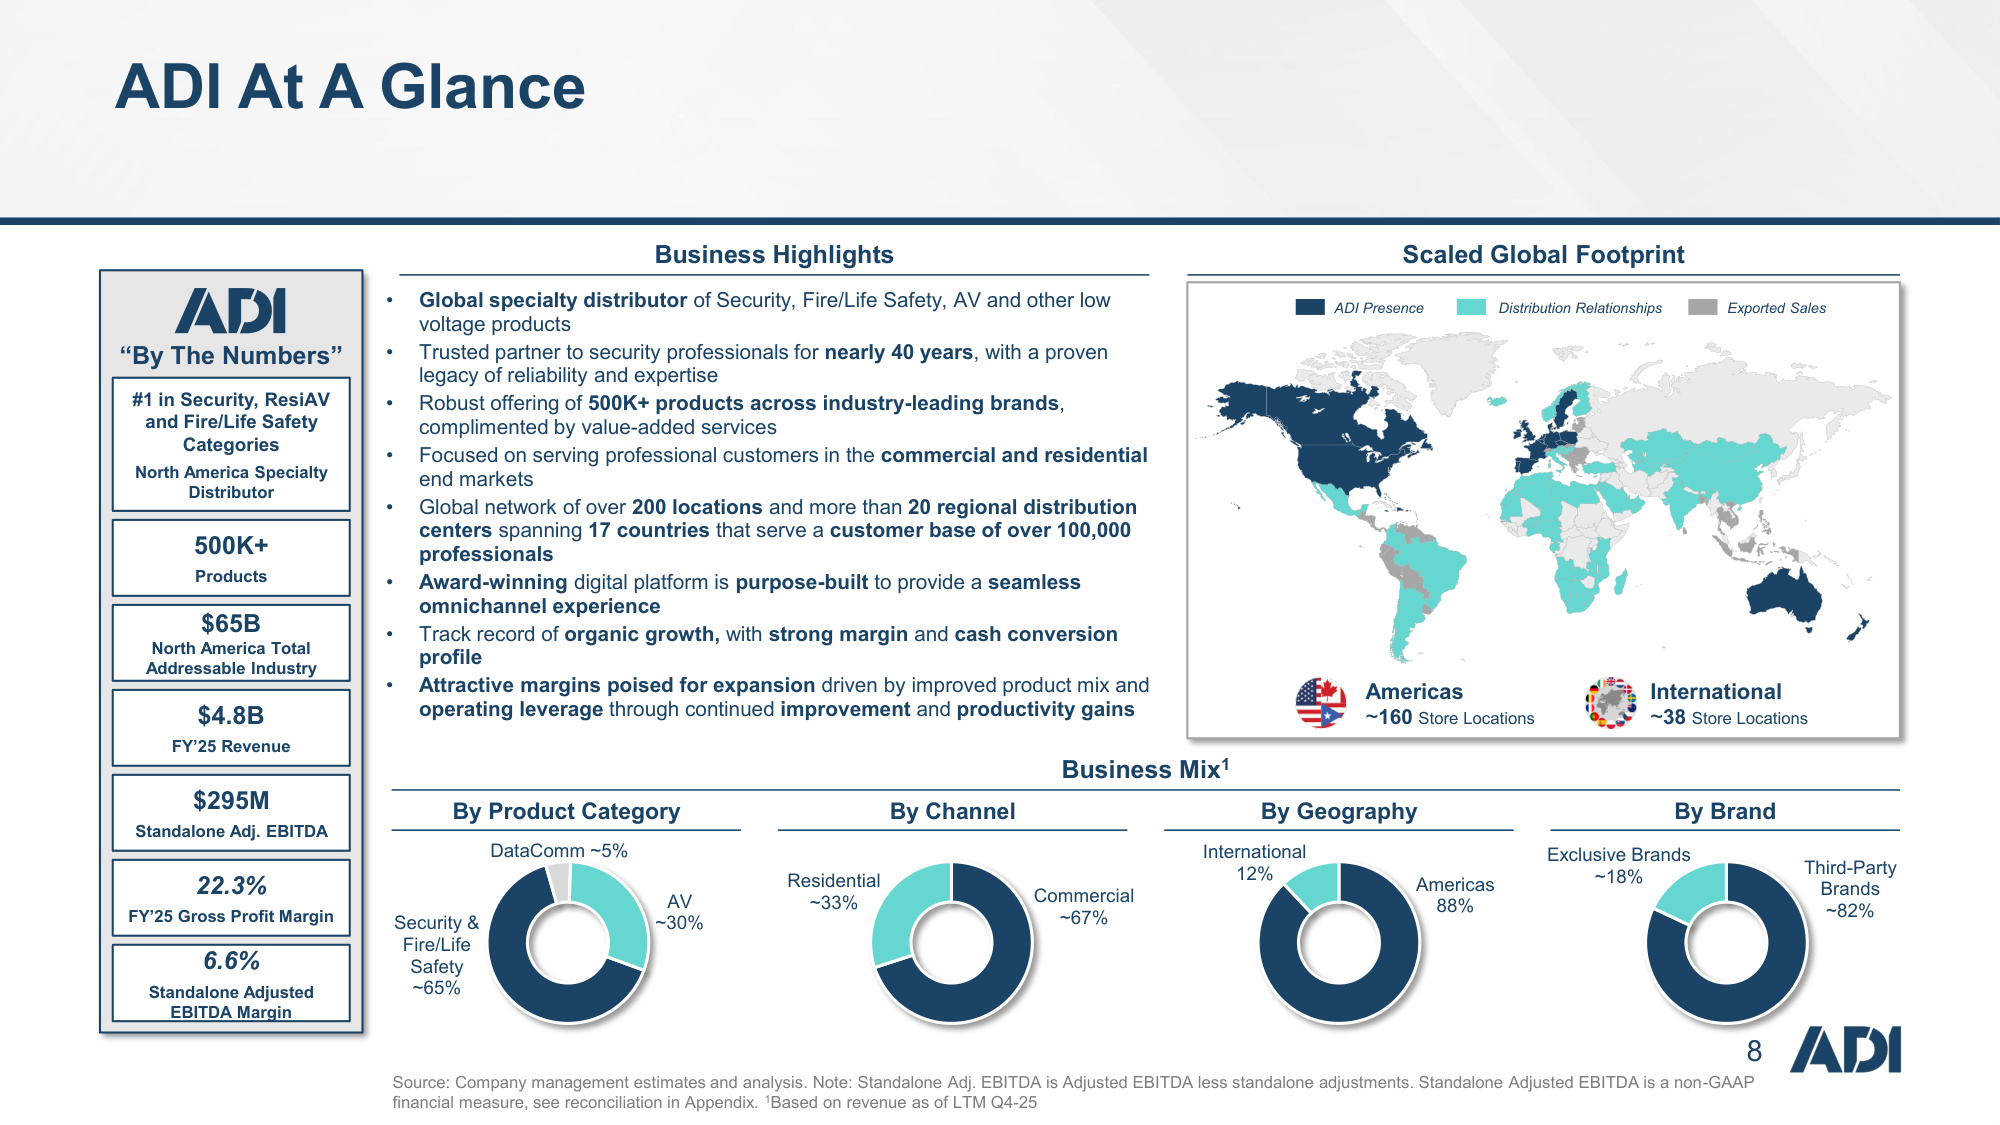
8 • Global specialty distributor of Security, Fire/Life Safety, AV and other low voltage products • Trusted partner to security professionals for nearly 40 years, with a proven legacy of reliability and expertise • Robust offering of 500K+ products across industry-leading brands, complimented by value-added services • Focused on serving professional customers in the commercial and residential end markets • Global network of over 200 locations and more than 20 regional distribution centers spanning 17 countries that serve a customer base of over 100,000 professionals • Award-winning digital platform is purpose-built to provide a seamless omnichannel experience • Track record of organic growth, with strong margin and cash conversion profile • Attractive margins poised for expansion driven by improved product mix and operating leverage through continued improvement and productivity gains Americas 88% International 12% Commercial ~67% Residential ~33% Third-Party Brands ~82% Exclusive Brands ~18% Security & Fire/Life Safety ~65% DataComm ~5% AV ~30% "By The Numbers" $65B North America Total Addressable Industry #1 in Security, ResiAV and Fire/Life Safety Categories North America Specialty Distributor 500K+ Products $4.8B FY'25 Revenue $295M Standalone Adj. EBITDA 22.3% FY'25 Gross Profit Margin 6.6% Standalone Adjusted EBITDA Margin Business Highlights Scaled Global Footprint By Product Category By Geography By Channel By Brand Business Mix1 Source: Company management estimates and analysis. Note: Standalone Adj. EBITDA is Adjusted EBITDA less standalone adjustments. Standalone Adjusted EBITDA is a non-GAAP financial measure, see reconciliation in Appendix. 1Based on revenue as of LTM Q4-25 Americas ~160 Store Locations International ~38 Store Locations ADI Presence Distribution Relationships Exported Sales ADI At A Glance
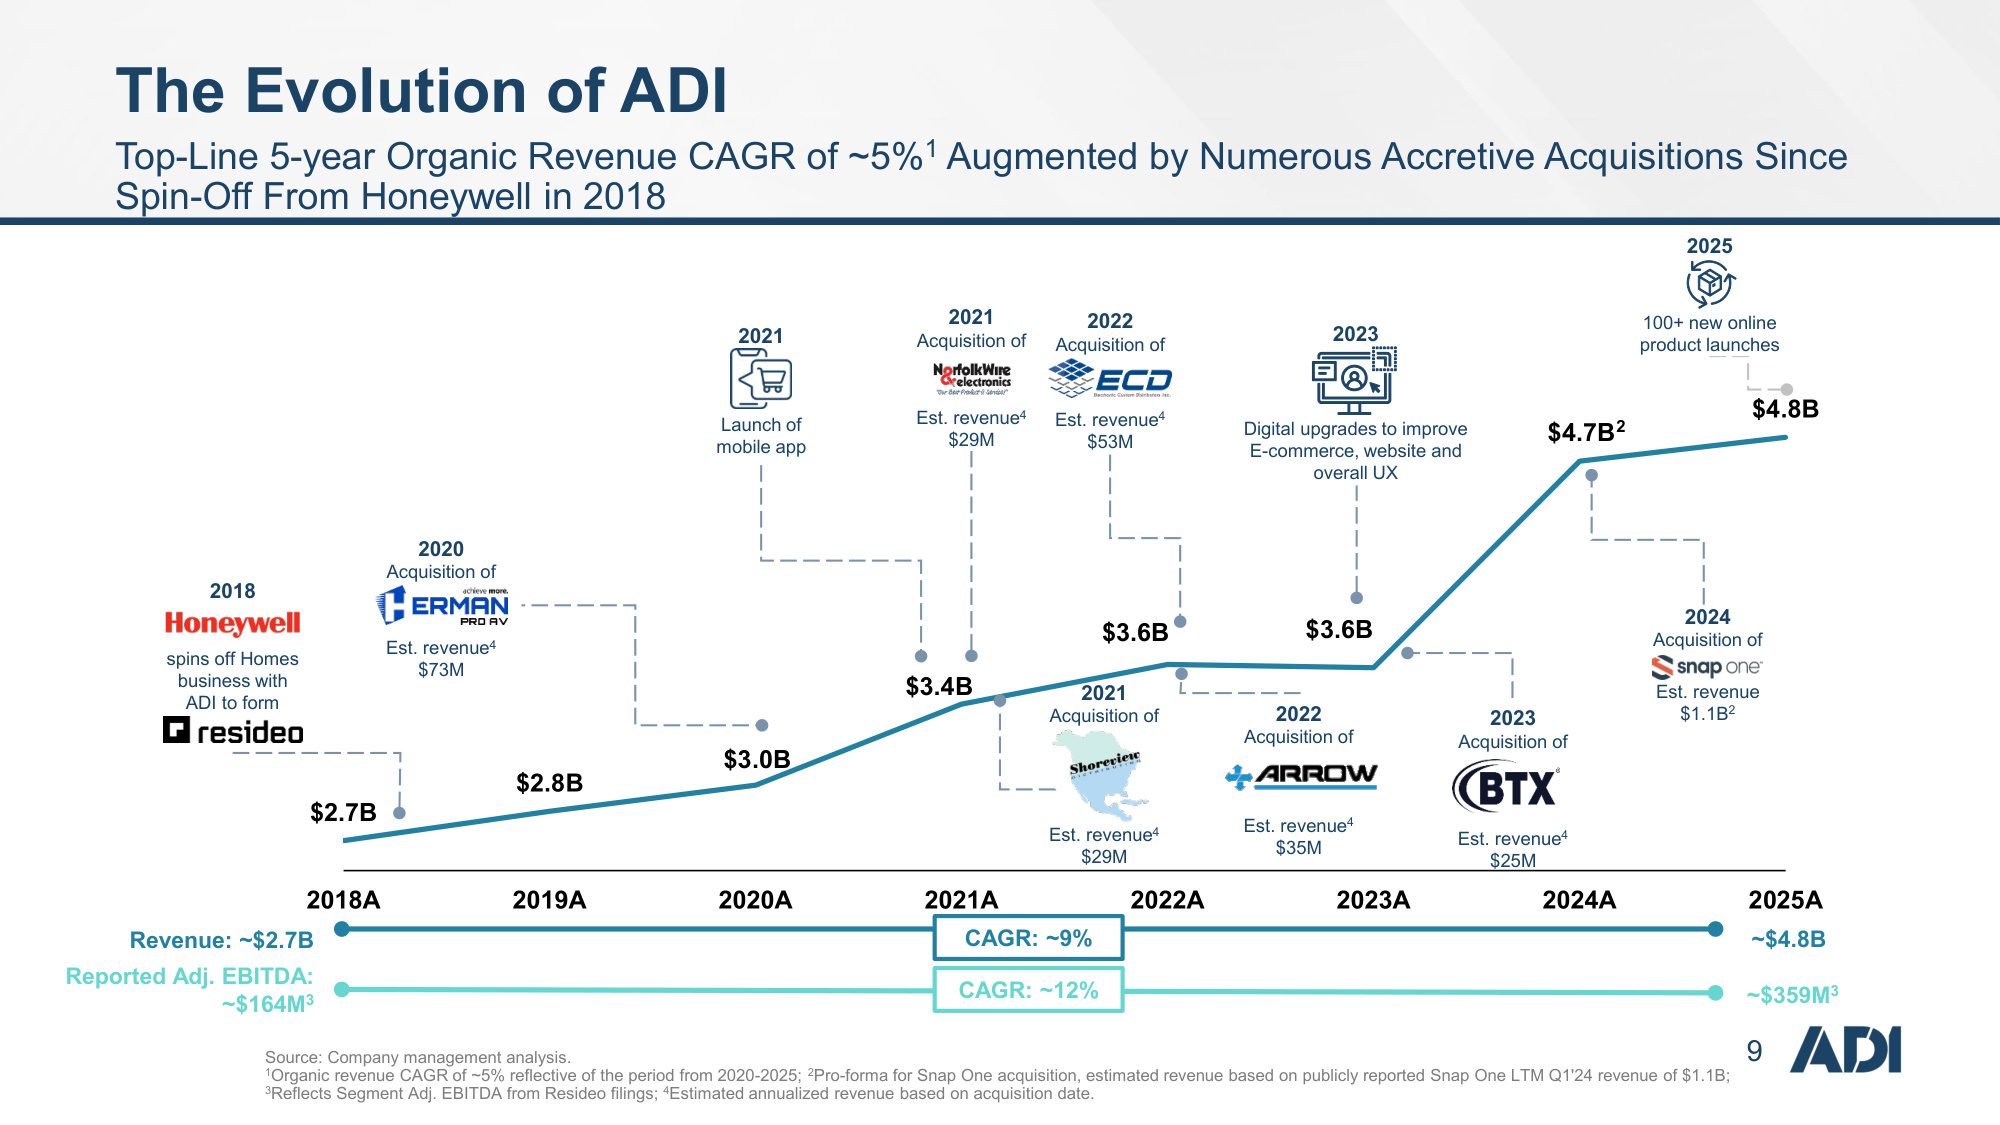
9 $2.7B $2.8B $3.0B $3.4B $3.6B $3.6B $4.7B $4.8B 2018A 2019A 2020A 2021A 2022A 2023A 2024A 2025A Revenue: ~$2.7B ~$4.8B CAGR: ~9% Reported Adj. EBITDA: ~$164M3 ~$359M3 CAGR: ~12% 2021 Acquisition of Est. revenue4 $29M 2022 Acquisition of Est. revenue4 $53M 2022 Acquisition of Est. revenue4 $35M 2021 Acquisition of Est. revenue4 $29M 2018 spins off Homes business with ADI to form 2023 Digital upgrades to improve E-commerce, website and overall UX 2025 100+ new online product launches 2021 Launch of mobile app 2020 Acquisition of Est. revenue4 $73M 2023 Acquisition of Est. revenue4 $25M 2024 Acquisition of Est. revenue $1.1B2 Source: Company management analysis. 1Organic revenue CAGR of ~5% reflective of the period from 2020-2025; 2Pro-forma for Snap One acquisition, estimated revenue based on publicly reported Snap One LTM Q1'24 revenue of $1.1B; 3Reflects Segment Adj. EBITDA from Resideo filings; 4Estimated annualized revenue based on acquisition date. 2 The Evolution of ADI Top-Line 5-year Organic Revenue CAGR of ~5%1 Augmented by Numerous Accretive Acquisitions Since Spin-Off From Honeywell in 2018
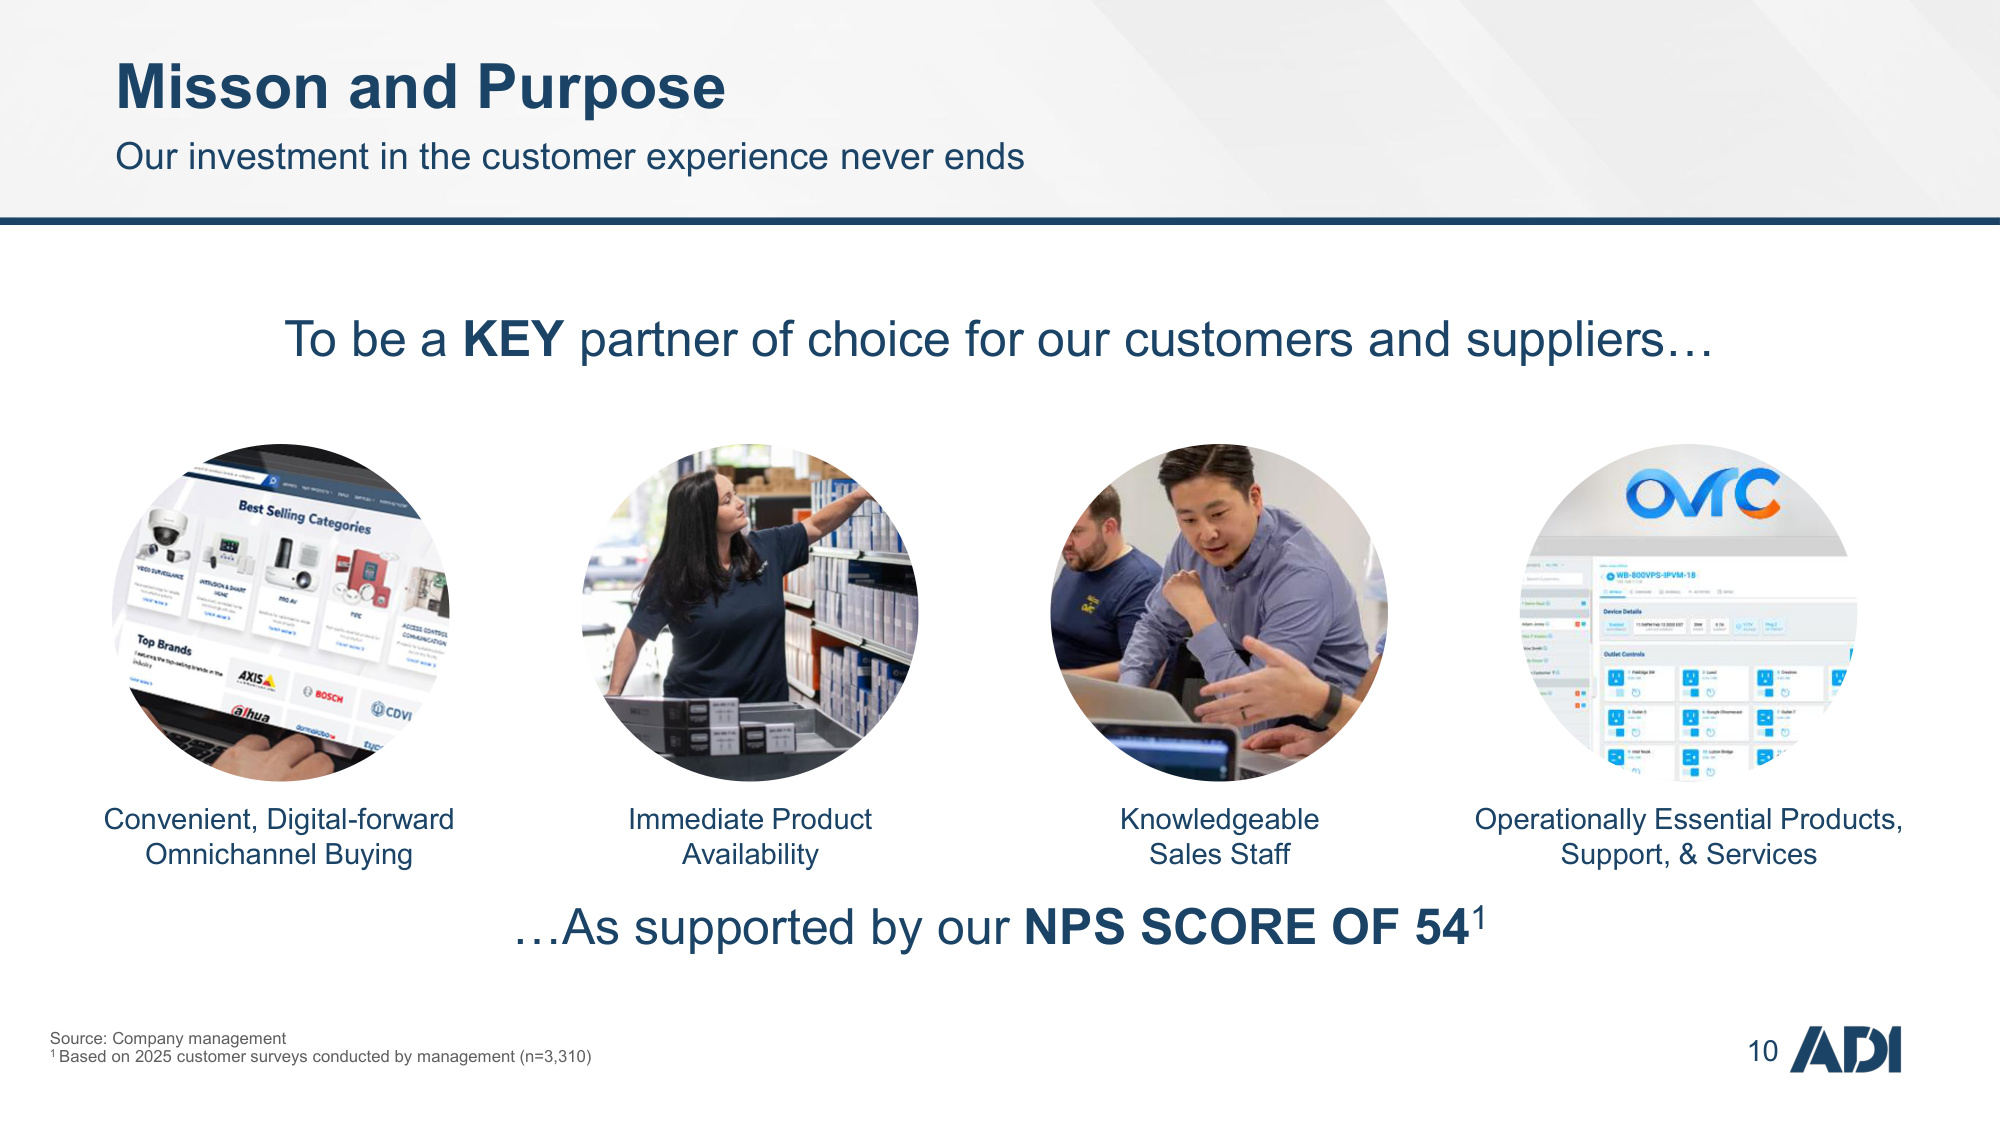
10 To be a KEY partner of choice for our customers and suppliers... Convenient, Digital-forward Omnichannel Buying Immediate Product Availability Operationally Essential Products, Support, & Services Knowledgeable Sales Staff ...As supported by our NPS SCORE OF 541 Source: Company management 1 Based on 2025 customer surveys conducted by management (n=3,310) Misson and Purpose Our investment in the customer experience never ends
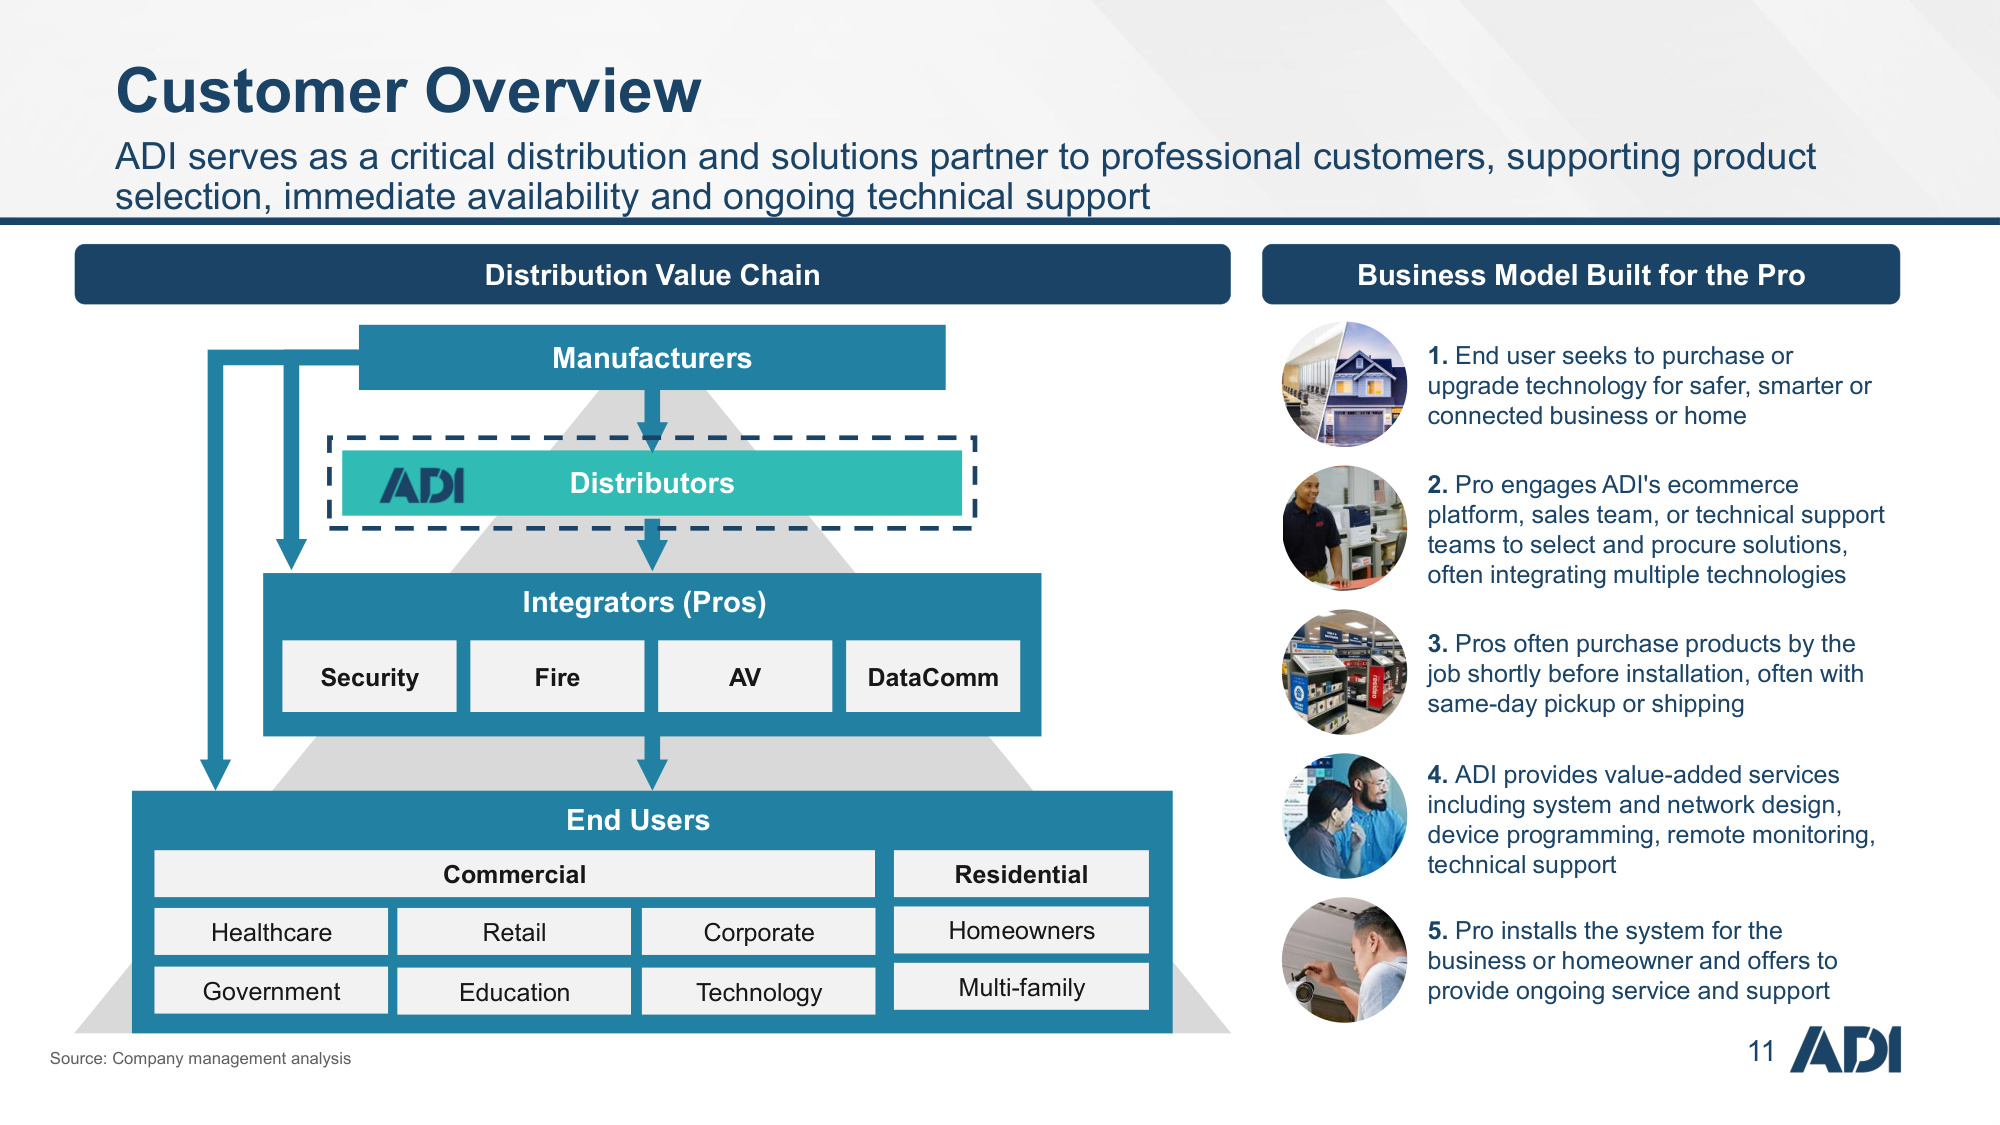
11 4. ADI provides value-added services including system and network design, device programming, remote monitoring, technical support Distribution Value Chain Commercial Manufacturers Distributors End Users Security Fire DataComm Healthcare Government Retail Education Corporate Technology Homeowners Multi-family Integrators (Pros) Residential AV Business Model Built for the Pro 1. End user seeks to purchase or upgrade technology for safer, smarter or connected business or home 3. Pros often purchase products by the job shortly before installation, often with same-day pickup or shipping 2. Pro engages ADI's ecommerce platform, sales team, or technical support teams to select and procure solutions, often integrating multiple technologies 5. Pro installs the system for the business or homeowner and offers to provide ongoing service and support Source: Company management analysis Customer Overview ADI serves as a critical distribution and solutions partner to professional customers, supporting product selection, immediate availability and ongoing technical support
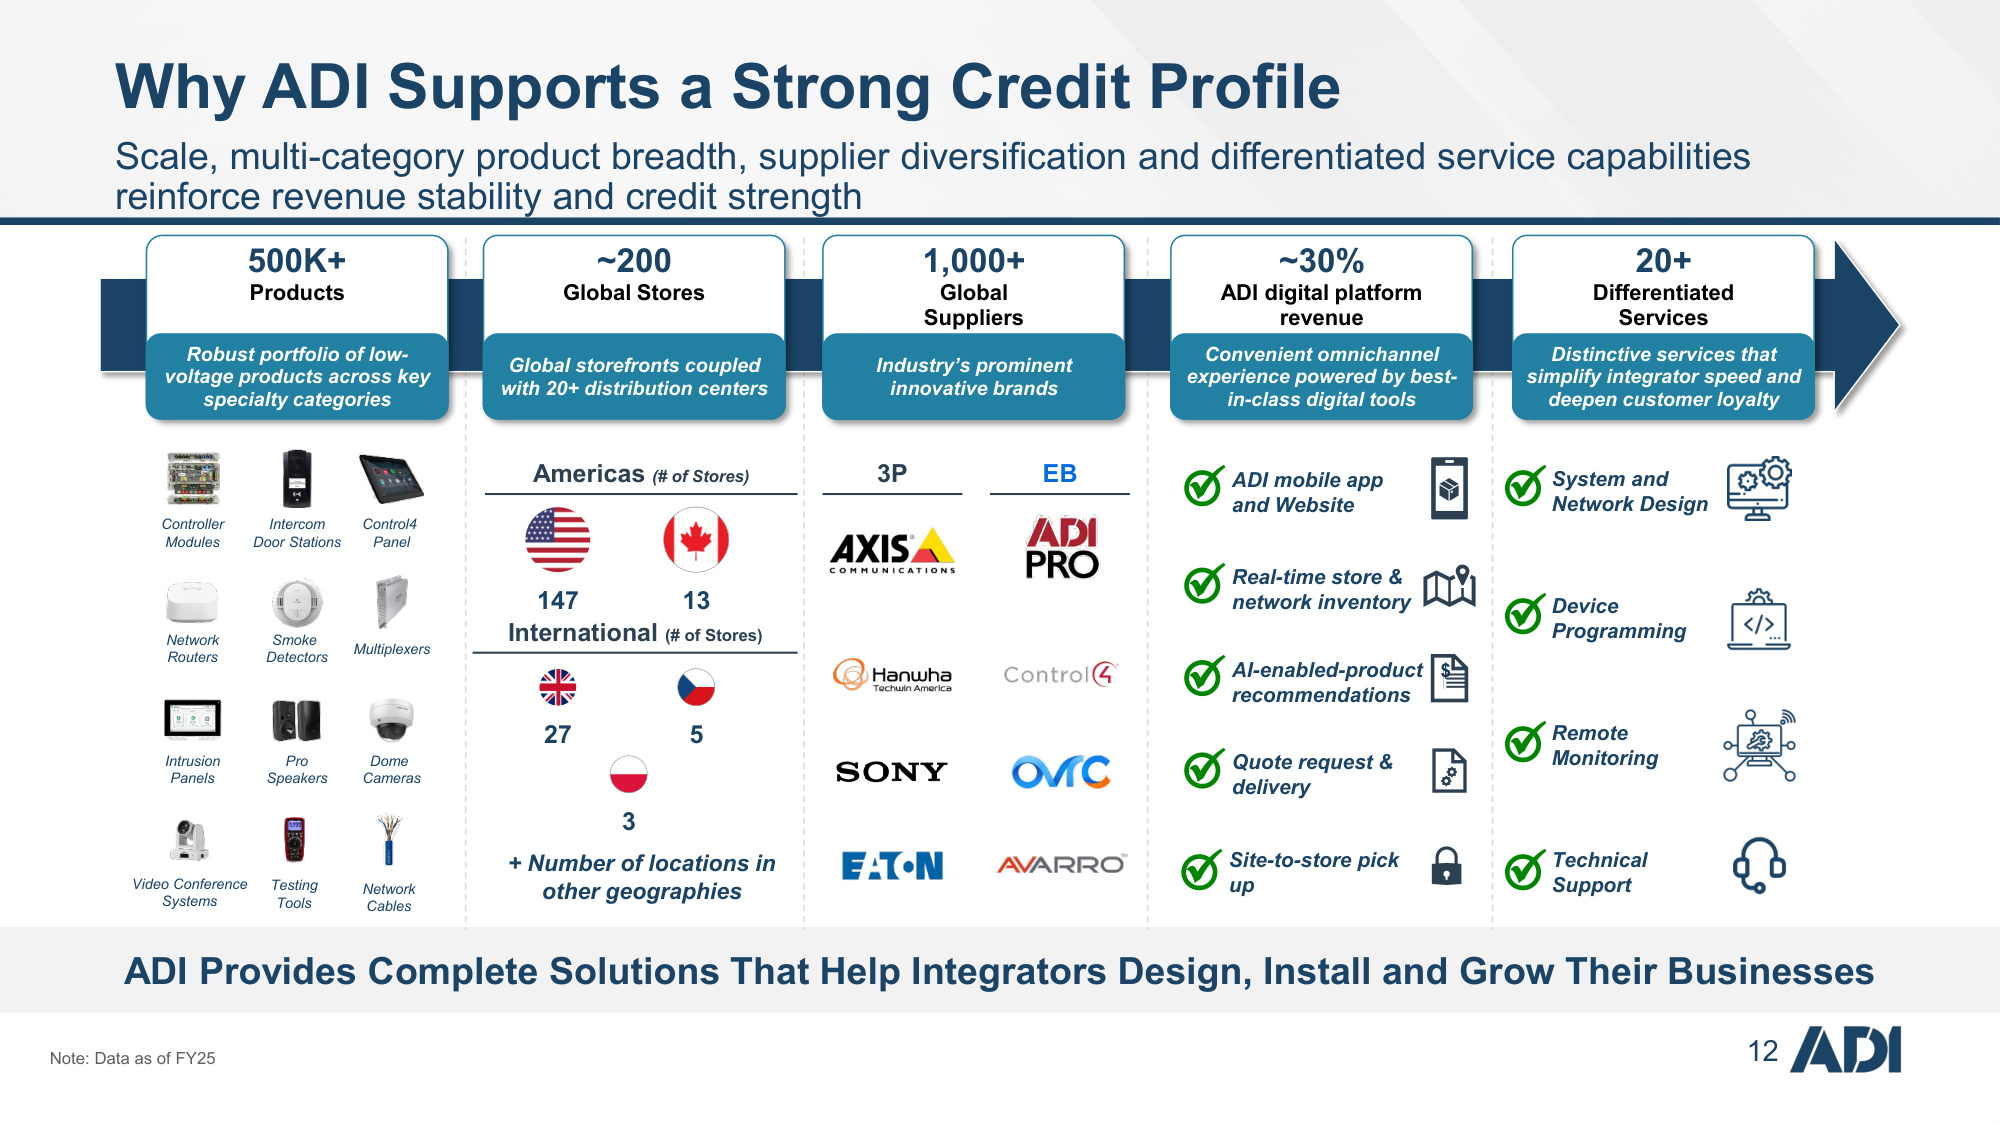
12 EB 3P Americas (# of Stores) International (# of Stores) ADI Provides Complete Solutions That Help Integrators Design, Install and Grow Their Businesses 20+ Differentiated Services Distinctive services that simplify integrator speed and deepen customer loyalty ~30% ADI digital platform revenue Convenient omnichannel experience powered by best- in-class digital tools 500K+ Products Robust portfolio of low- voltage products across key specialty categories 1,000+ Global Suppliers Industry's prominent innovative brands Global storefronts coupled with 20+ distribution centers ~200 Global Stores 147 13 27 5 3 Smoke Detectors Multiplexers Network Routers Network Cables Testing Tools Video Conference Systems Dome Cameras Pro Speakers Intrusion Panels Control4 Panel Intercom Door Stations Controller Modules $ AI-enabled-product recommendations ✓ Remote Monitoring ✓ Site-to-store pick up ✓ Technical Support ✓ Quote request & delivery ✓ ADI mobile app and Website ✓ Device Programming ✓ Real-time store & network inventory ✓ System and Network Design ✓ + Number of locations in other geographies Note: Data as of FY25 Why ADI Supports a Strong Credit Profile Scale, multi-category product breadth, supplier diversification and differentiated service capabilities reinforce revenue stability and credit strength
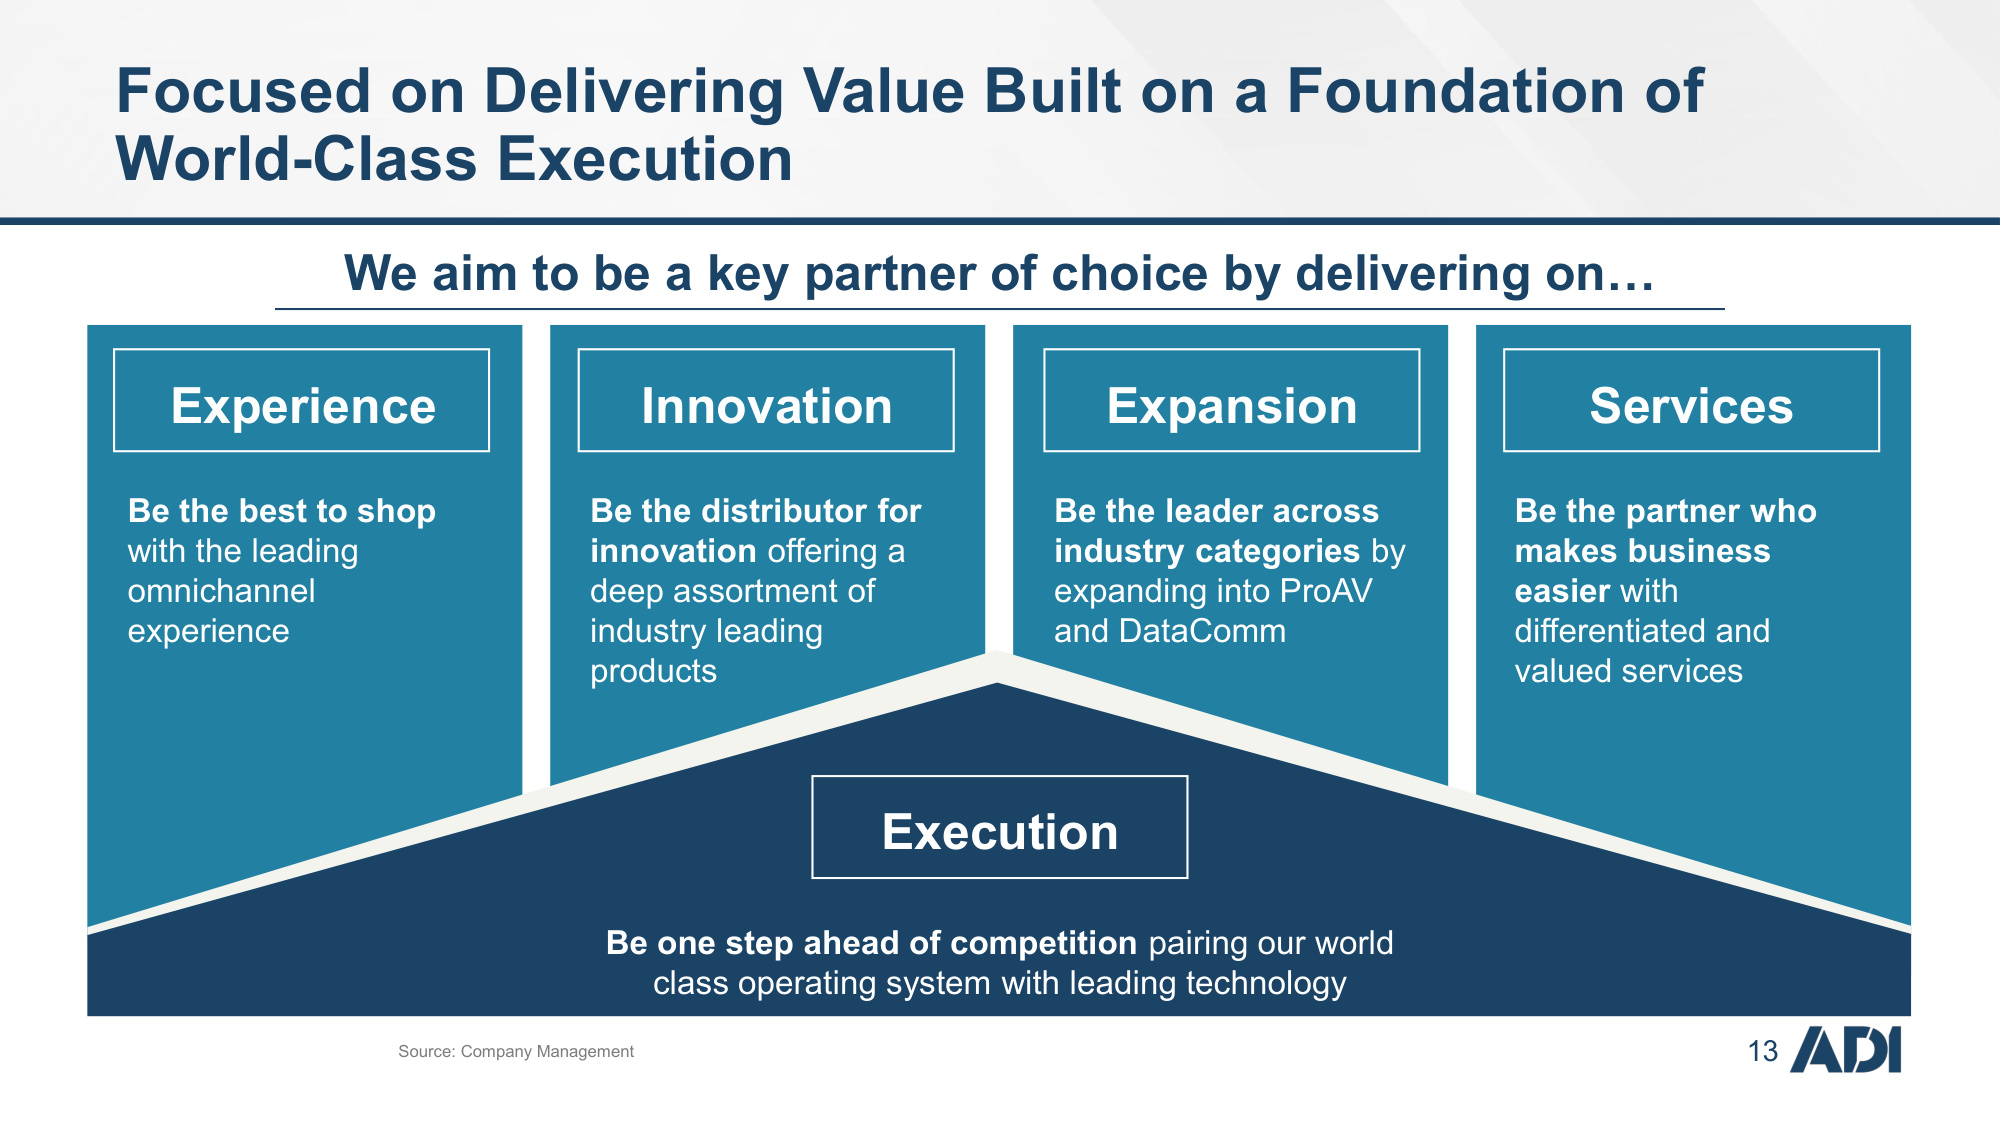
13 Source: Company Management Be the distributor for innovation offering a deep assortment of industry leading products Be the best to shop with the leading omnichannel experience Be the leader across industry categories by expanding into ProAV and DataComm Be the partner who makes business easier with differentiated and valued services Expansion Services Be one step ahead of competition pairing our world class operating system with leading technology Experience Innovation Execution We aim to be a key partner of choice by delivering on... Focused on Delivering Value Built on a Foundation of World-Class Execution
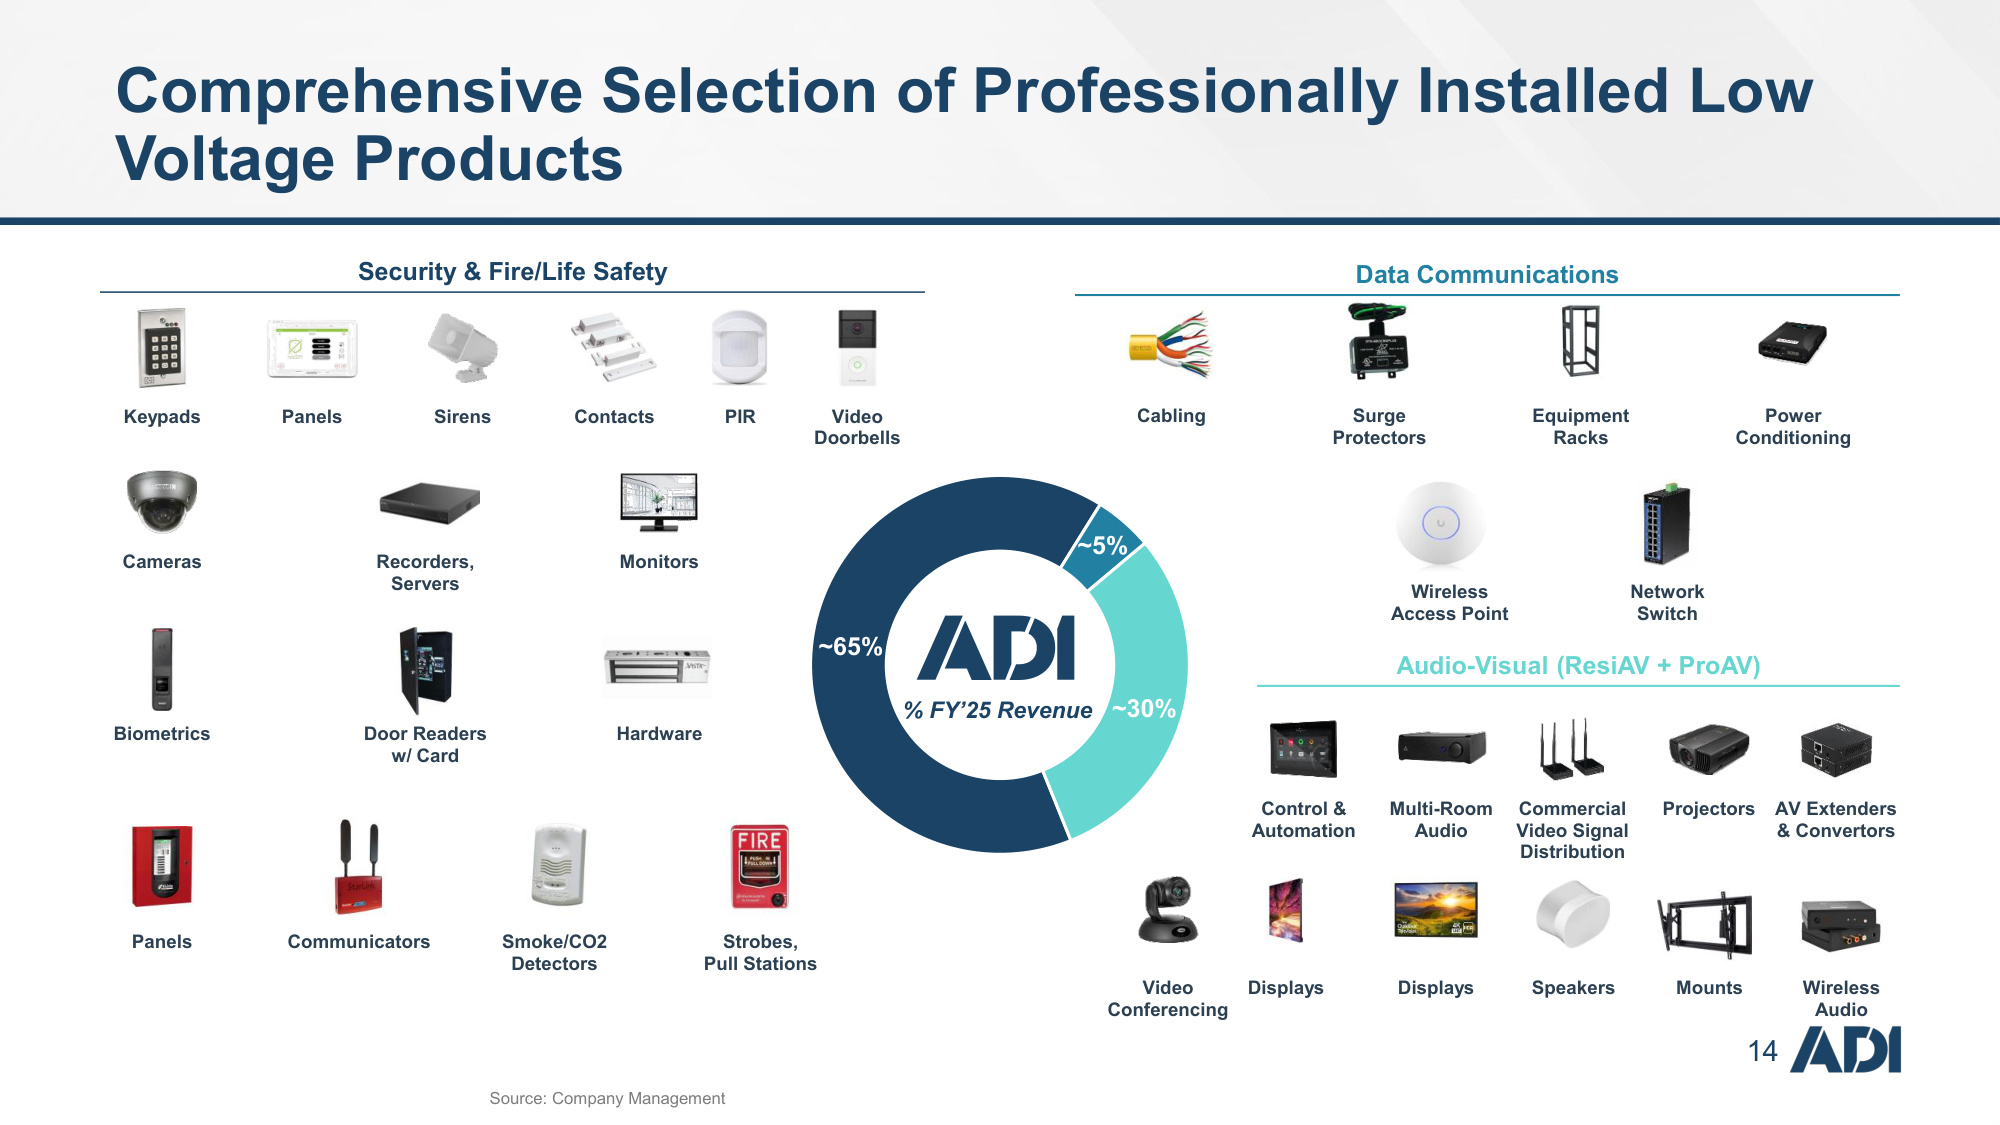
14 Comprehensive Selection of Professionally Installed Low Voltage Products Security & Fire/Life Safety ~65% ~5% ~30% % FY'25 Revenue Data Communications Source: Company Management Audio-Visual (ResiAV + ProAV) Panels Sirens Contacts PIR Panels Communicators Smoke/CO2 Detectors Strobes, Pull Stations Recorders, Servers Cameras Monitors Biometrics Door Readers w/ Card Hardware Video Doorbells Keypads Network Switch Wireless Access Point Equipment Racks Surge Protectors Cabling Power Conditioning Control & Automation Multi-Room Audio Video Conferencing Projectors AV Extenders & Convertors Displays Displays Speakers Mounts Wireless Audio Commercial Video Signal Distribution
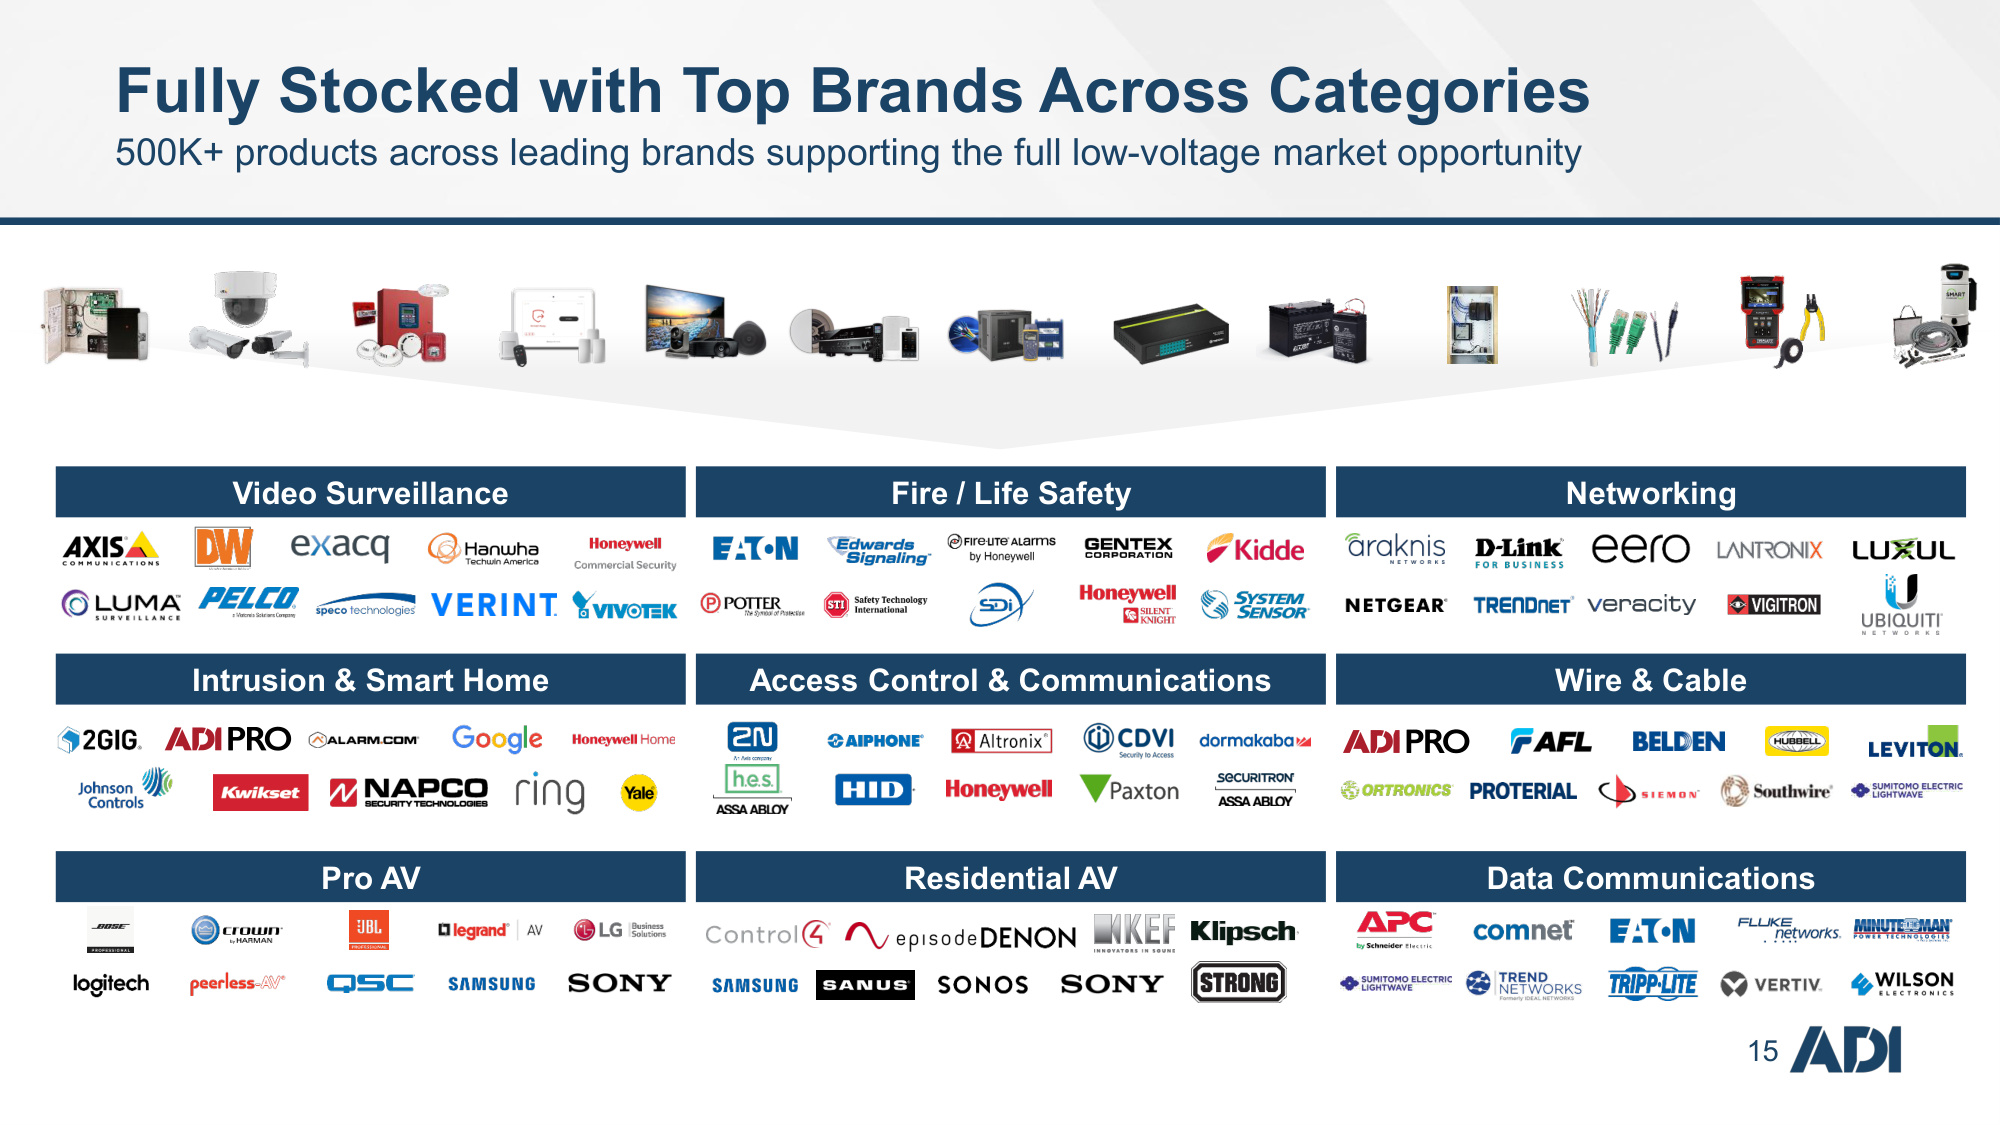
15 Fully Stocked with Top Brands Across Categories 500K+ products across leading brands supporting the full low-voltage market opportunity Intrusion & Smart Home Video Surveillance Pro AV Fire / Life Safety Access Control & Communications Residential AV Data Communications Wire & Cable Networking
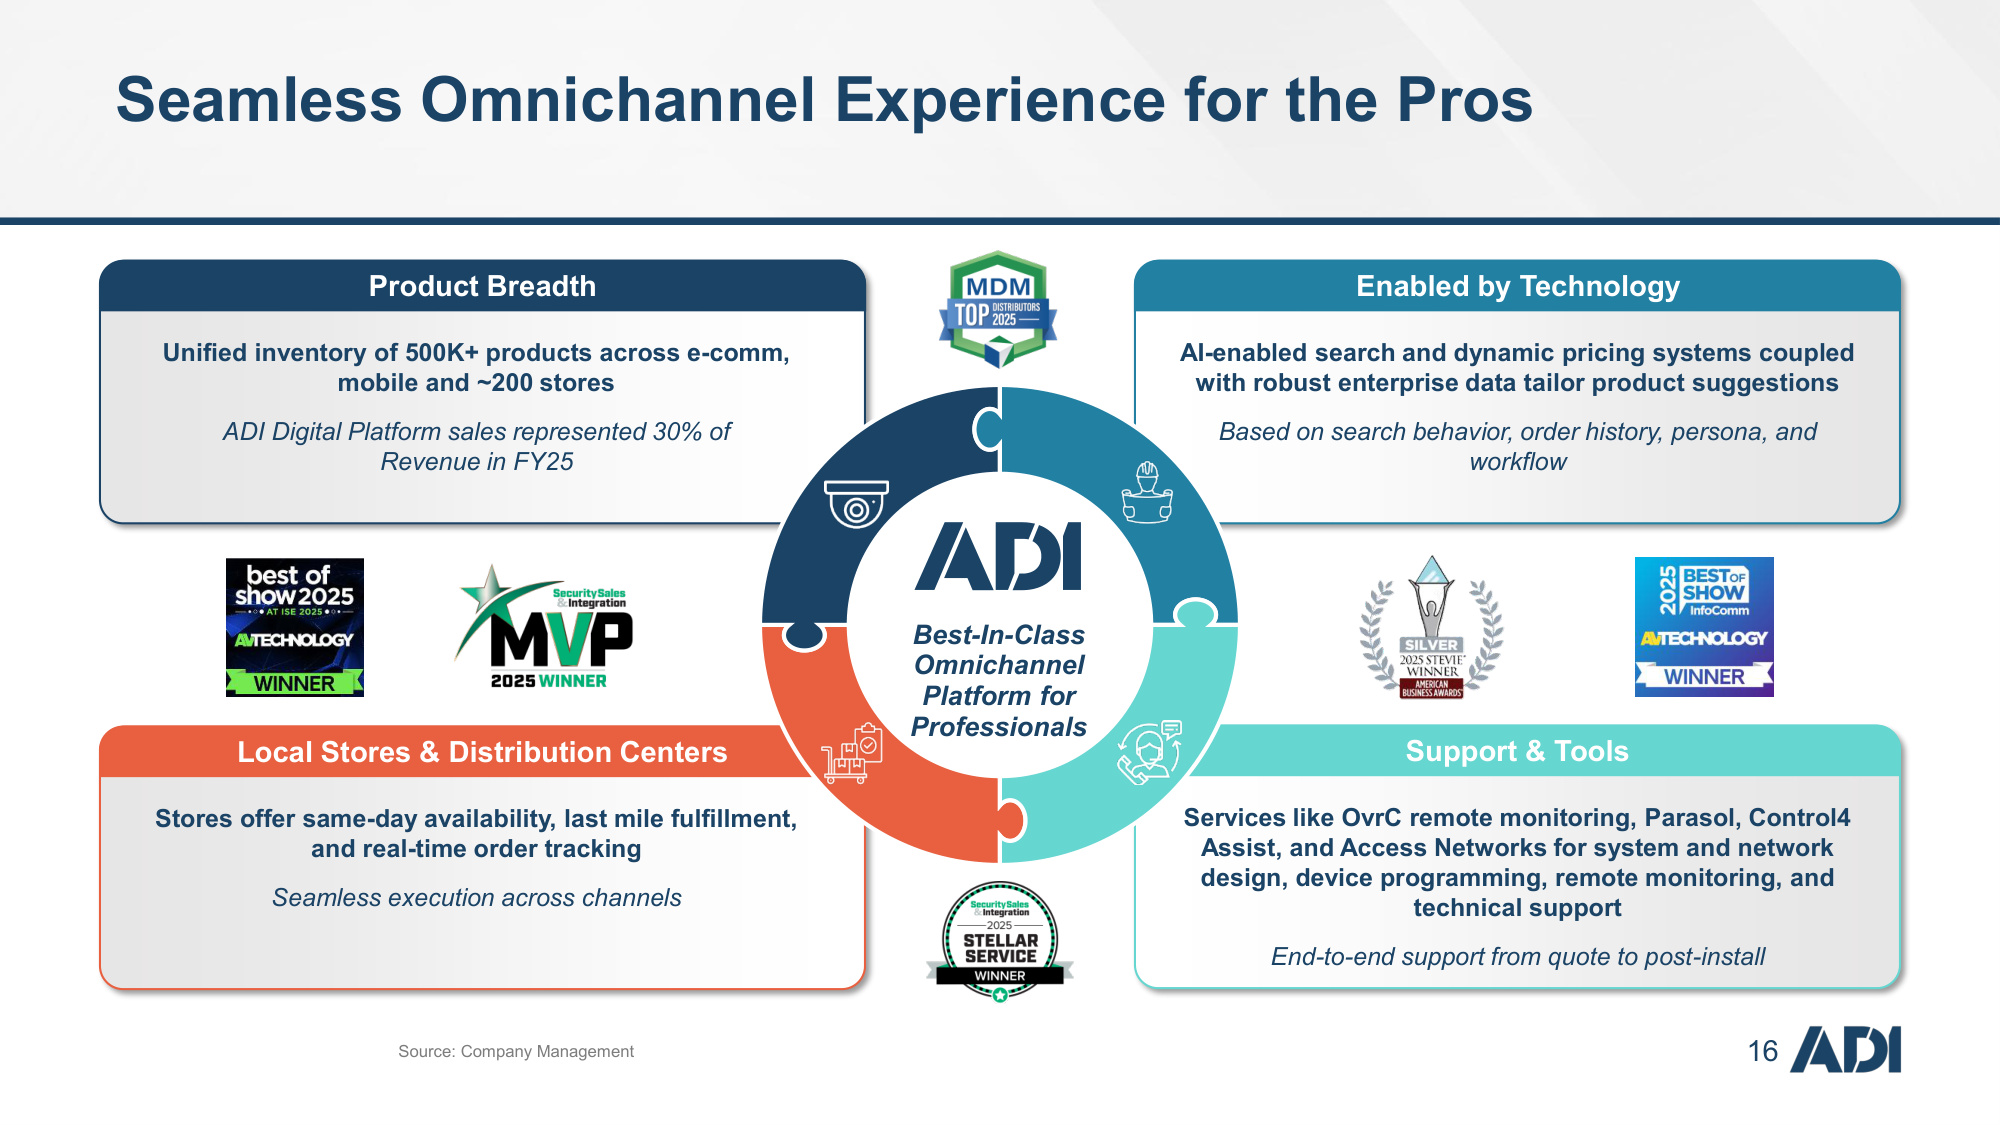
16 Seamless Omnichannel Experience for the Pros Unified inventory of 500K+ products across e-comm, mobile and ~200 stores ADI Digital Platform sales represented 30% of Revenue in FY25 Product Breadth Stores offer same-day availability, last mile fulfillment, and real-time order tracking Seamless execution across channels Local Stores & Distribution Centers Services like OvrC remote monitoring, Parasol, Control4 Assist, and Access Networks for system and network design, device programming, remote monitoring, and technical support End-to-end support from quote to post-install Support & Tools AI-enabled search and dynamic pricing systems coupled with robust enterprise data tailor product suggestions Based on search behavior, order history, persona, and workflow Enabled by Technology Best-In-Class Omnichannel Platform for Professionals Source: Company Management
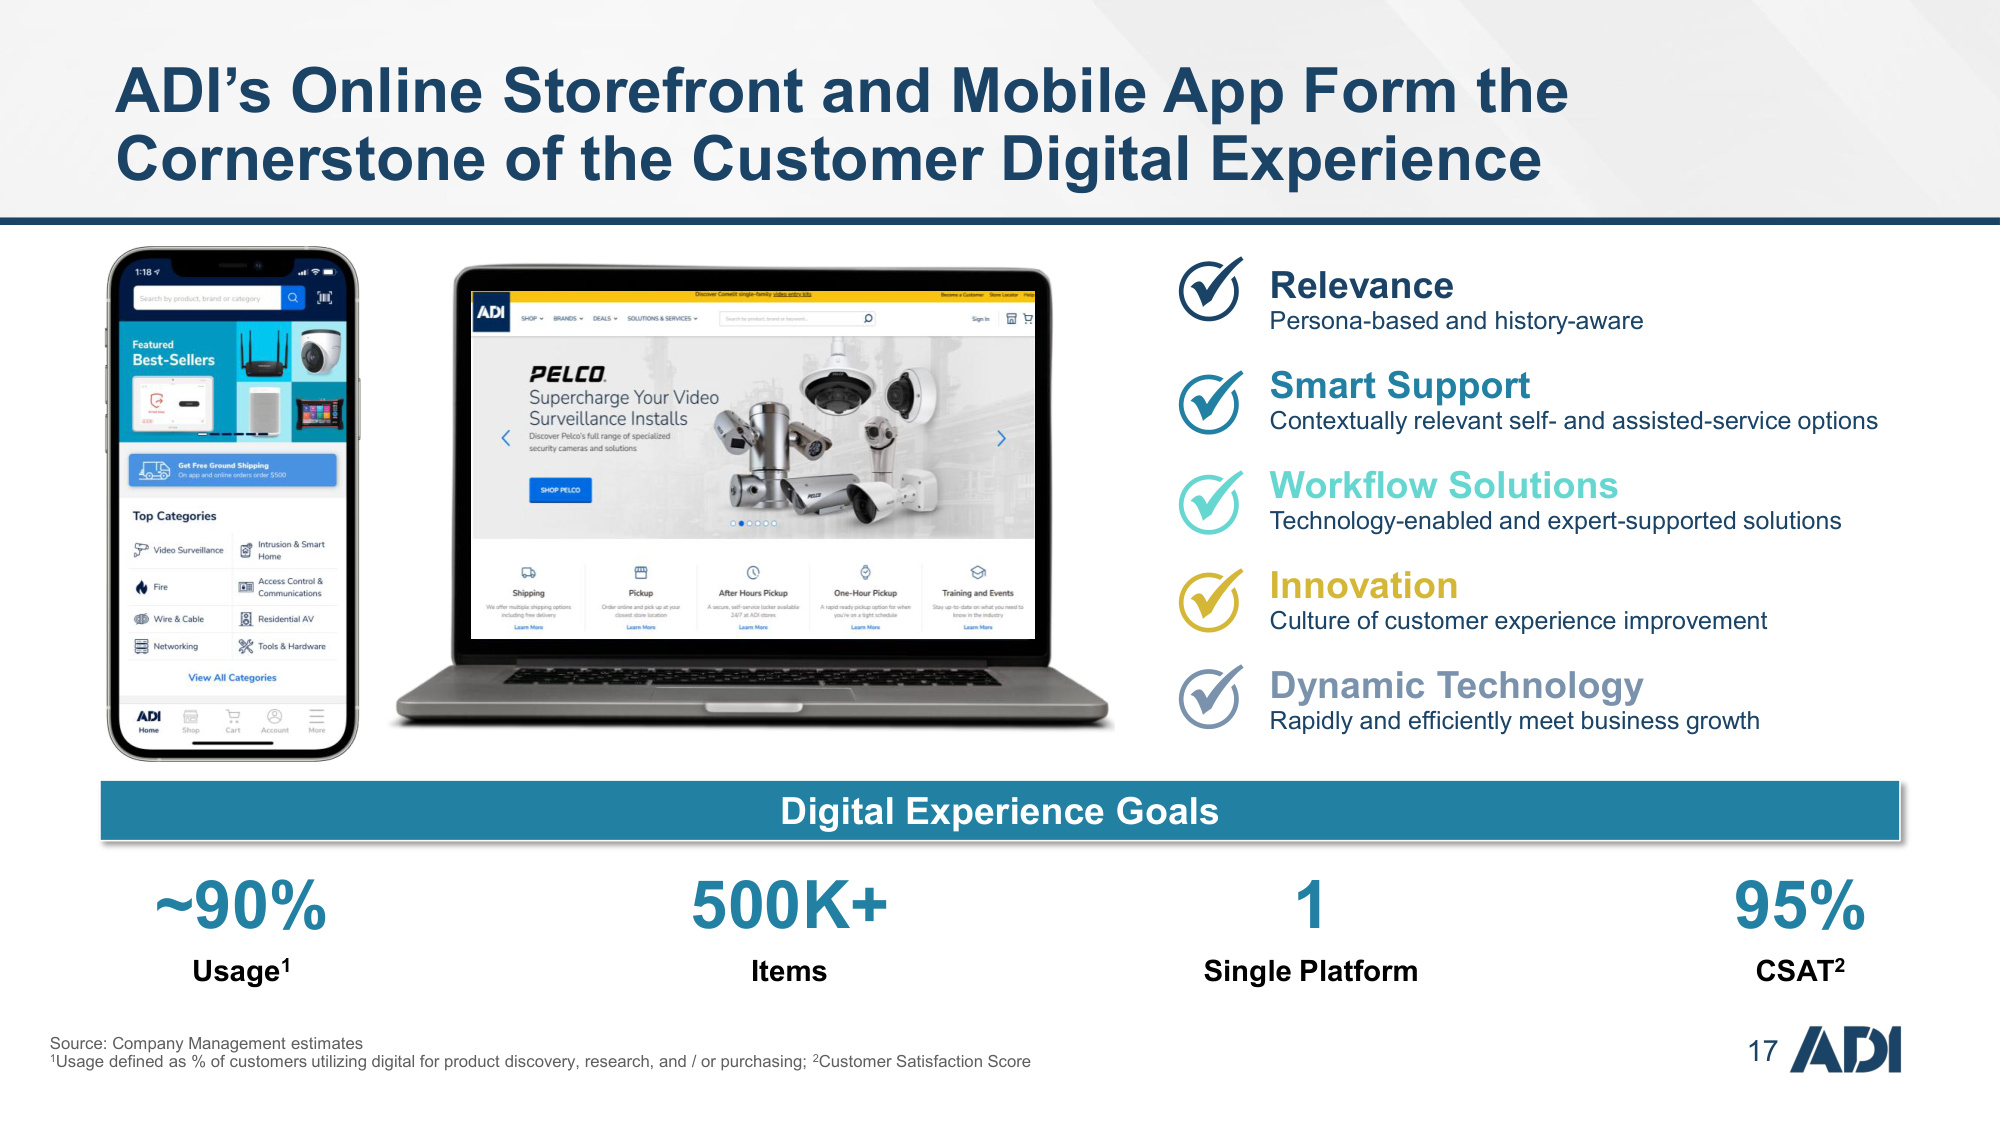
17 ADI's Online Storefront and Mobile App Form the Cornerstone of the Customer Digital Experience Relevance Persona-based and history-aware Smart Support Contextually relevant self- and assisted-service options Workflow Solutions Technology-enabled and expert-supported solutions Innovation Culture of customer experience improvement Dynamic Technology Rapidly and efficiently meet business growth 16 Source: Thunderball Management 1. Customer Satisfaction Score ✓ ✓ ✓ ✓ ✓ 500K+ Items ~90% Usage1 1 Single Platform 95% CSAT2 Digital Experience Goals Source: Company Management estimates 1Usage defined as % of customers utilizing digital for product discovery, research, and / or purchasing; 2Customer Satisfaction Score
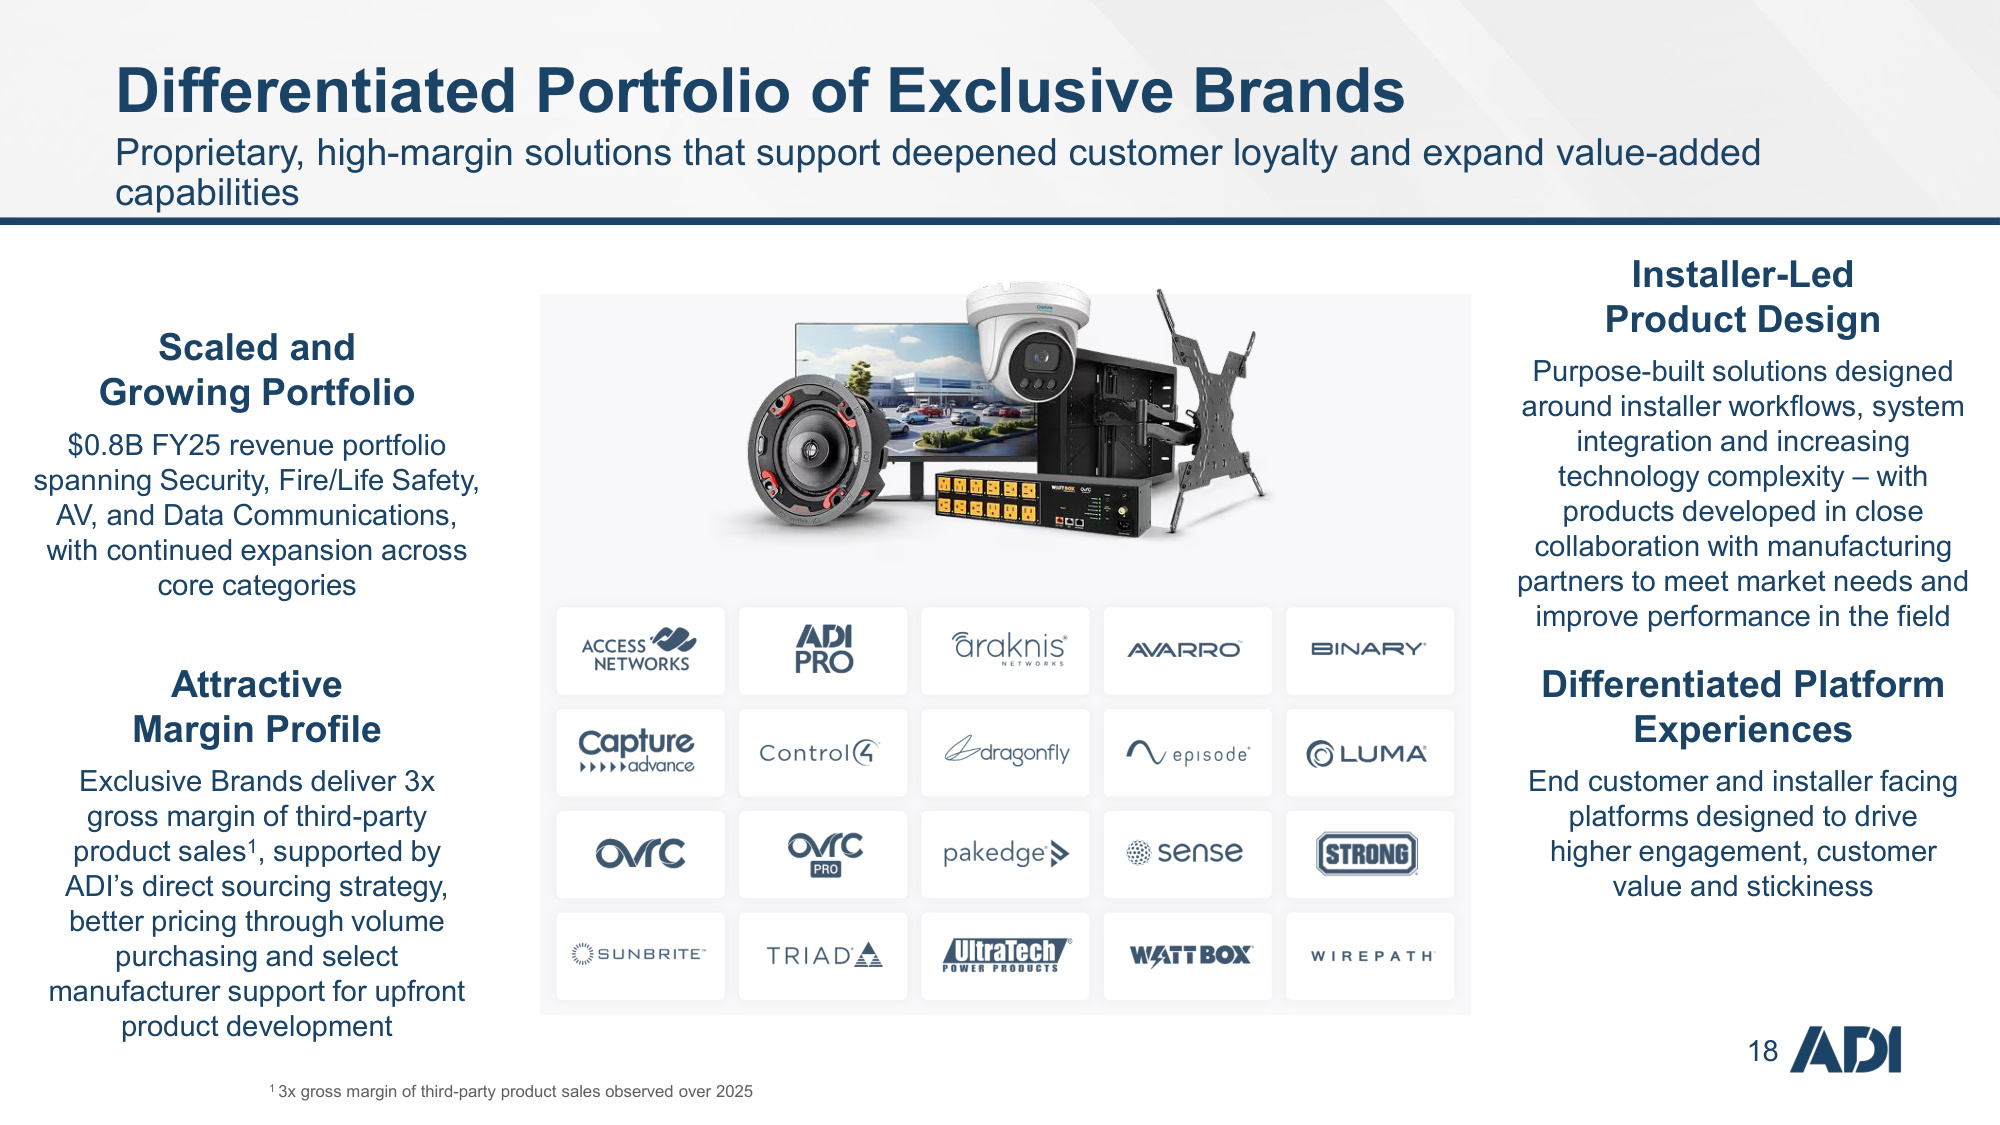
18 Differentiated Portfolio of Exclusive Brands Proprietary, high-margin solutions that support deepened customer loyalty and expand value-added capabilities Installer-Led Product Design Purpose-built solutions designed around installer workflows, system integration and increasing technology complexity – with products developed in close collaboration with manufacturing partners to meet market needs and improve performance in the field Differentiated Platform Experiences End customer and installer facing platforms designed to drive higher engagement, customer value and stickiness Attractive Margin Profile Exclusive Brands deliver 3x gross margin of third-party product sales1, supported by ADI's direct sourcing strategy, better pricing through volume purchasing and select manufacturer support for upfront product development Scaled and Growing Portfolio $0.8B FY25 revenue portfolio spanning Security, Fire/Life Safety, AV, and Data Communications, with continued expansion across core categories 1 3x gross margin of third-party product sales observed over 2025
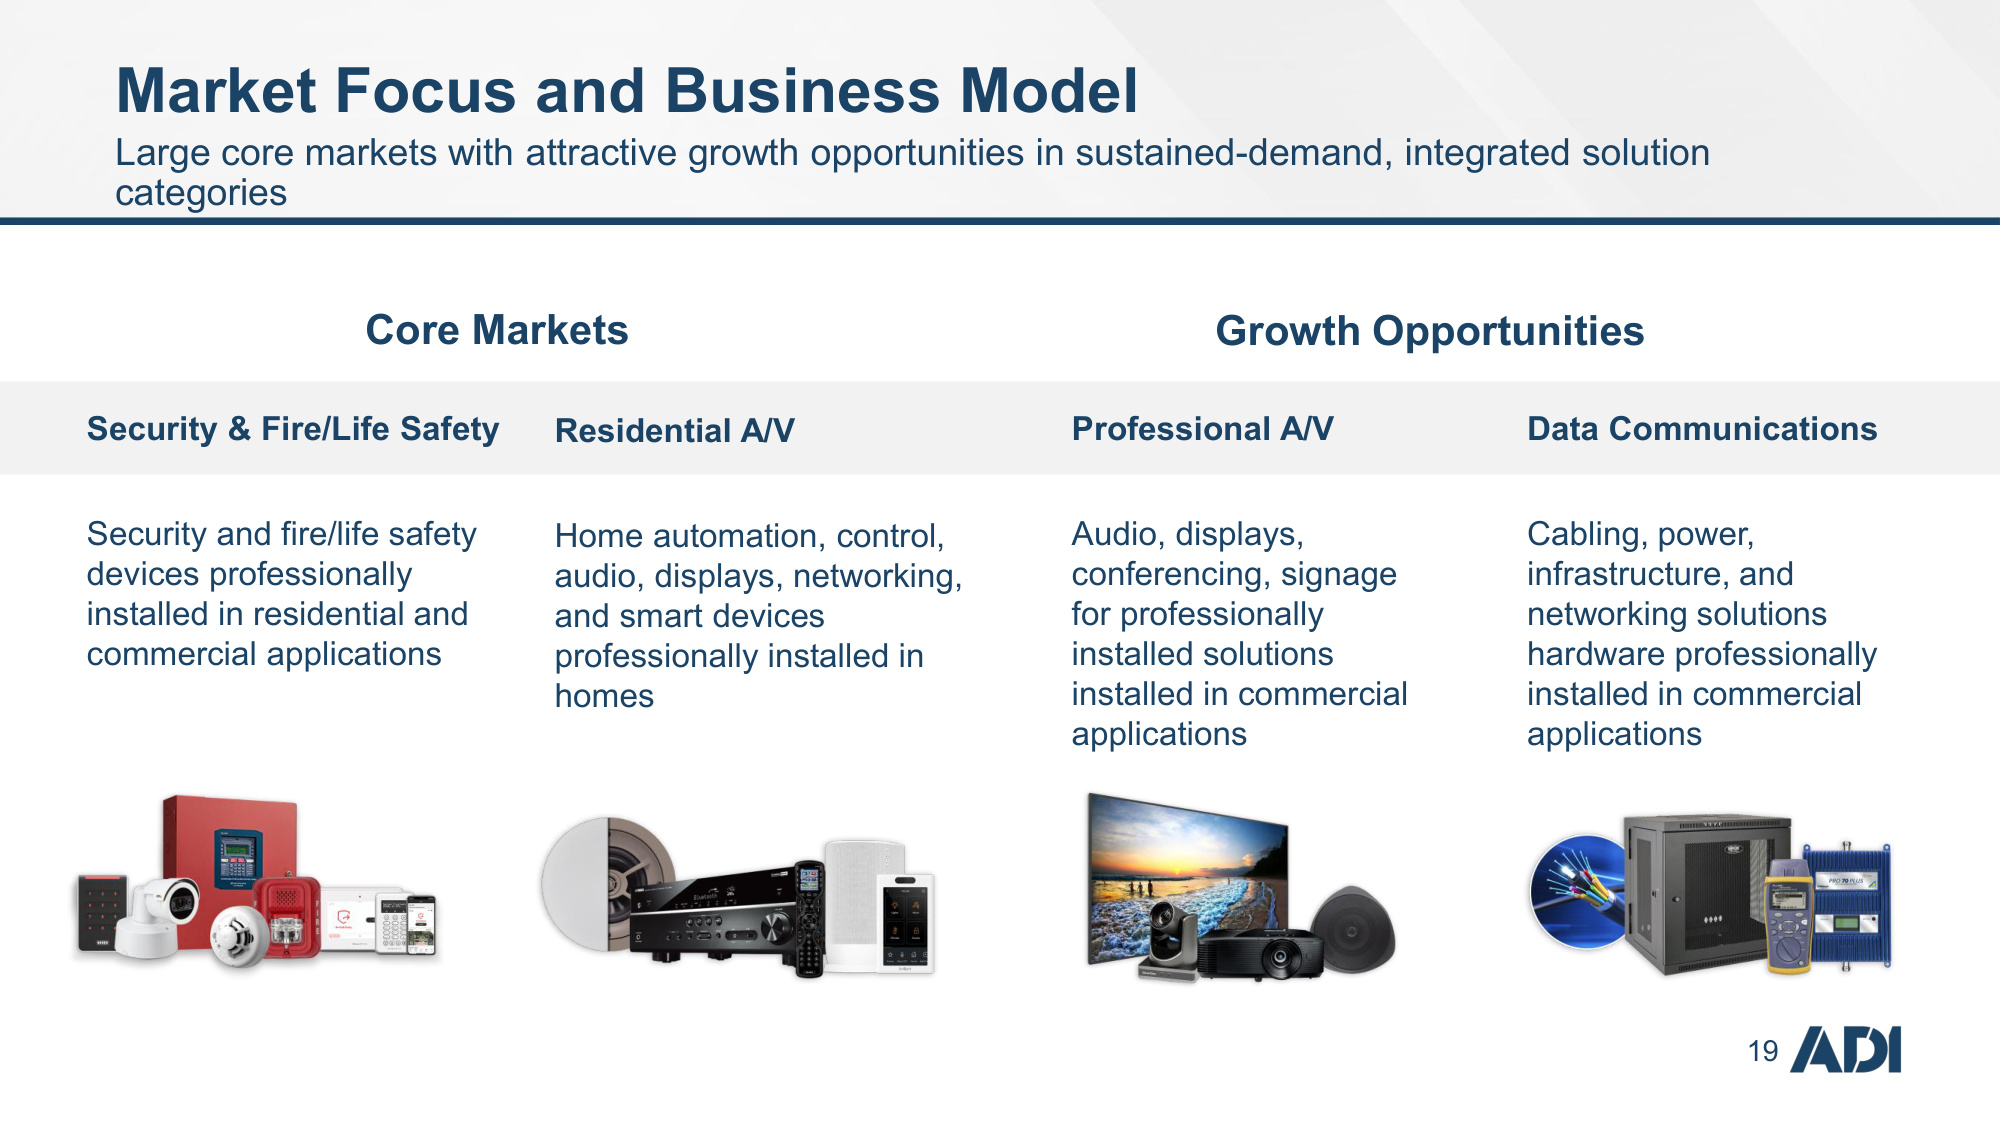
19 Market Focus and Business Model Large core markets with attractive growth opportunities in sustained-demand, integrated solution categories Core Markets Growth Opportunities Residential A/V Home automation, control, audio, displays, networking, and smart devices professionally installed in homes Professional A/V Audio, displays, conferencing, signage for professionally installed solutions installed in commercial applications Data Communications Cabling, power, infrastructure, and networking solutions hardware professionally installed in commercial applications Security & Fire/Life Safety Security and fire/life safety devices professionally installed in residential and commercial applications
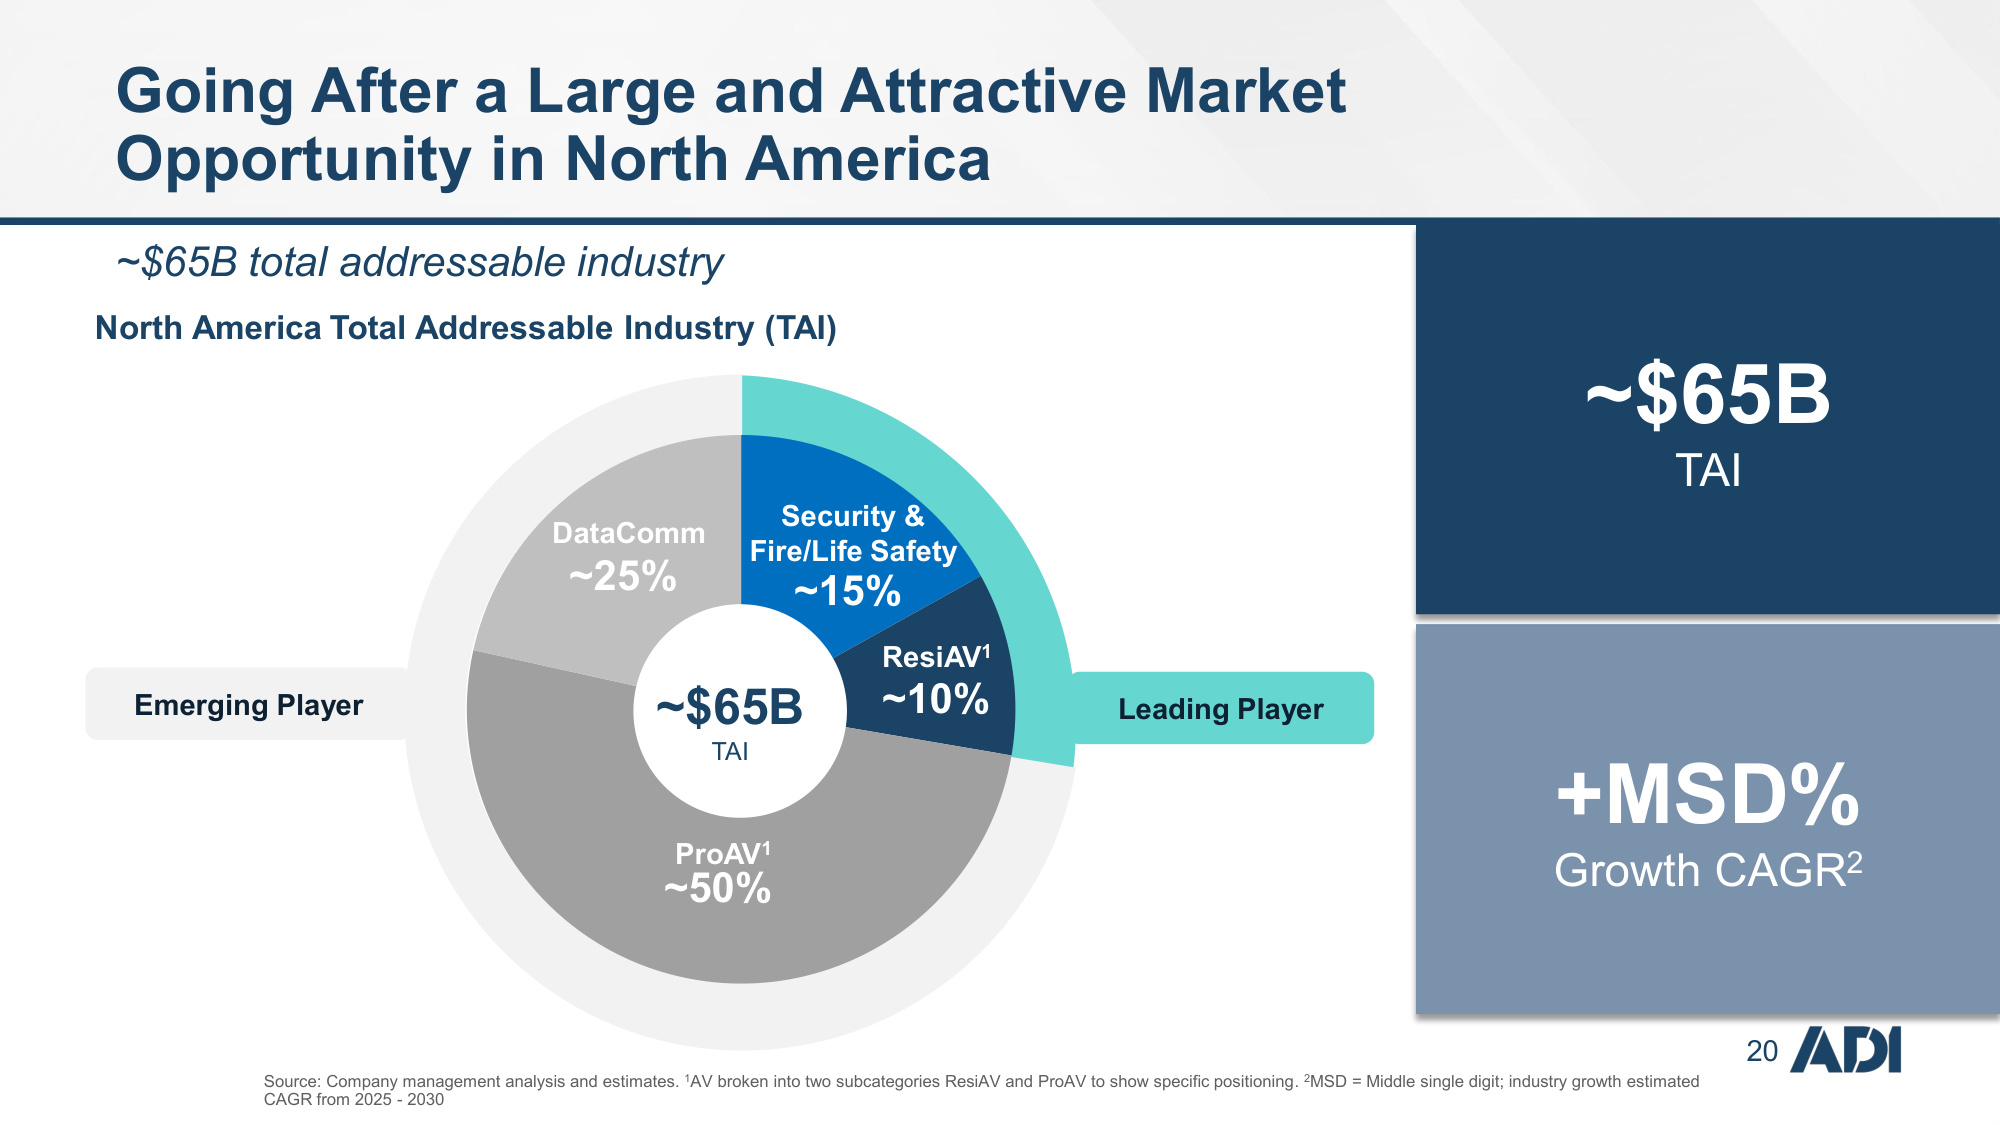
20 Going After a Large and Attractive Market Opportunity in North America +MSD% Growth CAGR2 ~$65B TAI Source: Company management analysis and estimates. 1AV broken into two subcategories ResiAV and ProAV to show specific positioning. 2MSD = Middle single digit; industry growth estimated CAGR from 2025 - 2030 ~$65B total addressable industry Emerging Player North America Total Addressable Industry (TAI) ~15% ~10% ~50% ~25% Leading Player ~$65B TAI ProAV1 DataComm Security & Fire/Life Safety ResiAV1
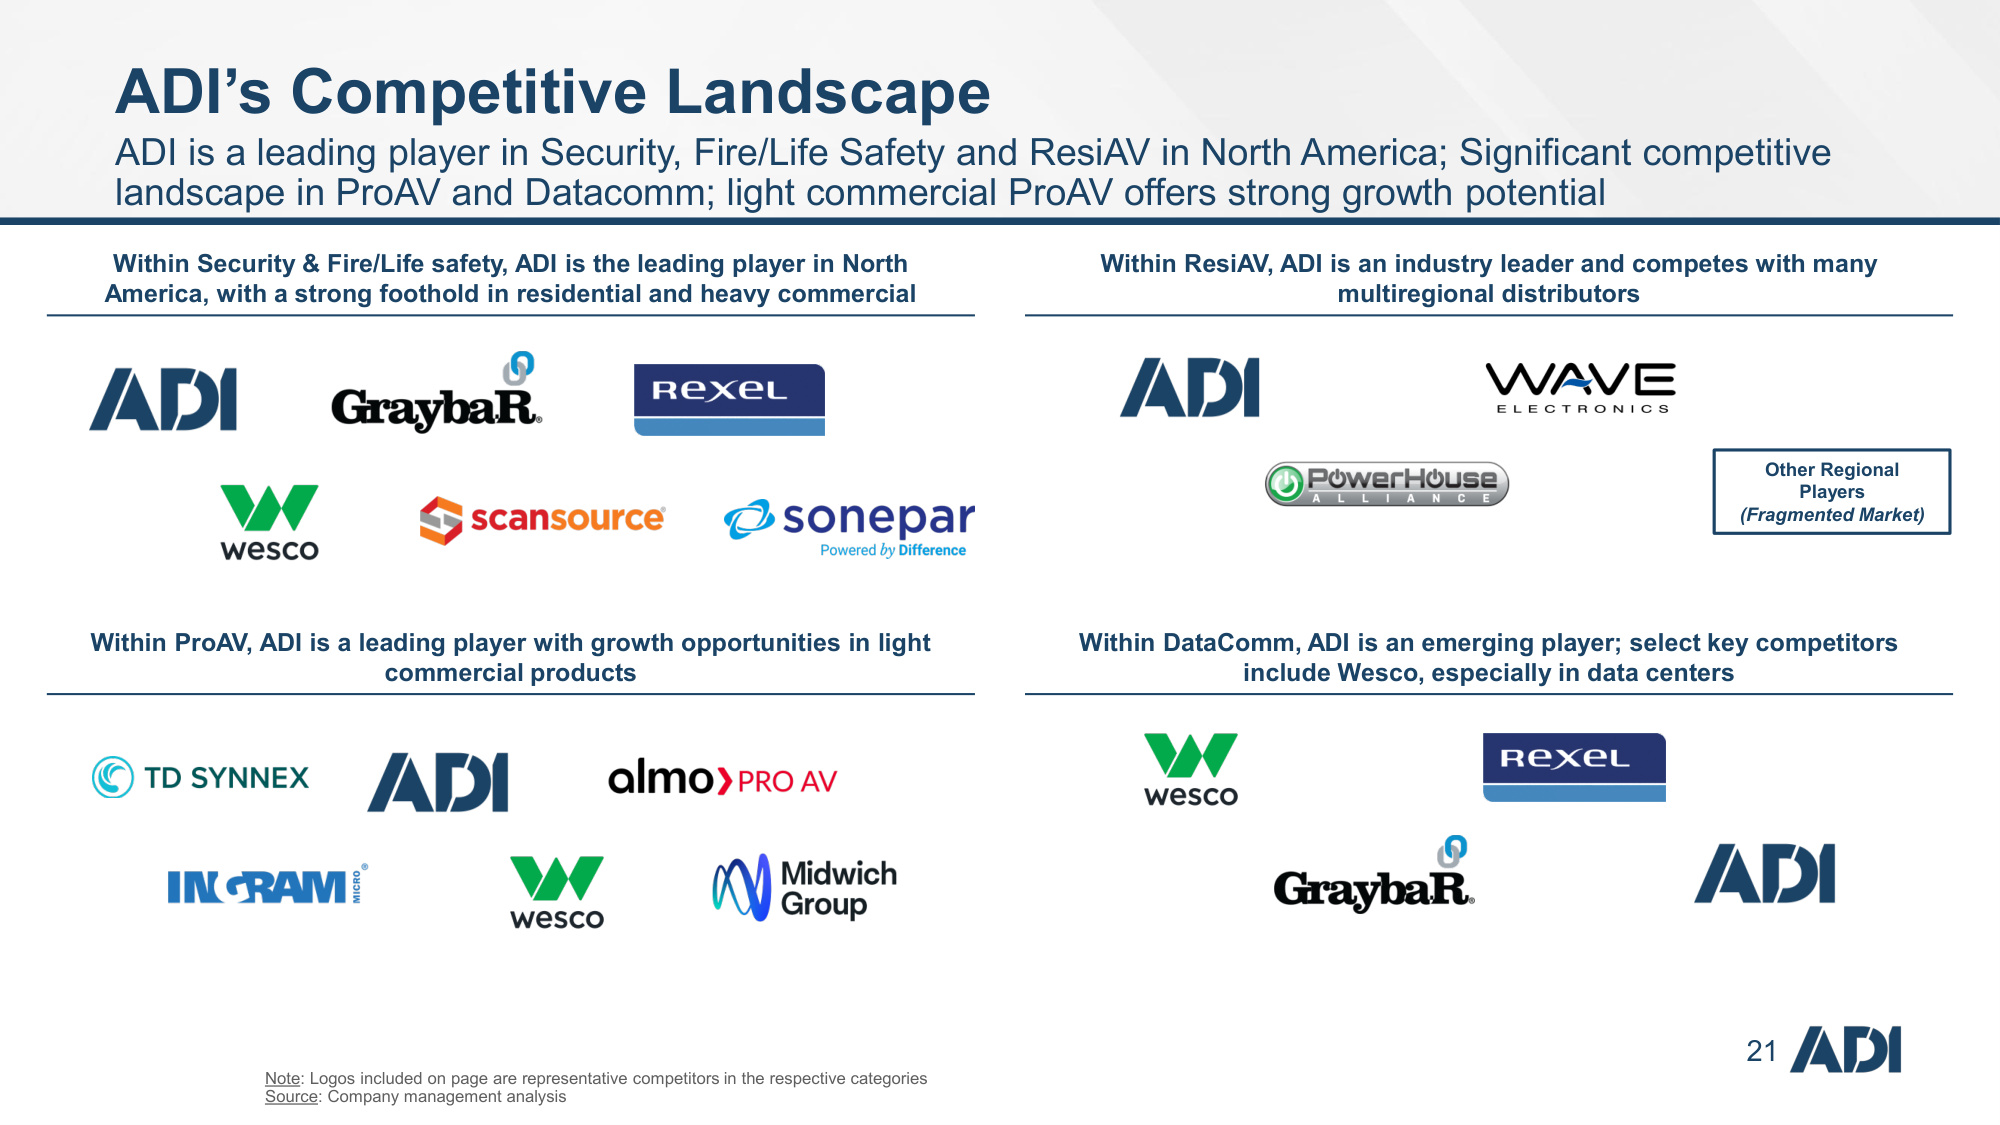
21 Within Security & Fire/Life safety, ADI is the leading player in North America, with a strong foothold in residential and heavy commercial Within ResiAV, ADI is an industry leader and competes with many multiregional distributors Within ProAV, ADI is a leading player with growth opportunities in light commercial products Within DataComm, ADI is an emerging player; select key competitors include Wesco, especially in data centers ADI's Competitive Landscape ADI is a leading player in Security, Fire/Life Safety and ResiAV in North America; Significant competitive landscape in ProAV and Datacomm; light commercial ProAV offers strong growth potential Other Regional Players (Fragmented Market) Note: Logos included on page are representative competitors in the respective categories Source: Company management analysis
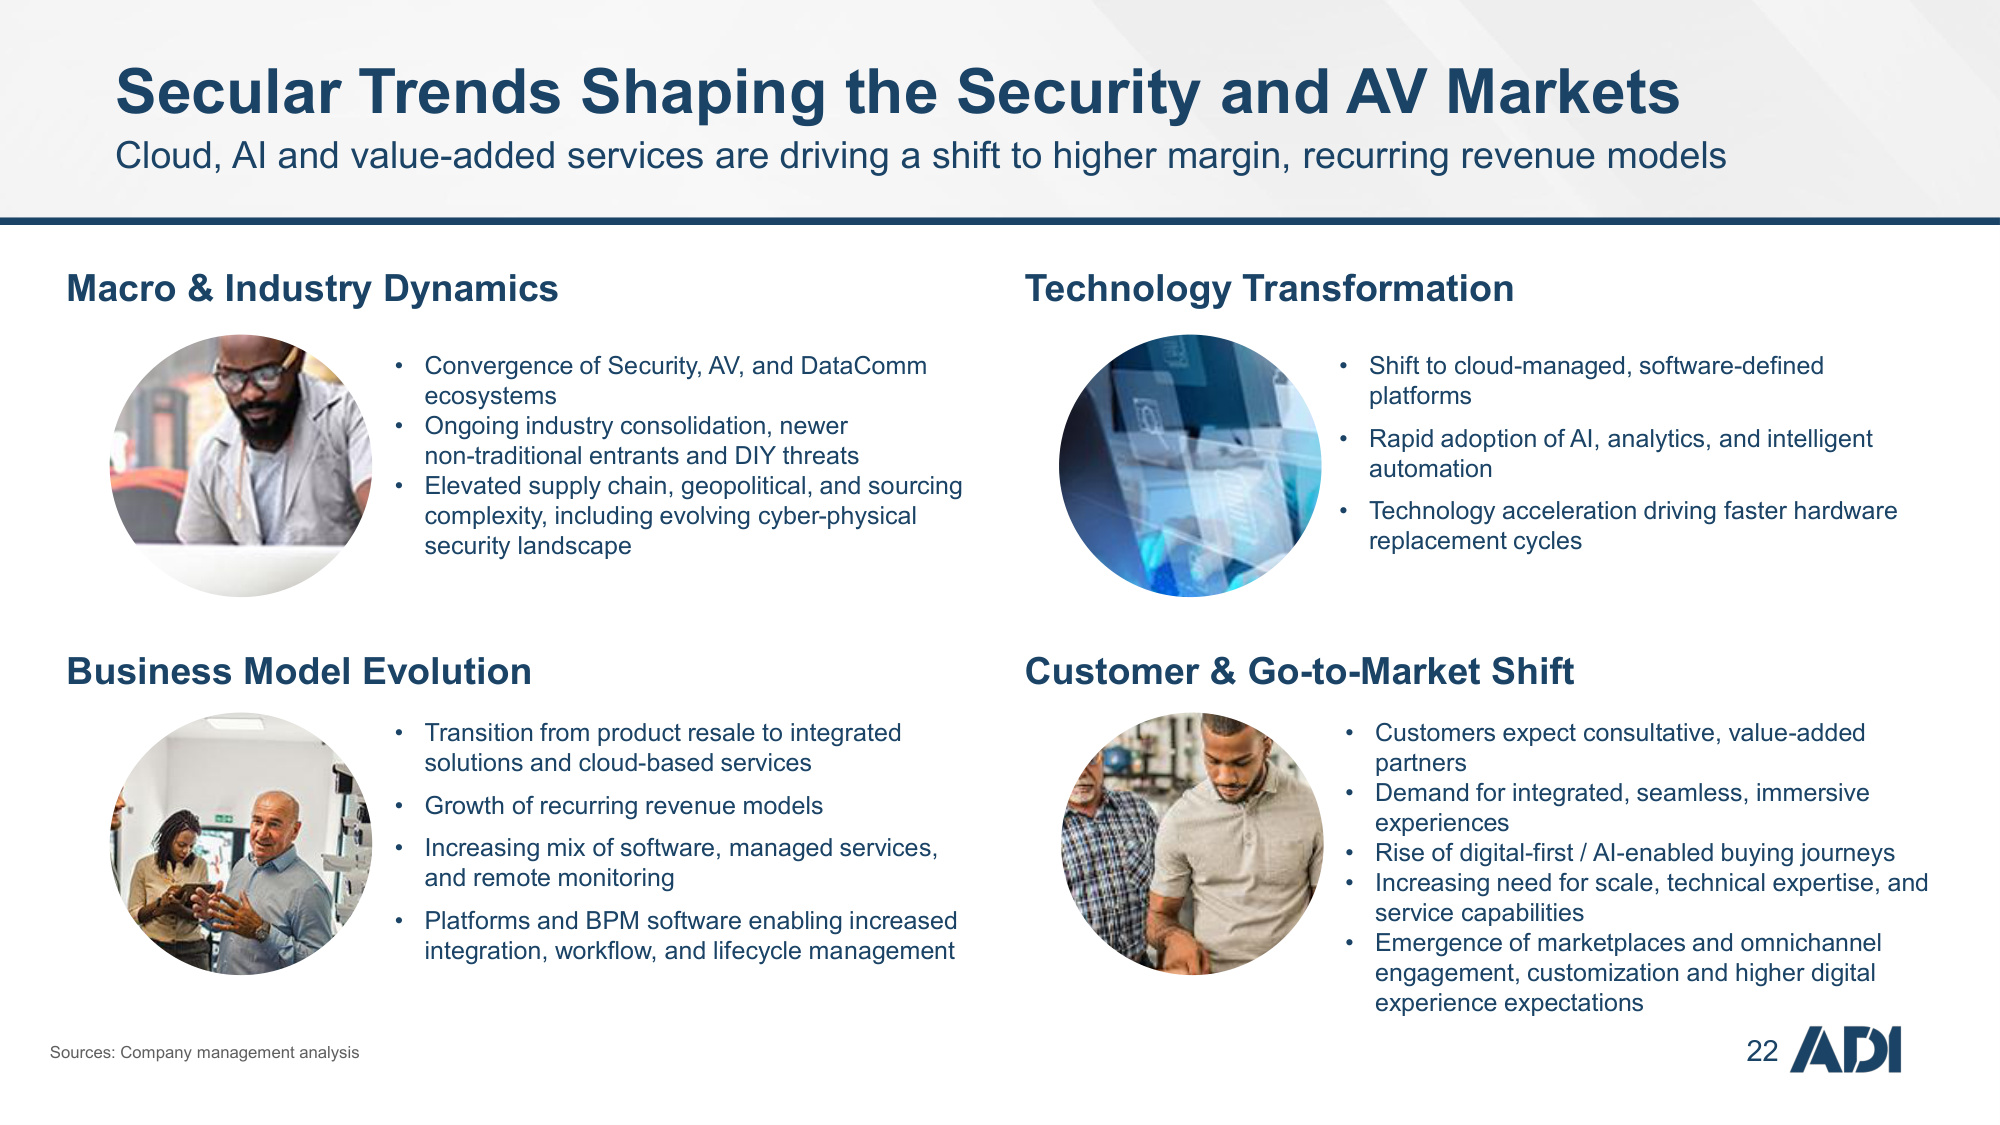
22 Secular Trends Shaping the Security and AV Markets Cloud, AI and value-added services are driving a shift to higher margin, recurring revenue models • Transition from product resale to integrated solutions and cloud-based services • Growth of recurring revenue models • Increasing mix of software, managed services, and remote monitoring • Platforms and BPM software enabling increased integration, workflow, and lifecycle management Business Model Evolution • Convergence of Security, AV, and DataComm ecosystems • Ongoing industry consolidation, newer non-traditional entrants and DIY threats • Elevated supply chain, geopolitical, and sourcing complexity, including evolving cyber-physical security landscape Macro & Industry Dynamics Technology Transformation Customer & Go-to-Market Shift • Shift to cloud-managed, software-defined platforms • Rapid adoption of AI, analytics, and intelligent automation • Technology acceleration driving faster hardware replacement cycles • Customers expect consultative, value-added partners • Demand for integrated, seamless, immersive experiences • Rise of digital-first / AI-enabled buying journeys • Increasing need for scale, technical expertise, and service capabilities • Emergence of marketplaces and omnichannel engagement, customization and higher digital experience expectations Sources: Company management analysis
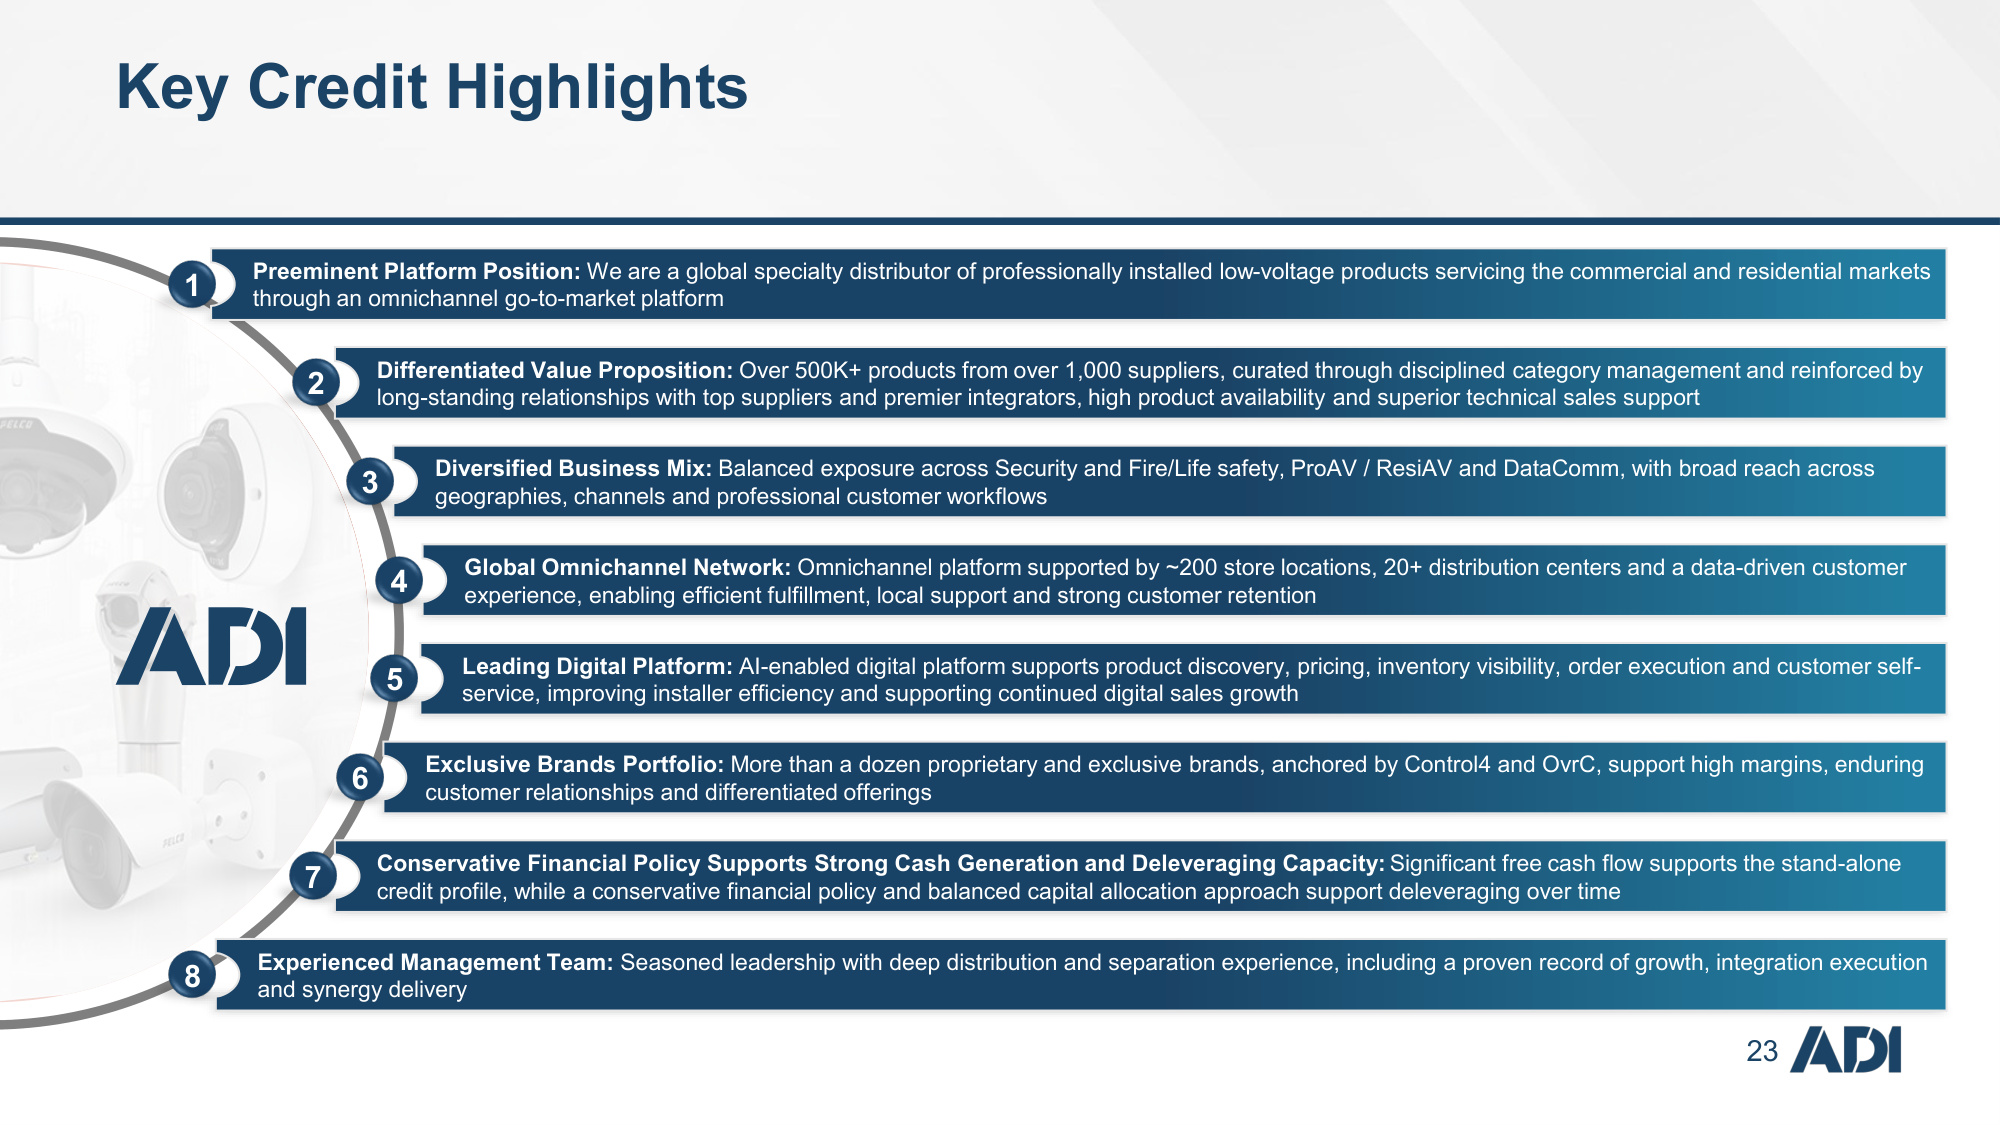
23 Key Credit Highlights 5 2 3 4 7 8 1 Preeminent Platform Position: We are a global specialty distributor of professionally installed low-voltage products servicing the commercial and residential markets through an omnichannel go-to-market platform Differentiated Value Proposition: Over 500K+ products from over 1,000 suppliers, curated through disciplined category management and reinforced by long-standing relationships with top suppliers and premier integrators, high product availability and superior technical sales support Diversified Business Mix: Balanced exposure across Security and Fire/Life safety, ProAV / ResiAV and DataComm, with broad reach across geographies, channels and professional customer workflows Global Omnichannel Network: Omnichannel platform supported by ~200 store locations, 20+ distribution centers and a data-driven customer experience, enabling efficient fulfillment, local support and strong customer retention Conservative Financial Policy Supports Strong Cash Generation and Deleveraging Capacity: Significant free cash flow supports the stand-alone credit profile, while a conservative financial policy and balanced capital allocation approach support deleveraging over time Exclusive Brands Portfolio: More than a dozen proprietary and exclusive brands, anchored by Control4 and OvrC, support high margins, enduring customer relationships and differentiated offerings Experienced Management Team: Seasoned leadership with deep distribution and separation experience, including a proven record of growth, integration execution and synergy delivery Leading Digital Platform: AI-enabled digital platform supports product discovery, pricing, inventory visibility, order execution and customer self- service, improving installer efficiency and supporting continued digital sales growth 6

24 Financial Overview
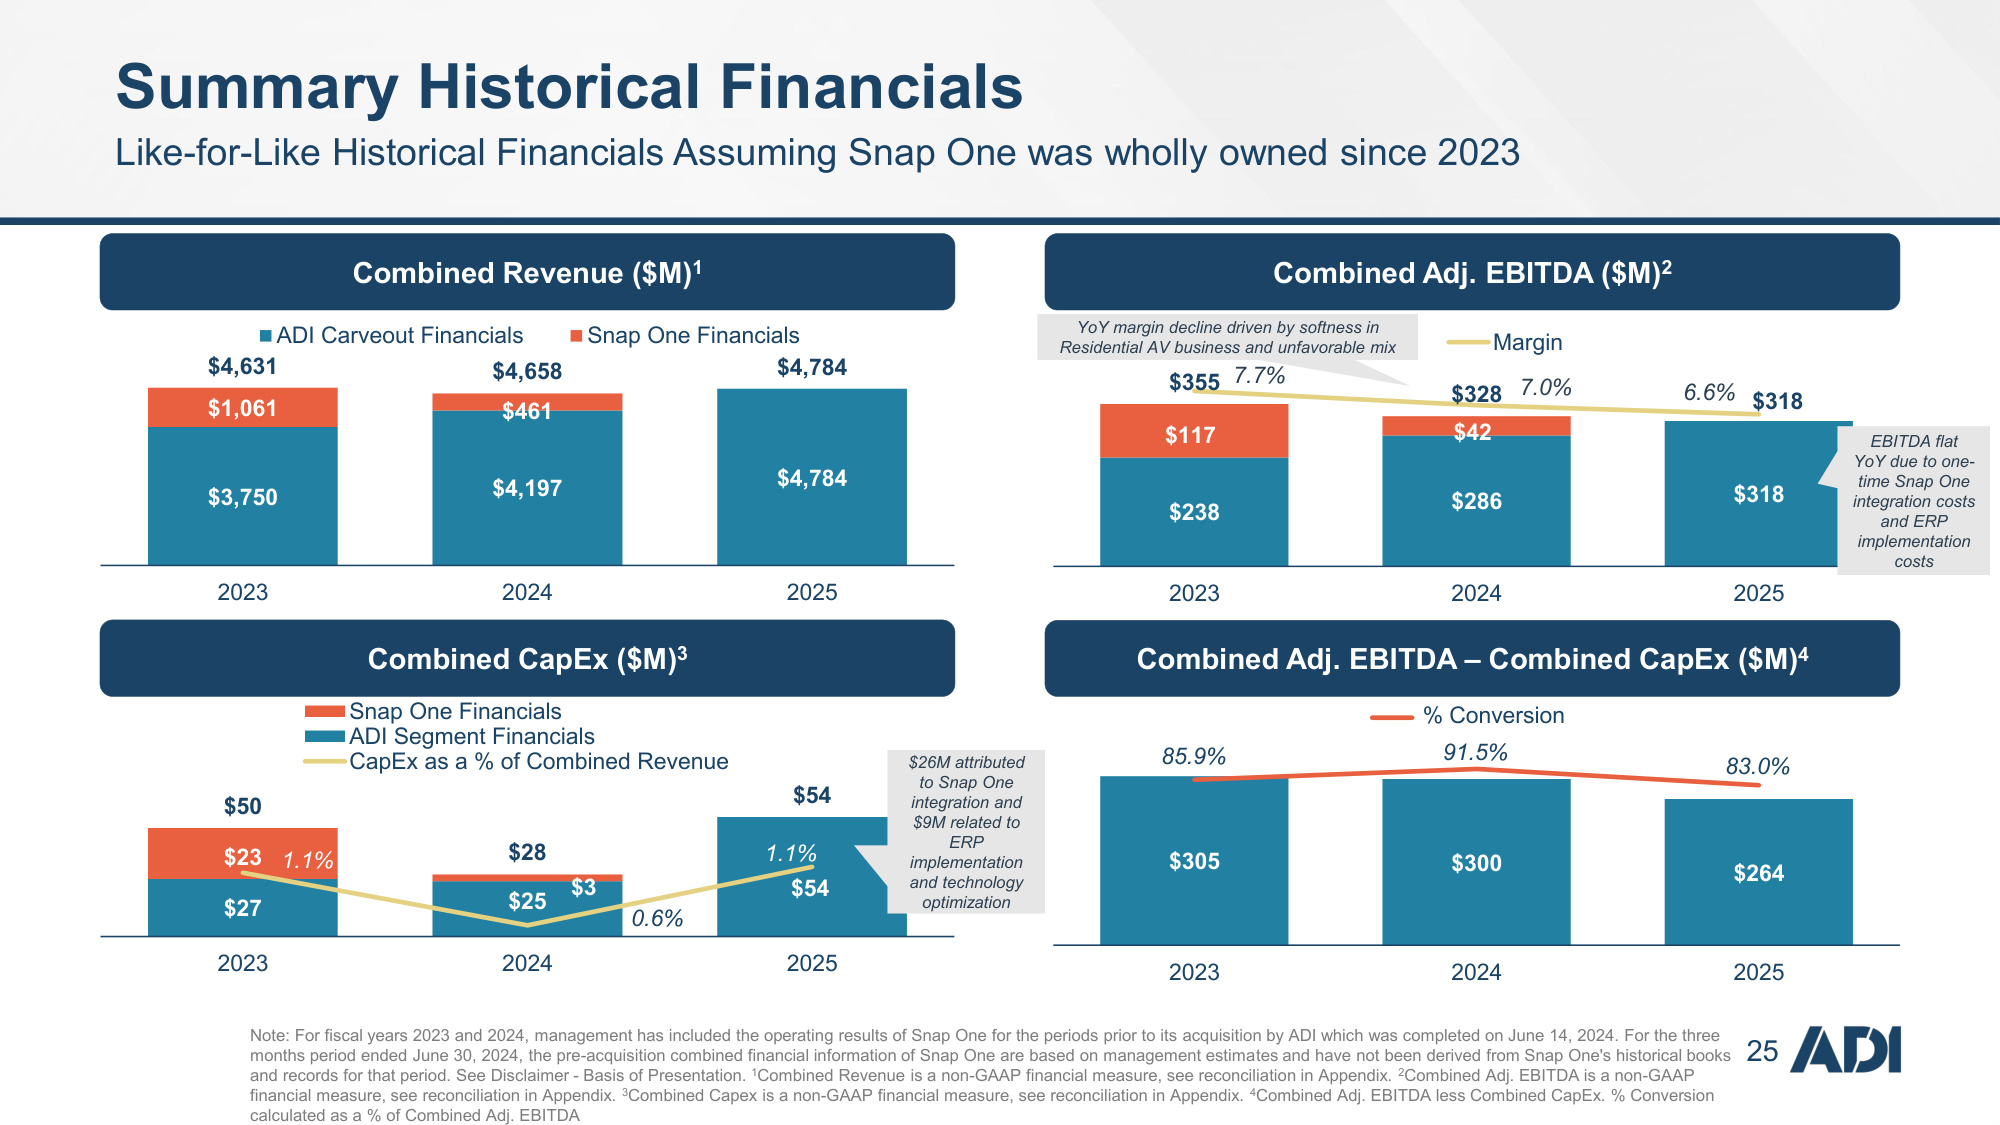
25 Summary Historical Financials Like-for-Like Historical Financials Assuming Snap One was wholly owned since 2023 Combined Revenue ($M)1 Combined Adj. EBITDA ($M)2 Combined Adj. EBITDA – Combined CapEx ($M)4 Combined CapEx ($M)3 $3,750 $4,197 $4,784 $1,061 $461 $4,631 $4,658 $4,784 2023 2024 2025 ADI Carveout Financials Snap One Financials $238 $286 $318 $117 $42 $355 $328 $318 7.7% 7.0% 6.6% 2023 2024 2025 Margin $27 $25 $54 $23 $3 $50 $28 $54 1.1% 0.6% 1.1% 2023 2024 2025 Snap One Financials ADI Segment Financials CapEx as a % of Combined Revenue $305 $300 $264 85.9% 91.5% 83.0% 2023 2024 2025 FCF Conversion EBITDA flat YoY due to one- time Snap One integration costs and ERP implementation costs $26M attributed to Snap One integration and $9M related to ERP implementation and technology optimization YoY margin decline driven by softness in Residential AV business and unfavorable mix Note: For fiscal years 2023 and 2024, management has included the operating results of Snap One for the periods prior to its acquisition by ADI which was completed on June 14, 2024. For the three months period ended June 30, 2024, the pre-acquisition combined financial information of Snap One are based on management estimates and have not been derived from Snap One's historical books and records for that period. See Disclaimer - Basis of Presentation. 1Combined Revenue is a non-GAAP financial measure, see reconciliation in Appendix. 2Combined Adj. EBITDA is a non-GAAP financial measure, see reconciliation in Appendix. 3Combined Capex is a non-GAAP financial measure, see reconciliation in Appendix. 4Combined Adj. EBITDA less Combined CapEx. % Conversion calculated as a % of Combined Adj. EBITDA % Conversion
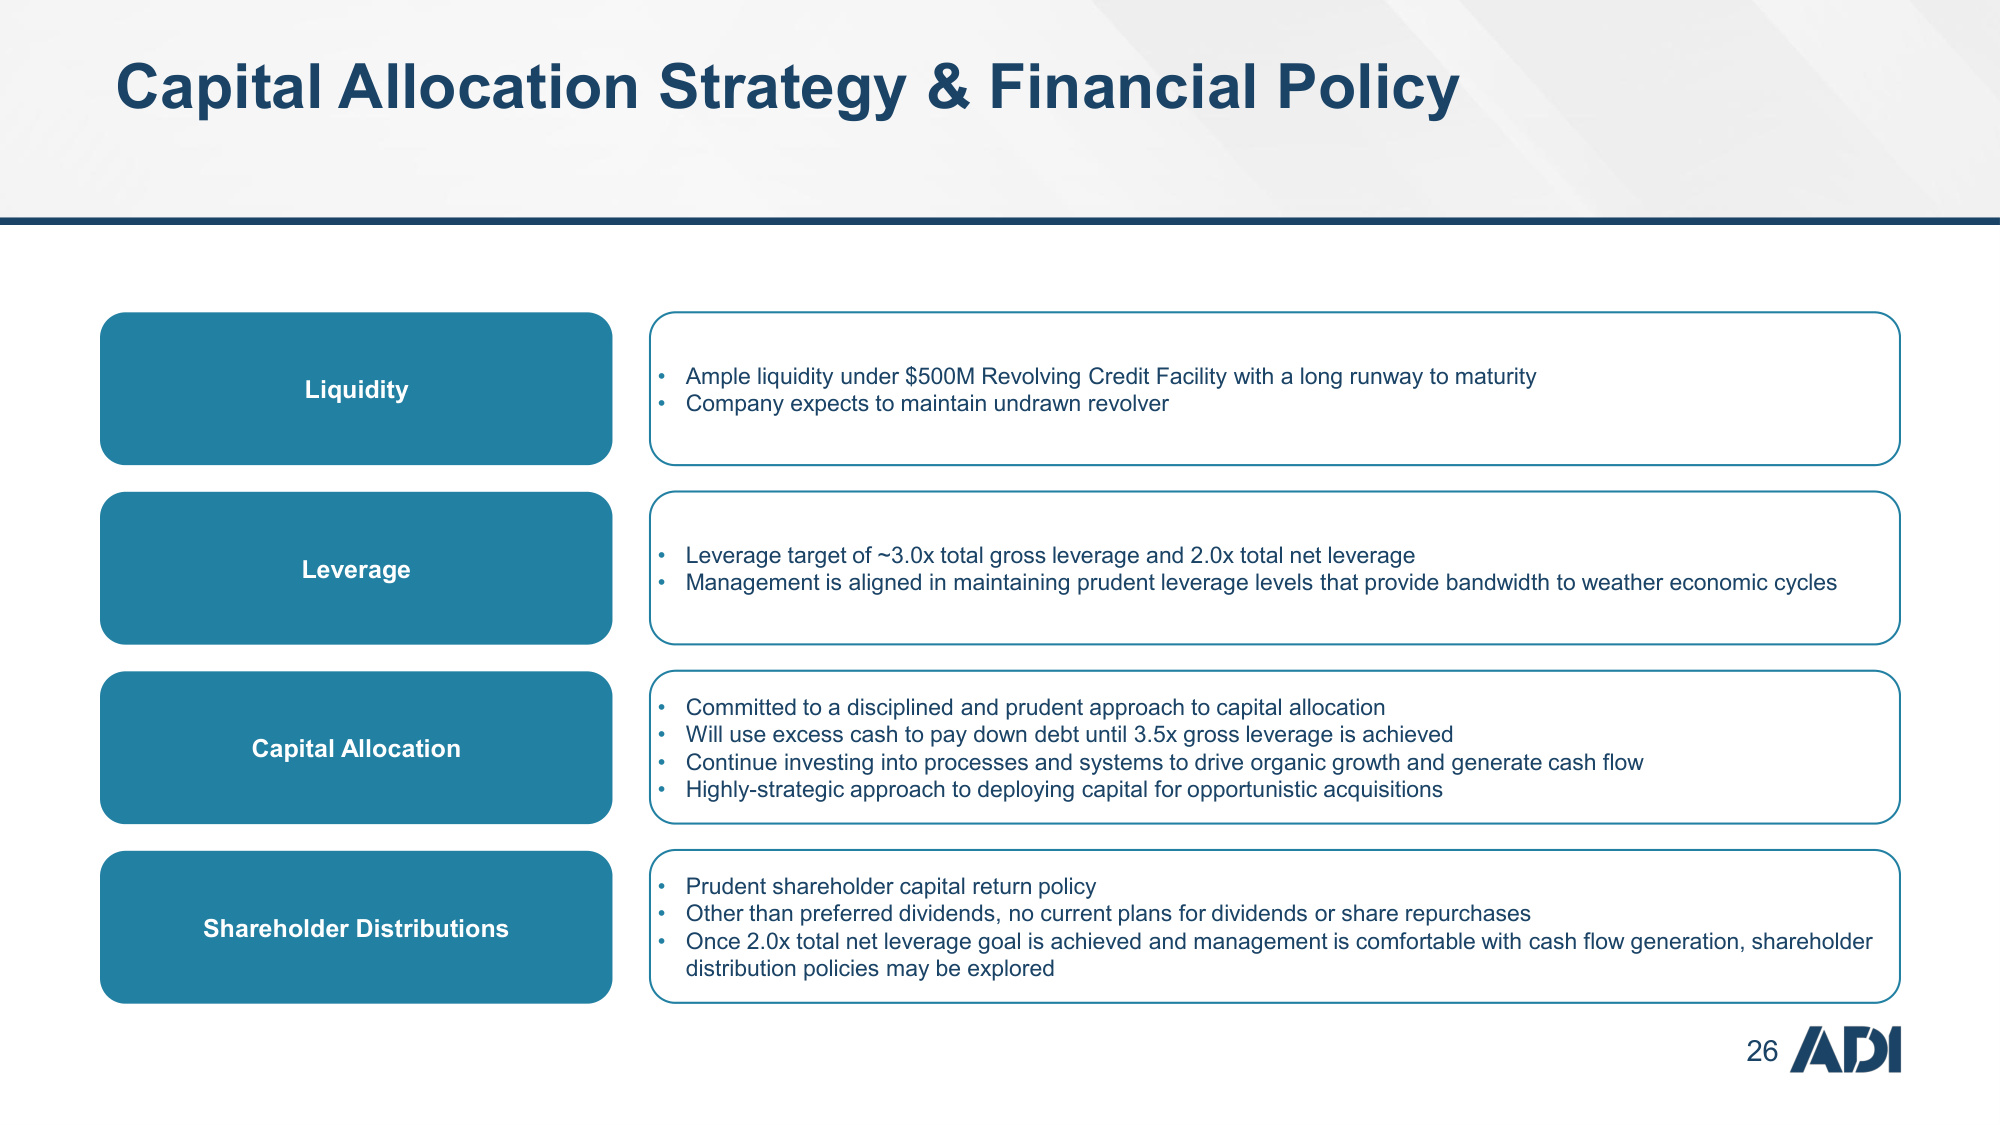
26 Capital Allocation Strategy & Financial Policy Leverage Capital Allocation Shareholder Distributions • Leverage target of ~3.0x total gross leverage and 2.0x total net leverage • Management is aligned in maintaining prudent leverage levels that provide bandwidth to weather economic cycles • Committed to a disciplined and prudent approach to capital allocation • Will use excess cash to pay down debt until 3.5x gross leverage is achieved • Continue investing into processes and systems to drive organic growth and generate cash flow • Highly-strategic approach to deploying capital for opportunistic acquisitions • Prudent shareholder capital return policy • Other than preferred dividends, no current plans for dividends or share repurchases • Once 2.0x total net leverage goal is achieved and management is comfortable with cash flow generation, shareholder distribution policies may be explored Liquidity • Ample liquidity under $500M Revolving Credit Facility with a long runway to maturity • Company expects to maintain undrawn revolver

27 Appendix
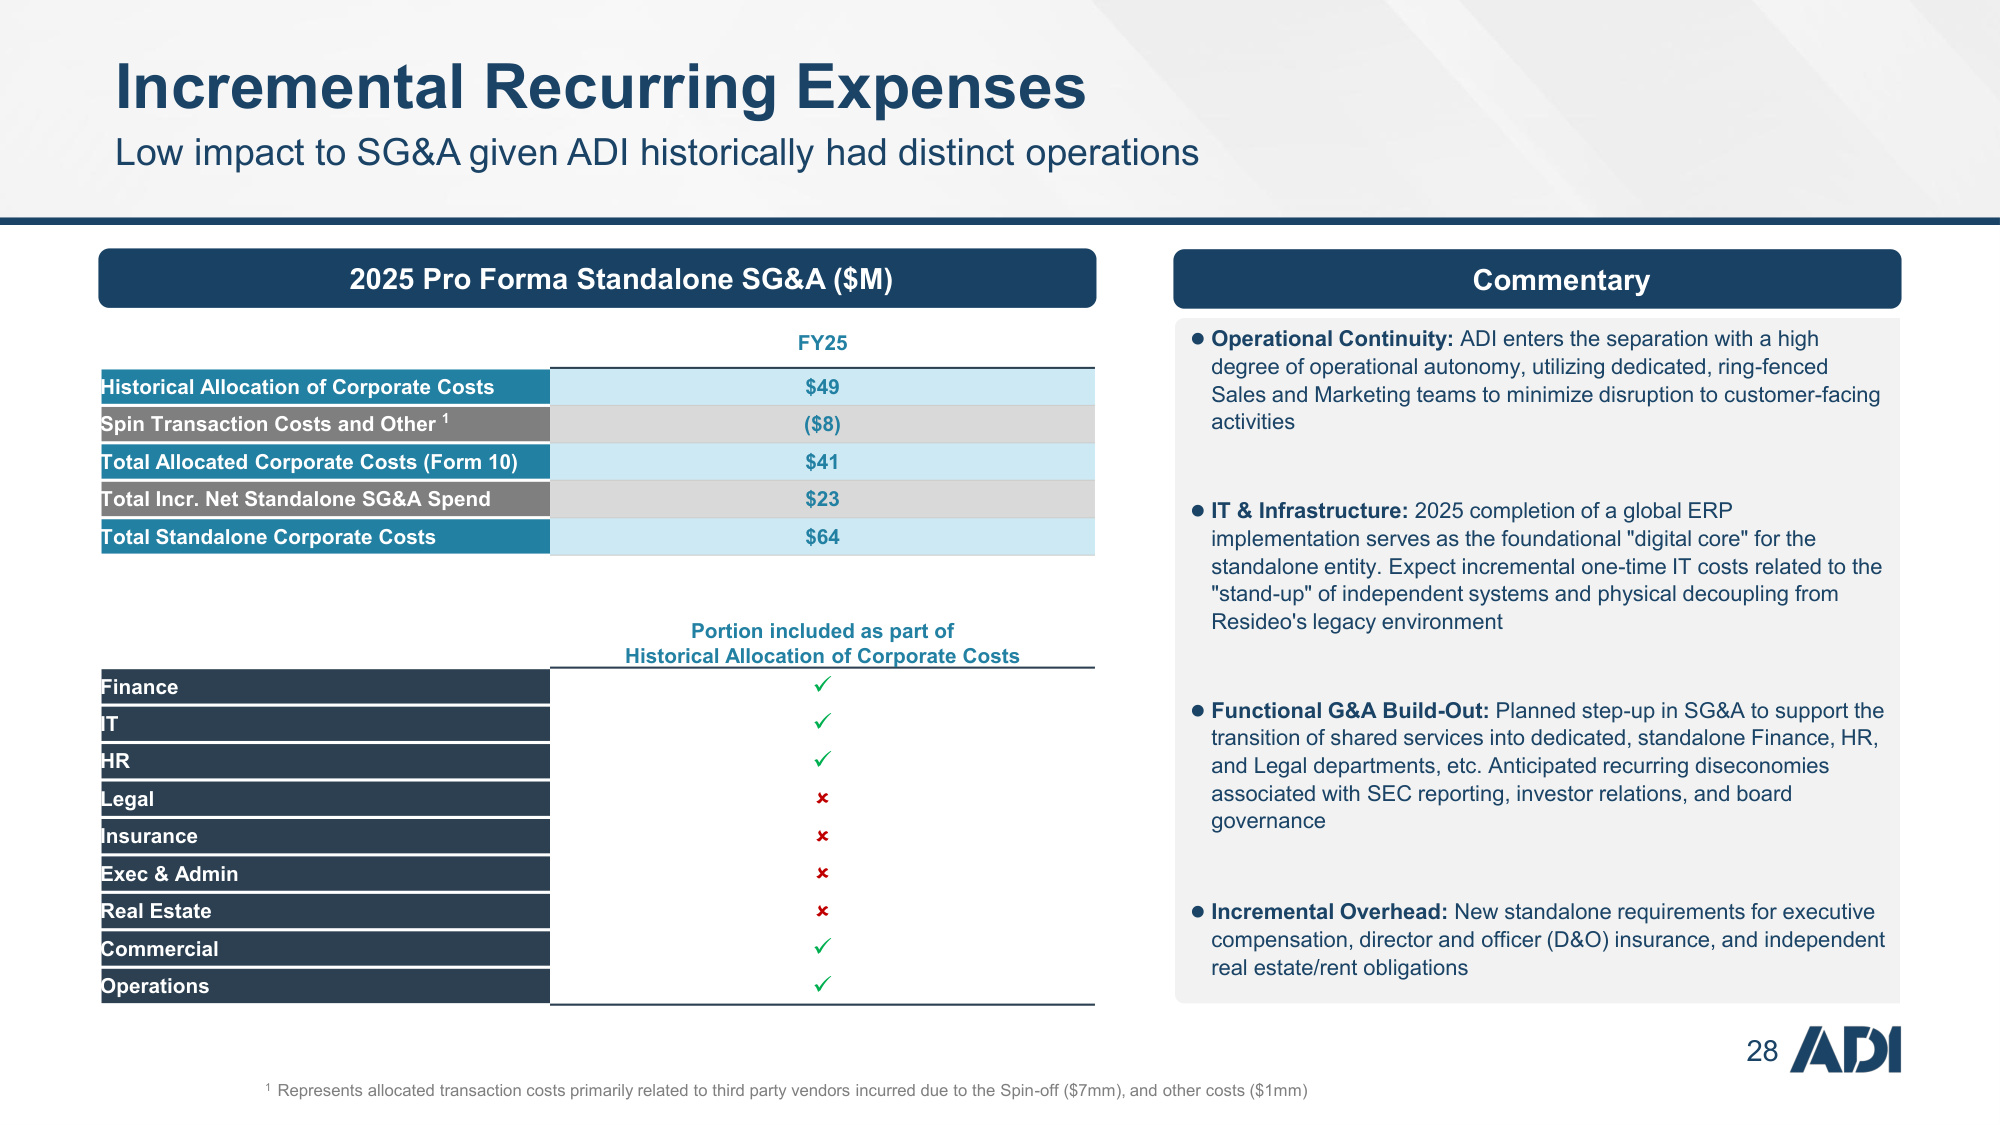
28 Commentary ⚫Operational Continuity: ADI enters the separation with a high degree of operational autonomy, utilizing dedicated, ring-fenced Sales and Marketing teams to minimize disruption to customer-facing activities ⚫IT & Infrastructure: 2025 completion of a global ERP implementation serves as the foundational "digital core" for the standalone entity. Expect incremental one-time IT costs related to the "stand-up" of independent systems and physical decoupling from Resideo's legacy environment ⚫Functional G&A Build-Out: Planned step-up in SG&A to support the transition of shared services into dedicated, standalone Finance, HR, and Legal departments, etc. Anticipated recurring diseconomies associated with SEC reporting, investor relations, and board governance ⚫Incremental Overhead: New standalone requirements for executive compensation, director and officer (D&O) insurance, and independent real estate/rent obligations Low impact to SG&A given ADI historically had distinct operations 2025 Pro Forma Standalone SG&A ($M) FY25 Historical Allocation of Corporate Costs $49 Spin Transaction Costs and Other 1 ($8) Total Allocated Corporate Costs (Form 10) $41 Total Incr. Net Standalone SG&A Spend $23 Total Standalone Corporate Costs $64 Portion included as part of Historical Allocation of Corporate Costs Finance ✓ IT ✓ HR ✓ Legal Insurance Exec & Admin Real Estate Commercial ✓ Operations ✓ Incremental Recurring Expenses 1 Represents allocated transaction costs primarily related to third party vendors incurred due to the Spin-off ($7mm), and other costs ($1mm)
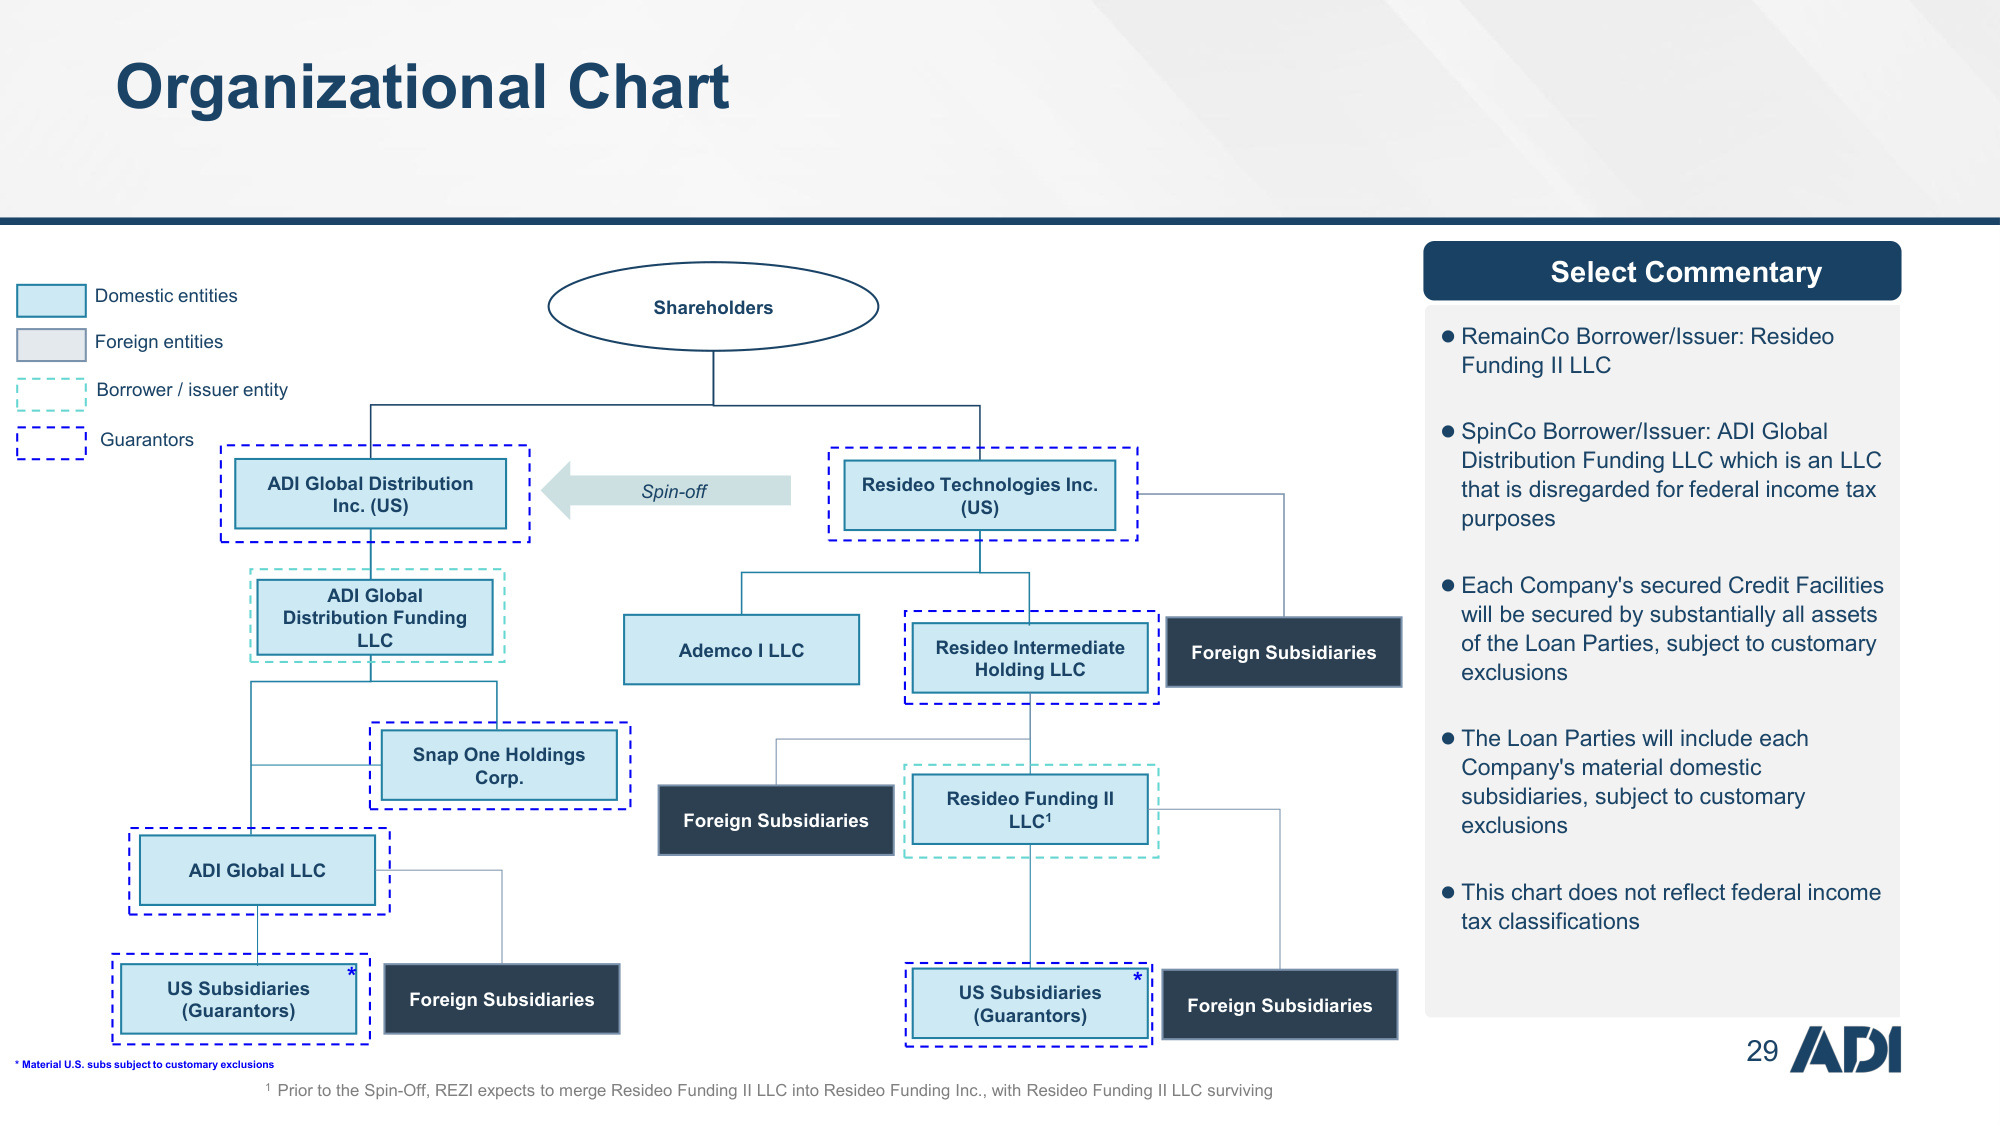
29 Organizational Chart Select Commentary ⚫RemainCo Borrower/Issuer: Resideo Funding II LLC ⚫SpinCo Borrower/Issuer: ADI Global Distribution Funding LLC which is an LLC that is disregarded for federal income tax purposes ⚫Each Company's secured Credit Facilities will be secured by substantially all assets of the Loan Parties, subject to customary exclusions ⚫The Loan Parties will include each Company's material domestic subsidiaries, subject to customary exclusions ⚫This chart does not reflect federal income tax classifications Shareholders Domestic entities Foreign entities Borrower / issuer entity ADI Global LLC US Subsidiaries (Guarantors) ADI Global Distribution Inc. (US) Snap One Holdings Corp. Resideo Technologies Inc. (US) Foreign Subsidiaries Spin-off Resideo Intermediate Holding LLC Ademco I LLC US Subsidiaries (Guarantors) Foreign Subsidiaries ADI Global Distribution Funding LLC Foreign Subsidiaries Resideo Funding II LLC1 Foreign Subsidiaries Guarantors * * * Material U.S. subs subject to customary exclusions 1 Prior to the Spin-Off, REZI expects to merge Resideo Funding II LLC into Resideo Funding Inc., with Resideo Funding II LLC surviving
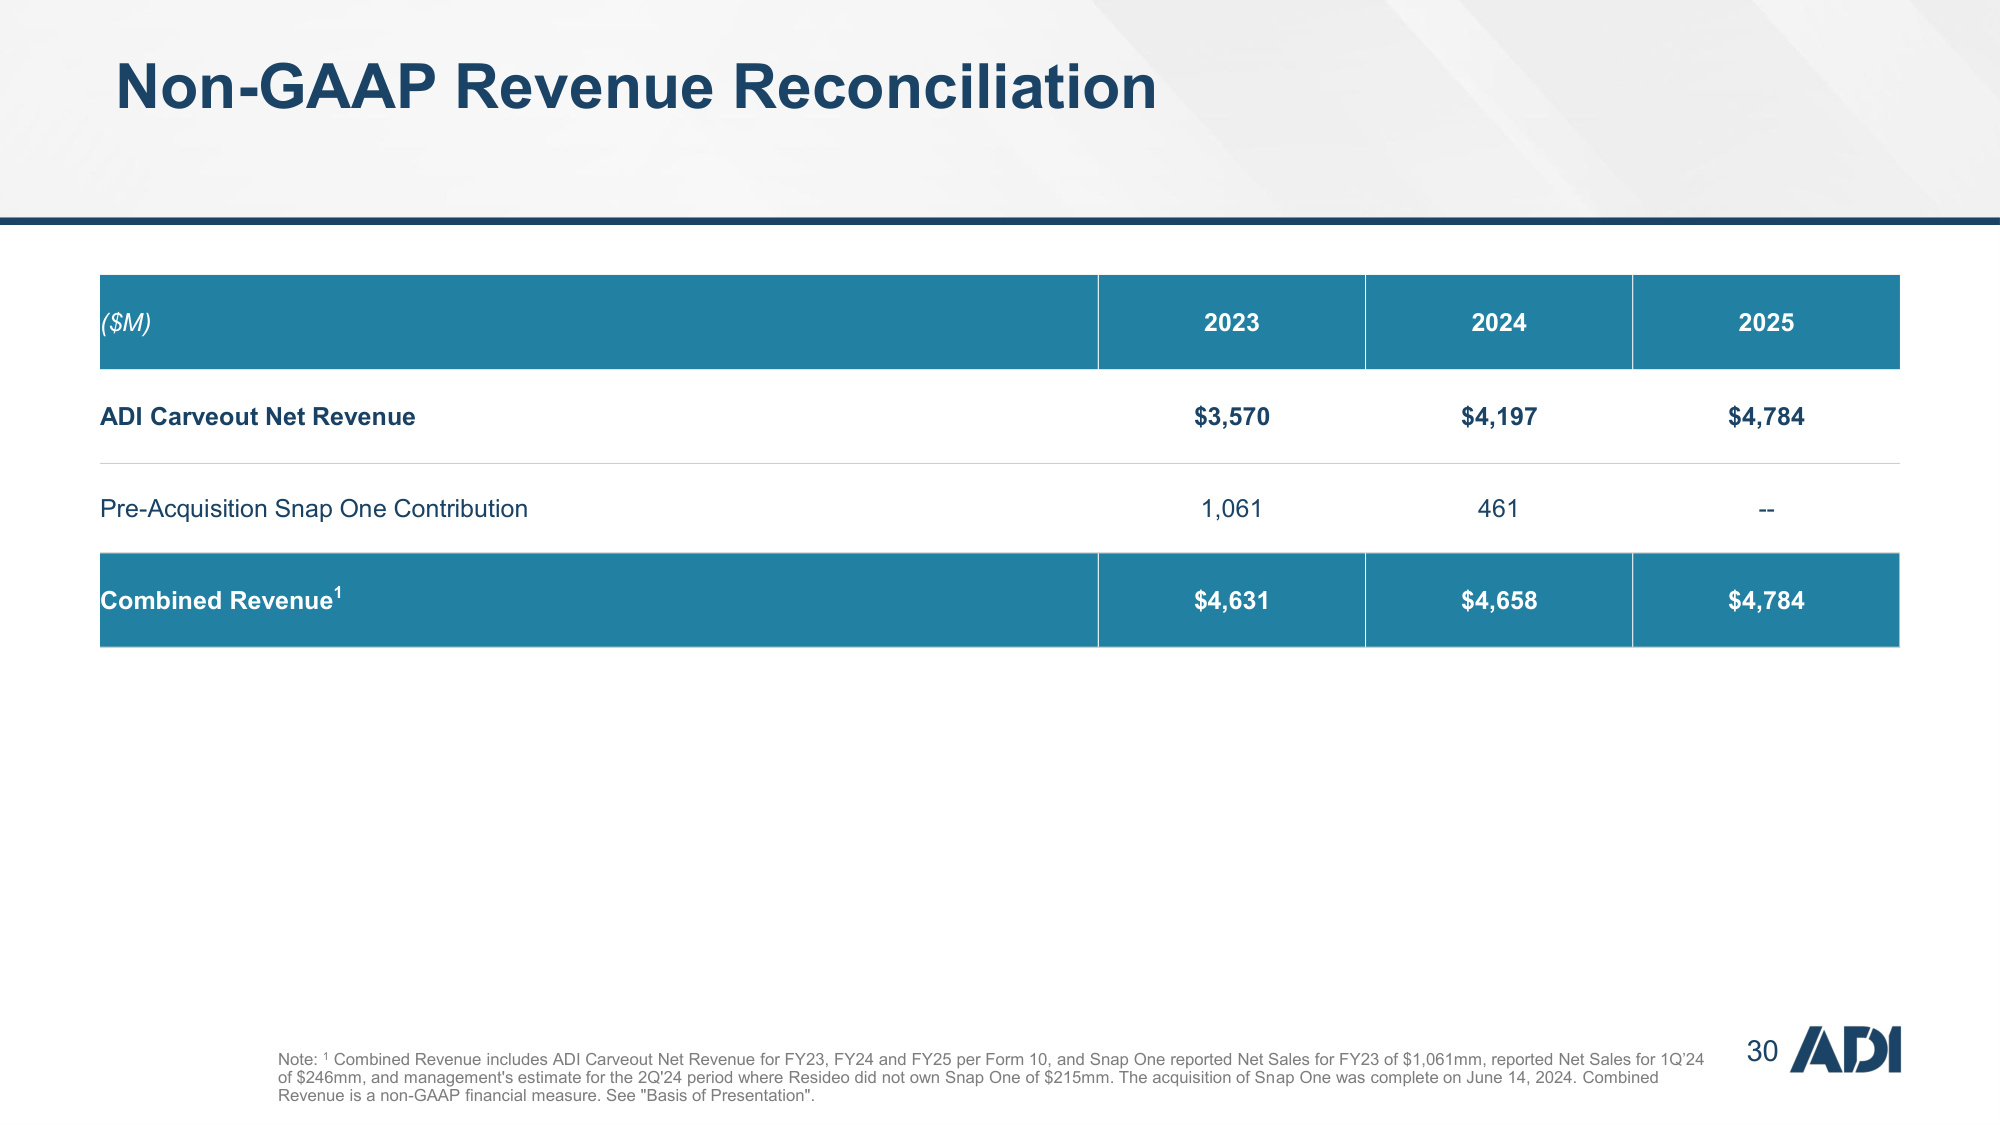
30 Non-GAAP Revenue Reconciliation Note: 1 Combined Revenue includes ADI Carveout Net Revenue for FY23, FY24 and FY25 per Form 10, and Snap One reported Net Sales for FY23 of $1,061mm, reported Net Sales for 1Q'24 of $246mm, and management's estimate for the 2Q'24 period where Resideo did not own Snap One of $215mm. The acquisition of Snap One was complete on June 14, 2024. Combined Revenue is a non-GAAP financial measure. See "Basis of Presentation". ($M) 2023 2024 2025 ADI Carveout Net Revenue $3,570 $4,197 $4,784 Pre-Acquisition Snap One Contribution 1,061 461 -- Combined Revenue1 $4,631 $4,658 $4,784
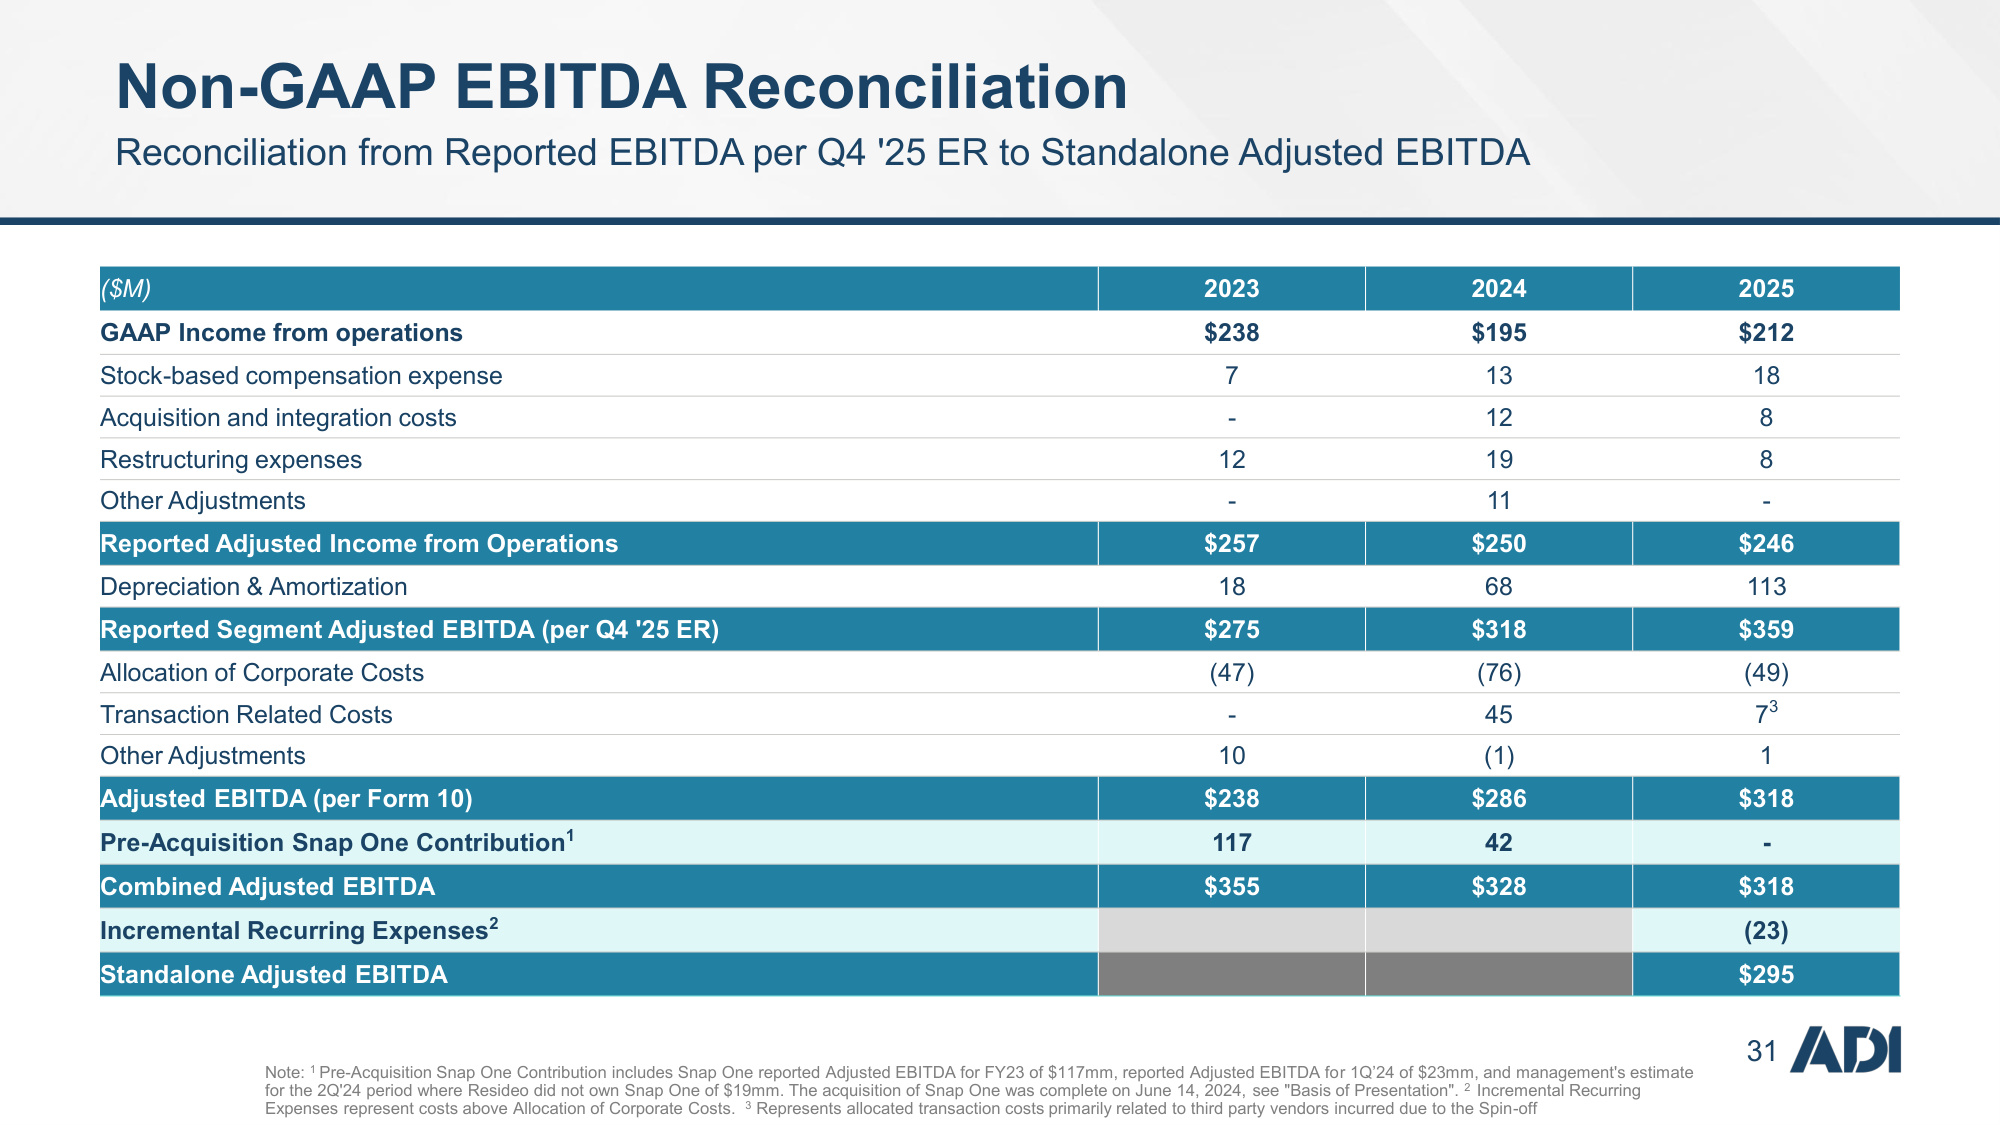
31 Non-GAAP EBITDA Reconciliation Reconciliation from Reported EBITDA per Q4 '25 ER to Standalone Adjusted EBITDA Note: 1 Pre-Acquisition Snap One Contribution includes Snap One reported Adjusted EBITDA for FY23 of $117mm, reported Adjusted EBITDA for 1Q'24 of $23mm, and management's estimate for the 2Q'24 period where Resideo did not own Snap One of $19mm. The acquisition of Snap One was complete on June 14, 2024, see "Basis of Presentation". 2 Incremental Recurring Expenses represent costs above Allocation of Corporate Costs. 3 Represents allocated transaction costs primarily related to third party vendors incurred due to the Spin-off ($M) 2023 2024 2025 GAAP Income from operations $238 $195 $212 Stock-based compensation expense 7 13 18 Acquisition and integration costs - 12 8 Restructuring expenses 12 19 8 Other Adjustments - 11 - Reported Adjusted Income from Operations $257 $250 $246 Depreciation & Amortization 18 68 113 Reported Segment Adjusted EBITDA (per Q4 '25 ER) $275 $318 $359 Allocation of Corporate Costs (47) (76) (49) Transaction Related Costs - 45 73 Other Adjustments 10 (1) 1 Adjusted EBITDA (per Form 10) $238 $286 $318 Pre-Acquisition Snap One Contribution1 117 42 - Combined Adjusted EBITDA $355 $328 $318 Incremental Recurring Expenses2 (23) Standalone Adjusted EBITDA $295
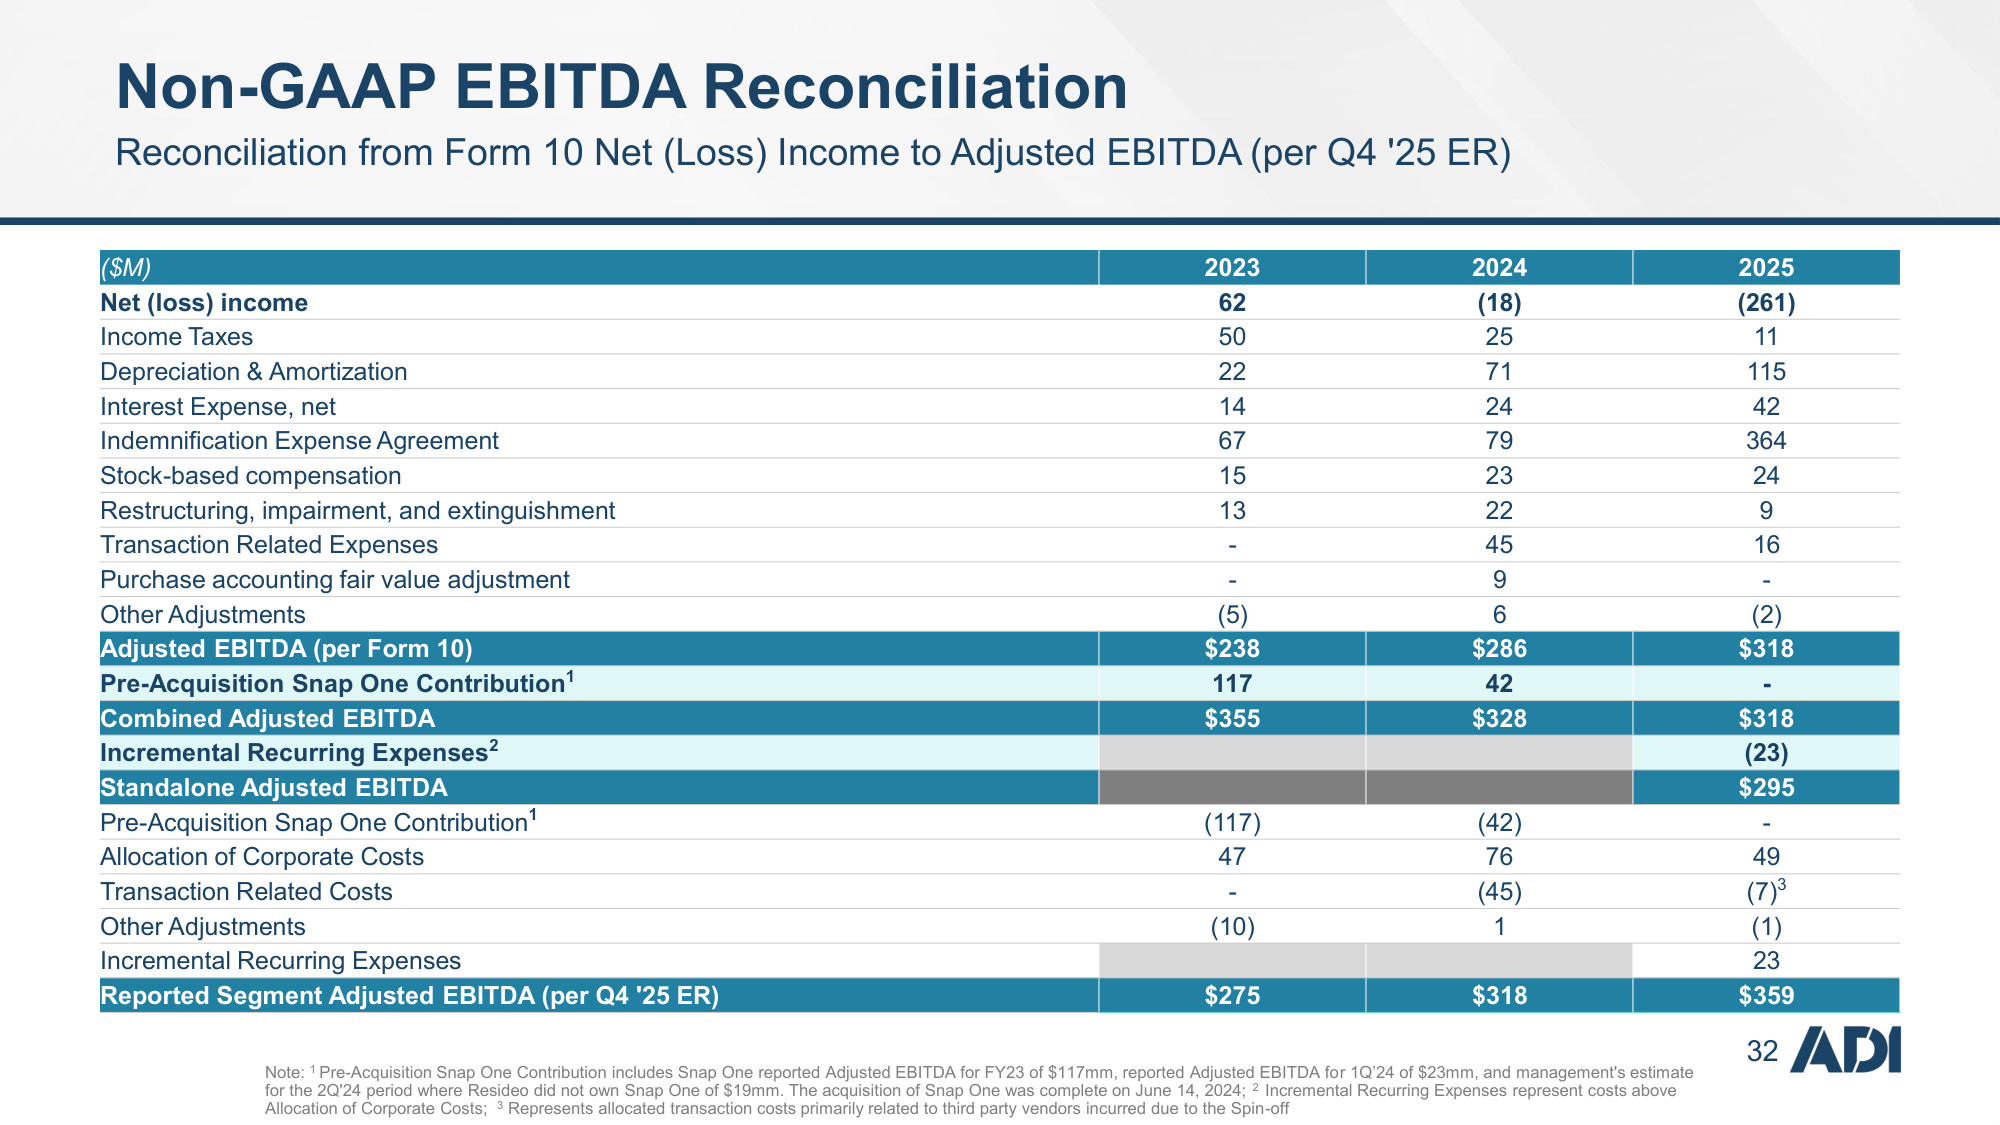
32 Non-GAAP EBITDA Reconciliation Reconciliation from Form 10 Net (Loss) Income to Adjusted EBITDA (per Q4 '25 ER) ($M) 2023 2024 2025 Net (loss) income 62 (18) (261) Income Taxes 50 25 11 Depreciation & Amortization 22 71 115 Interest Expense, net 14 24 42 Indemnification Expense Agreement 67 79 364 Stock-based compensation 15 23 24 Restructuring, impairment, and extinguishment 13 22 9 Transaction Related Expenses - 45 16 Purchase accounting fair value adjustment - 9 - Other Adjustments (5) 6 (2) Adjusted EBITDA (per Form 10) $238 $286 $318 Pre-Acquisition Snap One Contribution1 117 42 - Combined Adjusted EBITDA $355 $328 $318 Incremental Recurring Expenses2 (23) Standalone Adjusted EBITDA $295 Pre-Acquisition Snap One Contribution1 (117) (42) - Allocation of Corporate Costs 47 76 49 Transaction Related Costs - (45) (7)3 Other Adjustments (10) 1 (1) Incremental Recurring Expenses 23 Reported Segment Adjusted EBITDA (per Q4 '25 ER) $275 $318 $359 Note: 1 Pre-Acquisition Snap One Contribution includes Snap One reported Adjusted EBITDA for FY23 of $117mm, reported Adjusted EBITDA for 1Q'24 of $23mm, and management's estimate for the 2Q'24 period where Resideo did not own Snap One of $19mm. The acquisition of Snap One was complete on June 14, 2024; 2 Incremental Recurring Expenses represent costs above Allocation of Corporate Costs; 3 Represents allocated transaction costs primarily related to third party vendors incurred due to the Spin-off
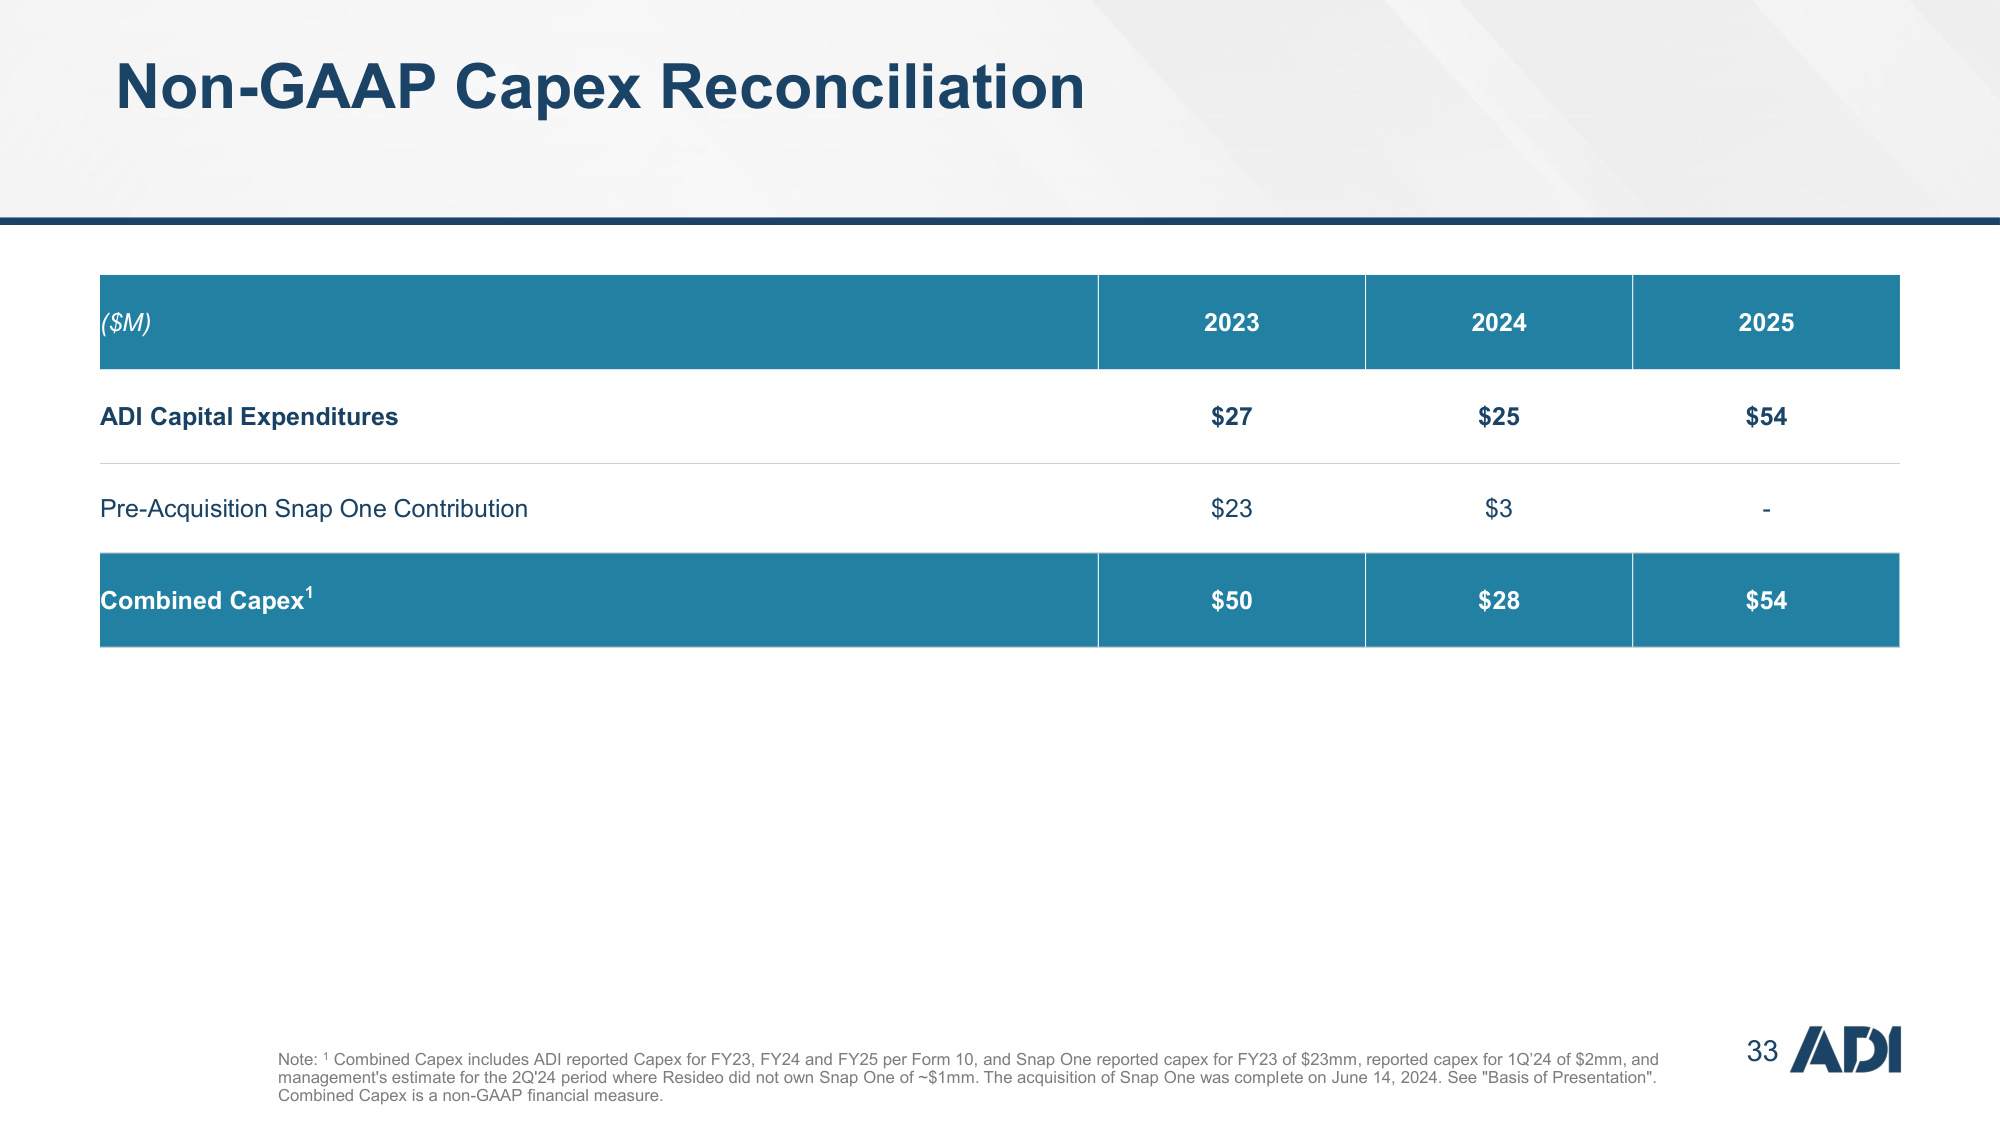
33 Non-GAAP Capex Reconciliation Note: 1 Combined Capex includes ADI reported Capex for FY23, FY24 and FY25 per Form 10, and Snap One reported capex for FY23 of $23mm, reported capex for 1Q'24 of $2mm, and management's estimate for the 2Q'24 period where Resideo did not own Snap One of ~$1mm. The acquisition of Snap One was complete on June 14, 2024. See "Basis of Presentation". Combined Capex is a non-GAAP financial measure. ($M) 2023 2024 2025 ADI Capital Expenditures $27 $25 $54 Pre-Acquisition Snap One Contribution $23 $3 - Combined Capex1 $50 $28 $54