Exhibit (c)(2)
UROV Take Private Analysis Strictly Private and Confidential July 2020 Banking, Capital Markets and Advisory | Global Healthcare Group
Exhibit (c)(2)
UROV Take Private Analysis Strictly Private and Confidential July 2020 Banking, Capital Markets and Advisory | Global Healthcare Group
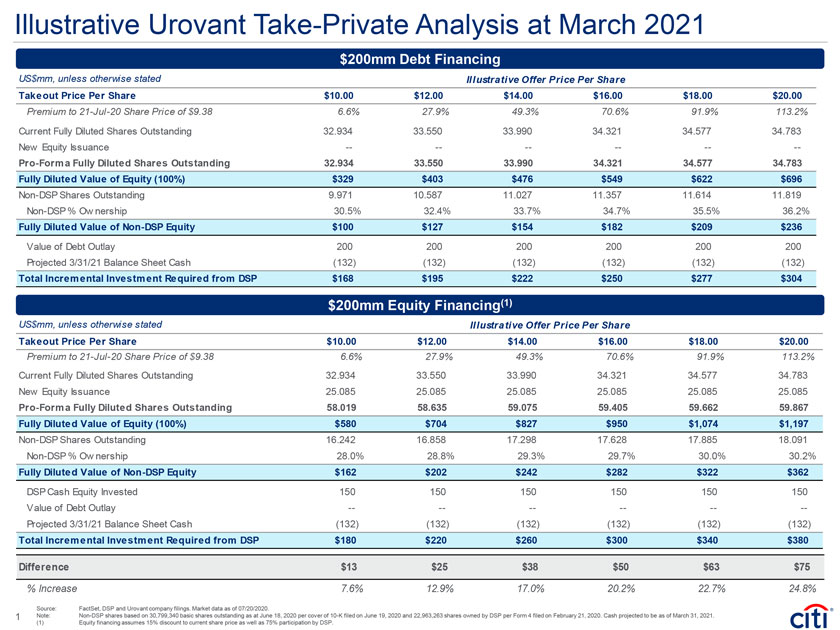
US$mm, unless otherwise stated Il lustrative Offer Price Per Share Takeout Price Per Share $10.00 $12.00 $14.00 $16.00 $18.00 $20.00 Premium to 21-Jul-20 Share Price of $9.38 6.6% 27.9% 49.3% 70.6% 91.9% 113.2% Current Fully Diluted Shares Outstanding 32.934 33.550 33.990 34.321 34.577 34.783 New Equity Issuance -—————- Pro-Forma Fully Diluted Shares Outstanding 32.934 33.550 33.990 34.321 34.577 34.783 Fully Diluted Value of Equity (100%) $329 $403 $476 $549 $622 $696 Non-DSP Shares Outstanding 9.971 10.587 11.027 11.357 11.614 11.819 Non-DSP % Ownership 30.5% 32.4% 33.7% 34.7% 35.5% 36.2% Fully Diluted Value of Non-DSP Equity $100 $127 $154 $182 $209 $236 Value of Debt Outlay 200 200 200 200 200 200 Projected 3/31/21 Balance Sheet Cash (132) (132) (132) (132) (132) (132) Total Incremental Investment Required from DSP $168 $195 $222 $250 $277 $304 Illustrative Urovant Take-Private Analysis at March 2021 Source: FactSet, DSP and Urovant company filings. Market data as of 07/20/2020. Note: Non-DSP shares based on 30,799,340 basic shares outstanding as at June 18, 2020 per cover of 10-K filed on June 19, 2020 and 22,963,263 shares owned by DSP per Form 4 filed on February 21, 2020. Cash projected to be as of March 31, 2021. (1) Equity financing assumes 15% discount to current share price as well as 75% participation by DSP. US$mm, unless otherwise stated Illustrative Offer Price Per Share Takeout Price Per Share $10.00 $12.00 $14.00 $16.00 $18.00 $20.00 Premium to 21-Jul-20 Share Price of $9.38 6.6% 27.9% 49.3% 70.6% 91.9% 113.2% Current Fully Diluted Shares Outstanding 32.934 33.550 33.990 34.321 34.577 34.783 New Equity Issuance 25.085 25.085 25.085 25.085 25.085 25.085 Pro-Forma Fully Diluted Shares Outstanding 58.019 58.635 59.075 59.405 59.662 59.867 Fully Diluted Value of Equity (100%) $580 $704 $827 $950 $1,074 $1,197 Non-DSP Shares Outstanding 16.242 16.858 17.298 17.628 17.885 18.091 Non-DSP % Ownership 28.0% 28.8% 29.3% 29.7% 30.0% 30.2% Fully Diluted Value of Non-DSP Equity $162 $202 $242 $282 $322 $362 DSP Cash Equity Invested 150 150 150 150 150 150 Value of Debt Outlay -—————- Projected 3/31/21 Balance Sheet Cash (132) (132) (132) (132) (132) (132) Total Incremental Investment Required from DSP $180 $220 $260 $300 $340 $380 Difference $13 $25 $38 $50 $63 $75 % Increase 7.6% 12.9% 17.0% 20.2% 22.7% 24.8% $200mm Debt Financing $200mm Equity Financing(1) 1
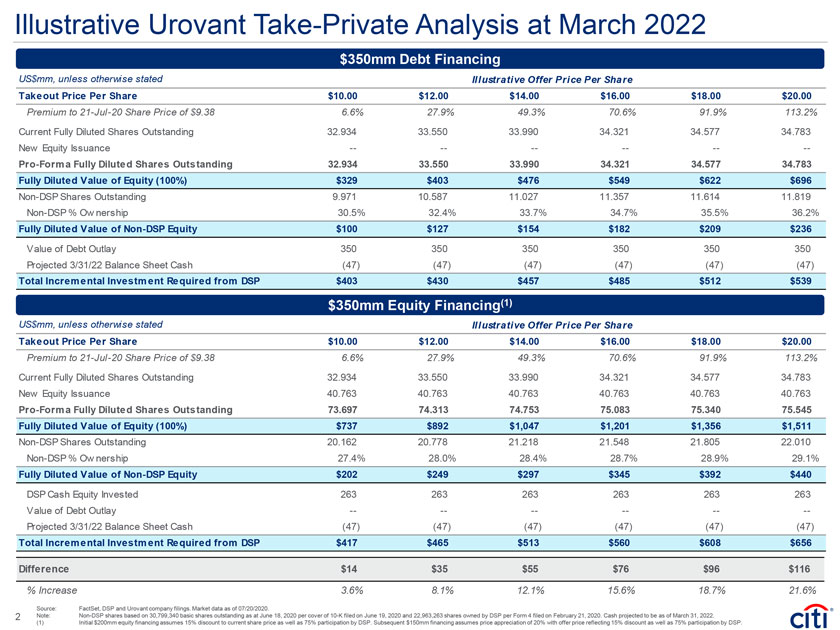
US$mm, unless otherwise stated Illustrative Offer Price Per Share Takeout Price Per Share $10.00 $12.00 $14.00 $16.00 $18.00 $20.00 Premium to 21-Jul-20 Share Price of $9.38 6.6% 27.9% 49.3% 70.6% 91.9% 113.2% Current Fully Diluted Shares Outstanding 32.934 33.550 33.990 34.321 34.577 34.783 New Equity Issuance -—————- Pro-Forma Fully Diluted Shares Outstanding 32.934 33.550 33.990 34.321 34.577 34.783 Fully Diluted Value of Equity (100%) $329 $403 $476 $549 $622 $696 Non-DSP Shares Outstanding 9.971 10.587 11.027 11.357 11.614 11.819 Non-DSP % Ownership 30.5% 32.4% 33.7% 34.7% 35.5% 36.2% Fully Diluted Value of Non-DSP Equity $100 $127 $154 $182 $209 $236 Value of Debt Outlay 350 350 350 350 350 350 Projected 3/31/22 Balance Sheet Cash (47) (47) (47) (47) (47) (47) Total Incremental Investment Required from DSP $403 $430 $457 $485 $512 $539 Illustrative Urovant Take-Private Analysis at March 2022 US$mm, unless otherwise stated I lustrative Offer Price Per Share Takeout Price Per Share $10.00 $12.00 $14.00 $16.00 $18.00 $20.00 Premium to 21-Jul-20 Share Price of $9.38 6.6% 27.9% 49.3% 70.6% 91.9% 113.2% Current Fully Diluted Shares Outstanding 32.934 33.550 33.990 34.321 34.577 34.783 New Equity Issuance 40.763 40.763 40.763 40.763 40.763 40.763 Pro-Forma Fully Diluted Shares Outstanding 73.697 74.313 74.753 75.083 75.340 75.545 Fully Diluted Value of Equity (100%) $737 $892 $1,047 $1,201 $1,356 $1,511 Non-DSP Shares Outstanding 20.162 20.778 21.218 21.548 21.805 22.010 Non-DSP % Ow nership 27.4% 28.0% 28.4% 28.7% 28.9% 29.1% Fully Diluted Value of Non-DSP Equity $202 $249 $297 $345 $392 $440 DSP Cash Equity Invested 263 263 263 263 263 263 Value of Debt Outlay -—————- Projected 3/31/22 Balance Sheet Cash (47) (47) (47) (47) (47) (47) Total Incremental Investment Required from DSP $417 $465 $513 $560 $608 $656 Difference $14 $35 $55 $76 $96 $116 % Increase 3.6% 8.1% 12.1% 15.6% 18.7% 21.6% $350mm Debt Financing $350mm Equity Financing(1) Source: FactSet, DSP and Urovant company filings. Market data as of 07/20/2020. Note: Non-DSP shares based on 30,799,340 basic shares outstanding as at June 18, 2020 per cover of 10-K filed on June 19, 2020 and 22,963,263 shares owned by DSP per Form 4 filed on February 21, 2020. Cash projected to be as of March 31, 2022. (1) Initial $200mm equity financing assumes 15% discount to current share price as well as 75% participation by DSP. Subsequent $150mm financing assumes price appreciation of 20% with offer price reflecting 15% discount as well as 75% participation by DSP. 2
IRS Circular 230 Disclosure: Citigroup Inc. and its affiliates do not provide tax or legal advice. Any discussion of tax matters in these materials (i) is not intended or written to be used, and cannot be used or relied upon, by you for the purpose of avoiding any tax penalties and (ii) may have been written in connection with the “promotion or marketing” of any transaction contemplated hereby (“Transaction”). Accordingly, you should seek advice based on your particular circumstances from an independent tax advisor. In any instance where distribution of this communication is subject to the rules of the US Commodity Futures Trading Commission (“CFTC”), this communication constitutes an invitation to consider entering into a derivatives transaction under U.S. CFTC Regulations §§ 1.71 and 23.605, where applicable, but is not a binding offer to buy/sell any financial instrument. Any terms set forth herein are intended for discussion purposes only and are subject to the final terms as set forth in separate definitive written agreements. This presentation is not a commitment to lend, syndicate a financing, underwrite or purchase securities, or commit capital nor does it obligate us to enter into such a commitment, nor are we acting as a fiduciary to you. By accepting this presentation, subject to applicable law or regulation, you agree to keep confidential the information contained herein and the existence of and proposed terms for any Transaction. Prior to entering into any Transaction, you should determine, without reliance upon us or our affiliates, the economic risks and merits (and independently determine that you are able to assume these risks) as well as the legal, tax and accounting characterizations and consequences of any such Transaction. In this regard, by accepting this presentation, you acknowledge that (a) we are not in the business of providing (and you are not relying on us for) legal, tax or accounting advice, (b) there may be legal, tax or accounting risks associated with any Transaction, (c) you should receive (and rely on) separate and qualified legal, tax and accounting advice and (d) you should apprise senior management in your organization as to such legal, tax and accounting advice (and any risks associated with any Transaction) and our disclaimer as to these matters. By acceptance of these materials, you and we hereby agree that from the commencement of discussions with respect to any Transaction, and notwithstanding any other provision in this presentation, we hereby confirm that no participant in any Transaction shall be limited from disclosing the U.S. tax treatment or U.S. tax structure of such Transaction. We are required to obtain, verify and record certain information that identifies each entity that enters into a formal business relationship with us. We will ask for your complete name, street address, and taxpayer ID number. We may also request corporate formation documents, or other forms of identification, to verify information provided. Any prices or levels contained herein are preliminary and indicative only and do not represent bids or offers. These indications are provided solely for your information and consideration, are subject to change at any time without notice and are not intended as a solicitation with respect to the purchase or sale of any instrument. The information contained in this presentation may include results of analyses from a quantitative model which represent potential future events that may or may not be realized, and is not a complete analysis of every material fact representing any product. Any estimates included herein constitute our judgment as of the date hereof and are subject to change without any notice. We and/or our affiliates may make a market in these instruments for our customers and for our own account. Accordingly, we may have a position in any such instrument at any time. Although this material may contain publicly available information about Citi corporate bond research, fixed income strategy or economic and market analysis, Citi policy (i) prohibits employees from offering, directly or indirectly, a favorable or negative research opinion or offering to change an opinion as consideration or inducement for the receipt of business or for compensation; and (ii) prohibits analysts from being compensated for specific recommendations or views contained in research reports. So as to reduce the potential for conflicts of interest, as well as to reduce any appearance of conflicts of interest, Citi has enacted policies and procedures designed to limit communications between its investment banking and research personnel to specifically prescribed circumstances. © 2020 Citigroup Global Markets Inc. Member SIPC. All rights reserved. Citi and Citi and Arc Design are trademarks and service marks of Citigroup Inc. or its affiliates and are used and registered throughout the world. Citi believes that sustainability is good business practice. We work closely with our clients, peer financial institutions, NGOs and other partners to finance solutions to climate change, develop industry standards, reduce our own environmental footprint, and engage with stakeholders to advance shared learning and solutions. Citi’s Sustainable Progress strategy focuses on sustainability performance across three pillars: Environmental Finance; Environmental and Social Risk Management; and Operations and Supply Chain. Our cornerstone initiative is our $100 Billion Environmental Finance Goal – to lend, invest and facilitate $100 billion over 10 years to activities focused on environmental and climate solutions.