Exhibit (c)(4)
Citi Banking, Capital Markets & Advisory | Global Healthcare Group September 2020 Urovant Update Materials Strictly Private and Confidential
Exhibit (c)(4)
Citi Banking, Capital Markets & Advisory | Global Healthcare Group September 2020 Urovant Update Materials Strictly Private and Confidential

Key Modeling Assumptions for Illustrative Valuation `1 Key Assumptions – P&L and Cash Flows · Probability of success assumptions by year for each indication provided by DSP · Probability of success assumptions for valuation date of September 30, 2020 consistent with assumptions for June 30, 2020 presented in June 2020 – Source: “20200608 PoS update_DSP_vEng.xlsx” provided by DSP on June 9, 2020 as well as additional guidance provided by DSP on June 22, 2020 and June 29, 2020 for PoS assumptions to be applied at future valuation dates (see table below): September 30, 2020 March 31, 2021 March 31, 2022 March 31, 2023 Probability of Success Urovant – Vibegron in OAB 85% 100% 100% 100% Urovant – Vibegron in OAB-BPH 72% 72% 72% 100% · 100% PoS adjusted revenue forecasts by indication, as well as total royalties and milestones received, provided to year ended March 31, 2038 for Urovant Revenue – Source: “09.01.2020 Vibegron long range forecast.xlsx” provided by DSP on September 2, 2020 (Incl. Royalties and Milestones · Forecasts adjusted at indication-level by respective PoS in each period Received) – Weighted average product PoS applied to royalties and milestones · 100% PoS adjusted values for COGS, SG&A and R&D provided to year ended March 31, 2038 for Urovant – Source: “09.01.2020 Vibegron long range forecast.xlsx” provided by DSP on September 2, 2020 COGS, SG&A, R&D · COGS and SG&A margins are implied from 100% PoS sales and applied to PoS adjusted sales · No PoS adjustment applied to R&D D&A and Capex · Excluded as they are assumed to offset one another per guidance provided by DSP on June 6, 2020 NWC · Change in net working capital equal to 15% of change in revenue per guidance provided by DSP on June 6, 2020 1 Source: DSP; Urovant public filings.
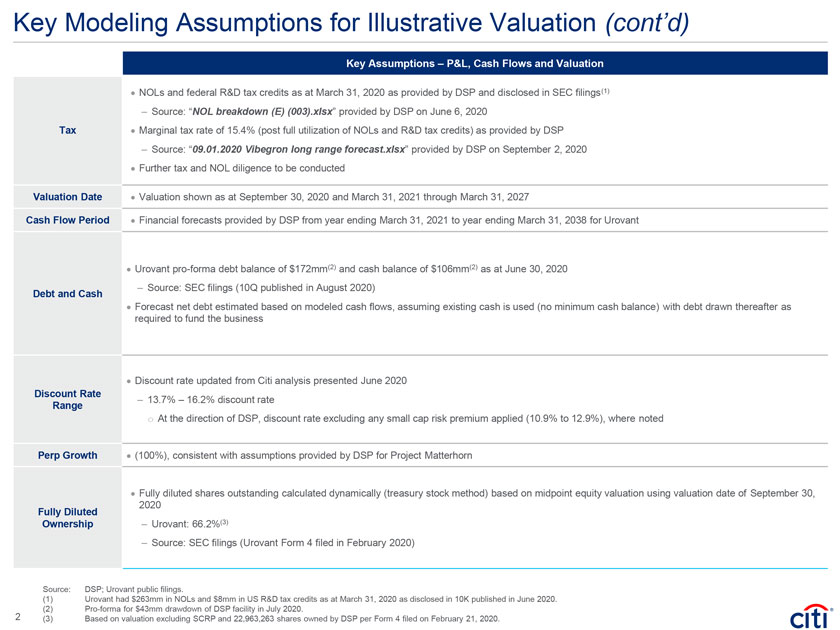
Key Modeling Assumptions for Illustrative Valuation (cont’d) `1 Key Assumptions – P&L, Cash Flows and Valuation · NOLs and federal R&D tax credits as at March 31, 2020 as provided by DSP and disclosed in SEC filings(1) – Source: “NOL breakdown (E) (003).xlsx” provided by DSP on June 6, 2020 Tax · Marginal tax rate of 15.4% (post full utilization of NOLs and R&D tax credits) as provided by DSP – Source: “09.01.2020 Vibegron long range forecast.xlsx” provided by DSP on September 2, 2020 · Further tax and NOL diligence to be conducted Valuation Date · Valuation shown as at September 30, 2020 and March 31, 2021 through March 31, 2027 Cash Flow Period · Financial forecasts provided by DSP from year ending March 31, 2021 to year ending March 31, 2038 for Urovant · Urovant pro-forma debt balance of $172mm(2) and cash balance of $106mm(2) as at June 30, 2020 – Source: SEC filings (10Q published in August 2020) Debt and Cash · Forecast net debt estimated based on modeled cash flows, assuming existing cash is used (no minimum cash balance) with debt drawn thereafter as required to fund the business · Discount rate updated from Citi analysis presented June 2020 Discount Rate – 13.7% – 16.2% discount rate Range o At the direction of DSP, discount rate excluding any small cap risk premium applied (10.9% to 12.9%), where noted Perp Growth · (100%), consistent with assumptions provided by DSP for Project Matterhorn · Fully diluted shares outstanding calculated dynamically (treasury stock method) based on midpoint equity valuation using valuation date of September 30, 2020 Fully Diluted Ownership – Urovant: 66.2%(3) – Source: SEC filings (Urovant Form 4 filed in February 2020) Source: DSP; Urovant public filings. (1) Urovant had $263mm in NOLs and $8mm in US R&D tax credits as at March 31, 2020 as disclosed in 10K published in June 2020. 2 (2) Pro-forma for $43mm drawdown of DSP facility in July 2020. (3) Based on valuation excluding SCRP and 22,963,263 shares owned by DSP per Form 4 filed on February 21, 2020.
1. Urovant Illustrative Analysis
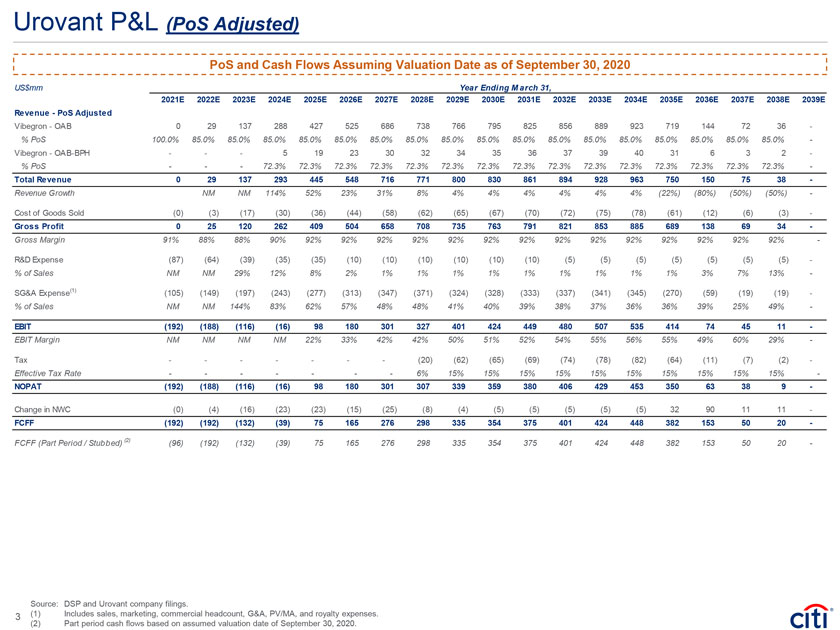
Urovant P&L (PoS Adjusted) PoS and Cash Flows Assuming Valuation Date as of September 30, 2020 US$mm Year Ending M arch 31, 2021E 2022E 2023E 2024E 2025E 2026E 2027E 2028E 2029E 2030E 2031E 2032E 2033E 2034E 2035E 2036E 2037E 2038E 2039E Revenue—PoS Adjusted Vibegron—OAB 0 29 137 288 427 525 686 738 766 795 825 856 889 923 719 144 72 36—% PoS 100.0% 85.0% 85.0% 85.0% 85.0% 85.0% 85.0% 85.0% 85.0% 85.0% 85.0% 85.0% 85.0% 85.0% 85.0% 85.0% 85.0% 85.0%—Vibegron—OAB-BPH ——5 19 23 30 32 34 35 36 37 39 40 31 6 3 2—% PoS ——72.3% 72.3% 72.3% 72.3% 72.3% 72.3% 72.3% 72.3% 72.3% 72.3% 72.3% 72.3% 72.3% 72.3% 72.3%—Total Revenue 0 29 137 293 445 548 716 771 800 830 861 894 928 963 750 150 75 38—Revenue Growth NM NM 114% 52% 23% 31% 8% 4% 4% 4% 4% 4% 4% (22%) (80%) (50%) (50%)—Cost of Goods Sold (0) (3) (17) (30) (36) (44) (58) (62) (65) (67) (70) (72) (75) (78) (61) (12) (6) (3)—Gross Profit 0 25 120 262 409 504 658 708 735 763 791 821 853 885 689 138 69 34—Gross Margin 91% 88% 88% 90% 92% 92% 92% 92% 92% 92% 92% 92% 92% 92% 92% 92% 92% 92%—R&D Expense (87) (64) (39) (35) (35) (10) (10) (10) (10) (10) (10) (5) (5) (5) (5) (5) (5) (5)—% of Sales NM NM 29% 12% 8% 2% 1% 1% 1% 1% 1% 1% 1% 1% 1% 3% 7% 13%—SG&A Expense(1) (105) (149) (197) (243) (277) (313) (347) (371) (324) (328) (333) (337) (341) (345) (270) (59) (19) (19)—% of Sales NM NM 144% 83% 62% 57% 48% 48% 41% 40% 39% 38% 37% 36% 36% 39% 25% 49%—EBIT (192) (188) (116) (16) 98 180 301 327 401 424 449 480 507 535 414 74 45 11—EBIT Margin NM NM NM NM 22% 33% 42% 42% 50% 51% 52% 54% 55% 56% 55% 49% 60% 29%—Tax — — ——(20) (62) (65) (69) (74) (78) (82) (64) (11) (7) (2)—Effective Tax Rate — — ——6% 15% 15% 15% 15% 15% 15% 15% 15% 15% 15%—NOPAT (192) (188) (116) (16) 98 180 301 307 339 359 380 406 429 453 350 63 38 9—Change in NWC (0) (4) (16) (23) (23) (15) (25) (8) (4) (5) (5) (5) (5) (5) 32 90 11 11—FCFF (192) (192) (132) (39) 75 165 276 298 335 354 375 401 424 448 382 153 50 20—FCFF (Part Period / Stubbed) (2) (96) (192) (132) (39) 75 165 276 298 335 354 375 401 424 448 382 153 50 20—Source: DSP and Urovant company filings. 3 (1) Includes sales, marketing, commercial headcount, G&A, PV/MA, and royalty expenses. (2) Part period cash flows based on assumed valuation date of September 30, 2020.
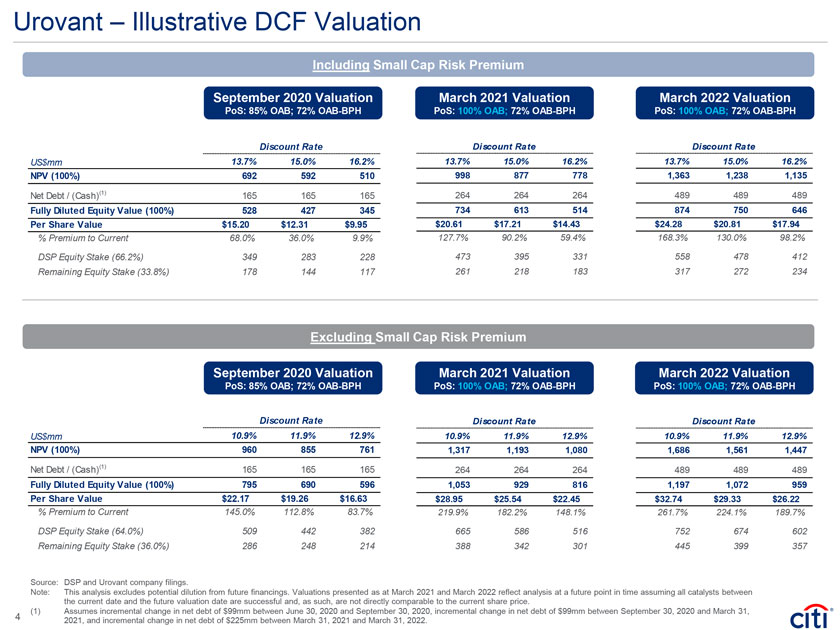
Urovant – Illustrative DCF Valuation Including Small Cap Risk Premium September 2020 Valuation March 2021 Valuation March 2022 Valuation PoS: 85% OAB; 72% OAB-BPH PoS: 100% OAB; 72% OAB-BPH PoS: 100% OAB; 72% OAB-BPH Discount Rate Discount Rate Discount Rate US$mm 13.7% 15.0% 16.2% 13.7% 15.0% 16.2% 13.7% 15.0% 16.2% NPV (100%) 692 592 510 998 877 778 1,363 1,238 1,135 Net Debt / (Cash)(1) 165 165 165 264 264 264 489 489 489 Fully Diluted Equity Value (100%) 528 427 345 734 613 514 874 750 646 Per Share Value $15.20 $12.31 $9.95 $20.61 $17.21 $14.43 $24.28 $20.81 $17.94 % Premium to Current 68.0% 36.0% 9.9% 127.7% 90.2% 59.4% 168.3% 130.0% 98.2% DSP Equity Stake (66.2%) 349 283 228 473 395 331 558 478 412 Remaining Equity Stake (33.8%) 178 144 117 261 218 183 317 272 234 Excluding Small Cap Risk Premium September 2020 Valuation March 2021 Valuation March 2022 Valuation PoS: 85% OAB; 72% OAB-BPH PoS: 100% OAB; 72% OAB-BPH PoS: 100% OAB; 72% OAB-BPH Discount Rate Discount Rate Discount Rate US$mm 10.9% 11.9% 12.9% 10.9% 11.9% 12.9% 10.9% 11.9% 12.9% NPV (100%) 960 855 761 1,317 1,193 1,080 1,686 1,561 1,447 Net Debt / (Cash)(1) 165 165 165 264 264 264 489 489 489 Fully Diluted Equity Value (100%) 795 690 596 1,053 929 816 1,197 1,072 959 Per Share Value $22.17 $19.26 $16.63 $28.95 $25.54 $22.45 $32.74 $29.33 $26.22 % Premium to Current 145.0% 112.8% 83.7% 219.9% 182.2% 148.1% 261.7% 224.1% 189.7% DSP Equity Stake (64.0%) 509 442 382 665 586 516 752 674 602 Remaining Equity Stake (36.0%) 286 248 214 388 342 301 445 399 357 Source: DSP and Urovant company filings. Note: This analysis excludes potential dilution from future financings. Valuations presented as at March 2021 and March 2022 reflect analysis at a future point in time assuming all catalysts between the current date and the future valuation date are successful and, as such, are not directly comparable to the current share price. (1) Assumes incremental change in net debt of $99mm between June 30, 2020 and September 30, 2020, incremental change in net debt of $99mm between September 30, 2020 and March 31, 4 2021, and incremental change in net debt of $225mm between March 31, 2021 and March 31, 2022.
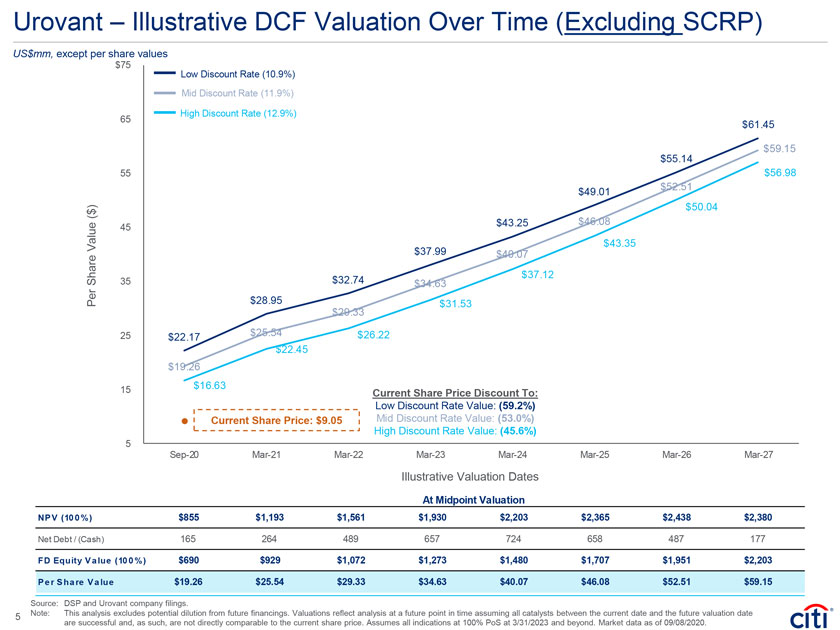
Urovant – Illustrative DCF Valuation Over Time (Excluding SCRP) US$mm, except per share values $75 Low Discount Rate (10.9%) Mid Discount Rate (11.9%) High Discount Rate (12.9%) 65 $61.45 $59.15 $55.14 55 $56.98 $52.51 $49.01 ) $50.04 ( $ 45 $43.25 $46.08 Value $43.35 $37.99 $40.07 $37.12 Share 35 $32.74 $34.63 Per $28.95 $31.53 $29.33 25 $22.17 $25.54 $26.22 $22.45 $19.26 15 $16.63 Current Share Price Discount To: Low Discount Rate Value: (59.2%) Current Share Price: $9.05 Mid Discount Rate Value: (53.0%) High Discount Rate Value: (45.6%) 5 Sep-20 Mar-21 Mar-22 Mar-23 Mar-24 Mar-25 Mar-26 Mar-27 Illustrative Valuation Dates At Midpoint Valuation NP V (10 0 %) $855 $1,193 $1,561 $1,930 $2,203 $2,365 $2,438 $2,380 Net Debt / (Cash) 165 264 489 657 724 658 487 177 FD Equity V a lue (10 0 %) $690 $929 $1,072 $1,273 $1,480 $1,707 $1,951 $2,203 P e r S ha re V a lue $19.26 $25.54 $29.33 $34.63 $40.07 $46.08 $52.51 $59.15 Source: DSP and Urovant company filings. 5 Note: This analysis excludes potential dilution from future financings. Valuations reflect analysis at a future point in time assuming all catalysts between the current date and the future valuation date are successful and, as such, are not directly comparable to the current share price. Assumes all indications at 100% PoS at 3/31/2023 and beyond. Market data as of 09/08/2020.
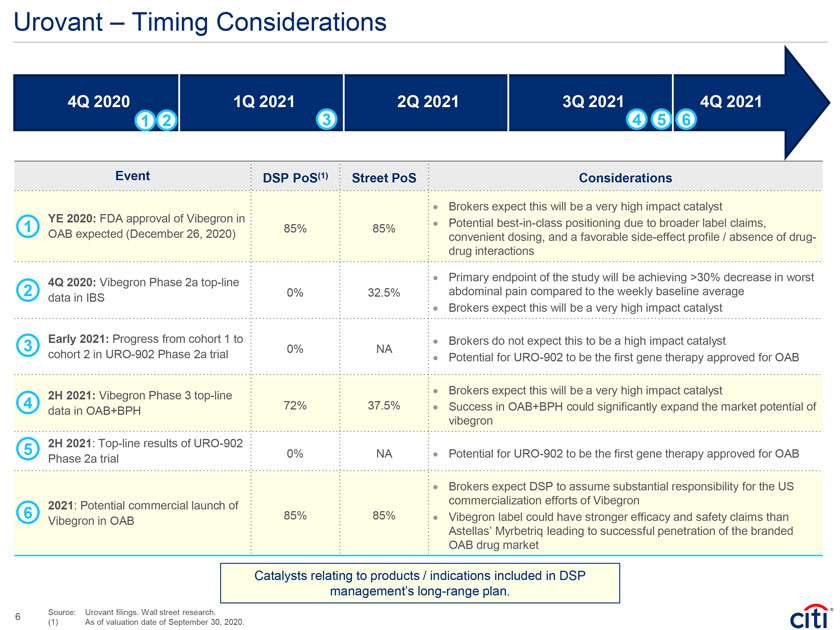
Urovant – Timing Considerations 4Q 2020 1Q 2021 2Q 2021 3Q 2021 4Q 2021 1 2 3 4 5 6 Event DSP PoS(1) Street PoS Considerations · Brokers expect this will be a very high impact catalyst YE 2020: FDA approval of Vibegron in · Potential best-in-class positioning due to broader label claims, 1 85% 85% OAB expected (December 26, 2020) convenient dosing, and a favorable side-effect profile / absence of drug-drug interactions 4Q 2020: Vibegron Phase 2a top-line · Primary endpoint of the study will be achieving >30% decrease in worst 2 0% 32.5% abdominal pain compared to the weekly baseline average data in IBS Brokers expect this will be very impact catalyst · a high 3 Early 2021: Progress from cohort 1 to 0% NA · Brokers do not expect this to be a high impact catalyst cohort 2 in URO-902 Phase 2a trial · Potential for URO-902 to be the first gene therapy approved for OAB 4 2H 2021: Vibegron Phase 3 top-line · Brokers expect this will be a very high impact catalyst 72% 37.5% · Success in OAB+BPH could significantly expand the market potential of data in OAB+BPH vibegron 5 2H 2021: Top-line results of URO-902 Potential 0% NA · for URO-902 to be the first gene therapy approved for OAB Phase 2a trial · Brokers expect DSP to assume substantial responsibility for the US 6 2021: Potential commercial launch of commercialization efforts of Vibegron 85% 85% · Vibegron label could have stronger efficacy and safety claims than Vibegron in OAB Astellas’ Myrbetriq leading to successful penetration of the branded OAB drug market Catalysts relating to products / indications included in DSP management’s long-range plan. Source: Urovant filings. Wall street research. 6 (1) As of valuation date of September 30, 2020.
IRSCircular 230 Disclosure: Citigroup Inc. and its affiliates do not provide tax or legal advice. Any discussion of tax matters in these materials (i) is not intended or written to be used, and cannot be used or relied upon, by you for the purpose of avoiding any tax penalties and (ii) may have been written in connection with the “promotion or marketing” of any transaction contemplated hereby (“Transaction”). Accordingly, you should seek advice based on your particular circumstances from an independent tax advisor. In any instance where distribution of this communication is subject to the rules of the US Commodity Futures Trading Commission (“CFTC”), this communication constitutes an invitation to consider entering into a derivatives transaction under U.S. CFTC Regulations §§ 1.71 and 23.605, where applicable, but is not a binding offer to buy/sell any financial instrument. Any terms set f orth herein are intended for discussion purposes only and are subject to the final terms as set forth in separate def initive written agreements. This presentation is not a commitment to lend, syndicate a financing, underwrite or purchase securities, or commit capital nor does it obligate us to enter into such a commitment, nor are we acting as a fiduciary to y ou. By accepting this presentation, subject to applicable law or regulation, y ou agree to keep confidential the information contained herein and the existence of and proposed terms for any Transaction. Prior to entering into any Transaction, you should determine, without reliance upon us or our affiliates, the economic risks and merits (and independently determine that you are able to assume these risks) as well as the legal, tax and accounting characterizations and consequences of any such Transaction. In this regard, by accepting this presentation, y ou acknowledge that (a) we are not in the business of providing (and you are not rely ing on us for) legal, tax or accounting advice, (b) there may be legal, tax or accounting risks associated with any Transaction, (c) you should receive (and rely on) separate and qualified legal, tax and accounting advice and (d) y ou should apprise senior management iny our organization as to such legal, tax and accounting adv ice (and any risks associated with any Transaction) and our disclaimer as to these matters. By acceptance of these materials, you and we hereby agree that f rom the commencement of discussions with respect to any Transaction, and notwithstanding any other provision in this presentation, we hereby confirm that no participant in any Transaction shall be limited f rom disclosingthe U.S. tax treatment or U.S. tax structure of such Transaction. We are required to obtain, v erify and record certain information that identif ies each entity that enters into a f ormal business relationship with us. We will ask f or your complete name, street address, and taxpayer ID number. We may also request corporate formation documents, or other forms of identification, to verify information provided. Any prices or levels contained herein are preliminary and indicative only and do not represent bids or offers. These indications are provided solely for your information and consideration, are subject to change at any time without notice and are not intended as a solicitation with respect to the purchase or sale of any instrument. The inf ormation contained in this presentation may include results of analyses f rom a quantitative model which represent potential future events that may or may not be realized, and is not a complete analysis of ev ery material fact representing any product. Any estimates included herein constitute our judgment as of the date hereof and are subject to change without any notice. We and/or our affiliates may make a market in these instruments f or our customers and for our own account. Accordingly, we may have a position in any such instrument at any time. Although this material may contain publicly av ailable inf ormation about Citi corporate bond research, f ixed income strategy or economic and market analysis, Citi policy (i) prohibits employees from offering, directly or indirectly, a f avorable or negative research opinion or offering to change an opinion as consideration or inducement f or the receipt of business or for compensation; and (ii) prohibits analysts from being compensated for specif ic recommendations or v iews contained in research reports. So as to reduce the potential for conf licts of interest, as well as to reduce any appearance of conflicts of interest, Citi has enacted policies and procedures designed to limit communications between its investment banking and research personnel tospecifically prescribed circumstances. © 2020 Citigroup Global Markets Inc. Member SIPC. All rights reserved. Citi and Citi and Arc Design are trademarks and service marks of Citigroup Inc. or its affiliates and are used and registered throughout the world. Citi believes that sustainability is good business practice. We work closely with our clients, peer financial institutions, NGOs and other partners to finance solutions to climate change, develop industry standards, reduce our own environmental footprint, and engage with stakeholders to advance shared learning and solutions. Citi’s Sustainable Progress strategy focuses on sustainability performance across three pillars: Environmental Finance; Environmental and Social Risk Management; and Operations and Supply Chain. Our cornerstone initiative is our $100 Billion Environmental Finance Goal – to lend, invest and facilitate $100 billion over 10 years to activities focused on environmental and climate solutions.