Exhibit (c)(6)
Citi Banking, Capital Markets & Advisory | Global Healthcare Group November 2020 Project Titan Discussion Materials Strictly Private and Confidential
Exhibit (c)(6)
Citi Banking, Capital Markets & Advisory | Global Healthcare Group November 2020 Project Titan Discussion Materials Strictly Private and Confidential
Confidential Material The following pages contain material provided to the Board of Directors (the “Board”) of Saturn (the “Company”) by Citigroup Global Markets Inc. (“Citi”) in connection with the proposed transaction involving the Company and Titan. The accompanying material was compiled or prepared on a confidential basis solely for the use of the Board of the Company. The information contained in the accompanying material was obtained from the Company, Titan, and other public sources. Any estimates and projections contained herein have been prepared or adopted by the management of the Company, obtained from public sources, or are based upon such estimates and projections, and involve numerous and significant subjective determinations, and there is no assurance that such estimates and projections will be realized. Citi does not take responsibility for such estimates and projections or the basis on which they were prepared. No representation or warranty, express or implied, is made as to the accuracy or completeness of such information and nothing contained herein is, or shall be relied upon as, a representation, whether as to the past, the present or the future. In preparing the accompanying material, Citi assumed and relied, without independent verification, upon the accuracy and completeness of all financial and other information and data publicly available or provided to or otherwise reviewed by or discussed with Citi and upon the assurances of the managements and other representatives of the Company that they are not aware of any relevant information that has been omitted or that remains undisclosed to Citi. The accompanying material was not prepared for use by readers not as familiar with the Company as the Board of the Company and, accordingly, neither the Company nor Citi nor their respective legal or financial advisors or accountants take any responsibility for the accompanying material if used by persons other than the Board of the Company. The accompanying material is necessarily based upon information available, and financial, stock market and other conditions and circumstances existing and disclosed, to Citi as of the date of the accompanying material. Citi does not have any obligation to update or otherwise revise the accompanying material. Nothing contained herein shall be construed as legal, regulatory, tax or accounting advice.
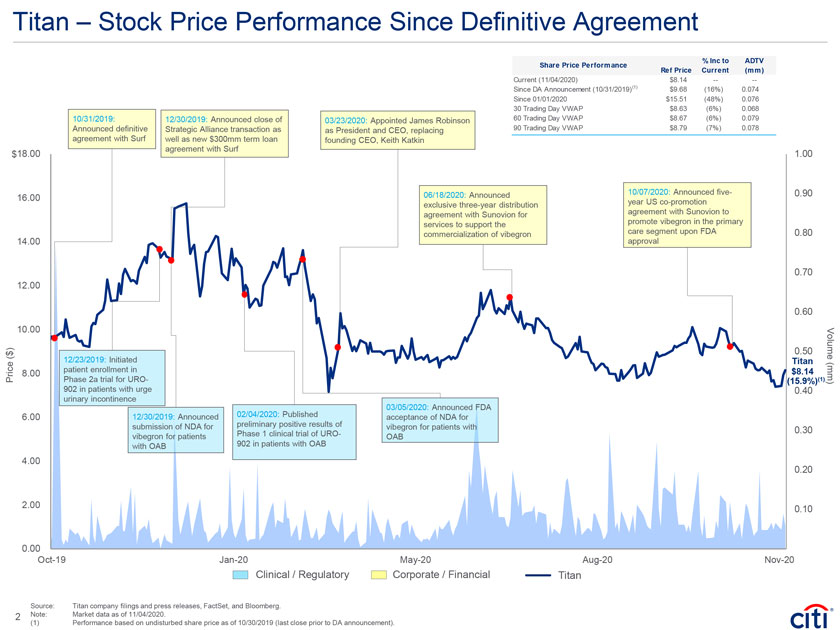
Titan – Stock Price Performance Since Definitive Agreement % Inc to ADTV Share Price Performance Ref Price Current (mm) Current (11/04/2020) $8.14 -—-Since DA Announcement (10/31/2019)(1) $9.68 (16%) 0.074 Since 01/01/2020 $15.51 (48%) 0.076 30 Trading Day VWAP $8.63 (6%) 0.068 10/31/2019: 12/30/2019: Announced close of 03/23/2020: Appointed James Robinson 60 Trading Day VWAP $8.67 (6%) 0.079 Announced definitive Strategic Alliance transaction as as President and CEO, replacing 90 Trading Day VWAP $8.79 (7%) 0.078 agreement with Surf well as new $300mm term loan founding CEO, Keith Katkin agreement with Surf $18.00 1.00 06/18/2020: Announced 10/07/2020: Announced five- 0.90 16.00 exclusive three-year distribution year US co-promotion agreement with Sunovion for agreement with Sunovion to services to support the promote vibegron in the primary commercialization of vibegron care segment upon FDA 0.80 14.00 approval 0.70 12.00 0.60 10.00 $ ) 0.50 ( 12/23/2019: Initiated Titan Volume 8.00 patient enrollment in $8.14 Price Phase 2a trial for URO- (15.9%)(1) (mm) 902 in patients with urge 0.40 urinary incontinence 02/04/2020: Published 03/05/2020: Announced FDA 6.00 12/30/2019: Announced preliminary positive results of acceptance of NDA for submission of NDA for Phase 1 clinical trial of URO- vibegron for patients with 0.30 vibegron for patients 902 in patients with OAB OAB with OAB 4.00 0.20 2.00 0.10 0.00 0.00 Oct-19 Jan-20 May-20 Aug-20 Nov-20 Clinical / Regulatory Corporate / Financial Titan Source: Titan company filings and press releases, FactSet, and Bloomberg. 2 Note: Market data as of 11/04/2020. (1) Performance based on undisturbed share price as of 10/30/2019 (last close prior to DA announcement).
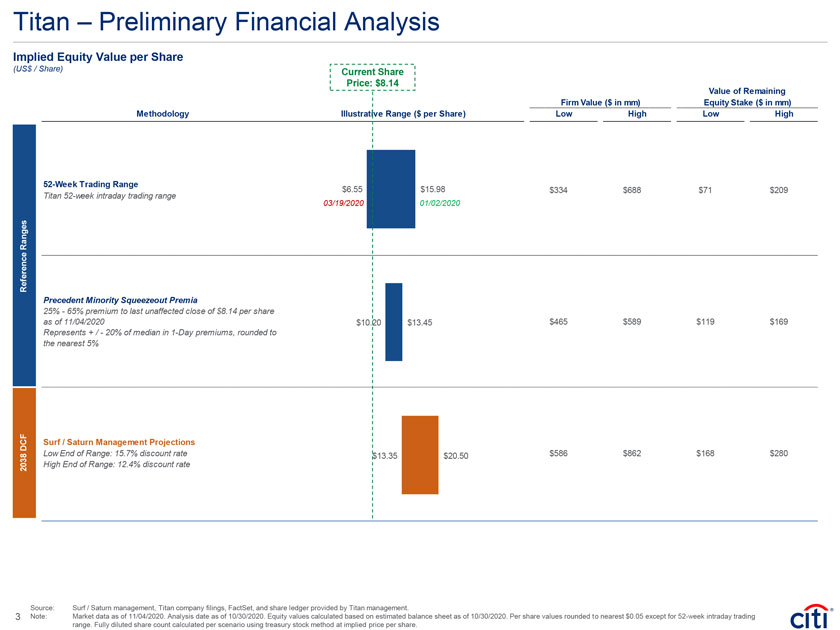
Titan – Preliminary Financial Analysis Implied Equity Value per Share (US$ / Share) Current Share Price: $8.14 Value of Remaining Firm Value ($ in mm) Equity Stake ($ in mm) Methodology Illustrative Range ($ per Share) Low High Low High 52-Week Trading Range $6.55 $15.98 $334 $688 $71 $209 Titan 52-week intraday trading range 03/19/2020 01/02/2020 g es Ra n e n c efe re R Precedent Minority Squeezeout Premia 25%—65% premium to last unaffected close of $8.14 per share as of 11/04/2020 $10.20 $13.45 $465 $589 $119 $169 Represents + /—20% of median in 1-Day premiums, rounded to the nearest 5% F C D Surf / Saturn Management Projections 8 Low End of Range: 15.7% discount rate $13.35 $20.50 $586 $862 $168 $280 03 2 High End of Range: 12.4% discount rate Source: Surf / Saturn management, Titan company filings, FactSet, and share ledger provided by Titan management. 3 Note: Market data as of 11/04/2020. Analysis date as of 10/30/2020. Equity values calculated based on estimated balance sheet as of 10/30/2020. Per share values rounded to nearest $0.05 except for 52-week intraday trading range. Fully diluted share count calculated per scenario using treasury stock method at implied price per share.
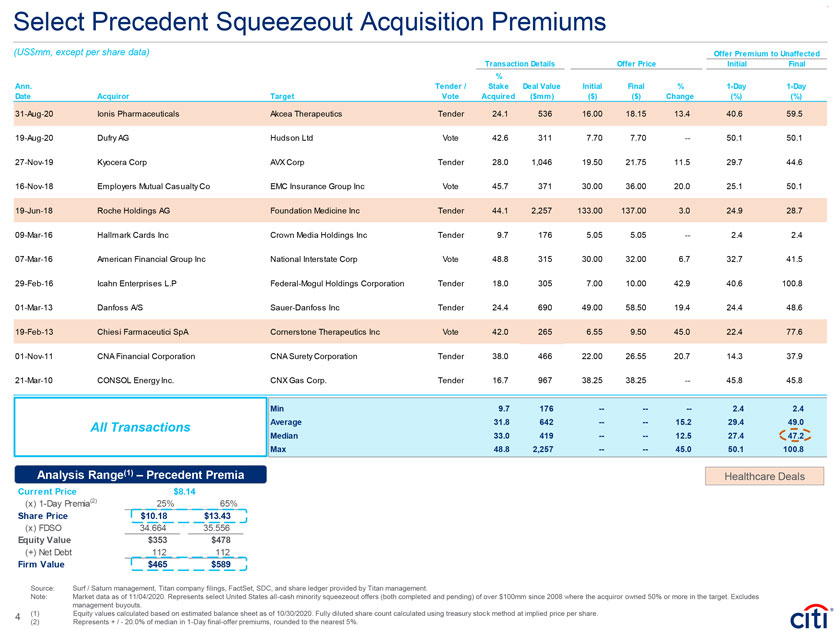
Select Precedent Squeezeout Acquisition Premiums (US$mm, except per share data) Offer Premium to Unaffected Transaction Details Offer Price Initial Final % Ann. Tender / Stake Deal Value Initial Final % 1-Day 1-Day Date Acquiror Target Vote Acquired ($mm) ($) ($) Change (%) (%) 31-Aug-20 Ionis Pharmaceuticals Akcea Therapeutics Tender 24.1 536 16.00 18.15 13.4 40.6 59.5 19-Aug-20 Dufry AG Hudson Ltd Vote 42.6 311 7.70 7.70 — 50.1 50.1 27-Nov-19 Kyocera Corp AVX Corp Tender 28.0 1,046 19.50 21.75 11.5 29.7 44.6 16-Nov-18 Employers Mutual Casualty Co EMC Insurance Group Inc Vote 45.7 371 30.00 36.00 20.0 25.1 50.1 19-Jun-18 Roche Holdings AG Foundation Medicine Inc Tender 44.1 2,257 133.00 137.00 3.0 24.9 28.7 09-Mar-16 Hallmark Cards Inc Crown Media Holdings Inc Tender 9.7 176 5.05 5.05 — 2.4 2.4 07-Mar-16 American Financial Group Inc National Interstate Corp Vote 48.8 315 30.00 32.00 6.7 32.7 41.5 29-Feb-16 Icahn Enterprises L.P Federal-Mogul Holdings Corporation Tender 18.0 305 7.00 10.00 42.9 40.6 100.8 01-Mar-13 Danfoss A/S Sauer-Danfoss Inc Tender 24.4 690 49.00 58.50 19.4 24.4 48.6 19-Feb-13 Chiesi Farmaceutici SpA Cornerstone Therapeutics Inc Vote 42.0 265 6.55 9.50 45.0 22.4 77.6 01-Nov-11 CNA Financial Corporation CNA Surety Corporation Tender 38.0 466 22.00 26.55 20.7 14.3 37.9 21-Mar-10 CONSOL Energy Inc. CNX Gas Corp. Tender 16.7 967 38.25 38.25 — 45.8 45.8 Min 9.7 176 -——- 2.4 2.4 All Transactions Average 31.8 642 -—- 15.2 29.4 49.0 Median 33.0 419 -—- 12.5 27.4 47.2 Max 48.8 2,257 -—- 45.0 50.1 100.8 Analysis Range(1) – Precedent Premia Healthcare Deals Current Price $8.14 (x) 1-Day Premia(2) 25% 65% Share Price $10.18 $13.43 (x) FDSO 34.664 35.556 Equity Value $353 $478 (+) Net Debt 112 112 Firm Value $465 $589 Source: Surf / Saturn management, Titan company filings, FactSet, SDC, and share ledger provided by Titan management. Note: Market data as of 11/04/2020. Represents select United States all-cash minority squeezeout offers (both completed and pending) of over $100mm since 2008 where the acquiror owned 50% or more in the target. Excludes management buyouts. 4 (1) Equity values calculated based on estimated balance sheet as of 10/30/2020. Fully diluted share count calculated using treasury stock method at implied price per share. (2) Represents + /—20.0% of median in 1-Day final-offer premiums, rounded to the nearest 5%.
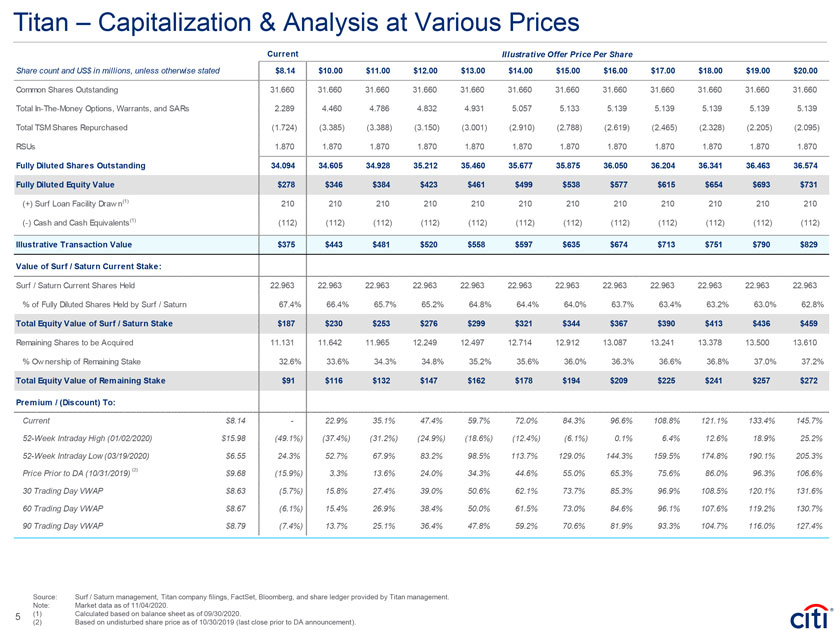
Titan – Capitalization & Analysis at Various Prices Current Illustrative Offer Price Per Share Share count and US$ in millions, unless otherwise stated $8.14 $10.00 $11.00 $12.00 $13.00 $14.00 $15.00 $16.00 $17.00 $18.00 $19.00 $20.00 Common Shares Outstanding 31.660 31.660 31.660 31.660 31.660 31.660 31.660 31.660 31.660 31.660 31.660 31.660 Total In-The-Money Options, Warrants, and SARs 2.289 4.460 4.786 4.832 4.931 5.057 5.133 5.139 5.139 5.139 5.139 5.139 Total TSM Shares Repurchased (1.724) (3.385) (3.388) (3.150) (3.001) (2.910) (2.788) (2.619) (2.465) (2.328) (2.205) (2.095) RSUs 1.870 1.870 1.870 1.870 1.870 1.870 1.870 1.870 1.870 1.870 1.870 1.870 Fully Diluted Shares Outstanding 34.094 34.605 34.928 35.212 35.460 35.677 35.875 36.050 36.204 36.341 36.463 36.574 Fully Diluted Equity Value $278 $346 $384 $423 $461 $499 $538 $577 $615 $654 $693 $731 (+) Surf Loan Facility Draw n(1) 210 210 210 210 210 210 210 210 210 210 210 210 (-) Cash and Cash Equivalents(1) (112) (112) (112) (112) (112) (112) (112) (112) (112) (112) (112) (112) Illustrative Transaction Value $375 $443 $481 $520 $558 $597 $635 $674 $713 $751 $790 $829 Value of Surf / Saturn Current Stake: Surf / Saturn Current Shares Held 22.963 22.963 22.963 22.963 22.963 22.963 22.963 22.963 22.963 22.963 22.963 22.963 % of Fully Diluted Shares Held by Surf / Saturn 67.4% 66.4% 65.7% 65.2% 64.8% 64.4% 64.0% 63.7% 63.4% 63.2% 63.0% 62.8% Total Equity Value of Surf / Saturn Stake $187 $230 $253 $276 $299 $321 $344 $367 $390 $413 $436 $459 Remaining Shares to be Acquired 11.131 11.642 11.965 12.249 12.497 12.714 12.912 13.087 13.241 13.378 13.500 13.610 % Ow nership of Remaining Stake 32.6% 33.6% 34.3% 34.8% 35.2% 35.6% 36.0% 36.3% 36.6% 36.8% 37.0% 37.2% Total Equity Value of Remaining Stake $91 $116 $132 $147 $162 $178 $194 $209 $225 $241 $257 $272 Premium / (Discount) To: Current $8.14—22.9% 35.1% 47.4% 59.7% 72.0% 84.3% 96.6% 108.8% 121.1% 133.4% 145.7% 52-Week Intraday High (01/02/2020) $15.98 (49.1%) (37.4%) (31.2%) (24.9%) (18.6%) (12.4%) (6.1%) 0.1% 6.4% 12.6% 18.9% 25.2% 52-Week Intraday Low (03/19/2020) $6.55 24.3% 52.7% 67.9% 83.2% 98.5% 113.7% 129.0% 144.3% 159.5% 174.8% 190.1% 205.3% Price Prior to DA (10/31/2019) (2) $9.68 (15.9%) 3.3% 13.6% 24.0% 34.3% 44.6% 55.0% 65.3% 75.6% 86.0% 96.3% 106.6% 30 Trading Day VWAP $8.63 (5.7%) 15.8% 27.4% 39.0% 50.6% 62.1% 73.7% 85.3% 96.9% 108.5% 120.1% 131.6% 60 Trading Day VWAP $8.67 (6.1%) 15.4% 26.9% 38.4% 50.0% 61.5% 73.0% 84.6% 96.1% 107.6% 119.2% 130.7% 90 Trading Day VWAP $8.79 (7.4%) 13.7% 25.1% 36.4% 47.8% 59.2% 70.6% 81.9% 93.3% 104.7% 116.0% 127.4% Source: Surf / Saturn management, Titan company filings, FactSet, Bloomberg, and share ledger provided by Titan management. Note: Market data as of 11/04/2020. 5 (1) Calculated based on balance sheet as of 09/30/2020. (2) Based on undisturbed share price as of 10/30/2019 (last close prior to DA announcement).
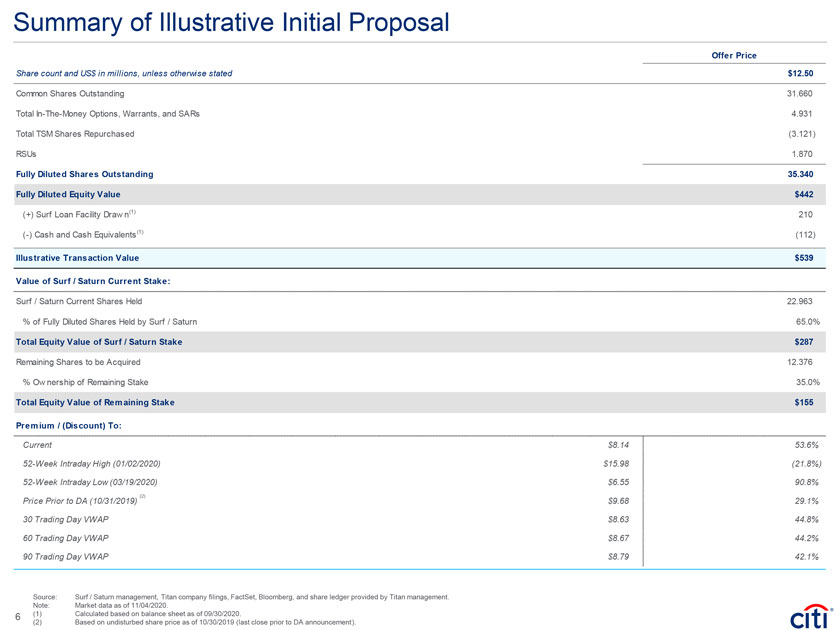
Summary of Illustrative Initial Proposal Offer Price Share count and US$ in millions, unless otherwise stated $12.50 Common Shares Outstanding 31.660 Total In-The-Money Options, Warrants, and SARs 4.931 Total TSM Shares Repurchased (3.121) RSUs 1.870 Fully Diluted Shares Outstanding 35.340 Fully Diluted Equity Value $442 (+) Surf Loan Facility Draw n(1) 210 (-) Cash and Cash Equivalents(1) (112) Illustrative Transaction Value $539 Value of Surf / Saturn Current Stake: Surf / Saturn Current Shares Held 22.963 % of Fully Diluted Shares Held by Surf / Saturn 65.0% Total Equity Value of Surf / Saturn Stake $287 Remaining Shares to be Acquired 12.376 % Ow nership of Remaining Stake 35.0% Total Equity Value of Remaining Stake $155 Premium / (Discount) To: Current $8.14 53.6% 52-Week Intraday High (01/02/2020) $15.98 (21.8%) 52-Week Intraday Low (03/19/2020) $6.55 90.8% (2) Price Prior to DA (10/31/2019) $9.68 29.1% 30 Trading Day VWAP $8.63 44.8% 60 Trading Day VWAP $8.67 44.2% 90 Trading Day VWAP $8.79 42.1% Source: Surf / Saturn management, Titan company filings, FactSet, Bloomberg, and share ledger provided by Titan management. Note: Market data as of 11/04/2020. 6 (1) Calculated based on balance sheet as of 09/30/2020. (2) Based on undisturbed share price as of 10/30/2019 (last close prior to DA announcement).