| PennyMac Financial Services, Inc. 4Q25 EARNINGS REPORT January 2026 |

| This presentation contains forward-looking statements within the meaning of Section 21E of the Securities Exchange Act of 1934, as amended, regarding management’s beliefs, estimates, projections and assumptions with respect to, among other things, our financial results, future operations, business plans and investment strategies, as well as industry and market conditions, all of which are subject to change. Words like “believe,” “expect,” “anticipate,” “promise,” “project,” “plan,” and other expressions or words of similar meanings, as well as future or conditional verbs such as “will,” “would,” “should,” “could,” or “may” are generally intended to identify forward-looking statements. Actual results and operations for any future period may vary materially from those projected herein and from past results discussed herein. These forward-looking statements include, but are not limited to, statements regarding future changes in interest rates, prepayment rates and the housing market; future loan origination, servicing and production, including future production, operating and hedge expenses; future loan delinquencies, defaults and forbearances; future earnings, return on equity as well as other business and financial projections and expectations. Factors which could cause actual results to differ materially from historical results or those anticipated include, but are not limited to: interest rate changes; changes in macroeconomic, consumer and real estate market conditions; changes in housing prices, housing sales and real estate values; changes in homeownership costs and affordability; compliance with changing federal, state and local laws and regulations applicable to the highly regulated industry in which we operate; lawsuits or governmental actions that may result from any noncompliance with the laws and regulations applicable to our business; the mortgage lending and servicing-related regulations promulgated by federal and state regulators and the enforcement of these regulations; the licensing and operational requirements of states and other jurisdictions applicable to our business, to which our bank competitors are not subject; difficulties inherent in adjusting the size of our operations to reflect changes in business levels; purchase and sales opportunities for mortgage servicing rights; our substantial amount of indebtedness; increases in loan delinquencies, defaults and forbearances; foreclosure delays and changes in foreclosure practices; our dependence on U.S. government-sponsored entities and changes in their current roles or their guarantees or guidelines; our reliance on PennyMac Mortgage Investment Trust (NYSE: PMT) as a significant contributor to our mortgage banking business; maintaining sufficient capital and liquidity and compliance with financial covenants; our obligation to indemnify third-party purchasers or repurchase loans if loans that we originate, acquire, service or assist in the fulfillment of, fail to meet certain criteria; our obligation to indemnify PMT if our services fail to meet certain criteria or characteristics or under other circumstances; investment management and incentive fees; the accuracy or changes in the estimates we make about uncertainties, contingencies and asset and liability valuations; conflicts of interest in allocating our services and investment opportunities among us and our advised entity; our ability to mitigate cybersecurity risks, cyber incidents and technology disruptions; the development of artificial intelligence; the effect of public opinion on our reputation; our exposure to risks of loss from severe weather events, man-made or other natural conditions, including climate change and pandemics; our ability to effectively identify, manage and hedge our credit, interest rate, prepayment, liquidity and climate risks; expanding or creating new business activities or strategies; our ability to detect misconduct and fraud; our ability to pay dividends to our stockholders; and our organizational structure and certain requirements in our charter documents. You should not place undue reliance on any forward-looking statement and should consider all of the uncertainties and risks described above, as well as those more fully discussed in reports and other documents filed by the Company with the Securities and Exchange Commission from time to time. The Company undertakes no obligation to publicly update or revise any forward-looking statements or any other information contained herein, and the statements made in this presentation are current as of the date of this presentation only. This presentation contains financial information calculated other than in accordance with U.S. generally accepted accounting principles (“GAAP”), such as pretax income excluding valuation-related items, operating net income, operating return on equity and others that provide a meaningful perspective on the Company’s business results since the Company utilizes this information to evaluate and manage the business. Non-GAAP disclosures have limitations as an analytical tool and should not be viewed as a substitute for financial information determined in accordance with GAAP. 2 FORWARD-LOOKING STATEMENTS |
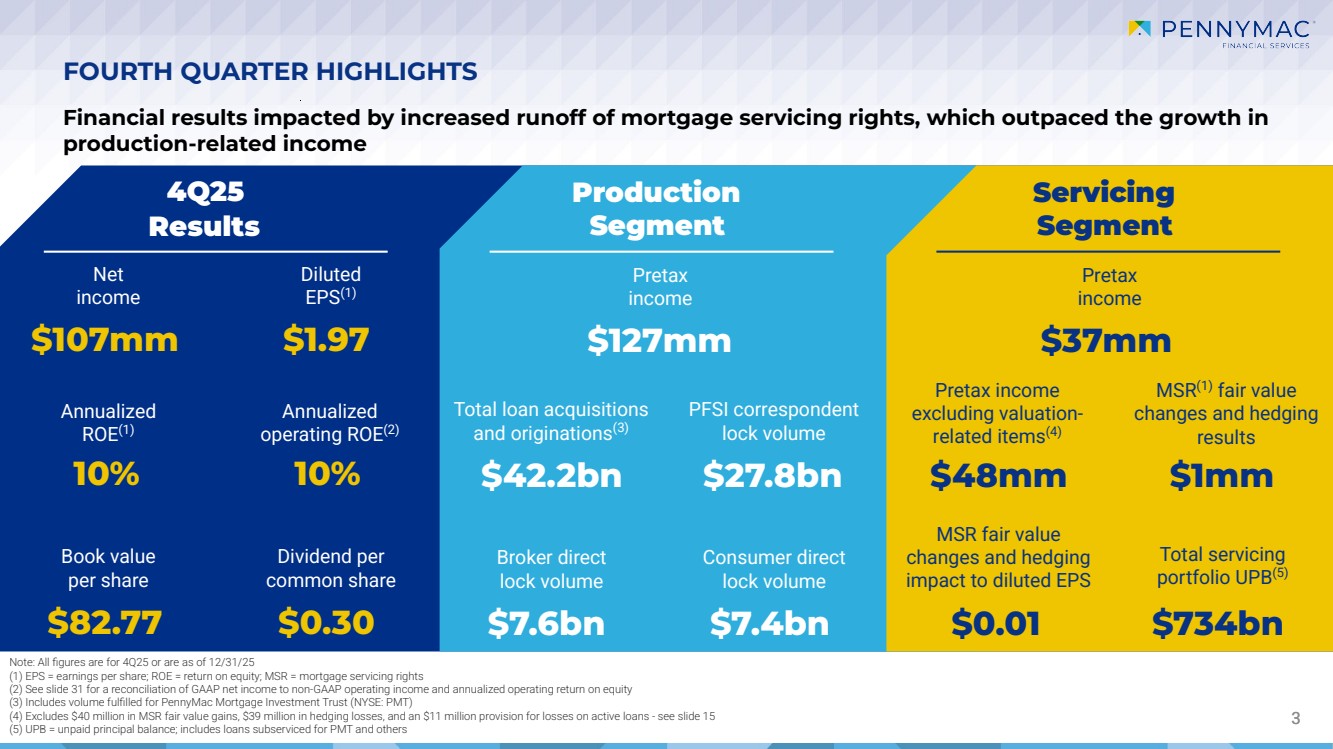
| 3 4Q25 Results Production Segment Servicing Segment FOURTH QUARTER HIGHLIGHTS Note: All figures are for 4Q25 or are as of 12/31/25 (1) EPS = earnings per share; ROE = return on equity; MSR = mortgage servicing rights (2) See slide 31 for a reconciliation of GAAP net income to non-GAAP operating income and annualized operating return on equity (3) Includes volume fulfilled for PennyMac Mortgage Investment Trust (NYSE: PMT) (4) Excludes $40 million in MSR fair value gains, $39 million in hedging losses, and an $11 million provision for losses on active loans - see slide 15 (5) UPB = unpaid principal balance; includes loans subserviced for PMT and others Annualized ROE(1) Annualized operating ROE(2) Book value per share Dividend per common share Pretax income Total loan acquisitions and originations(3) PFSI correspondent lock volume Broker direct lock volume Consumer direct lock volume Pretax income Pretax income excluding valuation-related items(4) MSR(1) fair value changes and hedging results MSR fair value changes and hedging impact to diluted EPS Total servicing portfolio UPB(5) $107mm $1.97 10% 10% $82.77 $0.30 $42.2bn $27.8bn $7.6bn $7.4bn $127mm $37mm $48mm $1mm $0.01 $734bn Net income Diluted EPS(1) Financial results impacted by increased runoff of mortgage servicing rights, which outpaced the growth in production-related income |
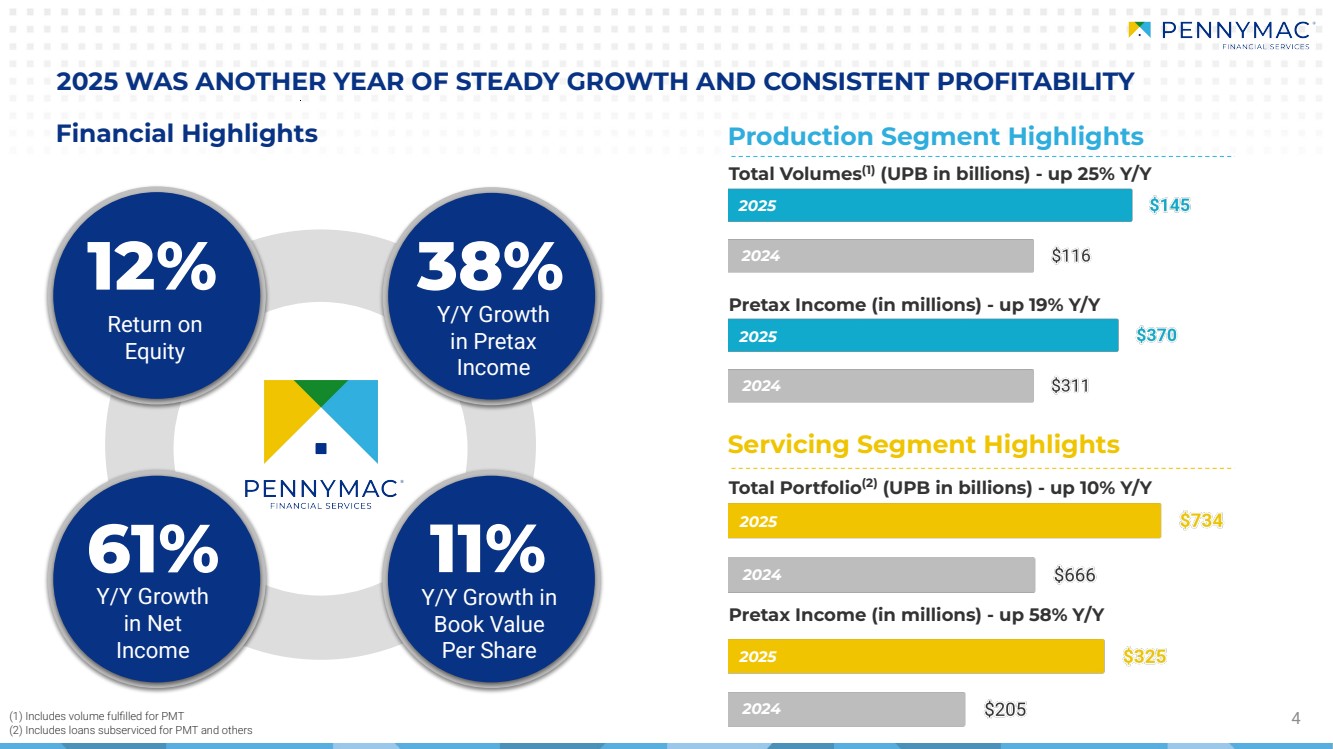
| 2025 WAS ANOTHER YEAR OF STEADY GROWTH AND CONSISTENT PROFITABILITY 4 38% Y/Y Growth in Pretax Income 12% Return on Equity 61% Y/Y Growth in Net Income 11% Y/Y Growth in Book Value Per Share Financial Highlights (1) Includes volume fulfilled for PMT (2) Includes loans subserviced for PMT and others Production Segment Highlights Total Volumes(1) (UPB in billions) - up 25% Y/Y Pretax Income (in millions) - up 19% Y/Y Servicing Segment Highlights Total Portfolio(2) (UPB in billions) - up 10% Y/Y Pretax Income (in millions) - up 58% Y/Y 2025 2024 2025 2024 2025 2024 2025 2024 |
| 4Q25 STRATEGIC UPDATE |

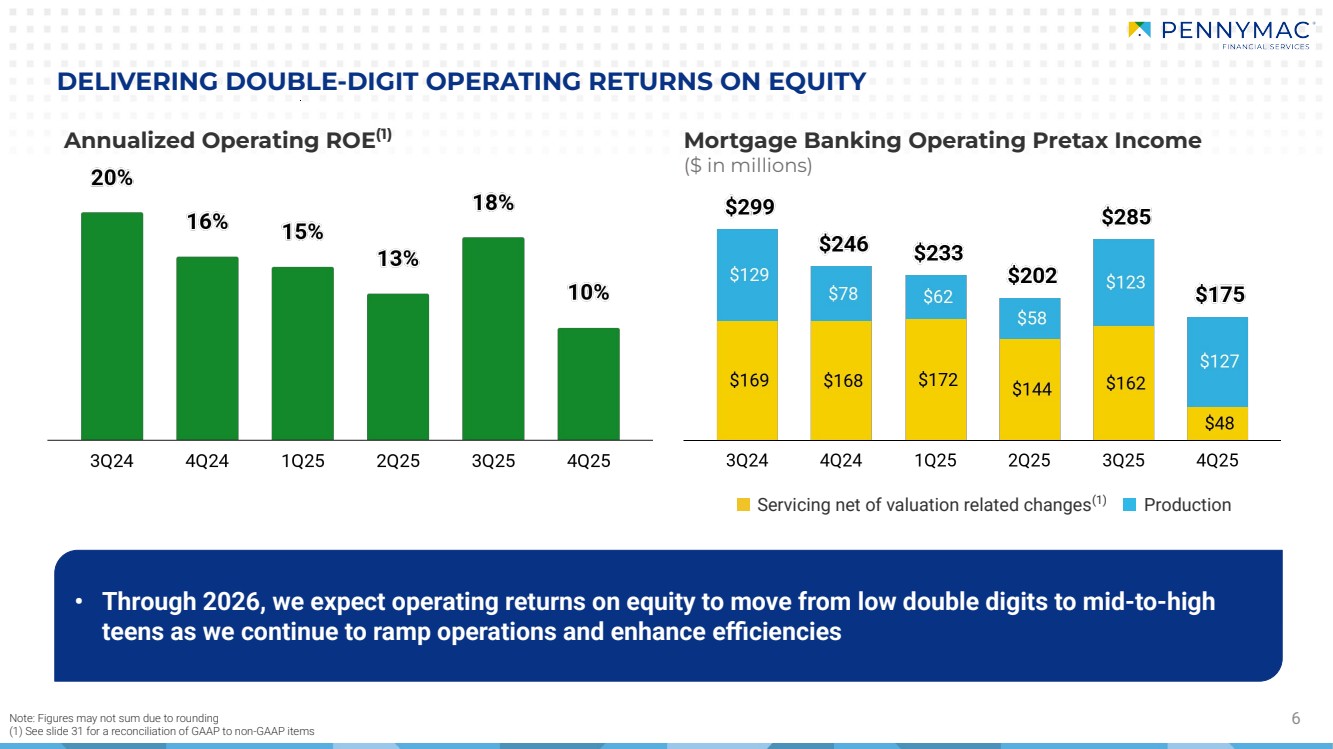
| Mortgage Banking Operating Pretax Income ($ in millions) Production 6 Annualized Operating ROE(1) Note: Figures may not sum due to rounding (1) See slide 31 for a reconciliation of GAAP to non-GAAP items Servicing net of valuation related changes(1) DELIVERING DOUBLE-DIGIT OPERATING RETURNS ON EQUITY • Through 2026, we expect operating returns on equity to move from low double digits to mid-to-high teens as we continue to ramp operations and enhance efficiencies |
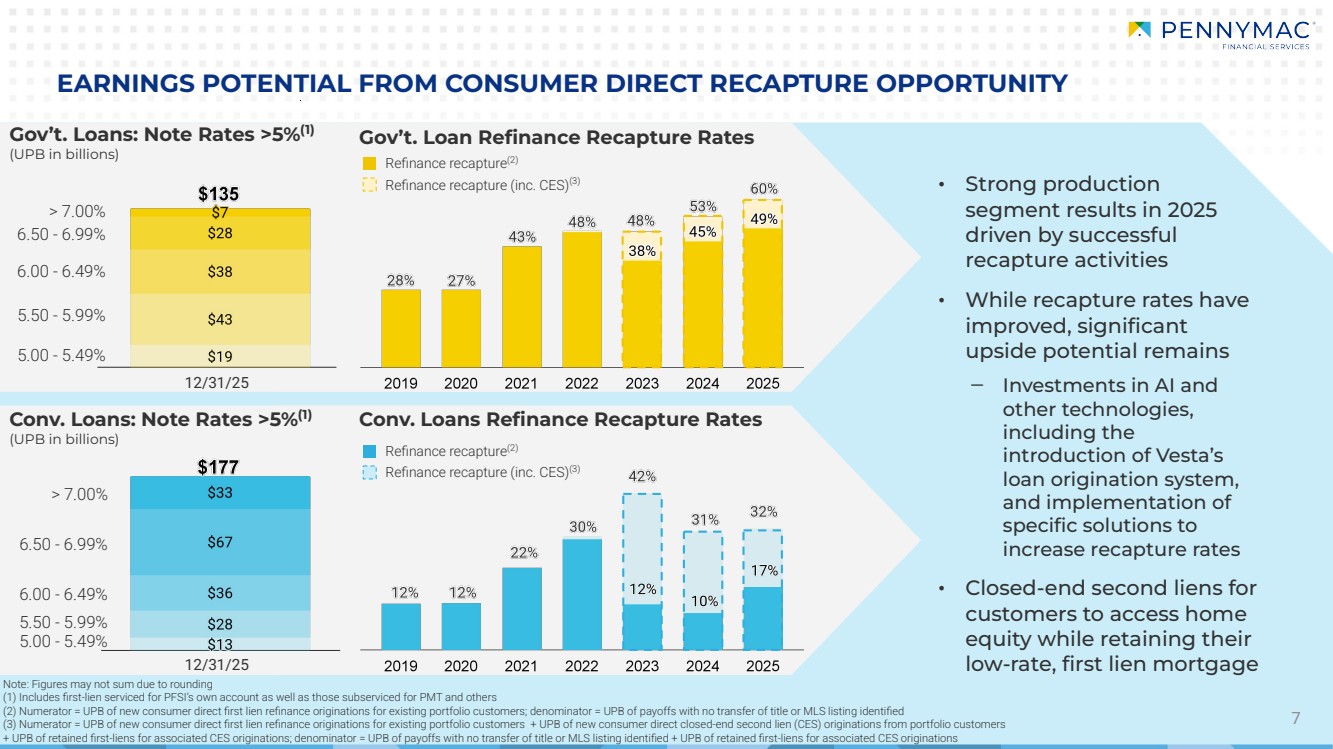
| 7 EARNINGS POTENTIAL FROM CONSUMER DIRECT RECAPTURE OPPORTUNITY Gov’t. Loan Refinance Recapture Rates Conv. Loans Refinance Recapture Rates > 7.00% 6.50 - 6.99% 5.50 - 5.99% 6.00 - 6.49% 5.00 - 5.49% Note: Figures may not sum due to rounding (1) Includes first-lien serviced for PFSI’s own account as well as those subserviced for PMT and others (2) Numerator = UPB of new consumer direct first lien refinance originations for existing portfolio customers; denominator = UPB of payoffs with no transfer of title or MLS listing identified (3) Numerator = UPB of new consumer direct first lien refinance originations for existing portfolio customers + UPB of new consumer direct closed-end second lien (CES) originations from portfolio customers + UPB of retained first-liens for associated CES originations; denominator = UPB of payoffs with no transfer of title or MLS listing identified + UPB of retained first-liens for associated CES originations Refinance recapture(2) Refinance recapture (inc. CES)(3) Refinance recapture(2) Refinance recapture (inc. CES)(3) Gov’t. Loans: Note Rates >5%(1) (UPB in billions) Conv. Loans: Note Rates >5%(1) (UPB in billions) 12/31/25 12/31/25 > 7.00% 6.50 - 6.99% 6.00 - 6.49% 5.50 - 5.99% 5.00 - 5.49% • Strong production segment results in 2025 driven by successful recapture activities • While recapture rates have improved, significant upside potential remains ‒ Investments in AI and other technologies, including the introduction of Vesta’s loan origination system, and implementation of specific solutions to increase recapture rates • Closed-end second liens for customers to access home equity while retaining their low-rate, first lien mortgage |
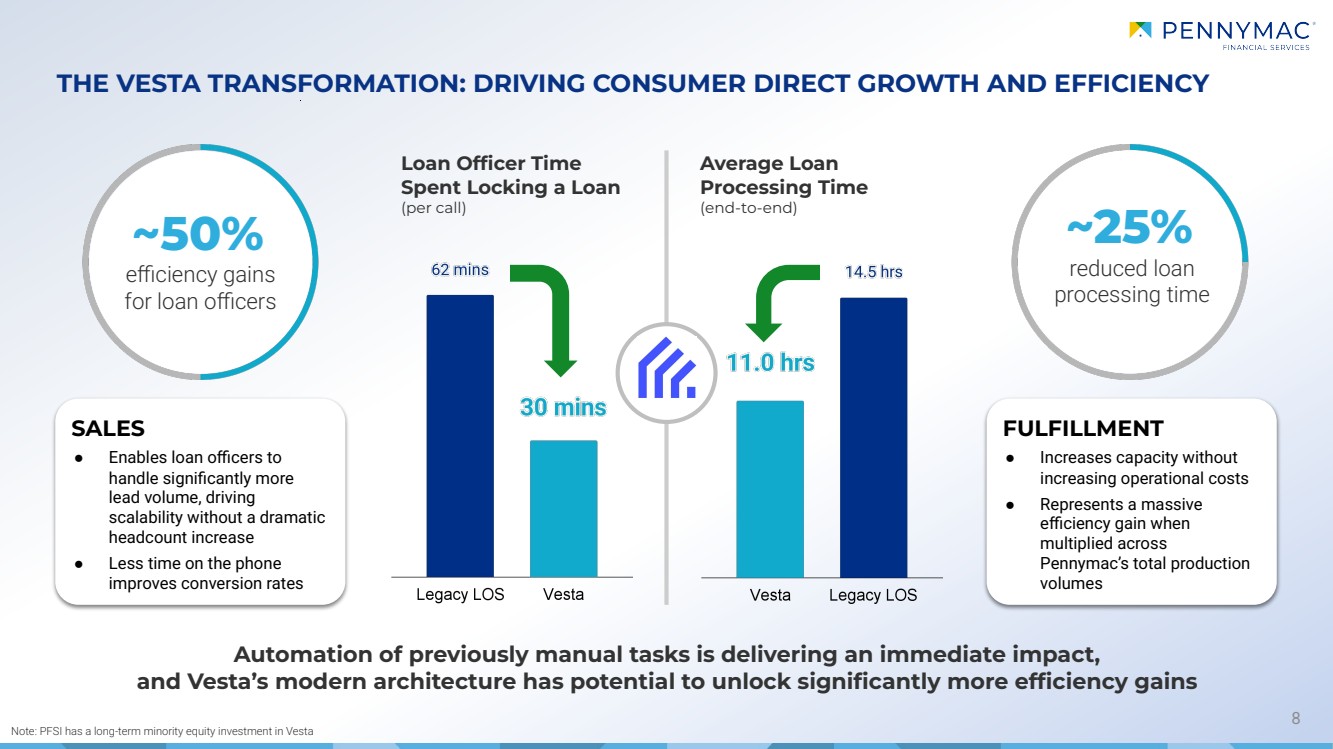
| 8 THE VESTA TRANSFORMATION: DRIVING CONSUMER DIRECT GROWTH AND EFFICIENCY Loan Officer Time Spent Locking a Loan (per call) Average Loan Processing Time (end-to-end) ~50% efficiency gains for loan officers ~25% reduced loan processing time SALES ● Enables loan officers to handle significantly more lead volume, driving scalability without a dramatic headcount increase ● Less time on the phone improves conversion rates FULFILLMENT ● Increases capacity without increasing operational costs ● Represents a massive efficiency gain when multiplied across Pennymac’s total production volumes Automation of previously manual tasks is delivering an immediate impact, and Vesta’s modern architecture has potential to unlock significantly more efficiency gains Note: PFSI has a long-term minority equity investment in Vesta |
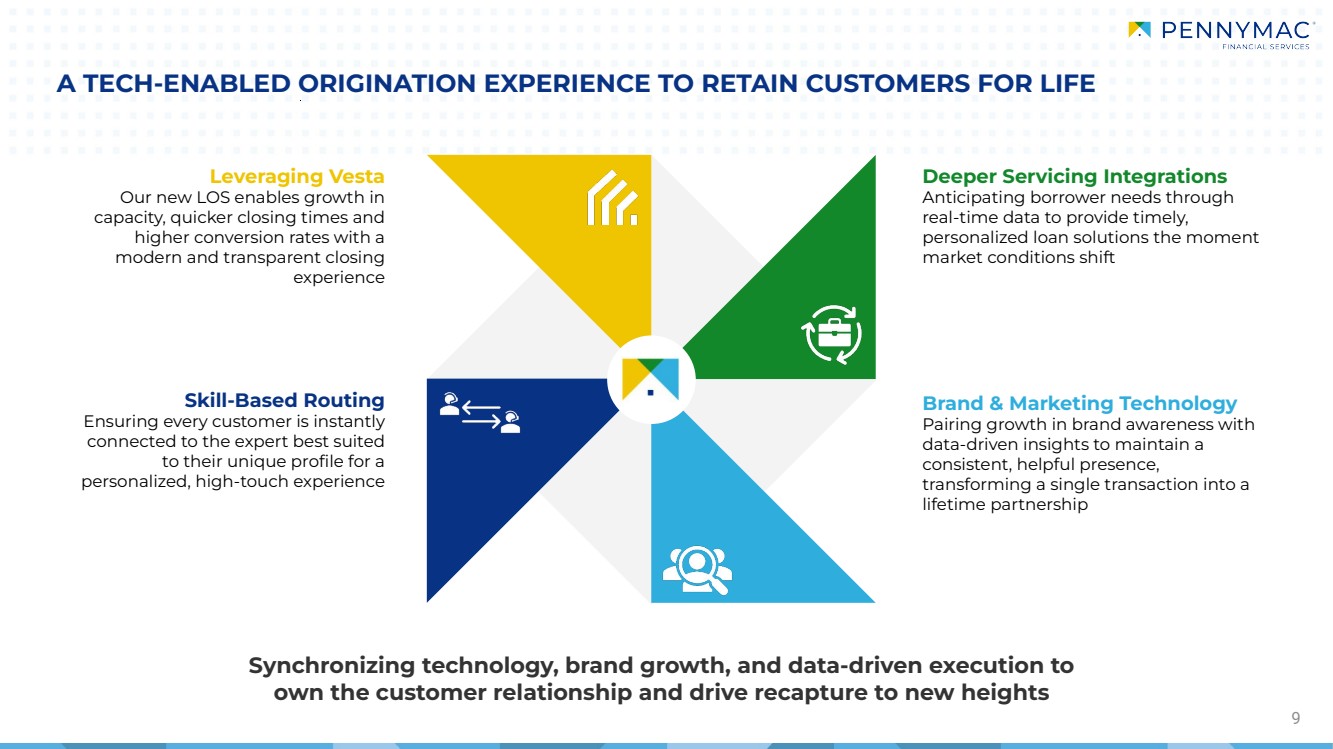
| 9 Synchronizing technology, brand growth, and data-driven execution to own the customer relationship and drive recapture to new heights Leveraging Vesta Our new LOS enables growth in capacity, quicker closing times and higher conversion rates with a modern and transparent closing experience Skill-Based Routing Ensuring every customer is instantly connected to the expert best suited to their unique profile for a personalized, high-touch experience Deeper Servicing Integrations Anticipating borrower needs through real-time data to provide timely, personalized loan solutions the moment market conditions shift Brand & Marketing Technology Pairing growth in brand awareness with data-driven insights to maintain a consistent, helpful presence, transforming a single transaction into a lifetime partnership A TECH-ENABLED ORIGINATION EXPERIENCE TO RETAIN CUSTOMERS FOR LIFE |
| KEY OPERATING METRICS & OTHER FINANCIAL SCHEDULES |

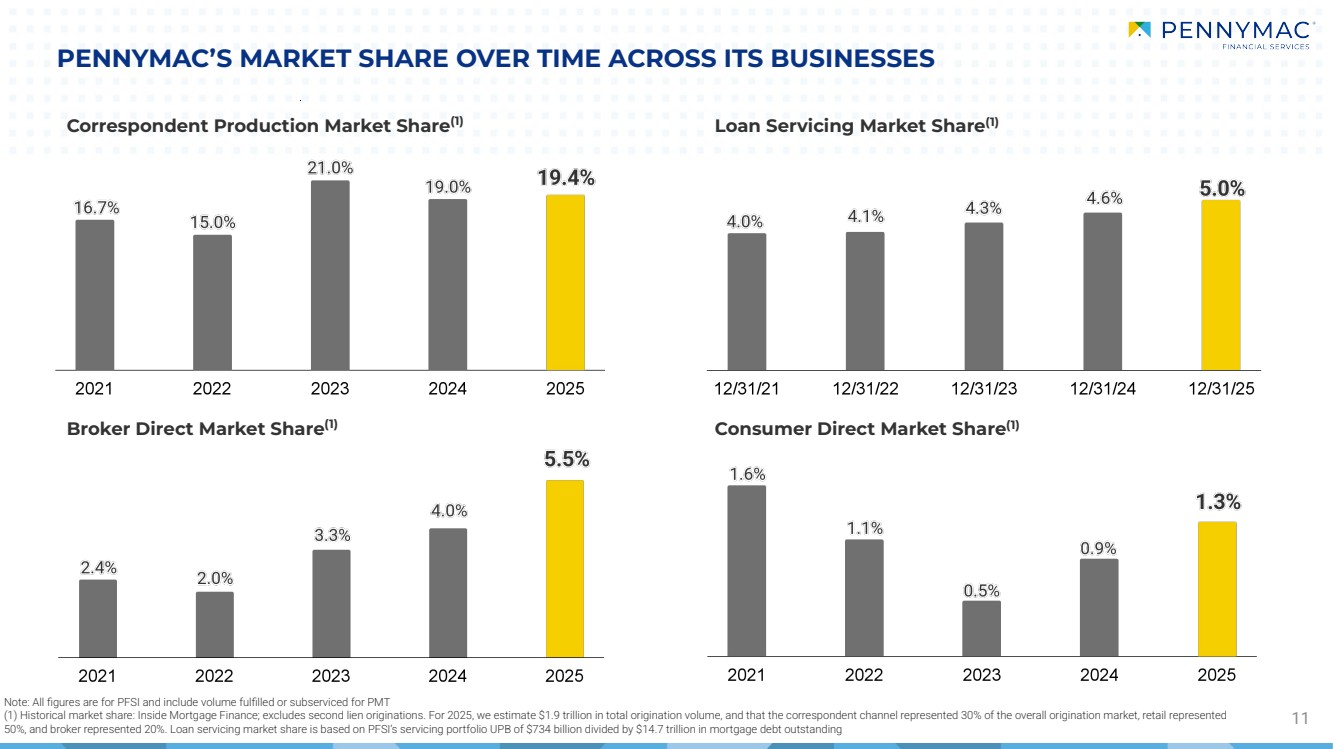
| PENNYMAC’S MARKET SHARE OVER TIME ACROSS ITS BUSINESSES 11 Loan Servicing Market Share Correspondent Production Market Share(1) (1) Broker Direct Market Share(1) Consumer Direct Market Share(1) Note: All figures are for PFSI and include volume fulfilled or subserviced for PMT (1) Historical market share: Inside Mortgage Finance; excludes second lien originations. For 2025, we estimate $1.9 trillion in total origination volume, and that the correspondent channel represented 30% of the overall origination market, retail represented 50%, and broker represented 20%. Loan servicing market share is based on PFSI’s servicing portfolio UPB of $734 billion divided by $14.7 trillion in mortgage debt outstanding |
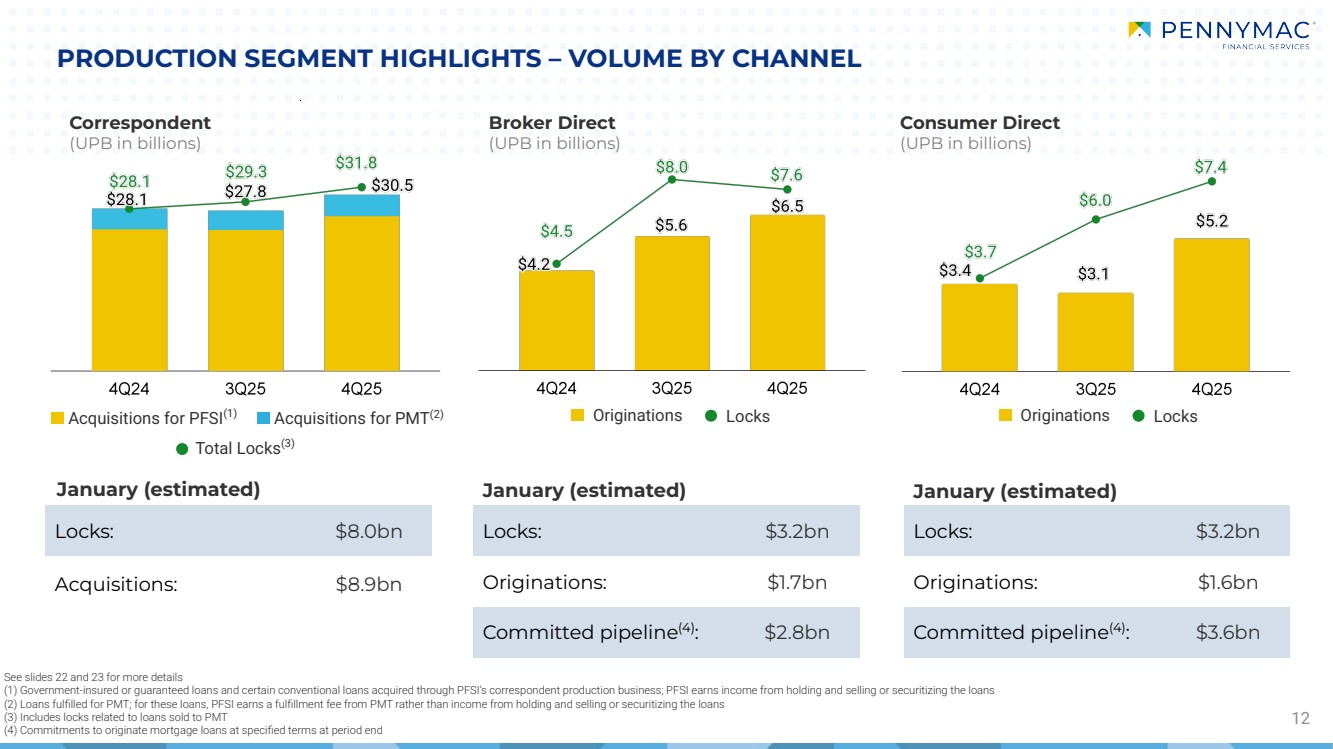
| Acquisitions for PFSI(1) 12 PRODUCTION SEGMENT HIGHLIGHTS – VOLUME BY CHANNEL Broker Direct (UPB in billions) See slides 22 and 23 for more details (1) Government-insured or guaranteed loans and certain conventional loans acquired through PFSI’s correspondent production business; PFSI earns income from holding and selling or securitizing the loans (2) Loans fulfilled for PMT; for these loans, PFSI earns a fulfillment fee from PMT rather than income from holding and selling or securitizing the loans (3) Includes locks related to loans sold to PMT (4) Commitments to originate mortgage loans at specified terms at period end Consumer Direct (UPB in billions) Correspondent (UPB in billions) Acquisitions for PMT(2) Originations Locks: $8.0bn Acquisitions: $8.9bn Locks: $3.2bn Originations: $1.7bn Committed pipeline(4): $2.8bn Locks: $3.2bn Originations: $1.6bn Committed pipeline(4): $3.6bn Total Locks(3) January (estimated) January (estimated) January (estimated) Locks Originations Locks |
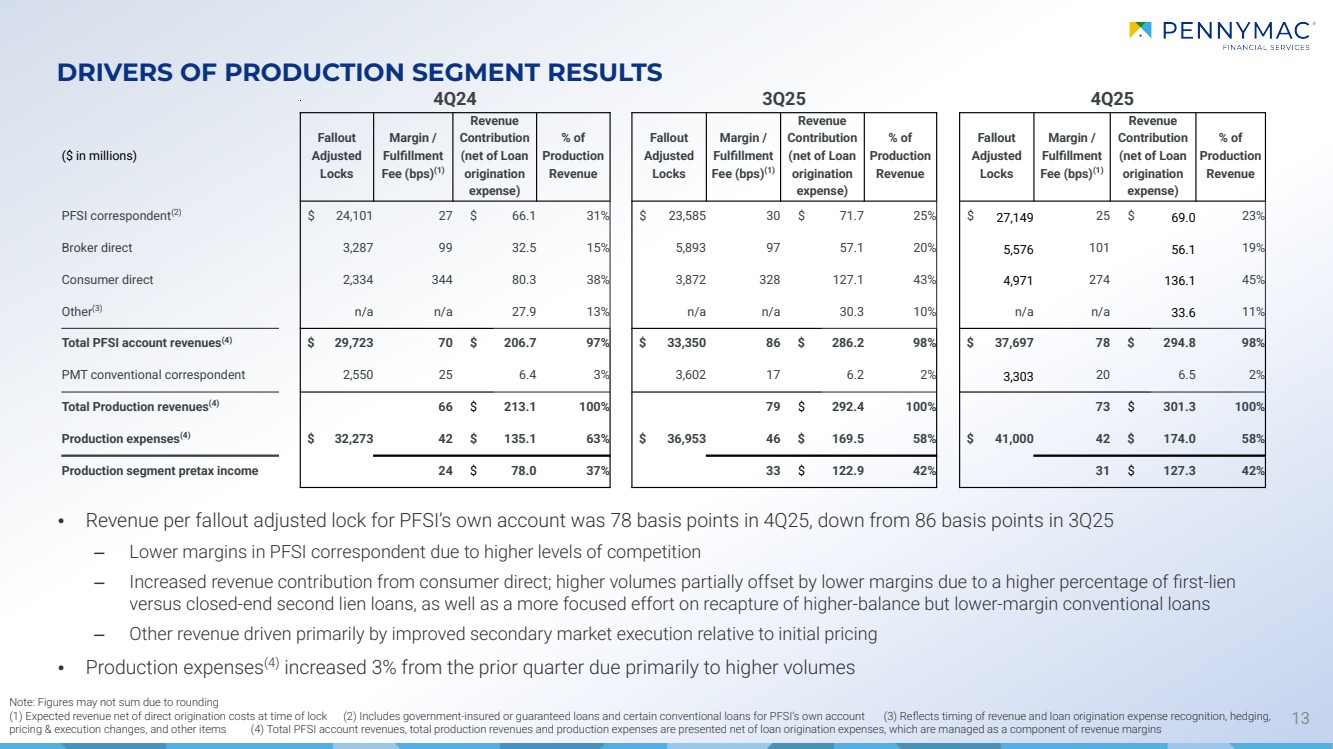
| • Revenue per fallout adjusted lock for PFSI’s own account was 78 basis points in 4Q25, down from 86 basis points in 3Q25 ‒ Lower margins in PFSI correspondent due to higher levels of competition ‒ Increased revenue contribution from consumer direct; higher volumes partially offset by lower margins due to a higher percentage of first-lien versus closed-end second lien loans, as well as a more focused effort on recapture of higher-balance but lower-margin conventional loans ‒ Other revenue driven primarily by improved secondary market execution relative to initial pricing • Production expenses(4) increased 3% from the prior quarter due primarily to higher volumes 13 DRIVERS OF PRODUCTION SEGMENT RESULTS 4Q24 3Q25 4Q25 ($ in millions) Fallout Adjusted Locks Margin / Fulfillment Fee (bps)(1) Revenue Contribution (net of Loan origination expense) % of Production Revenue Fallout Adjusted Locks Margin / Fulfillment Fee (bps)(1) Revenue Contribution (net of Loan origination expense) % of Production Revenue Fallout Adjusted Locks Margin / Fulfillment Fee (bps)(1) Revenue Contribution (net of Loan origination expense) % of Production Revenue PFSI correspondent(2) $ 24,101 27 $ 66.1 31% $ 23,585 30 $ 71.7 25% $ 27,149 25 $ 69.0 23% Broker direct 3,287 99 32.5 15% 5,893 97 57.1 20% 5,576 101 56.1 19% Consumer direct 2,334 344 80.3 38% 3,872 328 127.1 43% 4,971 274 136.1 45% Other(3) n/a n/a 27.9 13% n/a n/a 30.3 10% n/a n/a 33.6 11% Total PFSI account revenues(4) $ 29,723 70 $ 206.7 97% $ 33,350 86 $ 286.2 98% $ 37,697 78 $ 294.8 98% PMT conventional correspondent 2,550 25 6.4 3% 3,602 17 6.2 2% 3,303 20 6.5 2% Total Production revenues(4) 66 $ 213.1 100% 79 $ 292.4 100% 73 $ 301.3 100% Production expenses(4) $ 32,273 42 $ 135.1 63% $ 36,953 46 $ 169.5 58% $ 41,000 42 $ 174.0 58% Production segment pretax income 24 $ 78.0 37% 33 $ 122.9 42% 31 $ 127.3 42% Note: Figures may not sum due to rounding (1) Expected revenue net of direct origination costs at time of lock (2) Includes government-insured or guaranteed loans and certain conventional loans for PFSI’s own account (3) Reflects timing of revenue and loan origination expense recognition, hedging, pricing & execution changes, and other items (4) Total PFSI account revenues, total production revenues and production expenses are presented net of loan origination expenses, which are managed as a component of revenue margins |
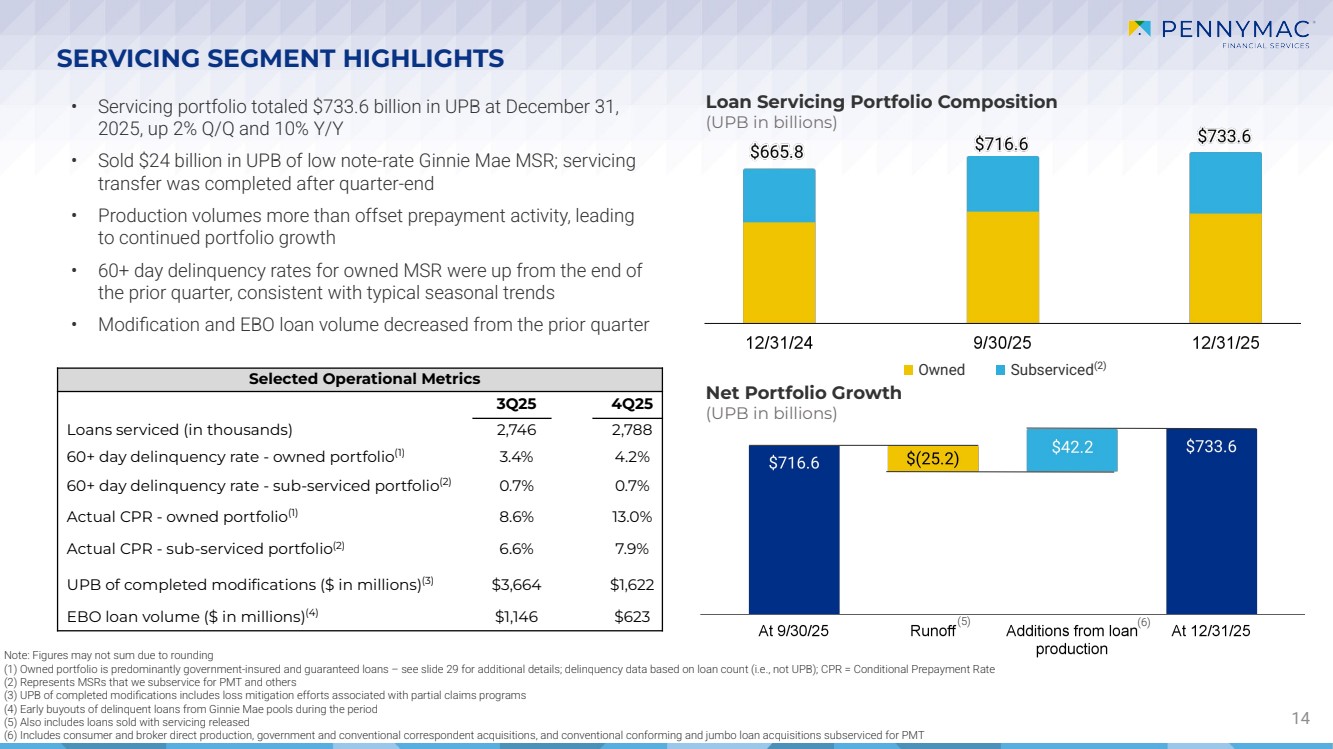
| Selected Operational Metrics 3Q25 4Q25 Loans serviced (in thousands) 2,746 2,788 60+ day delinquency rate - owned portfolio(1) 3.4% 4.2% 60+ day delinquency rate - sub-serviced portfolio(2) 0.7% 0.7% Actual CPR - owned portfolio(1) 8.6% 13.0% Actual CPR - sub-serviced portfolio(2) 6.6% 7.9% UPB of completed modifications ($ in millions)(3) $3,664 $1,622 EBO loan volume ($ in millions)(4) $1,146 $623 Owned Subserviced(2) SERVICING SEGMENT HIGHLIGHTS 14 Loan Servicing Portfolio Composition (UPB in billions) Net Portfolio Growth (UPB in billions) Note: Figures may not sum due to rounding (1) Owned portfolio is predominantly government-insured and guaranteed loans – see slide 29 for additional details; delinquency data based on loan count (i.e., not UPB); CPR = Conditional Prepayment Rate (2) Represents MSRs that we subservice for PMT and others (3) UPB of completed modifications includes loss mitigation efforts associated with partial claims programs (4) Early buyouts of delinquent loans from Ginnie Mae pools during the period (5) Also includes loans sold with servicing released (6) Includes consumer and broker direct production, government and conventional correspondent acquisitions, and conventional conforming and jumbo loan acquisitions subserviced for PMT (5) (6) • Servicing portfolio totaled $733.6 billion in UPB at December 31, 2025, up 2% Q/Q and 10% Y/Y • Sold $24 billion in UPB of low note-rate Ginnie Mae MSR; servicing transfer was completed after quarter-end • Production volumes more than offset prepayment activity, leading to continued portfolio growth • 60+ day delinquency rates for owned MSR were up from the end of the prior quarter, consistent with typical seasonal trends • Modification and EBO loan volume decreased from the prior quarter |
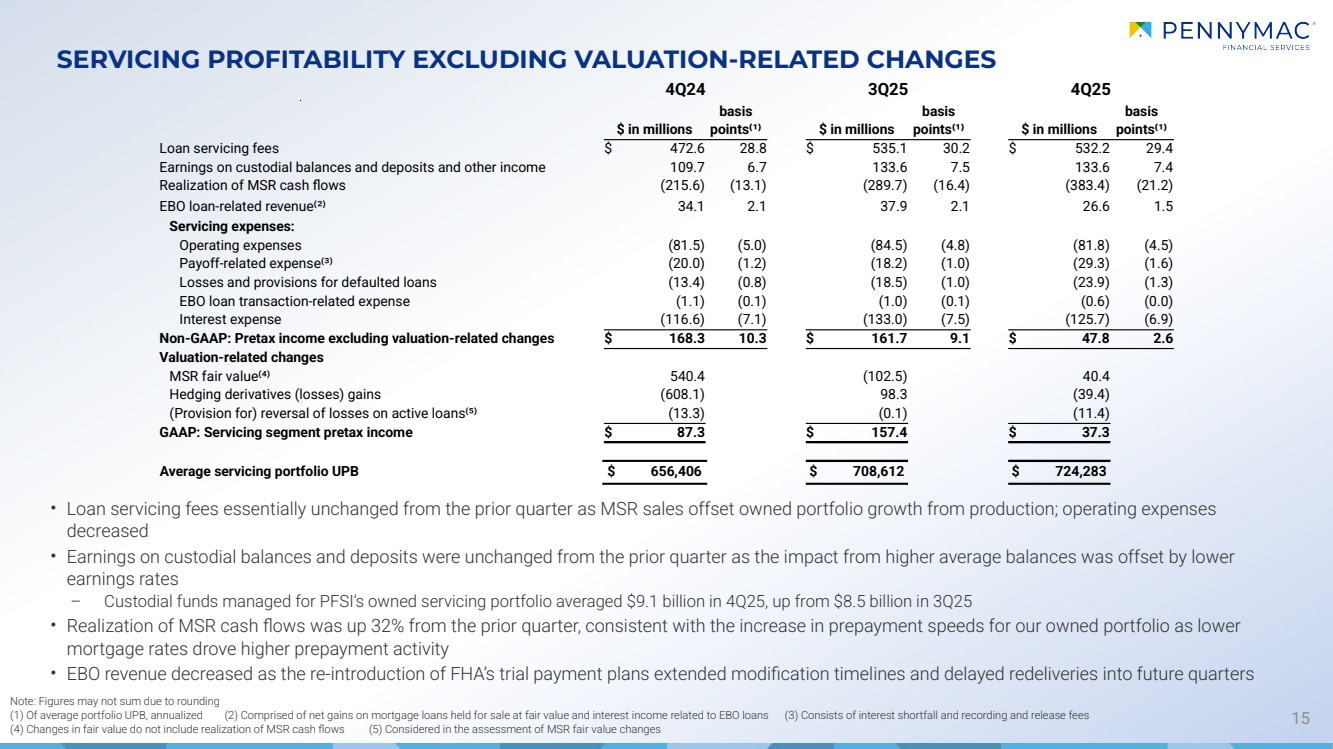
| SERVICING PROFITABILITY EXCLUDING VALUATION-RELATED CHANGES 15 Note: Figures may not sum due to rounding (1) Of average portfolio UPB, annualized (2) Comprised of net gains on mortgage loans held for sale at fair value and interest income related to EBO loans (3) Consists of interest shortfall and recording and release fees (4) Changes in fair value do not include realization of MSR cash flows (5) Considered in the assessment of MSR fair value changes 4Q24 3Q25 4Q25 $ in millions basis points⁽¹⁾ $ in millions basis points⁽¹⁾ $ in millions basis points⁽¹⁾ Loan servicing fees $ 472.6 28.8 $ 535.1 30.2 $ 532.2 29.4 Earnings on custodial balances and deposits and other income 109.7 6.7 133.6 7.5 133.6 7.4 Realization of MSR cash flows (215.6) (13.1) (289.7) (16.4) (383.4) (21.2) EBO loan-related revenue⁽²⁾ 34.1 2.1 37.9 2.1 26.6 1.5 Servicing expenses: Operating expenses (81.5) (5.0) (84.5) (4.8) (81.8) (4.5) Payoff-related expense⁽³⁾ (20.0) (1.2) (18.2) (1.0) (29.3) (1.6) Losses and provisions for defaulted loans (13.4) (0.8) (18.5) (1.0) (23.9) (1.3) EBO loan transaction-related expense (1.1) (0.1) (1.0) (0.1) (0.6) (0.0) Interest expense (116.6) (7.1) (133.0) (7.5) (125.7) (6.9) Non-GAAP: Pretax income excluding valuation-related changes $ 168.3 10.3 $ 161.7 9.1 $ 47.8 2.6 Valuation-related changes MSR fair value⁽⁴⁾ 540.4 (102.5) 40.4 Hedging derivatives (losses) gains (608.1) 98.3 (39.4) (Provision for) reversal of losses on active loans⁽⁵⁾ (13.3) (0.1) (11.4) GAAP: Servicing segment pretax income $ 87.3 $ 157.4 $ 37.3 Average servicing portfolio UPB $ 656,406 $ 708,612 $ 724,283 • Loan servicing fees essentially unchanged from the prior quarter as MSR sales offset owned portfolio growth from production; operating expenses decreased • Earnings on custodial balances and deposits were unchanged from the prior quarter as the impact from higher average balances was offset by lower earnings rates – Custodial funds managed for PFSI’s owned servicing portfolio averaged $9.1 billion in 4Q25, up from $8.5 billion in 3Q25 • Realization of MSR cash flows was up 32% from the prior quarter, consistent with the increase in prepayment speeds for our owned portfolio as lower mortgage rates drove higher prepayment activity • EBO revenue decreased as the re-introduction of FHA’s trial payment plans extended modification timelines and delayed redeliveries into future quarters |
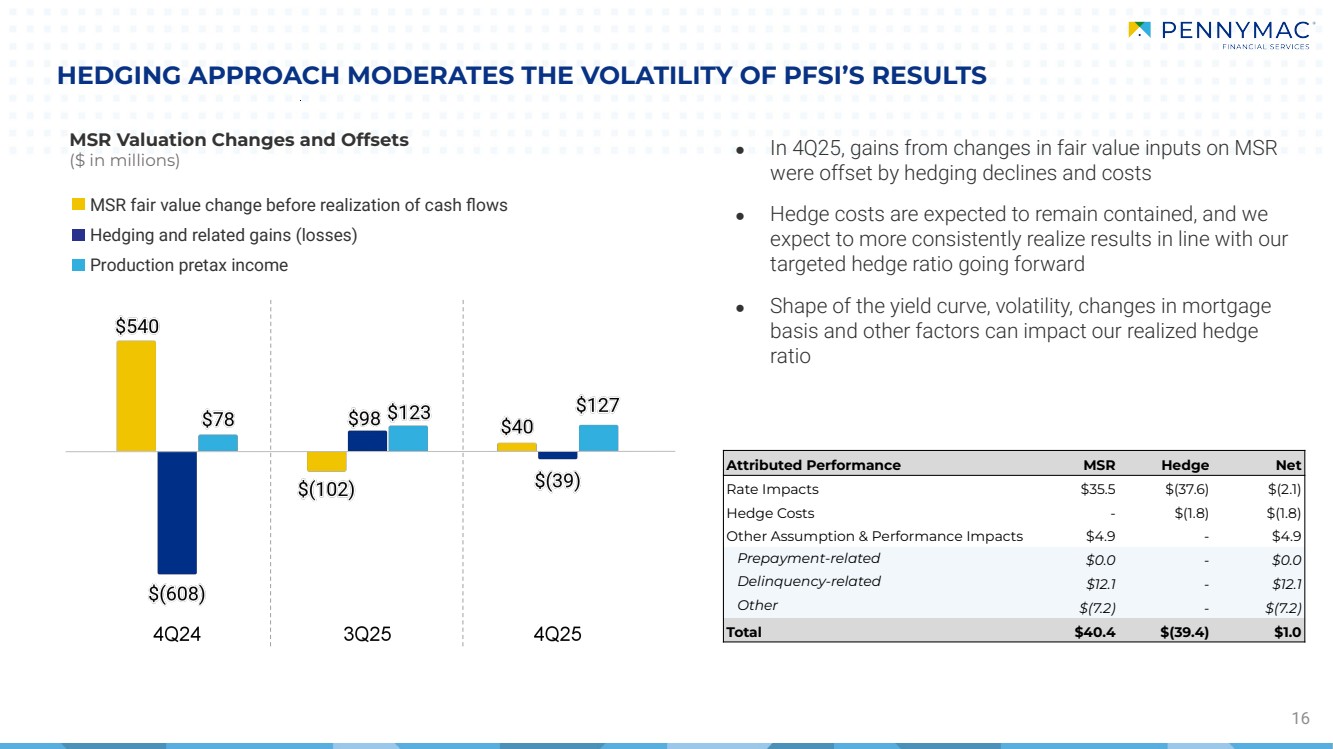
| 16 HEDGING APPROACH MODERATES THE VOLATILITY OF PFSI’S RESULTS MSR Valuation Changes and Offsets ($ in millions) MSR fair value change before realization of cash flows Hedging and related gains (losses) Production pretax income Attributed Performance MSR Hedge Net Rate Impacts $35.5 $(37.6) $(2.1) Hedge Costs - $(1.8) $(1.8) Other Assumption & Performance Impacts $4.9 - $4.9 Prepayment-related $0.0 - $0.0 Delinquency-related $12.1 - $12.1 Other $(7.2) - $(7.2) Total $40.4 $(39.4) $1.0 ● In 4Q25, gains from changes in fair value inputs on MSR were offset by hedging declines and costs ● Hedge costs are expected to remain contained, and we expect to more consistently realize results in line with our targeted hedge ratio going forward ● Shape of the yield curve, volatility, changes in mortgage basis and other factors can impact our realized hedge ratio |
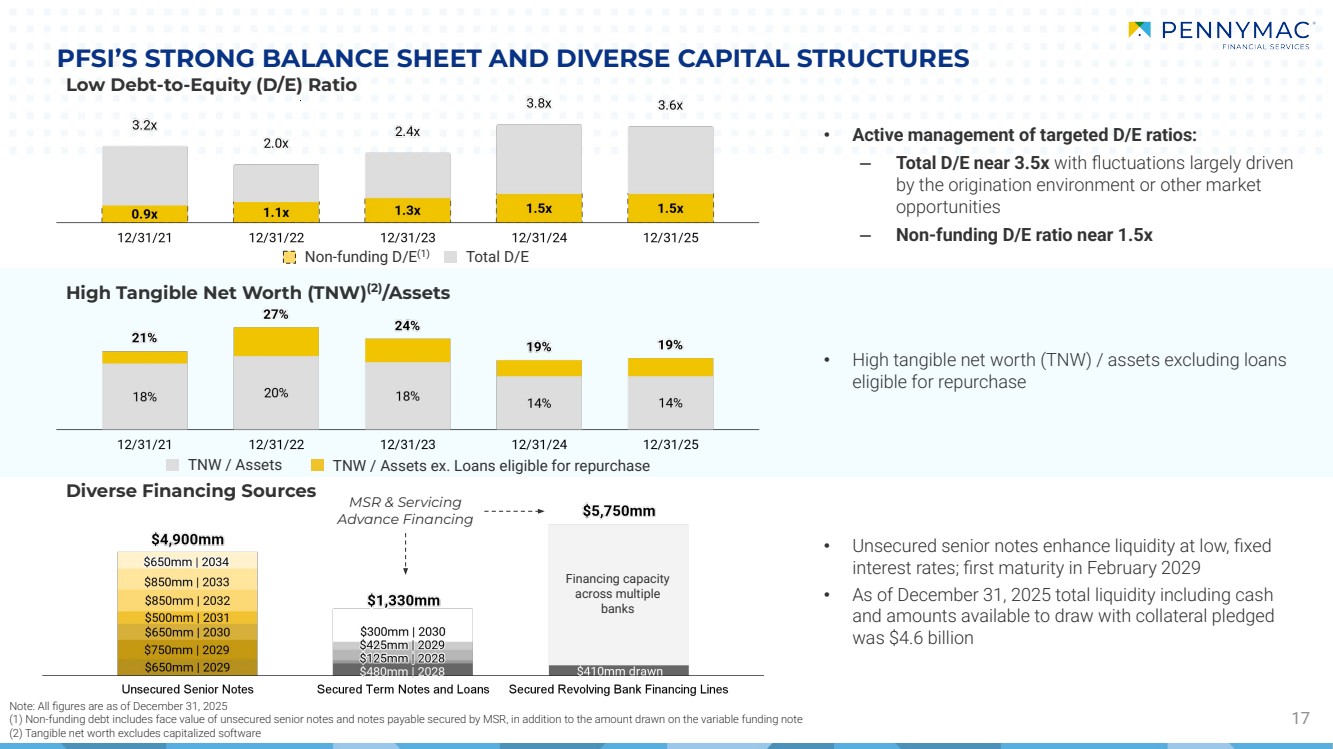
| • Active management of targeted D/E ratios: ‒ Total D/E near 3.5x with fluctuations largely driven by the origination environment or other market opportunities ‒ Non-funding D/E ratio near 1.5x MSR & Servicing Advance Financing PFSI’S STRONG BALANCE SHEET AND DIVERSE CAPITAL STRUCTURES 17 Low Debt-to-Equity (D/E) Ratio Diverse Financing Sources High Tangible Net Worth (TNW)(2)/Assets • High tangible net worth (TNW) / assets excluding loans eligible for repurchase • Unsecured senior notes enhance liquidity at low, fixed interest rates; first maturity in February 2029 • As of December 31, 2025 total liquidity including cash and amounts available to draw with collateral pledged was $4.6 billion Non-funding D/E(1) Total D/E TNW / Assets TNW / Assets ex. Loans eligible for repurchase Financing capacity across multiple banks Note: All figures are as of December 31, 2025 (1) Non-funding debt includes face value of unsecured senior notes and notes payable secured by MSR, in addition to the amount drawn on the variable funding note (2) Tangible net worth excludes capitalized software |
| APPENDIX |

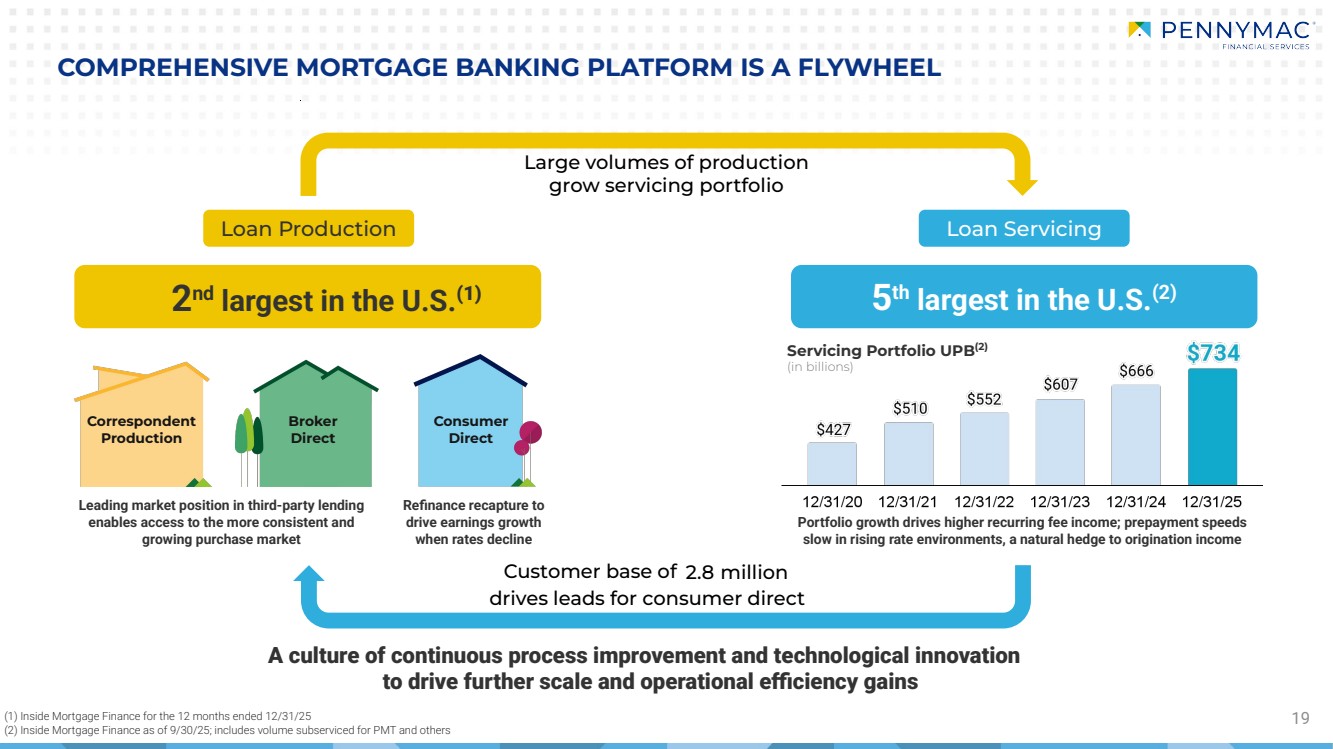
| Portfolio growth drives higher recurring fee income; prepayment speeds slow in rising rate environments, a natural hedge to origination income Refinance recapture to drive earnings growth when rates decline 19 COMPREHENSIVE MORTGAGE BANKING PLATFORM IS A FLYWHEEL Large volumes of production grow servicing portfolio 2 nd largest in the U.S.(1) 5 th largest in the U.S.(2) A culture of continuous process improvement and technological innovation to drive further scale and operational efficiency gains Customer base of 2.8 million drives leads for consumer direct Correspondent Production Broker Direct Consumer Direct Leading market position in third-party lending enables access to the more consistent and growing purchase market Servicing Portfolio UPB(2) (in billions) (1) Inside Mortgage Finance for the 12 months ended 12/31/25 (2) Inside Mortgage Finance as of 9/30/25; includes volume subserviced for PMT and others Loan Production Loan Servicing |
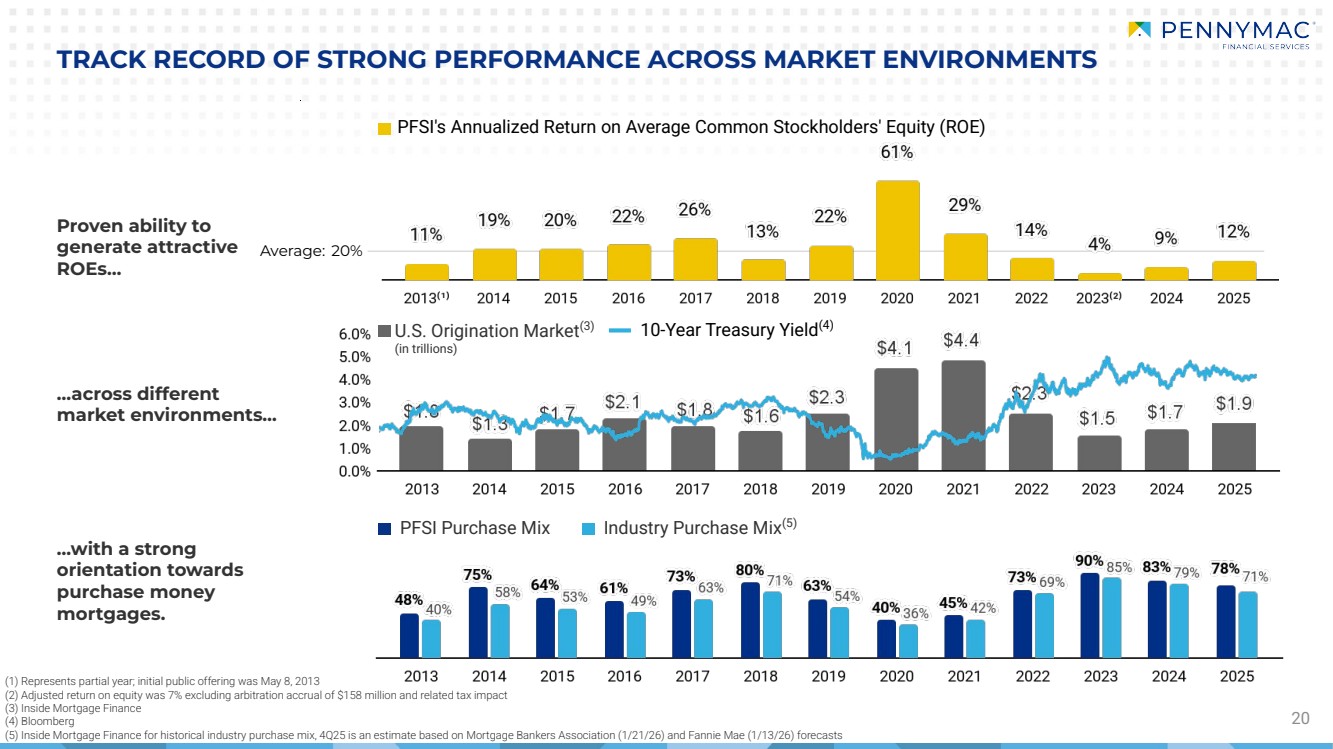
| PFSI Purchase Mix Industry Purchase Mix(5) 20 TRACK RECORD OF STRONG PERFORMANCE ACROSS MARKET ENVIRONMENTS Proven ability to generate attractive ROEs… …across different market environments… …with a strong orientation towards purchase money mortgages. (1) Represents partial year; initial public offering was May 8, 2013 (2) Adjusted return on equity was 7% excluding arbitration accrual of $158 million and related tax impact (3) Inside Mortgage Finance (4) Bloomberg (5) Inside Mortgage Finance for historical industry purchase mix, 4Q25 is an estimate based on Mortgage Bankers Association (1/21/26) and Fannie Mae (1/13/26) forecasts Average: 20% U.S. Origination Market(3) (in trillions) PFSI's Annualized Return on Average Common Stockholders' Equity (ROE) 10-Year Treasury Yield(4) |
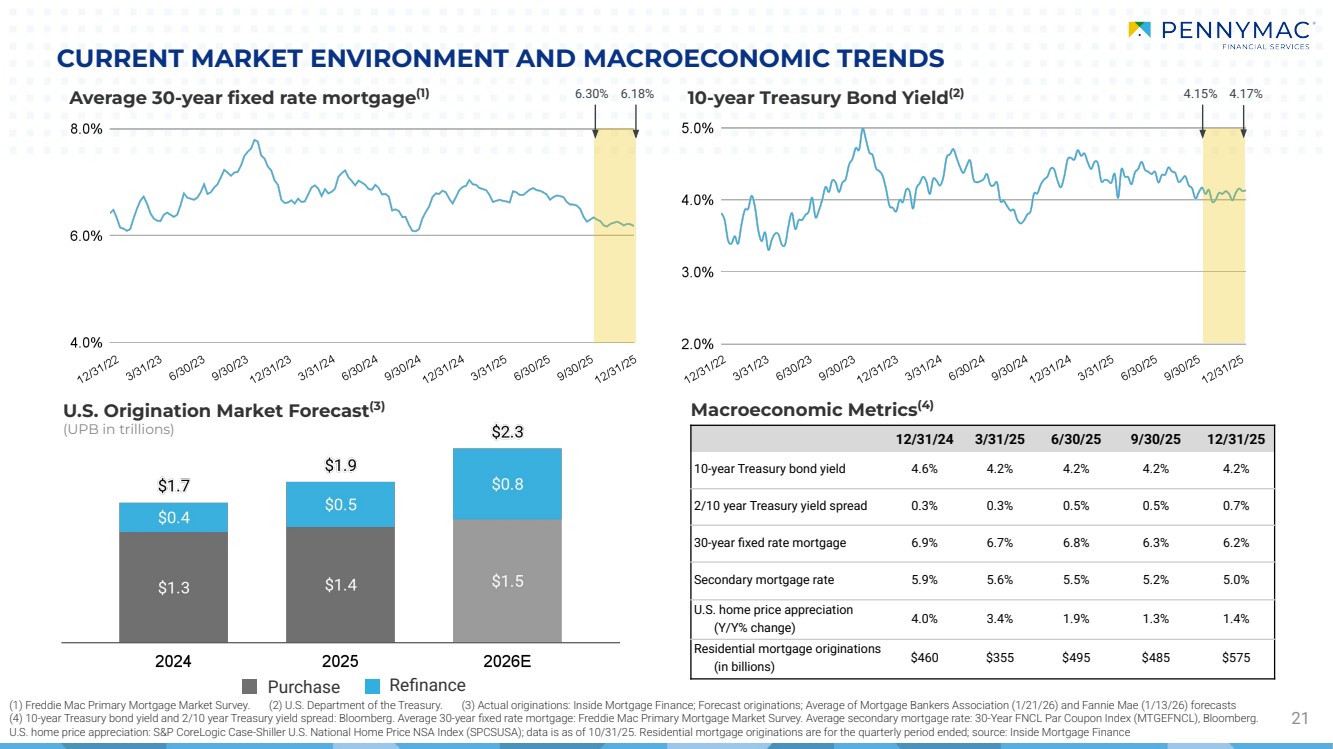
| (1) Freddie Mac Primary Mortgage Market Survey. (2) U.S. Department of the Treasury. (3) Actual originations: Inside Mortgage Finance; Forecast originations; Average of Mortgage Bankers Association (1/21/26) and Fannie Mae (1/13/26) forecasts (4) 10-year Treasury bond yield and 2/10 year Treasury yield spread: Bloomberg. Average 30-year fixed rate mortgage: Freddie Mac Primary Mortgage Market Survey. Average secondary mortgage rate: 30-Year FNCL Par Coupon Index (MTGEFNCL), Bloomberg. U.S. home price appreciation: S&P CoreLogic Case-Shiller U.S. National Home Price NSA Index (SPCSUSA); data is as of 10/31/25. Residential mortgage originations are for the quarterly period ended; source: Inside Mortgage Finance CURRENT MARKET ENVIRONMENT AND MACROECONOMIC TRENDS 21 Average 30-year fixed rate mortgage(1) Macroeconomic Metrics(4) U.S. Origination Market Forecast(3) (UPB in trillions) 10-year Treasury Bond Yield(2) 12/31/24 3/31/25 6/30/25 9/30/25 12/31/25 10-year Treasury bond yield 4.6% 4.2% 4.2% 4.2% 4.2% 2/10 year Treasury yield spread 0.3% 0.3% 0.5% 0.5% 0.7% 30-year fixed rate mortgage 6.9% 6.7% 6.8% 6.3% 6.2% Secondary mortgage rate 5.9% 5.6% 5.5% 5.2% 5.0% U.S. home price appreciation (Y/Y% change) 4.0% 3.4% 1.9% 1.3% 1.4% Residential mortgage originations (in billions) $460 $355 $495 $485 $575 6.30% 6.18% 4.15% 4.17% Purchase Refinance |
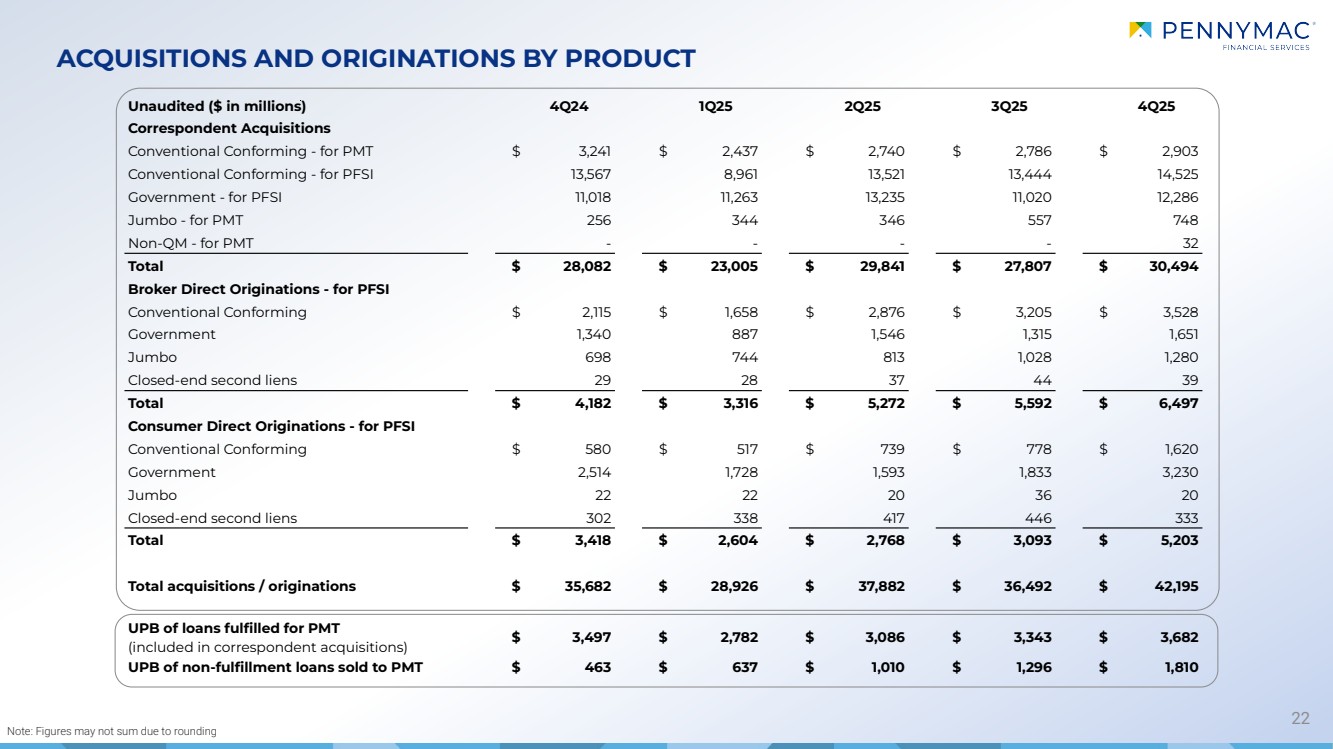
| ACQUISITIONS AND ORIGINATIONS BY PRODUCT 22 Note: Figures may not sum due to rounding Unaudited ($ in millions) 4Q24 1Q25 2Q25 3Q25 4Q25 Correspondent Acquisitions Conventional Conforming - for PMT $ 3,241 $ 2,437 $ 2,740 $ 2,786 $ 2,903 Conventional Conforming - for PFSI 13,567 8,961 13,521 13,444 14,525 Government - for PFSI 11,018 11,263 13,235 11,020 12,286 Jumbo - for PMT 256 344 346 557 748 Non-QM - for PMT - - - - 32 Total $ 28,082 $ 23,005 $ 29,841 $ 27,807 $ 30,494 Broker Direct Originations - for PFSI Conventional Conforming $ 2,115 $ 1,658 $ 2,876 $ 3,205 $ 3,528 Government 1,340 887 1,546 1,315 1,651 Jumbo 698 744 813 1,028 1,280 Closed-end second liens 29 28 37 44 39 Total $ 4,182 $ 3,316 $ 5,272 $ 5,592 $ 6,497 Consumer Direct Originations - for PFSI Conventional Conforming $ 580 $ 517 $ 739 $ 778 $ 1,620 Government 2,514 1,728 1,593 1,833 3,230 Jumbo 22 22 20 36 20 Closed-end second liens 302 338 417 446 333 Total $ 3,418 $ 2,604 $ 2,768 $ 3,093 $ 5,203 Total acquisitions / originations $ 35,682 $ 28,926 $ 37,882 $ 36,492 $ 42,195 UPB of loans fulfilled for PMT (included in correspondent acquisitions) $ 3,497 $ 2,782 $ 3,086 $ 3,343 $ 3,682 UPB of non-fulfillment loans sold to PMT $ 463 $ 637 $ 1,010 $ 1,296 $ 1,810 |
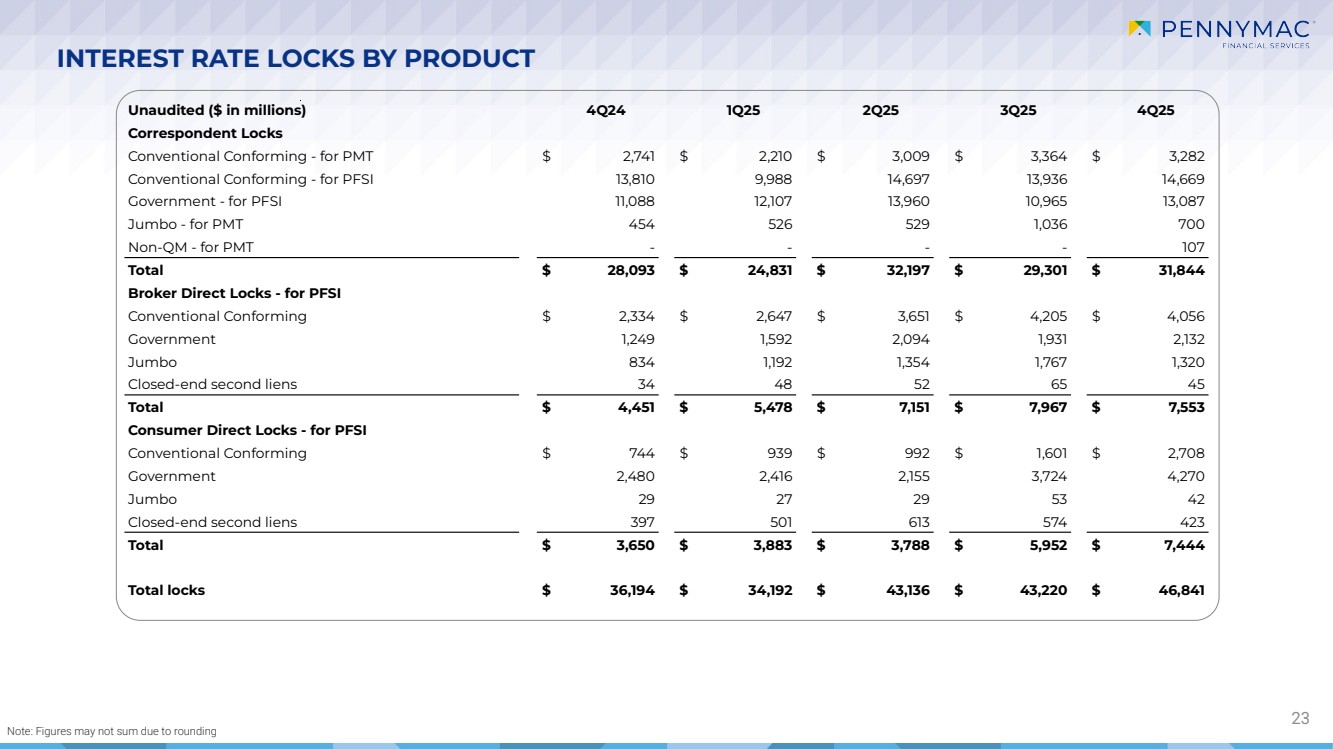
| Unaudited ($ in millions) 4Q24 1Q25 2Q25 3Q25 4Q25 Correspondent Locks Conventional Conforming - for PMT $ 2,741 $ 2,210 $ 3,009 $ 3,364 $ 3,282 Conventional Conforming - for PFSI 13,810 9,988 14,697 13,936 14,669 Government - for PFSI 11,088 12,107 13,960 10,965 13,087 Jumbo - for PMT 454 526 529 1,036 700 Non-QM - for PMT - - - - 107 Total $ 28,093 $ 24,831 $ 32,197 $ 29,301 $ 31,844 Broker Direct Locks - for PFSI Conventional Conforming $ 2,334 $ 2,647 $ 3,651 $ 4,205 $ 4,056 Government 1,249 1,592 2,094 1,931 2,132 Jumbo 834 1,192 1,354 1,767 1,320 Closed-end second liens 34 48 52 65 45 Total $ 4,451 $ 5,478 $ 7,151 $ 7,967 $ 7,553 Consumer Direct Locks - for PFSI Conventional Conforming $ 744 $ 939 $ 992 $ 1,601 $ 2,708 Government 2,480 2,416 2,155 3,724 4,270 Jumbo 29 27 29 53 42 Closed-end second liens 397 501 613 574 423 Total $ 3,650 $ 3,883 $ 3,788 $ 5,952 $ 7,444 Total locks $ 36,194 $ 34,192 $ 43,136 $ 43,220 $ 46,841 INTEREST RATE LOCKS BY PRODUCT 23 Note: Figures may not sum due to rounding |
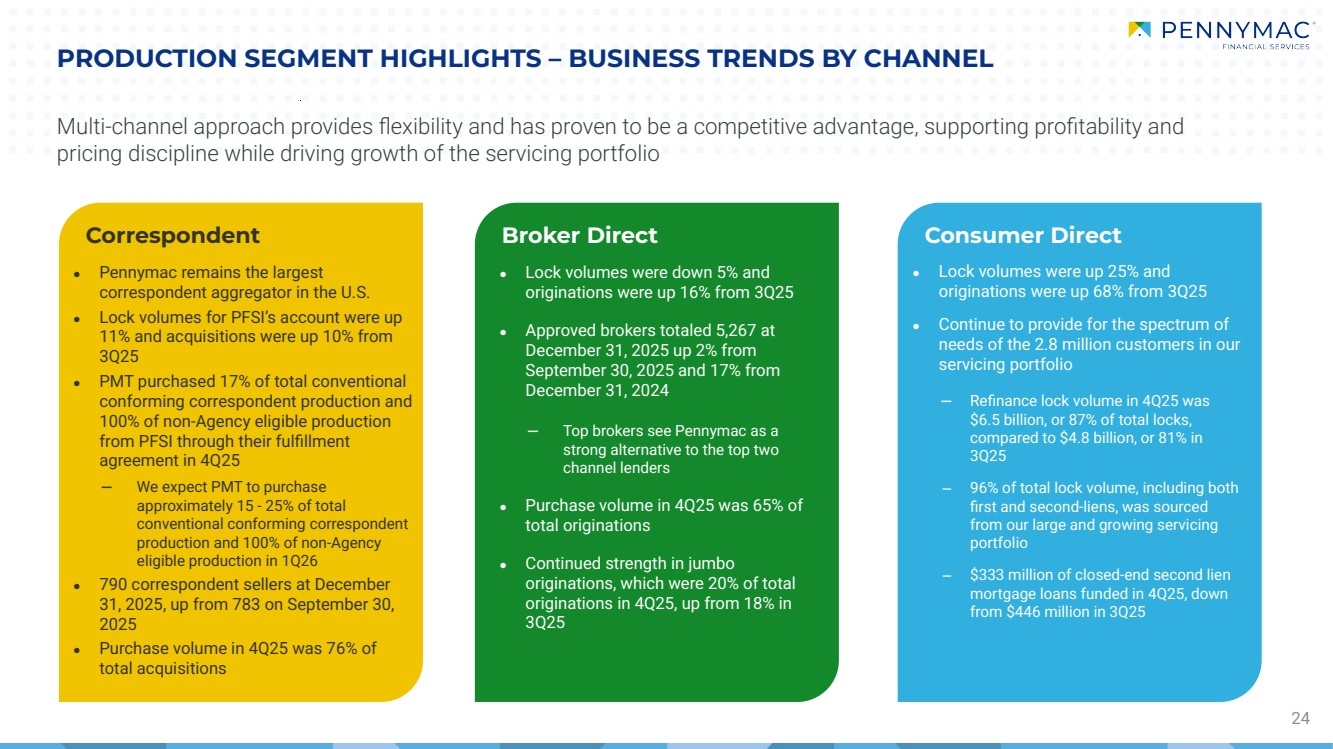
| Correspondent Broker Direct PRODUCTION SEGMENT HIGHLIGHTS – BUSINESS TRENDS BY CHANNEL 24 Consumer Direct ● Pennymac remains the largest correspondent aggregator in the U.S. ● Lock volumes for PFSI’s account were up 11% and acquisitions were up 10% from 3Q25 ● PMT purchased 17% of total conventional conforming correspondent production and 100% of non-Agency eligible production from PFSI through their fulfillment agreement in 4Q25 ‒ We expect PMT to purchase approximately 15 - 25% of total conventional conforming correspondent production and 100% of non-Agency eligible production in 1Q26 ● 790 correspondent sellers at December 31, 2025, up from 783 on September 30, 2025 ● Purchase volume in 4Q25 was 76% of total acquisitions Multi-channel approach provides flexibility and has proven to be a competitive advantage, supporting profitability and pricing discipline while driving growth of the servicing portfolio ● Lock volumes were down 5% and originations were up 16% from 3Q25 ● Approved brokers totaled 5,267 at December 31, 2025 up 2% from September 30, 2025 and 17% from December 31, 2024 ‒ Top brokers see Pennymac as a strong alternative to the top two channel lenders ● Purchase volume in 4Q25 was 65% of total originations ● Continued strength in jumbo originations, which were 20% of total originations in 4Q25, up from 18% in 3Q25 ● Lock volumes were up 25% and originations were up 68% from 3Q25 ● Continue to provide for the spectrum of needs of the 2.8 million customers in our servicing portfolio ‒ Refinance lock volume in 4Q25 was $6.5 billion, or 87% of total locks, compared to $4.8 billion, or 81% in 3Q25 ‒ 96% of total lock volume, including both first and second-liens, was sourced from our large and growing servicing portfolio ‒ $333 million of closed-end second lien mortgage loans funded in 4Q25, down from $446 million in 3Q25 |
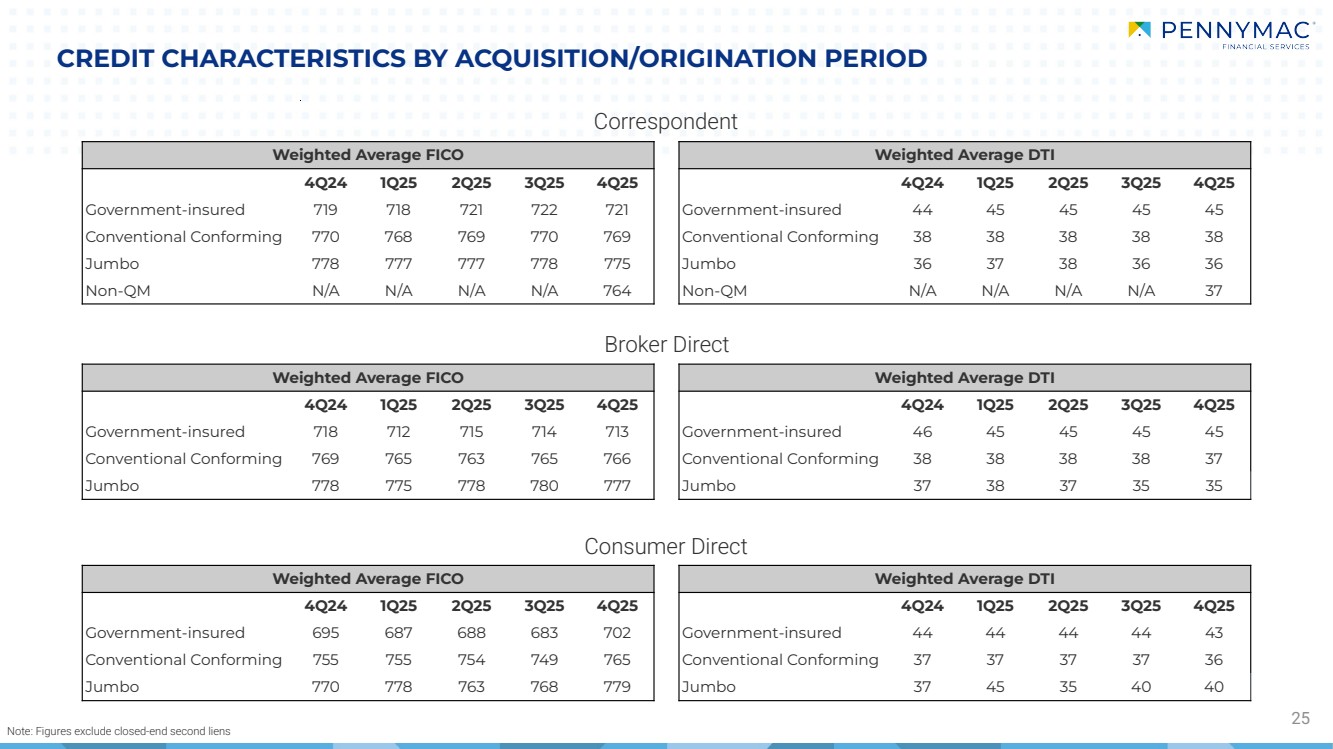
| CREDIT CHARACTERISTICS BY ACQUISITION/ORIGINATION PERIOD 25 Correspondent Broker Direct Consumer Direct Note: Figures exclude closed-end second liens Weighted Average FICO Weighted Average DTI 4Q24 1Q25 2Q25 3Q25 4Q25 4Q24 1Q25 2Q25 3Q25 4Q25 Government-insured 695 687 688 683 702 Government-insured 44 44 44 44 43 Conventional Conforming 755 755 754 749 765 Conventional Conforming 37 37 37 37 36 Jumbo 770 778 763 768 779 Jumbo 37 45 35 40 40 Weighted Average FICO Weighted Average DTI 4Q24 1Q25 2Q25 3Q25 4Q25 4Q24 1Q25 2Q25 3Q25 4Q25 Government-insured 718 712 715 714 713 Government-insured 46 45 45 45 45 Conventional Conforming 769 765 763 765 766 Conventional Conforming 38 38 38 38 37 Jumbo 778 775 778 780 777 Jumbo 37 38 37 35 35 Weighted Average FICO Weighted Average DTI 4Q24 1Q25 2Q25 3Q25 4Q25 4Q24 1Q25 2Q25 3Q25 4Q25 Government-insured 719 718 721 722 721 Government-insured 44 45 45 45 45 Conventional Conforming 770 768 769 770 769 Conventional Conforming 38 38 38 38 38 Jumbo 778 777 777 778 775 Jumbo 36 37 38 36 36 Non-QM N/A N/A N/A N/A 764 Non-QM N/A N/A N/A N/A 37 |
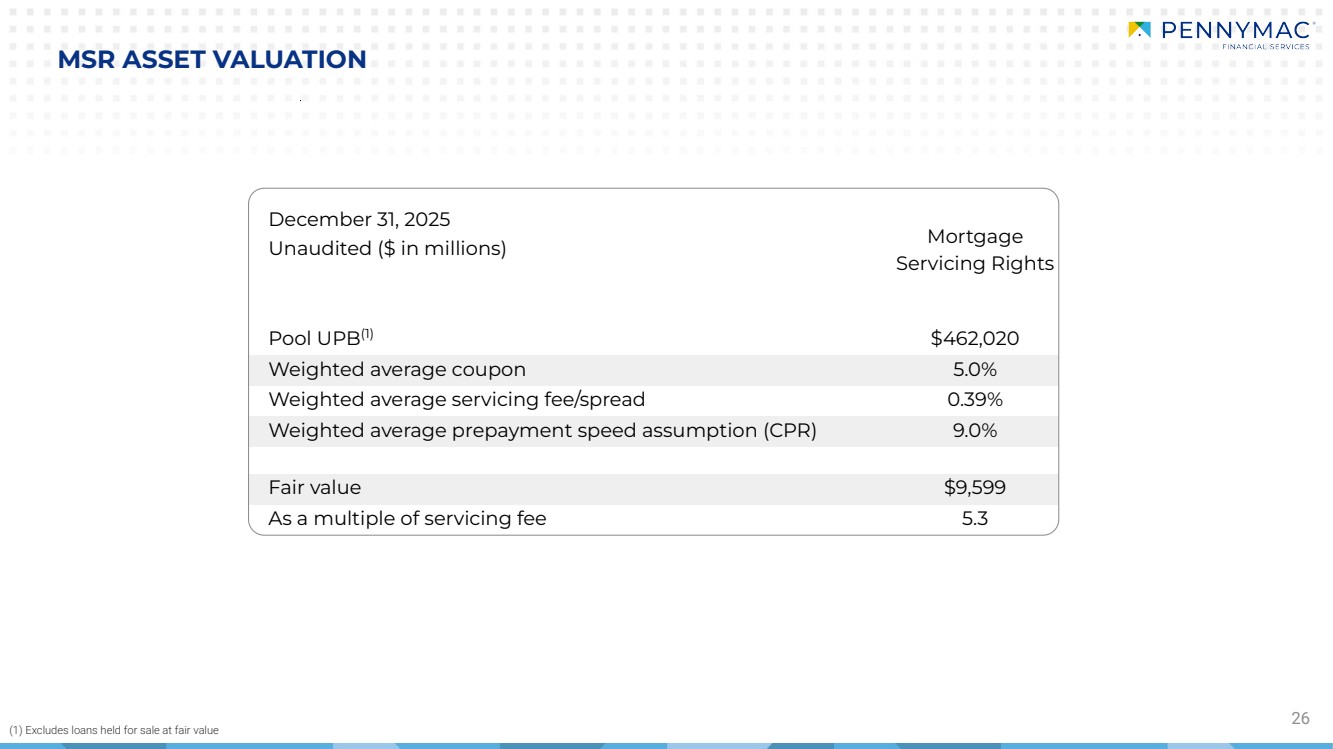
| December 31, 2025 Mortgage Servicing Rights Unaudited ($ in millions) Pool UPB(1) $462,020 Weighted average coupon 5.0% Weighted average servicing fee/spread 0.39% Weighted average prepayment speed assumption (CPR) 9.0% Fair value $9,599 As a multiple of servicing fee 5.3 26 MSR ASSET VALUATION (1) Excludes loans held for sale at fair value |
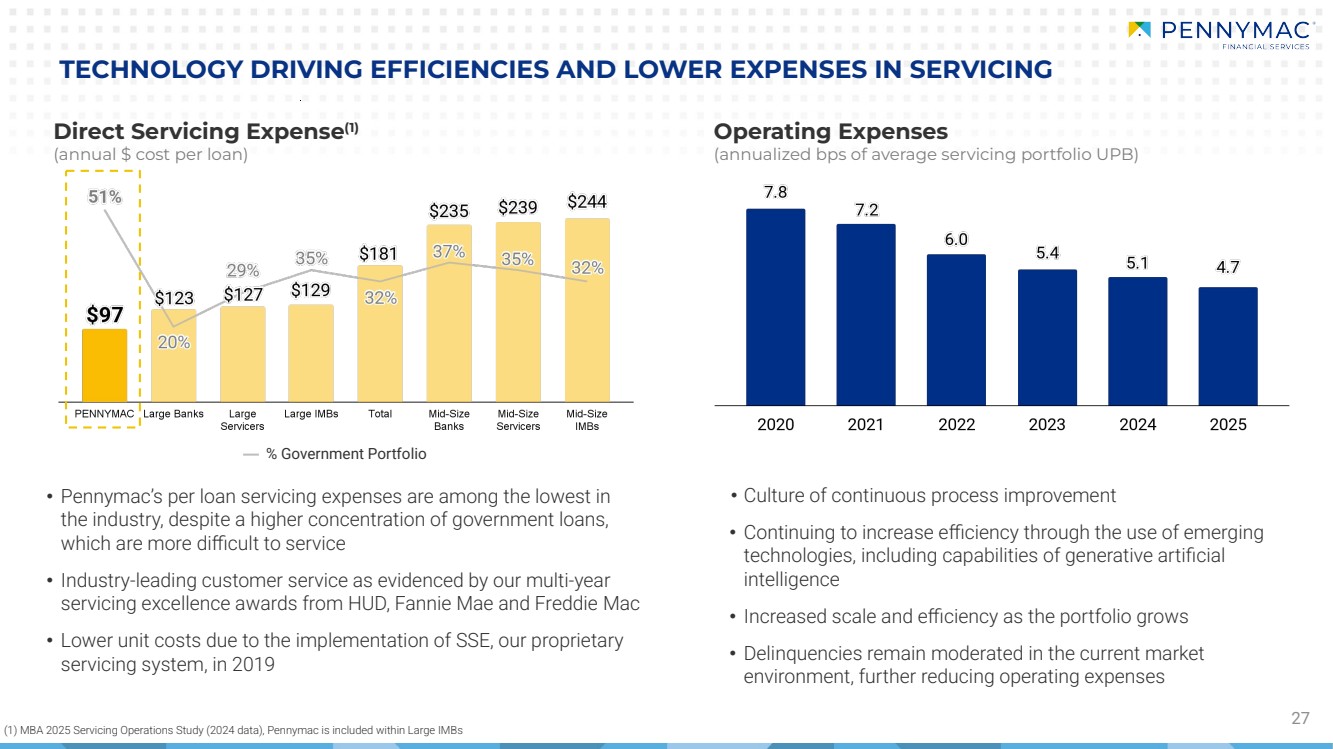
| • Pennymac’s per loan servicing expenses are among the lowest in the industry, despite a higher concentration of government loans, which are more difficult to service • Industry-leading customer service as evidenced by our multi-year servicing excellence awards from HUD, Fannie Mae and Freddie Mac • Lower unit costs due to the implementation of SSE, our proprietary servicing system, in 2019 27 Operating Expenses (annualized bps of average servicing portfolio UPB) Direct Servicing Expense(1) (annual $ cost per loan) TECHNOLOGY DRIVING EFFICIENCIES AND LOWER EXPENSES IN SERVICING • Culture of continuous process improvement • Continuing to increase efficiency through the use of emerging technologies, including capabilities of generative artificial intelligence • Increased scale and efficiency as the portfolio grows • Delinquencies remain moderated in the current market environment, further reducing operating expenses % Government Portfolio (1) MBA 2025 Servicing Operations Study (2024 data), Pennymac is included within Large IMBs |
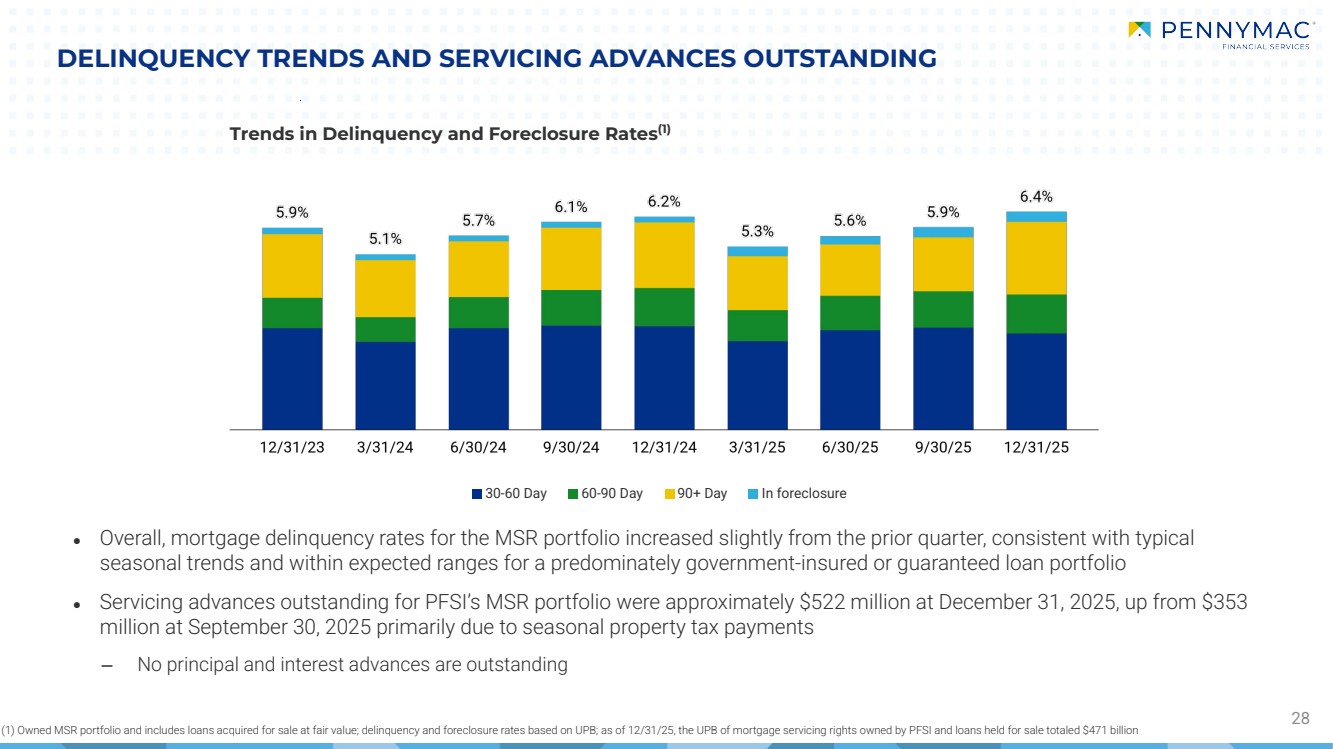
| DELINQUENCY TRENDS AND SERVICING ADVANCES OUTSTANDING 28 Trends in Delinquency and Foreclosure Rates(1) 30-60 Day 60-90 Day 90+ Day In foreclosure (1) Owned MSR portfolio and includes loans acquired for sale at fair value; delinquency and foreclosure rates based on UPB; as of 12/31/25, the UPB of mortgage servicing rights owned by PFSI and loans held for sale totaled $471 billion ● Overall, mortgage delinquency rates for the MSR portfolio increased slightly from the prior quarter, consistent with typical seasonal trends and within expected ranges for a predominately government-insured or guaranteed loan portfolio ● Servicing advances outstanding for PFSI’s MSR portfolio were approximately $522 million at December 31, 2025, up from $353 million at September 30, 2025 primarily due to seasonal property tax payments ‒ No principal and interest advances are outstanding |
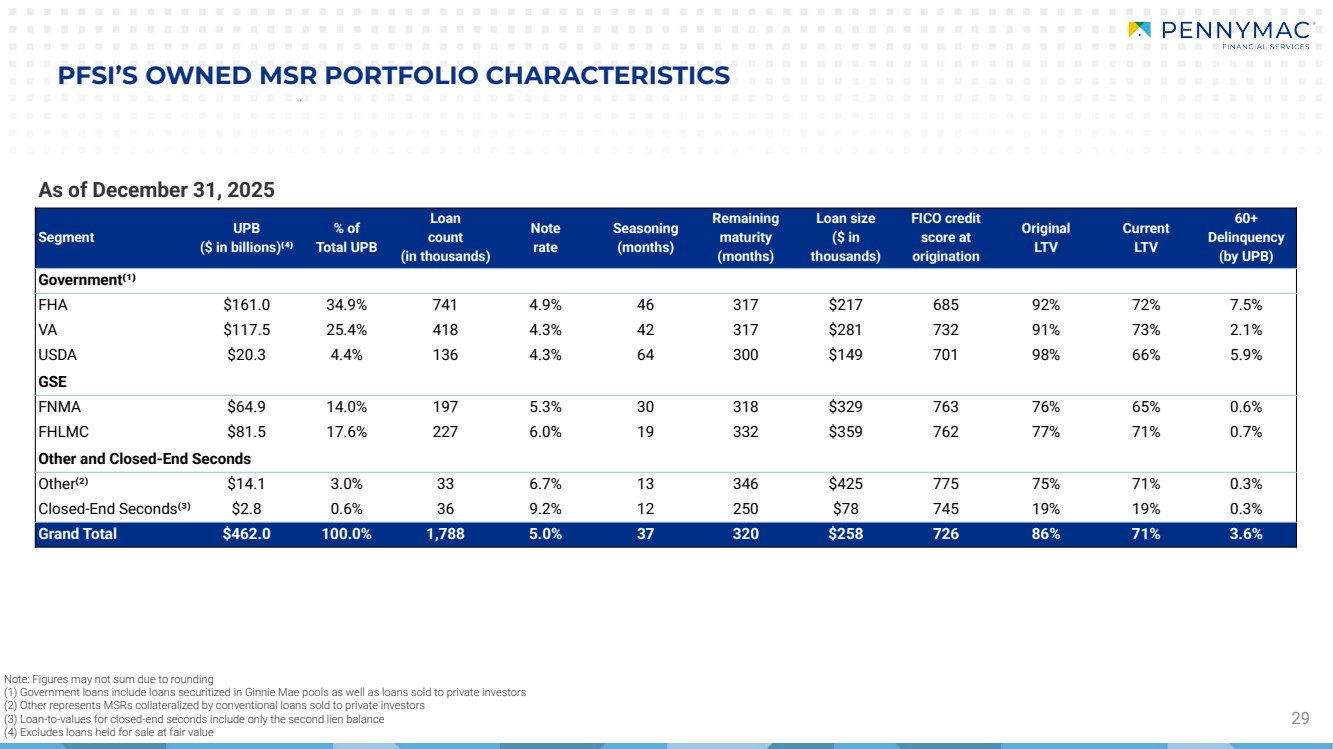
| 29 PFSI’S OWNED MSR PORTFOLIO CHARACTERISTICS Note: Figures may not sum due to rounding (1) Government loans include loans securitized in Ginnie Mae pools as well as loans sold to private investors (2) Other represents MSRs collateralized by conventional loans sold to private investors (3) Loan-to-values for closed-end seconds include only the second lien balance (4) Excludes loans held for sale at fair value As of December 31, 2025 Segment UPB ($ in billions)⁽⁴⁾ % of Total UPB Loan count (in thousands) Note rate Seasoning (months) Remaining maturity (months) Loan size ($ in thousands) FICO credit score at origination Original LTV Current LTV 60+ Delinquency (by UPB) Government⁽¹⁾ FHA $161.0 34.9% 741 4.9% 46 317 $217 685 92% 72% 7.5% VA $117.5 25.4% 418 4.3% 42 317 $281 732 91% 73% 2.1% USDA $20.3 4.4% 136 4.3% 64 300 $149 701 98% 66% 5.9% GSE FNMA $64.9 14.0% 197 5.3% 30 318 $329 763 76% 65% 0.6% FHLMC $81.5 17.6% 227 6.0% 19 332 $359 762 77% 71% 0.7% Other and Closed-End Seconds Other⁽²⁾ $14.1 3.0% 33 6.7% 13 346 $425 775 75% 71% 0.3% Closed-End Seconds⁽³⁾ $2.8 0.6% 36 9.2% 12 250 $78 745 19% 19% 0.3% Grand Total $462.0 100.0% 1,788 5.0% 37 320 $258 726 86% 71% 3.6% |
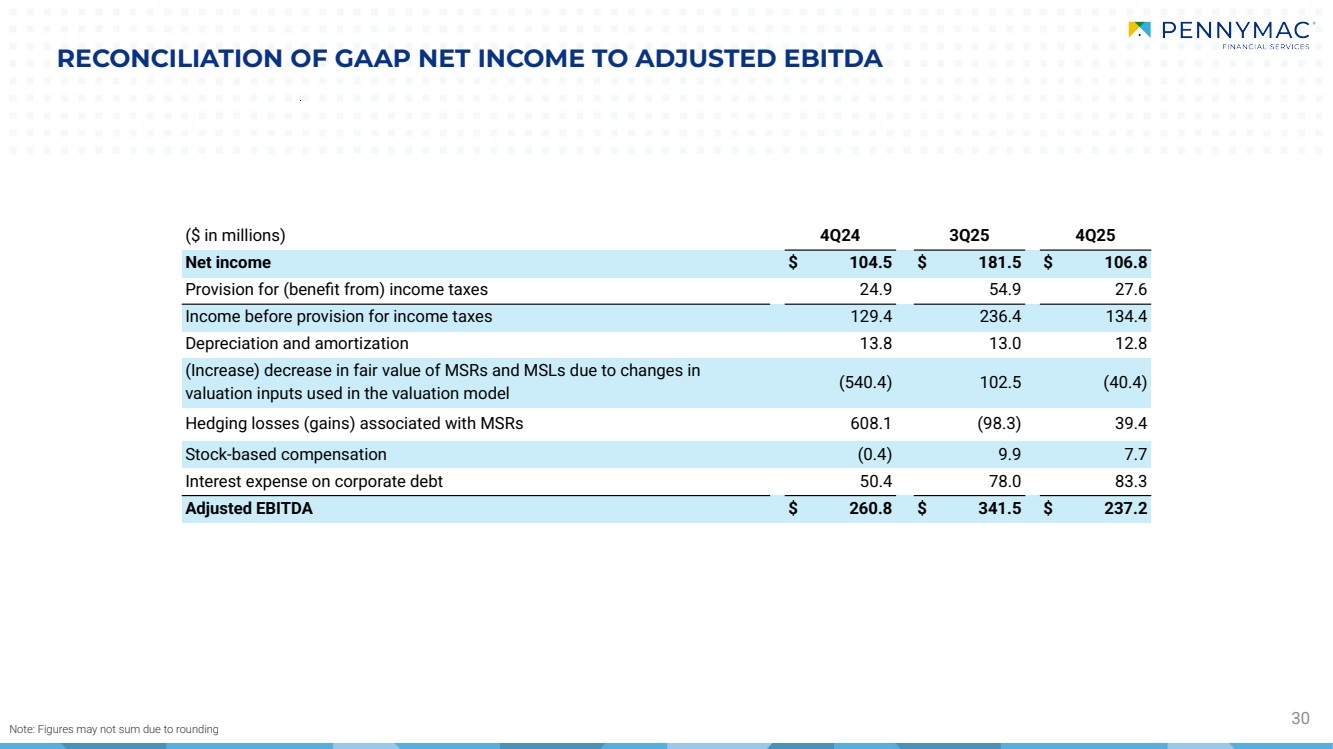
| RECONCILIATION OF GAAP NET INCOME TO ADJUSTED EBITDA 30 Note: Figures may not sum due to rounding ($ in millions) 4Q24 3Q25 4Q25 Net income $ 104.5 $ 181.5 $ 106.8 Provision for (benefit from) income taxes 24.9 54.9 27.6 Income before provision for income taxes 129.4 236.4 134.4 Depreciation and amortization 13.8 13.0 12.8 (Increase) decrease in fair value of MSRs and MSLs due to changes in valuation inputs used in the valuation model (540.4) 102.5 (40.4) Hedging losses (gains) associated with MSRs 608.1 (98.3) 39.4 Stock-based compensation (0.4) 9.9 7.7 Interest expense on corporate debt 50.4 78.0 83.3 Adjusted EBITDA $ 260.8 $ 341.5 $ 237.2 |
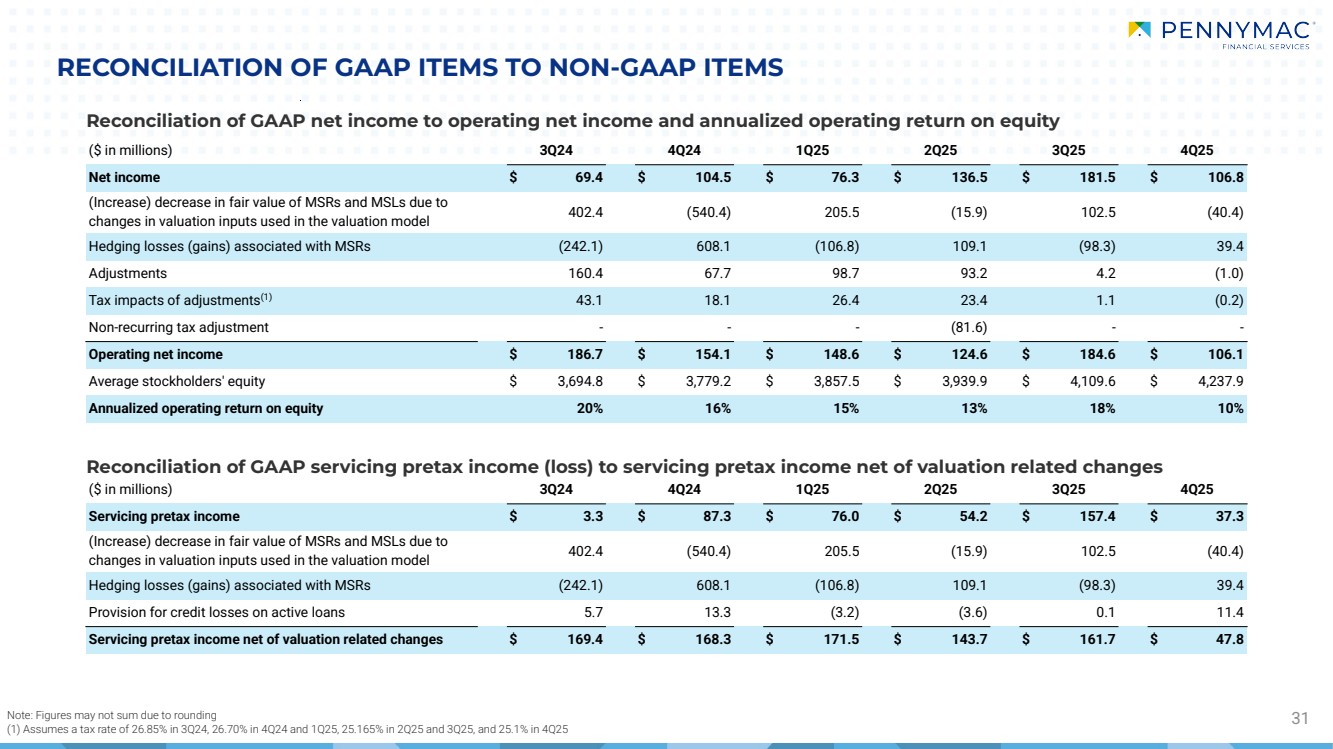
| ($ in millions) 3Q24 4Q24 1Q25 2Q25 3Q25 4Q25 Net income $ 69.4 $ 104.5 $ 76.3 $ 136.5 $ 181.5 $ 106.8 (Increase) decrease in fair value of MSRs and MSLs due to changes in valuation inputs used in the valuation model 402.4 (540.4) 205.5 (15.9) 102.5 (40.4) Hedging losses (gains) associated with MSRs (242.1) 608.1 (106.8) 109.1 (98.3) 39.4 Adjustments 160.4 67.7 98.7 93.2 4.2 (1.0) Tax impacts of adjustments(1) 43.1 18.1 26.4 23.4 1.1 (0.2) Non-recurring tax adjustment - - - (81.6) - - Operating net income $ 186.7 $ 154.1 $ 148.6 $ 124.6 $ 184.6 $ 106.1 Average stockholders' equity $ 3,694.8 $ 3,779.2 $ 3,857.5 $ 3,939.9 $ 4,109.6 $ 4,237.9 Annualized operating return on equity 20% 16% 15% 13% 18% 10% ($ in millions) 3Q24 4Q24 1Q25 2Q25 3Q25 4Q25 Servicing pretax income $ 3.3 $ 87.3 $ 76.0 $ 54.2 $ 157.4 $ 37.3 (Increase) decrease in fair value of MSRs and MSLs due to changes in valuation inputs used in the valuation model 402.4 (540.4) 205.5 (15.9) 102.5 (40.4) Hedging losses (gains) associated with MSRs (242.1) 608.1 (106.8) 109.1 (98.3) 39.4 Provision for credit losses on active loans 5.7 13.3 (3.2) (3.6) 0.1 11.4 Servicing pretax income net of valuation related changes $ 169.4 $ 168.3 $ 171.5 $ 143.7 $ 161.7 $ 47.8 Reconciliation of GAAP net income to operating net income and annualized operating return on equity RECONCILIATION OF GAAP ITEMS TO NON-GAAP ITEMS Note: Figures may not sum due to rounding 31 (1) Assumes a tax rate of 26.85% in 3Q24, 26.70% in 4Q24 and 1Q25, 25.165% in 2Q25 and 3Q25, and 25.1% in 4Q25 Reconciliation of GAAP servicing pretax income (loss) to servicing pretax income net of valuation related changes |
|