.2
KAYNEBDC.COM KAYNE ANDERSON BDC, INC. EARNINGS PRESENTATION First Quarter 2025
2 Disclaimer and Forward - Looking Statement This presentation may contain “forward - looking statements” that involve substantial risks and uncertainties . Such statements involve known and unknown risks, uncertainties and other factors and undue reliance should not be placed thereon . These forward - looking statements are not historical facts, but rather are based on current expectations, estimates and projections about Kayne Anderson BDC, Inc . (“KBDC”), its current and prospective portfolio investments, its industry, its beliefs and opinions, and its assumptions . Words such as “anticipates,” “expects,” “intends,” “plans,” “will,” “may,” “continue,” “believes,” “seeks,” “estimates,” “would,” “could,” “should,” “targets,” “projects,” “outlook,” “potential,” “predicts” and variations of these words and similar expressions are intended to identify forward - looking statements . These statements are not guarantees of future performance and are subject to risks, uncertainties and other factors, some of which are beyond KBDC’s control and difficult to predict and could cause actual results to differ materially from those expressed or forecasted in the forward - looking statements including, without limitation, the risks, uncertainties and other factors identified in KBDC’s filings with the SEC . All forward - looking statements speak only as of the date of this presentation . KBDC does not undertake any obligation to update or revise any forward - looking statements or any other information contained herein, except as required by applicable law .

EXECUTIVE SUMMARY
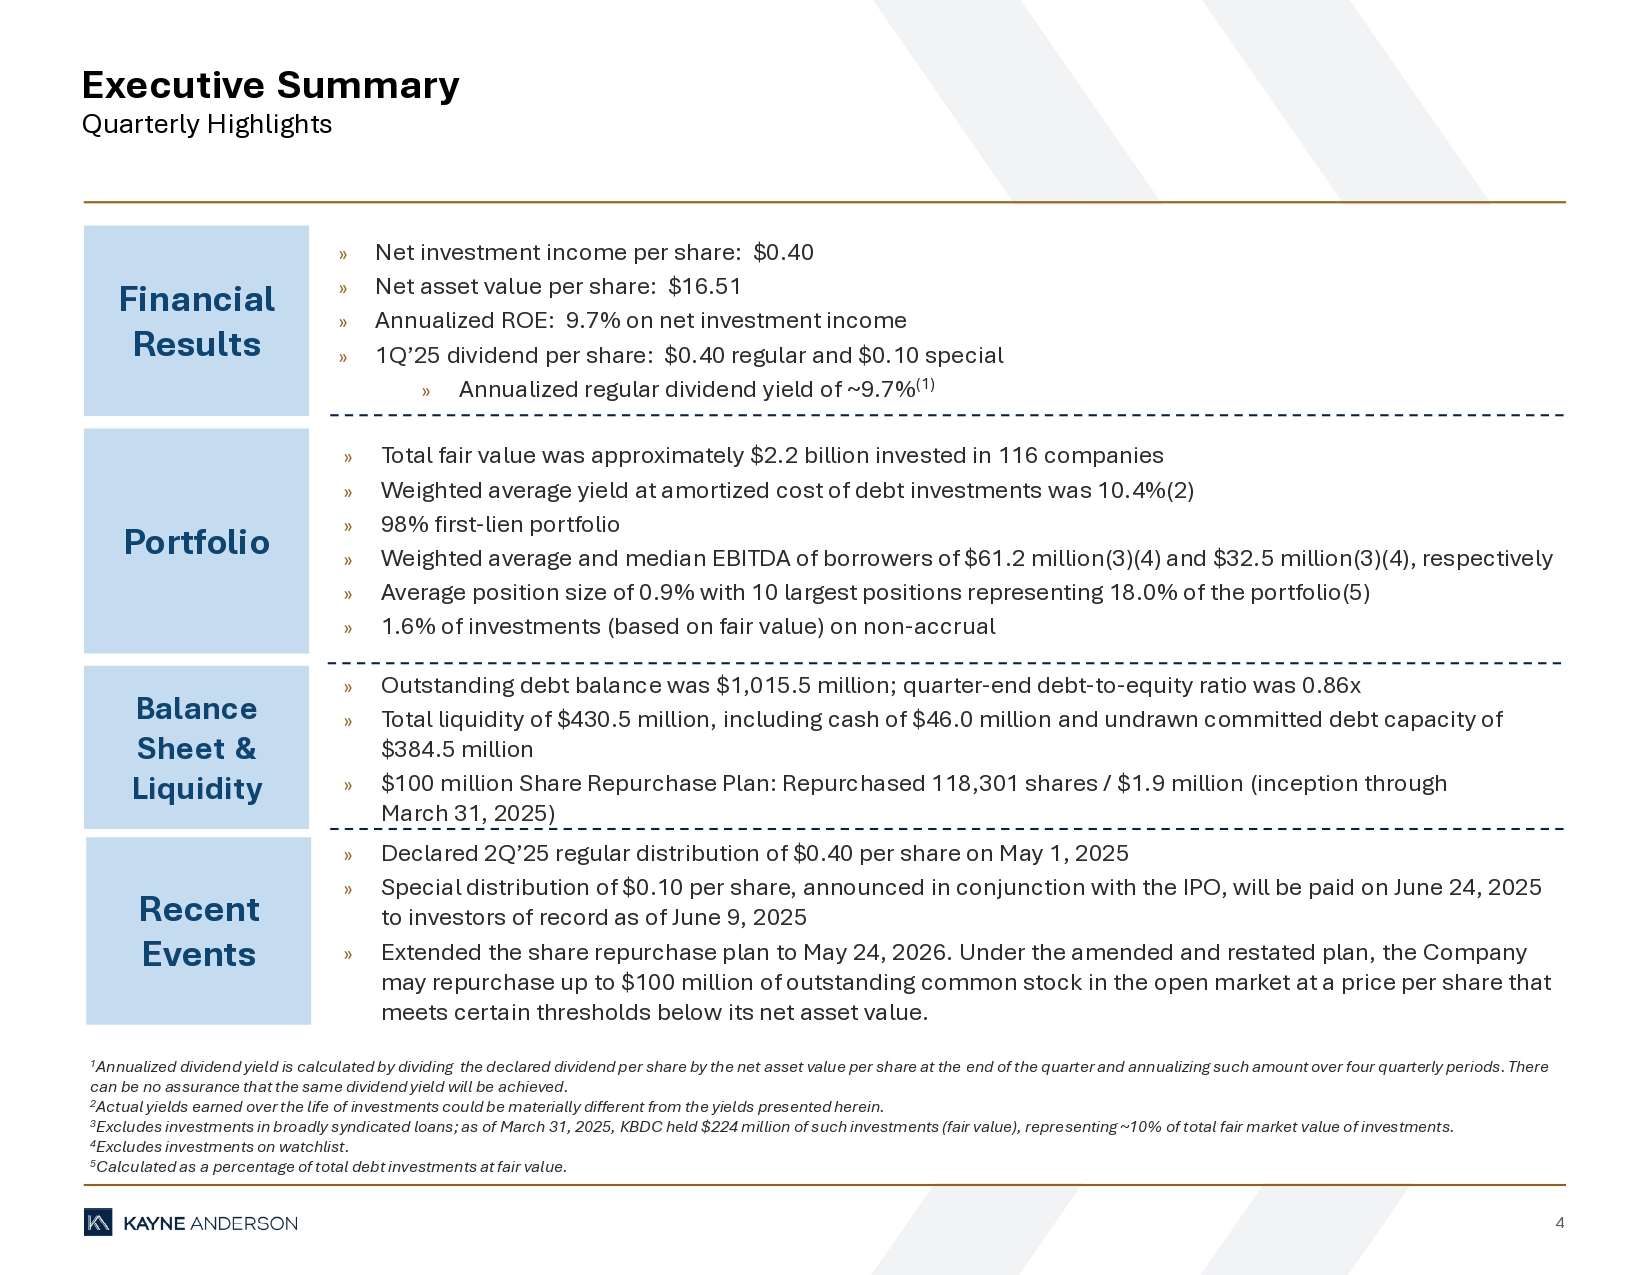
4 Executive Summary Quarterly Highlights 1 Annualized dividend yield is calculated by dividing the declared dividend per share by the net asset value per share at the end of the quarter and annualizing such amount over four quarterly periods. There can be no assurance that the same dividend yield will be achieved. 2 Actual yields earned over the life of investments could be materially different from the yields presented herein. 3 Excludes investments in broadly syndicated loans; as of March 31, 2025, KBDC held $224 million of such investments (fair value), repre se nting ~10% of total fair market value of investments. 4 Excludes investments on watchlist. 5 Calculated as a percentage of total debt investments at fair value. Financial Results Portfolio Balance Sheet & Liquidity Recent Events » Net investment income per share: $0.40 » Net asset value per share: $16.51 » Annualized ROE: 9.7% on net investment income » 1Q’25 dividend per share: $0.40 regular and $0.10 special » Annualized regular dividend yield of ~9.7% (1) » Total fair value was approximately $2.2 billion invested in 116 companies » Weighted average yield at amortized cost of debt investments was 10.4%(2) » 98% first - lien portfolio » Weighted average and median EBITDA of borrowers of $61.2 million(3)(4) and $32.5 million(3)(4), respectively » Average position size of 0.9% with 10 largest positions representing 18.0% of the portfolio(5) » 1.6% of investments (based on fair value) on non - accrual » Outstanding debt balance was $1,015.5 million; quarter - end debt - to - equity ratio was 0.86x » Total liquidity of $430.5 million, including cash of $46.0 million and undrawn committed debt capacity of $384.5 million » $100 million Share Repurchase Plan: Repurchased 118,301 shares / $1.9 million (inception through March 31, 2025) » Declared 2Q’25 regular distribution of $0.40 per share on May 1, 2025 » Special distribution of $0.10 per share, announced in conjunction with the IPO, will be paid on June 24, 2025 to investors of record as of June 9, 2025 » Extended the share repurchase plan to May 24, 2026. Under the amended and restated plan, the Company may repurchase up to $100 million of outstanding common stock in the open market at a price per share that meets certain thresholds below its net asset value.
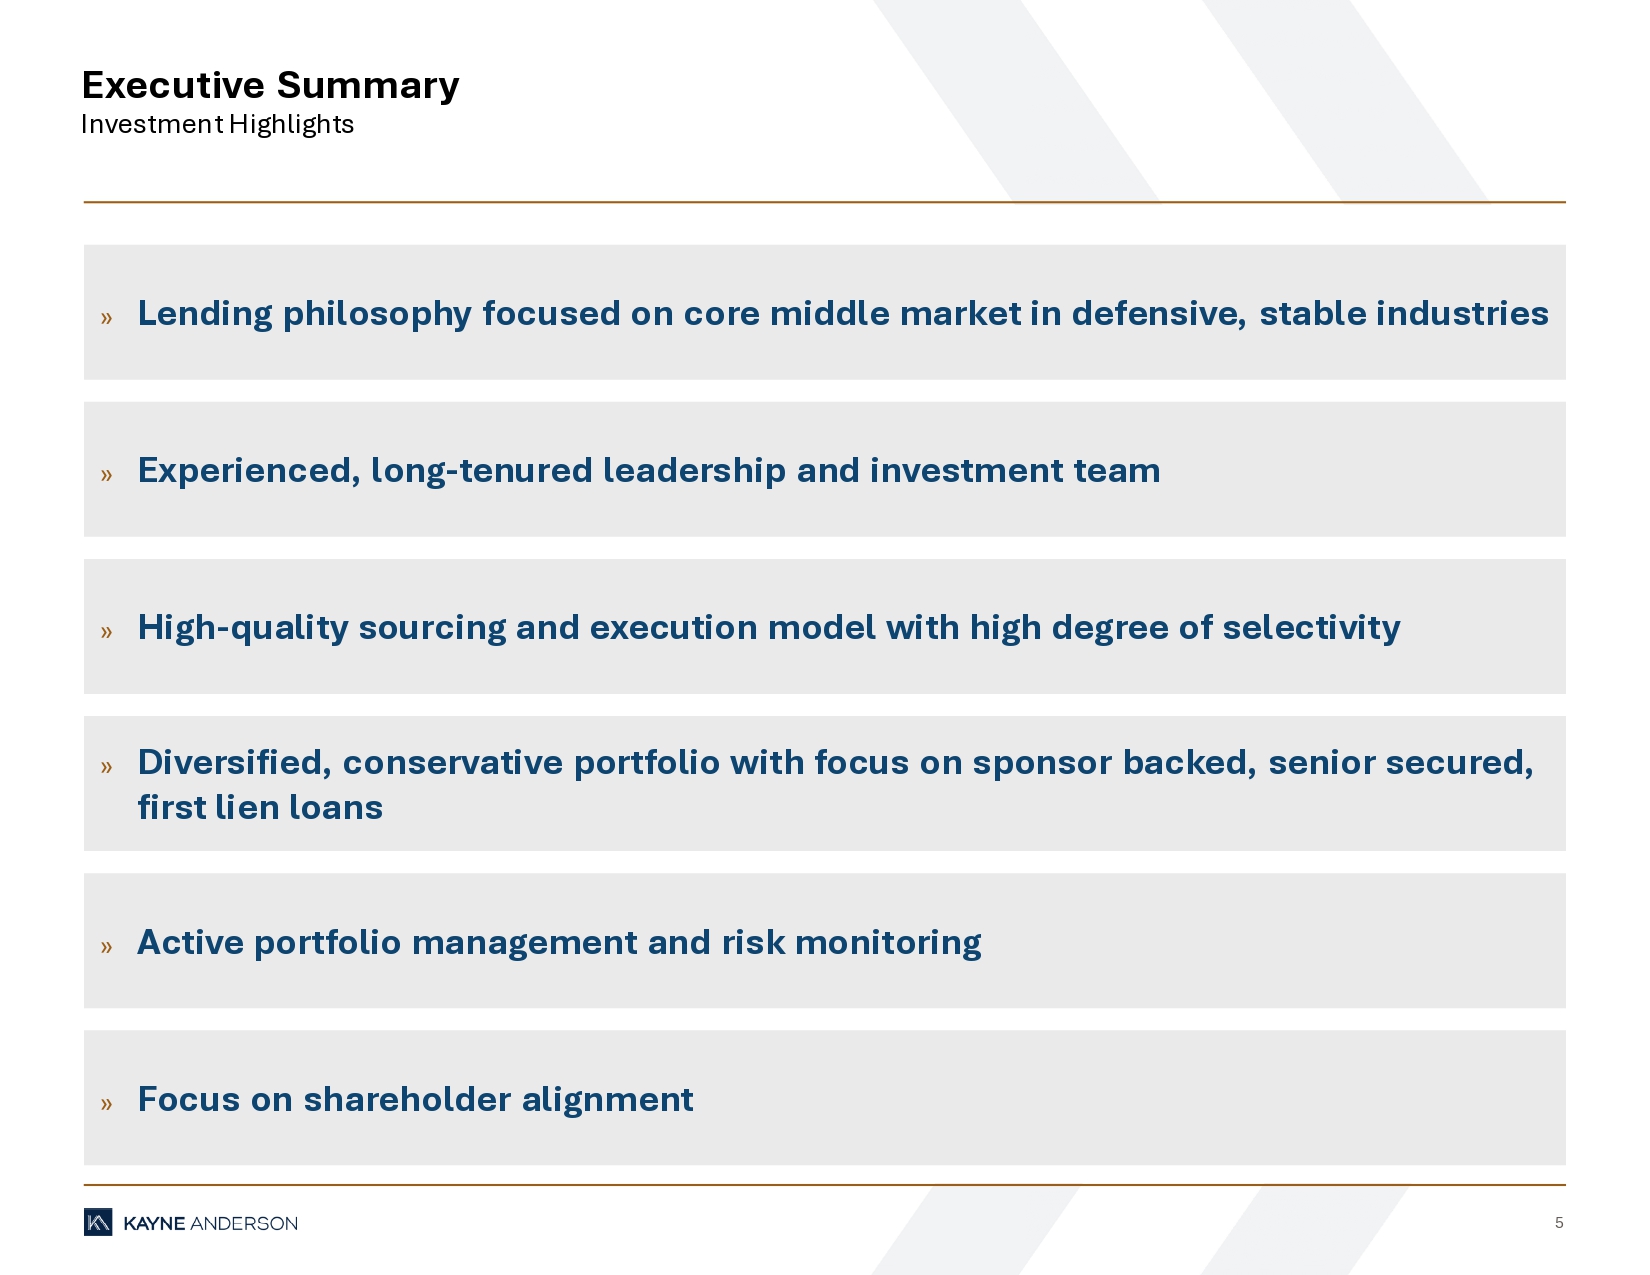
5 Executive Summary Investment Highlights » Lending philosophy focused on core middle market in defensive, stable industries » Experienced, long - tenured leadership and investment team » High - quality sourcing and execution model with high degree of selectivity » Diversified, conservative portfolio with focus on sponsor backed, senior secured, first lien loans » Active portfolio management and risk monitoring » Focus on shareholder alignment
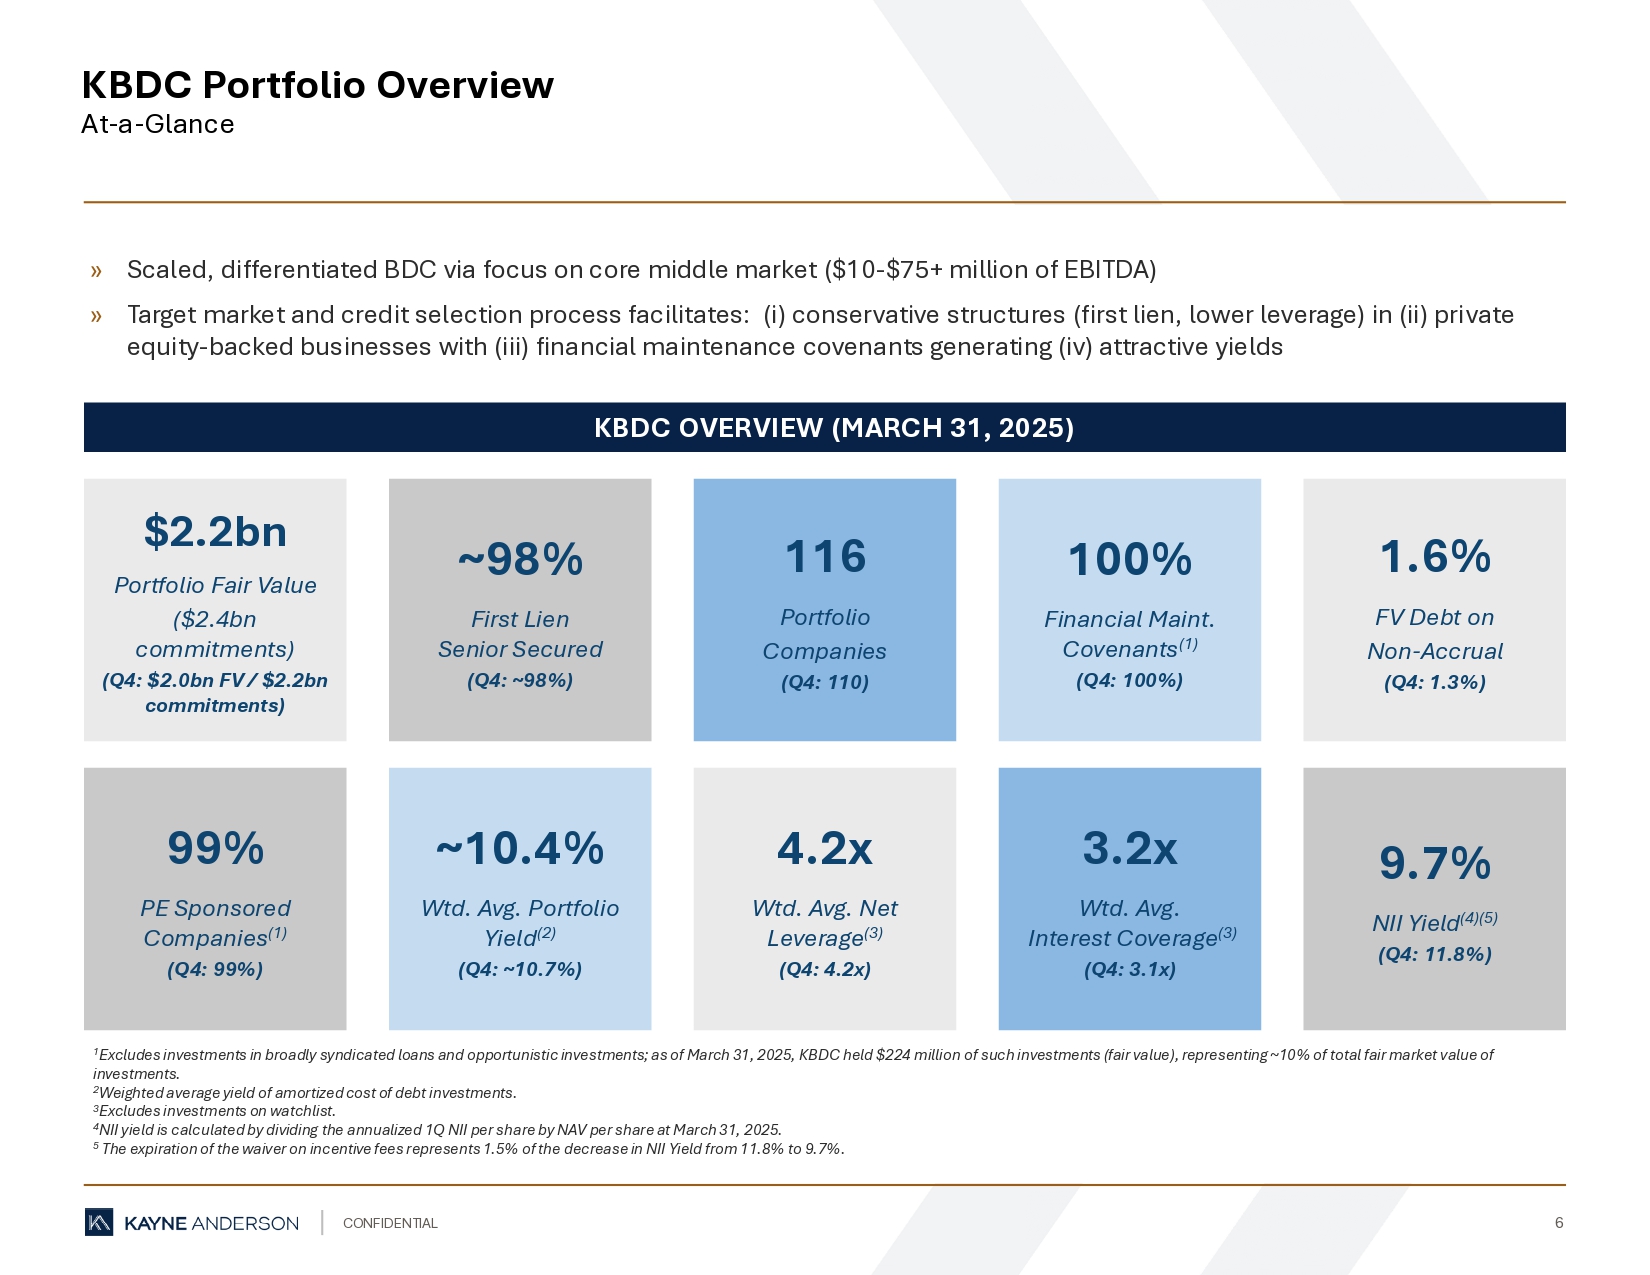
CONFIDENTIAL 6 » Scaled, differentiated BDC via focus on core middle market ($10 - $75+ million of EBITDA) » Target market and credit selection process facilitates: (i) conservative structures (first lien, lower leverage) in (ii) pri vat e equity - backed businesses with (iii) financial maintenance covenants generating (iv) attractive yields KBDC Portfolio Overview At - a - Glance 1 Excludes investments in broadly syndicated loans and opportunistic investments; as of March 31, 2025, KBDC held $224 million of such investments (fair value), representing ~10% of total fair market value of investments. 2 Weighted average yield of amortized cost of debt investments. 3 Excludes investments on watchlist. 4 NII yield is calculated by dividing the annualized 1Q NII per share by NAV per share at March 31, 2025. 5 T he expiration of the waiver on incentive fees represents 1.5% of the decrease in NII Yield from 11.8% to 9.7% . $2.2bn Portfolio Fair Value ($2.4bn commitments) (Q4: $2.0bn FV / $2.2bn commitments) 100% Financial Maint. Covenants (1) (Q4: 100%) ~98% First Lien Senior Secured (Q4: ~98%) 99% PE Sponsored Companies (1) (Q4: 99%) 116 Portfolio Companies (Q4: 110) 3.2x Wtd. Avg. Interest Coverage (3) (Q4: 3.1x) ~10.4% Wtd. Avg. Portfolio Yield (2) (Q4: ~10.7%) 4.2x Wtd. Avg. Net Leverage (3) (Q4: 4.2x) KBDC OVERVIEW (MARCH 31, 2025) 1.6% FV Debt on Non - Accrual (Q4: 1.3%) 9.7% NII Yield (4)(5) (Q4: 11.8%)
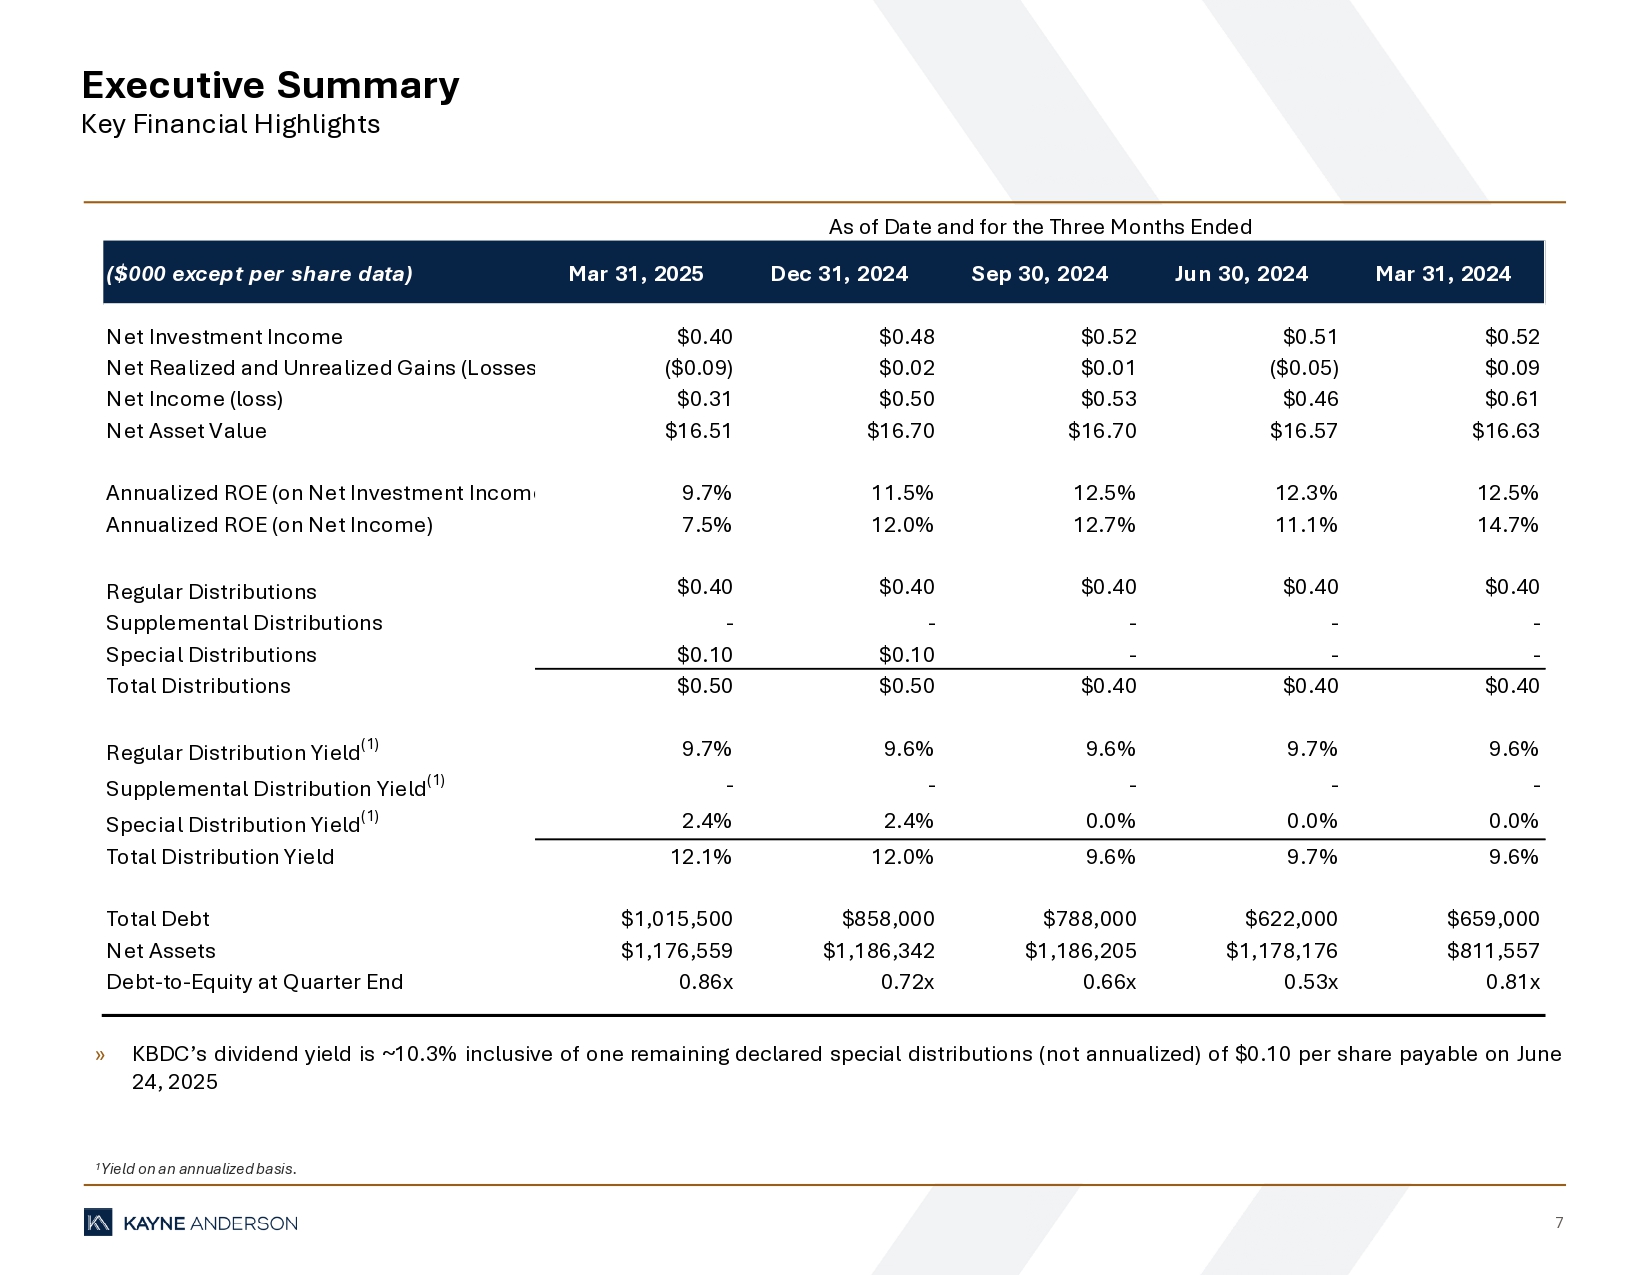
7 Executive Summary Key Financial Highlights » KBDC’s dividend yield is ~ 10 . 3 % inclusive of one remaining declared special distributions (not annualized) of $ 0 . 10 per share payable on June 24 , 2025 1 Yield on an annualized basis. ($000 except per share data) Mar 31, 2025 Dec 31, 2024 Sep 30, 2024 Jun 30, 2024 Mar 31, 2024 Net Investment Income $0.40 $0.48 $0.52 $0.51 $0.52 Net Realized and Unrealized Gains (Losses) ($0.09) $0.02 $0.01 ($0.05) $0.09 Net Income (loss) $0.31 $0.50 $0.53 $0.46 $0.61 Net Asset Value $16.51 $16.70 $16.70 $16.57 $16.63 Annualized ROE (on Net Investment Income) 9.7% 11.5% 12.5% 12.3% 12.5% Annualized ROE (on Net Income) 7.5% 12.0% 12.7% 11.1% 14.7% Regular Distributions $0.40 $0.40 $0.40 $0.40 $0.40 Supplemental Distributions - - - - - Special Distributions $0.10 $0.10 - - - Total Distributions $0.50 $0.50 $0.40 $0.40 $0.40 Regular Distribution Yield (1) 9.7% 9.6% 9.6% 9.7% 9.6% Supplemental Distribution Yield (1) - - - - - Special Distribution Yield (1) 2.4% 2.4% 0.0% 0.0% 0.0% Total Distribution Yield 12.1% 12.0% 9.6% 9.7% 9.6% Total Debt $1,015,500 $858,000 $788,000 $622,000 $659,000 Net Assets $1,176,559 $1,186,342 $1,186,205 $1,178,176 $811,557 Debt-to-Equity at Quarter End 0.86x 0.72x 0.66x 0.53x 0.81x As of Date and for the Three Months Ended

PORTFOLIO OVERVIEW

9 Portfolio Overview Key Statistics 1 As of 1Q’25, KBDC held $224 million (fair value) of broadly syndicated loans across 20 borrowers. KEY PORTFOLIO STATISTICS ($ IN MILLIONS) (1) Mar 31, 2025 Dec 31, 2024 Sep 30, 2024 Jun 30, 2024 Mar 31, 2024 Portfolio Highlights Funded Investments at Fair Value $2,167 $1,995 $1,943 $1,847 $1,784 Number of Portfolio Companies 116 110 110 106 103 Average Position Size at Fair Value ($) $18.7 $18.1 $17.7 $17.4 $17.3 Average Position Size at Fair Value (%) 0.9% 0.9% 0.9% 0.9% 1.0% Portfolio Composition (at fair value) First Lien 98% 98% 98% 98% 98% Second Lien 0% 0% 0% 0% 0% Subordinated 1% 1% 1% 1% 1% Equity 1% 1% 1% 1% 1% Loans by Interest Rate Type % Floating Rate Debt Investments 100.0% 100.0% 100.0% 100.0% 100.0% % Fixed Rate Debt Investments 0.0% 0.0% 0.0% 0.0% 0.0% Asset Level Yields (at fair value) Weighted Average Yield on Private Credit Loans 10.8% 11.1% 11.9% 12.3% 12.4% Weighted Average Yield on Broadly Syndicated Loans (1) 6.9% 7.1% 7.8% 8.3% 8.4% Weighted Average Yield on Debt Investments 10.4% 10.6% 11.3% 11.7% 11.7% Non-accrual Debt Investments (at fair value) Non-accrual Investments $33.3 $25.0 $19.2 $18.9 $7.0 Non-accrual Investments as a % of Debt Investments 1.6% 1.3% 1.0% 1.0% 0.4% Number of Investments on Non-accrual 4 3 2 2 1

10 Portfolio Overview Diversity (As of March 31, 2025) Note: Please see the Company’s filings with the SEC for more information about the Company’s portfolio 1 Calculated as a percentage of total debt investments at fair value. 2 In some instances, we have disclosed the borrower’s DBA name. 3 Calculated as a percentage of total fair value. INDUSTRY CONCENTRATION BORROWER CONCENTRATION (1)(2) INVESTMENT TYPE (3) Paris Presents 1.9% Suave 1.9% MARS 1.9% Keany 1.9% M2S 1.8% Handgards 1.8% American Equipment 1.7% CREO Group 1.7% Vitesse 1.7% FreshEdge 1.6% All Others 82.1% 116 Borrowers Trading Companies & Distributors 15.4% Commercial Services & Supplies 10.8% Food Products 9.2% Containers & Packaging 8.7% Health Care Providers & Services 7.8% Professional Services 5.4% Personal Care Products 4.7% Machinery 4.6% Leisure Products 4.5% Aerospace & Defense 4.1% All Others (20 Total) 24.8% 30 Industries 89%, Private 10%, BSL 1%, Equity (Avg Position: 0.9%)
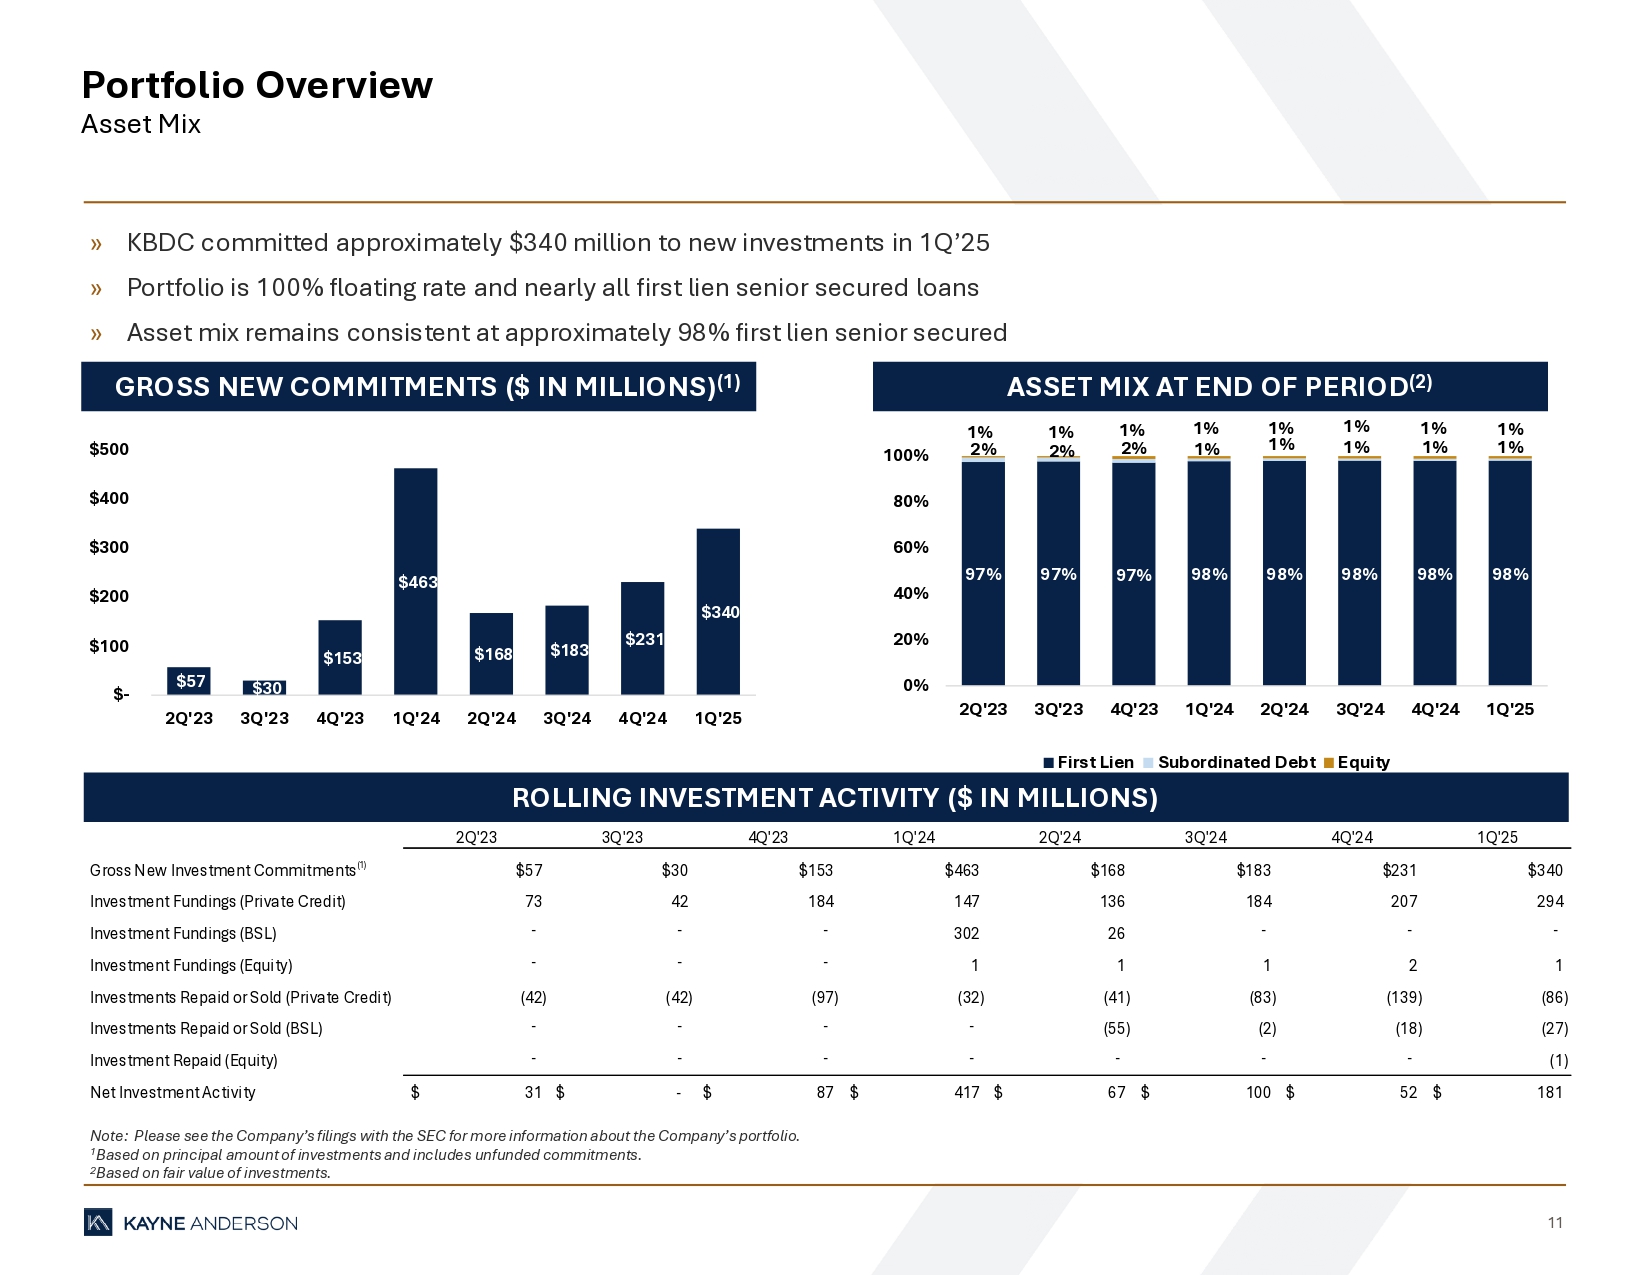
11 Portfolio Overview Asset Mix GROSS NEW COMMITMENTS ($ IN MILLIONS) (1) ASSET MIX AT END OF PERIOD (2) » KBDC committed approximately $340 million to new investments in 1Q’25 » Portfolio is 100% floating rate and nearly all first lien senior secured loans » Asset mix remains consistent at approximately 98% first lien senior secured ROLLING INVESTMENT ACTIVITY ($ IN MILLIONS) Note: Please see the Company’s filings with the SEC for more information about the Company’s portfolio. 1 Based on principal amount of investments and includes unfunded commitments. 2 Based on fair value of investments. $57 $30 $153 $463 $168 $183 $231 $340 $- $100 $200 $300 $400 $500 2Q'23 3Q'23 4Q'23 1Q'24 2Q'24 3Q'24 4Q'24 1Q'25 97% 97% 97% 98% 98% 98% 98% 98% 2% 2% 2% 1% 1% 1% 1% 1% 1% 1% 1% 1% 1% 1% 1% 1% 0% 20% 40% 60% 80% 100% 2Q'23 3Q'23 4Q'23 1Q'24 2Q'24 3Q'24 4Q'24 1Q'25 First Lien Subordinated Debt Equity 2Q'23 3Q'23 4Q'23 1Q'24 2Q'24 3Q'24 4Q'24 1Q'25 Gross New Investment Commitments(1) $57 $30 $153 $463 $168 $183 $231 $340 Investment Fundings (Private Credit) 73 42 184 147 136 184 207 294 Investment Fundings (BSL) - - - 302 26 - - - Investment Fundings (Equity) - - - 1 1 1 2 1 Investments Repaid or Sold (Private Credit) (42) (42) (97) (32) (41) (83) (139) (86) Investments Repaid or Sold (BSL) - - - - (55) (2) (18) (27) Investment Repaid (Equity) - - - - - - - (1) Net Investment Activity 31$ $ - 87$ 417$ 67$ 100$ 52$ 181$

FINANCIAL HIGHLIGHTS
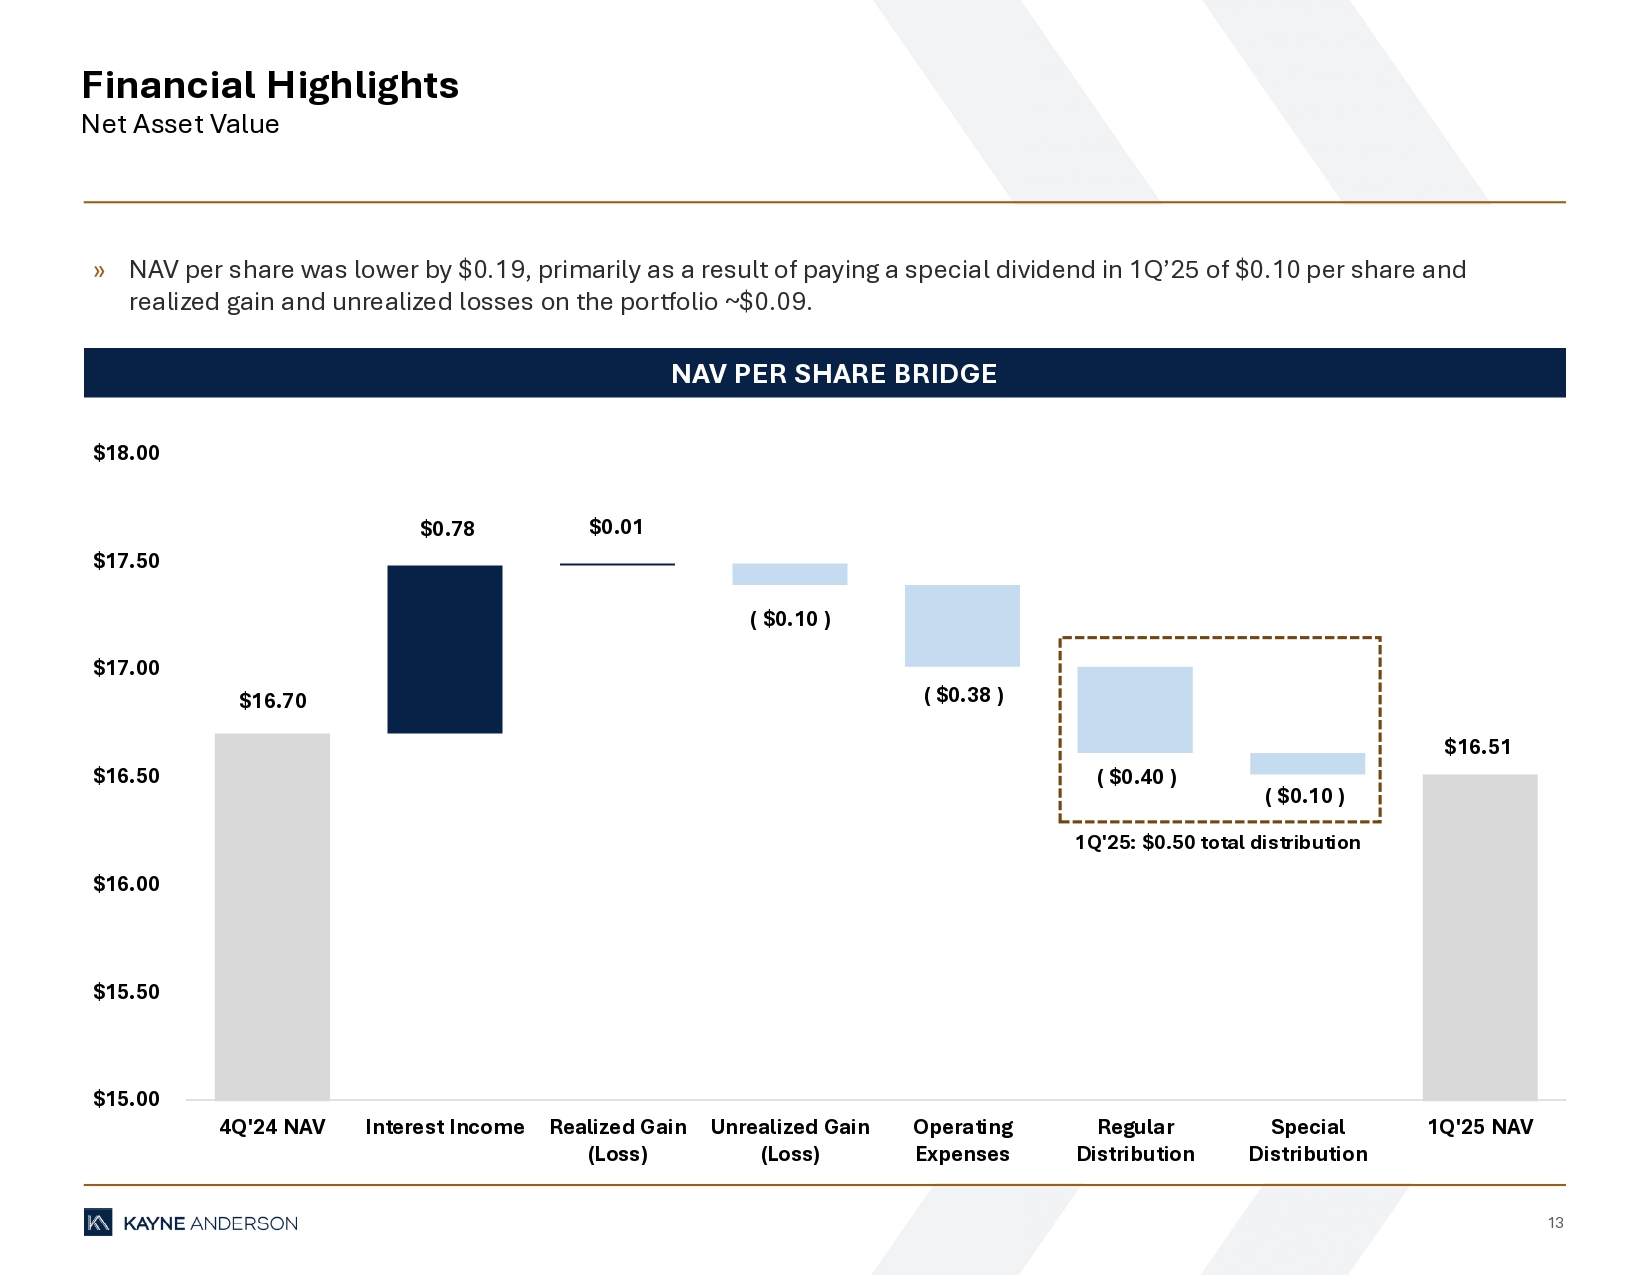
13 Financial Highlights Net Asset Value NAV PER SHARE BRIDGE » NAV per share was lower by $0.19, primarily as a result of paying a special dividend in 1Q’25 of $0.10 per share and realized gain and unrealized losses on the portfolio ~$0.09. ( $0.10 ) ( $0.38 ) ( $0.40 ) ( $0.10 ) $16.70 $0.78 $0.01 $16.51 $15.00 $15.50 $16.00 $16.50 $17.00 $17.50 $18.00 4Q'24 NAV Interest Income Realized Gain (Loss) Unrealized Gain (Loss) Operating Expenses Regular Distribution Special Distribution 1Q'25 NAV 1Q'25: $0.50 total distribution
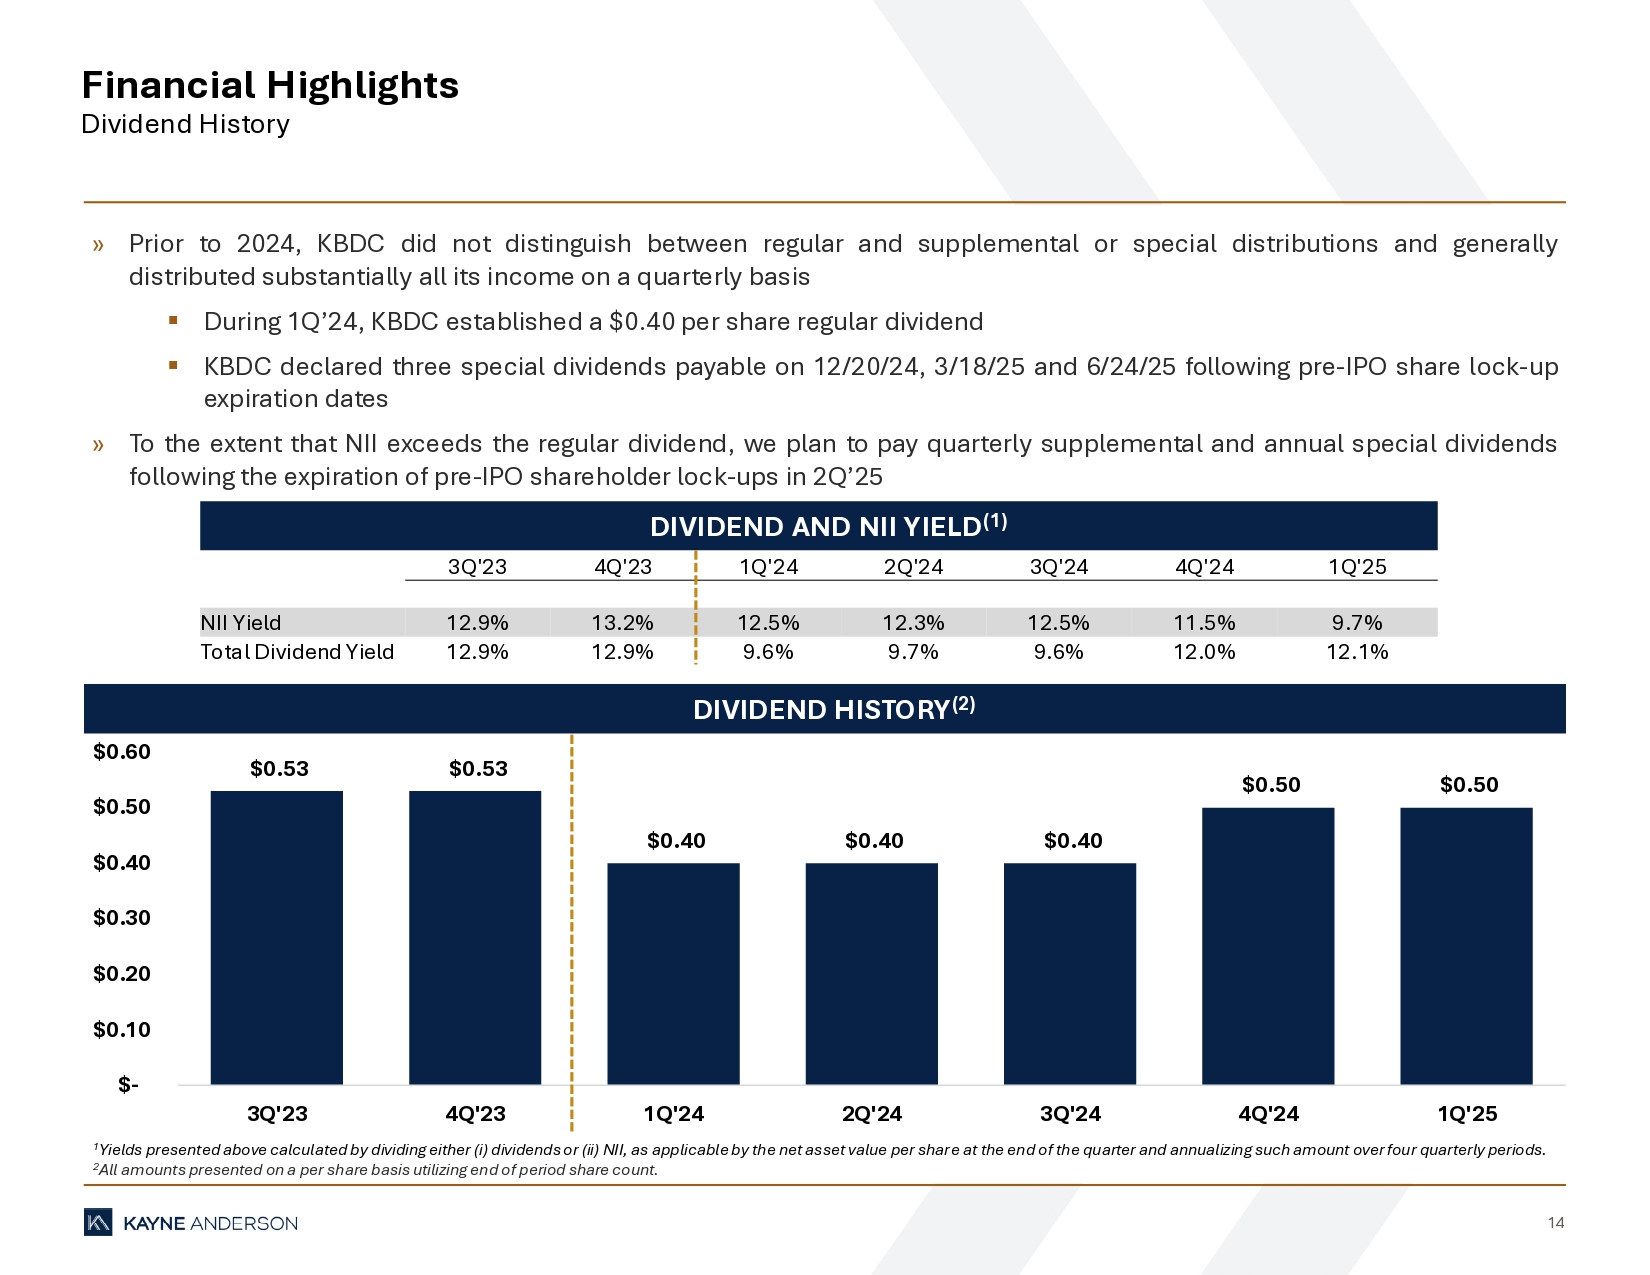
14 Financial Highlights Dividend History 1 Yields presented above calculated by dividing either (i) dividends or (ii) NII, as applicable by the net asset value per shar e a t the end of the quarter and annualizing such amount over four quarterly periods. 2 All amounts presented on a per share basis utilizing end of period share count. DIVIDEND HISTORY (2) DIVIDEND AND NII YIELD (1) » Prior to 2024 , KBDC did not distinguish between regular and supplemental or special distributions and generally distributed substantially all its income on a quarterly basis ▪ During 1 Q’ 24 , KBDC established a $ 0 . 40 per share regular dividend ▪ KBDC declared three special dividends payable on 12 / 20 / 24 , 3 / 18 / 25 and 6 / 24 / 25 following pre - IPO share lock - up expiration dates » To the extent that NII exceeds the regular dividend, we plan to pay quarterly supplemental and annual special dividends following the expiration of pre - IPO shareholder lock - ups in 2 Q’ 25 $0.53 $0.53 $0.40 $0.40 $0.40 $0.50 $0.50 $- $0.10 $0.20 $0.30 $0.40 $0.50 $0.60 3Q'23 4Q'23 1Q'24 2Q'24 3Q'24 4Q'24 1Q'25 1Q'25 4Q'24 3Q'24 2Q'24 1Q'24 4Q'23 3Q'23 9.7% 11.5% 12.5% 12.3% 12.5% 13.2% 12.9% NII Yield 12.1% 12.0% 9.6% 9.7% 9.6% 12.9% 12.9% Total Dividend Yield

BALANCE SHEET AND OPERATING RESULTS
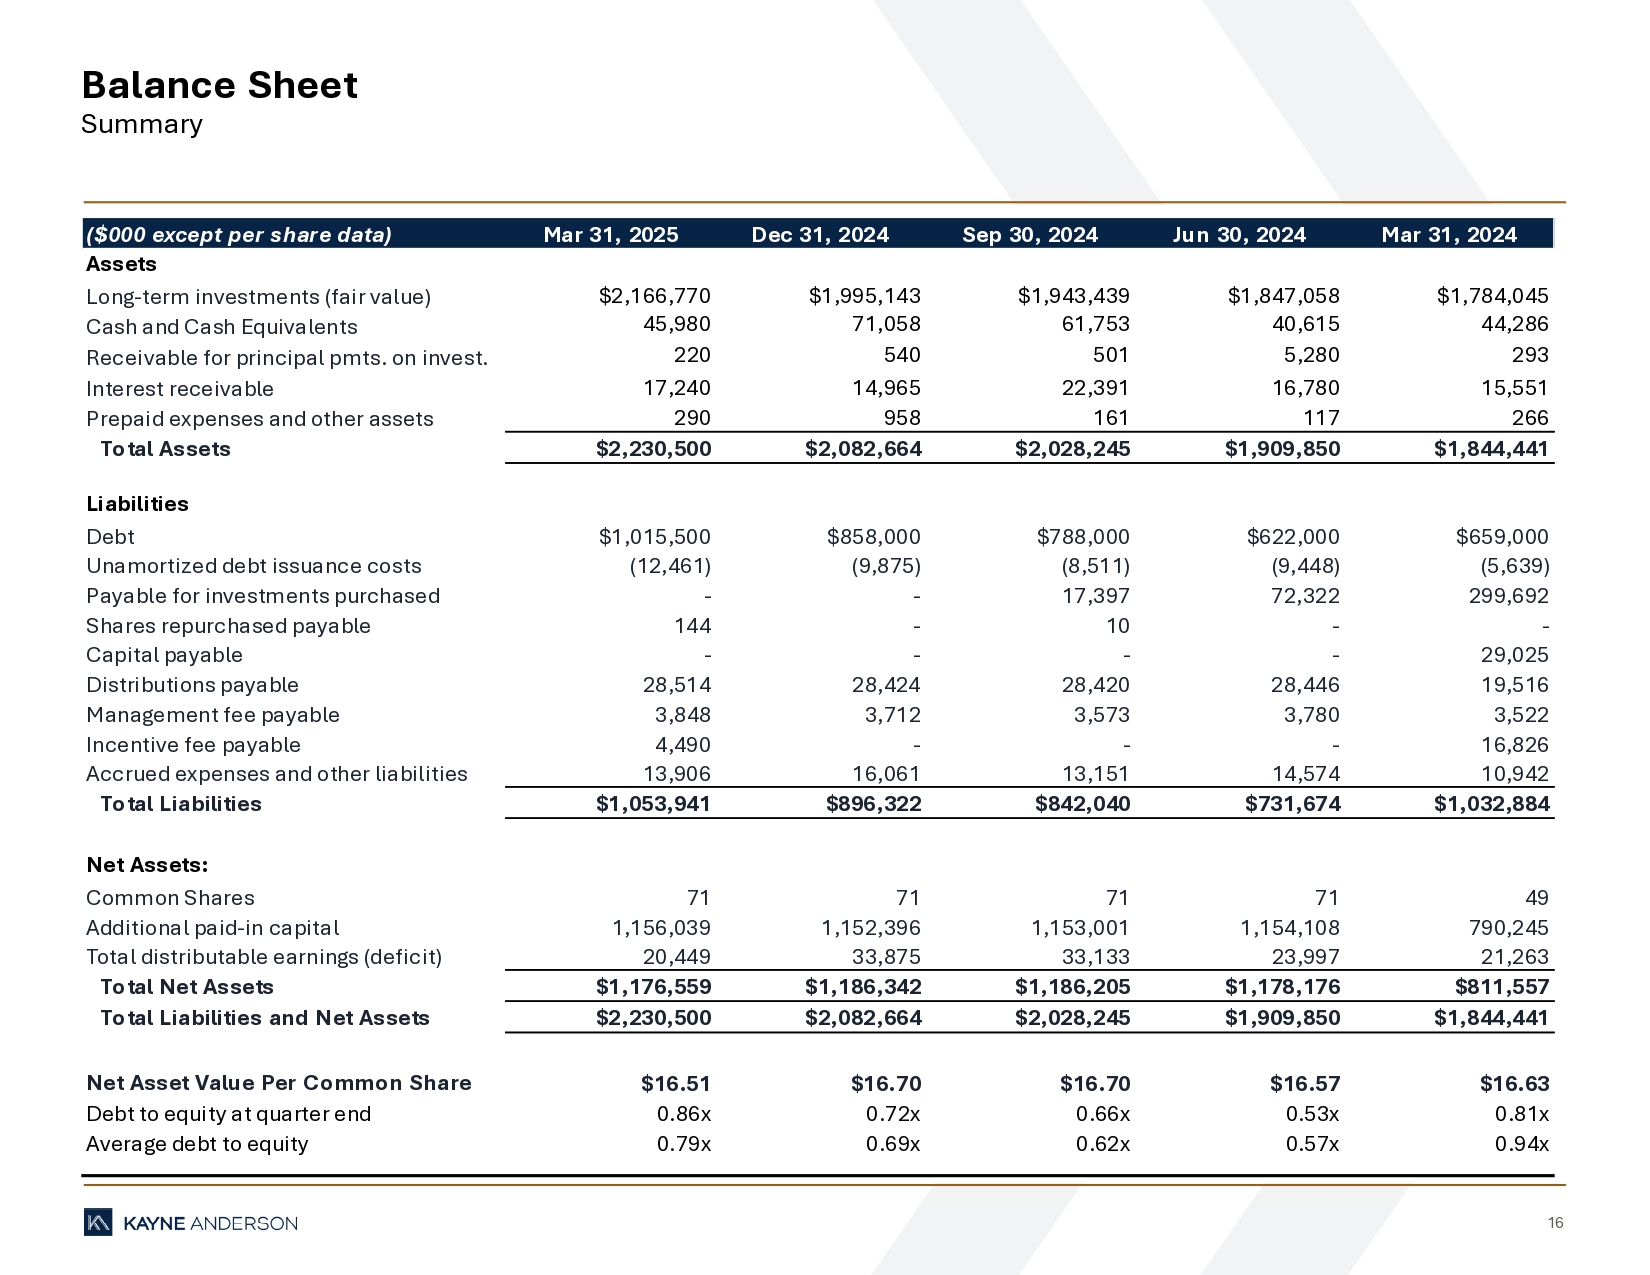
16 Balance Sheet Summary ($000 except per share data) Mar 31, 2025 Dec 31, 2024 Sep 30, 2024 Jun 30, 2024 Mar 31, 2024 Assets Long-term investments (fair value) $2,166,770 $1,995,143 $1,943,439 $1,847,058 $1,784,045 Cash and Cash Equivalents 45,980 71,058 61,753 40,615 44,286 Receivable for principal pmts. on invest. 220 540 501 5,280 293 Interest receivable 17,240 14,965 22,391 16,780 15,551 Prepaid expenses and other assets 290 958 161 117 266 Total Assets $2,230,500 $2,082,664 $2,028,245 $1,909,850 $1,844,441 Liabilities Debt $1,015,500 $858,000 $788,000 $622,000 $659,000 Unamortized debt issuance costs (12,461) (9,875) (8,511) (9,448) (5,639) Payable for investments purchased - - 17,397 72,322 299,692 Shares repurchased payable 144 - 10 - - Capital payable - - - - 29,025 Distributions payable 28,514 28,424 28,420 28,446 19,516 Management fee payable 3,848 3,712 3,573 3,780 3,522 Incentive fee payable 4,490 - - - 16,826 Accrued expenses and other liabilities 13,906 16,061 13,151 14,574 10,942 Total Liabilities $1,053,941 $896,322 $842,040 $731,674 $1,032,884 Net Assets: Common Shares 71 71 71 71 49 Additional paid-in capital 1,156,039 1,152,396 1,153,001 1,154,108 790,245 Total distributable earnings (deficit) 20,449 33,875 33,133 23,997 21,263 Total Net Assets $1,176,559 $1,186,342 $1,186,205 $1,178,176 $811,557 Total Liabilities and Net Assets $2,230,500 $2,082,664 $2,028,245 $1,909,850 $1,844,441 Net Asset Value Per Common Share $16.51 $16.70 $16.70 $16.57 $16.63 Debt to equity at quarter end 0.86x 0.72x 0.66x 0.53x 0.81x Average debt to equity 0.79x 0.69x 0.62x 0.57x 0.94x
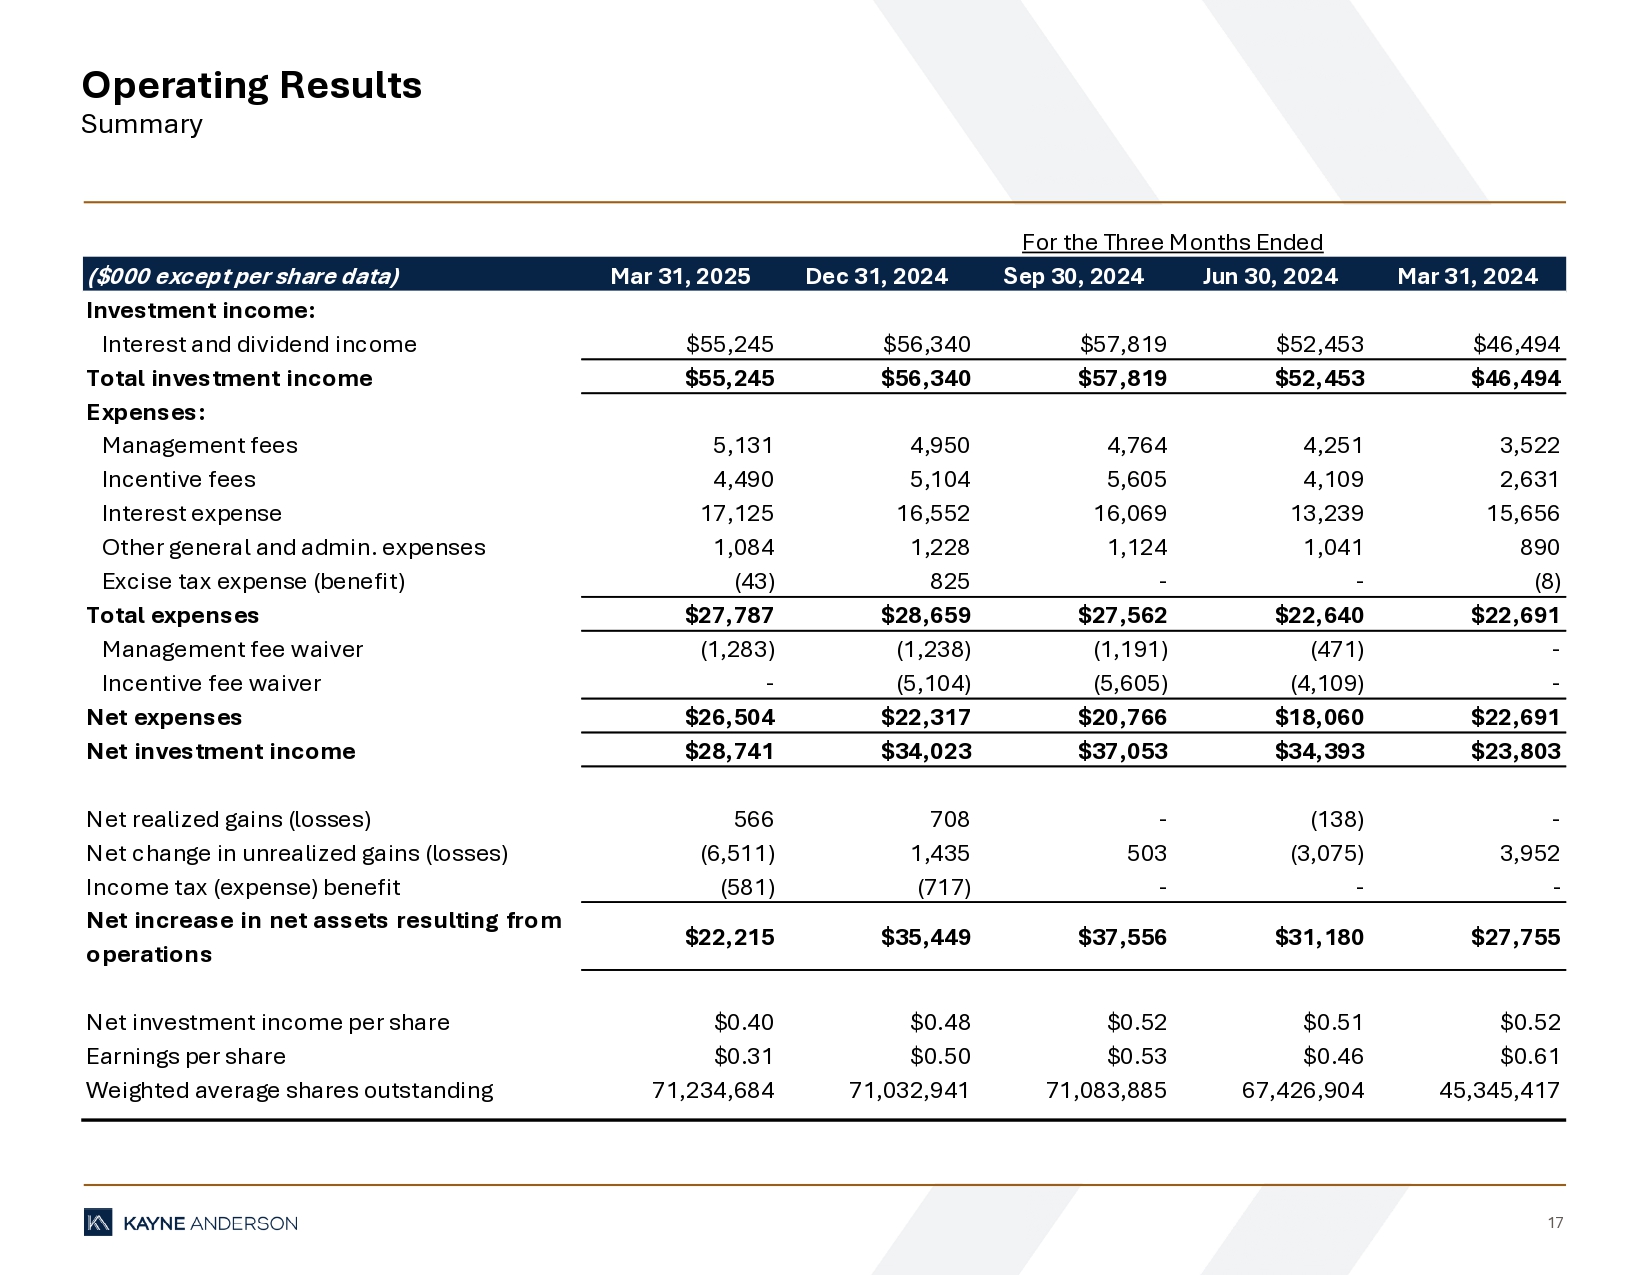
17 Operating Results Summary ($000 except per share data) Mar 31, 2025 Dec 31, 2024 Sep 30, 2024 Jun 30, 2024 Mar 31, 2024 Investment income: Interest and dividend income $55,245 $56,340 $57,819 $52,453 $46,494 Total investment income $55,245 $56,340 $57,819 $52,453 $46,494 Expenses: Management fees 5,131 4,950 4,764 4,251 3,522 Incentive fees 4,490 5,104 5,605 4,109 2,631 Interest expense 17,125 16,552 16,069 13,239 15,656 Other general and admin. expenses 1,084 1,228 1,124 1,041 890 Excise tax expense (benefit) (43) 825 - - (8) Total expenses $27,787 $28,659 $27,562 $22,640 $22,691 Management fee waiver (1,283) (1,238) (1,191) (471) - Incentive fee waiver - (5,104) (5,605) (4,109) - Net expenses $26,504 $22,317 $20,766 $18,060 $22,691 Net investment income $28,741 $34,023 $37,053 $34,393 $23,803 Net realized gains (losses) 566 708 - (138) - Net change in unrealized gains (losses) (6,511) 1,435 503 (3,075) 3,952 Income tax (expense) benefit (581) (717) - - - Net increase in net assets resulting from operations $22,215 $35,449 $37,556 $31,180 $27,755 Net investment income per share $0.40 $0.48 $0.52 $0.51 $0.52 Earnings per share $0.31 $0.50 $0.53 $0.46 $0.61 Weighted average shares outstanding 71,234,684 71,032,941 71,083,885 67,426,904 45,345,417 For the Three Months Ended
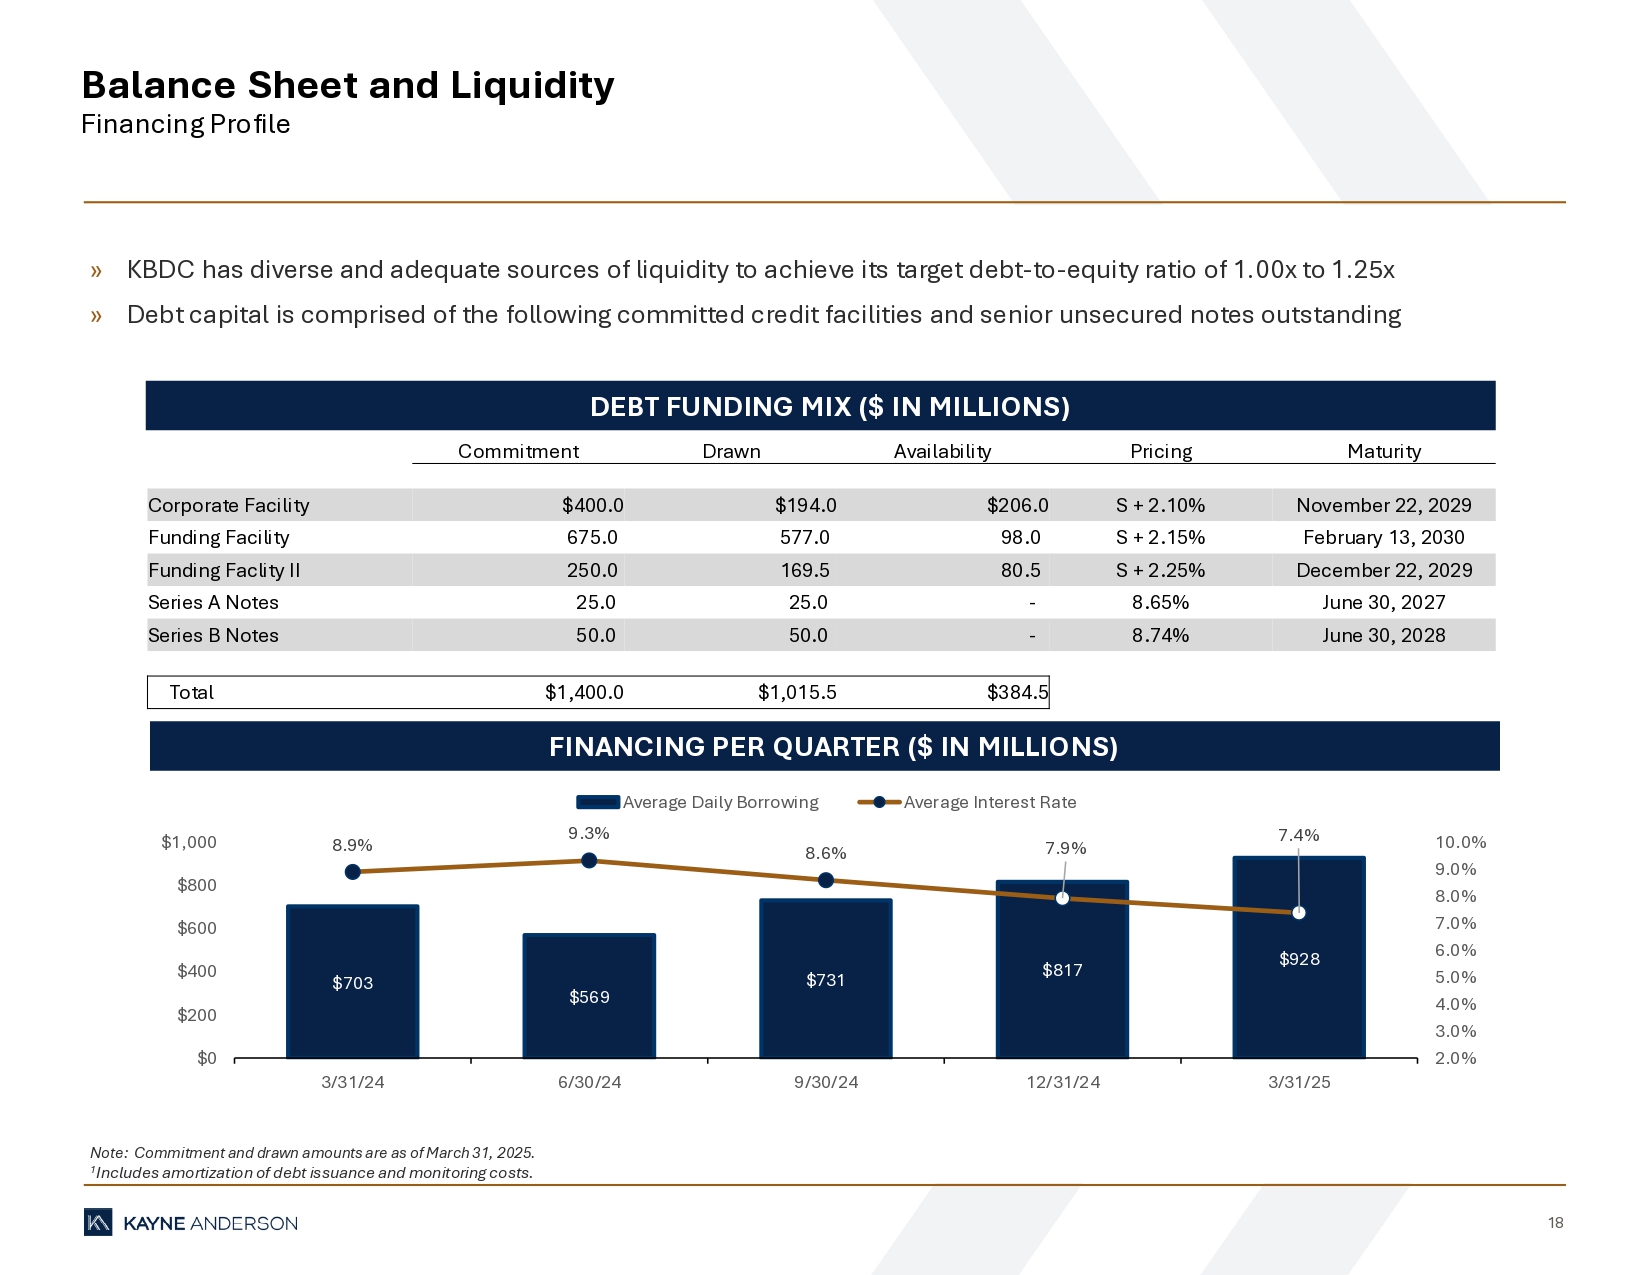
18 Balance Sheet and Liquidity Financing Profile Note: Commitment and drawn amounts are as of March 31, 2025. 1 Includes amortization of debt issuance and monitoring costs. DEBT FUNDING MIX ($ IN MILLIONS) FINANCING PER QUARTER ($ IN MILLIONS) » KBDC has diverse and adequate sources of liquidity to achieve its target debt - to - equity ratio of 1.00x to 1.25x » Debt capital is comprised of the following committed credit facilities and senior unsecured notes outstanding 1 $703 $569 $731 $817 $928 8.9% 9.3% 8.6% 7.9% 7.4% 2.0% 3.0% 4.0% 5.0% 6.0% 7.0% 8.0% 9.0% 10.0% $0 $200 $400 $600 $800 $1,000 3/31/24 6/30/24 9/30/24 12/31/24 3/31/25 Average Daily Borrowing Average Interest Rate Maturity Pricing Availability Drawn Commitment November 22, 2029 S + 2.10% $206.0 $194.0 $400.0 Corporate Facility February 13, 2030 S + 2.15% 98.0 577.0 675.0 Funding Facility December 22, 2029 S + 2.25% 80.5 169.5 250.0 Funding Faclity II June 30, 2027 8.65% - 25.0 25.0 Series A Notes June 30, 2028 8.74% - 50.0 50.0 Series B Notes $384.5 $1,015.5 $1,400.0 Total