Exhibit (c)(14)
INVESTMENT BANKING I DIVISION ‘WLINCOLN INTERNATIO NAL Board Discussion Materials Prepared for Project Padlock Strictly Private and Confidential April 20, 2022 Information contained herein, marked with [**], has been omitted pursuant to a request for confidential treatment. A complete copy of this document has been supplied to the Securities and Exchange Commission under separate cover.
Disclaimer INVESTMENT BANKING I DIVISION ‘WLINCOLN INTERNATIO NAL These materials have been prepared and are provided by Goldman Sachs on a confidential basis solely for the information and assistance of the Board of Directors (the “Board”) and senior management of Covetrus (the “Company”) in connection with their consideration of the matters referred to herein. These materials and Goldman Sachs’ presentation relating to these materials (the “Confidential Information”) may not be disclosed to any third party or circulated or referred to publicly or used for or relied upon for any other purpose without the prior written consent of Goldman Sachs. The Confidential Information was not prepared with a view to public disclosure or to conform to any disclosure standards under any state, federal or international securities laws or other laws, rules or regulations, and Goldman Sachs does not take any responsibility for the use of the Confidential Information by persons other than those set forth above. Notwithstanding anything in this Confidential Information to the contrary, the Company may disclose to any person the US federal income and state income tax treatment and tax structure of any transaction described herein and all materials of any kind (including tax opinions and other tax analyses) that are provided to the Company relating to such tax treatment and tax structure, without Goldman Sachs imposing any limitation of any kind. The Confidential Information has been prepared by the Investment Banking Division of Goldman Sachs and is not a product of its research department. Goldman Sachs and its affiliates are engaged in advisory, underwriting and financing, principal investing, sales and trading, research, investment management and other financial and non-financial activities and services for various persons and entities. Goldman Sachs and its affiliates and employees, and funds or other entities they manage or in which they invest or have other economic interests or with which they co-invest, may at any time purchase, sell, hold or vote long or short positions and investments in securities, derivatives, loans, commodities, currencies, credit default swaps and other financial instruments of the Company, any other party to any transaction and any of their respective affiliates or any currency or commodity that may be involved in any transaction. Goldman Sachs’ investment banking division maintains regular, ordinary course client service dialogues with clients and potential clients to review events, opportunities, and conditions in particular sectors and industries and, in that connection, Goldman Sachs may make reference to the Company, but Goldman Sachs will not disclose any confidential information received from the Company. The Confidential Information has been prepared based on historical financial information, forecasts and other information obtained by Goldman Sachs from publicly available sources, the management of the Company or other sources (approved for our use by the Company in the case of information from management and non-public information). In preparing the Confidential Information, Goldman Sachs has relied upon and assumed, without assuming any responsibility for independent verification, the accuracy and completeness of all of the financial, legal, regulatory, tax, accounting and other information provided to, discussed with or reviewed by us, and Goldman Sachs does not assume any liability for any such information. Goldman Sachs does not provide accounting, tax, legal or regulatory advice. Goldman Sachs has not made an independent evaluation or appraisal of the assets and liabilities (including any contingent, derivative or other off-balance sheet assets and liabilities) of the Company or any other party to any transaction or any of their respective affiliates and has no obligation to evaluate the solvency of the Company or any other party to any transaction under any state or federal laws relating to bankruptcy, insolvency or similar matters. The analyses contained in the Confidential Information do not purport to be appraisals nor do they necessarily reflect the prices at which businesses or securities actually may be sold or purchased. Goldman Sachs’ role in any due diligence review is limited solely to performing such a review as it shall deem necessary to support its own advice and analysis and shall not be on behalf of the Company. Analyses based upon forecasts of future results are not necessarily indicative of actual future results, which may be significantly more or less favorable than suggested by these analyses, and Goldman Sachs does not assume responsibility if future results are materially different from those forecast. The Confidential Information does not address the underlying business decision of the Company to engage in any transaction, or the relative merits of any transaction or strategic alternative referred to herein as compared to any other transaction or alternative that may be available to the Company. The Confidential Information is necessarily based on economic, monetary, market and other conditions as in effect on, and the information made available to Goldman Sachs as of, the date of such Confidential Information and Goldman Sachs assumes no responsibility for updating or revising the Confidential Information based on circumstances, developments or events occurring after such date. The Confidential Information does not constitute any opinion, nor does the Confidential Information constitute a recommendation to the Board, any security holder of the Company or any other person as to how to vote or act with respect to any transaction or any other matter. The Confidential Information, including this disclaimer, is subject to, and governed by, any written agreement between the Company, the Board and/or any committee thereof, on the one hand, and Goldman Sachs, on the other hand. The Confidential Information does not address, nor does Goldman Sachs express any view as to, the potential effects of volatility in the credit, financial and stock markets on the Company, any other party to any transaction or any transaction.
Update on Process Developments Since INVESTMENT BANKING I Board Meeting on April 7, 2022 DIVISION ‘WLINCOLN INTERNATIO NAL • Since the board meeting on April 7, 2022, Goldman Sachs (“GS”) and Lincoln have engaged with all parties in the next steps •—Very active in detailed diligence—3 meetings held, including a full day in-person diligence session, with [6] more scheduled I requested across subject matters including financial, legal, IT, HR, insurance, and other diligence workstreams, and engaged several external advisors and consultants—Have confirmed ability to move on accelerated timeline—Understand we need to see valuation improvement for the board to align on a transaction • — has decided to exit the process after the initial wave of diligence—Key areas of feedback focused on the macro dynamic of consolidation, the need to execute on several cost-savings initiatives, as well as the nascent nature of the prop brands strategy—Given importance of-as a customer they were transparent in highlighting potential hurdles — remains engaged and wants to acquire the technology business—They are in a holding pattern given—and awaiting direction on next steps—Have indicated value of $1.85bn—$2.05bn, which implies a multiple range of -21x to -23x 2022E EBITDA< 1 ·- >—Initial dialogue with the CEO, scheduling management presentation—Expressed sensitivity on information sharing (1) GTS EBITDA in- proposal includes NA GTS, International PIMS, assumes -$10M of PF corporate costs and excludes SmartPak. Information contained herein, marked with [**], has been omitted pursuant to a request for confidential treatment. A complete copy of this document has been supplied to the Securities and Exchange Commission under separate cover.
Potential Pathways to Pursue INVESTMENT BANKING I DIVISION ‘WLINCOLN INTERNATIO NAL covetrus I I a a Sell Tech I Distribution’ Standalone Status Quo Remains Public Company • Immediate liquidity for • Shareholders retain full exposure • Unlock embedded value within the shareholders at a premium to to upside technology segment current market valuation • Current plan shows pathway to • Expect robust demand in a • Strong process momentum with meaningful value creation over competitive auction for technology potential to sign prior to earnings time • Threshold valuation and potential • Execution risk for current plan, • Tax leakage of any separation for missed upside including ongoing business uncertainty and impact of ongoing • Operational impact, both resources • Limited alternatives to unlock full consolidation and effort to separate as well as embedded value of tech business potential negative impact to • Limited ability to rerate multiple distribution given relative weighting of distribution • Strength of standalone distribution equity story • Market volatility continues to weigh on stock price (current stock price of $16.23 and YTD price performance of -19%) Note: Market data as of 19-Apr-2022.
Illustrative Present Value of Future Share Price I INVESTMENT BANKING Analysis DIVISION ‘WLINCOLN NTM EV I EBITDA Multiple Method 1 ($ in millions, except per share data) INTERNATIO NAL —————-, Illustrative FSP Analysis PVFSP at Year End 2023 : Illustrative : I NTM EV I EBITDA I $40 NTM EBITDA Multiple I I .... 13.5x -ll- 12.5x $35 10.5 X 11.5 X 12.5 X 13.5 X -ll- 11.5x $30 ;::; 72.0 % $ 13.01 $ 14.60 $ 16.19 $ 17.79 -ll- 10.5x Cl)co cu c:- EBITDA CAGR: cuD.—8%(3} .....~— $25 Current E- ‘- tJj 86.0 % $ 16.26 $ 18.16 $20.06 $21.96 CVET NTM EBITDA $20 ‘t:0 ·=cu EBITDA CAGR: -13%13 1 Multiple: Cl) C) 11.0 X a..<C 100.0 % $ 19.51 $21.72 $23.93 $ 26.14 $15 EBITDA CAGR: Current FYE 2022 FYE 2023 FYE2024—17%13 1 NTM EBITDA $349 $397 $459 PVFSP at Year End 2024 Illustrative 11.5 X 11.5 X 11.5 X NTM EBITDA Multiple NTM EBITDA Multiple Implied Future EV $4,018 $4,564 $5,282 10.5 X 11.5 X 12.5 X 13.5 X (-) Net Debt (790) (680) (536) Implied Future Equity Value $3,228 $3,884 $ 4,747 E 72.0 % $ 14.68 $ 16.33 $ 17.97 $ 19.62 FDSO 142.4 142.6 142.7 Cl) c: o cu EBITDA CAGR: c:— 8%(3} cuD. Implied Future Stock Price $22.66 $27.25 $33.27 E- $ 18.04 $20.00 ‘- tJj 86.0 % $21.97 $23.93 Present Value of Future EBITDA CAGR: $20.23 $21.72 $23.68 0 ·= Stock Price1 ‘t: cu 3 Cl) C) -13%1 1 a..<C % Premium to Current 24.7 % 33.8 % 45.9 % 100.0 % $ 21.40 $23.68 $25.97 $28.25 EBITDA CAGR: as of 19-Apr-2022. Valuation date of 31-Mar-2022. 3 Source. Management Projections. Market data—17%1 1 Note. Analysis assumes NTM EV/EBITDA multiple applied to forward year EBITDA and utilizes projected net debt per management projections. 1 Future stock price discounted back to today utilizing an illustrative 12% cost of equity 2 Assumes performance against plan reduction applied to FY 2023- 2025 EBITDA 3 Reflects Who/eGo consolidated ‘21A—‘25E EBITDA CAGR.
Sensitivity Analysis—Future Share Price INVESTMENT BANKING I DIVISION ‘WLINCOLN IN TERNATIO NAL Impact to FYE 2023 Future Impact to FYE 2024 Future Scenarios Considered Share Price Share Price Base Case: 2025E Dist. Revenue: $4,850M 2025E Pre-Corp Dist. EBITDA: $412M Base Case: $23.68 ‘21A- ‘25E Pre-Corp Dist. EBITDA CAGR: -14% Base Case: $21.72 ‘21A- ‘25E WholeCo Consolidated EBITDA CAGR: -17% 25% Downside: r- 2025E Dist. Revenue: $4, 740M (/) 2025E Pre-Corp Dist. EBITDA: $379M $20.23 1$1.49 $21.79 c ‘21A- ‘25E Pre-Corp Dist. EBITDA CAGR: -12% —..0 ‘21A- ‘25E WholeCo Consolidated EBITDA CAGR: -15% c. ~ E~ 50% Downside: ·- ~—— ~ (/) 2025E Dist. Revenue: $4,630M .c (/) $18.77 I ($2.95) $19.96 I ($3.72) ·~ 2025E Pre-Corp Dist. EBITDA: $347M <( t) c ‘21A- ‘25E Pre-Corp Dist. EBITDA CAGR: -10% ._—- L-— ·- 0 ‘21A- ‘25E WholeCo Consolidated EBITDA CAGR: -13% 0:+: ‘- ns c.(1) 75% Downside: .. ——- a-—— 0 2025E Dist. Revenue: $4,520M $17.35 I ($4.37) $18.20 ($5.48) 2025E Pre-Corp Dist. EBITDA: $316M ‘21A- ‘25E Pre-Corp Dist. EBITDA CAGR: -7% L..——-‘21A- ‘25E WholeCo Consolidated EBITDA CAGR: -11% Full Downside: ——— ~———- ... 2025E Dist. Revenue: $4,410M $15.97 I ($5.75) $16.50 ($7.18) 2025E Pre-Corp Dist. EBITDA: $286M ‘21A- ‘25E Pre-Corp Dist. EBITDA CAGR: -5% L..———-‘21A- ‘25E WholeCo Consolidated EBITDA CAGR: -8% Downside cases assume annual revenue reduction of up to $100M, and pre-corp Dist. EBITDA margin growth reduction of up to 50 bps Source.· Management Projections. 51 Note. Base case assumes 11.5x NTM EBITDA and net debt of $680mm in YE 2023 and $536mm in YE 2024. Future stock price discounted back to today utilizing an illustrative 12% cost of equity.
Illustrative Discounted Cash Flow Analysis I INVESTMENT BANKING ($ in millions, except per share data) DIVISION ‘WLINCOLN INTERNATIO NAL Illustrative Unlevered Free Cash Flow Management Forecast Extrapolation 2022E 2023E 2024E 2025E 2026E 2027E 2028E Terminal Total Sales $ 4,916 $ 5,330 $ 5,775 $ 6,233 $ 6,600 $ 6,918 $ 7,208 $ 7,208 Rev % Growth 7.5% 8.4% 8.4% 7.9% 5.9% 4.8% 4.2% Total Adj. EBITDA $285 $349 $397 $459 $500 $537 $570 $ 570 %Margin 5.8% 6.6% 6.9% 7.4% 7.6% 7.8% 7.9% 7.9% D&A $(177) $(192) $(209) $(227) $(250) $(262) $(273) $(112) %ofSales (3.6~% (3.6~% (3.6~% (3.6~% (3.8~% (3.8~% (3.8~% EBIT $ 108 $ 157 $ 188 $233 $250 $274 $297 $458 %Margin 2.2% 2.9% 3.3% 3.7% 3.8% 4.0% 4.1 % 6.4% (-)Tax $(27) $(39) $(47) $(58) $(62) $(69) $(74) $(114) Tax Rate 25.0% 25.0% 25.0% 25.0% 25.0% 25.0% 25.0% 25.0% NOPAT $ 81 $ 118 $ 141 $175 $ 187 $206 $223 $343 (+) D&A $ 177 $ 192 $209 $227 $250 $262 $273 112 (-) fl. in NWC (46) (49) (56) (57) (58) (42) (38) (19) H Caeex ~75} ~86} ~97} ~97} ~102} ~107} ~112} ~112} Unlevered Free Cash Flow $ 137 $ 175 $ 197 $247 $278 $ 319 $345 $324 Implied Equity Value Implied Share Price Implied Terminal EV I EBITDA 2.0 % 2.5 % 3.0 % 2.0 % 2.5 % 3.0 % 2.0 % 2.5 % 3.0 % 9.00 % $ 3,021 $ 3,243 $ 3,502 9.00 % $ 21.22 $ 22.77 $ 24.57 9.00 % 8.3 X 9.0 X 9.8 X 10.00 % $2,508 $2,668 $ 2,850 10.00 % $ 17.63 $ 18.75 $ 20.02 10.00 % 7.2 X 7.8 X 8.4 X 11.00 % $2,109 $ 2,228 $ 2,363 11.00 % $ 14.84 $ 15.68 $ 16.62 11.00 % 6.4 X 6.9 X 7.3 X Source.· Management Projections. Note.· Analysis valuation date of 31-Dec-2021.
Illustrative SOTP Analysis INVESTMENT BANKING I DIVISION ($ in billions, except per share data) ‘WLINCOLN IN TERNATIO NAL Illustrative SOTP Analysis -$99mm of PF Corporate Costs including contingency (vs. WholeCo 2022E management est. of -$109 million inc. contingency) SOTP Implied Premium: 5.3%—38.5% Incremental $1OM at 1 O.Ox reduces implied value by -$0.1 bn and value per share by 70 cents $4.1 —- _$_2_:~—- r-————., I $0.9 $ 3.2 r-————., I $2.3 $ 1.7 Current 2022E —-_$_t l!.—-EV I EBITDAI1l: $ 2.4 11.6 X Products I Services GTS SOTP Implied EV Net Debt SOTP Implied Current Equity Value (Includes SmartPak) Equity Value 2022E EBITDA2 $200 $95 $295 2022E EBITDA Multiple Range 8.0x -9.0x 18.0x • 24.0x 11.2x -13.8x Implied Value Range $1.6 -1.88 $1.7 -2.38 $3.3 -4.18 ($0.9)8 $2.4 -3.28 $2.38 Value I Share $11.26 • $12.64 $12.06. $16.06 $23.32. $28.70 ($6.22) $17.09. $22.48 $16.23 Source.· Management Projections, Company filings, Cap/Q, market data as of 19-Apr-2022. 1 7 Note.· Distribution and GTS level enterprise values derived by applying the stated 2022E multiples to the 2022E metric for each segment. 1 Represents street estimates for 2022E EBITDA. 2 Full Corporate costs for GTS and Standalone Products I Services assumes $10M of cost savings relative to Who/eCo LRP ($7M corporate costs allocated to GTS and $92M allocated to standalone products I services, including $20M of contingency expense).
Illustrative Monetization of GTS via Strategic INvEsTMENT BANKING I Sale with Remaining Distribution Public Company {1/2) olvlsloN ~W~,~~5}?.~N ($ in millions, except per share data) Illustrative GTS Proceeds Implied RemainCo Value 2022E 2022E GTS EBITDA (Pre Corp.) $102 Distribution EBITDA (Pre Corp.) $ 270 (-)Pro Forma Corporate Expense $(7) (-) Pro Forma Corporate Expense and Contingency $(92) GTS EBITDA (Pro Forma) $95 Pro Forma Distribution EBITDA $178 GTS Purchase Multiple 25.0 X Assumed Trading Multiple 8.0 X Implied GTS Purchase Price (Pre-SmartPak) $2,383 RemainCo Enterprise Value $ 1,426 (+) SmartPak Value 300 (-) Existing Net Debt $(886) .—————————————————————--i-——-i Total GTS Purchase Price $2,683 : (+) Net Proceeds from Sale 1 $ 2,5921 ————————————————————————————-1111 ~———~ (-)Tax Leakage ($91) : RemainCo Equity Value $3,132 ————————————————————————-,———————-: t __________________________________________ _. ____ -.JNet Proceeds from Sale of GTS 12 I $22.00 : $2,592 : 1 Implied Equity Value 1 Share ‘ I r-——— Memo: Present Value I Share (12% Ke; 18 Months) !,. ______ 1 $18.56 ,: Implied Equity Value per Share Present Value of Implied Equity Value per Share GTS Purchase Multiple I Price GTS Purchase Multiple I Price 23.0x I $2.2B 25.0x I $2.4B 27.0x I $2.6B 23.0x I $2.2B 25.0x I $2.4B 27.0x I $2.6B 7.5x $20.19 $ 21.53 $22.87 7.5x $ 17.04 $ 18.17 $ 19.30 RemainCo $20.66 r-——— $23.34 RemainCo r-———2022E Multiple S.Ox 1!,. ______ ..$22.00 : 2022E Multiple S.Ox $17.43 L_~2~~-j $ 19.69 8.5x $ 21.13 $ 22.47 $23.81 8.5x $ 17.83 $ 18.96 $20.09 Source.· Management Projections. 81 Note.· RemainCo EBITDA burdened by incremental Corporate costs of -$92 million (includes $20 million of contingency and with the $7 million of allocated GTS corporate costs, assumes $10 million of cost savings relative to WholeCo management LRP). (1) Tax triggered by Products I Services business and SmartPak. (2) Assumes CVET fully diluted shares of -142M
Illustrative Monetization of GTS via Strategic INvEsTMENT BANKING I Sale with Remaining Distribution Public Company {2/2) olvlsloN ~W~,~~5}?.~N ($ in millions, except per share data) Required GTS Gross Proceeds at Various CVET Share Prices Sensitivity Analysis CVET Price per Share $20.00 $22.00 $24.00 $26.00 Gross GTS Purchase Price Shares outstanding 142.3 142.4 142.5 142.5 Equity Value $2,847 $3,133 $3,420 $3,706 WholeCo Price per Share $20.00 $22.00 $24.00 $26.00 ( +) Net Debt/ Minority Interest $886 $886 $886 $886 7.5x $2,165 $2,451 $2,737 $3,023 Enterprise Value $3,733 $4,019 $4,306 $4,592 Remain Co 2022E Multiple 8.0x $2,098 $2,384 $2,670 $2,957 2022E Distr bution EBITDA (Pre-Corp) $270 $270 $270 $270 8.5x $2,031 $2,317 $2,603 $2,890 Pro Forma Corporate Expenses ($92) ($92) ($92) ($92) RemainCo Pro Forma EBITDA $178 $178 $178 $178 Assumed Trading Multiple 8.0 X 8.0 X 8.0 X 8.0 X Pro Forma RemainCo Enterprise Value $1,426 $1,426 $1,426 $1,426 Gross GTS Purchase Price Net Proceeds from Smart Pak $300 $300 $300 $300 Present Value of WholeCo Price per Share Required Net Proceeds from Sale of GTS $2,007 $2,293 $2,579 $2,865 $20.00 $22.00 $24.00 $26.00 1 $91 $91 $91 $91 Tax Leakage<l Required Gross Proceeds from GTS $2,098 $2,384 $2,670 $2,957 7.5x $2,695 $3,034 $3,374 $3,713 Remain Co Implied EV I ‘22E EBITDA 22.0 X 25.0 X 28.0x 31.0 X 2022E Multiple 8.0x $2,628 $2,967 $3,307 $3,646 Memo: CVET NPV Price per Share (Ke = 12%, 18 Months) $16.87 $18.56 $20.25 $21.94 8.5x $2,561 $2,901 $3,240 $3,579 Source.· Management Projections. 91 Note.· RemainCo EBITDA burdened by incremental Corporate costs of -$92 million (includes $20 million of contingency and with the $7 million of allocated GTS corporate costs, assumes $10 million of cost savings relative to Whole Co management LRP). ( 1) Tax triggered by Products I Services business and SmartPak.
Illustrative Value in a Sum of the Parts Approach INvEsTMENT BANKING I ($ in millions, except per share data) 1 
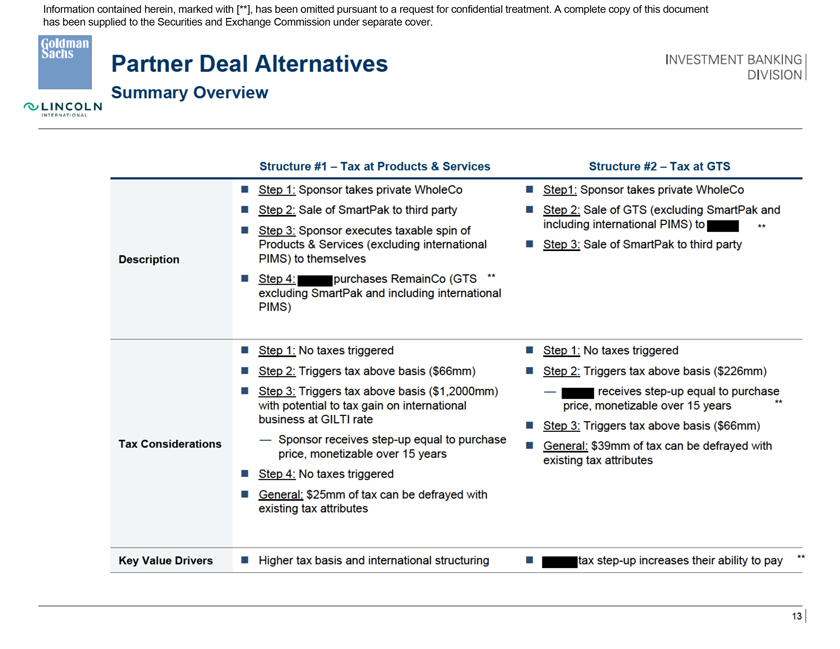
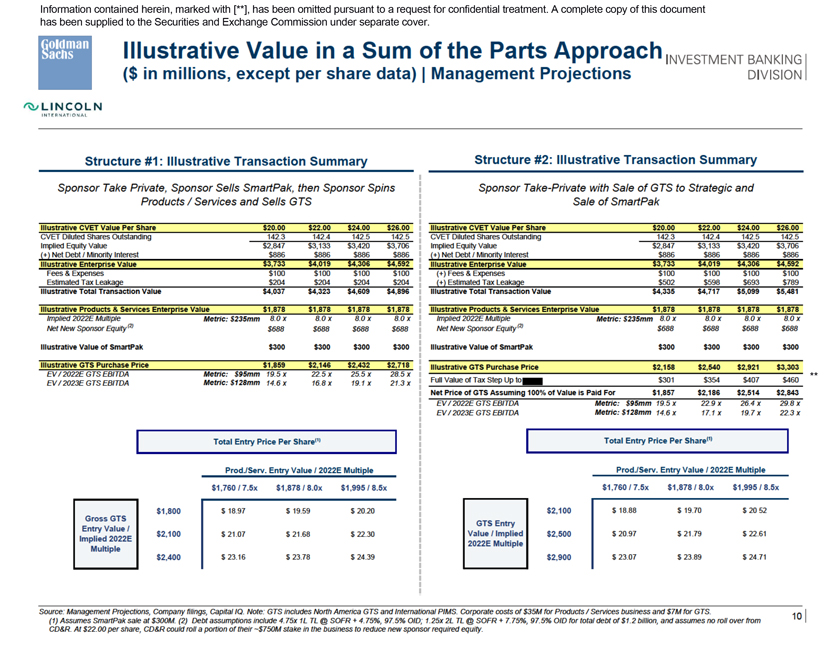
Management Projections DIVISION ‘WLINCOLN INTERNATIO NAL Structure #1: Illustrative Transaction Summary Structure #2: Illustrative Transaction Summary Sponsor Take Private, Sponsor Sells SmartPak, then Sponsor Spins Sponsor Take-Private with 
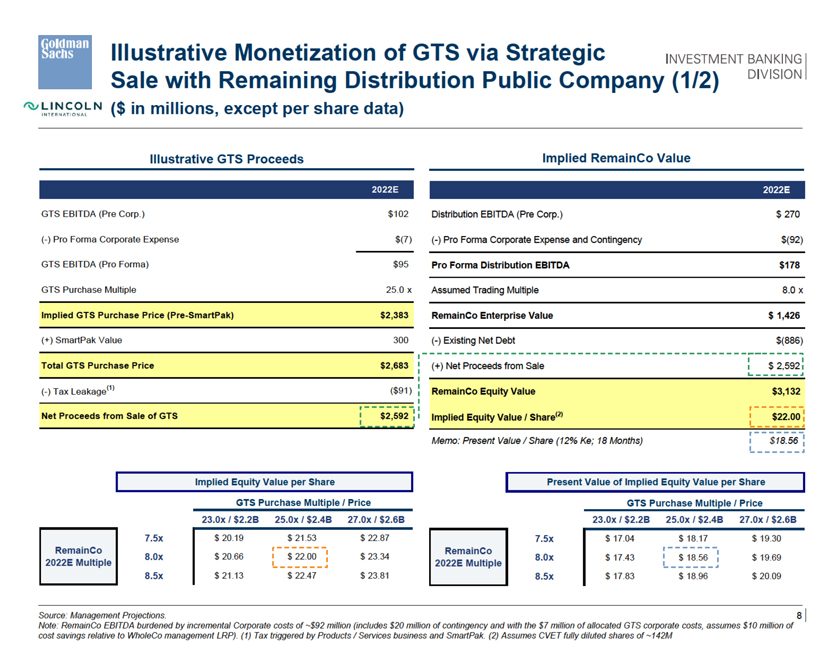
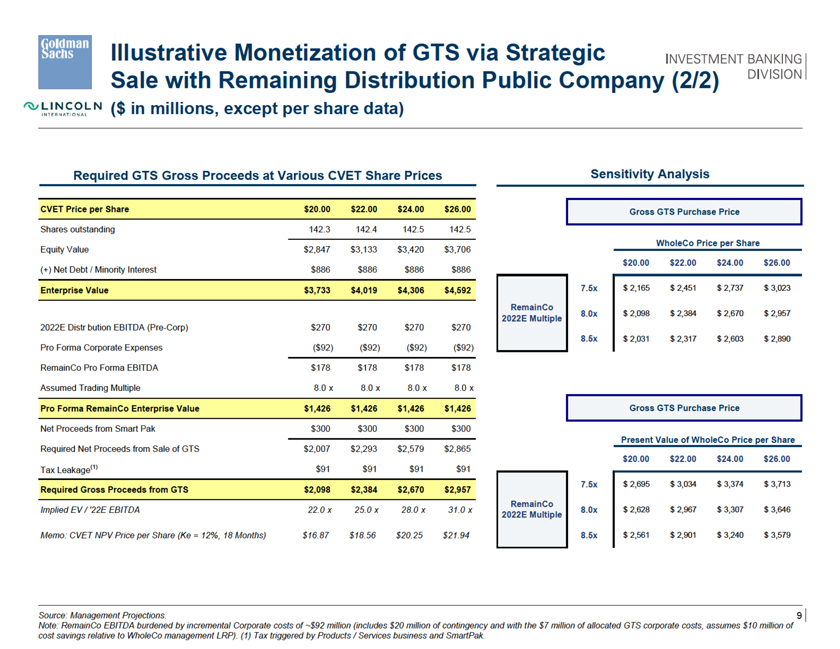
Sale of GTS to Strategic and Products I Services and Sells GTS Sale of SmartPak Illustrative CVET Value Per Share $20.00 $22.00 $24.00 $26.00 Illustrative CVET Value Per Share $20.00 $22.00 $24.00 $26.00 CVET Diluted Shares Outstanding 142.3 142.4 142.5 142.5 CVET Diluted Shares Outstanding 142.3 142.4 142.5 142.5 Implied Equity Value $2,847 $3,133 $3,420 $3,706 Implied Equity Value $2,847 $3,133 $3,420 $3,706 ! +2Net Debt I Minori~ Interest $886 $886 $886 $886 !+2Net Debt I Minori~ Interest $886 $886 $886 $886 Illustrative Entererise Value $3,733 $4,019 $4,306 $4,592 Illustrative Entererise Value $3,733 14,019 14,306 $4,592 Fees & Expenses $100 $100 $100 $100 (+)Fees & Expenses $100 $100 $100 $100 Estimated Tax Leakage $204 $204 $204 $204 !+!Estimated Tax LeaKage $502 $598 $693 $789 Illustrative Total Transaction Value $4,037 $4,323 $4,609 $4,896 Illustrative Total Transaction Value $4,335 $4,717 $5,099 $5,481 Illustrative Products & Services Ente!Erise Value $1,878 $1,878 $1,878 $1,878 Illustrative Products & Serv1ces Enterpnse Value $1,878 $1,878 $1,878 $1,878 Implied 2022E MUltiple Metric: $235mm 8.0 x 8.0x 8.0x 8.0 x Implied 2022E MUltiple Metric: $235mm 8.0x 8.0 x 8.0x 8.0x Net New Sponsor Equity(2) $688 $688 $688 $688 Net New Sponsor Equity(2) $688 $688 $688 $688 Illustrative Value of SmartPak $300 $300 $300 $300 Illustrative Value of SmartPak $300 $300 $300 $300 Illustrative GTS Purchase Price $1,859 $2,146 $2,432 $2,718 Illustrative GTS Purchase Price $2,158 $2,540 $2,921 $3,303 EV 12022E GTS EBIIDA Metric: $95mm 19.5 x 22.5x 25.5x 28.5 x $301 $354 $407 $460 Full Value ofT ax Step Up to- EV 12023E GTS EBIIDA Metric: $128mm 14.6 X 16.8 X 19.1 X 21.3 x Net Price of GTS Assuming 100% of Value is Paid For $1,857 $2,186 $2,514 $2,843 EV 12022E GTS EBIIDA Metric: $95mm 19.5x 22.9x 26.4 X 29.8x EV 12023E GTS EBIIDA Metric: $128mm 14.6 x 17.1 X 19.7 X 22.3x Total Entry Price Per Sharel’l Total Entry Price Per Share~l ProdJServ. Entry Value / 2022E Multiple Prod./Serv. Entry Value / 2022E Multiple $1,760 / 7.5x $1,878 I 8.0x $1,995 / 8.5x $1,760 / 7.5x $1,878 I 8.0x $1,995 I 8.5x $1,800 $ 18.97 $ 19.59 $ 20.20 $2,100 $ 18.88 $ 19.70 $20 52 Gross GTS GTS Entry Entry Value I Implied 2022E $2,100 $ 21.07 $ 21.68 $ 22.30 Value / Implied $2,500 $ 20.97 $ 21.79 $22.61 Multiple 2022E Multiple $2,400 $ 23.16 $ 23.78 $ 24.39 $2,900 $ 23.07 $ 23.89 $24.71 Source: Management Projections, Company filings, Capitai iQ. Note: GTS includes North America GTS and International PIMS. Corporate costs of $35M for Products I SeNices business and $7M for GTS. 10 1 (1) Assumes SmartPak sale at $300M. (2) Debt assumptions include 4.75x 1L TL@ SOFR + 4.75%, 97.5% OlD; 1.25x 2L TL@ SOFR + 7.75%, 97.5% OlD for total debt of $1.2 billion, and assumes no rollover from CD&R. At $22.00 per share, CD&R could roll a portion of their -$750M stake in the business to reduce new sponsor required equity. Information contained herein, marked with [**], has been omitted pursuant to a request for confidential treatment. A complete copy of this document has been supplied to the Securities and Exchange Commission under separate cover.
Considerations Regarding Engagement I INVESTMENT BANKING DIVISION ‘WLINCOLN INTERNATIO NAL Considerations • Robust engagement driven by CEO and executive leadership, with a focus on GTS • No clear partner for- at this time • Have indicated value of $1.85bn—$2.05bn, which implies a multiple range of—21x to -23x • Balance optionality with being 2022E EBITDA (including NA GTS, considerate of International PIMS, assuming -$1OM of PF corporate costs and excluding SmartPak) • Consider a few alternatives: • Open to discussing enhanced commercial arrangement to benefit distribution—Proceed with diligence “on spec” that a partner will avail themselves or leading party will want to engage—Ask them to find a partner (given our broad process, unlikely there • Their ability to pay for GTS can enable is one unidentified) WholeCo valuation—Ask them to stand-down with • TPG I CD&R have been hesitant to commit to appropriate encouragement of the though valuation may necessitate the longer -term optionality validation from- • Currently in a holding pattern without a natural partner Recommend being transparent but encouraging them to continue engagement to be on the front foot should things evolve Information contained herein, marked with [**], has been omitted pursuant to a request for confidential treatment. A complete copy of this document has been supplied to the Securities and Exchange Commission under separate cover.
INVESTMENT BANKING I DIVISION ‘WLINCOLN INTERNATIO NAL • Supplemental Materials
Partner Deal Alternatives INVESTMENT BANKING I DIVISION Summary Overview ‘WLINCOLN INTERNATIO NAL Structure #1- Tax at Products & Services Structure #2- Tax at GTS • Step 1: Sponsor takes private WholeCo • Step1: Sponsor takes private WholeCo • Step 2: Sale of SmartPak to third party • Step 2: Sale of GTS (excluding SmartPak and including international PIMS) to- • Step 3: Sponsor executes taxable spin of Products & Services (excluding international • Step 3: Sale of SmartPak to third party Description PIMS) to themselves • Step 4: purchases RemainCo (GTS excluding SmartPak and including international PIMS) • Step 1: No taxes triggered • Step 1: No taxes triggered • Step 2: Triggers tax above basis ($66mm) • Step 2: Triggers tax above basis ($226mm) • Step 3: Triggers tax above basis ($1,2000mm) — receives step-up equal to purchase with potential to tax gain on international price, monetizable over 15 years business at GIL Tl rate • Step 3: Triggers tax above basis ($66mm) Tax considerations—Sponsor receives step-up equal to purchase • General: $39mm of tax can be defrayed with price, monetizable over 15 years existing tax attributes • Step 4: No taxes triggered • General: $25mm of tax can be defrayed with existing tax attributes Key Value Drivers • Higher tax basis and international structuring • tax step-up increases their ability to pay Information contained herein, marked with [**], has been omitted pursuant to a request for confidential treatment. A complete copy of this document has been supplied to the Securities and Exchange Commission under separate cover.
Summary of Project Padlock Process INVESTMENT BANKING I DIVISION ‘WLINCOLN INTERNATIO NAL Illustrative Summary 24 17 Contacted Declined to Engage Received MP Declined to Bid Bids Submitted—Sponsors—Strategies Received feedback from all parties contacted in the process ArialMTInformation contained herein, marked with [**], has been omitted pursuant to a request for confidential treatment. A complete copy of this document has been supplied to the Securities and Exchange Commission under separate cover.
Shareholder Overlap {1/2) INVESTMENT BANKING I Covetrus and Henry Schein DIVISION ‘WLINCOLN D Shareholders of CVET and HSIC INTERNATIO NAL CVET Top Active Fund Holders HSIC Top Active Fund Holders % 0S in % 0S in % 0S in % 0Sin Fund Refinitiv Style AUM ($bn) CVET HSIC Fund Refinitiv Style AUM ($bn) HSIC CVET Freshford Capital Management, LLC Hedge Fund $ 0.7 2.8 % JPMorgan Mid Cap Value Fund Value $ 16.6 1.7% JPMorgan Small Cap Equity Fund Growth 7.0 2.4 American Century Mid Cap Value Fund Value 8.5 1.3 SCHF (GPE). LLC Hedge Fund 0.4 1.7 lnvesco Comstock Fund Value 10.1 1.0 Morgan Stanley Institutional Small Co. Inception Portfolio Growth 0.9 1.4 Eaton Vance SMID-Cap GARP 11.4 1.0 T. Rowe Price Mid-Cap Value GARP 14.0 1.3 D. E. Shaw Hedge Fund 69.1 0.9 0.7 Rock Springs Capital Management LP Hedge Fund 3.8 1.2 LO Funds—Generation Global Value 2.3 0.8 Wellington Global Healthcare Equity Fund Value 3.7 0.8 Ardevora Asset Management LLP Hedge Fund 9.6 0.7 D. E. Shaw Hedge Fund 69.1 0.7 0.9 BlackRock Health Sciences Opportunities Portfolio Sector Specific 10.6 0.5 Two Sigma Hedge Fund 76.8 0.7 0.1 Janus Henderson Mid Cap Value Fund Value 2.7 0.5 Kovitz Investment Group Partners, LLC Hedge Fund 4.9 0.7 Woodline Partners LP Hedge Fund 6.2 0.5 0.2 Millennium Mgm’t Hedge Fund 86.2 0.7 0.3 Swedbank Robur Transi ion Global Specialty 3.3 0.4 0.0 JPMorgan Funds—US Smaller Companies Fund Growth 1.4 0.5 AQR Capital Management. LLC Quantita ive 58.5 0.4 0.0 Allianz Pet and Animal Wellbeing Other 0.7 0.4 BGF World Healthscience Fund Sector Specific 13.6 0.4 ClearBridge All Cap Value Fund GARP 1.6 0.4 Vanguard Explorer Fund Growh 21.4 0.3 ClearBridge Small cap Fund GARP 1.1 0.3 FMI Common stock Fund GARP 0.9 0.3 Hartford Heal hcare Fund Sector Specific 1.5 0.3 Scout Mid Cap Fund Growh 4.6 0.3 American Century Small Cap Growth Fund GARP 1.9 0.3 Sound Shore Fund. Inc. Value 1.2 0.3 Nicholas Limited Edition. Inc. Growth 0.5 0.3 American Century NT Mid Cap Value other 1.9 0.3 Fidelity Series Large cap Stock Fund GARP 13.8 0.3 Millennium Mgm’t Hedge Fund 86.2 0.3 0.7 DFA u.s. Targeted Value Portfolio Quantitative 12.9 0.3 Renaissance TeCh. Quantita ive 77.6 0.3 0.0 Total $ 302.9 17.4 % 1.3 % Total $ 416.3 12.2 % 1.7 % Overlap in Top 20 CVET Active Fund Holders 2.1 % 1.3 % Overlap in Top 20 HSIC Active Fund Holders 2.8 % 1.7 % Overlap in All CVET Active Fund Holders 3.8 % 4.3 % Overlap in All HSIC Active Fund Holders 4.3 % 3.8% % Growth I GARP 45% % Growth I GARP 20% %Value 5% %Value 30% Source. Refinitiv as of 19-Apr-2022 15 1
Shareholder Overlap {2/2) INVESTMENT BANKING I Covetrus and Patterson DIVISION ‘WLINCOLN D Shareholders of CVET and HSIC INTERNATIO NAL CVET Top Active Fund Holders POCO Top Active Fund Holders %OS in % OS in %OS in% OS in Fund Refinitiv Style AUM ($bn) CVET POCO Fund Refinitiv Style AUM ($bn) POCO CVET Freshford Capital Management, LLC Hedge Fund $0.7 2.8% T Rowe Price Mid-Gap Value GARP $ 14.0 7.4% 1.3% JPMorgan Small Cap Equity Fund Growth 7.0 2.4 American Century Small Cap Value Fund Value 5.9 2.3 SCHF (GPE). LLC Hedge Fund 0.4 1.7 Allspring Special Small Cap Val Fd GARP 5.7 1.4 Morgan S1anley Institutional Small Co. Inception Portfolio Growth 0.9 1.4 Millennium Mgm1 Hedge Fund 86.2 1.1 0.7 T Rowe Price Mid-Cap Value GARP 14.0 1.3 7.4 Jonn Hancock Funds II Mid Value Fund Value 1.7 0.9 0.1 Rock Springs Capital Management LP Hedge Fund 3.8 1.2 DFA U.S. Small Cap Portfolio Quantitative 15.9 0.8 0.1 Wellington Global Healthcare Equity Fund Value 3.7 0.8 DFA U.S. Targeted Value Portfolio Quantitative 12.9 0.7 0.3 D. E. Shaw Hedge Fund 69.1 0.7 0.3 Balyasny Asset Management LP Hedge Fund 21.3 0.5 Two Sigma Hedge Fund 76.8 0.7 0.2 Brown Advisory Small-Cap Fundamental Value Fund GARP 1.3 0.5 Kovitz Investment Group Partners, LLC Hedge Fund 4.9 0.7 DFA U.S. Micro Cap Portfolio Quantitative 7.2 0.5 Millennium Mgm1 Hedge Fund 86.2 0.7 1.1 AMG River Road Small Cap Value Fund Growth 0.8 0.4 JPMorgan Funds—US Smaller Companies Fund Growth 1.4 0.5 Victory Integrity Small-Cap Value Fund GARP 1.9 0.4 Allianz Pet and Animal Wellbeing Other 0.7 0.4 0.3 DFA Dimensional US Targeted Value ETF Quantitative 6.9 0.4 0.1 ClearBridge All Cap Value Fund GARP 1.6 0.4 l odge Hill capital, LLC Hedge Fund 0.4 0.4 ClearBridge Small Cap Fund GARP 1.1 0.3 DFA U.S. Small Cap Value Quantitative 15.4 0.4 0.0 Hartford Healthcare Fund Sector Specific 1.5 0.3 S1orebrand Global Multifactor Value 2.8 0.4 American Century Small Cap Growth Fund GARP 1.9 0.3 Westwood Quality Smallcap Fund Growth 1.0 0.4 Nicholas limited Edition, Inc. Growth 0.5 0.3 CREF Stock Account Growth 125.6 0.4 0.2 Fidelity Series Large Cap S1ock Fund GARP 13.8 0.3 Royce Total Return Fund Value 1.4 0.4 DFA U.S. Targeted Value Portfolio QuantitatiVe 12.9 0.3 0.7 Heartland Value Fund GARP 0.7 0.4 Total $ 302.9 17.4 % 9.9 % Total $329.0 19.9 % 2.7 % Overlap in Top 20 CVET Active Fund Holders 4.0 % 9.9 % Overlap in Top 20 POCO Active Fund Holders 12.0 % 2.7 % Overlap in All CVET Active Fund Holders 6.6 % 17.5 % Overlap in All POCO Active Fund Holders 17.5 % 6.6 % % Growth I GARP 45% % Growth I GARP 40% %Value 5% %Value 20% Source. Refinitiv as of 19-Apr-2022 161
Operational Peer Benchmarking INVESTMENT BANKING I Management Projections DIVISION ‘WLINCOLN IN TERNATIO NAL 2021 E- 2023E Revenue Growth 2021E- 2023E EBITDA Growth1 18.5 % 25.3 % 23.1 % 19.8 % 18.3 % 9.7 % 8.7 % 7.9 % 7.5 % 5.7 % 8.2 % CVET CVET GTS CVET Total Distribution Profitable Companion Animal Health CVET CVET GTS CVET Total Distribution Profitable Companion Animal Health Distribu ion HCIT Animal HealthE-Commerce Distribu ion HCIT Animal HealthE-Commerce Solutions Solutions 2022 Gross Margin 2022 EBITDA Margin1 27.7 % 58.5 % 23.2 % 37.5 % 33.9 % 13.0 % 27.6 % 16.5 % 6.0 % 5.7 % CVET CVET GTS CVET Total Distribution Profitable Companion Animal Health CVET CVET GTS CVET Total Distribution Profitable Companion Animal Health Distribu ion HCIT Animal HealthE-Commerce Distribu ion HCIT Animal HealthE-Commerce Solutions Solutions Source. CVET based on management projections, peers based on IBES estimates as of 19-Apr-2022 Note: Distribution includes ABC, CAH, MCK, Owen & Minor, Henry Schein, Patterson. Animal Health E-Commerce Solutions includes PetMed Express and Chewy; Companions Animal Health includes Dechra Pharma, E/anco, Phibro, Vetoquinol, Virbac, Zoetis, ldexx, and Heska. Profitable HCIT includes Change Healthcare, Evolent, Gerner, Health Equity, R1, IQVIA, and Signify Health. 1Covetrus business units EBITDA burdened by corporate cost and contingency based on revenue contribution.
Valuation Peer Benchmarking INVESTMENT BANKING I Street Consensus DIVISION ‘WLINCOLN INTERNATIO NAL EV I 2022E EBITDA Henry Schein: 12.4 x 142.2 X Patterson: 11.1 x 16.9 X 11.6 X 12.1 X CVET Distribution Profitable HCIT Companion Animal Health Animal Health E-Commerce Solutions 07 -Dec-2021 11.3x 8.2x 13.8x 14.7x 28.9x Source: CVET and peers based on IBES estimates as of 19-Apr-2022 Note: Distribution includes ABC, CAH, MCK, Owen & Minor, Henry Schein, Patterson. Animal Health E-Commerce Solutions includes PetMed Express and Chewy; Companions Animal Health includes Dechra Pharma, Elanco, Phibro, Vetoquinol, Virbac, Zoetis, ldexx, and Heska. Profitable HCIT includes Change Healthcare, Evolent, Gerner, Health Equity, R1, IQVIA, and Signify Health.
Distribution Valuation Benchmarking I INVESTMENT BANKING Street Consensus ($ in millions) DIVISION ‘WLINCOLN INTERNATIO NAL EV I 2022E EBITDA 13.3 X Median: 12.1 x 12.1 X 12.1 X 11.1 X 9.5 X ~~0¥.¥ens .,.....~ ~HENRYSCHEIN”’ ~ ~- covetrus ‘WIWI&Minor M!;KESSON AmensourceBergerr PAITERSON CardinaiHealth” ‘ I)’· ,¥ ‘II :-. I EV $5,864 $ 14,456 $ 59,358 $42,977 $ 3,736 $ 24,506 $3,193 YoY Rev Growth(1J 4.9 % 3.9 % 2.0 % 5.3 % 3.1 % 4.4 % 5.8 % 22 Gross Margin 3.4 % 23.1% 7.8 % 7.3 % 19.1% YoY EBITDA Growth(1l 11.5 % 4.3 % 1.5 % 5.0 % 7.1 % 7.2 % 12.9 % 22 EBITDA Margin 4.6 % 8.8 % 1.9 % 1.5 % 5.1 % 1.4 % 5.6 % Source.· IBES estimates as of 19-Apr-2022, management projections. (1) Reflects CY 2022E—CY 2023E growth.
Covetrus Multiple Has Recently Contracted INVESTMENT BANKING I DIVISION Since All-Time High Levels Achieved in Early ‘21 ‘WLINCOLN INTERNATIO NAL NTM EV I EBITDA 40x 07-Dec-2021 ll Since Average 2Y 1Y 1M YTD 07-Dec-2021 High Low Covetrus 16.1 X 14.2 X 11.1 X 11.8 X (1.8)x 24.4 X 8.4 X ~85.6x Distribution’ 8.8 9.0 10.4 9.6 1.9 10.8 6.7 Current Animal Health Companion Animal Health3 20.7 22.0 19.0 19.4 (4.8) 24.5 11.6 E-Commerce Solutions Multiple2 01 30x Profitable HCJT 15.4 17.3 16.0 16.4 (2.6 19.5 9.2 S&P 500 15.5 15.5 14.5 14.6 (1.1) 16.8 10.2 Q. E ::J :E ~ 0 1- m w -g 20x .r::- .21 ~ Ql E ~ :E 1- 11.0 X z 10x 10.7 X Ox Feb-2019 Oct-2019 May-2020 Jan-2021 Aug-2021 Apr-2022—covetrus—Distribution’—companion Animal Health3—Profitable HCIP—S&PSOO Source: Bloomberg,CIQ and IBES, as of 19-Apr-2022. ‘Distribution includes ABC, CAH, MCK, Owen & Minor, Henry Schein, Patterson. ‘E-Commerce Solutions includes Chewy and PetMed Express. •companions Animal Health includes Dechra Pharma, Elanco, Phibro, Vetoquinol, Virbac, Zoetis, ldexx, and Heska. •Profitable HCIT includes lnvova/on, Evolent, Gerner, Change Healthcare, Health Equity, R1, IQVIA, and Si ni Health.