
Q3 2025 Earnings Call October 29, 2025
Safe Harbor Statement and Non-GAAP Financial Measures © 2025 Clarivate. All rights reserved. 2 Forward-Looking Statements This communication includes statements that express our opinions, expectations, beliefs, plans, objectives, assumptions, or projections regarding future events or future results and therefore are, or may be deemed to be, “forward-looking statements” within the meaning of the “safe harbor provisions” of the Private Securities Litigation Reform Act of 1995. These forward-looking statements can generally be identified by the use of forward-looking terminology, including the terms “believes,” “estimates,” “anticipates,” “expects,” “seeks,” “projects,” “intends,” “plans,” “may,” “will,” or “should” or, in each case, their negative or other variations or comparable terminology. These forward-looking statements include all matters that are not historical facts, and include statements regarding our intentions, beliefs, or current expectations concerning, among other things, anticipated cost savings, results of operations, financial condition, liquidity, prospects, growth, strategies, and the markets in which we operate. Such forward-looking statements are based on available current market material and management's expectations, beliefs, and forecasts concerning future events impacting us. There can be no assurance that future developments affecting us will be those that we have anticipated. These forward-looking statements involve a number of risks and uncertainties (some of which are beyond our control) or other assumptions that may cause actual results or performance to be materially different from those expressed or implied by these forward-looking statements. These risks and uncertainties include, but are not limited to, those factors described in Item 1A. Risk Factors of our annual report on Form 10-K, along with our other filings with the U.S. Securities and Exchange Commission ("SEC"). Should one or more of these risks or uncertainties materialize, or should any of the assumptions prove incorrect, actual results may vary in material respects from those projected in these forward-looking statements. We do not undertake any obligation to update or revise any forward-looking statements, whether as a result of new information, future events or otherwise, except as may be required under applicable securities laws. Please consult our public filings with the SEC, which are also available on our website at www.clarivate.com.
Safe Harbor Statement and Non-GAAP Financial Measures © 2025 Clarivate. All rights reserved. 3 Non-GAAP Financial Measures This presentation contains financial measures that have not been prepared in accordance with U.S. generally accepted accounting principles (“GAAP”), including Adjusted EBITDA, Adjusted EBITDA Margin, Adjusted Net Income, Adjusted Diluted EPS, Free Cash Flow, and Free Cash Flow Conversion. Non-GAAP financial measures are not recognized terms under GAAP, are not measures of financial condition or liquidity, and should not be considered as an alternative to profit or loss for the period determined in accordance with GAAP or operating cash flows determined in accordance with GAAP. As a result, you should not consider such measures in isolation from, or as a substitute for, financial measures or results of operations calculated or determined in accordance with GAAP. We use non-GAAP measures internally in our operational and financial decision-making, to assess the operating performance of our business, to assess performance for employee compensation purposes, and to decide how to allocate resources. We believe that such measures allow us to focus on what we deem to be more reliable indicators of ongoing operating performance and our ability to generate cash flow from operations, and we also believe that investors may find these non-GAAP financial measures useful for the same reasons. Non-GAAP measures are frequently used by securities analysts, investors, and other interested parties in their evaluation of companies comparable to us, many of which present non-GAAP measures when reporting their results. Further, these measures can be useful in evaluating our performance against our peer companies because we believe they provide users with valuable insight into key components of our GAAP financial disclosure. However, non-GAAP measures have limitations as analytical tools and because not all companies use identical calculations, our presentation of non-GAAP financial measures may not be comparable to other similarly titled measures of other companies. Our presentation of non-GAAP measures should not be construed as an inference that our future results will be unaffected by any of the adjusted items, or that any projections and estimates will be realized in their entirety or at all. In the Appendix to this presentation, we provide definitions of these non-GAAP measures and reconciliations to the most directly comparable GAAP measures. Industry and Market Data The market data and other statistical information used throughout this presentation are based on industry publications and surveys, public filings, and various government sources. Industry publications and surveys generally state that the information contained therein has been obtained from sources believed to be reliable, but there can be no assurance as to the accuracy or completeness of the included information. We have not independently verified such third-party information, nor have we ascertained the underlying economic assumptions relied upon in those sources, and we are unable to assure you of the accuracy or completeness of such information contained in this presentation. While we are not aware of any misstatements regarding our market, industry, or similar data presented herein, such data involve risks and uncertainties and are subject to change based on various factors.
Agenda 4© 2025 Clarivate. All rights reserved. Business Review Financial Review Q&A Matti Shem Tov Chief Executive Officer Jonathan Collins Executive Vice President and Chief Financial Officer
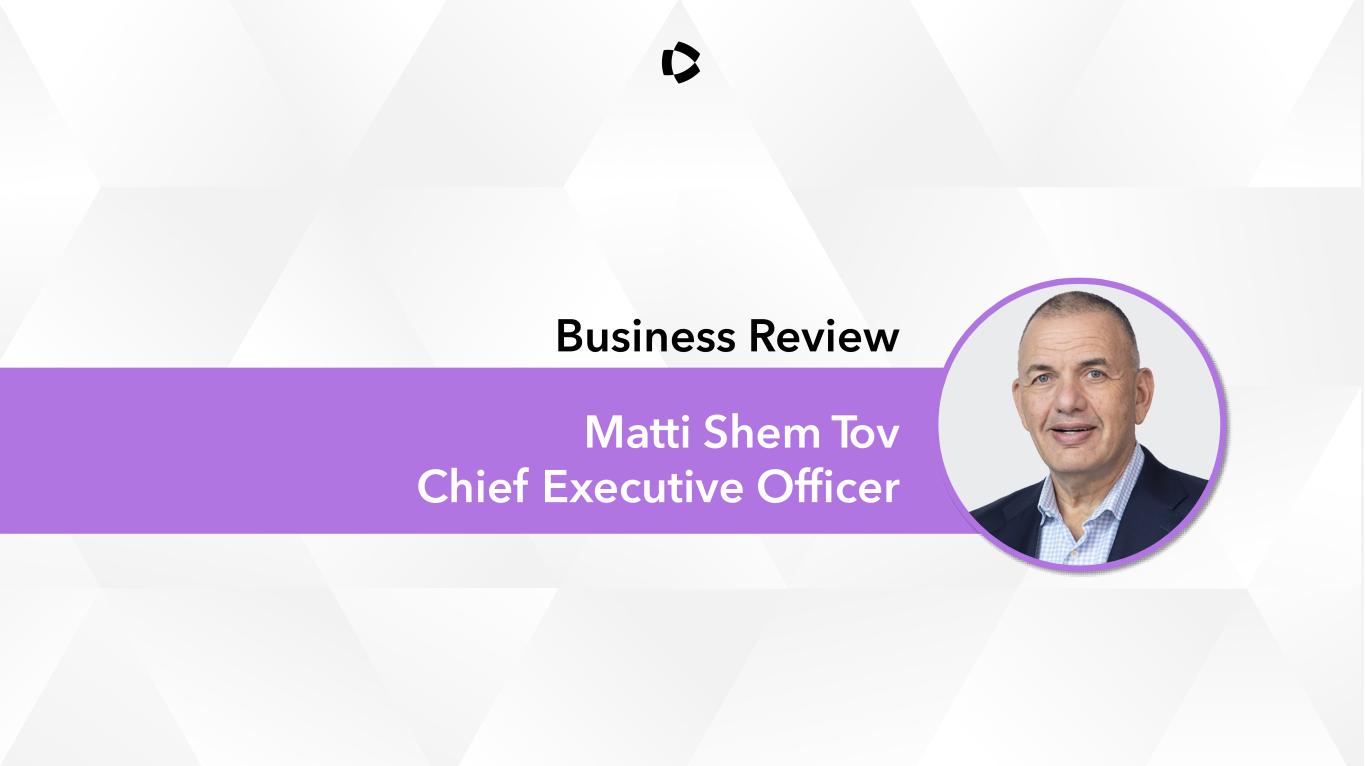
Matti Shem Tov Chief Executive Officer Business Review
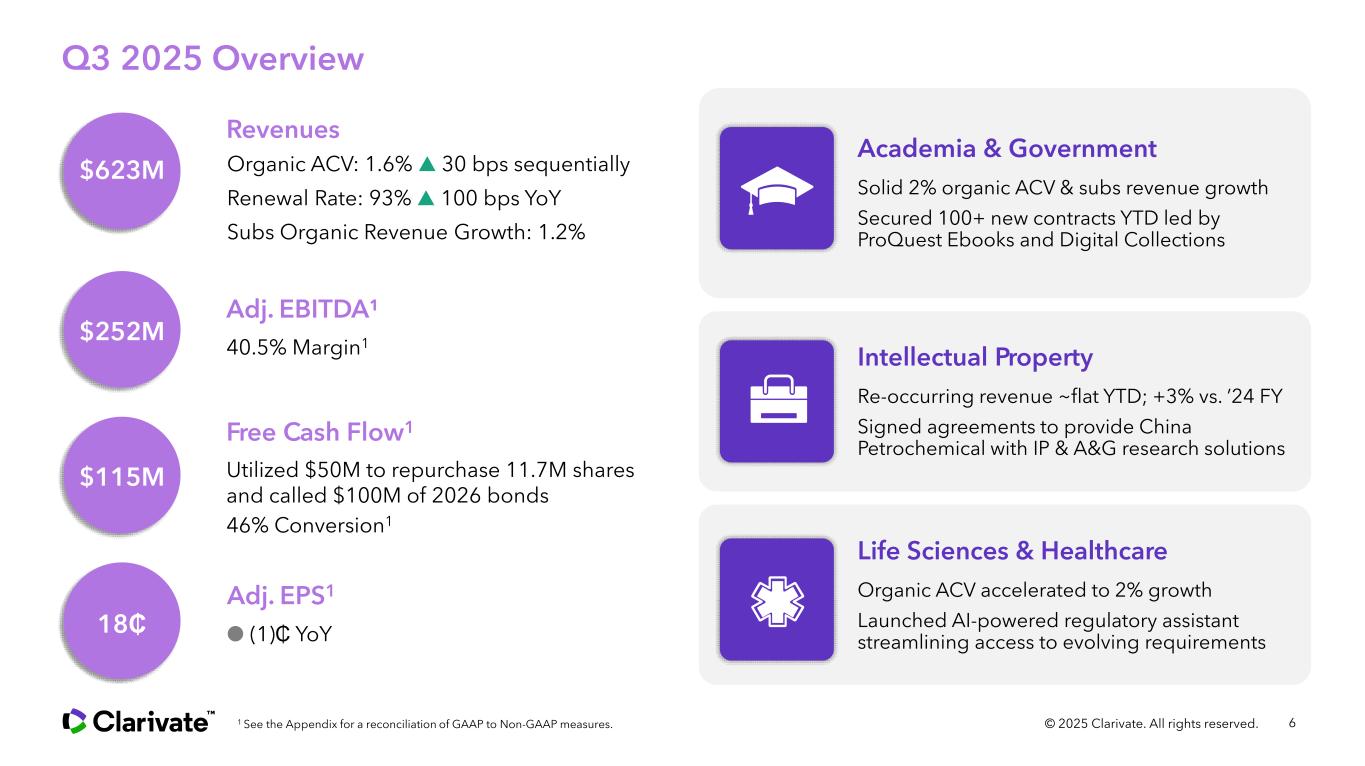
Q3 2025 Overview 6 Organic ACV: 1.6% ▲ 30 bps sequentially Renewal Rate: 93% ▲ 100 bps YoY Subs Organic Revenue Growth: 1.2% 40.5% Margin1 Utilized $50M to repurchase 11.7M shares and called $100M of 2026 bonds 46% Conversion1 ● (1)₵ YoY Revenues Adj. EBITDA¹ Free Cash Flow1 Adj. EPS1 $623M $252M $115M 18₵ 1 See the Appendix for a reconciliation of GAAP to Non-GAAP measures. Academia & Government Solid 2% organic ACV & subs revenue growth Secured 100+ new contracts YTD led by ProQuest Ebooks and Digital Collections Intellectual Property Re-occurring revenue ~flat YTD; +3% vs. ’24 FY Signed agreements to provide China Petrochemical with IP & A&G research solutions Life Sciences & Healthcare Organic ACV accelerated to 2% growth Launched AI-powered regulatory assistant streamlining access to evolving requirements © 2025 Clarivate. All rights reserved.
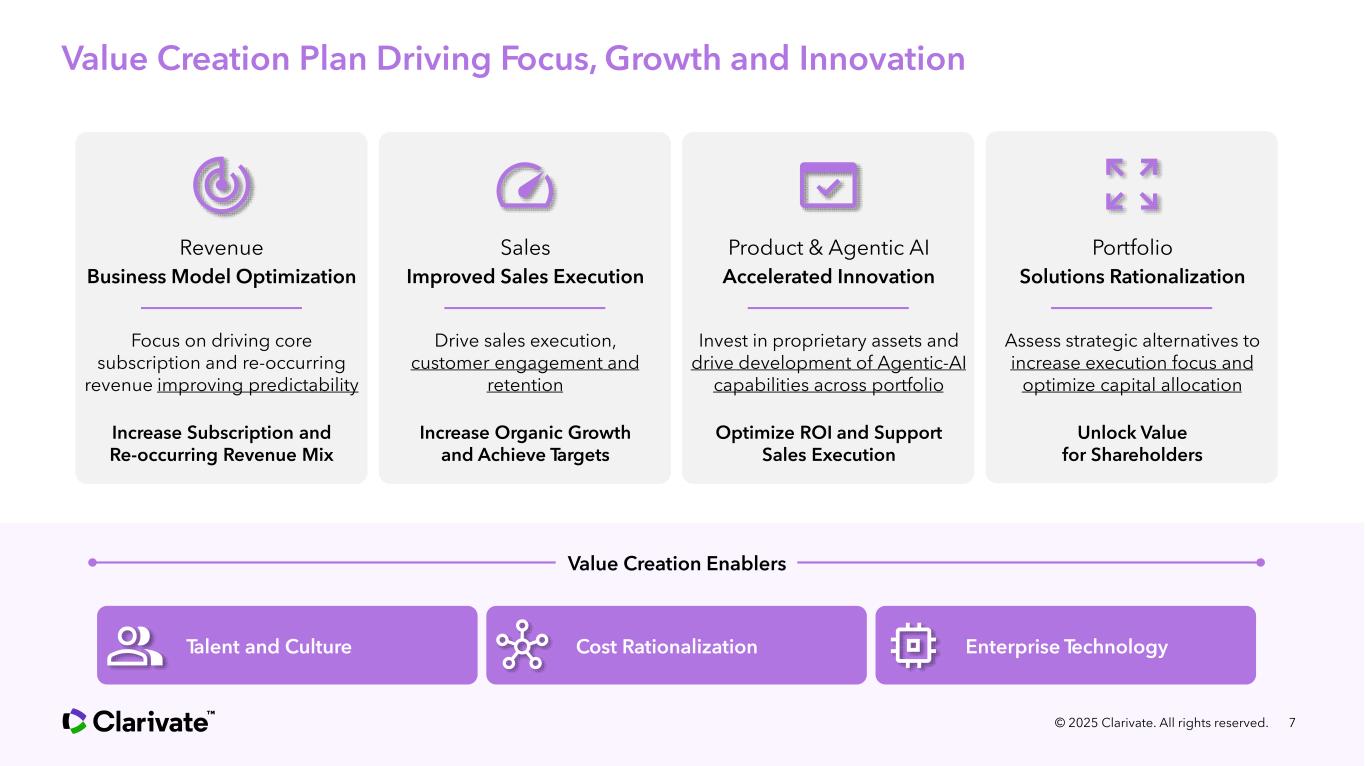
Value Creation Plan Driving Focus, Growth and Innovation Product & Agentic AI Accelerated Innovation Invest in proprietary assets and drive development of Agentic-AI capabilities across portfolio Optimize ROI and Support Sales Execution Sales Improved Sales Execution Drive sales execution, customer engagement and retention Increase Organic Growth and Achieve Targets Revenue Business Model Optimization Focus on driving core subscription and re-occurring revenue improving predictability Increase Subscription and Re-occurring Revenue Mix Portfolio Solutions Rationalization Assess strategic alternatives to increase execution focus and optimize capital allocation Unlock Value for Shareholders 7 Value Creation Enablers Talent and Culture Cost Rationalization Enterprise Technology © 2025 Clarivate. All rights reserved.
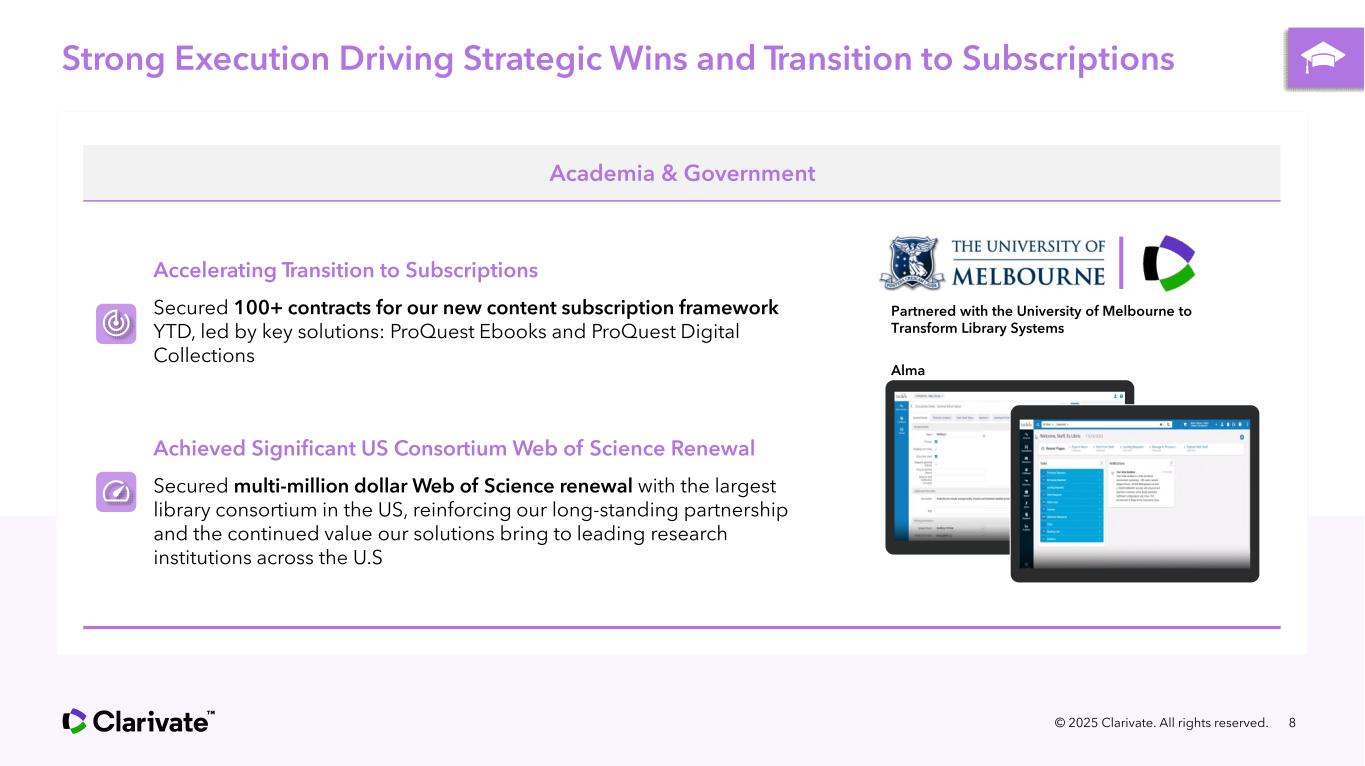
Strong Execution Driving Strategic Wins and Transition to Subscriptions © 2025 Clarivate. All rights reserved. 8 Academia & Government Accelerating Transition to Subscriptions Secured 100+ contracts for our new content subscription framework YTD, led by key solutions: ProQuest Ebooks and ProQuest Digital Collections Achieved Significant US Consortium Web of Science Renewal Secured multi-million dollar Web of Science renewal with the largest library consortium in the US, reinforcing our long-standing partnership and the continued value our solutions bring to leading research institutions across the U.S Partnered with the University of Melbourne to Transform Library Systems Alma
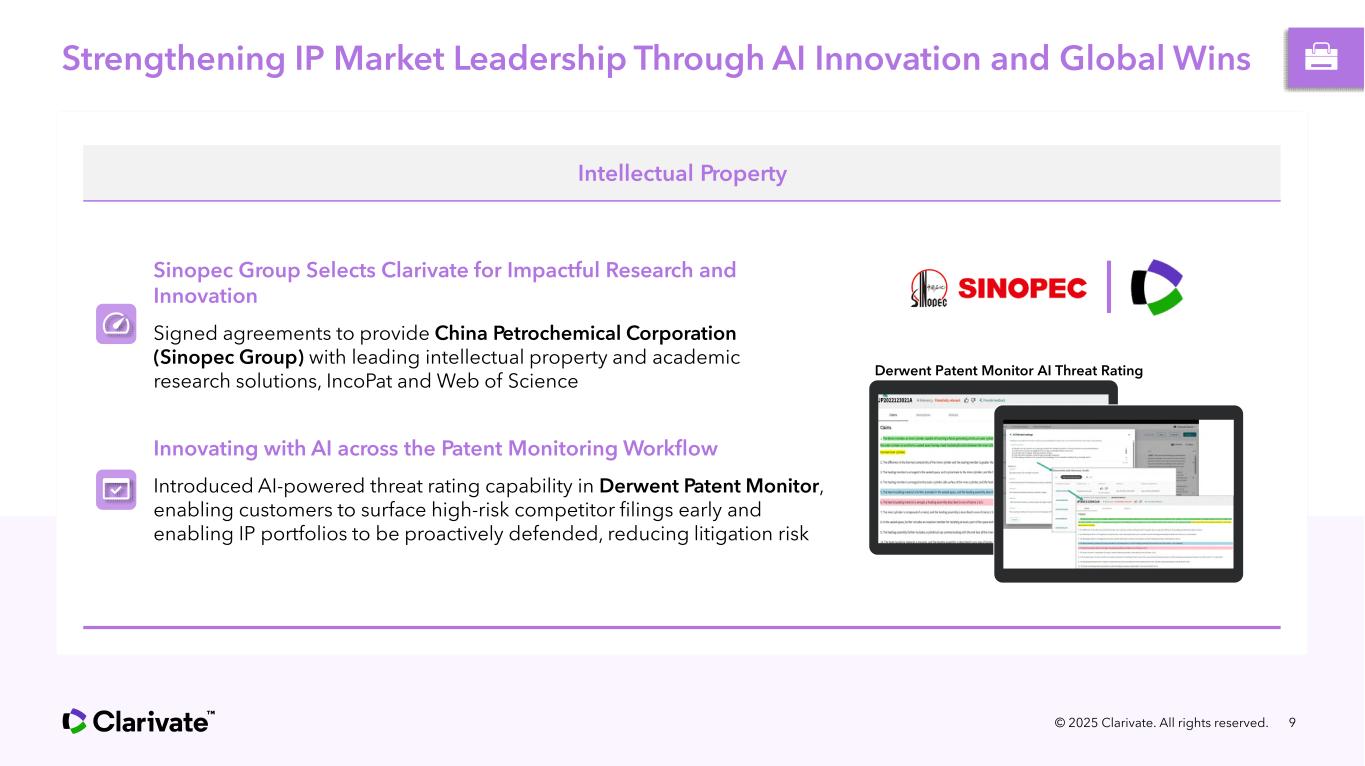
Strengthening IP Market Leadership Through AI Innovation and Global Wins © 2025 Clarivate. All rights reserved. 9 Intellectual Property Sinopec Group Selects Clarivate for Impactful Research and Innovation Signed agreements to provide China Petrochemical Corporation (Sinopec Group) with leading intellectual property and academic research solutions, IncoPat and Web of Science Innovating with AI across the Patent Monitoring Workflow Introduced AI-powered threat rating capability in Derwent Patent Monitor, enabling customers to surface high-risk competitor filings early and enabling IP portfolios to be proactively defended, reducing litigation risk Derwent Patent Monitor AI Threat Rating
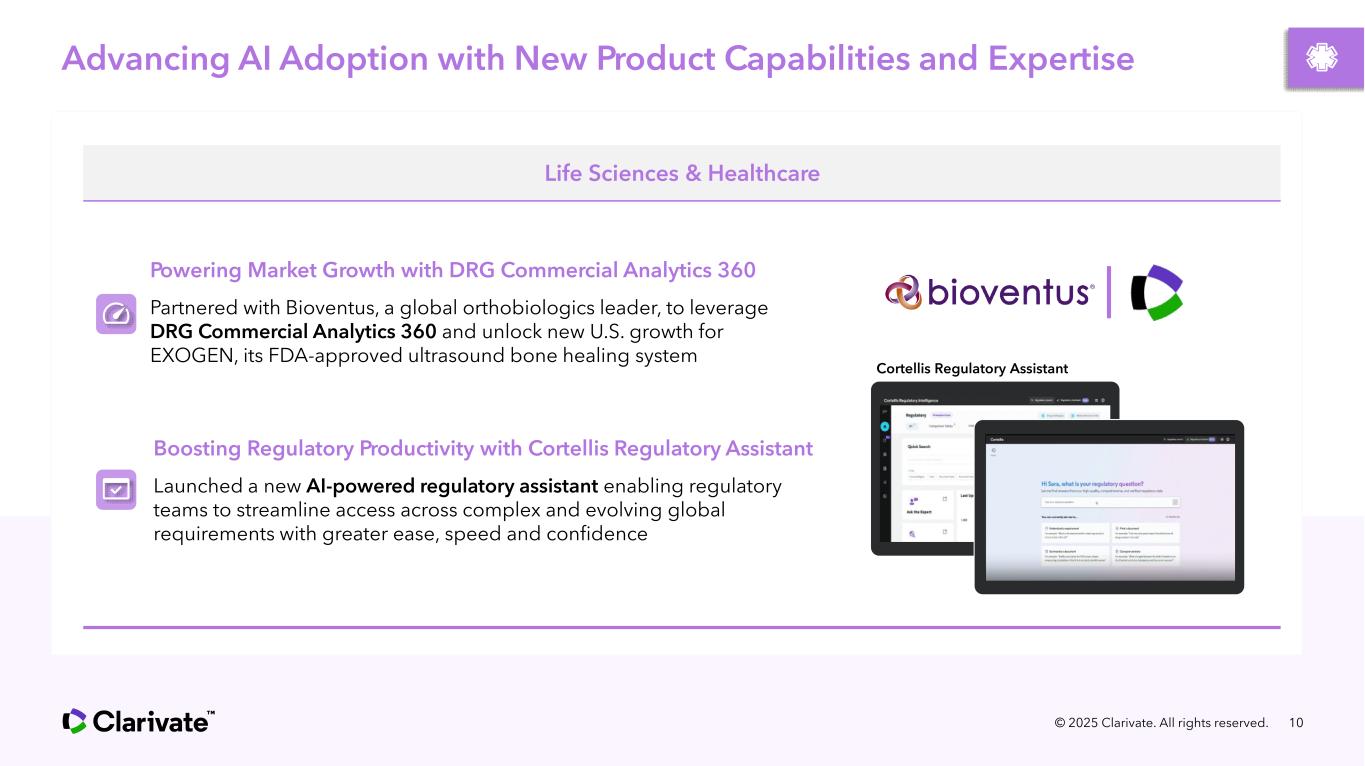
Advancing AI Adoption with New Product Capabilities and Expertise © 2025 Clarivate. All rights reserved. 10 Life Sciences & Healthcare Boosting Regulatory Productivity with Cortellis Regulatory Assistant Launched a new AI-powered regulatory assistant enabling regulatory teams to streamline access across complex and evolving global requirements with greater ease, speed and confidence Powering Market Growth with DRG Commercial Analytics 360 Partnered with Bioventus, a global orthobiologics leader, to leverage DRG Commercial Analytics 360 and unlock new U.S. growth for EXOGEN, its FDA-approved ultrasound bone healing system Cortellis Regulatory Assistant
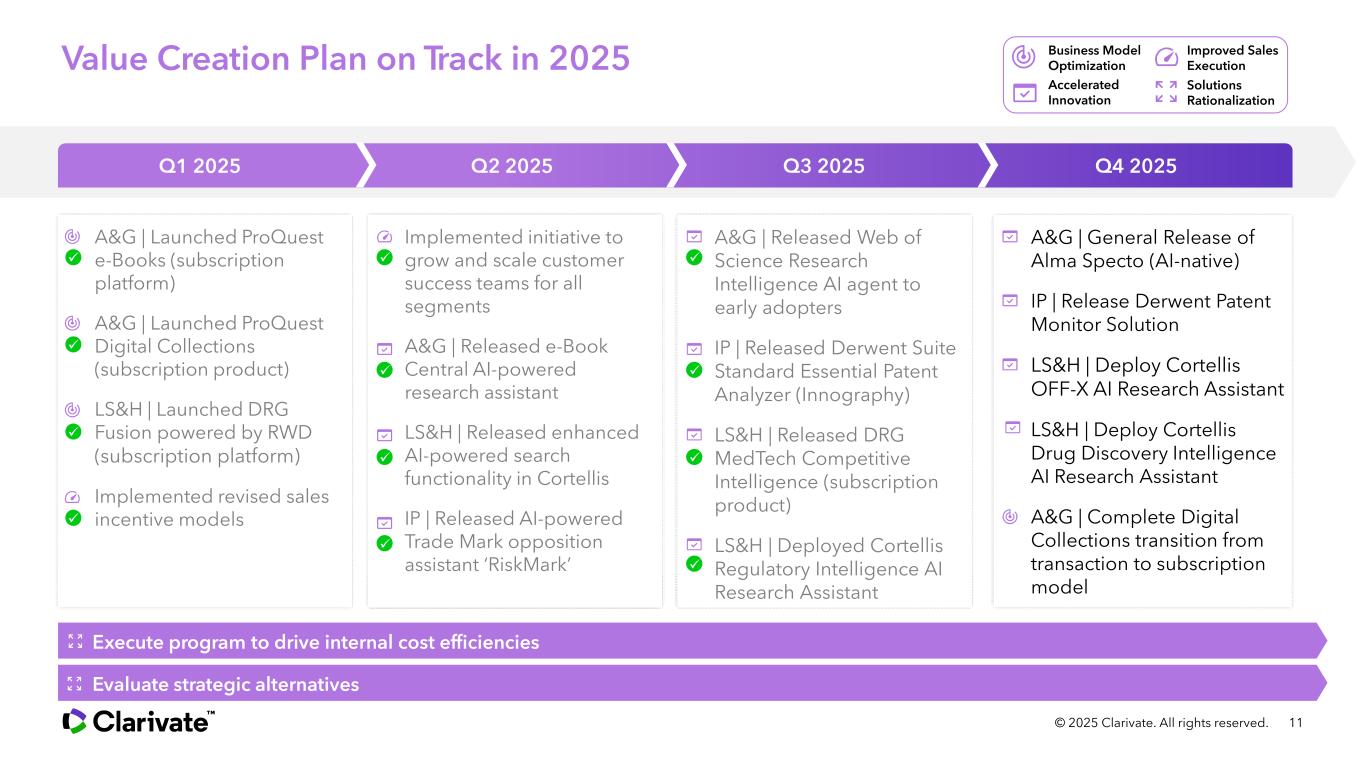
• A&G | General Release of Alma Specto (AI-native) • IP | Release Derwent Patent Monitor Solution • LS&H | Deploy Cortellis OFF-X AI Research Assistant • LS&H | Deploy Cortellis Drug Discovery Intelligence AI Research Assistant • A&G | Complete Digital Collections transition from transaction to subscription model Value Creation Plan on Track in 2025 © 2025 Clarivate. All rights reserved. 11 Q1 2025 Q3 2025Q2 2025 Q4 2025 Execute program to drive internal cost efficiencies Evaluate strategic alternatives Improved Sales Execution Business Model Optimization Accelerated Innovation Solutions Rationalization • A&G | Released Web of Science Research Intelligence AI agent to early adopters • IP | Released Derwent Suite Standard Essential Patent Analyzer (Innography) • LS&H | Released DRG MedTech Competitive Intelligence (subscription product) • LS&H | Deployed Cortellis Regulatory Intelligence AI Research Assistant • A&G | Launched ProQuest e-Books (subscription platform) • A&G | Launched ProQuest Digital Collections (subscription product) • LS&H | Launched DRG Fusion powered by RWD (subscription platform) • Implemented revised sales incentive models • Implemented initiative to grow and scale customer success teams for all segments • A&G | Released e-Book Central AI-powered research assistant • LS&H | Released enhanced AI-powered search functionality in Cortellis • IP | Released AI-powered Trade Mark opposition assistant ‘RiskMark’
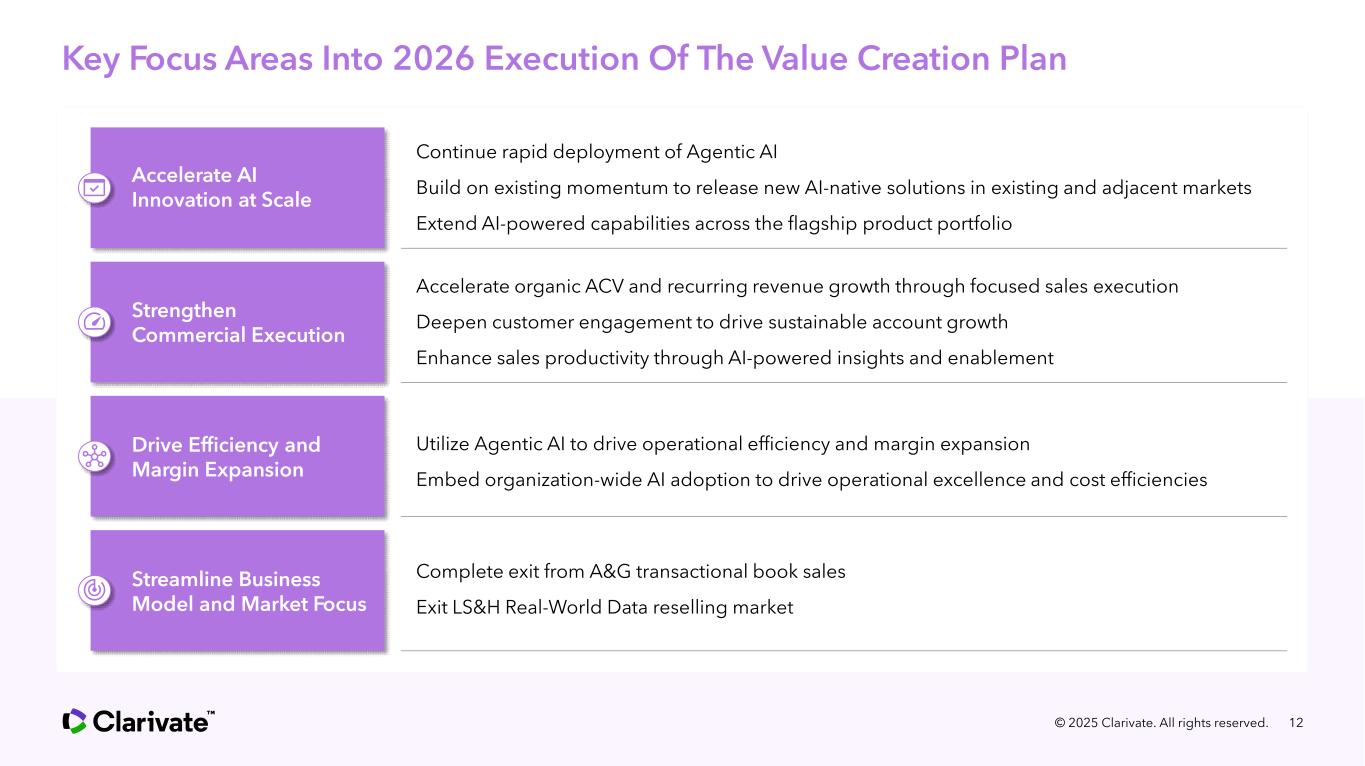
Key Focus Areas Into 2026 Execution Of The Value Creation Plan 12 Continue rapid deployment of Agentic AI Build on existing momentum to release new AI-native solutions in existing and adjacent markets Extend AI-powered capabilities across the flagship product portfolio Accelerate AI Innovation at Scale © 2025 Clarivate. All rights reserved. Accelerate organic ACV and recurring revenue growth through focused sales execution Deepen customer engagement to drive sustainable account growth Enhance sales productivity through AI-powered insights and enablement Strengthen Commercial Execution Utilize Agentic AI to drive operational efficiency and margin expansion Embed organization-wide AI adoption to drive operational excellence and cost efficiencies Drive Efficiency and Margin Expansion Complete exit from A&G transactional book sales Exit LS&H Real-World Data reselling market Streamline Business Model and Market Focus
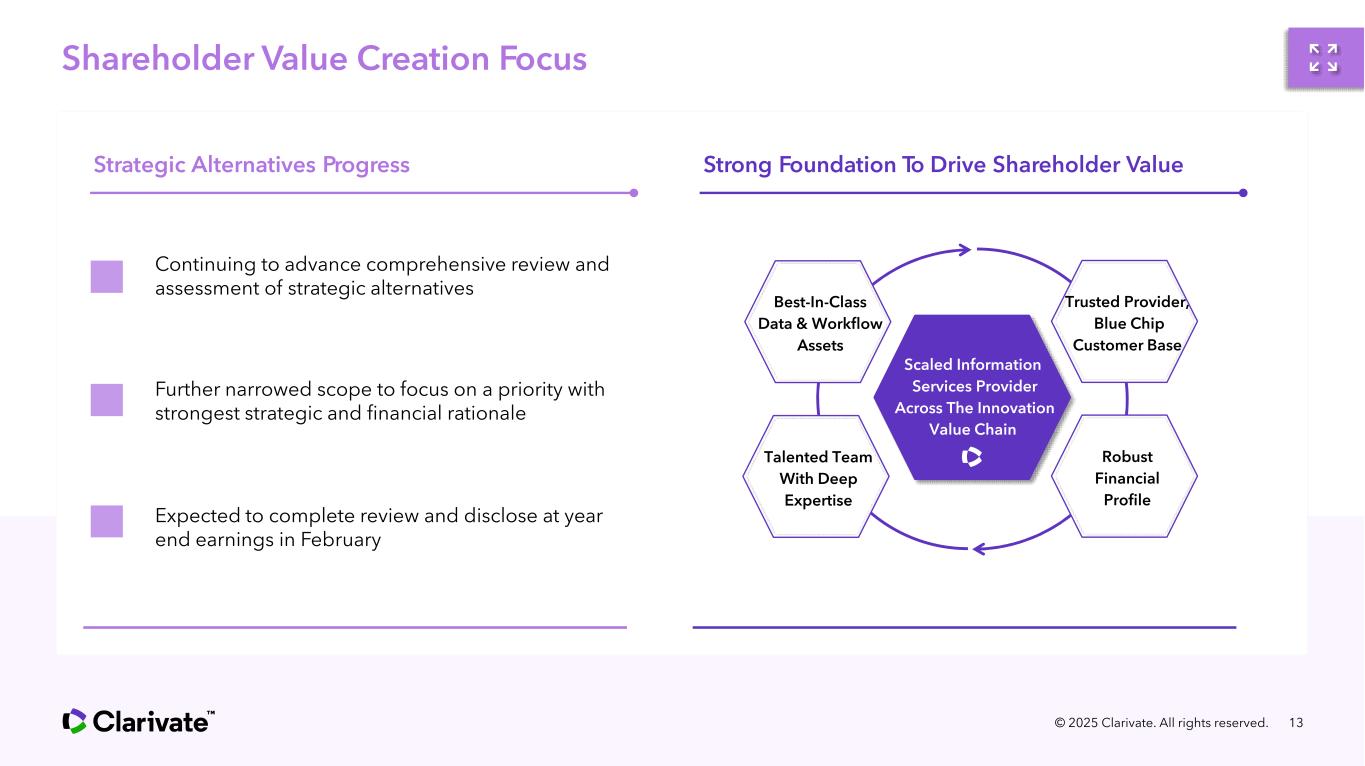
Shareholder Value Creation Focus © 2025 Clarivate. All rights reserved. 13 Continuing to advance comprehensive review and assessment of strategic alternatives Best-In-Class Data & Workflow Assets Products Colleagues Talented Team With Deep Expertise Trusted Provider, Blue Chip Customer Base Robust Financial Profile Scaled Information Services Provider Across The Innovation Value Chain Strategic Alternatives Progress Strong Foundation To Drive Shareholder Value Further narrowed scope to focus on a priority with strongest strategic and financial rationale Expected to complete review and disclose at year end earnings in February
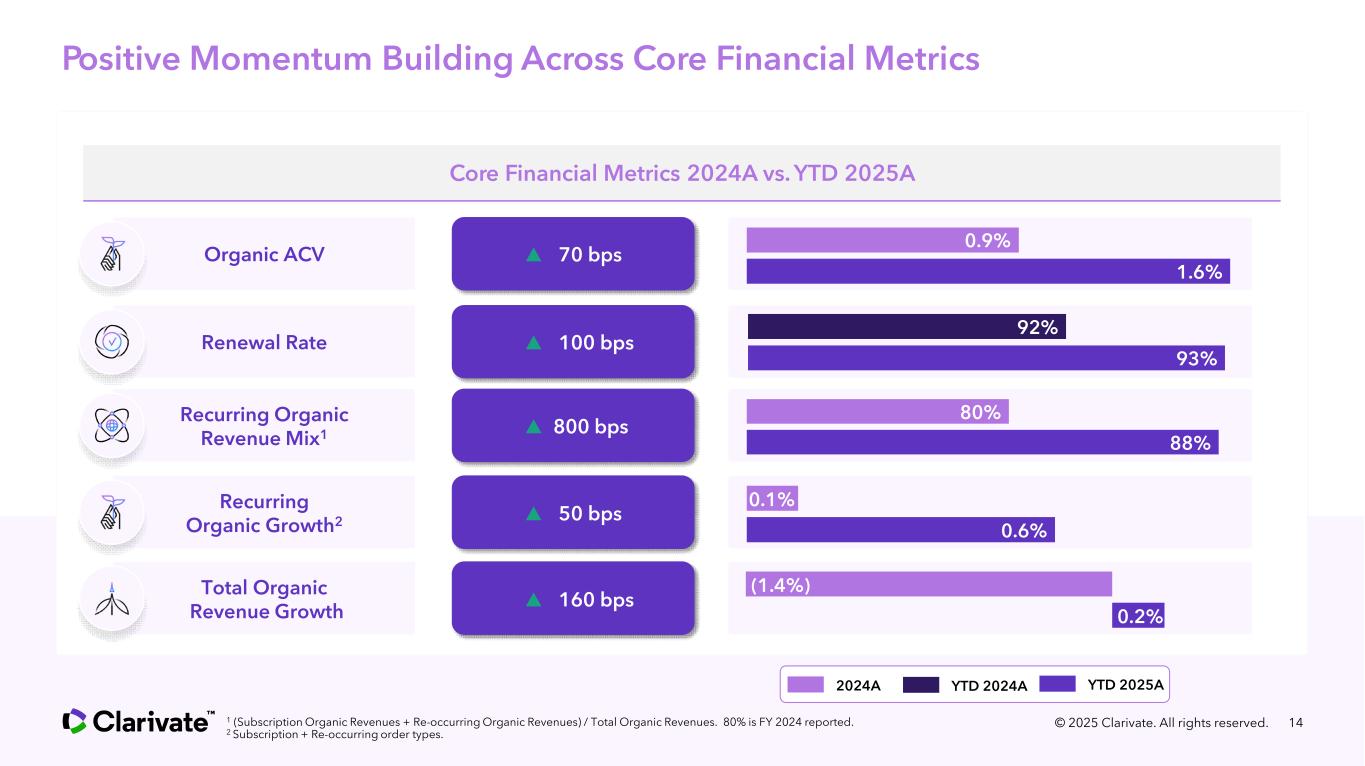
Positive Momentum Building Across Core Financial Metrics 141 (Subscription Organic Revenues + Re-occurring Organic Revenues) / Total Organic Revenues. 80% is FY 2024 reported. 2 Subscription + Re-occurring order types. Core Financial Metrics 2024A vs. YTD 2025A 2024A YTD 2025A Organic ACV 1.6% 0.9% Renewal Rate 93% 92% YTD 2024A ▲ 70 bps ▲ 100 bps Recurring Organic Revenue Mix1 88% 80% ▲ 800 bps Recurring Organic Growth2 0.6% 0.1% ▲ 50 bps Total Organic Revenue Growth 0.2% (1.4%) ▲ 160 bps © 2025 Clarivate. All rights reserved.
Jonathan Collins Chief Financial Officer Financial Review
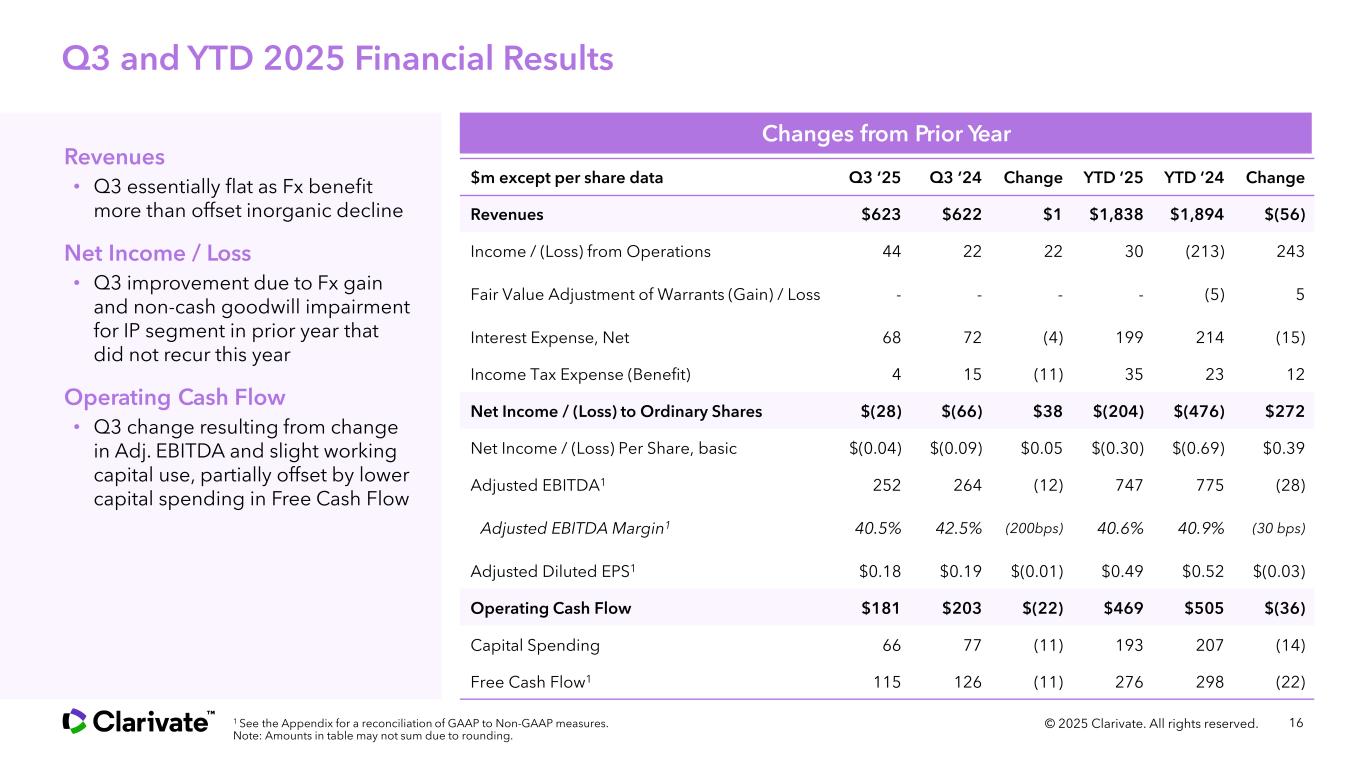
Q3 and YTD 2025 Financial Results 16 Changes from Prior Year 1 See the Appendix for a reconciliation of GAAP to Non-GAAP measures. Note: Amounts in table may not sum due to rounding. © 2025 Clarivate. All rights reserved. $m except per share data Q3 ‘25 Q3 ‘24 Change YTD ‘25 YTD ‘24 Change Revenues $623 $622 $1 $1,838 $1,894 $(56) Income / (Loss) from Operations 44 22 22 30 (213) 243 Fair Value Adjustment of Warrants (Gain) / Loss - - - - (5) 5 Interest Expense, Net 68 72 (4) 199 214 (15) Income Tax Expense (Benefit) 4 15 (11) 35 23 12 Net Income / (Loss) to Ordinary Shares $(28) $(66) $38 $(204) $(476) $272 Net Income / (Loss) Per Share, basic $(0.04) $(0.09) $0.05 $(0.30) $(0.69) $0.39 Adjusted EBITDA1 252 264 (12) 747 775 (28) Adjusted EBITDA Margin1 40.5% 42.5% (200bps) 40.6% 40.9% (30 bps) Adjusted Diluted EPS1 $0.18 $0.19 $(0.01) $0.49 $0.52 $(0.03) Operating Cash Flow $181 $203 $(22) $469 $505 $(36) Capital Spending 66 77 (11) 193 207 (14) Free Cash Flow1 115 126 (11) 276 298 (22) Revenues • Q3 essentially flat as Fx benefit more than offset inorganic decline Net Income / Loss • Q3 improvement due to Fx gain and non-cash goodwill impairment for IP segment in prior year that did not recur this year Operating Cash Flow • Q3 change resulting from change in Adj. EBITDA and slight working capital use, partially offset by lower capital spending in Free Cash Flow
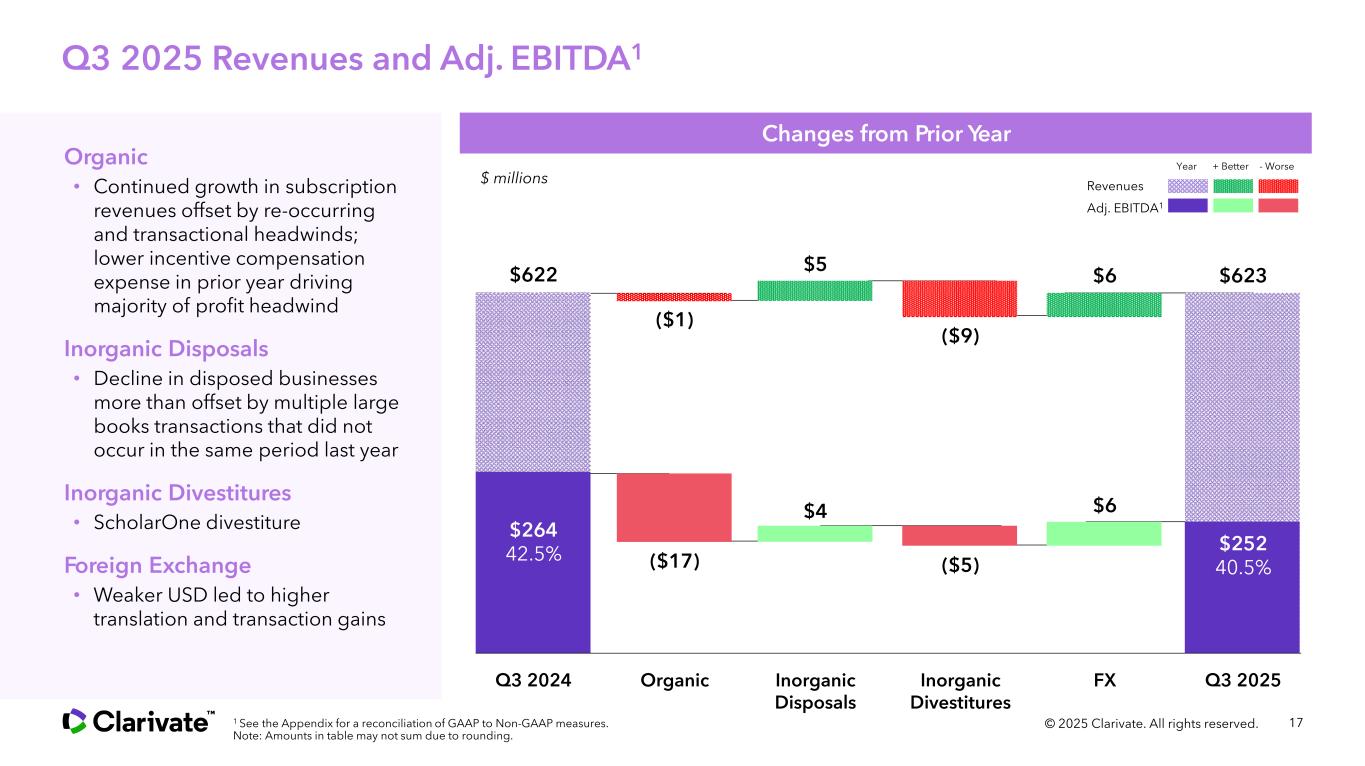
Changes from Prior Year Q3 2025 Revenues and Adj. EBITDA1 17© 2025 Clarivate. All rights reserved.1 See the Appendix for a reconciliation of GAAP to Non-GAAP measures. Note: Amounts in table may not sum due to rounding. Q3 2024 Q3 2025 $622 $623 $264 42.5% $252 40.5% Revenues Adj. EBITDA1 Year + Better - Worse $ millions FX $6 $6 Organic ($1) ($17) Inorganic Disposals $5 $4 Inorganic Divestitures ($9) ($5) Organic • Continued growth in subscription revenues offset by re-occurring and transactional headwinds; lower incentive compensation expense in prior year driving majority of profit headwind Inorganic Disposals • Decline in disposed businesses more than offset by multiple large books transactions that did not occur in the same period last year Inorganic Divestitures • ScholarOne divestiture Foreign Exchange • Weaker USD led to higher translation and transaction gains
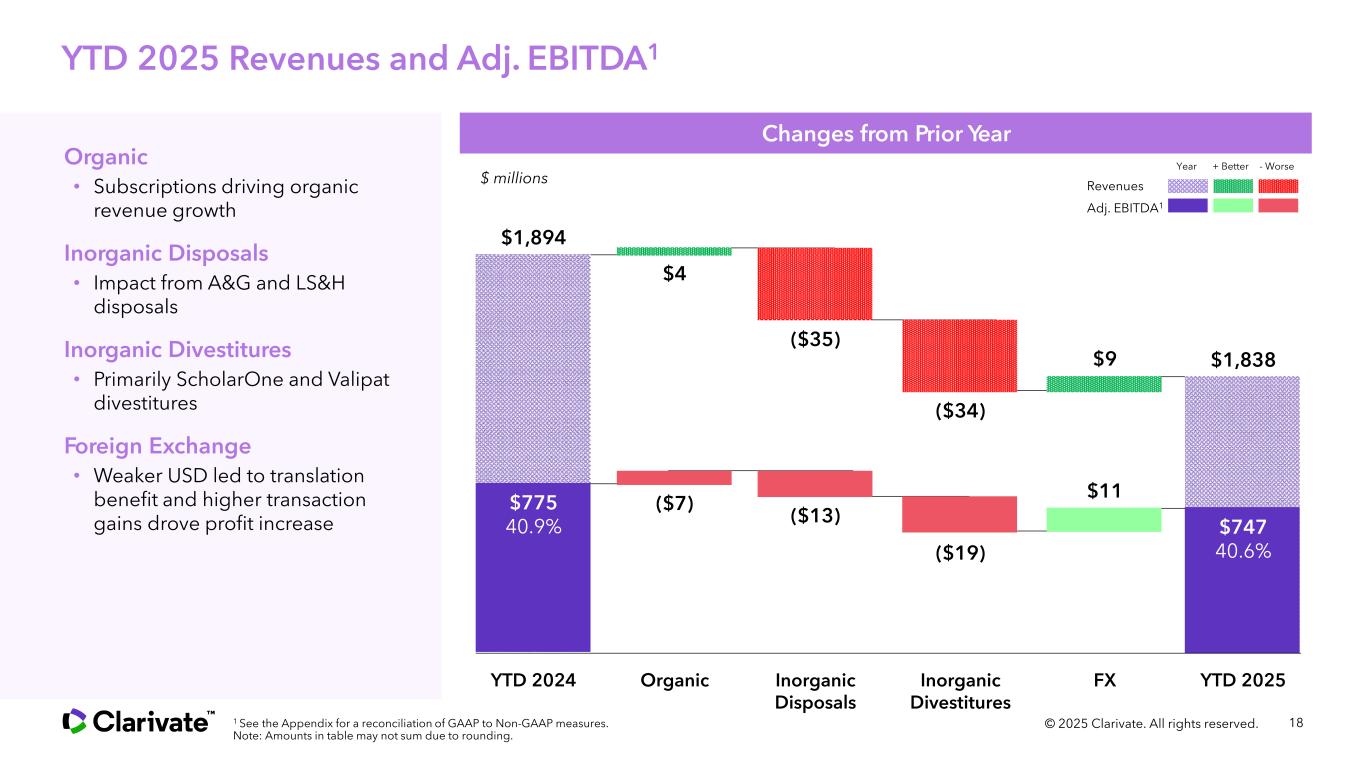
Changes from Prior Year YTD 2025 Revenues and Adj. EBITDA1 18© 2025 Clarivate. All rights reserved.1 See the Appendix for a reconciliation of GAAP to Non-GAAP measures. Note: Amounts in table may not sum due to rounding. YTD 2024 YTD 2025 $1,894 $1,838 $775 40.9% $747 40.6% Revenues Adj. EBITDA1 Year + Better - Worse $ millions FX $9 $11 Organic $4 ($7) Inorganic Disposals ($35) ($13) Inorganic Divestitures ($34) ($19) Organic • Subscriptions driving organic revenue growth Inorganic Disposals • Impact from A&G and LS&H disposals Inorganic Divestitures • Primarily ScholarOne and Valipat divestitures Foreign Exchange • Weaker USD led to translation benefit and higher transaction gains drove profit increase
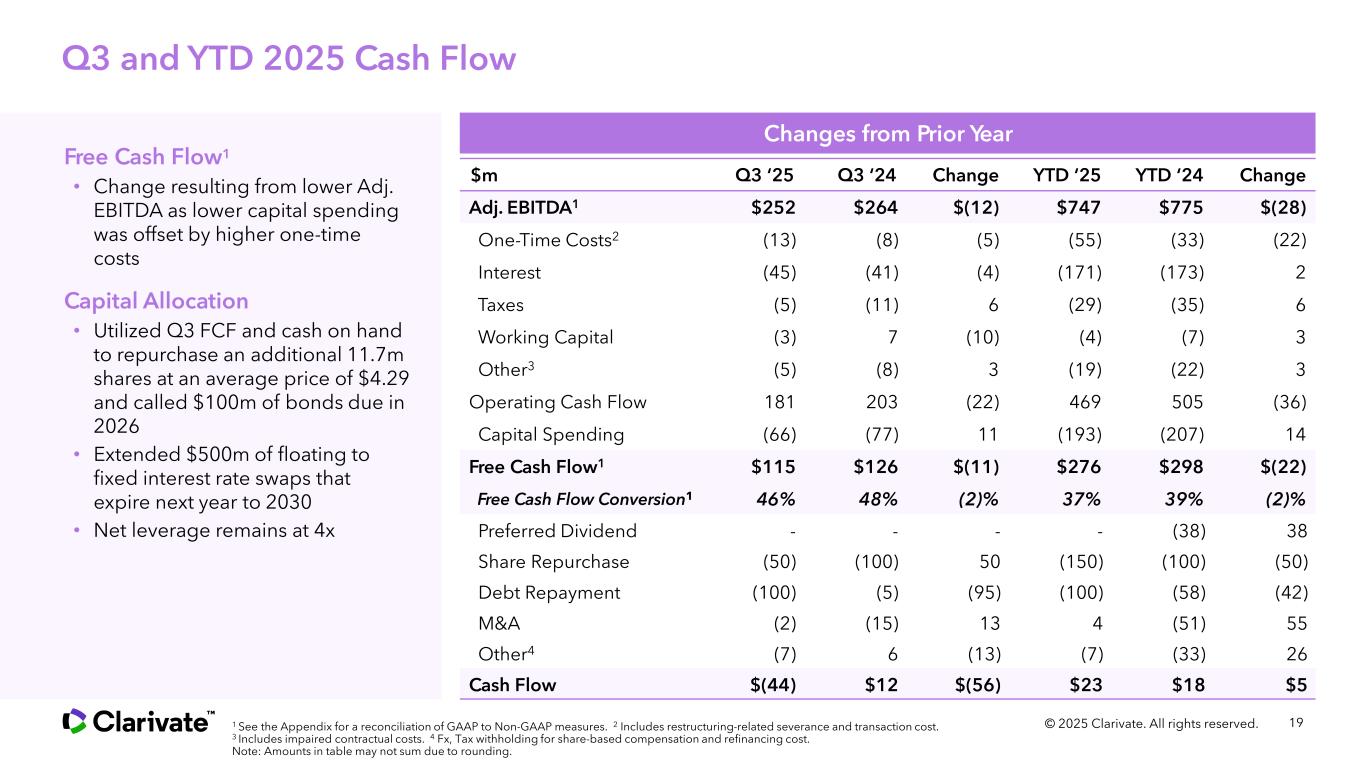
Q3 and YTD 2025 Cash Flow 19© 2025 Clarivate. All rights reserved. Changes from Prior Year $m Q3 ‘25 Q3 ‘24 Change YTD ‘25 YTD ‘24 Change Adj. EBITDA1 $252 $264 $(12) $747 $775 $(28) One-Time Costs2 (13) (8) (5) (55) (33) (22) Interest (45) (41) (4) (171) (173) 2 Taxes (5) (11) 6 (29) (35) 6 Working Capital (3) 7 (10) (4) (7) 3 Other3 (5) (8) 3 (19) (22) 3 Operating Cash Flow 181 203 (22) 469 505 (36) Capital Spending (66) (77) 11 (193) (207) 14 Free Cash Flow1 $115 $126 $(11) $276 $298 $(22) Free Cash Flow Conversion1 46% 48% (2)% 37% 39% (2)% Preferred Dividend - - - - (38) 38 Share Repurchase (50) (100) 50 (150) (100) (50) Debt Repayment (100) (5) (95) (100) (58) (42) M&A (2) (15) 13 4 (51) 55 Other4 (7) 6 (13) (7) (33) 26 Cash Flow $(44) $12 $(56) $23 $18 $5 Free Cash Flow1 • Change resulting from lower Adj. EBITDA as lower capital spending was offset by higher one-time costs Capital Allocation • Utilized Q3 FCF and cash on hand to repurchase an additional 11.7m shares at an average price of $4.29 and called $100m of bonds due in 2026 • Extended $500m of floating to fixed interest rate swaps that expire next year to 2030 • Net leverage remains at 4x 1 See the Appendix for a reconciliation of GAAP to Non-GAAP measures. 2 Includes restructuring-related severance and transaction cost. 3 Includes impaired contractual costs. 4 Fx, Tax withholding for share-based compensation and refinancing cost. Note: Amounts in table may not sum due to rounding.
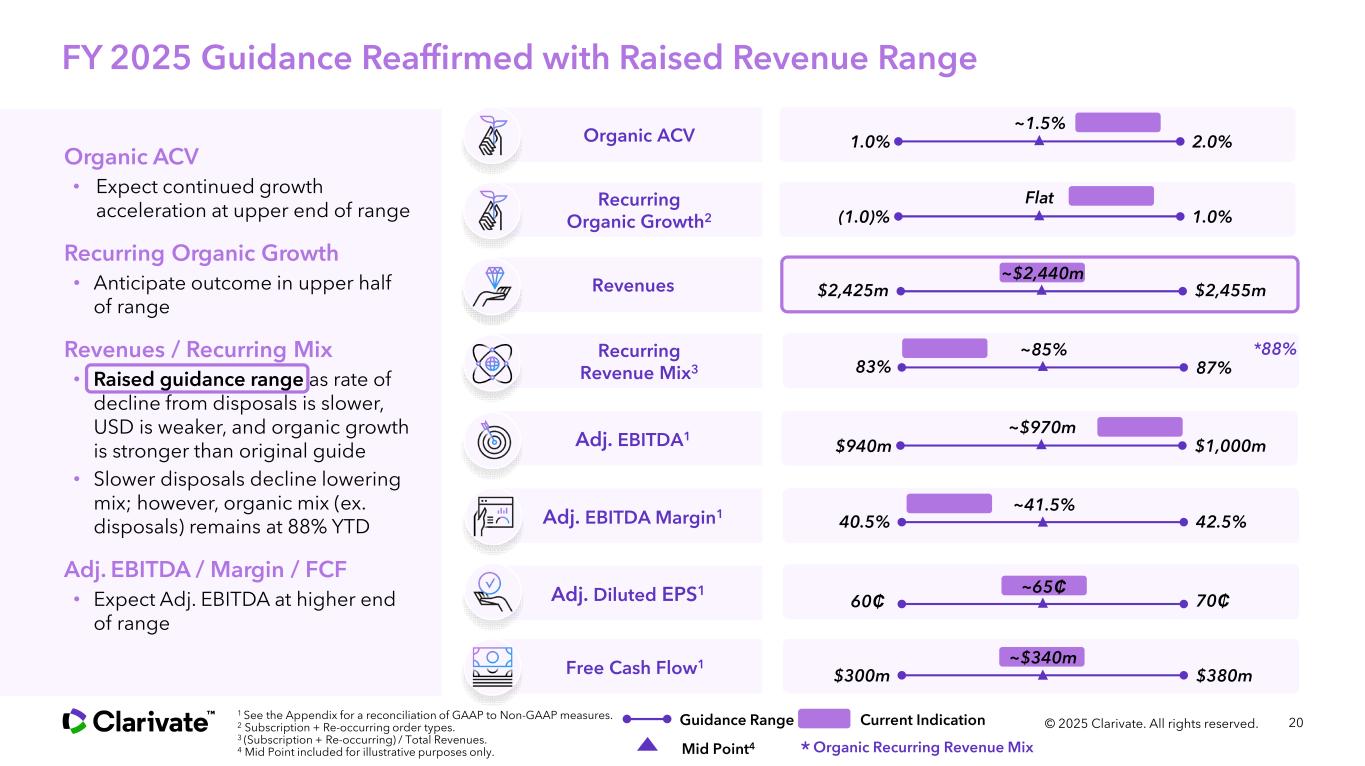
FY 2025 Guidance Reaffirmed with Raised Revenue Range 20 Organic ACV • Expect continued growth acceleration at upper end of range Recurring Organic Growth • Anticipate outcome in upper half of range Revenues / Recurring Mix • Raised guidance range as rate of decline from disposals is slower, USD is weaker, and organic growth is stronger than original guide • Slower disposals decline lowering mix; however, organic mix (ex. disposals) remains at 88% YTD Adj. EBITDA / Margin / FCF • Expect Adj. EBITDA at higher end of range 1 See the Appendix for a reconciliation of GAAP to Non-GAAP measures. 2 Subscription + Re-occurring order types. 3 (Subscription + Re-occurring) / Total Revenues. 4 Mid Point included for illustrative purposes only. © 2025 Clarivate. All rights reserved. Mid Point4 Guidance Range Organic ACV 1.0% 2.0% Recurring Revenue Mix3 83% 87% ~85% Adj. EBITDA1 $940m $1,000m ~$970m Adj. EBITDA Margin1 40.5% 42.5% ~41.5% Adj. Diluted EPS1 70₵60₵ Free Cash Flow1 $300m $380m Revenues $2,425m $2,455m Recurring Organic Growth2 (1.0)% 1.0% Flat ~1.5% ~$340m ~$2,440m ~65₵ Current Indication *88% * Organic Recurring Revenue Mix
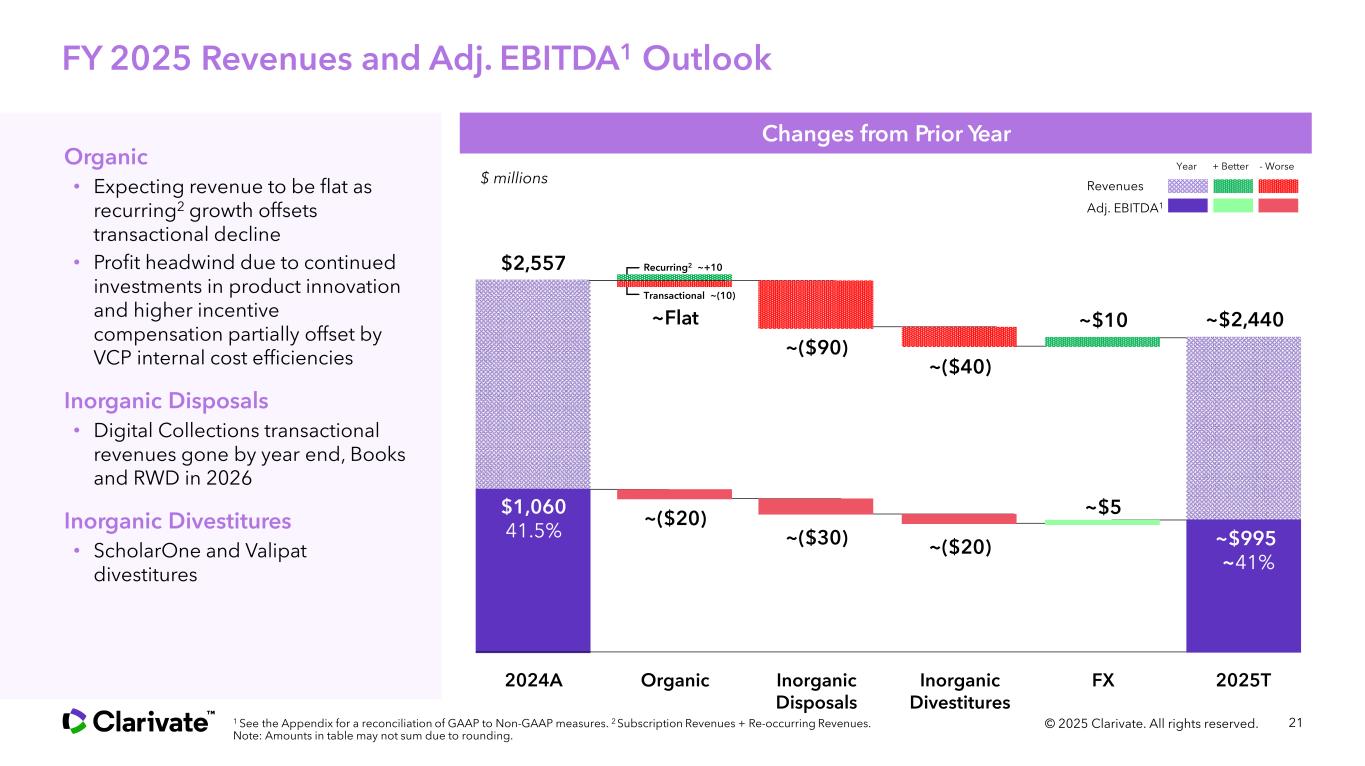
FY 2025 Revenues and Adj. EBITDA1 Outlook 21 2024A 2025T $2,557 ~$2,440 $1,060 41.5% Revenues Adj. EBITDA1 Year + Better - Worse $ millions FX ~$10 ~$5 © 2025 Clarivate. All rights reserved. Organic ~($20) Inorganic Disposals ~($90) ~($30) Changes from Prior Year Organic • Expecting revenue to be flat as recurring2 growth offsets transactional decline • Profit headwind due to continued investments in product innovation and higher incentive compensation partially offset by VCP internal cost efficiencies Inorganic Disposals • Digital Collections transactional revenues gone by year end, Books and RWD in 2026 Inorganic Divestitures • ScholarOne and Valipat divestitures Inorganic Divestitures ~($40) ~($20) 1 See the Appendix for a reconciliation of GAAP to Non-GAAP measures. 2 Subscription Revenues + Re-occurring Revenues. Note: Amounts in table may not sum due to rounding. ~Flat Recurring2 ~+10 Transactional ~(10) ~$995 ~41%
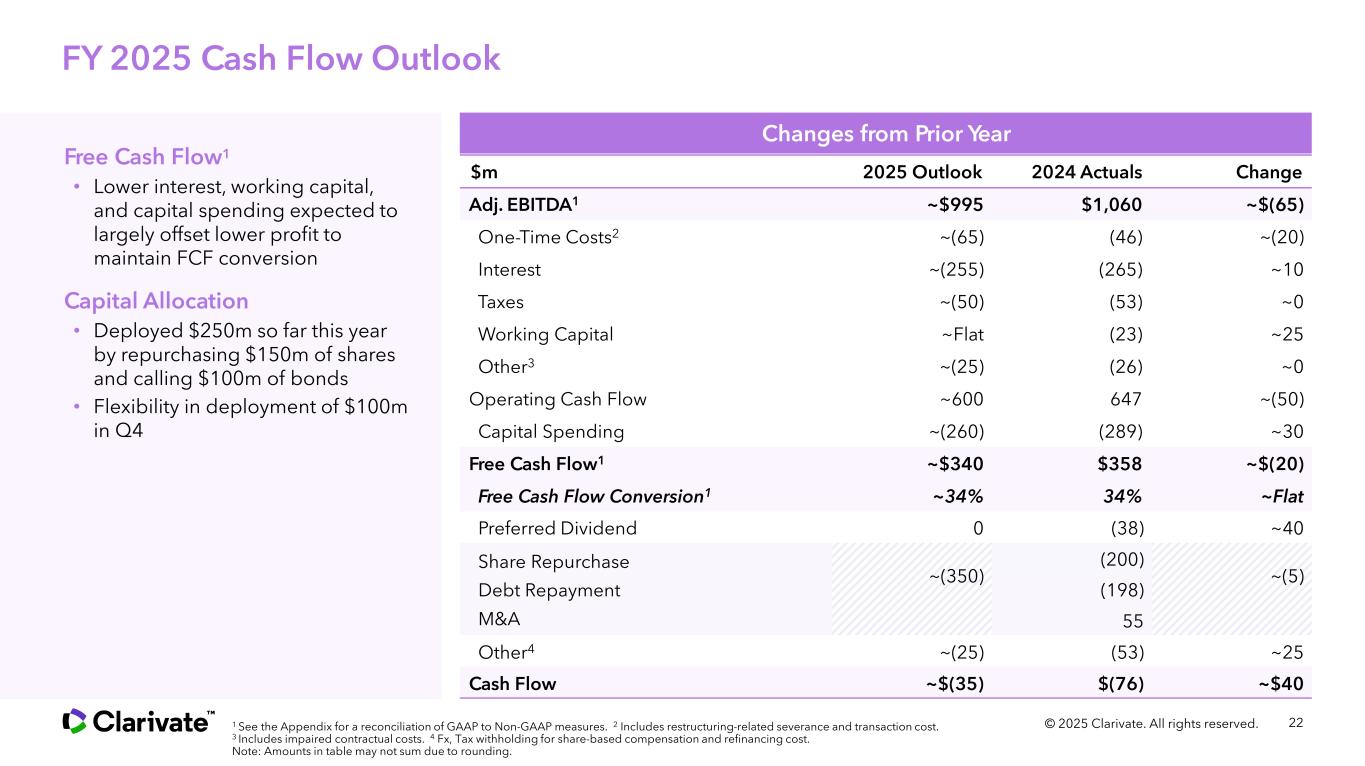
FY 2025 Cash Flow Outlook 22 $m 2025 Outlook 2024 Actuals Change Adj. EBITDA1 ~$995 $1,060 ~$(65) One-Time Costs2 ~(65) (46) ~(20) Interest ~(255) (265) ~10 Taxes ~(50) (53) ~0 Working Capital ~Flat (23) ~25 Other3 ~(25) (26) ~0 Operating Cash Flow ~600 647 ~(50) Capital Spending ~(260) (289) ~30 Free Cash Flow1 ~$340 $358 ~$(20) Free Cash Flow Conversion1 ~34% 34% ~Flat Preferred Dividend 0 (38) ~40 Share Repurchase ~(350) (200) ~(5) Debt Repayment (198) M&A 55 Other4 ~(25) (53) ~25 Cash Flow ~$(35) $(76) ~$40 © 2025 Clarivate. All rights reserved. Changes from Prior Year Free Cash Flow1 • Lower interest, working capital, and capital spending expected to largely offset lower profit to maintain FCF conversion Capital Allocation • Deployed $250m so far this year by repurchasing $150m of shares and calling $100m of bonds • Flexibility in deployment of $100m in Q4 1 See the Appendix for a reconciliation of GAAP to Non-GAAP measures. 2 Includes restructuring-related severance and transaction cost. 3 Includes impaired contractual costs. 4 Fx, Tax withholding for share-based compensation and refinancing cost. Note: Amounts in table may not sum due to rounding.
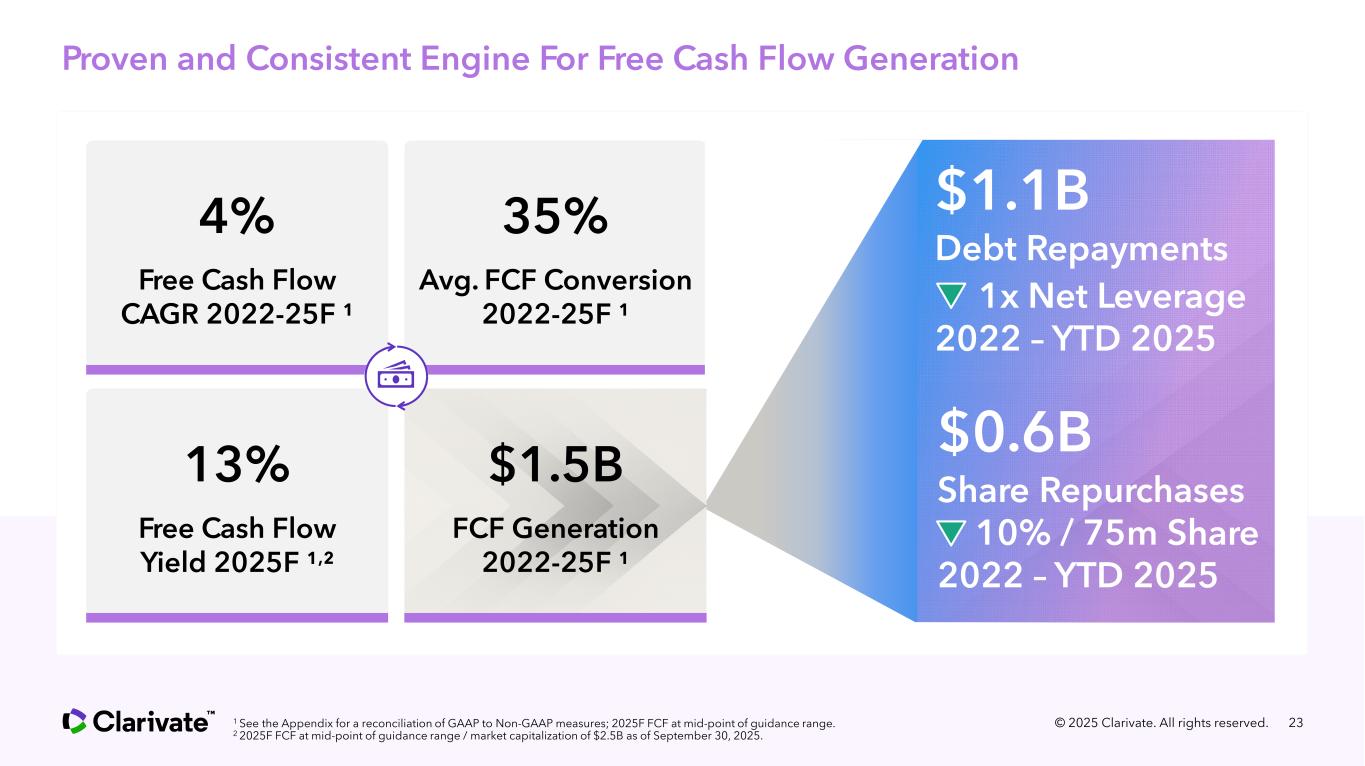
Proven and Consistent Engine For Free Cash Flow Generation © 2025 Clarivate. All rights reserved. 23 4% Free Cash Flow CAGR 2022-25F ¹ 35% Avg. FCF Conversion 2022-25F ¹ 13% Free Cash Flow Yield 2025F ¹,² 1 See the Appendix for a reconciliation of GAAP to Non-GAAP measures; 2025F FCF at mid-point of guidance range. 2 2025F FCF at mid-point of guidance range / market capitalization of $2.5B as of September 30, 2025. $1.1B Debt Repayments 1x Net Leverage 2022 – YTD 2025 $0.6B Share Repurchases 10% / 75m Share 2022 – YTD 2025 $1.5B FCF Generation 2022-25F ¹

Q&A Session
Appendix Presentation of Certain Non-GAAP Financial Measures
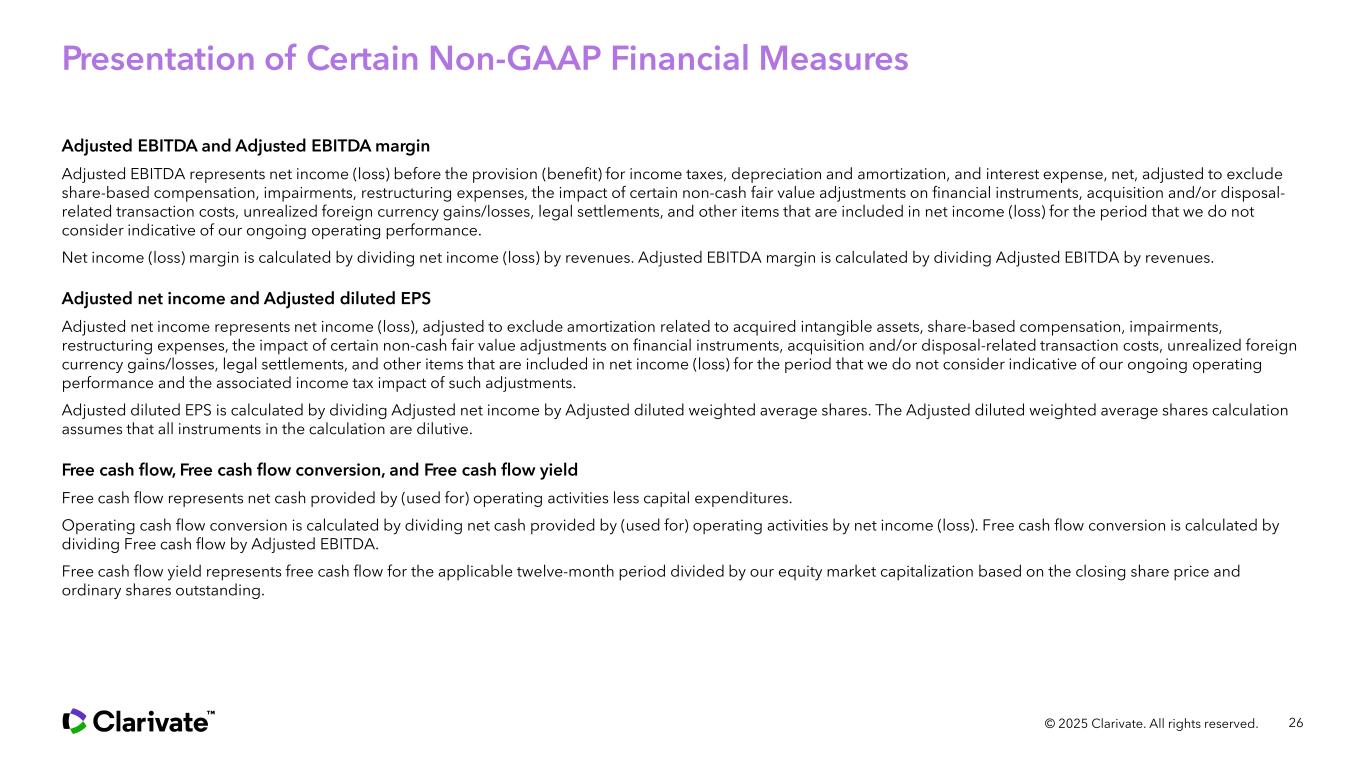
26© 2025 Clarivate. All rights reserved. Presentation of Certain Non-GAAP Financial Measures Adjusted EBITDA and Adjusted EBITDA margin Adjusted EBITDA represents net income (loss) before the provision (benefit) for income taxes, depreciation and amortization, and interest expense, net, adjusted to exclude share-based compensation, impairments, restructuring expenses, the impact of certain non-cash fair value adjustments on financial instruments, acquisition and/or disposal- related transaction costs, unrealized foreign currency gains/losses, legal settlements, and other items that are included in net income (loss) for the period that we do not consider indicative of our ongoing operating performance. Net income (loss) margin is calculated by dividing net income (loss) by revenues. Adjusted EBITDA margin is calculated by dividing Adjusted EBITDA by revenues. Adjusted net income and Adjusted diluted EPS Adjusted net income represents net income (loss), adjusted to exclude amortization related to acquired intangible assets, share-based compensation, impairments, restructuring expenses, the impact of certain non-cash fair value adjustments on financial instruments, acquisition and/or disposal-related transaction costs, unrealized foreign currency gains/losses, legal settlements, and other items that are included in net income (loss) for the period that we do not consider indicative of our ongoing operating performance and the associated income tax impact of such adjustments. Adjusted diluted EPS is calculated by dividing Adjusted net income by Adjusted diluted weighted average shares. The Adjusted diluted weighted average shares calculation assumes that all instruments in the calculation are dilutive. Free cash flow, Free cash flow conversion, and Free cash flow yield Free cash flow represents net cash provided by (used for) operating activities less capital expenditures. Operating cash flow conversion is calculated by dividing net cash provided by (used for) operating activities by net income (loss). Free cash flow conversion is calculated by dividing Free cash flow by Adjusted EBITDA. Free cash flow yield represents free cash flow for the applicable twelve-month period divided by our equity market capitalization based on the closing share price and ordinary shares outstanding.
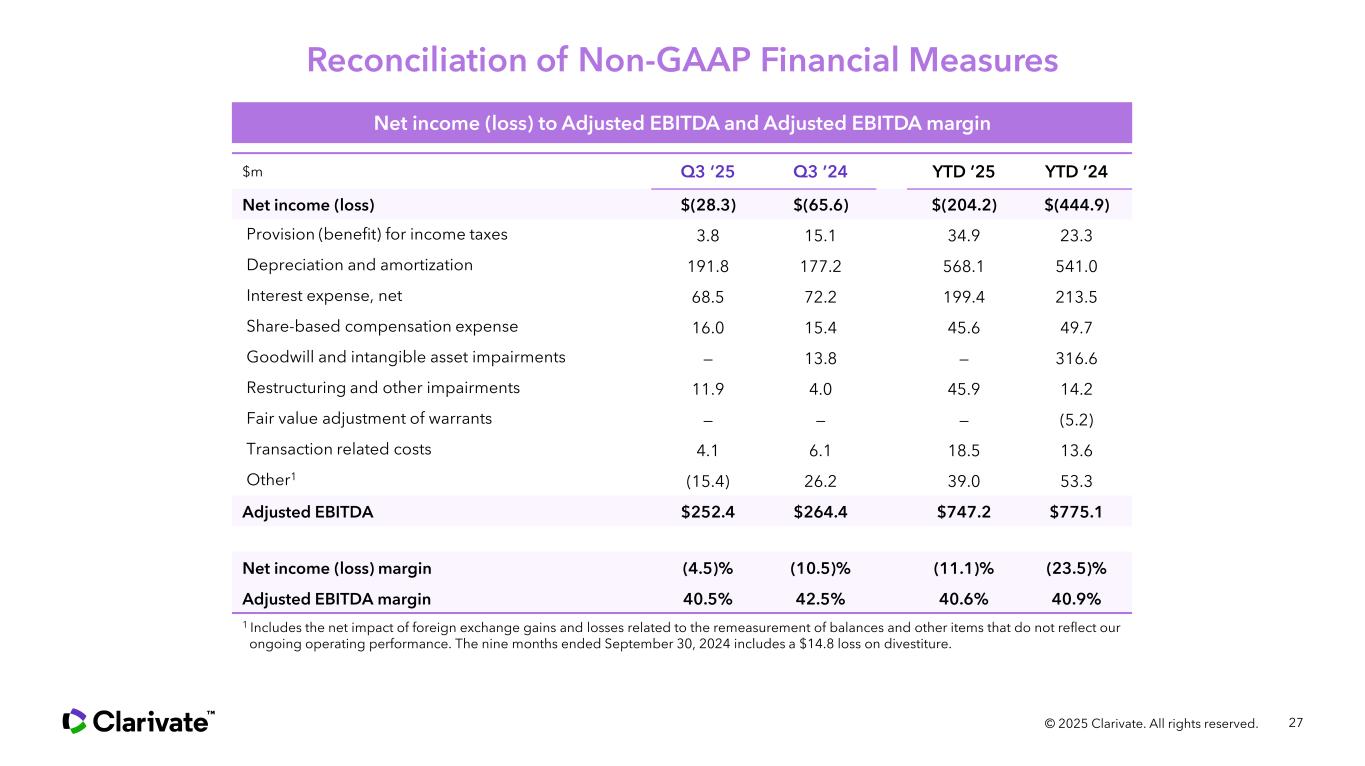
27 $m Q3 ‘25 Q3 ’24 YTD ’25 YTD ’24 Net income (loss) $(28.3) $(65.6) $(204.2) $(444.9) Provision (benefit) for income taxes 3.8 15.1 34.9 23.3 Depreciation and amortization 191.8 177.2 568.1 541.0 Interest expense, net 68.5 72.2 199.4 213.5 Share-based compensation expense 16.0 15.4 45.6 49.7 Goodwill and intangible asset impairments — 13.8 — 316.6 Restructuring and other impairments 11.9 4.0 45.9 14.2 Fair value adjustment of warrants — — — (5.2) Transaction related costs 4.1 6.1 18.5 13.6 Other1 (15.4) 26.2 39.0 53.3 Adjusted EBITDA $252.4 $264.4 $747.2 $775.1 Net income (loss) margin (4.5)% (10.5)% (11.1)% (23.5)% Adjusted EBITDA margin 40.5% 42.5% 40.6% 40.9% © 2025 Clarivate. All rights reserved. 1 Includes the net impact of foreign exchange gains and losses related to the remeasurement of balances and other items that do not reflect our ongoing operating performance. The nine months ended September 30, 2024 includes a $14.8 loss on divestiture. Reconciliation of Non-GAAP Financial Measures Net income (loss) to Adjusted EBITDA and Adjusted EBITDA margin
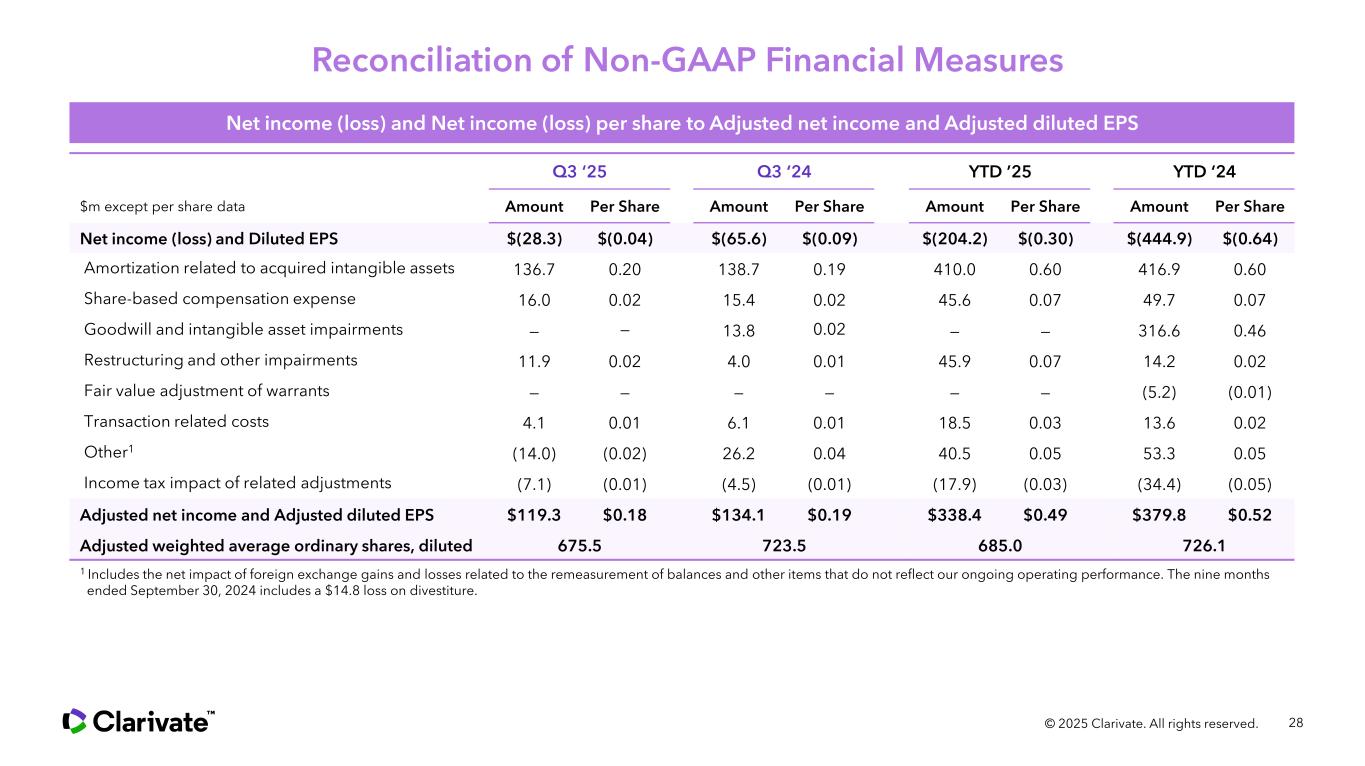
Reconciliation of Non-GAAP Financial Measures 28 Net income (loss) and Net income (loss) per share to Adjusted net income and Adjusted diluted EPS © 2025 Clarivate. All rights reserved. 1 Includes the net impact of foreign exchange gains and losses related to the remeasurement of balances and other items that do not reflect our ongoing operating performance. The nine months ended September 30, 2024 includes a $14.8 loss on divestiture. Q3 ‘25 Q3 ‘24 YTD ’25 YTD ‘24 $m except per share data Amount Per Share Amount Per Share Amount Per Share Amount Per Share Net income (loss) and Diluted EPS $(28.3) $(0.04) $(65.6) $(0.09) $(204.2) $(0.30) $(444.9) $(0.64) Amortization related to acquired intangible assets 136.7 0.20 138.7 0.19 410.0 0.60 416.9 0.60 Share-based compensation expense 16.0 0.02 15.4 0.02 45.6 0.07 49.7 0.07 Goodwill and intangible asset impairments — — 13.8 0.02 — — 316.6 0.46 Restructuring and other impairments 11.9 0.02 4.0 0.01 45.9 0.07 14.2 0.02 Fair value adjustment of warrants — — — — — — (5.2) (0.01) Transaction related costs 4.1 0.01 6.1 0.01 18.5 0.03 13.6 0.02 Other1 (14.0) (0.02) 26.2 0.04 40.5 0.05 53.3 0.05 Income tax impact of related adjustments (7.1) (0.01) (4.5) (0.01) (17.9) (0.03) (34.4) (0.05) Adjusted net income and Adjusted diluted EPS $119.3 $0.18 $134.1 $0.19 $338.4 $0.49 $379.8 $0.52 Adjusted weighted average ordinary shares, diluted 675.5 723.5 685.0 726.1
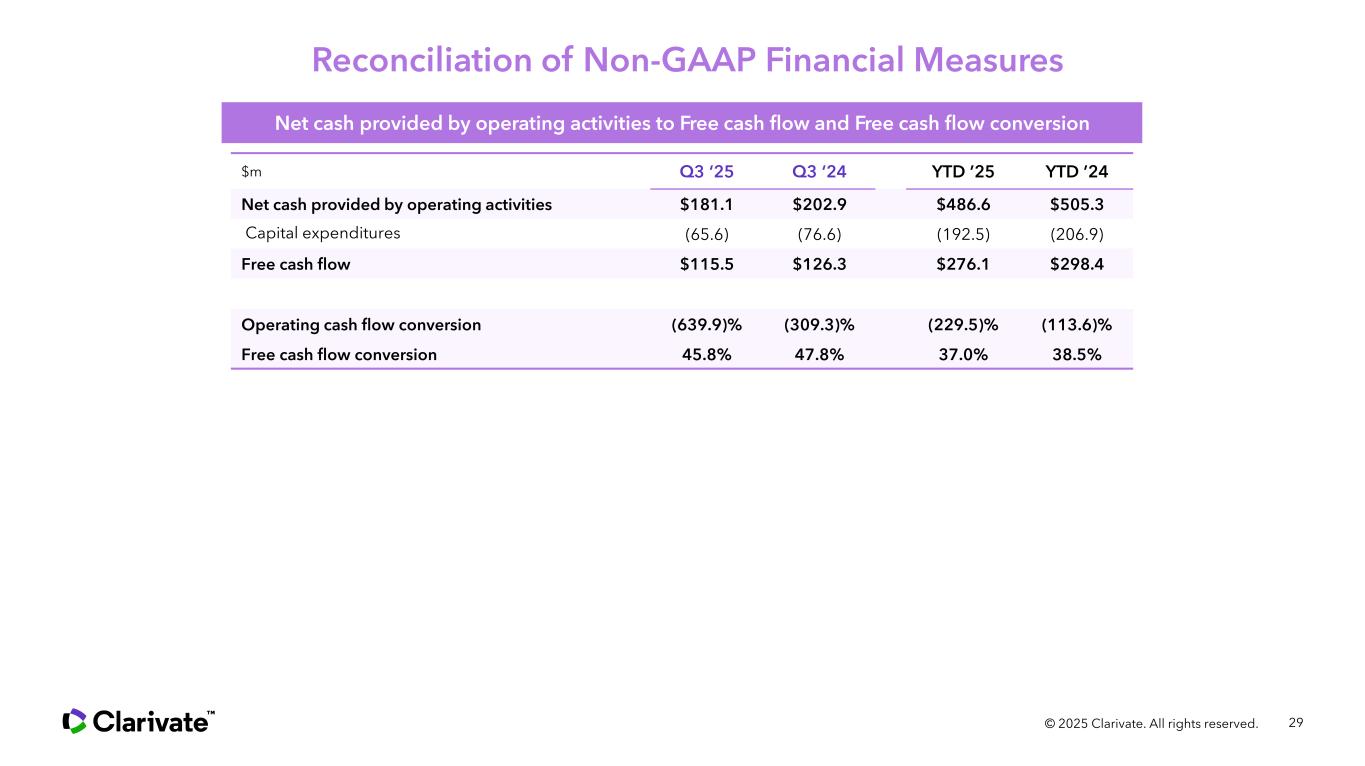
29© 2025 Clarivate. All rights reserved. $m Q3 ‘25 Q3 ‘24 YTD ’25 YTD ’24 Net cash provided by operating activities $181.1 $202.9 $486.6 $505.3 Capital expenditures (65.6) (76.6) (192.5) (206.9) Free cash flow $115.5 $126.3 $276.1 $298.4 Operating cash flow conversion (639.9)% (309.3)% (229.5)% (113.6)% Free cash flow conversion 45.8% 47.8% 37.0% 38.5% Reconciliation of Non-GAAP Financial Measures Net cash provided by operating activities to Free cash flow and Free cash flow conversion
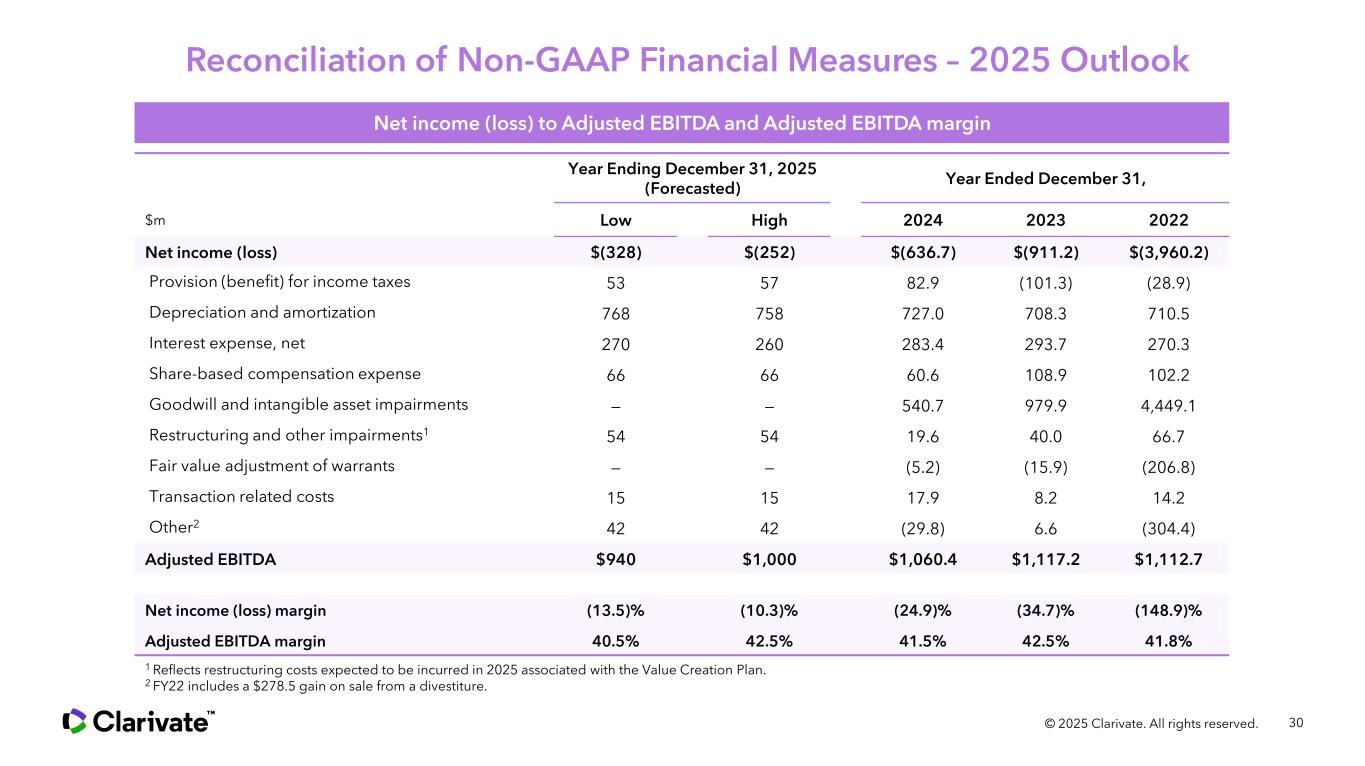
30© 2025 Clarivate. All rights reserved. Year Ending December 31, 2025 (Forecasted) Year Ended December 31, $m Low High 2024 2023 2022 Net income (loss) $(328) $(252) $(636.7) $(911.2) $(3,960.2) Provision (benefit) for income taxes 53 57 82.9 (101.3) (28.9) Depreciation and amortization 768 758 727.0 708.3 710.5 Interest expense, net 270 260 283.4 293.7 270.3 Share-based compensation expense 66 66 60.6 108.9 102.2 Goodwill and intangible asset impairments — — 540.7 979.9 4,449.1 Restructuring and other impairments1 54 54 19.6 40.0 66.7 Fair value adjustment of warrants — — (5.2) (15.9) (206.8) Transaction related costs 15 15 17.9 8.2 14.2 Other2 42 42 (29.8) 6.6 (304.4) Adjusted EBITDA $940 $1,000 $1,060.4 $1,117.2 $1,112.7 Net income (loss) margin (13.5)% (10.3)% (24.9)% (34.7)% (148.9)% Adjusted EBITDA margin 40.5% 42.5% 41.5% 42.5% 41.8% 1 Reflects restructuring costs expected to be incurred in 2025 associated with the Value Creation Plan. 2 FY22 includes a $278.5 gain on sale from a divestiture. Reconciliation of Non-GAAP Financial Measures – 2025 Outlook Net income (loss) to Adjusted EBITDA and Adjusted EBITDA margin
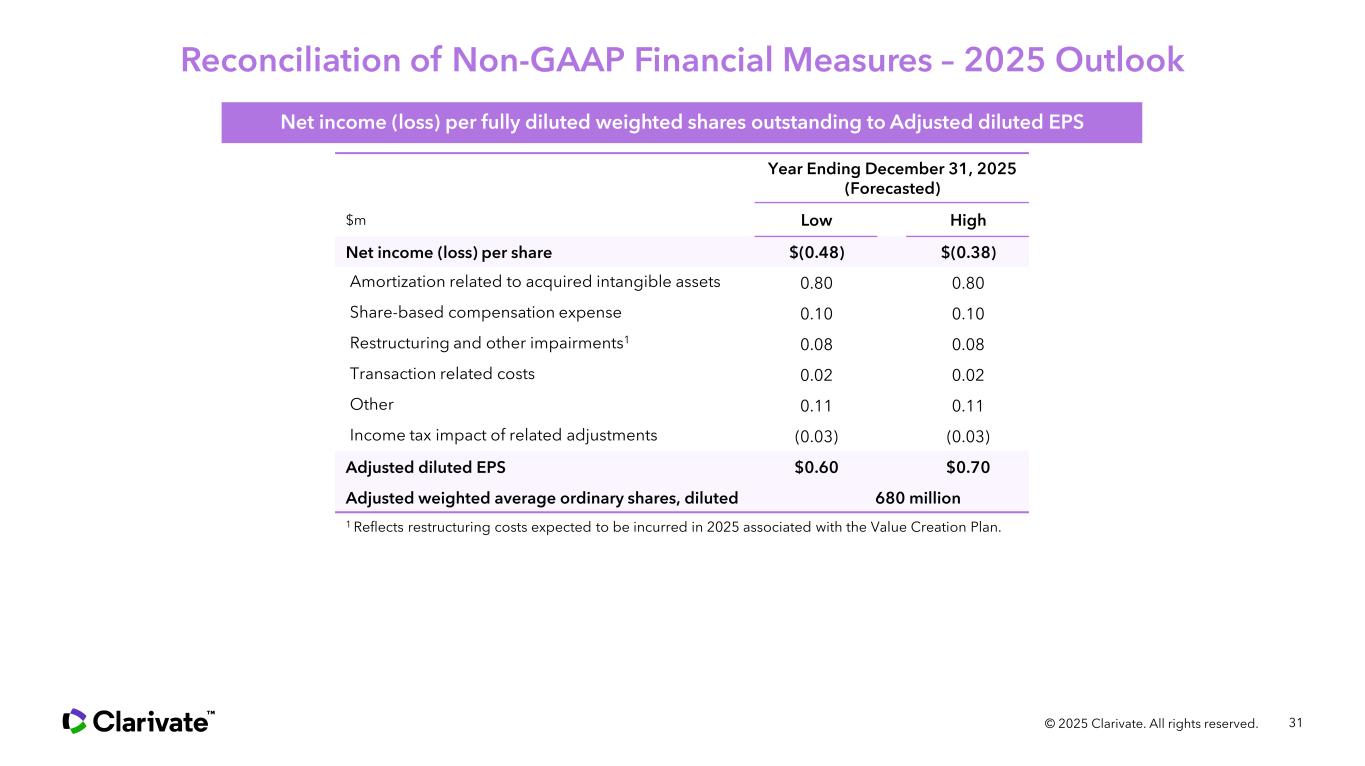
31© 2025 Clarivate. All rights reserved. Year Ending December 31, 2025 (Forecasted) $m Low High Net income (loss) per share $(0.48) $(0.38) Amortization related to acquired intangible assets 0.80 0.80 Share-based compensation expense 0.10 0.10 Restructuring and other impairments1 0.08 0.08 Transaction related costs 0.02 0.02 Other 0.11 0.11 Income tax impact of related adjustments (0.03) (0.03) Adjusted diluted EPS $0.60 $0.70 Adjusted weighted average ordinary shares, diluted 680 million Reconciliation of Non-GAAP Financial Measures – 2025 Outlook 1 Reflects restructuring costs expected to be incurred in 2025 associated with the Value Creation Plan. Net income (loss) per fully diluted weighted shares outstanding to Adjusted diluted EPS
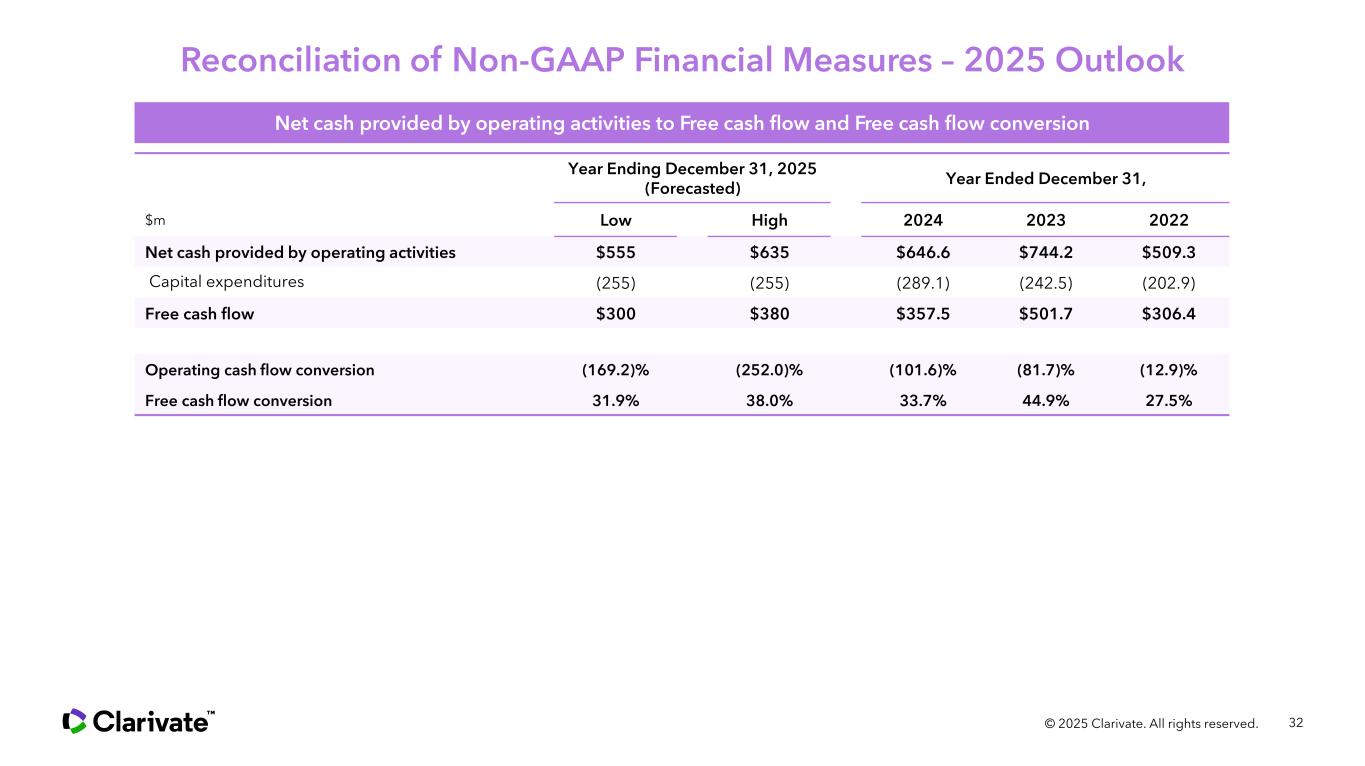
32 Year Ending December 31, 2025 (Forecasted) Year Ended December 31, $m Low High 2024 2023 2022 Net cash provided by operating activities $555 $635 $646.6 $744.2 $509.3 Capital expenditures (255) (255) (289.1) (242.5) (202.9) Free cash flow $300 $380 $357.5 $501.7 $306.4 Operating cash flow conversion (169.2)% (252.0)% (101.6)% (81.7)% (12.9)% Free cash flow conversion 31.9% 38.0% 33.7% 44.9% 27.5% © 2025 Clarivate. All rights reserved. Reconciliation of Non-GAAP Financial Measures – 2025 Outlook Net cash provided by operating activities to Free cash flow and Free cash flow conversion

© 2025 Clarivate Clarivate and its logo, as well as all other trademarks used herein, are trademarks of their respective owners and used under license. About Clarivate Clarivate is a leading global provider of transformative intelligence. We offer enriched data, insights & analytics, workflow solutions and expert services in the areas of Academia & Government, Intellectual Property and Life Sciences & Healthcare. For more information, please visit www.clarivate.com