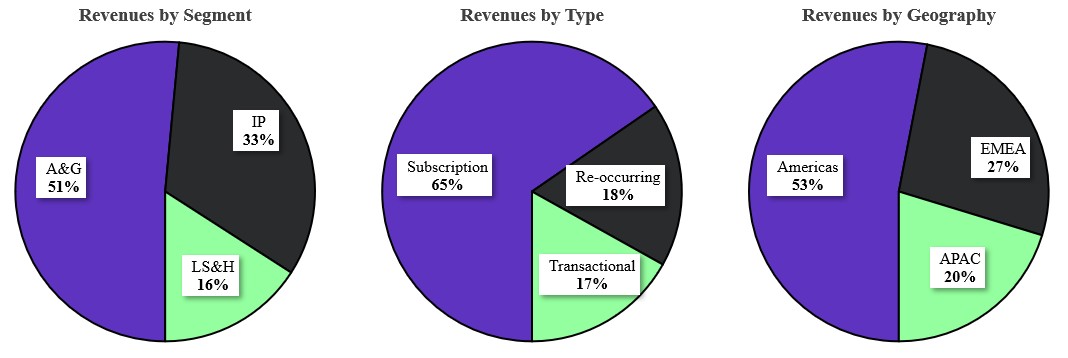
Not applicable | |
(State or other jurisdiction of incorporation or organization) | (I.R.S. Employer Identification No.) |
(Address of principal executive offices) | Not applicable (Zip Code) |
Title of each class | Trading Symbol(s) | Name of each exchange on which registered |
☒ | Accelerated filer | ☐ | |
Non-accelerated filer | ☐ | Smaller reporting company | |
Emerging growth company |
Page | |
PART I | |
PART II | |
PART III | |
PART IV | |


Plan Category | Number of securities to be issued upon exercise of outstanding options, warrants, and rights(1) | Weighted-average exercise price of outstanding options, warrants, and rights(2) | Number of securities remaining available for issuance under equity compensation plans(3) | |||
Equity Compensation Plans Approved by Security Holders: | ||||||
2019 Incentive Award Plan | 26,477,567 | $11.71 | 32,079,827 | |||
Equity Compensation Plans Not Approved by Security Holders | N/A | N/A | N/A | |||
Total | 26,477,567 | $11.71 | 32,079,827 |
Period | Total Number of Shares Purchased | Average Price Paid Per Share | Total Number of Shares Purchased as Part of Publicly Announced Plans or Programs | Approximate Dollar Value of Shares That May Yet Be Purchased Under Plans or Programs(1) | ||||
October 1, 2025 - October 31, 2025 | — | $— | — | $351 | ||||
November 1, 2025 - November 30, 2025 | 10,306,134 | $3.49 | 10,306,134 | $315 | ||||
December 1, 2025 - December 31, 2025 | 10,912,870 | $3.58 | 10,912,870 | $276 | ||||
Total | 21,219,004 | 21,219,004 |

Q4-23(1) | Q2-24(2) | Q4-24(2) | Q4-25 | ||||
Type of assessment | Quantitative, annual | Quantitative, interim | Quantitative, annual | Quantitative, annual | |||
Goodwill impairment: | |||||||
A&G | $— | $— | $— | $— | |||
IP | (582.2) | — | — | — | |||
LS&H | (265.5) | (302.8) | (149.1) | — | |||
Total | $(847.7) | $(302.8) | $(149.1) | $— | |||
(1) The impairment was primarily due to worsening macroeconomic and market conditions and sustained declines in our share price. | |||||||
(2) The impairments were primarily due to sustained declines in our share price. | |||||||
Year Ended December 31, | Change | ||||||
2025 | 2024 | $ | % | ||||
Revenues | $2,455.2 | $2,556.7 | (101.5) | (4)% | |||
Operating expenses: | |||||||
Cost of revenues | 833.6 | 869.2 | (35.6) | (4)% | |||
Selling, general and administrative costs | 708.6 | 727.6 | (19.0) | (3)% | |||
Depreciation and amortization | 757.2 | 727.0 | 30.2 | 4% | |||
Goodwill and intangible asset impairments | 15.0 | 540.7 | (525.7) | (97)% | |||
Restructuring and other impairments | 50.7 | 19.6 | 31.1 | N/M | |||
Other operating expense (income), net | 18.6 | (51.8) | 70.4 | N/M | |||
Total operating expenses | 2,383.7 | 2,832.3 | |||||
Income (loss) from operations | 71.5 | (275.6) | |||||
Fair value adjustment of warrants | — | (5.2) | 5.2 | N/M | |||
Interest expense, net | 265.4 | 283.4 | (18.0) | (6)% | |||
Income (loss) before income taxes | (193.9) | (553.8) | |||||
Provision (benefit) for income taxes | 7.2 | 82.9 | (75.7) | (91)% | |||
Net income (loss) | (201.1) | (636.7) | |||||
Dividends on preferred shares | — | 31.3 | (31.3) | N/M | |||
Net income (loss) attributable to ordinary shares | $(201.1) | $(668.0) | |||||
N/M - Represents a change approximately equal to or in excess of 100% or is not meaningful. | |||||||
Year Ended December 31, | Change | % of Change | ||||||||||
2025 | 2024 | $ | % | Acquisitions | Disposals | FX | Organic | |||||
Subscription | $1,605.5 | $1,626.8 | $(21.3) | (1.3)% | 0.1% | (2.7)% | 0.5% | 0.8% | ||||
Re-occurring | 434.2 | 429.8 | 4.4 | 1.0% | —% | —% | 1.4% | (0.4)% | ||||
Recurring revenues | 2,039.7 | 2,056.6 | (16.9) | (0.8)% | 0.1% | (2.2)% | 0.7% | 0.6% | ||||
Transactional | 415.5 | 500.1 | (84.6) | (16.9)% | 0.1% | (12.6)% | 0.4% | (4.8)% | ||||
Revenues | $2,455.2 | $2,556.7 | $(101.5) | (4.0)% | 0.1% | (4.7)% | 0.7% | (0.1)% | ||||
Year Ended December 31, | Change | % of Change | ||||||||||
2025 | 2024 | $ | % | Acquisitions | Disposals | FX | Organic | |||||
A&G | $1,266.0 | $1,326.4 | $(60.4) | (4.6)% | —% | (6.7)% | 0.5% | 1.6% | ||||
IP | 799.4 | 811.4 | (12.0) | (1.5)% | 0.1% | (1.0)% | 1.3% | (1.9)% | ||||
LS&H | 389.8 | 418.9 | (29.1) | (6.9)% | 0.2% | (6.0)% | 0.3% | (1.4)% | ||||
Revenues | $2,455.2 | $2,556.7 | $(101.5) | (4.0)% | 0.1% | (4.7)% | 0.7% | (0.1)% | ||||
Year Ended December 31, | Change | % of Change | ||||||||||
2025 | 2024 | $ | % | Acquisitions | Disposals | FX | Organic | |||||
Americas | $1,303.0 | $1,381.4 | $(78.4) | (5.7)% | 0.1% | (5.4)% | 0.1% | (0.5)% | ||||
EMEA | 654.8 | 667.8 | (13.0) | (1.9)% | —% | (4.3)% | 2.1% | 0.3% | ||||
APAC | 497.4 | 507.5 | (10.1) | (2.0)% | —% | (2.6)% | 0.3% | 0.3% | ||||
Revenues | $2,455.2 | $2,556.7 | $(101.5) | (4.0)% | 0.1% | (4.7)% | 0.7% | (0.1)% | ||||
Year Ended December 31, | |||
2025 | 2024 | ||
Net income (loss) | $(201.1) | $(636.7) | |
Provision (benefit) for income taxes | 7.2 | 82.9 | |
Depreciation and amortization | 757.2 | 727.0 | |
Interest expense, net | 265.4 | 283.4 | |
Share-based compensation expense | 63.0 | 60.6 | |
Goodwill and intangible asset impairments | 15.0 | 540.7 | |
Restructuring and other impairments | 50.7 | 19.6 | |
Fair value adjustment of warrants | — | (5.2) | |
Transaction related costs | 22.5 | 17.9 | |
Other(1) | 21.9 | (29.8) | |
Adjusted EBITDA | $1,001.8 | $1,060.4 | |
Net income (loss) margin | (8.2)% | (24.9)% | |
Adjusted EBITDA margin | 40.8% | 41.5% | |
(1) Includes the net impact of foreign exchange gains and losses related to the remeasurement of balances and other items that do not reflect our ongoing operating performance. This amount includes a net gain on sale of $54.7 from divestitures in 2024. See Note 2 - Acquisitions and Divestitures for further details. | |||
Year Ended December 31, | Change | ||||||
2025 | 2024 | $ | % | ||||
Net cash provided by operating activities | $628.5 | $646.6 | $(18.1) | (3)% | |||
Net cash used for investing activities | $(263.2) | $(236.7) | $(26.5) | 11% | |||
Net cash used for financing activities | $(343.1) | $(470.1) | $127.0 | (27)% | |||
Year Ended December 31, | Change | ||||||
2025 | 2024 | $ | % | ||||
Net cash provided by operating activities | $628.5 | $646.6 | $(18.1) | (3)% | |||
Capital expenditures | (263.2) | (289.1) | 25.9 | (9)% | |||
Free cash flow | $365.3 | $357.5 | $7.8 | 2% | |||
Page | |
As of December 31, | |||
(in millions) | 2025 | 2024 | |
ASSETS | |||
Current assets: | |||
Cash and cash equivalents, including restricted cash | $ | $ | |
Accounts receivable, net | |||
Prepaid expenses | |||
Other current assets | |||
Total current assets | |||
Property and equipment, net | |||
Other intangible assets, net | |||
Goodwill | |||
Other non-current assets | |||
Deferred income taxes | |||
Operating lease right-of-use assets | |||
Total assets | $ | $ | |
LIABILITIES AND SHAREHOLDERS' EQUITY | |||
Current liabilities: | |||
Accounts payable | $ | $ | |
Accrued compensation | |||
Accrued expenses and other current liabilities | |||
Current portion of deferred revenues | |||
Current portion of operating lease liability | |||
Current portion of long-term debt | |||
Total current liabilities | |||
Long-term debt | |||
Other non-current liabilities | |||
Deferred income taxes | |||
Operating lease liabilities | |||
Total liabilities | |||
Commitments and contingencies (Note 16) | |||
Shareholders' equity: | |||
Ordinary Shares, and outstanding as of December 31, 2025 and December 31, 2024, respectively | |||
Accumulated other comprehensive loss | ( | ( | |
Accumulated deficit | ( | ( | |
Total shareholders' equity | |||
Total liabilities and shareholders' equity | $ | $ | |
Year Ended December 31, | |||||
(In millions, except per share data) | 2025 | 2024 | 2023 | ||
Revenues | $ | $ | $ | ||
Operating expenses: | |||||
Cost of revenues | |||||
Selling, general and administrative costs | |||||
Depreciation and amortization | |||||
Goodwill and intangible asset impairments | |||||
Restructuring and other impairments | |||||
Other operating expense (income), net | ( | ( | |||
Total operating expenses | |||||
Income (loss) from operations | ( | ( | |||
Fair value adjustment of warrants | ( | ( | |||
Interest expense, net | |||||
Income (loss) before income taxes | ( | ( | ( | ||
Provision (benefit) for income taxes | ( | ||||
Net income (loss) | ( | ( | ( | ||
Dividends on preferred shares | |||||
Net income (loss) attributable to ordinary shares | $( | $( | $( | ||
Per share: | |||||
Basic | $( | $( | $( | ||
Diluted | $( | $( | $( | ||
Weighted average shares used to compute earnings per share: | |||||
Basic | |||||
Diluted | |||||
Year Ended December 31, | |||||
(In millions) | 2025 | 2024 | 2023 | ||
Net income (loss) | $( | $( | $( | ||
Other comprehensive income (loss), net of tax: | |||||
Hedging relationships, net of tax of $( | ( | ( | ( | ||
Defined benefit pension plans, net of tax | ( | ( | ( | ||
Foreign currency translation adjustment | ( | ||||
Other comprehensive income (loss), net of tax | ( | ||||
Comprehensive income (loss) | $( | $( | $( | ||
Ordinary Shares | Preferred Shares | Accumulated other comprehensive loss | Accumulated deficit | Total shareholders' equity | |||||||||
(In millions) | Shares | Amount | Shares | Amount | |||||||||
Balance at December 31, 2022 | $ | $ | $( | $( | $ | ||||||||
Exercise of stock options | — | — | — | — | |||||||||
Vesting of restricted stock units | — | — | — | — | — | — | |||||||
Share-based award activity | ( | — | — | — | — | ||||||||
Repurchase and retirement of ordinary shares | ( | ( | — | — | — | — | ( | ||||||
Dividends to preferred shareholders | — | — | — | — | — | ( | ( | ||||||
Net income (loss) | — | — | — | — | — | ( | ( | ||||||
Other comprehensive income (loss) | — | — | — | — | — | ||||||||
Balance at December 31, 2023 | $ | $ | $( | $( | $ | ||||||||
Vesting of restricted stock units | — | — | — | — | — | — | |||||||
Share-based award activity | ( | — | — | — | — | ||||||||
Conversion of preferred shares into ordinary shares | ( | ( | — | — | — | ||||||||
Repurchase and retirement of ordinary shares | ( | ( | — | — | — | — | ( | ||||||
Dividends to preferred shareholders | — | — | — | — | — | ( | ( | ||||||
Net income (loss) | — | — | — | — | — | ( | ( | ||||||
Other comprehensive income (loss) | — | — | — | — | ( | — | ( | ||||||
Balance at December 31, 2024 | $ | $ | $( | $( | $ | ||||||||
Vesting of restricted stock units | — | — | — | — | — | — | |||||||
Share-based award activity | ( | — | — | — | — | ||||||||
Repurchase and retirement of ordinary shares | ( | ( | — | — | — | — | ( | ||||||
Net income (loss) | — | — | — | — | — | ( | ( | ||||||
Other comprehensive income (loss) | — | — | — | — | — | ||||||||
Balance at December 31, 2025 | $ | $ | $( | $( | $ | ||||||||
Year Ended December 31, | |||||
(In millions) | 2025 | 2024 | 2023 | ||
Cash Flows From Operating Activities | |||||
Net income (loss) | $( | $( | $( | ||
Adjustments to reconcile net income (loss) to net cash provided by operating activities: | |||||
Depreciation and amortization | |||||
Share-based compensation | |||||
Restructuring and other impairments, including goodwill | |||||
Gain on sale from divestitures | ( | ||||
Gain on legal settlement | ( | ||||
Deferred income taxes | ( | ( | |||
Amortization and write-off of debt issuance costs | |||||
Other operating activities | ( | ||||
Changes in operating assets and liabilities: | |||||
Accounts receivable | ( | ( | |||
Prepaid expenses | ( | ||||
Other assets | ( | ||||
Accounts payable | ( | ||||
Accrued expenses and other current liabilities | ( | ( | |||
Deferred revenues | ( | ( | |||
Operating leases, net | ( | ( | ( | ||
Other liabilities | ( | ||||
Net cash provided by operating activities | |||||
Cash Flows From Investing Activities | |||||
Capital expenditures | ( | ( | ( | ||
Payments for acquisitions, net of cash acquired | ( | ( | |||
Proceeds from divestitures, net of cash divested | |||||
Net cash used for investing activities | ( | ( | ( | ||
Cash Flows From Financing Activities | |||||
Principal payments on debt | ( | ( | ( | ||
Proceeds from issuance of debt | |||||
Payment of debt issuance and extinguishment costs | ( | ( | |||
Repurchases of ordinary shares | ( | ( | ( | ||
Cash dividends on preferred shares | ( | ( | |||
Payments related to tax withholding for share-based compensation | ( | ( | ( | ||
Other financing activities | ( | ||||
Net cash used for financing activities | ( | ( | ( | ||
Effects of exchange rates | ( | ||||
Net change in cash and cash equivalents, including restricted cash | ( | ||||
Cash and cash equivalents, including restricted cash, beginning of period | |||||
Cash and cash equivalents, including restricted cash, end of period | $ | $ | $ | ||
Supplemental Cash Flow Information: | |||||
Cash paid for interest | $ | $ | $ | ||
Cash paid for income tax | $ | $ | $ | ||
Computer hardware | ||
Furniture, fixtures, and equipment | ||
Leasehold improvements | Lesser of lease term or estimated useful life |
Customer relationships | |
Technology and content | |
Computer software | |
Trade names and other |
December 31, | |||
2025 | 2024 | ||
Liabilities due to customers | $ | $ | |
Accrued royalties | |||
Miscellaneous accruals | |||
Accrued expenses and other current liabilities | $ | $ | |
Year Ended December 31, | ||||||
2025 | 2024 | 2023 | ||||
Gain on sale from divestitures | Note 2 | $ | $( | $ | ||
Gain on legal settlement | Note 16 | ( | ||||
Net foreign exchange loss | ||||||
Miscellaneous, net | ( | ( | ( | |||
Total | $ | $( | $( | |||
Year Ended December 31, | |||||
2025 | 2024 | 2023 | |||
Subscription | $ | $ | $ | ||
Re-occurring | |||||
Recurring revenues | |||||
Transactional | |||||
Revenues | $ | $ | $ | ||
Year Ended December 31, | |||||
2025 | 2024 | 2023 | |||
Americas | $ | $ | $ | ||
EMEA | |||||
APAC | |||||
Revenues | $ | $ | $ | ||
December 31, | |||
2025 | 2024 | ||
Accounts receivable, net | $ | $ | |
Current portion of deferred revenues | $ | $ | |
Non-current portion of deferred revenues | $ | $ | |
December 31, | |||
2025 | 2024 | ||
Accounts receivable | $ | $ | |
Accounts receivable allowance | ( | ( | |
Accounts receivable, net | $ | $ | |
Year Ended December 31, | |||||
2025 | 2024 | 2023 | |||
Balance at beginning of year | $ | $ | $ | ||
Additional provisions | |||||
Write-offs | ( | ( | ( | ||
Exchange rate change | ( | ||||
Balance at end of year | $ | $ | $ | ||
December 31, | |||
2025 | 2024 | ||
Computer hardware | $ | $ | |
Leasehold improvements | |||
Furniture, fixtures, and equipment | |||
Finance lease | |||
Other | |||
Property and equipment, gross | $ | $ | |
Accumulated depreciation | ( | ( | |
Property and equipment, net | $ | $ | |
December 31, 2025 | December 31, 2024 | ||||||||||
Gross | Accumulated Amortization | Net | Gross | Accumulated Amortization | Net | ||||||
Customer relationships | $ | $( | $ | $ | $( | $ | |||||
Technology and content | ( | ( | |||||||||
Computer software | ( | ( | |||||||||
Trade names and other | ( | ( | |||||||||
Definite-lived intangible assets | $ | $( | $ | $ | $( | $ | |||||
Indefinite-lived trade names | — | — | |||||||||
Other intangible assets, net | $ | $( | $ | $ | $( | $ | |||||
Customer relationships | |
Technology and content | |
Computer software | |
Trade names and other | |
Total |
2026 | $ |
2027 | |
2028 | |
2029 | |
2030 | |
Thereafter | |
Amortizing intangible assets | $ |
Internally developed software projects in process | |
Definite-lived intangible assets | $ |
A&G | IP | LS&H | Total Consolidated | ||||
Balance as of December 31, 2023 | $ | $ | $ | $ | |||
Acquisition | |||||||
Goodwill impairment | ( | ( | ( | ||||
Divestiture(1) | ( | ( | |||||
Impact of foreign currency fluctuations | ( | ( | |||||
Balance as of December 31, 2024 | $ | $ | $ | $ | |||
Impact of foreign currency fluctuations | |||||||
Balance as of December 31, 2025 | $ | $ | $ | $ | |||
(1) Related to the ScholarOne divestiture and its allocated portion of the A&G segment reporting unit’s goodwill balance. For further details, see Note 2 - Acquisitions and Divestitures. | |||||||
Year Ended December 31, | |||||
2025 | 2024 | 2023 | |||
Lease Cost | |||||
Operating lease cost | $ | $ | $ | ||
Variable and short-term lease cost | |||||
Finance lease cost | |||||
Total lease cost | $ | $ | $ | ||
Supplemental Cash Flow Disclosures | |||||
Cash paid for amounts included in measurement of lease liabilities: | |||||
Operating cash flows for operating leases | $ | $ | $ | ||
Operating cash flows for finance leases | |||||
Financing cash flows for finance leases | |||||
Right-of-use assets obtained in exchange for lease obligations: | |||||
Operating leases | $ | $ | $ | ||
Other Information | |||||
Weighted-average remaining lease term: | |||||
Operating leases | |||||
Finance leases | |||||
Weighted-average discount rate: | |||||
Operating leases | |||||
Finance leases | |||||
Year Ending December 31, | Operating Leases | Finance Leases | ||
2026 | $ | $ | ||
2027 | ||||
2028 | ||||
2029 | ||||
2030 | ||||
Thereafter | ||||
Total undiscounted cash flows | $ | $ | ||
Present value: | ||||
Current lease liabilities | ||||
Non-current lease liabilities | ||||
Total lease liabilities | $ | $ | ||
Interest on lease liabilities | $ | $ |
Type | Notional Value | Effective Date | Maturity Date | |||
Swaps entered May 2023 | $ | May 2023 | October 2026 | |||
Swaps entered June 2025 | June 2025 | January 2031 | ||||
Swap entered December 2025 | December 2025 | January 2031 | ||||
Forward-starting swaps entered Aug 2025 | October 2026 | January 2030 | ||||
Total | $ |
Balance Sheet Location | December 31, 2025 | December 31, 2024 | |||
Cash flow hedging relationships: | |||||
Interest rate swaps | Other current assets | $ | $ | ||
Interest rate swaps | Other non-current assets | ||||
Interest rate swaps | Other non-current liabilities | ||||
Fair value hedging relationships: | |||||
Cross-currency swaps | Other non-current liabilities | ||||
Net investment hedge: | |||||
Cross-currency swap | Other non-current assets | ||||
Cross-currency swap | Accrued expenses and other current liabilities | — | |||
Not designated as accounting hedges: | |||||
Foreign currency forwards | Other current assets | ||||
Foreign currency forwards | Accrued expenses and other current liabilities | ||||
Total derivative assets | $ | $ | |||
Total derivative liabilities | $ | $ |
December 31, 2025 | December 31, 2024 | |||||||||
Type | Maturity | Effective Interest Rate | Carrying Value | Effective Interest Rate | Carrying Value | |||||
Senior Secured Notes | 2026 | $ | $ | |||||||
Senior Secured Notes | 2028 | |||||||||
Senior Notes | 2029 | |||||||||
Revolving Credit Facility | 2029 | |||||||||
Term Loan Facility (Tranche 1) | 2031 | |||||||||
Term Loan Facility (Tranche 2) | 2031 | —% | — | |||||||
Finance lease | 2036 | |||||||||
Total debt outstanding | $ | $ | ||||||||
Debt discounts and issuance costs | ( | ( | ||||||||
Current portion of long-term debt(1) | ( | ( | ||||||||
Long-term debt | $ | $ | ||||||||
(1) $ | ||||||||||
Redemption Price (as a percentage of principal) | ||||
Period | Senior Notes (2029) | Senior Secured Notes (2028) | ||
2025 | ||||
2026 and thereafter | ||||
2026 | $ |
2027 | |
2028 | |
2029 | |
2030 | |
Thereafter | |
Total maturities | $ |
Less: capitalized debt issuance costs and original issue discount | ( |
Total, including the current portion of long-term debt | $ |
Hedging relationships(1) | Defined benefit pension plans | Foreign currency translation adjustment(2) | AOCL | ||||
Balance as of December 31, 2022 | $ | $ | $( | $( | |||
Other comprehensive income (loss) before reclassifications | ( | ||||||
Reclassifications from AOCL to net earnings | ( | ( | ( | ||||
Net other comprehensive income (loss) | ( | ( | |||||
Balance as of December 31, 2023 | $ | $ | $( | $( | |||
Other comprehensive income (loss) before reclassifications | ( | ( | ( | ||||
Reclassifications from AOCL to net earnings | ( | ( | |||||
Net other comprehensive income (loss) | ( | ( | ( | ( | |||
Balance as of December 31, 2024 | $ | $( | $( | $( | |||
Other comprehensive income (loss) before reclassifications | ( | ||||||
Reclassifications from AOCL to net earnings | ( | ( | ( | ||||
Net other comprehensive income (loss) | ( | ( | |||||
Balance as of December 31, 2025 | $ | $( | $( | $( | |||
(1) Includes amounts related to our interest rate swaps designated as cash flow hedges, and for the year ended December 31, 2025, also includes the excluded component of our cross-currency swaps designated as fair value hedges. Refer to Note 8 - Derivative Instruments for further information. | |||||||
(2) Includes the impact of translating foreign subsidiary assets and liabilities from their functional currency to USD, as well as amounts related to our cross- currency swap designated as a net investment hedge. | |||||||
Year Ended December 31, | |||||
2025 | 2024 | 2023 | |||
Cost of revenues | $ | $ | $ | ||
Selling, general and administrative costs | |||||
Total share-based compensation expense | $ | $ | $ | ||
Year Ended December 31, | |||||
2025 | 2024 | 2023 | |||
Provision (benefit) for income taxes | $( | $( | $( | ||
Year Ended December 31, 2025 | |||||||
RSUs | RSUs Weighted Average Grant Date Fair Value | PSUs | PSUs Weighted Average Grant Date Fair Value | ||||
Outstanding at December 31, 2024 | $ | $ | |||||
Granted | |||||||
Vested | ( | ( | |||||
Forfeited | ( | ( | |||||
Outstanding at December 31, 2025 | $ | $ | |||||
Total remaining unamortized compensation costs | $ | $ | |||||
Weighted average remaining service period | |||||||
Year Ended December 31, | |||||
2025 | 2024 | 2023 | |||
Severance and related benefit costs: | |||||
Value Creation Plan | $ | $ | $ | ||
Segment Optimization | |||||
ProQuest Acquisition Integration | ( | ||||
Total Severance and related benefit costs | |||||
Exit and disposal costs: | |||||
Value Creation Plan | |||||
Segment Optimization Program | |||||
ProQuest Acquisition Integration | |||||
Total Exit and disposal costs | |||||
Lease abandonment costs: | |||||
Value Creation Plan | |||||
Segment Optimization | ( | ||||
ProQuest Acquisition Integration | ( | ||||
Total Lease abandonment costs | ( | ||||
Restructuring costs | $ | $ | $ | ||
Year Ended December 31, | |||||
2025 | 2024 | 2023 | |||
Academia & Government: | |||||
Value Creation Plan | $ | $ | $ | ||
Segment Optimization | |||||
ProQuest Acquisition Integration | ( | ||||
Total A&G | |||||
Intellectual Property: | |||||
Value Creation Plan | |||||
Segment Optimization | |||||
ProQuest Acquisition Integration | |||||
Total IP | |||||
Life Sciences & Healthcare: | |||||
Value Creation Plan | |||||
Segment Optimization | |||||
ProQuest Acquisition Integration | |||||
Total LS&H | |||||
Restructuring costs | $ | $ | $ | ||
Severance and related benefit costs | Exit, disposal, and abandonment costs | Total | |||
Reserve balance as of December 31, 2023 | $ | $ | $ | ||
Expenses recorded | ( | ||||
Payments made | ( | ( | ( | ||
Noncash items | ( | ||||
Reserve balance as of December 31, 2024 | $ | $ | $ | ||
Expenses recorded | |||||
Payments made | ( | ( | ( | ||
Noncash items | ( | ( | |||
Reserve balance as of December 31, 2025 | $ | $ | $ |
Year Ended December 31, | |||||
2025 | 2024 | 2023 | |||
Current | |||||
U.K. | $ | $ | $( | ||
U.S. federal | ( | ||||
U.S. state | ( | ||||
Other | ( | ||||
Total current | ( | ||||
Deferred | |||||
U.K. | ( | ||||
U.S. federal | ( | ( | ( | ||
U.S. state | ( | ( | ( | ||
Other | ( | ( | |||
Total deferred | ( | ( | |||
Provision (benefit) for income taxes | $ | $ | $( | ||
Year Ended December 31, | |||||
2025 | 2024 | 2023 | |||
U.K. income (loss) | $( | $( | $( | ||
U.S. income (loss) | ( | ( | ( | ||
Other income (loss) | ( | ||||
Income (loss) before income taxes | $( | $( | $( | ||
Year Ended December 31, 2025 | |||
Amount | Percent | ||
U.K. statutory tax rate | $( | ||
Foreign tax effects: | |||
United States: | |||
Legal entity restructuring | ( | ||
Waived deductions under Section 59A | ( | ||
Valuation allowance | ( | ||
BEAT | ( | ||
State and local income taxes, net of federal benefit | ( | ||
Share-based compensation | ( | ||
R&D credits | ( | ||
Foreign branch | ( | ||
Statutory income tax rate differential | ( | ||
Subpart F income | ( | ||
Other | ( | ||
Germany: | |||
Local trade tax | ( | ||
Effect of different tax rates | ( | ||
Other | ( | ||
Israel: | |||
Effect of different tax rates | ( | ||
Other | ( | ||
Mexico: | |||
Valuation allowance | ( | ||
Other | ( | ||
Brazil: | |||
Withholding tax | ( | ||
Other | ( | ||
Other foreign jurisdictions | ( | ||
Changes in valuation allowances | ( | ||
Effect of cross-border tax laws | ( | ||
Nontaxable or nondeductible items | ( | ||
Changes in unrecognized tax benefits | ( | ||
Other adjustments | ( | ||
Effective tax rate | $ | ( | |
Year Ended December 31, | |||
2024 | 2023 | ||
Income (loss) before income taxes | $( | $( | |
Provision (benefit) for income taxes | ( | ||
Statutory rate | |||
Effect of different tax rates | ( | ||
BEAT | ( | ( | |
Change in tax law | ( | ||
Valuation allowances | ( | ( | |
Share-based compensation | ( | ( | |
Other permanent differences | ( | ( | |
Withholding tax | ( | ( | |
Uncertain tax positions | ( | ||
Outside basis difference in foreign subsidiary | ( | ||
Impairments | ( | ( | |
Divestitures | ( | ||
Tax credits | |||
Other | ( | ( | |
Effective tax rate | ( | ||
December 31, | |||
2025 | 2024 | ||
Accounts receivable | $ | $ | |
Accrued expenses | |||
Deferred revenue | |||
Partnerships outside basis difference | |||
Other assets | |||
Debt issuance costs | |||
Lease liabilities | |||
Goodwill | |||
Operating losses and tax attributes | |||
Fixed assets, net | |||
Total deferred tax assets | |||
Valuation allowances | ( | ( | |
Net deferred tax assets | |||
Other identifiable intangible assets, net | ( | ( | |
Other liabilities | ( | ( | |
Right-of-use assets | ( | ( | |
Fixed assets, net | ( | ||
Total deferred tax liabilities | ( | ( | |
Net deferred tax liabilities | $( | $( | |
December 31, | |||
2025 | 2024 | ||
Deferred tax asset | $ | $ | |
Deferred tax liability | ( | ( | |
Net deferred tax liability | $( | $( | |
December 31, | |||||
2025 | 2024 | 2023 | |||
Beginning balance, January 1 | $ | $ | $ | ||
Change charged to expense/(income) | |||||
Change charged to CTA | ( | ||||
Ending balance, December 31 | $ | $ | $ | ||
Year Ended December 31, 2025 | |
U.K. | $( |
Foreign: | |
India | |
U.S. federal | |
Germany federal | |
South Korea | |
Spain | |
Sweden | |
Brazil | |
Other foreign | |
Total | $ |
December 31, | |||||
2025 | 2024 | 2023 | |||
Beginning balance, January 1 | $ | $ | $ | ||
Increases for tax positions taken in prior years | |||||
Increases for tax positions taken in the current year | |||||
Decreases for tax positions taken in prior years | ( | ( | ( | ||
Decreases related to settlements with tax authorities | ( | ||||
Decreases due to statute expirations | ( | ( | ( | ||
Ending balance, December 31 | $ | $ | $ | ||
Year Ended December 31, | |||||
2025 | 2024 | 2023 | |||
Basic EPS | |||||
Net income (loss) | $( | $( | $( | ||
Dividends on preferred shares | |||||
Net income (loss) attributable to ordinary shares | $( | $( | $( | ||
Weighted average shares, basic | |||||
Basic EPS | $( | $( | $( | ||
Diluted EPS | |||||
Net income (loss) attributable to ordinary shares | $( | $( | $( | ||
Change in fair value of private placement warrants | |||||
Net income (loss) attributable to ordinary shares, diluted | $( | $( | $( | ||
Weighted average shares, basic | |||||
Weighted average effect of potentially dilutive shares | |||||
Weighted average shares, diluted | |||||
Diluted EPS | $( | $( | $( | ||
Year Ended December 31, | |||||
2025 | 2024 | 2023 | |||
Academia & Government | |||||
Revenues | $ | $ | $ | ||
People-related costs | ( | ( | ( | ||
Royalties and other product costs | ( | ( | ( | ||
Technology costs | ( | ( | ( | ||
Outside service costs | ( | ( | ( | ||
Other costs | ( | ( | ( | ||
A&G Adjusted EBITDA | $ | $ | $ | ||
Intellectual Property | |||||
Revenues | $ | $ | $ | ||
People-related costs | ( | ( | ( | ||
Royalties and other product costs | ( | ( | ( | ||
Technology costs | ( | ( | ( | ||
Outside service costs | ( | ( | ( | ||
Other costs | ( | ( | ( | ||
IP Adjusted EBITDA | $ | $ | $ | ||
Life Sciences & Healthcare | |||||
Revenues | $ | $ | $ | ||
People-related costs | ( | ( | ( | ||
Royalties and other product costs | ( | ( | ( | ||
Technology costs | ( | ( | ( | ||
Outside service costs | ( | ( | ( | ||
Other costs | ( | ( | ( | ||
LS&H Adjusted EBITDA | $ | $ | $ | ||
Total Reportable Segments | |||||
Revenues | $ | $ | $ | ||
People-related costs | ( | ( | ( | ||
Royalties and other product costs | ( | ( | ( | ||
Technology costs | ( | ( | ( | ||
Outside service costs | ( | ( | ( | ||
Other costs | ( | ( | ( | ||
Total Reportable Segments Adjusted EBITDA | $ | $ | $ | ||
Benefit (provision) for income taxes | ( | ( | |||
Depreciation and amortization | ( | ( | ( | ||
Interest expense, net | ( | ( | ( | ||
Share-based compensation expense | ( | ( | ( | ||
Goodwill and intangible asset impairments | ( | ( | ( | ||
Restructuring and lease impairments | ( | ( | ( | ||
Fair value adjustment of warrants | |||||
Transaction related costs | ( | ( | ( | ||
Other(1) | ( | ( | |||
Net income (loss) | $( | $( | $( | ||
(1) Includes the net impact of unrealized foreign currency gains and losses and other items that do not reflect our ongoing operating performance. This amount includes a net gain on sale of $ and Divestitures and Note 16 - Commitments and Contingencies for further details. | |||||
Year Ended December 31, | |||
2025 | 2024 | ||
U.S. | $ | $ | |
India | |||
U.K. | |||
All other | |||
Total long-lived assets | $ | $ | |
Exhibit Number | Description | |
3.1 | ||
4.1 | ||
4.2 | ||
4.3 | ||
4.4 | ||
4.5 | ||
4.6 | ||
4.7 | ||
4.8 | ||
4.9 | ||
4.10 | ||
4.11 | ||
10.1 | ||
10.2 |
10.3 | ||
10.4 | ||
10.5 | ||
10.6 | ||
10.7+ | ||
10.8+ | ||
10.9+ | ||
10.10+ | ||
10.11+ | ||
10.12+ | ||
10.13+ | ||
10.14+ | ||
10.15+ | ||
10.16*+ | ||
10.17*+ | ||
10.18+ | ||
10.19+ | ||
10.20+ | ||
10.21+ | ||
10.22+ | ||
10.23+ | ||
10.24+ | ||
10.25+ |
10.26+ | ||
19.1* | ||
21.1* | ||
23.1* | ||
24.1* | ||
31* | ||
32* | ||
97 | ||
101* | The following financial information from Clarivate’s Annual Report on Form 10-K for the year ended December 31, 2025, formatted in Inline XBRL: (i) Consolidated Balance Sheets, (ii) Consolidated Statements of Operations, (iii) Consolidated Statements of Comprehensive Income (Loss), (iv) Consolidated Statements of Changes in Equity, (v) Consolidated Statements of Cash Flows, and (vi) Notes to the Consolidated Financial Statements. | |
104* | Cover Page Interactive Data File (formatted in Inline XBRL and contained in Exhibit 101) |
CLARIVATE PLC | |
By: | /s/ Matitiahu Shem Tov |
Name: Matitiahu Shem Tov | |
Title: Chief Executive Officer and Director | |
Name | Title | |
/s/ Matitiahu Shem Tov | Chief Executive Officer and Director | |
Matitiahu Shem Tov | (Principal Executive Officer) | |
/s/ Jonathan M. Collins | Executive Vice President and Chief Financial Officer | |
Jonathan M. Collins | (Principal Financial Officer) | |
/s/ Michael Easton | Senior Vice President and Chief Accounting Officer | |
Michael Easton | (Principal Accounting Officer) | |
/s/ Andrew M. Snyder | Director and Chairman of the Board of Directors | |
Andrew M. Snyder | ||
/s/ Jane Okun Bomba | Director | |
Jane Okun Bomba | ||
/s/ Kenneth Cornick | Director | |
Kenneth Cornick | ||
/s/ Usama N. Cortas | Director | |
Usama N. Cortas | ||
/s/ Suzanne Heywood | Director | |
Suzanne Heywood | ||
/s/ Adam T. Levyn | Director | |
Adam T. Levyn | ||
/s/ Anthony Munk | Director | |
Anthony Munk | ||
/s/ Dr. Wendell E. Pritchett | Director | |
Dr. Wendell E. Pritchett | ||
/s/ Saurabh Saha | Director | |
Saurabh Saha |