
LS&H Divestiture Investor Call July 6, 2026
Safe Harbor Statement and Non-GAAP Financial Measures © 2026 Clarivate. All rights reserved. 2 Forward-Looking Statements This presentation includes statements that express our opinions, expectations, beliefs, plans, objectives, assumptions, or projections regarding future events or future results and therefore are, or may be deemed to be, “forward-looking statements” within the meaning of the “safe harbor provisions” of the Private Securities Litigation Reform Act of 1995. Forward-looking statements included in this presentation include all matters that are not historical facts, including statements relating to our intentions, beliefs, or current expectations concerning, among other things, the anticipated divestiture of our LS&H business or any other strategic transactions we may explore, the anticipated use of proceeds from the divestiture of our LS&H business, anticipated cost savings, results of operations, financial condition, liquidity, capital allocation plans and share repurchases, foreign exchange impacts, prospects, growth, strategies, and the markets in which we operate, our financial guidance for the fiscal year 2026 and key drivers thereof and underlying assumptions, the impact or anticipated benefits of our Value Creation Plan and other growth strategies, the global macroeconomic uncertainty and volatility, the impact of artificial intelligence (“AI”) on our business and strategy, and the timing of any of the foregoing. These forward-looking statements can generally be identified by the use of forward- looking terminology, including the terms “believes,” “estimates,” “anticipates,” “expects,” “seeks,” “projects,” “intends,” “plans,” “may,” “will,” or “should” or, in each case, their negative or other variations or comparable terminology. Such forward-looking statements are based on available current market material and management's expectations, beliefs, and forecasts concerning future events impacting us. These forward-looking statements involve a number of risks, uncertainties, and other important factors (some of which are beyond our control) or other assumptions that may cause actual results or performance to be materially different from those expressed or implied by these forward-looking statements. Factors that may impact such forward-looking statements include, but are not limited to, our ability to compete in the highly competitive industry in which we operate; our ability to maintain high annual renewal rates; our ability to maintain revenues if our products and services do not achieve and maintain broad market acceptance, or if we are unable to keep pace with or adapt to rapidly changing technology, evolving industry standards, and changing regulatory requirements; reductions in customers’ research budgets or government funding; the success of our Value Creation Plan; our ability to derive fully the anticipated benefits from organic growth, existing or future acquisitions, joint ventures, investments, or dispositions; our exposure to risk from the international scope of our operations; our level of indebtedness; our ability to leverage AI in our products and services; any significant disruption in or unauthorized access to or breaches of our computer systems or those of third parties that we utilize in our operations; other factors beyond our control; and those factors described in Item 1A. Risk Factors in our annual report on Form 10-K, along with our other filings with the U.S. Securities and Exchange Commission (“SEC”). There can be no assurance that future developments affecting us will be those that we have anticipated. Should one or more of these risks or uncertainties materialize, or should any of the assumptions prove incorrect, actual results may vary in material respects from those projected in these forward-looking statements. We do not undertake any obligation to update or revise any forward-looking statements, whether as a result of new information, future events, or otherwise, except as may be required under applicable securities laws. Please consult our public filings with the SEC, which are also available on our website at www.clarivate.com.
Safe Harbor Statement and Non-GAAP Financial Measures © 2026 Clarivate. All rights reserved. 3 Non-GAAP Financial Measures This presentation contains financial measures that have not been prepared in accordance with U.S. generally accepted accounting principles (“GAAP”), including Adjusted EBITDA, Adjusted EBITDA Margin, Adjusted Diluted EPS, Free Cash Flow, and Free Cash Flow Margin. Non-GAAP financial measures are not recognized terms under GAAP, are not measures of financial condition or liquidity, and should not be considered as an alternative to profit or loss for the period determined in accordance with GAAP or operating cash flows determined in accordance with GAAP. As a result, you should not consider such measures in isolation from, or as a substitute for, financial measures or results of operations calculated or determined in accordance with GAAP. We use non-GAAP measures internally in our operational and financial decision-making, to assess the operating performance of our business, to assess performance for employee compensation purposes, and to decide how to allocate resources. We believe that such measures allow us to focus on what we deem to be more reliable indicators of ongoing operating performance and our ability to generate cash flow from operations, and we also believe that investors may find these non-GAAP financial measures useful for the same reasons. Non-GAAP measures are frequently used by securities analysts, investors, and other interested parties in their evaluation of companies comparable to us, many of which present non-GAAP measures when reporting their results. Further, these measures can be useful in evaluating our performance against our peer companies because we believe they provide users with valuable insight into key components of our GAAP financial disclosure. However, non-GAAP measures have limitations as analytical tools and because not all companies use identical calculations, our presentation of non-GAAP financial measures may not be comparable to other similarly titled measures of other companies. Definitions and reconciliations of non-GAAP financial measures to the most directly comparable GAAP measures are provided within the Appendix to this presentation. Our presentation of non- GAAP measures should not be construed as an inference that our future results will be unaffected by any of the adjusted items, or that any projections and estimates will be realized in their entirety or at all. Industry and Market Data The market data and other statistical information used throughout this presentation are based on industry publications and surveys, public filings, and various government sources. Industry publications and surveys generally state that the information contained therein has been obtained from sources believed to be reliable, but there can be no assurance as to the accuracy or completeness of the included information. We have not independently verified such third-party information, nor have we ascertained the underlying economic assumptions relied upon in those sources, and we are unable to assure you of the accuracy or completeness of such information contained in this presentation. While we are not aware of any misstatements regarding our market, industry, or similar data presented herein, such data involve risks and uncertainties and are subject to change based on various factors.
Agenda 4© 2026 Clarivate. All rights reserved. Strategic Rationale Financial Implications Q&A Matti Shem Tov Chief Executive Officer Jonathan Collins Chief Financial Officer
Matti Shem Tov Chief Executive Officer Strategic Rationale
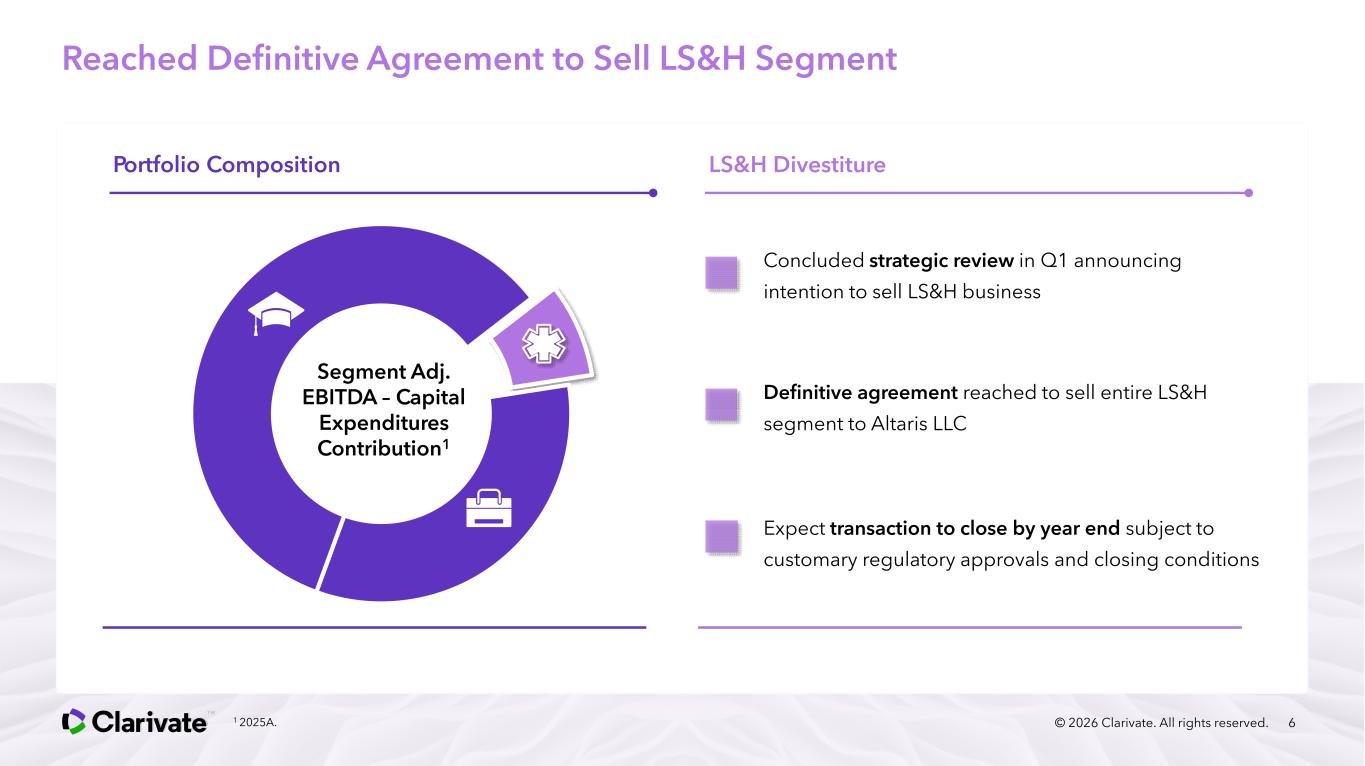
Reached Definitive Agreement to Sell LS&H Segment © 2026 Clarivate. All rights reserved. 6 Concluded strategic review in Q1 announcing intention to sell LS&H business LS&H DivestiturePortfolio Composition Definitive agreement reached to sell entire LS&H segment to Altaris LLC Expect transaction to close by year end subject to customary regulatory approvals and closing conditions 1 2025A. Segment Adj. EBITDA – Capital Expenditures Contribution1
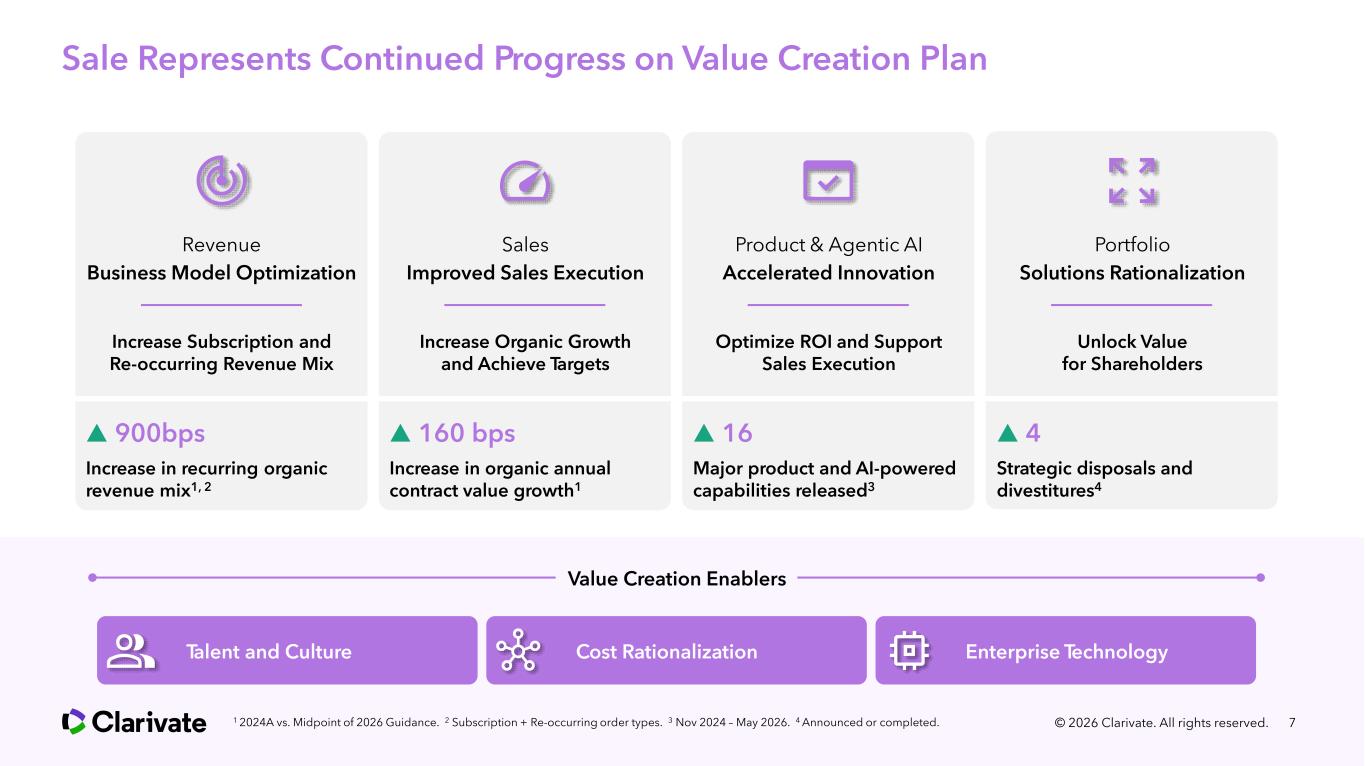
Sale Represents Continued Progress on Value Creation Plan Product & Agentic AI Accelerated Innovation Optimize ROI and Support Sales Execution Sales Improved Sales Execution Increase Organic Growth and Achieve Targets Revenue Business Model Optimization Increase Subscription and Re-occurring Revenue Mix Portfolio Solutions Rationalization Unlock Value for Shareholders 7 Value Creation Enablers Talent and Culture Cost Rationalization Enterprise Technology © 2026 Clarivate. All rights reserved. ▲ 900bps Increase in recurring organic revenue mix1, 2 ▲ 160 bps Increase in organic annual contract value growth1 ▲ 16 Major product and AI-powered capabilities released3 ▲ 4 Strategic disposals and divestitures4 1 2024A vs. Midpoint of 2026 Guidance. 2 Subscription + Re-occurring order types. 3 Nov 2024 – May 2026. 4 Announced or completed.
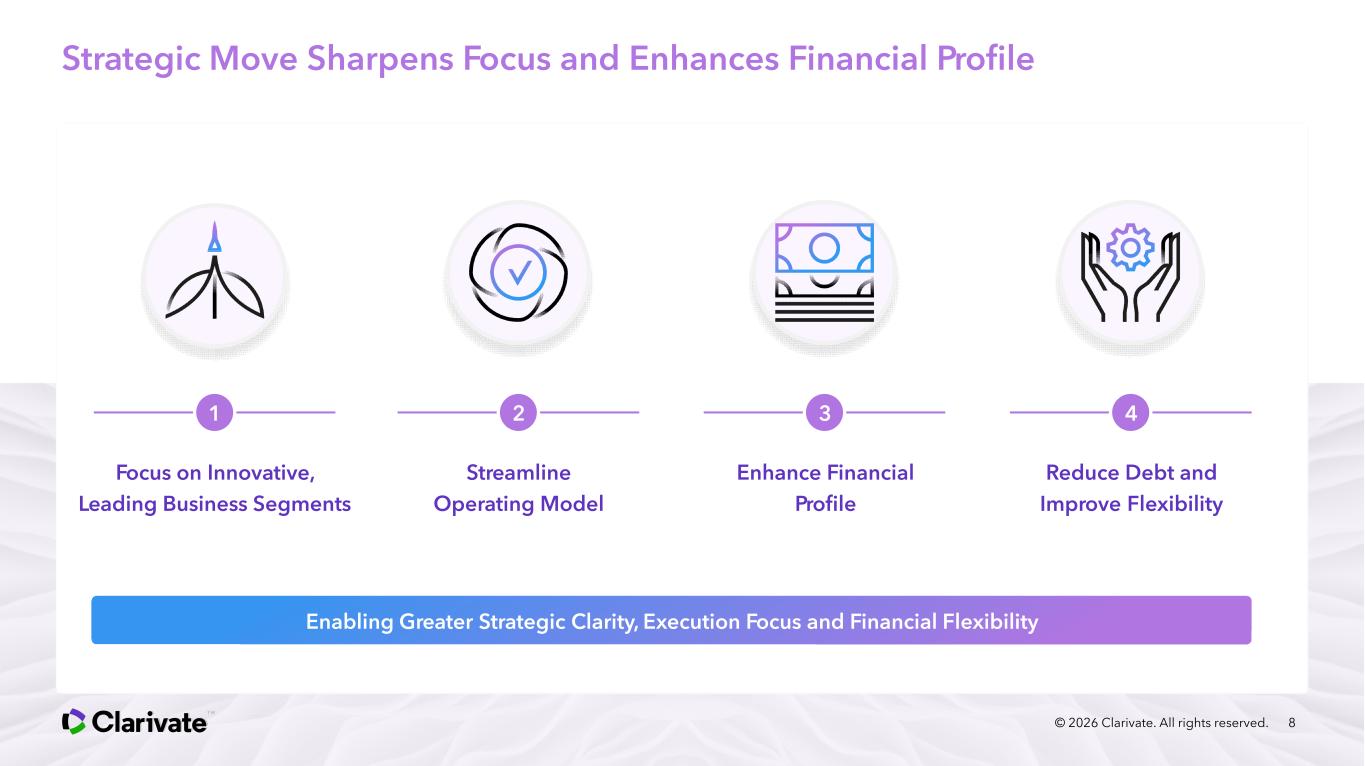
Strategic Move Sharpens Focus and Enhances Financial Profile © 2026 Clarivate. All rights reserved. 8 Focus on Innovative, Leading Business Segments 1 Streamline Operating Model 2 Enhance Financial Profile 3 Reduce Debt and Improve Flexibility 4 Enabling Greater Strategic Clarity, Execution Focus and Financial Flexibility
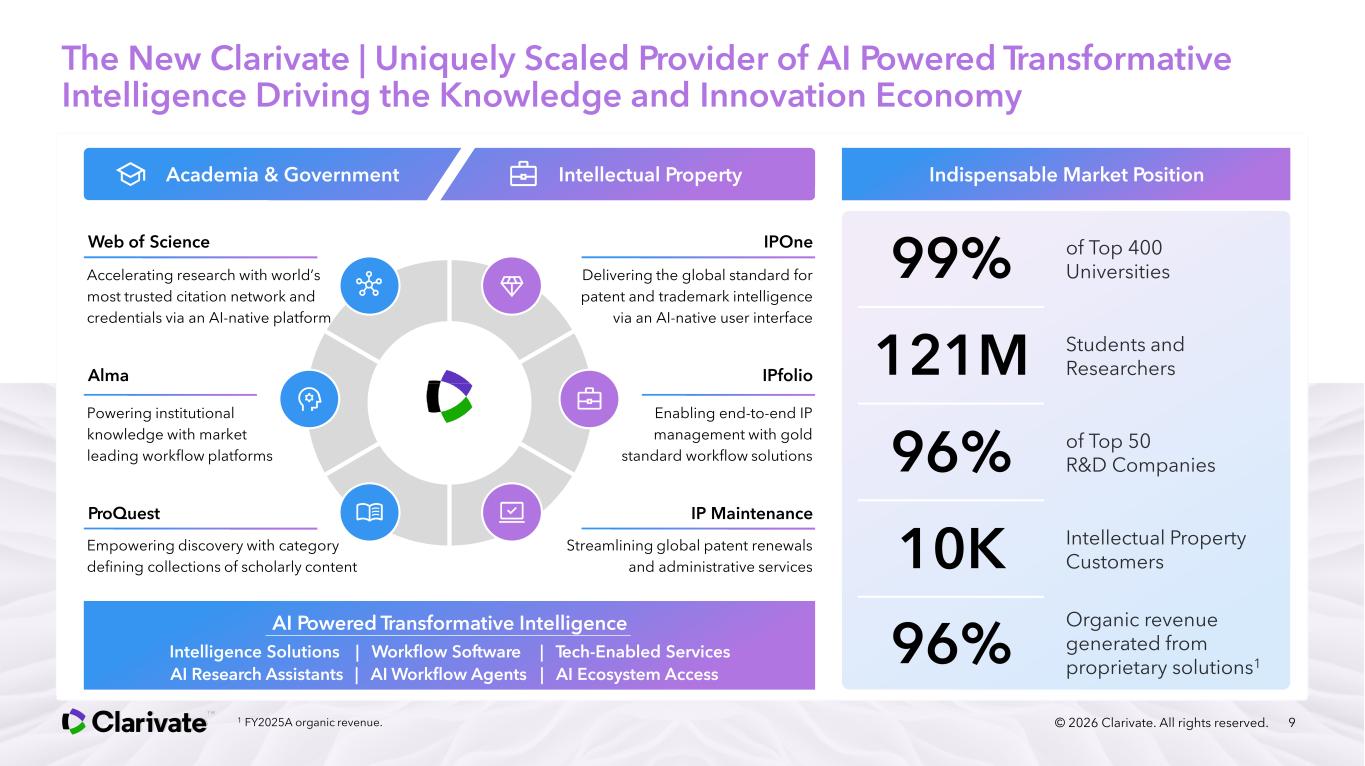
The New Clarivate | Uniquely Scaled Provider of AI Powered Transformative Intelligence Driving the Knowledge and Innovation Economy © 2026 Clarivate. All rights reserved. 9 Academia & Government Intellectual Property 99% of Top 400 Universities 121M Students and Researchers 96% of Top 50 R&D Companies 10K Intellectual Property Customers 96% Organic revenue generated from proprietary solutions1 Indispensable Market Position Accelerating research with world’s most trusted citation network and credentials via an AI-native platform Web of Science Powering institutional knowledge with market leading workflow platforms Alma Empowering discovery with category defining collections of scholarly content ProQuest Delivering the global standard for patent and trademark intelligence via an AI-native user interface IPOne Enabling end-to-end IP management with gold standard workflow solutions IPfolio Streamlining global patent renewals and administrative services IP Maintenance Intelligence Solutions | Workflow Software | Tech-Enabled Services AI Research Assistants | AI Workflow Agents | AI Ecosystem Access AI Powered Transformative Intelligence 1 FY2025A organic revenue.
Jonathan Collins Chief Financial Officer Financial Implications
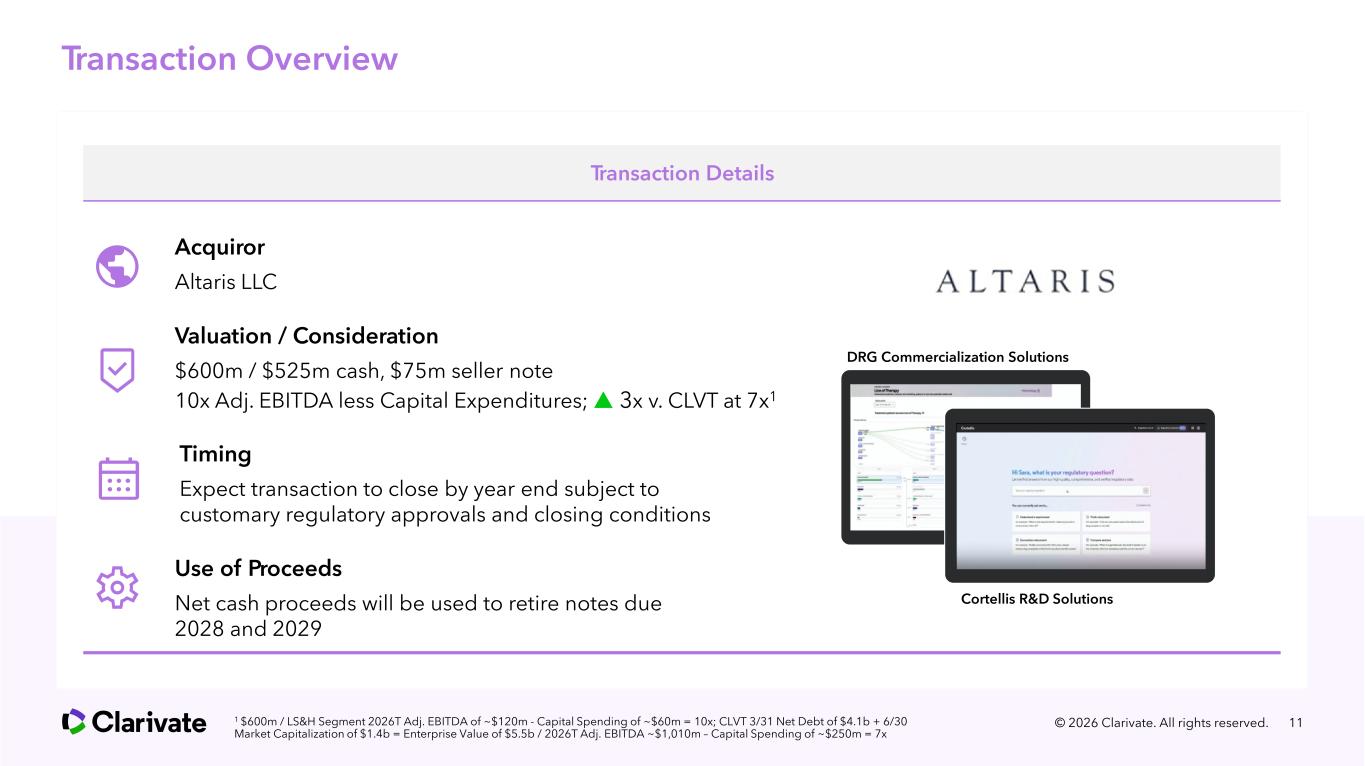
Transaction Overview © 2026 Clarivate. All rights reserved. 11 Acquiror Altaris LLC Use of Proceeds Net cash proceeds will be used to retire notes due 2028 and 2029 Timing Expect transaction to close by year end subject to customary regulatory approvals and closing conditions Valuation / Consideration $600m / $525m cash, $75m seller note 10x Adj. EBITDA less Capital Expenditures; ▲ 3x v. CLVT at 7x1 Transaction Details DRG Commercialization Solutions Cortellis R&D Solutions 1 $600m / LS&H Segment 2026T Adj. EBITDA of ~$120m - Capital Spending of ~$60m = 10x; CLVT 3/31 Net Debt of $4.1b + 6/30 Market Capitalization of $1.4b = Enterprise Value of $5.5b / 2026T Adj. EBITDA ~$1,010m – Capital Spending of ~$250m = 7x
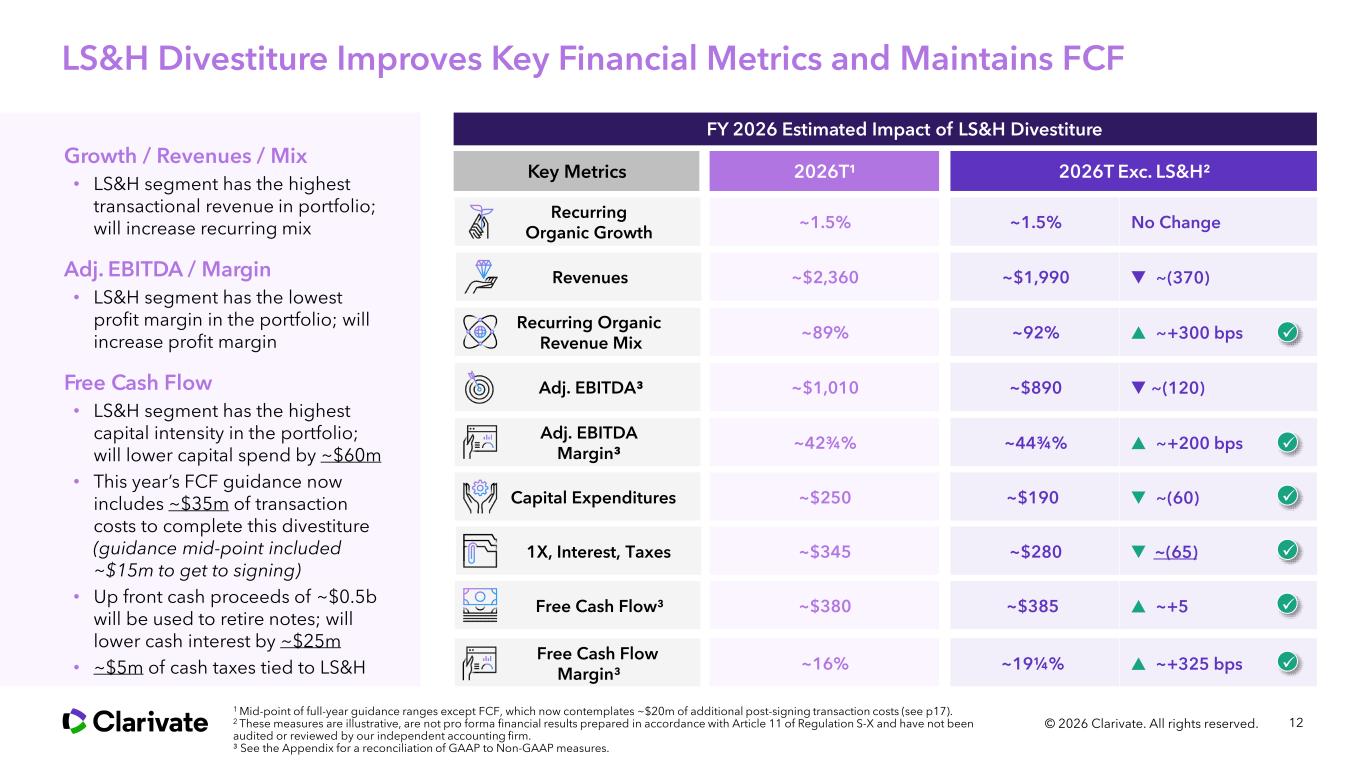
LS&H Divestiture Improves Key Financial Metrics and Maintains FCF 12© 2026 Clarivate. All rights reserved. Key Metrics 2026T¹ 2026T Exc. LS&H² Growth / Revenues / Mix • LS&H segment has the highest transactional revenue in portfolio; will increase recurring mix Adj. EBITDA / Margin • LS&H segment has the lowest profit margin in the portfolio; will increase profit margin Free Cash Flow • LS&H segment has the highest capital intensity in the portfolio; will lower capital spend by ~$60m • This year’s FCF guidance now includes ~$35m of transaction costs to complete this divestiture (guidance mid-point included ~$15m to get to signing) • Up front cash proceeds of ~$0.5b will be used to retire notes; will lower cash interest by ~$25m • ~$5m of cash taxes tied to LS&H Revenues ~$2,360 ~$1,990 ▼ ~(370) Adj. EBITDA³ ~$1,010 ~$890 ▼ ~(120) Free Cash Flow³ ~$380 ~$385 ▲ ~+5 1 Mid-point of full-year guidance ranges except FCF, which now contemplates ~$20m of additional post-signing transaction costs (see p17). 2 These measures are illustrative, are not pro forma financial results prepared in accordance with Article 11 of Regulation S-X and have not been audited or reviewed by our independent accounting firm. ³ See the Appendix for a reconciliation of GAAP to Non-GAAP measures. Recurring Organic Growth ~1.5% ~1.5% No Change Recurring Organic Revenue Mix ~89% ~92% ▲ ~+300 bps Adj. EBITDA Margin³ ~42¾% ~44¾% ▲ ~+200 bps ~$250 ~$190 ▼ ~(60)Capital Expenditures ~$345 ~$280 ▼ ~(65)1X, Interest, Taxes FY 2026 Estimated Impact of LS&H Divestiture Free Cash Flow Margin³ ~16% ~19¼% ▲ ~+325 bps
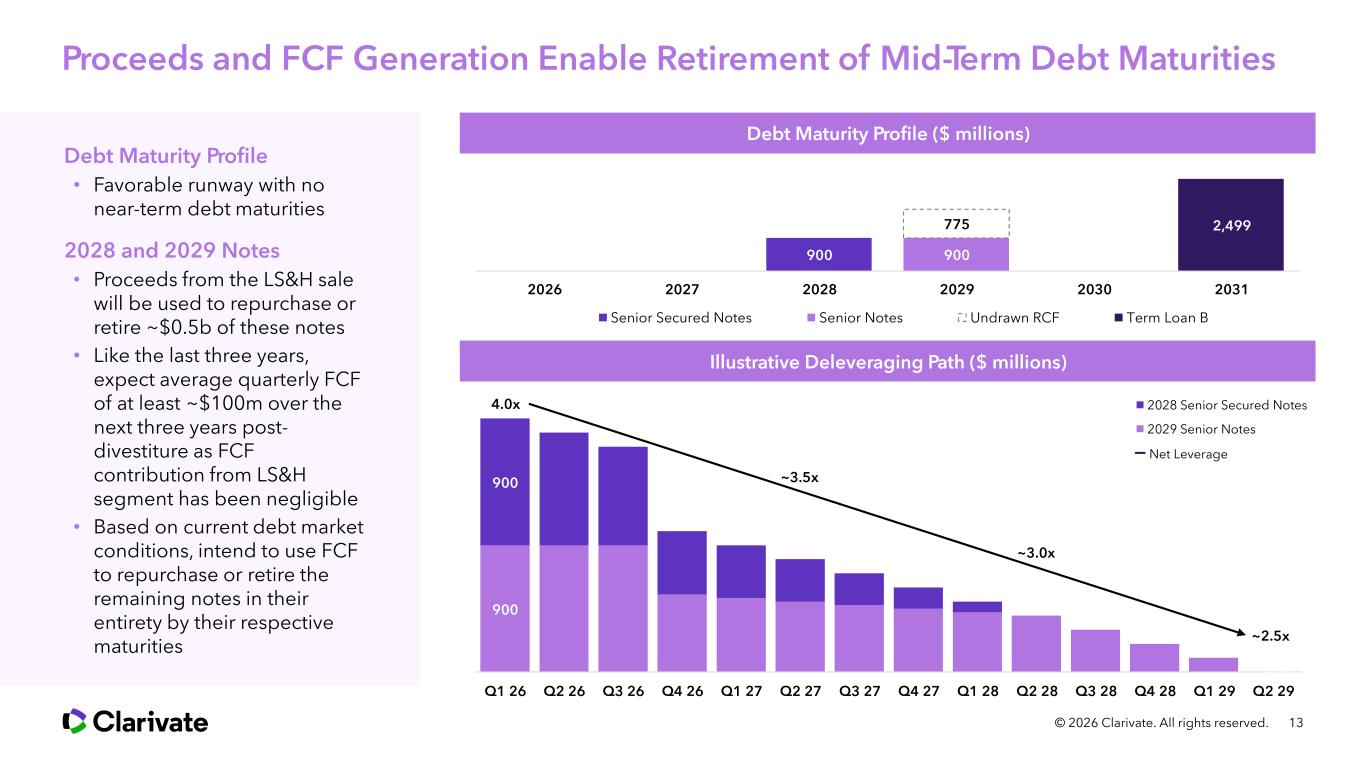
Proceeds and FCF Generation Enable Retirement of Mid-Term Debt Maturities © 2026 Clarivate. All rights reserved. 13 900 900 775 2,499 2026 2027 2028 2029 2030 2031 Senior Secured Notes Senior Notes Undrawn RCF Term Loan B Debt Maturity Profile ($ millions) Illustrative Deleveraging Path ($ millions) 900 ~500 900 Q1 26 Q2 26 Q3 26 Q4 26 Q1 27 Q2 27 Q3 27 Q4 27 Q1 28 Q2 28 Q3 28 Q4 28 Q1 29 Q2 29 2028 Senior Secured Notes 2029 Senior Notes Net Leverage 4.0x ~3.5x ~3.0x ~2.5x Debt Maturity Profile • Favorable runway with no near-term debt maturities 2028 and 2029 Notes • Proceeds from the LS&H sale will be used to repurchase or retire ~$0.5b of these notes • Like the last three years, expect average quarterly FCF of at least ~$100m over the next three years post- divestiture as FCF contribution from LS&H segment has been negligible • Based on current debt market conditions, intend to use FCF to repurchase or retire the remaining notes in their entirety by their respective maturities
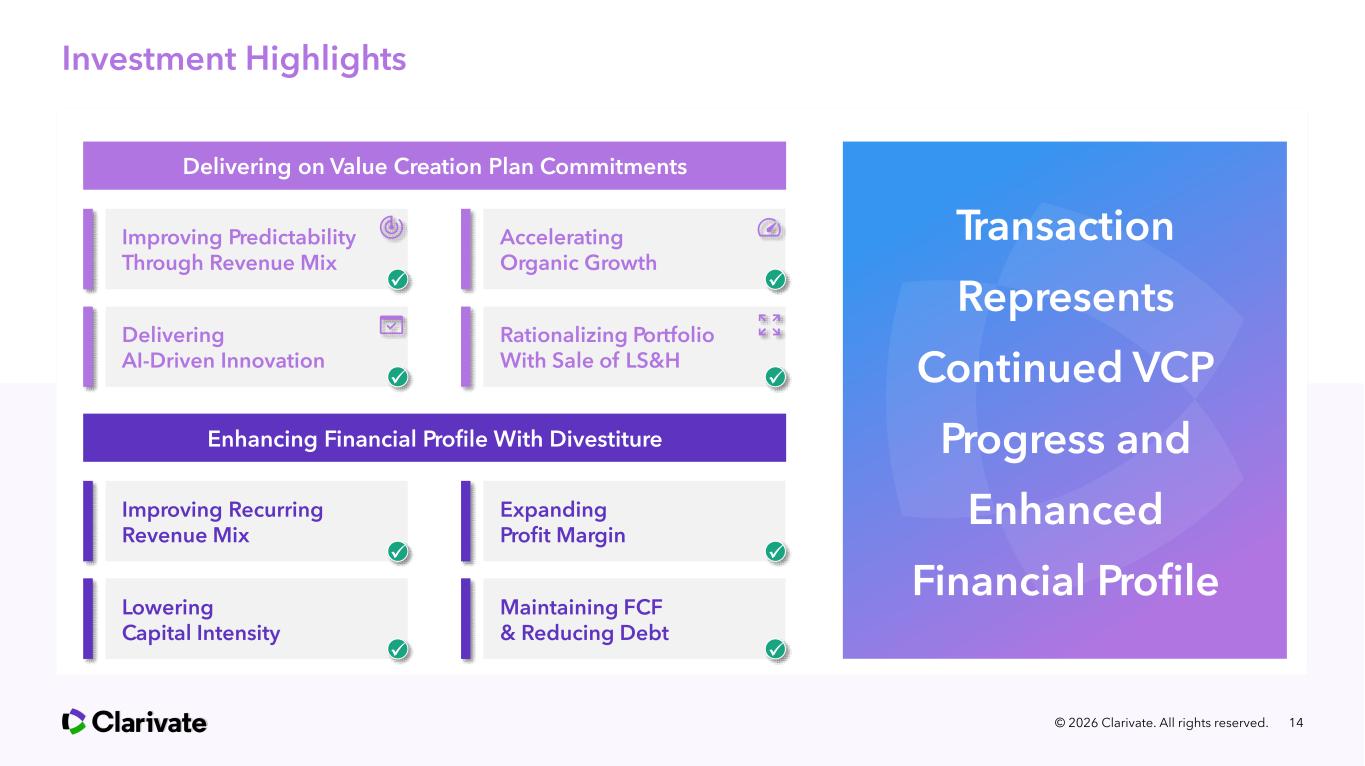
Investment Highlights © 2026 Clarivate. All rights reserved. 14 Transaction Represents Continued VCP Progress and Enhanced Financial Profile Delivering on Value Creation Plan Commitments Improving Predictability Through Revenue Mix Accelerating Organic Growth Delivering AI-Driven Innovation Rationalizing Portfolio With Sale of LS&H Enhancing Financial Profile With Divestiture Improving Recurring Revenue Mix Expanding Profit Margin Lowering Capital Intensity Maintaining FCF & Reducing Debt

Q&A Session

Appendix Full Year Guidance and Presentation of Certain Non-GAAP Financial Measures
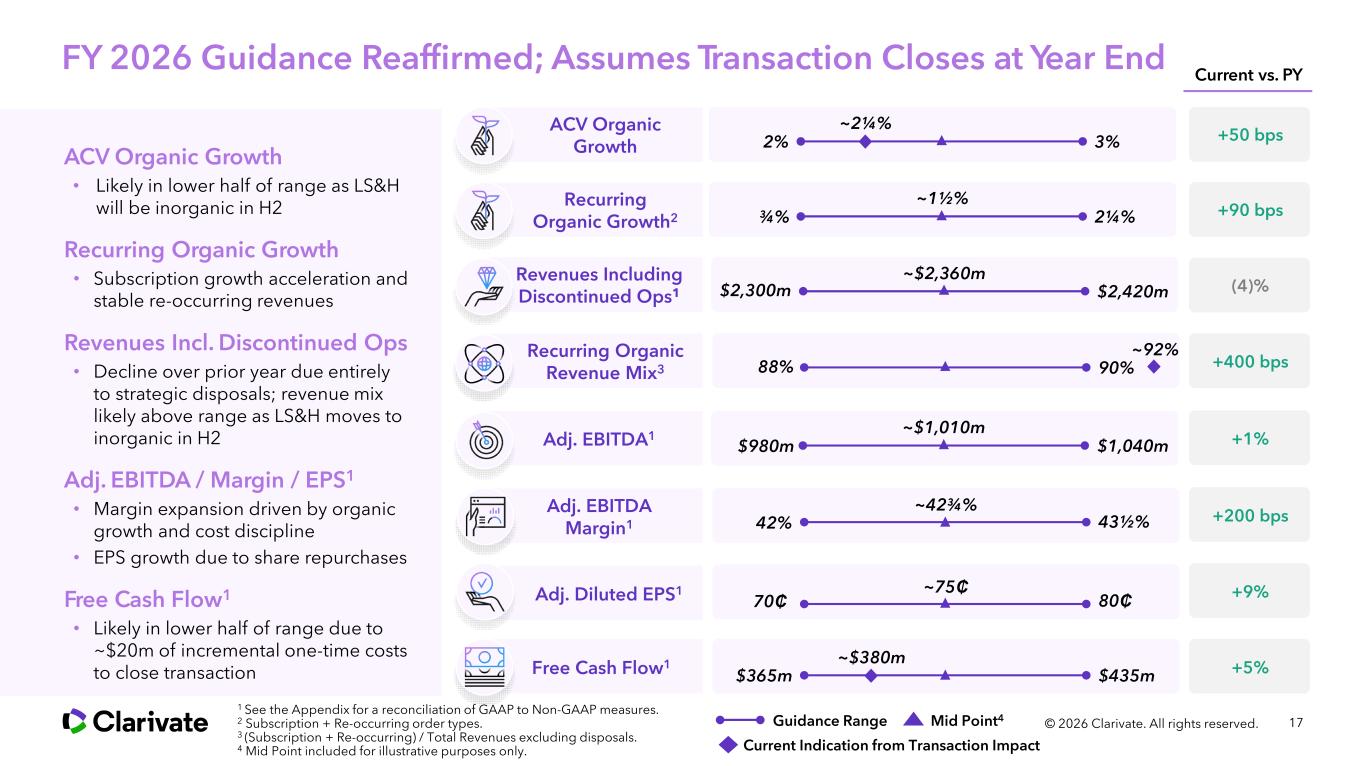
FY 2026 Guidance Reaffirmed; Assumes Transaction Closes at Year End 17© 2026 Clarivate. All rights reserved. ACV Organic Growth • Likely in lower half of range as LS&H will be inorganic in H2 Recurring Organic Growth • Subscription growth acceleration and stable re-occurring revenues Revenues Incl. Discontinued Ops • Decline over prior year due entirely to strategic disposals; revenue mix likely above range as LS&H moves to inorganic in H2 Adj. EBITDA / Margin / EPS1 • Margin expansion driven by organic growth and cost discipline • EPS growth due to share repurchases Free Cash Flow1 • Likely in lower half of range due to ~$20m of incremental one-time costs to close transaction +50 bps ACV Organic Growth 2% 3% ~2¼% Recurring Organic Revenue Mix3 88% 90% ~92% +400 bps Adj. EBITDA1 $980m $1,040m ~$1,010m +1% Adj. EBITDA Margin1 42% 43½% ~42¾% +200 bps Adj. Diluted EPS1 80₵70₵ ~75₵ +9% Free Cash Flow1 $365m $435m ~$380m +5% (4)% Revenues Including Discontinued Ops1 $2,300m $2,420m ~$2,360m +90 bps Recurring Organic Growth2 ¾% 2¼% ~1½% Current vs. PY 1 See the Appendix for a reconciliation of GAAP to Non-GAAP measures. 2 Subscription + Re-occurring order types. 3 (Subscription + Re-occurring) / Total Revenues excluding disposals. 4 Mid Point included for illustrative purposes only. Mid Point4Guidance Range Current Indication from Transaction Impact
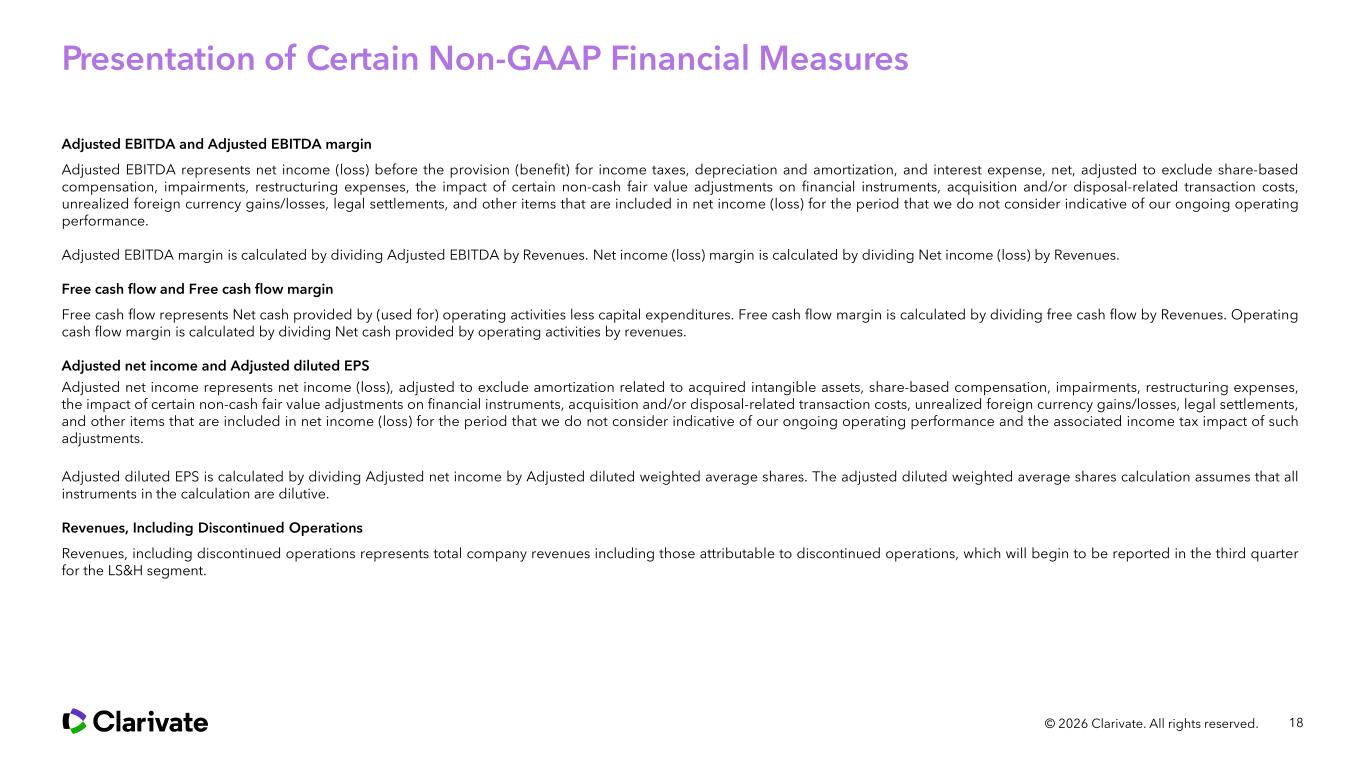
18© 2026 Clarivate. All rights reserved. Presentation of Certain Non-GAAP Financial Measures Adjusted EBITDA and Adjusted EBITDA margin Adjusted EBITDA represents net income (loss) before the provision (benefit) for income taxes, depreciation and amortization, and interest expense, net, adjusted to exclude share-based compensation, impairments, restructuring expenses, the impact of certain non-cash fair value adjustments on financial instruments, acquisition and/or disposal-related transaction costs, unrealized foreign currency gains/losses, legal settlements, and other items that are included in net income (loss) for the period that we do not consider indicative of our ongoing operating performance. Adjusted EBITDA margin is calculated by dividing Adjusted EBITDA by Revenues. Net income (loss) margin is calculated by dividing Net income (loss) by Revenues. Free cash flow and Free cash flow margin Free cash flow represents Net cash provided by (used for) operating activities less capital expenditures. Free cash flow margin is calculated by dividing free cash flow by Revenues. Operating cash flow margin is calculated by dividing Net cash provided by operating activities by revenues. Adjusted net income and Adjusted diluted EPS Adjusted net income represents net income (loss), adjusted to exclude amortization related to acquired intangible assets, share-based compensation, impairments, restructuring expenses, the impact of certain non-cash fair value adjustments on financial instruments, acquisition and/or disposal-related transaction costs, unrealized foreign currency gains/losses, legal settlements, and other items that are included in net income (loss) for the period that we do not consider indicative of our ongoing operating performance and the associated income tax impact of such adjustments. Adjusted diluted EPS is calculated by dividing Adjusted net income by Adjusted diluted weighted average shares. The adjusted diluted weighted average shares calculation assumes that all instruments in the calculation are dilutive. Revenues, Including Discontinued Operations Revenues, including discontinued operations represents total company revenues including those attributable to discontinued operations, which will begin to be reported in the third quarter for the LS&H segment.
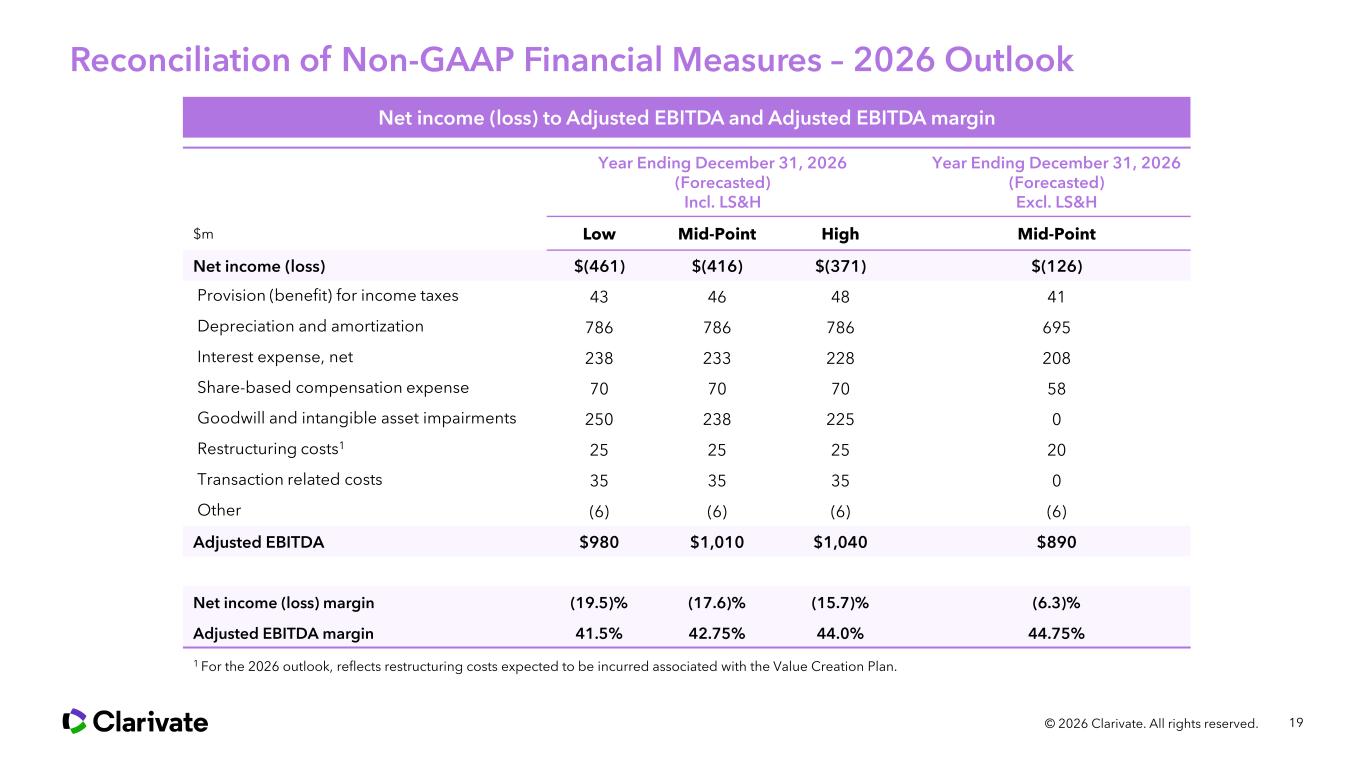
19© 2026 Clarivate. All rights reserved. Year Ending December 31, 2026 (Forecasted) Incl. LS&H Year Ending December 31, 2026 (Forecasted) Excl. LS&H $m Low Mid-Point High Mid-Point Net income (loss) $(461) $(416) $(371) $(126) Provision (benefit) for income taxes 43 46 48 41 Depreciation and amortization 786 786 786 695 Interest expense, net 238 233 228 208 Share-based compensation expense 70 70 70 58 Goodwill and intangible asset impairments 250 238 225 0 Restructuring costs1 25 25 25 20 Transaction related costs 35 35 35 0 Other (6) (6) (6) (6) Adjusted EBITDA $980 $1,010 $1,040 $890 Net income (loss) margin (19.5)% (17.6)% (15.7)% (6.3)% Adjusted EBITDA margin 41.5% 42.75% 44.0% 44.75% 1 For the 2026 outlook, reflects restructuring costs expected to be incurred associated with the Value Creation Plan. Reconciliation of Non-GAAP Financial Measures – 2026 Outlook Net income (loss) to Adjusted EBITDA and Adjusted EBITDA margin
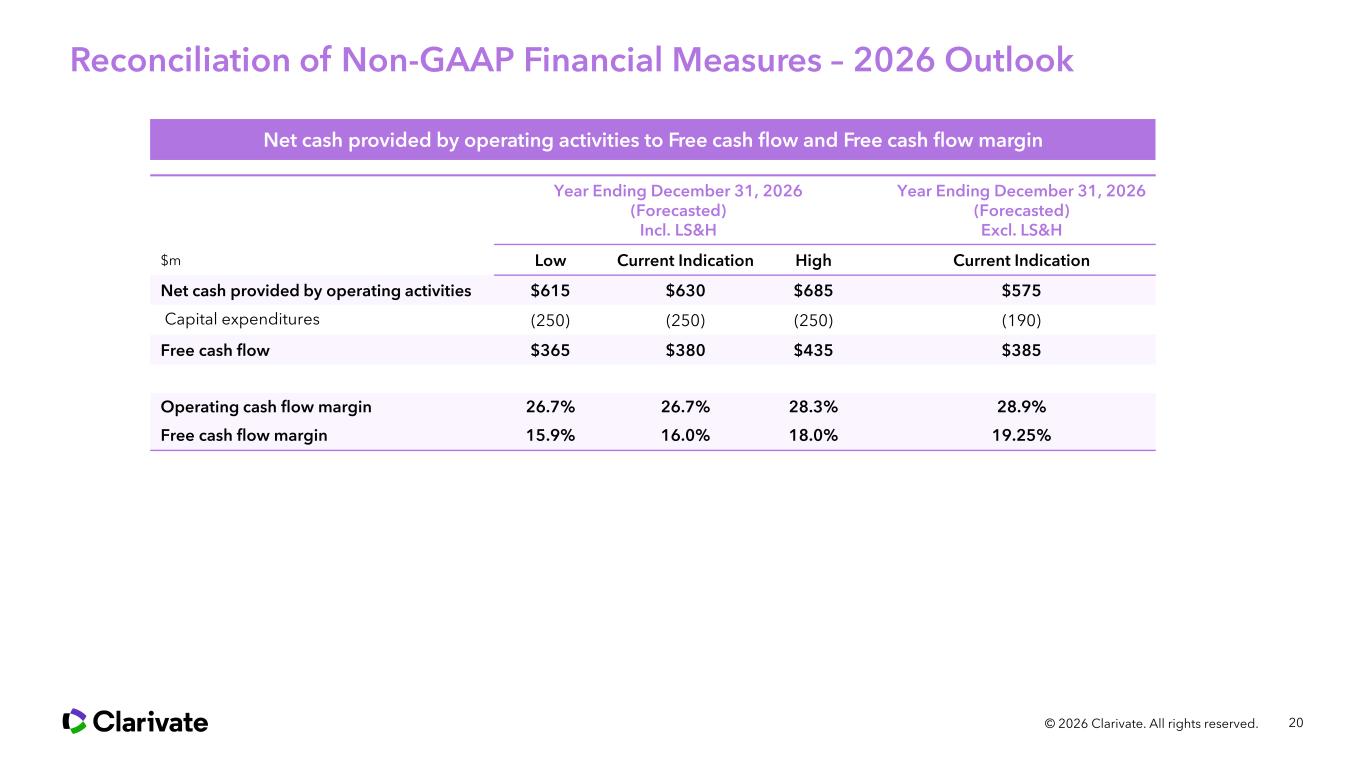
20 Year Ending December 31, 2026 (Forecasted) Incl. LS&H Year Ending December 31, 2026 (Forecasted) Excl. LS&H $m Low Current Indication High Current Indication Net cash provided by operating activities $615 $630 $685 $575 Capital expenditures (250) (250) (250) (190) Free cash flow $365 $380 $435 $385 Operating cash flow margin 26.7% 26.7% 28.3% 28.9% Free cash flow margin 15.9% 16.0% 18.0% 19.25% © 2026 Clarivate. All rights reserved. Reconciliation of Non-GAAP Financial Measures – 2026 Outlook Net cash provided by operating activities to Free cash flow and Free cash flow margin
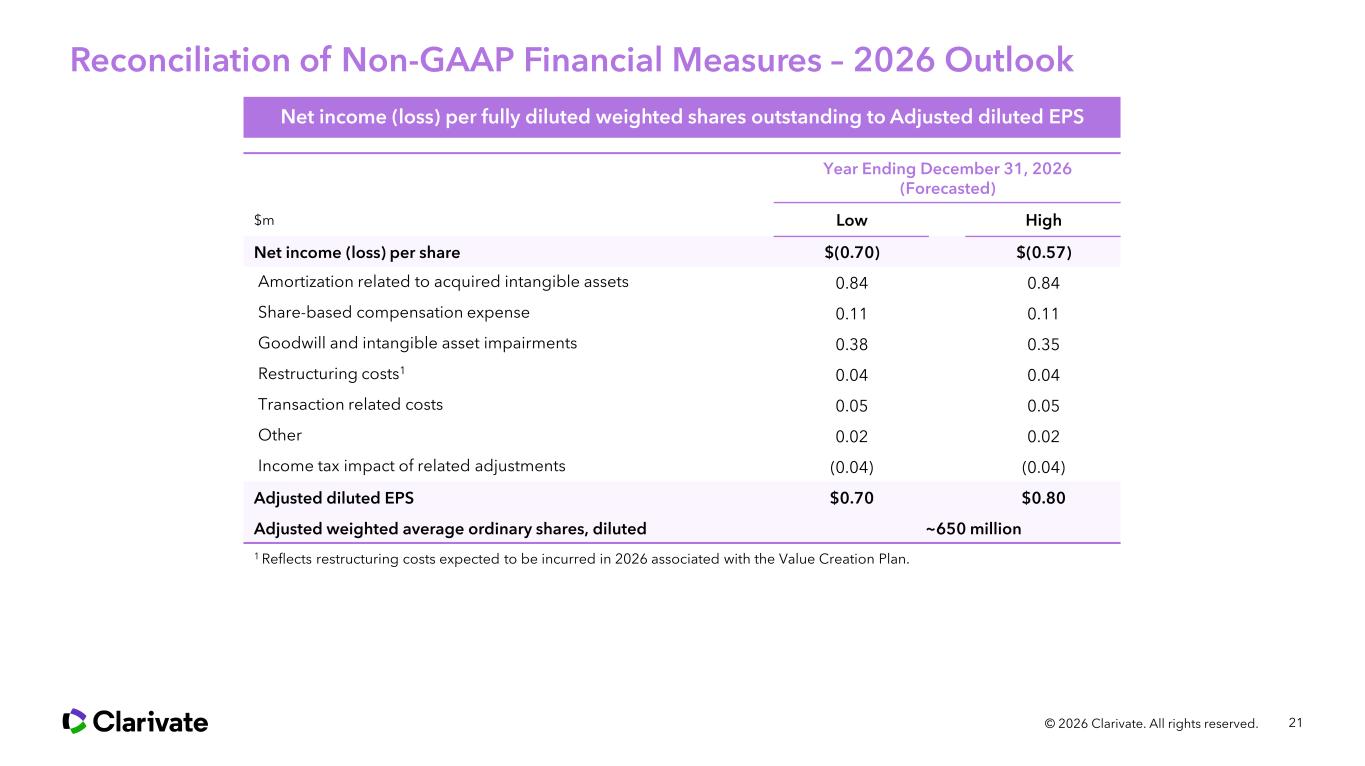
21© 2026 Clarivate. All rights reserved. Year Ending December 31, 2026 (Forecasted) $m Low High Net income (loss) per share $(0.70) $(0.57) Amortization related to acquired intangible assets 0.84 0.84 Share-based compensation expense 0.11 0.11 Goodwill and intangible asset impairments 0.38 0.35 Restructuring costs1 0.04 0.04 Transaction related costs 0.05 0.05 Other 0.02 0.02 Income tax impact of related adjustments (0.04) (0.04) Adjusted diluted EPS $0.70 $0.80 Adjusted weighted average ordinary shares, diluted ~650 million Reconciliation of Non-GAAP Financial Measures – 2026 Outlook 1 Reflects restructuring costs expected to be incurred in 2026 associated with the Value Creation Plan. Net income (loss) per fully diluted weighted shares outstanding to Adjusted diluted EPS
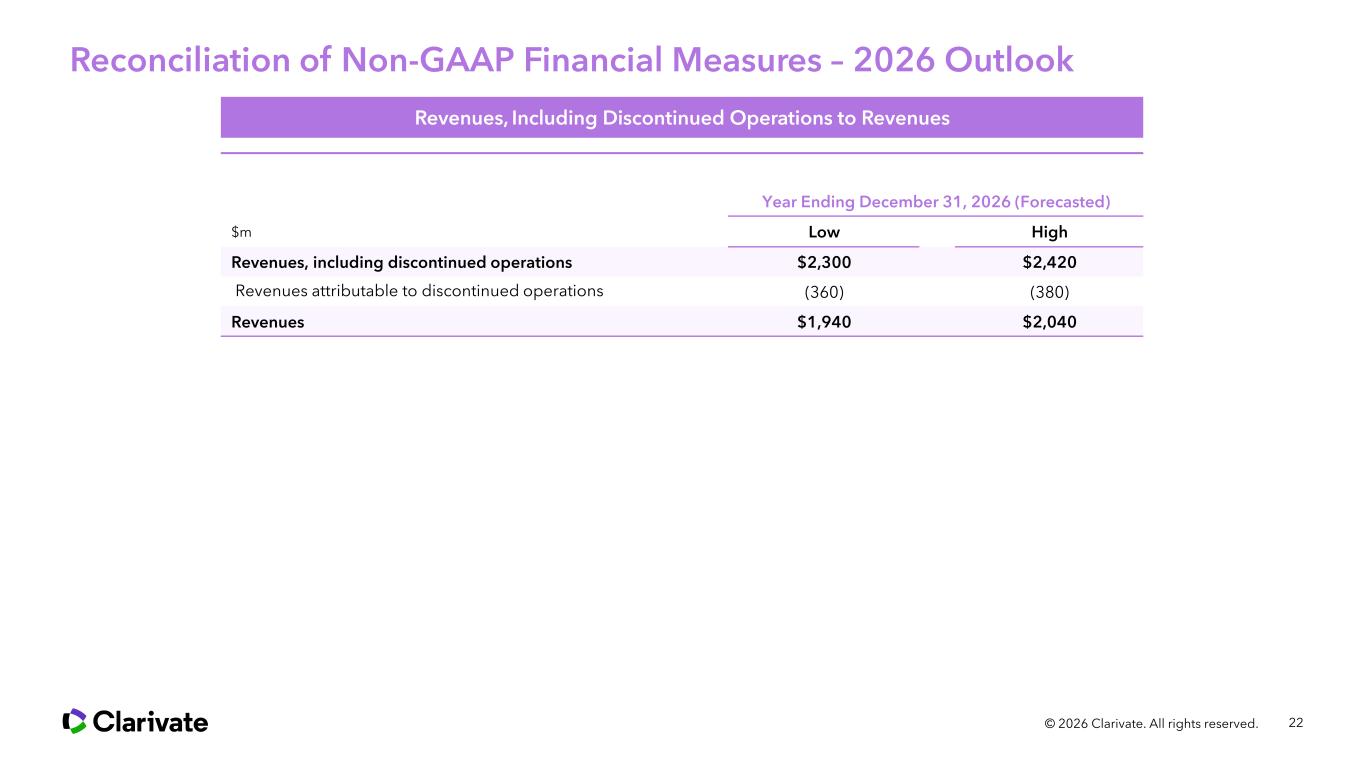
22 Year Ending December 31, 2026 (Forecasted) $m Low High Revenues, including discontinued operations $2,300 $2,420 Revenues attributable to discontinued operations (360) (380) Revenues $1,940 $2,040 © 2026 Clarivate. All rights reserved. Reconciliation of Non-GAAP Financial Measures – 2026 Outlook Revenues, Including Discontinued Operations to Revenues

© 2026 Clarivate Clarivate and its logo, as well as all other trademarks used herein, are trademarks of their respective owners and used under license. About Clarivate Clarivate is a leading global provider of transformative intelligence. We offer enriched data, insights & analytics, workflow solutions and expert services in the areas of Academia & Government, Intellectual Property and Life Sciences & Healthcare. For more information, please visit www.clarivate.com