
Investor Presentation November 2022 August 4, 2026 Third Quarter Fiscal Year 2026 Supplemental Presentation
2 Certain matters discussed in this presentation and the accompanying oral presentation are forward-looking statements within the meaning of the Private Securities Litigation Reform Act of 1995. These forward-looking statements are made based on known events and circumstances at the time of presentation, and as such, are subject to uncertainty and changes in circumstances. These forward-looking statements include, among others, statements regarding BellRing Brands, Inc.’s (“BellRing”) net sales, Adjusted EBITDA and capital expenditure outlook ranges and BellRing’s prospective financial and operating performance and opportunities. These forward- looking statements are sometimes identified from the use of forward-looking words such as “believe,” “should,” “could,” “potential,” “continue,” “expect,” “project,” “estimate,” “predict,” “anticipate,” “aim,” “intend,” “plan,” “forecast,” “target,” “is likely,” “will,” “can,” “may” or “would” or the negative of these terms or similar expressions, and include all statements regarding future performance, events or developments. There are a number of risks and uncertainties that could cause actual results to differ materially from the forward-looking statements made herein. THESE RISKS AND UNCERTAINTIES INCLUDE, BUT ARE NOT LIMITED TO, THE FOLLOWING: • BellRing's dependence on sales from its ready-to-drink (“RTD”) protein shakes; • BellRing’s ability to continue to compete in its product categories and its ability to retain its market position and favorable perceptions of its brands; • disruptions or inefficiencies in BellRing’s supply chain, including as a result of BellRing’s reliance on third-party suppliers or manufacturers for the manufacturing of many of its products, pandemics and other outbreaks of contagious diseases, labor shortages, fires and evacuations related thereto, changes in weather conditions, natural disasters, agricultural diseases and pests and other events beyond BellRing’s control; • BellRing’s dependence on third-party contract manufacturers for the manufacture of most of its products, including one manufacturer for nearly half of its RTD protein shakes; • the ability of BellRing’s third-party contract manufacturers to produce an amount of BellRing’s products that enables BellRing to meet customer and consumer demand for the products; • BellRing’s reliance on a limited number of third-party suppliers to provide certain ingredients and packaging; • significant volatility in the cost or availability of inputs to BellRing’s business (including freight, raw materials, packaging, energy, labor and other supplies), including as a result of tariffs or inflationary pressures; • BellRing’s ability to anticipate and respond to changes in consumer and customer preferences and behaviors and introduce new products; • BellRing’s ability to expand existing market penetration and enter into new markets; • consolidation in BellRing’s distribution channels; • the loss of, a significant reduction of purchases by or the bankruptcy of a major customer; • legal and regulatory factors, such as compliance with existing laws and regulations, as well as new laws and regulations and changes to existing laws and regulations and interpretations thereof, affecting BellRing’s business, including current and future laws and regulations regarding food safety, advertising, labeling, tax matters and environmental matters; • fluctuations in BellRing’s business due to changes in its promotional activities and seasonality; • BellRing’s ability to maintain the net selling prices of its products and manage promotional activities with respect to its products; • BellRing’s ability to obtain additional financing (including both secured and unsecured debt) and its ability to service its outstanding debt (including covenants that restrict the operation of its business); • the ultimate impact litigation or other regulatory matters may have on BellRing; • the accuracy of BellRing’s market data and attributes and related information; • changes in critical accounting estimates; • uncertain or unfavorable economic conditions that limit customer and consumer demand for BellRing’s products or increase its costs; Cautionary Statement Regarding Forward-Looking Statements
Cautionary Statement Regarding Forward-Looking Statements (Cont’d) 3 (CONTINUED FROM PRIOR PAGE): • risks related to BellRing’s ongoing relationship with Post Holdings, Inc. (“Post”) following BellRing’s separation from Post and Post’s distribution of BellRing stock to Post’s shareholders (the “Spin-off”), including BellRing’s obligations under various agreements with Post; • conflicting interests or the appearance of conflicting interests resulting from certain of BellRing’s directors also serving as officers and/or directors of Post; • risks related to the previously completed Spin-off; • risks associated with BellRing’s international business; • BellRing’s ability to protect its intellectual property and other assets and to continue to use third-party intellectual property subject to intellectual property licenses; • costs, business disruptions and reputational damage associated with technology failures, cybersecurity incidents and corruption of BellRing’s data privacy protections; • impairment in the carrying value of goodwill or other intangible assets or other long-lived assets; • BellRing’s ability to identify, complete and integrate or otherwise effectively execute acquisitions or other strategic transactions and effectively manage its growth; • BellRing’s ability to hire and retain talented personnel, employee absenteeism, labor strikes, work stoppages or unionization efforts; • BellRing’s ability to satisfy the requirements of Section 404 of the Sarbanes-Oxley Act of 2002; • significant differences in BellRing’s actual operating results from any guidance BellRing may give regarding its performance; and • other risks and uncertainties described in BellRing’s filings with the Securities and Exchange Commission. You should not rely upon forward-looking statements as predictions of future events. Although BellRing believes that the expectations reflected in the forward-looking statements are reasonable, BellRing cannot guarantee that the future results, levels of activity, performance or events and circumstances reflected in the forward-looking statements will be achieved or occur. Moreover, BellRing undertakes no obligation to update publicly any forward-looking statements for any reason after the date of this presentation to conform these statements to actual results or to changes in its expectations.
Additional Information 4 Prospective Information Any prospective information provided in this presentation regarding BellRing’s future performance, including BellRing’s plans, expectations, estimates and similar statements, represents BellRing management’s estimates as of August 4, 2026 only and are qualified by, and subject to, the assumptions and the other information set forth on the slide captioned “Cautionary Statement Regarding Forward-Looking Statements.” Prospective information provided in this presentation regarding BellRing’s plans, expectations, estimates and similar statements contained in this presentation are based upon a number of assumptions and estimates that, while they may be presented with numerical specificity, are inherently subject to business, economic and competitive uncertainties and contingencies, many of which are beyond BellRing’s control, are based upon specific assumptions with respect to future business decisions, some of which will change, and are necessarily speculative in nature. It can be expected that some or all of the assumptions of the estimates will not materialize or will vary significantly from actual results. Accordingly, the information set forth herein is only an estimate as of August 4, 2026, and actual results will vary from the estimates set forth herein. It should be recognized that the reliability of any forecasted financial data diminishes the farther in the future that the data is forecast. In light of the foregoing, investors should put all prospective information in context and not rely on it. Any failure to successfully implement BellRing’s operating strategy or the occurrence of the events or circumstances set forth under “Cautionary Statement Regarding Forward- Looking Statements” could result in the actual operating results being different than the estimates set forth herein, and such differences may be adverse and material. Market and Industry Data This presentation includes industry and trade association data, forecasts and information that were prepared based, in part, upon data, forecasts and information obtained from independent trade associations, industry publications and surveys and other independent sources available to BellRing. Some data also is based on BellRing management’s good faith estimates, which are derived from management’s knowledge of the industry and from independent sources. These third-party publications and surveys generally state that the information included therein has been obtained from sources believed to be reliable, but that the publications and surveys can give no assurance as to the accuracy or completeness of such information. BellRing has not independently verified any of the data from third-party sources nor has it ascertained the underlying economic assumptions on which such data are based. Similarly, BellRing believes its internal research is reliable, even though such research has not been verified by any independent sources and BellRing cannot guarantee its accuracy or completeness. Trademarks and Service Marks Logos, trademarks, trade names and service marks mentioned in this presentation, including BellRing®, BellRing Brands®, Premier Protein®, Dymatize®, PowerBar®, Premier Protein Clear®, ISO.100®, Elite Mass®, Elite Whey Protein®, Elite 100% Whey®, Super Mass Gainer®, All9 Amino®, Pebbles®, Dunkin®, PREW.O®, Athlete’s BCAA®, PowerBar Clean WheyTM, PowerBar Protein PlusTM, Protein Nut2TM and PowerBar EnergizeTM, are currently the property of, or are under license by, BellRing or one of its subsidiaries. BellRing or one of its subsidiaries owns or has rights to use the trademarks, service marks and trade names that are used in conjunction with the operation of BellRing or its subsidiaries’ businesses. Some of the more important trademarks that BellRing or one of its subsidiaries owns or has rights to use that appear in this presentation may be registered in the United States (“U.S.”) and other jurisdictions. Each logo, trademark, trade name or service mark of any other company appearing in this presentation is owned or used under license by such company.
5 Q3 FY2026 Consumption and Key Metrics Executive Summary ● The wellness category showed continued growth (+8%)1, with ready-to-drink (“RTD”) growth (+11%)1 and ready-to-mix (“RTM”) growth healthy. o 17% of the RTD category volumes were sold on price reduction, relatively inline with Q3 historical norms. ● Premier Protein RTD consumption grew (+6%)2 vs. Q3 FY2025 driven primarily by distribution growth. o Consumption grew 5%2 when excluding the timing shift of an eCommerce promotion. Growth excluding club and this promotional shift remained strong (+16%)2. o Strong distribution gains continued in Q3 FY2026, with TDP growth +27%1 vs. Q3 FY2025. o RTD household penetration (21.9%)3 grew vs prior year; Premier Protein’s household penetration and repeat rate remained number one in the RTD category. o Premier Protein’s market share continued to lead the RTD and wellness category, finishing the quarter at 21.9%1 in the RTD category. ● Premier Protein powders contracted (-4%2) vs. prior year driven by reduced distribution and elasticities due to inflation- driven price increase. ● Dymatize remained one of the strongest brands in the sports performance category with velocities in the top tertile of key customers. o Consumption was up +3%2 vs Q3 FY2025 with RTD shakes and eCommerce driving growth. Notes: 1. U.S. Circana Multi Outlet+ with Convenience 13 weeks ended June 28, 2026. 2. U.S. Circana Multi Outlet+ with Convenience 13 weeks ended June 28, 2026, and management estimates of untracked channels for the 13 weeks ended June 28, 2026. 3. Numerator Total. U.S. Panel, 52 weeks ending June 28, 2026.
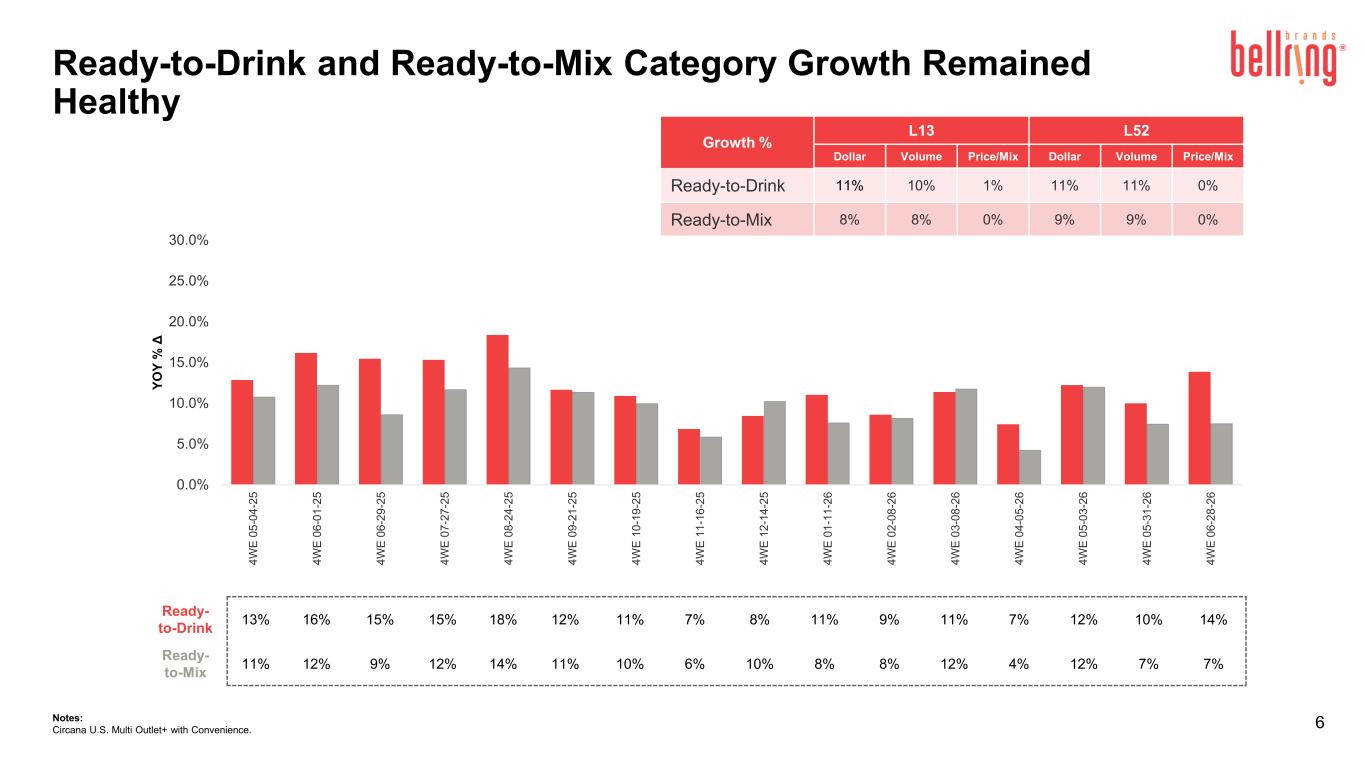
6 Ready-to-Drink and Ready-to-Mix Category Growth Remained Healthy Notes: Circana U.S. Multi Outlet+ with Convenience. Ready- to-Drink 13% 16% 15% 15% 18% 12% 11% 7% 8% 11% 9% 11% 7% 12% 10% 14% Ready- to-Mix 11% 12% 9% 12% 14% 11% 10% 6% 10% 8% 8% 12% 4% 12% 7% 7% 0.0% 5.0% 10.0% 15.0% 20.0% 25.0% 30.0% 4 W E 0 5 -0 4 -2 5 4 W E 0 6 -0 1 -2 5 4 W E 0 6 -2 9 -2 5 4 W E 0 7 -2 7 -2 5 4 W E 0 8 -2 4 -2 5 4 W E 0 9 -2 1 -2 5 4 W E 1 0 -1 9 -2 5 4 W E 1 1 -1 6 -2 5 4 W E 1 2 -1 4 -2 5 4 W E 0 1 -1 1 -2 6 4 W E 0 2 -0 8 -2 6 4 W E 0 3 -0 8 -2 6 4 W E 0 4 -0 5 -2 6 4 W E 0 5 -0 3 -2 6 4 W E 0 5 -3 1 -2 6 4 W E 0 6 -2 8 -2 6 Y O Y % Δ Growth % L13 L52 Dollar Volume Price/Mix Dollar Volume Price/Mix Ready-to-Drink 11% 10% 1% 11% 11% 0% Ready-to-Mix 8% 8% 0% 9% 9% 0%
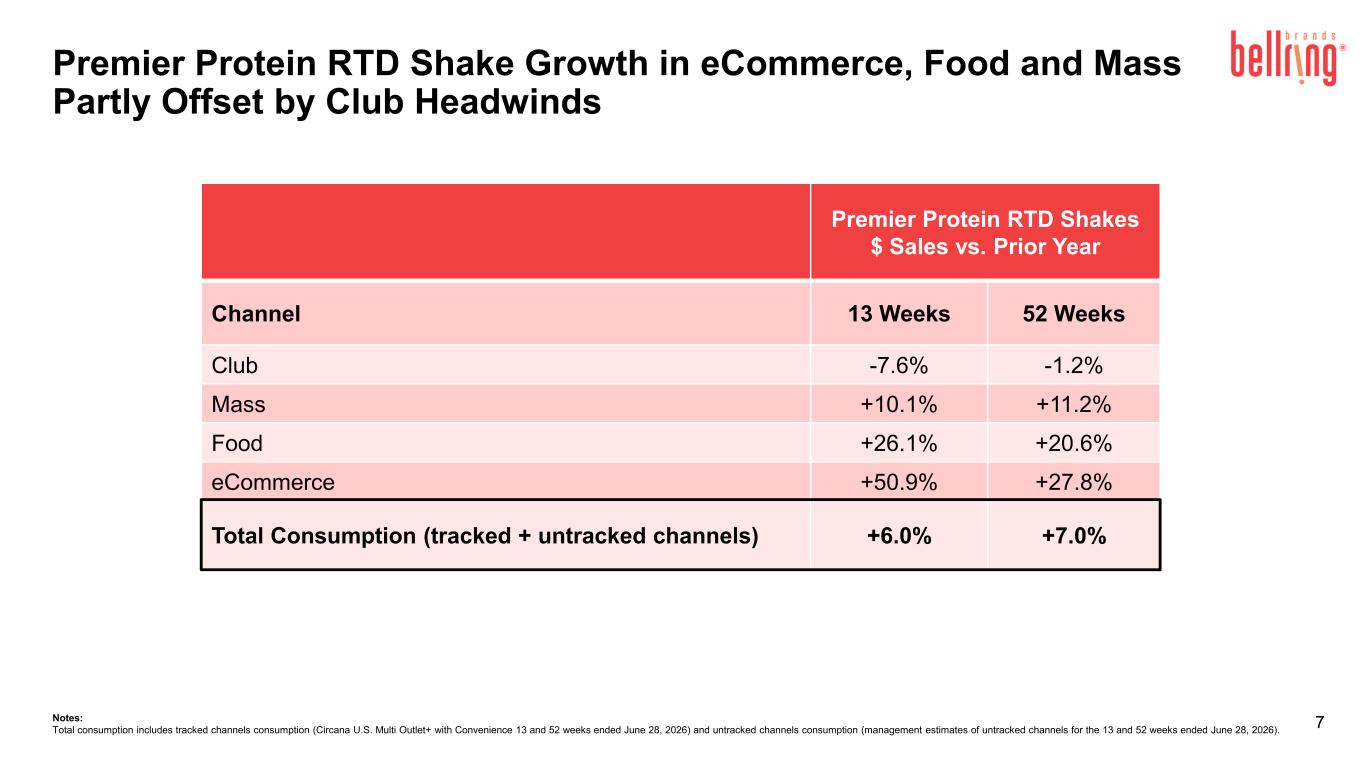
7 Premier Protein RTD Shakes $ Sales vs. Prior Year Channel 13 Weeks 52 Weeks Club -7.6% -1.2% Mass +10.1% +11.2% Food +26.1% +20.6% eCommerce +50.9% +27.8% Total Consumption (tracked + untracked channels) +6.0% +7.0% Notes: Total consumption includes tracked channels consumption (Circana U.S. Multi Outlet+ with Convenience 13 and 52 weeks ended June 28, 2026) and untracked channels consumption (management estimates of untracked channels for the 13 and 52 weeks ended June 28, 2026). Premier Protein RTD Shake Growth in eCommerce, Food and Mass Partly Offset by Club Headwinds
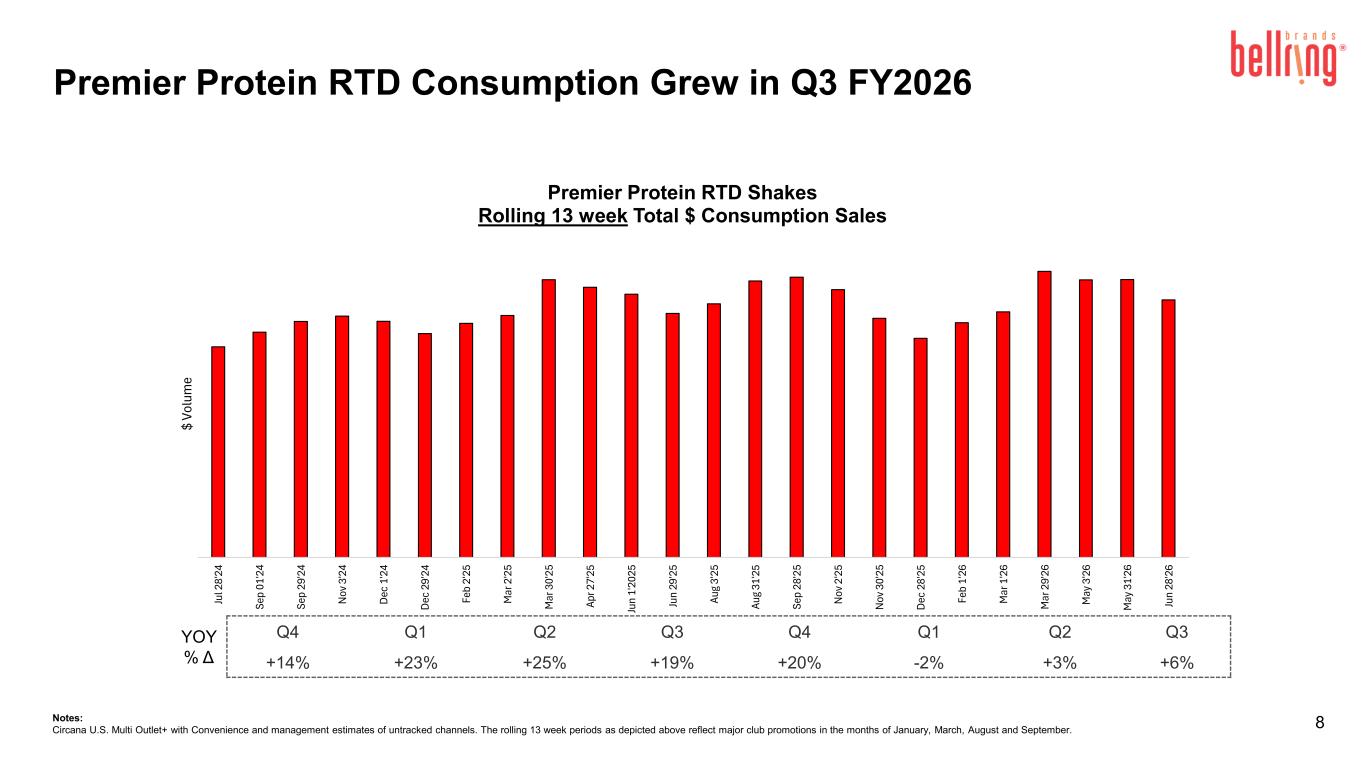
Ju l 2 8' 24 Se p 01 '2 4 Se p 29 '2 4 N ov 3 '2 4 D ec 1 '2 4 D ec 2 9' 24 Fe b 2' 25 M ar 2 '2 5 M ar 3 0' 25 Ap r 2 7' 25 Ju n 1' 20 25 Ju n 29 '2 5 Au g 3' 25 Au g 31 '2 5 Se p 28 '2 5 N ov 2 '2 5 N ov 3 0' 25 D ec 2 8' 25 Fe b 1' 26 M ar 1 '2 6 M ar 2 9' 26 M ay 3 '2 6 M ay 3 1' 26 Ju n 28 '2 6 $ Vo lu m e Premier Protein RTD Shakes Rolling 13 week Total $ Consumption Sales 8Notes: Circana U.S. Multi Outlet+ with Convenience and management estimates of untracked channels. The rolling 13 week periods as depicted above reflect major club promotions in the months of January, March, August and September. Q4 Q1 Q2 Q3 Q4 Q1 Q2 Q3 +14% +23% +25% +19% +20% -2% +3% +6% YOY % Δ Premier Protein RTD Consumption Grew in Q3 FY2026
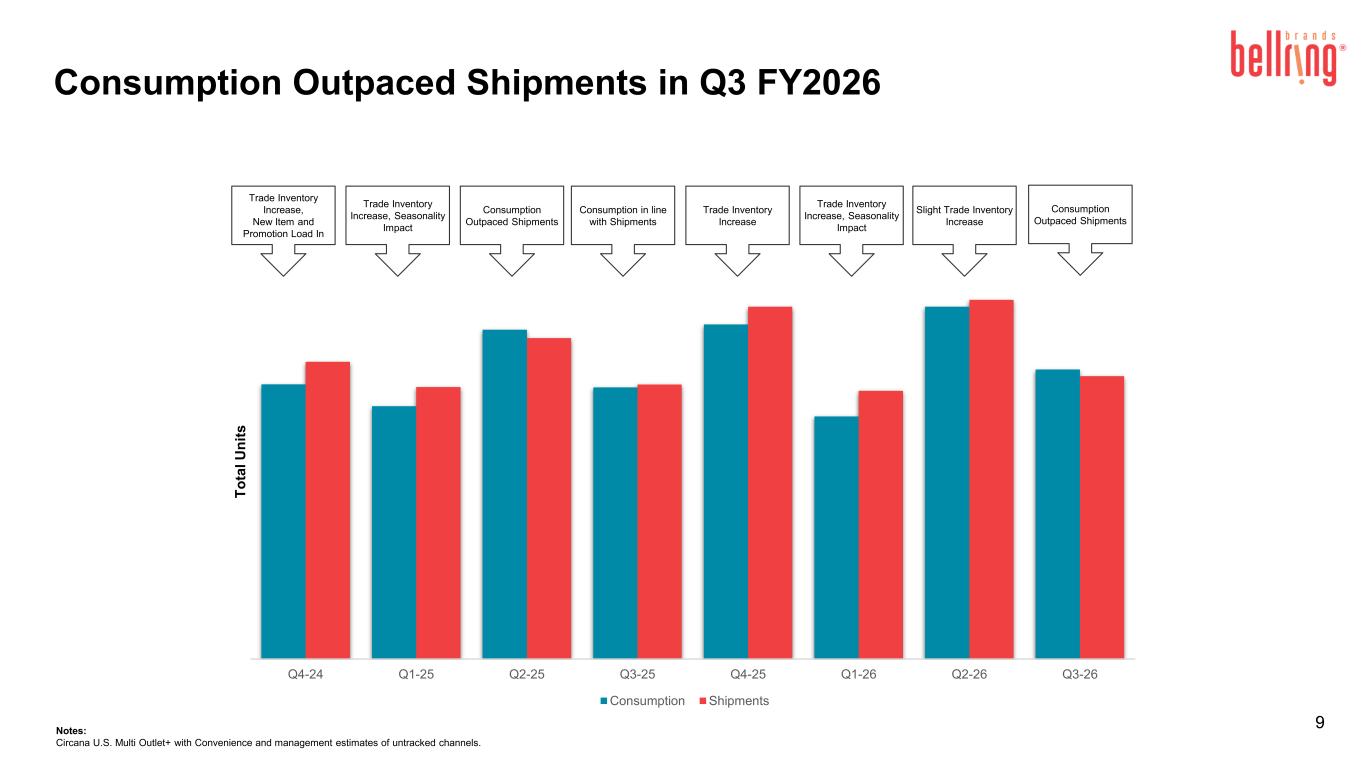
9 Consumption Outpaced Shipments Trade Inventory Increase, New Item and Promotion Load In Consumption Outpaced Shipments Trade Inventory Increase Trade Inventory Increase, Seasonality Impact Consumption in line with Shipments Trade Inventory Increase, Seasonality Impact Notes: Circana U.S. Multi Outlet+ with Convenience and management estimates of untracked channels. Slight Trade Inventory Increase Consumption Outpaced Shipments in Q3 FY2026 Q4-24 Q1-25 Q2-25 Q3-25 Q4-25 Q1-26 Q2-26 Q3-26 T o ta l U n it s Consumption Shipments
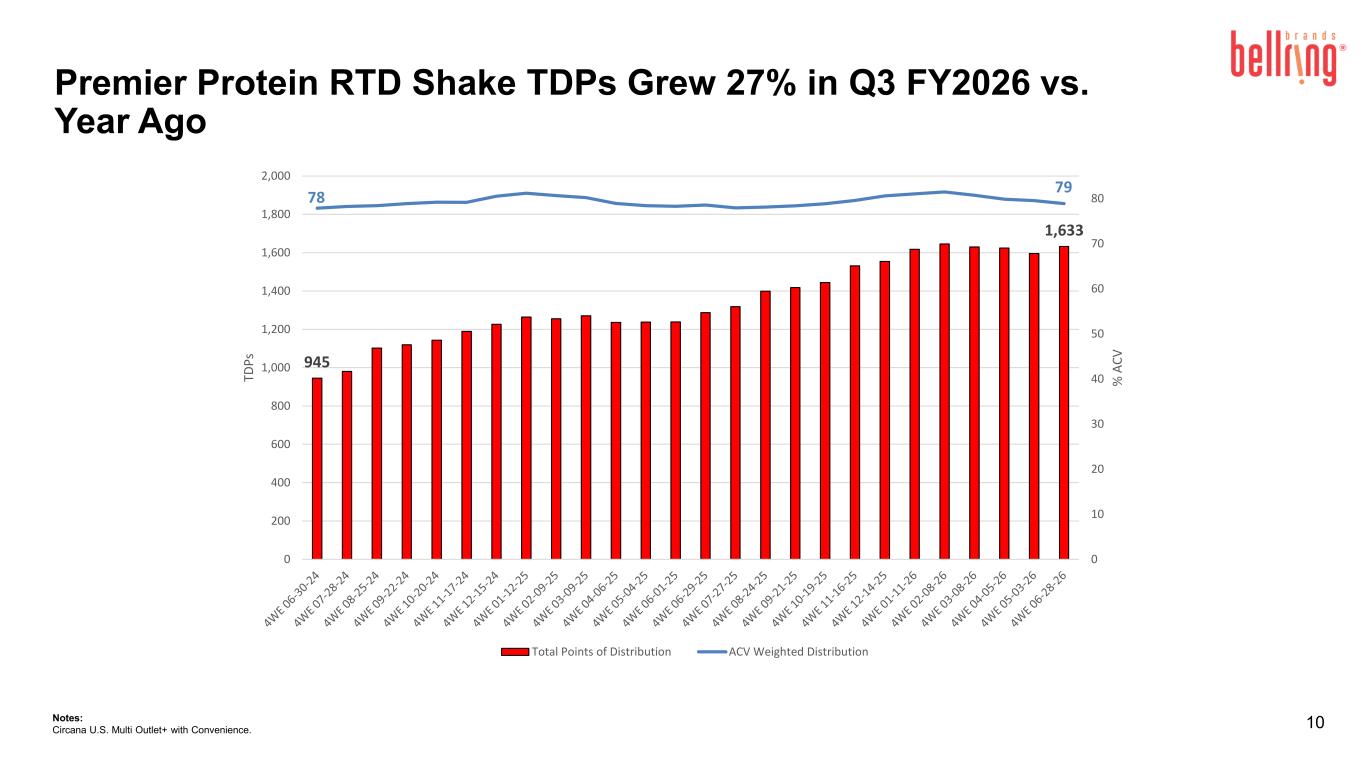
10Notes: Circana U.S. Multi Outlet+ with Convenience. 945 1,633 78 79 0 10 20 30 40 50 60 70 80 0 200 400 600 800 1,000 1,200 1,400 1,600 1,800 2,000 % A C V TD P s Total Points of Distribution ACV Weighted Distribution Premier Protein RTD Shake TDPs Grew 27% in Q3 FY2026 vs. Year Ago
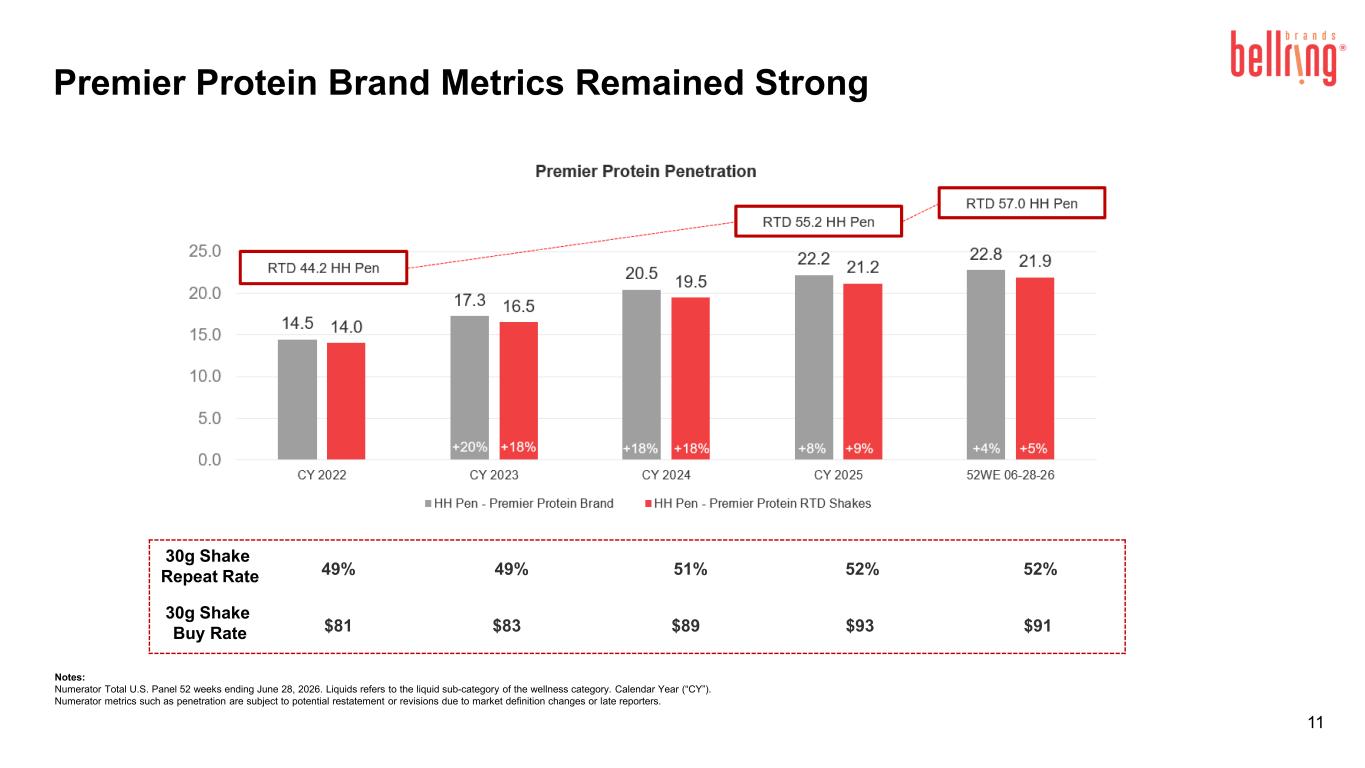
11 +17%+17%+17%+19% +9%+9% +8%+6% Notes: Numerator Total U.S. Panel 52 weeks ending June 28, 2026. Liquids refers to the liquid sub-category of the wellness category. Calendar Year (“CY”). Numerator metrics such as penetration are subject to potential restatement or revisions due to market definition changes or late reporters. 30g Shake Repeat Rate 49% 49% 51% 52% 52% 30g Shake Buy Rate $81 $83 $89 $93 $91 Premier Protein Brand Metrics Remained Strong
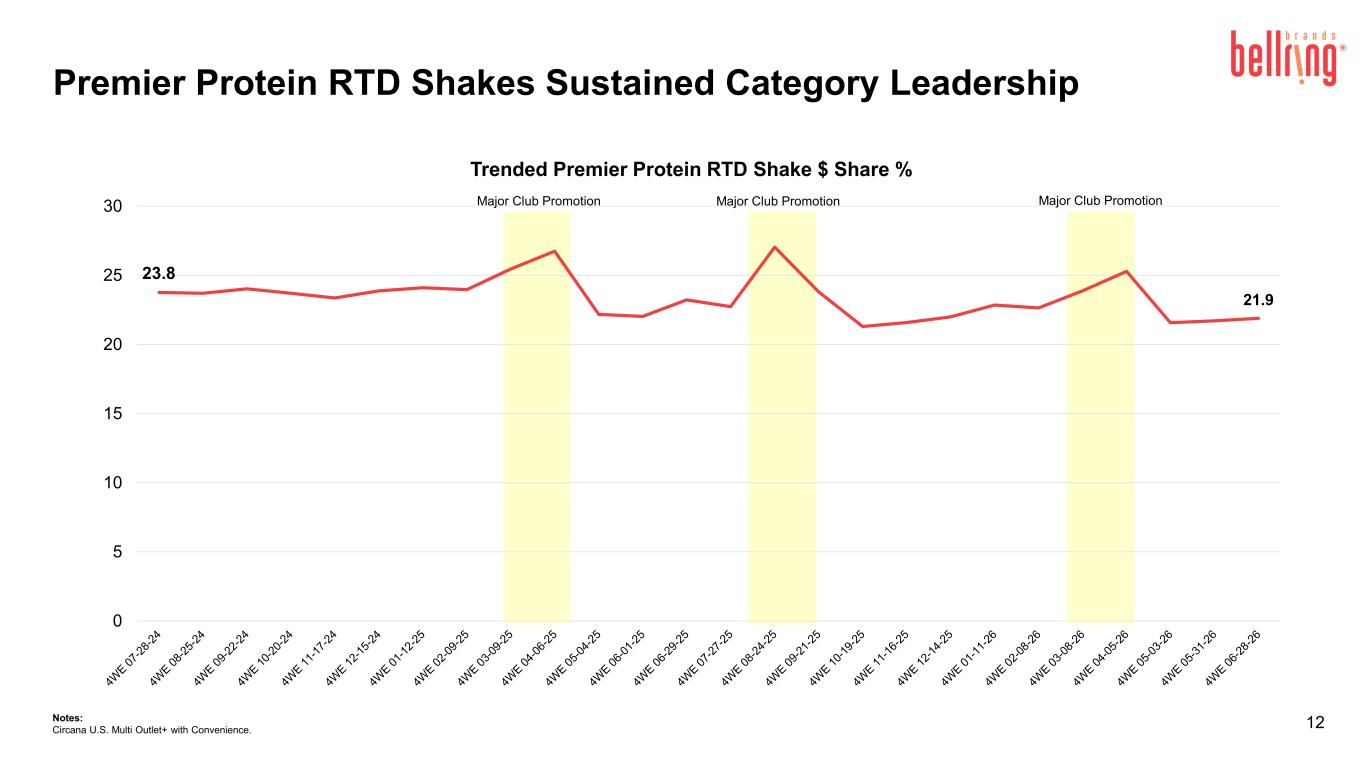
23.8 21.9 0 5 10 15 20 25 30 Trended Premier Protein RTD Shake $ Share % 12 Major Club Promotion Major Club PromotionMajor Club Promotion Notes: Circana U.S. Multi Outlet+ with Convenience. Premier Protein RTD Shakes Sustained Category Leadership
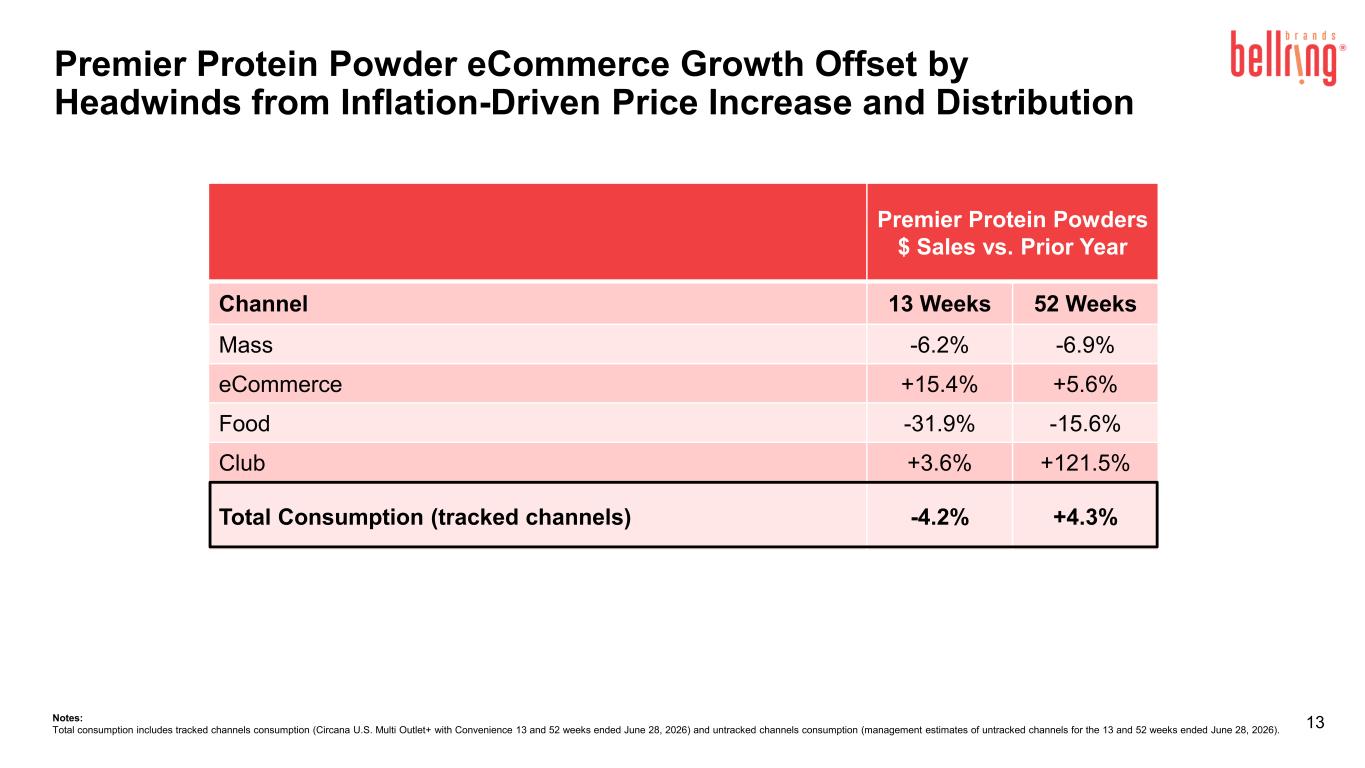
13 Premier Protein Powders $ Sales vs. Prior Year Channel 13 Weeks 52 Weeks Mass -6.2% -6.9% eCommerce +15.4% +5.6% Food -31.9% -15.6% Club +3.6% +121.5% Total Consumption (tracked channels) -4.2% +4.3% Premier Protein Powder eCommerce Growth Offset by Headwinds from Inflation-Driven Price Increase and Distribution Notes: Total consumption includes tracked channels consumption (Circana U.S. Multi Outlet+ with Convenience 13 and 52 weeks ended June 28, 2026) and untracked channels consumption (management estimates of untracked channels for the 13 and 52 weeks ended June 28, 2026).
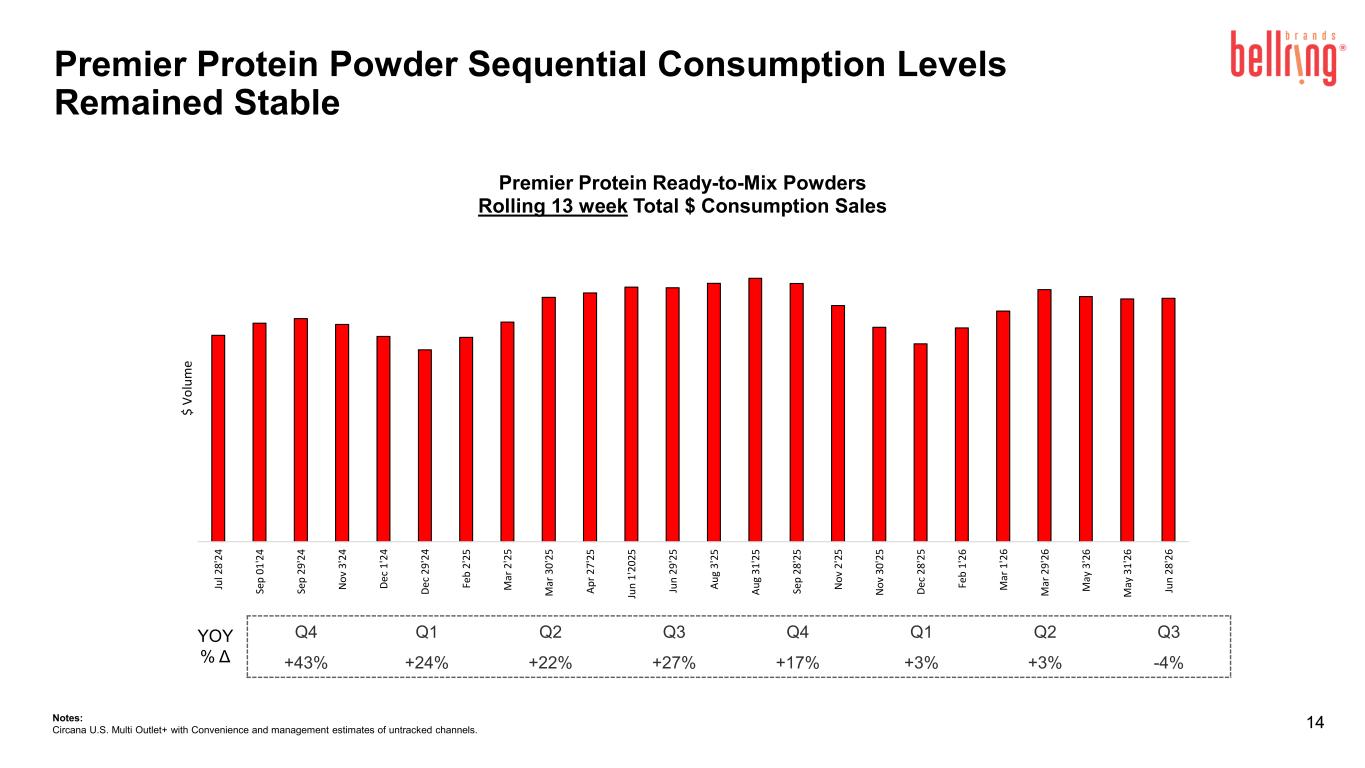
Premier Protein Powder Sequential Consumption Levels Remained Stable 14 Q4 Q1 Q2 Q3 Q4 Q1 Q2 Q3 +43% +24% +22% +27% +17% +3% +3% -4% YOY % Δ Ju l 2 8 '2 4 Se p 0 1 '2 4 Se p 2 9 '2 4 N o v 3 '2 4 D ec 1 '2 4 D ec 2 9 '2 4 Fe b 2 '2 5 M ar 2 '2 5 M ar 3 0 '2 5 A p r 2 7 '2 5 Ju n 1 '2 0 25 Ju n 2 9 '2 5 A u g 3 '2 5 A u g 3 1 '2 5 Se p 2 8 '2 5 N o v 2 '2 5 N o v 3 0 '2 5 D ec 2 8 '2 5 Fe b 1 '2 6 M ar 1 '2 6 M ar 2 9 '2 6 M ay 3 '2 6 M ay 3 1 '2 6 Ju n 2 8 '2 6 $ V o lu m e Premier Protein Ready-to-Mix Powders Rolling 13 week Total $ Consumption Sales Notes: Circana U.S. Multi Outlet+ with Convenience and management estimates of untracked channels.
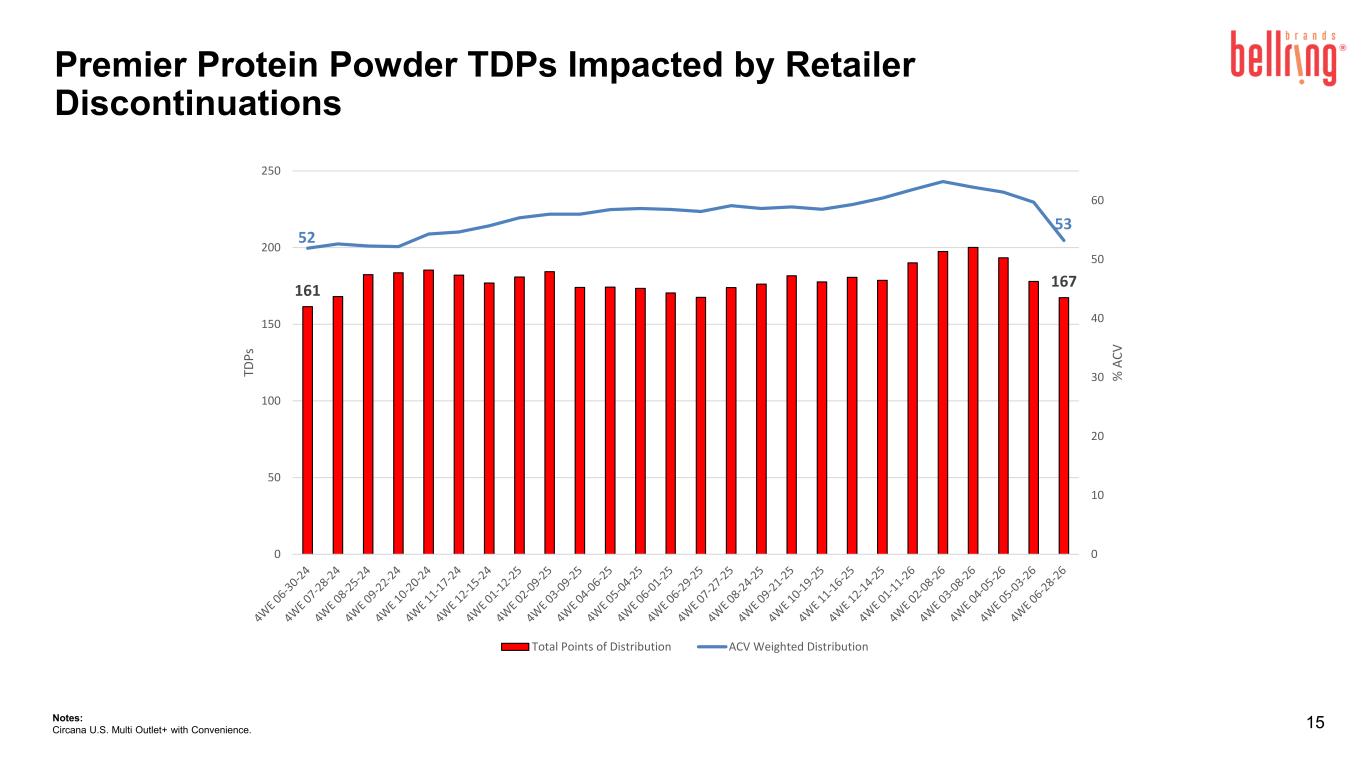
15Notes: Circana U.S. Multi Outlet+ with Convenience. 161 167 52 53 0 10 20 30 40 50 60 0 50 100 150 200 250 % A C V TD P s Total Points of Distribution ACV Weighted Distribution Premier Protein Powder TDPs Impacted by Retailer Discontinuations
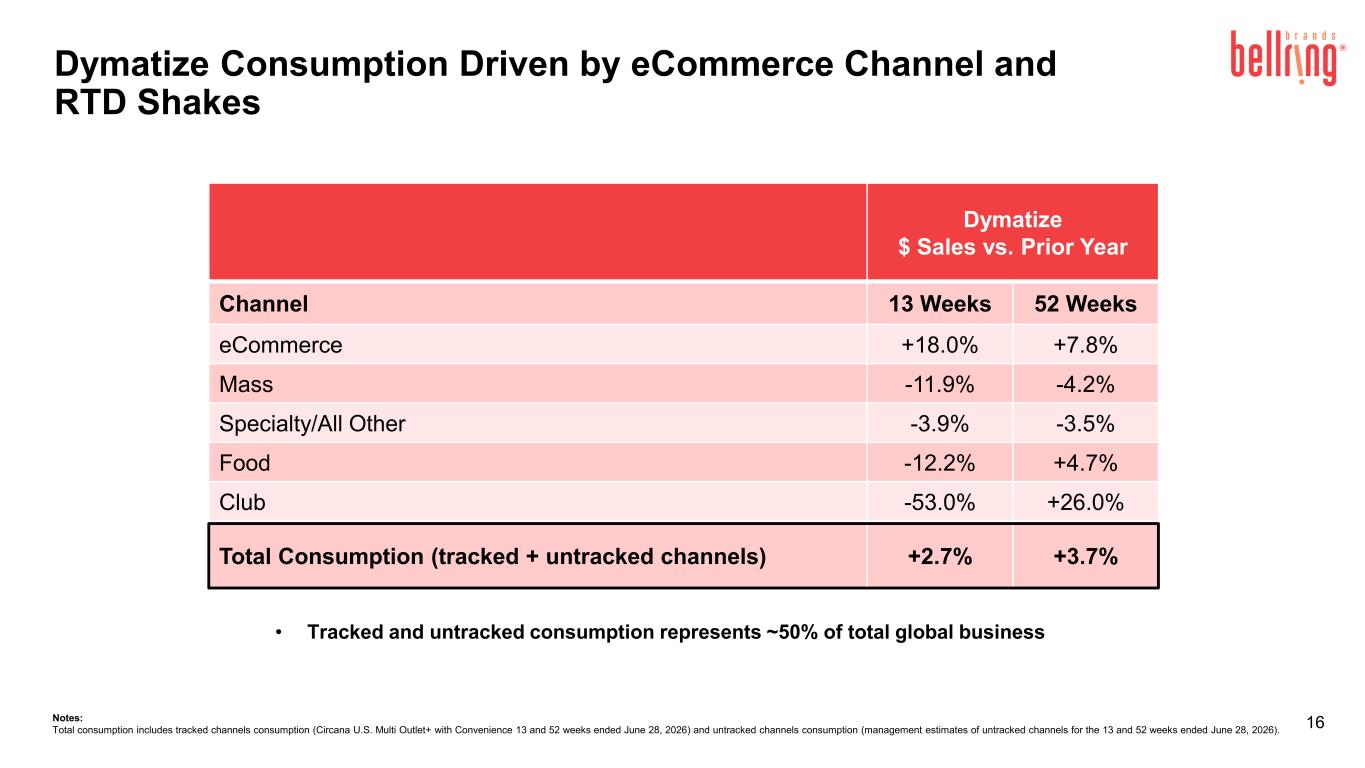
16 • Tracked and untracked consumption represents ~50% of total global business Dymatize $ Sales vs. Prior Year Channel 13 Weeks 52 Weeks eCommerce +18.0% +7.8% Mass -11.9% -4.2% Specialty/All Other -3.9% -3.5% Food -12.2% +4.7% Club -53.0% +26.0% Total Consumption (tracked + untracked channels) +2.7% +3.7% Notes: Total consumption includes tracked channels consumption (Circana U.S. Multi Outlet+ with Convenience 13 and 52 weeks ended June 28, 2026) and untracked channels consumption (management estimates of untracked channels for the 13 and 52 weeks ended June 28, 2026). Dymatize Consumption Driven by eCommerce Channel and RTD Shakes
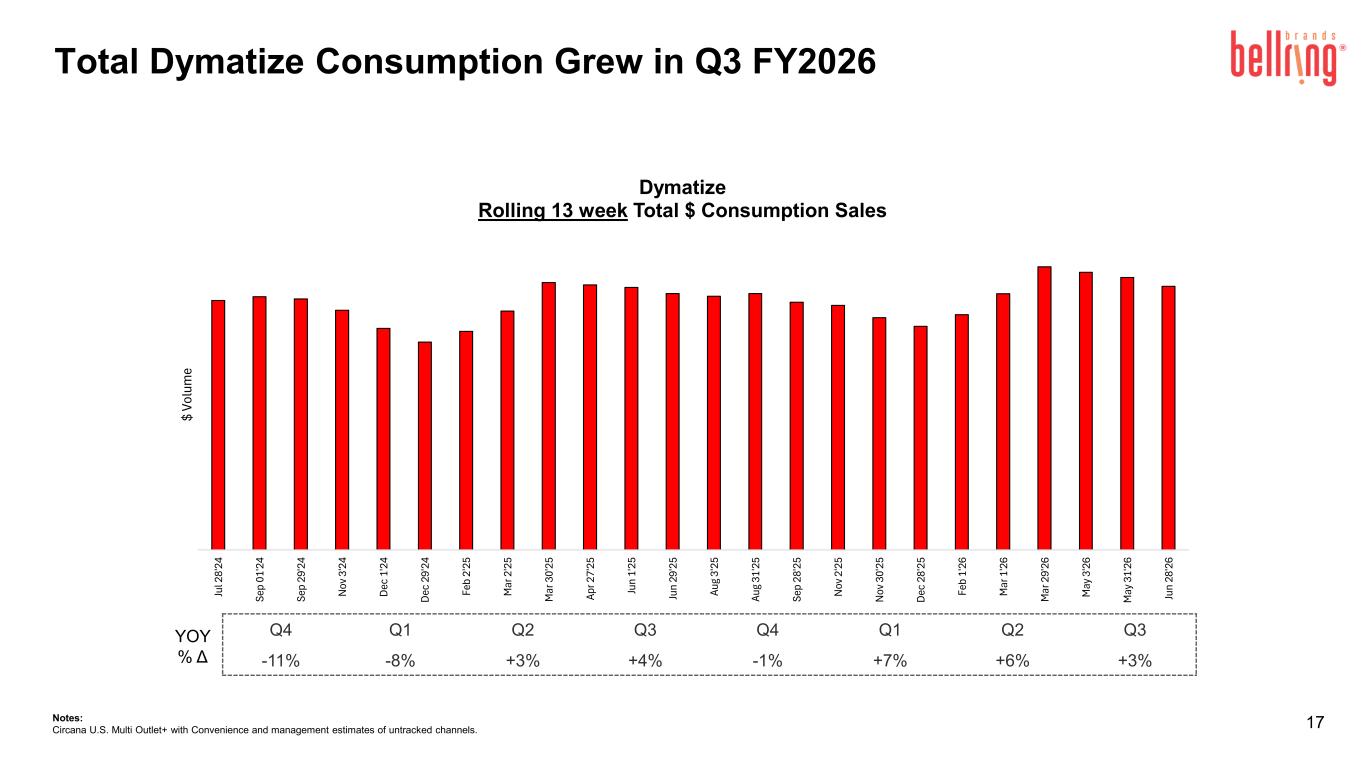
17Notes: Circana U.S. Multi Outlet+ with Convenience and management estimates of untracked channels. YOY % Δ Ju l 2 8' 24 Se p 01 '2 4 Se p 29 '2 4 N ov 3 '2 4 D ec 1 '2 4 D ec 2 9' 24 Fe b 2' 25 M ar 2 '2 5 M ar 3 0' 25 Ap r 2 7' 25 Ju n 1' 25 Ju n 29 '2 5 Au g 3' 25 Au g 31 '2 5 Se p 28 '2 5 N ov 2 '2 5 N ov 3 0' 25 D ec 2 8' 25 Fe b 1' 26 M ar 1 '2 6 M ar 2 9' 26 M ay 3 '2 6 M ay 3 1' 26 Ju n 28 '2 6 $ Vo lu m e Dymatize Rolling 13 week Total $ Consumption Sales Q4 Q1 Q2 Q3 Q4 Q1 Q2 Q3 -11% -8% +3% +4% -1% +7% +6% +3% Total Dymatize Consumption Grew in Q3 FY2026
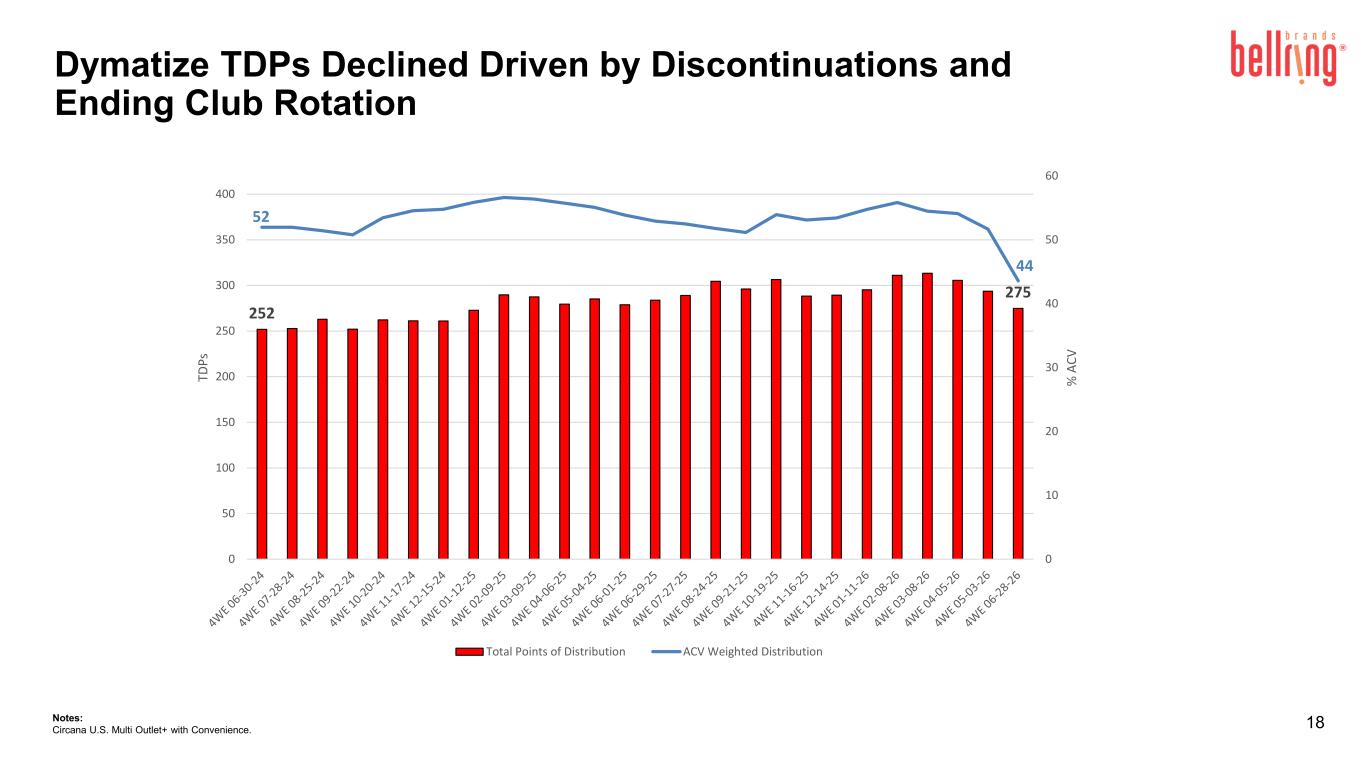
18Notes: Circana U.S. Multi Outlet+ with Convenience. 252 275 52 44 0 10 20 30 40 50 60 0 50 100 150 200 250 300 350 400 % A C V TD P s Total Points of Distribution ACV Weighted Distribution Dymatize TDPs Declined Driven by Discontinuations and Ending Club Rotation
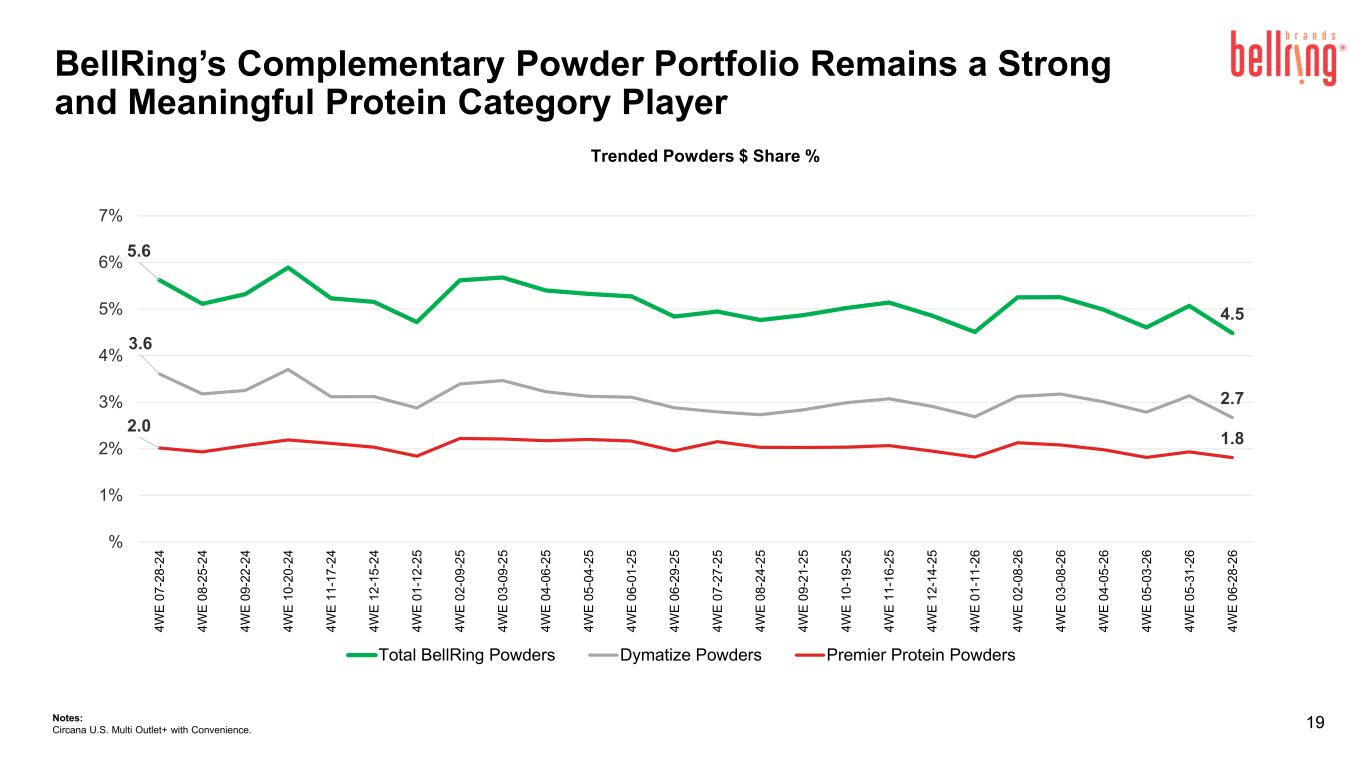
19 Trended Powders $ Share % Notes: Circana U.S. Multi Outlet+ with Convenience. 5.6 4.5 3.6 2.7 2.0 1.8 % 1% 2% 3% 4% 5% 6% 7% 4 W E 0 7 -2 8 -2 4 4 W E 0 8 -2 5 -2 4 4 W E 0 9 -2 2 -2 4 4 W E 1 0 -2 0 -2 4 4 W E 1 1 -1 7 -2 4 4 W E 1 2 -1 5 -2 4 4 W E 0 1 -1 2 -2 5 4 W E 0 2 -0 9 -2 5 4 W E 0 3 -0 9 -2 5 4 W E 0 4 -0 6 -2 5 4 W E 0 5 -0 4 -2 5 4 W E 0 6 -0 1 -2 5 4 W E 0 6 -2 9 -2 5 4 W E 0 7 -2 7 -2 5 4 W E 0 8 -2 4 -2 5 4 W E 0 9 -2 1 -2 5 4 W E 1 0 -1 9 -2 5 4 W E 1 1 -1 6 -2 5 4 W E 1 2 -1 4 -2 5 4 W E 0 1 -1 1 -2 6 4 W E 0 2 -0 8 -2 6 4 W E 0 3 -0 8 -2 6 4 W E 0 4 -0 5 -2 6 4 W E 0 5 -0 3 -2 6 4 W E 0 5 -3 1 -2 6 4 W E 0 6 -2 8 -2 6 Total BellRing Powders Dymatize Powders Premier Protein Powders BellRing’s Complementary Powder Portfolio Remains a Strong and Meaningful Protein Category Player