|
|
|
Nuveen Interval Fund
| Fund Name | Class A1 | Class A2 | Class I | |||||||||
| Nuveen Enhanced High Yield Municipal Bond Fund |
NHYEX | NHYAX | NMSSX | |||||||||
Annual
Report
UNITED STATES
SECURITIES AND EXCHANGE COMMISSION
Washington, D.C. 20549
FORM N-CSR
CERTIFIED SHAREHOLDER REPORT OF REGISTERED
MANAGEMENT INVESTMENT COMPANIES
| Investment Company Act file number | 811-23445 |
Nuveen Enhanced High Yield Municipal Bond Fund
(Exact name of registrant as specified in charter)
Nuveen Investments
333 West Wacker Drive
Chicago, Illinois 60606
(Address of principal executive offices) (Zip code)
Mark L. Winget
Vice President and Secretary
333 West Wacker Drive
Chicago, Illinois 60606
(Name and address of agent for service)
Registrant’s telephone number, including area code: (800) 257-8787
Date of fiscal year end: March 31
Date of reporting period: March 31, 2025
| Item 1. | Reports to Stockholders. |
|
|
|
Nuveen Interval Fund
| Fund Name | Class A1 | Class A2 | Class I | |||||||||
| Nuveen Enhanced High Yield Municipal Bond Fund |
NHYEX | NHYAX | NMSSX | |||||||||
Annual
Report
Table
of Contents
| 3 | ||||
| 4 | ||||
| 6 | ||||
| 7 | ||||
| Fund Performance, Expense Ratios, Leverage and Holdings Summaries |
8 | |||
| 12 | ||||
| 13 | ||||
| 14 | ||||
| 41 | ||||
| 43 | ||||
| 44 | ||||
| 45 | ||||
| 46 | ||||
| 49 | ||||
| 60 | ||||
| 61 | ||||
| 62 | ||||
| 63 | ||||
2
Management fees: As of May 1, 2024, the Fund’s overall complex-level fee begins at a maximum rate of 0.1600% of the Fund’s average daily net assets, with breakpoints for eligible complex-level assets above $124.3 billion.
3
Fund Performance
Nuveen Enhanced High Yield Municipal Bond Fund
Nuveen Asset Management, LLC (NAM), an affiliate of Nuveen Fund Advisors, LLC, is the investment adviser for the Nuveen Enhanced High Yield Municipal Bond Fund (HYIF).
The portfolio managers for HYIF are Daniel Close, CFA, Steven Hlavin, and Stephen Candido, CFA.
Below is a discussion of the Fund’s performance and the factors that contributed and detracted during the 12-month reporting period ended March 31, 2025. For more information on the Fund’s investment objectives and policies, please refer to the Shareholder Update section at the end of the report.
Nuveen Enhanced High Yield Municipal Bond Fund (HYIF)
What factors affected markets during the reporting period?
| • | Municipal bond yields rose over the reporting period, except for short maturities, whose yields fell. However, the path was not a straight line given uncertainties about the Federal Reserve’s plan for monetary easing, U.S. fiscal policy under the Trump administration and the impact to the economy and inflation. |
| • | Credit fundamentals remained strong, with default activity at low levels. Although supply increased during the reporting period, demand for municipal debt remained solid. |
What key strategies were used to manage the Fund during the reporting period?
| • | The Fund’s trading activity remained focused on pursuing its investment objectives. There were no material changes to the Fund’s positioning. |
| • | The portfolio management team actively worked to invest in new issues offering high tax-exempt income and attractive spreads and in secondary market opportunities where pricing dislocations presented attractive relative value. |
How did the Fund perform and what factors affected relative performance?
For the 12-month reporting period ended March 31, 2025, the Class I Shares of the Nuveen Enhanced High Yield Municipal Bond Fund returned 8.11%. The Fund outperformed the S&P Municipal Yield Index, which returned 3.78%.
Top contributors to relative performance
| • | Overweight to the incremental tax sector. |
| • | Overweight to non-rated bonds and an underweight to BBB-rated and A-rated bonds. |
Top detractors from relative performance
| • | Overweights to durations of zero to two years and durations of 12 years and longer. |
| • | Overweight to certain transportation sector bonds and an underweight to the hospital sector. |
4
This material is not intended to be a recommendation or investment advice, does not constitute a solicitation to buy, sell or hold a security or an investment strategy, and is not provided in a fiduciary capacity. The information provided does not take into account the specific objectives or circumstances of any particular investor, or suggest any specific course of action. Investment decisions should be made based on an investor’s objectives and circumstances and in consultation with his or her advisors.
Certain statements in this report are forward-looking statements. Discussions of specific investments are for illustration only and are not intended as recommendations of individual investments. The forward-looking statements and other views expressed herein are those of the portfolio managers as of the date of this report. Actual future results or occurrences may differ significantly from those anticipated in any forward-looking statements, and the views expressed herein are subject to change at any time, due to numerous market and other factors. The Fund disclaims any obligation to update publicly or revise any forward-looking statements or views expressed herein.
For financial reporting purposes, the ratings disclosed are the lowest rating given by one of the following national rating agencies: Standard & Poor’s Group (S&P), Moody’s Investors Service, Inc. (Moody’s) or Fitch, Inc. (Fitch). This treatment of split-rated securities may differ from that used for other purposes, such as for Fund investment policies. Credit ratings are subject to change. AAA, AA, A and BBB are investment grade ratings, while BB, B, CCC, CC, C and D are below investment grade ratings. Holdings designated N/R are not rated by these national rating agencies.
Bond insurance guarantees only the payment of principal and interest on the bond when due, and not the value of the bonds themselves, which will fluctuate with the bond market and the financial success of the issuer and the insurer. Insurance relates specifically to the bonds in the portfolio and not to the share prices of a Fund. No representation is made as to the insurers’ ability to meet their commitments.
Refer to the Glossary of Terms Used in this Report for further definition of the terms used within this section.
5
COMMON SHARE DISTRIBUTION INFORMATION
The following information regarding the Fund’s distributions is current as of March 31, 2025. The Fund’s distribution levels may vary over time based on the Fund’s investment activity and portfolio investments value changes.
During the current reporting period, the Fund’s distributions to common shareholders were as shown in the accompanying table.
| Monthly Distributions (Ex-Dividend Date) | Class A1 | Class A2 | Class I | |||||||||
| April 2024 |
$0.0325 | $0.0340 | $0.0370 | |||||||||
| May 2024 |
0.0325 | 0.0340 | 0.0370 | |||||||||
| June 2024 |
0.0325 | 0.0340 | 0.0370 | |||||||||
| July 2024 |
0.0325 | 0.0340 | 0.0370 | |||||||||
| August 2024 |
0.0325 | 0.0340 | 0.0370 | |||||||||
| September 2024 |
0.0325 | 0.0340 | 0.0370 | |||||||||
| October 2024 |
0.0325 | 0.0340 | 0.0370 | |||||||||
| November 2024 |
0.0320 | 0.0340 | 0.0370 | |||||||||
| December 2024 |
0.0320 | 0.0340 | 0.0370 | |||||||||
| January 2025 |
0.0320 | 0.0340 | 0.0370 | |||||||||
| February 2025 |
0.0320 | 0.0340 | 0.0370 | |||||||||
| March 2025 |
0.0320 | 0.0340 | 0.0370 | |||||||||
| Total Distributions from Net Investment Income |
$0.3875 | $0.4080 | $0.4440 | |||||||||
| Total Distributions from Long Term Capital Gains |
0.0067 | 0.0067 | 0.0067 | |||||||||
| Total Distributions |
0.3942 | 0.4147 | 0.4507 | |||||||||
| Class A1 | Class A2 | Class I | ||||||||||
| Distribution Rate on NAV* |
5.02% | 5.33% | 5.80% | |||||||||
| *Distribution | rate represents the latest declared distribution, annualized, divided by the Fund’s current net asset value (NAV) as of the end of the reporting period. |
The Fund seeks to pay regular monthly dividends out of its net investment income at a rate that reflects its past and projected net income performance. To permit the Fund to maintain a more stable monthly dividend, the Fund may pay dividends at a rate that may be more or less than the amount of net income actually earned by the Fund during the period. Distributions to common shareholders are determined on a tax basis, which may differ from amounts recorded in the accounting records. In instances where the monthly dividend exceeds the earned net investment income, the Fund would report a negative undistributed net ordinary income. Refer to the Notes to Financial Statements for additional information regarding the amounts of undistributed net ordinary income and undistributed net long-term capital gains and the character of the actual distributions paid by the Fund during the period.
All monthly dividends paid by the Fund during the current reporting period were paid from net investment income. If a portion of the Fund’s monthly distributions is sourced from or comprised of elements other than net investment income, including capital gains and/or a return of capital, shareholders will be notified of those sources. For financial reporting purposes, per share amounts of the Fund’s distributions for the reporting period are presented in this report’s Financial Highlights. For income tax purposes, distribution information for the Fund as of its most recent tax year end is presented in the Notes to Financial Statements of this report.
REPURCHASE OFFER
In order to provide liquidity to common shareholders, the Fund has adopted a fundamental investment policy, which may only be changed by a majority vote of shareholders, to make quarterly offers to repurchase between 5% and 25% of its outstanding Common Shares at NAV, reduced by any applicable repurchase fee. Subject to approval of the Board, for each quarterly repurchase offer, the Fund currently expects to offer to repurchase 7.5% of the outstanding Common Shares at NAV. The Fund does not currently expect to charge a repurchase fee.
Refer to the Notes to Financial Statements for further details on the Fund’s repurchase offer.
6
S&P Municipal Yield Index: An index that is structured so that 70% of the index consists of bonds that are either not rated or are rated below investment grade, 20% are rated BBB/Baa, and 10% are rated single A. Index returns assume reinvestment of distributions, but do not reflect any applicable sales charges or management fees.
7
Fund Performance, Expense Ratios, Leverage and Holdings Summaries
The Fund Performance, Leverage, Expense Ratios and Holdings Summaries for the Fund are shown within this section of the report.
Fund Performance
Performance data shown represents past performance and does not predict or guarantee future results. Investment returns and principal value will fluctuate so that when shares are repurchased, they may be worth more or less than their original cost. Current performance may be higher or lower than the performance shown.
Total returns for a period of less than one year are not annualized (i.e. cumulative returns). Since inception returns are shown for share classes that have less than 10-years of performance. Returns at NAV would be lower if the sales charge were included. Returns assume reinvestment of dividends and capital gains. For performance, current to the most recent month-end visit nuveen.com or call (800) 257-8787.
Returns do not reflect the deduction of taxes that a shareholder would pay on Fund distributions or the repurchase of Fund shares. Income is generally exempt from regular federal income taxes. Some income may be subject to state and local income taxes and to the federal alternative minimum tax. Capital gains, if any, are subject to tax.
Returns may reflect fee waivers and/or expense reimbursements by the investment adviser during the periods presented. If any such waivers and/or reimbursements had not been in place, returns would have been reduced. See Notes to Financial Statements for more information.
Returns reflect differences in sales charges and expenses, which are primarily differences in distribution and service fees, and assume reinvestment of dividends and capital gains.
Comparative index and Lipper return information is provided for Class A1 Shares at NAV only.
Impact of Leverage
One important factor impacting the returns of the Fund’s common shares relative to its comparative benchmarks was the Fund’s use of leverage through its issuance of preferred shares and investments in inverse floating rate securities, which represent leveraged investments in underlying bonds. The Fund uses leverage because our research has shown that, over time, leveraging provides opportunities for additional income. The opportunity arises when short-term rates that the Fund pays on its leveraging instruments are lower than the interest the Fund earns on its portfolio securities that it has bought with the proceeds of that leverage.
However, use of leverage can expose Fund common shares to additional price volatility. When the Fund uses leverage, the Fund’s common shares will experience a greater increase in their net asset value if the securities acquired through the use of leverage increase in value, but will also experience a correspondingly larger decline in their net asset value if the securities acquired through leverage decline in value. All this will make the shares’ total return performance more variable over time.
In addition, common share income in levered funds will typically decrease in comparison to unlevered funds when short-term interest rates increase and increase when short-term interest rates decrease. In recent quarters, fund leverage expenses have generally tracked the overall movement of short-term interest rates. While fund leverage expenses are higher than prior year lows, leverage nevertheless continues to provide the opportunity for incremental common share income, particularly over longer-term periods.
Leverage Ratios
The Fund’s Effective Leverage and Regulatory Leverage Ratios are set forth below. “Effective Leverage” is a Fund’s effective economic leverage, and includes both regulatory leverage and the leverage effects of certain derivative and other investments in a Fund’s portfolio that increase the Fund’s investment exposure. Currently, the leverage effects of Tender Option Bond (TOB) inverse floater holdings are included in effective leverage values, in addition to any regulatory leverage. “Regulatory Leverage” consists of preferred shares or borrowings of a Fund. Regulatory Leverage is a part of a Fund’s capital structure. Regulatory leverage is subject to asset coverage limits set forth in the Investment Company Act of 1940. A Fund, however, may from time to time borrow for temporary purposes, typically on a transient basis in connection with its day-to-day operations, primarily in connection with the need to settle portfolio trades. Such temporary borrowings are excluded from the calculation of a Fund’s Effective Leverage and Regulatory Leverage ratios.
8
Expense Ratios
The expense ratios shown are as of the Fund’s most recent prospectus. The expense ratios shown reflect total operating expenses (before fee waivers and/or expense reimbursements, if any). The expense ratios include management fees and other fees and expenses. Refer to the Financial Highlights later in this report for the Fund’s expense ratios as of the end of the reporting period.
Holdings Summaries
The Holdings Summaries data relates to the securities held in the Fund’s portfolio of investments as of the end of this reporting period. It should not be construed as a measure of performance for the Fund itself. Holdings are subject to change. Refer to the Fund’s Portfolio of Investments for individual security information.
The ratings disclosed are the lowest rating given by one of the following national rating agencies: Standard & Poor’s, Moody’s Investors Service, Inc. or Fitch, Inc. Credit ratings are subject to change. AAA, AA, A and BBB are investment grade ratings; BB, B, CCC, CC, C and D are below investment grade ratings. Holdings designated N/R are not rated by these national rating agencies.
9
| Nuveen Enhanced High Yield Municipal Bond Fund (continued) Fund Performance, Expense Ratios, Leverage and Holdings Summaries March 31, 2025 |
Fund Performance and Expense Ratios*
| Total Returns as of March 31, 2025** |
||||||||||||||||||||
| Average Annual | Expense Ratios*** | |||||||||||||||||||
| Inception Date |
1-Year | Since Inception |
Gross | Net | ||||||||||||||||
| Class A1 at NAV | 6/30/21 | 7.32% | (2.47)% | 3.87% | 3.76% | |||||||||||||||
| Class A1 at maximum Offering Price | 6/30/21 | 4.64% | (3.12)% | — | — | |||||||||||||||
| S&P Municipal Yield Index | — | 3.78% | 0.35% | — | — | |||||||||||||||
| Class A2 | 7/29/22 | 7.60% | 3.59% | 3.62% | 3.51% | |||||||||||||||
| Class I | 6/30/21 | 8.11% | (1.75)% | 3.12% | 3.01% | |||||||||||||||
| * | For purposes of Fund performance, relative results are measured against the S&P Municipal Yield Index. |
| ** | Class A1 Shares have a maximum 2.50% sales charge (Offering Price). Class A1 Share purchases of $100,000 or more are sold at net asset value without an up-front sales charge but may be subject to a contingent deferred sales charge (CDSC) of 1.50% if repur- chased before the first day of the month in which the one-year anniversary of the purchase falls. Class A2 and Class I Shares have no sales charge and may be purchased under limited circumstances or by specified classes of investors. |
| *** | The Fund’s investment adviser has contractually agreed to waive fees and/or reimburse Fund expenses through July 31, 2026 so that total annual Fund operating expenses (excluding distribution and/or service fees that may be applicable to a particular class of shares, issuance and dividend costs of preferred shares that may be issued by the Fund, interest expense, taxes, acquired fund fees and expenses, fees incurred in acquiring and disposing of portfolio securities, litigation expenses and extraordinary expenses) do not exceed 1.05% of the average daily managed assets of any class of Fund shares. This expense limitation may be terminated or modified prior to that date only with the approval of the Board of Trustees of the Fund. |
Growth of an Assumed $10,000 Investment as of March 31, 2025 - Class A1
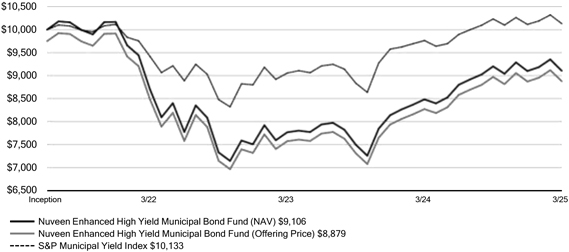
The graphs do not reflect the deduction of taxes, such as state and local income taxes or capital gains taxes that a shareholder may pay on Fund distributions or the redemptions of Fund shares.
10
Leverage and Holdings
Leverage
| Effective Leverage | 28.61% | |||
| Regulatory Leverage | 27.63% |
Fund Allocation
(% of net assets)
| Municipal Bonds | 140.6% | |||
| Variable Rate Senior Loan Interests | 0.0% | |||
| Other Assets & Liabilities, Net | 1.8% | |||
| Borrowings | (2.5)% | |||
| Floating Rate Obligations | (1.9)% | |||
| MFP Shares, Net | (38.0)% | |||
| Net Assets |
100% |
Bond Credit Quality
(% of total investments)
| AA | 1.0 | % | ||
| A | 1.3 | % | ||
| BBB | 2.6 | % | ||
| BB or Lower | 13.9 | % | ||
| N/R (not rated) | 81.2 | % | ||
| Total |
100 | % |
Portfolio Composition
(% of total investments)
| Tax Obligation/Limited | 39.0 | % | ||
| Education and Civic Organizations | 16.9 | % | ||
| Transportation | 11.3 | % | ||
| Long-Term Care | 9.2 | % | ||
| Consumer Staples | 6.0 | % | ||
| Industrials | 6.0 | % | ||
| Housing/Multifamily | 5.0 | % | ||
| Other | 6.6 | % | ||
| Variable Rate Senior Loan Interests | 0.0 | % | ||
| Total |
100 | % |
States and Territories1
(% of total municipal bonds)
| Colorado | 16.5 | % | ||
| Wisconsin | 14.8 | % | ||
| Florida | 13.1 | % | ||
| Texas | 8.0 | % | ||
| California | 7.5 | % | ||
| New York | 6.3 | % | ||
| Utah | 4.0 | % | ||
| Ohio | 3.7 | % | ||
| Illinois | 2.2 | % | ||
| Arkansas | 2.1 | % | ||
| Pennsylvania | 2.0 | % | ||
| District of Columbia | 1.7 | % | ||
| Alabama | 1.6 | % | ||
| Arizona | 1.6 | % | ||
| Missouri | 1.6 | % | ||
| Other | 13.3 | % | ||
| Total |
100 | % |
| 1 | See the Portfolio of Investments for the remaining states comprising “Other” and not listed in the table above. |
11
As a shareholder of the Fund, you incur two types of costs: (1) transaction costs, including up-front and back-end sales charges (loads) or redemption fees, where applicable; and (2) ongoing costs, including management fees; distribution and service (12b-1) fees, where applicable; and other Fund expenses. The Examples below are intended to help you understand your ongoing costs (in dollars) of investing in the Fund and to compare these costs with the ongoing costs of investing in other mutual funds. The examples below include the interest and related expenses from inverse floaters that are reflected in the financial statements later within this report, when applicable.
The examples are based on an investment of $10,000 invested at the beginning and held for the entire reporting period. The examples are also based on the Fund’s actual expenses, which may vary from the expense rates shown in the Fund’s prospectus.
What were the Fund’s costs for the last year? (based on a hypothetical $10,000 investment)
| Cost of a $10,000 investment |
Cost paid as a percentage of $10,000 investment |
|||||||
| Class A1 Shares |
$389 | 3.75% | ||||||
| Class A2 Shares |
$364 | 3.51% | ||||||
| Class I Shares |
$312 | 3.00% | ||||||
12
Report of Independent Registered Public Accounting Firm
To the Board of Trustees and Shareholders of Nuveen Enhanced High Yield Municipal Bond Fund
Opinion on the Financial Statements
We have audited the accompanying statement of assets and liabilities, including the portfolio of investments, of Nuveen Enhanced High Yield Municipal Bond Fund (the “Fund”) as of March 31, 2025, the related statements of operations and cash flows for the year ended March 31, 2025, the statement of changes in net assets for each of the two years in the period ended March 31, 2025, including the related notes, and the financial highlights for each of the periods indicated therein (collectively referred to as the “financial statements”). In our opinion, the financial statements present fairly, in all material respects, the financial position of the Fund as of March 31, 2025, the results of its operations and its cash flows for the year then ended, the changes in its net assets for each of the two years in the period ended March 31, 2025 and the financial highlights for each of the periods indicated therein in conformity with accounting principles generally accepted in the United States of America.
Basis for Opinion
These financial statements are the responsibility of the Fund’s management. Our responsibility is to express an opinion on the Fund’s financial statements based on our audits. We are a public accounting firm registered with the Public Company Accounting Oversight Board (United States) (PCAOB) and are required to be independent with respect to the Fund in accordance with the U.S. federal securities laws and the applicable rules and regulations of the Securities and Exchange Commission and the PCAOB.
We conducted our audits of these financial statements in accordance with the standards of the PCAOB. Those standards require that we plan and perform the audit to obtain reasonable assurance about whether the financial statements are free of material misstatement, whether due to error or fraud.
Our audits included performing procedures to assess the risks of material misstatement of the financial statements, whether due to error or fraud, and performing procedures that respond to those risks. Such procedures included examining, on a test basis, evidence regarding the amounts and disclosures in the financial statements. Our audits also included evaluating the accounting principles used and significant estimates made by management, as well as evaluating the overall presentation of the financial statements. Our procedures included confirmation of securities owned as of March 31, 2025 by correspondence with the custodian, agent banks and brokers; when replies were not received from agent banks or brokers, we performed other auditing procedures. We believe that our audits provide a reasonable basis for our opinion.
/s/ PricewaterhouseCoopers LLP
Chicago, Illinois
May 28, 2025
We have served as the auditor of one or more investment companies in Nuveen Funds since 2002.
13
Portfolio of Investments March 31, 2025
Enhanced High Yield Municipal Bond
| PRINCIPAL | DESCRIPTION | RATE | MATURITY | VALUE | ||||||||||||||
|
|
|
|||||||||||||||||
| LONG-TERM INVESTMENTS - 140.6% | ||||||||||||||||||
| MUNICIPAL BONDS - 140.6% (100.0% of Total Investments) | ||||||||||||||||||
| ALABAMA - 2.3% | ||||||||||||||||||
| $ | 4,000,000 | Hoover Industrial Development Board, Alabama, Environmental Improvement Revenue Bonds, United States Steel Corporation Proejcet, Series 2019, (AMT) | 5.750% | 10/01/49 | $ | 4,167,039 | ||||||||||||
| 650,000 | (a) | Jefferson County, Alabama, Sewer Revenue Warrants, Series 2024, (UB) | 5.250 | 10/01/49 | 670,707 | |||||||||||||
| 425,000 | (a) | Jefferson County, Alabama, Sewer Revenue Warrants, Series 2024, (UB) | 5.500 | 10/01/53 | 444,684 | |||||||||||||
| 250,000 | MidCity Improvement District, Alabama, Special Assessment Revenue Bonds, Series 2022 | 4.750 | 11/01/49 | 214,624 | ||||||||||||||
| 500,000 | MidCity Improvement District, Alabama, Special Assessment Revenue Bonds, Series 2024 | 6.500 | 11/01/44 | 478,332 | ||||||||||||||
| 550,000 | MidCity Improvement District, Alabama, Special Assessment Revenue Bonds, Series 2024 | 6.750 | 11/01/53 | 520,749 | ||||||||||||||
| 4,850,000 | Mobile County Industrial Development Authority, Alabama, Solid Waste Disposal Revenue Bonds, AM/NS Calvert LLC Project, Series 2024A, (AMT) | 5.000 | 06/01/54 | 4,800,263 | ||||||||||||||
| 2,220,000 | (b) | Montgomery Medical Clinic Board, Alabama, Health Care Facility Revenue Bonds, Jackson Hospital & Clinic, Series 2015 | 5.000 | 03/01/36 | 1,393,050 | |||||||||||||
| 3,790,000 | (c) | Tuscaloosa County Industrial Development Authority, Alabama, Gulf Opportunity Zone Bonds, Hunt Refining Project, Refunding Series 2019A |
5.250 | 05/01/44 | 3,830,243 | |||||||||||||
|
|
|
|||||||||||||||||
| TOTAL ALABAMA | 16,519,691 | |||||||||||||||||
|
|
||||||||||||||||||
| ARIZONA - 2.2% | ||||||||||||||||||
| 2,000,000 | (c) | Arizona Industrial Development Authority, Arizona, Education Revenue Bonds, Heritage Academy - Gateway and Laveen Pojects, Series 2021B | 5.000 | 07/01/51 | 1,784,003 | |||||||||||||
| 1,800,000 | (c) | Arizona Industrial Development Authority, Arizona, Education Revenue Bonds, Heritage Academy - Gateway and Laveen Pojects, Taxable Series 2021A | 5.000 | 07/01/51 | 1,605,603 | |||||||||||||
| 2,000,000 | (c) | Arizona Industrial Development Authority, Arizona, Education Revenue Bonds, Leman Academy of Excellence - Parker Colorado Campus Project, Series 2019A | 5.000 | 07/01/49 | 1,878,590 | |||||||||||||
| 2,500,000 | (c) | Arizona Industrial Development Authority, Arizona, Hotel Revenue Bonds, Provident Group ? Falcon Properties LLC, Project, Senior Series 2022A-1 | 4.000 | 12/01/41 | 1,948,899 | |||||||||||||
| 110,000 | (c) | Arizona Industrial Development Authority, Arizona, Hotel Revenue Bonds, Provident Group ? Falcon Properties LLC, Project, Senior Series 2022A-1 | 4.150 | 12/01/57 | 75,198 | |||||||||||||
| 100,000 | (c) | Arizona Industrial Development Authority, Arizona, Hotel Revenue Bonds, Provident Group ? Falcon Properties LLC, Project, Subordinate Series 2022B | 5.750 | 12/15/57 | 74,701 | |||||||||||||
| 150,000 | Estrella Mountain Ranch Community Facilities District, Goodyear, Arizona, Special Assessment Revenue Bonds, Montecito Assessment District 3, Series 2021 | 3.750 | 07/01/46 | 108,834 | ||||||||||||||
| 3,100,000 | (c) | Maricopa County Industrial Development Authority, Arizona, Education Revenue Bonds, Sun Valley Academy, Series 2024A | 6.625 | 07/01/59 | 3,195,287 | |||||||||||||
| 1,000,000 | (c) | Maricopa County Industrial Development Authority, Arizona, Education Revenue Bonds, Sun Valley Academy, Series 2024A | 6.750 | 07/01/63 | 1,034,539 | |||||||||||||
| 1,655,000 | Maricopa County Industrial Development Authority, Arizona, Education Revenue Bonds, Villa Montessori, Inc Project, Series 2023A | 5.500 | 07/01/53 | 1,637,833 | ||||||||||||||
| 250,000 | (d) | Sierra Vista Industrial Development Authority, Arizona, Economic Development Revenue Bonds, Convertible Capital Appreciation Revenue Bonds, Series 2021A | 0.000 | 10/01/56 | 204,098 | |||||||||||||
| 500,000 | Sierra Vista Industrial Development Authority, Arizona, Economic Development Revenue Bonds, Convertible Capital Appreciation Revenue Bonds, Series 2022A | 7.000 | 10/01/56 | 495,774 | ||||||||||||||
| 500,000 | (c) | Sierra Vista Industrial Development Authority, Arizona, Education Facility Revenue Bonds, American Leadership Academy Project, Series 2024 | 5.000 | 06/15/64 | 465,583 | |||||||||||||
| 14 | See Notes to Financial Statements |
| PRINCIPAL | DESCRIPTION | RATE | MATURITY | VALUE | ||||||||||||||
|
|
|
|||||||||||||||||
| ARIZONA (continued) | ||||||||||||||||||
| $ | 1,000,000 | (c) | Tempe Industrial Development Authority, Arizona, Revenue Bonds, Mirabella at ASU Project, Series 2017A | 6.125% | 10/01/47 | $ | 652,128 | |||||||||||
| 1,400,000 | (c) | Tempe Industrial Development Authority, Arizona, Revenue Bonds, Mirabella at ASU Project, Series 2017A |
6.125 | 10/01/52 | 888,177 | |||||||||||||
|
|
|
|||||||||||||||||
| TOTAL ARIZONA | 16,049,247 | |||||||||||||||||
|
|
||||||||||||||||||
| ARKANSAS - 3.0% | ||||||||||||||||||
| 4,000,000 | (c) | Arkansas Development Finance Authority, Arkansas, Environmental Improvement Revenue Bonds, United States Steel Corporation, Green Series 2022, (AMT) | 5.450 | 09/01/52 | 4,098,581 | |||||||||||||
| 1,000,000 | Arkansas Development Finance Authority, Arkansas, Environmental Improvement Revenue Bonds, United States Steel Corporation, Green Series 2023, (AMT) | 5.700 | 05/01/53 | 1,039,267 | ||||||||||||||
| 4,500,000 | (c) | Arkansas Development Finance Authority, Charter School Revenue Bonds, Academy of Math and Science - Little Rock Project Series 2024A | 7.000 | 07/01/59 | 4,241,682 | |||||||||||||
| 9,750,000 | (c) | Arkansas Development Finance Authority, Industrial Development Revenue Bonds, Big River Steel Project, Series 2019, (AMT) | 4.500 | 09/01/49 | 9,294,629 | |||||||||||||
| 3,000,000 | (c) | Arkansas Development Finance Authority, Industrial Development Revenue Bonds, Big River Steel Project, Series 2020A, (AMT) |
4.750 | 09/01/49 | 2,895,838 | |||||||||||||
|
|
|
|||||||||||||||||
| TOTAL ARKANSAS | 21,569,997 | |||||||||||||||||
|
|
||||||||||||||||||
| CALIFORNIA - 10.6% | ||||||||||||||||||
| 2,000,000 | (c) | California Community Housing Agency, California, Essential Housing Revenue Bonds, Creekwood, Series 2021A | 4.000 | 02/01/56 | 1,291,158 | |||||||||||||
| 4,725,000 | (c) | California Community Housing Agency, California, Essential Housing Revenue Bonds, Serenity at Larkspur Apartments, Series 2020A | 5.000 | 02/01/50 | 3,468,385 | |||||||||||||
| 12,300,000 | (c) | California Community Housing Agency, Workforce Housing Revenue Bonds, Annadel Apartments, Series 2019A | 5.000 | 04/01/49 | 10,482,845 | |||||||||||||
| 250,000 | (c) | California Enterprise Development Authority, Charter School Revenue Bonds, Norton Science & Language Academy Project, Series 2021 | 4.000 | 07/01/61 | 191,177 | |||||||||||||
| 9,450,000 | (c) | California Infrastructure and Economic Development Bank, Revenue Bonds, Brightline West Passenger Rail Project, Green Bond Series 2025A, (AMT), (Mandatory Put 1/01/35) | 9.500 | 01/01/65 | 9,450,096 | |||||||||||||
| 550,000 | (c) | California Municipal Finance Authority, Revenue Bonds, American Musical and Dramatic Academy Inc. AMDA Inc Project, Taxable Series 2023B | 9.500 | 07/01/30 | 569,958 | |||||||||||||
| 1,400,000 | California Municipal Finance Authority, Revenue Bonds, American Musical and Dramatic Academy Inc., Series 2023A | 7.250 | 07/01/53 | 1,413,076 | ||||||||||||||
| 5,770,000 | California Public Finance Authority, Senior Living Revenue Bonds, The James, Senior Series 2024A | 6.500 | 06/01/54 | 5,552,901 | ||||||||||||||
| 6,000,000 | California Public Finance Authority, Senior Living Revenue Bonds, The James, Senior Series 2024A | 6.375 | 06/01/59 | 5,621,061 | ||||||||||||||
| 1,750,000 | (c) | California School Finance Authority, California, Charter School Revenue Bonds, Alta Public Schools - Obligated Group, Series 2024 | 5.875 | 06/01/54 | 1,647,283 | |||||||||||||
| 1,925,000 | (c) | California School Finance Authority, California, Charter School Revenue Bonds, Alta Public Schools - Obligated Group, Series 2024 | 6.000 | 06/01/64 | 1,800,345 | |||||||||||||
| 250,000 | (c) | California School Finance Authority, California, Charter School Revenue Bonds, Girls Athletic Leadership School Los Angeles Project, Series 2021A | 4.000 | 06/01/51 | 187,209 | |||||||||||||
| 1,360,000 | (c) | California School Finance Authority, California, Charter School Revenue Bonds, Hayward Twin Oaks Montessori Charter School Project, Series 2024A | 6.000 | 06/15/54 | 1,299,107 | |||||||||||||
| 2,765,000 | (c) | California School Finance Authority, California, Charter School Revenue Bonds, Hayward Twin Oaks Montessori Charter School Project, Series 2024A | 6.125 | 06/15/64 | 2,638,761 | |||||||||||||
| 5,000,000 | (c) | California School Finance Authority, Charter School Lease Revenue Bonds, Pathways to College Project, Series 2023A | 7.500 | 06/15/63 | 5,132,879 | |||||||||||||
| See Notes to Financial Statements | 15 |
Portfolio of Investments March 31, 2025 (continued)
Enhanced High Yield Municipal Bond
| PRINCIPAL | DESCRIPTION | RATE | MATURITY | VALUE | ||||||||||||||
|
|
|
|||||||||||||||||
| CALIFORNIA (continued) | ||||||||||||||||||
| $ | 1,380,000 | (c) | California School Finance Authority, Charter School Revenue Bonds, Arts in Action Charter Schools - Obligated Group, Series 2020A | 5.000% | 06/01/30 | $ | 1,359,201 | |||||||||||
| 500,000 | (c) | California School Finance Authority, Charter School Revenue Bonds, Arts in Action Charter Schools - Obligated Group, Series 2020A | 5.000 | 06/01/59 | 422,296 | |||||||||||||
| 250,000 | (c) | California School Finance Authority, Charter School Revenue Bonds, Citizens of the World Charter, Series 2022A | 6.250 | 04/01/52 | 252,991 | |||||||||||||
| 100,000 | (c) | California School Finance Authority, Charter School Revenue Bonds, Partnerships to Uplift Communities Project, Refunding Social Series 2023 | 5.500 | 08/01/47 | 103,601 | |||||||||||||
| 250,000 | (c) | California School Finance Authority, Charter School Revenue Bonds, Russell Westbrook Why Not? Academy ? Obligated Group, Series 2021A | 4.000 | 06/01/51 | 193,842 | |||||||||||||
| 500,000 | (c) | California School Finance Authority, Charter School Revenue Bonds, Scholarship Prep Public Schools ? Obligated Group, Series 2023A | 6.000 | 06/01/63 | 503,143 | |||||||||||||
| 245,000 | California Statewide Communities Development Authority, Statewide Community Infrastructure Program Revenue Bonds, Series 2021C | 4.000 | 09/02/51 | 201,759 | ||||||||||||||
| 500,000 | (c) | CMFA Special Finance Agency I, California, Essential Housing Revenue Bonds, The Mix at Center City, Subordinate Series 2021B | 8.000 | 04/01/56 | 370,405 | |||||||||||||
| 250,000 | (c) | CMFA Special Finance Agency, California, Essential Housing Revenue Bonds, Latitude 33, Senior Series 2021A-2 | 4.000 | 12/01/45 | 199,795 | |||||||||||||
| 290,000 | (c) | CSCDA Community Improvement Authority, California, Essential Housing Revenue Bonds, 1818 Platinum Triangle-Anaheim, Mezzanine Lien Series 2021B | 4.000 | 04/01/57 | 209,673 | |||||||||||||
| 325,000 | (c) | CSCDA Community Improvement Authority, California, Essential Housing Revenue Bonds, 1818 Platinum Triangle-Anaheim, Social Bond Series 2021A-2 | 3.250 | 04/01/57 | 236,930 | |||||||||||||
| 250,000 | (c) | CSCDA Community Improvement Authority, California, Essential Housing Revenue Bonds, Acacia on Santa Rosa Creek, Mezzanine Lien Series 2021B | 4.000 | 10/01/46 | 197,381 | |||||||||||||
| 305,000 | (c) | CSCDA Community Improvement Authority, California, Essential Housing Revenue Bonds, Acacia on Santa Rosa Creek, Senior Lien Series 2021A | 4.000 | 10/01/56 | 249,188 | |||||||||||||
| 3,000,000 | (c) | CSCDA Community Improvement Authority, California, Essential Housing Revenue Bonds, Center City Anaheim, Series 2020A | 5.000 | 01/01/54 | 2,525,603 | |||||||||||||
| 630,000 | (c) | CSCDA Community Improvement Authority, California, Essential Housing Revenue Bonds, Millennium South Bay-Hawthorne, Mezzanine Lien Series 2021B | 4.000 | 07/01/58 | 348,266 | |||||||||||||
| 250,000 | (c) | CSCDA Community Improvement Authority, California, Essential Housing Revenue Bonds, Monterrey Station Apartments, Series 2021B | 4.000 | 07/01/58 | 169,927 | |||||||||||||
| 250,000 | (c) | CSCDA Community Improvement Authority, California, Essential Housing Revenue Bonds, Westgate Phase 1-Pasadena Apartments, Mezzanine Lien Series 2021B | 4.000 | 06/01/57 | 76,729 | |||||||||||||
| 5,000,000 | Golden State Tobacco Securitization Corporation, California, Tobacco Settlement Asset-Backed Bonds, Capital Appreciation Series 2021B-2 | 0.000 | 06/01/66 | 538,461 | ||||||||||||||
| 20,000,000 | Inland Empire Tobacco Securitization Authority, California, Tobacco Settlement Asset-Backed Bonds, Series 2007C-1.Turbo Capital Appreciation | 0.000 | 06/01/36 | 9,326,212 | ||||||||||||||
| 1,000,000 | Kaweah Delta Health Care District, California, Revenue Bonds, Series 2015B | 5.000 | 06/01/40 | 955,029 | ||||||||||||||
| 4,100,000 | Oroville, California, Revenue Bonds, Oroville Hospital Series 2019 | 5.250 | 04/01/54 | 3,193,552 | ||||||||||||||
| 35,000 | Palomar Health System, California, Revenue Bonds, Refunding Series 2017 | 5.000 | 11/01/42 | 27,446 | ||||||||||||||
| 16 | See Notes to Financial Statements |
| PRINCIPAL | DESCRIPTION | RATE | MATURITY | VALUE | ||||||||||||||
|
|
|
|||||||||||||||||
| CALIFORNIA (continued) | ||||||||||||||||||
| $ | 15,000,000 | Tobacco Securitization Authority of Southern California, Tobacco Settlement Asset-Backed Bonds, San Diego County Tobacco Asset Securitization Corporation, First Subordinate CABs, Series 2006B |
0.000% | 06/01/46 | $ | 3,702,560 | ||||||||||||
|
|
|
|||||||||||||||||
| TOTAL CALIFORNIA | 76,110,231 | |||||||||||||||||
|
|
||||||||||||||||||
| COLORADO - 23.2% | ||||||||||||||||||
| 2,725,000 | (c) | Aerotropolis Regional Transportation Authority, Colorado, Special Revenue Bonds, Series 2024 | 5.750 | 12/01/54 | 2,812,991 | |||||||||||||
| 3,025,000 | Arista Metropolitan District, Broomfield County, Colorado, General Obligation Limited Tax Bonds, Refunding and Improvement Series 2023B | 8.250 | 12/15/39 | 3,111,449 | ||||||||||||||
| 2,500,000 | Aurora Highlands Community Authority Board, Adams County, Colorado, Special Tax Revenue Bonds, Refunding & Improvement Series 2021A | 5.750 | 12/01/51 | 2,334,614 | ||||||||||||||
| 1,200,000 | Baseline Metropolitan District 1, In the City and County of Broomfield, Colorado, Special Revenue Bonds, Subordinate Series 2024B | 6.750 | 12/15/54 | 1,199,093 | ||||||||||||||
| 4,775,000 | (c) | Bella Mesa Metropolitan District, Castle Rock, Colorado, Limited Tax General Obligation Bonds, Subordinate Series 2024B | 8.000 | 12/15/54 | 4,783,712 | |||||||||||||
| 500,000 | Berthoud-Heritage Metropolitan District 10, Larimer County, Colorado, Limited Tax General Obligation Bonds, Senior Series 2022A | 4.750 | 12/01/52 | 423,307 | ||||||||||||||
| 1,750,000 | Bradley Heights Metropolitan District 2, Colorado Springs, El Paso County, Colorado, General Obligation Limited Tax Bonds, Series 2021A-3 | 4.750 | 12/01/51 | 1,349,253 | ||||||||||||||
| 500,000 | Broadway Station Metropolitan District 2, Denver City and County, Colorado, General Obligation Limited Tax Bonds, Convertible to Unlimited Series 2019A | 5.000 | 12/01/35 | 446,345 | ||||||||||||||
| 1,475,000 | Broadway Station Metropolitan District 2, Denver City and County, Colorado, General Obligation Limited Tax Bonds, Convertible to Unlimited Series 2019A | 5.125 | 12/01/48 | 1,200,791 | ||||||||||||||
| 4,675,000 | Broadway Station Metropolitan District 3, Denver City and County, Colorado, General Obligation Limited Tax Bonds, Convertible to Unlimited Series 2019A | 5.000 | 12/01/49 | 3,645,645 | ||||||||||||||
| 7,872,000 | Broadway Station Metropolitan District 3, Denver County, Colorado, Tax Increment Supported Revenue Bonds, Series 2023A | 7.000 | 12/15/32 | 7,592,849 | ||||||||||||||
| 446,000 | Buffalo Ridge Metropolitan District (In the City of Commerce City), Adams County, Colorado, General Obligation Refunding and Improvement Bonds, Series 2018B | 7.375 | 12/15/47 | 447,234 | ||||||||||||||
| 1,000,000 | Centerra Metropolitan District 1, Loveland, Colorado, Special Revenue Bonds, Refunding & Improvement Series 2020A | 5.000 | 12/01/51 | 914,307 | ||||||||||||||
| 500,000 | Centerra Metropolitan District 1, Loveland, Colorado, Special Revenue Improvement Bonds, Series 2022 | 6.500 | 12/01/53 | 510,094 | ||||||||||||||
| 1,000,000 | Chambers Highpoint Metropolitan District No. 2, Colorado, Limited Tax General Obligation and Special Revenue Bonds, Series 2021 | 5.000 | 12/01/51 | 808,525 | ||||||||||||||
| 140,000 | (c) | Cherry Hills City Metropolitan District, Arapahoe County, Colorado, General Obligation Limited Tax Bonds, Subordinate Series 2020B-3 | 8.000 | 12/15/47 | 129,140 | |||||||||||||
| 500,000 | Citadel on Colfax Business Improvement District, Aurora, Colorado, Special Revenue and Tax Supported Bonds, Senior Series 2020A | 5.350 | 12/01/50 | 471,302 | ||||||||||||||
| 2,000,000 | Colorado Educational and Cultural Facilities Authority, Charter School Revenue Bonds, Community Leadership Academy, Inc. Second Campus Project, Series 2013 | 7.450 | 08/01/48 | 2,005,945 | ||||||||||||||
| 1,170,000 | (c) | Colorado Educational and Cultural Facilities Authority, Revenue Bonds, Rocky Mountain Classical Academy Project, Refunding Series 2019 | 5.000 | 10/01/59 | 1,084,219 | |||||||||||||
| 3,100,000 | (b) | Colorado Health Facilities Authority, Colorado, Revenue Bonds, American Baptist Homes of the Midwest Obligated Group, Series 2013 | 8.000 | 08/01/43 | 1,977,299 | |||||||||||||
| 117,278 | (b) | Colorado Health Facilities Authority, Colorado, Revenue Bonds, Ralston Creek at Arvada Project, Series 2017A | 5.250 | 11/01/32 | 1,759 | |||||||||||||
| See Notes to Financial Statements | 17 |
Portfolio of Investments March 31, 2025 (continued)
Enhanced High Yield Municipal Bond
| PRINCIPAL | DESCRIPTION | RATE | MATURITY | VALUE | ||||||||||||||
|
|
|
|||||||||||||||||
| COLORADO (continued) | ||||||||||||||||||
| $ | 349,229 | (b) | Colorado Health Facilities Authority, Colorado, Revenue Bonds, Ralston Creek at Arvada Project, Series 2017A | 5.500% | 11/01/37 | $ | 5,239 | |||||||||||
| 651,547 | (b) | Colorado Health Facilities Authority, Colorado, Revenue Bonds, Ralston Creek at Arvada Project, Series 2017A | 5.750 | 11/01/47 | 10,099 | |||||||||||||
| 435,233 | (b) | Colorado Health Facilities Authority, Colorado, Revenue Bonds, Ralston Creek at Arvada Project, Series 2017A | 6.000 | 11/01/52 | 6,572 | |||||||||||||
| 500,000 | (b),(c) | Colorado Health Facilities Authority, Colorado, Revenue Bonds, Sunny Vista Living Center Project, Refunding & Improvement Series 2015A | 5.500 | 12/01/30 | 390,529 | |||||||||||||
| 500,000 | (b),(c) | Colorado Health Facilities Authority, Colorado, Revenue Bonds, Sunny Vista Living Center Project, Refunding & Improvement Series 2015A | 6.250 | 12/01/50 | 321,982 | |||||||||||||
| 500,000 | Copperleaf Metropolitan District 6, Arapahoe County, Colorado, Limited Tax, General Obligation Bonds, Subordinate Series 2022B | 6.000 | 12/15/41 | 497,602 | ||||||||||||||
| 2,000,000 | Crossroads Metropolitan District 1, El Paso County, Colorado, Limited Tax General Obligation and Special Revenue Bonds, Series 2022 | 6.500 | 12/01/51 | 1,986,347 | ||||||||||||||
| 1,400,000 | Dawson Trails Metropolitan District 1, Colorado, In The Town of Castle Rock, Limited Tax General Obligation Capital Appreciation Turbo Bonds, Series 2024 | 0.000 | 12/01/31 | 815,687 | ||||||||||||||
| 2,000,000 | DC Metropolitan District, Denver County, Colorado, Limited Tax General Obligation Bonds, Convertible to Unlimited Tax Series 2024A | 5.875 | 12/01/54 | 1,924,676 | ||||||||||||||
| 1,250,000 | DC Metropolitan District, Denver County, Colorado, Limited Tax General Obligation Bonds, Convertible to Unlimited Tax Series 2024B | 8.000 | 12/15/54 | 1,241,015 | ||||||||||||||
| 600,000 | (c) | Falcon Area Water and Wastewater Authority (El Paso County, Colorado), Tap Fee Revenue Bonds, Series 2022A | 6.750 | 12/01/34 | 581,028 | |||||||||||||
| 500,000 | (c) | Glen Metropolitan District 3, El Paso County, Colorado, General Obligation Limited Tax Bonds, Series 2021 | 4.250 | 12/01/51 | 396,371 | |||||||||||||
| 1,277,000 | Grand Avenue Metropolitan District, In the City of Aurora, Arapahoe County, Colorado, Limited Tax General Obligation Bonds, Series 2023 | 8.125 | 12/01/52 | 1,277,168 | ||||||||||||||
| 5,000,000 | Green Valley Ranch East Metropolitan District 6, Adams County, Colorado, Limited Tax General Obligation Bonds, Series 2020A-3 | 5.875 | 12/01/50 | 4,995,462 | ||||||||||||||
| 1,185,000 | Haymeadow Metropolitan District 1, Eagle County, Colorado, General Obligation Bonds, Limited Tax Subordinate Series 2025B | 8.375 | 12/15/49 | 1,176,990 | ||||||||||||||
| 1,000,000 | Haymeadow Metropolitan District 1, Eagle County, Colorado, General Obligation Bonds, Subordinate Limited Tax Series 2025A | 6.125 | 12/01/54 | 1,003,230 | ||||||||||||||
| 1,335,000 | Hess Ranch Metropolitan District 5, Parker, Colorado, Special Assessment Revenue Bonds, Special Improvement District 1, Series 2024A-1 | 6.000 | 12/01/43 | 1,358,817 | ||||||||||||||
| 585,000 | (c) | Hess Ranch Metropolitan District 5, Parker, Colorado, Special Assessment Revenue Bonds, Special Improvement District 2, Series 2024 | 5.500 | 12/01/44 | 571,159 | |||||||||||||
| 1,000,000 | (c) | Kremmling Memorial Hospital District, Colorado, Certificates of Participation, Series 2024 | 6.625 | 12/01/56 | 965,278 | |||||||||||||
| 2,000,000 | Lakota Pointe Metropolitan District 1, Winter Park, Colorado, Limited Tax General Obligation Bonds, Series 2025A | 6.000 | 12/01/55 | 2,010,673 | ||||||||||||||
| 1,185,000 | Lakota Pointe Metropolitan District 1, Winter Park, Colorado, Limited Tax General Obligation Bonds, Subordinate Series 2025B | 8.250 | 12/15/55 | 1,190,993 | ||||||||||||||
| 1,000,000 | (c) | Ledge Rock Center Commercial Metropolitan District (In the Town of Johnstown, Weld County, Colorado), Limited Tax General Obligation Bonds, Series 2022 | 7.375 | 11/01/52 | 1,007,839 | |||||||||||||
| 500,000 | Ledge Rock Center Residential Metropolitan District 1, Weld County, Colorado, Limited Tax General Obligation Bonds, Series 2024A | 6.375 | 12/01/54 | 504,029 | ||||||||||||||
| 1,000,000 | Legato Community Authority, Colorado, Commerce City Colorado Limited Tax Supported Revenue Bonds District 12 3 & 7 Convertible Capital Appreciation Series 2021A-2 | 5.000 | 12/01/51 | 752,948 | ||||||||||||||
| 18 | See Notes to Financial Statements |
| PRINCIPAL | DESCRIPTION | RATE | MATURITY | VALUE | ||||||||||||||
|
|
|
|||||||||||||||||
| COLORADO (continued) | ||||||||||||||||||
| $ | 535,000 | Lochbuie Station Metropolitan District, Colorado, General Obligation Limited Tax Bonds, Subordinate General Obligation Limited Tax Bonds, Series 2020B | 6.250% | 12/15/44 | $ | 529,858 | ||||||||||||
| 500,000 | (c) | Mineral Business Improvement District, Arapahoe County, Colorado, General Obligation and Special Revenue Bonds, Limited Tax Series 2024A | 5.750 | 12/01/54 | 505,449 | |||||||||||||
| 1,000,000 | Mirabelle Metropolitan District 2, Douglas County, Colorado, Limited Tax General Obligation Bonds, Subordinate Series 2025B | 6.125 | 12/15/49 | 1,001,759 | ||||||||||||||
| 500,000 | Mountain Brook Metropolitan District, Longmont, Boulder County, Colorado, Limited Tax General Obligation Bonds, Series 2021 | 4.750 | 12/01/51 | 402,464 | ||||||||||||||
| 1,000,000 | Mulberry Metropolitan District 2, Fort Collins, Colorado, Limited Tax General Obligation Bonds, Series 2022A | 7.000 | 12/01/52 | 1,023,342 | ||||||||||||||
| 500,000 | North Pine Vistas Metropolitan District 3, Castle Pines, Douglas County, Colorado, Limited Tax General Obligation Bonds, Subordinate Series 2021B - AGM Insured | 4.625 | 12/15/51 | 415,523 | ||||||||||||||
| 2,000,000 | North Range Metropolitan District 3, Adams County, Colorado, Limited Tax General Obligation Bonds, Series 2020A-3 | 5.250 | 12/01/50 | 2,001,751 | ||||||||||||||
| 2,175,000 | (c) | Old Towne Metropolitan District, Douglas County, Colorado, General Obligation Bonds, Refunding and Improvement Limited Tax Series 2024 | 6.000 | 12/01/53 | 2,063,174 | |||||||||||||
| 2,500,000 | (c) | Orchard Park Place South Metropolitan District, Adams County, Colorado, General Obligation Bonds, Limited Tax Series 2024 | 6.000 | 12/01/54 | 2,444,886 | |||||||||||||
| 1,500,000 | Painted Prairie Public Improvement Authority, Aurora, Colorado, Special Revenue Bonds, Series 2019 | 5.000 | 12/01/49 | 1,342,907 | ||||||||||||||
| 2,005,000 | (c),(d) | Palisade Metropolitan District 2, Broomfield County, Colorado, General Obligation Limited Tax Bonds, Refunding Subordinate Convertible Capital Appreciation Series 2024B | 0.000 | 12/15/54 | 1,829,895 | |||||||||||||
| 1,215,000 | (c) | Palisade Metropolitan District 2, Broomfield County, Colorado, General Obligation Limited Tax Bonds, Second Subordinate Series 2024C | 8.000 | 12/15/37 | 1,210,048 | |||||||||||||
| 1,000,000 | Peak Metropolitan District 3, Colorado Springs, El Paso County, Colorado, Limited Tax General Obligation Bonds, Series 2022A-1 | 7.500 | 12/01/52 | 1,007,235 | ||||||||||||||
| 500,000 | Pinery Commercial Metropolitan District 2, Douglas County, Colorado, Special Revenue Bonds, Series 2025 | 5.750 | 12/01/54 | 501,169 | ||||||||||||||
| 2,486,000 | Pioneer Community Authority Board (Weld County, Colorado), Special Revenue Bonds, Series 2022 | 6.500 | 12/01/34 | 2,382,984 | ||||||||||||||
| 500,000 | (c) | Prairie Song Metropolitan District 4, Windsor, Colorado, Limited Tax General Obligation Bonds, Series 2021 | 6.000 | 12/01/51 | 454,895 | |||||||||||||
| 1,310,000 | (c) | Pueblo Urban Renewal Authority, Colorado, Tax Increment Capital Appreciation Revenue Bonds, EVRAZ Project, Series 2021A and Tax Increment Revenue Capital Appreciation Bonds, Series 2021B | 0.000 | 12/01/25 | 1,265,021 | |||||||||||||
| 6,015,000 | (c) | Pueblo Urban Renewal Authority, Colorado, Tax Increment Revenue Bonds, EVRAZ Project, Series 2021A | 4.750 | 12/01/45 | 5,188,207 | |||||||||||||
| 1,100,000 | (c) | Reagan Ranch Metropolitan District 1, Colorado Springs, Colorado, General Obligation Bonds, Limited Tax & Special Revenue, Series 2025 | 6.125 | 12/01/54 | 1,065,299 | |||||||||||||
| 1,000,000 | Reagan Ranch Metropolitan District 1, Colorado Springs, Colorado, General Obligation Bonds, Limited Tax Series 2021-3 | 5.375 | 12/01/51 | 867,424 | ||||||||||||||
| 1,000,000 | Red Barn Metropolitan District, Mead, Colorado, Weld County, Colorado, General Obligation Bond, Limited Tax Convertible to Unlimited Tax, Refunding and Improvement, Series 2025A | 5.500 | 12/01/55 | 976,023 | ||||||||||||||
| 1,000,000 | Redtail Ridge Metropolitan District, City of Louisville, Boulder County, Colorado, General Obligation Limited Tax Capital Appreciation Turbo Bonds, Series 2025 | 0.000 | 12/01/32 | 588,312 | ||||||||||||||
| 1,070,000 | (c) | Ridge at Johnstown Metropolitan District 8, Larimer County, Colorado, Special Assessment Revenue Bonds, Special Improvement District 1, Series 2024 | 5.875 | 12/01/44 | 1,021,235 | |||||||||||||
| 657,000 | Ritoro Metropolitan District In the Town of Elizabeth, Elbert County, Colorado, Limited Tax General Obligation Bonds, Subordinate Refunding Series 2025B | 6.250 | 12/15/57 | 648,206 | ||||||||||||||
| 1,250,000 | Riverwalk Metropolitan District 2, Glendale, Arapahoe County, Colorado, Special Revenue Bonds, Series 2022A | 5.000 | 12/01/42 | 1,125,970 | ||||||||||||||
| See Notes to Financial Statements | 19 |
Portfolio of Investments March 31, 2025 (continued)
Enhanced High Yield Municipal Bond
| PRINCIPAL | DESCRIPTION | RATE | MATURITY | VALUE | ||||||||||||||
|
|
|
|||||||||||||||||
| COLORADO (continued) | ||||||||||||||||||
| $ | 1,370,000 | RM Mead Metropolitan District, Weld County, Colorado, Limited Tax General Obligation Bonds, Series 2020A | 5.250% | 12/01/50 | $ | 1,311,987 | ||||||||||||
| 500,000 | RRC Metropolitan District 2, Jefferson County, Colorado, Limited Tax General Obligation Bonds, Series 2021 | 5.250 | 12/01/51 | 432,053 | ||||||||||||||
| 750,000 | Sagebrush Farm Metropolitan District 1, Aurora, Adams County, Colorado, General Obligation Limited Tax Bonds, Series 2022A | 6.375 | 12/01/42 | 786,142 | ||||||||||||||
| 2,545,000 | Sagebrush Farm Metropolitan District 1, Aurora, Adams County, Colorado, General Obligation Limited Tax Bonds, Subordinate Series 2024 | 8.000 | 12/15/54 | 2,551,468 | ||||||||||||||
| 1,000,000 | (c) | Saint Vrain Lakes Metropolitan District 4, Weld County, Colorado, General Obligation Bonds, Firestone Subordinate Limited Tax Series 2024B | 8.750 | 09/20/54 | 993,858 | |||||||||||||
| 500,000 | Senac South Metropolitan District No. 1, Aurora, Colorado, General Obligation Bonds, Limited Tax Series 2021A(3) | 5.250 | 12/01/51 | 445,503 | ||||||||||||||
| 500,000 | Siena Lake Metropolitan District, Gypsum, Colorado, General Obligation Limited Tax Bonds, Series 2021 | 4.000 | 12/01/51 | 367,562 | ||||||||||||||
| 1,500,000 | (c) | Sky Ranch Community Authority Board (Arapahoe County, Colorado), Limited Tax Supported District No. 3 Senior Bonds (Tax-Exempt Fixed Rate), Series 2022A and Subordinate Bonds (Tax-Exempt Fixed Rate), Series 2022B(3) | 5.750 | 12/01/52 | 1,430,431 | |||||||||||||
| 500,000 | (c),(d) | St. Vrain Lakes Metropolitan District 4, Weld County, Colorado, General Obligation Bonds, Firestone Convertible Capital Appreciation Limited Tax Series 2024A | 0.000 | 09/20/54 | 339,060 | |||||||||||||
| 675,000 | St. Vrain Lakes Metropolitan District No. 2, Weld County, Colorado, Limited Tax General Obligation Bonds, Refunding and Improvement Series 2024B | 6.375 | 11/15/54 | 693,987 | ||||||||||||||
| 600,000 | Sterling Ranch Community Authority Board, Douglas County, Colorado, Limited Tax Supported and Special Revenue Bonds, Special District 4, Series 2024A | 6.500 | 12/01/54 | 616,432 | ||||||||||||||
| 975,000 | Sterling Ranch Community Authority Board, Douglas County, Colorado, Limited Tax Supported and Special Revenue Bonds, Special District 4, Series 2024B | 8.750 | 12/15/54 | 982,996 | ||||||||||||||
| 648,000 | (c) | Sunset Parks Metropolitan District, Weld County, Colorado, General Obligation Bonds, Limited Tax Subordinate Series 2024B | 7.625 | 12/15/54 | 641,831 | |||||||||||||
| 500,000 | (c) | Third Creek Metropolitan District 1, Commerce City, Colorado, Limited Tax General Obligation Bonds, Series 2022A-1 | 4.750 | 12/01/51 | 394,888 | |||||||||||||
| 500,000 | Trails at Crowfoot Metropolitan District 3, Parker, Colorado, Limited Tax General Obligation Bonds, Refunding Series 2024B | 6.875 | 12/15/52 | 494,669 | ||||||||||||||
| 1,000,000 | Transport Metropolitan District 3, In the City of Aurora, Adams County, Colorado, General Obligation Limited Bonds, Series 2021A-1 | 4.125 | 12/01/31 | 909,473 | ||||||||||||||
| 5,700,000 | Transport Metropolitan District 3, In the City of Aurora, Adams County, Colorado, General Obligation Limited Bonds, Series 2021A-1 | 5.000 | 12/01/41 | 4,858,185 | ||||||||||||||
| 7,960,000 | Transport Metropolitan District 3, In the City of Aurora, Adams County, Colorado, General Obligation Limited Bonds, Series 2021A-1 | 5.000 | 12/01/51 | 6,187,412 | ||||||||||||||
| 3,000,000 | (c) | Tree Farm Metropolitan District, Eagle County, Colorado, General Obligation Limited Tax Bonds, Series 2021 | 4.750 | 12/01/50 | 2,588,595 | |||||||||||||
| 3,000,000 | (c) | USAFA Visitor?s Center Business Improvement District, Colorado Springs, Colorado, Special Revenue Bonds, Series 2022A, | 5.000 | 12/01/52 | 2,656,636 | |||||||||||||
| 500,000 | (d) | Verve Metropolitan District 1, Jefferson County and the City and County of Broomfield, Colorado, General Obligation Bonds, Convertible Capital Appreciation Improvement Series 2024A | 0.000 | 12/01/54 | 360,724 | |||||||||||||
| 2,250,000 | Verve Metropolitan District 1, Jefferson County and the City and County of Broomfield, Colorado, General Obligation Bonds, Refunding and Improvement Limited Tax Series 2021 | 5.000 | 12/01/41 | 1,986,855 | ||||||||||||||
| 500,000 | Villages at Johnstown Metropolitan District 7, Johnstown, Colorado, Limited Tax General Obligation Bonds, Series 2022A(3) | 6.250 | 12/01/52 | 505,027 | ||||||||||||||
| 500,000 | West Globeville Metropolitan District 1, Denver, Colorado, General Obligation Limited Tax Bonds, Series 2022 | 6.750 | 12/01/52 | 477,797 | ||||||||||||||
| 3,000,000 | (c) | West Globeville Metropolitan District 1, Denver, Colorado, General Obligation Limited Tax Bonds, Series 2024A-2 | 8.000 | 12/01/54 | 1,746,183 | |||||||||||||
| 20 | See Notes to Financial Statements |
| PRINCIPAL | DESCRIPTION | RATE | MATURITY | VALUE | ||||||||||||||
|
|
|
|||||||||||||||||
| COLORADO (continued) | ||||||||||||||||||
| $ | 1,625,000 | Westerly Metropolitan District 4, Weld County, Colorado, General Obligation Limited Tax Bonds, Series 2021A-1 | 5.000% | 12/01/50 | $ | 1,569,926 | ||||||||||||
| 2,500,000 | Westgate Metropolitan District, Colorado Springs, El Paso County, Colorado, General Obligation Limited Tax Bonds, Series 2022 | 5.125 | 12/01/51 | 2,099,142 | ||||||||||||||
| 500,000 | (c) | Westwood Metropolitan District, Thornton, Adams County, Colorado, Limited Tax General Obligation Bonds, Senior Series 2021A | 4.000 | 12/01/51 | 376,727 | |||||||||||||
| 1,146,000 | (c) | Willow Springs Ranch Metropolitan District, Monument, El Paso County, Colorado, Limited Tax General Obligation Bonds, Subordinate Series 2024B | 6.500 | 10/15/54 | 1,134,951 | |||||||||||||
| 5,000,000 | (c),(d) | Windler Public Improvement Authority, Aurora, Colorado, Limited Tax Supported Revenue Bonds, Convertible Capital Appreciation Series 2021A-2 | 0.000 | 12/01/41 | 3,513,586 | |||||||||||||
| 24,250,000 | (c) | Windler Public Improvement Authority, Aurora, Colorado, Limited Tax Supported Revenue Bonds, Convertible Capital Appreciation Series 2021A-2 | 4.625 | 12/01/51 | 15,456,058 | |||||||||||||
| 2,250,000 | (c) | Windler Public Improvement Authority, Aurora, Colorado, Limited Tax Supported Revenue Bonds, Series 2021A-1 | 4.000 | 12/01/36 | 2,003,541 | |||||||||||||
| 3,000,000 | (c) | Windler Public Improvement Authority, Aurora, Colorado, Limited Tax Supported Revenue Bonds, Series 2021A-1 | 4.000 | 12/01/41 | 2,475,784 | |||||||||||||
| 11,750,000 | (c) | Windler Public Improvement Authority, Aurora, Colorado, Limited Tax Supported Revenue Bonds, Series 2021A-1 | 4.125 | 12/01/51 | 8,998,343 | |||||||||||||
|
|
|
|||||||||||||||||
| TOTAL COLORADO | 166,492,454 | |||||||||||||||||
|
|
||||||||||||||||||
| CONNECTICUT - 1.1% | ||||||||||||||||||
| 3,550,000 | Connecticut Development Authority, Airport Facilities Revenue Bonds, Learjet Inc., Series 2004, (AMT) | 7.950 | 04/01/26 | 3,550,895 | ||||||||||||||
| 4,000,000 | (c) | Connecticut Health and Educational Facilities Authority, Revenue Bonds, Mary Wade Home Issue, Series 2019A-1 | 5.000 | 10/01/54 | 3,084,141 | |||||||||||||
| 1,500,000 | (e) | Stamford Housing Authority, Connecticut, Revenue Bonds, Mozaic Concierge Living Project, Series 2025A | 6.250 | 10/01/60 | 1,511,182 | |||||||||||||
| 100,000 | (c) | Steel Point Infrastructure Improvement District, Connecticut, Special Obligation Revenue Bonds, Steelpointe Harbor Project, Series 2024 | 6.000 | 04/01/52 | 106,211 | |||||||||||||
|
|
|
|||||||||||||||||
| TOTAL CONNECTICUT | 8,252,429 | |||||||||||||||||
|
|
||||||||||||||||||
| DELAWARE - 0.1% | ||||||||||||||||||
| 1,100,000 | Delaware Economic Development Authority, Revenue Bonds, ASPIRA of Delaware Charter Operations, Inc. Project, Series 2016A | 5.000 | 06/01/51 | 1,035,071 | ||||||||||||||
|
|
|
|||||||||||||||||
| TOTAL DELAWARE | 1,035,071 | |||||||||||||||||
|
|
||||||||||||||||||
| DISTRICT OF COLUMBIA - 2.4% | ||||||||||||||||||
| 300,000 | District of Columbia Revenue Bonds, Rocketship Education DC Public Charter School Inc., Obligated Group -Issue 3, Series 2024A | 5.750 | 06/01/54 | 304,992 | ||||||||||||||
| 64,000,000 | District of Columbia Tobacco Settlement Corporation, Tobacco Settlement Asset-Backed Bonds, Series 2006A | 0.000 | 06/15/46 | 16,277,446 | ||||||||||||||
| 3,335,000 | District of Columbia Tobacco Settlement Corporation, Tobacco Settlement Asset-Backed Bonds, Series 2006C | 0.000 | 06/15/55 | 337,421 | ||||||||||||||
|
|
|
|||||||||||||||||
| TOTAL DISTRICT OF COLUMBIA | 16,919,859 | |||||||||||||||||
|
|
||||||||||||||||||
| FLORIDA - 18.4% | ||||||||||||||||||
| 250,000 | (c) | Alachua County Health Facilities Authority, Florida, Health Facilities Revenue Bonds, Terraces at Bonita Springs Project, Refunding Series 2022A | 5.000 | 11/15/61 | 184,300 | |||||||||||||
| 200,000 | Avenir Community Development District, Palm Beach Gardens, Florida, Special Assessment Bonds, Area 3 - Master Infrastructure Project, Series 2023 | 5.625 | 05/01/54 | 202,430 | ||||||||||||||
| 250,000 | (c) | Babcock Ranch Community Independent Special District, Charlotte County, Florida, Special Assessment Bonds, 2024 Project Series 2024 | 5.250 | 05/01/55 | 243,530 | |||||||||||||
| 2,500,000 | (c) | Capital Trust Agency, Florida, Educational Facilities Revenue Bonds, LLT Academy South Bay Project, Series 2020A | 6.000 | 06/15/55 | 2,525,827 | |||||||||||||
| See Notes to Financial Statements | 21 |
Portfolio of Investments March 31, 2025 (continued)
Enhanced High Yield Municipal Bond
| PRINCIPAL | DESCRIPTION | RATE | MATURITY | VALUE | ||||||||||||||
|
|
|
|||||||||||||||||
| FLORIDA (continued) | ||||||||||||||||||
| $ | 15,020,000 | (c) | Capital Trust Agency, Florida, Revenue Bonds, Educational Growth Fund, LLC, Charter School Portfolio Projects, Subordinate Series 2021B | 0.000% | 07/01/61 | $ | 1,014,227 | |||||||||||
| 1,345,000 | (c) | Capital Trust Agency, Florida, Revenue Bonds, Viera Charter School Project, Series 2019A | 5.000 | 10/15/54 | 1,279,152 | |||||||||||||
| 250,000 | (c) | Capital Trust Agency, Florida, Senior Living Facilities Revenue Bonds, Elim Senior Housing, Inc. Project, Series 2017 | 5.375 | 08/01/32 | 236,667 | |||||||||||||
| 175,000 | (c) | Capital Trust Agency, Florida, Senior Living Facilities Revenue Bonds, Elim Senior Housing, Inc. Project, Series 2017 | 5.625 | 08/01/37 | 161,908 | |||||||||||||
| 1,000,000 | (c) | Capital Trust Authority, Florida, Educational Facilities Revenue Bonds, Babcock Neighborhood School Inc Project, Series 2024 | 6.000 | 08/15/63 | 961,562 | |||||||||||||
| 500,000 | (c) | Capital Trust Authority, Florida, Educational Facilities Revenue Bonds, Imagine School at West Pasco Project, Series 2023A | 6.500 | 12/15/53 | 501,308 | |||||||||||||
| 4,100,000 | (c) | Capital Trust Authority, Florida, Educational Facilities Revenue Bonds, Imagine School at West Pasco Project, Series 2023A | 6.500 | 12/15/58 | 4,100,425 | |||||||||||||
| 1,750,000 | (c) | Capital Trust Authority, Florida, Educational Facilities Revenue Bonds, IPS Enterprises, Inc. Projects, Refunding Series 2023A | 6.250 | 06/15/53 | 1,806,511 | |||||||||||||
| 2,600,000 | (c) | Capital Trust Authority, Florida, Educational Facilities Revenue Bonds, IPS Enterprises, Inc. Projects, Refunding Series 2023A | 6.375 | 06/15/58 | 2,692,579 | |||||||||||||
| 1,890,000 | (b) | Celebration Pointe Community Development District 1, Alachua County, Florida, Special Assessment Revenue Bonds, Series 2021 | 4.000 | 05/01/53 | 1,495,878 | |||||||||||||
| 250,000 | (c) | Curiosity Creek Community Development District, Manatee County, Florida, Capital Improvement Revenue Bonds, Assessment Area 1, Series 2024 | 5.700 | 05/01/55 | 244,876 | |||||||||||||
| 500,000 | Edgewater West Community Development District, Osceola County, Florida, Special Assessment Revenue Bonds, Assessment Area One Series 2024 | 5.500 | 05/01/54 | 477,231 | ||||||||||||||
| 1,200,000 | (c) | Everlands Community Development District, Florida, Special Assessment Revenue Bonds, Assessment Area 2 Series 2024 | 5.500 | 06/15/54 | 1,174,688 | |||||||||||||
| 1,000,000 | (c) | Florida Development Finance Corporation, Educational Facilities Revenue Bonds, Creative Inspiration Journey School of St. Cloud, Series 2021A | 5.000 | 06/15/51 | 884,833 | |||||||||||||
| 4,600,000 | (c) | Florida Development Finance Corporation, Educational Facilities Revenue Bonds, Creative Inspiration Journey School of St. Cloud, Series 2021A | 5.000 | 06/15/56 | 3,985,832 | |||||||||||||
| 1,420,000 | (c) | Florida Development Finance Corporation, Educational Facilities Revenue Bonds, Discovery High School Project, Series 2020A | 5.000 | 06/01/40 | 1,138,868 | |||||||||||||
| 100,000 | (c) | Florida Development Finance Corporation, Educational Facilities Revenue Bonds, Dreamers Academy Project, Series 2022A | 6.000 | 01/15/57 | 92,986 | |||||||||||||
| 625,000 | (c) | Florida Development Finance Corporation, Educational Facilities Revenue Bonds, Global Outreach Charter Academy, Series 2021A | 4.000 | 06/30/36 | 530,811 | |||||||||||||
| 765,000 | (c) | Florida Development Finance Corporation, Educational Facilities Revenue Bonds, Global Outreach Charter Academy, Series 2021A | 4.000 | 06/30/41 | 596,100 | |||||||||||||
| 1,000,000 | (c) | Florida Development Finance Corporation, Educational Facilities Revenue Bonds, Pepin Academies of Pasco County Inc., Series 2020A | 5.000 | 01/01/50 | 846,269 | |||||||||||||
| 500,000 | (c) | Florida Development Finance Corporation, Educational Facilities Revenue Bonds, Southwest Charter Foundation Inc Projects, Series 2017A | 6.125 | 06/15/47 | 501,285 | |||||||||||||
| 1,400,000 | (c) | Florida Development Finance Corporation, Florida, Solid Waste Disposal Revenue Bonds, Waste Pro USA, Inc. Project, Series 2023, (AMT), (Mandatory Put 7/01/26) | 6.125 | 07/01/32 | 1,426,255 | |||||||||||||
| 31,400,000 | (c) | Florida Development Finance Corporation, Revenue Bonds, Brightline Florida Passenger Rail Expansion Project, Brightline Trains Florida LLC Issue, Series 2024, (AMT), (Mandatory Put 7/15/28) | 12.000 | 07/15/32 | 33,313,645 | |||||||||||||
| 1,800,000 | Florida Development Finance Corporation, Revenue Bonds, Brightline Florida Passenger Rail Expansion Project, Brightline Trains Florida LLC Issue, Series 2024, (AMT) | 5.000 | 07/01/41 | 1,751,627 | ||||||||||||||
| 2,300,000 | Florida Development Finance Corporation, Revenue Bonds, Brightline Florida Passenger Rail Expansion Project, Brightline Trains Florida LLC Issue, Series 2024 - AGM Insured, (AMT) | 5.250 | 07/01/47 | 2,348,515 | ||||||||||||||
| 22 | See Notes to Financial Statements |
| PRINCIPAL | DESCRIPTION | RATE | MATURITY | VALUE | ||||||||||||||
|
|
|
|||||||||||||||||
| FLORIDA (continued) | ||||||||||||||||||
| $ | 2,465,000 | Florida Development Finance Corporation, Revenue Bonds, Brightline Florida Passenger Rail Expansion Project, Brightline Trains Florida LLC Issue, Series 2024 - AGM Insured, (AMT) | 5.250% | 07/01/53 | $ | 2,512,001 | ||||||||||||
| 1,500,000 | Florida Development Finance Corporation, Revenue Bonds, Brightline Florida Passenger Rail Expansion Project, Brightline Trains Florida LLC Issue, Series 2024, (AMT) | 5.500 | 07/01/53 | 1,515,693 | ||||||||||||||
| 4,000,000 | (c) | Florida Development Finance Corporation, Revenue Bonds, Brightline Florida Passenger Rail Expansion Project, Brightline Trains Florida LLC Issue, Series 2024A, (AMT), (Mandatory Put 7/15/28) | 10.000 | 07/15/59 | 4,120,327 | |||||||||||||
| 12,000,000 | (c) | Florida Development Finance Corporation, Revenue Bonds, Brightline Florida Passenger Rail Expansion Project, Series 2025A, (AMT), (Mandatory Put 8/13/25) | 8.250 | 07/01/57 | 12,461,914 | |||||||||||||
| 3,040,000 | (c) | Florida Development Finance Corporation, Student Housing Revenue Bonds, SPP - Tampa I - LLC The Henry Project, Series 2024B | 6.500 | 06/01/59 | 3,084,655 | |||||||||||||
| 1,975,000 | Florida Housing Finance Corporation, Multifamily Mortgage Revenue Bonds, Brookside Square Apartments, Series 2015J, (Mandatory Put 6/01/32) | 5.000 | 06/01/57 | 1,858,224 | ||||||||||||||
| 250,000 | Hobe-Saint Lucie Conservancy District, Florida, Special Assessment Revenue Bonds, Improvement Unit 1A, Series 2024 | 5.875 | 05/01/55 | 254,382 | ||||||||||||||
| 730,000 | (c) | Kelly Park Community Development District, Florida, Special Assessment Revenue Bonds, Assessment Area One Project Series 2023 | 6.250 | 11/01/53 | 750,914 | |||||||||||||
| 1,210,000 | Lake County, Florida Retirement Facility Revenue Bonds, Lakeside at Waterman Village Project, Series 2020A | 5.750 | 08/15/50 | 1,188,953 | ||||||||||||||
| 1,000,000 | Lake County, Florida Retirement Facility Revenue Bonds, Lakeside at Waterman Village Project, Series 2020A | 5.750 | 08/15/55 | 969,906 | ||||||||||||||
| 1,405,000 | Lakewood Ranch Stewardship District, Florida, Special Assessment Revenue Bonds, Taylor Ranch Project, Series 2023 | 6.300 | 05/01/54 | 1,472,207 | ||||||||||||||
| 2,850,000 | (c) | Lee County Industrial Development Authority, Florida, Charter School Revenue Bonds, Lee County Community Charter Schools, Series 2024A | 6.250 | 06/15/42 | 2,882,837 | |||||||||||||
| 405,000 | (c) | LTC Ranch Residential Community Development District, Port Saint Lucie, Florida, Special Assessment Bonds, Assessment Area 4 Project, Refunding Series 2024AA4 | 5.650 | 05/01/54 | 396,687 | |||||||||||||
| 870,000 | (c) | Magnolia Island Community Development District, Pasco County, Florida, Capital Improvement Revenue Bonds, Assessment Area 1, series 2025 | 5.750 | 05/01/55 | 863,166 | |||||||||||||
| 85,000 | (c) | Mandarin Grove Community Development District, Manatee County, Florida, Special Assessment Revenue Bonds, 2022 Project Series 2022 | 6.625 | 05/01/53 | 98,137 | |||||||||||||
| 3,000,000 | (c) | Miami-Dade County Housing Finance Authority, Florida, Multifamily Mortgage Revenue Bonds, Wynwood Works, Series 2023B, (Mandatory Put 6/01/26) | 5.780 | 06/01/27 | 3,010,894 | |||||||||||||
| 1,000,000 | (c) | Miami-Dade County Industrial Development Authority, Florida, Industrial Development Revenue Bonds, CFC-MB I, LLC Collins Park Housing Project Series 2023 | 6.250 | 01/01/59 | 996,373 | |||||||||||||
| 415,000 | (c) | Middleton Community Development District A, Florida, Special Assessment Revenue Bonds, Series 2022 | 6.200 | 05/01/53 | 435,198 | |||||||||||||
| 120,000 | (c) | Mirada Community Development District, Florida, Capital Improvement Bonds, Assessment Area 3 Series 2024 | 6.000 | 05/01/55 | 120,366 | |||||||||||||
| 70,000 | (c) | North Powerline Road Community Development District, Polk County, Florida, Special Assessment Revenue Bonds, Series 2022 | 5.625 | 05/01/52 | 71,613 | |||||||||||||
| 1,000,000 | (c) | Ocean and Highway Port Authority, Florida, Port Facilities Revenue Bonds, Worldwide Terminals Fernandina, LLC Project, Series 2019, (AMT) | 5.500 | 12/01/49 | 807,644 | |||||||||||||
| 1,500,000 | (c) | Palm Beach County, Florida, Revenue Bonds, Provident Group - LU Properties LLC Lynn University Housing Project, Series 2021A | 5.000 | 06/01/57 | 1,355,017 | |||||||||||||
| 2,560,000 | Palm Beach County, Florida, Revenue Bonds, Provident Group - LU Properties LLC Lynn University Housing Project, Series 2024A | 6.125 | 06/01/54 | 2,555,509 | ||||||||||||||
| 2,240,000 | Palm Beach County, Florida, Revenue Bonds, Provident Group - LU Properties LLC Lynn University Housing Project, Series 2024A | 6.250 | 06/01/59 | 2,251,370 | ||||||||||||||
| See Notes to Financial Statements | 23 |
Portfolio of Investments March 31, 2025 (continued)
Enhanced High Yield Municipal Bond
| PRINCIPAL | DESCRIPTION | RATE | MATURITY | VALUE | ||||||||||||||
|
|
|
|||||||||||||||||
| FLORIDA (continued) | ||||||||||||||||||
| $ | 1,725,000 | (c) | Parrish Lakes Community Development District, Manatee County, Florida, Capital Improvement Revenue Bonds, Assessment Area 2, Series 2023A | 5.625% | 05/01/53 | $ | 1,737,287 | |||||||||||
| 240,000 | (c) | Parrish Lakes Community Development District, Manatee County, Florida, Capital Improvement Revenue Bonds, Assessment Area 3, Series 2024 | 5.800 | 05/01/54 | 235,151 | |||||||||||||
| 1,125,000 | (c) | Peace Creek Village Community Development District, Winter Haven, Florida, Special Assessment Revenue Bonds, Series 2025 | 5.850 | 05/01/55 | 1,110,022 | |||||||||||||
| 710,000 | Pine Island Community Development District, Florida, Special Assessment Bonds, Bella Collina, Series 2004 | 5.750 | 05/01/35 | 713,139 | ||||||||||||||
| 1,500,000 | (c) | Pioneer Ranch Community Development District, Marion County, Florida, Special Assessment Bonds, Series 2024 | 5.300 | 05/01/55 | 1,417,126 | |||||||||||||
| 1,000,000 | (c) | Rye Ranch Community Development District, Florida, Special Assessment Revenue Bonds, Pod B - Assessment Area 1 Series 2023 | 6.000 | 11/01/53 | 1,024,838 | |||||||||||||
| 1,000,000 | (c) | Saltleaf Community Development District, Florida, Capital Improvement Revenue Bonds, Series 2024 | 6.000 | 05/01/56 | 1,006,536 | |||||||||||||
| 500,000 | (c) | Sawyers Landing Community Development District, Florida, Special Assessment Revenue Bonds, Series 2021 | 4.250 | 05/01/53 | 423,478 | |||||||||||||
| 415,000 | Seminole County Industrial Development Authority, Florida, Retirement Facility Revenue Bonds, Legacy Pointe At UCF Project, Series 2019A | 5.000 | 11/15/29 | 417,712 | ||||||||||||||
| 3,980,000 | Seminole County Industrial Development Authority, Florida, Retirement Facility Revenue Bonds, Legacy Pointe At UCF Project, Series 2019A | 5.500 | 11/15/49 | 3,884,206 | ||||||||||||||
| 1,500,000 | Seminole County Industrial Development Authority, Florida, Retirement Facility Revenue Bonds, Legacy Pointe At UCF Project, Series 2019A | 5.750 | 11/15/54 | 1,493,206 | ||||||||||||||
| 465,000 | (c) | Three Rivers Community Development District, Florida, Special Assessment Revenue Bonds, South Assessment Area Series 2021B | 4.625 | 05/01/36 | 448,379 | |||||||||||||
| 2,000,000 | Tradition Community Development District 1, Port Saint Lucie, Florida, Irrigation System Revenue Bonds, Existing System Series 2017 | 4.500 | 10/01/47 | 1,833,196 | ||||||||||||||
| 880,000 | (e) | Tradition Community Development District 9, Port Saint Lucie, Florida, Special Assessment Bonds, Series 2025 | 5.650 | 05/01/56 | 867,897 | |||||||||||||
| 2,000,000 | (c) | Venice, Florida, Retirement Community Revenue Improvement Bonds, Village On The Isle Project, Fixed Rate Series 2024A | 5.625 | 01/01/60 | 2,008,725 | |||||||||||||
| 225,000 | (c) | Village Community Development District 15, Florida, Special Assessment Revenue Bonds, Series 2023 | 5.250 | 05/01/54 | 229,725 | |||||||||||||
| 665,000 | West Villages Improvement District, Florida, Special Assessment Revenue Bonds, Unit of Development 7 Villages F-3 and G-1B Series 2023 | 6.250 | 05/01/54 | 698,479 | ||||||||||||||
|
|
|
|||||||||||||||||
| TOTAL FLORIDA | 132,303,214 | |||||||||||||||||
|
|
||||||||||||||||||
| GEORGIA - 1.8% | ||||||||||||||||||
| 9,910,000 | (d) | Atlanta Development Authority, Georgia, Economic Development Certificates, Gulch Enterprise Zone Project, Convertible Capital Appreciation Series 2024A-1 Class A | 0.000 | 12/15/48 | 8,514,416 | |||||||||||||
| 1,950,000 | (b) | Atlanta Development Authority, Georgia, Senior Health Care Facilities Revenue Bonds, Georgia Proton Treatment Center Project, Current Interest Series 2017A-1 | 7.000 | 01/01/40 | 780,000 | |||||||||||||
| 1,750,000 | (c) | Bulloch County Development Authority, Georgia, Charter School Revenue Bonds, Statesboro Steam Academy Project Series 2024 | 6.750 | 06/15/64 | 1,764,650 | |||||||||||||
| 500,000 | Cobb County Development Authority, Georgia, Charter School Revenue Bonds, Northwest Classical Academy, Inc. Project, Series 2023A | 6.375 | 06/15/58 | 503,240 | ||||||||||||||
| 1,670,000 | Fayette County Development Authority, Georgia, Revenue Bonds, United States Soccer Federation, Inc. Project Series 2024 | 5.250 | 10/01/54 | 1,733,815 | ||||||||||||||
|
|
|
|||||||||||||||||
| TOTAL GEORGIA | 13,296,121 | |||||||||||||||||
|
|
||||||||||||||||||
| HAWAII - 0.1% | ||||||||||||||||||
| 1,000,000 | (c) | Hawaii County, Hawaii, Special Tax Revenue Bonds, Community Facilities District 1-2021, Kaloko Heights Project, Series 2023 | 7.250 | 05/15/52 | 996,200 | |||||||||||||
|
|
|
|||||||||||||||||
| TOTAL HAWAII | 996,200 | |||||||||||||||||
|
|
||||||||||||||||||
| 24 | See Notes to Financial Statements |
| PRINCIPAL | DESCRIPTION | RATE | MATURITY | VALUE | ||||||||||||||
|
|
|
|||||||||||||||||
| IDAHO - 0.6% | ||||||||||||||||||
| $ | 186,000 | (c) | Eagle Avimor Community Infrastructure District 1, Ada, Boise, and Gem Counties, Idaho, Special Assessment Revenue Bonds, Assessment Area 5 Series 2024 | 5.875% | 09/01/53 | $ | 190,311 | |||||||||||
| 500,000 | (c) | Eagle Avimor Community Infrastructure District 1, Ada, Boise, and Gem Counties, Idaho, Special Assessment Revenue Bonds, Assessment Area 6 Series 2024B | 5.500 | 09/01/53 | 501,394 | |||||||||||||
| 1,980,000 | (c) | Idaho Falls Auditorium District, Idaho, Certifications of Participation, Annual Appropriation Series 2021 | 5.250 | 05/15/51 | 1,951,198 | |||||||||||||
| 730,000 | (c) | Idaho Housing and Finance Association, Nonprofit Facilities Revenue Bonds, Doral Academy of Idaho, Series 2021A | 5.000 | 07/15/41 | 633,184 | |||||||||||||
| 250,000 | (c) | Idaho Housing and Finance Association, Nonprofit Facilities Revenue Bonds, Doral Academy of Idaho, Series 2021A | 5.000 | 07/15/56 | 197,723 | |||||||||||||
| 250,000 | (c) | Idaho Housing and Finance Association, Nonprofit Facilities Revenue Bonds, Gem Prep Meridian South Charter School Project, Series 2021 | 4.000 | 05/01/56 | 180,331 | |||||||||||||
| 500,000 | Spring Valley Community Infrastructure District 1, Eagle, Idaho, Special Assessment Bonds, Series 2024 | 6.250 | 09/01/53 | 521,361 | ||||||||||||||
|
|
|
|||||||||||||||||
| TOTAL IDAHO | 4,175,502 | |||||||||||||||||
|
|
||||||||||||||||||
| ILLINOIS - 3.1% | ||||||||||||||||||
| 346,166 | (c) | Chicago, Illinois, Certificates of Participation, Tax Increment Allocation Revenue Note, North Pullman Chicago Neighborhood Initiative, Inc.Redevelopement Project-Whole Foods Warehouse & Distribution Facility, Series 2016A | 5.000 | 03/15/34 | 346,307 | |||||||||||||
| 950,000 | (c) | Illinois Finance Authority, Charter School Revenue Bonds, Art in Motion AIM Project, Series 2021A | 4.000 | 07/01/31 | 836,754 | |||||||||||||
| 1,500,000 | (c) | Illinois Finance Authority, Charter School Revenue Bonds, Art in Motion AIM Project, Series 2021A | 5.000 | 07/01/51 | 1,132,132 | |||||||||||||
| 2,750,000 | (c) | Illinois Finance Authority, Charter School Revenue Bonds, Art in Motion AIM Project, Series 2021A | 5.000 | 07/01/56 | 2,024,168 | |||||||||||||
| 250,000 | Illinois Finance Authority, Revenue Bonds, Admiral at the Lake Project, Refunding Series 2017 | 5.500 | 05/15/54 | 198,807 | ||||||||||||||
| 1,280,000 | (b) | Illinois Finance Authority, Revenue Bonds, Christian Homes Inc. Obligated Group, Refunding Series 2016 | 5.000 | 05/15/31 | 934,400 | |||||||||||||
| 2,800,000 | (b) | Illinois Finance Authority, Revenue Bonds, Christian Homes Inc. Obligated Group, Refunding Series 2016 | 5.000 | 05/15/36 | 2,044,000 | |||||||||||||
| 500,000 | (b) | Illinois Finance Authority, Revenue Bonds, Christian Horizons Obligated Group, Series 2021A | 4.000 | 05/15/41 | 365,000 | |||||||||||||
| 7,375,000 | (c) | Illinois Finance Authority, Revenue Bonds, Roosevelt University, Series 2019A | 6.125 | 04/01/58 | 7,221,531 | |||||||||||||
| 2,000,000 | (c) | Illinois Finance Authority, Solid Waste Revenue Bonds, LRS Holdings LLC Project, Series 2023B, (Mandatory Put 9/01/33) | 7.375 | 09/01/42 | 2,292,545 | |||||||||||||
| 2,000,000 | Metropolitan Pier and Exposition Authority, Illinois, McCormick Place Expansion Project Bonds, Refunding Series 2022A | 4.000 | 12/15/47 | 1,760,038 | ||||||||||||||
| 3,000,000 | Palos Heights, Illinois, Revenue Bonds, Trinity Christian College Association, Series 2024A | 7.000 | 01/01/50 | 2,882,225 | ||||||||||||||
|
|
|
|||||||||||||||||
| TOTAL ILLINOIS | 22,037,907 | |||||||||||||||||
|
|
||||||||||||||||||
| INDIANA - 0.5% | ||||||||||||||||||
| 85,000 | (c) | Indiana Finance Authority, Educational Facilities Revenue Bonds, Circle City Preparatory Inc. Project, Series 2021A | 5.000 | 12/01/30 | 81,764 | |||||||||||||
| 700,000 | Indiana Finance Authority, Educational Facilities Revenue Bonds, Seven Oaks Classical School Project, Series 2021A | 5.000 | 06/01/51 | 614,427 | ||||||||||||||
| 775,000 | Indiana Finance Authority, Educational Facilities Revenue Bonds, University of Evansville Project, Series 2022A | 5.250 | 09/01/57 | 745,222 | ||||||||||||||
| 750,000 | Indiana Housing and Community Development Authority, Multifamily Housing Revenue Bonds, Vita of New Whiteland Project, Series 2022 | 6.750 | 01/01/43 | 746,280 | ||||||||||||||
| 1,000,000 | Indianapolis Local Public Improvement Bond Bank, Indiana, Revenue Bonds, Convention Center Hotel Subordinate Series 2023F-1 | 7.750 | 03/01/67 | 1,109,257 | ||||||||||||||
|
|
|
|||||||||||||||||
| TOTAL INDIANA | 3,296,950 | |||||||||||||||||
|
|
||||||||||||||||||
| See Notes to Financial Statements | 25 |
Portfolio of Investments March 31, 2025 (continued)
Enhanced High Yield Municipal Bond
| PRINCIPAL | DESCRIPTION | RATE | MATURITY | VALUE | ||||||||||||||
|
|
|
|||||||||||||||||
| IOWA - 0.1% | ||||||||||||||||||
| $ | 1,000,000 | Iowa Finance Authority Senior Living Facilities Revenue Bonds, Sunrise Retirement Community Project, Refunding Series 2021 | 5.000% | 09/01/51 | $ | 763,662 | ||||||||||||
|
|
|
|||||||||||||||||
| TOTAL IOWA | 763,662 | |||||||||||||||||
|
|
||||||||||||||||||
| KANSAS - 1.0% | ||||||||||||||||||
| 1,060,000 | Hutchinson, Kansas, Hospital Facilities Revenue Bonds, Hutchinson Regional Medical Center, Inc., Series 2016 | 5.000 | 12/01/41 | 888,394 | ||||||||||||||
| 1,725,000 | Kansas Development Finance Authority Revenue Bonds, Village Shalom Project, Series 2018A | 5.250 | 11/15/53 | 1,106,751 | ||||||||||||||
| 100,000 | Overland Park Development Corporation, Kansas, Revenue Bonds, Convention Center Hotel, Refunding & improvement Series 2019 | 5.000 | 03/01/49 | 98,537 | ||||||||||||||
| 6,250,000 | (b) | Overland Park, Kansas, Sales Tax Special Obligation Revenue Bonds, Prairiefire at Lionsgate Project, Series 2012 | 5.250 | 12/15/29 | 3,125,000 | |||||||||||||
| 1,000,000 | Wichita, Kansas, Health Care Facilities Revenue Bonds, Presbyterian Manors, Series 2024VIII | 6.000 | 05/15/54 | 997,619 | ||||||||||||||
| 1,000,000 | (c) | Wyandotte County-Kansas City Unified Government, Kansas, Sales Tax Special Obligation Bonds, Village East Project Areas 2B 3 and 5, Series 2022 | 5.750 | 03/01/41 | 1,029,856 | |||||||||||||
|
|
|
|||||||||||||||||
| TOTAL KANSAS | 7,246,157 | |||||||||||||||||
|
|
||||||||||||||||||
| LOUISIANA - 1.9% | ||||||||||||||||||
| 1,500,000 | (c) | Louisiana Publc Facilities Authority, Lousiana, Revenue Bonds, Lincoln Preparatory School Project, Series 2021A | 5.250 | 06/01/60 | 1,216,545 | |||||||||||||
| 2,850,000 | (c) | Louisiana Publc Facilities Authority, Lousiana, Revenue Bonds, Young Audiences Charter School, Series 2019A | 5.000 | 04/01/39 | 2,615,824 | |||||||||||||
| 2,635,000 | (c) | Louisiana Publc Facilities Authority, Lousiana, Revenue Bonds, Young Audiences Charter School, Series 2019A | 5.000 | 04/01/49 | 2,275,762 | |||||||||||||
| 1,000,000 | (c) | Louisiana Publc Facilities Authority, Lousiana, Revenue Bonds, Young Audiences Charter School, Series 2019A | 5.000 | 04/01/57 | 830,872 | |||||||||||||
| 2,365,000 | (c) | Louisiana Public Facilities Authority, Dock and Wharf Revenue Bonds, Impala Warehousing (US) LLC Project, Series 2013, (AMT) | 6.500 | 07/01/36 | 2,365,851 | |||||||||||||
| 44,403 | (b),(c) | Louisiana Public Facilities Authority, Louisiana, Revenue Bonds, Encore Academy Project, Series 2021A | 5.000 | 06/01/41 | 6,661 | |||||||||||||
| 44,028 | (b),(c) | Louisiana Public Facilities Authority, Louisiana, Revenue Bonds, Encore Academy Project, Series 2021A | 5.000 | 06/01/51 | 6,604 | |||||||||||||
| 950,000 | (c) | Louisiana Public Facilities Authority, Louisiana, Revenue Bonds, Lincoln Preparatory School Project, Series 2022A | 6.375 | 06/01/52 | 924,006 | |||||||||||||
| 2,000,000 | (c) | Louisiana Public Facilities Authority, Solid Waste Disposal Revenue Bonds, Waste Pro USA Inc Project Series 2023, (AMT), (Mandatory Put 10/01/28) | 6.750 | 10/01/53 | 2,147,261 | |||||||||||||
| 500,000 | Louisiana Public Facilities Authority, Solid Waste Disposal Revenue Bonds, Waste Pro USA Inc Project Series 2023R-2, (AMT), (Mandatory Put 10/01/28) | 6.500 | 10/01/53 | 533,057 | ||||||||||||||
| 500,000 | (c) | Plaquemines Port, Louisiana, Harbor and Terminal District Facilities Revenue Bonds NOLA Terminal LLC Project Dock and Wharf Series 2024A | 9.000 | 12/01/44 | 489,500 | |||||||||||||
|
|
|
|||||||||||||||||
| TOTAL LOUISIANA | 13,411,943 | |||||||||||||||||
|
|
||||||||||||||||||
| MAINE - 0.3% | ||||||||||||||||||
| 2,000,000 | Maine Health and Higher Educational Facilities Authority Revenue Bonds, Eastern Maine Medical Center Obligated Group Issue, Series 2016A | 5.000 | 07/01/46 | 1,841,238 | ||||||||||||||
|
|
|
|||||||||||||||||
| TOTAL MAINE | 1,841,238 | |||||||||||||||||
|
|
||||||||||||||||||
| MARYLAND - 0.2% | ||||||||||||||||||
| 135,000 | (c) | Maryland Health and Higher Educational Facilities Authority, Revenue Bonds, Imagine Andrews Public Charter School, Series 2022A | 5.500 | 05/01/52 | 130,015 | |||||||||||||
| 1,000,000 | (c) | Prince George’s County, Maryland, Special Obligation Bonds, Westphalia Town Center Project, Series 2018 | 5.250 | 07/01/48 | 1,007,530 | |||||||||||||
|
|
|
|||||||||||||||||
| TOTAL MARYLAND | 1,137,545 | |||||||||||||||||
|
|
||||||||||||||||||
| MASSACHUSETTS - 0.1% | ||||||||||||||||||
| 1,000,000 | Massachusetts Development Finance Agency Revenue Bonds, Lawrence General Hospital Issue, Series 2017 | 5.000 | 07/01/42 | 886,271 | ||||||||||||||
|
|
|
|||||||||||||||||
| TOTAL MASSACHUSETTS | 886,271 | |||||||||||||||||
|
|
||||||||||||||||||
| 26 | See Notes to Financial Statements |
| PRINCIPAL | DESCRIPTION | RATE | MATURITY | VALUE | ||||||||||||||
|
|
|
|||||||||||||||||
| MICHIGAN - 1.0% | ||||||||||||||||||
| $ | 5,525,000 | Detroit City & General Retirement System Service Corporation, Michigan, Certificates of Participation, Taxable Series 2005A -FGIC Insured | 3.000% | 06/15/20 | $ | 5,469,750 | ||||||||||||
| 330,000 | Michigan Finance Authority, Public School Academy Limited Obligation Revenue Bonds, Holly Academy Project, Refunding Series 2021 | 4.000 | 12/01/51 | 261,797 | ||||||||||||||
| 290,000 | Michigan Finance Authority, Public School Academy Limited Obligation Revenue Bonds, Madison Academy Project, Refunding Series 2021 | 5.000 | 12/01/46 | 252,590 | ||||||||||||||
| 40,000,000 | Michigan Tobacco Settlement Finance Authority, Tobacco Settlement Asset-Backed Revenue Bonds, Capital Appreciation Turbo Term Series 2008C | 0.000 | 06/01/58 | 1,246,524 | ||||||||||||||
| 185,000 | Trillium Academy, Michigan, Public School Academy Revenue Bonds, Refunding Series 2019 | 5.750 | 11/01/40 | 181,886 | ||||||||||||||
|
|
|
|||||||||||||||||
| TOTAL MICHIGAN | 7,412,547 | |||||||||||||||||
|
|
||||||||||||||||||
| MINNESOTA - 0.8% | ||||||||||||||||||
| 500,000 | Bethel, Minnesota, Charter School Lease Revenue Bonds, Level Up Academy, Series 2021A | 5.000 | 06/15/56 | 368,084 | ||||||||||||||
| 1,000,000 | (c) | Deephaven, Minnesota, Charter School Lease Revenue Bonds, Seven Hills Preparatory Academy Project, Series 2024A | 6.125 | 06/15/61 | 955,210 | |||||||||||||
| 770,000 | (c) | Minneapolis, Minnesota, Charter School Lease Revenue Bonds, Spero Academy Project, Series 2017A | 6.500 | 07/01/48 | 777,040 | |||||||||||||
| 2,000,000 | Rochester, Minnesota, Charter School Lease Revenue Bonds, Rochester Math & Science Academy Project, Series 2018A | 5.125 | 09/01/38 | 1,724,018 | ||||||||||||||
| 1,000,000 | (b),(c) | Saint Cloud, Minnesota, Charter School Lease Revenue Bonds, Athlos Academy, Series 2022A | 5.875 | 06/01/57 | 750,000 | |||||||||||||
| 1,000,000 | (c) | Saint Paul Housing & Redevelopment Authority, Minnesota, Charter School Lease Revenue Bonds, Community School of Excellence, Series 2023 |
5.250 | 03/01/43 | 994,483 | |||||||||||||
|
|
|
|||||||||||||||||
| TOTAL MINNESOTA | 5,568,835 | |||||||||||||||||
|
|
||||||||||||||||||
| MISSOURI - 2.2% | ||||||||||||||||||
| 2,000,000 | Independence Industrial Development Authority, Missouri, Revenue Bonds, Tax Increment and Special Districts, Hub Drive Redevelopment Project Series 2023 | 6.750 | 11/01/53 | 2,031,599 | ||||||||||||||
| 250,000 | (c) | Kansas City Industrial Development Authority, Missouri, Economic Activity Tax Revenue Bonds, Historic Northeast Redevelopment Plan Series 2024A-1 | 5.000 | 06/01/54 | 237,939 | |||||||||||||
| 1,000,000 | Kirkwood Industrial Development Authority, Missouri, Retirement Community Revenue Bonds, Aberdeen Heights Project, Refunding Series 2017A | 5.000 | 05/15/26 | 997,471 | ||||||||||||||
| 800,000 | Kirkwood Industrial Development Authority, Missouri, Retirement Community Revenue Bonds, Aberdeen Heights Project, Refunding Series 2017A | 5.000 | 05/15/27 | 796,559 | ||||||||||||||
| 2,000,000 | Kirkwood Industrial Development Authority, Missouri, Retirement Community Revenue Bonds, Aberdeen Heights Project, Refunding Series 2017A | 5.250 | 05/15/42 | 1,841,163 | ||||||||||||||
| 1,000,000 | Kirkwood Industrial Development Authority, Missouri, Retirement Community Revenue Bonds, Aberdeen Heights Project, Refunding Series 2017A | 5.250 | 05/15/50 | 870,084 | ||||||||||||||
| 250,000 | (c) | Land Clearance for Redevelopment Authority of Kansas City, Missouri, Project Revenue Bonds, Convention Center Hotel Project - TIF Financing, Series 2018B | 5.000 | 02/01/40 | 243,334 | |||||||||||||
| 4,375,000 | (c) | Land Clearance for Redevelopment Authority of Kansas City, Missouri, Project Revenue Bonds, Convention Center Hotel Project - TIF Financing, Series 2018B | 5.000 | 02/01/50 | 4,155,819 | |||||||||||||
| 1,555,000 | (b) | Missouri Health and Educational Facilities Authority, Revenue Bonds, Christian Homes Inc., Senior Living Facilities Series 2018 | 5.000 | 05/15/32 | 1,135,150 | |||||||||||||
| 2,280,000 | (b) | Missouri Health and Educational Facilities Authority, Revenue Bonds, Christian Homes Inc., Senior Living Facilities Series 2018 | 5.000 | 05/15/36 | 1,664,400 | |||||||||||||
| 1,975,000 | (b) | Missouri Health and Educational Facilities Authority, Revenue Bonds, Christian Homes Inc., Senior Living Facilities Series 2018 | 5.000 | 05/15/40 | 1,441,750 | |||||||||||||
| 100,000 | Missouri Southern State University, Auxiliary Enterprise System Revenue Bonds, Series 2021 | 4.000 | 10/01/34 | 94,362 | ||||||||||||||
| See Notes to Financial Statements | 27 |
Portfolio of Investments March 31, 2025 (continued)
Enhanced High Yield Municipal Bond
| PRINCIPAL | DESCRIPTION | RATE | MATURITY | VALUE | ||||||||||||||
|
|
|
|||||||||||||||||
| MISSOURI (continued) | ||||||||||||||||||
| $ | 100,000 | Missouri Southern State University, Auxiliary Enterprise System Revenue Bonds, Series 2021 | 4.000% | 10/01/44 | $ | 86,048 | ||||||||||||
| 235,725 | (c) | North Outer Forty Transportation Development District, Chesterfield, Missouri, Transportation Development Revenue Notes, Refunding Series 2021A | 4.000 | 12/01/46 | 173,030 | |||||||||||||
|
|
|
|||||||||||||||||
| TOTAL MISSOURI | 15,768,708 | |||||||||||||||||
|
|
||||||||||||||||||
| NEVADA - 0.4% | ||||||||||||||||||
| 900,865 | (b),(c) | Director of Nevada State Department of Business & Industry, Environmental Improvement Revenue Bonds, Fulcrum Sierra BioFuels LLC Project, Green Series 2018, (AMT) | 6.950 | 02/15/38 | 3,693 | |||||||||||||
| 2,600,000 | (c) | Director of Nevada State Department of Business and Industry, Revenue Bonds, Brightline West Passenger Rail Project, Series 2025A, (AMT), (Mandatory Put 1/01/33) | 9.500 | 01/01/65 | 2,591,557 | |||||||||||||
|
|
|
|||||||||||||||||
| TOTAL NEVADA | 2,595,250 | |||||||||||||||||
|
|
||||||||||||||||||
| NEW HAMPSHIRE - 0.6% | ||||||||||||||||||
| 2,000,000 | (c) | National Finance Authority, New Hampshire, Resource Recovery Revenue Bonds, Covanta Project, Refunding Series 2020B, (AMT), (Mandatory Put 7/02/40) | 3.750 | 07/01/45 | 1,693,119 | |||||||||||||
| 5,000,000 | (c) | New Hampshire National Finance Authority, Travis and Burnet Counties, Special Revenue Bonds, Thomas Ranch Project Capital Appreciation Improvement Districts Series 2024 | 0.000 | 12/01/34 | 2,652,197 | |||||||||||||
|
|
|
|||||||||||||||||
| TOTAL NEW HAMPSHIRE | 4,345,316 | |||||||||||||||||
|
|
||||||||||||||||||
| NEW JERSEY - 0.7% | ||||||||||||||||||
| 5,000,000 | New Jersey Economic Development Authority, Special Facilities Revenue Bonds, Continental Airlines Inc., Refunding Series 2012, (AMT) | 5.750 | 09/15/27 | 5,007,164 | ||||||||||||||
|
|
|
|||||||||||||||||
| TOTAL NEW JERSEY | 5,007,164 | |||||||||||||||||
|
|
||||||||||||||||||
| NEW YORK - 8.9% | ||||||||||||||||||
| 6,550,000 | (c) | Dormitory Authority of the State of New York, General Revenue Bonds, American Musical and Dramatic Academy Inc., Series 2023A | 7.250 | 07/01/53 | 6,611,175 | |||||||||||||
| 4,500,000 | (c) | Dormitory Authority of the State of New York, Revenue Bonds, Orange Regional Medical Center Obligated Group, Series 2017 | 5.000 | 12/01/36 | 4,322,260 | |||||||||||||
| 1,500,000 | (c) | Dormitory Authority of the State of New York, Revenue Bonds, Orange Regional Medical Center Obligated Group, Series 2017 | 5.000 | 12/01/37 | 1,421,184 | |||||||||||||
| 10,000,000 | Erie County Tobacco Asset Securitization Corporation, New York, Tobacco Settlement Asset-Backed Bonds, 1st Subordinate Series 2005B | 0.000 | 06/01/47 | 2,096,011 | ||||||||||||||
| 4,760,000 | Glen Cove Local Economic Assistance Corporation, New York, Revenue Bonds, Garvies Point Public Improvement Project, Capital Appreciation Series 2016B | 0.000 | 01/01/45 | 1,291,375 | ||||||||||||||
| 8,500,000 | Glen Cove Local Economic Assistance Corporation, New York, Revenue Bonds, Garvies Point Public Improvement Project, Capital Appreciation Series 2016C | 5.625 | 01/01/55 | 7,573,485 | ||||||||||||||
| 2,000,000 | Monroe County Industrial Development Corporation, New York, Revenue Bonds, Saint Ann?s Community Project, Series 2019 | 5.000 | 01/01/50 | 1,721,788 | ||||||||||||||
| 1,000,000 | New York City Housing Development Corporation, New York, Multifamily Housing Revenue Bonds, Sustainable Neighborhood Green Series 2020D-1B | 2.400 | 11/01/50 | 611,038 | ||||||||||||||
| 750,000 | (b) | New York City Industrial Development Agency, New York, Civic Facility Revenue Bonds, Bronx Parking Development Company, LLC Project, Series 2007 | 2.350 | 10/01/46 | 480,000 | |||||||||||||
| 2,500,000 | (c) | New York Liberty Development Corporation, New York, Liberty Revenue Bonds, 3 World Trade Center Project, Class 3 Series 2014 | 7.250 | 11/15/44 | 2,507,067 | |||||||||||||
| 12,235,000 | (a) | New York Transportation Development Corporation, New York, Special Facilities Revenue Bonds, Terminal 6 John F Kennedy International Airport Redevelopment Project, Senior Green Series 2024A, (AMT), (UB) | 5.250 | 12/31/54 | 12,662,983 | |||||||||||||
| 750,000 | Syracuse Industrial Development Authority, New York, PILOT Revenue Bonds, Carousel Center Project, Refunding Series 2016A, (AMT) | 5.000 | 01/01/28 | 605,775 | ||||||||||||||
| 28 | See Notes to Financial Statements |
| PRINCIPAL | DESCRIPTION | RATE | MATURITY | VALUE | ||||||||||||||
|
|
|
|||||||||||||||||
| NEW YORK (continued) | ||||||||||||||||||
| $ | 1,450,000 | Syracuse Industrial Development Authority, New York, PILOT Revenue Bonds, Carousel Center Project, Refunding Series 2016A, (AMT) | 5.000% | 01/01/29 | $ | 1,145,930 | ||||||||||||
| 150,000 | Syracuse Industrial Development Authority, New York, PILOT Revenue Bonds, Carousel Center Project, Refunding Series 2016A, (AMT) | 5.000 | 01/01/30 | 116,821 | ||||||||||||||
| 4,135,000 | Syracuse Industrial Development Authority, New York, PILOT Revenue Bonds, Carousel Center Project, Refunding Series 2016A, (AMT) | 5.000 | 01/01/31 | 3,189,232 | ||||||||||||||
| 1,010,000 | Syracuse Industrial Development Authority, New York, PILOT Revenue Bonds, Carousel Center Project, Refunding Series 2016A, (AMT) | 5.000 | 01/01/32 | 772,332 | ||||||||||||||
| 3,050,000 | Syracuse Industrial Development Authority, New York, PILOT Revenue Bonds, Carousel Center Project, Refunding Series 2016A, (AMT) | 5.000 | 01/01/33 | 2,318,245 | ||||||||||||||
| 630,000 | Syracuse Industrial Development Authority, New York, PILOT Revenue Bonds, Carousel Center Project, Refunding Series 2016A, (AMT) | 5.000 | 01/01/34 | 476,565 | ||||||||||||||
| 2,200,000 | Syracuse Industrial Development Authority, New York, PILOT Revenue Bonds, Carousel Center Project, Refunding Series 2016A, (AMT) | 5.000 | 01/01/35 | 1,657,774 | ||||||||||||||
| 650,000 | Syracuse Industrial Development Authority, New York, PILOT Revenue Bonds, Carousel Center Project, Refunding Series 2016A, (AMT) | 5.000 | 01/01/36 | 488,242 | ||||||||||||||
| 11,000,000 | TSASC Inc., New York, Tobacco Asset-Backed Bonds, Series 2006 | 5.000 | 06/01/48 | 10,095,032 | ||||||||||||||
| 2,000,000 | (c) | Westchester County Local Development Corporation, New York, Revenue Bond, Purchase Senior Learning Community, Inc. Project, Accd Inv Series 2021A | 4.500 | 07/01/56 | 1,736,296 | |||||||||||||
| 250,000 | (c) | Westchester County Local Development Corporation, New York, Revenue Bond, Purchase Senior Learning Community, Inc. Project, Accd Inv Series 2021A | 5.000 | 07/01/56 | 238,401 | |||||||||||||
|
|
|
|||||||||||||||||
| TOTAL NEW YORK | 64,139,011 | |||||||||||||||||
|
|
||||||||||||||||||
| NORTH CAROLINA - 0.1% | ||||||||||||||||||
| 745,000 | North Carolina Medical Care Commission, Retirement Facility Revenue Bonds, Penick Village Project First Mortgage Series 2024A | 5.500 | 09/01/54 | 732,210 | ||||||||||||||
|
|
|
|||||||||||||||||
| TOTAL NORTH CAROLINA | 732,210 | |||||||||||||||||
|
|
||||||||||||||||||
| NORTH DAKOTA - 0.6% | ||||||||||||||||||
| 3,725,000 | (a) | North Dakota Housing Finance Agency, Home Mortgage Finance Program Bonds, Social Series 2024A, (UB) | 4.700 | 07/01/49 | 3,682,972 | |||||||||||||
| 1,000,000 | Ward County Health Care, North Dakota, Revenue Bonds, Trinity Obligated Group, Series 2017C | 5.000 | 06/01/53 | 950,316 | ||||||||||||||
|
|
|
|||||||||||||||||
| TOTAL NORTH DAKOTA | 4,633,288 | |||||||||||||||||
|
|
||||||||||||||||||
| OHIO - 5.2% | ||||||||||||||||||
| 245,000 | (c) | Brecksville, Ohio, Tax Increment Financing Revenue Bonds, Valor Acres Project, Series 2022 | 5.625 | 12/01/53 | 234,693 | |||||||||||||
| 40,000,000 | Buckeye Tobacco Settlement Financing Authority, Ohio, Tobacco Settlement Asset-Backed Revenue Bonds, Refunding Senior Lien Capital Appreciation Series 2020B-3 Class 2 | 0.000 | 06/01/57 | 3,984,936 | ||||||||||||||
| 15,000,000 | Buckeye Tobacco Settlement Financing Authority, Ohio, Tobacco Settlement Asset-Backed Revenue Bonds, Refunding Senior Lien Series 2020B-2 Class 2 | 5.000 | 06/01/55 | 13,240,538 | ||||||||||||||
| 2,000,000 | (c) | Cleveland-Cuyahoga County Port Authority, Ohio, Lease Revenue Bonds, Constellation Schools Project, Refunding & improvement Series 2024A | 5.875 | 01/01/49 | 1,957,681 | |||||||||||||
| 140,000 | (c) | Cleveland-Cuyahoga County Port Authority, Ohio, Tax Increment Financing Revenue Bonds, Flats East Bank Project, Refunding Senior Series 2021A | 4.000 | 12/01/55 | 110,338 | |||||||||||||
| 95,000 | Cleveland-Cuyahoga County Port Authority, Ohio, Tax Increment Financing Revenue Bonds, Flats East Bank Project, Refunding Subordinate Series 2021B | 4.500 | 12/01/55 | 78,858 | ||||||||||||||
| 4,250,000 | County of Lucas, Ohio, Hospital Revenue Bonds, ProMedica Healthcare Obligated Group, Series 2018A | 5.250 | 11/15/48 | 4,276,371 | ||||||||||||||
| See Notes to Financial Statements | 29 |
Portfolio of Investments March 31, 2025 (continued)
Enhanced High Yield Municipal Bond
| PRINCIPAL | DESCRIPTION | RATE | MATURITY | VALUE | ||||||||||||||
|
|
|
|||||||||||||||||
| OHIO (continued) | ||||||||||||||||||
| $ | 2,640,000 | Cuyahoga County, Ohio, Hospital Revenue Bonds, MetroHealth System, Series 2017 | 5.250% | 02/15/47 | $ | 2,599,508 | ||||||||||||
| 7,750,000 | (c) | Ohio Air Quality Development Authority, Ohio, Exempt Facilities Revenue Bonds, AMG Vanadium Project, Series 2019, (AMT) | 5.000 | 07/01/49 | 7,047,140 | |||||||||||||
| 250,000 | Ohio Air Quality Development Authority, Ohio, Pollution Control Revenue Bonds, FirstEnergy Generation Corporation Project, Refunding Series 2009D | 3.375 | 08/01/29 | 245,020 | ||||||||||||||
| 2,050,000 | (c) | Ohio Air Quality Development Authority, Ohio, Revenue Bonds, Pratt Paper Ohio, LLC Project, Series 2017, (AMT) | 4.500 | 01/15/48 | 1,904,909 | |||||||||||||
| 1,135,000 | (c) | Ohio Housing Finance Agency, Multifamily Housing Revenue Bonds, Sanctuary at Springboro Project, Series 2017 | 5.450 | 01/01/38 | 1,120,685 | |||||||||||||
| 250,000 | (c) | Ohio Housing Finance Agency, Multifamily Housing Revenue Bonds, Silver Birch of Mansfield Project, Series 2024 | 6.000 | 01/01/45 | 247,250 | |||||||||||||
|
|
|
|||||||||||||||||
| TOTAL OHIO | 37,047,927 | |||||||||||||||||
|
|
||||||||||||||||||
| OKLAHOMA - 0.2% | ||||||||||||||||||
| 1,000,000 | Osage County Industrial Authority, Oklahoma, Sales and Use Tax Revenue Bonds, Refunding Series 2023 | 5.750 | 09/01/53 | 987,794 | ||||||||||||||
| 100,000 | (c) | Tulsa Authority for Economic Opportunity, Tulsa County, Oklahoma, Tax Apportionment Revenue Bonds, Santa Fe Square Project, Series 2021 | 4.375 | 12/01/41 | 89,541 | |||||||||||||
| 230,000 | (c) | Tulsa Authority for Economic Opportunity, Tulsa County, Oklahoma, Tax Apportionment Revenue Bonds, Vast Bank Project, Series 2021 | 4.000 | 12/01/43 | 207,906 | |||||||||||||
|
|
|
|||||||||||||||||
| TOTAL OKLAHOMA | 1,285,241 | |||||||||||||||||
|
|
||||||||||||||||||
| OREGON - 1.6% | ||||||||||||||||||
| 2,750,000 | (c) | Oregon Facilities Authority Charter School Revenue Bonds, Oregon, Portland Village School Project, Series 2024 | 7.000 | 12/15/60 | 2,740,599 | |||||||||||||
| 2,250,000 | (c) | Port of Morrow, Morrow County Oregon, Full Faith and Credit Obligations, Series 2024A | 5.150 | 10/01/26 | 2,251,966 | |||||||||||||
| 730,000 | Port of Saint Helens, Oregon, Pollution Control Revenue Bonds, Boise Cascade Project, Series 1997 | 5.650 | 12/01/27 | 730,839 | ||||||||||||||
| 3,250,000 | Yamhill County Hospital Authority, Oregon, Revenue Bonds, Friendsview Retirement Community, Refunding Series 2016A | 5.000 | 11/15/46 | 2,870,881 | ||||||||||||||
| 2,830,000 | Yamhill County Hospital Authority, Oregon, Revenue Bonds, Friendsview Retirement Community, Refunding Series 2021A | 5.000 | 11/15/46 | 2,499,875 | ||||||||||||||
| 250,000 | Yamhill County Hospital Authority, Oregon, Revenue Bonds, Friendsview Retirement Community, Refunding Series 2021A | 5.000 | 11/15/56 | 211,180 | ||||||||||||||
|
|
|
|||||||||||||||||
| TOTAL OREGON | 11,305,340 | |||||||||||||||||
|
|
||||||||||||||||||
| PENNSYLVANIA - 2.8% | ||||||||||||||||||
| 500,000 | Allegheny County Industrial Development Authority, Pennsylvania, Revenue Bonds, Penn Hills Charter School of Entrepreneurship, Series 2021A | 4.000 | 06/15/51 | 397,375 | ||||||||||||||
| 1,610,000 | (c) | Allentown Neighborhood Improvement Zone Development Authority, Pennsylvania, Tax Revenue Bonds, Neuweiler Lofts Project, Series 2023 | 6.250 | 05/01/42 | 1,589,095 | |||||||||||||
| 26,000 | Berks County Municipal Authority, Pennsylvania, Revenue Bonds, Tower Health Project, Series 2024A-2 | 6.000 | 06/30/34 | 28,038 | ||||||||||||||
| 1,350,000 | Berks County Municipal Authority, Pennsylvania, Revenue Bonds, Tower Health Project, Series 2024A-3 | 5.000 | 06/30/39 | 1,308,429 | ||||||||||||||
| 175,000 | (d) | Berks County Municipal Authority, Pennsylvania, Revenue Bonds, Tower Health Project, Series 2024B-1 | 0.000 | 06/30/44 | 129,244 | |||||||||||||
| 55,000 | Berks County Municipal Authority, Pennsylvania, Revenue Bonds, Tower Health Project, Taxable Series 2024A-1 | 8.000 | 06/30/34 | 56,300 | ||||||||||||||
| 1,215,000 | (c) | Erie County, Industrial Development Authority, Pennsylvania, Essential Housing Revenue Bonds, Senior-CFC-Erie I LLC Erie Apartments, Series 2024A | 6.750 | 09/01/61 | 1,199,476 | |||||||||||||
| 11,500,000 | (c) | Lehigh County Industrial Development Authority, Pennsylvania, Revenue Bonds, Provident Group -Lehigh Valley International Airport Hotel Project First Tier Series 2025A-2 | 5.750 | 01/01/65 | 11,107,227 | |||||||||||||
| 1,065,000 | (c) | Lehigh County Industrial Development Authority, Pennsylvania, Revenue Bonds, Provident Group -Lehigh Valley International Airport Hotel Project Second Tier Series 2025C | 6.750 | 01/01/65 | 1,031,337 | |||||||||||||
| 30 | See Notes to Financial Statements |
| PRINCIPAL | DESCRIPTION | RATE | MATURITY | VALUE | ||||||||||||||
|
|
|
|||||||||||||||||
| PENNSYLVANIA (continued) | ||||||||||||||||||
| $ | 3,000,000 | McCandless IDA, Pennsylvania, University Revenue Bonds Series A and B of 2022 La Roche University | 6.750% | 12/01/46 | $ | 2,800,369 | ||||||||||||
| 370,000 | Montgomery County Redevelopment Authority, Pennsylvania, Special Obligation Revenue Bonds, River Pointe Project Series 2023 | 6.500 | 09/01/43 | 373,353 | ||||||||||||||
| 495,000 | (b),(f) | Pennsylvania Economic Development Financing Authority, Exempt Facilities Revenue Bonds, KDC Agribusiness Fairless Hills LLC Project, Series 2021A | 10.000 | 12/01/31 | 49 | |||||||||||||
|
|
|
|||||||||||||||||
| TOTAL PENNSYLVANIA | 20,020,292 | |||||||||||||||||
|
|
||||||||||||||||||
| PUERTO RICO - 1.7% | ||||||||||||||||||
| 450,000 | (b) | Puerto Rico Electric Power Authority, Power Revenue Bonds, Series 2007TT | 5.000 | 01/01/26 | 205,211 | |||||||||||||
| 160,000 | (b) | Puerto Rico Electric Power Authority, Power Revenue Bonds, Series 2010AAA | 5.250 | 07/01/27 | 72,086 | |||||||||||||
| 4,000 | (b) | Puerto Rico Electric Power Authority, Power Revenue Bonds, Series 2010ZZ | 5.000 | 07/01/24 | 1,940 | |||||||||||||
| 325,000 | (b) | Puerto Rico Electric Power Authority, Power Revenue Bonds, Series 2010ZZ | 5.000 | 07/01/24 | 148,141 | |||||||||||||
| 115,000 | (b) | Puerto Rico Electric Power Authority, Power Revenue Bonds, Series 2010ZZ | 5.250 | 07/01/26 | 52,581 | |||||||||||||
| 105,000 | (b) | Puerto Rico Electric Power Authority, Power Revenue Bonds, Series 2013A | 5.000 | 07/01/29 | 48,160 | |||||||||||||
| 190,000 | (b) | Puerto Rico Electric Power Authority, Revenue Bonds, Series 2007TT | 5.000 | 07/01/32 | 85,937 | |||||||||||||
| 250,000 | (b) | Puerto Rico Electric Power Authority, Revenue Bonds, Series 2007TT | 5.000 | 07/01/37 | 113,074 | |||||||||||||
| 115,000 | (b) | Puerto Rico Electric Power Authority, Revenue Bonds, Series 2008WW | 5.500 | 01/01/26 | 52,110 | |||||||||||||
| 100,000 | (b) | Puerto Rico Electric Power Authority, Revenue Bonds, Taxable Series 2010EEE | 5.950 | 07/01/30 | 47,997 | |||||||||||||
| 100,000 | (b) | Puerto Rico Electric Power Authority, Revenue Bonds, Taxable Series 2010EEE | 6.250 | 07/01/40 | 47,960 | |||||||||||||
| 10,000,000 | Puerto Rico Sales Tax Financing Corporation, Sales Tax Revenue Bonds, Restructured 2018A-1 | 0.000 | 07/01/51 | 2,428,061 | ||||||||||||||
| 1,365,000 | Puerto Rico Sales Tax Financing Corporation, Sales Tax Revenue Bonds, Restructured 2018A-1 | 5.000 | 07/01/58 | 1,346,346 | ||||||||||||||
| 4,507,235 | Puerto Rico, General Obligation Bonds, Clawback Highway Transportation Authority Claims Taxable Series 2022 | 0.000 | 11/01/51 | 2,805,754 | ||||||||||||||
| 81,740 | Puerto Rico, General Obligation Bonds, Restructured Series 2022A-1 | 5.625 | 07/01/27 | 84,661 | ||||||||||||||
| 78,106 | Puerto Rico, General Obligation Bonds, Restructured Series 2022A-1 | 5.750 | 07/01/31 | 85,874 | ||||||||||||||
| 74,065 | Puerto Rico, General Obligation Bonds, Restructured Series 2022A-1 | 4.000 | 07/01/33 | 72,583 | ||||||||||||||
| 57,138 | Puerto Rico, General Obligation Bonds, Restructured Series 2022A-1 | 4.000 | 07/01/37 | 54,069 | ||||||||||||||
| 247,059 | Puerto Rico, General Obligation Bonds, Restructured Series 2022A-1 | 4.000 | 07/01/46 | 215,696 | ||||||||||||||
| 5,800,000 | Puerto Rico, General Obligation Bonds, Vintage CW NT Claims Taxable Series 2022 | 0.000 | 11/01/43 | 3,639,500 | ||||||||||||||
| 877,518 | Puerto Rico, General Obligation Bonds, Vintage CW NT Claims Taxable Series 2022 | 1.000 | 11/01/51 | 472,324 | ||||||||||||||
|
|
|
|||||||||||||||||
| TOTAL PUERTO RICO | 12,080,065 | |||||||||||||||||
|
|
||||||||||||||||||
| SOUTH CAROLINA - 1.0% | ||||||||||||||||||
| 2,920,000 | (c) | South Carolina Jobs-Economic Development Authority, Economic Development Revenue Bonds, Hilton Head Christian Academy, Series 2020 | 5.000 | 01/01/40 | 2,711,810 | |||||||||||||
| 500,000 | (c) | South Carolina Jobs-Economic Development Authority, Economic Development Revenue Bonds, Palmetto Scholars Academy Project, Series 2015A | 5.125 | 08/15/35 | 479,667 | |||||||||||||
| 2,000,000 | (c) | South Carolina Jobs-Economic Development Authority, Educational Facilities Revenue Bonds, Lowcountry Leadership Charter School Project, Series 2019A | 5.000 | 12/01/49 | 1,756,195 | |||||||||||||
| See Notes to Financial Statements | 31 |
Portfolio of Investments March 31, 2025 (continued)
Enhanced High Yield Municipal Bond
| PRINCIPAL | DESCRIPTION | RATE | MATURITY | VALUE | ||||||||||||||
|
|
|
|||||||||||||||||
| SOUTH CAROLINA (continued) | ||||||||||||||||||
| $ | 200,000 | (c) | South Carolina Jobs-Economic Development Authority, Educational Facilities Revenue Bonds, Virtus Academy Project, Series 2021A | 4.000% | 06/15/31 | $ | 183,948 | |||||||||||
| 1,840,000 | (c) | South Carolina Jobs-Economic Development Authority, Educational Facilities Revenue Bonds, Virtus Academy Project, Series 2021A | 5.000 | 06/15/41 | 1,596,291 | |||||||||||||
| 330,000 | (c) | South Carolina Jobs-Economic Development Authority, Educational Facilities Revenue Bonds, Virtus Academy Project, Series 2021A | 5.000 | 06/15/51 | 266,822 | |||||||||||||
| 250,000 | (c) | South Carolina Jobs-Economic Development Authority, Educational Facilities Revenue Bonds, Virtus Academy Project, Series 2023A | 7.000 | 06/15/53 | 255,559 | |||||||||||||
| 250,000 | (c) | South Carolina Jobs-Economic Development Authority, Educational Facilities Revenue Bonds, Virtus Academy Project, Series 2023A |
7.125 | 06/15/58 | 256,495 | |||||||||||||
|
|
|
|||||||||||||||||
| TOTAL SOUTH CAROLINA | 7,506,787 | |||||||||||||||||
|
|
||||||||||||||||||
| TENNESSEE - 0% | ||||||||||||||||||
| 100,000 | (c) | Metropolitan Government of Nashville-Davidson County Industrial Development Board, Tennessee, Special Assessment Revenue Bonds, South Nashville Central Business Improvement District, Series 2021A |
4.000 | 06/01/51 | 84,528 | |||||||||||||
|
|
|
|||||||||||||||||
| TOTAL TENNESSEE | 84,528 | |||||||||||||||||
|
|
||||||||||||||||||
| TEXAS - 11.2% | ||||||||||||||||||
| 1,195,000 | Abilene Convention Center Hotel Development Corporation, Texas, Hotel Revenue Bonds, First-Lien Series 2021A | 4.000 | 10/01/50 | 929,488 | ||||||||||||||
| 250,000 | (c) | Abilene Convention Center Hotel Development Corporation, Texas, Hotel Revenue Bonds, Second-Lien Series 2021B | 5.000 | 10/01/50 | 206,933 | |||||||||||||
| 200,000 | (c) | Anna, Texas, Special Assessment Revenue Bonds, Meadow Vista Public Improvement District Area 1 Project, Series 2024 | 5.750 | 09/15/54 | 194,466 | |||||||||||||
| 1,190,000 | Arlington Higher Education Finance Corporation, Texas, Education Revenue Bonds, Legacy Traditional Schools - Texas Project, Refunding Series 2021A | 4.125 | 02/15/41 | 960,900 | ||||||||||||||
| 250,000 | Arlington Higher Education Finance Corporation, Texas, Education Revenue Bonds, Legacy Traditional Schools - Texas Project, Refunding Series 2021A | 4.500 | 02/15/56 | 188,395 | ||||||||||||||
| 785,000 | (c) | Arlington Higher Education Finance Corporation, Texas, Education Revenue Bonds, Legacy Traditional Schools - Texas Project, Refunding Series 2022A | 6.750 | 02/15/62 | 800,365 | |||||||||||||
| 1,825,000 | Arlington Higher Education Finance Corporation, Texas, Education Revenue Bonds, Odyssey Academy Inc Series 2023A | 6.000 | 02/15/43 | 1,856,839 | ||||||||||||||
| 2,635,000 | Baytown Municipal Development District, Texas, Hotel Revenue Bonds, Baytown Convention Center Hotel, First-Lien Series 2021A | 4.000 | 10/01/50 | 2,031,881 | ||||||||||||||
| 100,000 | (c) | Bee Cave, Travis County, Texas, Special Assessment Revenue Bonds, Backyard Public Improvement District Project, Series 2021 | 5.250 | 09/01/51 | 94,292 | |||||||||||||
| 250,000 | (c) | Buda, Texas, Special Assessment Revenue Bonds, Persimmon Public improvement District Major Improvement Area Project, Series 2025 | 6.750 | 09/01/55 | 243,837 | |||||||||||||
| 1,600,000 | (c) | Celina, Texas, Special Assessment Revenue Bonds, Cross Creek Meadows Public Improvement District, Major Improvement Area District Series 2023 | 6.125 | 09/01/53 | 1,606,876 | |||||||||||||
| 1,000,000 | (c) | Celina, Texas, Special Assessment Revenue Bonds, Parvin Public Improvement District Project, Series 2023 | 6.750 | 09/01/53 | 1,001,949 | |||||||||||||
| 3,000,000 | (c) | Clifton Higher Education Finance Corporation, Texas, Education Revenue Bonds, Valor Education Foundation, Series 2023A | 6.250 | 06/15/53 | 3,012,580 | |||||||||||||
| 300,000 | (c) | Clifton Higher Education Finance Corporation, Texas, Education Revenue Bonds, Valor Education Foundation, Series 2024A | 6.000 | 06/15/54 | 292,800 | |||||||||||||
| 2,050,000 | Conroe Local Government Corporation, Texas, Hotel Revenue Bonds, Conroe Convention Center Hotel, First-Lien Series 2021A | 4.000 | 10/01/50 | 1,583,059 | ||||||||||||||
| 7,390,000 | Conroe Local Government Corporation, Texas, Hotel Revenue Bonds, Conroe Convention Center Hotel, Second-Lien Series 2021B | 5.000 | 10/01/50 | 5,660,950 | ||||||||||||||
| 32 | See Notes to Financial Statements |
| PRINCIPAL | DESCRIPTION | RATE | MATURITY | VALUE | ||||||||||||||
|
|
|
|||||||||||||||||
| TEXAS (continued) | ||||||||||||||||||
| $ | 1,250,000 | (c) | Corpus Christi, Nueces, Aransas, San Patricio, ad Kleberg Counties, Texas, Special Assessment Revenue Bonds, Whitecap Public Improvement District 1 Improvement Area 1 Project Series 2024 | 6.125% | 09/15/44 | $ | 1,232,604 | |||||||||||
| 1,000,000 | (c) | Corpus Christi, Nueces, Aransas, San Patricio, ad Kleberg Counties, Texas, Special Assessment Revenue Bonds, Whitecap Public Improvement District 1 Improvement Area 1 Project Series 2024 | 6.500 | 09/15/54 | 989,605 | |||||||||||||
| 700,000 | (c) | Denton County, Texas, Special Assessment Revenue Bonds, Green Meadows Public Improvement District Major Improvement Area Project, Series 2025 | 6.125 | 12/31/55 | 684,743 | |||||||||||||
| 1,500,000 | Denton County, Texas, Special Assessment Revenue Bonds, Tabor Ranch Public Improvement District Improvement Area 1 Project, Junior Lien Series 2024B | 5.750 | 12/31/44 | 1,469,428 | ||||||||||||||
| 2,000,000 | Denton County, Texas, Special Assessment Revenue Bonds, Tabor Ranch Public Improvement District Improvement Area 1 Project, Junior Lien Series 2024B | 6.125 | 12/31/54 | 1,970,752 | ||||||||||||||
| 2,150,000 | (c) | Denton County, Texas, Special Assessment Revenue Bonds, Tabor Ranch Public Improvement District Major Improvement Area Project, Series 2024 | 6.000 | 12/31/44 | 2,133,663 | |||||||||||||
| 1,320,000 | (c) | Denton County, Texas, Special Assessment Revenue Bonds, Tabor Ranch Public Improvement District Major Improvement Area Project, Series 2024 | 6.250 | 12/31/54 | 1,269,467 | |||||||||||||
| 1,070,000 | (c) | Dorchester, Texas, Special Assessment Revenue Bonds, Cottonwood Public Improvement District Improvement Area 1 Project Series 2024 | 6.000 | 09/15/44 | 1,026,242 | |||||||||||||
| 1,993,000 | (c) | Forney, Texas, Special Assessment Revenue Bonds, Bellagio Public Improvement District 1 Phase I Project Series 2023 | 6.500 | 09/15/53 | 1,925,714 | |||||||||||||
| 3,490,000 | Friendswood, Harris and Galveston Counties, Texas, Special Assessment Revenue Bonds, City Center Public Improvement District, Initial Major Improvements Project Series 2024 | 7.000 | 09/15/54 | 3,409,113 | ||||||||||||||
| 3,000,000 | Hidalgo County Regional Mobility Authority, Texas, Toll and Vehicle Registration Fee Revenue Bonds, Refunding Junior Lien Series 2022B | 0.000 | 12/01/46 | 946,590 | ||||||||||||||
| 4,665,000 | Houston, Texas, Airport System Special Facilities Revenue Bonds, Continental Airlines Inc. - Terminal Improvement Project, Refunding Series 2011, (AMT) | 6.500 | 07/15/30 | 4,711,448 | ||||||||||||||
| 500,000 | Houston, Texas, Airport System Special Facilities Revenue Bonds, Continental Airlines Inc. - Terminal Improvement Project, Refunding Series 2011, (AMT) | 6.625 | 07/15/38 | 504,965 | ||||||||||||||
| 2,205,000 | (c) | Kyle, Texas, Special Assessment Revenue Bonds, Porter County Public Improvement District Improvement Area 1 Project, Series 2023 | 6.000 | 09/01/53 | 2,187,596 | |||||||||||||
| 1,205,000 | (c) | Kyle, Texas, Special Assessment Revenue Bonds, Southwest Kyle Public Improvement District 1 Improvement Area 2 Project, Series 2023 | 6.750 | 09/01/48 | 1,256,154 | |||||||||||||
| 1,625,000 | (c) | Lewisville, Denton and Dallas Counties, Texas, Special Assessment Revenue Bonds, Lakeside Crossing Public Improvement District Series 2023 | 8.000 | 09/01/53 | 1,684,285 | |||||||||||||
| 1,000,000 | (c) | Marble Falls, Burnet County, Texas, Special Assessment Revenue Bonds, Thunder Rock Public Improvement District Remainder Area Project, Series 2024 | 7.625 | 09/01/54 | 967,589 | |||||||||||||
| 250,000 | (c) | Mesquite, Texas, Special Assessment Revenue Bonds, Solterra Public Improvement District Improvement Area A-1 Projects, Series 2023 | 5.750 | 09/01/53 | 254,353 | |||||||||||||
| 770,000 | (c) | New Hope Cultural Education Facilities Finance Corporation, Texas, Education Revenue Bonds, Beta Academy, Series 2019A | 5.000 | 08/15/49 | 723,867 | |||||||||||||
| 70,000 | (b) | New Hope Cultural Education Facilities Finance Corporation, Texas, Retirement Facility Revenue Bonds, Buckingham Senior Living Community, Inc. Project, Series 2021A-1 | 7.500 | 11/15/37 | 55,554 | |||||||||||||
| 435,000 | (b) | New Hope Cultural Education Facilities Finance Corporation, Texas, Retirement Facility Revenue Bonds, Buckingham Senior Living Community, Inc. Project, Series 2021A-2 | 7.500 | 11/15/36 | 357,315 | |||||||||||||
| See Notes to Financial Statements | 33 |
Portfolio of Investments March 31, 2025 (continued)
Enhanced High Yield Municipal Bond
| PRINCIPAL | DESCRIPTION | RATE | MATURITY | VALUE | ||||||||||||||
|
|
|
|||||||||||||||||
| TEXAS (continued) | ||||||||||||||||||
| $ | 3,166,045 | (b) | New Hope Cultural Education Facilities Finance Corporation, Texas, Retirement Facility Revenue Bonds, Buckingham Senior Living Community, Inc. Project, Series 2021B | 0.380% | 11/15/61 | $ | 1,156,165 | |||||||||||
| 9,310,000 | New Hope Cultural Education Facilities Finance Corporation, Texas, Senior Living Revenue Bonds, Sanctuary LTC LLC Project, Series 2021A-1 | 5.500 | 01/01/57 | 8,977,639 | ||||||||||||||
| 650,000 | (b) | New Hope Cultural Education Facilities Finance Corporation, Texas, Student Housing Revenue Bonds, NCCD - College Station Properties LLC - Texas A&M University Project, Series 2015A | 5.000 | 07/01/25 | 649,127 | |||||||||||||
| 250,000 | (b) | New Hope Cultural Education Facilities Finance Corporation, Texas, Student Housing Revenue Bonds, NCCD - College Station Properties LLC - Texas A&M University Project, Series 2015A | 5.000 | 08/01/25 | 250,000 | |||||||||||||
| 500,000 | (b) | New Hope Cultural Education Facilities Finance Corporation, Texas, Student Housing Revenue Bonds, NCCD - College Station Properties LLC - Texas A&M University Project, Series 2015A | 5.000 | 07/01/30 | 490,600 | |||||||||||||
| 652,440 | (b) | New Hope Cultural Education Facilities Finance Corporation, Texas, Student Housing Revenue Bonds, NCCD - College Station Properties LLC - Texas A&M University Project, Series 2015A | 5.000 | 07/01/33 | 652,440 | |||||||||||||
| 1,000,000 | (b) | New Hope Cultural Education Facilities Finance Corporation, Texas, Student Housing Revenue Bonds, NCCD - College Station Properties LLC - Texas A&M University Project, Series 2015A | 5.000 | 07/01/35 | 964,404 | |||||||||||||
| 2,500,000 | (b) | New Hope Cultural Education Facilities Finance Corporation, Texas, Student Housing Revenue Bonds, NCCD - College Station Properties LLC - Texas A&M University Project, Series 2015A | 5.000 | 07/01/47 | 2,397,964 | |||||||||||||
| 1,275,000 | (c) | New Hope Higher Education Finance Corporation, Texas, Education Revenue Bonds, Southwest Preparatory School Series 2023A | 6.375 | 08/15/53 | 1,350,918 | |||||||||||||
| 100,000 | (c) | New Hope Higher Education Finance Corporation, Texas, Education Revenue Bonds, Southwest Preparatory School Taxable Series 2023A | 8.000 | 08/15/30 | 101,604 | |||||||||||||
| 1,000,000 | (c) | Oak Point, Denton County, Texas, Special Assessment Revenue Bonds, Chaparral Park Public Improvement District Improvement Area 1 Project, Series 2024 | 5.250 | 09/15/54 | 948,376 | |||||||||||||
| 465,000 | (c) | Plano, Collin and Denton Counties, Texas, Special Assessment Revenue Bonds, Haggard Farm Public Improvement District Project, Area 1 Project Series 2023 | 7.500 | 09/15/53 | 486,603 | |||||||||||||
| 1,000,000 | (c) | Plano, Collin and Denton Counties, Texas, Special Assessment Revenue Bonds, Haggard Farm Public Improvement District Project, Major Improvement Area Project Series 2023 | 8.500 | 09/15/53 | 1,044,657 | |||||||||||||
| 2,000,000 | (c) | Port Beaumont Industrial Development Authority, Texas, Facility Revenue Bonds, Jefferson Gulf Coast Energy Project, Series 2021B | 4.100 | 01/01/28 | 1,815,367 | |||||||||||||
| 1,000,000 | (c) | Port Beaumont Navigation District, Jefferson County, Texas, Dock and Wharf Facility Revenue Bonds, Jefferson Gulf Coast Energy Project, Series 2021A, (AMT) | 3.000 | 01/01/50 | 685,412 | |||||||||||||
| 250,000 | (c) | Princeton, Texas, Special Assessment Revenue Bonds, Sicily Public Improvement District Improvement Area 1 Project, Series 2023 | 7.000 | 09/01/53 | 250,481 | |||||||||||||
| 500,000 | (c) | Princeton, Texas, Special Assessment Revenue Bonds, Sicily Public Improvement District Major Improvement Area Project, Series 2023 | 7.875 | 09/01/53 | 505,662 | |||||||||||||
| 125,000 | (b) | Red River Health Facilities Development Corporation, Texas, First Mortgage Revenue Bonds, Eden Home Inc., Series 2012 | 3.000 | 12/15/32 | 57,500 | |||||||||||||
| 500,000 | (b) | Red River Health Facilities Development Corporation, Texas, First Mortgage Revenue Bonds, Eden Home Inc., Series 2012 | 3.000 | 12/15/42 | 230,000 | |||||||||||||
| 305,000 | (b) | Red River Health Facilities Development Corporation, Texas, First Mortgage Revenue Bonds, Eden Home Inc., Series 2012 | 3.000 | 12/15/47 | 140,300 | |||||||||||||
| 2,000,000 | (c) | Rockdale, Milam County, Texas, Special Assessment Revenue Bonds, Cornerstone Public Improvement District Improvement Area 1, Series 2023 | 7.500 | 09/15/54 | 2,060,340 | |||||||||||||
| 610,000 | (c) | Sachse, Texas, Special Assessment Bonds, Sachse Public Improvement District 1 Improvement Areas 2-3 Project, Series 2022 | 7.000 | 09/15/52 | 664,718 | |||||||||||||
| 34 | See Notes to Financial Statements |
| PRINCIPAL | DESCRIPTION | RATE | MATURITY | VALUE | ||||||||||||||
|
|
|
|||||||||||||||||
| TEXAS (continued) | ||||||||||||||||||
| $ | 720,000 | Salado, Bell County, Texas, Special Assessment Revenue Bonds, Sanctuary East Public Improvement District Improvement Area 1 Project Series 2024 | 6.250% | 09/01/44 | $ | 717,792 | ||||||||||||
| 1,500,000 | (c) | San Marcos City, Hays, Caldwell and Guadalupe Counties, Texas, Special Assessment Revenue Bonds, San Marcos Trace Public Improvement District Series 2024 | 6.000 | 09/01/48 | 1,480,118 | |||||||||||||
| 100,000 | (c) | Sinton, San Patricio County, Texas, Special Assessment Revenue Bonds, Somerset Public Improvement District 1 Series 2022 | 5.250 | 09/01/51 | 96,818 | |||||||||||||
| 500,000 | (b) | Tarrant County Cultural Education Facilities Finance Corporaton, Texas, Retirement Facility Revenue Bonds, C.C. Young Memorial Home Project, Series 2016A | 3.750 | 02/15/37 | 275,000 | |||||||||||||
| 800,000 | (c) | Venus, Johnson County, Texas, Special Assessment Revenue Bonds, Brahman Ranch Public Improvement District, Series 2022 | 6.500 | 09/15/52 | 804,857 | |||||||||||||
| 80,000 | Viridian Municipal Management District, Texas, Assessment Revenue Bonds, Series 2017 | 4.250 | 12/01/44 | 70,427 | ||||||||||||||
| 900,000 | (c) | Vista Lago, Travis County, Texas, Special Assessment Revenue Bonds, Tessera on Lake Travis Public Improvement District Improvement Area #3 Project, Series 2024 |
6.000 | 09/01/54 | 901,252 | |||||||||||||
|
|
|
|||||||||||||||||
| TOTAL TEXAS | 80,653,198 | |||||||||||||||||
|
|
||||||||||||||||||
| UTAH - 5.6% | ||||||||||||||||||
| 500,000 | (c) | Arrowhead Springs Public Infrastructure District, Utah, Special Assessment Bonds, Arrowhead Springs Assessment Area, Series 2025 | 5.625 | 12/01/54 | 500,701 | |||||||||||||
| 500,000 | (c) | Black Desert Public Infrastructure District, Utah, Limited Tax General Obligation Bonds Subordinate Series 2021B | 7.375 | 09/15/51 | 433,226 | |||||||||||||
| 2,000,000 | (c) | Black Desert Public Infrastructure District, Washington County, Utah, Special Assessment Bonds, Black Desert Assessment Area 1, Series 2024 | 5.625 | 12/01/53 | 2,006,099 | |||||||||||||
| 1,615,000 | (c) | Chelsey Public Infrastructure District 1, Utah, Limited Tax General Obligation Bonds Series 2024 | 7.250 | 03/01/54 | 1,615,783 | |||||||||||||
| 4,200,000 | (c) | Chelsey Public Infrastructure District 1, Utah, Special Assessment Bonds Chelsey Assessment Area 1 Series 2024 | 7.000 | 12/01/42 | 4,249,571 | |||||||||||||
| 500,000 | Coral Junction Public Infrastructure District 1, Utah, Limited Tax General Obligation Bonds, Series 2022A-1 | 6.500 | 03/01/53 | 479,485 | ||||||||||||||
| 1,000,000 | (c) | Downtown East Streetcar Sewer Public Infrastructure District, South Salt Lake, Salt Lake County, Utah, Limited Tax General Obligation Bonds, Series 2022A | 5.750 | 03/01/42 | 996,449 | |||||||||||||
| 1,000,000 | (c) | Downtown East Streetcar Sewer Public Infrastructure District, South Salt Lake, Salt Lake County, Utah, Limited Tax General Obligation Bonds, Series 2022A | 6.000 | 03/01/53 | 995,637 | |||||||||||||
| 825,000 | (c) | Fields Estates Public Infrastructure District, Utah, General Obligation Bonds, Limited Tax Series 2024A-1 | 6.125 | 03/01/55 | 827,074 | |||||||||||||
| 1,000,000 | (c) | Gateway at Sand Hollow, Public Infrastructure District 1, Utah, Limited Tax General Obligation Bonds, Series 2021A | 5.500 | 03/01/51 | 773,290 | |||||||||||||
| 1,595,000 | (c) | Jordanelle Ridge Public Infrastructure District 2, Utah, General Obligation Bonds, Limited Tax Series 2023A | 7.750 | 03/01/54 | 1,600,089 | |||||||||||||
| 2,180,000 | (c) | Medical School Campus Public Infrastructure District, Utah, Limited Tax General Obligation Bonds, Series 2020A | 5.250 | 02/01/40 | 1,878,248 | |||||||||||||
| 2,915,000 | (c) | Medical School Campus Public Infrastructure District, Utah, Limited Tax General Obligation Bonds, Series 2020A | 5.500 | 02/01/50 | 2,378,691 | |||||||||||||
| 1,790,000 | (c) | MIDA Military Installation Development Authority Golf and Equestrian Center Public Infrastructure District, Utah, Limited Tax and Tax Allocation Revenue Bonds, Series 2021 | 4.125 | 06/01/36 | 1,526,384 | |||||||||||||
| 2,500,000 | (c) | MIDA Military Installation Development Authority Golf and Equestrian Center Public Infrastructure District, Utah, Limited Tax and Tax Allocation Revenue Bonds, Series 2021 | 4.625 | 06/01/57 | 1,926,869 | |||||||||||||
| 2,435,000 | (c) | MIDA Mountain Veterans Program Public Infrastructure District, Utah, Tax Allocation Revenue Bonds, Series 2024 | 5.200 | 06/01/54 | 2,396,293 | |||||||||||||
| 650,000 | (c) | MIDA Mountain Village Public Infrastructure District, Utah, Subordinate Tax Allocation Revenue Bonds, Series 2024-2 | 6.000 | 06/15/54 | 671,378 | |||||||||||||
| 1,250,000 | Military Installation Development Authority, Utah, Tax Allocation and Hotel Tax Revenue Bonds Series 2021A-1 | 4.000 | 06/01/52 | 1,066,633 | ||||||||||||||
| See Notes to Financial Statements | 35 |
Portfolio of Investments March 31, 2025 (continued)
Enhanced High Yield Municipal Bond
| PRINCIPAL | DESCRIPTION | RATE | MATURITY | VALUE | ||||||||||||||
|
|
|
|||||||||||||||||
| UTAH (continued) | ||||||||||||||||||
| $ | 1,000,000 | Military Installation Development Authority, Utah, Tax Allocation Revenue Bonds Series 2021A-2 | 4.000% | 06/01/41 | $ | 892,743 | ||||||||||||
| 660,000 | (c) | Moonlight Village, Public Infrastructure District 1, Utah, Limited Tax General Obligation Bonds, Series 2025A | 6.000 | 03/01/56 | 652,165 | |||||||||||||
| 951,000 | Olympia Public Infrastructure District 1, Utah, Limited Tax General Obligation Bonds, Subordinate Series 2024B | 8.000 | 03/15/55 | 950,352 | ||||||||||||||
| 865,000 | (c) | Sienna Hills Public Infrastructure District No. 1 Limited Tax General Obligation and Sales Tax Revenue Bonds, Utah, Series 2023A | 6.750 | 07/01/35 | 869,521 | |||||||||||||
| 690,000 | (c) | Soleil Hills Public Infrastructure District No. 1, Utah, Limited Tax General Obligation and Special Revenue Bonds, Series 2025A | 5.875 | 03/01/55 | 681,400 | |||||||||||||
| 1,000,000 | (c) | Sun Stone Infrastructure Financing District, Utah, Special Assessment Bonds, Assessment Area 1, Series 2024 | 6.750 | 06/01/54 | 957,343 | |||||||||||||
| 375,000 | Utah Charter School Finance Authority, Charter School Revenue Bonds, Bridge Elementary Project, Series 2021A | 4.000 | 06/15/41 | 309,276 | ||||||||||||||
| 250,000 | (c) | Utah Charter School Finance Authority, Charter School Revenue Bonds, Saint George Academy Project, Series 2021A | 5.000 | 06/15/56 | 193,985 | |||||||||||||
| 7,000,000 | (c) | Ventana Resort Village Public Infrastructure District, Utah, General Obligation Bonds, Limited Tax Series 2024 | 5.500 | 03/01/54 | 6,713,123 | |||||||||||||
| 500,000 | (c) | Wakara Ridge Public Infrastructure District, Utah, Special Assessment Bonds, Wakara Ridge Assessment Area, Series 2025 | 5.625 | 12/01/54 | 502,654 | |||||||||||||
| 1,015,000 | (c) | Wohali Public Infrastructure District 1, Utah, Special Assessment Revenue Bonds, Assessment Area 1 Series 2023 | 7.000 | 12/01/42 | 1,012,632 | |||||||||||||
|
|
|
|||||||||||||||||
| TOTAL UTAH | 40,057,094 | |||||||||||||||||
|
|
||||||||||||||||||
| VIRGIN ISLANDS - 0.7% | ||||||||||||||||||
| 1,000,000 | (c) | Virgin Islands Public Finance Authority, Revenue Bonds, Frenchman’s Reef Hotel Development Hotel Occupancy Series 2024A | 6.000 | 04/01/53 | 1,026,365 | |||||||||||||
| 215,000 | (c) | Virgin Islands Water and Power Authority, Electric System Revenue Bonds, Bond Anticipation Notes, Senior Series 2021A | 6.750 | 07/01/26 | 211,136 | |||||||||||||
| 1,070,000 | Virgin Islands Water and Power Authority, Electric System Revenue Bonds, Series 2007B | 5.000 | 07/01/26 | 1,043,472 | ||||||||||||||
| 2,745,000 | Virgin Islands Water and Power Authority, Electric System Revenue Bonds, Series 2007B | 5.000 | 07/01/31 | 2,560,270 | ||||||||||||||
| 250,000 | (c) | West Indian Company Limited, Virgin Islands, Port Facilities Revenue Bonds WICO Financing Series 2022B, (AMT) | 6.500 | 04/01/52 | 241,991 | |||||||||||||
|
|
|
|||||||||||||||||
| TOTAL VIRGIN ISLANDS | 5,083,234 | |||||||||||||||||
|
|
||||||||||||||||||
| VIRGINIA - 1.1% | ||||||||||||||||||
| 300,000 | James City County Economic Development Authority, Virginia, Residential Care Facility Revenue Bonds, Williamsburg Landing Inc., Series 2024A | 6.875 | 12/01/58 | 326,975 | ||||||||||||||
| 1,000,000 | Norfolk Redevelopment and Housing Authority, Virginia, Fort Norfolk Retirement Community, Inc., Harbor’s Edge Project, Series 2019A | 5.000 | 01/01/49 | 894,724 | ||||||||||||||
| 4,145,000 | Virginia Beach Development Authority, Virginia, Residential Care Facility Revenue Bonds, Westminster Canterbury on Chesapeake Bay, Series 2023A | 7.000 | 09/01/59 | 4,623,785 | ||||||||||||||
| 2,000,000 | Virginia Small Business Financing Authority, Private Activity Revenue Bonds, Transform 66 P3 Project, Senior Lien Series 2017, (AMT) | 5.000 | 12/31/56 | 1,973,162 | ||||||||||||||
|
|
|
|||||||||||||||||
| TOTAL VIRGINIA | 7,818,646 | |||||||||||||||||
|
|
||||||||||||||||||
| WASHINGTON - 0.1% | ||||||||||||||||||
| 1,135,000 | Tacoma Consolidated Local Improvement District 65, Washington, Special Assessment Bonds, Series 2013 | 5.750 | 04/01/43 | 1,099,122 | ||||||||||||||
|
|
|
|||||||||||||||||
| TOTAL WASHINGTON | 1,099,122 | |||||||||||||||||
|
|
||||||||||||||||||
| 36 | See Notes to Financial Statements |
| PRINCIPAL | DESCRIPTION | RATE | MATURITY | VALUE | ||||||||||||||
|
|
|
|||||||||||||||||
| WEST VIRGINIA - 0.3% | ||||||||||||||||||
| $ | 480,000 | Huntington, West Virginia, Tax Increment Revenue Bonds, Kinetic Park Project 3, Refunding Series 2024 | 5.625% | 05/01/50 | $ | 471,845 | ||||||||||||
| 975,000 | (c),(d) | Monongalia County Commission, West Virginia, Special District Excise Tax Revenue Bonds, University Town Centre Economic Opportunity Development District, Subordinate Improvement and Refunding Series 2023B | 0.000 | 06/01/53 | 209,886 | |||||||||||||
| 440,000 | (c) | Monongalia County, West Virginia, Tax Increment Revenue Bonds, University Town Centre Development District 4, Senior Refunding and Improvement Series 2023A | 6.000 | 06/01/53 | 463,298 | |||||||||||||
| 185,000 | (c) | South Charleston, West Virginia, Special District Excise Tax Revenue Improvement Bonds, South Charleston Park Place Project, Series 2022A | 4.250 | 06/01/42 | 148,873 | |||||||||||||
| 250,000 | (c) | South Charleston, West Virginia, Special District Excise Tax Revenue Improvement Bonds, South Charleston Park Place Project, Series 2022A | 4.500 | 06/01/50 | 197,354 | |||||||||||||
| 685,000 | (c) | West Virginia Economic Development Authority, Dock and Wharf Facilities Revenue Bonds, Empire Trimodal Terminal, LLC Project, Series 2020 | 7.625 | 12/01/40 | 544,082 | |||||||||||||
|
|
|
|||||||||||||||||
| TOTAL WEST VIRGINIA | 2,035,338 | |||||||||||||||||
|
|
||||||||||||||||||
| WISCONSIN - 20.8% | ||||||||||||||||||
| 3,020,000 | Ashwaubenon Community Development Authority, Wisconsin, Lease Revenue Bonds, Brown County Expo Center Project, Series 2019 | 0.000 | 06/01/54 | 694,062 | ||||||||||||||
| 255,000 | (c) | Public Finance Authority of Wisconsin, Charter School Revenue Bonds, Alamance Community School, Series 2021A | 5.000 | 06/15/51 | 216,308 | |||||||||||||
| 2,275,000 | (c) | Public Finance Authority of Wisconsin, Charter School Revenue Bonds, Corvian Community School Bonds, North Carolina, Series 2019A | 5.000 | 06/15/49 | 1,988,193 | |||||||||||||
| 1,425,000 | (c) | Public Finance Authority of Wisconsin, Charter School Revenue Bonds, Discovery Charter School Project, Series 2022A | 6.750 | 06/01/62 | 1,425,121 | |||||||||||||
| 2,070,000 | (c) | Public Finance Authority of Wisconsin, Charter School Revenue Bonds, Eno River Academy Project, Series 2020A | 5.000 | 06/15/54 | 1,955,332 | |||||||||||||
| 600,000 | (c) | Public Finance Authority of Wisconsin, Charter School Revenue Bonds, Founders Academy of Las Vegas, Series 2023A | 6.625 | 07/01/53 | 619,047 | |||||||||||||
| 550,000 | (c) | Public Finance Authority of Wisconsin, Charter School Revenue Bonds, Founders Academy of Las Vegas, Series 2023A | 6.750 | 07/01/58 | 569,574 | |||||||||||||
| 1,000,000 | (c) | Public Finance Authority of Wisconsin, Charter School Revenue Bonds, Freedom Classical Academy Inc., Series 2020A | 5.000 | 01/01/42 | 931,459 | |||||||||||||
| 1,000,000 | (c) | Public Finance Authority of Wisconsin, Charter School Revenue Bonds, Freedom Classical Academy Inc., Series 2020A | 5.000 | 01/01/56 | 867,174 | |||||||||||||
| 2,385,000 | (c) | Public Finance Authority of Wisconsin, Charter School Revenue Bonds, Hapeville Charter Project, Series 2025A | 6.875 | 06/15/54 | 2,400,433 | |||||||||||||
| 3,750,000 | (c) | Public Finance Authority of Wisconsin, Charter School Revenue Bonds, North Carolina Charter Educational Foundation Project, Series 2016A | 5.000 | 06/15/36 | 3,403,526 | |||||||||||||
| 625,000 | (c) | Public Finance Authority of Wisconsin, Charter School Revenue Bonds, North Carolina Charter Educational Foundation Project, Series 2016A | 5.000 | 06/15/46 | 508,440 | |||||||||||||
| 500,000 | (c) | Public Finance Authority of Wisconsin, Charter School Revenue Bonds, Phoenix Academy Charter School, North Carolina, Series 2017A | 5.875 | 06/15/47 | 479,125 | |||||||||||||
| 1,110,000 | (c) | Public Finance Authority of Wisconsin, Charter School Revenue Bonds, Quality Education Academy Project, Series 2023A | 6.250 | 07/15/53 | 1,167,994 | |||||||||||||
| 1,175,000 | (c) | Public Finance Authority of Wisconsin, Charter School Revenue Bonds, Quality Education Academy Project, Series 2023A | 6.500 | 07/15/63 | 1,247,826 | |||||||||||||
| 7,125,000 | (c) | Public Finance Authority of Wisconsin, Charter School Revenue Bonds, Vegas Vista Academy, Series 2024A | 7.000 | 06/01/59 | 6,749,839 | |||||||||||||
| 1,250,000 | (c) | Public Finance Authority of Wisconsin, Contract Revenue Bonds, Mercer Crossing Public Improvement District Project, Series 2017 | 7.000 | 03/01/47 | 1,278,648 | |||||||||||||
| 300,000 | (c) | Public Finance Authority of Wisconsin, Education Revenue Bonds, Casa Esperanza Montessori, Series 2021A | 4.375 | 06/01/46 | 242,868 | |||||||||||||
| 100,000 | (c) | Public Finance Authority of Wisconsin, Education Revenue Bonds, Casa Esperanza Montessori, Series 2021A | 4.500 | 06/01/56 | 77,965 | |||||||||||||
| See Notes to Financial Statements | 37 |
Portfolio of Investments March 31, 2025 (continued)
Enhanced High Yield Municipal Bond
| PRINCIPAL | DESCRIPTION | RATE | MATURITY | VALUE | ||||||||||||||
|
|
|
|||||||||||||||||
| WISCONSIN (continued) | ||||||||||||||||||
| $ | 1,000,000 | (c) | Public Finance Authority of Wisconsin, Education Revenue Bonds, Corvian Community School, North Carolina Series 2023A | 6.250% | 06/15/53 | $ | 1,009,754 | |||||||||||
| 500,000 | (c) | Public Finance Authority of Wisconsin, Education Revenue Bonds, Mater Academy of Nevada, - East Las Vegas Campus Project, Series 2024A | 5.000 | 12/15/54 | 475,323 | |||||||||||||
| 750,000 | Public Finance Authority of Wisconsin, Educational Facilities Revenue Bonds, Cincinnati Classical Academy, Series 2024A | 5.875 | 06/15/54 | 743,443 | ||||||||||||||
| 1,000,000 | (c) | Public Finance Authority of Wisconsin, Hotel Revenue Bonds, Grand Hyatt San Antonio Hotel Acquisition Project, Subordinate Lien Series 2022B | 6.000 | 02/01/62 | 1,035,256 | |||||||||||||
| 1,105,000 | (b),(c) | Public Finance Authority of Wisconsin, Limited Obligation Grant Revenue Bonds, American Dream @ Meadowlands Project, Series 2017A | 6.250 | 08/01/27 | 1,069,087 | |||||||||||||
| 80,000 | (b),(c) | Public Finance Authority of Wisconsin, Limited Obligation Grant Revenue Bonds, American Dream @ Meadowlands Project, Series 2017A | 6.750 | 08/01/31 | 71,800 | |||||||||||||
| 500,000 | (b),(c) | Public Finance Authority of Wisconsin, Limited Obligation Grant Revenue Bonds, American Dream @ Meadowlands Project, Series 2017B | 5.625 | 08/01/27 | 483,750 | |||||||||||||
| 2,000,000 | (c) | Public Finance Authority of Wisconsin, Limited Obligation PILOT Revenue Bonds, American Dream @ Meadowlands Project, Series 2017 | 5.000 | 12/01/27 | 1,955,057 | |||||||||||||
| 5,935,000 | (c) | Public Finance Authority of Wisconsin, Limited Obligation PILOT Revenue Bonds, American Dream @ Meadowlands Project, Series 2017 | 6.500 | 12/01/37 | 5,999,232 | |||||||||||||
| 500,000 | (c) | Public Finance Authority of Wisconsin, Limited Obligation PILOT Revenue Bonds, American Dream @ Meadowlands Project, Series 2017 | 6.750 | 12/01/42 | 506,112 | |||||||||||||
| 58,300,000 | (c) | Public Finance Authority of Wisconsin, Limited Obligation PILOT Revenue Bonds, American Dream @ Meadowlands Project, Series 2017 | 7.000 | 12/01/50 | 59,121,272 | |||||||||||||
| 4,035,000 | (c) | Public Finance Authority of Wisconsin, Multifamily Housing Revenue Bonds, Promenade Apartments Project, Series 2024 | 6.250 | 02/01/39 | 4,100,704 | |||||||||||||
| 1,000,000 | (c) | Public Finance Authority of Wisconsin, Multifamily Housing Revenue Bonds, Renaissance Hall at Old Course LLC Project, Subordinate Series 2024 | 8.000 | 06/01/67 | 955,326 | |||||||||||||
| 250,000 | (c) | Public Finance Authority of Wisconsin, Retirement Facility Revenue Bonds, Penick Village, Series 2019 | 5.000 | 09/01/54 | 226,163 | |||||||||||||
| 13,650,000 | (c) | Public Finance Authority of Wisconsin, Revenue Anticipation Capital Appreciation Bonds, Texas Infrastructure Authority Program, Myrtle Creek Project, Series 2025 | 0.000 | 12/15/41 | 4,766,482 | |||||||||||||
| 2,700,000 | (b),(c) | Public Finance Authority of Wisconsin, Revenue Bonds, Procure Proton Therapy Center, Senior Series 2018A | 7.000 | 07/01/48 | 1,890,000 | |||||||||||||
| 700,000 | (c) | Public Finance Authority of Wisconsin, Revenue Bonds, Revolution Academy, Refunding Series 2023A | 6.250 | 10/01/58 | 722,389 | |||||||||||||
| 250,000 | Public Finance Authority of Wisconsin, Revenue Bonds, SearStone Retirement Community, Series 2023A | 5.000 | 06/01/37 | 252,378 | ||||||||||||||
| 1,250,000 | Public Finance Authority of Wisconsin, Revenue Bonds, SearStone Retirement Community, Series 2023A | 5.000 | 06/01/52 | 1,168,659 | ||||||||||||||
| 250,000 | (c) | Public Finance Authority of Wisconsin, Revenue Bonds, Senior Revenue Bonds, Proton International Arkansas, LLC, Series 2021A | 6.850 | 01/01/51 | 174,511 | |||||||||||||
| 5,095,000 | Public Finance Authority of Wisconsin, Revenue Bonds, Sky Harbour LLC Obligated Group Aviation Facilities Project, Series 2021, (AMT) | 4.000 | 07/01/41 | 4,487,214 | ||||||||||||||
| 4,245,000 | Public Finance Authority of Wisconsin, Revenue Bonds, Sky Harbour LLC Obligated Group Aviation Facilities Project, Series 2021, (AMT) | 4.250 | 07/01/54 | 3,479,572 | ||||||||||||||
| 1,000,000 | (b),(c) | Public Finance Authority of Wisconsin, Senior Revenue Bonds, Maryland Proton Treatment Center, Series 2018A-1 | 6.375 | 01/01/48 | 450,000 | |||||||||||||
| 100,000 | (b),(f) | Public Finance Authority of Wisconsin, Wisconsin Revenue Note, KDC Agribusiness LLC Project, Series 2022B | 15.000 | 12/31/25 | 10 | |||||||||||||
| 1,730,000 | (c) | Public Finance Authority, Wisconsin, Revenue Bonds, Two Step Project, Series 2024 | 0.000 | 12/15/34 | 967,486 | |||||||||||||
| 38 | See Notes to Financial Statements |
| PRINCIPAL | DESCRIPTION | RATE | MATURITY | VALUE | ||||||||||||||
|
|
|
|||||||||||||||||
| WISCONSIN (continued) | ||||||||||||||||||
| $ | 500,000 | (c) | Public Finance Authority, Wisconsin, Tax Increment Revenue Senior Bonds, World Center Project Series 2024A | 5.000% | 06/01/41 | $ | 508,787 | |||||||||||
| 7,635,000 | (c) | Public Finance Authority, Wisconsin, Tax Increment Revenue Subordinate Bonds, World Center Project Series 2024B | 8.000 | 06/15/42 | 7,687,432 | |||||||||||||
| 100,000 | (c) | Saint Croix Chippewa Indians of Wisconsin, Revenue Bonds, Refunding Senior Series 2021 | 5.000 | 09/30/41 | 89,006 | |||||||||||||
| 290,000 | Wisconsin Health and Educational Facilities Authority, Revenue Bonds, Covenant Communities Inc, Second Tier Series 2018B | 4.375 | 07/01/38 | 257,422 | ||||||||||||||
| 250,000 | Wisconsin Health and Educational Facilities Authority, Wisconsin, Revenue Bonds, Dickson Hollow Phase 2 Project, Series 2024 | 6.125 | 10/01/59 | 255,228 | ||||||||||||||
| 450,000 | Wisconsin Health and Educational Facilities Authority, Wisconsin, Revenue Bonds, Hope Christian Schools Obligated Group, Series 2021 | 3.000 | 12/01/31 | 385,413 | ||||||||||||||
| 1,000,000 | Wisconsin Health and Educational Facilities Authority, Wisconsin, Revenue Bonds, Oakwood Lutheran Senior Ministries, Series 2021 | 4.000 | 01/01/57 | 783,998 | ||||||||||||||
| 8,500,000 | Wisconsin Health and Educational Facilities Authority, Wisconsin, Senior Living Revenue Bonds, Chiara Housing and Services, Inc. Project, Series 2024 | 5.875 | 07/01/55 | 8,589,629 | ||||||||||||||
| 6,000,000 | Wisconsin Health and Educational Facilities Authority, Wisconsin, Senior Living Revenue Bonds, Chiara Housing and Services, Inc. Project, Series 2024 | 6.000 | 07/01/60 | 6,086,426 | ||||||||||||||
| 2,500,000 | (c) | Wisconsin Housing and Economic Development Authority, Multifamily Housing Bonds, Meadow Village Project Series 2020A | 5.000 | 07/01/37 | 2,269,470 | |||||||||||||
|
|
|
|||||||||||||||||
| TOTAL WISCONSIN | 149,846,725 | |||||||||||||||||
|
|
||||||||||||||||||
| TOTAL MUNICIPAL BONDS (Cost $1,010,989,958) |
1,010,467,555 | |||||||||||||||||
|
|
||||||||||||||||||
| PRINCIPAL | DESCRIPTION | RATE | MATURITY | VALUE | ||||||||||||||
|
|
|
|||||||||||||||||
| VARIABLE RATE SENIOR LOAN INTERESTS - 0.0% (0.0% of Total Investments) | ||||||||||||||||||
| CAPITAL GOODS - 0.0% | ||||||||||||||||||
| 128,676 | (b),(f) | KDC Agribusiness Fairless Hills LLC | 12.000 | 09/15/23 | 13 | |||||||||||||
|
|
|
|||||||||||||||||
| TOTAL CAPITAL GOODS | 13 | |||||||||||||||||
|
|
||||||||||||||||||
| HEALTH CARE EQUIPMENT & SERVICES - 0.0% | ||||||||||||||||||
| 45,154 | (f) | Jackson Hospital | 13.000 | 11/04/25 | 45,154 | |||||||||||||
| 62,714 | (f) | Jackson Hospital, Inc. and Jackson Hospital Financing, LLC | 13.000 | 12/16/25 | 62,714 | |||||||||||||
|
|
|
|||||||||||||||||
| TOTAL HEALTH CARE EQUIPMENT & SERVICES | 107,868 | |||||||||||||||||
|
|
||||||||||||||||||
| TOTAL VARIABLE RATE SENIOR LOAN INTERESTS (Cost $234,422) |
107,881 | |||||||||||||||||
|
|
||||||||||||||||||
| TOTAL LONG-TERM INVESTMENTS (Cost $1,011,224,380) |
1,010,575,436 | |||||||||||||||||
|
|
||||||||||||||||||
| BORROWINGS - (2.5)% (g) | (18,004,699) | |||||||||||||||||
|
|
||||||||||||||||||
| FLOATING RATE OBLIGATIONS - (1.9)% | (13,565,000) | |||||||||||||||||
|
|
||||||||||||||||||
| MFP SHARES, NET - (38.0)%(h) | (273,456,820) | |||||||||||||||||
|
|
||||||||||||||||||
| OTHER ASSETS & LIABILITIES, NET - 1.8% | 13,273,026 | |||||||||||||||||
|
|
||||||||||||||||||
| NET ASSETS APPLICABLE TO COMMON SHARES - 100% | $ | 718,821,943 | ||||||||||||||||
|
|
||||||||||||||||||
All percentages shown in the Portfolio of Investments are based on net assets applicable to common shares unless otherwise noted.
| AMT | Alternative Minimum Tax |
| UB | Underlying bond of an inverse floating rate trust reflected as a financing transaction. Inverse floating rate trust is a Recourse Trust unless otherwise noted. |
| (a) | Investment, or portion of investment, has been pledged to collateralize the net payment obligations for investments in inverse floating rate transactions. |
| (b) | Defaulted security. A security whose issuer has failed to fully pay principal and/or interest when due, or is under the protection of bankruptcy. |
| (c) | Security is exempt from registration under Rule 144A of the Securities Act of 1933, as amended. These securities are deemed liquid and may be resold in transactions exempt from registration, which are normally those transactions with qualified institutional buyers. As of the end of the reporting period, the aggregate value of these securities is $570,059,954 or 56.4% of Total Investments. |
| See Notes to Financial Statements | 39 |
Portfolio of Investments March 31, 2025 (continued)
Enhanced High Yield Municipal Bond
| (d) | Step-up coupon bond, a bond with a coupon that increases (“steps up”), usually at regular intervals, while the bond is outstanding. The rate shown is the coupon as of the end of the reporting period. |
| (e) | When-issued or delayed delivery security. |
| (f) | For fair value measurement disclosure purposes, investment classified as Level 3. |
| (g) | Borrowings as a percentage of Total Investments is 1.8%. |
| (h) | MFP Shares, Net as a percentage of Total Investments is 27.1%. |
| 40 | See Notes to Financial Statements |
Statement of Assets and Liabilities
| March 31, 2025 | Enhanced High Yield Municipal Bond |
|||
| ASSETS |
||||
| Long-term investments, at value† |
$ | 1,010,575,436 | ||
| Cash |
275,000 | |||
| Receivables: |
||||
| Interest |
18,630,301 | |||
| Investments sold |
1,598,156 | |||
| Shares sold |
1,395,954 | |||
| Unfunded commitments |
133,980 | |||
| Other |
78,135 | |||
| Total assets |
1,032,686,962 | |||
| LIABILITIES |
||||
| Borrowings |
18,004,699 | |||
| Floating rate obligations |
13,565,000 | |||
| MFP Shares, Net** |
273,456,820 | |||
| Payables: |
||||
| Management fees |
793,621 | |||
| Dividends |
1,291,612 | |||
| Interest |
112,970 | |||
| Investments purchased - regular settlement |
3,685,000 | |||
| Investments purchased - when-issued/delayed-delivery settlement |
2,406,835 | |||
| Accrued expenses: |
||||
| Custodian fees |
84,714 | |||
| Trustees fees |
12,888 | |||
| Professional fees |
3,558 | |||
| Shareholder reporting expenses |
11,968 | |||
| Shareholder servicing agent fees |
33,709 | |||
| Distribution and service fees (12b-1) |
248,112 | |||
| Shelf offering costs |
3,000 | |||
| Other |
150,513 | |||
| Total liabilities |
313,865,019 | |||
| Commitments and contingencies(1) |
||||
| Net assets applicable to common shares |
$ | 718,821,943 | ||
| NET ASSETS APPLICABLE TO COMMON SHARES CONSIST OF: |
||||
| Paid-in capital |
$ | 719,259,144 | ||
| Total distributable earnings (loss) |
(437,201 | ) | ||
| Net assets applicable to common shares |
$ | 718,821,943 | ||
|
† Long-term investments, cost |
$ | 1,011,224,380 | ||
| ** MFP Shares, liquidation preference |
274,500,000 | |||
| (1) | As disclosed in Notes to Financial Statements. |
See Notes to Financial Statements
41
Statement of Assets and Liabilities (continued)
| Enhanced High Bond |
||||
| CLASS A1: |
||||
| Net assets |
$ | 245,749,027 | ||
| Common Shares outstanding |
32,114,590 | |||
| Net asset value (“NAV”) per common share |
$ | 7.65 | ||
| Maximum sales charge |
2.50 | % | ||
| Offering price per common share (NAV per common share plus maximum sales charge) |
$ | 7.85 | ||
| CLASS A2: |
||||
| Net assets |
$ | 218,073,278 | ||
| Common Shares outstanding |
28,453,666 | |||
| NAV and offering price per common share |
$ | 7.66 | ||
| CLASS I: |
||||
| Net assets |
$ | 254,999,638 | ||
| Common Shares outstanding |
33,323,728 | |||
| NAV and offering price per common share |
$ | 7.65 | ||
| Authorized shares - per class |
Unlimited | |||
| Par value per common share |
$ | 0.01 | ||
See Notes to Financial Statements
42
| Year Ended March 31, 2025 | Enhanced High Bond |
|||
| INVESTMENT INCOME |
||||
| Interest |
$ | 51,637,592 | ||
| Total investment income |
51,637,592 | |||
| EXPENSES |
||||
| Management fees |
7,277,356 | |||
| Distribution and service fees (12b-1) - Class A1 |
1,500,434 | |||
| Distribution and service fees (12b-1) - Class A2 |
785,112 | |||
| Shareholder servicing agent fees - Class A1 |
79,176 | |||
| Shareholder servicing agent fees - Class A2 |
62,413 | |||
| Shareholder servicing agent fees - Class I |
83,462 | |||
| Interest expense and amortization of offering costs |
9,256,645 | |||
| Trustees fees |
30,624 | |||
| Custodian expenses, net |
16,734 | |||
| Excise tax liability expense |
6,580 | |||
| Registration fees |
168,027 | |||
| Professional fees |
168,562 | |||
| Shareholder reporting expenses |
55,645 | |||
| Other |
76,416 | |||
| Total expenses before fee waiver/expense reimbursement |
19,567,186 | |||
| Fee waiver/expense reimbursement |
(220,367 | ) | ||
| Net expenses |
19,346,819 | |||
| Net investment income (loss) |
32,290,773 | |||
| REALIZED AND UNREALIZED GAIN (LOSS) |
||||
| Realized gain (loss) from: |
||||
| Investments |
5,671,191 | |||
| Net realized gain (loss) |
5,671,191 | |||
| Change in unrealized appreciation (depreciation) on: |
||||
| Investments |
(2,954,918 | ) | ||
| Net change in unrealized appreciation (depreciation) |
(2,954,918 | ) | ||
| Net realized and unrealized gain (loss) |
2,716,273 | |||
| Net increase (decrease) in net assets applicable to common shares from operations |
$ | 35,007,046 | ||
See Notes to Financial Statements
43
Statement of Changes in Net Assets
| Enhanced High Yield Municipal Bond | ||||||||
|
|
Year Ended 3/31/25 |
Year Ended 3/31/24 |
||||||
| OPERATIONS |
||||||||
| Net investment income (loss) |
$ | 32,290,773 | $ | 14,637,392 | ||||
| Net realized gain (loss) |
5,671,191 | (732,341) | ||||||
| Net change in unrealized appreciation (depreciation) |
(2,954,918 | ) | 16,504,700 | |||||
| Net increase (decrease) in net assets applicable to common shares from operations |
35,007,046 | 30,409,751 | ||||||
| DISTRIBUTIONS TO COMMON SHAREHOLDERS |
||||||||
| Dividends: |
||||||||
| Class A1 |
(10,205,584 | ) | (4,453,283) | |||||
| Class A2 |
(8,448,860 | ) | (2,758,613) | |||||
| Class I |
(12,308,575 | ) | (7,693,612) | |||||
| Total distributions |
(30,963,019 | ) | (14,905,508) | |||||
| FUND SHARE TRANSACTIONS |
||||||||
| Subscriptions |
378,764,023 | 254,619,118 | ||||||
| Reinvestments of distributions |
17,235,803 | 6,503,791 | ||||||
| Repurchases and redemptions |
(76,605,470 | ) | (10,183,693) | |||||
| Net increase (decrease) applicable to common shares from Fund share transactions |
319,394,356 | 250,939,216 | ||||||
| Net increase (decrease) in net assets applicable to common shares |
323,438,383 | 266,443,459 | ||||||
| Net assets applicable to common shares at the beginning of the period |
395,383,560 | 128,940,101 | ||||||
| Net assets applicable to common shares at the end of the period |
$ | 718,821,943 | $ | 395,383,560 | ||||
See Notes to Financial Statements
44
| Year Ended March 31, 2025 | Enhanced High Bond |
|||
| CASH FLOWS FROM OPERATING ACTIVITIES |
||||
| Net Increase (Decrease) in Net Assets Applicable to Common Shares from Operations |
$ | 35,007,046 | ||
| Adjustments to reconcile the net increase (decrease) in net assets applicable to common shares from operations to net cash provided by (used in) operating activities: |
||||
| Purchases of investments |
(622,733,499 | ) | ||
| Proceeds from sale and maturities of investments |
156,028,755 | |||
| Amortization (Accretion) of premiums and discounts, net |
(6,401,638 | ) | ||
| Amortization of deferred offering costs (Increase) Decrease in: |
49,904 | |||
| Receivable for interest |
(7,899,491 | ) | ||
| Receivable for investments sold |
4,766,844 | |||
| Receivable for reimbursement from Adviser |
34,494 | |||
| Other assets |
(11,376 | ) | ||
| Increase (Decrease) in: |
||||
| Payable for interest |
107,442 | |||
| Payable for investments purchased - regular settlement |
(9,574,280 | ) | ||
| Payable for investments purchased - when-issued/delayed-delivery settlement |
(147,250 | ) | ||
| Payable for management fees |
373,983 | |||
| Accrued custodian fees |
39,792 | |||
| Accrued distribution and service fees (12b-1) |
128,069 | |||
| Accrued Trustees fees |
7,883 | |||
| Accrued professional fees |
(803 | ) | ||
| Accrued shareholder reporting expenses |
(8,271 | ) | ||
| Accrued shareholder servicing agent fees |
17,497 | |||
| Accrued shelf offering costs |
3,000 | |||
| Accrued other expenses |
105,124 | |||
| Net realized (gain) loss from investments |
(5,671,191 | ) | ||
| Net realized (gain) loss from paydowns |
(546,536 | ) | ||
| Net change in unrealized (appreciation) depreciation of investments |
2,954,918 | |||
| Net cash provided by (used in) operating activities |
(453,369,584 | ) | ||
| CASH FLOWS FROM FINANCING ACTIVITIES |
||||
| Proceeds from borrowings |
72,066,182 | |||
| (Repayments) of borrowings |
(54,061,483 | ) | ||
| Proceeds from floating rate obligations |
9,785,000 | |||
| Proceeds from MFP Shares issued, at liquidation preference |
135,000,000 | |||
| (Payments for) deferred offering costs |
(307,000 | ) | ||
| Cash distributions paid to common shareholders |
(13,496,947 | ) | ||
| Subscriptions |
379,214,159 | |||
| Repurchases |
(76,844,244 | ) | ||
| Net cash provided by (used in) financing activities |
451,355,667 | |||
| Net increase (decrease) in cash |
(2,013,917 | ) | ||
| Cash at the beginning of period |
2,288,917 | |||
| Cash at the end of period |
$ | 275,000 | ||
| SUPPLEMENTAL DISCLOSURE OF CASH FLOW INFORMATION | Enhanced High Bond |
|||
| Cash paid for interest |
$ | 8,847,066 | ||
| Non-cash financing activities not included herein consists of reinvestments of common share distributions |
17,111,147 | |||
See Notes to Financial Statements
45
The following data is for a common share outstanding for each fiscal year end unless otherwise noted:
| Investment Operations | Less Distributions to Common Shareholders |
Common Share Net Asset Value, End of Period |
||||||||||||||||||||||||||||||
| Common Share Value, of Period |
Net (Loss)(a) |
Net Realized/ Unrealized Gain (Loss) |
Total | From NII |
From Gains |
Total | ||||||||||||||||||||||||||
| Enhanced High Yield Municipal Bond |
|
|||||||||||||||||||||||||||||||
| Class A1 |
||||||||||||||||||||||||||||||||
| 3/31/25 |
$7.50 | $0.41 | $0.14 | $0.55 | $(0.39 | ) | $(0.01 | ) | $(0.40 | ) | $7.65 | |||||||||||||||||||||
| 3/31/24 |
7.25 | 0.38 | 0.26 | 0.64 | (0.39 | ) | — | (0.39 | ) | 7.50 | ||||||||||||||||||||||
| 3/31/23 |
8.54 | 0.41 | (1.32 | ) | (0.91 | ) | (0.38 | ) | — | (0.38 | ) | 7.25 | ||||||||||||||||||||
|
3/31/22(e) |
10.00 | 0.31 | (1.59 | ) | (1.28 | ) | (0.18 | ) | — | (0.18 | ) | 8.54 | ||||||||||||||||||||
| Class A2 |
||||||||||||||||||||||||||||||||
| 3/31/25 |
7.51 | 0.44 | 0.13 | 0.57 | (0.41 | ) | (0.01 | ) | (0.42 | ) | 7.66 | |||||||||||||||||||||
| 3/31/24 |
7.26 | 0.41 | 0.25 | 0.66 | (0.41 | ) | — | (0.41 | ) | 7.51 | ||||||||||||||||||||||
|
3/31/23(g) |
8.08 | 0.29 | (0.84 | ) | (0.55 | ) | (0.27 | ) | — | (0.27 | ) | 7.26 | ||||||||||||||||||||
| Class I |
||||||||||||||||||||||||||||||||
| 3/31/25 |
7.50 | 0.47 | 0.13 | 0.60 | (0.44 | ) | (0.01 | ) | (0.45 | ) | 7.65 | |||||||||||||||||||||
| 3/31/24 |
7.25 | 0.43 | 0.26 | 0.69 | (0.44 | ) | — | (0.44 | ) | 7.50 | ||||||||||||||||||||||
| 3/31/23 |
8.54 | 0.47 | (1.32 | ) | (0.85 | ) | (0.44 | ) | — | (0.44 | ) | 7.25 | ||||||||||||||||||||
|
3/31/22(e) |
10.00 | 0.30 | (1.54 | ) | (1.24 | ) | (0.22 | ) | — | (0.22 | ) | 8.54 | ||||||||||||||||||||
| (a) | Based on average common shares outstanding. |
| (b) | Total returns are at NAV and do not include any sales charge. Total returns are not annualized. |
| (c) | The expense ratios reflect, among other things, the interest expense deemed to have been paid by the Fund on the floating rate certificates issued by the special purpose trusts for the self-deposited inverse floaters held by the Fund, where applicable, as described in Notes to Financial Statements and the interest expense and fees paid on preferred shares and borrowings, as described in Notes to Financial Statements. |
| (d) | After fee waiver and/or expense reimbursement from the Adviser, where applicable. See Notes to Financial Statements for more information. |
| (e) | For the period June 30, 2021 (commencement of operations) through March 31, 2022. |
| (f) | Annualized. |
| (g) | For the period July 29, 2022 (commencement of operations) through March 31, 2023. |
46
| Common Share Supplemental Data/ Ratios Applicable to Common Shares |
||||||||||||||||||||
| Ratios to Average Net Assets |
||||||||||||||||||||
| Common Share Total Return(b) |
Net Assets, End of Period (000) |
Gross Expenses Including |
Gross Expenses Excluding Interest |
Net Expenses Including Interest(c),(d) |
Net Expenses Excluding Interest(d) |
NII (Loss)(d) |
Portfolio Turnover Rate |
|||||||||||||
|
|
||||||||||||||||||||
| 7.32% |
$245,749 | 3.79% | 2.16% | 3.75 | % | 2.12 | % | 5.32% | 20 | % | ||||||||||
| 9.21 |
139,764 | 4.09 | 2.34 | 3.89 | 2.14 | 5.35 | 41 | |||||||||||||
| (10.70) |
48,252 | 3.98 | 2.76 | 3.48 | 2.26 | 5.49 | 46 | |||||||||||||
| (13.00) |
13,849 | 2.91(f) | 2.62(f) | 2.58 | (f) | 2.29 | (f) | 4.43(f) | 88 | |||||||||||
|
|
||||||||||||||||||||
| 7.60 |
218,073 | 3.55 | 1.92 | 3.51 | 1.88 | 5.63 | 20 | |||||||||||||
| 9.47 |
85,656 | 3.84 | 2.09 | 3.64 | 1.89 | 5.64 | 41 | |||||||||||||
| (6.71) |
26,007 | 3.43(f) | 2.21(f) | 3.03 | (f) | 1.81 | (f) | 5.94(f) | 46 | |||||||||||
|
|
||||||||||||||||||||
| 8.11 |
255,000 | 3.04 | 1.41 | 3.00 | 1.37 | 6.07 | 20 | |||||||||||||
| 10.03 |
169,964 | 3.34 | 1.59 | 3.14 | 1.39 | 6.05 | 41 | |||||||||||||
| (9.99) |
54,680 | 3.25 | 2.03 | 2.77 | 1.55 | 6.28 | 46 | |||||||||||||
| (12.59) |
46,795 | 2.05(f) | 1.76(f) | 1.72 | (f) | 1.43 | (f) | 4.18(f) | 88 | |||||||||||
See Notes to Financial Statements
47
Financial Highlights (continued)
The following table sets forth information regarding the Fund’s outstanding securities as of the end of the Fund’s last five fiscal periods, as applicable.
| Borrowings | MFP Shares | |||||||||||||||
| Aggregate Amount Outstanding (000)(a) |
Asset Share(b) |
Aggregate (000)(a) |
Asset Per $100,000 Share(c) |
|||||||||||||
| Enhanced High Yield Municipal Bond |
||||||||||||||||
| 3/31/25 |
$— | $— | $274,500 | $361,866 | ||||||||||||
| 3/31/24 |
— | — | 139,500 | 383,429 | ||||||||||||
| 3/31/23 |
— | — | 27,500 | 568,873 | ||||||||||||
|
3/31/22(d) |
20,000 | 4,032 | — | — | ||||||||||||
| (a) | Aggregate Amount Outstanding: Aggregate amount outstanding represents the principal amount outstanding or liquidation preference, if applicable, as of the end of the relevant fiscal year. |
| (b) | Asset Coverage Per $1,000: Asset coverage per $1,000 is calculated by subtracting the Fund’s liabilities and indebtedness not represented by senior securities from the Fund’s total assets, dividing the result by the aggregate amount of the Fund’s senior securities representing indebtedness then outstanding (if applicable), plus the aggregate of the involuntary liquidation preference of the outstanding preferred shares, if applicable, and multiplying the result by 1,000. |
| (c) | Asset Coverage Per $100,000: Asset coverage per $100,000 is calculated by subtracting the Fund’s liabilities and indebtedness not represented by senior securities from the Fund’s total assets, dividing the result by the aggregate amount of the Fund’s senior securities representing indebtedness then outstanding (if applicable,) plus the aggregate of the involuntary liquidation preference of the outstanding preferred shares, if applicable, and multiplying the result by 100,000. |
| (d) | For the period June 30, 2021 (commencement of operations) through March 31, 2022. |
48
| 1. | General Information |
Fund Information: The fund covered in this report is Nuveen Enhanced High Yield Municipal Bond Fund (the “Fund”). The Fund is registered under the Investment Company Act of 1940 (the “1940 Act”), as amended, as a closed-end management investment company that continually offers its common shares of beneficial interest (“Common Shares”) and is operated as an “interval fund.” The Fund was organized as a Massachusetts business trust on May 22, 2019.
Current Fiscal Period: The end of the reporting period for the Fund is March 31, 2025, and the period covered by these Notes to Financial Statements is the fiscal year ended March 31, 2025 (the “current fiscal period”).
Investment Adviser and Sub-Adviser: The Fund’s investment adviser, Nuveen Fund Advisors, LLC (the “Adviser”), a subsidiary of Nuveen, LLC (“Nuveen”). Nuveen is the investment management arm of Teachers Insurance and Annuity Association of America (TIAA). The Adviser has overall responsibility for management of the Fund, oversees the management of the Fund’s portfolio, manages the Fund’s business affairs and provides certain clerical, bookkeeping and other administrative services, and, if necessary, asset allocation decisions. The Adviser has entered into a sub- advisory agreement with Nuveen Asset Management, LLC (the “Sub-Adviser”), a subsidiary of the Adviser, under which the Sub-Adviser manages the investment portfolio of the Fund.
Share Classes and Sales Charges: Class A1 Shares are generally sold with an up-front sales charge. Class A1 Share purchases of $100,000 or more are sold at net asset value (“NAV”) without an up-front sales charge but may be subject to a contingent deferred sales charge (“CDSC”) of 1.50% if repurchased before the first day of the month in which the one-year anniversary of the purchase falls. Class A2 Shares and Class I Shares are sold without an upfront sales charge.
| 2. | Significant Accounting Policies |
The accompanying financial statements were prepared in accordance with accounting principles generally accepted in the United States of America (“U.S. GAAP”), which may require the use of estimates made by management and the evaluation of subsequent events. Actual results may differ from those estimates. The Fund is an investment company and follows accounting guidance in the Financial Accounting Standards Board (“FASB”) Accounting Standards Codification 946, Financial Services — Investment Companies. The NAV for financial reporting purposes may differ from the NAV for processing security and shareholder transactions. The NAV for financial reporting purposes includes security and shareholder transactions through the date of the report. Total return is computed based on the NAV used for processing security and shareholder transactions. The following is a summary of the significant accounting policies consistently followed by the Fund.
Compensation: The Fund pays no compensation directly to those of its officers, all of whom receive remuneration for their services to the Fund from the Adviser or its affiliates. The Fund’s Board of Trustees (the “Board”) has adopted a deferred compensation plan for independent trustees that enables trustees to elect to defer receipt of all or a portion of the annual compensation they are entitled to receive from certain Nuveen-advised funds. Under the plan, deferred amounts are treated as though equal dollar amounts had been invested in shares of select Nuveen-advised funds.
Custodian Fee Credit: As an alternative to overnight investments, the Fund has an arrangement with its custodian bank, State Street Bank and Trust Company, (the “Custodian”) whereby certain custodian fees and expenses are reduced by net credits earned on the Fund’s cash on deposit with the bank. Credits for cash balances may be offset by charges for any days on which a Fund overdraws its account at the Custodian. The amount of custodian fee credit earned by a Fund is recognized on the Statement of Operations as a component of “Custodian expenses, net.” During the current reporting period, the custodian fee credit earned by the Fund was as follows:
| Fund | Gross Credits |
|||
| Enhanced High Yield Municipal Bond |
$ | 88,278 | ||
Distributions to Common Shareholders: Distributions to common shareholders are recorded on the ex-dividend date. The amount, character and timing of distributions are determined in accordance with federal income tax regulations, which may differ from U.S. GAAP.
Indemnifications: Under the Fund’s organizational documents, its officers and trustees are indemnified against certain liabilities arising out of the performance of their duties to the Fund. In addition, in the normal course of business, the Fund enters into contracts that provide general indemnifications to other parties. The Fund’s maximum exposure under these arrangements is unknown as this would involve future claims that may be made against the Fund that have not yet occurred. However, the Fund has not had prior claims or losses pursuant to these contracts and expects the risk of loss to be remote.
Investments and Investment Income: Securities transactions are accounted for as of the trade date for financial reporting purposes. Realized gains and losses on securities transactions are based upon the specific identification method. Investment income is comprised of interest income, which is recorded on an accrual basis and includes accretion of discounts and amortization of premiums for financial reporting purposes. Investment income also reflects payment-in-kind (“PIK”) interest and paydown gains and losses, if any. PIK interest represents income received in the form of securities in lieu of cash.
Multiclass Operations and Allocations: Income and expenses of the Fund that are not directly attributable to a specific class of shares are prorated among the classes based on the relative net assets of each class. Expenses directly attributable to a class of shares are recorded to the specific class. 12b-1 distribution and service fees are allocated on a class-specific basis.
49
Notes to Financial Statements (continued)
Realized and unrealized capital gains and losses of the Fund are prorated among the classes based on the relative net assets of each class.
Netting Agreements: In the ordinary course of business, the Fund may enter into transactions subject to enforceable International Swaps and Derivatives Association, Inc. (ISDA) master agreements or other similar arrangements (“netting agreements”). Generally, the right to offset in netting agreements allows the Fund to offset certain securities and derivatives with a specific counterparty, when applicable, as well as any collateral received or delivered to that counterparty based on the terms of the agreements. Generally, the Fund manages its cash collateral and securities collateral on a counterparty basis. With respect to certain counterparties, in accordance with the terms of the netting agreements, collateral posted to the Fund is held in a segregated account by the Fund’s custodian and/or with respect to those amounts which can be sold or repledged, are presented in the Fund’s Portfolio of Investments or Statement of Assets and Liabilities.
The Fund’s investments subject to netting agreements as of the end of the reporting period, if any, are further described later in these Notes to Financial Statements.
Segment Reporting: In November 2023, the FASB issued Accounting Standard Update (“ASU”) No. 2023-07, Segment Reporting (Topic 280) Improvements to Reportable Segment Disclosures (“ASU 2023-07”). The amendments in ASU 2023-07 improve reportable segment disclosure requirements, primarily through enhanced disclosures about significant segment expenses. ASU 2023-07 also requires a public entity that has a single reportable segment to provide all the disclosures required by the amendments in ASU 2023-07 and all existing segment disclosures in Topic 280. The amendments in ASU 2023-07 are effective for fiscal years beginning after December 15, 2023, and interim periods within fiscal years beginning after December 15, 2024. The Fund adopted ASU 2023-07 during the current reporting period. Adoption of the new standard impacted financial statement disclosures only and did not affect the Fund’s financial positions or the results of their operations.
The officers of the Fund act as the chief operating decision maker (“CODM”). The Fund represents a single operating segment. The CODM monitors the operating results of the Fund as a whole and is responsible for the Fund’s long-term strategic asset allocation in accordance with the terms of its prospectus, based on a defined investment strategy which is executed by the Fund’s portfolio managers as a team. The financial information in the form of the Fund’s portfolio composition, total returns, expense ratios and changes in net assets (i.e., changes in net assets resulting from operations, subscriptions and redemptions), which are used by the CODM to assess the segment’s performance versus the Fund’s comparative benchmarks and to make resource allocation decisions for the Fund’s single segment, is consistent with that presented within the Fund’s financial statements. Segment assets are reflected on the Statement of Assets and Liabilities as “total assets” and significant segment revenues and expenses are listed on the Statement of Operations.
New Accounting Pronouncement: In December 2023, the FASB issued ASU No. 2023-09, Income Taxes (Topic 740) Improvements to Income tax disclosures (“ASU 2023-09”). The primary purpose of the amendments within ASU 2023-09 is to enhance the transparency and decision usefulness of income tax disclosures primarily related to the rate reconciliation table and income taxes paid information. The amendments in ASU 2023-09 are effective for annual periods beginning after December 15, 2024. Management is currently evaluating the implications of these changes on the financial statements.
| 3. | Investment Valuation and Fair Value Measurements |
The Fund’s investments in securities are recorded at their estimated fair value utilizing valuation methods approved by the Adviser, subject to oversight of the Board. Fair value is defined as the price that would be received upon selling an investment or transferring a liability in an orderly transaction to an independent buyer in the principal or most advantageous market for the investment. U.S. GAAP establishes the three-tier hierarchy which is used to maximize the use of observable market data and minimize the use of unobservable inputs and to establish classification of fair value measurements for disclosure purposes. Observable inputs reflect the assumptions market participants would use in pricing the asset or liability. Observable inputs are based on market data obtained from sources independent of the reporting entity. Unobservable inputs reflect management’s assumptions about the assumptions market participants would use in pricing the asset or liability. Unobservable inputs are based on the best information available in the circumstances. The following is a summary of the three-tiered hierarchy of valuation input levels.
| Level 1 – | Inputs are unadjusted and prices are determined using quoted prices in active markets for identical securities. |
| Level 2 – | Prices are determined using other significant observable inputs (including quoted prices for similar securities, interest rates, credit spreads, etc.). |
| Level 3 – | Prices are determined using significant unobservable inputs (including management’s assumptions in determining the fair value of investments). |
A description of the valuation techniques applied to the Fund’s major classifications of assets and liabilities measured at fair value follows:
Equity securities and exchange-traded funds listed or traded on a national market or exchange are valued based on their last reported sales price or official closing price of such market or exchange on the valuation date. Foreign equity securities and registered investment companies that trade on a foreign exchange are valued at the last reported sales price or official closing price on the principal exchange where traded, and converted to U.S. dollars at the prevailing rates of exchange on the valuation date. For events affecting the value of foreign securities between the time when the exchange on which they are traded closes and the time when the Fund’s net assets are calculated, such securities will be valued at fair value in accordance with procedures adopted by the Adviser, subject to the oversight of the Board. To the extent these securities are actively traded and no valuation adjustments are applied, they are generally classified as Level 1. When valuation adjustments are applied to the most recent last sales price or official closing price, these securities are generally classified as Level 2.
Prices of fixed-income securities are generally provided by pricing services approved by the Adviser, which is subject to review by the Adviser and oversight of the Board. Pricing services establish a security’s fair value using methods that may include consideration of the following: yields or prices of investments of comparable quality, type of issue, coupon, maturity and rating, market quotes or indications of value from security dealers,
50
evaluations of anticipated cash flows or collateral, general market conditions and other information and analysis, including the obligor’s credit characteristics considered relevant. In pricing certain securities, particularly less liquid and lower quality securities, pricing services may consider information about a security, its issuer or market activity provided by the Adviser. These securities are generally classified as Level 2.
For any portfolio security or derivative for which market quotations are not readily available or for which the Adviser deems the valuations derived using the valuation procedures described above not to reflect fair value, the Adviser will determine a fair value in good faith using alternative procedures approved by the Adviser, subject to the oversight of the Board. As a general principle, the fair value of a security is the amount that the owner might reasonably expect to receive for it in a current sale. A variety of factors may be considered in determining the fair value of such securities, which may include consideration of the following: yields or prices of investments of comparable quality, type of issue, coupon, maturity and rating, market quotes or indications of value from security dealers, evaluations of anticipated cash flows or collateral, general market conditions and other information and analysis, including the obligor’s credit characteristics considered relevant. To the extent the inputs are observable and timely, the values would be classified as Level 2; otherwise they would be classified as Level 3.
The following table summarizes the market value of the Fund’s investments as of the end of the reporting period, based on the inputs used to value them:
| Enhanced High Yield Municipal Bond | Level 1 | Level 2 | Level 3 | Total | ||||
| Long-Term Investments: |
||||||||
| Municipal Bonds |
$ – | $ 1,010,467,496 | $ 59 | $ 1,010,467,555 | ||||
| Variable Rate Senior Loan Interests |
– | – | 107,881 | 107,881 | ||||
| Unfunded Commitments* |
– | – | 133,980 | 133,980 | ||||
| Total |
$ – | $ 1,010,467,496 | $ 241,920 | $ 1,010,709,416 |
| * | Unfunded commitments are valued at the unrealized appreciation (depreciation) on the commitment. |
The Fund holds liabilities in floating rate obligations and preferred shares, which are not reflected in the tables above. The fair values of the Fund’s liabilities for floating rate obligations approximate their liquidation values. Floating rate obligations are generally classified as Level 2 and further described in these Notes to Financial Statements. The fair values of the Fund’s liabilities for preferred shares approximate their liquidation preference. Preferred shares are generally classified as Level 2 and further described in these Notes to Financial Statements.
| 4. | Portfolio Securities |
Inverse Floating Rate Securities: The Fund is authorized to invest in inverse floating rate securities. An inverse floating rate security is created by depositing a municipal bond (referred to as an “Underlying Bond”), typically with a fixed interest rate, into a special purpose tender option bond (“TOB”) trust (referred to as the “TOB Trust”) created by or at the direction of one or more Funds. In turn, the TOB Trust issues (a) floating rate certificates (referred to as “Floaters”), in face amounts equal to some fraction of the Underlying Bond’s par amount or market value, and (b) an inverse floating rate certificate (referred to as an “Inverse Floater”) that represents all remaining or residual interest in the TOB Trust. Floaters typically pay short-term tax-exempt interest rates to third parties who are also provided a right to tender their certificate and receive its par value, which may be paid from the proceeds of a remarketing of the Floaters, by a loan to the TOB Trust from a third party liquidity provider (“Liquidity Provider”), or by the sale of assets from the TOB Trust. The Inverse Floater is issued to a long term investor, such as the Fund. The income received by the Inverse Floater holder varies inversely with the short-term rate paid to holders of the Floaters, and in most circumstances the Inverse Floater holder bears substantially all of the Underlying Bond’s downside investment risk and also benefits disproportionately from any potential appreciation of the Underlying Bond’s value. The value of an Inverse Floater will be more volatile than that of the Underlying Bond because the interest rate is dependent on not only the fixed coupon rate of the Underlying Bond but also on the short-term interest paid on the Floaters, and because the Inverse Floater essentially bears the risk of loss (and possible gain) of the greater face value of the Underlying Bond.
The Inverse Floater held by the Fund gives the Fund the right to (a) cause the holders of the Floaters to tender their certificates at par (or slightly more than par in certain circumstances), and (b) have the trustee of the TOB Trust (the “Trustee”) transfer the Underlying Bond held by the TOB Trust to the Fund, thereby collapsing the TOB Trust.
A Fund may acquire an Inverse Floater in a transaction where it (a) transfers an Underlying Bond that it owns to a TOB Trust created by a third party or (b) transfers an Underlying Bond that it owns, or that it has purchased in a secondary market transaction for the purpose of creating an Inverse Floater, to a TOB Trust created at its direction, and in return receives the Inverse Floater of the TOB Trust (referred to as a “self-deposited Inverse Floater”). The Fund may also purchase an Inverse Floater in a secondary market transaction from a third party creator of the TOB Trust without first owning the Underlying Bond (referred to as an “externally-deposited Inverse Floater”).
An investment in a self-deposited Inverse Floater is accounted for as a “financing” transaction (i.e., a secured borrowing). For a self-deposited Inverse Floater, the Underlying Bond deposited into the TOB Trust is identified in the Fund’s Portfolio of Investments as “(UB) – Underlying bond of an inverse floating rate trust reflected as a financing transaction,” with the Fund recognizing as liabilities, labeled “Floating rate obligations” on the Statement of Assets and Liabilities, (a) the liquidation value of Floaters issued by the TOB Trust, and (b) the amount of any borrowings by the TOB Trust from a Liquidity Provider to enable the TOB Trust to purchase outstanding Floaters in lieu of a remarketing. In addition, the Fund recognizes in “Investment Income” the entire earnings of the Underlying Bond, and recognizes (a) the interest paid to the holders of the Floaters or on the TOB Trust’s borrowings, and (b) other expenses related to remarketing, administration, trustee, liquidity and other services to a TOB Trust, as a component of “Interest expense and amortization of offering costs” on the Statement of Operations. Earnings due from the Underlying Bond and interest due to the holders of the Floaters as of the end of the reporting period are recognized as components of “Receivable for interest” and “Payable for interest” on the Statement of Assets and Liabilities, respectively.
51
Notes to Financial Statements (continued)
In contrast, an investment in an externally-deposited Inverse Floater is accounted for as a purchase of the Inverse Floater and is identified in the Fund’s Portfolio of Investments as “(IF) – Inverse floating rate investment.” For an externally-deposited Inverse Floater, a Fund’s Statement of Assets and Liabilities recognizes the Inverse Floater and not the Underlying Bond as an asset, and the Fund does not recognize the Floaters, or any related borrowings from a Liquidity Provider, as a liability. Additionally, the Fund reflects in “Investment Income” only the net amount of earnings on the Inverse Floater (net of the interest paid to the holders of the Floaters or the Liquidity Provider as lender, and the expenses of the Trust), and does not show the amount of that interest paid or the expenses of the TOB Trust as described above as interest expense on the Statement of Operations.
Fees paid upon the creation of a TOB Trust for self-deposited Inverse Floaters and externally-deposited Inverse Floaters are recognized as part of the cost basis of the Inverse Floater and are capitalized over the term of the TOB Trust.
As of the end of the reporting period, the aggregate value of Floaters issued by the Fund’s TOB Trust for self-deposited Inverse Floaters and externally-deposited Inverse Floaters was as follows:
| Fund | Floating Rate Deposited |
Floating Rate Obligations: Externally-Deposited Inverse Floaters |
Total | |||||||||
| Enhanced High Yield Municipal Bond |
$ | 13,565,000 | $ | — | $ | 13,565,000 | ||||||
During the current fiscal period, the average amount of Floaters (including any borrowings from a Liquidity Provider) outstanding, and the average annual interest rates and fees related to self-deposited Inverse Floaters, were as follows:
| Fund | Average Floating Rate Obligations Outstanding |
Average Annual Interest Rate And Fees |
||||||
| Enhanced High Yield Municipal Bond |
$ | 7,720,808 | 3.57 | % | ||||
TOB Trusts are supported by a liquidity facility provided by a Liquidity Provider pursuant to which the Liquidity Provider agrees, in the event that Floaters are (a) tendered to the Trustee for remarketing and the remarketing does not occur, or (b) subject to mandatory tender pursuant to the terms of the TOB Trust agreement, to either purchase Floaters or to provide the Trustee with an advance from a loan facility to fund the purchase of Floaters by the TOB Trust. In certain circumstances, the Liquidity Provider may otherwise elect to have the Trustee sell the Underlying Bond to retire the Floaters that were tendered and not remarketed prior to providing such a loan. In these circumstances, the Liquidity Provider remains obligated to provide a loan to the extent that the proceeds of the sale of the Underlying Bond are not sufficient to pay the purchase price of the Floaters.
The size of the commitment under the loan facility for a given TOB Trust is at least equal to the balance of that TOB Trust’s outstanding Floaters plus any accrued interest. In consideration of the loan facility, fee schedules are in place and are charged by the Liquidity Provider(s). Any loans made by the Liquidity Provider will be secured by the purchased Floaters held by the TOB Trust. Interest paid on any outstanding loan balances will be effectively borne by the Fund that owns the Inverse Floaters of the TOB Trust that has incurred the borrowing and may be at a rate that is greater than the rate that would have been paid had the Floaters been successfully remarketed.
As described above, any amounts outstanding under a liquidity facility are recognized as a component of “Floating rate obligations” on the Statement of Assets and Liabilities by the Fund holding the corresponding Inverse Floaters issued by the borrowing TOB Trust. As of the end of the reporting period, there were no loans outstanding under any such facility.
The Fund may also enter into shortfall and forbearance agreements (sometimes referred to as a “recourse arrangement”) (TOB Trusts involving such agreements are referred to herein as “Recourse Trusts”), under which a Fund agrees to reimburse the Liquidity Provider for the Trust’s Floaters, in certain circumstances, for the amount (if any) by which the liquidation value of the Underlying Bond held by the TOB Trust may fall short of the sum of the liquidation value of the Floaters issued by the TOB Trust plus any amounts borrowed by the TOB Trust from the Liquidity Provider, plus any shortfalls in interest cash flows (referred to herein as “Shortfall Payment”). Under these agreements, a Fund’s potential exposure to losses related to or on an Inverse Floater may increase beyond the value of the Inverse Floater as a Fund may potentially be liable to fulfill all amounts owed to holders of the Floaters or the Liquidity Provider. Any such shortfall amount in the aggregate is recognized as “Unrealized depreciation on Recourse Trusts” on the Statement of Assets and Liabilities.
As of the end of the reporting period, the Fund’s maximum exposure to the Floaters issued by Recourse Trusts for self-deposited Inverse Floaters and externally-deposited Inverse Floaters was as follows:
| Fund | Maximum Exposure to Recourse Trusts: Self-Deposited Inverse Floaters |
Maximum Exposure to Recourse Trusts: Externally-Deposited Inverse Floaters |
Total | |||||||||
| Enhanced High Yield Municipal Bond |
$ | 13,565,000 | $ | — | $ | 13,565,000 | ||||||
52
Zero Coupon Securities: A zero coupon security does not pay a regular interest coupon to its holders during the life of the security. Income to the holder of the security comes from accretion of the difference between the original purchase price of the security at issuance and the par value of the security at maturity and is effectively paid at maturity. The market prices of zero coupon securities generally are more volatile than the market prices of securities that pay interest periodically.
Purchases and Sales: Long-term purchases and sales during the current fiscal period were as follows:
| Fund | Non-U.S. Government |
Non-U.S. Government Sales |
||||||
| Enhanced High Yield Municipal Bond |
$ | 622,733,499 | $ | 156,028,755 | ||||
The Fund may purchase securities on a when-issued or delayed-delivery basis. Securities purchased on a when-issued or delayed-delivery basis may have extended settlement periods; interest income is not accrued until settlement date. Any securities so purchased are subject to market fluctuation during this period. If the Fund has outstanding when-issued/delayed-delivery purchases commitments as of the end of the reporting period, such amounts are recognized on the Statement of Assets and Liabilities.
The Fund is entitled to purchase future Puerto Rico Electric Power Authority (“PREPA”) bonds, which has been reflected as an unfunded commitment as of March 31, 2025. Any unrealized appreciation (depreciation) for an unfunded commitment is separately presented on the Statements of Assets and Liabilities. An unfunded commitment is priced at its fair market value and any unrealized appreciation (depreciation) is separately presented on the Statement of Assets and Liabilities.
| Fund | Asset Class | Principal Amount |
Value | Unrealized Appreciation (Depreciation) |
||||||||||||
| Enhanced High Yield Municipal Bond |
Unfunded Commitments | $1,460,249 | $133,980 | $133,980 | ||||||||||||
Puerto Rico Electric Power Authority Bonds: On March 28, 2025, the Financial Oversight and Management Board for Puerto Rico (the “FOMB”) filed the Fifth Amended Plan of Adjustment (the “Fifth Amended Plan”) that would reduce PREPA debt from approximately $10 billion to the equivalent of $2.6 billion of Base Consideration for creditors in cash or bonds, reflecting the projections and findings of a new PREPA fiscal plan that was certified by the FOMB on February 6, 2025.
Given the new PREPA fiscal plan along with proposed amendments outlined in the Fifth Amended Plan, greater uncertainty exists as to whether PREPA will issue new bonds (the “Bonds”) in accordance with the terms of the previously agreed upon Forward Delivery Bond Purchase Agreement (“Bond Purchase Agreement”) for which the Fund has participated as a member of the Ad Hoc Group of Consenting PREPA bondholders (the
“Ad Hoc Group”). If PREPA terminates the Bond Purchase Agreement and instead participates in an alternative exit financing transaction, the Ad Hoc Group is entitled to a “break-up fee” equivalent to the difference between the principal amount of Bonds each member of the Ad Hoc Group committed to purchase and the estimated market value of the Bonds as of the termination date of the Bond Purchase Agreement and/or
confirmation of the Fifth Amended Plan. Management is monitoring the impact of the Fifth Amended and ongoing developments on the valuation of the unfunded commitment and the existing PREPA bonds held by the Fund.
| 5. | Derivative Investments |
The Fund is authorized to invest in certain derivative instruments. As defined by U.S. GAAP, a derivative is a financial instrument whose value is derived from an underlying security price, foreign exchange rate, interest rate, index of prices or rates, or other variables. Investments in derivatives as of the end of and/or during the current fiscal period, if any, are included within the Statement of Assets and Liabilities and the Statement of Operations, respectively.
Market and Counterparty Credit Risk: In the normal course of business the Fund may invest in financial instruments and enter into financial transactions where risk of potential loss exists due to changes in the market (market risk) or failure of the other party to the transaction to perform (counterparty credit risk). The potential loss could exceed the value of the financial assets recorded on the financial statements. Financial assets, which potentially expose the Fund to counterparty credit risk, consist principally of cash due from counterparties on forward, option and swap transactions, when applicable. The extent of the Fund’s exposure to counterparty credit risk in respect to these financial assets approximates their carrying value as recorded on the Statement of Assets and Liabilities.
The Fund helps manage counterparty credit risk by entering into agreements only with counterparties the Adviser believes have the financial resources to honor their obligations and by having the Adviser monitor the financial stability of the counterparties. Additionally, counterparties may be required to pledge collateral daily (based on the daily valuation of the financial asset) on behalf of the Fund with a value approximately equal to the amount of any unrealized gain above a pre-determined threshold. Reciprocally, when the Fund has an unrealized loss, the Fund has instructed the custodian to pledge assets of the Fund as collateral with a value approximately equal to the amount of the unrealized loss above a pre-determined threshold. Collateral pledges are monitored and subsequently adjusted if and when the valuations fluctuate, either up or down, by at least the pre-determined threshold amount.
53
Notes to Financial Statements (continued)
| 6. | Fund Shares |
Quarterly Repurchase Offer: In order to provide liquidity to common shareholders, the Fund has adopted a fundamental policy, which may only be changed by a majority vote of shareholders, to make quarterly offers to repurchase between 5% and 25% of its outstanding Common Shares at NAV, reduced by any applicable repurchase fee. Subject to approval of the Board, for each quarterly repurchase offer, the Fund currently expects to offer to repurchase 7.5% of the outstanding Common Shares at NAV. The Fund does not currently expect to charge a repurchase fee and no amounts were charged during the current fiscal period. However, the Fund may charge a repurchase fee of up to 2.00% of the repurchase proceeds, which the Fund would retain to help offset non-de minimis estimated costs related to the repurchase incurred by the Fund, directly or indirectly, as a result of repurchasing Common Shares, thus allocating estimated transaction costs to the Common Shareholder whose Common Shares are being repurchased.
During the current fiscal period, the Fund engaged in quarterly repurchase offers as follows:
| Repurchase Request Deadline |
Repurchase Offer Amount (as a percentage of outstanding shares) |
Number of Shares Repurchased |
Percentage of Repurchased |
|||||||||
| 06 May 2024 |
7.50% | 410,870 | 0.73% | |||||||||
| 05 Aug 2024 |
7.50% | 3,706,867 | 5.58% | |||||||||
| 05 Nov 2024 |
7.50% | 4,366,077 | 5.34% | |||||||||
| 05 Feb 2025 |
7.50% | 1,314,561 | 1.48% | |||||||||
Common Share Transactions
Transactions in common shares during the Fund’s current and prior fiscal period were as follows:
| Year Ended 3/31/25* |
Year Ended 3/31/24* |
|||||||||||||||
| Enhanced High Yield Municipal Bond | Shares | Amount | Shares | Amount | ||||||||||||
| Subscriptions: |
||||||||||||||||
| Class A1 |
14,053,734 | $ | 108,729,762 | 12,514,933 | $ | 90,457,934 | ||||||||||
| Class A2 |
16,442,568 | 128,026,665 | 7,830,952 | 55,994,800 | ||||||||||||
| Class I |
18,294,557 | 142,007,596 | 15,072,948 | 108,166,384 | ||||||||||||
| Total subscriptions |
48,790,859 | 378,764,023 | 35,418,833 | 254,619,118 | ||||||||||||
| Reinvestments of distributions: |
||||||||||||||||
| Class A1 |
860,836 | 6,670,923 | 398,108 | 2,862,917 | ||||||||||||
| Class A2 |
899,925 | 6,994,250 | 301,508 | 2,177,313 | ||||||||||||
| Class I |
460,211 | 3,570,630 | 203,957 | 1,463,561 | ||||||||||||
| Total reinvestments of distributions |
2,220,972 | 17,235,803 | 903,573 | 6,503,791 | ||||||||||||
| Repurchases and redemptions: |
||||||||||||||||
| Class A1 |
(1,424,068 | ) | (11,153,624 | ) | (941,014 | ) | (6,793,578 | ) | ||||||||
| Class A2 |
(287,329 | ) | (2,238,178 | ) | (314,385 | ) | (2,303,785 | ) | ||||||||
| Class I |
(8,086,978 | ) | (63,213,668 | ) | (158,796 | ) | (1,086,330 | ) | ||||||||
| Total repurchases and redemptions |
(9,798,375 | ) | (76,605,470 | ) | (1,414,195 | ) | (10,183,693 | ) | ||||||||
| Net increase (decrease) |
41,213,456 | $ | 319,394,356 | 34,908,211 | $ | 250,939,216 | ||||||||||
| * | As of March 31, 2024, the Advisor owned 9,900 shares. As of March 31, 2025, the Advisor no longer held shares of the Fund. |
Preferred Shares
MuniFund Preferred Shares: The Fund has issued and has outstanding MuniFund Preferred (“MFP”) Shares, with a $100,000 liquidation preference per share. These MFP Shares were issued via private placement and are not publicly available.
The Fund is obligated to redeem its MFP Shares by the date as specified in its offering documents (“Term Redemption Date”), unless earlier redeemed by the Fund. MFP Shares are initially issued in a pre-specified mode, however, MFP Shares can be subsequently designated as an alternative mode at a later date at the discretion of the Fund. The modes within MFP Shares detail the dividend mechanics and are described as follows. At a subsequent date, the Fund may establish additional mode structures with the MFP Share.
| • | Variable Rate Remarketed Mode (“VRRM”) – Dividends for MFP Shares within this mode will be established by a remarketing agent; therefore, the market value of the MFP Shares is expected to approximate its liquidation preference. Shareholders have the ability to request a best-efforts tender of their shares upon seven days notice. If the remarketing agent is unable to identify an alternative purchaser, the shares will be retained by the shareholder requesting tender and the subsequent dividend rate will increase to its step-up dividend rate. If after one consecutive year of unsuccessful remarketing attempts, the Fund will be required to designate an alternative mode or redeem the shares. |
54
The Fund will pay a remarketing fee on the aggregate principal amount of all MFP Shares while designated in VRRM. Payments made by the Fund to the remarketing agent are recognized as “Remarketing fees” on the Statement of Operations.
| • | Variable Rate Mode (“VRM”) – Dividends for MFP Shares designated in this mode are based upon a short-term index plus an additional fixed “spread” amount established at the time of issuance or renewal / conversion of its mode. At the end of the period of the mode, the Fund will be required to either extend the term of the mode, designate an alternative mode or redeem the MFP Shares. |
The fair value of MFP Shares while in VRM are expected to approximate their liquidation preference so long as the fixed “spread” on the shares remains roughly in line with the “spread’ being demanded by investors on instruments having similar terms in the current market. During the current reporting period, the Adviser has determined that the fair value of the shares approximated their liquidation preference.
| • | Variable Rate Demand Mode (“VRDM”) – Dividends for MFP Shares designated in this mode will be established by a remarketing agent; therefore, the market value of the MFP Shares is expected to approximate its liquidation preference. While in this mode, shares will have an unconditional liquidity feature that enable its shareholders to require a liquidity provider, which the Fund has entered into a contractual agreement, to purchase shares in the event that the shares are not able to be successfully remarketed. In the event that shares within this mode are unable to be successfully remarketed and are purchased by the liquidity provider, the dividend rate will be the maximum rate which is designed to escalate according to a specified schedule in order to enhance the remarketing agent’s ability to successfully remarket the shares. The Fund is required to redeem any shares that are still owned by a liquidity provider after six months of continuous, unsuccessful remarketing. |
The Fund will pay a liquidity and remarketing fee on the aggregate principal amount of all MFP Shares while within VRDM. Payments made by the Fund to the liquidity provider and remarketing agent are recognized as “Liquidity fees” and “Remarketing fees”, respectively, on the Statement of Operations.
For financial reporting purposes, the liquidation preference of MFP Shares is recorded as a liability and is recognized as a component of “MFP Shares, Net” on the Statement of Assets and Liabilities. Dividends on the MFP shares are treated as interest payments for financial reporting purposes. Unpaid dividends on MFP shares are recognized as a component on “Payable for interest” on the Statement of Assets and Liabilities. Dividends accrued on MFP Shares are recognized as a component of “Interest expense and amortization of offering costs” on the Statement of Operations.
Subject to certain conditions, MFP Shares may be redeemed, in whole or in part, at any time at the option of the Fund. The Fund may also be required to redeem certain MFP shares if the Fund fails to maintain certain asset coverage requirements and such failures are not cured by the applicable cure date. The redemption price per share in all circumstances is equal to the liquidation preference per share plus any accumulated but unpaid dividends.
The Fund incurred offering costs of $307,000 in connection with its offering of MFP Shares, which were recorded as a deferred charge and are being amortized over the life of the shares. These offering costs are recognized as a component of “MFP Shares, Net” on the Statement of Assets and Liabilities and “Interest expense and amortization of offering costs” on the Statement of Operations.
As of the end of the reporting period, the Fund had $273,456,820 MFP Shares at liquidation preference, net of deferred offering costs. Further details of the Fund’s MFP Shares outstanding as of the end of the reporting period, were as follows:
| Series | Shares Outstanding |
Liquidation Preference |
Term Date |
Mode | Mode Date |
|||||||||||||||
| A |
1,295 | $ | 129,500,000 | September 1, 2042 | VRM | September 25, 2025 | ||||||||||||||
| B |
1,450 | $ | 145,000,000 | July 1, 2043 | VRM | July 1, 2043* | ||||||||||||||
| * | Subject to early termination by either the Fund or the holder. |
The average liquidation preference of MFP Shares outstanding and the annualized dividend rate during the current fiscal period were as follows:
| Fund | Average Liquidation Preference of MFP Shares Outstanding |
Annualized Dividend Rate | ||||||
| Enhanced High Yield Municipal Bond |
$203,691,781 | 4.18% | ||||||
Preferred Share Transactions: Transactions in preferred shares during the Fund’s current and prior fiscal period, where applicable, are noted in the following table.
55
Notes to Financial Statements (continued)
Transactions in MFP Shares for the Fund, where applicable, were as follows:
| Year Ended 3/31/25 | ||||||||||||
| Series | Shares | Amount | ||||||||||
| MFP Shares Issued |
A | 750 | $ | 75,000,000 | ||||||||
| MFP Shares Issued |
B | 600 | $ | 60,000,000 | ||||||||
| Year Ended 3/31/24 | ||||||||||||
| Series | Shares | Amount | ||||||||||
| MFP Shares Issued |
A | 270 | $ | 27,000,000 | ||||||||
| MFP Shares Issued |
B | 850 | $ | 85,000,000 | ||||||||
| 7. | Income Tax Information |
The Fund intends to distribute substantially all of its net investment income and net capital gains to shareholders and otherwise comply with the requirements of Subchapter M of the Internal Revenue Code applicable to regulated investment companies. Therefore, no federal income tax provision is required.
The Fund intends to satisfy conditions that will enable interest from municipal securities, which is exempt from regular federal income tax, to retain such tax-exempt status when distributed to shareholders of the Fund. Net realized capital gains and ordinary income distributions paid by the Fund are subject to federal taxation.
The Fund files income tax returns in U.S. federal and applicable state and local jurisdictions. A Fund’s federal income tax returns are generally subject to examination for a period of three fiscal years after being filed. State and local tax returns may be subject to examination for an additional period of time depending on the jurisdiction. Management has analyzed the Fund’s tax positions taken for all open tax years and has concluded that no provision for income tax is required in the Fund’s financial statements.
Differences between amounts for financial statement and federal income tax purposes are primarily due to timing differences in recognizing gains and losses on investment transactions. Temporary differences do not require reclassification. As of year end, permanent differences that resulted in reclassifications among the components of net assets relate primarily to distribution reallocations, nondeductible expenses, paydowns, taxable market discount, and taxes paid. Temporary and permanent differences have no impact on a Fund’s net assets.
As of year end, the aggregate cost and the net unrealized appreciation/(depreciation) of all investments for federal income tax purposes were as follows:
| Fund | Tax Cost | Gross Unrealized Appreciation |
Gross Unrealized (Depreciation) |
Net Unrealized Appreciation (Depreciation) |
||||||||||||
| Enhanced High Yield Municipal Bond |
$ | 995,129,052 | $ | 28,570,284 | $ | (26,554,920 | ) | $ | 2,015,364 | |||||||
For purposes of this disclosure, tax cost generally includes the cost of portfolio investments as well as up-front fees or premiums exchanged on derivatives and any amounts unrealized for income statement reporting but realized income and/or capital gains for tax reporting, if applicable.
As of year end, the components of accumulated earnings on a tax basis were as follows:
| Fund | Undistributed Income1 |
Undistributed Ordinary Income |
Undistributed Long-Term Capital Gains |
Unrealized Appreciation (Depreciation) |
Capital Loss Carryforwards |
Late-Year Loss Deferrals |
Other Book-to-Tax Differences |
Total | ||||||||||||||||||||||||
| Enhanced High |
||||||||||||||||||||||||||||||||
| Yield Municipal Bond |
$ | 1,472,803 | $ | 114,014 | $ | 82,844 | $ | 2,015,364 | $ | (951,904) | $ | — | $ | (3,170,322)$ | (437,201) | |||||||||||||||||
| 1 | Undistributed tax-exempt income (on a tax basis) has not been reduced for the dividends declared during the period March 3, 2025 through March 31, 2025 and paid on April 1, 2025. |
The tax character of distributions paid was as follows:
| 3/31/25 | 3/31/24 | |||||||||||||||||||||||
| Fund | Tax-Exempt Income1 |
Ordinary Income |
Long-Term Capital Gains |
Tax-Exempt Income |
Ordinary Income |
Long-Term Capital Gains |
||||||||||||||||||
| Enhanced High Yield Municipal Bond |
$ | 30,102,445 | $ | 366,305 | $ | 494,269 | $ | 14,812,808 | $ | 92,700 | $ | — | ||||||||||||
| 1 | The Fund designates these amounts paid during the period as Exempt Interest Dividends. |
As of year end, the Fund had capital loss carryforwards, which will not expire:
56
| Fund | Short-Term | Long-Term | Total | |||||||||
| Enhanced High Yield Municipal Bond1 |
$ | 951,904 | $ | — | $ | 951,904 | ||||||
| 1 | A portion of Enhanced High Yield Municipal Bond’s capital loss carryforwards is subject to limitation under the Internal Revenue Code and related regulations. |
As of year end, the Fund utilized the following capital loss carryforwards:
| Fund | Utilized | |||
| Enhanced High Yield Municipal Bond |
$ | 6,118,191 | ||
| 8. | Management Fees and Other Transactions with Affiliates |
Management Fees: The Fund’s management fee compensates the Adviser for the overall investment advisory and administrative services and general office facilities. The Sub-Adviser is compensated for its services to the Fund from the management fees paid to the Adviser.
The Fund’s management fee consists of two components – a fund-level fee, based only on the amount of assets within the Fund, and a complex- level fee, based on the aggregate amount of all eligible fund assets managed by the Adviser. This pricing structure enables the Fund’s shareholders to benefit from growth in the assets within the Fund as well as from growth in the amount of complex-wide assets managed by the Adviser.
The annual fund-level fee, payable monthly, is calculated according to the following schedule:
| Average Daily Managed Assets* | Fund-Level Fee Rate | |||
| For the first $125 million |
0.8000 | % | ||
| For the next $125 million |
0.7875 | |||
| For the next $250 million |
0.7750 | |||
| For the next $500 million |
0.7625 | |||
| For the next $1 billion |
0.7500 | |||
| For the next $3 billion |
0.7250 | |||
| For managed assets over $5 billion |
0.7125 | |||
For the period April 1, 2024 through April 30, 2024, the annual complex-level fee, payable monthly, was calculated according to the following schedule:
| Complex-Level Eligible Asset Breakpoint Level* | Effective Complex-Level Fee Rate at Breakpoint Level | |||
| $55 billion |
0.2000 | % | ||
| $56 billion |
0.1996 | |||
| $57 billion |
0.1989 | |||
| $60 billion |
0.1961 | |||
| $63 billion |
0.1931 | |||
| $66 billion |
0.1900 | |||
| $71 billion |
0.1851 | |||
| $76 billion |
0.1806 | |||
| $80 billion |
0.1773 | |||
| $91 billion |
0.1691 | |||
| $125 billion |
0.1599 | |||
| $200 billion |
0.1505 | |||
| $250 billion |
0.1469 | |||
| $300 billion |
0.1445 | |||
| * | The complex-level fee is calculated based upon the aggregate daily “eligible assets” of all Nuveen open-end and closed-end funds. Eligible assets do not include assets attributable to investments in other Nuveen funds or assets in excess of a determined amount (originally $2 billion) added to the Nuveen fund complex in connection with the Adviser’s assumption of the management of the former First American Funds effective January 1, 2011, but do include certain assets of certain Nuveen funds that were reorganized into funds advised by an affiliate of the Adviser during the 2019 calendar year. Eligible assets include closed-end fund assets managed by the Adviser that are attributable to certain types of leverage. For these purposes, leverage includes the closed-end funds’ use of preferred stock and borrowings and certain investments in the residual interest certificates (also called inverse floating rate securities) in tender option bond (TOB) trusts, including the portion of assets held by a TOB trust that has been effectively financed by the trust’s issuance of floating rate securities, subject to an agreement by the Adviser as to certain funds to limit the amount of such assets for determining eligible assets in certain circumstances. |
Effective May 1, 2024 the annual complex-level fee, payable monthly, for the Fund is calculated according to the following schedule:
| Complex-Level Asset Breakpoint Level* | Complex-Level Fee | |||
| For the first $124.3 billion |
0.1600 | % | ||
| For the next $75.7 billion |
0.1350 | |||
| For the next $200 billion |
0.1325 | |||
| For eligible assets over $400 billion |
0.1300 | |||
57
Notes to Financial Statements (continued)
| * | The complex-level fee is calculated based upon the aggregate daily “eligible assets” of all Nuveen-branded closed-end funds and Nuveen branded open-end funds (“Nuveen Mutual Funds”). Except as described below, eligible assets include the assets of all Nuveen-branded closed-end funds and Nuveen Mutual Funds organized in the United States. Eligible assets do not include the net assets of: Nuveen fund-of-funds, Nuveen money market funds, Nuveen index funds, Nuveen Large Cap Responsible Equity Fund or Nuveen Life Large Cap Responsible Equity Fund. In addition, eligible assets include a fixed percentage of the aggregate net assets of the active equity and fixed income Nuveen Mutual Funds advised by the Adviser’s affiliate, Teachers Advisors, LLC (except those identified above). The fixed percentage will increase annually until May 1, 2033, at which time eligible assets will include all of the aggregate net assets of the active equity and fixed income Nuveen Mutual Funds advised by Teachers Advisors, LLC (except those identified above). Eligible assets include closed-end fund assets managed by the Adviser that are attributable to financial leverage. For these purposes, financial leverage includes the closed-end funds’ use of preferred stock and borrowings and certain investments in the residual interest certificates (also called inverse floating rate securities) in tender option bond (TOB) trusts, including the portion of assets held by a TOB trust that has been effectively financed by the trust’s issuance of floating rate securities, subject to an agreement by the Adviser as to certain funds to limit the amount of such assets for determining eligible assets in certain circumstances. |
As of March 31, 2025, the complex-level fee rate for the Fund was as follows:
| Fund | Complex-Level Fee | |||
| Enhanced High Yield Municipal Bond |
0.1580 | % | ||
The Adviser has agreed to waive fees and/or reimburse expenses through July 31, 2026, so that the total annual operating expenses of the Fund (excluding any distribution and/or service fees that may be applicable to a particular class of shares, issuance and dividend costs of Preferred Shares that may be issued by the Fund, interest expenses, taxes, acquired fund fees and expenses, fees incurred in acquiring and disposing of portfolio securities, litigation expenses and extraordinary expenses) do not exceed 1.05% of the average daily managed assets of any class of Fund shares. This expense limitation may be terminated or modified prior to that date only with the approval of the Board.
Distribution and Service Fees: The Fund has adopted a Distribution and Servicing Plan for Class A1 Common Shares and Class A2 Common Shares of the Fund. The Distribution and Servicing Plan operates in a manner consistent with Rule 12b-1 under the 1940 Act, which regulates the manner in which an open-end investment company may directly or indirectly bear the expenses of distributing its Common Shares. Although the Fund is not an open-end investment company, it has undertaken to comply with the terms of Rule 12b-1 as a condition of an exemptive order under the 1940 Act which permits it to, among other things, impose distribution and shareholder servicing fees. The Distribution and Servicing Plan permits the Fund to compensate the Nuveen Securities, LLC (the “Distributor”), a wholly-owned subsidiary of Nuveen, for using reasonable efforts to secure purchasers of the Fund’s Common Shares, including by providing continuing information and investment services and/or by making payments to certain authorized institutions in connection with the sale of Common Shares or servicing of shareholder accounts. Most or all of the distribution and/ or service fees are paid to financial firms through which Shareholders may purchase or hold Class A1 Common Shares and/or Class A2 Common Shares. The maximum annual rates at which the distribution and/or servicing fees may be paid under the Distribution and Servicing Plan for Class A1 Common Shares (calculated as a percentage of the Fund’s average daily net assets attributable to the Class A1 Common Shares) is 0.75%. The maximum annual rates at which the distribution and/or servicing fees may be paid under the Distribution and Servicing Plan for Class A2 Common Shares (calculated as a percentage of the Fund’s average daily net assets attributable to the Class A2 Common Shares) is 0.50%. During the current reporting period the annual rate paid by the Fund for Class A1 Shares and Class A2 Shares was 0.75% and 0.50%, respectively.
Other Transactions with Affiliates: The Fund is permitted to purchase or sell securities from or to certain other funds or accounts managed by the Sub-Adviser or by an affiliate of the Adviser (each an, “Affiliated Entity”) under specified conditions outlined in procedures adopted by the Board (“cross-trade”). These procedures have been designed to ensure that any cross-trade of securities by the Fund from or to an Affiliated Entity by virtue of having a common investment adviser (or affiliated investment adviser), common officer and/or common trustee complies with Rule 17a-7 under the 1940 Act. These transactions are effected at the current market price (as provided by an independent pricing service) without incurring broker commissions.
During the current fiscal period, the Fund engaged in cross-trades pursuant to these procedures as follows:
| Fund | Purchases | Sales | Realized Gain (Loss) |
|||||||||
| Enhanced High Yield Municipal Bond |
$ | 29,301,118 | $ | — | $ | — | ||||||
The Distributor also received 12b-1 service fees on Class A1 Shares and Class A2 Shares, substantially all of which were paid to compensate financial intermediaries for providing services to shareholders relating to their investments.
During the current fiscal period, the Distributor compensated financial intermediaries directly with commission advances at the time of purchase as follows:
| Fund | Commission Advances (Unaudited) |
|||
| Enhanced High Yield Municipal Bond |
$ | 1,476,437 | ||
The remaining 12b-1 fees charged to the Fund were paid to compensate financial intermediaries for providing services to shareholders relating to their investments.
The Distributor also collected and retained CDSC on share redemptions during the current fiscal period, as follows:
58
| Fund | CDSC Retained (Unaudited) |
|||
| Enhanced High Yield Municipal Bond |
$ | 41,407 | ||
As of the end of the reporting period TIAA owned less than 1% of Fund shares.
| 9. | Commitments and Contingencies |
In the normal course of business, the Fund enters into a variety of agreements that may expose the Fund to some risk of loss. These could include recourse arrangements for certain TOB Trusts and certain agreements related to preferred shares, which are described elsewhere in these Notes to Financial Statements. The risk of future loss arising from such agreements, while not quantifiable, is expected to be remote. As of the end of the reporting period, the Fund did not have any unfunded commitments other then those disclosed in the Notes to Financial Statements, when applicable.
From time to time, the Fund may be party to certain legal proceedings in the ordinary course of business, including proceedings relating to the enforcement of the Fund’s rights under contracts. As of the end of the reporting period, the Fund is not subject to any material legal proceedings.
| 10. | Borrowing Arrangements |
Committed Line of Credit: The Fund, along with certain funds managed by the Adviser and by an affiliate of the Adviser (“Participating Funds”), have established a 364-day, $2.700 billion standby credit facility with a group of lenders, under which the Participating Funds may borrow for temporary purposes (other than on-going leveraging for investment purposes). Each Participating Fund is allocated a designated proportion of the facility’s capacity (and its associated costs, as described below) based upon a multi-factor assessment of the likelihood and frequency of its need to draw on the facility, the size of the Fund and its anticipated draws, and the potential importance of such draws to the operations and well-being of the Fund, relative to those of the other Funds. A Fund may effect draws on the facility in excess of its designated capacity if and to the extent that other Participating Funds have undrawn capacity. The credit facility expires in June 2025 unless extended or renewed.
The credit facility has the following terms: 0.15% per annum on unused commitment amounts and a drawn interest rate equal to the higher of (a) OBFR (Overnight Bank Funding Rate) plus 1.20% per annum or (b) the Fed Funds Effective Rate plus 1.20% per annum on amounts borrowed. Interest expense incurred by the Participating Funds, when applicable, is recognized as a component of “Interest expense and amortization of offering costs” on the Statement of Operations. Participating Funds paid administration, legal and arrangement fees, which are recognized as a component of “Interest expense and amortization of offering costs” on the Statement of Operations, and along with commitment fees, have been allocated among such Participating Funds based upon the relative proportions of the facility’s aggregate capacity reserved for them and other factors deemed relevant by the Adviser and the Board of each Participating Fund.
During the current fiscal period, the Fund utilized this facility. The Fund’s maximum outstanding balance during the utilization period was as follows:
| Fund | Maximum Balance |
|||
| Enhanced High Yield Municipal Bond |
$ | 22,861,483 | ||
During the Fund’s utilization period(s) during the current fiscal period, the average daily balance outstanding and average annual interest rate on the Borrowings were as follows:
| Fund | Utilization Period (Days Outstanding) |
Average Daily Balance Outstanding |
Average Annual Interest Rate |
|||||||||
| Enhanced High Yield Municipal Bond |
61 | $ | 17,584,060 | 5.72% | ||||||||
Borrowings outstanding as of the end of the reporting period, if any, are recognized as “Borrowings” on the Statement of Assets and Liabilities.
59
(Unaudited)
As required by the Internal Revenue Code and Treasury Regulations, certain tax information, as detailed below, must be provided to shareholders. Shareholders are advised to consult their tax advisor with respect to the tax implications of their investment. The amounts listed below may differ from the actual amounts reported on Form 1099-DIV, which will be sent to shareholders shortly after calendar year end.
Long-Term Capital Gains
As of year end, the Fund designates the following distribution amounts, or maximum amount allowable, as being from net long-term capital gains pursuant to Section 852(b)(3) of the Internal Revenue Code:
| Fund | Net Long-Term Capital Gains |
|||
|
|
||||
| Enhanced High Yield Municipal Bond |
$494,269 | |||
|
|
||||
60
(Unaudited)
| Board of Trustees | ||||||||||||
| Joseph A. Boateng | Michael A. Forrester | Thomas J. Kenny | Amy B.R. Lancellotta | Joanne T. Medero | Albin F. Moschner | John K. Nelson | ||||||
| Loren M. Starr | Matthew Thornton III | Terence J. Toth | Margaret L. Wolff | Robert L. Young | ||||||||
|
| ||||||||
| Investment Adviser Nuveen Fund Advisors, LLC 333 West Wacker Drive Chicago, IL 60606 |
Custodian State Street Bank & Trust Company One Congress Street Boston, MA 02111 |
Legal Counsel Chicago, IL 60603 |
Independent Registered Public Accounting Firm PricewaterhouseCoopers LLP One North Wacker Drive Chicago, IL 60606 |
Transfer Agent and Shareholder Services DST Asset Manager Solutions, Inc. (DST) 333 West 11th
Street Kansas City, MO 64105 | ||||
Portfolio of Investments Information The Fund is required to file its complete schedule of portfolio holdings with the Securities and Exchange Commission (SEC) for the first and third quarters of each fiscal year as an exhibit to its report on Form N-PORT. You may obtain this information on the SEC’s website at http://www.sec.gov.
Nuveen Funds’ Proxy Voting Information You may obtain (i) information regarding how each fund voted proxies relating to portfolio securities held during the most recent twelve-month period ended June 30, without charge, upon request, by calling Nuveen toll-free at (800) 257-8787 or on Nuveen’s website at www.nuveen.com and (ii) a description of the policies and procedures that each fund used to determine how to vote proxies relating to portfolio securities without charge, upon request, by calling Nuveen toll-free at (800) 257-8787. You may also obtain this information directly from the SEC. Visit the SEC on-line at http://www.sec.gov.
FINRA BrokerCheck: The Financial Industry Regulatory Authority (FINRA) provides information regarding the disciplinary history of FINRA member firms and associated investment professionals. This information as well as an investor brochure describing FINRA BrokerCheck is available to the public by calling the FINRA BrokerCheck Hotline number at (800) 289-9999 or by visiting www.FINRA.org.
61
Glossary of Terms Used in this Report
(Unaudited)
Average Annual Total Return: This is a commonly used method to express an investment’s performance over a particular, usually multi-year time period. It expresses the return that would have been necessary each year to equal the investment’s actual cumulative performance (including change in NAV or offer price and reinvested dividends and capital gains distributions, if any) over the time period being considered.
Effective Leverage: Effective leverage is a fund’s effective economic leverage, and includes both regulatory leverage (see leverage) and the leverage effects of certain derivative investments in the fund’s portfolio. Currently, the leverage effects of Tender Option Bond (TOB) inverse floater holdings are included in effective leverage values, in addition to any regulatory leverage.
Inverse Floating Rate Securities: Inverse floating rate securities are the residual interest in a tender option bond (TOB) trust, sometimes referred to as “inverse floaters,” are created by depositing a municipal bond, typically with a fixed interest rate, into a special purpose trust. This trust, in turn, (a) issues floating rate certificates typically paying short-term tax-exempt interest rates to third parties in amounts equal to some fraction of the deposited bond’s par amount or market value, and (b) issues an inverse floating rate certificate (sometimes referred to as an “inverse floater’’) to an investor (such as a Fund) interested in gaining investment exposure to a long-term municipal bond. The income received by the holder of the inverse floater varies inversely with the short-term rate paid to the floating rate certificates’ holders, and in most circumstances the holder of the inverse floater bears substantially all of the underlying bond’s downside investment risk. The holder of the inverse floater typically also benefits disproportionately from any potential appreciation of the underlying bond’s value. Hence, an inverse floater essentially represents an investment in the underlying bond on a leveraged basis.
Leverage: Leverage is created whenever a fund has investment exposure (both reward and/or risk) equivalent to more than 100% of the investment capital.
Net Asset Value (NAV) Per Share: A fund’s Net Assets is equal to its total assets (securities, cash, accrued earnings and receivables) less its total liabilities. NAV per share is equal to the fund’s Net Assets divided by its number of shares outstanding.
Regulatory Leverage: Regulatory leverage consists of preferred shares issued by or borrowings of a fund. Both of these are part of a fund’s capital structure. Regulatory leverage is subject to asset coverage limits set in the Investment Company Act of 1940.
Tax Obligation/General Bonds: Bonds backed by the general revenues of an issuer, including taxes, where the issuer has the ability to increase taxes by an unlimited amount to pay the bonds back.
Tax Obligation/Limited Bonds: Bonds backed by the general revenues of an issuer, including taxes, where the issuer doesn’t have the ability to increase taxes by an unlimited amount to pay the bonds back.
Total Investment Exposure: Total investment exposure is a fund’s assets managed by the Adviser that are attributable to financial leverage. For these purposes, financial leverage includes a fund’s use of preferred stock and borrowings and investments in the residual interest certificates (also called inverse floating rate securities) in the residual interest certificates (also called inverse floating rate securities) in tender option bond (TOB) trusts, including the portion of assets heId by a TOB trust that has been effectively financed by the trust’s issuance of floating rate securities.
62
(Unaudited)
The management of the Funds, including general supervision of the duties performed for the Funds by the Adviser, is the responsibility of the Board of Trustees of the Funds. None of the trustees who are not “interested” persons of the Funds (referred to herein as “independent board members”) has ever been a director or employee of, or consultant to, Nuveen or its affiliates. The names and business addresses of the trustees and officers of the Funds, their principal occupations and other affiliations during the past five years, the number of portfolios each Trustee oversees and other directorships they hold are set forth below.
| Name, Year of Birth & Address |
Position(s) Held with the Funds |
Year First Elected or Appointed and Term(1) |
Principal Occupation(s) Including other Directorships During Past 5 Years |
Number of Overseen By | ||||
| Independent Trustees: | ||||||||
| Joseph A. Boateng 1963 333 W. Wacker Drive Chicago, IL 60606 |
Board Member | 2019 Class II |
Chief Investment Officer, Casey Family Programs (since 2007); formerly, Director of U.S. Pension Plans, Johnson & Johnson (2002–2006); Board Member, Lumina Foundation (since 2019) and Waterside School (since 2021); Board Member (2012–2019) and Emeritus Board Member (since 2020), Year-Up Puget Sound; Investment Advisory Committee Member and Former Chair (since 2007), Seattle City Employees’ Retirement System; Investment Committee Member (since 2019), The Seattle Foundation; Trustee (2018–2023), the College Retirement Equities Fund; Manager (2019–2023), TIAA Separate Account VA-1. | 212 | ||||
| Michael A. Forrester 1967 333 W. Wacker Drive Chicago, IL 60606 |
Board Member | 2007 Class I |
Formerly, Chief Executive Officer (2014–2021) and Chief Operating Officer (2007–2014), Copper Rock Capital Partners, LLC; Director, Aflac Incorporated (since 2025); Trustee, Dexter Southfield School (since 2019); Member (since 2020), Governing Council of the Independent Directors Council (IDC); Trustee, the College Retirement Equities Fund and Manager, TIAA Separate Account VA-1 (2007–2023). | 212 | ||||
| Thomas J. Kenny 1963 333 W. Wacker Drive Chicago, IL 60606 |
Board Member | 2011 Class I |
Formerly, Advisory Director (2010–2011), Partner (2004–2010), Managing Director (1999–2004) and Co-Head of Global Cash and Fixed Income Portfolio Management Team (2002–2010), Goldman Sachs Asset Management; Director (since 2015) and Chair of the Finance and Investment Committee (since 2018), Aflac Incorporated; Director (since 2018), ParentSquare; formerly, Director (2021–2022) and Finance Committee Chair (2016–2022), Sansum Clinic; formerly, Advisory Board Member (2017–2019), B’Box; formerly, Member (2011–2012), the University of California at Santa Barbara Arts and Lectures Advisory Council; formerly, Investment Committee Member (2012–2020), Cottage Health System; formerly, Board member (2009–2019) and President of the Board (2014–2018), Crane Country Day School; Trustee (2011– 2023) and Chairman (2017–2023), the College Retirement Equities Fund; Manager (2011–2023) and Chairman (2017–2023), TIAA Separate Account VA-1. | 217 | ||||
| Amy B. R. Lancellotta 1959 333 W. Wacker Drive Chicago, IL 60606 |
Board Member | 2021 Class II |
Formerly, Managing Director, IDC (supports the fund independent director community and is part of the Investment Company Institute (ICI), which represents regulated investment companies) (2006-2019); formerly, various positions with ICI (1989-2006); President (since 2023) and Member (since 2020) of the Board of Directors, Jewish Coalition Against Domestic Abuse (JCADA). | 217 | ||||
63
Board Members & Officers (Unaudited) (continued)
| Name, Year of Birth & Address |
Position(s) Held with the Funds |
Year First Elected or Appointed and Term(1) |
Principal Occupation(s) Including other Directorships During Past 5 Years |
Number of Overseen By | ||||
| Joanne T. Medero 1954 333 W. Wacker Drive Chicago, IL 60606 |
Board Member | 2021 Class III |
Formerly, Managing Director, Government Relations and Public Policy (2009-2020) and Senior Advisor to the Vice Chairman (2018- 2020), BlackRock, Inc. (global investment management firm); formerly, Managing Director, Global Head of Government Relations and Public Policy, Barclays Group (IBIM) (investment banking, investment management and wealth management businesses) (2006-2009); formerly, Managing Director, Global General Counsel and Corporate Secretary, Barclays Global Investors (global investment management firm) (1996-2006); formerly, Partner, Orrick, Herrington & Sutcliffe LLP (law firm) (1993-1995); formerly, General Counsel, Commodity Futures Trading Commission (government agency overseeing U.S. derivatives markets) (1989-1993); formerly, Deputy Associate Director/Associate Director for Legal and Financial Affairs, Office of Presidential Personnel, The White House (1986-1989); Member of the Board of Directors, Baltic-American Freedom Foundation (seeks to provide opportunities for citizens of the Baltic states to gain education and professional development through exchanges in the U.S.) (since 2019). | 217 | ||||
| Albin F. Moschner 1952 333 W. Wacker Drive Chicago, IL 60606 |
Board Member | 2016 Class III |
Founder and Chief Executive Officer, Northcroft Partners, LLC, (management consulting) (since 2012); formerly, Chairman (2019), and Director (2012-2019), USA Technologies, Inc., (provider of solutions and services to facilitate electronic payment transactions); formerly, Director, Wintrust Financial Corporation (1996-2016); previously, held positions at Leap Wireless International, Inc. (consumer wireless services), including Consultant (2011-2012), Chief Operating Officer (2008-2011), and Chief Marketing Officer (2004-2008); formerly, President, Verizon Card Services division of Verizon Communications, Inc. (2000-2003); formerly, President, One Point Services at One Point Communications (telecommunication services) (1999-2000); formerly, Vice Chairman of the Board, Diba, Incorporated (internet technology provider) (1996-1997); formerly, various executive positions (1991-1996) including Chief Executive Officer (1995-1996) of Zenith Electronics Corporation (consumer electronics). |
217 | ||||
| John K. Nelson 1962 333 W. Wacker Drive Chicago, IL 60606 |
Board Member | 2013 Class II |
Formerly, Member of Board of Directors of Core12 LLC (2008– 2023) (private firm which develops branding, marketing and communications strategies for clients); formerly, Member of The President’s Council of Fordham University (2010–2019); formerly, Director of the Curran Center for Catholic American Studies (2009–2018); formerly, senior external advisor to the Financial Services practice of Deloitte Consulting LLP. (2012–2014); formerly, Trustee and Chairman of the Board of Trustees of Marian University (2010–2013); formerly Chief Executive Officer of ABN AMRO Bank N.V., North America, and Global Head of the Financial Markets Division (2007–2008), with various executive leadership roles in ABN AMRO Bank N.V. between 1996 and 2007. | 217 | ||||
| Loren M. Starr 1961 333 W. Wacker Drive Chicago, IL 60606 |
Board Member | 2022 Class III |
Independent Consultant/Advisor (since 2021); formerly, Vice Chair, Senior Managing Director (2020–2021), Chief Financial Officer, Senior Managing Director (2005–2020), Invesco Ltd.; Director (since 2023) and Chair of the Audit Committee (since 2024), AMG; formerly, Chair and Member of the Board of Directors (2014–2021), Georgia Leadership Institute for School Improvement (GLISI); formerly, Chair and Member of the Board of Trustees (2014–2018), Georgia Council on Economic Education (GCEE); Trustee, the College Retirement Equities Fund and Manager, TIAA Separate Account VA-1 (2022–2023). | 216 | ||||
64
| Name, Year of
Birth |
Position(s) Held with the Funds |
Year First Elected or Appointed and Term(1) |
Principal Occupation(s) Including other Directorships During Past 5 Years |
Number of Portfolios in Fund Complex Overseen By Board Member | ||||
| Matthew Thornton III 1958 333 W. Wacker Drive Chicago, IL 60606 |
Board Member | 2020 Class III |
Formerly, Executive Vice President and Chief Operating Officer (2018-2019), FedEx Freight Corporation, a subsidiary of FedEx Corporation (FedEx) (provider of transportation, e-commerce and business services through its portfolio of companies); formerly, Senior Vice President, U.S. Operations (2006-2018), Federal Express Corporation, a subsidiary of FedEx; formerly Member of the Board of Directors (2012-2018), Safe Kids Worldwide® (a non-profit organization dedicated to preventing childhood injuries). Member of the Board of Directors (since 2014), The Sherwin-Williams Company (develops, manufactures, distributes and sells paints, coatings and related products); Director (since 2020), Crown Castle International (provider of communications infrastructure). | 217 | ||||
| Terence J. Toth 1959 333 W. Wacker Drive Chicago, IL 60606 |
Board Member | 2008 Class II |
Formerly, a Co–Founding Partner, Promus Capital (investment advisory firm) (2008–2017); formerly, Director, Quality Control Corporation (manufacturing) (2012–2021); formerly, Chair and Member of the Board of Directors (2021–2024), Kehrein Center for the Arts (philanthropy); Member of the Board of Directors (since 2008), Catalyst Schools of Chicago (philanthropy); Member of the Board of Directors (since 2012), formerly, Investment Committee Chair (2017–2022), Mather Foundation Board (philanthropy); formerly, Member (2005–2016), Chicago Fellowship Board (philanthropy); formerly, Director, Fulcrum IT Services LLC (information technology services firm to government entities) (2010–2019); formerly, Director, LogicMark LLC (health services) (2012–2016); formerly, Director, Legal & General Investment Management America, Inc. (asset management) (2008–2013); formerly, CEO and President, Northern Trust Global Investments (financial services) (2004–2007); Executive Vice President, Quantitative Management & Securities Lending (2000–2004); prior thereto, various positions with Northern Trust Company (financial services) (since 1994); formerly, Member, Northern Trust Mutual Funds Board (2005–2007), Northern Trust Global Investments Board (2004–2007), Northern Trust Japan Board (2004–2007), Northern Trust Securities Inc. Board (2003–2007) and Northern Trust Hong Kong Board (1997–2004). | 217 | ||||
| Margaret L. Wolff 1955 333 W. Wacker Drive Chicago, IL 60606 |
Board Member | 2016 Class I |
Formerly, member of the Board of Directors (2013-2017) of Travelers Insurance Company of Canada and The Dominion of Canada General Insurance Company (each, a part of Travelers Canada, the Canadian operation of The Travelers Companies, Inc.); formerly, Of Counsel, Skadden, Arps, Slate, Meagher & Flom LLP (Mergers & Acquisitions Group) (legal services) (2005- 2014); Member of the Board of Trustees of New York-Presbyterian Hospital (since 2005); Member of the Board of Trustees (since 2004) formerly, Chair (2015-2022) of The John A. Hartford Foundation (a philanthropy dedicated to improving the care of older adults); formerly, Member (2005-2015) and Vice Chair (2011- 2015) of the Board of Trustees of Mt. Holyoke College. |
217 | ||||
| Robert L. Young 1963 333 W. Wacker Drive Chicago, IL 60606 |
Chair and Board Member | 2017 Class I |
Formerly, Chief Operating Officer and Director, J.P. Morgan Investment Management Inc. (financial services) (2010-2016); formerly, President and Principal Executive Officer (2013-2016), and Senior Vice President and Chief Operating Officer (2005-2010), of J.P. Morgan Funds; formerly, Director and various officer positions for J.P. Morgan Investment Management Inc. (formerly, JPMorgan Funds Management, Inc. and formerly, One Group Administrative Services) and JPMorgan Distribution Services, Inc. (financial services) (formerly, One Group Dealer Services, Inc.) (1999-2017). | 217 | ||||
65
Board Members & Officers (Unaudited) (continued)
| Name, Year of Birth & Address |
Position(s) Held with the Funds |
Year First Elected or Appointed(2) |
Principal Occupation(s) Including other Directorships During Past 5 Years | |||
| Officers of the Funds: | ||||||
| David J. Lamb 1963 333 W. Wacker Drive Chicago, IL 60606 |
Chief Administrative Officer (Principal Executive Officer) | 2015 | Senior Managing Director of Nuveen Fund Advisors, LLC, Nuveen Securities, LLC and Nuveen; has previously held various positions with Nuveen. | |||
| Brett E. Black 1972 333 W. Wacker Drive Chicago, IL 60606 |
Vice President and Chief Compliance Officer | 2022 | Managing Director, Chief Compliance Officer of Nuveen; formerly, Vice President (2014-2022), Chief Compliance Officer and Anti-Money Laundering Compliance Officer (2017-2022) of BMO Funds, Inc. | |||
| Marc Cardella 1984 8500 Andrew Carnegie Blvd. Charlotte, NC 28262 |
Vice President and Controller (Principal Financial Officer) | 2024 | Senior Managing Director, Head of Public Investment Finance of Nuveen; Senior Managing Director of Nuveen Fund Advisors, LLC, Nuveen Asset Management, LLC, Teachers Advisors, LLC and TIAA-CREF Investment Management, LLC, Managing Director of Teachers Insurance and Annuity Association of America and TIAA SMA Strategies LLC; Principal Financial Officer, Principal Accounting Officer and Treasurer of TIAA Separate Account VA-1 and the College Retirement Equities Fund. | |||
| Joseph T. Castro 1964 333 W. Wacker Drive Chicago, IL 60606 |
Vice President | 2025 | Executive Vice President, Chief Risk and Compliance Officer, formerly, Senior Managing Director and Head of Compliance, Nuveen; Executive Vice President, formerly, Senior Managing Director, Nuveen Securities, LLC; Senior Managing Director, Nuveen Fund Advisors, LLC and Nuveen, LLC. | |||
| Mark J. Czarniecki 1979 901 Marquette Avenue Minneapolis, MN 55402 |
Vice President and Assistant Secretary | 2013 | Managing Director and Assistant Secretary of Nuveen Securities, LLC and Nuveen Fund Advisors, LLC; Managing Director and Associate General Counsel of Nuveen; Managing Director, Assistant Secretary and Associate General Counsel of Nuveen Asset Management, LLC; has previously held various positions with Nuveen; Managing Director, Associate General Counsel and Assistant Secretary of Teachers Advisors, LLC and TIAA-CREF Investment Management, LLC. | |||
| Jeremy D. Franklin 1983 8500 Andrew Carnegie Blvd. Charlotte, NC 28262 |
Vice President and Assistant Secretary | 2024 | Managing Director and Assistant Secretary, Nuveen Fund Advisors, LLC; Managing Director, Associate General Counsel and Assistant Secretary, Nuveen Asset Management, LLC, Teachers Advisors, LLC and TIAA-CREF Investment Management, LLC; Vice President and Associate General Counsel, Teachers Insurance and Annuity Association of America; Vice President and Assistant Secretary, TIAA-CREF Funds and TIAA-CREF Life Funds; Vice President, Associate General Counsel, and Assistant Secretary, TIAA Separate Account VA-1 and College Retirement Equities Fund. | |||
| Diana R. Gonzalez 1978 8500 Andrew Carnegie Blvd. Charlotte, NC 28262 |
Vice President and Assistant Secretary | 2017 | Vice President and Assistant Secretary of Nuveen Fund Advisors, LLC; Vice President, Associate General Counsel and Assistant Secretary of Nuveen Asset Management, LLC, Teachers Advisors, LLC and TIAA-CREF Investment Management, LLC; Vice President and Associate General Counsel of Nuveen. | |||
| Nathaniel T. Jones 1979 333 W. Wacker Drive Chicago, IL 60606 |
Vice President and Treasurer | 2016 | Senior Managing Director of Nuveen; President. formerly, Senior Managing Director, of Nuveen Fund Advisors, LLC; has previously held various positions with Nuveen; Chartered Financial Analyst. | |||
| Brian H. Lawrence 1982 8500 Andrew Carnegie Blvd. Charlotte, NC 28262 |
Vice President and Assistant Secretary | 2023 | Vice President and Associate General Counsel of Nuveen; Vice President, Associate General Counsel and Assistant Secretary of Teachers Advisors, LLC and TIAA-CREF Investment Management, LLC; formerly Corporate Counsel of Franklin Templeton (2018-2022). | |||
| Tina M. Lazar 1961 333 W. Wacker Drive Chicago, IL 60606 |
Vice President | 2002 | Managing Director of Nuveen Securities, LLC. | |||
| Brian J. Lockhart 1974 333 W. Wacker Drive Chicago, IL 60606 |
Vice President | 2019 | Senior Managing Director and Head of Investment Oversight of Nuveen; Senior Managing Director of Nuveen Fund Advisors, LLC; has previously held various positions with Nuveen; Chartered Financial Analyst and Certified Financial Risk Manager. | |||
66
| Name, Year of Birth & Address |
Position(s) Held with the Funds |
Year First Elected or Appointed(2) |
Principal Occupation(s) Including other Directorships During Past 5 Years | |||
| John M. McCann 1975 8500 Andrew Carnegie Blvd. Charlotte, NC 28262 |
Vice President and Assistant Secretary | 2022 | Senior Managing Director, Division General Counsel of Nuveen; Senior Managing Director, General Counsel and Secretary of Nuveen Fund Advisors, LLC; Managing Director, Associate General Counsel and Assistant Secretary of Nuveen Asset Management, LLC; Managing Director and Assistant Secretary of TIAA SMA Strategies LLC; Managing Director, Associate General Counsel and Assistant Secretary of College Retirement Equities Fund, TIAA Separate Account VA-1, TIAA- CREF Funds, TIAA-CREF Life Funds, Teachers Insurance and Annuity Association of America, Teacher Advisors LLC, TIAA-CREF Investment Management, LLC, and Nuveen Alternative Advisors LLC; has previously held various positions with Nuveen/TIAA. | |||
| Kevin J. McCarthy 1966 333 W. Wacker Drive Chicago, IL 60606 |
Vice President and Assistant Secretary | 2007 | Executive Vice President, Secretary and General Counsel of Nuveen Investments, Inc.; Executive Vice President and Assistant Secretary of Nuveen Securities, LLC and Nuveen Fund Advisors, LLC; Executive Vice President and Secretary of Nuveen Asset Management, LLC, Teachers Advisors, LLC, TIAA-CREF Investment Management, LLC and Nuveen Alternative Investments, LLC; Executive Vice President, Associate General Counsel and Assistant Secretary of TIAA-CREF Funds and TIAA-CREF Life Funds; has previously held various positions with Nuveen; Vice President and Secretary of Winslow Capital Management, LLC; formerly, Vice President (2007-2021) and Secretary (2016-2021) of NWQ Investment Management Company, LLC and Santa Barbara Asset Management, LLC. | |||
| William A. Siffermann 1975 333 W. Wacker Drive Chicago, IL 60606 |
Vice President | 2017 | Senior Managing Director of Nuveen. | |||
| Mark L. Winget 1968 333 W. Wacker Drive Chicago, IL 60606 |
Vice President and Secretary | 2008 | Vice President and Assistant Secretary of Nuveen Securities, LLC and Nuveen Fund Advisors, LLC; Vice President, Associate General Counsel and Assistant Secretary of Teachers Advisors, LLC and TIAA-CREF Investment Management, LLC and Nuveen Asset Management, LLC; Vice President and Associate General Counsel of Nuveen. | |||
| Rachael Zufall 1973 8500 Andrew Carnegie Blvd. Charlotte, NC 28262 |
Vice President and Assistant Secretary | 2022 | Managing Director and Assistant Secretary of Nuveen Fund Advisors, LLC; Managing Director, Associate General Counsel and Assistant Secretary of the College Retirement Equities Fund, TIAA Separate Account VA-1, TIAA-CREF Funds and TIAA-CREF Life Funds; Managing Director, Associate General Counsel and Assistant Secretary of Teacher Advisors, LLC and TIAA-CREF Investment Management, LLC; Managing Director of Nuveen, LLC and of TIAA. | |||
| (1) | Trustees serve an indefinite term until his/her successor is elected or appointed. The year first elected or appointed represents the year in which the director was first elected or appointed to any fund in the Nuveen Fund Complex. |
| (2) | Officers serve one year terms through August of each year. The year first elected or appointed represents the year in which the officer was first elected or appointed to any fund in the Nuveen Fund Complex. |
67

Nuveen:
Serving Investors for Generations
Since 1898, financial advisors and their clients have relied on Nuveen to provide dependable investment solutions through continued adherence to proven, long-term investing principles. Today, we offer a range of high quality solutions designed to be integral components of a well-diversified core portfolio.
Focused on meeting investor needs.
Nuveen is the investment manager of TIAA. We have grown into one of the world’s premier global asset managers, with specialist knowledge across all major asset classes and particular strength in solutions that provide income for investors and that draw on our expertise in alternatives and responsible investing. Nuveen is driven not only by the independent investment processes across the firm, but also the insights, risk management, analytics and other tools and resources that a truly world-class platform provides. As a global asset manager, our mission is to work in partnership with our clients to create solutions which help them secure their financial future.
Find out how we can help you.
To learn more about how the products and services of Nuveen may be able to help you meet your financial goals, talk to your financial advisor, or call us at (800) 257-8787. Please read the information provided carefully before you invest. Investors should consider the investment objective and policies, risk considerations, charges and expenses of any investment carefully. Where applicable, be sure to obtain a prospectus, which contains this and other relevant information. To obtain a prospectus, please contact your securities representative or Nuveen, 333 W. Wacker Dr., Chicago, IL 60606. Please read the prospectus carefully before you invest or send money.
Learn more about Nuveen Funds at: www.nuveen.com/interval-funds
NOT FDIC INSURED MAY LOSE VALUE NO BANK GUARANTEE
Nuveen Securities, LLC, member FINRA and SIPC | 333 West Wacker Drive | Chicago, IL 60606 | www.nuveen.com RAN-HYIF-0325P 4395192
| Item 2. | Code of Ethics. |
As of the end of the period covered by this report, the registrant has adopted a code of ethics that applies to the registrant’s principal executive officer, principal financial officer, principal accounting officer or controller, or persons performing similar functions. There were no amendments to or waivers from the code during the period covered by this report. Upon request, a copy of the registrant’s code of ethics is available without charge by calling 800-257-8787.
| Item 3. | Audit Committee Financial Expert. |
As of the end of the period covered by this report, the registrant’s Board of Directors or Trustees (“Board”) had determined that the registrant has at least one “audit committee financial expert” (as defined in Item 3 of Form N-CSR) serving on its Audit Committee. The members of the registrant’s audit committee that have been designated as audit committee financial experts are Joseph A. Boateng, John K. Nelson, Loren M. Starr and Robert L. Young, who are “independent” for purposes of Item 3 of Form N-CSR.
Mr. Boateng has served as the Chief Investment Officer for Casey Family Programs since 2007. He was previously Director of U.S. Pension Plans for Johnson & Johnson from 2002-2006. Mr. Boateng is a board member of the Lumina Foundation and Waterside School, an emeritus board member of Year Up Puget Sound, member of the Investment Advisory Committee and former Chair for the Seattle City Employees’ Retirement System, and an Investment Committee Member for The Seattle Foundation. Mr. Boateng previously served on the Board of Trustees for the College Retirement Equities Fund (2018-2023) and on the Management Committee for TIAA Separate Account VA-1 (2019-2023).
Mr. Nelson formerly served on the Board of Directors of Core12, LLC from 2008 to 2023, a private firm which develops branding, marketing, and communications strategies for clients. Mr. Nelson has extensive experience in global banking and markets, having served in several senior executive positions with ABN AMRO Holdings N.V. and its affiliated entities and predecessors, including LaSalle Bank Corporation from 1996 to 2008, ultimately serving as Chief Executive Officer of ABN AMRO N.V. North America. During his tenure at the bank, he also served as Global Head of its Financial Markets Division, which encompassed the bank’s Currency, Commodity, Fixed Income, Emerging Markets, and Derivatives businesses. He was a member of the Foreign Exchange Committee of the Federal Reserve Bank of the United States and during his tenure with ABN AMRO served as the bank’s representative on various committees of The Bank of Canada, European Central Bank, and The Bank of England. Mr. Nelson previously served as a senior, external advisor to the financial services practice of Deloitte Consulting LLP. (2012-2014).
Mr. Starr was Vice Chair, Senior Managing Director from 2020 to 2021, and Chief Financial Officer, Senior Managing Director from 2005 to 2020, for Invesco Ltd. Mr. Starr is also a Director and Chair of the Audit Committee for AMG. He is former Chair and member of the Board of Directors, Georgia Leadership Institute for School Improvement (GLISI); former Chair and member of the Board of Trustees, Georgia Council on Economic Education (GCEE). Mr. Starr previously served on the Board of Trustees for the College Retirement Equities Fund and on the Management Committee for TIAA Separate Account VA-1 (2022-2023).
Mr. Young has more than 30 years of experience in the investment management industry. From 1997 to 2017, he held various positions with J.P. Morgan Investment Management Inc. (“J.P. Morgan Investment”) and its affiliates (collectively, “J.P. Morgan”). Most recently, he served as Chief Operating Officer and Director of J.P. Morgan Investment (from 2010 to 2016) and as President and Principal Executive Officer of the J.P. Morgan Funds (from 2013 to 2016). As Chief Operating Officer of J.P. Morgan Investment, Mr. Young led service, administration and business platform support activities for J.P. Morgan’s domestic retail mutual fund and institutional commingled and separate account businesses and co-led these activities for J.P. Morgan’s global retail and institutional investment management businesses. As President of the J.P. Morgan Funds, Mr. Young interacted with various service providers to these funds, facilitated the relationship between such funds and their boards, and was directly involved in establishing board agendas, addressing regulatory matters, and establishing policies and procedures. Before joining J.P. Morgan, Mr. Young, a former Certified Public Accountant (CPA), was a Senior Manager (Audit) with Deloitte & Touche LLP (formerly, Touche Ross LLP), where he was employed from 1985 to 1996. During his tenure there, he actively participated in creating, and ultimately led, the firm’s midwestern mutual fund practice.
| Item 4. | Principal Accountant Fees and Services. |
Nuveen Enhanced High Yield Municipal Bond Fund
The following tables show the amount of fees that PricewaterhouseCoopers LLP (“PwC”), the auditor, billed to the Registrant during the Registrant’s last two full fiscal years. The Audit Committee approved in advance all audit services and non-audit services that PwC provided to the Registrant, except for those non-audit services that were subject to the pre-approval exception under Rule 2-01 of Regulation S-X (the “pre-approval exception”). The pre-approval exception for services provided directly to the Registrant waives the pre-approval requirement for services other than audit, review or attest services if: (A) the aggregate amount of all such services provided constitutes no more than 5% of the total amount of revenues paid by the Registrant during the fiscal year in which the services are provided; (B) the Registrant did not recognize the services as non-audit services at the time of the engagement; and (C) the services are promptly brought to the Audit Committee’s attention, and the Committee (or its delegate) approves the services before the audit is completed.
The Audit Committee has delegated certain pre-approval responsibilities to its Chair (or, in the Chair’s absence, any other member of the Audit Committee).
SERVICES THAT THE REGISTRANT’S AUDITOR BILLED TO THE REGISTRANT
| Fiscal Year Ended | Audit Fees Billed to Registrant1 |
Audit-Related Fees Billed to Registrant2 |
Tax Fees Billed to Registrant3 |
All Other Fees Billed to Registrant4 |
||||||||||||
| March 31, 2025 |
$61,078 | $5,000 | $0 | $0 | ||||||||||||
| Percentage approved pursuant to pre-approval exception | 0% | 0% | 0% | 0% | ||||||||||||
| March 31, 2024 |
$60,714 | $10,000 | $2,000 | $0 | ||||||||||||
| Percentage approved pursuant to pre-approval exception | 0% | 0% | 0% | 0% | ||||||||||||
| 1 | “Audit Fees” are the aggregate fees billed for professional services for the audit of the Registrant’s annual financial statements and services provided in connection with statutory and regulatory filings or engagements. |
| 2 | “Audit-Related Fees” are the aggregate fees billed for assurance and related services reasonably related to the performance of the audit or review of financial statements that are not reported under “Audit Fees”. These fees include offerings related to the Registrant’s common shares and leverage. |
| 3 | “Tax Fees” are the aggregate fees billed for professional services for tax advice, tax compliance, and tax planning. These fees include: all global withholding tax services; excise and state tax reviews; capital gain, tax equalization and taxable basis calculations performed by the independent registered public accounting firm. |
| 4 | “All Other Fees” are the aggregate fees billed for products and services other than “Audit Fees”, “Audit-Related Fees” and “Tax Fees”. These fees represent all “Agreed-Upon Procedures” engagements pertaining to the Registrant’s use of leverage. |
SERVICES THAT THE REGISTRANT’S AUDITOR BILLED TO THE
ADVISER AND AFFILIATED REGISTRANT SERVICE PROVIDERS
The following tables show the amount of fees billed by PwC to Nuveen Fund Advisors, LLC (the “Adviser”), and any entity controlling, controlled by or under common control with the Adviser that provides ongoing services to the Registrant (“Affiliated Fund Service Provider”), for engagements directly related to the Registrant’s operations and financial reporting, during the Registrant’s last two full fiscal years.
The tables also show the percentage of fees subject to the pre-approval exception. The pre-approval exception for services provided to the Adviser and any Affiliated Fund Service Provider (other than audit, review or attest services) waives the pre-approval requirement if: (A) the aggregate amount of all such services provided constitutes no more than 5% of the total amount of revenues paid by the Registrant, the Adviser and Affiliated Fund Service Providers during the fiscal year in which the services are provided that would have to be pre-
approved by the Audit Committee; (B) the Registrant did not recognize the services as non-audit services at the time of the engagement; and (C) the services are promptly brought to the Audit Committee’s attention, and the Committee (or its delegate) approves the services before the Registrant’s audit is completed.
| Fiscal Year Ended | Audit-Related Fees Billed to Adviser and Affiliated Fund Service Providers |
Tax Fees Billed to Adviser and Affiliated Fund Service Providers |
All Other Fees Billed to Adviser and Affiliated Fund Service Providers |
|||||||||||
| March 31, 2025 |
$0 | $0 | $0 | |||||||||||
| Percentage approved pursuant to pre-approval exception |
0% | 0% | 0% | |||||||||||
| March 31, 2024 |
$0 | $0 | $0 | |||||||||||
| Percentage approved pursuant to pre-approval exception |
0% | 0% | 0% | |||||||||||
NON-AUDIT SERVICES
The following table shows the amount of fees that PwC billed during the Registrant’s last two full fiscal years for non-audit services. The Audit Committee is required to pre-approve non-audit services that the Registrant’s independent registered public accounting firm provides to the Adviser and any Affiliated Fund Services Provider, if the engagement related directly to the Registrant’s operations and financial reporting (except for those subject to the pre-approval exception described above). The Audit Committee requested and received information from PwC about any non-audit services rendered during the Registrant’s last fiscal year to the Adviser and any Affiliated Fund Service Provider. The Committee considered this information in evaluating PwC’s independence.
| Fiscal Year Ended | Total Non-Audit Fees Billed to Registrant |
Total Non-Audit Fees Billed to Adviser and Affiliated Fund Service Providers (engagements related directly to the operations and financial reporting of the Registrant) |
Total Non-Audit Fees Billed to Adviser and Affiliated Fund Service Providers (all other engagements) |
Total | ||||||||||||
| March 31, 2025 |
$0 | $0 | $0 | $0 | ||||||||||||
| March 31, 2024 |
$2,000 | $0 | $0 | $2,000 | ||||||||||||
“Non-Audit Fees billed to Registrant” for both fiscal year ends represent “Tax Fees” and “All Other Fees” billed to the Registrant in their respective amounts from the previous table.
Less than 50 percent of the hours expended on the independent registered public accounting firm’s engagement to audit the Registrant’s financial statements for the most recent fiscal year were attributed to work performed by persons other than the independent registered public accounting firm’s full-time, permanent employees.
Audit Committee Pre-Approval Policies and Procedures. Generally, the Audit Committee must approve (i) all non-audit services to be performed for the Registrant by the Registrant’s independent registered public accounting firm and (ii) all audit and non-audit services to be performed by the Registrant’s independent registered public accounting firm for the Affiliated Fund Service Providers with respect to the operations and financial reporting of the Registrant. Regarding tax and research projects conducted by the independent registered public accounting firm for the Registrant and Affiliated Fund Service Providers (with respect to operations and financial reports of the Registrant) such engagements will be (i) pre-approved by the Audit Committee if they are expected to be for amounts greater than $10,000; (ii) reported to the Audit Committee Chair for verbal approval prior to engagement if they are expected to be for amounts under $10,000 but greater than $5,000; and (iii) reported to the Audit Committee at the next Audit Committee meeting if they are expected to be for an amount under $5,000.
Item 4(i) and Item 4(j) are not applicable to the Registrant.
| Item 5. | Audit Committee of Listed Registrants. |
The registrant’s Board has a separately designated Audit Committee established in accordance with Section 3(a)(58)(A) of the Securities Exchange Act of 1934, as amended (15 U.S.C. 78c(a)(58)(A)). The members of the audit committee are Joseph A. Boateng, Amy B. R. Lancellotta, John K. Nelson, Chair, Loren M. Starr, Matthew Thornton III, Margaret L. Wolff and Robert L. Young.
| Item 6. | Investments. |
| (a) | Schedule of Investments is included as part of the Portfolio of Investments filed under Item 1 of this Form N-CSR. |
| (b) | Not applicable. |
| Item 7. | Financial Statements and Financial Highlights for Open-End Management Investment Companies. |
Not applicable to closed-end investment companies.
| Item 8. | Changes in and Disagreements with Accountants for Open-End Management Investment Companies. |
Not applicable to closed-end investment companies.
| Item 9. | Proxy Disclosures for Open-End Management Investment Companies. |
Not applicable to closed-end investment companies.
| Item 10. | Remuneration Paid to Directors, Officers, and Others of Open-End Management Investment Companies. |
Not applicable to closed-end investment companies.
| Item 11. | Statement Regarding Basis for Approval of Investment Advisory Contract. |
Not applicable.
| Item 12. | Disclosure of Proxy Voting Policies and Procedures for Closed-End Management Investment Companies. |
| Item 13. | Portfolio Managers of Closed-End Management Investment Companies. |
Nuveen Fund Advisors, LLC is the registrant’s investment adviser (also referred to as the “Adviser”). The Adviser is responsible for the selection and on-going monitoring of the Fund’s investment portfolio, managing the Fund’s business affairs and providing certain clerical, bookkeeping and administrative services. The Adviser has engaged Nuveen Asset Management, LLC (“Nuveen Asset Management” or “Sub-Adviser”) as Sub-Adviser to provide discretionary investment advisory services. The following section provides information on the portfolio managers at the Sub-Adviser:
(a)(1) Portfolio Manager Biographies
As of the date of filing this report, the following individuals at the Sub-Adviser (the “Portfolio Managers”) have primary responsibility for the day-to-day implementation of the registrant’s investment strategies:
Steven M. Hlavin is a Managing Director and portfolio manager at Nuveen. As a member of the High Yield Municipal Portfolio Management Team, he is responsible for supporting all High Yield Municipal strategies and is specifically responsible for managing the Enhanced High Yield Municipal Bond, High Yield Municipal Opportunities LP, Municipal Opportunities and Short Duration High Yield Municipal Bond Strategies. He oversees a number of state-specific, tax-exempt portfolios including the Kansas Municipal Bond, Louisiana Municipal Bond and Wisconsin Municipal Bond Strategies. He is also responsible for the tender option bond/inverse floating rate program used by some of the firm’s closed-end and open-end funds. Steven began his career with Nuveen in 2003, also working as a senior analyst responsible for risk management and performance measurement processes, developing yield curve strategies and portfolio optimization techniques. He received his B.A. in Finance and Accounting and an M.B.A. in Finance from Miami University.
Daniel J. Close, CFA, Managing Director at Nuveen Asset Management, leads the municipal fixed income strategic direction and investment perspectives for Nuveen. He serves as lead portfolio manager for high yield municipal strategies, along with tax-exempt and taxable municipal strategies that include customized institutional portfolios, open-end funds and closed-end funds. Prior to his current role, in 2010, Dan helped establish and expand the platform as Head of Taxable Municipals. Dan helps set direction for custom fixed income solutions and asset allocation across multi-sector portfolios. As a leading expert on taxable municipals, Dan serves as trusted voice on the complexities of the taxable municipal market. After joining Nuveen in 2000, he was a municipal fixed income research analyst covering the corporate-backed, energy, transportation and utility sectors. Dan began working in the investment industry in 1998 as an analyst at Banc of America Securities. He received his BS in Business from Miami University and his MBA from Northwestern University’s J. L. Kellogg School of Management. Mr. Close has earned the Chartered Financial Analyst designation and is a member of the CFA Institute and the CFA Society of Chicago.
Stephen J. Candido, CFA, Managing Director at Nuveen Asset Management, is a portfolio manager for high yield municipal strategies at Nuveen, managing high yield funds and institutional accounts. He also has responsibility for tax-exempt open-end funds and closed-end funds that allocate to both investment grade and high yield municipals. Stephen started working in the investment industry in 1996 when he joined Nuveen in the Unit Trust Division. Prior to his current role, he was a vice president and senior research analyst specializing in high yield sectors including land secured credits, project finance and housing. Stephen was also an assistant vice president for Nuveen’s Global Structured Products team beginning in 2005. He also served as the manager of the Fixed Income Unit Trust Product Management and Pricing Group starting in 2001 and prior to that held positions as an equity research analyst and fixed income pricing analyst. Stephen graduated with a B.S. in Finance from Miami University and an M.B.A. in Finance from the University of Illinois at Chicago. He holds the Chartered Financial Analyst designation and is a member of the CFA Institute and the CFA Society of Chicago.
(a)(2) Other Accounts Managed by Portfolio Managers
Other Accounts Managed. In addition to managing the registrant, the Portfolio Managers are also primarily responsible for the day-to-day portfolio management of the following accounts:
| Portfolio Manager | Type of Account Managed |
Number of Accounts |
Assets* | |||||
| Steven M. Hlavin |
Registered Investment Company | 13 | $18.98 billion | |||||
| Other Pooled Investment Vehicles | 1 | $370.68 million | ||||||
| Other Accounts | 0 | $0 | ||||||
| Daniel J. Close |
Registered Investment Company | 17 | $25.58 billion | |||||
| Other Pooled Investment Vehicles | 2 | $482.27 million | ||||||
| Other Accounts | 49 | $17.68 billion | ||||||
| Stephen J. Candido |
Registered Investment Company | 30 | $54.43 billion | |||||
| Other Pooled Investment Vehicles | 2 | $482.27 million | ||||||
| Other Accounts | 3 | $200.55 million | ||||||
| * | Assets are as of March 31, 2025. None of the assets in these accounts are subject to an advisory fee based on performance. |
Potential Material Conflicts of Interest
Actual or apparent conflicts of interest may arise when a portfolio manager has day-to-day management responsibilities with respect to more than one account. More specifically, portfolio managers who manage multiple accounts are presented a number of potential conflicts, including, among others, those discussed below.
The management of multiple accounts may result in a portfolio manager devoting unequal time and attention to the management of each account. Nuveen Asset Management seeks to manage such competing interests for the time and attention of portfolio managers by having portfolio managers focus on a particular investment discipline. Most accounts managed by a portfolio manager in a particular investment strategy are managed using the same investment models.
If a portfolio manager identifies a limited investment opportunity which may be suitable for more than one account, an account may not be able to take full advantage of that opportunity due to an allocation of filled purchase or sale orders across all eligible accounts. To deal with these situations, Nuveen Asset Management has adopted procedures for allocating limited opportunities across multiple accounts.
With respect to many of its clients’ accounts, Nuveen Asset Management determines which broker to use to execute transaction orders, consistent with its duty to seek best execution of the transaction. However, with respect to certain other accounts, Nuveen Asset Management may be limited by the client with respect to the selection of brokers or may be instructed to direct trades through a particular broker. In these cases, Nuveen Asset Management may place separate, non-simultaneous, transactions for a Fund and other accounts which may temporarily affect the market price of the security or the execution of the transaction, or both, to the detriment of the Fund or the other accounts.
Some clients are subject to different regulations. As a consequence of this difference in regulatory requirements, some clients may not be permitted to engage in all the investment techniques or transactions or to engage in these transactions to the same extent as the other accounts managed by a portfolio manager. Finally, the appearance of a conflict of interest may arise where Nuveen Asset Management has an incentive, such as a performance-based management fee, which relates to the management of some accounts, with respect to which a portfolio manager has day-to-day management responsibilities.
Conflicts of interest may also arise when the Sub-Adviser invests one or more of its client accounts in different or multiple parts of the same issuer’s capital structure, including investments in public versus private securities, debt versus equity, or senior versus junior/subordinated debt, or otherwise where there are different or inconsistent rights or benefits. Decisions or actions such as investing, trading, proxy voting, exercising, waiving or amending rights or covenants, workout activity, or serving on a board, committee or other involvement in governance may result in conflicts of interest between clients holding different securities or investments. Generally, individual portfolio managers will seek to act in a manner that they believe serves the best interest of the accounts they manage. In cases where a portfolio manager or team faces a conflict among its client accounts, it will seek to act
in a manner that it believes best reflects its overall fiduciary duty, which may result in relative advantages or disadvantages for particular accounts.
Nuveen Asset Management has adopted certain compliance procedures which are designed to address these types of conflicts common among investment managers. However, there is no guarantee that such procedures will detect each and every situation in which a conflict arises.
Nuveen Asset Management or its affiliates, including TIAA, sponsor an array of financial products for retirement and other investment goals, and provide services worldwide to a diverse customer base. Accordingly, from time to time, a Fund may be restricted from purchasing or selling securities, or from engaging in other investment activities because of regulatory, legal or contractual restrictions that arise due to another client account’s investments and/or the internal policies of Nuveen Asset Management, TIAA or its affiliates designed to comply with such restrictions. As a result, there may be periods, for example, when Nuveen Asset Management will not initiate or recommend certain types of transactions in certain securities or instruments with respect to which investment limits have been reached.
The investment activities of Nuveen Asset Management or its affiliates may also limit the investment strategies and rights of the Funds. For example, in certain circumstances where the Funds invest in securities issued by companies that operate in certain regulated industries, in certain emerging or international markets, or are subject to corporate or regulatory ownership definitions, or invest in certain futures and derivative transactions, there may be limits on the aggregate amount invested by Nuveen Asset Management or its affiliates for the Funds and other client accounts that may not be exceeded without the grant of a license or other regulatory or corporate consent. If certain aggregate ownership thresholds are reached or certain transactions undertaken, the ability of Nuveen Asset Management, on behalf of the Funds or other client accounts, to purchase or dispose of investments or exercise rights or undertake business transactions may be restricted by regulation or otherwise impaired. As a result, Nuveen Asset Management, on behalf of the Funds or other client accounts, may limit purchases, sell existing investments, or otherwise restrict or limit the exercise of rights (including voting rights) when Nuveen Asset Management, in its sole discretion, deems it appropriate in light of potential regulatory or other restrictions on ownership or other consequences resulting from reaching investment thresholds.
(a)(3) Fund Manager Compensation
As of the most recently completed fiscal year end, the primary Portfolio Managers’ compensation is as follows:
Portfolio manager compensation consists primarily of base salary and variable components consisting of (i) a cash bonus; (ii) a long-term performance award; and (iii) participation in a profits interest plan.
Base salary. A portfolio manager’s base salary is determined based upon an analysis of the portfolio manager’s general performance, experience and market levels of base pay for such position.
Cash bonus. A portfolio manager is eligible to receive an annual cash bonus that is based on three variables: risk-adjusted investment performance relative to benchmark generally measured over the most recent one, three and five year periods (unless the portfolio manager’s tenure is shorter), ranking versus Morningstar peer funds generally measured over the most recent one, three and five year periods (unless the portfolio manager’s tenure is shorter), and management and peer reviews.
Long-term performance award. A portfolio manager is eligible to receive a long-term performance award that vests after three years. The amount of the award when granted is based on the same factors used in determining the cash bonus. The value of the award at the completion of the three-year vesting period is adjusted based on the risk-adjusted investment performance of Fund(s) managed by the portfolio manager during the vesting period and the performance of the TIAA organization as a whole.
Profits interest plan. Portfolio managers are eligible to receive profits interests in Nuveen Asset Management and its affiliate, Teachers Advisors, LLC, which vest over time and entitle their holders to a percentage of the firms’ annual profits. Profits interests are allocated to each portfolio manager based on such person’s overall contribution to the firms.
There are generally no differences between the methods used to determine compensation with respect to the Fund and the Other Accounts shown in the table above.
(a)(4) Beneficial Ownership of HYIF Securities
As of March 31, 2025, the portfolio managers beneficially owned the following dollar range of equity securities issued by the Fund.
| Name of Portfolio Manager | None | $1- $10,000 |
$10,001- $50,000 |
$50,001- $100,000 |
$100,001- $500,000 |
$500,001- $1,000,000 |
Over $1,000,000 | |||||||
|
Steven M. Hlavin |
X | |||||||||||||
|
Daniel J. Close |
X | |||||||||||||
|
Stephen J. Candido |
X | |||||||||||||
| Item 14. | Purchases of Equity Securities by Closed-End Management Investment Company and Affiliated Purchasers. |
Not applicable.
| Item 15. | Submission of Matters to a Vote of Security Holders. |
There have been no material changes to the procedures by which shareholders may recommend nominees to the registrant’s Board implemented after the registrant last provided disclosure in response to this Item.
| Item 16. | Controls and Procedures. |
| (a) | The registrant’s principal executive and principal financial officers, or persons performing similar functions, have concluded that the registrant’s disclosure controls and procedures (as defined in Rule 30a-3(c) under the Investment Company Act of 1940, as amended (the “1940 Act”) (17 CFR 270.30a-3(c))) are effective, as of a date within 90 days of the filing date of this report that includes the disclosure required by this paragraph, based on their evaluation of the controls and procedures required by Rule 30a-3(b) under the 1940 Act (17 CFR 270.30a-3(b)) and Rules 13a-15(b) or 15d-15(b) under the Securities Exchange Act of 1934, as amended (the “Exchange Act”) (17 CFR 240.13a-15(b) or 240.15d-15(b)). |
| (b) | There were no changes in the registrant’s internal control over financial reporting (as defined in Rule 30a-3(d) under the 1940 Act (17 CFR 270.30a-3(d)) that occurred during the period covered by this report that has materially affected, or is reasonably likely to materially affect, the registrant’s internal control over financial reporting. |
| Item 17. | Disclosure of Securities Lending Activities for Closed-End Management Investment Companies. |
Not applicable.
| Item 18. | Recovery of Erroneously Awarded Compensation. |
| (a) | Not applicable. |
| (b) | Not applicable. |
| Item 19. | Exhibits. |
| (a)(1) | Not applicable because the code of ethics is available, upon request and without charge, by calling 800-257-8787 and there were no amendments during the period covered by this report. | |
| (a)(2) | Not applicable. | |
| (a)(3) | ||
| (a)(4) | Not applicable. | |
| (a)(5) | Not applicable. | |
| (b) | ||
SIGNATURES
Pursuant to the requirements of the Securities Exchange Act of 1934 and the Investment Company Act of 1940, the registrant has duly caused this report to be signed on its behalf by the undersigned, thereunto duly authorized.
Nuveen Enhanced High Yield Municipal Bond Fund
| Date: June 5, 2025 | By: /s/ David J. Lamb | |||
| David J. Lamb | ||||
| Chief Administrative Officer |
Pursuant to the requirements of the Securities Exchange Act of 1934 and the Investment Company Act of 1940, this report has been signed below by the following persons on behalf of the registrant and in the capacities and on the dates indicated.
| Date: June 5, 2025 | By: /s/ David J. Lamb | |||
| David J. Lamb | ||||
| Chief Administrative Officer (principal executive officer) | ||||
| Date: June 5, 2025 | By: /s/ Marc Cardella | |||
| Marc Cardella | ||||
| Vice President and Controller (principal financial officer) | ||||