 |
TABLE OF CONTENTS
| 1.0 | EXECUTIVE SUMMARY (ITEM 1) | 1 | |
| 1.1 | Property Description and Ownership | 1 | |
| 1.2 | Exploration and Mining History | 2 | |
| 1.3 | Geology and Mineralization | 2 | |
| 1.4 | Metallurgical Testing and Mineral Processing | 3 | |
| 1.5 | Mineral Resource Estimate | 4 | |
| 1.6 | Mineral Reserve Estimates and Mining Methods | 7 | |
| 1.7 | Processing | 8 | |
| 1.8 | Project Infrastructure | 9 | |
| 1.9 | Environmental and Social Impact | 10 | |
| 1.10 | Capital and Operating Costs | 10 | |
| 1.11 | Conclusions, Interpretations, and Recommendations | 11 | |
| 2.0 | INTRODUCTION AND TERMS OF REFERENCE (ITEM 2) | 12 | |
| 2.1 | Project Scope and Terms of Reference | 13 | |
| 2.2 | Qualified Persons and Site Visits | 15 | |
| 2.3 | Frequently Used Acronyms, Abbreviations, Definitions, and Units of Measure | 17 | |
| 3.0 | RELIANCE ON OTHER EXPERTS (ITEM 3) | 20 | |
| 4.0 | PROPERTY DESCRIPTION AND LOCATION (ITEM 4) | 21 | |
| 4.1 | Location and Land Area | 21 | |
| 4.2 | Mineral Title | 24 | |
| 4.3 | Agreements and Encumbrances | 28 | |
| 4.4 | Environmental Liabilities | 30 | |
| 4.5 | Environmental Permitting | 31 | |
| 5.0 | ACCESSIBILITY, CLIMATE, LOCAL RESOURCES, INFRASTRUCTURE, AND PHYSIOGRAPHY (ITEM 5) | 33 | |
| 5.1 | Access to Property | 33 | |
| 5.2 | Climate | 33 | |
| 5.3 | Physiography | 34 | |
| 5.4 | Local Resources and Infrastructure | 34 | |
|
| 6.0 | HISTORY (ITEM 6) | 35 | ||
| 6.1 | Modern-Era Exploration History | 38 | ||
| 6.1.1 | 1996-1997 Western Mining Corporation | 38 | ||
| 6.1.2 | 1997-2006 Resources and Mining S.A. | 38 | ||
| 6.1.3 | 2003 Pila Gold Ltd | 38 | ||
| 6.1.4 | 2006-2009 Condor Gold Plc. | 38 | ||
| 6.1.5 | 2009-2018 Golden Reign Resources, Ltd. | 39 | ||
| 6.2 | Historical Mineral Resource Estimates | 39 | ||
| 6.2.1 | 1948 Peale Historical Estimate, San Albino and Arras | 39 | ||
| 6.2.2 | 2008 Arras Mine Historical Resource Estimate | 40 | ||
| 6.2.3 | San Albino 2013 Historical Resource Estimate, P & E Consultants, Inc. | 40 | ||
| 6.2.4 | 2015 San Albino Historical Resource Estimate, P & E Consultants, Inc. | 41 | ||
| 6.3 | Historical Production | 43 | ||
| 6.4 | Production by Mako, 2021 to 2023 | 43 | ||
| 7.0 | GEOLOGIC SETTING AND MINERALIZATION (ITEM 7) | 44 | ||
| 7.1 | Regional Geologic Setting | 44 | ||
| 7.2 | Property and Project Area Geology | 46 | ||
| 7.3 | Mineralization | 48 | ||
| 7.3.1 | San Albino Deposit | 49 | ||
| 7.3.2 | Las Conchitas Deposit | 54 | ||
| 8.0 | DEPOSIT TYPES (ITEM 8) | 57 | ||
| 9.0 | EXPLORATION (ITEM 9) | 60 | ||
| 9.1 | San Albino-Murra Concession | 60 | ||
| 9.1.1 | San Albino-Murra Concession Mapping and Surface Sampling | 60 | ||
| 9.1.2 | San Albino-Murra Concession Underground Sampling | 62 | ||
| 9.1.3 | San Albino-Murra Concession, San Albino and Las Conchitas Area Drilling | 62 | ||
| 9.2 | El Jicaro Concession | 63 | ||
| 9.3 | Potrerillos Concession | 63 | ||
| 9.4 | La Segoviana Concession | 63 | ||
| 10.0 | DRILLING (ITEM 10) | 64 | ||
| 10.1 | Summary | 64 | ||
| 10.2 | Historical Drilling | 65 | ||
| 10.2.1 | Historical Drilling by Western Mining Corporation | 65 | ||
| 10.2.2 | Historical Drilling by Resources and Mining S.A. | 66 | ||
| 10.2.3 | Historical Drilling by Condor Gold Plc. | 66 | ||
|
| 10.3 | Mako Mining Corp. Drilling - San Albino and Las Conchitas Deposit Areas | 66 | ||||
| 10.3.1 | San Albino | 66 | ||||
| 10.3.1.1 | San Albino Norte | 69 | ||||
| 10.3.2 | Las Conchitas Area | 70 | ||||
| 10.4 | Mako Mining Corp. Drilling - El Jicaro Concession | 72 | ||||
| 10.5 | Mako Mining Corp. Drilling - Potrerillos Concession | 73 | ||||
| 10.6 | Mako Mining Corp. Drilling - La Segoviana Concession | 73 | ||||
| 10.7 | Drillhole Collar Surveys | 75 | ||||
| 10.8 | Downhole Surveys | 76 | ||||
| 10.8.1 | Magnetic Declination | 76 | ||||
| 10.9 | Summary Statement | 76 | ||||
| 11.0 | SAMPLE PREPARATION, ANALYSIS, AND SECURITY (ITEM 11) | 77 | ||||
| 11.1 | Sample Preparation | 77 | ||||
| 11.1.1 | Channel Samples of Exploration Pits and Trenches | 77 | ||||
| 11.1.2 | Reverse Circulation Drilling Samples | 78 | ||||
| 11.1.3 | Core Drilling Samples | 78 | ||||
| 11.1.4 | Sample Security | 79 | ||||
| 11.2 | Sample Analysis | 79 | ||||
| 11.3 | Quality Assurance/Quality Control | 81 | ||||
| 11.3.1 | Historical Operators' Quality Assurance/Quality Control | 81 | ||||
| 11.3.2 | Authorship of QA/QC Evaluations | 82 | ||||
| 11.3.3 | QA/QC Materials and Methods of Evaluation | 82 | ||||
| 11.3.3.1 | Standards | 82 | ||||
| 11.3.3.2 | Duplicates | 82 | ||||
| 11.3.4 | San Albino QA/QC 2010 - 2020 | 83 | ||||
| 11.3.4.1 | San Albino Project Channel Samples | 83 | ||||
| 11.3.4.1.1 | Blanks Inserted with Channel Samples | 83 | ||||
| 11.3.4.1.2 | Channel Sample Standards | 84 | ||||
| 11.3.4.1.3 | Channel Sample Duplicates | 85 | ||||
| 11.3.4.2 | San Albino Project Blanks in Drill Samples | 86 | ||||
| 11.3.4.3 | San Albino Project Standards in Drill Samples | 89 | ||||
| 11.3.4.4 | San Albino Project Duplicates in Drill Samples | 91 | ||||
| 11.3.4.4.1 | Drill Samples - Core Duplicates | 91 | ||||
| 11.3.4.4.2 | Drill Samples - Coarse Reject Duplicates | 92 | ||||
| 11.3.4.4.3 | Reverse-Circulation Drilling Field Duplicates | 92 | ||||
| 11.3.4.5 | Metallic-Screen Fire Assays | 95 | ||||
|
| 11.3.5 | San Albino QA/QC 2021-2022 | 97 | ||||
| 11.3.5.1 | Drill Sample Blanks SW San Albino Deposit 2021-2022 Period | 97 | ||||
| 11.3.5.2 | Drill Sample Standards SW San Albino Deposit 2021-2022 Period | 98 | ||||
| 11.3.5.3 | Duplicate Drilling Samples SW San Albino Deposit 2021-2022 Period | 100 | ||||
| 11.3.6 | Las Conchitas Project Trench or Channel Samples | 109 | ||||
| 11.3.6.1 | Standards in Channel Samples | 109 | ||||
| 11.3.6.2 | Duplicates in Channel Samples | 115 | ||||
| 11.3.6.3 | Blanks in Channel Samples | 116 | ||||
| 11.3.6.4 | Concluding Comment on QA/QC Data for Channel Samples | 119 | ||||
| 11.3.7 | Las Conchitas Project Drill Samples | 119 | ||||
| 11.3.7.1 | Standards in Drillhole Samples | 120 | ||||
| 11.3.7.2 | Duplicates in Drillhole Samples | 126 | ||||
| 11.3.7.3 | Blanks in Drillhole Samples | 128 | ||||
| 11.4 | Density Data | 130 | ||||
| 11.5 | Summary Statement | 131 | ||||
| 12.0 | DATA VERIFICATION (ITEM 12) | 132 | ||||
| 12.1 | Site Visits | 132 | ||||
| 12.2 | Database Verification | 133 | ||||
| 12.2.1 | Verification of the San Albino Database | 133 | ||||
| 12.2.1.1 | The 2020 Database Audit | 133 | ||||
| 12.2.1.2 | The 2022 and 2023 Database Audits | 134 | ||||
| 12.2.1.2.1 | San Albino Assay Table | 135 | ||||
| 12.2.1.2.2 | San Albino Collar Table | 135 | ||||
| 12.2.1.2.3 | San Albino Downhole Survey Table | 136 | ||||
| 12.2.1.2.4 | Summary Statement Regarding the Audited San Albino Database | 137 | ||||
| 12.2.2 | Verification of the Las Conchitas Database | 137 | ||||
| 12.2.2.1 | Las Conchitas Assay Table | 137 | ||||
| 12.2.2.2 | Las Conchitas Collar Table | 138 | ||||
| 12.2.2.3 | Las Conchitas Downhole Survey Table | 139 | ||||
| 12.2.2.4 | Summary Statement Regarding the Audited Las Conchitas Database | 139 | ||||
| 12.3 | Independent Verification Sampling | 139 | ||||
| 12.4 | Independent Verification of Drillhole Collars | 140 | ||||
| 12.5 | Specific Gravity Data | 141 | ||||
| 12.6 | Summary Statement on Data Verification | 141 | ||||
|
| 13.0 | MINERAL PROCESSING AND METALLURGICAL TESTING (ITEM 13) | 142 | |||
| 13.1 | Testing Prior to 2022 | 142 | |||
| 13.1.1 | Summary | 142 | |||
| 13.1.2 | Sample Selection for 2019-2020 Test Work | 144 | |||
| 13.1.3 | Head Sample Characterization | 144 | |||
| 13.1.4 | Carbon Content | 145 | |||
| 13.1.5 | Mineralogical Studies | 146 | |||
| 13.1.6 | Comminution Studies | 146 | |||
| 13.1.7 | Gravity Recovery | 146 | |||
| 13.1.8 | Metallurgical Response Tests | 146 | |||
| 13.1.9 | Cyanide Consumption | 147 | |||
| 13.1.10 | Optimized Leach Tests | 147 | |||
| 13.1.11 | Factors Affecting Recovery | 147 | |||
| 13.1.12 | Detoxification of the Leach Circuit Tailings | 147 | |||
| 13.1.13 | Metallurgical Analysis of Historical Dump Material | 147 | |||
| 13.2 | 2022 Testing | 148 | |||
| 13.2.1 | Summary | 148 | |||
| 13.2.2 | Testing Procedures | 148 | |||
| 13.2.3 | Samples Tested and Test Results | 149 | |||
| 13.2.4 | Conclusions | 151 | |||
| 14.0 | MINERAL RESOURCE ESTIMATES (ITEM 14) | 152 | |||
| 14.1 | Introduction | 152 | |||
| 14.2 | San Albino | 155 | |||
| 14.2.1 | Database | 155 | |||
| 14.2.2 | Mineral Domains | 156 | |||
| 14.2.3 | Density | 165 | |||
| 14.2.4 | Core Recovery and Reverse Circulation Downhole Contamination | 166 | |||
| 14.2.5 | Other 3D Models | 167 | |||
| 14.2.5.1 | Overburden, Oxide and Fresh Rock | 167 | |||
| 14.2.5.2 | Mine Dumps | 168 | |||
| 14.2.5.3 | Historical Underground Workings | 169 | |||
| 14.2.6 | Assay Capping and Sample Composites | 170 | |||
| 14.2.7 | Gold and Silver Grade Estimation | 174 | |||
| 14.2.8 | Mineral Resources | 177 | |||
| 14.2.9 | Discussion of Resources | 183 | |||
|
| 14.3 | Las Conchitas | 186 | |||
| 14.3.1 | Database | 186 | |||
| 14.3.2 | Geology and Mineral Domains | 187 | |||
| 14.3.3 | Density | 193 | |||
| 14.3.4 | Core Recovery | 194 | |||
| 14.3.5 | Other 3D Models | 195 | |||
| 14.3.5.1 | Overburden, Oxide and Fresh Rock | 195 | |||
| 14.3.5.2 | Mine Dumps and Historical Underground Workings | 195 | |||
| 14.3.6 | Assay Capping and Sample Composites | 195 | |||
| 14.3.7 | Gold and Silver Grade Estimation | 198 | |||
| 14.3.8 | Mineral Resources | 201 | |||
| 14.3.9 | Discussion of Resources | 206 | |||
| 15.0 | MINERAL RESERVE ESTIMATES | 209 | |||
| 16.0 | MINING METHODS | 210 | |||
| 16.1 | Economic Parameters | 210 | |||
| 16.2 | Cutoff Grades | 211 | |||
| 16.3 | Geometric Parameters | 211 | |||
| 16.4 | Pit Designs | 212 | |||
| 16.4.1 | In-Pit Resources | 214 | |||
| 16.4.2 | Actual Mine Production | 214 | |||
| 17.0 | RECOVERY METHODS | 216 | |||
| 17.1 | Summary | 216 | |||
| 17.1.1 | Crushing | 216 | |||
| 17.1.2 | Grinding | 216 | |||
| 17.1.3 | Gravity and ICU | 218 | |||
| 17.1.4 | Thickening and CIL Leach | 218 | |||
| 17.1.5 | Carbon Desorption and Regeneration | 218 | |||
| 17.1.6 | Cyanide Detoxification | 219 | |||
| 17.1.7 | Slurry Filtration and Tails Deposition | 220 | |||
| 17.1.8 | Refinery | 220 | |||
| 17.2 | Production | 221 | |||
| 17.3 | Consumption of Water, Energy and Other Consumables | 222 | |||
| 17.3.1 | Fresh Water Consumption | 222 | |||
| 17.3.2 | Electrical Power Consumption | 222 | |||
| 17.3.3 | Consumption of Reagents and Other Consumables | 222 | |||
|
| 18.0 | PROJECT INFRASTRUCTURE | 224 | |||
| 18.1 | Overview | 224 | |||
| 18.2 | Site Access | 224 | |||
| 18.3 | Primary Infrastructure | 227 | |||
| 18.3.1 | Power Generation | 227 | |||
| 18.3.2 | Assay Lab | 227 | |||
| 18.3.3 | Communication | 227 | |||
| 18.3.4 | Diesel Storage | 227 | |||
| 18.3.5 | Weather Station | 227 | |||
| 18.3.6 | Clinic | 227 | |||
| 18.3.7 | Storage of Blasting Supplies | 228 | |||
| 18.3.8 | Mine Waste Dumps | 228 | |||
| 18.3.9 | Ore Stockpiles | 228 | |||
| 18.4 | Tailings Storage Facility | 228 | |||
| 18.5 | Water Management | 229 | |||
| 19.0 | MARKET STUDIES AND CONTRACTS | 230 | |||
| 19.1 | Markets | 230 | |||
| 19.2 | Contracts | 230 | |||
| 20.0 | ENVIRONMENTAL STUDIES, PERMITTING AND SOCIAL OR COMMUNITY IMPACT | 232 | |||
| 20.1 | Environmental Studies and Known Environmental Issues | 232 | |||
| 20.1.1 | Climate | 232 | |||
| 20.1.1.1 | Precipitation | 232 | |||
| 20.1.1.2 | Temperature | 232 | |||
| 20.1.1.3 | Evapotranspiration | 233 | |||
| 20.1.2 | Soils | 233 | |||
| 20.1.3 | Hydrology | 233 | |||
| 20.1.4 | Physiography | 234 | |||
| 20.1.5 | Seismicity | 234 | |||
| 20.1.6 | Vegetation | 234 | |||
| 20.1.6.1 | Ecosystem Classification | 234 | |||
| 20.1.6.2 | Conservation Status, Protected and Threatened Flora | 235 | |||
| 20.1.7 | Fauna | 235 | |||
| 20.1.7.1 | Reptiles and Amphibians | 235 | |||
| 20.1.7.2 | Mammals | 236 | |||
| 20.1.7.3 | Birds | 236 | |||
| 20.1.7.4 | Conservation Status, Protected and Threatened Fauna | 236 | |||
|
| 20.1.8 | Summary Statement on Environmental Issues that Could Materially Impact Development of Mineral Resources | 237 | |||
| 20.2 | Waste and Tailings Disposal, Site Monitoring, Water Management, Environmental Management Plans | 237 | |||
| 20.2.1 | Tailings Storage Facility | 237 | |||
| 20.2.2 | Waste Rock Piles | 238 | |||
| 20.2.3 | Surface Water Management | 238 | |||
| 20.2.4 | Ground Water Management | 238 | |||
| 20.2.4.1 | Process Plant | 238 | |||
| 20.2.4.2 | Tailings Storage Facility | 239 | |||
| 20.2.4.3 | Pits and Waste Rock Piles | 239 | |||
| 20.2.5 | Air Quality Management | 239 | |||
| 20.2.5.1 | Measures to Counteract Noise | 240 | |||
| 20.2.5.2 | Measures to Counteract Particulate Matter and Gases | 240 | |||
| 20.2.6 | Cyanide Management Plan | 241 | |||
| 20.2.7 | Solid Waste Management | 242 | |||
| 20.2.7.1 | Hazardous Wastes | 242 | |||
| 20.2.7.2 | Non Hazardous Waste | 243 | |||
| 20.2.8 | Site Monitoring | 243 | |||
| 20.3 | Permitting | 244 | |||
| 20.4 | Social and Community Impact | 246 | |||
| 20.4.1 | Background | 246 | |||
| 20.4.2 | Population and Demographics | 246 | |||
| 20.4.3 | Infrastructure and Public Services | 246 | |||
| 20.4.3.1 | Education | 246 | |||
| 20.4.3.2 | Health | 246 | |||
| 20.4.3.3 | Electrical Power | 246 | |||
| 20.4.3.4 | Telecommunications | 246 | |||
| 20.4.3.5 | Sanitary Drinking Water | 247 | |||
| 20.4.3.6 | Roads | 247 | |||
| 20.4.4 | Community and Government | 247 | |||
| 20.4.5 | Economic Activity, Income, Marginalization | 248 | |||
| 20.4.5.1 | Economic Activity | 248 | |||
| 20.4.5.2 | Income and Marginalization | 249 | |||
| 20.4.6 | Social Management System, Mitigation of Negative Impacts, Community Agreements | 249 | |||
|
| 20.4.6.1 | Social Management | 249 | |||
| 20.4.6.2 | General Guidelines of the Community Relations Plan | 250 | |||
| 20.4.6.3 | Guidelines for Compensation for Land Use | 250 | |||
| 20.4.6.4 | Community Agreements | 251 | |||
| 20.4.6.5 | Community Benefits | 251 | |||
| 20.4.7 | Summary Statement on Social and Community Issues that Could Materially Impact Development of Mineral Resources | 252 | |||
| 20.5 | Mine Closure | 253 | |||
| 20.5.1 | Closure Plan for the Mineral Processing Plant | 253 | |||
| 20.5.2 | Closure Plan for Mine Waste and Tailings, Site Monitoring and Water Management | 253 | |||
| 20.5.2.1 | Mine Closure - Obligations of the Project Management | 253 | |||
| 20.5.2.2 | Considerations for Project Closure | 254 | |||
| 20.5.2.3 | Actions within the Closure Plan | 254 | |||
| 20.5.2.4 | Area Revegetation (If applicable) | 254 | |||
| 20.5.2.5 | Implementation and Monitoring of the Closure Plan | 255 | |||
| 20.5.2.6 | Closure Assessment | 255 | |||
| 20.5.2.7 | Tailings Storage Facility Closure Plan | 255 | |||
| 20.5.2.8 | Guidelines | 256 | |||
| 20.5.2.9 | Obligations | 256 | |||
| 20.5.2.10 | Closure and Abandonment Plan Procedure | 256 | |||
| 20.5.2.11 | Budget and Estimated Costs | 256 | |||
| 20.5.2.12 | Activities to be Developed | 257 | |||
| 20.5.2.13 | Periodic Reports | 257 | |||
| 20.5.2.14 | Closure Execution Schedule | 258 | |||
| 21.0 | CAPITAL AND OPERATING COSTS | 259 | |||
| 21.1 | Capital Costs | 259 | |||
| 21.2 | Operating Costs | 259 | |||
| 21.2.1 | Mine Operating Costs | 259 | |||
| 21.2.2 | Process Operating Costs | 260 | |||
| 21.2.3 | G&A Operating Costs | 260 | |||
| 22.0 | ECONOMIC ANALYSIS | 262 | |||
| 23.0 | ADJACENT PROPERTIES (ITEM 23) | 263 | |||
| 24.0 | OTHER RELEVANT DATA AND INFORMATION (ITEM 24) | 264 | |||
| 25.0 | INTERPRETATION AND CONCLUSIONS (ITEM 25) | 265 | |||
|
| 26.0 | RECOMMENDATIONS (ITEM 26) | 267 | ||
| 26.1 | San Albino | 267 | ||
| 26.1.1 | San Albino Area Pre-Development Drilling | 267 | ||
| 26.1.2 | San Albino Area Exploration Drilling | 268 | ||
| 26.2 | Las Conchitas Area | 268 | ||
| 26.2.1 | Las Conchitas Area Pre-Development Drilling | 268 | ||
| 26.2.2 | Las Conchitas Area Exploration Drilling | 268 | ||
| 26.3 | Other Areas | 268 | ||
| 26.4 | Phase II | 269 | ||
| 27.0 | REFERENCES (ITEM 27) | 270 | ||
| 28.0 | DATE AND SIGNATURE PAGE | 272 | ||
| 29.0 | CERTIFICATE OF QUALIFIED PERSONS | 273 | ||
|
LIST OF TABLES
| Table 1-1 | All Veins in San Albino Deposit: Open Pit, Underground, and Dump Resources | 6 |
| Table 1-2 | All Veins in Las Conchitas Deposit: Open Pit, Underground, and Dump Resources | 6 |
| Table 1-3 | All Veins in San Albino Project: Open Pit, Underground, and Dump Resources | 7 |
| Table 1-4 | Economic Parameters for Pit Optimizations | 8 |
| Table 1-5 | Operating Cost Summary | 10 |
| Table 1-6 | Budget for Recommended Work Program | 11 |
| Table 2-1 | Other Changes Incorporated in this Amended Report | 13 |
| Table 2-2 | Qualified Persons and Report Responsibilities | 16 |
| Table 4-1 | Details of San Albino Project Concessions | 25 |
| Table 4-2 | Annual Concession Fees | 26 |
| Table 4-3 | Summary of Annual Property Tenure Costs | 26 |
| Table 5-1 | Climate Data for El Jicaro, Nicaragua | 34 |
| Table 6-1 | Historical Exploration and Mining of the San Albino project | 37 |
| Table 6-2 | Historical 1948 Resource Estimate, San Albino and Aguja de Arras Mines | 39 |
| Table 6-3 | Geosure 2008 Historical Resource of the Arras Mine | 40 |
| Table 6-4 | P & E 2013 San Albino Historical Resource Estimate | 41 |
| Table 6-5 | P & E 2015 San Albino Historical Resource Estimate | 42 |
| Table 6-6 | Historical Gold Production, San Albino Underground Mine | 43 |
| Table 9-1 | Channel Sampling at the San Albino and Las Conchitas Deposits | 62 |
| Table 10-1 | Summary of San Albino, Las Conchitas and Related Area Drilling | 65 |
| Table 10-2 | Exploration Drilling at San Albino by Year | 67 |
| Table 10-3 | Exploration Drilling at Las Conchitas by Year | 70 |
| Table 10-4 | Summary of All Drilling at San Albino and Las Conchitas | 72 |
| Table 10-5 | Significant Assay Results La Segoviana Drillholes | 75 |
| Table 11-1 | Authors of QA/QC Evaluations | 82 |
| Table 11-2 | Channel Sample Standards | 85 |
| Table 11-3 | Channel Sample Duplicates | 86 |
| Table 11-4 | Gold CRMs, San Albino project Drill Samples | 90 |
| Table 11-5 | Silver CRMs, San Albino project Drill Samples | 90 |
| Table 11-6 | Duplicates for San Albino project Drill Samples | 91 |
| Table 11-7 | Number of Gold Metallic-Screen Analyses | 95 |
| Table 11-8 | SW San Albino CRMs for Au BV Labs: 2021 and 2022 | 99 |
| Table 11-9 | SW San Albino CRMs for Ag BV Labs: 2021 and 2022 | 100 |
|
| Table 11-10 | Counts of QA/QC Samples in Trench Channel Samples | 109 |
| Table 11-11 | QA/QC Sample Ratios in Trench Channel Samples | 109 |
| Table 11-12 | Summary of Gold Results for Analyses of Standards with Channel (Trench) Samples | 113 |
| Table 11-13 | Summary of Silver Results for Analyses of Standards with Trench Samples | 114 |
| Table 11-14 | Summary of Results for Field Duplicates in Trench Channel Samples | 116 |
| Table 11-15 | Counts of QA/QC Samples in Drill Samples | 119 |
| Table 11-16 | QA/QC Sample Ratios in Drill Samples | 119 |
| Table 11-17 | Summary of Gold Results for Analyses of Standards with Drillhole Samples | 124 |
| Table 11-18 | Summary of Silver Results for Analyses of Standards with Drillhole Samples | 125 |
| Table 11-19 | Summary of Results for Duplicates from Drill Core Samples | 127 |
| Table 12-1 | Summary of San Albino Assay Table Checks | 135 |
| Table 12-2 | Summary of San Albino Collar Location Checks | 136 |
| Table 12-3 | Summary of San Albino Downhole Survey Checks | 137 |
| Table 12-4 | Summary of Las Conchitas Assay Table Checks | 138 |
| Table 12-5 | Summary of Las Conchitas Collar Location Checks | 138 |
| Table 12-6 | Summary of Las Conchitas Downhole Survey Checks | 139 |
| Table 12-7 | Field Checks of Las Conchitas Collar Locations | 140 |
| Table 13-1 | Composite Gold Head Grade Analysis | 145 |
| Table 13-2 | Other Head Grade Analyses | 145 |
| Table 13-3 | Effect of Standard Leaching versus CIL, San Albino Deposit Composites | 146 |
| Table 13-4 | Summary of 2020 Results for Historic Dump Material Overall Recovery | 148 |
| Table 13-5 | Test Results from Las Conchitas composites | 149 |
| Table 13-6 | Test Results from San Albino Mill Feed | 150 |
| Table 14-1 | Descriptive Statistics of the Resource Database | 156 |
| Table 14-2 | Modeled Geological and Mineral Domains, San Albino Deposit | 157 |
| Table 14-3 | Descriptive Statistics of Samples by Vein and Domain | 161 |
| Table 14-4 | Descriptive Statistics of Density Data by Vein and Domain | 165 |
| Table 14-5 | Assigned Density Values | 166 |
| Table 14-6 | Core Recovery | 167 |
| Table 14-7 | Capping Grades and Number of Samples by Vein and Domain | 171 |
| Table 14-8 | Descriptive Statistics of Composites by Vein and Domain | 172 |
| Table 14-9 | Estimation Areas - Search Ellipse Orientations | 174 |
| Table 14-10 | Estimation Parameters for Gold in San Albino Vein, Halo and Outside Domains | 175 |
| Table 14-11 | Estimation Parameters for Silver in San Albino Vein, Halo and Outside Domains | 176 |
| Table 14-12 | Mineral Resource Classification | 177 |
|
| Table 14-13 | All Veins in San Albino Deposit: Open Pit Resources | 179 |
| Table 14-14 | All Veins in San Albino Deposit: Underground Resources | 179 |
| Table 14-15 | San Albino Deposit: Inferred Mine Dump Resources | 180 |
| Table 14-16 | All Veins in San Albino Deposit: Open Pit, Underground and Dump Resources | 180 |
| Table 14-17 | Descriptive Statistics of the Las Conchitas Resource Database | 186 |
| Table 14-18 | Modeled Geological and Mineral Domains, Las Conchitas Deposit(s) | 187 |
| Table 14-19 | Descriptive Statistics of Samples by Vein and Domain: Las Conchitas | 190 |
| Table 14-20 | Descriptive Statistics of Density Data by Vein and Domain: Las Conchitas | 193 |
| Table 14-21 | Core Recovery | 194 |
| Table 14-22 | Capped Gold Grades and Number of Samples by Domain: Las Conchitas | 196 |
| Table 14-23 | Capped Silver Grades and Number of Samples Domain: Las Conchitas | 196 |
| Table 14-24 | Descriptive Statistics of Composites by Vein and Domain | 197 |
| Table 14-25 | Estimation Areas - Search Ellipse Orientations | 198 |
| Table 14-26 | Estimation Parameters for Gold at Las Conchitas | 199 |
| Table 14-27 | Estimation Parameters for Silver at Las Conchitas | 200 |
| Table 14-28 | Mineral Resource Classification | 201 |
| Table 14-29 | All Veins in Las Conchitas Deposit: Open Pit Resources | 203 |
| Table 14-30 | All Veins in Las Conchitas Deposit: Underground Resources | 203 |
| Table 14-31 | Las Conchitas Deposit: Inferred Mine Dump Resources | 203 |
| Table 14-32 | All Veins in Las Conchitas Deposit: Open Pit, Underground and Dump Resources | 203 |
| Table 16-1 | Economic Parameters for Pit Optimizations | 211 |
| Table 16-2 | Slope Parameters | 211 |
| Table 16-3 | San Albino In-Pit Resources | 214 |
| Table 16-4 | San Albino Actual Mine Production | 215 |
| Table 17-1 | Quarterly Mill Production | 221 |
| Table 17-2 | Consumables Consumptions | 223 |
| Table 19-1 | Active Contracts | 230 |
| Table 20-1 | San Albino Mine Closure Program - September 2023 | 257 |
| Table 21-1 | Operating Cost Summary | 259 |
| Table 21-2 | Actual Mining Costs | 260 |
| Table 21-3 | Actual Processing Costs | 260 |
| Table 21-4 | Actual Indirect and G&A Costs | 261 |
| Table 26-1 | Mako Mining Corp. Cost Estimate for the Recommended Program | 269 |
|
LIST OF FIGURES
| Figure 4-1 | Location of the San Albino Project | 22 |
| Figure 4-2 | San Albino Property Map | 23 |
| Figure 4-3 | Surface Rights Owned by Mako | 27 |
| Figure 6-1 | Areas of Historical Exploration, San Albino Project | 36 |
| Figure 7-1 | Regional Geologic Setting of the San Albino Project | 45 |
| Figure 7-2 | Geologic Map of the San Albino-Murra Concession, San Albino Project | 47 |
| Figure 7-3 | 3D Rendering of the San Albino Deposit Veins | 49 |
| Figure 7-4 | San Albino Vein Exposed in West Pit | 51 |
| Figure 7-5 | San Albino Vein Drill Core Exposure SA12-46, 73m | 51 |
| Figure 7-6 | SVS Mineralization Overprinting QS Vein, San Albino, Drillhole SA12-48, Assayed 67.7 g Au/t, 96.6 g Ag/t, 2.8% Pb, 1.8% Zn | 52 |
| Figure 7-7 | QS Vein, Bayacun, Drillhole LC20-307, Assayed 13.5 g Au/t and 0.8 g Ag/t | 55 |
| Figure 7-8 | SVS Mineralization Overprinted on QS Vein, Mina Francisco, Drillhole LC22-549, Assayed 8.7 g Au/t and 49.2 g Ag/t | 55 |
| Figure 7-9 | 3D Rendering of the Las Conchitas Deposit Veins | 56 |
| Figure 8-1 | Diagrammatic Orogenic Gold Deposit Model | 58 |
| Figure 9-1 | Exploration Surface Samples in ppm Au | 61 |
| Figure 10-1 | Map of San Albino Project Drillholes and Channel Samples | 68 |
| Figure 10-2 | Map of San Albino-Murra Exploration Drillholes | 69 |
| Figure 10-3 | Map of Las Conchitas Project Drillholes and Channel Samples | 71 |
| Figure 10-4 | Map of El Jicaro Drillholes | 72 |
| Figure 10-5 | Map of La Segoviana Drillholes | 74 |
| Figure 11-1 | Channel Sample Blanks | 84 |
| Figure 11-2 | Relative Percent Difference of Channel Sample Duplicates | 87 |
| Figure 11-3 | Absolute Percent Difference of Channel Sample Duplicates | 87 |
| Figure 11-4 | Gold Blanks: Drilling | 88 |
| Figure 11-5 | Silver Blanks: Drilling | 88 |
| Figure 11-6 | Relative Difference of Gold in Quarter Core | 92 |
| Figure 11-7 | Absolute Value of Relative Difference of Gold in Quarter Core | 92 |
| Figure 11-8 | Relative Difference of Gold in Coarse Reject Material | 93 |
| Figure 11-9 | Absolute Value of Relative Difference of Gold in Coarse Rejects | 93 |
| Figure 11-10 | Relative Difference of Gold in RC Field Duplicates | 94 |
| Figure 11-11 | Absolute Value of Relative Difference of Gold in RC Field Duplicates | 94 |
|
| Figure 11-12 | Maximum Relative Difference of Metallic-Screen vs. 30 Gram Fire Assay Gold Values | 96 |
| Figure 11-13 | Absolute Value of the Relative Difference from Mean of Metallic-Screen vs. 30 Gram Fire Assay Gold Values | 96 |
| Figure 11-14 | SW San Albino Blanks for Au BV Labs: 2021 and 2022 | 97 |
| Figure 11-15 | SW San Albino Blanks for Ag BV Labs: 2021 and 2022 | 98 |
| Figure 11-16 | SW San Albino Scatter Plot Au Coarse Duplicates (150 PPM) 2021-2022 | 101 |
| Figure 11-17 | SW San Albino Scatter Plot Au Coarse Duplicates (80 PPM) 2021-2022 | 101 |
| Figure 11-18 | SW San Albino Scatter Plot Au Coarse Duplicates (5 PPM) 2021-2022 | 102 |
| Figure 11-19 | SW San Albino Scatter Plot Au Coarse Duplicates (1 PPM) 2021-2022 | 102 |
| Figure 11-20 | SW San Albino Scatter Plot Au Coarse Duplicates (0.5 PPM) 2021-2022 | 103 |
| Figure 11-21 | SW San Albino Thompson-Howarth Precision Plot for Au Coarse Duplicates: 2021 - 2022 | 103 |
| Figure 11-22 | SW San Albino Mean of Sample Pair Versus Absolute Relative Difference of Sample Pair | 104 |
| Figure 11-23 | SW San Albino Scatter Plot Ag Coarse Duplicates (120 PPM) 2021-2022 | 105 |
| Figure 11-24 | SW San Albino Scatter Plot Ag Coarse Duplicates (80 PPM) 2021-2022 | 105 |
| Figure 11-25 | SW San Albino Scatter Plot Ag Coarse Duplicates (40 PPM) - 2021-2022 | 106 |
| Figure 11-26 | SW San Albino Scatter Plot Ag Coarse Duplicates (5 PPM) 2021-2022 | 106 |
| Figure 11-27 | SW San Albino Thompson-Howarth Precision Plot for Ag Coarse Duplicates: 2021-2022 | 107 |
| Figure 11-28 | SW San Albino Mean of Sample Pair Versus Absolute Relative Difference of Sample Pair | 108 |
| Figure 11-29 | Control Chart for Silver in OREAS 229b | 112 |
| Figure 11-30 | Gold in Blanks and in Preceding Samples, Trenches, 2012 - 2018 | 117 |
| Figure 11-31 | Gold in Blanks and in Preceding Samples, Trenches, 2019 - 2023 | 117 |
| Figure 11-32 | Silver in Blanks and in Preceding Samples, Trenches, 2012 - 2018 | 118 |
| Figure 11-33 | Silver in Blanks and in Preceding Samples, Trenches, 2019 - 2023 | 118 |
| Figure 11-34 | Silver in Oreas 210 | 122 |
| Figure 11-35 | Silver in Oreas 240 | 122 |
| Figure 11-36 | Relative Difference, Gold in Drill Core Samples | 128 |
| Figure 11-37 | Gold in Blanks and in Preceding Samples | 129 |
| Figure 11-38 | Silver in Blanks and Preceding Samples | 130 |
| Figure 11-39 | Silver in Blanks - All Data | 130 |
| Figure 13-1 | San Albino Deposit Metallurgical Test History | 143 |
| Figure 14-1 | Cumulative Probability Plot for All Veins and Country Rock: Au, Ag, Pb and As | 158 |
| Figure 14-2 | Core with Dikes | 160 |
| Figure 14-3 | Cross Section 11 Showing Veins | 163 |
| Figure 14-4 | Cross Section 16 Showing Veins | 164 |
| Figure 14-5 | 3D Perspective View of the San Albino Mine Dumps | 169 |
|
| Figure 14-6 | 3D Perspective View of the San Albino Mine Workings | 170 |
| Figure 14-7 | San Albino Deposit Gold Block Model - Cross Section 11 | 181 |
| Figure 14-8 | San Albino Deposit Gold Block Model - Cross Section 16 | 181 |
| Figure 14-9 | 3D Perspective of San Albino Grade Shells and Resource-Controlling Solids | 185 |
| Figure 14-10 | Cumulative Probability Plot for All Veins and Country Rock: Au, Ag, Cu, Pb a | 188 |
| Figure 14-11 | Cross Section 650 Showing Veins | 191 |
| Figure 14-12 | Cross Section 1830 Showing Veins | 192 |
| Figure 14-13 | Las Conchitas Deposit Gold Block Model - Cross Section 650 | 204 |
| Figure 14-14 | Las Conchitas Deposit Gold Block Model - Cross Section 1830 | 205 |
| Figure 14-15 | 3D Perspective of Las Conchitas Grade Shells and Resource-Controlling Solids | 208 |
| Figure 17-1 | San Albino Mill Flowsheet | 217 |
| Figure 17-2 | Fresh Water Consumption | 222 |
| Figure 18-1 | Overall San Albino Site Plan | 225 |
| Figure 18-2 | Detail Plan of San Albino Process Facility | 226 |
|
1.0 EXECUTIVE SUMMARY (ITEM 1)
The authors have prepared this Amended Technical Report on the San Albino gold project, located in Nueva Segovia, Nicaragua (the "San Albino project") at the request of Mako Mining Corp ("Mako"). This amended report principally includes an explanation in Section 15.0 and the addition of Sections 16.0 through 21.0 and some changes listed Section 2.0. This report and the resource estimates herein have been prepared in accordance with the disclosure and reporting requirements set forth in the Canadian Securities Administrators' National Instrument 43-101 ("NI 43-101"), Companion Policy 43-101CP, and Form 43-101F1, as well as with the Canadian Institute of Mining, Metallurgy and Petroleum's "CIM Definition Standards - For Mineral Resources and Reserves, Definitions and Guidelines" ("CIM Standards") adopted by the CIM Council on May 10, 2014.
1.1 PROPERTY DESCRIPTION AND OWNERSHIP
The San Albino mining property is located in Nueva Segovia Department of the Republic of Nicaragua, 227km north of the city of Managua, and approximately 15km southeast of the northern border of Nicaragua with Honduras. Within the property, the San Albino gold deposit (the "San Albino deposit") is currently being mined by Mako and is located at Latitude 13° 41' 23"N and Longitude 86° 06' 04"W (597,200E, 1,513,600N, UTM Zone 16, WGS 84 Datum). The Las Conchitas deposit is located 0.5km south of the San Albino open pit. The San Albino property consists of four contiguous mining concessions referred to as: 1) San Albino- Murra, 2) El Jicaro, 3) La Segoviana, and 4) Potrerillos concessions, respectively, and comprise a total of 18,816.72 hectares (188.17km2).
Mako, indirectly through their subsidiary, Nicoz Resources, S.A., holds a 100% interest in the San Albino- Murra, La Segoviana and Potrerillos concessions. Mako, indirectly through their subsidiary, Gold Belt, S.A., holds a 100% interest in the El Jicaro concession. Annual fee payments on the mineral concessions are required on a semi-annual basis, payable in January and July each year. The payments escalate from US$0.25 per hectare to US$8.00 per hectare over the first 10 years and are US$12.00 per hectare thereafter. Concession fees and taxes have been paid in full to December 31, 2023. The annual holding costs for all four concessions are estimated at $185,420.
Mako has purchased the surface rights over 100% of the area covering the San Albino deposit. Additional surface rights were purchased to cover all the area permitted for processing infrastructure and mining activities, as well as additional properties at the Las Conchitas area. The Company has acquired surface rights totaling 915.584 manzanas (645.127 hectares) in 92 individual properties. The Company is currently negotiating the purchase of additional properties on future exploration areas.
|
1.2 EXPLORATION AND MINING HISTORY
Gold-bearing quartz vein mineralization was discovered at the San Albino project area around 1790 by Spaniards who initially mined gold at the San Albino deposit from an open pit and subsequently by underground methods. Flooding eventually stopped the early work. From 1885 to 1926 and possibly into the 1930s, the property was worked by several operators. In 1922 to 1926, Charles Butters, an American metallurgist, built a mill on site. In 1926, the operation was seized by Augusto Sandino, leader of the Nicaraguan revolution.
The first modern-era exploration was conducted by Western Mining starting in 1996 on the Quilali-Murra exploration concession. Work included stream-sediment and rock chip sampling, as well as soil sampling along trails and footpaths. Two vertical core holes were drilled to shallow depths. Beginning in 1997 through 2006, Resources and Mining S.A. ("REMISA") controlled the property and focused its efforts on the historical San Albino mine. REMISA reopened historical cross-cuts but could not reach the main drift. A soil survey was completed and shallow core drilling was conducted from the hanging wall of the mineralized structure. During the second half of 2003, Pila Gold Ltd. ("Pila") identified and mapped showings of mineralization, collected rock samples, soil samples, and silt samples from the San Albino vein and adjacent Murra area. Additionally, Pila hand-excavated and sampled 24 trenches. Most work was concentrated around the Las Conchitas target and the historical San Albino mine. In 2006 to early 2009, Condor Gold Plc. ("Condor") explored the San Albino and Arras veins. Condor collected 2,398 samples from 75 trenches and a total of 694 samples were taken from 82 road cuts. Condor mapped or inspected 246m along eight adits from which 246 samples were taken. Twenty-two reverse circulation ("RC") drillholes and two core holes (2,754m) were drilled at the Arras and San Albino veins. In 2009, Golden Reign Resources Ltd. ("Golden Reign") acquired the San Albino-Murra concession. In 2018, Golden Reign merged with Marlin Gold Mining Ltd. ("Marlin") to form Mako. Exploration at the San Albino project area has been ongoing since it was acquired by Golden Reign (now Mako).
1.3 GEOLOGY AND MINERALIZATION
Rocks at the San Albino property consist of black, occasionally carbonaceous, argillite or metapelite. Folds and thrusts have been recognized within these meta-sedimentary rocks. Regional metamorphism and deformation are thought to predate the Dipilto batholith. The schistose foliation is attributed to shortening that preceded emplacement of the Dipilto batholith. The meta-sedimentary rocks at the San Albino project are cut by dikes of intermediate composition.
|
Low- and moderate-angle faults control the distribution of gold-bearing quartz veins. At the San Albino project, quartz-bearing shear zones up to several meters thick are stacked in subparallel fashion (e.g., San Albino, Naranjo, and Arras veins) to comprise the San Albino deposit. The separation between shears averages just under 100m. The shear-related veins and their enclosing faults have anastomosing, pinch-and-swell geometries. The continuity between shear zones and metamorphic foliation is consistent with a thrust geometry.
The mineralization in the San Albino project area is best interpreted in the context of an "orogenic gold" deposit model based on the association of gold mineralization with metamorphic host rocks, the textures and mineralogy of the San Albino and Las Conchitas veins, the wallrock alteration, and the "gold-only" character of mineralization. The veins are hosted in lower greenschist-facies metamorphic rocks, and their geometries indicate that veins formed in response to contractional deformation. Other common orogenic gold deposit features present in the San Albino system include ribbon-textured shear veins containing milky quartz, visible gold, relatively high Au:Ag ratios, and low percentages of base metal sulfides.
1.4 METALLURGICAL TESTING AND MINERAL PROCESSING
Based on the recent metallurgical test work completed in 2020, the selected processing approach for material from the San Albino deposit includes milling of the material followed by cyanide extraction of gold and silver using a carbon-in-leach ("CIL") plant, which yielded optimized overall recoveries ranging from 86.1% to 96.9%, depending on the mineralization type and despite the presence of carbonaceous material in the samples. Tests were completed in 2016 through 2020 and were designed to confirm conclusions from work done in 2013 and 2014, as well as provide further design parameters for the mill flowsheet and the associated mill operations and tailings management. Overall, the latest programs supported conclusions of previous process development work and the current mill design parameters. Gravity recoveries averaged 36.3% with higher gravity recoveries possible when higher-grade material is processed through the plant.
Samples from the Las Conchitas deposit were collected, composited and tested in the metallurgical laboratory at the San Albino mill in 2022. The 2022 testing was completed as variability testing to verify processing Las Conchitas material using the existing milling circuit at San Albino would produce similar results as had been experienced when processing material from the San Albino deposit. The results from the 2022 test program indicates Las Conchitas mineralization can be expected to perform similar to the San Albino deposit; however, these results should be used as an indication of potential processing results only. Confirmation testing to verify results at a third-party laboratory is recommended.
|
Feed samples from the existing mill facility were collected and tested in the laboratory at the San Albino mine site. The testing parameters used in the laboratory were adjusted until the results from laboratory testing closely matched the results from the operating facility. These testing parameters were used for the testing of the Las Conchitas composites. The test results from the composites closely matched the results from the operating mill when the mill processed feed material of similar organic carbon content.
There are also plans to complete test pits from several of the Las Conchitas veins and process the material through the San Albino mill to further support the expectation of Las Conchitas material's performance being similar that of San Albino material. No further testing of samples from the San Albino deposit were completed in 2022.
Both San Albino and Las Conchitas deposits contain three major mineralization types: weathered, transition, and fresh. When processing these mineralization types from the San Albino mine through the San Albino mill, the average gold recoveries were: oxide 94%, transition 86% and fresh 79%. Preg-rob potential present in the various types is the primary reason for the lower recovery in the transition and fresh mineralization types compared to the weathered material.
1.5 MINERAL RESOURCE ESTIMATE
The effective date of the San Albino resource estimate is August 18, 2023. The effective date of the Las Conchitas resource estimate is October 11, 2023.
Both the San Albino and Las Conchitas deposits were initially modeled on sections spaced 10m apart and looking N40oE (95 sections at San Albino and 159 sections at Las Conchitas). Logged geology (including angles to core axes), core photographs, and gold grades were utilized to model vein mineralization and halo mineralization. The halo mineralization was typically separated into hanging wall and footwall zones. These sectional interpretations were reviewed by Mako geologists and modifications were made until there was a mutually agreed-upon interpretation. These interpretations were used to code the database for domain and vein name. Unreliable data (such as obviously incorrect locations, less than 45% core recovery, and RC drill results) were eliminated. After evaluating each vein's assays statistically, capping levels were defined and assigned, and then compositing was done to one meter lengths respecting the vein and halo boundaries. The cross section interpretations were snapped to the drill holes in three dimensions, sliced vertically along N40oE long sections, and reinterpreted on one meter intervals. These long sections were then treated as solids for coding the block model.
|
San Albino has three main groups of veins - San Albino, Naranjo, and Arras - each with multiple splays. Las Conchitas has 16 veins, each of which was modeled and estimated separately. A polygonal estimate was completed for each area to anticipate its size and grade, and to be a check on the estimates. The one meter composites were used to estimate gold and silver grades using inverse-distance cubed, kriging, and nearest- neighbor methods. Multiple estimates were made to evaluate sensitivity to and optimization of estimation parameters. While the three types of estimates (and the polygonal estimate) were used to check each other, the reported estimate used inverse-distance cubed.
The block models are rotated 40o to respect the strike of the deposits. Block sizes are one meter high by two- meters long by one meter across strike. Gold and silver grades were estimated for the veins, halos, and the unmineralized material. Vein grades were diluted depending on the material types adjacent to the vein by any or all of the footwall halo, hanging wall halo, or unmineralized material. For open pit resources, San Albino was assigned a 0.5m dilution rind on both the top and the bottom of the veins, while at Las Conchitas a 0.4m dilution rind on both the top and the bottom of the veins was applied. A thinner dilution rind was applied at Conchitas because actual productions shows that dilution can be smaller than 0.5m on the hanging wall. Because little engineering work has been done for underground mining, the underground resources reported are block diluted.
The author has used his judgment with respect to the technical and economic factors likely to influence the "prospects for eventual economic extraction" and the estimates listed in the tables below fulfill that requirement. The San Albino deposit and Las Conchitas deposit mineral resources are based on potential open pit as well as potential underground mining scenarios.
Technical and economic factors likely to influence the "reasonable prospects for eventual economic extraction" were evaluated using the best judgment of the author responsible for this section of the report. For evaluating the open pit potential, a series of optimized pits were run using variable gold prices and parameters. The accepted open pit mining cost was $3/t, processing cost $65/t, and G&A cost $2/t. Metallurgical recoveries of gold used in the pit optimizations were 83%, 90%, and 95% for fresh rock, transition, and oxide material, respectively. Silver was not considered in the optimizations. For evaluating the potential for underground mining, a series of stope optimizations were run at variable cutoffs. For the reporting cutoff grade of 4.0g Au/t, an average underground mining cost of $144/t, processing cost of $65/t, and G&A of $2/t were assumed. Underground resources are those at or above the 4.0g Au/t cutoff lying within the 3.0g Au/t optimized stopes. The factors used in defining cutoff grades for open pit and underground are based on a gold price of US$1,750/oz.
|
Classification of the resources considered adequacy and reliability of sampling, geologic understanding, results of quality control analyses, geologic complication, and apparent grade continuity. Table 1-1, Table 1-2, and Table 1-3 present the estimates of San Albino, Las Conchitas, and combined for the San Albino project totals. There are some estimated resources in the historic mine dumps, all of which are classified as Inferred.
Table 1-1 All Veins in San Albino Deposit: Open Pit, Underground, and Dump Resources
| Open Pit and Underground and Dumps | |||||
| `All Measured | |||||
| Cutoff | Tonnes | g Au/t | Oz Au | g Ag/t | Oz Ag |
| variable | 47,200 | 9.88 | 15,000 | 17.8 | 27,000 |
| All Indicated | |||||
| Cutoff | Tonnes | g Au/t | Oz Au | g Ag/t | Oz Ag |
| variable | 251,600 | 12.10 | 97,900 | 21.0 | 169,700 |
| All Measured and Indicated | |||||
| Cutoff | Tonnes | g Au/t | Oz Au | g Ag/t | Oz Ag |
| variable | 298,800 | 11.75 | 112,900 | 20.5 | 196,700 |
| All Inferred | |||||
| Cutoff | Tonnes | g Au/t | Oz Au | g Ag/t | Oz Ag |
| variable | 240,800 | 10.53 | 81,500 | 15.4 | 119,200 |
| Note: Variable cutoffs are 1.5g Au/t for open pit and 4.0g Au/t for underground |
Table 1-2 All Veins in Las Conchitas Deposit: Open Pit, Underground, and Dump Resources
| Open Pit and Underground and Dumps | |||||
| All Indicated | |||||
| Cutoff | Tonnes | g Au/t | Oz Au | g Ag/t | Oz Ag |
| variable | 371,300 | 11.50 | 137,300 | 13.3 | 158,300 |
| All Inferred | |||||
| Cutoff | Tonnes | g Au/t | Oz Au | g Ag/t | Oz Ag |
| variable | 142,500 | 11.56 | 48,400 | 13.8 | 63,400 |
| Note: Variable cutoffs are 1.5g Au/t for open pit and 4.0g Au/t for underground |
|
Table 1-3 All Veins in San Albino Project: Open Pit, Underground, and Dump Resources
| Open Pit and Underground and Dumps | |||||
| All Measured | |||||
| Cutoff | Tonnes | g Au/t | Oz Au | g Ag/t | Oz Ag |
| variable | 47,200 | 9.88 | 15,000 | 17.8 | 27,000 |
| All Indicated | |||||
| Cutoff | Tonnes | g Au/t | Oz Au | g Ag/t | Oz Ag |
| variable | 622,900 | 11.74 | 235,200 | 16.4 | 328,000 |
| All Measured and Indicated | |||||
| Cutoff | Tonnes | g Au/t | Oz Au | g Ag/t | Oz Ag |
| variable | 298,800 | 11.61 | 112,900 | 16.5 | 355,000 |
| All Inferred | |||||
| Cutoff | Tonnes | g Au/t | Oz Au | g Ag/t | Oz Ag |
| variable | 383,300 | 10.54 | 129,900 | 14.8 | 182,600 |
| Note: Variable cutoffs are 1.5g Au/t for open pit and 4.0g Au/t for underground |
The exploration procedures, sampling, and data derived from Mako's work are high quality and can be used with confidence to support the resource estimate. Confidence in vein correlations between holes varies by vein, and veins have been modeled accordingly. The veins at Las Conchitas, for example, were generally projected less far than those at San Albino because they appear to be less continuous. It is expected that infill drilling at Las Conchitas may well increase the defined resources.
1.6 MINERAL RESERVE ESTIMATES AND MINING METHODS
RESERVES
There are no Reserves at San Albino because the mine plan used to put the project into production is based on material including Inferred. The mine production has had good reconciliation (within 10% as of the Effective Date) with the Inferred material as well as Measured and Indicated.
MINING METHODS
Mining for the San Albino project includes the San Albino deposit and no current mine plans have been assumed for the Las Cochitas deposit. The methodology used for mine planning includes:
|
• Define assumptions for the economic parameters;
• Define geometric parameters and constraints;
• Complete Lerches Grossman pit optimizations;
• Create pit designs;
• Create dump designs;
Pit optimizations and subsequent pit designs are based on the economic parameters shown in Table 1-4. Silver price used is $25/oz Ag.
Table 1-4 Economic Parameters for Pit Optimizations
| Mining Costs | ||
| Waste Mining Reference Cost | $/t mined | 3.00 |
| Above COG Mining Reference Cost | $/t mined | 3.00 |
| Total Reference Mining Costs | $/t mined | 3.00 |
| Process Based Costs | ||
| Process Cost | $/t ore stacked | 65.000 |
| Selling Cost & Credits | $/t ore stacked | 2.00 |
| G&A | $/t ore stacked | 2.00 |
| Total Ore Based Costs | $/t ore stacked | 69.000 |
| Other Economic Parameters | ||
| Au Price | US$/oz | 1,750 |
| Au Oxide Recovery | % | 95.0% |
| Au Mixed Recovery | % | 90.0% |
| Au Sulphide Recovery | % | 83.0% |
| Ag Oxide Recovery | % | 60.0% |
| Ag Mixed Recovery | % | 55.0% |
| Ag Sulphide Recovery | % | 50.0% |
| Average Au Rec | % | 89.3% |
The resource is presented as a diluted vein with a 0.5m rind along the hanging wall and footwall. Effectively, all estimated vein material is above cutoff so all vein material and the 1m of total dilution is mineable.
Actual production from July 2021 through September 2023 totals over 11,139,000 tonnes with 401,000 tonnes of material from pits and 90,000 of historic dump material sent to the mill.
1.7 PROCESSING
The process plant at San Albino has been in operation since the second quarter of 2021 and utilizes a conventional processing flowsheet that is proven in industry. Run of Mine ("ROM") ore is delivered to the process plant stockpile adjacent to the crushing circuit. The ore is stockpiled separately by gold grade and preg-robing potential (due to organic carbon) to maximize the mill performance.
|
A front-end loader feeds a two-stage crushing circuit that reduces the ROM feed material to 80% passing 3/8in. The crushed ore is conveyed to the grinding circuit for further size reduction to 75% passing 200 mesh. A Knelson gravity concentrator is located within the grinding circuit to produce a concentrate stream containing the coarse-gold fraction. The concentrate stream reports to an Intense Cyanidation Unit ("ICU") located in the refinery where the coarse gold is leached into solution and recovered into a precipitant in a dedicated electrowinning circuit.
The product from the grinding circuit is thickened and leached in a series of five carbon-in-leach (CIL) tanks. The loaded carbon is pumped from the first CIL tank to the carbon handling circuit. In the carbon circuit the gold is stripped from the carbon using a hot caustic solution and recovered from solution into a precipitant using a dedicated electrowinning circuit. After stripping the carbon is regenerated and returned to the fifth CIL tank. The precipitant from the ICU electrowinning circuit and from the carbon stripping circuit are poured into doré bars for transport to final refining off site. The precipitate from the two streams are treated identically but kept separate for accounting reasons.
The slurry exiting the fifth CIL tank is circuit tails. The cyanide remaining in the slurry is treated to levels safe for the environment. The slurry is then filtered with the solid filtrate conveyed and stacked in the tailings storage facility. The solution filtered from the slurry is returned to the processing circuit.
1.8 PROJECT INFRASTRUCTURE
The main infrastructure supporting the operation of the San Albino mine is located near the process facility with a few installations located near operating mine pits and ore stockpiles. A list of these installations is given below:
/ Assay lab
/ Communication tower
/ Diesel Storage tanks
/ Weather station
/ Clinic
/ Blasting supplies storage
/ Mine waste dumps
/ Ore stockpiles
/ Tailings Storage Facility
|
The mine generates all required electrical power on site using diesel powered generators. Four 1000KW generators are on site with two operating continuously and an additional generator started to handle the in-rush resulting in mill start-ups. After a mill start-up, the third generator is shut down when the mill is operating at steady state.
The tailings storage facility is designed to accept dry solid tails from the process plant. The slurry tails are filtered to remove excess solution and delivered to the storage facility by conveyors. A dozer is used to distribute the tails in thin lifts throughout the facility. The facility has been designed to contain 1.87 million tonnes of solid tails and is to be constructed in three phases. The first phase was completed before mill start-up in 2021 with 434,000 tons of tails deposited to date. Subsequent phases are to be constructed as available capacity requires.
Water is pumped from the nearby Jicaro River to supply the facility with all fresh water and fire-suppressant water requirements. Bottled water is used to supply all potable water requirements on site. Only the water entrained with the filtered tails is sent to the tailings storage facility. All other water used in the processing facility returned to the mill to minimize fresh-water requirements.
1.9 ENVIRONMENTAL AND SOCIAL IMPACT
No environmental, social, or community issues were identified that would impact Mako's ability to develop the Mineral Resources at the San Albino Project. Mako has obtained all necessary permits to construct and operate the San Albino mine and has been mining since 2021.
1.10 CAPITAL AND OPERATING COSTS
The initial capital required to place the San Albino mine into production have been completed. As of the effective date, there is not sufficient information to complete a sustaining capital cost estimate. This will subject to future studies.
A summary of actual operating costs are given in the following table:
Table 1-5 Operating Cost Summary
| Cost $/tonne | ||
| Operating Costs | Processed | Mined |
| Mining | $ 89.45 | $ 3.23 |
| Processing | $ 65.17 | NA |
| Indirect/G&A | $ 20.76 | NA |
| Total | $ 175.38 | NA |
|
1.11 CONCLUSIONS, INTERPRETATIONS, AND RECOMMENDATIONS
The San Albino project benefits from a team of mining professionals that have spent multiple years working on the project, successfully mining a narrow vein, open pit deposit at San Albino that is similar to the geology and resource defined at Las Conchitas. The technical team has shown a commitment to collecting quality data and innovative thinking toward developing the project.
The authors are not aware of any significant risks or uncertainties that could reasonably be expected to affect the reliability or confidence in the exploration information as applied to the estimated mineral resources.
The San Albino project, inclusive of Las Conchitas, is a project of merit and warrants the proposed programs and level of expenditures outlined below. These veins are open down dip and along strike, with significant potential to expand the resources estimated for this report. Additionally, the stacked nature and even distribution of the veins parallel to the regional foliation provide a proven exploration strategy for regional exploration. The recommended program is broken down into the San Albino area, Las Conchitas area, and regional exploration is shown in Table 1-6. The total recommended plan is estimated to cost US$6,300,000.
Table 1-6 Budget for Recommended Work Program
| Category | USD |
| San Albino: Pre-Development Drilling | $980,000 |
| San Albino: Exploration Drilling | $180,000 |
| Las Conchitas: Pre-Development Drilling | $480,000 |
| Las Conchitas: Exploration Drilling | $2,700,000 |
| Regional Exploration | $1,960,000 |
| Total (rounded to 100,000) | $6,300,000 |
Success at San Albino, Las Conchitas, or other concessions is defined, respectively, as finding additional resources, defining a resource, or discovering deposits deserving follow-up drilling. Given historic successes it is likely that follow-up work would include additional drilling if not economic studies on the newly discovered resources and prospects. Approximate costs could be at least as large as the currently recommended Phase I costs.
|
2.0 INTRODUCTION AND TERMS OF REFERENCE (ITEM 2)
The authors have prepared this Technical Report on the San Albino gold project, located in Nueva Segovia, Nicaragua (the "San Albino project") at the request of Mako Mining Corp ("Mako"), a Canadian company based in Vancouver, British Columbia, Canada. Mako is listed on the TSX Venture Exchange (MKO-TSXV) and trades over the counter (MAKOF-OTCMKTS). This report has been prepared in accordance with the disclosure and reporting requirements set forth in the Canadian Securities Administrators' National Instrument 43-101 ("NI 43-101"), Companion Policy 43-101CP, and Form 43-101F1, as amended.
This report is an amendment of Technical Report and Estimate of Mineral Resources for the San Albino and Las Conchitas Deposits Nueva Segovia, Nicaragua dated October 25, 2023 with an Effective Date of October 11, 2023. This amended report dated June 10, 2024, provides more complete disclosure for a producing property by including an explanation in Section 15.0, the addition of Sections 16.0 through 21.0, and their respective summaries in Section 1.0. Other changes to the report are listed in Table 2-1.
|
Table 2-1 Other Changes Incorporated in this Amended Report
| Issue | Resolution |
| QP Certificates | Removed joint responsibilities for certain sections of the report and listed explicit responsibilities. |
| "Other relevant Data and information" (Section 24) | Removed disclosure from Section 24 and expanded on it in Sections 16 through 21. |
| Data and source of reliance information missing and deletion of certain reliance (Section 3) | Dates and source of information relied on concerning legal and environmental information added, and reliance on Mako interpretations deleted. |
| Clarify if resource assumptions are based on current knowledge and stage of development of the property | Clarified in the affirmative and removed the word "anticipated". |
| Explain why the company has not established mineral reserves | Added explanation in Section 15. |
| Disclosure of mineral resources that do not comply in Section 14.2.9 | Deleted the reference to "potentially economic material" and replaced with "unclassified material". Removed the sentence: "Within the total 144,000 tonnes of dump material are an estimated 10,900 tonnes grading 10.28g Au/t and 20.2g Ag/t (Appendix A)." |
| Figures 14-9 & 14-15 disclose mineral content that has not been categorized | Deleted the reference to "potentially economic material" and replaced with "unclassified material". Modified the sentences: "It is important to note that those ounces currently reported in the resource that have "…reasonable prospects for eventual economic extraction" are not all the ounces estimated at and for San Albino." To The reported resources with "…reasonable prospects for eventual economic extraction" are presented in Tables [listed]. Those resources occur at the outcrop of veins that extend downward at shallow to moderate dips." The notes to the figures were modified. |
| January 2020 estimate completed by company is not an "Historical Estimate" | Deleted prior estimate. |
| Title page missing data | Effective date and name and professional designation of each qualified person moved from second title page to the first. |
| Appendices A and B disclose mineral resources at multiple cutoff grades; sensitivity analysis should not be disclosed as mineral resources | Removed Appendices A and B. |
2.1 PROJECT SCOPE AND TERMS OF REFERENCE
The purpose of this report is to provide an updated estimate of mineral resources and a technical summary of the San Albino project which is located about 227km north of Managua, Nicaragua. The San Albino project is currently in operation, producing gold from orogenic veins by open pit mining of the San Albino and Arras veins, feeding a 500tpd mill with annual gold production of approximately 36,000oz. This Technical Report presents an updated resource estimate for the San Albino deposit and a first-time resource estimate for the Las Conchitas deposit, and builds upon and supersedes the Technical Reports of Kowalchuk (2011) and Puritch et al. (2013), the Technical Report and preliminary economic assessment ("PEA") of Puritch et al. (2015), the Technical Report and Resource Estimate of Ristorcelli and Unger (2020) and the Technical Report and Estimate of Mineral Resources for the San Albino and Las Conchitas Deposits Nueva Segovia, Nicaragua dated October 25, 2023 with an Effective Date of October 11, 2023.
|
The scope of this study included a review of pertinent technical reports and data provided by Mako relative to the general setting, geology, project history, exploration activities and results, methodology, quality assurance, interpretations, drilling programs, and metallurgy. This report is based almost entirely on data and information derived from work done by historical operators and Mako. The authors have reviewed much of the available data, Ristorcelli and Gray visited the project site, and all authors made judgments about the general reliability of the underlying data. Where deemed either inadequate or unreliable, the data were either eliminated from use or procedures were modified to account for lack of confidence in suspect information. The authors have made such independent investigations as deemed necessary in their professional judgment to be able to reasonably present the conclusions, interpretations, and recommendations presented herein.
The term San Albino is used in multiple ways throughout this report. For clarity, the following describes each use:
/ San Albino property: This refers explicitly to the four concessions: 1) San Albino-Murra, 2) El Jicaro, 3) La Segoviana, and 4) Potrerillos.
/ San Albino-Murra concession: This is one of four concessions that comprise the San Albino property and contains the San Albino deposit.
/ San Albino project: This is a general term that includes activities, exploration and engineering programs, infrastructure and the geographic area of the four concessions but does not refer explicitly to only mineral tenure (e.g. San Albino property).
/ San Albino deposit: The principal components of the San Albino deposit are the Arras, Naranjo, and San Albino shear zones with quartz veins, the smaller El Jobo, and a few other less continuous unnamed veins.
/ San Albino vein: This use of San Albino explicitly refers to the one vein that holds the majority of open pit resources and is the stratigraphically highest of all the veins within the San Albino deposit.
The term Las Conchitas is used in multiple ways throughout this report. For clarity, the following describes each use:
|
/ Las Conchitas: This refers to the area immediately south of the San Albino mine, within the San Albino-Murra mining concession.
/ Las Conchitas deposit: This refers to the aggregate of all veins for which resources have been estimated within the Las Conchitas area.
/ Las Conchitas vein(s): This use of Las Conchitas explicitly refers to any individual vein or multiple veins that comprise the resources of the Las Conchitas deposit.
The Effective Date of this Technical Report is October 11, 2023.
2.2 QUALIFIED PERSONS AND SITE VISITS
Qualified Persons under NI43-101 that contributed to this report are Mr. Steven J. Ristorcelli, C.P.G., independent consulting geologist; Mr. Peter Ronning, P. Eng, independent consultant engineer; Dr. Matthew D. Gray, C.P.G., Principal Geologist with Resource Geosciences Inc., an independent technical consulting firm; Mr. John Rust, consulting metallurgical engineer and Chief Metallurgist for Mako US Corp.; Mr. Brian Ray, P. Geo., independent consultant geologist; and Mr. Thomas L. Dyer, P. E., Principal Engineer with Respec Company, LLC., an independent technical consulting firm. With the exception of Mr. Rust, the Qualified Persons have no affiliations with Mako, or their subsidiaries, except that of independent consultant/client relationships. Report responsibilities of the Qualified Persons are detailed in Table 2-2.
Ristorcelli and Gray have made multiple site visits, most recently from 15 to 21 March 2023, accompanied by Frank Powell and Zoran Pudar of Mako. This site visit included a review of recently drilled core, observation of core logging and sampling procedures, field checks of drill-collar locations, field visits to channel sampling locations in trenches and outcrops, visits to active exploration drill sites, a review of Mako's geologic model with Mako geologic staff, and review of land, legal, permitting, and environmental issues with the responsible Mako staff. The authors observed that the procedures were satisfactory and that the work was completed with careful attention to generating quality data.
Mr. Ray visited the site prior to the commencement of commercial production at San Albino. Mr. Ronning has not visited the project site. Mr. Rust most recently visited the project in the period 25 to 29 January, 2023. Mr. Dyer has not visited the project site.
|
Table 2-2 Qualified Persons and Report Responsibilities
| Item Number |
Item Topic | Responsible Author(s) |
| 1 | Executive Summary | as indicated below |
| 1.0 -1.3 | Property Description and Ownership | Gray |
| 1.4 | Metallurgical Testing and Mineral Processing | Rust |
| 1.5 | Mineral Resource Estimate | Ristorcelli |
| 1.6 | Mineral Reserves Estimates and Mining Methods | Dyer |
| 1.7 | Processing | Rust |
| 1.8 | Project Infrastructure | Rust |
| 1.9 | Environmental and Social Impact | Gray |
| 1.10 | Capital and Operating Costs | Rust |
| 1.11 | Conclusions, Interpretations, and Recommendations | Ristorcelli |
| 2 | Introduction and Terms of Reference | Ristorcelli |
| 3 | Reliance on Other Experts | Gray |
| 4 | Property Description and Location | Gray |
| 5 | Accessibility, Climate, Local Resources, Infrastructure and Physiography | Gray |
| 6 | History | Gray |
| 7 | Geological Setting and Mineralization | Gray |
| 8 | Deposit Types | Gray |
| 9 | Exploration | Gray |
| 10 | Drilling | as indicated below |
| 10.0 | Ristorcelli | |
| 10.1 - 10.3 | Summary; historical drilling; San Albino and Las Conchitas drilling Exclusive of 10.3.1.1 |
Ronning |
| 10.3.1.1 | San Albino Norte drilling | Gray |
| 10.4 - 10.6 | El Jicaro; Potrerillos; La Segoviana drilling | Gray |
| 10.7 - 10.9 | Collar surveys; downhole surveys & summary statement | Ronning |
| 11 | Sample Preparation, Analyses and Security | as indicated below |
| 11.0 | Ristorcelli | |
| 11.1 - 11.2 | Sample preparation & sample analysis | Ronning |
| 11.3.1 - | Historical QA/QC; material & methods | Ronning |
| 11.3.3 | ||
| 11.3.4 | San Albino QA/QC 2010 - 2020 | Ristorcelli |
| 11.3.5 | San Albino QA/QC 2021-2022 | Ray |
| 11.3.6 - | Las Conchitas QA/QC (trenches & drill holes) | Ronning |
| 11.3.7 | ||
| 11.4 - 11.5 | Density & summary statement | Ronning |
| 12 | Data Verification | as indicated below |
| 12.1 | Site Visits | Ristorcelli |
| 12.2 | Database Verification | Ronning |
| 12.3 | Independent Verification Sampling | Ristorcelli |
| 12.4 | Independent Verification of Drillhole Collars | Gray |
| 12.5 - 12.6 | Specific gravity, summary statement | Ronning |
|
| Item Number |
Item Topic | Responsible Author(s) |
| 13 | Mineral Processing and Metallurgical Testing | Rust |
| 14 | Mineral Resource Estimates | Ristorcelli |
| 15 | Mineral Reserve Estimates | Dyer |
| 16 | Mining Methods | Dyer |
| 17 | Recovery Methods | Rust |
| 18 | Project Infrastructure | Rust |
| 19 | Market Studies and Contracts | Rust |
| 20 | Environmental Studies, Permitting and Social or Community Impact | as indicated below |
| 20.1 | Environmental Studies and Known Environmental Issues | Gray |
| 20.2 | Waste and Tailings Disposal, Site Monitoring, Water Management, Environmental Management Plans | Rust |
| 20.3 | Permitting | Gray |
| 20.4 | Social and Community | Gray |
| 20.5 | Mine Closure | Rust |
| 21 | Capital and Operating Costs | Rust |
| 22 | Economic Analysis | not applicable |
| 23 | Adjacent Properties | Gray |
| 24 | Other Relevant Data and Information | Ristorcelli |
| 25 | Interpretation and Conclusions | Ristorcelli |
| 26 | Recommendations | Gray |
| 27 | References | Gray |
2.3 FREQUENTLY USED ACRONYMS, ABBREVIATIONS, DEFINITIONS, AND UNITS OF MEASURE
In this report, measurements are generally reported in metric units. Where information was originally reported in imperial units, the authors have made the conversions as shown below. In some cases where there are tables of historical resource estimates or production totals, the authors did not convert the original units for historical completeness or to avoid changes to precision due to rounding.
Currency, units of measure, and conversion factors used in this report include:
| Linear Measure | ||
| 1 centimeter | = 0.3937 inch | |
| 1 meter | = 3.2808 feet | = 1.0936 yard |
| 1 kilometer | = 0.6214 mile | |
| Area Measure | ||
| 1 hectare | = 2.471 acres | = 0.0039 square mile |
| 1 manzana | = 0.7044 hectare |
|
| Capacity Measure (liquid) | ||
| 1 liter | = 0.2642 US gallons | |
| Weight | ||
| 1 gram | = 0.03215 troy ounces | |
| 1 kilogram | = 2.205 pounds | |
| 1 tonne | = 1.1023 short tons | = 2,205 pounds |
Currency - Unless otherwise indicated, all references to dollars ($) in this report refer to currency of the United States.
Frequently used acronyms and abbreviations:
| 3D | three dimensional |
| AA | atomic absorption analytical method |
| Ag | silver |
| As | arsenic |
| Au | gold |
| AuEq | gold equivalent |
| Bi | bismuth |
| BV | Bureau Veritas laboratories |
| Ca | calcium |
| CIL | carbon-in-leach |
| cm | centimeters |
| cm3 | cubic centimeters |
| CO2 | carbon dioxide |
| core | diamond core-drilling method |
| C | carbon |
| oC | degrees Celsius |
| CN | cyanide |
| CRM | certified reference material |
| Cu | copper |
| CV | coefficient of variation |
| Fe | iron |
| ft | foot or feet |
| g | grams |
| gal | gallons |
| gpl | grams per liter |
| GPS | global positioning system |
| GRA | gravimetric |
| ha | hectares |
|
| hr(s) | hour(s) |
| ICP | inductively coupled plasma analytical method |
| in. | inch |
| INORG | inorganic |
| kg | kilograms |
| km | kilometers |
| km2 | square kilometers |
| kW | kilowatt |
| l | liter |
| m | meters |
| Ma | million annum |
| mg | milligram |
| mm | millimeters |
| Mo | molybdenum |
| NaCN | sodium cyanide |
| Ni | nickel |
| oz | ounce |
| ORG | organic |
| Pb | lead |
| ppm | parts per million |
| ppb | parts per billion |
| QA/QC | quality assurance and quality control |
| RC | reverse circulation drilling method |
| S | sulfur |
| Se | selenium |
| SiO2 | silicon dioxide |
| SO4 | sulfate |
| SG | specific gravity |
| Sb | antimony |
| Std Dev | standard deviation |
| t | metric tonne or tonnes |
| tph | tonnes per hour |
| Ton or ton | Imperial short ton |
| TOT | total |
| Zn | zinc |
|
3.0 RELIANCE ON OTHER EXPERTS (ITEM 3)
The authors are not experts in legal matters, such as the assessment of the validity of mining claims, mineral rights, and property agreements in Nicaragua or elsewhere. Furthermore, the authors did not conduct any investigations of the environmental, social, or political issues associated with the San Albino project, and are not experts with respect to these matters. The authors have therefore relied fully upon information provided by Mr. Oscar Molina, Country Manager for Mako, on July 21, 2023 with regards to the following:
/ Section 4.2, which pertains to land tenure; and
/ Section 4.3, which pertains to legal agreements and encumbrances.
The authors have relied fully upon information provided by Mr. Lewis Javier Fuentes, an expert in Nicaraguan environmental and permitting matters, of the Environmental Department of Mako, on July 18, 2023 with regards to the following:
/ Section 4.4, which pertains to environmental liabilities; and
/ Section 4.5, which pertains to environmental agreements and permits.
The authors have relied fully upon information provided by Ramon Encinas, Environmental & Safety Manager, Mako US Corp. current as of October 11, 2023 for Sections 20.1, and 20.3.
|
4.0 PROPERTY DESCRIPTION AND LOCATION (ITEM 4)
The authors are not experts in land, legal, environmental, and permitting matters and express no opinion regarding these topics as they pertain to the San Albino project. Subsections 4.2 and 4.3 were prepared under the supervision of Oscar Molina, Country Manager for Mako. Mr. Lewis Javier Fuentes, an expert in Nicaraguan environmental and permitting matters and part of the Environmental Department of Mako, prepared and reviewed Sections 4.4 and 4.5 for Mako.
The authors do not know of any significant factors and risks that may affect access, title, or the right or ability to perform work on the property, beyond what is described in this report.
4.1 LOCATION AND LAND AREA
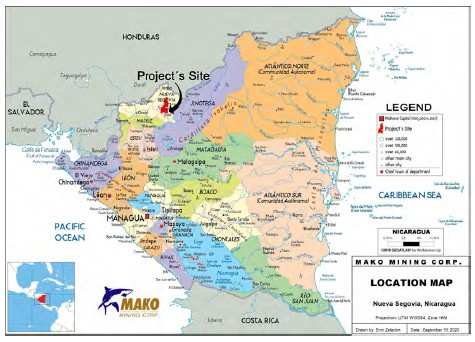
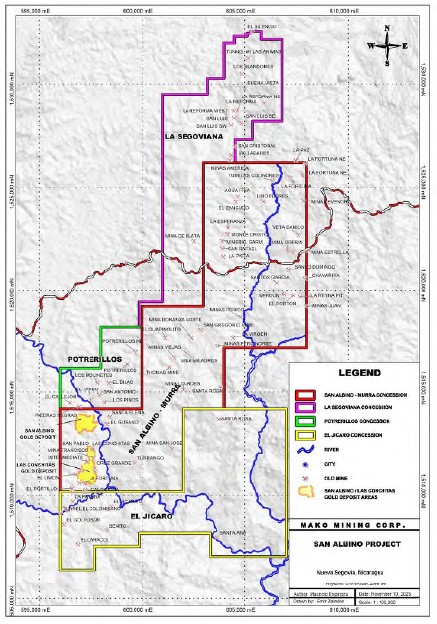
The San Albino project, which as herein defined includes the San Albino and Las Conchitas deposits and surrounding mineral concessions, is located in Nueva Segovia Department of the Republic of Nicaragua, 227km north of the city of Managua, and approximately 15km southeast of the northern border of Nicaragua with Honduras (Figure 4-1). The Nueva Segovia Department has a population of 211,200 (2005 census). Within the property, the San Albino gold deposit (the "San Albino deposit") is currently being mined by Mako and is located at Latitude 13° 41' 23"N and Longitude 86° 06' 04"W (597,200E, 1,513,600N, UTM Zone 16, WGS 84 Datum). The Las Conchitas deposit is located 0.5km south of the San Albino open pit. The small town of El Jicaro is located 6km northwest of the San Albino deposit and the town of Murra (population 1,000) is located 11.7km northeast of the San Albino deposit, within the northern part of the concessions (Figure 4-2).
|
Figure 4-1 Location of the San Albino Project
(from Mako, 2020)
The San Albino project consists of four contiguous mining concessions (Figure 4-2) referred to as: 1) San Albino-Murra, 2) El Jicaro, 3) La Segoviana, and 4) Potrerillos concessions, respectively, and comprise a total of 18,816.72 hectares (188.17km2).
|
Figure 4-2 San Albino Property Map
(from Mako, 2023; 5kmUTM grid lines for scale)
|
4.2 MINERAL TITLE
Mako Mining Corp., indirectly through their subsidiary, Nicoz Resources, S.A., holds the legal titles of the San Albino-Murra, La Segoviana, and Potrerillos concessions according to the Nicaraguan Ministry of Mining, Resolution Numbers 611-RN-MC/2006, 008-DM002-2020, and 025-DM-003-2020, respectively. Mako Mining Corp., indirectly through their subsidiary, Gold Belt, S.A., holds the legal title of the El Jicaro concession according to the Nicaraguan Ministry of Mining, Resolution Number 012-DM-330-2012. The four mineral concessions are contiguous and total 18,816.72 Ha. Details of the individual concessions as well as the geographical UTM coordinates are shown in Table 4-1.
Mako provided the authors with certifications prepared by the Nicaraguan Ministry of Energy and Mines, dated 3 May 2023, confirming that:
1. Nicoz Resources, S.A. holds the legal titles of the San Albino-Murra, La Segoviana, and Potrerillos concessions;
2. Gold Belt, S.A. is the holder of the mining concession "El Jicaro";
Senior management of Mako has affirmed to the authors that both Gold Belt S.A. and Nicoz Resources S.A. are validly existing legal entities in good standing of all their technical and economic obligations with the Ministry of Energy and Mining of the Republic of Nicaragua in accordance with the provisions of the Law, as of the effective date of this report, and that Nicoz Resources, S.A. and Gold Belt, S.A. are wholly owned subsidiaries of Mako Mining Corp.
Nicoz Resources, S.A. is registered under number 26810-B5, page 24/ 39, entry 921-B5 of the Second Book of Corporations; and under number 36,118, pages 105/106; entry 169 of the Book of Legal Persons, both Books recorded by the Public Registry of Managua. Gold Belt, S.A. is registered under number 2188, page 502/514, entry 921-B5 of the Second Book of Corporations; and under number 8,011, pages 267/268; entry XXI of the Book of Legal Persons, both Books recorded by the Public Registry of Masaya.
Annual fee payments on the mineral concession are required on a semi-annual basis, payable January 1 to 30 and July 1 to 30 each year. The payments escalate from US$0.25 per hectare to US$8.00 per hectare over the first 10 years and are US$12.00 per hectare thereafter (Table 4-2).
Concession fees and taxes have been paid in full to December 31, 2023. The annual holding costs for the San Albino concessions are estimated at $185,420 (Table 4-3).
|
Table 4-1 Details of San Albino Project Concessions
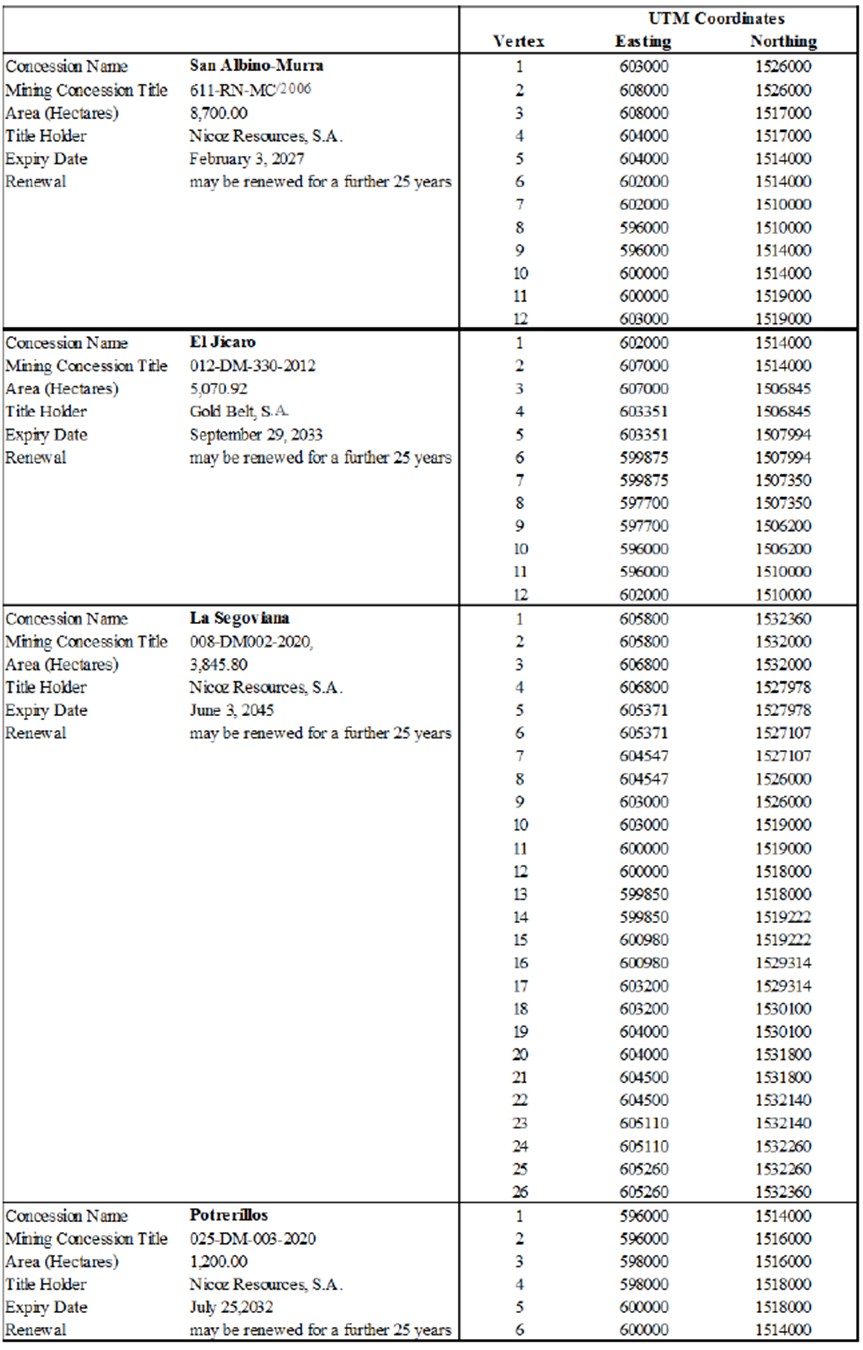
|
Table 4-2 Annual Concession Fees
| ANNUAL CONCESSION FEE $US/HECTARE | |
| 1 Year | $0.25 |
| 2 Year | $0.75 |
| 3 and 4 Year | $1.50 |
| 5 and 6 Year | $3.00 |
| 7 and 8 Year | $4.00 |
| 9 and 10 Year | $8.00 |
| 11 Years or more | $12.00 |
Table 4-3 Summary of Annual Property Tenure Costs
| MINING CONCESSION | AREA (Hectares) |
GRANTED | EXPIRES | 2023 ANNUAL SURFACE FEE |
TOTAL U$ ANNUAL AMOUNT |
SURFACE FEE PAYMENT STATUS |
| San Albino-Murra 611-RN-MC-2006 | 8700.00 | June 27, 2006 | June 26, 2031 | U$12.00 X Hect. | $104,400.00 | Valid to Dec 31, 2023 |
| La Segoviana 008-DM-002-2020 | 3845.80 | June 3th,2020 | June 2th,2045 | U$1.50 X Hect. | $5,768.70 | Valid to Dec 31, 2023 |
| Potrerillos 041-DM-24-2007 | 1200.00 | July 26, 2007 | July 25,2032 | U$12.00 X Hect. | $14,400.00 | Valid to Dec 31, 2023 |
| El Jicaro 029-DM-107-2008 | 5070.92 | Sep 29 ,2008 | Sep,28,2033 | U$12.00 X Hect. | $60,851.04 | Valid to Dec 31, 2023 |
| TOTAL LAND PACKAGE | 18816.72 | TOTAL ANNUAL FEE 2023. | $185,419.74 | |||
Surface Rights
Mako has purchased the surface rights over 100% of the area covering the San Albino deposit and the majority of the Las Conchitas deposit. Additional surface rights were purchased to cover all the area permitted for infrastructure and mining facilities. Mako has acquired surface rights, as shown in Figure 4-3, totaling 915.584 manzanas (644.937 hectares) in 92 individual properties and has purchase options agreements for an additional four properties totaling 297.247 manzanas (209.38 hectares). Mako is currently negotiating the purchase of additional properties on future exploration areas.
|
Figure 4-3 Surface Rights Owned by Mako
(from Mako, 2023; 1km UTM grid lines for scale)
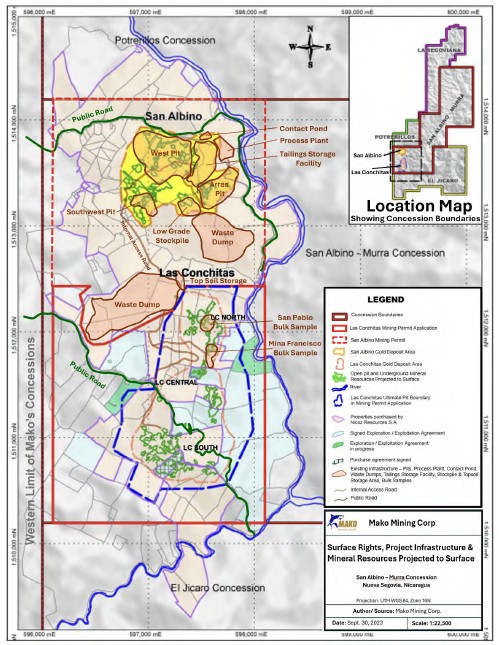
|
4.3 AGREEMENTS AND ENCUMBRANCES
The San Albino-Murra concession was originally granted to Delgratia Mining Corporation by Decree No 179- RN-MC/2002, dated February 4, 2002. On November 10, 2003, the property was transferred to Chorti Holdings, S.A., by Decree No 346-RN-MC/2003. The property was transferred to Nicoz Resources, S.A., ("Nicoz") the present title holder, by Decree No 611-RN-MC/2006, dated June 22, 2006. The concession is valid for a period of 25 years ending on February 3, 2027 and may be renewed for a further 25 years.
On May 7, 2012, Golden Reign announced the completion of an 80% earn-in interest in the San Albino-Murra concession pursuant to the terms of a four-year property option agreement dated June 26, 2009, with Nicoz, a private Nicaraguan company. Under the terms of the property option agreement, consideration paid for the 80% interest consisted of:
/ Aggregate cash payments totaling US$450,000
/ The issuance of 4,000,000 common shares of Golden Reign
/ Completion of exploration expenditures of US$5,000,000
On October 31, 2012, Golden Reign announced an agreement to acquire the remaining 20% interest in the San Albino-Murra concession by making cash payments totaling US$650,000 and issuing 2,100,000 common shares from its treasury over a period of 12 months. The acquisition of the remaining 20% was completed in October 2013, as reported in Golden Reign's Management Discussion and Analysis for the six months ending October 31, 2013.
The El Jicaro concession was acquired in February 2012 from a Nicaraguan title holder. Aggregate costs incurred to purchase and transfer title of the mining exploration and exploitation license were US$120,000. The El Jicaro concession license is valid for a period of twenty-five years, until September 28, 2033, and may be renewed for a further 25 years.
The mining concessions are subject to annual exploration reports, to be submitted to the Government of Nicaragua, and annual taxes. All concessions are subject to a 3% net smelter return ("NSR") royalty on gold production, payable to the Government of Nicaragua.
On July 11, 2014, Golden Reign announced the completion of a US$15.0 million gold-streaming facility with Marlin Gold Mining Ltd ("Marlin") to provide financing for the development of the San Albino project. Under the terms of the facility, a wholly owned subsidiary of Marlin ("Marlin subsidiary") was entitled to purchase 40% of gold production at US$700 per ounce until Golden Reign repaid US$19.6 million. Prior to commercial production, the Marlin subsidiary was entitled to an 8% semi-annual coupon on the US$15.0 million. On commercial production, Golden Reign was required to make minimum monthly payments of US$282,800. After Golden Reign repaid the US$19.6 million, the Marlin subsidiary was entitled to purchase 20% of the gold production at US$700/ounce subject to a 1% annual price escalation after three years of commercial production, plus 50% of the price differential should the gold price exceed US$1,200/ounce.
|
Mako was formed on August 3, 2018, when Golden Reign, Marlin and Sailfish Royalty Corp. ("Sailfish") entered into a definitive agreement whereby Mako acquired all of the issued and outstanding shares of Marlin (the "Marlin Transaction"). As a condition to closing the Marlin Transaction, Mako and its subsidiaries, Marlin and one of its subsidiaries, and Sailfish entered into a master agreement (the "Sailfish Master Agreement") whereby:
(a) the parties agreed to restructure the existing gold stream on a certain area of interest on the San Albino deposit totaling approximately 3.5km2 (the "AOI") (refer below);
(b) Marlin made cash payments to Sailfish in respect of any amounts recovered by Marlin in certain lawsuits Marlin has filed against the Mexican tax authority for the purpose of obtaining previously denied Mexican value added tax refunds, net of certain interest and inflation adjustments and applicable legal fees;
(c) Sailfish extinguished Mako's liability of $1,100,985 associated with the existing gold stream on the AOI;
(d) Sailfish's remaining funding obligation of approximately $13.9 million was eliminated; and
(e) Marlin assigned to Sailfish its El Compas Royalty and La Cigarra Royalty and granted an option to Sailfish to purchase its Gavilanes property in Mexico.
Under the terms of the Sailfish Master Agreement, Mako, Marlin and Sailfish restructured the gold stream arrangement (the "Amended and Restated Gold Purchase Agreement") whereby the terms and conditions of the Amended and Restated Gold Purchase Agreement provide Sailfish with the right to purchase 4% of the mineral resources for 25% of the spot price of gold at the time of sale with respect to the AOI.
In addition, the parties agreed to a new royalty agreement whereby Mako and its subsidiaries have granted Sailfish a 2% NSR royalty on production from the San Albino-Murra mining concession (exclusive of the AOI) and the El Jicaro concession. The Las Conchitas deposit is subject to this 2% NSR royalty.
On August 30, 2021 Mako announced the signing of a loan agreement with Sailfish for a gold-linked loan pursuant to which Sailfish provided an $8 million unsecured gold-linked term loan to Mako (the "Term Loan"). As compensation for making the Term Loan available to Mako, Sailfish was entitled to certain cash compensation (the "Lender Compensation") based on the prevailing price of gold per ounce, subject to a floor price of $1,750 and a ceiling price of $2,000. Mako made 24 monthly cash payments to Sailfish on account of the principal amount of the Term Loan and the Lender Compensation, which equalized the cash equivalent of 205 ounces of gold multiplied by the preceding month's average gold price pursuant to the terms of the Loan Agreement. On March 2, 2023 Mako announced that it had reached an agreement with Sailfish whereby the remaining seven payments of the outstanding gold-linked loan were made in physical silver. At of the end of Q3 2023 Mako was current on its obligations and at the end of Q3 Mako made the seven remaining payments.
|
On May 25, 2023 Mako announced that it had entered into a 24-month silver stream (the "Initial Silver Stream") to Sailfish for cash consideration of US$6,000,000 payable by Sailfish to Mako on the closing of the Initial Silver Stream transaction and an option (the "Option") to Sailfish, exercisable at the discretion of Sailfish on or after 12 months following the closing of the Initial Silver Stream upon payment of additional cash consideration of US$1,000,000, to purchase subsequent silver produced from the San Albino mine, or from concessions currently owned by Mako and processed through Mako's San Albino processing facility, until silver production is no longer economically viable as mutually agreed between Mako and Sailfish (the "Transaction"). The material terms of the Transaction are as follows:
/ Mako has agreed to deliver to Sailfish 13,500oz of silver from its concessions, or alternatively gold equivalent ounces or silver credits, at the end of each month beginning on the last day of the first full month immediately following the closing date of the Transaction.
/ The obligations of Mako under the definitive silver stream agreement to be entered into between the parties shall be secured by a mortgage in favor of Sailfish against Mako's San Albino property.
The only registered encumbrance on Title of the San Albino-Murra concession is a mortgage in favor of Sailfish, registered under number 1, Book 1, pages 6 and 7, entry 3rd, from the Mortgages Section of the Special Book of Concessions recorded by the Public Registry of Nueva Segovia.
There are no registered encumbrances on Titles of the El Jicaro, La Segoviana, or Potrerillos concessions.
4.4 ENVIRONMENTAL LIABILITIES
No environmental liabilities were identified in the Environmental Impact Study ("EIS") for the San Albino mine and the environmental permit was issued on September 12, 2017 following the public consultation meeting.
|
No environmental liabilities were identified in the EIS for the mining of the Las Conchitas deposit. Issuance of the environmental permit is pending.
4.5 ENVIRONMENTAL PERMITTING
In order to conduct exploration activities in Nicaragua such as geophysics, geochemistry, trenching and drilling, an environmental permit is required from the Ministry of Natural Resources and Environment ("MARENA"). The permits require submittal of a plan of work report and EIS. The permit does specify an expiration date and exploration activities must commence within 18 months from the date of issue or the permit is invalidated.
In addition, MARENA, requires the Company to submit semi-annual and annual environmental status reports and MARENA conducts site inspections several times a year to ensure the Company is in compliance. Once the established limits of drillholes and trenches are reached, the Company can apply for a new permit.
San Albino - Murra Concession
Nicoz Resources, S.A. submitted a plan of work report and an EIS to MARENA, and was permitted to conduct exploration work including diamond drilling, trenching, soil sampling and geological mapping under Administrative Resolution No. DGCA-P0040-1111-030-2012, (San Albino-Murra Geological Exploration) on September 12, 2012 and a subsequent modification and expansion of permitted activities granted on April 28, 2021.
The environmental permit for the development, construction, and operation of up to a 500 tonnes per day operation at the San Albino gold deposit was issued by MARENA to Nicoz Resources S.A. by Administrative Resolution DGCA/P0030/0615/007/2017. On July 2, 2020 MARENA issued Administrative Resolution DGCA-180620-P0267-1 which amended the environmental permit granted in 2017 to allow for the processing of up to 1,000tpd at the San Albino gold project. The amendment is initially effective for a period of five years and can be renewed indefinitely so long as the Company complies with the conditions set forth by MARENA. All other provisions contained in the environmental permit granted in 2017 remain in force and are fully applicable apart from the increased throughput from 500tpd to 1,000tpd.
Processing of any material sourced from the Las Conchitas deposit can be done at the existing operating San Albino plant under the terms of the current permit. Mining of deposits at Las Conchitas will require approval of a new EIS. On June 28, 2023 MARENA issued to Nicoz a Letter of No Objection MEM-VM-EMC-004-06- 2023 which comprises the environmental permit necessary for bulk sample mining of the Las Conchitas deposit(s) and forms the legal basis under which the Ministry of Energy and Mines and the National Police allow the use of industry standard blasting methods for the bulk mining. Appropriate notice of use of blasting agents was made to both agencies on 16 August 2023. This bulk sampling is ongoing while the EIS for large- scale mining of deposits at Las Conchitas is under review. The Las Conchitas EIS was received by MARENA on 11 July 2023. The Municipality of El Jicaro has authorized Nicoz to temporarily close municipal roads and to create alternate access roads as required for exploitation of deposits at Las Conchitas.
|
El Jicaro Concession
The El Jicaro Exploration Environmental Permit was issued by MARENA to Gold Belt S.A. by Administrative Resolution DGCA-P0028-0812-023-2013, (Geological Exploration El Jicaro) on December 3, 2013. The El Jicaro environmental permit specifies 331 diamond drillholes or 100,000m and 400 trenches with dimensions of 50m to 70m long, 2m deep and 1m wide.
The El Jicaro Exploration Environmental Permit is valid until May 20, 2026.
La Segoviana
The La Segoviana environmental permit was issued by MARENA to Nicoz Resources S.A. by Administrative Resolution DGCA-270521-P1536/036/2021, (Geological Exploration La Segoviana) on December 17, 2021. The permit is valid for 10 years and is renewable for up to an additional 20 years. The Company is now permitted to drill up to 1,100,000m as follows: 500,000m of diamond drilling; 300,000m of RC drilling; and 300,000m of blast hole drilling. The Company is also permitted to carry out up to 32,500m of trenching.
Potrerillos Concession
The Potrerillos environmental permit was issued by MARENA to Nicoz Resources S.A. by Administrative Resolution DGCA-260221-P1177/-25/2021, (Geological Exploration Potrerillos) on November 15, 2021. Starting from November 15, 2021, the permit is valid for 10 years and is renewable for up to an additional 20 years. The Company is now permitted to drill up to 800,000m as follows: 250,000m of diamond drilling; 250,000m of reverse circulation ("RC") drilling; and 300,000m of blast hole drilling. The Company is also permitted to carry out up to 12,000m of trenching.
|
5.0 ACCESSIBILITY, CLIMATE, LOCAL RESOURCES, INFRASTRUCTURE, AND PHYSIOGRAPHY (ITEM 5)
The information summarized in this section is derived from publicly available sources, as cited. The authors have reviewed this information and believe this summary is materially accurate.
5.1 ACCESS TO PROPERTY
Access to the property from Managua City, the national capital and closest international airport, is via the Pan American Highway (Highway CA-1) 193km to the paved road Highway CA-6, then continuing another 20km north to Ocotal City. From Ocotal City one travels the paved road, Highway NIC-29, 33km east, and then turns onto paved road NN-16 on which one continues for 13km east to the town of Susucayan. At Susucayan NN-16 becomes the paved road NIC-55, which continues another 7km north to the village of El Jicaro. From El Jicaro, a well maintained dirt road leads to the San Albino project. The drive time to the project from Mako's offices in El Jicaro is typically 15 to 20 minutes.
The surface rights as described in Section 4.0 are sufficient for the mining and exploration activities proposed in this report. The authors are not aware of any concerns that would prevent access to the property.
5.2 CLIMATE
The climate in Nicaragua is tropical. Mining and exploration can be conducted year-round. The area experiences dry and rainy seasons. The dry season runs from December to May during which there is virtually no rain. The rainy season begins in late May; it often rains once a day for generally short periods of time. The heaviest rains usually occur in September and October and can bring strong tropical downpours. Temperatures are warm to hot throughout the year and show very little variability (Table 5-1).
|
Table 5-1 Climate Data for El Jicaro, Nicaragua
(modified from https://en.climate-data.org/, 2020)
| Month | Jan | Feb | Mar | Apr | May | Jun | Jul | Aug | Sep | Oct | Nov | Dec |
| Average Min. Temperature (°C) | 15.8 | 15.9 | 16.8 | 18 | 19.2 | 19.3 | 19.1 | 18.9 | 18.8 | 18.8 | 17.3 | 16.4 |
| Average Max. Temperature (°C) | 28.5 | 29.6 | 31.2 | 32 | 31.9 | 29.9 | 29.3 | 29.2 | 29.5 | 29.5 | 28.6 | 28.1 |
| Precipitation (mm) | 24 | 7 | 4 | 66 | 87 | 255 | 178 | 169 | 226 | 201 | 74 | 33 |
5.3 PHYSIOGRAPHY
The San Albino property lies in an area of moderate to steep relief with elevations at the property mainly ranging from 450 to 650 meters above sea level. In the northern portion of the San Albino-Murra concession the elevation reaches up to 1,218m above sea level and the highest elevation within the La Segoviana concession is 1,250m above sea level. Soil cover is usually less than half a meter with saprolite development grading into oxidized rock beneath. The active weathering environment means that rock outcrops are rare in the hilly areas and more common in the drainages. Vegetation ranges from dense tree cover to thick brush and undergrowth. Most of the developed land is devoted to small-scale farming of crops or pasture for cattle.
5.4 LOCAL RESOURCES AND INFRASTRUCTURE
Nicaragua has moderately well-developed infrastructure including a network of roads, communications, airports, and seaports. The area has a long history of small-scale mining and Nicaragua has several active mines elsewhere in the country. A skilled work force is available by ground transport from Managua, about 200km to the south, and other, closer towns within the country. Many of the geologists working at the San Albino project studied geology at the university in Managua.
Electrical power for the San Albino project can be obtained from the national grid system that passes less than one kilometer from the San Albino deposit (Puritch, et al., 2015). Mako's camp and office facilities in El Jicaro are supplied from the grid, however the processing plant relies on its own diesel generators for power. Mako is currently mining the San Albino deposit and thus has trackhoes, bulldozers, haul trucks, and blast hole drills onsite and additional heavy equipment is available to be contracted locally. Water for drilling is readily available from the El Jicaro, Murra, and Susucayon rivers as well as several creeks that flow through the property year-round. Mako has developed tailings storage areas, waste-rock disposal areas, and processing sites within the property for the San Albino deposit and there are adequate locations for developing tailings storage areas, waste-rock disposal areas, and processing sites for the Las Conchitas deposit.
|
6.0 HISTORY (ITEM 6)
This section is modified from Puritch et al. (2015) and MDA (2020) which drew on the information summarized by Puritch et al. (2013), Kowalchuk (2011), and Price (2009). Dr. Gray has reviewed this information and believes it is a materially accurate summary of the history of the San Albino project.
The early history of the property was summarized by Peale (1948). Gold-quartz vein mineralization was discovered at the San Albino project area (Figure 6-1) around 1790 by Spaniards during placer mining activities on the Rio Cocos. Spaniards initially mined gold at the San Albino deposit from an open pit and subsequently by underground methods. Flooding eventually stopped the early work. From 1885 to 1926 and possibly into the 1930s, the property was worked by several operators. The last significant work was from 1922 to 1926, when Charles Butters, an American metallurgist, built a mill on site and mined approximately 3,000 tons. The operation was seized in 1926 by Augusto Sandino, leader of the Nicaraguan revolution.
Historical mining and production at the El Jicaro concession (Figure 6-1) was centered primarily in the El Golfo area, which was mined for gold by the Spaniards in the 18th century. Later mining was by underground methods until 1915 when a flood destroyed a wooden dam and part of the mill.
The historical exploration and mining at the San Albino project area, prior to the work of the issuer of this report, is summarized in Table 6-1, from Price (2009), Kowalchuk (2011), Puritch et al. (2013) and sources cited therein.
|
Figure 6-1 Areas of Historical Exploration, San Albino Project
(from Mako, 2020; grid lines at 5km for scale)
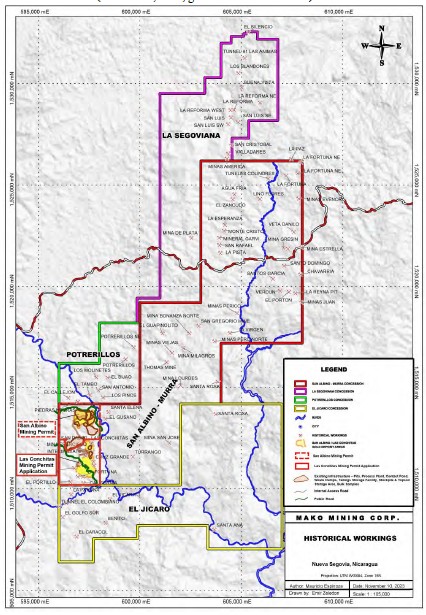
|
Table 6-1 Historical Exploration and Mining of the San Albino project
| Year | Company | Exploration |
| 1885-1899 | Ramon Raudales | Reportedly mined 12,000 tons of material at an estimated recovery of $12.00/ton and an estimated head grade of $15/ton. |
| 1899-1906 | San Albino Mines Ltd. |
2,000 tons of material, that averaged $17.00/ton, was mined from stopes and pillars. |
| 1906-1912 | Jicaro Gold Estates Ltd. |
11,000 tons of "ore", valued at $7.00/ton was mined from pillars and dumps. |
| 1912-1920 | John May and G.J. Williams |
Mined 7,000 tons at an estimated value of $11.00/ton. 1,500 tons was stoped and the remainder was taken from development and pillars. |
| 1922-1926 | Charles Butters | Heavy mill equipment brought to property, small production of about 10 tons per day. Dam built on the El Jicaro River for power. 3,000 tons mined. |
| 1926 | Augusto Sandino | Took over the mine with the miners and milled the 3,000 tons of stockpiled material previously mined by Charles Butters. |
| 1935 | New York and Honduras Rosario Mining Co. |
Sampling conducted on the 400 level. |
| 1938 | General Anastasio Somosa |
Intermittent operations in late 1930s and early 1940s. Closed down after the hydroelectric dam on the El Jicaro river was lost. No production records exist. |
| 1948 | Luis Somosa | Property inspected by Rodgers Peale, a mining consulting engineer, who wrote a compilation report of work done to 1948. |
| 1981 | The historic San Albino mine plant was burned down by Sandinista revolutionaries and the remains of the mill equipment were scattered at the plant site. | |
| 1996 | Western Mining Corporation |
The 200L, 400L and Naranjo cross cut were channel sampled at 1.5m intervals. The 300L cross cut was reopened for a distance of 87m but didn't reach the 300L main drift. The 300L cross cut was channel sampled at 1.5m intervals from the entrance to 44.2m. |
| 1996-1997 | Western Mining Corporation |
Conducted the first modern exploration on the Quilqli-Murra concession, an area covering 106,600 hectares, which included the 8,700 hectares that later became the San Albino-Murra mining concession. Exploration work included a stream-sediment survey, and rock chip and soil sampling. Two shallow, vertical holes were drilled. |
| 1997-2006 | Resources and Mining S.A.; Pila Gold Ltd |
Reopened old cross-cuts at different levels but could not reach the main drift. A soil survey and shallow core drilling were done at the San Albino hanging wall. Geological mapping, rock, soil, stream-sediment and trench sampling were conducted. |
| 2006-2009 | Condor Gold Plc. | Excavated and sampled 75 trenches totaling 2,250m; collected 1,100 rock and soil samples, and drilled 22 RC and two core holes. |
|
6.1 MODERN-ERA EXPLORATION HISTORY
Modern-era exploration began in the late 1990s and was focused on the San Albino and Arras veins, within the San Albino deposit area shown in Figure 6-1. Other significant prospects and workings are shown as well.
6.1.1 1996-1997 WESTERN MINING CORPORATION
Western Mining conducted the first modern exploration from 1996 to 1997 on the Quilali-Murra exploration concession, which included the San Albino-Murra concession. Work included stream-sediment and rock chip sampling over the San Albino-Murra concession area. Soil samples were collected on 500m intervals along trails and footpaths crossing the area. Two vertical core holes were drilled to shallow depths. The details of this drilling are summarized in Section 10.2.1.
6.1.2 1997-2006 RESOURCES AND MINING S.A.
In 1997 through 2006, Resources and Mining S.A. ("REMISA") controlled the property and focused its efforts on the historical San Albino mine. REMISA reopened historical cross-cuts at different levels but could not reach the main drift. An unknown number of shallow core holes were drilled, as discussed further in Section 10.2.2. Additionally, soil samples and rock chip samples were collected.
6.1.3 2003 PILA GOLD LTD.
During the second half of 2003, Pila identified and mapped 350 showings of mineralization, and collected 893 rock samples, 189 soil samples, and 43 silt samples from the San Albino vein and adjacent Murra area. Pila hand-excavated and sampled 24 trenches. Most work was concentrated in the Las Conchitas area and the historical San Albino mine.
6.1.4 2006-2009 CONDOR GOLD PLC.
In 2006 to early 2009, Condor Gold Plc. ("Condor") focused its exploration on the San Albino and Arras vein areas of the property (Figure 6-1). Condor collected 2,398 samples from 75 trenches totaling 2,250m. A total of 694 samples were taken from a total of 584m in 82 road cuts. Condor mapped or inspected 246m of eight adits from which 246 samples were taken. Also, 1,100 rock chip and soil samples were taken. Twenty-two reverse circulation ("RC") drillholes and two RC holes finished with core tails, having a cumulative total of 2,754m, were drilled at the Arras and San Albino veins. The details of this drilling are summarized in Section 10.2.3.
|
6.1.5 2009-2018 GOLDEN REIGN RESOURCES, LTD.
Golden Reign Resources, Ltd. ("Golden Reign") acquired the San Albino-Murra concession in 2009. In 2018, Golden Reign merged with Marlin Gold Mining Ltd. ("Marlin") to form Mako Mining Corp. The exploration conducted in 2009 through 2018 by Golden Reign (now Mako) is summarized in Section 9.0 together with Mako's exploration in the period 2019 to 2023 to the effective date of this report.
6.2 HISTORICAL MINERAL RESOURCE ESTIMATES
The authors are aware of five historical resource estimates for the San Albino project, which includes the adjacent, historical San Albino and Arras underground workings. These workings were formerly identified as separate mines (the San Albino and Aguja de Arras mines). These estimates are relevant for historical completeness.
6.2.1 1948 PEALE HISTORICAL ESTIMATE, SAN ALBINO AND ARRAS
A historical resource estimate for what were then known as the San Albino and Aguja de Arras mines was reported by Peale (1948) and is shown in Table 6-2 This estimate combined mapping and sampling work at Aguja de Arras by that author, Rogers Peale, along with past work by Charles Janin, who mapped, sampled, and assayed the San Albino and Aguja de Arras underground workings circa 1934, and a 1921 report written by A.W. Newberry for Charles Butters. The current mineral resources for the San Albino project are discussed in Section 14.2.
Table 6-2 Historical 1948 Resource Estimate, San Albino and Aguja de Arras Mines
(modified from Peale, 1948)
| Mine | Tons | Vein Width (feet) |
Value* (USD/ton) |
US$** |
| San Albino | 80,486 | 8.5 | 18.60 | 1,497,151.55 |
| Aguja de Arras | 1,981 | 4.0 | 25.81 | 51,133.50 |
| GRAND TOTAL | 82,467 | 8.4 | 18.77 | $ 1,548,285.05 |
| *The price of gold in 1948 was $35/oz; **1948 dollars | ||||
The authors have not done sufficient work to classify the historical estimates summarized in Table 6-2 as current mineral resources or mineral reserves, which are relevant only for historical context, and Mako is not treating these historical estimates as current mineral resources or mineral reserves. The classification terminology is presented as described in Price (2009) and these terms do not conform to the Measured, Indicated, and Inferred Mineral Resource classifications as set out in the CIM Definition Standards. The authors are unaware of the key assumptions, parameters, and methods used to prepare the historical estimates.
|
Accordingly, these estimates should not be relied upon. The current mineral resources for the San Albino project are discussed in Section 14.2. The value of mineralized material in the Peale estimate was calculated based on a gold price in 1948 of $35 per troy ounce. The historical San Albino mine workings were not accessible at the time of Price's visit in 2009.
Janin's original maps (1934) and cross sections are archived at the Huntington Library in San Marino, California. Additional data from Janin's (1934) work at the San Albino mine are held in the Thayer Lindsley Collection at the University of Wyoming. Copies from both libraries were obtained by Mako personnel. The present authors have not assessed these historical records.
6.2.2 2008 ARRAS MINE HISTORICAL RESOURCE ESTIMATE
In 2008, Geosure Geological Consultants of Australia completed a resource estimate for the Arras vein about 0.5km southeast of the historical San Albino underground mine for Condor (Montgomery, 2008) as summarized in Table 6-3. The estimate was apparently based upon sampling from 15 drillholes and an unspecified number of trenches. At the time of the estimate, Condor was in an earn-in agreement with Nicoz Resources S.A., a private Nicaraguan company.
Table 6-3 Geosure 2008 Historical Resource of the Arras Mine
(from Montgomery, 2008)
| Cutoff Grade g Au/t |
Tonnes | Average Grade g Au/t |
Contained Ounces Au |
| 0.5 | 480,000 | 5.1 | 78,000 |
| 0.8 | 410,000 | 5.8 | 77,000 |
| 1.0 | 390,000 | 6.1 | 76,000 |
The authors have not done sufficient work to classify the 2008 historical estimate summarized in Table 6-3 as current mineral resources or mineral reserves, which are relevant only for historical context, and Mako is not treating these historical estimates as current mineral resources or mineral reserves. The key assumptions, parameters, and methods were given in Montgomery (2008). The resources were classified as Inferred by Montgomery (2008) due to several "significant risk" factors including low data density, lack of geologic understanding, and poor data quality. The current mineral resources for the San Albino deposit are discussed in Section 14.2.
6.2.3 SAN ALBINO 2013 HISTORICAL RESOURCE ESTIMATE, P & E CONSULTANTS, INC.
In 2013, P & E Consultants of Toronto, Ontario performed a resource estimate for the San Albino project (Table 6-4) that was presented in the Technical Report of Puritch et al. (2013). The resource estimate included the San Albino, Naranjo, and Arras vein systems, a series of stacked, shallowly west-dipping veins. The estimate was based on data from 154 core holes and 12 trenches, and included 16,798 samples containing gold and silver assays. With some exceptions, according to Puritch et al. (2013), the resource estimate included only vein domains that showed spatial and geologic continuity at or greater than 1.5g Au/t, and domains were generally not permitted to extend beyond 25m of drillhole piercements. Individual blocks in the block model measured 2m (x-direction) by 6m (y-direction), by 2m (z-direction). The estimate was based on a gold price of $1,592/oz and a silver price of $32/oz.
|
Table 6-4 P & E 2013 San Albino Historical Resource Estimate
| Open Pit Resource Estimate at 0.50 g AuEq/t Cutoff Grade | |||||||
| Classification | Tonnes | g Au/t | g Ag/t | g AuEq/t | Au (oz) | Ag (oz) | AuEq (oz) |
| Indicated | 247,000 | 9 | 10.8 | 9.18 | 71,000 | 86,000 | 73,000 |
| Inferred | 682,000 | 8.25 | 10.7 | 8.42 | 181,000 | 234,000 | 185,000 |
| Underground Resource Estimate at 1.50 g AuEq/t Cutoff Grade | |||||||
| Classification | Tonnes | g Au/t | g Ag/t | g AuEq/t | Au (oz) | Ag (oz) | AuEq (oz) |
| Indicated | 101,000 | 6.59 | 9.7 | 6.76 | 21,000 | 31,000 | 22,000 |
| Inferred | 2,689,000 | 7 | 10.6 | 7.17 | 605,000 | 912,000 | 620,000 |
| Total Open Pit and Underground Resource Estimate | |||||||
| Classification | Tonnes | g Au/t | g Ag/t | g AuEq/t | Au (oz) | Ag (oz) | AuEq (oz) |
| Indicated | 348,000 | 8.3 | 10.5 | 8.47 | 92,000 | 117,000 | 95,000 |
| Inferred | 3,371,000 | 7.25 | 10.6 | 7.43 | 786,000 | 1,146,000 | 805,000 |
The authors have not done sufficient work to classify the historical estimates in Table 6-4 as current mineral resources or mineral reserves. The estimates in Table 6-4 are relevant only for historical context, Mako is not treating these historical estimates as current mineral resources or mineral reserves, and these estimates should not be relied upon. Although Puritch et al. (2013) used the CIM Definition Standards to classify the mineral resources, these historical resources have been superseded by the current mineral resources discussed in Section 14.2.
6.2.4 2015 SAN ALBINO HISTORICAL RESOURCE ESTIMATE, P & E CONSULTANTS, INC.
P & E Consultants provided another resource estimate in 2015 following more drilling and trenching by Golden Reign (now Mako). These are reported in the Technical Report by Puritch et al. (2015) and summarized in Table 6-5. The 2015 estimate included 193 drillholes (177 core holes and 16 RC holes) and 36 trenches, which collectively contained 26,654 gold assays and 25,422 silver assays. A total of 11 mineral domains were used, each of which were, according to Puritch et al. (2015):
|
"defined by continuously mineralized structures along strike and down dip, and assay intervals equal to or greater than 0.75g AuEq/t for the potential open pit mining area, and 2.0g AuEq/t for the potential underground mining area using an optimized pit shell as a guideline."
Table 6-5 P & E 2015 San Albino Historical Resource Estimate
| Zone | CLASS | Cutoff | Tonnage | Au | Contained Au | Ag | Contained Ag |
AuEq | Contained AuEq |
|
| g AuEq/t | Tonnes | g/t | oz | g/t | oz | g/t | oz | |||
| In-pit | Oxide | Indicated | 0.75 | 485,000 | 6.26 | 97,700 | 12.9 | 200,700 | 6.40 | 99,900 |
| Inferred | 0.75 | 313,000 | 5.05 | 50,900 | 9.5 | 95,600 | 5.16 | 51,900 | ||
| Sulfide | Indicated | 0.75 | 171,000 | 9.59 | 52,700 | 12.2 | 67,000 | 9.77 | 53,700 | |
| Inferred | 0.75 | 567,000 | 7.74 | 141,100 | 10.82 | 197,700 | 7.90 | 144,000 | ||
| Subtotal | Indicated | 0.75 | 656,000 | 7.13 | 150,400 | 12.7 | 267,700 | 7.28 | 153,600 | |
| Inferred | 0.75 | 880,000 | 6.78 | 192,000 | 10.4 | 293,300 | 6.93 | 195,900 | ||
| Out of pit |
Oxide | Indicated | 2.0 | 9,000 | 3.36 | 1,000 | 5.3 | 1,500 | 3.41 | 1,000 |
| Inferred | 2.0 | 15,000 | 2.89 | 1,400 | 11.8 | 5,800 | 3.02 | 1,500 | ||
| Sulfide | Indicated | 2.0 | 13,000 | 3.57 | 1,500 | 6.4 | 2,700 | 3.66 | 1,500 | |
| Inferred | 2.0 | 2,172,000 | 8.51 | 594,400 | 13.7 | 955,200 | 8.72 | 608,700 | ||
| Subtotal | Indicated | 2.0 | 22,000 | 3.48 | 2,500 | 5.9 | 4,200 | 3.56 | 2,500 | |
| Inferred | 2.0 | 2,187,000 | 8.47 | 595,800 | 13.7 | 961,000 | 8.68 | 610,200 | ||
| Total | Oxide | Indicated | 0.75/2.0 | 494,000 | 6.21 | 98,700 | 12.7 | 202,200 | 6.35 | 100,900 |
| Inferred | 0.75/2.0 | 328,000 | 4.95 | 52,300 | 9.6 | 101,400 | 5.06 | 53,400 | ||
| Sulfide | Indicated | 0.75/2.0 | 184,000 | 9.17 | 54,200 | 11.8 | 69,600 | 9.34 | 55,200 | |
| Inferred | 0.75/2.0 | 2,739,000 | 8.35 | 735,500 | 13.1 | 1,152,900 | 8.55 | 752,700 | ||
| Total | Indicated | 0.75/2.0 | 678,000 | 7.01 | 152,900 | 12.5 | 271,800 | 7.16 | 156,100 | |
| Inferred | 0.75/2.0 | 3,067,000 | 7.99 | 787,800 | 12.7 | 1,254,300 | 8.17 | 806, 100 |
(1) The Ag:Au ratio used for Oxide Mineralization was 92:1, and 67:1 for Sulfide mineralization
Puritch et al. (2015) used a gold price of $1,404/oz and a silver price of $23.47/oz. The estimate was reported using a cutoff of 0.75g Au/t for open pit resources and 2.0g Au/t for underground resources. Although the Puritch et al. (2015) estimate used the CIM Definition Standards to classify the mineral resources, the authors have not done sufficient work to classify the historical estimates summarized in Table 6-5 as current mineral resources or mineral reserves. The 2015 estimates are relevant only for historical context, Mako is not treating these historical estimates as current mineral resources or mineral reserves, and these estimates should not be relied upon. These historical resources have been superseded by the current mineral resources discussed in Section 14.2.
 |
6.3 HISTORICAL PRODUCTION
The earliest exploitation is considered to have taken place during the Colonial era in the late 1700s, although no records of production are known from that time. More recent, albeit incomplete production records are known from underground mining during 1885 through 1926 under several operators (Peale, 1948). The estimated gold production from the historical San Albino mine, based on these records, is about 18,200 ounces as summarized in Table 6-6. The authors have no information on the production from the historical El Golfo mine in the El Jicaro concession.
Table 6-6 Historical Gold Production, San Albino Underground Mine
(modified from Peale, 1948)
| Years | Owner | Mined Tons | Recovered Grade US$/ton |
Approximate Production Au* (oz) |
| 1885-1899 | Ramon Raudales | 12,000 | $12.00 | 7,000 |
| 1899-1906 | San Albino Mines Ltd. | 2,000 | $17.00 | 1,600 |
| 1906-1912 | Jicaro Gold Estates Ltd. | 11,000 | $7.00 | 3,700 |
| 1912-1920 | John May and G.J. Williams | 7,000 | $11.00 | 3,700 |
| 1922-1926 | Charles Butters | 3,000 | 15 | 2,200 |
| Total | 35,000 | 10.8* | 18,200 |
| *Using the pre-1935 gold price of $20.67/oz. |
6.4 PRODUCTION BY MAKO, 2021 TO 2023
Mako commissioned the San Albino mill on May 12, 2021 and declared commercial production on July 1, 2021. From May 12, 2021 through September 30, 2023; 84,636 Troy ounces of gold have been produced from the San Albino deposit, from 433,394 tonnes milled at an average grade of 7.34 g Au/t, with average gold recovery of 82.7%.
|
7.0 GEOLOGIC SETTING AND MINERALIZATION (ITEM 7)
The information presented in this section of the report is derived from multiple sources, as cited, and is based on the compilation presented by MDA (2020) and supplemented by post 2020 geologic studies. The authors have reviewed this information and believe this summary accurately represents the San Albino project geology and mineralization as it is presently understood.
7.1 REGIONAL GEOLOGIC SETTING
Northwestern Nicaragua, which includes the San Albino project area, is partly underlain by arc-related sedimentary rocks. These strata are included into the Chortis Block ("CB"), which includes pre-Cenozoic basement rocks ranging in age from Proterozoic through middle Mesozoic in neighboring Honduras, El Salvador, and Guatemala. The CB includes the only exposed cratonic basement of the Caribbean Plate (Rogers et al., 2007). Regional correlations suggest some CB strata were deposited along the continental margin of the North American plate after its separation with South America (Burianek and Dolnicek, 2011).
The eastern part of the CB in southern Honduras and adjacent northwestern Nicaragua comprises a regionally metamorphosed Jurassic sedimentary sequence that also includes tectonic inliers as old as Paleozoic (Mann, 2007). The eastern CB is separated from older rocks of the central CB in Honduras by the northeast-striking Guayape fault, a major Quaternary sinistral-slip fault. Regional metamorphism in the eastern CB ranges from lower greenschist through amphibolite facies, although the youngest strata commonly lack metamorphic textures. An important and widely distributed unit in the Honduras part of the eastern CB is the Middle Jurassic Agua Fría Formation, which is at least 1.7km thick and consists of metamorphosed marine turbidites, as well as conglomerate and sandstone, and scarce carbonate strata. The Agua Fría was subsequently correlated by Burianek and Dolnicek (2011) with rocks exposed in northwestern Nicaragua, including the San Albino project area. Viland et al. (1996) suggests regional metamorphism and contractional deformation in the Agua Fría Formation predate late Cretaceous overlap strata (Mann, 2007; Rogers et al., 2007).
Rocks of the eastern CB in northern Nicaragua were intruded by Cretaceous granitic rocks including the >800km2 Dipilto batholith, which yielded variable isotopic ages of between 83 and 140 Ma (Rogers et al., 2007; Burianek and Dolnicek, 2011). Importantly, the oldest batholith age constrains deformation and regional metamorphism in the intruded wall rocks to between late Jurassic and earliest Cretaceous (Rogers et al., 2007). Cretaceous granitoids of northern Nicaragua range from cordierite-bearing granite to calc-alkaline tonalite and granodiorite with less abundant diorite and gabbro. A contact metamorphic aureole up to a few kilometers wide extends beyond the Dipilto batholith, further obscuring original wall rock textures and making correlation difficult.
|
Rocks of the CB and Cretaceous plutons are largely buried by thick and laterally extensive arc-related volcanic rocks of Neogene age in northwestern Nicaragua, except for some areas of Nueva Segovia. Neogene volcanic rocks comprise a continuous northwest-trending belt about 80km wide in western Nicaragua that lies about 40km east of the modern volcanic arc. The two arcs are separated by the Nicaraguan Depression, a major arc- parallel valley (McBirney and Williams, 1965). Volcano-sedimentary rocks associated with Neogene volcanism extend over a much broader region of the country. Equivalent volcanic and volcaniclastic rocks unconformably overlie deformed and metamorphosed rocks of the CB about 15km southeast of the San Albino project.
The regional geologic setting of the property is shown in Figure 7-1. The gold deposits of the San Albino project are situated ~three kilometers east of the east-central edge of the exposed Dipilto batholith.
Figure 7-1 Regional Geologic Setting of the San Albino Project
(from Mako, 2020)
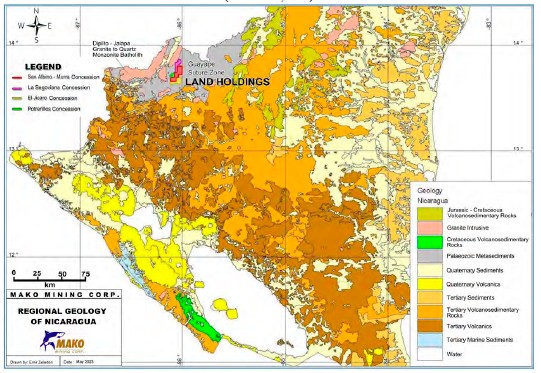
|
7.2 PROPERTY AND PROJECT AREA GEOLOGY
The San Albino property is situated in mountainous terrain along the southeast flank of the Dipilto-Jalapa Mountains, the highest range in Nicaragua. The core of the range consists of granitoids of the Dipilto batholith. On the flanks of the range, west and north of the property, the Dipilto batholith intruded phyllite and carbonaceous schist. These deformed and variably metamorphosed, originally fine-grained basinal strata underlie most of the property and have been assigned to the probably Paleozoic Palacaguina Formation and related units (Sundblad et al., 1991) or, more recently, to the mid-Jurassic Agua Fría Formation and equivalent units (Rogers et al., 2007; Burianek and Dolnicek, 2011; Viland et al., 1996).
Nearly all of the property is underlain by schist and phyllite that Mako geologists assign to the Agua Fría Formation. The phyllite likely is of volcaniclastic derivation (Kowalchuk, 2011). Figure 7-2 shows the geology of the San Albino-Murra concession, which is the portion of the project where the San Albino and Las Conchitas deposits are located.
|
Figure 7-2 Geologic Map of the San Albino-Murra Concession, San Albino Project
(from Mako, 2020)
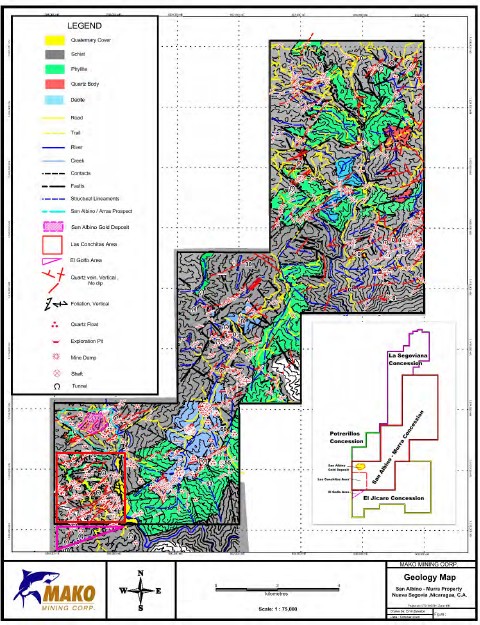
|
Rocks at the project consist of black, occasionally carbonaceous argillite or metapelite (i.e., locally termed "graphitic schist") derived from shale protoliths. We use the term carbonaceous argillite instead of graphitic schist in describing unoxidized host rocks in the San Albino and Las Conchitas area based on preliminary metallurgical testing that indicates most carbon is of lower maturity than graphite (Puritch et al., 2015). Outboard of the historical mine areas and argillite exposures, quartz-muscovite phyllite (i.e., locally termed "gray phyllite") is predominant.
Southeast vergent folds and thrusts have been recognized within the meta-sedimentary rocks of the San Albino property. Regional metamorphism and deformation are thought to predate the Dipilto batholith (Rogers et al., 2007; Burianek and Dolnicek, 2011). The schistose foliation is attributed to shortening that preceded emplacement of the Dipilto batholith.
The earliest structures affecting metamorphic rocks in the immediate San Albino deposit area include: 1) northeast-striking, shallowly to moderately northwest-dipping faults and more broadly distributed shear zones; 2) subparallel open to tight folds, and 3) steeply dipping northeast- and northwest-striking faults These observations were originally reported by Goerse (1996) and were later summarized in Kowalchuk (2011).
The meta-sedimentary rocks at the San Albino deposit are cut by dikes of intermediate composition that strike, in part to the northeast, subparallel to the prevailing foliation in the meta-sedimentary rocks and to the contact with the Dipilto batholith. However, the age and relationships of these dikes to exposed granitic rocks of the Dipilto batholith and to the regional metamorphism and deformation are not known.
7.3 MINERALIZATION
The principal commodity exploited in the historical San Albino and nearby mines was gold, which was extracted from both placer workings and quartz-bearing lodes sporadically since the Spanish Colonial period (Roberts and Irving, 1957). Silver accompanies gold at the San Albino deposit, but its economic significance is relatively low.
Lode gold deposits at the San Albino project are largely hosted in shallow- to moderate-dipping, northeast- striking quartz veins and thin vein margins concordant with the metamorphic fabric developed in carbonaceous schist (English, 2009). The gold-bearing quartz veins dip to the west and appear to be localized in zones that show greater degrees of strain than surrounding argillite, suggesting these dominant veins are shear-parallel veins (or, "shear veins"), although the similarity in footwall and hanging wall rocks suggests modest displacement.
|
7.3.1 SAN ALBINO DEPOSIT
Mining at the historical San Albino mine occurred on three separate vein systems: Arras, Naranjo, and San Albino. Subsequent exploration drilling and mine development by Mako confirmed that the three gold-bearing vein systems exhibit down dip continuity and comprise a stacked set of subparallel veins, with a regular spacing of about 90m between the veins (Figure 7-3). The shear-hosted quartz veins dip on average about 40° northwest, but dips range from nearly flat to about 60°. Veins pinch-and-swell (i.e., boudinage) in both their dip and strike directions but, commonly, thicker shear-hosted vein intervals and higher-grade gold in workings of the historical San Albino mine appear to be in "flats" flanking antiformal fold hinges or "crests" in the foliation.
Figure 7-3 3D Rendering of the San Albino Deposit Veins
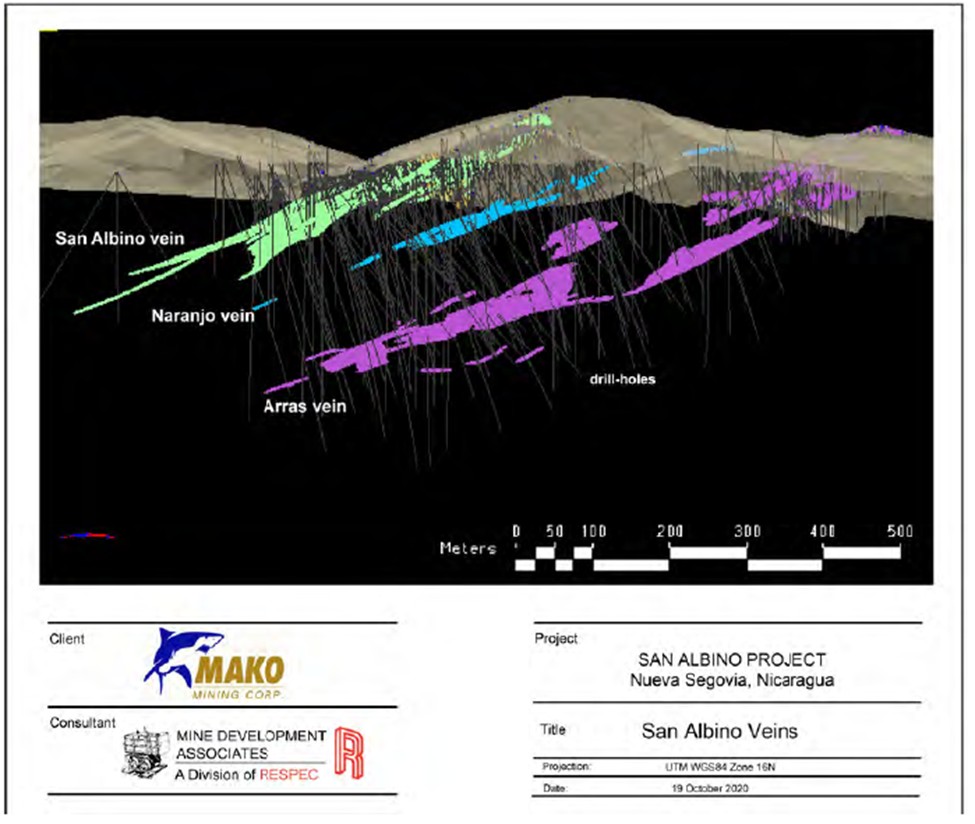
|
Much thinner veins, commonly with steeper orientations that cut foliation, occur in the footwall and hanging wall of the principal shear-hosted veins. These gold-bearing veins are consistent with extensional veins. Extensional veins or veinlets commonly occur proximal to the shear-hosted veins, and they may also form late brittle quartz-filled fractures within the shear veins themselves. At San Albino, such extensional veins are developed mainly within a 1.0m rind adjacent to the primary shear-hosted veins; the extensional veins cut foliation and thereby exhibit greater degrees of folding.
The principal components of the San Albino deposit are the San Albino, Naranjo, and Arras quartz veins, as well as the smaller El Jobo vein. Quartz veins at the San Albino deposit have distinctive characteristics according to Gray (2019), who distinguished six vein types based on their mineralogy, texture, and geographic location. Observations made during the March 2023 review led to a re-assessment of conclusions reached in 2019 about vein styles and mineralization events. New observations confirm that contrasting textural, mineralogic, and geochemical characteristics are evidence of multiple vein forming events, of which two types at the San Albino deposit are gold mineralized and of significance to the mineral resource (Gray, 2023):
1. Quartz Sulfide ("QS") veins: multi-stage crack-seal veins, gold and silver mineralized, late syn- deformation, weakly deformed, concordant, banded, styolitic. San Albino is archetype and Arras and Naranjo belong to this vein type. These are early stage compact quartz veins described as mottled grey- white, with color variation sometimes defining weak banding; styolitic banding or ribbon vein texture is almost always present (Figure 7-4, Figure 7-5), most commonly at margins; visible gold is common as submillimeter scale blebs in quartz not associated with microfractures or sulfides. If not overprinted by the later Sulfide Veins and Stringers ("SVS") event, the QS veins have relatively low sulfide content, Au:Ag ratio of approximately 1:1, with minor As. In general, the QS veins are milky white but vary based on the degree of deformation observed, sulfide and carbonate contents, degree of banding, and gold contents. In addition to diagnostic milky quartz, the QS veins commonly contain ankerite and/or siderite, possibly albite, and variable amounts of sulfide minerals up to 3% by volume. The sulfide grains are generally paragenetically late and consist of pyrite, arsenopyrite, galena, and sphalerite, which form web- like veinlets and clots as well as more regular bands within milky quartz.
|
Figure 7-4 San Albino Vein Exposed in West Pit
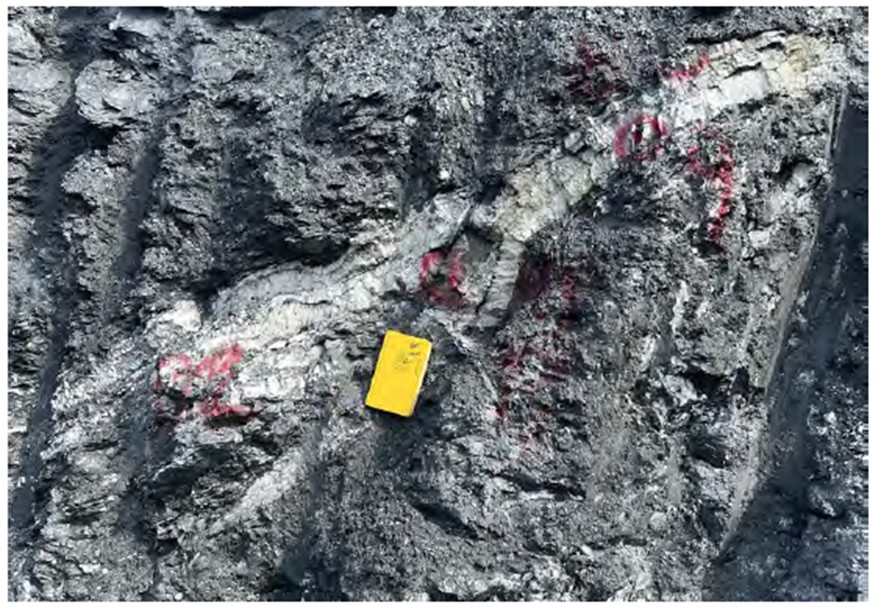
Figure 7-5 San Albino Vein Drill Core Exposure SA12-46, 73m
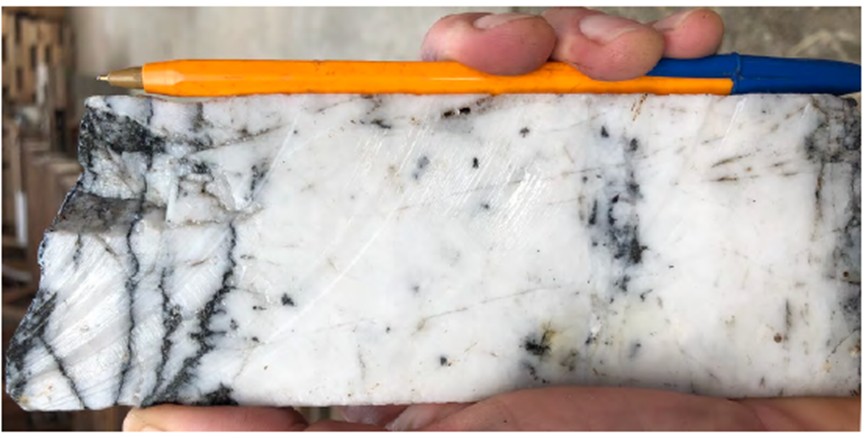
2. Sulfide Veins and Stringer ("SVS") comprises later Au-Ag-Pb-(Zn) mineralization. SVS occurs as sulfide bands, stringers, and impregnations in fractured, earlier-stage QS quartz veins (Figure 7-6); as sulfide impregnations in breccia and gouge zones in hanging wall (most often) and footwall (not common) in tectonized vein zones sometimes without appreciable quartz veining; and as sulfide bands or veins; relatively Ag rich, Au:Ag <1. Visible gold may be present as discrete blebs contained in quartz or less commonly in sulfides.
|
Figure 7-6 SVS Mineralization Overprinting QS Vein, San Albino, Drillhole SA12-48, Assayed 67.7 g Au/t, 96.6 g
Ag/t, 2.8% Pb, 1.8% Zn
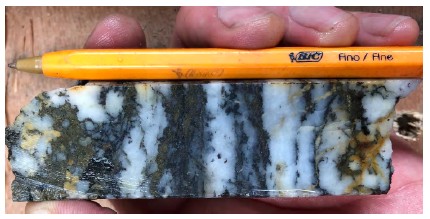
The supermajority of defined mineral resources at San Albino project are related to QS veins and SVS mineralization. A small but unquantified contribution of gold to the mineral inventory likely comes from local, discontinuous, discordant veinlets in the immediate margins of the QA and SVS vein zones.
Wallrock hydrothermal alteration associated with gold-bearing veins at San Albino is subtle. In saprolite, removal of carbon from argillite reveals abundant muscovite and minor chlorite (English, 2009) together with pyrite. However, it is unclear to what degree this alteration reflects primary or diagenetic effects, metamorphism, or late hydrothermal fluids. Below the weathered zone, wall rocks immediately adjacent to gold-bearing veins at the San Albino deposit have bleaching interpreted to be sericite alteration typical of many gold-bearing quartz vein-hosted systems in metamorphic rocks.
In summary, the following conclusions are drawn regarding the gold mineralization at the San Albino deposit based upon descriptions of the mineralized material, vein geometries, textures, and ore minerals:
/ Gold-bearing quartz veins were emplaced into shears (i.e., shears defined as brittle-ductile faults associated with metamorphism and contractional deformation);
/ Shears and their enclosed veins have corrugated or anastomosing geometries, and typically veins are pinch-and-swell type, with thicker intervals in "flats";
|
/ Milky colored, massive-textured veins are characteristic, most of which are concordant with foliation in enclosing metamorphic rocks;
/ "Ribbon quartz" is common and reflects shear-parallel crack-seal replacement processes wherein wallrock is incorporated during vein growth;
/ Visible gold is present; and
/ Gold occurs in association with generally low amounts (up to 3%) of pyrite, arsenopyrite, galena, and sphalerite in quartz veins.
/ Post mineralization compression has caused deformation and imbricate faulting of veins (Figure 7-4).
The mean gold concentration determined in 2020 (4,474 individual samples with >200ppb Au) from Mako's San Albino verified drillholes at the San Albino deposit is 7.16 Au g/t whereas the mean silver is 14.3 Ag g/t, yielding a relatively high Au:Ag ratio of 0.5. Copper in chalcopyrite was reported in the deeper workings of the historical San Albino mine, but no production records for copper are known (Roberts and Irving, 1957). The mean values of other metals from drilling at the San Albino deposit from Mako's drilling database (for Au>200ppb) are 95ppm Cu, 2,296ppm Pb, and 623ppm Zn. From composited drill samples wherein lead concentration was >500ppm, the average contents of metals and semi-metals are: 4,365ppm As, 0.8ppm Hg, 6.6ppm Sb, and 3.1ppm Tl. Gold and silver correlate moderately. Silver also correlates moderately with lead, and zinc correlates poorly with the other metals. These data support mineralogic information from drillhole core logging, surface sampling, and mining at the historical San Albino mine that indicate visible gold, probably as electrum, most commonly occurs in milky quartz veins in spatial association with pyrite, arsenopyrite, galena, and sphalerite. The moderate to poor inter-element correlations further suggest that although gold is spatially correlated with silver, lead, and zinc, the metals were partitioned differently among various ore minerals and therefore were deposited in differing amounts during more than one stage of mineralization.
Metallurgical testing discussed in Section 13.0, found that an average of 36% of gold reported to gravity concentration; with a total recovery from gravity and leach of about 95%. Over 90% of the gold occurs as native gold, or gold electrum, with only trace quantities in other gold minerals. The size of the gold grains averages 12.4 to 30 microns, with more than 50% coarser than 30 microns. Silver occurrences show 60 to 90% containment in the gold particles or gold minerals.
The low- and moderate-angle faults mentioned in Section 7.2 control the distribution of gold-bearing quartz veins. At the San Albino deposit, quartz vein-bearing shear zones up to several meters thick are stacked in subparallel fashion (e.g., San Albino, Naranjo, and Arras). The separation between shears and the enclosed veins averages about 90m. The shear-related veins and their enclosing faults have anastomosing, pinch-and- swell geometries. The continuity between shear zones and metamorphic foliation is consistent with a thrust- fault geometry, although no kinematic indicators are documented. Both quartz vein-bearing shears and early folds possibly were later folded; re-folded folds affecting schistose rocks are commonly overturned or even recumbent with southeast-directed vergence, whereas late folding of shear zones and veins produced discontinuous and broad, east-southeast vergent open folds (English, 2009; Kowalchuk, 2011).
|
High-angle faults that cut gold-bearing veins were summarized in English (2009) as having normal slip, with strikes that either are subparallel with, or nearly orthogonal to, earlier-formed low- to moderate-angle shear- hosted veins. The northeast-striking set of high-angle faults may also contain quartz veins and these possibly reflect extensional veins between shear strands. In contrast, no additional information exists on the timing and geometries of northwest-striking high-angle faults that are orthogonal to gold-bearing shear-hosted veins; possibly, these originated as tear faults developed by differential strain between thrust segments. Farther north in the Murra sector of the property, quartz-bearing shear zones with similarities to those at the San Albino deposit are flat-lying or have shallow dips to the east or southeast.
7.3.2 LAS CONCHITAS DEPOSIT
Mineralization at the Las Conchitas deposit is related to veins of the same mineralogic and structural style as those described at the San Albino deposit. In drillcore exposures mineralized zones from the two deposits are indistinguishable from each other. Both comprise early compact quartz veins (QS veins, Figure 7-7) and later Au-Ag-Pb-(Zn) mineralization (SVS, Figure 7-8). However, drillcore exposures indicate that many of the mineralized zones at Las Conchitas have undergone the same imbricate faulting observed at San Albino but with a greater thickness and degree of tectonic brecciation and cataclasis.
Grillo (2023) observed that the main gold-bearing structures have well developed hanging wall and footwall zones defined by breccias that correspond to boundaries of the low angle fault zones that controlled vein emplacement, and that felsic and andesitic dikes intrude the schists with two preferred orientations, northwest to southeast and east-northeast to west-southwest. The dikes are unmineralized and unfoliated thus appear to be relatively late features unrelated to mineralization.
|
Figure 7-7 QS Vein, Bayacun, Drillhole LC20-307, Assayed 13.5 g Au/t and 0.8 g Ag/t
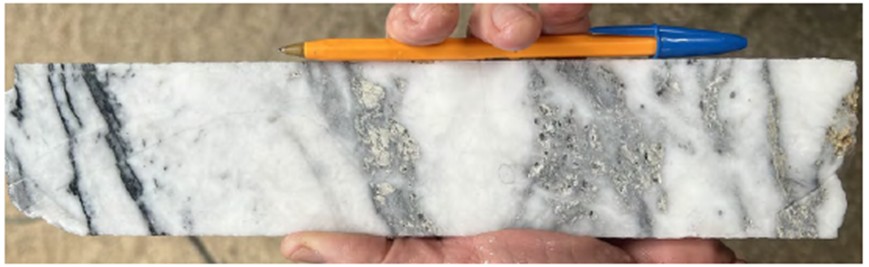
Figure 7-8 SVS Mineralization Overprinted on QS Vein, Mina Francisco, Drillhole LC22-549, Assayed 8.7 g Au/t
and 49.2 g Ag/t
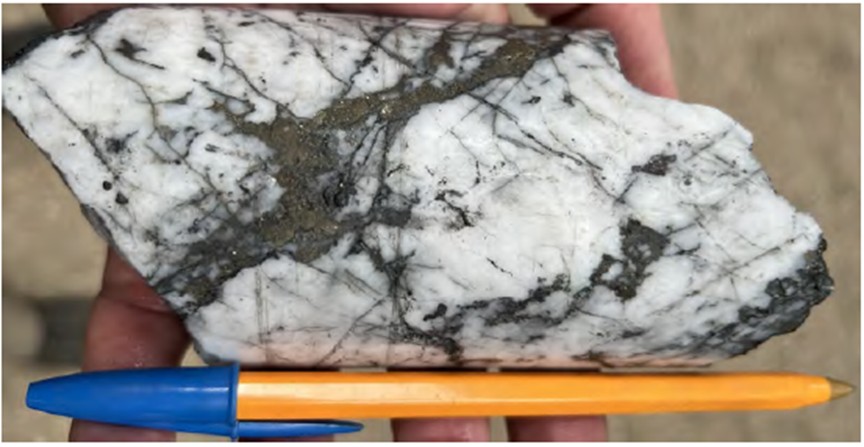
Modeling of mineralized veins at Las Conchitas has identified 15 principal veins as shown in Figure 7-9. Similar to the San Albino deposit, the Las Conchitas deposit veins are semi-parallel to each other and create a geometry of stacked veins with general strike northeast-southwest and dipping gently to the northwest.
|
Figure 7-9 3D Rendering of the Las Conchitas Deposit Veins
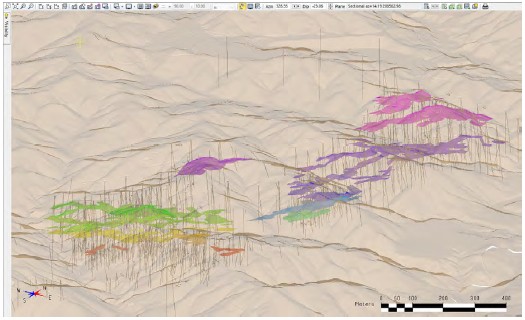
|
8.0 DEPOSIT TYPES (ITEM 8)
The information presented in this section of the report is derived from multiple sources, as cited, and is based on the compilation presented by MDA (2020) and supplemented by post 2020 geologic studies. The authors have reviewed this information and believe this summary accurately represents the San Albino project geology and mineralization as it is presently understood.
The mineralization in the San Albino project area is best interpreted in the context of an "orogenic gold" deposit model (e.g., Goldfarb and Groves, 2015) based on the association of gold mineralization with metamorphic host rocks, and the textures and mineralogy of the San Albino and Las Conchitas veins, the wallrock alteration, and the "gold-only" character of mineralization. Orogenic gold deposits are fundamentally linked with orogenesis, or collisional plate tectonic settings. Unlike many other base- and precious-metal deposit types that formed in the shallow crust, orogenic gold deposits have formed over great intervals of depth. As such, orogenic gold deposits vary widely in characteristics that reflect variable formation depth and therefore, variable degree of metamorphism (Figure 8-1).
|
Figure 8-1 Diagrammatic Orogenic Gold Deposit Model
(modified from Goldfarb and Groves, 2015; Groves, et al., 1998)
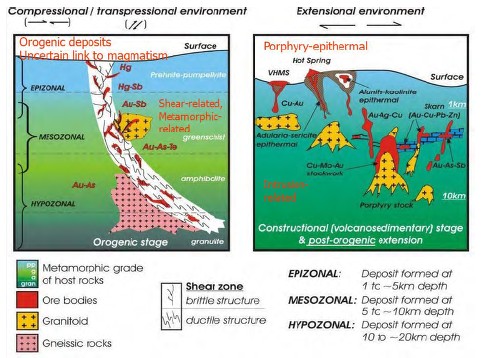
Orogenic gold deposits, although diverse in several respects because of their varied age and broad formation depth, share many characteristics that are used to define the class (e.g., Goldfarb and Groves, 2015; Bierlein et al., 2009; Goldfarb et al., 2005), which include: 1) an association with orogens, or collisional tectonic settings, 2) metamorphic host rocks, and typically rocks that have undergone greenschist- to lower amphibolite facies metamorphism, 3) deep-penetrating faults that transitioned between brittle and ductile conditions, 4) CO2-rich fluids thought to derive from prograde metamorphic processes, including dehydration and decarbonation reactions, 5) a gold-only character and worldwide association with placer camps. Textural and mineralogic features of orogenic veins include milky, coarse-grained quartz, common "ribbon" quartz reflecting vein growth through crack-seal mechanisms, replacement processes, quartz-sericite-carbonate wall rock alteration, and an association with small quantities of base metal sulfides, including galena and sphalerite.
The veins at the San Albino project share most of the important characteristics of orogenic gold deposits. The gold-bearing veins are not only hosted in lower greenschist-facies metamorphic rocks, but their geometries indicate that veins formed during contractional deformation. Other features that are distinctive of orogenic deposits present at the San Albino project include ribbon-textured shear-hosted veins containing milky quartz, visible gold, relatively high Au:Ag ratios (i.e., "gold-only"), low percentages of base metal sulfides including galena and sphalerite, and the presence of placer gold. Other features of orogenic deposits have yet to be confirmed including the presence of iron-rich carbonate (siderite or ankerite) and quartz-sericite alteration. The lack of recognized alteration assemblages may reflect the relatively low degree of metamorphism, which has retained a significant amount of organic carbon from the protoliths. The low degree of metamorphism (i.e., argillite host) and greater control by thrust faults at San Albino, rather than large-scale, steep-dipping shear zones, is similar to orogenic gold deposits that formed in higher levels of orogens. Examples of geologically analogous high level orogenic gold deposits include Juneau, Alaska; Muruntau, Uzbekistan; and Paracatu, Brazil.
|
Monecke et al. (2022) conducted petrographic and fluid inclusion studies of mineralized veins from the San Albino and Las Conchitas deposits and surrounding vein exposures to determine conditions of formation. They interpreted that the results of reconnaissance microthermometry were consistent with sublithostatic conditions prevailing, beginning at ~285°C at ~10 km (1 kbar), after the bulk of the quartz formed at higher temperatures under ductile conditions, and that sphalerite and galena deposition was established later by ~235°C fluids. Monecke et al. concluded that the petrographic features found in the San Albino mine exposures and prospective areas are exactly like those recently published for other orogenic Au deposits worldwide including Samot in Egypt, Huangjindong in China; Grass Valley in California, USA; and Garrcon in the Abitibi greenstone belt, Canada.
|
9.0 EXPLORATION (ITEM 9)
This section summarizes the exploration work carried out by Mako, including that by Golden Reign prior to their name change to Mako. Drilling conducted by Mako is described in Section 10.3 and was ongoing as of the effective date of this report. The authors have drawn on information presented in prior reports by Puritch, et al. (2015), Puritch, et al. (2013) and Kowalchuck (2011), with confirmation and additional detail provided by Mako. The authors believe this information is materially accurate as summarized in this report.
9.1 SAN ALBINO-MURRA CONCESSION
Exploration work began on the San Albino-Murra concession in 2009 and is ongoing as of the date of this report, primarily focused at and around the San Albino deposit. In 2019, Mako conducted an induced potential and resistivity ("IP/Res") survey at the San Albino deposit. The IP/Res survey was carried out by Investigaciones Geologicas y Geofisicas S.A. ("I GEOS") of Managua using an ABEM Terrameter LS (Lund System). Approximately 15.2 line-kilometers were surveyed on lines oriented NE-SW and spaced 10m apart. The objective of the survey was to determine whether IP and/or resistivity could be used to define: 1) historical dumps and workings, 2) mineralized veins and 3) faults and fractured rock. Results of the survey were mixed, there is not a clear IP and/or resistivity response for the mineralized veins; historical dumps and workings had a marginal response, while faults and fractured rock had a clear response.
9.1.1 SAN ALBINO-MURRA CONCESSION MAPPING AND SURFACE SAMPLING
Since 2009, Mako has completed mapping covering the entire concession at 1:20,000 scale and has collected surface samples in the concession. This total number of samples includes 8,194 surface samples (grab, float, channel and underground), 6,278 soil samples covering an area of around 23km2, and 17,212 channel samples from exploration pits and trenches, nearly evenly split between the San Albino and Las Conchitas deposit areas. The results of the surface rock chip sampling are shown in Figure 9-1 and rendered immaterial in the area of the resources since so many trench and channel samples were taken. The channel sample results are, in some cases, used in the estimation of resources at the San Albino and Las Conchitas deposits.
|
Figure 9-1 Exploration Surface Samples in ppm Au
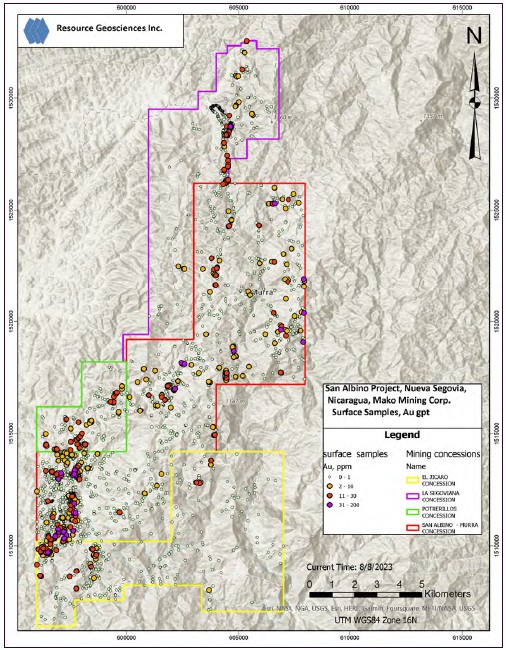
|
Numerous surface exposures of veins at the San Albino and Las Conchitas deposits have been developed by trenching, which makes channel sampling a useful exploration and delineation technique. Mako has completed channel sampling of 761 trenches and exploration pits as summarized in Table 9-1; see Section 10.0 for the locations of the channel samples which are shown, together with drillhole collars, in Figure 10-1 and Figure 10-3. Channel samples generally ranged from 0.5 to 3m in length and averaged 1.5m.
Table 9-1 Channel Sampling at the San Albino and Las Conchitas Deposits
| Location | Period | Total Samples |
Total Number of Trenches/Pits |
| San Albino - Arras | 2011-2020 | 8,364 | 293 |
| San Albino - Arras | 2021-present | 497 | 37 |
| Conchitas | 2010-2020 | 6,862 | 305 |
| Conchitas | 2021-present | 1,489 | 126 |
| Total | 17,212 | 761 |
Channel samples collected by Mako from trenches and exploration pits were collected carefully and are well documented. The authors believe the channel samples are representative and of generally adequate quality to use for resource modeling, subject to those exclusions discussed in Section 12.2 and Section 14.0. The relevant results are summarized in Section 14.2.8 and 14.2.9. Channel sampling procedures are discussed in Section 11.1.1.
9.1.2 SAN ALBINO-MURRA CONCESSION UNDERGROUND SAMPLING
Mako has had limited access to the historical San Albino mine workings via four adits on the 150, 200, 300 and 400 levels. All of the tunnels had collapsed blocking access to the veins and mineralization. Mako conducted a small amount of channel sampling outside the mineralized zones. Existing and recorded historical underground sampling was more useful, although these historical data are not in the resource database and were not used in estimation. At the Arras tunnel 3, Mako collected 31 samples over a 10m to 15m strike length.
9.1.3 SAN ALBINO-MURRA CONCESSION, SAN ALBINO AND LAS CONCHITAS AREA DRILLING
Mako commenced core drilling in the San Albino area in 2010 and in the Las Conchitas area in 2011. Drilling is summarized in Section 10.3 of this report.
|
9.2 EL JICARO CONCESSION
The El Jicaro concession was acquired by Mako in early 2012. Initial work by Mako consisted of mapping and sampling. Multiple areas with exposed gold mineralized veins and vein float were identified. An auger soil sampling program was conducted over an area of 15.17km2 (covering approximately half of concession) and 3,414 soil samples were collected in total. In late 2015, a trenching program was conducted at the historical El Golfo mine area. A total of seven trenches totaling 134m in length, and seven exploration pits across 50m, were excavated by hand, from which a total of 292 samples were collected and assayed. Three diamond core drillholes were completed in 2022, totaling 410.1m as discussed in Section 10.4 of this report.
9.3 POTRERILLOS CONCESSION
The Potrerillos concession was acquired in 2019. Preliminary geological mapping, sampling and prospect evaluation has been conducted. A graphical summary of assay results and locations of gold mineralized rock chip and float samples are shown in Figure 9-1. Seven diamond core drillholes were completed in 2022, totaling 1,098.7m as discussed in Section 10.5 of this report.
9.4 LA SEGOVIANA CONCESSION
The La Segoviana concession was acquired in 2020. Prospect evaluation and limited surface sampling began in 2023 (Figure 9-1). Mapping and sampling of seven trenches and pits has been completed, including collection of 386 samples for assay. Diamond core drilling of the concession commenced in 2023 and results are summarized in Section 10.6 of this report.
|
10.0 DRILLING (ITEM 10)
This section summarizes the drilling conducted at the San Albino deposit and the Las Conchitas deposit and nearby prospects. The information presented in this section of the report is derived from multiple sources, as cited.
The descriptions of drilling in this section include information from Ristorcelli et al. (2020), which report focused on the San Albino deposit. Drilling at San Albino and Las Conchitas was managed by the same geological team working at the same facility, and Mako advises that field operations and core handling procedures were the same for the two deposits at any given time.
No drilling was in progress at the time of the site inspection by Messrs. Ristorcelli and Gray in 2023. However, Mr. Ristorcelli had previously reviewed drilling procedures for the San Albino deposit (Ristorcelli et. al.,, 2020). Numerous discussions during the 2023 inspection did not reveal anything to indicate that operations and procedures at Las Conchitas diverged from those at San Albino observed in 2020.
10.1 SUMMARY
A total of 193,349m have been drilled in 2,201 diamond core and RC holes since 1996 in the San Albino and Las Conchitas deposits and nearby prospects. as summarized in Table 10-1. More details are provided in sections that follow.
|
Table 10-1 Summary of San Albino, Las Conchitas and Related Area Drilling
| Company | Project or Concession |
Years | Meters | Holes | ||||
| Core | RC | All | Core | RC | All | |||
| Historic Drilling (Prior to Golden Reign) | ||||||||
| Western Mining Corp | 1996-1997 | 52 | - | 52 | 2 | - | 2 | |
| Resources and Mining S.A. | 1997-2005 | n/a | n/a | n/a | n/a | n/a | n/a | |
| Condor Resources | 2006-2008 | 2,754 | - | 2,754 | 24 | - | 24 | |
| Company | Project or Concession |
Years | Meters | Holes | ||||
| Core | RC | All | Core | RC | All | |||
| Drilling by Golden Reign and Mako | ||||||||
| Golden Reign / Mako | San Albino | 2010-2022 | 105,033 | 4,205 | 109,238 | 1,232 | 200 | 1,432 |
| Golden Reign / Mako | Las Conchitas | 2011-2023 | 78,640 | 4,074 | 82,174 | 718 | 109 | 827 |
| Mako | Jicaro | 2022 | 410 | - | 410 | 3 | - | 3 |
| Mako | Potrerillos | 2022 | 1,099 | - | 1,099 | 7 | - | 7 |
| Mako | La Segoviana | 2023 | 1,155 | - | 1,155 | 15 | - | 15 |
| Golden Reign / Mako | Total | 186,337 | 8,279 | 194,076 | 1,975 | 309 | 2,284 | |
The RC drilling listed for Las Conchitas was done in 2023 and was not used in the estimation of the resources described in section 14.3.
10.2 HISTORICAL DRILLING
The first part of Section 6.0 sets out a summary of what is known about drilling in the project area prior to Golden Reign acquiring the project in 2009. The databases used for the resource estimates described in this report do not contain any information derived from the drilling done prior to 2010.
10.2.1 HISTORICAL DRILLING BY WESTERN MINING CORPORATION
Western Mining attempted to drill two core holes using a JKS Boyles Winkie drill rig. However, that small drill rig was under-powered for the drilling conditions encountered. The first core hole only reached a depth of 29m and the second only reached 23m. No additional drilling was attempted (Kowalchuk, 2011).
|
10.2.2 HISTORICAL DRILLING BY RESOURCES AND MINING S.A.
Both English (2009) and Kowalchuk (2011) report REMISA (also known as "EMSA") drilled an unknown number of shallow core holes. The drill rig was reported to be under-powered and unable to reach target depths.
10.2.3 HISTORICAL DRILLING BY CONDOR GOLD PLC.
Condor drilled a total of 24 RC holes, of which two were finished with core tails (English, 2009). The San Albino vein was tested by three holes totaling 283m. In the Arras area, 21 RC holes were drilled with two having core tails for a total of 2,471m of drilling. Condor's drilling was conducted using a UDR650 drill. The authors are unaware of the drilling contractor or further information on the methods and procedures used.
10.3 MAKO MINING CORP. DRILLING - SAN ALBINO AND LAS CONCHITAS DEPOSIT AREAS
Disclosing resource estimates for the San Albino and Las Conchitas deposits is the primary purpose of this report, so drilling at these two deposits is of greater importance than the drilling at other prospects. Tabulations of intercepts and graphical cross sections are not included in Section 10.6 as these are superseded by resource tabulations and cross sections in Section 14.0
10.3.1 SAN ALBINO
Mako (then Golden Reign) began drilling at San Albino in 2010 and since then until the end of 2022 a total of 109,238m have been drilled in 1,432 core and RC holes in the San Albino deposit area (Table 10-2). The locations of the drillholes in relation to property boundaries are illustrated on Figure 4-2.
From 2010 through 2013, 226 core holes were drilled totaling 41,164m. All drilling utilized HQ size core. Drilling in 2010 was completed by R&R Drilling of Honduras using a Longyear Super 38 man-portable drill. In the years 2011 through 2013, drilling was performed by Canchi Perforaciones de Nicaragua, S.A. using a JS 1500 self-propelled drill.
No drilling was conducted in 2014 or 2015. Drilling resumed in 2016 with 266 holes totaling 6,560m. This included 75 core holes totaling 3,320m; 56 of these holes were drilled for metallurgical samples. Exploration holes were drilled with HQ size core and metallurgy holes were drilled with PQ size core. Exploration and metallurgical core drilling were performed by Canchi Perforaciones de Nicaragua, S.A. using a JS 1500 self- propelled drill. RC methods were used to drill 191 holes for 3,240m. The RC drilling was conducted by Continental Drilling S.A. of Nicaragua using a MPD 1000 track-mounted RC drill using a five-inch tricone bit or face-discharge hammer.
|
No drilling was done in 2017 or 2018.
Drilling resumed in 2019 and continued through 2022. Drilling during 2019-2022 was conducted by three drilling contractors:
/ Continental Drilling S.A. using a Boart Longyear LF90 drill , a Sandvick DE 710 or two-man portable drill rigs, all drilling HQ size core;
/ Rodio Swissboring, S.A., using a Christensen CS 1000 with HQ size core (only a small contract and only at San Albino); and
/ Kluane Nicaragua, S.A., using a KD600 man-portable drill with HTW size core.
During 2019-2022, 931 core holes comprising 60,549m were drilled at San Albino. In 2022 nine RC holes were drilled comprising 965m. However, the nine RC holes, while included in the San Albino database, are spatially separated from the resource by more than 100m, do not influence the modeling of the resource and do not contribute to the gold or silver estimates of the resource.
Table 10-2 summarizes drilling at San Albino by year, exclusive of blast holes. Figure 10-1 shows the locations of drillholes and of channel (trench) samples.
Table 10-2 Exploration Drilling at San Albino by Year
| Year | Hole Type | Number of Holes | Number of Meters |
| 2010 | core | 14 | 1,520 |
| 2011 | core | 54 | 14,431 |
| 2012 | core | 84 | 19,050 |
| 2013 | core | 74 | 6,163 |
| 2016 | core | 75 | 3,320 |
| 2016 | RC | 191 | 3,240 |
| 2019 | core | 312 | 15,326 |
| 2020 | core | 230 | 10,609 |
| 2021 | core | 237 | 14,486 |
| 2022 | core | 152 | 20,128 |
| 2022 | RC | 9 | 965 |
| Totals | 1,432 | 109,238 | |
|
Figure 10-1 Map of San Albino Project Drillholes and Channel Samples
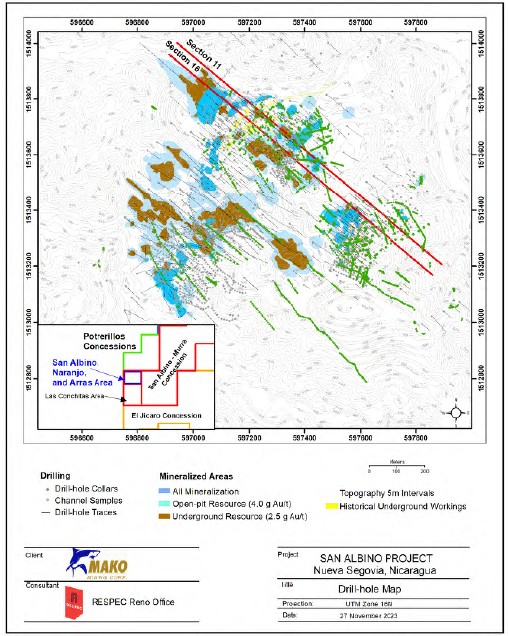
Note: property lines are outside the coverage of this map; the relationships of drillhole locations and resources to property boundaries are given in Figure 4-2 and Figure 4-3.
|
10.3.1.1 SAN ALBINO NORTE
In 2022 Mako drilled 8 diamond drillholes, SA22-588 to SA22-595, totaling 1,452.9m at the San Albino Norte prospect in the San Albino-Murra concession (Figure 10-2). Drillhole SA22-588 intersected a 0.5m interval from 213.5 to 214.0m that assayed 8.92g Au/t and 38.4g Ag/t, and a 0.5m interval from 215.0 to 215.5m that assayed 1.12g Au/t and 0.4g Ag/t. True width of these intercepts is unknown. The remaining six drillholes failed to intersect gold mineralization greater than 1g Au/t. These eight drillholes are in the database used for estimating the San Albino resources presented in this report and are included in the drillhole count in Table 10-2, but they were testing exploration targets outside of the San Albino and Las Conchitas resource areas and they are not used in estimation of the resources.
Figure 10-2 Map of San Albino-Murra Exploration Drillholes
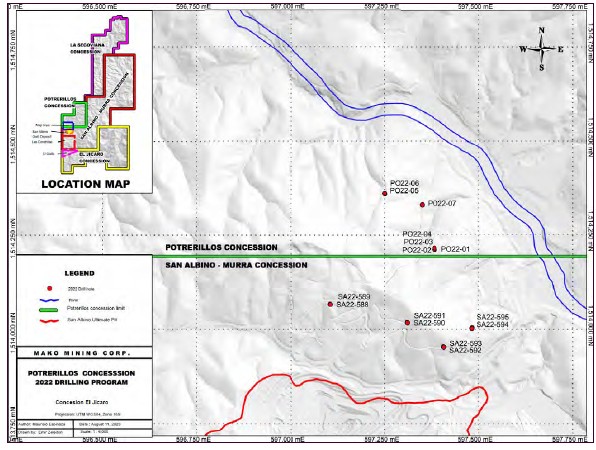
|
10.3.2 LAS CONCHITAS AREA
Diamond core drilling commenced in the Las Conchitas area in 2011. As of the effective date of the Las Conchitas database (July 11, 2023), 78,640m have been drilled in 718 core holes, as indicated in Table 10-3. Figure 10-3 shows the locations of the Las Conchitas area drillholes and channel (trench) samples. In addition, 109 RC drill holes were completed in 2023 for a total of 4,074m, which were neither audited nor used in modeling or estimation.
Drilling at the Las Conchitas area occurred in tandem with the drilling at the San Albino deposit and thus the contractors, rigs, and core sizes were the same as those used in the same years at San Albino, discussed in Section 10.3.
Approximately 50% of all the drilling at Las Conchitas was completed in 2022 by Continental and Kluane.
Table 10-3 Exploration Drilling at Las Conchitas by Year
| Year | Hole Type | Number of Holes | Number of Meters |
| 2011 | core | 6 | 1,712 |
| 2012 | core | 1 | 300 |
| 2013 | core | 11 | 1,027 |
| 2018 | core | 49 | 2,192 |
| 2019 | core | 81 | 6,021 |
| 2020 | core | 185 | 15,762 |
| 2021 | core | 108 | 11,435 |
| 2022 | core | 277 | 40,191 |
| 2023 | RC* | 109 | 4,074 |
| Totals | 827 | 82,714 | |
*The RC holes drilled in 2023 are listed here, for the record, but they were not used in the resource estimate described in Section 14.3. They were used to check that the model reasonably predicted grades.
|
Figure 10-3 Map of Las Conchitas Project Drillholes and Channel Samples
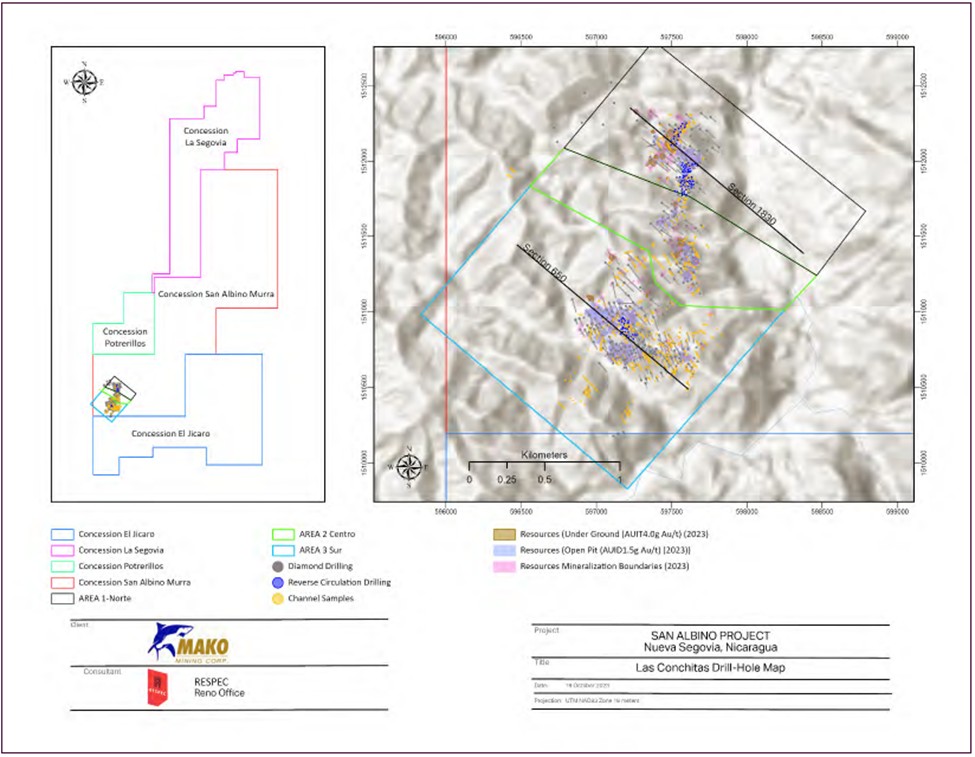
|
Table 10-4 Summary of All Drilling at San Albino and Las Conchitas
| Drillhole Type | Number of Holes | Total Meters |
| San Albino Deposit | ||
| core | 1,232 | 105,033 |
| RC | 200 | 4,205 |
| blast hole | 499 | 9,968 |
| Las Conchitas Deposit | ||
| core | 718 | 78,640 |
| RC | 109 | 4,074 |
10.4 MAKO MINING CORP. DRILLING - EL JICARO CONCESSION
In 2022 Mako drilled four diamond drillholes totaling 495.5m at the Tivo prospect in the El Jicaro concession (Figure 10-4). Drillholes EJ22-01 and EJ22-02 each intersected a weakly gold anomalous (<1g Au/t) breccia and vein zone over downhole widths of 1.0 and 0.5m respectively, with true width undetermined. Drillhole EJ22-03 did not hit any reportable gold mineralization above 0.1g Au/t. Drillhole LC22-499 was collared in the San Albino-Murra concession on the boundary of the El Jicaro concession, north of the Tivo prospect, but was angle drilled into the El Jicaro concession testing the Tivo prospect, and intersected a 1.0m mineralized interval from 13.40 to 14.40m that assayed 2.04g Au/t and 1.7g Ag/t and a 0.5m interval from 15.0 to 15.5m that assayed 3.52g Au/t and 3.1g Ag/t. True widths are unknown. All four of these drillholes were testing exploration targets outside of the San Albino and Las Conchitas areas and they are not used in estimation of resources presented in this report.
Figure 10-4 Map of El Jicaro Drillholes
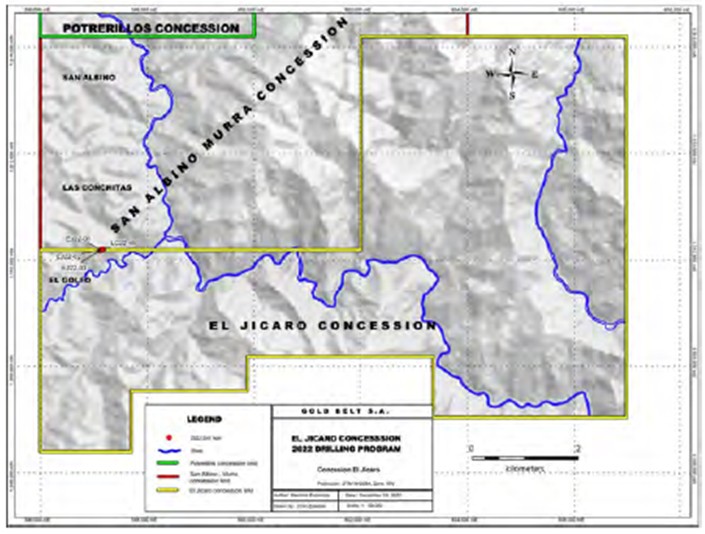
|
10.5 MAKO MINING CORP. DRILLING - POTRERILLOS CONCESSION
In 2022 Mako drilled seven diamond drillholes totaling 1,098.7m at the Piedras Negras prospect in the Potrerillos concession (Figure 10-2). Drillhole PO22-05 intersected 13.5g Au/t and 7.3g Ag/t over a 1.20m interval from 42.30 to 43.50m, with estimated true width of 1.1m. The other drillholes intersected weakly gold anomalous (<1g Au/t) breccia and vein zones over widths of 0.7 to 1.5m. True thicknesses are unknown. These seven drillholes were testing exploration targets outside of the San Albino and Las Conchitas areas and they are not used in estimation of resources presented in this report.
10.6 MAKO MINING CORP. DRILLING - LA SEGOVIANA CONCESSION
In 2023 Mako drilled 15 diamond drillholes totaling 1,154.9m at the La Reforma, La Reforma West, San Luis and Minas America prospects in the La Segoviana concession (Figure 10-5). Assay results of vein intercepts calculated using a 1g Au/t cutoff are summarized in Table 10-5. These 15 drillholes were testing exploration targets outside of the San Albino and Las Conchitas areas and they are not used in estimation of resources presented in this report.
|
Figure 10-5 Map of La Segoviana Drillholes
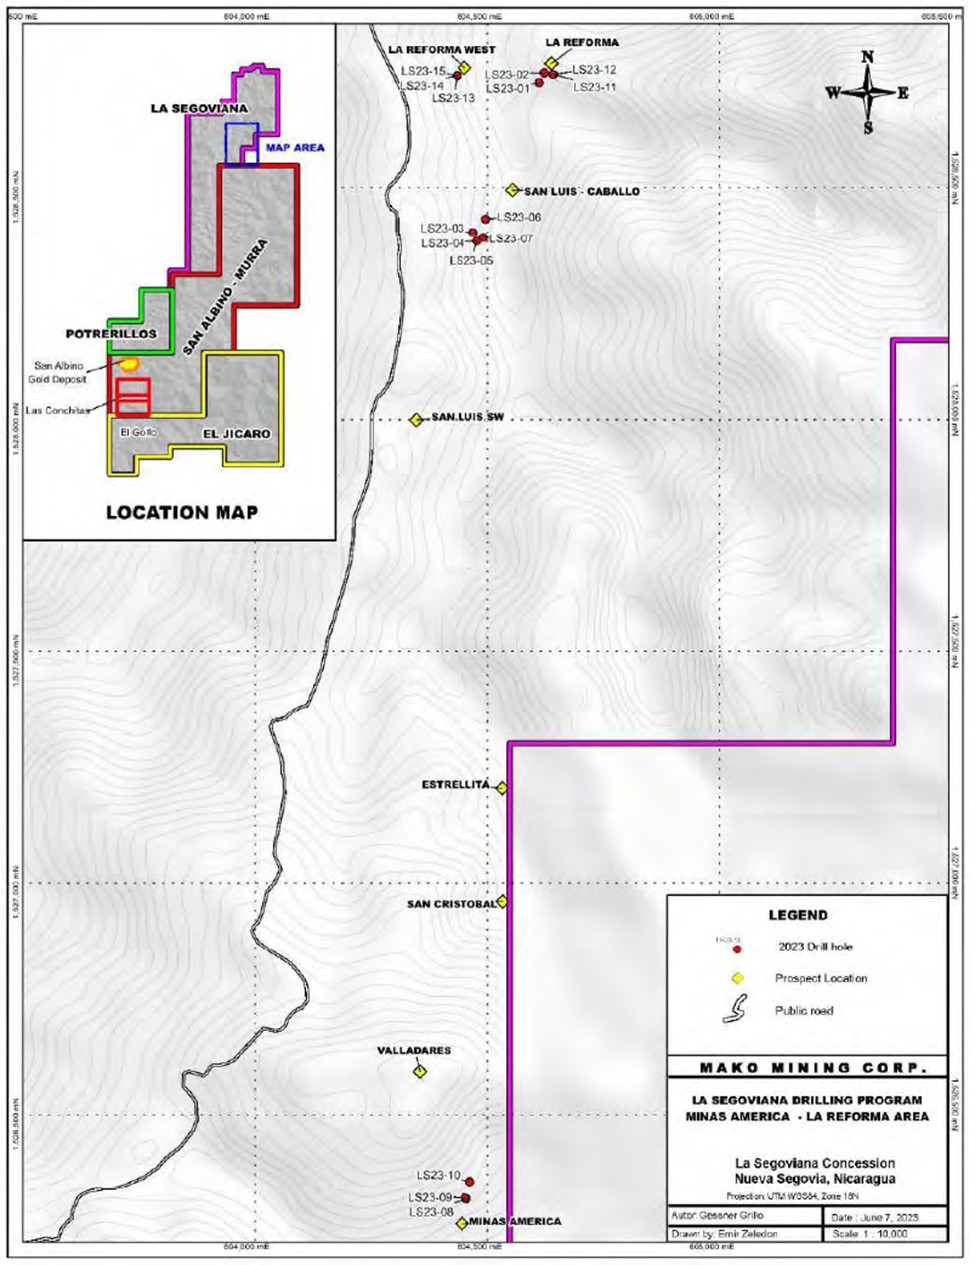
|
Table 10-5 Significant Assay Results La Segoviana Drillholes
| Location | Drillhole | From (m) |
To (m) | Width (m) |
Estimated True Width (m) |
g Au/t | g Ag/t |
| La Reforma | LS23-01 | No intercept greater than 1 g Au/t | |||||
| La Reforma | LS23-02 | 26.8 | 27.8 | 1.0 | 1.0 | 1.22 | 3.3 |
| San Luis | LS23-03 | 41.8 | 43.0 | 1.2 | 1.1 | 6.06 | 9.2 |
| San Luis | LS23-03 | 77.7 | 78.4 | 0.7 | 0.6 | 2.08 | 26.2 |
| San Luis | LS23-04 | 51.9 | 52.8 | 0.9 | 0.6 | 1.41 | 0.7 |
| San Luis | LS23-04 | 52.8 | 53.1 | 0.3 | 0.2 | 1.23 | 0.7 |
| San Luis | LS23-04 | 53.1 | 53.6 | 0.5 | 0.3 | 171.70 | 116.0 |
| San Luis | LS23-04 | 53.6 | 54.0 | 0.4 | 0.3 | 1.73 | 3.6 |
| San Luis | LS23-05 | 74.3 | 75.3 | 1.0 | 0.7 | 1.96 | 1.5 |
| San Luis | LS23-06 | 21.5 | 22.4 | 0.9 | 0.8 | 1.42 | 1.1 |
| San Luis | LS23-07 | 31.4 | 34.3 | 2.9 | 2.6 | 2.31 | 2.4 |
| Minas America | LS23-08 | 38.6 | 40.8 | 2.2 | 2.0 | 1.94 | 26.2 |
| Minas America | LS23-09 | No intercept greater than 1 g Au/t | |||||
| Minas America | LS23-10 | 38.6 | 40.8 | 2.2 | 2.0 | 1.94 | 26.2 |
| Minas America | LS23-10 | 44.2 | 44.6 | 0.4 | 0.4 | 2.75 | 20.5 |
| La Reforma | LS23-11 | 32.5 | 34.6 | 2.1 | 1.9 | 6.97 | 7.0 |
| La Reforma | LS23-12 | 21.0 | 23.7 | 2.7 | 2.4 | 4.11 | 6.0 |
| La Reforma West | LS23-13 | No intercept greater than 1 g Au/t | |||||
| La Reforma West | LS23-14 | hit void | |||||
| La Reforma West | LS23-15 | 48.4 | 49.5 | 1.1 | 1.0 | 6.14 | 4.7 |
10.7 DRILLHOLE COLLAR SURVEYS
Historical drill sites in the San Albino deposit area were originally located using a handheld GPS unit. The authors have no further information on the methods or procedures used. Beginning in 2011, Mako's drillhole locations were surveyed using total station surveying equipment, which included re-surveys of Mako's previous drilling. During the 2020 site visit (Ristorcelli et. al., 2020), Mr. Unger measured the coordinates of 17 drillhole collars with a handheld Garmin GPS-64 GPS receiver. The Garmin GPS-64 receiver does not have the precision of total station survey equipment, but the results substantially support the collar coordinates in the database. The results of this comparison are discussed in Section 12.4.
|
During his 2023 site visit Dr. Gray (Gray, 2023) measured the coordinates of 13 drillholes in the Las Conchitas deposit using a Garmin GPS MAP 64 handheld unit. The results of comparing Dr. Gray's coordinates to those in the database are discussed in Section 12.4.
10.8 DOWNHOLE SURVEYS
Downhole surveys for inclination and magnetic azimuth were carried out at approximately 50m intervals using a Reflex Multishot survey instrument. The downhole surveys were conducted by the drill crews. Verification of the survey data in Mako's database is discussed in sections 12.2.1.2 (San Albino) and 12.2.2.3 (Las Conchitas).
10.8.1 MAGNETIC DECLINATION
Mako does not adjust the azimuths measured in the downhole surveys for magnetic declination. To determine how this might affect the geometry of the drillhole array, the author checked1 the magnetic declination at the approximate center of the San Albino deposit as it was at the beginning of 2011 and the beginning of 2023. The declinations obtained were:
January 2011: 0° 21′ W
January 2023: 1° 52′ W
Given the accuracy of magnetic downhole instruments, in 2011 it would have made little sense to try to do declination adjustments. By 2023 it would have been marginally useful. The author suggests that Mako should monitor future declination changes and be prepared to implement a system for adjusting magnetically measured azimuths if the difference between magnetic and true north continues to increase.
10.9 SUMMARY STATEMENT
The authors believe that the drilling procedures provided samples that are representative and of sufficient quality for use in the resource estimations discussed in Section 14.0. The authors are unaware of any sampling or recovery factors that materially impact the mineral resources discussed in Section 14.0, except those described in Section 14.3.4. The details of sampling are discussed in Section 11.0.
________________________________
1 Checks were done using an online calculator which in March of 2023 was available at: "https://www.ngdc.noaa.gov/geomag/calculators/magcalc.shtml#declination"
|
11.0 SAMPLE PREPARATION, ANALYSIS, AND SECURITY (ITEM 11)
This section summarizes all information known to the authors relating to sample preparation, analysis, and security, as well as quality assurance/quality control ("QA/QC") procedures and results, that pertain to the San Albino and Las Conchitas deposits. The information has either been compiled by the authors, or provided to the authors by the Mako database manager, Ms. Natalia Cherepanova.
Sections 11.1, 11.2, and their subsections are derived in large part from Ristorcelli et al., 2020. Updated information from later sources is identified as such in the text.
Samples from San Albino and samples from Las Conchitas are collected by the same exploration team working from the same facility and are analyzed by the same laboratory. Hence sections 11.1, 11.2 and their subsections apply to both deposits.
11.1 SAMPLE PREPARATION
11.1.1 CHANNEL SAMPLES OF EXPLORATION PITS AND TRENCHES
Numerous channel samples have been collected at San Albino and Las Conchitas from vein exposures created by digging pits or trenches. During a site inspection at San Albino in 2020 it was observed that the channel sample sites were carefully marked with spray paint to indicate the area of each sample (Ristorcelli et al., 2020).
Channel samples were collected using a saw when possible. If the area to be sampled was broken or very soft material, a chisel was used. In the years 2010-2012 locations were originally surveyed using a handheld GPS. Beginning in 2013, locations were surveyed using a total station and trench beginning and end locations from 2010-2012 were resurveyed using a total station. Samples were collected in multiple orientations, depending on location and exposure, including vertically, parallel to the dip of the vein, and across the true thickness of the vein. When possible, a vein exposure was excavated in a hand-dug exploration pit of less than 2m depth and width to expose the vein in all three dimensions. Individual samples were typically about 1.0m in length, 5cm wide and approximately 3cm in depth, collected along each channel from visible veins and separately from adjacent sheared wallrock. Each sample was placed in its entirety in a sample bag and the sample numbers and type of material were recorded. Each channel sample location was photographed and logged. In some cases, one or both of the trench walls were mapped and in all cases plan maps of the trenches were made.
|
11.1.2 REVERSE CIRCULATION DRILLING SAMPLES
RC drilling at the San Albino deposit was done in 2016, during which 191 RC holes were drilled, and in 2022, during which 9 RC holes were drilled. In 2016 drilling was done without water injection using either a five- inch tricone bit or center-return hammer and bit. Sample intervals were 1m in length in 2016. Samples were double bagged with a sample tag inserted into the bag then zip-tied shut. RC field duplicate samples were collected every 20 intervals by splitting the total sample in half with a riffle splitter and then splitting one half again so the original and duplicate each represented one quarter of the total sample.
The nine holes of RC drilling done in 2022 were not done using the same protocols as in 2016. A two-meter sample interval was used, samples were processed by Mako's mine laboratory rather than an independent lab and normal QA/QC protocols were not consistently applied. Although the holes are included in the San Albino database, they are spatially separated from the resource by more than 100 meters, do not influence the modeling of the resource and do not contribute to the gold or silver estimates of the resource.
11.1.3 CORE DRILLING SAMPLES
Core samples were transported from the drill site to the core logging facility in the nearby town of El Jicaro by Company personnel. Core was then logged, photographed wet and dry, and marked for sampling by the geologists. In the mineralized zones, the geologists used wax pencils to indicate the start and end point of the sample interval by marking the core perpendicular to the core axis. To prevent bias in the sampling, the geologists rotated the core in the core box so that the foliation dipped toward the geologist. A cut line was then drawn down the center of the core, parallel to the core axis. The half of core on the right side of the cut line was always sampled and the left side was always retained for reference. Samples generally did not extend across geologic breaks with special attention given to separating quartz veins from the surrounding hanging wall and footwall zones. Sample lengths were limited to a minimum of 0.5m so smaller zones of texturally distinct vein were often included together in one sample. Outside the mineralized zones, the samples were generally taken on 1.5m intervals. During the 2020 site visit (Ristorcelli et. al., 2020) the authors2 reviewed sample selections on the drill core being logged and found it to be reasonable. Sample intervals were dominantly 1.0m long, in the better mineralized areas, or 1.5m long, in the clearly unmineralized areas. Samples were placed in sample bags and assigned a sample number from preprinted sample tags. A portion of the sample tag with the sample number was placed in the bag and a portion retained. Mako staff recorded the drillhole number and depth intervals that corresponded to each sample number. Sample bags were then closed with ties and placed in much larger sample sacks labeled with the first and last sample number contained in each sack.
________________________________
2 "authors" in this sentence refers to the authors of Ristorcelli et al., 2020.
|
No core sampling was being done during the 2023 site visit (Ristorcelli, 2023 and Gray, 2023), but Mr. Ristorcelli and Dr. Gray reviewed core from a dozen or more drillholes. The sample intervals appeared to have been selected as described above and were appropriate to the observed geology and mineralization.
11.1.4 SAMPLE SECURITY
At the time of the 2020 site visit (Ristorcelli et. al., 2020), the drill and channel samples were being picked up at Mako's El Jicaro core logging facility by the Bureau Veritas laboratory personnel and transported by truck to Managua for sample preparation and analysis at the Bureau Veritas laboratories in Nicaragua and/or Canada. Ristorcelli and Unger (2020) observed that Mako's core logging facility in El Jicaro had 24-hour security personnel and that previously logged and sampled core was stored at a separate secure warehouse.
In 2023 Mr. Ristorcelli observed that security arrangements were the same as they had been in 2020.
In 2010, samples were shipped via United Parcel Service ("UPS") to Inspectorate's preparation facility in Guatemala. The samples were first transported directly to the UPS facility in Managua, Nicaragua accompanied by a Golden Reign representative. Currently, and in years 2011-2019, samples are transported from the drill or channel sample site to the logging facility in El Jicaro under the supervision of a Mako geologist. Samples are stored at the logging facility in El Jicaro until a representative from Bureau Veritas or its subsidiaries picks up the samples, or occasionally, the samples are transported to the laboratory by a Company representative. Samples are delivered to the laboratory on a weekly basis. On the day of delivery, samples are loaded into the transportation vehicle and the vehicle is locked. The transportation vehicle then drives directly to the laboratory in Managua without stopping.
11.2 SAMPLE ANALYSIS
The authors are unaware of the laboratories or methods of analysis utilized by historical operators focusing on the San Albino deposit. Assays of historical operators have not been utilized for the modeling of mineralized domains and the estimation of the mineral resources presented in Section 14.0 of this report.
All Mako's assays of rock and drill samples from the San Albino and Las Conchitas projects were carried out by Bureau Veritas laboratories, or by labs that were eventually absorbed by Bureau Veritas, Acme Labs and Inspectorate, herein collectively referred to as "Bureau Veritas". Bureau Veritas and its subsidiaries are certified3 commercial laboratories independent of Mako and its subsidiaries. The authors have no information on the methods of analysis or the elements assayed in the soil samples collected at the property.
________________________________
3 Bureau Veritas in their 2023 Canadian catalogue state "Through the process of external auditing by recognized organizations, our facilities maintain ISO 17025 accreditation. This accreditation provides independent verification that the management system has been implemented and meets the requirements of the standard. All analytical hubs have received ISO/IEC 17025 accreditation for specific laboratory procedures and sample preparation facilities are monitored to ensure compliance with quality control and quality assurance requirements for off site preparation."
|
In 2010, samples were prepared in Guatemala at a sample preparation facility operated by Inspectorate. In the following years, the samples were prepared in the Bureau Veritas preparation laboratory in Managua, Nicaragua where they were crushed, split to 1.0kg or less with a riffle splitter, and the splits were pulverized until 85% of the material passed a 200-mesh screen. An extra "wash" of barren silica material was run through the crusher between each sample. The pulverized "pulps" were then shipped by air freight to Bureau Veritas' assay laboratory in Vancouver, Canada for assaying. In addition to gold and silver, multiple elements including As, Ca, Cu, Fe, Mo, Ni, Pb, S, Sb, and Zn were analyzed using aqua regia digestion and inductively coupled plasma ("ICP").
In 2010, analyses for silver were completed using aqua regia digestion followed by ICP analysis. Testing was also completed for ore-grade levels of zinc and lead using a four-acid digestion followed by atomic absorption ("AA") analysis. In 2011, gold was determined by fire assay using a metallic screening at 150 mesh with a nominal pulp weight of 500g. Gold analyses of the coarse and fine fractions were done by fire assay fusion with an AA finish. Analyses for silver were initially completed using an aqua regia digestion followed by ICP analyses. In cases where silver exceeded the upper detection limit of 100g Ag/t, the sample was re-analyzed using AA following aqua regia digestion. Analyses were also completed for over-limit ore-grade levels of zinc and lead using aqua regia digestion with an AA finish.
In 2012, gold was analyzed at Inspectorate using either metallic-screen fire assays as in 2011 or fire assay fusion of a 30g aliquot with AA finish. Gold assays greater than 10g Au/t on the 30g pulps were then analyzed by fire assay fusion with a gravimetric finish. Analyses for silver were initially completed using an aqua regia digestion followed by ICP analyses. In cases where silver exceeded the upper detection limit of 100g Ag/t, the sample was re-analyzed using AA following aqua regia digestion. Analyses were also completed for ore-grade levels of zinc and lead using aqua regia digestion with an AA finish.
In 2013 and 2014, the samples were analyzed at Acme Labs in Vancouver, Canada, also a subsidiary of Bureau Veritas, who apparently took over the facilities previously operated by Inspectorate in Managua, Nicaragua. Sample preparation work was completed primarily in Managua and occasionally in Vancouver. Gold analyses were completed in Vancouver by 30g fire assay fusion with AA finish; samples with greater than 10g Au/t were
|
re-analyzed using fire assay fusion with a gravimetric finish. Additionally, some samples were analyzed for gold using metallic-screen fire assays at 150-mesh size with a nominal pulp weight of 500g. Silver was analyzed using aqua regia digestion followed by ICP. In cases where silver exceeded the upper detection limit of 100g Ag/t, the sample was re-analyzed using aqua regia digestion followed by either ICP or fire assay fusion with a gravimetric finish. Analyses were completed for ore-grade levels of lead using aqua regia digestion with an AA finish.
The author did not find any records showing that drilling or channel samples were analyzed in the year 2015. In 2016, 2017, and 2018, samples were delivered to the Bureau Veritas facility in Managua, Nicaragua. Gold analyses were completed at the Bureau Veritas facilities in Vancouver, Canada by 30g fire assay fusion with AA finish. Samples that exceeded 10g Au/t were re-analyzed using fire assay fusion followed by a gravimetric finish. Additionally, some samples were analyzed for gold using metallic-screen fire assays at 150-mesh size with a nominal pulp weight of 500g. Silver was analyzed using aqua regia digestion followed by ICP. In cases where silver exceeded the upper detection limit of 100g Ag/t, the sample was re-analyzed using aqua regia digestion followed by either ICP or fire assay fusion with a gravimetric finish.
In 2019 through 2022, Mako's samples were delivered to the Bureau Veritas facility in Managua, Nicaragua. Gold analyses were completed at the Bureau Veritas facilities in Vancouver, Canada by 30g fire assay fusion with AA finish. Samples that exceeded 10g/t Au were re-analyzed using fire assay fusion with a gravimetric finish. Additionally, some samples were analyzed using metallic-screen fire assays at 150-mesh size with a nominal pulp weight of 500g. Silver was analyzed using aqua regia digestion followed by ICP. In cases where silver exceeded the upper detection limit of 100g Ag/t, the sample was re-analyzed using aqua regia digestion followed by either ICP or fire assay fusion with a gravimetric finish.
A total of 23,450 samples from San Albino in 212 batches were sent for analysis. The batches range in size from 8 to 199 samples and this number includes the QA/QC samples inserted in the batches: certified reference material (standard), blank and coarse duplicate.
11.3 QUALITY ASSURANCE/QUALITY CONTROL
11.3.1 HISTORICAL OPERATORS' QUALITY ASSURANCE/QUALITY CONTROL
The authors are unaware of any QA/QC data collected by historical operators of the San Albino deposit. Assays done for historical operators have not been utilized for the modeling of mineralized domains and the estimation of the mineral resources presented in Section 14.0 of this report.
|
11.3.2 AUTHORSHIP OF QA/QC EVALUATIONS
QA/QC procedures and analyses for the San Albino and Las Conchitas deposits were implemented by the same team and analyses were done at the same lab. However the evaluations of QA/QC data for this report were done by different authors at different times and hence are reported separately herein. Table 11-1 explains the authorship of the QA/QC evaluations included in this report.
Table 11-1 Authors of QA/QC Evaluations
| Deposit | Time Period | Responsible Author | Report Section(s) |
| San Albino | 2010 - 2020 | Ristorcelli | 11.3.4 |
| San Albino | 2021 - 2022 | Ray | 11.3.5 |
| Las Conchitas | 2011 - 2022 | Ronning | 11.3.6 and 11.3.7 |
11.3.3 QA/QC MATERIALS AND METHODS OF EVALUATION
11.3.3.1 STANDARDS
In this discussion the term "standards" is used to refer to "certified reference materials" ("CRM"), also sometimes called "standard reference materials". These are materials with known concentrations of, in this case gold and/or silver, established by rigorous testing. They are included with sample shipments to test the performance of the lab(s) Mako employs. Mako uses standards obtained from Ore Research & Exploration P/L ("OREAS"), a well-known reputable supplier.
11.3.3.2 DUPLICATES
For samples from drill core, Mako has at various periods collected and caused to be analyzed duplicates of three types:
Field Duplicates
According to Ristorcelli et. al. (2020), and Grillo (2019), Mako's field duplicates are quarter core duplicates, cut from the half-core retained for reference after the first half-core sample has been collected. All sources of error including natural geological heterogeneity, field sampling error, sample preparation error and analytical error are encompassed in field duplicates.
Preparation (Coarse) Duplicates
These, also called coarse reject duplicates, "… are collected by taking a second split after crushing, before the pulverizing stage. These samples are sent to the same laboratory at a later stage." (Grillo, 2019). Preparation duplicates encompass all sources of error that occur within the laboratory, such as grinding and pulverizing, sample size reduction (splitting), and analytical error.
|
Pulp Duplicates
Grillo (2019) describes pulp duplicate simples as "… the identical pulp samples collected at the final stage of sample reduction". The author takes this to mean that the pulp duplicates are second splits taken from the same pulp as the original analytical aliquot.
Blanks
"Blanks" consist of unmineralized rock which is submitted to the laboratory like a real sample, to test whether the laboratory is reporting significant mineral grades in material that should have no or very low grades.
Mako uses coarse blank material which is processed by the laboratory similarly to real samples, including being subjected to the crushing and grinding process. The blank material is locally sourced rock. Previous sources used were crushed granite or locally sourced barren rock. In recent years prior to the first or second quarter of 2022 locally sourced granite was used. Subsequently, pumice has been used. These materials do not have certified grades but are presumed to contain very little or no mineralization.
11.3.4 SAN ALBINO QA/QC 2010 - 2020
11.3.4.1 SAN ALBINO PROJECT CHANNEL SAMPLES
The channel samples at the San Albino project were monitored for QA/QC purposes beginning in 2013. Blank materials, standards, and duplicates were inserted into the sample stream, prior to shipment to the assay laboratory, at a rate of every five to 10 samples. Blank material consisted of crushed granite or locally sourced barren rock. Standards consisted of prepackaged pulps of CRM. Duplicates were collected by sampling the same channel, either beside or deeper into the channel, twice and analyzing each sample separately.
11.3.4.1.1 BLANKS INSERTED WITH CHANNEL SAMPLES
The author reviewed 217 blanks inserted with channel samples from the year 2013 to 2020. Figure 11-1 shows the variability of gold values in blanks relative to the date analyzed. Two blanks had gold values greater than 0.2g Au/t. One of these blanks had a gold value of 0.21g Au/t, but the previous sample did not have detectable amounts of gold. It is possible this sample was a mislabeled channel sample because the following samples had similar gold values. The other anomalous blank immediately followed a sample with gold values of 545.9g Au/t. Overall, the results suggest a small amount of cross-contamination occurred during sample preparation.
|
Figure 11-1 Channel Sample Blanks
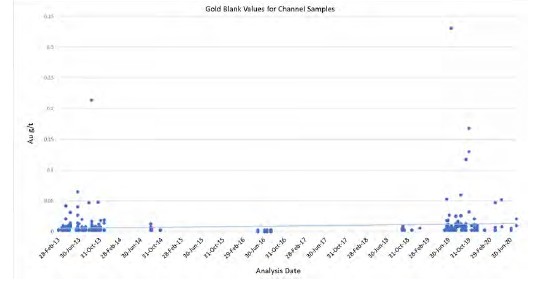
11.3.4.1.2 CHANNEL SAMPLE STANDARDS
Eleven CRMs were inserted as standards with the channel samples. Only CRMs with 30 or more analyses were considered to have sufficient data to evaluate for failure rate and weighted-average bias (Table 11-2). They showed a failure rate of 3% when failure is defined as a value greater than or less than the accepted standard value plus or minus three standard deviations, respectively. The weighted-average bias for these CRM samples shows an overall positive bias of 1%. These samples amount to 230 of the 255 CRM samples analyzed. If the additional 25 analyses covering seven different CRMs are factored in, the failure rate remains 3% and the weighted-average bias increases to 1.5%. The only CRM with a notable number of failures is OREAS-10C. It is unclear if this is due to a sample mislabeling/mishandling issue or actual failures. Additionally, four samples were removed from the failure rate calculation because they had improbably low values and thus likely were caused by sample mislabeling/mishandling. Standard OREAS-203 exhibited a high bias rate of +8.2%.
|
Table 11-2 Channel Sample Standards
| CRM ID | Grades in g Au/tonne | Total Samples |
Samples Deleted |
Dates Used | Failure Counts | Failure Rate |
Bias | |||||
| Certified Value |
Average | Max | Min | First | Last | High | Low | |||||
| OREAS-203 | 0.825 | 0.893 | 0.994 | 0.794 | 31 | 1 | 10-Apr-13 | 8-Oct-14 | 0 | 0 | 0.0% | 8.2% |
| OREAS-66a | 1.237 | 1.253 | 1.359 | 1.009 | 52 | 0 | 12-Feb-13 | 8-Oct-14 | 0 | 1 | 1.9% | 1.3% |
| OREAS-10C | 6.600 | 6.529 | 7.073 | 5.934 | 70 | 0 | 12-Feb-13 | 8-Oct-14 | 0 | 6 | 8.6% | -1.1% |
| OREAS-12a | 11.790 | 11.782 | 12.300 | 10.300 | 77 | 3 | 12-Feb-13 | 8-Oct-14 | 0 | 1 | 1.4% | -0.1% |
Note: only CRMs with more than 30 analyses shown.
11.3.4.1.3 CHANNEL SAMPLE DUPLICATES
The author evaluated the performance of duplicates by calculating the relative percent difference ("Rel Pct Diff") between the duplicate sample compared to the original sample expressed as percent. The relative percent difference listed in Table 11-3 is an average of individual relative differences, each of which is calculated as:

Additionally, an alternative calculation, which MDA has also done as part of this evaluation, but whose results are not listed in Table 11-3 is:

A total of 320 sample duplicates were inserted by Mako for the channel samples from trenches and exploration pits. Twelve had highly anomalous values greater than 500% difference between the original and duplicate sample, though only six had a gold content of greater than 1.0g Au/t in either the original or duplicate sample. Additionally, 40 samples were ignored because one or both samples had gold grades below detectable. Overall, the duplicates show a positive bias of around four percent and an average absolute relative difference around 45% (Table 11-3), both of which, given the difficulty and human error involved in channel sampling, can be considered good data reproducibility. Figure 11-2 and Figure 11-3 show relative percent bias and absolute relative present bias, respectively; of note is the somewhat expected increased variability in samples averaging more than 1.0g Au/t.
|
Table 11-3 Channel Sample Duplicates
| Duplicate Type | Year | Lab | Metal | Samples | Averages as Percent | |||
| Total | Used | Outliers | Relative % Difference |
Absolute % Difference |
||||
| Channel Sample Field | 2013-2020 | Inspectorate/ Bureau Veritas |
Au | 320 | 308 | 12 | 4.5 | 45.2 |
11.3.4.2 SAN ALBINO PROJECT BLANKS IN DRILL SAMPLES
Drill samples were monitored for QA/QC purposes in part by inserting blank material consisting of crushed granite or locally derived barren rock every 10 samples and randomly after suspected high-grade vein intervals. There are 1,926 blanks having gold values in Mako's database. One blank returned a significant value (0.62g Au/t), but it did not follow a mineralized sample. Thus, it may represent sample mishandling and/or mislabeling. Two other blanks had values greater than 0.2g Au/t, one followed a sample with insignificant gold. The other followed a sequence of five samples with grades ranging from 1.2 to 8.7g Au/t gold and thus could represent cross-contamination during sample preparation. This amount of potential cross-contamination, while measurable, is not significant.
Figure 11-4 shows all gold values in blanks and the dates they were received. It is noteworthy that increased variability in the blank gold values occurs over a period of August to December 2019. All the samples showing increased variability were prepared and analyzed by Bureau Veritas.
There are 1,926 blanks having silver values in Mako's database. One blank returned a significant value (10.3g Ag/t). This is the same sample mentioned above that returned a high gold value. It did not follow a mineralized sample, and may represent sample mishandling and/or mislabeling. Figure 11-5 shows all silver values in blanks and the dates they were received. It is noteworthy that increased variability in the blank silver values occurs over a period of December 2019 to March 2020. All samples showing increased variability were analyzed at Bureau Veritas.
|
Figure 11-2 Relative Percent Difference of Channel Sample Duplicates
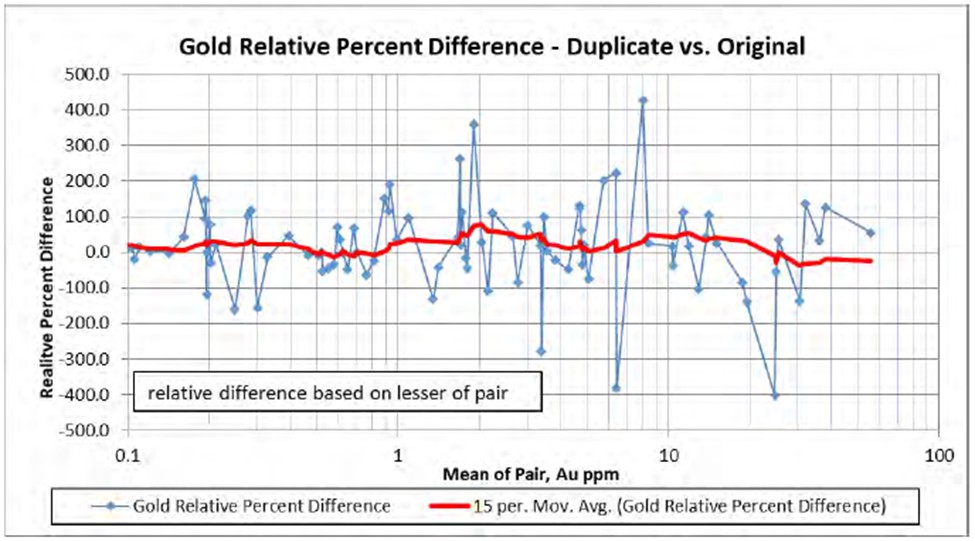
Note: a positive relative percent difference means the duplicate sample had a higher assay value than the original sample.
Figure 11-3 Absolute Percent Difference of Channel Sample Duplicates
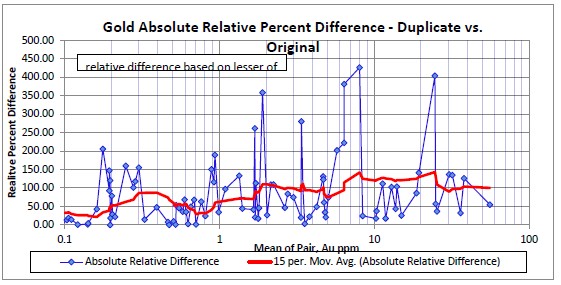
|
Figure 11-4 Gold Blanks: Drilling
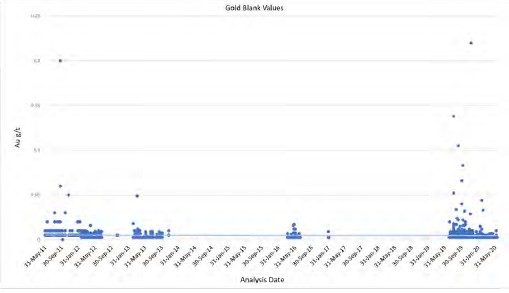
Note: One sample at 0.62g Au/t not shown
Figure 11-5 Silver Blanks: Drilling
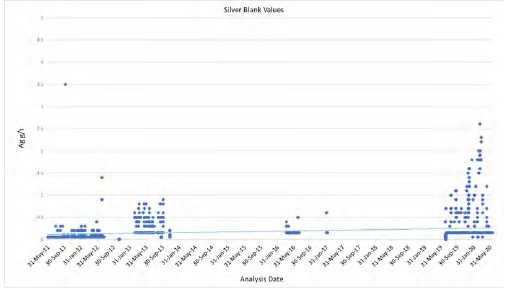
Note: One sample at 10.3g Ag/t not shown.
|
11.3.4.3 SAN ALBINO PROJECT STANDARDS IN DRILL SAMPLES
Drill sample QA/QC was also monitored by inserting CRMs every 10 samples. The CRMs consisted of prepackaged pulps of certified reference material. The author only evaluated results for the 16 CRMs with 30 or more analyses, which totaled 1,443 insertions, as summarized in Table 11-4. The failure rate for gold CRMs was 4% when using the definition for failures as greater than or less than the certified grade, plus or minus three standard deviations, respectively. The author found 30 failures that appear to be mislabeled CRMs. With these samples removed from consideration, the failure rate drops to 1% (Table 11-4). The weighted-average bias for all CRMs was found to be +2%.
Although not of primary economic interest, Mako did have one higher-grade CRM for silver. This standard had no failures and showed a bias of -3% (Table 11-5). Four other CRMs for silver all had certified values less than 1.5g Ag/t. These were considered inconsequential because the data lacked adequate precision and the silver grade is well below a grade likely to have reasonable prospects for eventual economic extraction. Thus, this silver CRM data was excluded from the QA/QC evaluation.
|
Table 11-4 Gold CRMs, San Albino project Drill Samples
| Standard ID | Grades in g Au/tonne | Samples Used |
Samples Deleted |
Dates Used | Failure Counts | Failure Rate |
Bias | |||||
| Certified Value |
Average | Max. | Min. | First | Last | High | Low | |||||
| OREAS-203 | 0.825 | 0.876 | 0.935 | 0.668 | 41 | 5 | 5-Mar-13 | 3-Feb-17 | 0 | 0 | 0.0% | 6.2% |
| OREAS-15h | 1.019 | 0.990 | 1.074 | 0.938 | 51 | 3 | 8-Mar-12 | 4-Apr-20 | 0 | 2 | 3.9% | -2.8% |
| OREAS-221 | 1.042 | 1.070 | 1.155 | 0.741 | 88 | 2 | 20-Jul-19 | 6-Mar-20 | 0 | 1 | 1.1% | 2.7% |
| OREAS-222 | 1.206 | 1.227 | 1.301 | 1.180 | 44 | 0 | 11-Jul-19 | 23-Jan-20 | 0 | 0 | 0.0% | 1.7% |
| OREAS-205 | 1.210 | 1.226 | 1.292 | 1.171 | 56 | 0 | 9-Apr-16 | 23-Jun-16 | 0 | 0 | 0.0% | 1.3% |
| OREAS-253 | 1.220 | 1.186 | 1.239 | 1.095 | 48 | 0 | 20-Jul-19 | 8-Jun-20 | 0 | 0 | 0.0% | -2.8% |
| OREAS-66a | 1.237 | 1.232 | 1.429 | 1.085 | 96 | 1 | 15-Jun-12 | 5-Jul-19 | 1 | 0 | 1.0% | -0.4% |
| OREAS-239 | 3.410 | 3.585 | 3.764 | 3.383 | 92 | 0 | 20-Jul-19 | 16-Apr-20 | 0 | 0 | 0.0% | 5.1% |
| OREAS-210 | 5.040 | 5.433 | 5.740 | 4.304 | 156 | 1 | 18-Apr-16 | 25-Feb-20 | 0 | 0 | 0.0% | 7.8% |
| OREAS-226 | 5.360 | 5.419 | 5.733 | 5.160 | 34 | 0 | 11-Jul-19 | 15-May-20 | 0 | 0 | 0.0% | 1.1% |
| OREAS-10C | 6.600 | 6.479 | 6.902 | 6.111 | 209 | 14 | 8-Mar-12 | 4-Apr-20 | 0 | 4 | 1.9% | -1.8% |
| OREAS-256 | 7.540 | 7.740 | 8.137 | 7.306 | 72 | 1 | 20-Jul-19 | 25-Apr-20 | 0 | 0 | 0.0% | 2.6% |
| OREAS-228 | 8.720 | 8.713 | 9.062 | 8.224 | 46 | 2 | 20-Jul-19 | 3-Feb-20 | 0 | 0 | 0.0% | -0.1% |
| OREAS-208 | 8.810 | 9.406 | 9.950 | 8.833 | 69 | 0 | 13-Apr-16 | 13-Aug-19 | 1 | 0 | 1.4% | 6.8% |
| OREAS-12a | 11.790 | 11.732 | 12.548 | 11.022 | 201 | 1 | 8-Mar-12 | 3-Feb-17 | 1 | 4 | 2.5% | -0.5% |
| OREAS-229b | 11.860 | 12.054 | 15.800 | 10.900 | 110 | 0 | 11-Jul-19 | 18-Jun-20 | 4 | 0 | 3.6% | 1.6% |
Table 11-5 Silver CRMs, San Albino project Drill Samples
| Standard ID | Grades in g Ag/tonne | Total Samples |
Samples Deleted |
Dates Used | Failure Counts | Failure Rate |
Bias | |||||
| Certified Value |
Average | Maximum | Minimum | First | Last | High | Low | |||||
| OREAS-66a | 18.9 | 18.3 | 21.1 | 15.9 | 91 | 0 | 15-Jun-12 | 3-Oct-13 | 0 | 0 | 0.0% | -3.3% |
|
11.3.4.4 SAN ALBINO PROJECT DUPLICATES IN DRILL SAMPLES
Three types of duplicates were inserted by Mako: quarter core samples, coarse rejects of core samples, and field duplicates collected at the RC drill. Quarter core samples show the highest degree of variability as expected, while the coarse reject and RC field duplicates show lower levels of variability. This illustrates the effect crushing the sample, whether at the lab or during the drilling process, has on reducing heterogeneity.
Table 11-6 Duplicates for San Albino project Drill Samples
| Duplicate Type | Year | Lab | Metal | Samples | Averages as Percent | |||
| Total | Used | Outliers | Relative Difference |
Absolute Difference |
||||
| Quarter Core | 2012, 2013, 2020 |
Inspectorate/ Bureau Veritas |
Au | 183 | 172 | 11 | 0.6 | 74.4 |
| Core Coarse Reject | 2010-2013, 2016, 2019-2020 |
Inspectorate/ Bureau Veritas |
Au | 2,456 | 2,441 | 15 | 1.2 | 26.8 |
| RC Field Duplicate | 2016 | Bureau Veritas | Au | 177 | 176 | 1 | -2.1 | 21.9 |
It should be noted that a higher relative difference is seen in the 2020 quarter core samples analyzed by Bureau Veritas compared to the samples analyzed by Inspectorate in 2012-2013. This difference is caused by the number of Bureau Veritas samples available, only 22, and by the sample selection. Only 11 of the Bureau Veritas samples have average gold grades greater than 1.0g Au/t. If only the higher-grade samples are considered, the average relative difference drops to -3.0% and average absolute relative difference drops to 57.6%, which both compare very favorably with the 2012-2013 Inspectorate samples. This illustrates the distortions that very low-grade samples can introduce in the data averages.
11.3.4.4.1 DRILL SAMPLES - CORE DUPLICATES
Core duplicates consist of sawn quarter core samples submitted for assay and compared to the original half- core assay. These were prepared by cutting the retained half-core lengthwise into two quarters and submitting one of the quarters as a duplicate of the original half-core sample. Analysis of the relative percent difference shows a generally low bias below gold grades of 1.0g Au/t and a high bias above 2.0g Au/t. Figure 11-6 shows duplicate samples versus original. Figure 11-7 shows the relative difference as an absolute value.
|
11.3.4.4.2 DRILL SAMPLES - COARSE REJECT DUPLICATES
Coarse reject material from analyzed core samples was selected and re-submitted as a type of duplicate. These duplicate samples were then analyzed at the same laboratory as the original samples. Very little bias is observed in these samples as shown in Figure 11-8 and Figure 11-9.
11.3.4.4.3 REVERSE-CIRCULATION DRILLING FIELD DUPLICATES
RC field duplicates show very little bias below 1.0g Au/t and a slight positive bias between 1.0 to 6.0g Au/t in the duplicate sample (Figure 11-10 and Figure 11-11).
Figure 11-6 Relative Difference of Gold in Quarter Core
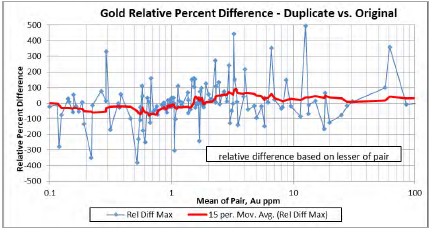
Note: a positive relative percent difference means the duplicate sample had a higher assay value than the original sample.
Figure 11-7 Absolute Value of Relative Difference of Gold in Quarter Core
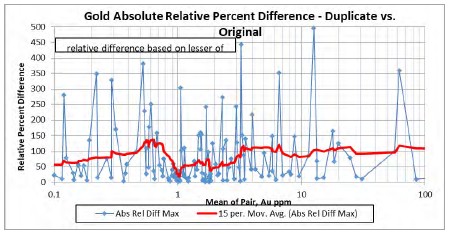
|
Figure 11-8 Relative Difference of Gold in Coarse Reject Material
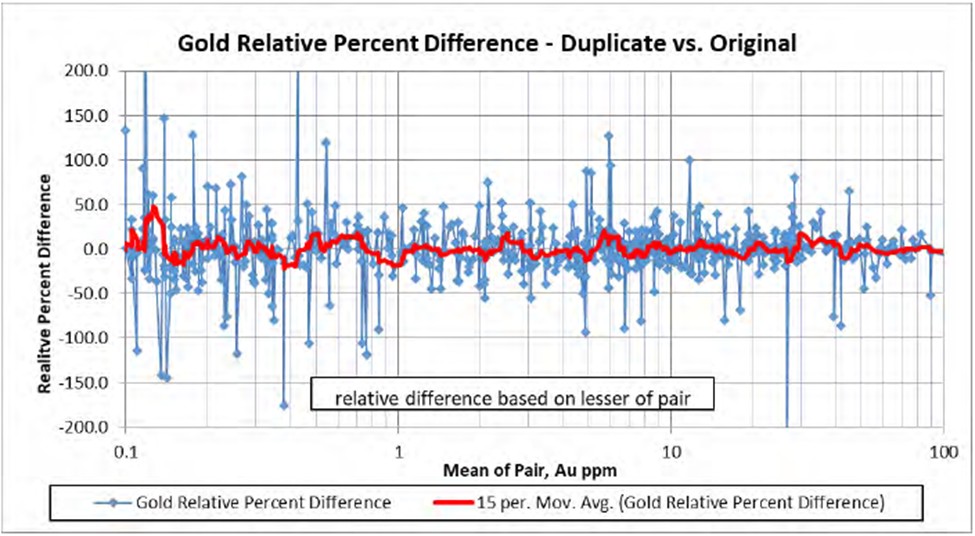
Note: a positive relative percent difference means the duplicate sample had a higher assay value than the original sample
Figure 11-9 Absolute Value of Relative Difference of Gold in Coarse Rejects
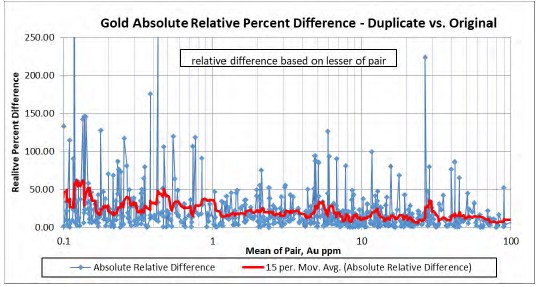
|
Figure 11-10 Relative Difference of Gold in RC Field Duplicates
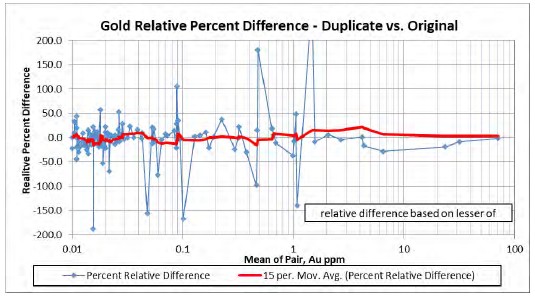
Note: a positive relative percent difference means the duplicate sample had a higher assay value than the original sample.
Figure 11-11 Absolute Value of Relative Difference of Gold in RC Field Duplicates
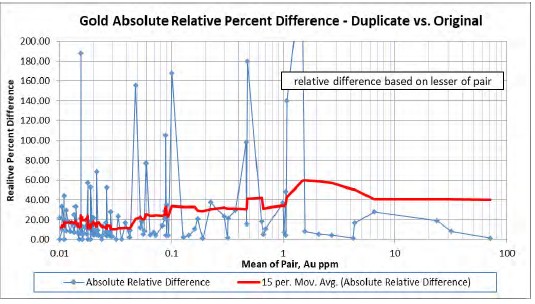
|
11.3.4.5 METALLIC-SCREEN FIRE ASSAYS
Mako completed 1,891 metallic-screen analyses of drill samples as of February 28, 2020. The screen-fire assays were compared to the standard 30g fire assays done on the same sample. A breakdown of data available and data used is given in Table 11-7. Graphs in Figure 11-12 and Figure 11-13 show plots of the maximum relative differences and the absolute values of the relative differences between metallic-screen analyses and 30g analyses. Analyzing all the data together, the maximum relative difference graph shows that, for the most part, at the lower grades (<2g Au/t) the metallic-screen assay values have a high bias (around 10%-20%) when compared to the paired 30g analyses. For the most part, except the two sets of data above around 3g Au/t, the tendency is for the metallic-screen analyses and 30g sample analyses to be similar. The absolute value of the relative difference graph shows that the relative differences are around 50% at the low grades, dropping to around 15% at the highest grades.
Table 11-7 Number of Gold Metallic-Screen Analyses
| San Albino | Las Conchitas | Total | |
| Total number of metallic-screen assays | 1,599 | 292 | 1,891 |
| Number of sample pairs with mean grade <0.4g Au/t | 911 | 151 | 1,062 |
| Number pairs with differences in grade >1000% diff. | 20 | 3 | 23 |
| Number pairs with differences in grade >1000% diff. and mean grade >0.4g Au/t | 17 | 1 | 18 |
| Data used in evaluations and graphing | 671 | 140 | 811 |
|
Figure 11-12 Maximum Relative Difference of Metallic-Screen vs. 30 Gram Fire Assay Gold Values
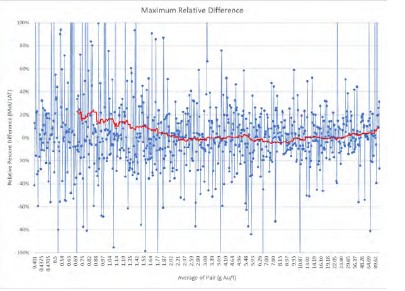
(Excluding all samples with differences of >1000%, and two samples at 3g Au/t with ~500% difference)
Figure 11-13 Absolute Value of the Relative Difference from Mean of Metallic-Screen vs. 30 Gram Fire Assay Gold
Values
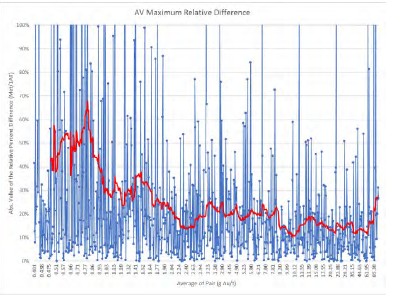
(Excluding all samples with differences of >1000%, and two samples at 3g Au/t with ~500% difference)
|
11.3.5 SAN ALBINO QA/QC 2021-2022
11.3.5.1 DRILL SAMPLE BLANKS SW SAN ALBINO DEPOSIT 2021-2022 PERIOD
Drill samples were monitored for QA/QC purposes in part by inserting blank material consisting of crushed granite or locally derived barren rock (geological blanks) every 20 samples. A total of 1,355 geological blanks were used in Mako's database for SW San Albino deposit in 2021-2022 period.
If the assayed value for Au in a certificate was indicated as being less than detection limit (<0.005) the value was assigned the value of half the detection limit (0.0025) for data treatment purposes. An upper tolerance limit of three times the detection limit (0.015) was indicated for Au.
There were 17 occasions where the Au value in the blanks were above three times the detection limit. Eleven of these samples were within intervals with insignificant gold results or other reference material in close proximity in the batches were passing, thus no further action was suggested. There were re-runs suggested to be done for six sample intervals where the blank samples were failing, however, most of the blank failures will have no significance because they are of such low-grade, and even though they represent contamination, the amount by which they contaminate the following sample(s) is very little and so far below cutoff grade.
Figure 11-14 shows all gold values in blanks and the sample numbers.
Figure 11-14 SW San Albino Blanks for Au BV Labs: 2021 and 2022
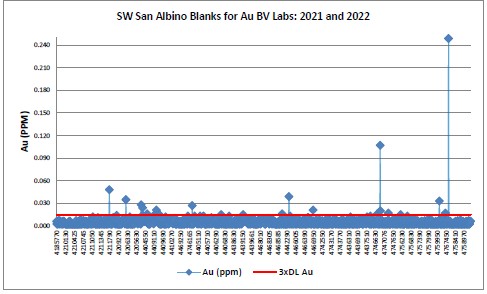
|
If the assayed value for Ag in a certificate was indicated as being less than detection limit (<0.3) the value was assigned the value of half the detection limit (0.15) for data treatment purposes. An upper tolerance limit of three times the detection limit (0.9) was indicated for Ag.
There were 12 occasions where the Ag value in the blanks were above three times the detection limit. All of these samples were within intervals with insignificant silver results or other reference material in close proximity in the batches were passing, thus no further action was suggested.
Figure 11-15 shows all silver values in blanks and the sample numbers.
Figure 11-15 SW San Albino Blanks for Ag BV Labs: 2021 and 2022
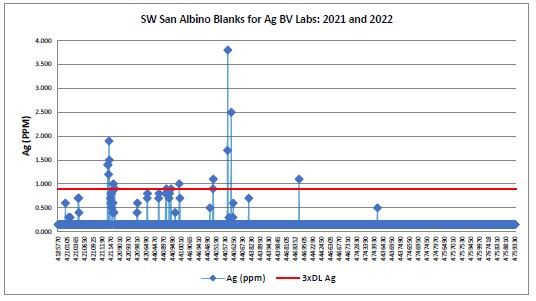
11.3.5.2 DRILL SAMPLE STANDARDS SW SAN ALBINO DEPOSIT 2021-2022 PERIOD
Drill sample QA/QC was also monitored by inserting CRMs every 20 samples for drillholes SA21-510 to SA21-512, SA21-536 partial to SA22-587, SA22-599 partial to SA22-620 partial and SA22-631 to SA22-704 with rare exceptions. CRMs were not inserted in drillholes SA21-513 to SA21-536 partial, SA22-596 to SA22- 599 partial and SA22-620 partial to SA22-631.
|
The CRMs consisted of prepackaged pulps of certified reference material. There were 932 insertions of CRMs for Au in Mako's database for SW San Albino deposit in 2021-2022 period, as summarized in Table 11-8. Six of the 932 CRMs had insufficient material for the gravimetric testing, thus do not have values for Au. The author found 20 failures (8 high and 12 low) when using the definition for failures as greater than or less than the certified grade, plus or minus three standard deviations, respectively.
Most of the failures for Au appear in CRM OREAS-235 (10) and CRM OREAS-258 (8). Almost all of them were within intervals with insignificant gold values or other reference material in close proximity in the batches were passing, thus no further action was suggested. There were re-runs suggested to be done for four sample intervals - three where OREAS-235 was failing and one where OREAS-258 was failing within samples with higher gold values. Table 11-8 summarizes the CRMs used for gold in SW San Albino in 2021-2022 and their performance.
Table 11-8 SW San Albino CRMs for Au BV Labs: 2021 and 2022
| Standard ID | Grades in g Au/ppm | Samples Used |
Failure Counts | Note | |||
| Certified Value |
3rd High Dev |
3rd Low Dev |
High | Low | |||
| OREAS-211 | 0.768 | 0.849 | 0.687 | 79 | 0 | 0 | |
| OREAS-235 | 1.590 | 1.704 | 1.476 | 228 | 3 | 7 | |
| OREAS-240 | 5.510 | 5.927 | 5.093 | 256 | 0 | 1 | |
| OREAS-241 | 6.910 | 7.837 | 5.983 | 67 | 0 | 0 | |
| OREAS-257b | 14.220 | 15.339 | 13.101 | 82 | 1 | 0 | |
| OREAS-258 | 11.150 | 11.927 | 10.373 | 214 | 4 | 4 | The standards are 220, however, there was insufficient material for following gravimetric analyses for 6 CRMs |
There were 932 insertions of CRMs for Ag in Mako's database for SW San Albino deposit in 2021-2022 period, as summarized in Table 11-9 The author found 98 failures (61 high and 37 low) when using the definition for failures as greater than or less than the certified grade, plus or minus three standard deviations, respectively. With exception of CRM OREAS-257b, all other have failures for Ag.
Almost all of the failures were within intervals with insignificant silver values or other reference material in close proximity in the batches were passing, thus no further action was suggested. There were two sample intervals where OREAS-240 was failing within samples with higher silver values for SA21-536 (batch MGA21002014 - sample 4211533) and SA22-609 (batch MGA22000342 - sample 4406463). Table 11-9 summarizes the CRMs used for silver in SW San Albino in 2021-2022 and their performance.
|
Table 11-9 SW San Albino CRMs for Ag BV Labs: 2021 and 2022
| Standard ID | Grades in g Ag/ppm | Samples Used |
Failure Counts | Note | |||
| Certified Value |
3rd High Dev |
3rd Low Dev |
High | Low | |||
| OREAS-211 | 0.205 | 0.249 | 0.160 | 79 | 16 | 0 | The standard is not suitable for Ag as the value is under the detection limit (0.3 ppm) of the assay method used. |
| OREAS-235 | 0.135 | 0.167 | 0.103 | 228 | 14 | 0 | The standard is not suitable for Ag as the value is under the detection limit (0.3 ppm) of the assay method used. |
| OREAS-240 | 1.300 | 1.560 | 1.040 | 256 | 25 | 20 | |
| OREAS-241 | 1.710 | 1.980 | 1.440 | 67 | 2 | 13 | |
| OREAS-257b | 14.220 | 15.339 | 13.101 | 82 | 0 | 0 | |
| OREAS-258 | 11.150 | 11.927 | 10.373 | 220 | 4 | 4 | |
11.3.5.3 DUPLICATE DRILLING SAMPLES SW SAN ALBINO DEPOSIT 2021-2022 PERIOD
Mako inserted coarse duplicates every 20 samples. Statistical analyses were applied to the accumulated 2021- 2022 coarse duplicate data in order to obtain an indication of precision. The data set consisted of 1,150 coarse duplicate pairs for Au and Ag.
Scatter plots for Au coarse duplicates in different cutoffs are presented in Figures 11-16 to 11-20.
Thompson-Howarth Precision Plot Figure 11-21 as well as graph of the Mean of the Sample Pair versus the Absolute Relative Difference of the Sample Pair (ARD plot) Figure 11-22 were created and compared for Au.
As a rule of thumb, if 90 percent of the coarse duplicates for Au have a relative difference within ±20 percent (best practice) and ±30 percent (acceptable practice), the preparation protocol can be considered to provide good precision.
The cumulative coarse duplicate data for gold yielded value of 32.7% for T-H Precision Plot and 15% for the ARD Precision Plot.
|
Figure 11-16 SW San Albino Scatter Plot Au Coarse Duplicates (150 PPM) 2021-2022
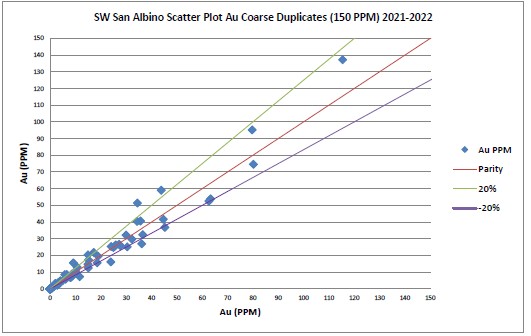
Figure 11-17 SW San Albino Scatter Plot Au Coarse Duplicates (80 PPM) 2021-2022
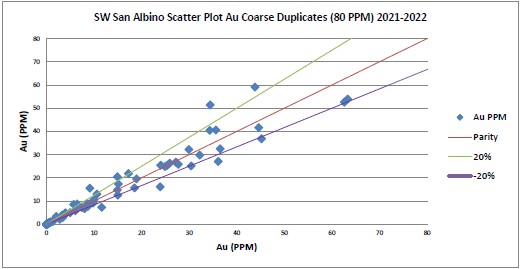
 |
Figure 11-18 SW San Albino Scatter Plot Au Coarse Duplicates (5 PPM) 2021-2022
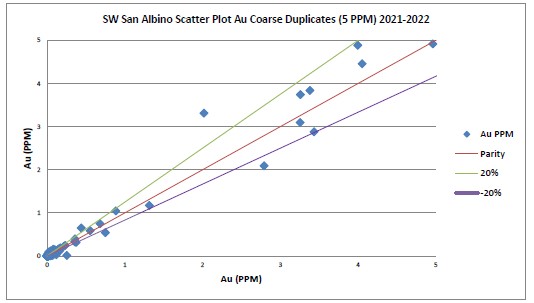
Figure 11-19 SW San Albino Scatter Plot Au Coarse Duplicates (1 PPM) 2021-2022
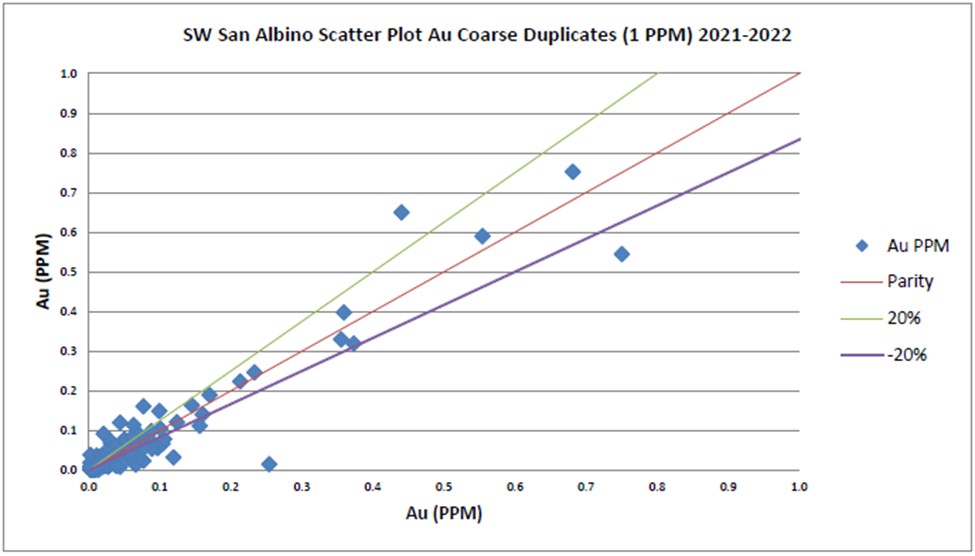
|
Figure 11-20 SW San Albino Scatter Plot Au Coarse Duplicates (0.5 PPM) 2021-2022
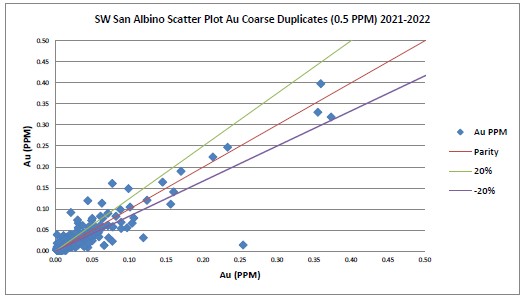
Figure 11-21 SW San Albino Thompson-Howarth Precision Plot for Au Coarse Duplicates: 2021 - 2022
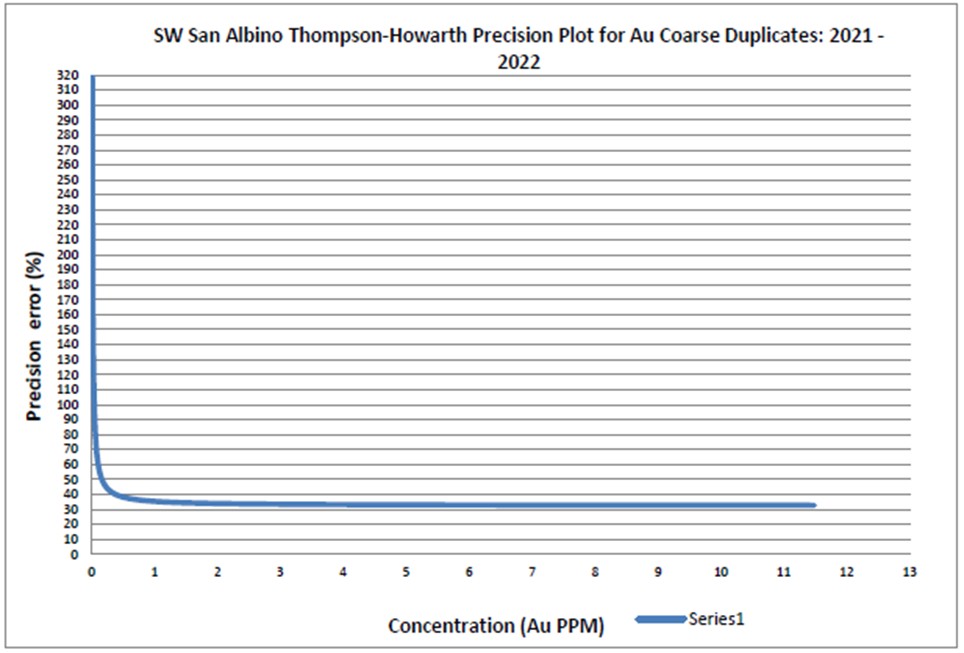
|
Figure 11-22 SW San Albino Mean of Sample Pair Versus Absolute Relative Difference of Sample Pair
Au Duplicate Pairs: Coarse Duplicates, 2021 - 2022
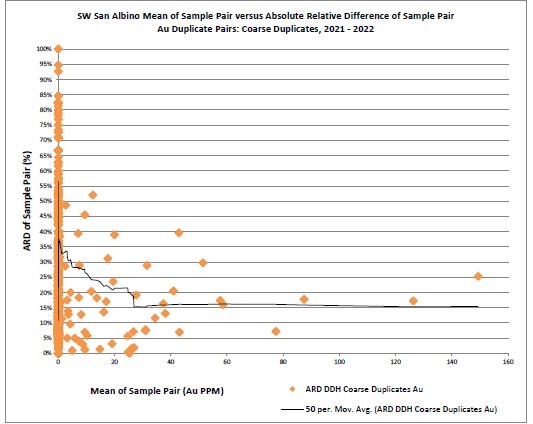
Scatter plots for Ag coarse duplicates in different cutoffs are presented in Figures 11-23 to 11-26.
Thompson-Howarth Precision Plot Figure 11-27 as well as graph of the Mean of the Sample Pair versus the Absolute Relative Difference of the Sample Pair (ARD plot) Figure 11-28 were created and compared for Ag. As a rule of thumb, if 90 percent of the coarse duplicates for Ag have a relative difference within ±20 percent (best practice) and ±30 percent (acceptable practice), the preparation protocol can be considered to provide good precision.
The cumulative coarse duplicate data for silver yielded value of 30% for T-H Precision Plot and 21% for the ARD Precision Plot.
|
Figure 11-23 SW San Albino Scatter Plot Ag Coarse Duplicates (120 PPM) 2021-2022
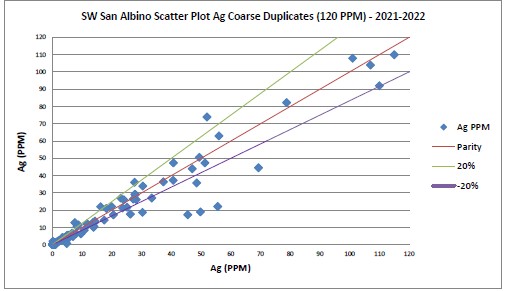
Figure 11-24 SW San Albino Scatter Plot Ag Coarse Duplicates (80 PPM) 2021-2022
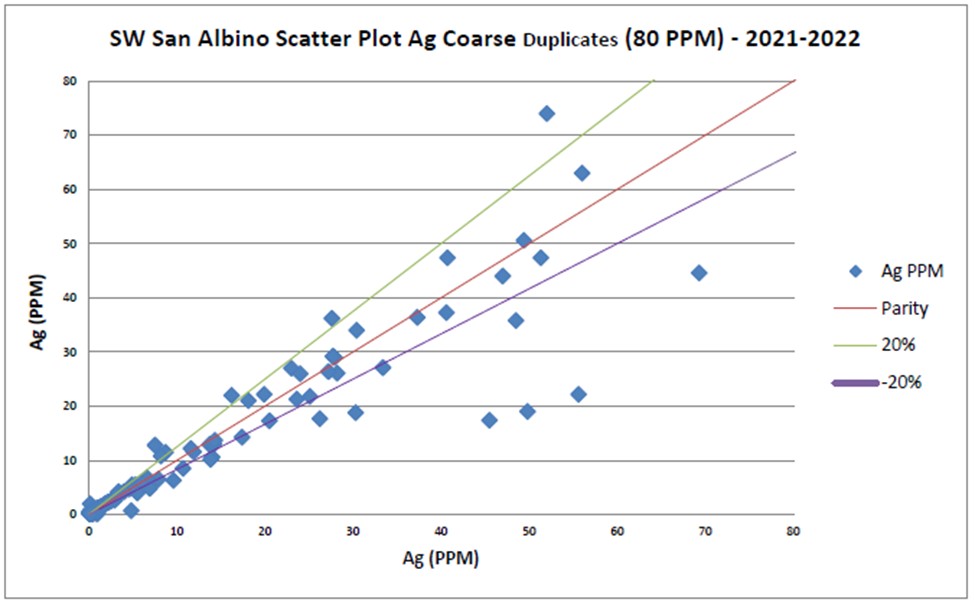
|
Figure 11-25 SW San Albino Scatter Plot Ag Coarse Duplicates (40 PPM) - 2021-2022
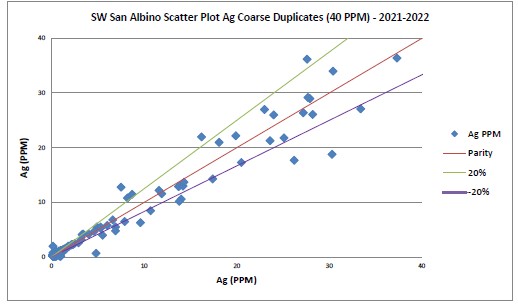
Figure 11-26 SW San Albino Scatter Plot Ag Coarse Duplicates (5 PPM) 2021-2022
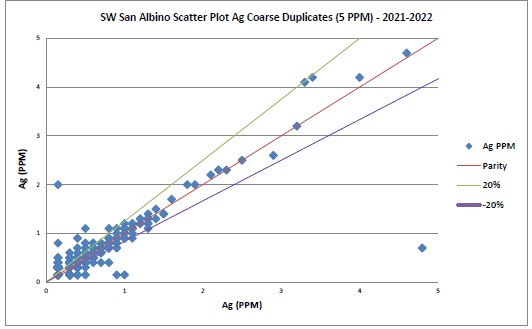
|
Figure 11-27 SW San Albino Thompson-Howarth Precision Plot for Ag Coarse Duplicates: 2021-2022
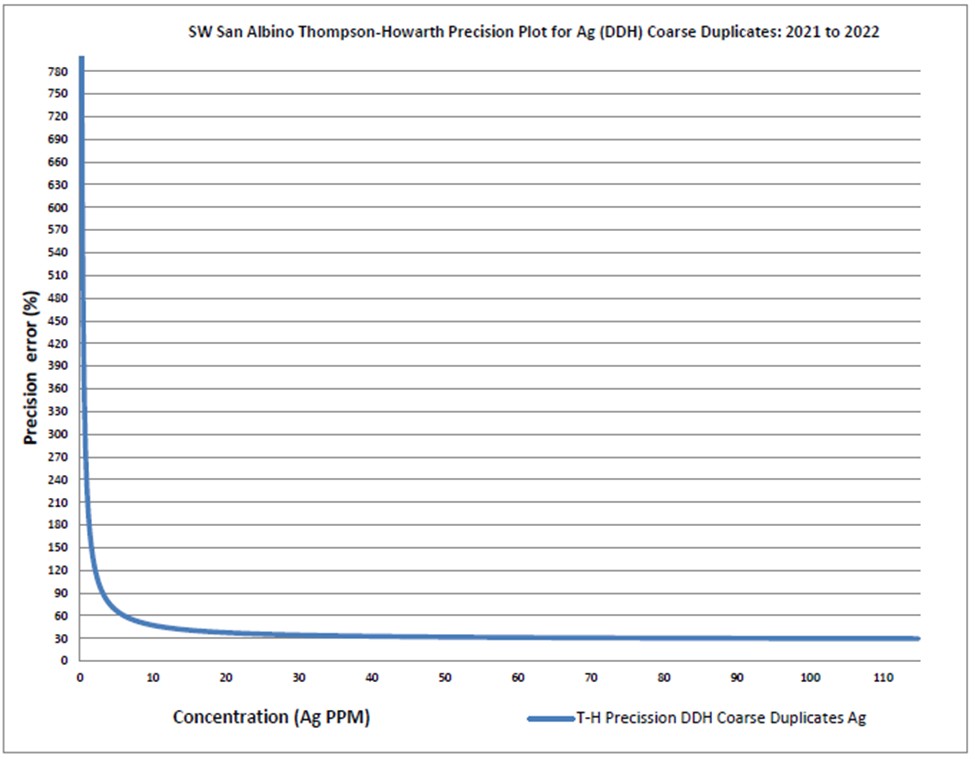
|
Figure 11-28 SW San Albino Mean of Sample Pair Versus Absolute Relative Difference of Sample Pair
Ag Duplicate Pairs: Coarse Duplicates, 2021 - 2022
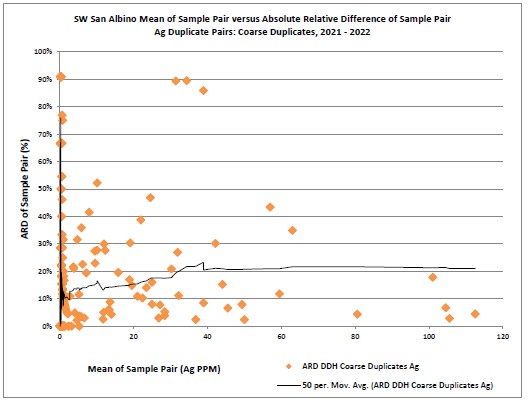
|
11.3.6 LAS CONCHITAS PROJECT TRENCH OR CHANNEL SAMPLES
Table 11-10 and Table 11-11 summarize the numbers of QA/QC samples in the trench assay database and the ratios of QA/QC samples to real samples.
Table 11-10 Counts of QA/QC Samples in Trench Channel Samples
| Year | Pulp Duplicates | Standards | Blanks | Samples |
| 2012 | 16 | 0 | 15 | 737 |
| 2013 | 30 | 43 | 39 | 631 |
| 2017 | 72 | 75 | 84 | 1,924 |
| 2018 | 11 | 13 | 13 | 417 |
| 2019 | 57 | 58 | 60 | 1,020 |
| 2020 | 17 | 17 | 21 | 305 |
| 2021 | 59 | 16 | 63 | 946 |
| 2022 | 33 | 1 | 32 | 481 |
Table 11-11 QA/QC Sample Ratios in Trench Channel Samples
| Year | Pulp Duplicates | Standards | Blanks | All QA/QC |
| 2012 | 2.2 % | 0 % | 2.0 % | 4.2 % |
| 2013 | 4.8 % | 6.8 % | 6.2 % | 17.7 % |
| 2017 | 3.7 % | 3.9 % | 4.4 % | 12.0 % |
| 2018 | 2.6 % | 3.1 % | 3.1 % | 8.9 % |
| 2019 | 5.6 % | 5.7 % | 5.9 % | 17.2 % |
| 2020 | 5.6 % | 5.6 % | 6.9 % | 18.0 % |
| 2021 | 6.2 % | 1.7 % | 6.7 % | 14.6 % |
| 2022 | 6.9 % | 0.2 % | 6.7 % | 13.7 % |
Starting in 2013, the ratios of analyses of QA/QC samples to those of real samples has been 12% or greater in all years except 2018. However, it is noteworthy that in 2021 and 2022, relatively few standards were analyzed with the samples from trenches.
11.3.6.1 STANDARDS IN CHANNEL SAMPLES
Terminology
Descriptions of some terms used in this discussion to describe the performance of standards follow.
Target Value: also sometimes called the "expected value", this is the certified value of gold or silver in a standard, as stated by the supplier.
|
Specification Limits4: limits within which an analyses is deemed to be acceptable based on information supplied with a standard. The author uses Equation 3 to establish specification limits.

Control Limits: limits based on the performance of the lab analyzing the samples. The calculation is like that for specification limits but uses the average and standard deviation obtained by the lab being monitored. When a standard first enters use at any given lab the control limits will not be known as there will not be any data available for the calculation. The author uses Equation 4 to establish control limits.

Performance Ratio: Usually abbreviated as "Pp", This is a term used more in industrial process control than in monitoring the performance of laboratories analyzing mineral samples, but the author finds it useful. For the purpose of the present discussion it can be thought of as the ratio of the expected standard deviation (per specifications) to the achieved standard deviation, as in Equation 5.

The performance ratio as calculated using Equation 5 is a useful way of comparing a lab's precision to the precision implied by the specifications for a standard. However, it fails to account for accuracy or bias. To overcome this the author also looks at "Performance Ratio Taking into Account Process Centering", usually abbreviated as "Ppk". Ppk can be thought of as the performance ratio reduced as bias increases.
In a perfect world Pp and PpK would be 1. In the real world, the author considers performance ratios in the range of 0.5 to 1.5 to be acceptable. Performance ratios outside these limits do not necessarily mean that data are unacceptable but do mean that the reasons for such deviations and their possible consequences should be understood.
Gold in Standards
Table 11-12 (page 113) contains a summary of the results of gold analyses of standards analyzed with batches of samples from trenches for the years 2012 - 2022. The results are good.
/ There are only two high-side failures, for a failure rate of less than 1% on the high side.
_________________________________
4 Specification Limits may also be called "Control Limits" in some reports. The author prefers to make a distinction between the two. As used in this discussion the former measure performance against an external specification whereas the latter measure a lab's internal performance.
|
/ There are five or six low-side failures, depending on whether control limits or specifications are used to designate failures. This is less than 3% failures on the low side.
/ Biases relative to target values are all within ±5%. In the author's experience biases within this range are typical for the industry. The greatest-magnitude bias, -4.3% in OREAS 211, is based on only one analysis of that standard, so it means very little.
/ Except for standard OREAS 203, the performance ratios, Pp and PpK, are, in the author's experience, typical for the industry. In the case of OREAS 203 the Pp and PpK are 7.5 and 6.7 respectively, which are very high. However, the performance ratio calculations are based on only three analyses of OREAS 203, too few for statistics to have much meaning.
If there is a criticism to be made of the data for analyses of standards in batches of samples from the trenches, it is that many of the standards were used too few times in this data set for meaningful statistics to be derived from them. The number of different standards could be reduced while still maintaining a useful range of target values. This would increase the number of analyses of each standard, allowing for more robust statistical evaluations.
Silver in Standards
Table 11-13 (page 114) contains a summary of the results of silver analyses of standards analyzed with batches of samples from trenches for the years 2012 - 2022. Fewer of the standards used by Mako have certified values for silver, and three of those have certified values below the detection limit for Mako's analytical method. The results for the silver analyses are more problematic than the results for gold.
/ Two of the biases have magnitudes of close to 10% (OREAS 226 and OREAS 229b).
/ The performance ratios are unusually low in OREAS 216b and OREAS 229b.
/ On the positive side, two of the standards, OREAS 66a and OREAS 210, have reasonably good results. OREAS 66a is the highest-grade of the silver standards and the only one routinely assayed using a fire assay - gravimetric method.
Figure 11-29 is a control chart that illustrates the issues with silver in OREAS 229b. The average of the analyses is more than 10% higher than the target value. The spread between the lower and upper control limits is much broader than the spread between the lower and upper specification limits, indicating that the precision of the laboratory is significantly less than the precision obtained during the certification process for the standard, resulting in the low performance ratios seen in Table 11-12 for this standard.
The low-side failure seen in Figure 11-29 is quite extreme. It is more likely to be due to a sample mix-up than an analytical failure, but the cause cannot be determined with certainty.
|
Figure 11-29 Control Chart for Silver in OREAS 229b
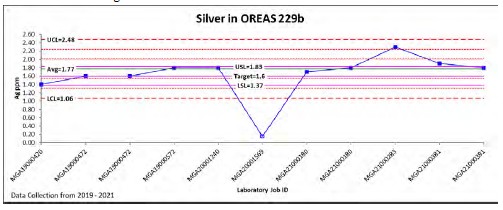
|
Table 11-12 Summary of Gold Results for Analyses of Standards with Channel (Trench) Samples
| Standard ID | Grades, ppm Gold | Count | Dates | Fails per Specs | Bias pct | Pp | PpK | Fails per Cntrl Lmts | ||||||
| Target | Average | Maximum | Minimum | Start | End | High | Low | High | Low | |||||
| OREAS 10c | 6.6 | 6.581 | 6.958 | 6.079 | 14 | 2013 | 2013 | 0 | 1 | -0.29 | 0.6 | 0.6 | 0 | 0 |
| OREAS 12a | 11.79 | 11.76 | 12.0 | 9.5 | 16 | 2013 | 2013 | 0 | 1 | -0.25 | 0.9 | 0.8 | 0 | 1 |
| OREAS 66a | 1.237 | 1.278 | 1.355 | 1.217 | 9 | 2013 | 2013 | 0 | 0 | 3.31 | 1.2 | 0.9 | 0 | 0 |
| OREAS 203 | 0.871 | 0.881 | 0.885 | 0.877 | 3 | 2013 | 2013 | 0 | 0 | 1.15 | 7.5 | 6.7 | 0 | 0 |
| OREAS 204 | 1.043 | 1.042 | 1.194 | 1.002 | 31 | 2017 | 2017 | 1 | 0 | -0.1 | 1.6 | 1.5 | 1 | 0 |
| OREAS 208 | 9.248 | 9.392 | 9.898 | 8.426 | 26 | 2017 | 2017 | 0 | 0 | 1.56 | 1.3 | 1.2 | 0 | 0 |
| OREAS 210 | 5.49 | 5.489 | 5.742 | 4.687 | 39 | 2017 | 2019 | 0 | 1 | -0.02 | 1.3 | 1.3 | 0 | 1 |
| OREAS 211 | 0.768 | 0.735 | 0.735 | 0.735 | 1 | 2022 | 2022 | 0 | 0 | -4.3 | n/a | n/a | 0 | 0 |
| OREAS 216b | 6.66 | 6.722 | 7.056 | 6.395 | 6 | 2020 | 2020 | 0 | 0 | 0.93 | 0.7 | 0.6 | 0 | 0 |
| OREAS 221 | 1.062 | 1.063 | 1.098 | 1.042 | 7 | 2019 | 2020 | 0 | 0 | 0.09 | 1.9 | 1.9 | 0 | 0 |
| OREAS 222 | 1.22 | 1.217 | 1.245 | 1.029 | 11 | 2018 | 2019 | 0 | 2 | -0.25 | 1.4 | 1.3 | 0 | 2 |
| OREAS 226 | 5.45 | 5.573 | 5.675 | 5.488 | 5 | 2019 | 2019 | 0 | 0 | 2.26 | 1.4 | 1.0 | 0 | 0 |
| OREAS 228 | 8.73 | 8.63 | 8.876 | 8.282 | 5 | 2017 | 2019 | 0 | 0 | -1.15 | 1.1 | 1.0 | 0 | 0 |
| OREAS 229 | 12.11 | 11.98 | 12.2 | 11.8 | 14 | 2018 | 2020 | 0 | 0 | -1.07 | 1.9 | 1.5 | 0 | 0 |
| OREAS 229b | 11.95 | 12.11 | 12.6 | 0.006 | 10 | 2019 | 2021 | 0 | 1 | 1.34 | 1.0 | 0.8 | 0 | 1 |
| OREAS 232 | 0.902 | 0.872 | 0.894 | 0.854 | 6 | 2021 | 2022 | 0 | 0 | -3.33 | 1.4 | 0.8 | 0 | 0 |
| OREAS 239 | 3.55 | 3.591 | 3.591 | 3.591 | 1 | 2019 | 2019 | 0 | 0 | 1.15 | n/a | n/a | 0 | 0 |
| OREAS 253 | 1.22 | 1.206 | 1.388 | 1.156 | 7 | 2019 | 2020 | 1 | 0 | -1.15 | 1.2 | 1.0 | 1 | 0 |
| OREAS 256 | 7.66 | 7.795 | 8.003 | 7.445 | 10 | 2019 | 2021 | 0 | 0 | 1.76 | 1.2 | 1.0 | 0 | 0 |
| Count: | 221 | 2 | 6 | 2 | 5 | |||||||||
| Percent: | 100 | 0.9 | 2.7 | 0.9 | 2.3 | |||||||||
| Min: | 1 | 0 | 0 | 0 | 0 | |||||||||
| Max: | 39 | 1 | 2 | 1 | 2 | |||||||||
Note: The total count of analyses in Table 11-12 is 221, whereas the total count of standards in Table 11-10 is 223. Two analyses from 2013 are not included in Table 11-12 because the analyses were over-limit and the samples were not re-analyzed using a higher-limit method.
|
Table 11-13 Summary of Silver Results for Analyses of Standards with Trench Samples
| Standard ID | Grades, ppm Silver | Count | Dates | Fails per Specs | Bias pct | Pp | PpK | Fails per Cntrl Lmts | ||||||
| Target | Average | Maximum | Minimum | Start | End | High | Low | High | Low | |||||
| OREAS 66a | 18.9 | 18.1 | 19.3 | 17.0 | 9 | 2013 | 2013 | 0 | 0 | -4.23 | 1.714 | 1.333 | 0 | 0 |
| OREAS 210 | 0.943 | 0.944 | 1.2 | 0.7 | 39 | 2017 | 2019 | 0 | 0 | 0.11 | 0.969 | 0.966 | 0 | 0 |
| OREAS 211 | 0.214 | 0.15 | 0.15 | 0.15 | 1 | 2022 | 2022 | 0 | 1 | -29.91 | n/a | n/a | 0 | 0 |
| OREAS 216b | 1.09 | 1.133 | 1.3 | 0.15 | 6 | 2020 | 2020 | 1 | 3 | 3.94 | 0.340 | 0.246 | 0 | 3 |
| OREAS 226 | 0.904 | 0.82 | 0.9 | 0.7 | 5 | 2019 | 2019 | 0 | 1 | -9.29 | 0.880 | 0.507 | 0 | 0 |
| OREAS 229b | 1.6 | 1.77 | 2.3 | 0.15 | 11 | 2019 | 2021 | 2 | 1 | 10.63 | 0.322 | 0.082 | 0 | 1 |
| OREAS 232 | 0.093 | 0.508 | 0.6 | 0.15 | 6 | 2021 | 2021 | 6 | 0 | 446.24 | 0.039 | -0.730 | 0 | 0 |
| OREAS 239 | 0.244 | 0.15 | 0.15 | 0.15 | 1 | 2019 | 2019 | 0 | 1 | -38.52 | n/a | n/a | 0 | 0 |
| Sum or Count: | 78 | 3 (9) | 5 (7) | 0 | 4 | |||||||||
| Percent: | 100 | 3.8 | 6.4 | 0 | 5.1 | |||||||||
| Min: | 1 | 0 | 0 | 0 | 0 | |||||||||
| Max: | 39 | 2 (6) | 3 | 0 | 3 | |||||||||
Note: The target silver values for standards OREAS 211, OREAS 232 and OREAS 239 are lower than the detection limit for the analytical method in use. Results for those standards and calculations including them are greyed and italicized. Silver results for those standards should be disregarded.
|
11.3.6.2 DUPLICATES IN CHANNEL SAMPLES
Terminology
The author evaluates all types of duplicates using scatterplots, linear regressions, relative difference plots and correlation coefficients. Most of these are standard tools of basic statistics and need not be explained here. Relative difference is a less common term and can be ambiguous, with the term being applied to at least six different ways of the doing the calculation, each giving a different outcome. The author used two ways of calculating relative differences expressed as percentages in this study, as shown in Equation 1 and Equation 2 in Section 11.3.4.1.3.
All the relative differences presented in this discussion were calculated using Equation 1.
Mako advises the author that the duplicate analyses included in the data set for channel samples are field duplicates. Ristorcelli et al. described channel sample duplicates collected at the San Albino deposit as follows:
"Duplicates were collected by sampling the same channel, either beside or deeper into the channel, twice and analyzing each sample separately." The author understands that duplicates from the trenches at Las Conchitas were collected in a similar manner.
Table 11-14 contains a summary of the results obtained for gold and silver in field duplicate samples from trenches at Las Conchitas. The author separated the gold data by analytical method, as indicated in the table and the notes below it.
Collecting duplicate channel samples in trenches is difficult. Differences due to natural geological heterogeneity are compounded by inevitable sampling differences. This is reflected in the high absolute relative differences indicated in Table 11-14.
The three calculated average relative differences for gold in Table 11-14 are all positive, showing that the duplicate samples tend to have higher gold grades than the originals. The author has no basis to ascribe a high gold bias in the duplicates to any specific cause or causes, although sampling bias is one likely suspect.
For silver, the duplicate samples tend to have lower grades, the opposite of the observed tendency for gold. As with gold, the author has no basis to ascribe the low silver bias in the duplicates to any specific cause or causes.
|
Table 11-14 Summary of Results for Field Duplicates in Trench Channel Samples
| Analyte | Counts | Averages of Relative Differences as Percent |
Correlation Coefficient |
|||
| Pairs Available |
Pairs Used |
Outliers | Relative Diff | Abs Rel Diff | ||
| Au (AA) | 284 | 248 | 8 | 6.0 | 47.2 | 0.88 |
| Au (GV) | 7 | 7 | 0 | 16.4 | 19.1 | 0.99 |
| Au (met) | 7 | 7 | 0 | 6.1 | 78.7 | 0.70 |
| Ag (AR) | 297 | 93 | 2 | -9.6 | 72.2 | 0.90 |
Notes: Relative differences in Table 11-13 were calculated using Equation 1
(AA) indicates analysis using fire assay preparation with an atomic absorption finish.
(GV) indicates analysis using fire assay preparation with a gravimetric finish.
(met) indicates a screened metallic analysis.
(AR) indicates an aqua regia digestion with an ICP finish.
"Pairs Used" excludes outliers & any pairs with an analysis below detection limits.
11.3.6.3 BLANKS IN CHANNEL SAMPLES
The author evaluates results for blanks using charts similar to Figure 11-30. Such charts show the analysis obtained for the blank along with the analysis of the sample numerically preceding the blank. This is done to obtain a quick visual impression as to whether blanks analyzed immediately after higher-grade samples tend to register higher grades than blanks following lower grade samples. For this to be useful, the lab must process samples through the same circuits in numerical sequence.
The charts for blanks also show a "warning limit", set for the Las Conchitas blanks at five times the lower detection limit for the analytical method used5. The choice of where to set a warning limit is rather arbitrary, and it should not be seen as a failure limit, only as a warning to look more closely at the blank and adjacent samples and consider the implications of the observed assays.
Figure 11-30 through Figure 11-33 illustrate the results obtained from blanks in channel samples from trenches. There are two plots for each of gold and silver because the data were split into earlier and later sets to make the plots more legible.
Comments relating to the gold analyses of blanks are:
/ There is some evidence that there may be a degree of sample-to-sample contamination in the lab, as evidenced by a few cases in which gold grades reported for the blanks spike upwards when the preceding sample has a high gold grade. Such events were more common in the 2012-2018 period than in the 2019- 2023 period, although the most extreme such case occurred in 2019, in laboratory job MGA19000185. A blank for which 0.105 ppm Au was reported was immediately preceded by a sample reported to contain 45.82 ppm Au.
___________________________________
5 In section 11.3.5.1 Ray uses the term "tolerance limit" and sets it at three times the lower detection limit. These differences are due to individual authors' preferences and judgment.
|
/ In only three cases did the reported gold grade in a blank exceed the warning limit.
Figure 11-30 Gold in Blanks and in Preceding Samples, Trenches, 2012 - 2018
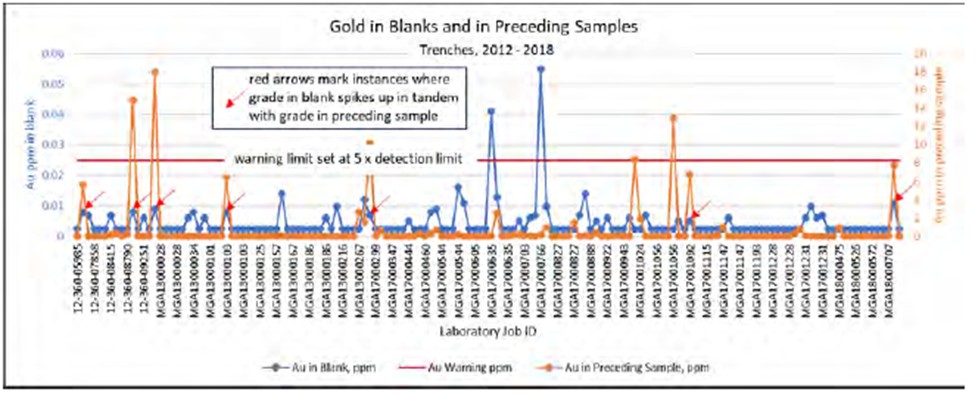
Figure 11-31 Gold in Blanks and in Preceding Samples, Trenches, 2019 - 2023
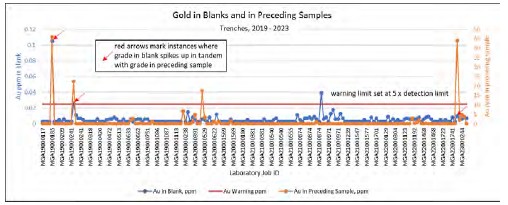
Comments relating to the silver analyses of blanks are:
/ There are few cases in which silver grades appear to spike upwards in blanks that follow samples with high silver grades. There are apparently no such cases in the data for the 2019-2023 period.
|
/ Only one silver analysis exceeds the warning limit.
/ There is a pattern of clusters of higher silver analyses of blanks interspersed among longer periods of time with only below-detection-limit grades reported. This is particularly evident in the data for 2019- 2023.
Figure 11-32 Silver in Blanks and in Preceding Samples, Trenches, 2012 - 2018
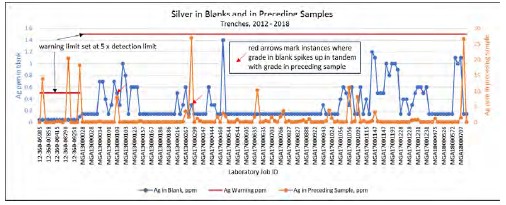
Figure 11-33 Silver in Blanks and in Preceding Samples, Trenches, 2019 - 2023
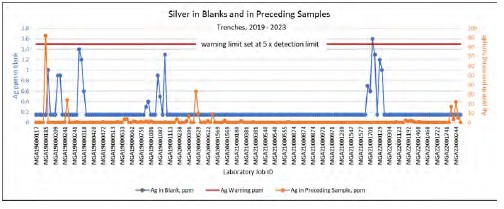
|
11.3.6.4 CONCLUDING COMMENT ON QA/QC DATA FOR CHANNEL SAMPLES
A few issues have been pointed out in sections 11.3.6.1, 11.3.6.2 and 11.3.6.3. The numbers and types of issues are typical of mineral exploration projects. Overall, the QA/QC data for trench samples are good and the data support the use of data from trench samples as described in section 14.0
11.3.7 LAS CONCHITAS PROJECT DRILL SAMPLES
Table 11-15 and Table 11-16 summarize the numbers of QA/QC samples in the drill assay database and the ratios of QA/QC samples to real samples. The tables show that the QA/QC programs have included adequate numbers of preparation duplicates and blanks since the inception of drilling at Las Conchitas. Adequate numbers of standards have been used since 2013. Field duplicates and pulp duplicates have been analyzed in much smaller numbers and aren't major components of the QA/QC data. Since 2013 QA/QC samples have comprised between about 17% and 19% of the samples analyzed.
Table 11-15 Counts of QA/QC Samples in Drill Samples
| Year | Field Duplicates | Preparation Duplicates | Pulp Duplicates | Standards | Blanks | Samples |
| 2011* | 9 | 84 | 6 | 65 | 1,179 | |
| 2012* | 11 | 1 | 9 | 184 | ||
| 2013 | 49 | 50 | 51 | 847 | ||
| 2018 | 103 | 93 | 95 | 1,690 | ||
| 2019 | 330 | 3 | 270 | 273 | 4,646 | |
| 2020 | 2 | 596 | 295 | 706 | 976 | 13,608 |
| 2021 | 11 | 551 | 136 | 464 | 806 | 11,263 |
| 2022! | 5 | 2,212 | 56 | 1,575 | 3,000 | 40,424 |
Notes: *Field duplicates and standards analyzed with samples from 2011 & 2012 were in fact analyzed in 2017.
!Counts for 2022 do not include assays for 584 samples and the associated QA/QC data which were received after the QA/QC evaluation was completed.
Table 11-16 QA/QC Sample Ratios in Drill Samples
| Year | Field Duplicates | Preparation Duplicates | Pulp Duplicates | Standards | Blanks | All QA/QC |
| 2011 | 0.8 % | 7.1 % | 0.5 % | 5.5 % | 13.9 % | |
| 2012 | 6.0 % | 0.5 % | 4.9 % | 11.4 % | ||
| 2013 | 5.8 % | 5.9 % | 6.0 % | 17.7 % | ||
| 2018 | 6.1 % | 5.5 % | 5.6 % | 17.2 % | ||
| 2019 | 7.1 % | 0.1 % | 5.8 % | 5.9 % | 18.9 % | |
| 2020 | 0.0 % | 4.4 % | 2.2 % | 5.2 % | 7.2 % | 18.9 % |
| 2021 | 0.1 % | 4.9 % | 1.2 % | 4.1 % | 7.2 % | 17.5 % |
| 2022 | 0.0 % | 5.5 % | 0.1 % | 3.9 % | 7.4 % | 16.9 % |
|
11.3.7.1 STANDARDS IN DRILLHOLE SAMPLES
In this discussion of standards the author uses various terms as described in section 11.3.6.1 on page 109.
Gold in Standards
Table 11-17 contains a summary of results for gold analyses of standards included with batches of samples from drillholes. Results are generally good, with a few exceptions:
/ Biases are within normal acceptable ranges.
/ Failure counts are low for the most part although a few higher failure counts stand out:
» Using the specifications, six percent of the analyses of OREAS 235 are failures, mostly on the low side. This is largely due to the analyses obtained by Mako having a greater standard deviation than is in the specifications. The lab's accuracy is good but its precision for analyses of this standard is mediocre.
» Using the specifications, six percent of the analyses of OREAS 258 show as failures, in this case mostly on the high side. However, this is very misleading. Of 15 high-side "failures", nine are cases in which the initial analysis was over a 10 ppm Au limit for the analytical method, and higher-limit analyses couldn't be done for lack of sufficient remaining material. Mako entered the analyses for these samples into the database at a default value of 12.5 ppm Au. For this standard, 12.5 ppm is a high-side failure. The author considers these nine cases as failures, but procedural and data management failures rather than analytical failures. For OREAS 258 the proportion of failures with an actual reported analysis available is 3%.
Mako's Response to Failures
The author reviewed actions taken by Mako in response to apparent failures of gold analyses of standards in batches of samples from drillholes. Mako provided a set of assay batch files representing re-runs of samples. The author made a list of re-run samples and compared it to a list the 88 high or low gold failures. This led to the following observations:
/ Selected samples were re-run from two batches that each contained one extreme failure on the low side. The new results obtained were not significantly different from the original gold assays. Mako apparently elected to retain the original gold assays in the database, a decision which the author considers reasonable.
/ A re-run of a standard whose original assay was an extreme failure on the high side was requested but could not be performed because of insufficient material. In any case, re-running only the standard would not have provided useful information. Nearby samples all had reported grades of 0.02 ppm Au or less, so no samples having a material effect on the resource estimate were affected.
|
/ In 85 instances of failures of varying severity the author did not find any record of re-runs. In 77 such instances the grades of nearby samples were low enough that re-runs were, in the author's opinion, not necessary. In eight such instances, the author believes that re-runs would have been prudent. However, the oversight has little to no material impact on the resource estimate for Las Conchitas described in this report.
Silver in Standards
Table 11-18 contains a summary of results for silver analyses of standards included with batches of samples from drillholes. Compared to the results for gold, the results for silver are poor:
/ Failure counts relative to specifications for the standards are high for all but two of the standards. The two exceptions are OREAS 66a with a target value of 18.9 ppm Ag and OREAS 275b with a target value of 2.36 ppm Ag. Notably, these happen to be the two standards with the highest silver grades.
/ Biases also tend to have large magnitudes, with again the same two exceptions plus one other, OREAS 210 with a target value of 0.943 ppm Ag.
/ The performance ratios (Pp and PpK) for six of the standards are 0.5 or less, indicating that the analyses obtained by Mako have large standard deviations relative to expectations based on the specifications for the standards. This suggests low precision in the silver analyses, compared to the specifications.
A table such as Table 11-18 with simple statistics for each standard is a concise way of presenting results but necessarily obscures details. For example, the table shows four high-side failures for OREAS 210, but Figure 11-34 shows the same information with additional useful context. All four high-side failures occurred in the period of September-October 2018, and all four have similar magnitudes. They are interspersed with accurate analyses of the same standard during the same time period. These four high-side failures might indicate analytical problems, but the evidence suggests an alternative that they may be due to sample mix-ups.
|
Figure 11-34 Silver in Oreas 210
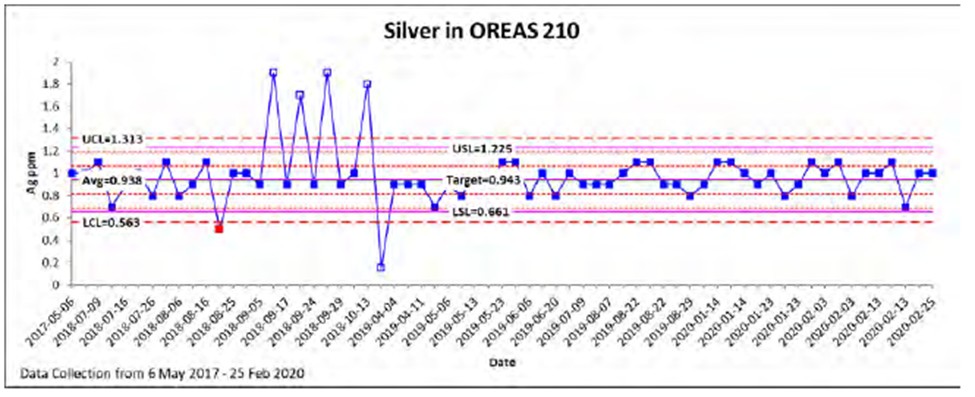
Note: Analyses with hollow markers in Figure 11-34 were not used in calculating the average and control limits for OREAS 210.
Figure 11-35 further exhibits some of the issues with silver analyses. There are two distinct patterns on the chart. Up to the end of March, 2022 the silver analyses average 1.62 ppm Ag, 25% higher than the target value of 1.30 ppm Ag. Thereafter the silver analyses average 1.31 ppm Ag, effectively the same as the target value. However, even though the average looks good in the post-March period, there are a great many low-side failures. In fact, many analyses are reported below the detection limit, shown by the hollow markers in Figure 11-35.
Figure 11-35 Silver in Oreas 240
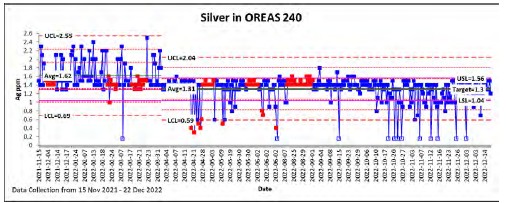
Note: Analyses with hollow markers in Figure 11-35 were not used in calculations of the average and control limits for OREAS 240.
|
With the exceptions of OREAS 66a and OREAS 275b the results obtained from analyses of silver in the standards used with drillhole samples at Las Conchitas are problematic. This is less of an issue than it might have been if silver were a major driver of the value of the deposit. Two considerations are:
/ The standards in use were selected for their gold grades, and most have low silver target grades.
/ Good results were obtained for the single standard with a high silver target grade, OREAS 66a, although there are few analyses of this standard, only thirteen.
The writer suggests that if silver is important enough to be included in future resource estimates, results obtained for silver in standards should be monitored more closely and standards should be used that have a range of silver target values at grades that might be important.
|
Table 11-17 Summary of Gold Results for Analyses of Standards with Drillhole Samples
| Standard ID | Grades, ppm Gold | Count | Dates | Fails per Specs | Bias pct | Pp | PpK | Fails per Cntrl Lmts | ||||||
| Target | Average | Maximum | Minimum | Start | End | High | Low | High | Low | |||||
| OREAS 10c | 6.600 | 6.480 | 6.763 | 6.238 | 16 | 31-Jul-13 | 10-Sep-13 | 0 | 0 | -1.8 | 0.9 | 0.7 | 0 | 0 |
| OREAS 12a | 11.790 | 11.650 | 12.000 | 11.200 | 15 | 31-Jul-13 | 10-Sep-13 | 0 | 0 | -1.2 | 0.9 | 0.7 | 0 | 0 |
| OREAS 66a | 1.237 | 1.240 | 1.328 | 1.171 | 13 | 31-Jul-13 | 10-Sep-13 | 0 | 0 | 0.2 | 1.4 | 1.3 | 0 | 0 |
| OREAS 203 | 0.871 | 0.872 | 0.937 | 0.795 | 6 | 31-Jul-13 | 2-Sep-13 | 0 | 0 | 0.1 | 0.6 | 0.6 | 0 | 0 |
| OREAS 204 | 1.043 | 1.045 | 1.272 | 0.982 | 25 | 6-May-17 | 23-May-19 | 1 | 0 | 0.2 | 1.3 | 1.3 | 1 | 0 |
| OREAS 208 | 9.248 | 9.476 | 9.893 | 4.956 | 26 | 6-May-17 | 7-Aug-19 | 0 | 1 | 2.5 | 2.1 | 1.7 | 0 | 1 |
| OREAS 210 | 5.490 | 5.472 | 5.760 | 5.211 | 65 | 6-May-17 | 25-Feb-20 | 0 | 0 | -0.3 | 1.2 | 1.1 | 0 | 0 |
| OREAS 211 | 0.768 | 0.768 | 0.846 | 0.601 | 186 | 19-Aug-22 | 14-Dec-22 | 0 | 2 | 0.0 | 1.1 | 1.1 | 1 | 2 |
| OREAS 216b | 6.660 | 6.691 | 6.963 | 6.343 | 51 | 15-May-20 | 11-Aug-20 | 0 | 0 | 0.5 | 1.1 | 1.0 | 0 | 0 |
| OREAS 221 | 1.062 | 1.065 | 1.169 | 0.998 | 123 | 16-Aug-18 | 2-Nov-20 | 0 | 0 | 0.3 | 1.3 | 1.3 | 1 | 0 |
| OREAS 222 | 1.220 | 1.223 | 1.296 | 1.156 | 28 | 16-Jul-18 | 3-Feb-20 | 0 | 0 | 0.3 | 1.0 | 1.0 | 0 | 0 |
| OREAS 226 | 5.450 | 5.467 | 5.906 | 3.063 | 130 | 17-Apr-19 | 2-Nov-20 | 2 | 2 | 0.3 | 0.9 | 0.9 | 1 | 2 |
| OREAS 228 | 8.730 | 8.752 | 8.998 | 7.537 | 37 | 9-Jul-18 | 21-Oct-19 | 0 | 1 | 0.3 | 1.7 | 1.6 | 0 | 1 |
| OREAS 229 | 12.110 | 11.950 | 12.500 | 11.300 | 22 | 16-Aug-18 | 7-Aug-19 | 0 | 1 | -1.3 | 0.8 | 0.6 | 0 | 0 |
| OREAS 229b | 11.950 | 12.070 | 14.500 | 10.900 | 337 | 17-Apr-19 | 3-May-21 | 6 | 1 | 1.0 | 1.2 | 1.0 | 6 | 5 |
| OREAS 232 | 0.902 | 0.897 | 0.972 | 0.800 | 98 | 4-Feb-21 | 17-May-21 | 1 | 1 | -0.6 | 0.8 | 0.7 | 0 | 1 |
| OREAS 235 | 1.590 | 1.578 | 1.810 | 1.135 | 388 | 8-Nov-21 | 17-Feb-23 | 4 | 19 | -0.8 | 0.7 | 0.6 | 2 | 4 |
| OREAS 239 | 3.550 | 3.617 | 3.782 | 3.418 | 28 | 2-Aug-19 | 25-Apr-20 | 0 | 0 | 1.9 | 1.1 | 0.8 | 0 | 0 |
| OREAS 240 | 5.510 | 5.476 | 6.009 | 4.736 | 448 | 15-Nov-21 | 22-Dec-22 | 3 | 6 | -0.6 | 0.9 | 0.9 | 3 | 6 |
| OREAS 241 | 6.910 | 7.009 | 7.527 | 5.931 | 156 | 7-Aug-22 | 22-Dec-22 | 0 | 1 | 1.4 | 1.5 | 1.3 | 0 | 2 |
| OREAS 253 | 1.220 | 1.190 | 1.371 | 0.929 | 184 | 17-Apr-19 | 6-Sep-21 | 1 | 7 | -2.5 | 1.0 | 0.8 | 1 | 4 |
| OREAS 255b | 4.160 | 4.144 | 4.378 | 3.852 | 46 | 21-Jun-21 | 13-Sep-21 | 0 | 0 | -0.4 | 0.9 | 0.9 | 0 | 0 |
| OREAS 256 | 7.660 | 7.641 | 14.400 | 1.174 | 169 | 2-Aug-19 | 30-Aug-21 | 1 | 1 | -0.3 | 1.2 | 1.1 | 1 | 1 |
| OREAS 257b | 14.220 | 14.240 | 15.200 | 12.500 | 224 | 21-Jun-21 | 22-Dec-22 | 0 | 7 | 0.1 | 1.6 | 1.5 | 1 | 9 |
| OREAS 258 | 11.150 | 11.160 | 13.400 | 9.308 | 344 | 8-Nov-21 | 17-Feb-23 | 15 | 4 | 0.1 | 1.2 | 1.1 | 15 | 8 |
| Sum or Count: | 3,165 | 34 | 54 | 33 | 42 | |||||||||
| Percent: | 100 | 1.1 | 1.7 | 1.0 | 1.3 | |||||||||
| Min: | 6 | 0 | 0 | -2.5 | 0 | 0 | ||||||||
| Max: | 448 | 15 | 19 | 2.5 | 15 | 9 | ||||||||
|
Table 11-18 Summary of Silver Results for Analyses of Standards with Drillhole Samples
| Standard ID | Grades, ppm Silver | Count | Dates | Fails per Specs |
Bias pct | Pp | PpK | Fails per | ||||||
| Cntrl Lmts | ||||||||||||||
| Target | Average | Maximum | Minimum | Start | End | High | Low | High | Low | |||||
| OREAS 66a | 18.9 | 18.4 | 20.1 | 16.0 | 13 | 31-Jul-13 | 10-Sep-13 | 0 | 0 | -2.7 | 1.1 | 0.9 | 0 | 0 |
| OREAS 210 | 0.943 | 0.938 | 1.9 | 0.15 | 65 | 6-May-17 | 25-Feb-20 | 4 | 2 | -0.5 | 0.8 | 0.7 | 4 | 2 |
| OREAS 211 | 0.214 | 0.189 | 0.5 | 0.15 | 186 | 19-Aug-22 | 14-Dec-22 | 37 | 149 | -11.7 | 0.2 | 0.1 | 1 | 0 |
| OREAS 216b | 1.09 | 1.174 | 1.6 | 0.15 | 51 | 15-May-20 | 11-Aug-20 | 16 | 10 | 7.7 | 0.3 | 0.1 | 0 | 5 |
| OREAS 226 | 0.904 | 0.998 | 3 | 0.15 | 130 | 17-Apr-19 | 2-Nov-20 | 18 | 8 | 10.4 | 0.4 | 0.2 | 5 | 2 |
| OREAS 229b | 1.6 | 1.782 | 4 | 0.15 | 337 | 17-Apr-19 | 3-May-21 | 92 | 6 | 11.4 | 0.4 | 0.1 | 6 | 4 |
| OREAS 232 | 0.093 | 0.270 | 0.9 | 0.15 | 98 | 4-Feb-21 | 17-May-21 | 98 | 0 | 190.3 | 0.0 | -0.3 | 1 | 0 |
| OREAS 235 | 0.135 | 0.249 | 1.6 | 0.15 | 388 | 8-Nov-21 | 17-Feb-23 | 46 | 0 | 84.4 | 0.0 | -0.1 | 17 | 0 |
| OREAS 239 | 0.244 | 0.223 | 0.4 | 0.15 | 28 | 2-Aug-19 | 25-Apr-20 | 11 | 17 | -8.6 | 0.1 | 0.1 | 0 | 0 |
| OREAS 240 | 1.3 | 1.400 | 2.5 | 0.15 | 448 | 15-Nov-21 | 22-Dec-22 | 55 | 61 | 7.7 | 0.3 | 0.2 | 6 | 18 |
| OREAS 241 | 1.73 | 1.550 | 2.1 | 0.15 | 156 | 7-Aug-22 | 22-Dec-22 | 2 | 37 | -10.4 | 0.3 | 0.1 | 0 | 2 |
| OREAS 255b | 0.924 | 0.790 | 1.0 | 0.5 | 46 | 21-Jun-21 | 13-Sep-21 | 0 | 15 | -14.5 | 0.5 | 0.1 | 0 | 0 |
| OREAS 257b | 2.36 | 2.310 | 2.7 | 1.0 | 224 | 21-Jun-21 | 22-Dec-22 | 0 | 1 | -2.1 | 1.4 | 1.2 | 0 | 2 |
| OREAS 258 | 1.72 | 1.570 | 1.9 | 1.0 | 344 | 8-Nov-21 | 17-Feb-23 | 0 | 16 | -8.7 | 1.1 | 0.7 | 0 | 4 |
| Sum or Count: | 2,514 | 379 | 322 | 40 | 39 | |||||||||
| Percent: | 100 | 15.1 | 12.8 | 1.6 | 1.6 | |||||||||
| Min | 13 | 0 | 0 | -14.5 | 0 | 0 | ||||||||
| Max | 448 | 98 | 149 | 190.3 | 17 | 18 | ||||||||
Note: The target silver values for standards OREAS 211, OREAS 232, OREAS 235 and OREAS 239 are lower than the detection limit for the analytical method in use. Results for those standards and calculations are greyed and italicized. Silver results for those standards should be disregarded.
|
11.3.7.2 DUPLICATES IN DRILLHOLE SAMPLES
The author evaluates all types of duplicates using scatterplots, linear regressions, relative difference plots and correlation coefficients. Most of these are standard tools of basic statistics and need not be explained here. Relative difference is a less common term and can be ambiguous, with the term being applied to at least six different ways of the doing the calculation, each giving a different outcome. The author used two ways of calculating relative differences expressed as percentages in this study, shown in Equation 1 and Equation 2 in Section 11.3.4.1.3.
All the relative differences presented in this discussion were calculated using Equation 1.
For samples from drill core, Mako has at various periods collected and caused to be analyzed duplicates of three types: Field Duplicates, Preparation Duplicates, and Pulp Duplicates, as defined in Section 11.3.3.2
Grillo (2019) describes pulp duplicate simples as "… the identical pulp samples collected at the final stage of sample reduction". The author takes this to mean that the pulp duplicates are second splits from the same pulp as the original sample.
As seen in Table 11-15 and Table 11-16, preparation duplicates have been used consistently throughout drill programs since 2011. Field duplicates have been collected only sporadically and in small numbers, too few to make for a meaningful body of data. Useful numbers of pulp duplicates were collected starting only in 2020.
Table 11-19 summarizes the results obtained from analyses of duplicates of drill core samples. The results are good, with no real surprises or causes for concern. Differences within duplicate pairs are greatest in the field duplicates, as expressed by the relative differences. This is expected, given that the field duplicate comparisons encompass all sources of error including the sources of largest differences, those being natural geological heterogeneity and sampling error.
For gold the field duplicates have on average a positive relative difference (duplicate > original) whereas for silver the field duplicates have a negative relative difference (duplicate < original). This difference is likely due to some differences in the distributions of gold and silver in the rock, and mechanical differences in how the gold-bearing and silver-bearing minerals respond to the sampling process.
One unexpected observation is the similarity of the average absolute relative differences for the preparation duplicates and the pulp duplicates. This is seen for both gold and silver. Preparation duplicates encompass many more potential sources of error than do pulp duplicates, so the observation that the relative differences are of similar magnitudes is surprising.
|
It may be noted that in the preparation and pulp duplicates, for silver fewer than half of the available sample pairs were used in the calculations of statistics ("Pairs Used" column in Table 11-19). This is because in most of the sample pairs one or both of the analyses were reported as below the detection limit. Such pairs were not used. This is a natural outcome of having generally low silver grades, but the issue could be mitigated in the future by biasing the selection of samples for duplication towards those with measurable silver grades.
Table 11-19 Summary of Results for Duplicates from Drill Core Samples
| Analyte | Duplicate Type |
Counts | Averages of Relative Differences as Percent |
Correlation Coefficient |
|||
| Pairs Available |
Pairs Used |
Outliers | Relative Diff | Abs Rel Diff | |||
| Au | Field Dup | 27 | 22 | 3 | 20.7 | 43.1 | 0.913 |
| Au | Prep Dup | 3936 | 3699 | 1 | -1.8 | 26.7 | 0.993 |
| Au | Pulp Dup | 490 | 438 | 1 | -2.9 | 27.3 | 0.994 |
| Ag | Field Dup | 27 | 24 | 3 | -26.0 | 38.4 | 0.984 |
| Ag | Prep Dup | 3936 | 1672 | 7 | 0.3 | 17.7 | 0.979 |
| Ag | Pulp Dup | 490 | 223 | 1 | -0.2 | 16.3 | 0.986 |
Notes: Relative differences in Table 11-19 were calculated using Equation 1.
"Pairs Used" excludes outliers & any pairs with an analysis below detection limits.
While a table like Table 11-19 is a concise way of summarizing data it necessarily obscures details. For example, Figure 11-36 is a relative difference plot looking at the same data as on the "Au Prep Dup" line of Table 11-19. It shows that the large relative differences which make the greatest contribution to the absolute average of 26.7% are concentrated at grades below about 0.1 ppm Au. At higher grades of greater economic significance, the majority of the relative differences are smaller.
|
Figure 11-36 Relative Difference, Gold in Drill Core Samples
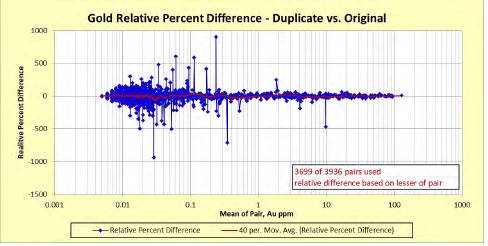
The results obtained for analyses of preparation duplicates and pulp duplicates support the use of Mako's gold and silver analyses from Las Conchitas for the purpose they are used in the resource estimate described in Section 14.3.
11.3.7.3 BLANKS IN DRILLHOLE SAMPLES
As seen in Table 11-15 and Table 11-16, blanks have been used in substantial numbers in every drill program at Las Conchitas. The simplest way to explain the results for the blanks is with reference to the plots appearing as Figure 11-37 (for gold) and Figure 11-38 (for silver). Each of the plots covers the period from 2011 to 2022. To make the plots legible, analyses near and below the respective detection limits have been filtered out, as those low values present no issues.
In Figure 11-37 it can be seen that of 5,147 analyses of blank material analyzed over more than ten years, only 16 gold analyses exceeded the warning limit. Only two exceeded 0.09 ppm Au. The highest gold analysis purported to come from a blank was 7.304 ppm Au (off the scale in Figure 11-37) in laboratory job MGA22000349. One may speculate that this high grade in a purported blank is due to a sample mix-up but that can't be proven.
Five instances are identified in Figure 11-37 in which a spike in the grade of a blank follows a relatively high- grade sample. This suggests the possibility of sample-to-sample contamination but the proportion of such possible instances in this data set is very much lower than is typically seen in exploration data sets.
|
Figure 11-37 Gold in Blanks and in Preceding Samples
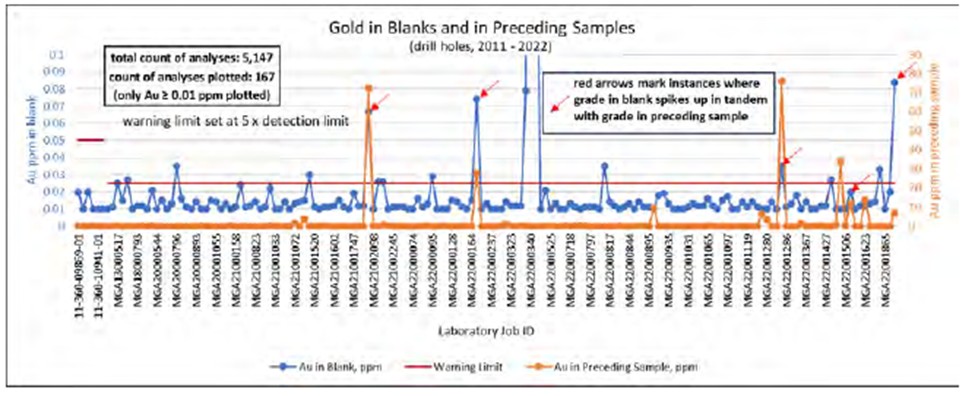
In Figure 11-38 there are 17 out of 5,147 silver analyses exceeding the warning limit. Eleven of the 17 are in a cluster of laboratory jobs covering sample batches with a "Date Received" of March 23, 2020 (jobs starting with MGA20000266 and ending with MGA20000277).
There are seven instances of possible sample-to-sample contamination marked in Figure 11-38.
An aspect of the data set for silver in blanks that isn't obvious in Figure 11-38 but is clear in Figure 11-39 is that the earlier half of the data set (left hand half of the plot) is much "noisier" than the later half (right hand half of the plot). There are many more higher-grade analyses in the earlier part of the plot. The change occurs sometime around March 31, 2022. Mako has advised that they changed the source of the material used for the blank in 2022. Prior to the change-over a locally sourced granite was used. In 2022 they began using a pumice instead. It is likely, though unproven, that the change of material is responsible for the difference between the earlier and later parts of the plot in Figure 11-39.
|
Figure 11-38 Silver in Blanks and Preceding Samples
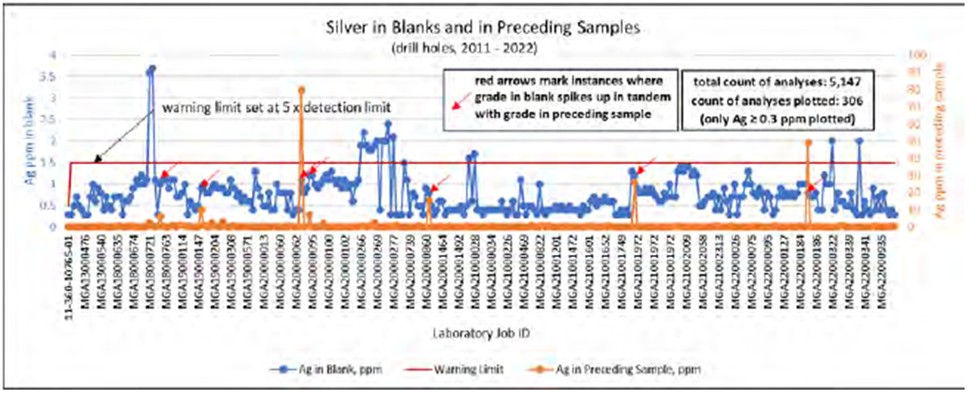
Figure 11-39 Silver in Blanks - All Data
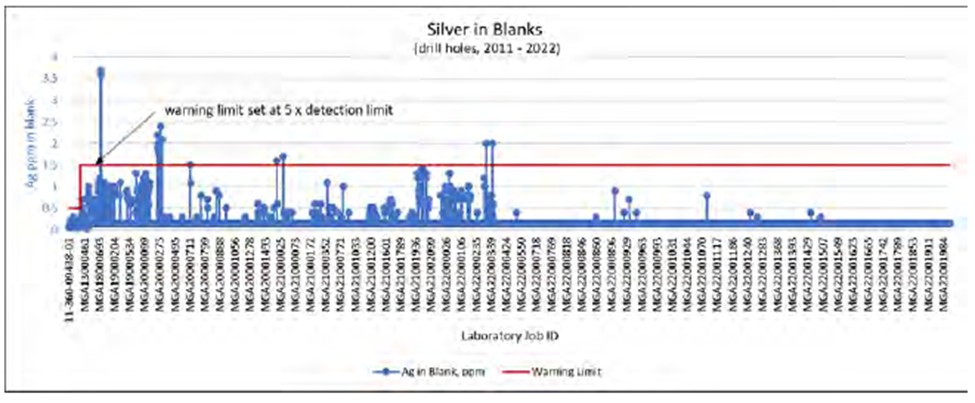
Although some issues have been noted in the data for gold and silver analyses of the blanks, the overall performance of the labs used by Mako is better than most and is acceptable. The data support the use of Mako's data for gold and silver as described in Section 14.3 of this report.
11.4 DENSITY DATA
San Albino
(Note: This description of checking the San Albino density data is copied from Ristorcelli et al., 2020)
For each drillhole, multiple density measurements were collected. Sample selection focused on getting at least one sample of regolith, as well as multiple oxidized and unoxidized rock samples, and at least one sample in the mineralized zone. Samples were selected to be between 5cm and 10cm long in length. After recording the length, sample depth and hole number, the samples were placed in a mesh bag and weighed with a hanging scale in air, in water, and in air after being submersed in water. These measurements were then used to calculate the density as a specific gravity ("SG") measurement. The author checked the calculated drill core specific gravity using Mako's measurements of "Final Dry Sample Weight" and "Submerged Sample Weight" with the formula:
|
Specific Gravity = Dry Sample Weight / (Dry Sample Weight - Submerged Sample Weight)
During the site visit in 2020, the author (of Ristorcelli et al., 2020) observed Mako personnel measuring the density of core samples using the submersion method for core. Overall, the data looks reasonable and there were no impossible values in the dataset.
Las Conchitas
The current author checked the density calculations for Las Conchitas in a spreadsheet supplied by Mako. The same equation as in the San Albino case was used. The calculations had been done correctly, and the calculated densities had been accurately inserted into the database used for the resource estimate described in this report.
The current author has not visited Mako's site and so has not observed Mako personnel measuring densities, nor has he checked the entry of the raw data collected in the field into the spreadsheet supplied by Mako.
11.5 SUMMARY STATEMENT
The author concludes that the sample preparation, security, analytical procedures, and QA/QC methods and results are adequate, and the channel and drill sample data are acceptable for use in resource estimation of the San Albino and Las Conchitas deposits. Mako benefits from the fact that Mr. Zoran Pudar, Exploration Manager, has been part of the technical team since 2009 and has consistently and carefully applied the proper sample preparation, security, analytical procedures. Mako used well-known certified laboratories for all sample preparation and analyses. Sample preparation, analysis, security and QA/QC data collection have been and are done well and provide the project with a reliable set of analytical data.
|
12.0 DATA VERIFICATION (ITEM 12)
12.1 SITE VISITS
Mr. Ristorcelli visited the San Albino and Las Conchitas project site from February 18 through February 21, 2020, accompanied by Mr. Unger, a co-author of Ristorcelli et al., 2020. During the site visit, the project geology and drilling procedures were reviewed. This included:
/ a field tour of the San Albino deposit and Las Conchitas areas,
/ visual inspection of core drilling procedures at active drill sites,
/ discussion of the current geologic interpretations with Mako personnel,
/ reviewing sampling and logging procedures,
/ independently verifying selected drillhole collar locations, and
/ visited several trench and exploration pits to review channel sampling procedures.
Mr. Ristorcelli visited the site again during the period 16 March through 21 March 2023 (Ristorcelli, 2023). During this visit he:
/ gathered data,
/ discussed geology with the geologists, reviewed maps, examined outcrops,
/ reviewed portions of holes representative of the mineralized zones,
/ discussed modeling procedures and philosophy of resource estimation, and
/ set up and trained Mako staff in the use of MinePlan(™) software.
Dr. Gray has visited the project site a number of times, most recently during the period 15 through 21 March 2023 (Gray, 2023). During this site visit he:
/ reviewed drill core from multiple mineralized zones,
/ did a field examination of the San Pablo and Tivo areas,
/ checked the collar locations of 13 drillholes using a handheld Garmin GPSMap64s,
/ examined pit wall exposures of the San Albino vein and the Arras vein, and
/ did field examinations of a number of regional exploration target areas.
|
12.2 DATABASE VERIFICATION
The current drillhole databases, which support the resource estimations of the San Albino and Las Conchitas deposits, were created and are maintained by Mako in an SQL database. The databases used for current work described in this report were delivered to the authors as collections of digital text files exported from the database in "csv" format, with tables and fields requested by Mr. Ristorcelli for loading into MinePlan software. Mr. Ronning audited the data using the same sets of text files as the starting points.
The terms "verify", "audit" and "check" as used in this discussion all refer to the same process of verification.
12.2.1 VERIFICATION OF THE SAN ALBINO DATABASE
The San Albino database was audited in three stages:
/ In 2020, to verify the data used in the 2020 resource estimate (Ristorcelli et al., 2020),
/ In late 2022, to verify post-2020 data for use in unpublished incremental updates to the 2020 resource estimate, and
/ In 2023 to verify the most recent data to be included in the resource estimate described in this report.
12.2.1.1 THE 2020 DATABASE AUDIT
Unlike in 2022 and 2023, in 2020 The San Albino deposit data was delivered to MDA in a SQL database. The following description of the data verification is copied from Ristorcelli et al. (2020).
The database contained information for 979 drillholes, 788 of which were core holes, and 191 reverse circulation holes. The core hole data included 2,620 downhole survey measurements of azimuth and inclination which were checked only for reasonableness as no original-source documentation existed. Mr. Unger found 32 entries in the database that had greater than 15% deviation in either the azimuth or dip between two survey points. These anomalous deviations were reported to Mako and either confirmed, corrected, or excluded from the database used for the resource estimation.
Collar coordinates for all drillholes were checked against limited collar survey records, and minor corrections were made where the database entries did not match the survey records. Because most of the surveying was done by Mako in-house, the coordinates were only questioned during verification by the authors if they did not fit with the topography well.
The geologic log data was tested for consistency of rock type and alteration intensity, and as a consequence of working with it during modeling. Only minor inconsistencies were found and corrected. When a few holes were clearly mis-located compared to surrounding holes and geology, Mako corrected the inaccurate data or the holes and their data were deemed unusable and flagged for exclusion from further use.
|
MDA personnel, under the direction of Mr. Unger compared 45,615 drill sample intervals in the database received from Mako to assay certificates received directly from Bureau Veritas, representing almost 82% of the drilling assays. The remainder of the assays were verified by comparison to assay certificates supplied by Mako personnel. MDA created a new database from the laboratory-supplied and client-supplied certificates to compare to the Mako database. The certificates that MDA used to create the new database comprised 49,514 total samples, with some samples analyzing the same drill sample interval with different assay methods.
After several rounds of corrections to the assay database, mostly to prioritize the use of metallic-screen fire assay data, consistency between the MDA created database and the Mako master database was determined by Mr. Unger to be acceptable. In the final comparison between the MDA created assay database and the original Mako database, there were 24 sample intervals with differences in gold values and 67 intervals with differences in silver values. These were all due to missing data in the MDA database.
12.2.1.2 THE 2022 AND 2023 DATABASE AUDITS
The 2022 database audit was an incremental audit looking only at data generated since the 2020 resource estimate. The methods used were like those used in the subsequent 2023 audit and in the remainder of this discussion the 2022 work and the 2023 work are treated as the same process, albeit one that took place sporadically over a protracted time period from August 2022 through late May 2023.
The author received several incremental updates to the San Albino database, as sets of csv data files, over the course of the latter half of 2022. These contained only new data, not the entire database. The assay, collar location and downhole survey tables were checked as they were received.
The author received the complete database, as a set of csv data files, on March 18, 2023. The complete database of March 18 is the one on which the audit was completed. The assay, collar location and downhole survey tables were checked.
The audit proceeded in two steps:
1. Compare the 2023 database to the audited 2020 database. For those holes that are in both databases, the data in the 2023 database were deemed to be correct if they matched the audited 2020 database.
2. For the audit of post-2020 data, the database was checked against sources as close to original laboratory or field records as possible. All sources were digital, although some were scans of paper records. The sources used are described in the following discussions of individual tables.
|
12.2.1.2.1 SAN ALBINO ASSAY TABLE
The author audited gold and silver assays. Those that were in the 2020 database were checked by comparing them to the audited 2020 database. To audit the post-2020 assays the author used csv data files issued by the laboratory, Bureau Veritas. These, with accompanying certificates in pdf file format, were supplied to the author by Mako, so the chain of custody of the data files and certificates was not independent of Mako.
The author used a similar procedure to that of 2020, though possibly using different software. The csv assay table received from Mako was imported into a table in Microsoft Access™. The many laboratory data files were compiled into a separate Microsoft Access table. Query tools were used to compare the two tables.
The outcome of checking the 2023 assay table is summarized in Table 12-1.
Table 12-1 Summary of San Albino Assay Table Checks
| Element | Sample Type | Number of Assays in Database |
Number of Assays Checked |
Number of Differences |
Number of Material Differences |
| gold | 1 - core | 79,326 | 74,623 | 11 | nil |
| 3 - RC | 3,707 | 3,223 | nil | nil | |
| 4 - blast | 5,050 | Nil | n/a | n/a | |
| 5 - trench | 8,989 | 8,844 | nil | nil | |
| silver | 1 - core | 79,253 | 74,550 | Nil | nil |
| 3 - RC | 3,687 | 3,223 | nil | nil | |
| 4 - blast | 850 | Nil | n/a | n/a | |
| 5 - trench | 8,954 | 8,838 | nil | nil |
The author prepared a list of drillholes whose assays had not been checked, and Mr. Ristorcelli reviewed those holes onscreen in the model. The authors concluded that the holes either are in parts of the deposit that have already been mined or do not contain significant mineralization.
12.2.1.2.2 SAN ALBINO COLLAR TABLE
The author did some checking of drillhole collar coordinates in the collar table. Those holes that were in the 2020 database were checked by comparing the coordinates to those in the audited 2020 database. Post-2020 collar locations were checked against simple csv-format text files received from Mako on December 12, 2022 and April 19, 2023.
Collar location surveys are done in-house by Mako, and the author understands that the csv-format text files received from Mako are copies of files delivered by the survey team to Mako's database administrator.
The outcome of checking the 2023 collar table is summarized in Table 12-2.
|
Table 12-2 Summary of San Albino Collar Location Checks
| Hole Type | Number of Holes in Database |
Number of Locations Checked |
Number of Differences |
Number of Material Differences |
| 1 - core | 1,232 | 1,226 | 15 | nil |
| 3 - RC | 200 | 191 | nil | nil |
| 4 - blast hole | 499 | nil | nil | nil |
| 5 - trench/channel | 4,467 | 707 | nil | nil |
Notes: All core holes with coordinate differences date from 2016 or earlier. The smallest difference is 0.2m, the median is 2.7m and the maximum is 5m.
Ristorcelli et al. (2020) reported the results of checking the collar locations of 17 drillholes in the field using a handheld Garmin GPS-64 GPS. All the checks confirmed the locations of the holes as reported in the database, within the limits of accuracy achievable with a handheld GPS.
12.2.1.2.3 SAN ALBINO DOWNHOLE SURVEY TABLE
The author audited 2,516 downhole survey measurements in core holes. However, the quality of the checking varied, as described in the following paragraphs.
Those measurements that are present in the 2023 survey table and were present in the audited 2020 survey table were checked by comparing the 2023 survey table to the 2020 survey table. If the measurements agree they are deemed to be correct. However it should be noted that in 2020 Ristorcelli et al. only checked the downhole surveys for reasonableness. They did not have access to original sources.
To check downhole surveys in post-2020 core holes, the author used pdf scans of survey data that had been delivered to Mako as paper documents by the drilling contractors. Several different contractors used several different instruments and formatted the resulting survey data differently, All used magnetic downhole instruments.
The author used Optical Character Recognition ("OCR") software to extract survey data from the scans and compile it into a table of downhole survey data. The author then used query tools in Microsoft Access™ to compare the independently compiled downhole surveys to those in Mako's survey table. Of the "Measurements Checked" in Table 12-3, 612 were checked in this way. No errors were found in these.
|
Table 12-3 Summary of San Albino Downhole Survey Checks
| Hole Type | Number of Measurements (collar excluded) |
Number of Measurements Checked |
Number of Differences |
Number of Material Differences |
| 1 - core | 3,314 | 2,516 | nil | nil |
12.2.1.2.4 SUMMARY STATEMENT REGARDING THE AUDITED SAN ALBINO DATABASE
In the opinion of the author, Mr. Ronning, the database used to prepare the resource estimate for San Albino described in Section 14.2 of this report is of good quality exceeding industry norms and is sufficiently accurate to support the resource estimate.
12.2.2 VERIFICATION OF THE LAS CONCHITAS DATABASE
The author received the database for Las Conchitas, on which the audit was done, on March 7, 2023, as a series of csv files exported from Mako's SQL database. This is a copy of the same database used by Mr. Ristorcelli in preparing the resource estimate for Las Conchitas described in this report. The database was audited primarily during the period March 7, 2023 through May 8, 2023. Occasional details and clarifications were done through to the end of July 2023.
12.2.2.1 LAS CONCHITAS ASSAY TABLE
The author audited gold and silver assays in the Las Conchitas assay table. For sources he used csv data files issued by the laboratories used over the years of drilling and sampling at Las Conchitas. These, with accompanying certificates in pdf file format, were supplied to the author by Mako, so the chain of custody of the data files and certificates was not independent of Mako.
The csv assay table received from Mako was imported into a table in Microsoft Access™. The many laboratory data files were compiled into a separate Microsoft Access™ table. Query tools were used to compare the two tables.
The outcome of checking the Las Conchitas assay table is summarized in Table 12-4. The four different gold and the two different silver values in trenches were corrected after consultation with Mako's database administrator.
|
Table 12-4 Summary of Las Conchitas Assay Table Checks
| Element | Sample Type |
Number of Assays in Database |
Number of Assays Checked |
Number of Differences |
Number of Material Differences |
| gold | 1 - core | 73,708 | 73,132 | nil | nil |
| 5 - trench | 8,320 | 8,320 | 4 | nil | |
| silver | 1 - core | 73,708 | 73,132 | nil | nil |
| 5 - trench | 8,320 | 8,320 | 2 | nil |
12.2.2.2 LAS CONCHITAS COLLAR TABLE
The drillhole and trench collar locations were checked against a page of location data in each of two spreadsheets; one for drillholes and one for trenches. Both these sources are compilations of data that was received from field surveys. They are not original sources, but they are closer to the sources than the collar table in the database. The checks are summarized in Table 12-2.
In the case of drillholes, no significant differences were found between the collar locations in the spreadsheet and those in the database. In the database, collar coordinates are recorded to two decimal places, whereas in the spreadsheet many are recorded to three decimal places. The author noted in many instances the coordinates were rounded from three to two decimal places using conventional rounding. However, in many other instances the coordinates were truncated to two decimal places. This is an inconsistency but a minor one that has no material nor even discernible effect on the resource estimate for Las Conchitas described in this report.
Table 12-2 shows that only 2,181 out of 5,358 locations of trench samples were checked. These checks all found agreement between the locations in the spreadsheet and those in the database.
The reason that less than half the trench sample locations were checked has to do with the fact that trenches are treated as pseudo drillholes in the database used by the report authors. To accomplish this some work-arounds were needed to accommodate samples that were collected at some angle to the direction of the trench. Subsets of samples within trenches were treated as individual "drillholes" in the database, having different orientations than the trench itself, thus differing from the information in the spreadsheet. It was impractical to check the locations of all of them, so the author chose to check only a subset, the 2,181 listed in Table 12-2.
Table 12-5 Summary of Las Conchitas Collar Location Checks
| Hole Type | Number of Holes in Database |
Number of Locations Checked |
Number of Differences |
Number of Material Differences |
| 1 - core | 718 | 718 | nil | nil |
| 5 - trench/channel | 5,358 | 2,181 | nil | nil |
|
12.2.2.3 LAS CONCHITAS DOWNHOLE SURVEY TABLE
To check downhole surveys in core holes at Las Conchitas, the author for the most part used pdf scans of survey data that had been delivered to Mako as paper documents by the drilling contractors. Several different contractors used several different instruments and formatted the resulting survey data differently. All used magnetic downhole instruments.
For holes drilled in 2011 and 2013, Mako Provided Microsoft Excel™ files containing the downhole survey data. They appear to be files prepared by a drill contractor.
For the PDF files the author used Optical Character Recognition ("OCR") software to extract survey data from the scans and compile it into a table of downhole survey data. The author copied data from the Excel™ files and pasted it into the same table.
The author then used query tools in Microsoft Access™ to compare the independently compiled downhole surveys to those in Mako's survey table. The results of this comparison are summarized in Table 12-6.
Table 12-6 Summary of Las Conchitas Downhole Survey Checks
| Hole Type | Number of Measurements (collar excluded) |
Number of Measurements Checked |
Number of Differences |
Number of Material Differences |
| 1 - core | 2,611 | 2,475 | 24 | nil |
12.2.2.4 SUMMARY STATEMENT REGARDING THE AUDITED LAS CONCHITAS DATABASE
In the opinion of the author, Mr. Ronning, the database used to prepare the resource estimate for Las Conchitas described in Section 14.3 of this report is of good quality exceeding industry norms and is sufficiently accurate to support the resource estimate.
12.3 INDEPENDENT VERIFICATION SAMPLING
Ristorcelli et al. (2020) reported having collected six quarter core samples from then-recently drilled core at San Albino. The samples were cut from the half-core remaining after Mako's original samples had been collected. They concluded that "… the results support the general tenor and style of mineralization portrayed in the original samples." The author has reviewed the gold assays from these samples, reported in Ristorcelli et al. (2020), and concurs with their conclusion. None of the authors of the current report have collected any independent samples from the Las Conchitas deposit.
|
12.4 INDEPENDENT VERIFICATION OF DRILLHOLE COLLARS
Ristorcelli et al. (2020) reported having checked the locations of 17 drillhole collars in the San Albino deposit, using a handheld consumer-quality GPS. They concluded that the results they obtained "… substantially support the surveys in the database and are considered acceptable." The author has reviewed the 17 location results reported in Ristorcelli et al. (2020) and concurs with their conclusion.
Gray (2023) checked the collar locations of 13 drillholes in the Las Conchitas area using a handheld Garmin GPS MAP 64s. This consumer-quality GPS does not have survey-quality accuracy but is adequate to use to check that the recorded location of a drillhole is in the correct general area.
The results of the Las Conchitas collar location checks are set out in Table 12-7. As expected, given the lesser accuracy of the handheld GPS, there are differences. The differences in the eastings are in about the range the author would have expected. The differences in the northings are greater than the author would have expected, for unknown reasons. The comparison in Table 12-7 is close enough to show that drillholes are in the expected general area but cannot be used to confirm the specific accuracy of any single drillhole location.
Table 12-7 Field Checks of Las Conchitas Collar Locations
| HoleID | Database Coordinates UTM WGS84 (meters) |
Differences (meters) |
Field Check Coordinates UTM WGS84 (m) |
||||||
| East | North | Elev. | East | North | Elev. | East | North | Elevation | |
| LC11-02 | 597198.70 | 1511009.61 | 626.45 | 5.30 | 8.39 | 9.55 | 597204 | 1511018 | 636 |
| LC20-233 | 597180.32 | 1510674.47 | 536.58 | 5.68 | 11.53 | 19.42 | 597186 | 1510686 | 556 |
| LC20-258 | 597227.6 | 1510904.43 | 609.65 | 3.40 | 6.57 | 10.35 | 597231 | 1510911 | 620 |
| LC20-262 | 597245.17 | 1510915.37 | 608.95 | 3.83 | 13.63 | 10.05 | 597249 | 1510929 | 619 |
| LC20-268 | 597278.46 | 1510782.12 | 592.16 | 4.54 | 11.88 | 12.84 | 597283 | 1510794 | 605 |
| LC20-302 | 597307.49 | 1510695.16 | 579.74 | 2.51 | 7.84 | 10.26 | 597310 | 1510703 | 590 |
| LC21-369 | 597365.00 | 1510595.14 | 543.49 | 3.00 | 4.86 | 14.51 | 597368 | 1510600 | 558 |
| LC21-374 | 597324.97 | 1510527.38 | 518.63 | 3.03 | 6.62 | 18.37 | 597328 | 1510534 | 537 |
| LC21-377 | 597331.42 | 1510623.72 | 548.93 | 6.58 | 6.28 | 12.07 | 597338 | 1510630 | 561 |
| LC22-488 | 597103.66 | 1510684.39 | 526.20 | 3.34 | 8.61 | 18.80 | 597107 | 1510693 | 545 |
| LC22-489 | 597110.72 | 1510656.28 | 523.11 | 3.28 | 5.72 | 18.89 | 597114 | 1510662 | 542 |
| EJ22-01 | 597141.718 | 1510192.857 | 598.71 | 1.28 | 10.14 | 15.29 | 597143 | 1510203 | 614 |
| LC22-499 | 597178.91 | 1510205.47 | 592.37 | 4.09 | 10.53 | 14.63 | 597183 | 1510216 | 607 |
Note: The gps used to obtain the Field Check Coordinates was a Garmin GPS MAP 64s, set to report coordinates in UTM UPS; Map Datum: WGS84; Map Spheroid WGS84.
Mako advises that the coordinates in the company's drillhole databases for San Albino and Las Conchitas are UTM Zone 16N based on the WGS84 datum.
|
12.5 SPECIFIC GRAVITY DATA
A description of Mako's methods for determining rock density or specific gravity, and of checks done, appears in section 11.4, "Density Data".
12.6 SUMMARY STATEMENT ON DATA VERIFICATION
The author experienced no limitations with respect to data verification for the San Albino and Las Conchitas deposits. In consideration of the information summarized in this and other sections of this report, including the acceptable QA/QC methods and results summarized in Section 11.3, the author concludes that the San Albino and Las Conchitas deposits data are acceptable as used in this report, most significantly to support the estimation and classification of the mineral resources reported herein.
|
13.0 MINERAL PROCESSING AND METALLURGICAL TESTING (ITEM 13)
The sample preparation, compositing, and test work were preformed or overseen by Bureau Veritas laboratories in Vancouver, Canada for all testing completed before 2022. Their processes and assaying results met the requirements of Mako and its employees, including Senior Metallurgical Engineer Craig L. McKenzie, and are traceable and well documented. John Rust, a "Qualified Person" under 43-101, has reviewed and approved the written scientific and technical disclosure contained in this section. Note Figure 13.1 and Sections 13.1.2 through 13.1.13 were taken from Ristorcelli et. al. (2020).
Testing completed in 2022 was performed in the laboratory at the mine site. The 2022 testing was completed as variability testing to verify processing Las Conchitas ore using the existing milling circuit at San Albino would produce similar results as had been experienced when processing mineralized material from the San Albino deposit. The results from the 2022 test program indicate Las Conchitas mineralized material can be expected to perform similar to the San Albino deposit; however, these results should be used as an indication of potential processing results only. Confirmation testing to verify results at a third-party laboratory is recommended. There are also plans at site to complete test pits from each of the various deposits and process the mineralized material from the test pits through the operating mill at San Albino to further support the expectation of Las Conchitas performance being similar to the performance from San Albino mineralized material. No further testing of samples from the San Albino deposit were tested in 2022.
13.1 TESTING PRIOR TO 2022
13.1.1 SUMMARY
Metallurgical test work has been completed for the San Albino project during five distinct periods as shown in Figure 13-1. Based on the recent metallurgical test work, Mako has decided on a processing approach with milling of all material followed by cyanide extraction of gold and silver using a carbon-in-leach ("CIL") plant. The expected optimized overall recoveries range from 86.1% to 96.9%, depending on the mineralization type despite the presence of carbonaceous material in the samples.
|
Figure 13-1 San Albino Deposit Metallurgical Test History
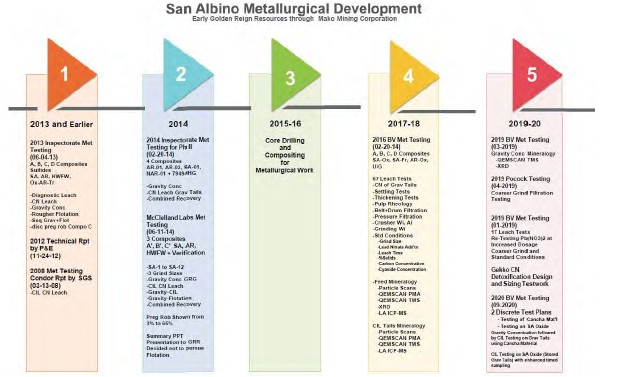
Tests completed in 2019 and 2020 were designed to confirm conclusions from work done in 2013 and 2014, as well as provide further design parameters for the mill flowsheet and the associated mill operations and tailings management. Overall, the latest programs supported conclusions of previous process development work and the current mill design parameters. Gravity recoveries averaged 36.3% with higher gravity recoveries possible when higher-grade material is processed through the plant.
Additional metallurgical tests of the mine dumps and San Albino vein oxide material, which were the first materials processed through the plant, indicated gold recoveries in excess of 95%. It was therefore determined that 95% was a reasonable gold recovery percentage for the purposes of reporting the San Albino resources in 2020.
|
The final metallurgical test program completed prior to 2022 was designed to subject each of the samples to bench-scale tests of the chosen flowsheet for the San Albino project from comminution, gravity concentration, CIL cyanide leaching, cyanide destruction in tailings, and separation of solids from liquids in the tailings.
The scope of work completed in 2019 and 2020 includes:
/ Sample selection;
/ Head sample characterization;
/ Carbon content; Mineralogical studies;
/ Comminution studies;
/ Gravity recovery of gold;
/ Metallurgical response tests;
/ Cyanide consumption;
/ Optimized leach tests;
/ Factors affecting gold recovery;
/ Detoxification of the leach circuit tailings; and
/ Metallurgical analysis of historic dump materials.
A summary of each of these items is provided in the following subsections.
13.1.2 SAMPLE SELECTION FOR 2019-2020 TEST WORK
As with previous process development testing, the sample material used for the 2019 to 2020 testing program represented the three styles of mineralization at the San Albino deposit recognized as sulfide, oxide and mixtures of oxide and sulfide. Four composite samples were assembled from drill core to represent the deposit as follows: (1) the San Albino oxide composite - San Albino Oxide; (2) the San Albino fresh composite - SA- Fresh ; (3) the Arras oxide composite, and (4) the underground composite. The four composites were selected by Mako's metallurgist working with the geologist and were considered to be representative of the deposit.
13.1.3 HEAD SAMPLE CHARACTERIZATION
With the recognized impact of the free gold in the deposit, the head grade of the samples was determined in triplicate by fire assay and cross-checked with metallic-screen fire assays. The silver assays were completed by AA while the sulfur and carbon analyses were done by microbalance measurements and Leco furnace gas detection. The grades of the four composites used in the testing program are shown in Table 13-1 and Table 13-2 below.
|
Table 13-1 Composite Gold Head Grade Analysis
| Composite ID | Au (g/t) by fire assays on 30g splits | Au (g/t) by metallic-screen, | Average | |||
| Cut A | Cut B | Cut C | REP Cut A | ~500g splits with 30g fire assay | ||
| San Albino Oxide | 8.69 | 12.75 | 9.38 | 11.65 | 10.14 | 10.52 |
| San Albino Fresh | 11.60 | 11.81 | 9.99 | 11.45 | 8.57 | 10.6 |
| Arras Oxide | 4.28 | 3.86 | 3.96 | 3.62 | 4.71 | 4.09 |
| Underground | 7.86 | 5.79 | 4.86 | 8.60 | 6.85 | 6.79 |
| Overall Average 8.02 | ||||||
Table 13-2 Other Head Grade Analyses
| Composite ID | |||||
| Items | Unit | San Albino Oxide | San Albino Fresh | Arras Oxide | Underground |
| Ag | ppm | 21.30 | 16.3 | 12.90 | 11.5 |
| TOT/C | % | 0.22 | 1.34 | 0.10 | 1.65 |
| C/ORG | % | 0.17 | 0.65 | 0.08 | 0.80 |
| C/INORG | % | <0.01 | 0.43 | <0.01 | 0.71 |
| C/GRA | % | 0.05 | 0.26 | 0.01 | 0.28 |
| TOT/S | % | 0.23 | 1.72 | 0.10 | 1.58 |
| ELM/S | % | 0.01 | <0.01 | <0.01 | <0.01 |
| S/S- | % | 0.06 | 1.50 | 0.09 | 1.31 |
| S(SO4) | % | 0.21 | 0.02 | 0.21 | 0.05 |
| As | ppm | 2650.0 | 5368.0 | 9647.0 | 2570.0 |
| Sb | ppm | 7.5 | 7.1 | 10.6 | 5.2 |
| Bi | ppm | 34.5 | 20.9 | <0.5 | 8.9 |
| Se | ppm | 18.0 | 12.0 | 22.0 | 14.0 |
| SiO2 | % | 73.77 | 75.0 | 75.0 | 79.72 |
13.1.4 CARBON CONTENT
The four composites in the 2019-2020 test work had a total carbon content ranging from 0.10 to 1.65% with the potential gold absorbing levels ranging from <0.01 to 0.71% inorganic carbon. The underground composite had the highest level of potential preg-robbing carbon with the SA-Fresh composite having somewhat less.
The proposed CIL leach circuit will employ activated carbon to address the known carbon content at San Albino. The use of CIL versus carbon-in-pulp ("CIP") or standard cyanide leaching was validated by tests completed in 2019 on three composites. Table 13-3 shows the different extraction percentages for the three composites. Note: SA-Ox is slightly preg-robbing at approximately 5% lower, and the SA-Fresh is significantly preg-robbing at 66% lower.
|
Table 13-3 Effect of Standard Leaching versus CIL, San Albino Deposit Composites
| COMPOSITE NAME | CIL Au EXTRACTION % | DIFFERENCE | STANDARD CIP Au EXTRACTION % |
| SAN ALBINO - OX | 94.00% | 5.2% | 88.8% |
| SAN ALBINO - FRESH | 74.03% | 66.23% | 7.8% |
| ARRAS - OX | 89.15% | 1.35% | 87.8% |
13.1.5 MINERALOGICAL STUDIES
The four composite samples were subjected to mineralogical studies to characterize the gold and silver occurrences, assess particle size and shape, and levels of liberation. The studies showed that over 90% of the gold in the four composites occurred as native gold, or gold electrum, with only trace quantities in other gold minerals. The size of the gold grains averaged 12.4 to 30 microns, with more than 50% coarser than 30 microns and generally conducive to gravity concentration. The particle shape was mostly circular. There was a high proportion of liberation of the gold particles at 80% passing 150 microns and conducive to cyanide leaching. The silver occurrence had 60% to 90% containment in the gold particles or gold minerals and could be recovered in conjunction with the gold.
13.1.6 COMMINUTION STUDIES
In support of comminution in the crushing and grinding of the San Albino deposit mineralization, the crusher work index tests averaged 4.72kW/t with the abrasion index average at 0.2882. The work index for grinding averaged 15.4kW/t indicating a moderately hard rock to grind to liberation of the gold and silver at 80% passing 75 microns.
13.1.7 GRAVITY RECOVERY
Gravity recovery of the four composites showed good results and ranged from 28.8% to 50.1% with the highest gravity recovery result on the Arras oxide composite.
13.1.8 METALLURGICAL RESPONSE TESTS
Metallurgical response tests were carried out on the four composites for grinding, gravity recovery and cyanidation of the gravity tails with CIL. Four different grind sizes were tested for each composite sample. The testing showed gold recoveries by gravity ranging from 24.7 to 50.1% with overall gold recoveries from combined gravity and CIL ranging from 70.2% to 96.8%. The oxide samples showed the highest recoveries, and the fresh composite sample showed the lowest. Although there were four size distributions used in the testing from 80% passing 50 microns to 150 microns there was no appreciable trend in recoveries on the finer sizes as would be expected.
|
13.1.9 CYANIDE CONSUMPTION
The cyanide leach conditions were maintained with NaCN consumption ranging from 0.97 kg/t to 2.65kg/t and lime consumption ranging from 0.62 to 1.89kg/t. The lowest reagent consumption indicated was on the SA-Fresh composite sample. Preliminary optimization testing showed no improvement with the addition of lead nitrate, but some improvement with extension of the leach time from 24 to 48hr for the SA-Fresh composite sample with the leach time extension increasing the cyanide consumption.
13.1.10 OPTIMIZED LEACH TESTS
The optimized leach tests on the three composites showed overall gold recoveries averaging 86.1% for the SA- Fresh composite, 92.3% for the Arras oxide composite and 96.9% for the SA-Ox composite (each averages of four CIL tests, respectively). Gravity recovery for the three composite samples averaged 36.3%. Silver recovery was relatively constant for the three composites tested, averaging 67.5%, with the highest silver recovery at 74.1% reported on the lower grade Arras oxide composite. The leach conditions were optimized for three tests on each composite with the grind at 80% passing 75 microns.
13.1.11 FACTORS AFFECTING RECOVERY
Comparisons of the overall flowsheet performance to the sulfur content of the mineralization and the acid- insoluble carbon showed strong correlations with both constituents in the mineralization contributing to decreases in gold recovery.
13.1.12 DETOXIFICATION OF THE LEACH CIRCUIT TAILINGS
Detoxification of the leach circuit tailings showed that the INCO/SO2 treatment could achieve less than 1 mg/l of WAD CN in the tailings with cyanide lowered to less than the compliance level. Settling and filtration testing of the leach tailings showed that pressure filtration would be required to achieve a tailings moisture level suitable for conveying and dry stacking. Work is continuing on defining tailings treatment procedures.
13.1.13 METALLURGICAL ANALYSIS OF HISTORICAL DUMP MATERIAL
Metallurgical analysis performed in 2020 by Bureau Veritas tested mill feed material from the historical dump material (cancha) of the San Albino deposit for the start of operations (Table 13-4). The first stage utilized a benchtop Knelson concentrator for gold and silver recovery. The second portion of the test focused on passing the tails generated from the gravity concentrator through a simulation of the CIL circuit. The overall average recovery of 96.4% compared favorably to the SA-Ox composite, which had an overall average recovery of 96.9%.
|
Table 13-4 Summary of 2020 Results for Historic Dump Material Overall Recovery
| Test No | Gravity | CIL | Overall | |||
| Au % | Ag % | Au % | Ag % | Au % | Ag % | |
| G1 and CIL-1 | 48.6 | 18.2 | 47.9 | 70.9 | 96.6 | 89.1 |
| G1 and CIL-2 | 48.6 | 18.2 | 47.6 | 69.2 | 96.3 | 87.4 |
| Average | 48.6 | 18.2 | 47.8 | 70.01 | 96.4 | 88.3 |
* metallic-screen analysis
One result of the test work performed on the historic dump material is an estimate of the rate of consumption of NaCN. The preliminary test work had shown a consumption rate of 5.44kg/t of material where previous test work had shown NaCN consumption rates at 3.07kg/t with both tests at 72hrs of leaching. This difference impacts the cost of recovery, while the test work shows slightly improved recovery. This difference in reagent consumption will remain a parameter for ongoing study.
13.2 2022 TESTING
13.2.1 SUMMARY
Metallurgical testing was completed in the laboratory at the San Albino mine site on 12 composites from the Las Conchitas deposit in 2022. The samples were tested using the procedures developed in the laboratory on the mine site that produce results that compare quite well with the results achieved in the operating mill facility. The results of these tests indicate the mineralized material from Las Conchitas should give similar results in the operating mill as is currently being achieved in the San Albino mill.
13.2.2 TESTING PROCEDURES
Testing procedures have been developed in the laboratory at the San Albino mine site to ensure the results from lab testing compare with the results achieved in the operating mill when processing similar feed material. The lab procedures are based on a feed production similar in size to the feed product from the operating mill. Lab grind tests have been completed on mill feed samples to develop the list of lab parameters required to achieve the same grind size as the operating mill. The product from the lab grinding mill was tested under varying leach parameters until the parameters needed to duplicate the leach results in the operating mill were realized. These parameters include:
Grind parameters:
» Grind at 60% solids in lab ball mill
» Grind time 26 minutes
|
Leach Parameters:
» Leach at 45% solids
» pH between 10.2 and 10.8
» Cyanide concentration to start at 700 ppm NaCN and allowed to drift
» Leach for 36 hours
» Leach includes 10 grams per liter activated carbon.
13.2.3 SAMPLES TESTED AND TEST RESULTS
The following composites were tested:
/ Mina Francisco zone
» One composite of weathered mineralized material (MFOC-1)
» One composite of fresh (MFFC-1)
» Cruz Grande One composite of weathered mineralized material (CGOC-1)
» Two composites of fresh (CGFC-1, CGFC-2)
/ Mango zone
» One composite of weathered mineralized material (MgOC-1)
» Two composites of fresh (MgFC-1, MgFC-2)
/ Bayacun zone
» Two composites of weathered mineralized material (BoOC-1, BoOC-2)
» Two composites of fresh (BoFC-1, BoFC-2)
Each of these composites were tested in the laboratory at the mine site using the parameters listed above. These parameters were chosen because the plan is to use the current mill at San Albino with the current operating conditions when processing the mineralized material from Las Conchitas. The testing of the Las Conchitas composites was done to verify the current operating parameters will ensure successful processing of the mineralized material from Las Conchitas. The results from these tests are given in Table 13-5 Table 13-6 along with the results from a mill feed sample taken on November 7 (Table 13-6).
Table 13-5 Test Results from Las Conchitas composites
| Composite | MFOC-1 | MFFC-1 | CGOC-1 | CGFC-1 | CGFC-2 | MgOC-1 |
| Head Assay | 6.91 | 11.50 | 12.87 | 6.93 | 7.41 | 2.89 |
| BC Head | 7.18 | 10.50 | 11.21 | 6.99 | 7.13 | 2.74 |
| % preg-rob | 18.7% | 47.2% | 29.0% | 39.0% | 54.8% | 15.6% |
|
| Composite | MFOC-1 | MFFC-1 | CGOC-1 | CGFC-1 | CGFC-2 | MgOC-1 |
| % passing 200 mesh | 77.1% | 76.7% | 79.3% | 81.9% | 77.5% | 79.4% |
| Tail soln, g/t Au | 0.18 | 0.06 | 0.08 | 0.04 | 0.19 | 0.06 |
| Tail solid, g/t | 0.760 | 1.633 | 1.653 | 1.320 | 1.753 | 0.280 |
| Carbon assay, ppm Au | 279 | 396 | 426 | 253 | 232 | 107 |
| Final CN conc, ppm | 550 | 550 | 370 | 300 | 350 | 510 |
| % Rec. assay head | 89.0% | 85.8% | 87.2% | 81.0% | 76.4% | 90.3% |
| % Rec. BC head | 89.4% | 84.4% | 85.2% | 81.1% | 75.4% | 89.8% |
| Composite | MgFC-1 | MgFC-2 | BoOC-1 | BoOC-2 | BoFC-1 | BoFC-2 |
| Head Assay | 7.16 | 9.79 | 8.04 | 4.08 | 21.97 | 8.27 |
| BC Head | 7.55 | 8.73 | 7.68 | 3.50 | 20.54 | 7.16 |
| % preg-rob | 51.3% | 34.6% | 16.7% | 26.8% | 37.4% | 56.1% |
| % passing 200 mesh | 80.0% | 78.4% | 84.8% | 81.2% | 79.7% | 79.5% |
| Tail soln, g/t Au | 0.04 | 0.05 | 0.11 | 0.06 | 0.09 | 0.06 |
| Tail solid, g/t | 1.540 | 2.013 | 0.687 | 0.533 | 2.360 | 1.907 |
| Carbon assay, ppm Au | 268 | 300 | 309 | 130 | 813 | 233 |
| Final CN conc, ppm | 500 | 540 | 580 | 320 | 350 | 420 |
| % Rec. assay head | 78.5% | 79.4% | 91.5% | 86.9% | 89.3% | 77.0% |
| % Rec. BC head | 79.6% | 76.9% | 91.1% | 84.7% | 88.5% | 73.4% |
Table 13-6 Test Results from San Albino Mill Feed
| Composite | San Albino Mill Feed Sample |
| Head Assay | 5.57 |
| BC Head | |
| % preg-rob | 72.5% |
| % passing 200 mesh | 86.2% |
| Tail soln, g/t Au | 0.38 |
| Tail solid, g/t | 1.033 |
| Carbon assay, ppm Au | |
| Final CN conc, ppm | |
| % Rec. assay head | 81.4% |
| % Rec. BC head |
|
The lab test on the mill feed sample gives a head grade of 5.57 g/t Au, preg-rob of 72.5% and a recovery of 81.4% (second table). This compares to a mill feed head grade of 5.60 g/t Au, preg-rob of 78.8% and a recovery of 81.2%.
13.2.4 CONCLUSIONS
Both San Albino and Las Conchitas deposits contain three major types of mineralized material: weathered, transition and fresh. When processing these types of mineralized material from the San Albino mine through the San Albino mill the average gold recoveries were: oxide 94%, transition 86% and fresh 79% with the preg- rob potential present in the various types of mineralized material being the primary reason for the lower recovery in the transition and fresh mineralized material types compared to the weathered mineralized material. The weathered and fresh types of material from Las Conchitas were tested in the lab on site in the 2022 test program. Results from these tests indicate the gold recovery to be very dependent upon the preg-rob potential present similar to the results from milling the San Albino mineralized material. As the Las Conchitas deposit is processed it will be important to blend down the preg-rob potential of the mill feed by mixing oxide mineralized material with low preg-rob potential with the higher preg-rob potential fresh mineralized material.
Before full-scale mining starts at Las Conchitas, test pits will be mined to produce mineralized material from each of the individual mineralized material zones for test runs through the existing mill at San Albino. A minimum of 500 tons of mineralized material is planned to be processed from each of these mineralized material zones during the operation of the test pits. Results from these test runs will be used to better understand the processing results that can be expected from the Las Conchitas mine. This test work is in progress as of the effective date of this report
|
14.0 MINERAL RESOURCE ESTIMATES (ITEM 14)
14.1 INTRODUCTION
The mineral resource estimation for the San Albino and Las Conchitas deposits was completed for disclosure in accordance with Canadian National Instrument 43-101 ("NI 43-101"). The San Albino modeling and estimation of the mineral resources were completed on May 17, 2020 under the supervision of Mr. Steven Ristorcelli, a Qualified Person with respect to mineral resource estimations under NI 43-101. Pit optimizations were completed on August 14, 2023 and stope optimizations were completed on August 3, 2023 but tabulations used topography dated June 30, 2023. Therefore, the Effective Date of the San Albino resource estimate is August 18, 2023 using a database with an Effective Date of March 18, 2023. Las Conchitas open pit and stope optimizations were completed on October 9, 2023 and tabulations from within those resource shells were completed on October 11, 2023, making that the effective date of the Las Conchitas resource estimate. The Las Conchitas database has an Effective Date of July 11, 2023 (trivial additions to the database were made up until July 11, 2023 after the initial database was completed on March 11, 2023).
Mr. Ristorcelli is independent of Mako and its subsidiaries by the definitions and criteria set forth in NI 43- 101; there is no affiliation between Mr. Ristorcelli and Mako or its subsidiaries except that of independent consultant/client relationships. Mr. Ristorcelli is not aware of any environmental, permitting, legal, title, taxation, socio-economic, marketing, or political factors, beyond those discussed in this report, that may materially affect the San Albino or Las Conchitas deposits mineral resources as of the date of this report. No mineral reserves have been estimated for the San Albino or Las Conchitas deposits.
The San Albino and Las Conchitas mineral resources are classified in order of increasing geological and quantitative confidence into Inferred, Indicated, and Measured categories in accordance with the "CIM Definition Standards - For Mineral Resources and Mineral Reserves" (2014) and therefore NI 43-101. CIM mineral resource definitions are given below, with CIM's explanatory text shown in italics:
Mineral Resource
Mineral Resources are sub-divided, in order of increasing geological confidence, into Inferred, Indicated and Measured categories. An Inferred Mineral Resource has a lower level of confidence than that applied to an Indicated Mineral Resource. An Indicated Mineral Resource has a higher level of confidence than an Inferred Mineral Resource but has a lower level of confidence than a Measured Mineral Resource.
|
A Mineral Resource is a concentration or occurrence of solid material of economic interest in or on the Earth's crust in such form, grade or quality and quantity that there are reasonable prospects for eventual economic extraction.
The location, quantity, grade or quality, continuity and other geological characteristics of a Mineral Resource are known, estimated or interpreted from specific geological evidence and knowledge, including sampling.
Material of economic interest refers to diamonds, natural solid inorganic material, or natural solid fossilized organic material including base and precious metals, coal, and industrial minerals.
The term Mineral Resource covers mineralization and natural material of intrinsic economic interest which has been identified and estimated through exploration and sampling and within which Mineral Reserves may subsequently be defined by the consideration and application of Modifying Factors. The phrase 'reasonable prospects for eventual economic extraction' implies a judgment by the Qualified Person in respect of the technical and economic factors likely to influence the prospect of economic extraction. The Qualified Person should consider and clearly state the basis for determining that the material has reasonable prospects for eventual economic extraction. Assumptions should include estimates of cutoff grade and geological continuity at the selected cutoff, metallurgical recovery, smelter payments, commodity price or product value, mining and processing method and mining, processing and general and administrative costs. The Qualified Person should state if the assessment is based on any direct evidence and testing.
Interpretation of the word 'eventual' in this context may vary depending on the commodity or mineral involved. For example, for some coal, iron, potash deposits and other bulk minerals or commodities, it may be reasonable to envisage 'eventual economic extraction' as covering time periods in excess of 50 years. However, for many gold deposits, application of the concept would normally be restricted to perhaps 10 to 15 years, and frequently to much shorter periods of time.
Inferred Mineral Resource
An Inferred Mineral Resource is that part of a Mineral Resource for which quantity and grade or quality are estimated on the basis of limited geological evidence and sampling. Geological evidence is sufficient to imply but not verify geological and grade or quality continuity.
|
An Inferred Mineral Resource has a lower level of confidence than that applying to an Indicated Mineral Resource and must not be converted to a Mineral Reserve. It is reasonably expected that the majority of Inferred Mineral Resources could be upgraded to Indicated Mineral Resources with continued exploration.
An Inferred Mineral Resource is based on limited information and sampling gathered through appropriate sampling techniques from locations such as outcrops, trenches, pits, workings and drill holes. Inferred Mineral Resources must not be included in the economic analysis, production schedules, or estimated mine life in publicly disclosed Pre-Feasibility or Feasibility Studies, or in the Life of Mine plans and cash flow models of developed mines. Inferred Mineral Resources can only be used in economic studies as provided under NI 43-101.
There may be circumstances, where appropriate sampling, testing, and other measurements are sufficient to demonstrate data integrity, geological and grade/quality continuity of a Measured or Indicated Mineral Resource, however, quality assurance and quality control, or other information may not meet all industry norms for the disclosure of an Indicated or Measured Mineral Resource. Under these circumstances, it may be reasonable for the Qualified Person to report an Inferred Mineral Resource if the Qualified Person has taken steps to verify the information meets the requirements of an Inferred Mineral Resource.
Indicated Mineral Resource
An Indicated Mineral Resource is that part of a Mineral Resource for which quantity, grade or quality, densities, shape and physical characteristics are estimated with sufficient confidence to allow the application of Modifying Factors in sufficient detail to support mine planning and evaluation of the economic viability of the deposit.
Geological evidence is derived from adequately detailed and reliable exploration, sampling and testing and is sufficient to assume geological and grade or quality continuity between points of observation.
An Indicated Mineral Resource has a lower level of confidence than that applying to a Measured Mineral Resource and may only be converted to a Probable Mineral Reserve.
Mineralization may be classified as an Indicated Mineral Resource by the Qualified Person when the nature, quality, quantity and distribution of data are such as to allow confident interpretation of the geological framework and to reasonably assume the continuity of mineralization. The Qualified Person must recognize the importance of the Indicated Mineral
|
Resource category to the advancement of the feasibility of the project. An Indicated Mineral Resource estimate is of sufficient quality to support a Pre-Feasibility Study which can serve as the basis for major development decisions.
Measured Mineral Resource
A Measured Mineral Resource is that part of a Mineral Resource for which quantity, grade or quality, densities, shape, and physical characteristics are estimated with confidence sufficient to allow the application of Modifying Factors to support detailed mine planning and final evaluation of the economic viability of the deposit.
Geological evidence is derived from detailed and reliable exploration, sampling and testing and is sufficient to confirm geological and grade or quality continuity between points of observation.
A Measured Mineral Resource has a higher level of confidence than that applying to either an Indicated Mineral Resource or an Inferred Mineral Resource. It may be converted to a Proven Mineral Reserve or to a Probable Mineral Reserve.
Mineralization or other natural material of economic interest may be classified as a Measured Mineral Resource by the Qualified Person when the nature, quality, quantity and distribution of data are such that the tonnage and grade or quality of the mineralization can be estimated to within close limits and that variation from the estimate would not significantly affect potential economic viability of the deposit. This category requires a high level of confidence in, and understanding of, the geology and controls of the mineral deposit.
Mr. Ristorcelli reports resources at cutoffs that are reasonable for deposits of this nature given mining methods and plant processing costs, while also considering economic conditions, because of the regulatory requirements that a resource exists "in such form and quantity and of such a grade or quality that it has reasonable prospects for eventual economic extraction."
14.2 SAN ALBINO
14.2.1 DATABASE
The resource estimate in this report used drill and channel sample data discussed in Sections 9.1, 10, and 11. The database used for the resource estimate has an Effective Date of March 18, 2023 and the resource estimate is August 18, 2023.
|
Descriptive statistics of that database are given in Table 14-1. The resource database does include channel samples from trenches and pits in the San Albino resource area. All the samples were coded for type: core, RC and channel samples. A total of 1,144 trench samples and 41 core samples were eliminated from use for resource estimation because some aspect made them less reliable. RC and blast hole samples were not used for estimation and rarely used for modeling.
Results from channel samples taken from trenches and shallow surface exploration pits are treated as "drillholes" in the database. In addition to those data shown in Table 14-1, logged geologic data as well as 33- element trace-element geochemistry was available and loaded. The database used for this estimate is comprehensive, well maintained and extremely useful.
Table 14-1 Descriptive Statistics of the Resource Database
| Valid | Median | Mean | Std. Dev. | CV | Minimum | Maximum | Units | |
| From | 90,929 | 0.00 | 392.00 | m | ||||
| To | 90,929 | 0.10 | 393.20 | m | ||||
| Length* | 90,929 | 1.00 | 1.28 | 0.05 | 37.50 | m | ||
| Type | 87,659 | 1 | 5 | |||||
| Use | 90,929 | 1 | 1 | |||||
| Conf. code | 90,929 | 0 | 1 | |||||
| Au | 87,241 | 0.014 | 0.444 | 4.393 | 9.9 | 0.001 | 546 | g/t |
| Ag | 87,133 | 0.39 | 1.49 | 16.26 | 10.9 | 0.05 | 3086 | g/t |
| Cu | 87,063 | 50 | 66 | 98 | 1.5 | 1 | 12500 | ppm |
| Pb | 86,928 | 15 | 145 | 1073 | 7.4 | 1 | 49900 | ppm |
| Zn | 86,902 | 182 | 264 | 572 | 2.2 | 1 | 58900 | ppm |
| As | 87,122 | 14 | 234 | 1113 | 4.8 | 1 | 12500 | ppm |
| Core recovery | 82,660 | 90 | 86 | 14 | 0.2 | 0 | 100 | % |
| Density | 5,496 | 2.56 | 2.52 | 0.21 | 0.1 | 1.50 | 4.09 | g/cm3 |
* Long sample lengths were just intervals without samples.
"CV" is Coefficient of Variation (standard deviation divided by the mean)
14.2.2 MINERAL DOMAINS
Mako and its predecessor have modeled the geology of the San Albino gold deposits for a decade. Little was changed from Mako's overall geologic interpretation. Ristorcelli verified the interpretation and added more detail based on core and trench logs, collar and downhole survey data, and photographs. A three dimensional ("3D") model was created using cross-sectional interpretations looking N40oE and spaced at 10m intervals. Like in 2020, the interpretation was reviewed by Mako and Ristorcelli. The combined geologic and domain model that included quartz veins, "halos" of mineralized hanging wall sheared rock, halos of mineralized footwall sheared rock, dumps, and surfaces for the limits of overburden, and completely oxidized material and transitional oxidation was accepted by both parties.
|
Three major veins and subsidiary veins at the San Albino deposit were grouped as shown in Table 14-2. The veins were numbered, and higher numbers indicate structurally higher levels. Each vein shape was modeled based on drill and trench data. For the San Albino vein, the hanging wall halo mineralization was modeled separately from the footwall halo, while the mineralized halos around the Arras and Naranjo veins were modeled as envelopes without a distinction of hanging wall and footwall. Ristorcelli did not separate vein versus halo for the El Jobo vein or the unnamed "miscellaneous" veins. El Jobo and the miscellaneous veins are entirely categorized as Inferred resources because of uncertain continuity due in part to insufficient drilling.
Table 14-2 Modeled Geological and Mineral Domains, San Albino Deposit
| Geologic Domain Name | Comment | Domain Number |
| Miscellaneous veins | poorly defined, uncertain continuity | 95 |
| El Jobo vein | poorly defined in San Albino hanging wall* | 75 |
| San Albino hanging wall | hanging wall halo | 57 |
| San Albino II vein | hanging wall splay of San Albino vein | 55 |
| San Albino vein | main vein | 55 |
| San Albino footwall | footwall halo | 53 |
| Naranjo halo | footwall and hanging wall halo | 37 |
| Naranjo vein | main vein | 35 |
| Arras halo | footwall and hanging wall halo | 17 |
| Arras vein | main vein | 15 |
*Modeled with San Albino and considered part of San Albino main vein
Cumulative probability plots of major and trace elements, including gold and silver, were made; Figure 14-1 shows cumulative probability plots of gold, silver, lead and arsenic from 2020. The gold cumulative probability plot is interpreted in context of the San Albino deposit geology: unmineralized country rock constitutes about 80% to 90% of assayed samples; halo or hanging wall and footwall mineralization fills the range between about 90% and 98% of assays, and the mineralized veins at the San Albino deposit comprise the upper ~2% of all assayed samples. The highest gold grades, likely represented by veins with "stylolitic" textures and galena, are a subset of the vein domain. Arsenic forms a broader halo around the veins than gold. Lead, contained in galena, occurs mainly in the mineralized veins, with low concentrations in the halos and wall rocks. Mako had recognized these relationships.
|
Two mineral domains - almost coincident with and driven by the geologic model domains - were used to control the gold resource estimate: a low-grade, vein halo domain containing mineralized wall rock with grades generally between ~0.1g Au/t and ~2-4g Au/t, and a vein domain beginning at ~2-4g Au/t. The gold mineralization in the low-grade domain is in sheared and/or brecciated wallrock in the margins of gold-bearing quartz veins and contains sparse, often broken or brecciated, discontinuous quartz veins. The mid-grade vein domain is made up of vein quartz with minor sulfides, and minor intensely sheared and mineralized wall rock. The probability plots indicate the presence of a third and higher-grade domain with grades greater than ~20- 30g Au/t. This high-grade mineralization is contained in quartz veins with "styolitic" textures, galena, and commonly containing visible gold. Although distinct, the higher-grade quartz vein domain was not modeled separately from the vein domain because of volume and continuity considerations. While the mid- and high- grade domains are primarily composed of quartz veins, several instances of strongly brecciated and gold mineralized material with quartz vein clasts were observed as well.
Figure 14-1 Cumulative Probability Plot for All Veins and Country Rock: Au, Ag, Pb and As
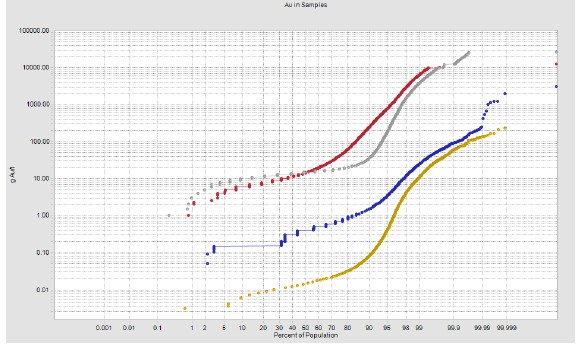
(yellow - gold; blue - silver; grey - lead; red - arsenic)
The gold and silver probability plots have similar forms suggesting that both metals were similarly introduced in quartz veins, with only minor and local differences. Because silver represents a small portion of the economic value of the deposit, and the spatial distributions of the gold and silver are substantially similar, the gold domains were used to control the silver estimation.
|
The definitions and spatial distributions of the geologic mineral domains were previously established by Mako from their logging of drill core and channel samples, and Mako's geologic modeling. Those interpretations were subsequently modified by the author. For resource estimation purposes, Mr. Ristorcelli retained the low- grade domain but combined the high- and mid-grade domains into a single vein domain. Thus, the following mineral domains were used to constrain the estimate:
/ Sheared low-grade halo domain from ~0.1g Au/t to ~2-4g Au/t. Hanging wall and footwall zones of ductile and brittle shearing; gold likely associated with stringer veins and clasts of vein incorporated into the breccias; and
/ Vein domain from ~2-4g Au/t to ~20-30g Au/t. White, stylolitic quartz veins with minor amounts of sulfides including galena; can contain visible gold as grains less than 1mm; includes internal zones with greater than ~20-30g Au/t.
Dikes have been logged but rarely and an example is shown in Figure 14-2. The example in Figure 14-2 is distinctly different from the country rock and mineralization. The author attempted to include the dikes in the 3D geologic model but was unable to confidently correlate individual dikes between drillholes. In 2020, to further evaluate the relationship of dikes to mineralization, the author tabulated the gold grade in dikes intersected in drilling. Sixty-nine dike intercepts were not sampled or analyzed; 167 had non-detectable gold grades to grades up to 0.1g Au/t; nine had grades between 0.1 and 1.0g Au/t; and only three samples logged as dikes had grades greater than 5.0g Au/t. The effect of the thin dikes on dilution was considered minimal to non-existent.
|
Figure 14-2 Core with Dikes
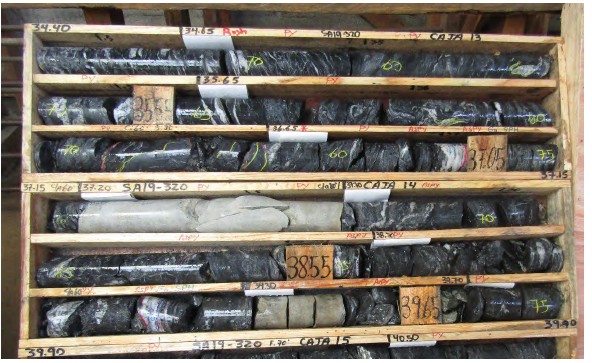
A typical dike interval is shown by the light coloration from 37.2m to 37.7m and 39.3m to 39.5m.
In addition to the vein domains, historical mine dumps at the San Albino deposit were modeled and estimated for their contained gold resources. Descriptive information for the San Albino mineral domains, country rock, and the mine dumps at the San Albino deposit are given in Table 14-3. Geologic cross sections showing the veins are given in Figure 14-3 and Figure 14-4. It is noteworthy and expected that grades of the halo material have substantially higher coefficients of variation ("CV") because of the local and discontinuous nature of its vein mineralization. The vein material, however, has relatively low coefficients of variation even with uncapped assays. All historical mine dumps were mined prior to the 2023 update.
 |
Table 14-3 Descriptive Statistics of Samples by Vein and Domain
| Arras Vein | ||||||||
| Samples | Median | Mean | Std Dev | CV | Minimum | Maximum | Units | |
| Au | 733 | 6.94 | 13.56 | 20.65 | 1.52 | 0.01 | 234.19 | g/t |
| Au Capped | 733 | 6.94 | 13.03 | 16.84 | 1.29 | 0.01 | 100.00 | g/t |
| Ag | 728 | 15.60 | 24.48 | 27.18 | 1.11 | 0.20 | 204.20 | g/t |
| Ag Capped | 728 | 15.60 | 24.22 | 25.80 | 1.07 | 0.20 | 150.00 | g/t |
| Arras Halo | ||||||||
| Samples | Median | Mean | Std Dev | CV | Minimum | Maximum | Units | |
| Au | 1,379 | 0.27 | 0.77 | 1.75 | 2.28 | 0.01 | 24.00 | g/t |
| Au Capped | 1,379 | 0.27 | 0.72 | 1.37 | 1.90 | 0.01 | 10.00 | g/t |
| Ag | 1,369 | 1.90 | 3.54 | 5.96 | 1.68 | 0.05 | 92.50 | g/t |
| Ag Capped | 1,369 | 1.90 | 3.37 | 4.54 | 1.35 | 0.05 | 30.00 | g/t |
| Naranjo Vein | ||||||||
| Samples | Median | Mean | Std Dev | CV | Minimum | Maximum | Units | |
| Au | 218 | 13.48 | 22.38 | 26.11 | 1.17 | 0.04 | 168.30 | g/t |
| Au Capped | 218 | 13.48 | 20.04 | 18.69 | 0.93 | 0.04 | 65.00 | g/t |
| Ag | 207 | 21.59 | 30.09 | 28.83 | 0.96 | 0.90 | 193.00 | g/t |
| Ag Capped | 207 | 21.60 | 28.15 | 22.91 | 0.81 | 0.90 | 80.00 | g/t |
| Naranjo Halo | ||||||||
| Samples | Median | Mean | Std Dev | CV | Minimum | Maximum | Units | |
| Au | 363 | 0.29 | 0.77 | 1.05 | 1.37 | 0.00 | 7.43 | g/t |
| Au Capped | 363 | 0.29 | 0.77 | 1.05 | 1.37 | 0.00 | 7.43 | g/t |
| Ag | 347 | 1.50 | 2.95 | 5.25 | 1.78 | 0.05 | 56.40 | g/t |
| Ag Capped | 347 | 1.50 | 2.70 | 3.58 | 1.32 | 0.05 | 20.00 | g/t |
| San Albino Footwall | ||||||||
| Samples | Median | Mean | Std Dev | CV | Minimum | Maximum | Units | |
| Au | 946 | 0.28 | 0.73 | 2.00 | 2.73 | 0.01 | 51.54 | g/t |
| Au Capped | 946 | 0.28 | 0.67 | 1.04 | 1.55 | 0.01 | 7.00 | g/t |
| Ag | 938 | 1.90 | 4.09 | 15.12 | 3.70 | 0.15 | 423.00 | g/t |
| Ag Capped | 938 | 1.90 | 3.40 | 4.30 | 1.26 | 0.15 | 25.00 | g/t |
| San Albino Vein | ||||||||
| Samples | Median | Mean | Std Dev | CV | Minimum | Maximum | Units | |
| Au | 686 | 9.81 | 17.20 | 20.59 | 1.20 | 0.04 | 145.50 | g/t |
| Au Capped | 686 | 9.81 | 16.86 | 18.88 | 1.12 | 0.04 | 100.00 | g/t |
| Ag | 685 | 19.00 | 28.05 | 27.81 | 0.99 | 0.20 | 189.00 | g/t |
| Ag Capped | 685 | 19.00 | 27.95 | 27.27 | 0.98 | 0.20 | 150.00 | g/t |
| San Albino Hanging Wall | ||||||||
| Samples | Median | Mean | Std Dev | CV | Minimum | Maximum | Units | |
| Au | 547 | 0.29 | 0.70 | 1.12 | 1.60 | 0.01 | 12.60 | g/t |
| Au Capped | 547 | 0.29 | 0.65 | 0.86 | 1.31 | 0.01 | 4.00 | g/t |
| Ag | 546 | 1.50 | 2.90 | 4.70 | 1.62 | 0.05 | 52.80 | g/t |
| Ag Capped | 546 | 1.50 | 2.75 | 3.63 | 1.32 | 0.05 | 22.00 | g/t |
| (see Table 14-7 for capping details) |
|
Table 14-3 Descriptive Statistics by Vein and Domain (continued)
| El Jobo | ||||||||
| Samples | Median | Mean | Std Dev | CV | Minimum | Maximum | Units | |
| Au | 35 | 0.19 | 0.79 | 2.23 | 2.83 | 0.01 | 10.90 | g/t |
| Au Capped | 35 | 0.19 | 0.79 | 2.23 | 2.83 | 0.01 | 10.90 | g/t |
| Ag | 35 | 0.91 | 2.09 | 4.17 | 2.00 | 0.15 | 24.60 | g/t |
| Ag Capped | 35 | 0.90 | 2.09 | 4.17 | 2.00 | 0.15 | 24.60 | g/t |
| Miscellaneous Veins | ||||||||
| Samples | Median | Mean | Std Dev | CV | Minimum | Maximum | Units | |
| Au | 31 | 0.55 | 3.41 | 8.04 | 2.36 | 0.05 | 42.27 | g/t |
| Au Capped | 31 | 0.55 | 1.90 | 2.67 | 1.41 | 0.05 | 7.00 | g/t |
| Ag | 31 | 1.59 | 7.69 | 12.45 | 1.62 | 0.15 | 46.80 | g/t |
| Ag Capped | 31 | 1.60 | 6.66 | 9.49 | 1.42 | 0.15 | 30.00 | g/t |
| Country Rock | ||||||||
| Samples | Median | Mean | Std Dev | CV | Minimum | Maximum | Units | |
| Au | 75,038 | 0.01 | 0.06 | 2.12 | 36.77 | 0.00 | 545.96 | g/t |
| Au Capped | 75,038 | 0.01 | 0.03 | 0.17 | 5.13 | 0.00 | 3.00 | g/t |
| Ag | 74,717 | 0.39 | 0.70 | 11.31 | 16.26 | 0.00 | 1969.00 | g/t |
| Ag Capped | 74,717 | 0.40 | 0.56 | 0.87 | 1.55 | 0.00 | 10.00 | g/t |
| Dumps | ||||||||
| Samples | Median | Mean | Std Dev | CV | Minimum | Maximum | Units | |
| Au | 1,106 | 1.22 | 4.76 | 10.76 | 2.26 | 0.00 | 136.40 | g/t |
| Au Capped | 1,106 | 1.22 | 3.93 | 6.23 | 1.59 | 0.00 | 25.00 | g/t |
| Ag | 1,106 | 3.91 | 10.17 | 18.00 | 1.77 | 0.05 | 212.00 | g/t |
| Ag Capped | 1,106 | 3.90 | 9.55 | 14.16 | 1.48 | 0.05 | 70.00 | g/t |
| (see Table 14-7 for capping details) |
|
Figure 14-3 Cross Section 11 Showing Veins
Cross section locations shown in Figure 10-1 (looking azimuth 40o)
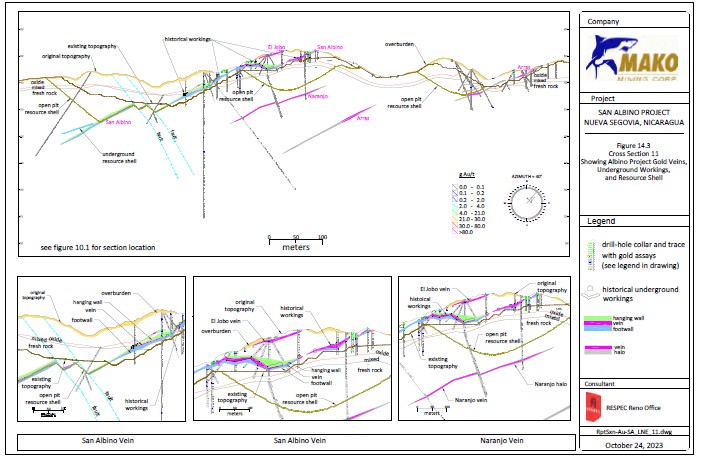
|
Figure 14-4 Cross Section 16 Showing Veins
Cross section locations shown in Figure 10-1 (looking azimuth 40o)
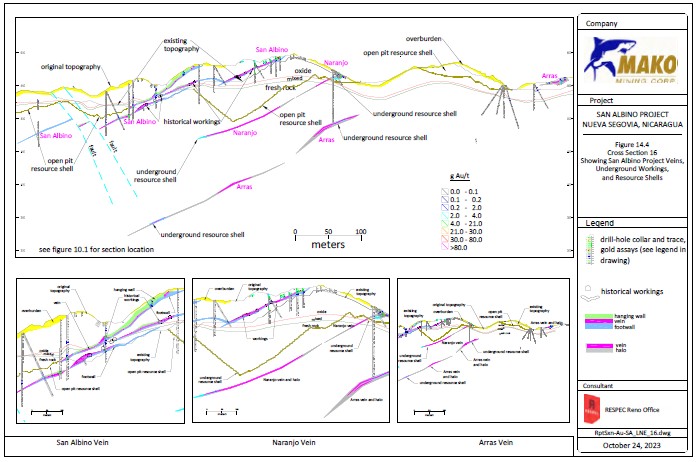
|
14.2.3 DENSITY
There are 5,176 rock density measurements determined for rocks from the San Albino deposit. Most density samples were collected from unmineralized country rock. Ristorcelli subdivided density measurements based on material type, including vein and halo categories, and whether a material was oxidized or mixed oxidized or fresh (the term used by Mako for unoxidized rock). Taking these data into account, Ristorcelli summarizes the densities of different materials in Table 14-4. The values assigned to the resource block model are presented in Table 14-5 and remained the same from the 2020 estimate.
Table 14-4 Descriptive Statistics of Density Data by Vein and Domain
| Valid | Median | Mean | Std Dev | CV | Min | Max | Units | |
| Arras Vein - Fresh Rock | 41 | 2.65 | 2.64 | 0.10 | 0.04 | 2.34 | 2.84 | g/cm3 |
| Arras Vein - Oxide | 82 | 2.44 | 2.40 | 0.25 | 0.10 | 1.93 | 3.59 | g/cm3 |
| Naranjo Vein - Fresh Rock | 58 | 2.69 | 2.71 | 0.16 | 0.06 | 2.44 | 3.45 | g/cm3 |
| Naranjo Vein - Oxide | 4 | 2.50 | 2.57 | 0.13 | 0.05 | 2.48 | 2.77 | g/cm3 |
| San Albino Vein - Fresh Rock | 84 | 2.64 | 2.65 | 0.11 | 0.04 | 2.26 | 3.12 | g/cm3 |
| San Albino Vein - Oxide | 72 | 2.49 | 2.50 | 0.19 | 0.07 | 1.96 | 2.98 | g/cm3 |
| El Jobo Vein - Fresh Rock | none | g/cm3 | ||||||
| El Jobo Vein - Oxide | 2 | 2.12 | 2.15 | 0.04 | 0.02 | 2.12 | 2.18 | g/cm3 |
| Miscellaneous Vein - Fresh Rock | 5 | 2.75 | 2.69 | 0.46 | 0.17 | 2.26 | 3.38 | g/cm3 |
| Miscellaneous Vein - Oxide | none | g/cm3 | ||||||
| Valid | Median | Mean | Std Dev | CV | Min | Max | Units | |
| Arras Halo - Fresh Rock | 41 | 2.55 | 2.54 | 0.15 | 0.06 | 2.02 | 2.81 | g/cm3 |
| Arras Halo - Oxide | 111 | 2.36 | 2.32 | 0.22 | 0.09 | 1.96 | 3.05 | g/cm3 |
| Naranjo Halo - Fresh Rock | 34 | 2.66 | 2.64 | 0.10 | 0.04 | 2.34 | 2.82 | g/cm3 |
| Naranjo Halo - Oxide | 3 | 2.23 | 2.30 | 0.19 | 0.08 | 2.15 | 2.51 | g/cm3 |
| San Albino footwall - Fresh Rock | 22 | 2.57 | 2.58 | 0.12 | 0.05 | 2.36 | 2.81 | g/cm3 |
| San Albino footwall - Oxide | 50 | 2.37 | 2.37 | 0.21 | 0.09 | 1.71 | 2.72 | g/cm3 |
| San Albino hanging wall - Fresh Rock | 13 | 2.55 | 2.56 | 0.17 | 0.07 | 2.18 | 2.80 | g/cm3 |
| San Albino hanging wall - Oxide | 25 | 2.42 | 2.43 | 0.19 | 0.08 | 2.09 | 2.78 | g/cm3 |
| Valid | Median | Mean | Std Dev | CV | Min | Max | Units | |
| Country Rock- Fresh Rock | 2,527 | 2.66 | 2.64 | 0.13 | 0.05 | 1.93 | 4.09 | g/cm3 |
| Country Rock - Oxide | 2,004 | 2.44 | 2.42 | 0.18 | 0.08 | 1.59 | 3.66 | g/cm3 |
| Note: Oxide includes mixed material (oxide and sulfide); Std Dev = standard deviation; CV = coefficient of variation |
|
Table 14-5 Assigned Density Values
| Vein Name | g/cm3 |
| Overburden | 1. 80 |
| Dumps | 1. 80 |
| Oxide country rock | 2.42 |
| Fresh country rock | 2.65 |
| Oxide halo | 2.42 |
| Fresh halo | 2.65 |
| Miscellaneous vein oxide | 2.50 |
| Miscellaneous vein fresh | 2.65 |
| San Albino vein oxide | 2.50 |
| San Albino vein fresh | 2.65 |
| Naranjo vein oxide | 2.50 |
| Naranjo vein fresh | 2.65 |
| Arras vein oxide | 2.42 |
| Arras vein fresh | 2.62 |
Note: El Jobo vein is assigned along with San Albino vein.
14.2.4 CORE RECOVERY AND REVERSE CIRCULATION DOWNHOLE CONTAMINATION
During the site visit the authors observed Mako's core recovery measurement method and found it to be correct. At a project level, core recovery is considered average. Core recovery based on domain type is presented in Table 14-6. The association of relatively high-grade mineralized veins with shear zones makes it particularly important to assess sample recovery because difficult drilling conditions and lower recoveries commonly are encountered in fault zones in general, and the mineralization at the San Albino deposit specifically. Mineralized domains generally yielded lower core recovery than the country rock.
|
Table 14-6 Core Recovery
| Domain | Valid Samples |
Median | Mean | Standard Deviation |
CV | Minimum | Maximum |
| Arras vein | 366 | 83 | 77 | 19 | 0.2 | 0 | 100 |
| Arras halo | 898 | 82 | 78 | 17 | 0.2 | 0 | 100 |
| Naranjo vein | 165 | 90 | 87 | 11 | 0.1 | 35 | 100 |
| Naranjo halo | 319 | 87 | 84 | 14 | 0.2 | 11 | 100 |
| San Albino footwall | 793 | 89 | 83 | 16 | 0.2 | 6 | 100 |
| San Albino vein | 526 | 89 | 84 | 16 | 0.2 | 0 | 100 |
| San Albino hanging wall | 452 | 89 | 83 | 15 | 0.2 | 3 | 100 |
| El Jobo | 13 | 84 | 84 | 10 | 0.1 | 61 | 98 |
| Miscellaneous vein(s) | 30 | 95 | 92 | 9 | 0.1 | 61 | 99 |
| Country rock | 77,049 | 90 | 86 | 13 | 0.2 | 0 | 100 |
An analysis in 2020 of gold and silver grades by core recovery for San Albino vein and halo was completed. There is little apparent relationship between gold and silver grades and core recovery. However, both gold and silver grades show greater variability at or below 45% core recovery. Consequently, ninety samples with core recoveries less than 45% were coded as not usable.
Several phases of RC drilling were completed. The results are highly variable although there is some potential downhole contamination magnifying the apparent footwall thickness. Ristorcelli did not use any RC samples for modeling or estimation.
14.2.5 OTHER 3D MODELS
14.2.5.1 OVERBURDEN, OXIDE AND FRESH ROCK
Mako provided detailed drillhole logging data that includes assignment of fresh (unoxidized) rock, mixed or transitional rock, and oxidized rock. These data were used to build cross-sectional interpretations, which in turn were used to build 3D surfaces. Fresh rock dominates volumetrically, the mixed zone is thin (absent to about 5m thick and averaging a few meters thick) and the remainder is oxidized. The oxidized rock extends from the surface and is usually 20m to 30m thick. The mixed zone and oxidized zone can follow the mineralized structures, as would be expected. The qualitative logging data is augmented by quantitative geochemical data. Variations in sulfur concentrations in drillhole samples helped define and support the interpretation of the oxide boundaries and clearly show the weathering. Low sulfur values correlate with logging of oxide and mixed zones.
|
Sulfur values are an order of magnitude lower in the oxidized zone. Iron and calcium concentrations show reasonable correlation to the logged oxidation state, but these elements define a more diffuse contact than either the logging or sulfur values. Figure 14-3 gives an example of the oxidation surfaces. The base of overburden was also interpreted from hole-to-hole on the cross sections and a 3D surface was built for that, too.
14.2.5.2 MINE DUMPS
Mako previously interpreted a solid of the historical mine waste dumps. This was modified by Ristorcelli based on data from drilling, selected trenches, and a topographic survey of the toes of the dumps. Figure 14-5 shows these mine dumps. There were about 140,000 tonnes of historical mine dump material around the San Albino deposit excluding the Arras vein and assuming a density value of 1.8g/cm3. The 3D mine dump solids were used to code drillhole and channel samples, which in turn were used to estimate the average dump grades. Since mining commenced and as of the effective date of this report, all but 1,600t grading 2.64g Au/t and 4.4g Ag/t remained (Table 14-15).
|
Figure 14-5 3D Perspective View of the San Albino Mine Dumps
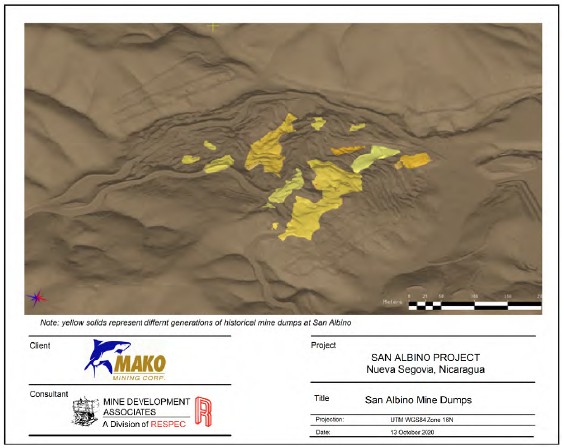
(different shades only denote different mine dumps)
14.2.5.3 HISTORICAL UNDERGROUND WORKINGS
In 2020 Mako provided Ristorcelli with 3D solids representing the underground workings at the historical San Albino mine and had identified a discrepancy between reported underground production tonnage versus tonnage estimates based on surveyed mined voids and mine waste dumps. Mako's estimated volume of underground workings from historical level plans and other maps is about one fifth of that based on reported historical production. It is acknowledged that the historical production is poorly documented, which could account for some of this discrepancy. Consequently, these differences were addressed by adding or modifying modeled underground workings based on where drillholes hit voids, had no core recovery, or had logged "wood" or "mine fill". Ristorcelli began with Mako's model of the workings and modified those very slightly to respect the drill data, and then built 3D models of stopes. Ristorcelli's 3D perspective of the underground workings as defined in 2020 is given in Figure 14-6 Ristorcelli estimates that approximately 87,000 tonnes of material were historically mined based on all the modeled underground workings including the historical development at San Albino. A polygonal estimate of material mined from Ristorcelli's model of the workings, and assuming no dilution of the vein material, totals 45,800 tonnes grading 18.7g Au/t and 29g Ag/t, for about 27,500oz of gold and 43,000oz of silver. This correlates to reported production of 35,000 imperial tons likely around 11g Au/t. Reported production is commonly less than actual production, and the actual historical production from the old San Albino mine is probably higher. Very minor additions to the underground workings were made since the 2020 model because all the areas with underground workings have been mined.
|
Figure 14-6 3D Perspective View of the San Albino Mine Workings
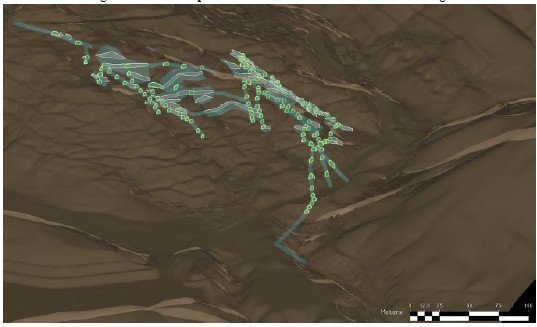
Note: light green polygons show the historical workings as modeled by Mako in cross sections; green solids show the updated historical workings model created by Ristorcelli; newly defined stopes modeled by Ristorcelli are shown as white polygons.
14.2.6 ASSAY CAPPING AND SAMPLE COMPOSITES
Capping of samples was done prior to compositing. Details of capping levels and number of samples are given in Table 14-7. Capping levels were determined considering coefficients of variation, cumulative probability plots, and outlier sample locations and the same capping levels were used in 2023 as were used in 2020. Descriptive statistics of the composite samples are given in Table 14-8. Capping was rather harsh in the dumps because high- grade material likely is represented by volumes of say ore-car size.
|
Capped drillhole and channel sample assays were composited to a length of 1.0m. The composite lengths are 1.0m to support a resource block dimension of one meter. Most sample lengths are one meter or less in the veins and halos but not all are 1.0m or less in length causing some de-compositing of those longer than one meter length samples. The author evaluated iterations of the estimate using 1.0m and 1.5m composites, and the estimate performed better using 1.0m composite intervals. In the country rock, about half of the samples are one meter length or shorter, and about half are longer than one meter. Therefore, de-compositing was more extensive. As the country rock is by far unmineralized, with only a few random intersections with gold grades locally, de- compositing is not material to the resource estimate.
Table 14-7 Capping Grades and Number of Samples by Vein and Domain
| Domain | Au Capping level (g/t) |
Number capped |
Ag Capping level (g/t) |
Number capped |
| Arras vein | 100 | 8 | 150 | 8 |
| Arras halo | 10 | 38 | 30 | 38 |
| Naranjo vein | 65 | 15 | 80 | 16 |
| Naranjo halo | 20 | 2 | 20 | 7 |
| San Albino footwall | 7 | 19 | 25 | 24 |
| San Albino vein | 100 | 10 | 150 | 5 |
| San Albino hanging wall | 4 | 18 | 22 | 14 |
| El Jobo vein | none | none | none | none |
| Miscellaneous veins | 7 | 3 | 30 | 3 |
| Country Rock | 3 | 234 | 10 | 326 |
| Dumps | 25 | 45 | 70 | 21 |
|
Table 14-8 Descriptive Statistics of Composites by Vein and Domain
| Arras Vein | ||||||||
| Valid | Median | Mean | Std. Devn. | CV | Minimum | Maximum | Units | |
| Au | 979 | 6.81 | 13.12 | 18.26 | 1.39 | 0.01 | 212.69 | g/t |
| Au Capped | 979 | 6.81 | 12.80 | 16.02 | 1.25 | 0.01 | 100.00 | g/t |
| Ag | 973 | 16.19 | 24.66 | 26.64 | 1.08 | 0.40 | 204.20 | g/t |
| Ag Capped | 973 | 16.20 | 24.43 | 25.47 | 1.04 | 0.40 | 150.00 | g/t |
| Arras Halo | ||||||||
| Valid | Median | Mean | Std. Devn. | CV | Minimum | Maximum | Units | |
| Au | 1,770 | 0.30 | 0.78 | 1.66 | 2.11 | 0.01 | 18.60 | g/t |
| Au Capped | 1,770 | 0.30 | 0.74 | 1.34 | 1.81 | 0.01 | 10.00 | g/t |
| Ag | 1,761 | 1.90 | 3.62 | 5.45 | 1.51 | 0.05 | 67.10 | g/t |
| Ag Capped | 1,761 | 1.90 | 3.48 | 4.58 | 1.32 | 0.05 | 30.00 | g/t |
| Naranjo Vein | ||||||||
| Valid | Median | Mean | Std. Devn. | CV | Minimum | Maximum | Units | |
| Au | 238 | 14.92 | 24.15 | 27.29 | 1.13 | 0.06 | 168.30 | g/t |
| Au Capped | 238 | 14.92 | 21.38 | 19.10 | 0.89 | 0.06 | 65.00 | g/t |
| Ag | 228 | 21.99 | 30.81 | 29.54 | 0.96 | 1.98 | 193.00 | g/t |
| Ag Capped | 228 | 22.00 | 28.44 | 22.02 | 0.77 | 1.98 | 80.00 | g/t |
| Naranjo Halo | ||||||||
| Valid | Median | Mean | Std. Devn. | CV | Minimum | Maximum | Units | |
| Au | 407 | 0.34 | 0.77 | 1.00 | 1.30 | 0.00 | 7.43 | g/t |
| Au Capped | 407 | 0.34 | 0.77 | 1.00 | 1.30 | 0.00 | 7.43 | g/t |
| Ag | 392 | 1.50 | 2.69 | 4.03 | 1.50 | 0.05 | 44.70 | g/t |
| Ag Capped | 392 | 1.50 | 2.54 | 3.09 | 1.22 | 0.05 | 20.00 | g/t |
| San Albino Footwall | ||||||||
| Valid | Median | Mean | Std. Devn. | CV | Minimum | Maximum | Units | |
| Au | 1,151 | 0.29 | 0.72 | 1.85 | 2.55 | 0.01 | 51.54 | g/t |
| Au Capped | 1,151 | 0.30 | 0.67 | 1.00 | 1.49 | 0.01 | 7.00 | g/t |
| Ag | 1,144 | 1.99 | 4.01 | 13.99 | 3.49 | 0.15 | 423.00 | g/t |
| Ag Capped | 1,144 | 2.00 | 3.35 | 4.03 | 1.20 | 0.15 | 25.00 | g/t |
| San Albino Vein | ||||||||
| Valid | Median | Mean | Std. Devn. | CV | Minimum | Maximum | Units | |
| Au | 826 | 9.40 | 16.30 | 18.50 | 1.14 | 0.05 | 136.00 | g/t |
| Au Capped | 826 | 9.40 | 16.02 | 17.18 | 1.07 | 0.05 | 100.00 | g/t |
| Ag | 825 | 18.29 | 26.77 | 25.51 | 0.95 | 0.30 | 177.00 | g/t |
| Ag Capped | 825 | 18.30 | 26.70 | 25.20 | 0.94 | 0.30 | 150.00 | g/t |
| San Albino Hanging Wall | ||||||||
| Valid | Median | Mean | Std. Devn. | CV | Minimum | Maximum | Units | |
| Au | 695 | 0.33 | 0.72 | 1.11 | 1.55 | 0.01 | 12.60 | g/t |
| Au Capped | 695 | 0.32 | 0.67 | 0.84 | 1.24 | 0.01 | 4.00 | g/t |
| Ag | 694 | 1.59 | 2.87 | 4.36 | 1.52 | 0.05 | 47.77 | g/t |
| Ag Capped | 694 | 1.60 | 2.72 | 3.41 | 1.25 | 0.05 | 22.00 | g/t |
|
Table 14-8 Descriptive Statistics of Composites by Vein and Domain (continued)
| El Jobo | ||||||||
| Valid | Median | Mean | Std. Devn. | CV | Minimum | Maximum | Units | |
| Au | 42 | 0.19 | 0.69 | 2.05 | 2.97 | 0.01 | 10.90 | g/t |
| Au Capped | 42 | 0.19 | 0.69 | 2.05 | 2.97 | 0.01 | 10.90 | g/t |
| Ag | 42 | 0.91 | 2.12 | 3.91 | 1.84 | 0.15 | 24.60 | g/t |
| Ag Capped | 42 | 0.90 | 2.12 | 3.91 | 1.84 | 0.15 | 24.60 | g/t |
| Miscellaneous Veins | ||||||||
| Valid | Median | Mean | Std. Devn. | CV | Minimum | Maximum | Units | |
| Au | 35 | 0.55 | 2.45 | 4.64 | 1.89 | 0.05 | 21.19 | g/t |
| Au Capped | 35 | 0.55 | 1.62 | 2.32 | 1.43 | 0.05 | 7.00 | g/t |
| Ag | 35 | 1.99 | 6.52 | 9.37 | 1.44 | 0.15 | 41.06 | g/t |
| Ag Capped | 35 | 2.00 | 5.92 | 7.73 | 1.31 | 0.15 | 28.56 | g/t |
| Country Rock | ||||||||
| Valid | Median | Mean | Std. Devn. | CV | Minimum | Maximum | Units | |
| Au | 88,906 | 0.01 | 0.06 | 1.95 | 33.55 | 0.00 | 545.96 | g/t |
| Au Capped | 88,906 | 0.01 | 0.04 | 0.18 | 5.08 | 0.00 | 3.00 | g/t |
| Ag | 88,591 | 0.39 | 0.68 | 9.17 | 13.52 | 0.00 | 1969.00 | g/t |
| Ag Capped | 88,591 | 0.40 | 0.56 | 0.84 | 1.51 | 0.00 | 10.00 | g/t |
| Workings | ||||||||
| Valid | Median | Mean | Std. Devn. | CV | Minimum | Maximum | Units | |
| Au | 34 | 2.07 | 7.53 | 12.66 | 1.68 | 0.01 | 57.32 | g/t |
| Au Capped | 34 | 2.07 | 2.17 | 1.69 | 0.78 | 0.01 | 4.00 | g/t |
| Ag | 34 | 10.11 | 16.25 | 15.43 | 0.95 | 0.20 | 60.00 | g/t |
| Ag Capped | 34 | 10.10 | 15.57 | 13.85 | 0.89 | 0.20 | 40.00 | g/t |
| Dumps | ||||||||
| Valid | Median | Mean | Std. Devn. | CV | Minimum | Maximum | Units | |
| Au | 1,557 | 1.48 | 5.40 | 12.13 | 2.25 | 0.00 | 136.40 | g/t |
| Au Capped | 1,557 | 1.48 | 4.29 | 6.55 | 1.53 | 0.00 | 25.00 | g/t |
| Ag | 1,557 | 4.49 | 11.22 | 19.91 | 1.77 | 0.05 | 212.00 | g/t |
| Ag Capped | 1,557 | 4.50 | 10.39 | 15.12 | 1.46 | 0.05 | 70.00 | g/t |
| Overburden | ||||||||
| Valid | Median | Mean | Std. Devn. | CV | Minimum | Maximum | Units | |
| Au | 3,244 | 0.01 | 0.12 | 1.24 | 9.93 | 0.00 | 55.60 | g/t |
| Au Capped | 3,244 | 0.01 | 0.07 | 0.25 | 3.41 | 0.00 | 2.00 | g/t |
| Ag | 3,234 | 0.14 | 2.12 | 54.41 | 25.62 | 0.00 | 3086.20 | g/t |
| Ag Capped | 3,234 | 0.15 | 1.04 | 2.70 | 2.61 | 0.00 | 20.00 | g/t |
|
14.2.7 GOLD AND SILVER GRADE ESTIMATION
The block model is rotated in a horizontal plane 40o clockwise, and the blocks are 2m along vein strike, by 1m vertical, by 1m across strike. Four estimates for gold and silver each were completed: polygonal, nearest- neighbor ("NN"), inverse-distance to the third power ("ID3"), and kriged. With the exception of the polygonal method which was only run in 2020, each of these types of estimates was run almost two-dozen times in order to optimize estimation parameters and provide better resource estimates.
The San Albino deposit was divided into six broad estimation areas to control and vary the search orientation and anisotropy in estimation in different portions of the deposit (see Table 14-9). The six estimation areas to guide the estimate are based on a generalized orientation of the vein-controlling shear zones.
Table 14-9 Estimation Areas - Search Ellipse Orientations
| Area | Rotation Azimuth | Dip |
| 1 | 310o | -15o |
| 2 | 310o | -25o |
| 3 | 310o | -30o |
| 4 | 310o | 0o |
| 5 | 310o | -25o |
| 6 | 310o | -40o |
One single estimation pass was run for each of the halo and vein domains in each of the six estimation areas. The search distance was set to "fill" all blocks coded to veins and halos. In the San Albino vein, about half of the blocks' grade estimates were based on samples that were ≤10m away, and 53% of all blocks were located within 30m of a composite sample. About 1.6% of the blocks' grades were based solely on channel samples and 95% are based solely on drilled sample data. The areas outside modeled geologic and mineral domains were estimated in one single orientation. The maximum search distance outside the domains was 30m from composites, but a very stringent pullback on "higher" gold grades was used. A minimum of two composites was required to estimate a block outside modeled domains, compared to one within domains. Estimation parameters are given in Table 14-10 and Table 14-11.
Table 14-12 presents the criteria for classification.
|
Table 14-10 Estimation Parameters for Gold in San Albino Vein, Halo and Outside Domains
(for all rotations/dip/tilt and search distance values, see Table 14-9)
| Description | Parameter |
| Vein Domain | |
| Search: San Albino; all others | quadrant / no restriction |
| Samples (minimum-maximum per hole) San Albino | 1 - 2 |
| Samples: maximum San Albino / Narjano / Arras / El Jobo / Miscellaneous | 8 / 8 / 6 / 8 / 8 |
| Rotation/Dip/Tilt (variogram and searches): (see Table 14-9) | varies by estimation area |
| Search (m): major/semimajor/minor (perpendicular) all except | 90m / 90m / 22.5m* |
| El Jobo | 24m / 24m / 6m |
| Inverse-distance power (except those below) | 3 |
| Naranjo | 2 |
| High-grade restrictions (grade in g/t and distance in m) San Albino | 20 / 20 |
| Naranjo | none |
| Arras | 20 / 30 |
| El Jobo | 2 / 3 |
| Miscellaneous | 5 / 15 |
| Halo Domain | |
| Search: San Albino / all others | quadrant / no restriction |
| Samples (minimum-maximum per hole) San Albino; all others | 1 - 3; 1 - 2 |
| Samples: maximum San Albino / Narjano / Arras / El Jobo / Miscellaneous | 12 / 10 / 10 / 8 / 8 |
| Rotation/Dip/Tilt (variogram and searches): (see Table 14-9) | varies by estimation area |
| Search (m): major/semimajor/minor (perpendicular) | 90m / 90m / 22.5m |
| Inverse-distance power (except those below) | 3 |
| High-grade restrictions (grade in g/t and distance in m) San Albino Footwall | 2 / 4 |
| San Albino Hanging Wall | 1.5 / 4 |
| Naranjo | 1 / 4 |
| Arras | 2 / 4 |
| Outside Domains | |
| Samples: minimum-maximum-maximum per hole | 2 - 10 - 2 |
| Rotation/Dip/Tilt (variogram and searches): | 310 / -20 / 0 |
| Search (m): major/semimajor/minor (vertical) | 30 / 30 / 10 |
| Inverse-distance power | 3 |
| High-grade restrictions (grade in g/t and distance in m) | 0.2 / 3 |
| Dumps | |
| Samples: minimum-maximum-maximum per hole | 1 - 8 - 2 |
| Rotation/Dip/Tilt (variogram and searches): | 0 / 0 / 0 |
| Search (m): major/semimajor/minor (vertical) | 30 / 30 / 10 |
| Inverse-distance power | 4 |
| High-grade restrictions (grade in g/t and distance in m) | 2.5 / 4 |
* Effective search distances are controlled by the vein name, domain and the number of samples per hole; the thin veins, number of samples per hole, and vein coding would restrict searches greatly and if the search distances expanded, it would be immaterial to the estimate.
|
Table 14-11 Estimation Parameters for Silver in San Albino Vein, Halo and Outside Domains
(for all rotations/dip/tilt and search distance values, see Table 14-9)
| Description | Parameter |
| Vein Domain | |
| Search: San Albino ; all others | quadrant / no restriction |
| Samples (minimum-maximum per hole) San Albino; all others | 1 - 3; 1 - 2 |
| Samples: maximum San Albino / Narjano / Arras / El Jobo / Miscellaneous | 12 / 8 / 6 / 8 / 8 |
| Rotation/Dip/Tilt (variogram and searches): (see Table 14-9) | varies by estimation area |
| Search (m): major/semimajor/minor (perpendicular) all except | 90m / 90m / 22.5m |
| El Jobo | 24m / 24m / 6m |
| Inverse-distance power | 3 |
| High-grade restrictions (grade in g/t and distance in m) San Albino | 40 / 40 |
| Naranjo | none |
| Arras | none |
| El Jobo | 10 / 3 |
| Miscellaneous | 10 / 15 |
| Halo Domain | |
| Search: San Albino / all others | quadrant / no restriction |
| Samples (minimum-maximum per hole) San Albino and Naranjo; all others | 1 - 3; 1 - 2 |
| Samples: maximum San Albino / Narjano / Arras / El Jobo / Miscellaneous | 12 / 12 / 10 / 8 / 8 |
| Rotation/Dip/Tilt (variogram and searches): (see Table 14-9) | varies by estimation area |
| Search (m): major/semimajor/minor (perpendicular) | 90m / 90m / 22.5m |
| Inverse-distance power (except those below) | 3 |
| High-grade restrictions (grade in g/t and distance in m) San Albino Footwall | 6 / 4 |
| San Albino Hanging Wall | 7 / 4 |
| Naranjo | 7 / 4 |
| Arras | 5 / 4 |
| Outside Domains | |
| Samples: minimum-maximum-maximum per hole | 2 - 10 - 2 |
| Rotation/Dip/Tilt (variogram and searches): | 310 / -20 / 0 |
| Search (m): major/semimajor/minor (vertical) | 30 / 30 / 10 |
| Inverse-distance power | 3 |
| High-grade restrictions (grade in g/t and distance in m) | 0.2 / 3 |
| Dumps | |
| Samples: minimum-maximum-maximum per hole | 1 - 8 - 2 |
| Rotation/Dip/Tilt (variogram and searches): | 0 / 0 / 0 |
| Search (m): major/semimajor/minor (vertical) | 30 / 30 / 10 |
| Inverse-distance power | 4 |
| High-grade restrictions (grade in g/t and distance in m) | 2.5 / 4 |
* Effective search distances are controlled by the vein name, domain and the number of samples per hole; the thin veins, number of samples per hole, and vein coding would restrict searches greatly and if the search distances expanded, it would be immaterial to the estimate.
|
Table 14-12 Mineral Resource Classification
| Description | Parameter |
| Measured (in San Albino vein only) | |
| In domains and | |
| Minimum holes; minimum composites; maximum distance to closest comp | 2; NA; 10m |
| or | |
| Minimum holes; minimum composites; maximum distance to closest comp | 2; NA; 5m |
| and | |
| Average distance of all composites used to estimate the block | <25m |
| and | |
| Block is influenced more by drillholes than by channel samples | |
| Indicated (in San Albino and Arras veins only) | |
| In domains and | |
| Minimum holes; minimum composites; maximum distance to closest comp | 3; NA; 35m |
| or | |
| Minimum holes; minimum composites; maximum distance to closest comp | 2; 3; 25m |
| or | |
| Minimum holes; minimum composites; maximum distance to closest comp | 1; 2; 15m |
| and | |
| Average distance of all composites used to estimate the block | <60m |
| and | |
| Block is influenced more by drillholes than by channel samples | |
| Inferred in Domains | |
| Any block within the domains not classified as Measure or Indicated or intersecting workings and all dumps, | |
| Inferred outside Domains | |
| Number of composites | 2 |
| Range to closest composite (m) | 20 |
Note that there is an extreme restriction limiting the projection of high grades
14.2.8 MINERAL RESOURCES
For reporting, technical, and economic factors likely to influence the "reasonable prospects for eventual economic extraction" were evaluated using the best judgment of the author responsible for this section of the report. For evaluating the open pit potential, a series of optimized pits were run using variable gold prices and parameters. The engineering parameters, mining costs, and metallurgical recoveries are based on actual and current production data. The mining cost used was $3/t, processing cost $65/t, and G&A cost $2/t. Metallurgical recoveries of gold used in the pit optimizations were 83%, 90%, and 95% for fresh rock, transition, and oxide material, respectively. Silver was not considered in the optimizations. For evaluating the potential for underground mining, a series of stope optimizations were run at variable cutoffs. For the reporting cutoff grade of 4.0g Au/t an average mining cost of $144/t, processing cost of $65/t, and G&A of $2/t were assumed. The factors used in defining cutoff grades are based on a gold price of US$1,750/oz.
|
Table 14-13, Table 14-14, Table 14-15, and Table 14-16 present the estimates of the Measured, Indicated and Inferred resources at San Albino. Classification of the resources considered adequacy and reliability of sampling, geologic understanding, results of quality control analyses, geologic complication, and apparent grade continuity. A Measured classification was permitted only in the San Albino vein, because there is a very good understanding of the San Albino deposit geology and because there is extensive drilling and channel sampling. Indicated resources were permitted only in the San Albino and Arras veins. Because Naranjo is poorly understood, it has only Inferred resources, but those, like all the Inferred, will most likely be upgraded with additional drilling. The Southwest Pit area on the Naranjo vein was discovered after the 2020 model and estimate. Mako discovered it and did some follow-up drilling. However, the bottom of the resource-confining pit is defined by four holes, consequently, that Inferred classification remains. Any block that intersects modeled workings has been classified as Inferred, which is mostly not applicable now that those areas with workings have been mined out, in addition to the reduction of tonnes for historical mining.
The author has used his judgment with respect to the technical and economic factors likely to influence the "prospects for eventual economic extraction" and the estimates listed in those tables do fulfill that requirement. The San Albino deposit reported mineral resources are based on potential open pit as well as potential underground mining scenarios.
The resources potentially minable by open pit include a 0.5m rind of dilution along the hanging wall and footwall (Table 14-13). Effectively, all estimated vein material is above cutoff so all vein material and the 1m of total dilution is the reported resource because the author assumes that selective mining cannot be done to better than 0.5m on the upper and lower margins of all veins. If mining selectivity can be better than the total 1.0m, then the potentially minable resource grade will increase, but the opposite is true too.
The resources potentially minable by underground methods are presented in
. The underground resources are reported at a cutoff of 4.0g Au/t and lie within stopes optimized at 3.0g Au/t. Using the 3.0g Au/t stopes for confining the estimate allows for showing tonnage below the reporting cutoff but lying adjacent to those reported tonnages.
There are few estimated resources in the historic mine dumps, all of which are classified as Inferred because of the difficulty in estimating mine dump material. The majority have been removed and processed already. These are presented in Table 14-15.
|
The total resources potentially minable by open pit and potentially minable by underground methods, as well as the dumps, are presented in Table 14-16. Cross sections of the San Albino and Arras veins for gold and silver are presented in Figure 14-7 and Figure 14-8.
Table 14-13 All Veins in San Albino Deposit: Open Pit Resources
| Open Pit | |||||
| All Measured | |||||
| Fully | Tonnes | MD g Au/t | Oz Au | MD g Ag/t | Oz Ag |
| Diluted | 46,100 | 9.86 | 14,600 | 17.7 | 26,200 |
| All Indicated | |||||
| Fully | Tonnes | MD g Au/t | Oz Au | MD g Ag/t | Oz Ag |
| Diluted | 83,600 | 10.39 | 27,900 | 20.9 | 56,100 |
| All Measured and Indicated | |||||
| Fully | Tonnes | MD g Au/t | Oz Au | MD g Ag/t | Oz Ag |
| Diluted | 129,700 | 10.19 | 42,500 | 19.7 | 82,300 |
| All Inferred | |||||
| Fully | Tonnes | MD g Au/t | Oz Au | MD g Ag/t | Oz Ag |
| Diluted | 93,400 | 10.28 | 30,900 | 15.3 | 45,800 |
Note: MD is the model grade with expected mining dilution
Table 14-14 All Veins in San Albino Deposit: Underground Resources
| Underground | |||||
| All Measured | |||||
| Cutoff | Tonnes | BD g Au/t | Oz Au | BD g Ag/t | Oz Ag |
| 4.0 | 1,100 | 10.43 | 400 | 23.0 | 800 |
| All Indicated | |||||
| Cutoff | Tonnes | BD g Au/t | Oz Au | BD g Ag/t | Oz Ag |
| 4.0 | 168,000 | 12.96 | 70,000 | 21.0 | 113,600 |
| All Measured and Indicated | |||||
| Cutoff | Tonnes | BD g Au/t | Oz Au | BD g Ag/t | Oz Ag |
| 4.0 | 169,100 | 12.95 | 70,400 | 21.0 | 114,400 |
| All Inferred | |||||
| Cutoff | Tonnes | BD g Au/t | Oz Au | BD g Ag/t | Oz Ag |
| 4.0 | 131,000 | 11.62 | 49,000 | 16.7 | 70,400 |
Note: BD is the block-diluted model grade
|
Table 14-15 San Albino Deposit: Inferred Mine Dump Resources
| All Dumps, all Inferred | |||||
| Cutoff | Tonnes | BD g Au/t | Oz Au | BD g Ag/t | Oz Ag |
| 1.0 | 1,600 | 2.64 | 100 | 4.4 | 200 |
Table 14-16 All Veins in San Albino Deposit: Open Pit, Underground and Dump Resources
| Open Pit and Underground and Dumps | |||||
| All Measured | |||||
| Cutoff | Tonnes | g Au/t | Oz Au | g Ag/t | Oz Ag |
| variable | 47,200 | 9.88 | 15,000 | 17.8 | 27,000 |
| All Indicated | |||||
| Cutoff | Tonnes | g Au/t | Oz Au | g Ag/t | Oz Ag |
| variable | 251,600 | 12.10 | 97,900 | 21.0 | 169,700 |
| All Measured and Indicated | |||||
| Cutoff | Tonnes | g Au/t | Oz Au | g Ag/t | Oz Ag |
| variable | 298,800 | 11.75 | 112,900 | 20.5 | 196,700 |
| All Inferred | |||||
| Cutoff | Tonnes | g Au/t | Oz Au | g Ag/t | Oz Ag |
| variable | 240,800 | 10.53 | 81,500 | 15.4 | 119,200 |
|
Figure 14-7 San Albino Deposit Gold Block Model – Cross Section 11
Cross section locations shown in Figure 10-1 (looking azimuth 40o)
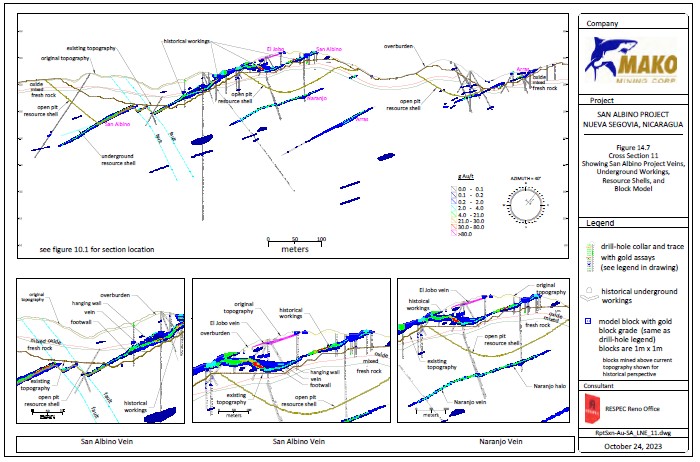
|
Figure 14-8 San Albino Deposit Gold Block Model – Cross Section 16
Cross Section locations shown in Figure 10-1 (looking azimuth 40o)
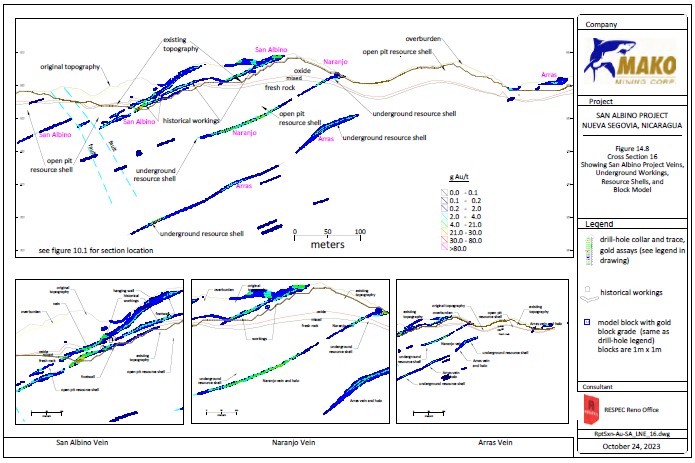
|
14.2.9 DISCUSSION OF RESOURCES
The exploration procedures, sampling and data derived from Mako's work are high quality and can be used to support the resource estimate. Mako's geologic interpretations were sound and required few changes besides more detail for the domain model to be used in controlling the estimate. The deposit's location is predictable in that drilling intersects the structure close to where it is predicted. The veins of the San Albino deposit are high- grade as shown in the resource tables listed above. The estimated undiluted vein grades are 13.77g Au/t, 19.42g Au/t, and 15.96g Au/t for the San Albino, Naranjo, and Arras veins, respectively. These vein grades are consistent for a high-grade vein system, decreasing towards the margins of the veins. The style of mineralization is well understood. The deposits are open ended along strike and down dip.
The author observed Mako's core sampling procedures and found them to be well done with careful consideration paid to reducing sampling bias. Specific methods are discussed in Sections 10.3 and 11.0. Sampling is generally done on geologic breaks with special attention given to separating quartz veins from the surrounding hanging wall and footwall halo mineralization. The Mako geologists are very good at determining general grades of the different portions of the vein, particularly those portions likely to contain very high grades versus those that are low grade. Ristorcelli found that high-grade portions of the vein sometimes were included in sample intervals that contained material that may be substantially lower grade. The resulting concealment of the high-grade limits the ability to accurately estimate the spatial extents of the highest-grade zones and creates an inherent risk in the resource estimation. This risk is somewhat mitigated by the closely spaced drilling in the San Albino vein, though in some areas it did contribute to portions of the resource estimate being classified at a lower confidence level.
When there was some doubt in any of the samples' reliability, they were eliminated from use. One issue with sampling that imparts some risk is the moderate core recovery. Graphic representations of the grades plotted against core recovery (in 2020) showed effectively no differences until around 45% recovery below which there is high variability in grade. Samples with recoveries below 45% were eliminated from use in the estimate. RC samples were not used for estimating or final modeling. And there were quite a few channel samples that were eliminated because their locations were suspect. Mako has since corrected the surveying of those channel samples and they will be suitable for use in future estimations.
Mining dilution is an important factor at the San Albino project in part because the veins are in some places so thin that the dilution can render it uneconomic. Detailed grade control is critical for the success at the San Albino project, and Mako has shown their abilities to do this well. In many places the veins have visually distinct hanging wall and footwall contacts, which help with grade control. The estimated resources include 0.5m rind of dilution on the hanging wall and 0.5m rind of dilution the footwall of each vein. Mako reports that they have mined to thinner dilution. The average dilution grade varies from almost zero to up to 0.5g Au/t, depending on whether or not the halo mineralization is present. In all cases, the dilution grade is taken from the estimation, as opposed to a single grade applied globally. It is expected that dilution during underground mining will be greater because of ground conditions, shallow dip, minimum mining height, and less data, and therefore control on locating hanging wall and footwall. The author is reporting full-block-diluted grades for material within the 3.0g Au/t optimized underground stopes at a cutoff of 4.0g Au/t.
|
Mako has been reconciling mine production to the previous estimates including Measured, Indicated, and Inferred material. Reported production is 5% and 8% less gold and silver, respectively than the estimated mine production, in 9% more tonnes at 15% and 19% lower grade, for gold and silver, respectively.
Modeling and extracting volumes of underground workings is always difficult in part because full survey data is usually missing. The San Albino deposit is not an exception, however most of the areas with underground workings have been mined out and this no longer is material. For the San Albino deposit, the dumps are estimated to contain around 144,000 tonnes of rock. In 2020, The total estimated amount of material mined from the modeled underground working was 87,000 tonnes at the San Albino vein, which includes stopes and drifts, production, and development workings. In addition to the historical underground workings, there were some historical pit excavations. Ristorcelli's block model estimated total diluted material of 68,400 tonnes grading 12.8g Au/t and 21.1g Ag/t for about 28,040oz Au and 36,400oz Ag. Ristorcelli's block model of undiluted vein material contained 45,800 undiluted tonnes grading 18.9g Au/t and 29g Ag/t for about 27,900oz Au and 42,700oz Ag, respectively. This correlates to reported production of 31,750 tonnes likely at around 18g Au/t. There remains a shortfall of ~15,000 tonnes, part of which can be explained by the mine dumps, as there are some high grades in the dumps, and in part because of the incomplete underground survey data.
The author had some difficulty with the estimate caused by extensive drilling in the higher-grade parts of the deposit. This clustering of high-grade data resulted in the use of a quadrant search to minimize spreading out the high grades. This clustering is clearly demonstrated by the difference in Measured and Indicated grades (Table 14-13, Table 14-14 and Table 14-16). While higher-grade in higher-classification material is not unusual, at the San Albino deposit the effect was exaggerated by their normal exploration and follow-up drilling to better define the higher grades. Given that history, the Indicated material may also increase in grade as those high-grade zones are drilled out.
That clustering of data imparted a complication in estimation in that higher-than-expected biases were present between the inverse-distance, kriged, and nearest-neighbor estimations. Well over a dozen iterations comparing the three interpolation methods were completed prior to arriving at the final reported estimate. The use of mineralization domains to control the estimation decreases this risk substantially. The author verified this reasonableness by visually comparing the interpolated grades in the block model to the mineralization domains modeled using the drilling and channel sample data and evaluating grade distributions graphically. In all cases, the grade, tonnes and ounces were close to the polygonal estimation.
|
The reported resources with “…reasonable prospects for eventual economic extraction” are presented in Table 14-13, Table 14-14, Table 14-15, and Table 14-16. Those resources occur at the outcrop of the veins that extend downward at shallow to moderate dips. Figure 14-9 shows these relationships.
Figure 14-9 3D Perspective of San Albino Grade Shells and Resource-Controlling Solids
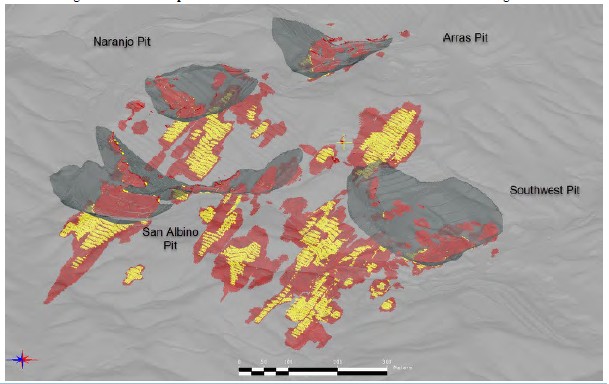
Note: Grey is the $1,750/gold oz pit; red is 1.5 g Au/t grade shells of unclassified material for San Albino, Naranjo and Arras; yellow shows the underground resource (Table 14-14) below the optimized pits; vein material outside the pit and yellow underground shells is unclassified material.
|
14.3 LAS CONCHITAS
14.3.1 DATABASE
The resource estimate in this report used drill sample and channel sample data as discussed in Sections 11.0 and 12.0. The database used for the resource estimate was received on March 6, 2023. The effective date of the database is July 11, 2023 because assays from six core holes, all RC drillholes, (none of which was not used for modeling or estimation - just general validation), and Mako's updated oxidation coding were received later. The effective date of the resource estimate is October 11, 2023, 2023, the date optimizations were completed.
Descriptive statistics of that database are given in Table 14-17. All the samples were coded for type: core, RC and channel samples. There are 718 core holes plus assays from 5,358 continuous sets of channel samples from pits and trenches in the Las Conchitas resource area. A total of 4,120 samples were eliminated from use for resource estimation: 32 core samples, 19 trench samples, and all RC samples (4069). Results from channel samples taken from trenches and shallow surface exploration pits are treated as "drillholes" in the database. In addition to those data shown in Table 14-1, logged geologic data, geotechnical data, as well as 33-element trace- element geochemistry were available and loaded. The database used for this estimate is comprehensive, well maintained, reliable and extremely useful.
Table 14-17 Descriptive Statistics of the Las Conchitas Resource Database
| Valid | Median | Mean | Std. Devn. | C of V | Minimum | Maximum | Units | |
| From | 82,641 | 0.00 | 357.00 | M | ||||
| To | 82,641 | 0.10 | 357.60 | M | ||||
| Length | 82,641 | 1.00 | 1.08 | 0.07 | 30.00 | M | ||
| Au | 81,604 | 0.014 | 0.272 | 3.253 | 11.9 | 0.001 | 376 | g/t |
| Au Capped | 81,604 | 0.012 | 0.225 | 2.459 | 10.9 | 0.001 | 150 | g/t |
| Ag | 81,604 | 0.14 | 1.18 | 35.68 | 30.20 | 0.00 | 9098 | g/t |
| Ag Capped | 81,604 | 0.15 | 0.78 | 4.01 | 5.14 | 0.00 | 359 | g/t |
| Density | 5,710 | 2.63 | 2.57 | 0.20 | 0.1 | 1.42 | 4.14 | g/cm3 |
RC drilling was conducted at Las Conchitas, but due to lack of precision and potential contamination the data from RC drilling were not used for modeling or estimation, just for assessing the general tenor and location of the interpreted mineralized zones.
|
14.3.2 GEOLOGY AND MINERAL DOMAINS
Mako and its predecessor have modeled the geology of the neighboring San Albino gold deposits for a decade and Las Conchitas is a similar type of deposit; however, Mako only modeled the veins and oxide/transition/fresh rock at Las Conchitas. This estimate used Mako's model as a guide to geometry and orientation but Ristorcelli interpreted the veins including detail of footwall and hanging wall halos, and added more detail based on core and trench logs, collar and downhole survey data, and photographs . This detail was always based on core and trench logs and often photographs. The vein domain model interpreted for this estimate is smaller and less continuous than Mako's model of the vein.
A three dimensional ("3D") model was created beginning with cross-sectional interpretations looking N40oE and spaced at 10m intervals. The interpretations were reviewed by Mako. The combined geologic and domain model included veins, halos of mineralized hanging wall and footwall sheared rock, dumps, fresh rock, completely oxidized material, and transitional oxidation. Fifteen veins with halos were defined (Table 14-2).
Table 14-18 Modeled Geological and Mineral Domains, Las Conchitas Deposit(s)
| Vein/Material Name | Domain |
| Bayacun | footwall halo, vein, and hanging wall halo |
| Misc | footwall halo, vein, and hanging wall halo |
| Las Dolores Upper | footwall halo and vein |
| Misc Mango 2 | footwall halo, vein, and hanging wall halo |
| Mango2 | footwall halo, vein, and hanging wall halo |
| Mango | footwall halo, vein, and hanging wall halo |
| Limon | footwall halo, vein, and hanging wall halo |
| Cruz Grand 2 | footwall halo, vein, and hanging wall halo |
| Cruz Grande Upper | footwall halo, vein, and hanging wall halo |
| Intermediate2 | footwall halo, vein, and hanging wall halo |
| Mina San Francisco | footwall halo, vein, and hanging wall halo |
| Limon Upper | footwall halo, vein, and hanging wall halo |
| San Pablo | footwall halo, vein, and hanging wall halo |
| San Pablo Upper | footwall halo, vein, and hanging wall halo |
| Tirado | footwall halo, vein, and hanging wall halo |
| country rock | |
| workings | |
| mine dumps |
Cumulative probability plots of major and trace elements, including gold and silver, were made; Figure 14-10 shows cumulative probability plots of gold, silver, copper, lead, and zinc. The gold cumulative probability plot, interpreted in context of the Las Conchitas deposit geology, shows that: unmineralized country rock constitutes about 90% of assayed samples; halo (hanging wall and footwall mineralization) samples comprise approximately the 90th to 98th percentiles of the samples. Lead, contained in galena, occurs mainly in the mineralized veins, with low concentrations in the halos and wall rocks, similar to the gold and the silver. The lead and copper have distinct distributions. Interestingly, there is a volumetrically small but very high-grade population with base metals and silver, likely unrelated to the main gold and silver mineralizing event. Mako had recognized these relationships.
|
Figure 14-10 Cumulative Probability Plot for All Veins and Country Rock: Au, Ag, Cu, Pb and Zn
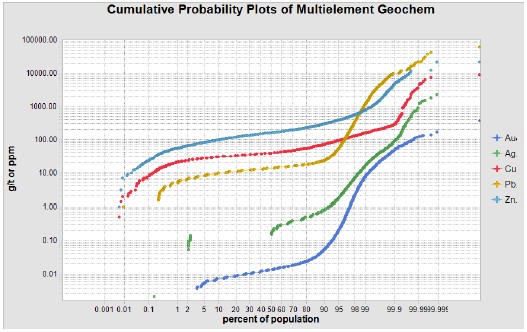
The gold and silver probability plots have similar forms suggesting that, for the most part, both metals were similarly introduced in quartz veins, with only minor and local differences. Because silver represents a small portion of the economic value of the deposit, substantially smaller than even at San Albino, and the spatial distribution between gold and silver are substantially similar, the gold domains were used to control the silver estimation. Silver also occurs in a volumetrically and insignificant volume unrelated to the gold.
Dikes of intermediate composition have been encountered in the drilling although they do not affect mineralization and are unmineralized. An example in Figure 14-2 is distinctly different from the country rock and mineralization. The effect of the thin dikes on dilution is considered insignificant.
The definitions and spatial distributions of the geologic mineral domains were defined using sample grades and geologic logging descriptions of drill core and channel samples. Mako had made interpretations of the veins,
|
which were subsequently modified and halo mineralization was added by the author. Thus, the following mineral domains were used to constrain the estimate:
/ Sheared low-grade halo domain from ~0.05g Au/t to ~2-6g Au/t. Gold mineralization in the footwall and hanging wall low-grade halo domains is in sheared and/or brecciated wallrock along the margins of the quartz veins. The halos contain sparse, often broken or brecciated, discontinuous quartz veins in a sheared country rock matrix. There is ductile and brittle shearing; gold is likely associated with stringer veins and clasts of vein incorporated into the breccias; halos range in thickness from absent to five to ten meters thick. Commonly, 3 to 6g Au/t material is gouge with mineralized fragments, as if it was part of the vein but was subsequently destroyed; and
/ Vein domain from ~2-6g Au/t and above. The vein domain is predominantly vein quartz with minor sulfides. Fragments of wall rock, which are occasionally intensely sheared and mineralized, also exist in the veins. Unlike the San Albino vein, the probability plots do not indicate the presence of a third and higher-grade domain. The veins are made up of white quartz veins with minor amounts of sulfides including galena. Styolites are oftentimes associated with the higher-grade areas, but not always. Their presence is a favorable sign, but does not insure higher grades are present, and the lack of styolites does not preclude high-grade.
The material modeled as unmineralized country rock does contain spotty discontinuous mineralization but it is too sparse to model. This spotty mineralization is being estimated into blocks immediately adjacent to the drillhole intercepts.
In addition to the vein domains, historical mine dumps at the Las Conchitas deposit were modeled and estimated for their contained gold resources. Unlike at San Albino, the dumps at Las Conchitas are volumetrically insignificant. Descriptive information for the Las Conchitas mineral domains, country rock, and the mine dumps is given in Table 14-19. Geologic cross sections showing the veins are given in Figure 14-11 and Figure 14-12. It is noteworthy and expected that grades of the halo material have substantially higher coefficients of variation ("CV") because of the local and discontinuous nature of its vein mineralization. The vein material, however, has relatively low coefficients of variation even with uncapped assays.
|
Table 14-19 Descriptive Statistics of Samples by Vein and Domain: Las Conchitas
(see Table 14-7 for capping details)
| Domain | Footwall | |||||||
| Valid | Median | Mean | Std. Devn. | CV | Minimum | Maximum | Units | |
| Length | 2,170 | 1.00 | 0.99 | 0.30 | 2.20 | m | ||
| Au | 2,167 | 0.09 | 0.45 | 1.68 | 3.72 | 0.003 | 41.57 | g/t |
| Au Capped | 2,167 | 0.09 | 0.36 | 0.70 | 1.98 | 0.003 | 7.00 | g/t |
| Ag | 2,167 | 0.59 | 2.78 | 46.54 | 16.74 | 0.001 | 1759.00 | g/t |
| Ag Capped | 2,167 | 0.60 | 1.44 | 3.47 | 2.42 | 0.001 | 100.00 | g/t |
| Domain | Vein | |||||||
| Valid | Median | Mean | Std. Devn. | CV | Minimum | Maximum | Units | |
| Length | 996 | 1.00 | 0.96 | 0.07 | 2.50 | m | ||
| Au | 995 | 8.86 | 15.32 | 22.05 | 1.44 | 0.008 | 376.49 | g/t |
| Au Capped | 995 | 8.86 | 14.73 | 17.77 | 1.21 | 0.008 | 150.00 | g/t |
| Ag | 995 | 12.06 | 20.20 | 23.09 | 1.14 | 0.050 | 359.00 | g/t |
| Ag Capped | 995 | 12.10 | 20.05 | 22.56 | 1.13 | 0.050 | 359.00 | g/t |
| Domain | Hanging Wall | |||||||
| Valid | Median | Mean | Std. Devn. | CV | Minimum | Maximum | Units | |
| Length | 1,739 | 1.00 | 0.98 | 0.07 | 2.29 | m | ||
| Au | 1,739 | 0.11 | 0.73 | 2.88 | 3.93 | 0.001 | 49.10 | g/t |
| Au Capped | 1,739 | 0.11 | 0.55 | 1.23 | 2.24 | 0.001 | 9.00 | g/t |
| Ag | 1,739 | 0.68 | 2.31 | 12.49 | 5.40 | 0.001 | 498.00 | g/t |
| Ag Capped | 1,739 | 0.70 | 1.75 | 3.07 | 1.75 | 0.001 | 20.00 | g/t |
| ZONES | 108 | workings | ||||||
| Valid | Median | Mean | Std. Devn. | CV | Minimum | Maximum | Units | |
| Length | 38 | 1.20 | 1.57 | 0.50 | 4.00 | m | ||
| Au | 14 | 0.51 | 2.08 | 2.94 | 1.41 | 0.009 | 8.90 | g/t |
| Au Capped | 14 | 0.51 | 2.08 | 2.94 | 1.41 | 0.009 | 8.90 | g/t |
| Ag | 14 | 2.87 | 3.97 | 3.57 | 0.90 | 0.150 | 11.50 | g/t |
| Ag Capped | 14 | 2.90 | 3.97 | 3.57 | 0.90 | 0.150 | 11.50 | g/t |
| ZONES | 109 | dump | ||||||
| Valid | Median | Mean | Std. Devn. | CV | Minimum | Maximum | Units | |
| Length | 426 | 1.00 | 1.13 | 0.15 | 3.00 | m | ||
| Au | 421 | 0.37 | 3.18 | 10.51 | 3.30 | 0.001 | 139.44 | g/t |
| Au Capped | 421 | 0.37 | 2.44 | 4.61 | 1.89 | 0.001 | 20.00 | g/t |
| Ag | 421 | 1.41 | 5.01 | 11.71 | 2.34 | 0.001 | 115.00 | g/t |
| Ag Capped | 421 | 1.40 | 3.70 | 5.25 | 1.42 | 0.001 | 20.00 | g/t |
| ZONES | 999 | country rock | ||||||
| Valid | Median | Mean | Std. Devn. | CV | Minimum | Maximum | Units | |
| Length | 77,272 | 1.00 | 1.08 | 0.08 | 30.00 | m | ||
| Au | 76,268 | 0.01 | 0.06 | 1.39 | 21.58 | 0.001 | 148.47 | g/t |
| Au Capped | 76,268 | 0.01 | 0.03 | 0.19 | 5.92 | 0.001 | 3.00 | g/t |
| Ag | 76,268 | 0.14 | 0.87 | 35.83 | 41.18 | 0.001 | 9098.00 | g/t |
| Ag Capped | 76,268 | 0.15 | 0.50 | 2.43 | 4.89 | 0.001 | 60.00 | g/t |
|
Figure 14-11 Cross Section 650 Showing Veins
Cross section locations shown in Figure 10-3 (looking azimuth 40o)
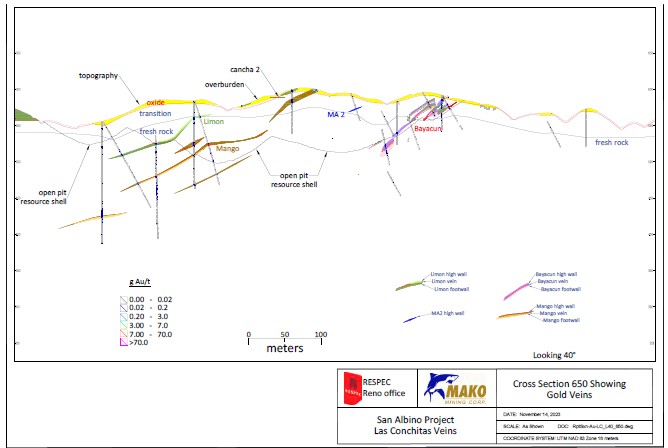
|
Figure 14-12 Cross Section 1830 Showing Veins
Cross section locations shown in Figure 10-3 looking azimuth 40o)
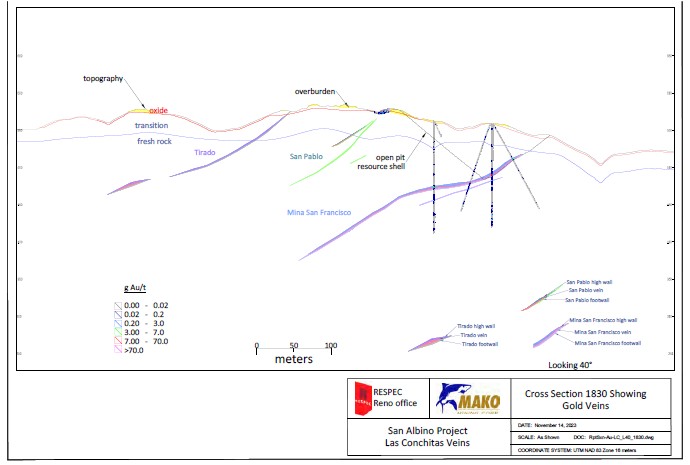
|
14.3.3 DENSITY
There are 5,721 rock density measurements determined for samples from the Las Conchitas deposit from mineralized rock, and unmineralized country rock. The density measurements were subdivided based on material type, including vein and halo categories, and whether a material was oxidized, mixed oxidized or fresh (the term used by Mako for unoxidized rock). The number of and average density values by these material types are presented in Table 14-20 along with density values assigned to the block model in the column headed "Proposed Density". The proposed density for hanging wall oxide is much different from the measured density because a) the mean of the measured values are not plausible and b) there are so few samples.
Table 14-20 Descriptive Statistics of Density Data by Vein and Domain: Las Conchitas
| Oxidation State | Number | Average | Diff from Fresh Rock |
Proposed Density |
Units |
| fresh rock | 3932 | 2.66 | g/cm3 | ||
| footwall | 119 | 2.63 | 2.60 | g/cm3 | |
| vein | 161 | 2.63 | 2.60 | g/cm3 | |
| hanging wall | 86 | 2.62 | 2.60 | g/cm3 | |
| country rock | 3566 | 2.66 | 2.65 | g/cm3 | |
| transition | 1230 | 2.47 | -7% | g/cm3 | |
| footwall | 45 | 2.40 | -8% | 2.40 | g/cm3 |
| vein | 56 | 2.50 | -5% | 2.50 | g/cm3 |
| hanging wall | 39 | 2.35 | -10% | 2.40 | g/cm3 |
| country rock | 1088 | 2.48 | -7% | 2.45 | g/cm3 |
| oxide | 533 | 2.21 | -17% | g/cm3 | |
| footwall | 10 | 2.35 | -11% | 2.30 | g/cm3 |
| vein | 5 | 2.55 | -3% | 2.40 | g/cm3 |
| hanging wall | 6 | 2.17 | -17% | 2.30 | g/cm3 |
| country rock | 486 | 2.21 | -17% | 2.20 | g/cm3 |
| dump | 26 | 2.14 | -11% | 2.10 | g/cm3 |
|
14.3.4 CORE RECOVERY
During the first site visit, core recovery measurement methods were observed, and they were found to be done properly. At a project level, core recovery is considered average; core recovery based on domain type is presented in Table 14-21. The association of relatively high-grade mineralized veins with shear zones makes it particularly important to assess sample recovery because difficult drilling conditions and lower recoveries commonly are encountered in shear zones in general, and the mineralization at the Las Conchitas deposit specifically. Mineralized domains consistently yielded lower core recovery than the country rock.
Table 14-21 Core Recovery
| Oxidation State | Number | Average Core Recovery |
Diff from Fresh Rock |
Units |
| oxide | 7947 | 73 | -12% | % |
| footwall | 198 | 68 | -14% | % |
| vein | 39 | 67 | -18% | % |
| hanging wall | 126 | 72 | -7% | % |
| country rock | 7584 | 73 | -12% | % |
| transition | 50595 | 83 | 0% | % |
| footwall | 1293 | 79 | 0% | % |
| vein | 399 | 78 | -5% | % |
| hanging wall | 1107 | 79 | 1% | % |
| country rock | 47796 | 83 | 0% | % |
| fresh rock | 145599 | 83 | % | |
| footwall | 2658 | 79 | % | |
| vein | 897 | 82 | % | |
| hanging wall | 2103 | 78 | % | |
| country rock | 139941 | 83 | % |
An analysis of gold and silver grades by core recovery for San Albino vein and halo was completed in 2020. There is little apparent relationship between gold and silver grades and core recovery except there is greater variability at or below 45% core recovery. Consequently, 32 Las Conchitas samples from with core recoveries less than 45% were coded as not usable.
|
14.3.5 OTHER 3D MODELS
14.3.5.1 OVERBURDEN, OXIDE AND FRESH ROCK
Mako produced detailed drillhole logging data that include assignment of fresh (unoxidized) rock, mixed or transitional rock, and oxidized rock. These data were used by Mako to build 3D surfaces. By far, volumetrically, fresh rock dominates, the oxidized zone is thin, and the remainder is transitional. The oxidized rock extends from the surface down and is usually less than five meters thick. The top of fresh rock surface is well defined by the sulfur grades; the grades change from consistently around 0.8%S in the fresh rock to more variable grades around 0.1%S in the transition zone. The transition zone's sulfur grades are more variable and includes rock that has, based on sulfur grades alone, oxidized material. Calcium concentrations show reasonable correlation to the modeled oxidation state, with relatively high calcium grades (~0.85%Ca) in the fresh rock and low calcium grades in the transition material (~0.05%Ca). The oxidized zone has sulfur and calcium grades similar to the low-end grades in the transition zone. Figure 14-11 and Figure 14-12 show the oxidation, transition, and fresh rock surfaces.
The base of overburden was not interpreted at Las Conchitas because it was so thin so as to render it insignificant.
14.3.5.2 MINE DUMPS AND HISTORICAL UNDERGROUND WORKINGS
Mako previously interpreted a solid of the historical mine waste dumps. These interpretations were modified slightly based on data from drilling, selected trenches, and a topographic survey of the toes of the dumps. At Las Conchitas the volume of waste dumps is insignificant and likely much of the material in the waste dumps would have been mined by the report's date, though not as of June 30, 2023, the date of the topographic surface used in this model and estimate.
Mako provided Ristorcelli with 3D solids representing the historical underground workings. The volume of material mined at Las Conchitas is insignificant.
14.3.6 ASSAY CAPPING AND SAMPLE COMPOSITES
Samples were capped prior to compositing. Details of capping levels and number of samples are given in Table 14-22 and Table 14-23. Capping levels were determined considering coefficients of variation, cumulative probability plots, and outlier sample locations. Descriptive statistics of the composite samples are given in Table 14-24. Any dump sample's grade likely represents at most an ore-car size volume of material, likely less than a tonne, so a pullback was placed on the projections of the higher grades. The pullback range was short, but longer than what "an ore-car size volume of material" would be in order to compensate for those small higher-grade zones of mineralization that would not have been intercepted.
|
Table 14-22 Capped Gold Grades and Number of Samples by Domain: Las Conchitas
| Domain | Au Capping level (g/t) Minimum* |
Au Capping level (g/t) Maximum* |
Number capped |
| Footwall | 1 | 7 | 71 |
| Vein | 10 | 150 | 19 |
| Hanging wall | 1 | 9 | 40 |
| Country rock | 3 | 3 | 208 |
| Dumps | 20 | 20 | 10 |
| *depending on vein |
Table 14-23 Capped Silver Grades and Number of Samples Domain: Las Conchitas
| Domain | Ag Capping level (g/t) Minimum* |
Ag Capping level (g/t) Maximum* |
Number capped |
| Footwall | 3 | 100 | 46 |
| Vein | 20 | 100 | 45 |
| Hanging wall | 5 | 20 | 44 |
| Country rock | 60 | 60 | 43 |
| Dumps | 20 | 20 | s46 |
| *depending on vein |
Capped drillhole and channel sample assays were composited to a length of 1.0m. The composite lengths are 1.0m to support the vertical block dimension of one meter. Most sample lengths are one meter or less in the veins and halos but not all are 1.0m or less in length, so some de-compositing has also taken place. In the country rock, about half of the samples are one meter length or shorter, and about half are longer than one meter. Therefore, de-compositing was more extensive. As the country rock is largely unmineralized, with only a few discontinuous intersections with gold grades locally, de-compositing is not material to the resource estimate.
|
Table 14-24 Descriptive Statistics of Composites by Vein and Domain
| ZONE | 1 | footwall | ||||||
| Valid | Median | Mean | Std. Devn. | CoV | Minimum | Maximum | Units | |
| LNGTH | 2,567 | 1.00 | 0.85 | 0.00 | 1.00 | m | ||
| AU | 2,565 | 0.10 | 0.46 | 1.69 | 3.67 | 0.003 | 41.57 | g/t |
| AUC | 2,565 | 0.10 | 0.36 | 0.70 | 1.94 | 0.003 | 7.00 | g/t |
| AG | 2,565 | 0.59 | 2.81 | 46.29 | 16.50 | 0.001 | 1759.00 | g/t |
| AGC | 2,565 | 0.60 | 1.47 | 3.47 | 2.36 | 0.001 | 100.00 | g/t |
| ZONE | 2 | vein | ||||||
| Valid | Median | Mean | Std. Devn. | CoV | Minimum | Maximum | Units | |
| LNGTH | 1,224 | 1.00 | 0.79 | 0.00 | 1.00 | m | ||
| AU | 1,219 | 9.13 | 15.32 | 21.41 | 1.40 | 0.018 | 376.49 | g/t |
| AUC | 1,219 | 9.10 | 14.70 | 17.17 | 1.17 | 0.018 | 150.00 | g/t |
| AG | 1,219 | 12.51 | 20.22 | 22.57 | 1.12 | 0.050 | 359.00 | g/t |
| AGC | 1,219 | 12.50 | 20.08 | 22.07 | 1.10 | 0.050 | 359.00 | g/t |
| ZONE | 3 | hanging wall | ||||||
| Valid | Median | Mean | Std. Devn. | CoV | Minimum | Maximum | Units | |
| LNGTH | 2,020 | 1.00 | 0.85 | 0.00 | 1.00 | m | ||
| AU | 2,018 | 0.12 | 0.74 | 2.85 | 3.85 | 0.001 | 49.10 | g/t |
| AUC | 2,018 | 0.12 | 0.55 | 1.21 | 2.18 | 0.001 | 9.00 | g/t |
| AG | 2,018 | 0.68 | 2.37 | 12.41 | 5.24 | 0.001 | 498.00 | g/t |
| AGC | 2,018 | 0.70 | 1.79 | 3.04 | 1.70 | 0.001 | 20.00 | g/t |
| ZONE | 108 | workings | ||||||
| Valid | Median | Mean | Std. Devn. | CoV | Minimum | Maximum | Units | |
| LNGTH | 40 | 0.00 | 0.32 | 0.00 | 1.00 | m | ||
| AU | 18 | 0.09 | 1.50 | 2.02 | 1.35 | 0.009 | 8.90 | g/t |
| AUC | 18 | 0.09 | 1.50 | 2.02 | 1.35 | 0.009 | 8.90 | g/t |
| AG | 18 | 2.59 | 3.17 | 2.50 | 0.79 | 0.150 | 9.70 | g/t |
| AGC | 18 | 2.60 | 3.17 | 2.50 | 0.79 | 0.150 | 9.70 | g/t |
| ZONE | 109 | dump | ||||||
| Valid | Median | Mean | Std. Devn. | CoV | Minimum | Maximum | Units | |
| LNGTH | 610 | 1.00 | 0.79 | 0.00 | 1.00 | m | ||
| AU | 608 | 0.42 | 3.17 | 10.44 | 3.29 | 0.001 | 139.44 | g/t |
| AUC | 608 | 0.42 | 2.44 | 4.57 | 1.87 | 0.001 | 20.00 | g/t |
| AG | 608 | 1.41 | 5.00 | 11.62 | 2.32 | 0.001 | 115.00 | g/t |
| AGC | 608 | 1.40 | 3.70 | 5.17 | 1.40 | 0.001 | 20.00 | g/t |
| ZONE | 999 | country rock | ||||||
| Valid | Median | Mean | Std. Devn. | CoV | Minimum | Maximum | Units | |
| LNGTH | 85,912 | 1.00 | 0.96 | 0.00 | 1.00 | m | ||
| AU | 84,693 | 0.01 | 0.06 | 1.32 | 20.76 | 0.001 | 138.20 | g/t |
| AUC | 84,693 | 0.01 | 0.03 | 0.18 | 5.65 | 0.001 | 3.00 | g/t |
| AG | 84,693 | 0.14 | 0.87 | 33.20 | 38.25 | 0.001 | 9098.00 | g/t |
| AGC | 84,693 | 0.15 | 0.50 | 2.27 | 4.55 | 0.001 | 60.00 | g/t |
|
14.3.7 GOLD AND SILVER GRADE ESTIMATION
The block model is rotated in a horizontal plane 40o clockwise, and the blocks are 2m along vein strike, by 1m vertical, by 1m across strike. Four estimates for gold and silver each were completed: polygonal, nearest- neighbor ("NN"), inverse-distance to the third power ("ID3"), and kriged. Except for the polygonal method, each of these types of estimates was run over half a dozen times, to optimize estimation parameters and provide better resource estimates.
The Las Conchitas deposit was divided into four broad estimation areas to change the search orientation and anisotropy in estimation in different portions of the deposit (see Table 14-25). The four estimation areas are based on a generalized orientation of the vein-controlling shear zones.
Table 14-25 Estimation Areas - Search Ellipse Orientations
| Area | Rotation Azimuth | Dip |
| 1 | 310o | -15o |
| 2 | 310o | -0o |
| 3 | 310o | -45o |
| 9 | 310o | -30o |
One single estimation pass was run for each of the halo and vein domains in each of the four estimation areas. The search distance was set to "fill" all blocks coded to veins and halos. About three quarters of the blocks' grade estimates were based on samples that were ≤10m away. About 5% of the blocks' grades are based solely on channel samples and 92% are based solely on drilled sample data. The areas outside modeled geologic and mineral domains were estimated in one single orientation. The maximum search distance outside the domains was 30m from composites, but with a very stringent pullback on "higher" gold grades. A minimum of two composites was required to estimate a block outside modeled domains, compared to one within domains. Estimation parameters are given in Table 14-26.
|
Table 14-26 Estimation Parameters for Gold at Las Conchitas
(for all rotations/dip/tilt and search distance values, see Table 14-25)
| Description | Parameter |
| Vein Domain | |
| Search: type / number of samples | quadrant / 2 per quadrant |
| Samples (minimum / maximum / maximum per hole) | 1 / 8 / 2 |
| Rotation/Dip/Tilt (variogram and searches): (see Table 14-25) | varies (see Table 14-25) |
| Search (m): major/semimajor/minor (perpendicular) all except | 60m / 60m / 15m |
| Inverse-distance power (except those below) | 3 |
| High-grade restrictions (grade in g/t and distance in m) San Pablo Upper and | 60 / 10 |
| Limon Upper | |
| Footwall and Hanging Wall Halo Domains | |
| Search: type / number of samples | quadrant / 3 per quadrant |
| Samples (minimum / maximum / maximum per hole) | 1 / 12 / 3 |
| Rotation/Dip/Tilt (variogram and searches): | varies (see Table 14-25) |
| Search (m): major/semimajor/minor (perpendicular) footwall | 100m / 100m / 25m |
| hanging wall | 75m / 75m / 18.75m |
| Inverse-distance power (except those below) | 3 |
| High-grade restrictions (grade in g/t and distance in m) footwall | 2 / 4 |
| hanging wall | 1 / 4 |
| Outside Domains | |
| Samples: minimum-maximum-maximum per hole | 2 / 10 / 2 |
| Rotation/Dip/Tilt (variogram and searches): | 310 / -30 / 0 |
| Search (m): major/semimajor/minor (vertical) | 30 / 30 / 10 |
| Inverse-distance power | 3 |
| High-grade restrictions (grade in g/t and distance in m) | 0.15 / 3 |
| Dumps | |
| Samples: minimum-maximum-maximum per hole | 1 / 8 / 2 |
| Rotation/Dip/Tilt (variogram and searches): | 0 / 0 / 0 |
| Search (m): major/semimajor/minor (vertical) | 30 / 30 / 10 |
| Inverse-distance power | 4 |
| High-grade restrictions (grade in g/t and distance in m) | 2.5 / 4 |
* Effective search distances are controlled by the vein name, domain, and the number of samples per hole; the thin veins, number of samples per hole, and vein coding would restrict searches greatly and if the search distances expanded, it would be immaterial to the estimate.
|
Table 14-27 Estimation Parameters for Silver at Las Conchitas
for all rotations/dip/tilt and search distance values, see Table 14-25)
| Description | Parameter |
| Vein Domain | |
| Search: type / number of samples | quadrant / 2 per quadrant |
| Samples (minimum / maximum / maximum per hole) | 1 / 8 / 2 |
| Rotation/Dip/Tilt (variogram and searches): (see Table 14-25) | varies (see Table 14-25) |
| Search (m): major/semimajor/minor (perpendicular) all except | 60m / 60m / 15m |
| Inverse-distance power (except those below) | 3 |
| High-grade restrictions (grade in g/t and distance in m) San Albino | 50 / 10 |
| Footwall and Hanging Wall Halo Domains | |
| Search: type / number of samples | quadrant / 3 per quadrant |
| Samples (minimum / maximum / maximum per hole) | 1 / 12 / 3 |
| Rotation/Dip/Tilt (variogram and searches): | varies (see Table 14-25) |
| Search (m): major/semimajor/minor (perpendicular) footwall | 100m / 100m / 25m |
| hanging wall | 75m / 75m / 18.75m |
| Inverse-distance power (except those below) | 3 |
| High-grade restrictions (grade in g/t and distance in m) footwall | 1.5 / 4 |
| hanging wall | 2 / 4 |
| Outside Domains | |
| Samples: minimum-maximum-maximum per hole | 2 / 10 / 2 |
| Rotation/Dip/Tilt (variogram and searches): | 310 / -30 / 0 |
| Search (m): major/semimajor/minor (vertical) | 30 / 30 / 10 |
| Inverse-distance power | 3 |
| High-grade restrictions (grade in g/t and distance in m) | 2.0 / 3 |
| Dumps | |
| Samples: minimum-maximum-maximum per hole | 1 / 8 / 2 |
| Rotation/Dip/Tilt (variogram and searches): | 0 / 0 / 0 |
| Search (m): major/semimajor/minor (vertical) | 30 / 30 / 10 |
| Inverse-distance power | 4 |
| High-grade restrictions (grade in g/t and distance in m) | 6.0 / 4 |
|
14.3.8 MINERAL RESOURCES
Technical and economic factors that influence the "reasonable prospects for eventual economic extraction" were evaluated. For evaluating the open pit potential, a series of optimized pits were run using variable gold prices and parameters. The engineering parameters, mining costs, and metallurgical recoveries are based on actual and current production data. The open pit mining cost was $3/t, processing cost $65/t, and G&A cost $2/t. Metallurgical recoveries of gold used in the pit optimizations were 83%, 90%, and 95% for fresh rock, transition, and oxide material, respectively. Silver was not considered in the optimizations. For evaluating the potential for underground mining, a series of stope optimizations were run at variable cutoffs and for the reporting cutoff grade an average mining cost of $144/t, processing cost of $65/t and G&A of $2/t were assumed. Because the underground resources are dominantly in fresh rock, only the 83% metallurgical recovery was applied. A gold price of US$1,750/oz was used to define the reporting cutoff grade.
Classification of the resources considered adequacy and reliability of sampling and the database, geologic understanding, results of quality control analyses, geologic complication, predictability, and apparent grade continuity. No Measured classification was assigned at Las Conchitas because this is the first estimate, drilling is generally more widely spaced than at San Albino, and vein continuity has not yet been sufficiently well defined. Workings are likely underreported but at the same time are probably not significant in volume. Table 14-28 presents the criteria for classification.
Table 14-28 Mineral Resource Classification
| Description | Parameter |
| Indicated | |
| In domains and | |
| Minimum holes; minimum composites; maximum distance to closest comp | 3; NA; 35m |
| or | |
| Minimum holes; minimum composites; maximum distance to closest comp | 2; 3; 25m |
| or | |
| Minimum holes; minimum composites; maximum distance to closest comp | 2; 2; 15m |
| and | |
| Average distance of all composites used to estimate the block | <60m |
| and | |
| Block is influenced more by drillholes than by channel samples | |
| Inferred in Domains | |
| Any block within the domains not classified as Indicated and all dumps | |
| Inferred outside Domains | |
| Number of composites | 2 |
| Range to closest composite (m)* | 20 |
*Note that there is an extreme restriction limiting the projection of high grades outside the defined mineral domains
|
The author has used his judgment with respect to the technical and economic factors likely to influence the "prospects for eventual economic extraction" and the estimates listed in those tables do fulfill that requirement. The Las Conchitas deposit reported mineral resources are based on potential open pit as well as potential underground mining scenarios. Table 14-13 present the estimates of the Indicated and Inferred resources at Las Conchitas.
The resources potentially minable by open pit include a 0.4m rind of dilution along the hanging wall and also along the footwall (Table 14-29). Reported vein resources includes 0.8m of dilution along the top and the bottom of the vein. Mako's production finds that they average ~0.35m in the hanging wall and ~0.5m. The calculated dilution is 0.4m on the upper and lower margins of all veins. If mining selectivity can be better than the total one meter, then the potentially minable resource will change to higher cutoff grades.
Those resources potentially minable by underground methods are presented in Table 14-30. The underground resource is that material at or above 4.0g Au/t that lies within 3.0g Au/t optimized stopes.
There are estimated resources in the historic mine dumps, all of which are classified as Inferred because of the difficulty in estimating mine dump material. These are presented in Table 14-31.
The total resources potentially minable by open pit and potentially minable by underground methods, as well as the dumps, are presented in Table 14-32. Cross sections including the block model are presented in Figure 14-13 and Figure 14-14.
|
Table 14-29 All Veins in Las Conchitas Deposit: Open Pit Resources
| Open Pit | |||||
| All Indicated | |||||
| Cutoff | Tonnes | MD g Au/t | Oz Au | g Ag/t | Oz Ag |
| 1.5 | 295,700 | 10.83 | 103,000 | 12.7 | 121,100 |
| All Inferred | |||||
| MD | Tonnes | MD g Au/t | Oz Au | g Ag/t | Oz Ag |
| 1.5 | 106,600 | 9.55 | 32,700 | 13.2 | 45,200 |
Note: MD is the model grade with expected mining dilution
Table 14-30 All Veins in Las Conchitas Deposit: Underground Resources
| Underground | |||||
| Indicated | |||||
| Cutoff | Tonnes | BD g Au/t | Oz Au | BD g Ag/t | Oz Ag |
| 4.0 | 75,600 | 14.12 | 34,300 | 15.3 | 37,200 |
| Inferred | |||||
| Cutoff | Tonnes | BD g Au/t | Oz Au | BD g Ag/t | Oz Ag |
| 4.0 | 27,600 | 16.98 | 15,100 | 19.3 | 17,200 |
Note: BD is the block-diluted model grade
Table 14-31 Las Conchitas Deposit: Inferred Mine Dump Resources
| Dumps, all Inferred | |||||
| Cutoff | Tonnes | BD g Au/t | Oz Au | BD g Ag/t | Oz Ag |
| 1.0 | 8,300 | 2.39 | 600 | 3.7 | 1,000 |
Note: BD is the block-diluted model grade
Table 14-32 All Veins in Las Conchitas Deposit: Open Pit, Underground and Dump Resources
| Open Pit and Underground and Dumps | |||||
| Indicated | |||||
| Cutoff | Tonnes | g Au/t | Oz Au | g Ag/t | Oz Ag |
| variable | 371,300 | 11.50 | 137,300 | 13.3 | 158,300 |
| All Inferred | |||||
| Cutoff | Tonnes | g Au/t | Oz Au | g Ag/t | Oz Ag |
| variable | 142,500 | 10.56 | 48,400 | 13.8 | 63,400 |
Note: Variable cutoffs are 1.5g Au/t for open pit and 4.0g Au/t for underground
|
Figure 14-13 Las Conchitas Deposit Gold Block Model – Cross Section 650
Cross section locations shown in Figure 10-3 (looking azimuth 40o)
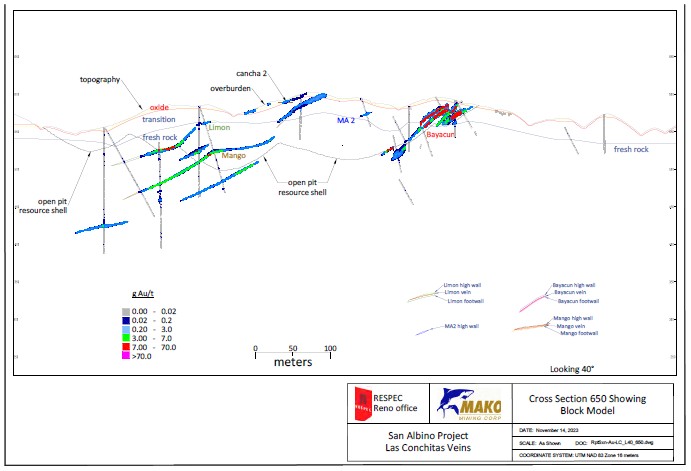
|
Figure 14-14 Las Conchitas Deposit Gold Block Model – Cross Section 1830
Cross section locations shown in Figure 10-3 (looking azimuth 40o)
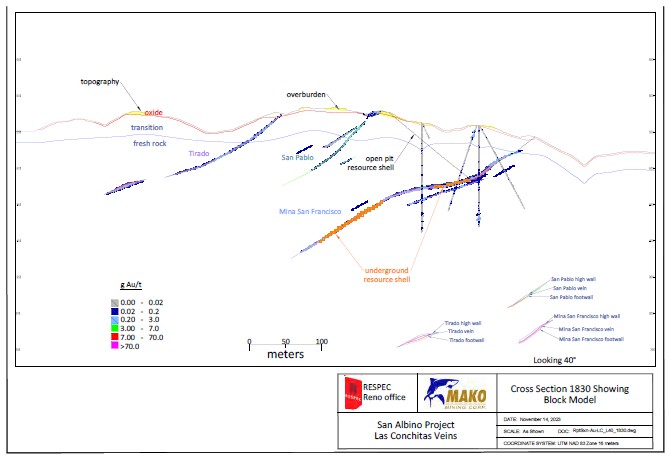
|
14.3.9 DISCUSSION OF RESOURCES
The exploration procedures and data derived from Mako's work are high quality and can be used to support the resource estimate. At Las Conchitas, vein correlations between holes cannot be made as confidently as at the San Albino deposit because many of the veins are not as persistent or strong, and because the current, relatively wide drill spacing does not permit it. Because of this lack of confidence with correlations, the veins are not projected as far as they might have been had the drilling been more tightly spaced. Consequently, the author believes that there is a reasonable probability that the resource will increase with additional infill drilling. While there is confidence in the present interpretations, the expectation is that more vein material will be defined within the resource area.
In several locations the author's interpretations showed more faulting offset than Mako's interpretations, which represented deformation more from folding. There are very complicated structural offsets at the Bayacun vein, which would require extensive development drilling if this were to be mined underground. The more likely open pit exploitation will recover the estimated material but accurate budgeting and scheduling will be difficult to do without more drilling. In those areas where significant offset exists, classification was dropped to Inferred. Because continuity for most of the 15 veins is not as predictable as the San Albino vein, this is the first estimate, and drill spacing is currently relatively wide, no resources are classified as Measured.
The veins of the Las Conchitas deposit are high-grade as shown in the resource tables listed above. The estimated average undiluted grade of all the veins at Las Conchitas is 16.4g Au/t. The style of mineralization is well understood. The deposits are open ended along strike and down dip.
The author observed Mako's core sampling procedures and found them to be well done with careful consideration paid to reducing sampling bias. Specific methods are discussed in Section 11.1.3. Sampling is generally done on geologic breaks with special attention given to separating quartz veins from the surrounding hanging wall and footwall zones. The Mako geologists are very good at determining general grades of the different portions of the vein, particularly those portions likely to contain very high grades versus those that are low grade. The high-grade portions of the vein sometimes were included in sample intervals that contained material that may be substantially lower grade. The resulting concealment of the high-grade limits the ability to accurately estimate the spatial extents of the highest-grade zones and creates an inherent risk in estimation.
When there was some doubt in any of the samples' reliability, they were eliminated from use. One issue with sampling that imparts some risk is the moderate core recovery; however, graphic representations of the grades from the San Albino area plotted against core recovery show effectively no differences until below around 45% recovery at which point there is high-grade variability. At Las Conchitas all 32 samples with recoveries below 45% were eliminated from use in the estimate. No RC holes were explicitly used for modeling or grade estimation because of their data not being sufficiently accurate and or potentially having some contamination; however, they were used to support minor adjustments to sectional interpretations.
|
Mining dilution is an important factor for the deposits at Las Conchitas and more so than at San Albino because the veins are in some places so thin that the dilution can render them uneconomic. Mining at Las Conchitas, like at San Albino, requires detailed grade control to maintain grade. In many places the veins have visually distinct hanging wall and footwall contacts, which help with grade control. The estimated open pit resources include approximately 0.4m rind of dilution on both the hanging wall and footwall of each vein. The average dilution grade varies from almost zero to up to 0.5g Au/t, depending on whether the halo mineralization is present. In all cases, the dilution grade is taken from the estimate and is not a single grade applied globally. It is expected that dilution during underground mining will be greater because of ground conditions, shallow dip, minimum mining height, less grade control data, and therefore less control on locating hanging wall and footwall. The author is reporting full-block-diluted grades at a cutoff of 4.0g Au/t for material within the optimized underground stopes at 3.0g Au/t.
The volume of underground workings at Las Conchitas is negligible and not significant.
Clustering of data from trench sampling imparted a complication in estimation so a quadrant search section was used. The author verified reasonableness by visually comparing the interpolated grades in the block model to the mineralization domains modeled using the drilling and channel sample data and evaluating grade distributions graphically.
After the initial sectional interpretations were completed, RC drillholes with gold grades were imported. The RC drillholes did not undergo any independent auditing and the assays were done at the on site lab, at which the authors have not conducted independent checking. The purpose of importing these RC holes was to get a sense of reasonableness of the interpreted gold domains. While RC drilling distorts perceptions of this deposit because of the 1.5 or 3m sample intervals without regard for geology like vein or halo contacts, they still provide a general sense of reasonableness. And, for the most part, this study did just that. The RC holes did provide comfort that the domain models reasonably portray locations and general tenor of mineralization, except for one area on the Mina San Francisco vein where that post-model checking indicated that the vein's location is lower by about 5m than what was modeled. Mineralization around structures is classified as Inferred because of the lack of certainty of location.
Comparisons were made between 1m bench composites and the coincident blocks. For Indicated blocks, the mean was similar between the two sets of grades. The median grade was higher in the estimate indicating a distortion in the inverse-distance estimate. However, the kriged estimate was significantly different with greater distortion. The nearest-neighbor estimated grades were closer to the coincident composite grades than either the kriged or nearest-neighbor estimated grades. Comparisons were also made between coincident bench composites and blocks by sample type for a) Indicated versus Inferred material, b) inside the vein, and c) in the halos. In general, the estimates “behaved” better with core samples than around channel samples and Indicated material “behaved” better than Inferred material. The most important conclusion from this evaluation is that the highest grades are not reflected in the estimate of the halo, meaning that small high-grade zones will be encountered while mining that are not well represented in the estimate. The estimated grades in the vein more accurately reflect the coincident composites.
|
The reported resources with “…reasonable prospects for eventual economic extraction” are presented in Table 14-29, Table 14-30, Table 14-31, and Table 14-32. Those resources occur at the outcrop of veins that extend downward at shallow to moderate dips. Figure 14-15 shows these relationships.
Figure 14-15 3D Perspective of Las Conchitas Grade Shells and Resource-Controlling Solids
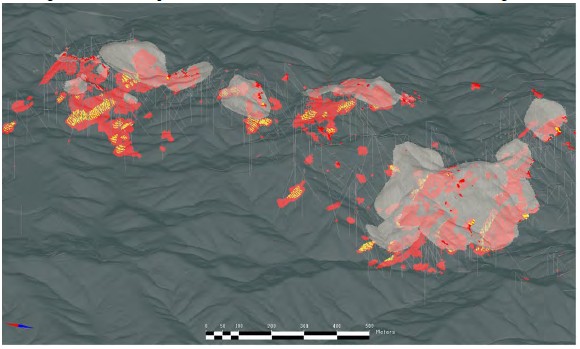
Note: Light tan-grey is the $1,750/gold oz pit; red is the 1.5g Au/t grade shells of unclassified material; yellow shells are the underground resource (Table 14-30); looking N70W, down at 35o. Vein material outside the pit and underground shells is unclassified material..
|
15.0 MINERAL RESERVE ESTIMATES (ITEM 15)
There are no Reserves at San Albino because the mine plan used to put the project into production was based on material including Inferred resources. Mako's current mine plan and mine production schedule are also based on the current mineral resource estimate including inferred material. Inferred mineral resources are considered too speculative geologically to have the economic considerations applied that would enable them to be classified as mineral reserves.
The mine production has had good reconciliation (within 10% as of the Effective Date) with the Inferred material as well as Measured and Indicated.
|
16.0 MINING METHODS (ITEM 16)
The San Albino project is currently being mined using open pit truck and excavator methods. Current mining has totaled over 11,139,000 tonnes through September 2023. Due to having more than $90 million in aggregate revenues over the past three years, Mako is considered a producing issuer for the purpose of NI 43- 101 reporting. The current mine plan and mine production include Inferred material. Accordingly, there is no certainty that the mine plan, even though based on current operations, will be realized in the future.
Mining for the San Albino project includes the San Albino deposit and no current mine plans have been assumed for Las Cochitas. The methodology used for Life-of-Mine ("LOM") mine planning includes:
• Define assumptions for the economic parameters;
• Define geometric parameters and constraints;
• Complete Lerches Grossman pit optimizations;
• Create pit designs;
• Create dump designs;
16.1 ECONOMIC PARAMETERS
Pit optimizations and subsequent pit designs are based on the economic parameters shown in Table 16-1.
|
Table 16-1 Economic Parameters for Pit Optimizations
| Mining Costs | ||
| Waste Mining Reference Cost | $/t mined | 3.00 |
| Above COG Mining Reference Cost | $/t mined | 3.00 |
| Total Reference Mining Costs | $/t mined | 3.00 |
| Process Based Costs | ||
| Process Cost | $/t ore stacked | 65.000 |
| Selling Cost & Credits | $/t ore stacked | 2.00 |
| G&A | $/t ore stacked | 2.00 |
| Total Ore Based Costs | $/t ore stacked | 69.000 |
| Other Economic Parameters | ||
| Au Price | US$/oz | 1,750 |
| Au Oxide Recovery | % | 95.0% |
| Au Mixed Recovery | % | 90.0% |
| Au Sulphide Recovery | % | 83.0% |
| Ag Oxide Recovery | % | 60.0% |
| Ag Mixed Recovery | % | 55.0% |
| Ag Sulphide Recovery | % | 50.0% |
| Average Au Rec | % | 89.3% |
While silver is not a large contributor to the San Albino project economics, a $25/oz Ag is used for mine planning.
16.2 CUTOFF GRADES
As per Section 14.2.8, the resource is presented as a diluted vein with a 0.5m rind along the hanging wall and footwall. Effectively, all estimated vein material is above cutoff so all vein material and the 1m of total dilution is mineable.
16.3 GEOMETRIC PARAMETERS
Geometric parameters include slope parameters which are shown in Table 16-2. A 40° inner-ramp angle was used for pit optimizations. Table 16-2 also shows the design parameters used for waste rock storage facilities.
Table 16-2 Slope Parameters
| Location | Bench Width (Meters) | Face Angle (DD) | Bench Height | overall angle (DD) | Road Width (Meters) |
| South WRD | 9 | 32 | 10 | 2.5:1 or 21.3545 | 10.8 m |
| Arras Pit | 3.5 | 45 | 6 | South 29.826 West 29.994 North 28.685 | 13.7 m |
| West Pit | 3.5 | 45 | 6 | West 31.069 North 25.975 East 31.446 | 9.8 m |
| Southwest Pit | 2.25 | 45 | 6 | North East 34.25 North West 34.4613 South West 28.1438 | 13.2 m |
|
No property boundary constraints were used for pit optimization process.
16.4 PIT DESIGNS
Pit designs were created for the San Albino deposit and used in the LOM plan. The ultimate pit designs and waste rock storage facilities are shown in the general arrangement drawings in Figure 16-1 The ultimate pit design consists of West Pit, Southwest Pit and the Arras Pit. The LOM plan includes a single Waste Rock Dump ("WRD") design as the South WRD.
|
Figure 16-1 San Albino Ultimate Pit General Arrangement
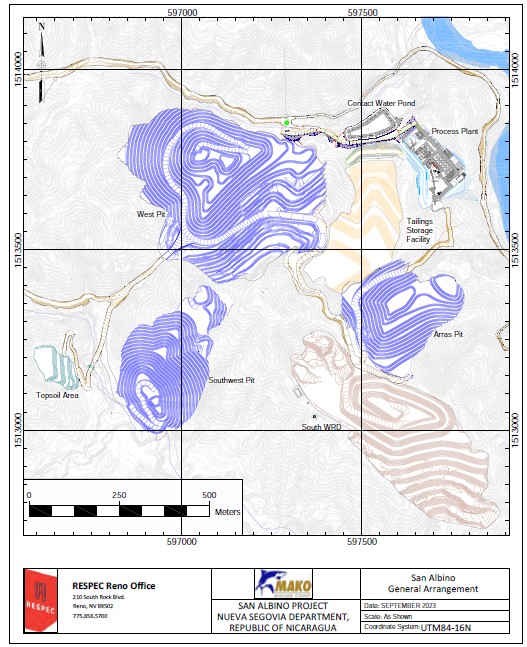
|
16.4.1 IN-PIT RESOURCES
Total San Albino in-pit resources include Measured, Indicated, and Inferred Resources as shown in Table 16-3.
Table 16-3 San Albino In-Pit Resources
| Arras | Naranjo | Southwest | West | Total San | ||
| Units | Pit | Zone | Pit | Pit | Albino | |
| Measured | k Tonnes | 8 | 3 | 5 | 63 | 78 |
| g Au/t | 11.50 | 3.79 | 3.92 | 11.54 | 10.76 | |
| k ozs Au | 3 | 0 | 1 | 23 | 27 | |
| g Ag/t | 18.50 | 11.79 | 9.03 | 23.59 | 21.72 | |
| k ozs Ag | 5 | 1 | 1 | 47 | 55 | |
| Indicated | k Tonnes | 24 | 1 | 4 | 17 | 46 |
| g Au/t | 7.94 | 4.60 | 5.65 | 14.03 | 9.93 | |
| k ozs Au | 6 | 0 | 1 | 8 | 15 | |
| g Ag/t | 13.04 | 12.42 | 10.06 | 26.74 | 17.87 | |
| k ozs Ag | 10 | 1 | 1 | 15 | 26 | |
| M&I | k Tonnes | 31 | 4 | 9 | 80 | 124 |
| g Au/t | 8.81 | 4.03 | 4.67 | 12.07 | 10.45 | |
| k ozs Au | 9 | 1 | 1 | 31 | 42 | |
| g Ag/t | 14.37 | 11.97 | 9.48 | 24.26 | 20.30 | |
| k ozs Ag | 14 | 2 | 3 | 62 | 81 | |
| Inferred | k Tonnes | 1 | 30 | 57 | 12 | 99 |
| g Au/t | 3.45 | 9.69 | 10.28 | 9.77 | 9.96 | |
| k ozs Au | 0 | 9 | 19 | 4 | 32 | |
| g Ag/t | 7.58 | 14.73 | 14.41 | 17.81 | 14.82 | |
| k ozs Ag | 0 | 14 | 26 | 7 | 47 | |
| Waste | k Tonnes | 1,097 | 1,287 | 2,712 | 1,748 | 6,844 |
| Total Tonnes | k Tonnes | 1,130 | 1,320 | 2,778 | 1,839 | 7,067 |
| Strip Ratio (MI&I) | W:O | 33.88 | 38.00 | 41.34 | 19.15 | 30.67 |
16.4.2 ACTUAL MINE PRODUCTION
San Albino mine production started September 1, 2021. This production, through September 2023, totals over 11,139,000 tonnes with 401,000 tonnes of material from pits and 90,000 of historic dump material sent to the mill. Table 16-4 summarizes actual mining through September 2023.
|
Table 16-4 San Albino Actual Mine Production
| 2023 | |||||
| Mine Production | Units | 2021 | 2022 | (Through Sept) | Total |
| Above COG | tonnes | 60,440 | 199,977 | 141,423 | 401,840 |
| g Au/t | 11.20 | 6.77 | 6.56 | 7.36 | |
| ozs Au | 21,766 | 43,519 | 29,839 | 95,124 | |
| g Ag/t | 20.77 | 13.77 | 13.81 | 14.83 | |
| ozs Ag | 40,360 | 88,518 | 62,780 | 191,659 | |
| Waste Mined | tonnes | 970,983 | 5,424,417 | 4,341,838 | 10,737,238 |
| Total Mined | tonnes | 1,031,423 | 5,624,394 | 4,483,261 | 11,139,078 |
| Strip Ratio | W:O | 16.07 | 27.13 | 30.70 | 26.72 |
|
17.0 RECOVERY METHODS (ITEM 17)
17.1 SUMMARY
The process plant at San Albino incorporates a conventional processing flowsheet that is well proven in industry. The flowsheet includes: crushing, grinding, gravity recovery, ICU for gravity gold recovery, CIL cyanide leach, carbon desorption and regeneration, cyanide detoxification, filtering and dry stacking of leach tails. Doré bars are shipped off site for final refining. A copy of the plant flow sheet is given in Figure 17-1.
17.1.1 CRUSHING
Run-of-mine (ROM) ore from the mine is stockpiled in front of the crusher in various stockpiles depending on gold grade and the preg-rob potential of the ore. The ore from the stockpiles is blended to control the gold grade and preg-rob potential of the feed material.
A front-end loader feeds the blended ROM ore to a 24 X 36 jaw crusher. Crusher discharge is conveyed to a double deck vibrating screen. The oversize from both the top deck (1in. opening) and bottom deck (1/2in. opening) reports to a 4.25ft standard cone crusher for further crushing. The screen undersize from the bottom deck reports as final product. The discharge from the cone crusher is combined with the jaw crusher discharge and returns to the double deck screen. The final crushed product, at approximately 80% passing 3/8in., reports to a crushed ore stockpile. The crusher throughput rate averages 75tph to 100tph during the dry season with throughput rate reduced during the rainy season.
17.1.2 GRINDING
The grinding circuit includes two identical ball mills (9ft 6in. diameter X 17ft long, 700 hp) with one mill operating and the other in stand-by mode. Ore is reclaimed from the crusher ore stockpile using a mill feed conveyor with each mill having a dedicated feeder and feed conveyor. Process water, cyclone underflow, and new feed are added to the mill to achieve a mill density of approximately 70% solids. A portion of the mill discharge is sent to the gravity circuit with the balance of the mill discharge combined with gravity circuit tail are pumped to a bank of three 10in. cyclones (two operating, one spare). The cyclone overflow is ground product and reports to a 7m diameter pre-leach thickener and the underflow is returned to the mill for further grinding. To control pH in the CIL leach circuit, an automated lime feed-screw conveyor is used to add lime from the lime storage silo to the operating mill feed conveyor. Approximately 800kgs of 3in. steel grinding balls are added to the mill each day to maintain the required ball charge.
|
Figure 17-1 San Albino Mill Flowsheet
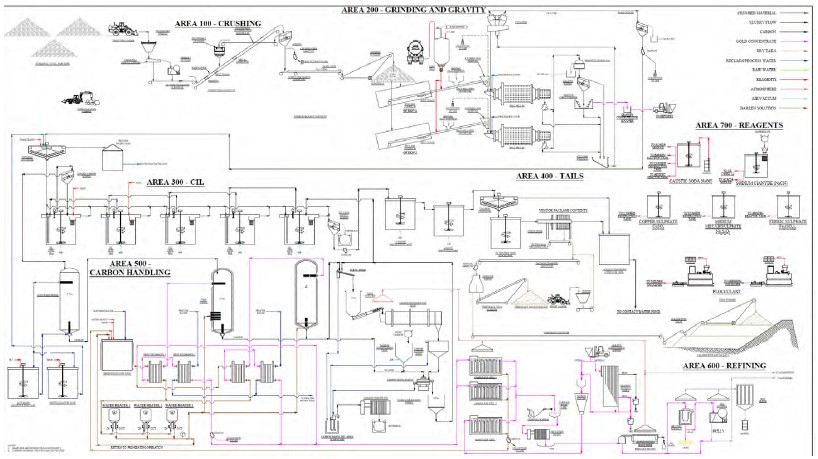
|
17.1.3 GRAVITY AND ICU
A portion of the ball mill discharge is pumped to the gravity recovery circuit. This portion can be changed by making an adjustment in the mill discharge launder directing more or less flow to the gravity circuit. The gravity circuit feed is first passed through a magnetic separator to remove any ball chips present then passed over a screen deck with 2mm openings. The screen oversize is returned to the cyclone-feed pump box and the screen undersize is fed to the operating XD20 Knelson concentrator. The tails stream from the concentrator returns to the cyclone feed pump box with the concentrate periodically flushed from the concentrator and sent to a concentrate holding tank. At the end of each shift the concentrate holding tank is transported to the refinery in preparation for Intense Cyanidation.
Each day, the concentrate from two holding tanks is transferred to the Acacia CS500 leach reactor. A leach solution is mixed containing strong cyanide (approximately 25,000ppm NaCN), high caustic concentration (3%), and Leach Aid, a proprietary leach catalyst, and is leached for 20 hours. After leaching, the concentrate is pumped to the CIL circuit. The precious metals are recovered from the pregnant leach solution using a dedicated electrowinning cell. The precipitate is periodically collected from the electrowinning cell, smelted and poured into doré bars.
17.1.4 THICKENING AND CIL LEACH
Cyclone overflow passes over a trash screen to remove any wood chips and other trash present in the slurry and flows by gravity to the pre-leach thickener. The thickener overflow is clear solution and reports to a process solution tank for use throughout the plant.
The thickener underflow, thickened to 45% solids, is pumped to the first of five CIL tanks (approximately 36 hours total leach retention time) where cyanide is added to begin leaching. The slurry flows by gravity through each of the five agitated tanks in series. Each tank contains 40gpl activated carbon to adsorb the leached gold. Sparge air is added to each tank to improve cyanide leach kinetics. Each of the tanks also has a carbon- retention screen to allow the slurry to flow to the succeeding tank and ensuring the carbon remains in the tank. Periodically the carbon is pumped upstream counter-current to the slurry flow with carbon from the first CIL tank pumped to the carbon desorption/regeneration circuit. Regenerated and fresh carbon is added to the fifth CIL tank to replace the carbon removed for desorption. The slurry exiting the fifth CIL tank represents leached slurry and considered circuit tails.
17.1.5 CARBON DESORPTION AND REGENERATION
The loaded carbon is pumped over a carbon washing screen with the slurry returned to the first leach tank and the washed carbon sent to the acid wash vessel. When the acid wash vessel is full, the carbon advance pump is shut down and the carbon in the vessel is rinsed with water. HCl is added to water in the dilute-acid tank to make a solution of pH 1.5 to 2.0. The acidic solution is circulated through the carbon for three to four hours to remove the carbonate scale that has accumulated on the carbon in the CIL tanks. After the acid wash is complete and solution is neutralized with NaOH, it is returned to the CIL circuit. The washed carbon is transferred to the strip vessel.
|
The precious metals are removed from the carbon in the strip vessel by pumping solution containing 2.5% NaOH through the carbon at 140oC for 8hrs. The strip solution is mixed by adding NaOH to fresh water in the barren-solution tank. This solution is pumped through a heat exchanger to pre-heat the solution then through a series of direct-heat solution heaters (two operating, one stand-by) to achieve the140oC before being introduced into the bottom of the strip vessel. The solution is kept under pressure to prevent boiling. The pregnant strip solution exits the top of the strip vessel and is routed through the opposite side of the heat exchanger, which is preheating the solution, to initially cool the solution, then through a heat exchanger with water on the other side to cool the solution to below boiling. The cooled solution then reports to an electrowinning cell (one operating, one stand by) where the gold is removed from solution. The solution then returns to the barren tank to be circulated back through the process.
After the carbon stripping is completed, a portion of the carbon is pumped to a kiln feed tank and the remainder of the carbon is returned directly to the fifth CIL tank. The carbon is dewatered and processed through the kiln at 750oC for one hour. The elevated temperature in an atmosphere devoid of oxygen removes the organic materials (lubrication oil, etc.) that were adsorbed on the surface of the carbon. The discharge from the kiln is screened to remove the carbon fines and returned to the fifth leach tank. In addition, new carbon is also added to supplement the carbon returning to the system to make up for the fines being generated throughout the process. The carbon fines are bagged and stored on site. A couple times a year the fines are shipped off site for processing. Approximately 75% of the carbon that is stripped is routed through the kiln.
The removal of carbonate material in the acid wash step before stripping and the removal of organics in the kiln improve the carbon activity allowing the carbon to more effectively adsorb gold from solution, leading to improved metal recoveries. The San Albino carbon handling circuit is sized to process two tonnes of carbon per batch and can process approximately 1.5 batches per day.
17.1.6 CYANIDE DETOXIFICATION
The leach tails slurry exits the final leach tank and flows by gravity to the cyanide detoxification tank. The free cyanide is reduced to environmentally safe concentrations using the SO2/Air process. The process calls for a large volume of air to be added to a very vigorously agitated tank. Sodium metabisulfite is added, along with NaOH for pH control, to treat the cyanide. Copper sulfate is added, if needed, to maintain reaction kinetics. The slurry retention time in the cyanide detoxification tank is two hours.
 |
The slurry reports to an arsenic treatment tank following cyanide detoxification. Ferric sulfate is added to the slurry to form an insoluble arsenate solid to reduce the arsenic concentrations in solution to below environmental permit requirements.
17.1.7 SLURRY FILTRATION AND TAILS DEPOSITION
The arsenic treatment tank discharge report to the tails thickener (identical to pre-leach thickener). The underflow from the thickener (55% to 60% solids) is pumped to a filter press surge tank. The overflow from the thickener is pumped to a process solution tank to be reused as needed throughout the plant.
The thickened slurry is pumped from the surge tank to a filter press to remove additional water and produce a dry solid that is conveyed to thetailings storage facility ("TSF"). The solids are stacked and compacted in the TSF per facility design. The solution removed by the filter press reports to a process solution tank to be reused throughout the plant.
17.1.8 REFINERY
Precious metals are recovered in the two electrowinning circuits: Intense Cyanidation, and carbon stripping. The metal is precipitated from solution in both circuits. The precipitate is treated identically but kept separate for accounting purposes. In both instances, the precipitate is washed from the cathodes with a pressure washer and washed into a filter press to be dewatered. The precipitate is transferred from the filter press to the mercury retort oven for drying and to remove any mercury present. After eight hours in the retort, furnace fluxes are mixed with the dried precipitate and smelted in an induction furnace. The poured doré bars are stored in a safe located within the refinery until the security contractor transports them to Managua for shipment to the Asahi refinery in Salt Lake City.
|
17.2 PRODUCTION
The San Albino mill has been in continuous operation since the second quarter of 2021. Table 17-1 shows the mill production on a quarterly basis.
Table 17-1 Quarterly Mill Production
| 2021 Q2 | 2021 Q3 | 2021 Q4 | 2022 Q1 | 2022 Q2 | 2022 Q3 | 2022 Q4 | 2023 Q1 | 2023 Q2 | 2023 Q3 | |
| Feed tonnes | 16,246 | 33,441 | 38,313 | 46,869 | 49,332 | 44,452 | 49,204 | 49,675 | 54,284 | 51,578 |
| Feed grade, g/t |
12.52 | 8.25 | 9.01 | 7.20 | 7.30 | 7.82 | 7.55 | 6.34 | 5.25 | 6.63 |
| Feed ounces | 6,539 | 8,872 | 11,102 | 10,843 | 11,576 | 11,172 | 11,937 | 10,119 | 9,157 | 10,997 |
| Recovered ounces |
6,300 | 8,239 | 10,291 | 9,280 | 8,630 | 8,598 | 9,882 | 8,347 | 6,563 | 8,506 |
| % recovery | 96.3% | 92.9% | 92.7% | 85.6% | 74.5% | 77.0% | 82.8% | 82.5% | 71.7% | 77.4% |
| % mill availability |
68% | 85% | 82% | 87% | 92% | 94% | 95% | 94% | 95% | 94% |
| average tons per day |
460 | 429 | 507 | 596 | 589 | 512 | 563 | 587 | 627 | 598 |
|
17.3 CONSUMPTION OF WATER, ENERGY AND OTHER CONSUMABLES
17.3.1 FRESH WATER CONSUMPTION
The San Albino mine is permitted to pump at total of 7,655m3 of water from the Jicaro River each month. The permit requires the mine to document the water consumption each month and report this to the government on an annual basis. Figure 17-2 shows the monthly fresh-water consumption since the mill started up.
Figure 17-2 Fresh Water Consumption
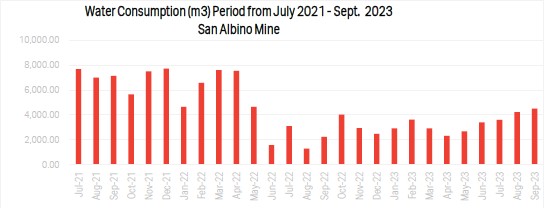
17.3.2 ELECTRICAL POWER CONSUMPTION
All electrical power used in the process area is generated on site. A total of four diesel powered generators are on site with two operating at all times and a third one started during peak demands such as mill start-up. Each of the four generators are rated at 1000kW with a recommended peak capacity of 910kW to prevent possible equipment damage. The average power consumption during normal operation is 700 kW from each of the two generators operating under normal conditions. Each generator consumes approximately 50gal of diesel each hour of operation.
17.3.3 CONSUMPTION OF REAGENTS AND OTHER CONSUMABLES
A list and quantity of consumable items used at the plant is given Table 17-2.
|
Table 17-2 Consumables Consumptions
| Item | Consumption (kg/t milled) |
| Steel balls | 1.79 |
| Sodium cyanide | 1.28 |
| Floculant | 0.11 |
| Caustic soda | 0.91 |
| Hydrochloric acid | 0.42 |
| Lime | 2.27 |
| Activated carbon | 0.35 |
| LPG gas | 1.09 |
| Antiscalant | 0.005 |
| Copper sulfate | 0.05 |
| Sodium metabisulfite | 1.80 |
| Borax | 0.0350 |
| Soda Ash | 0.0156 |
| Silica | 0.0274 |
| Fluorspar | 0.0009 |
| Nitre (KNO3) | 0.0030 |
| Leach Aid (Kg/l solution) | 0.0029 |
|
18.0 PROJECT INFRASTRUCTURE (ITEM 18)
18.1 OVERVIEW
The main infrastructure supporting the operation of the San Albino mine is located near the mill facility with a few installations located near operating mine pits and ore stockpiles. Figure 18-1 shows the overall San Albino site plan. Figure 18-2 shows details of the plant site.
18.2 SITE ACCESS
Site access to the mine is provided through the guard gate shown in Figure 18.1. The guard gate has radio and telephone communication with the entire mine site and is continually manned.
|
Figure 18-1 Overall San Albino Site Plan
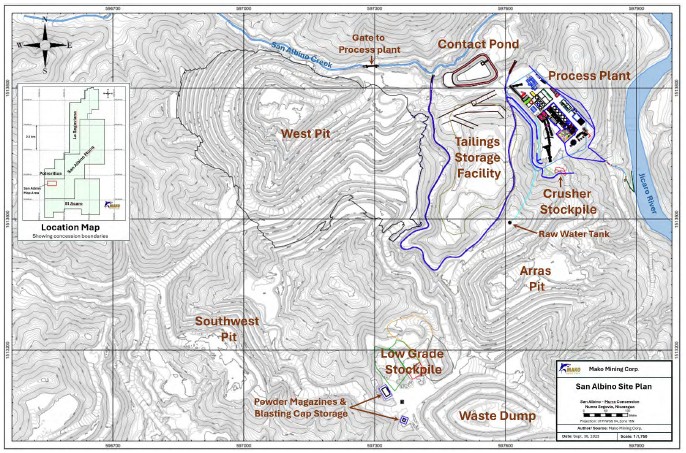
|
Figure 18-2 Detail Plan of San Albino Process Facility
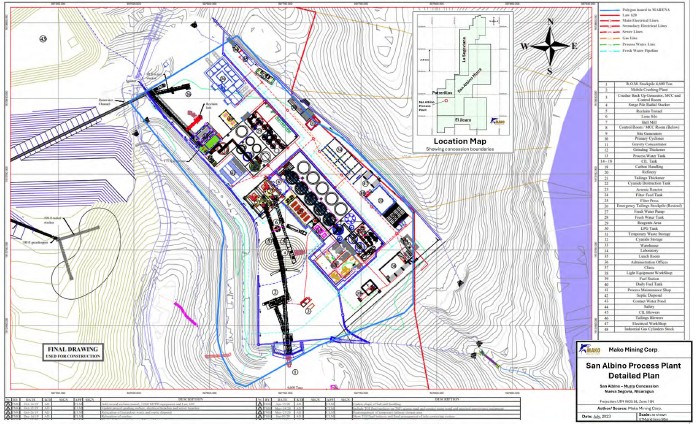
|
18.3 PRIMARY INFRASTRUCTURE
The primary components of the site infrastructure include:
18.3.1 POWER GENERATION
The portable generators, described in detail in section 17.3.2, are located within the plant site area and supply all electrical power for the entire mine site.
18.3.2 ASSAY LAB
An assay lab is located within the process plant area. The lab is equipped to complete 150 to 200 fire assays each day in support of mine and milling operations. The lab also has an AA machine for solution analysis and an ICP for any special sample analysis required in support of the operation.
18.3.3 COMMUNICATION
A communication tower located on top of the hill behind the process facility receive internet services and cell phone coverage from Claro and Tigo . The site has cell phone coverage and internet derived from a local tower. The site has installed numerous cameras to monitor the entire process area. These cameras were initially installed to assist with construction to alleviate many restrictions due to Covid regulations. They have remained in service during operations and are used extensively to monitor all aspects of the operation.
18.3.4 DIESEL STORAGE
Two diesel storage tanks are located in the process area to store diesel for the entire site. The tanks are located within a containment area to prevent any spills from escaping into the environment.
18.3.5 WEATHER STATION
A weather station is located adjacent to the main office building in the process area. The station monitors rainfall, daily high and low temperature, evaporation rate, and includes dust monitoring.
18.3.6 CLINIC
A medical clinic is located in the process plant area. The clinic has a medical doctor available to treat mine employees as needed. In addition, industrial related care (e.g., hearing tests and eye tests) is available at the clinic as well as any required PPE.
|
18.3.7 STORAGE OF BLASTING SUPPLIES
The powder magazine and blasting caps are stored in separate containers near low-grade stockpiles. Both containers are fenced and have a person guarding the two containers 24hrs/d seven days a week to prevent access by unauthorized personnel.
18.3.8 MINE WASTE DUMPS
Mine waste dumps are located near operating pits to reduce the haulage distance as much as possible. Figure 18-1 shows one waste dump located near the low-grade stockpiles.
18.3.9 ORE STOCKPILES
Ore from the pit is hauled to either the high-grade stockpile area near the crusher to be processed within days of delivery or to the low-grade stockpile area located a short distance from the crusher stockpile area to be processed as needed. Ore is segregated by weathered/fresh and preg-rob potential in both stockpile locations to allow for ore blending to maximize mill performance.
18.4 TAILINGS STORAGE FACILITY
The tailings storage facility ("TSF") is located southwest of the processing facility. The facility is designed for dry stacked tails and is fully lined with a 60 mil high density polyethylene ("HDPE")liner. The tails from the plant are filtered and delivered by conveyor to the storage facility. A wide-track D6 dozer is used to distribute the tails in thin lifts across the facility. A drainage system of perforated HDPE pipe is located on top the liner under the tails to assist with draining water away from the facility as needed. Water from this line reports to the contact water pond located just north of the storage facility. To date, this drainage system has only had a small stream of water during the rainy months and is completely dry for the remainder of the year.
The facility was designed to store 1.87 million tonnes of mill tails. It was designed to be constructed in three stages with the first stage completed before the mill was started in the second quarter of 2021. The second and third stages are fully designed and permitted and is yet to be scheduled as additional storage capacity is required. Through October of 2023, 434,000 tonnes of tails had been deposited in the storage facility.
The north end of the facility is a structural component that requires the addition of waste rock along with dry tails and compaction to ensure structural integrity. Several tests on material placed in the TSF meet or exceed the level of compaction required by the design. The stored tails are monitored for vibration and movement on a continuous basis per design requirements.
|
18.5 WATER MANAGEMENT
Fresh water is pumped from the Jicaro river to the raw water tank on top of the hill overlooking the process plant and tailings storage facility. The raw water tank has two separate discharge lines that flow by gravity to the process facility. One line, located about 1.5m above the bottom of the tank, supplies all fresh water required to operate the mill. The second line, located at the bottom of the tank, is dedicated to fire water service. The two lines are at different elevations in the tank to maximize the volume of water available to fight fires.
Rainfall that comes in contact with the process facility or tailings storage facility cannot be discharged directly to the Jicaro River without being treated. Several diversion channels have been constructed around the process area the tailings facility to divert as much rainfall as possible around the process area and directly to the Jicaro River. The rain that cannot be diverted is collected in the contact water pond located northwest of the process facility. This water is used as make-up water in the mill in place of fresh water to minimize site fresh-water consumption.
The site has no potable water treatment facility on site so bottled water is used to meet all potable water requirements.
|
19.0 MARKET STUDIES AND CONTRACTS (ITEM 19)
19.1 MARKETS
The San Albino operation ships doré bars containing gold and silver to Asahi Refining in Salt Lake City for final refinement. The company sells the gold and silver at the daily market spot price on the day of shipment.
19.2 CONTRACTS
The San Albino property has a number of contracts for the supply of products and services. These contracts are for varying time frames and are awarded through a bidding process to ensure favorable contract terms for the mine. A list of the contracts the mine is working under currently is shown in Table 19.1. The contracts are all within the Nicaraguan industry norms.
Table 19-1 Active Contracts
| Product | Supplier |
| Earth movement | Roberto Jose Quiñones |
| Drilling and boring | Explotec Nicaragua |
| Reverse circulation drilling | Kluane |
| Diamond drilling and reverse circulation contract | Continetal Drilling |
| Construction of new reagents warehouse | Construcciones Medina |
| Diesel fuel transportation for process plant | Roberto Jose Quiñones |
| Supply of activated carbon | KANINS |
| Physical security services contract | C & B Security |
| Precious metals trading | StoneX Group Inc. |
| Refining agreement | Asahi Refining USA, Inc. |
| Permanent tax advisory services | Price Waterhouse Corp. |
| Corrosion inhibitor | Ecoquimica |
| Sandblasting, painting, de-installation and re- installation of gratings - process area | Sergio Marin Vasquez Real |
| Contract for the construction of a new reagents warehouse-Detox | Juan Luis Medina Ruiz |
| Camp N° 1 (Exploration) | Donald José Larios Quezada |
|
| Product | Supplier |
| Jicaro Community Clinic | Amelia del Carmen Mejía Alvarez |
| Geology staff camp | Glenda Suyapa Marín Martínez |
| Warehouse N° 4 (Nuclei Warehouse) | Allan Jafet Salinas Aguilar |
| Parking of vehicles, machinery and equipment | José Ramón Hernández Aguilera |
| Camp N° 2 (Casa Blanca) office and rooms | Donald José Larios Quezada |
| Camp N° 3 (Rooms For Company Personnel) | Carmen Patricia Hernández Marín |
| Electric generator plant for supplying camp N°2 | Marcos Tulio Aguilar Bustamante |
| Contract Modulo 4J, 4I and 4 A and B, offices Managua | Invenio, Sociedad Anónima (Gilda del Carmen Jerez Arguello) |
|
20.0 ENVIRONMENTAL STUDIES, PERMITTING AND SOCIAL OR COMMUNITY IMPACT (ITEM 20)
20.1 ENVIRONMENTAL STUDIES AND KNOWN ENVIRONMENTAL ISSUES
Information for this section was sourced from two project permitting documents, the Environmental Impact Statement prepared and submitted in 2016 for construction and operation of the San Albino mine (Nicoz Resources, 2016), and the Environmental Impact Statement prepared and submitted in 2023 for development and mining of the Las Conchitas deposit (Nicoz Resources, 2023).
20.1.1 CLIMATE
Climate studies were based on data from the Ocotal climatic station belonging to the meteorological network of the Nicaraguan Institute of Territorial Studies (INETER), which is located 27.5 km southwest of the western limit of the Jícaro basin.
20.1.1.1 PRECIPITATION
Mean annual precipitation in the period 1971 to 2000 varies between 1440.3 mm in the Jalapa zone and 822mm at the Ocotal station. The average precipitation at the El Jícaro station reaches 1,240 mm. The months of January to April and November to December are the ones with the lowest precipitation for all stations in Nueva Segovia, while the months with the highest precipitation occur from May to October. There are two well- defined climatic seasons. The first is the rainy season that begins in May and ends in October, where the average monthly rainfall exceeds 70 mm. The second is the dry season, where the sporadic rainfall may occur, but in general, there is no rain during this period, or only occasionally. Precipitation increases from May to June, in July and part of August there is a reduction. Subsequently, from August to October, there is a gradual increase in this variable. The maximum monthly rainfall occurs during October.
20.1.1.2 TEMPERATURE
The average annual temperature of the Ocotal station is 24.60° C. The maximum temperature occurs in the month of April with an average of 26.83° C, which coincides with the last month of the dry period and the beginning of the rainy season. The average temperature gradually increases from January until it reaches its peak in April, and progressively decreases until December.
|
20.1.1.3 EVAPOTRANSPIRATION
Potential evapotranspiration (ETP) was calculated through the Hargreaves method, using temperature data from the Ocotal station with a 15-year data series. The annual potential evapotranspiration was calculated at 2118.11 mm. Evapotranspiration increases from January to April, then it begins to descend progressively until December, whose value is the minimum of the year.
20.1.2 SOILS
The edaphic characterization of the area of the project area was carried out through the primary and secondary collection of information. Field sampling was carried out through the collection of surface samples at a depth of 20 and 40 cm, with the use of an auger. The ranges of values obtained for the pH of the sampled soil range from 5.4 to 6.9. The predominant texture of the soils studied was clay-sandy loam. By criteria of the USDA texture triangle classification of soil textures, the average for the project on 22-21-55, which classifies the soil as a medium soil type, between clay and sandy, with medium fertility, an average capacity for erosion, an average capacity for water infiltration, and an average capacity for mineralization of organic matter.
20.1.3 HYDROLOGY
Nicoz Resources has carried out hydrological studies covering the project area. The area under study has an area of 605.34 km2, with a perimeter of 158.81 km. Its centroid is located at UTM coordinates WGS 84 589105E and 1527455N. The surface water harvesting site used for the project is located at UTM coordinates WGS 84 597897E and 1513620N, and rises above sea level to 496 m. This is a surface intake on the El Jícaro River, in the lower part of the study area.
The compactness coefficient or Gravelius index calculated for the study area is 1.82, which classifies the basin as rectangular to highly lobed. The area under study tends not to concentrate large volumes of water at its exutory point.
The drainage density of the study area was estimated to be 1.36 km/km2. A low drainage density reflects a poorly drained basin with a very slow hydrologic response.
The study area is dominated by slopes classified as steep (30 - 60%), extending over an approximate area of 252.10 km2, equivalent to 41.65 % of the total area under study. Slopes between 15% and 30% (undulating) occupy 29.66% of the total area under study, occupying approximately 179.51 km2. Slopes classified as moderately undulating (5 - 15%) and flat to nearly flat account for 18.64% and 9.28% respectively. Very steep slopes (> 60%) occupy an area equal to 4.75 km2, equivalent to less than 1% (0.79%). The maximum slopes are located to the northwest of the centroid of the area under study, on the Dipilto and Jalapa mountain ranges, on the border between the Republic of Nicaragua and Honduras. The concentration time of the study area using the Giandotti method was estimated 592.45 minutes. The lag time of the study area is estimated at 355.47 minutes.
|
In May, potential evapotranspiration is higher than actual evapotranspiration (ETR), creating a water deficit. In contrast, in the month of June the precipitation is greater than the ETR, which causes the storage of water in the soil, infiltration to groundwater, and subsurface runoff. During the months of July and August, precipitation is lower than potential evapotranspiration, resulting in the use of the water reserve in the soil. From September to October, precipitation is again greater than actual evapotranspiration and there is water storage in the soil and production of water surpluses. From November to December, the actual evapotranspiration is greater than precipitation, so the consumption or use of the water reserve in the soil occurs. Once the water reserve in the soil has been exhausted, from January until June there is a water deficit.
20.1.4 PHYSIOGRAPHY
The project is located in the Central-North Physiographic Province, southeast of the Dipilito Cordillera and west of the Isabelia Mountain Range. The topographic elevations of this province vary from 200 to 1500 m.a.s.l.. Locally, the relief is characterized by a set of denudational hills and hills, gently undulating hills of low to medium height (500-100 m.a.s.l.) with moderate slopes and dendritic drainage dissections.
20.1.5 SEISMICITY
According to seismic zoning (Nicaraguan National Construction Regulations, 2007), the San Albino project is located in the central strip of the country, corresponding to seismic zone B, which has a seismic acceleration a0 of 0.2, limited to the west to the Pacific coast by seismic zone C with a value of a0 equivalent to 0.3; while the strip located to the east of the Caribbean coast called seismic zone A has an a0 value of 0.1. The occurrence of intermediate earthquakes, with depths between 30 and 100 km, are spatially distributed in the subduction zone, showing greater seismicity in the Central and Northwest part.
20.1.6 VEGETATION
A flora census and forest inventory was conducted. Terms and definitions of the World Forest Resources Assessment (ERA) 2005 (FAO 2005) were used to classify ecosystems.
20.1.6.1 ECOSYSTEM CLASSIFICATION
The zones found within the area of the project area are: Other Silvopastoral Agroforestry Lands 69.21 %, this use covers the highest percentage of area, followed by Secondary Thin Broadleaf Forests with 28.46 % and with a minimum percentage of Natural Tree and Shrub Lands (Tacotales) with 15.02 %.
|
Silvopastoral agroforestry lands are highly anthropized due to use for agriculture and livestock grazing. Despite the deterioration, it preserves a moderately diverse flora, presenting 12 registered species with average diameters of 22.6 and height of 8.5. Among the most representative species are Jiñocuabo (Bursera simarouba) and the royal lemon (Citrus limón)
Lands with trees and shrubs are the second most diverse ecosystem and are mostly distributed in areas bordering sparse secondary forests and in small fragments of areas abandoned after some agricultural or other subsistence use. This ecosystem is of moderate tree richness with only 5 species present, dominated by Jiñocuabo (Bursera simarouba) and Nancite (Byrsonima crassifolia).
The sparse secondary forest is the least diverse of the ecosystems, the tree population has 5 species recorded, the most abundant and representative species is Nancite (Byrsonima crassifolia).
In the project area, a total of 22 tree species with a diameter ≥10 cm of DAP 1.30 m were found, grouped into 15 botanical families. The seven predominant species are, in descending order: Nancite (Byrsonima crassifolia); Lizard (Zanthoxylum belicense); Royal Lemon (Citrus lemon); Palo de Piedra (Homalium trichostemon); Black Guanacaste (Enterolobium cyclocarpum); Guácimo ternera (Guazuma ulmifolia); and Jagua (Genipa americana, L.).
20.1.6.2 CONSERVATION STATUS, PROTECTED AND THREATENED FLORA
Conservation statuses were defined by reviewing the updated lists of the Convention on International Trade in Endangered Species of Wild Flora and Fauna "CITES" and the list of prohibited species according to Law 585. None of the species existing in the study area are on the list of these conservation and protection instruments. Two species in the project area are registered as IUCN Protected Species: Zanthoxylum belicense in danger of extinction; and Carica papaya with decreasing conservation status DD.
20.1.7 FAUNA
20.1.7.1 REPTILES AND AMPHIBIANS
Fauna census shows that in the project area the reptile and amphibian group is represented by: 8 families, 9 genera, and 9 species. The most abundant species observed is Aspidoscelis deppii (lizard), followed by Sceloporus squamosus (pichete) and Bufo valliceps. The species Ctenosaura similis, Boa constrictor, is present and enjoys national protection through the National Partial Closure system, (VPN- Ministerial Resolution No. 12-2021). The species of Boa is also found in Appendix II of CITES. The species is strongly threatened, although it is not yet in danger of extinction, therefore, its use and breeding in captivity must follow all the guidelines established in national environmental regulations.
|
Of the 8 species identified, 5 are in Mild Threatened Status (LC) and two are not assessed (NE) by IUCN.
20.1.7.2 MAMMALS
Mammals in the project area comprise: 10 species, 10 genera grouped into 9 families. The species Sciurus griseus and Mus musculus were the most abundant, followed by the species Didelphis virginiana.
According to the registry of species in the area, Sphiggurus mexicanus was found, which is currently in Appendix III of CITES, this means that the species is not in danger of extinction, but could be depending on the measures taken or not for its protection. This species is very prone to death from being run over on roads and highways. The species, Dasypus novemcinctus, is under a partial national ban (NPV) due to pressure from poaching for human consumption.
Of the species recorded, 7 are in the latest edition of the IUCN Red List 2019, version 30, with Mild Threat (LC) status and the species Mus musculus, which is not yet assessed (NE) by the IUCN.
20.1.7.3 BIRDS
The flying fauna is the most diverse group in the project area in terms of number of species and individuals. Taxonomically they are grouped as follows: 12 families, 14 genera, and 14 species. The species of Coragyps atratus is the most abundant, followed by the zanate (Quiscalus nicaraguensis), followed by the species Common Guis (Pitangus sulphuratus.
From the group of birds, 4 species are listed in conservation status Indefinite National Ban (VNI) (Sarcoramphus papa, Brotogeris jugularis, Accipiter superciliosus, Quiscalus nicaraguensis) according to Ministerial Resolution No. 12-2021. The species Brotogeris jugularis, Accipiter superciliosus are listed in Appendix II of CITES, this includes species that are not endangered (threatened) but are at risk of becoming so if their trade is not controlled. The zanate (Quiscalus mexicanus), despite being a fairly common species in the different mostly open ecosystems throughout the national territory, enjoys national protection status under Ministerial Resolution No. 12-2021, this means that the habitat of this bird species must be protected and safeguarded, because its habitat is strongly threatened by different types of anthropic pressures, mainly due to the change in land use caused by different productive purposes.
20.1.7.4 CONSERVATION STATUS, PROTECTED AND THREATENED FAUNA
Of the total number of species present in the project area, 4 are in Appendix II and III of CITES. These species have commercial value, but their commercialization is restricted, although they are not in danger of extinction.
|
20.1.8 SUMMARY STATEMENT ON ENVIRONMENTAL ISSUES THAT COULD MATERIALLY IMPACT DEVELOPMENT OF MINERAL RESOURCES
No environmental issues were identified that would impact Mako's ability to develop the Mineral Resources at the San Albino Project. Mako has obtained all necessary permits to construct and operate the San Albino mine and has been mining
since 2021.
The project area is located distant from the Serranía Dipilto Jalapa Nature Reserve (17 km) and the Cerro Kilambe Nature Reserve (38 km). The project activities will not cause any impact on the protected areas.
The San Albino mine operating plan includes appropriate mitigation to allow for development in accordance with Nicaraguan environmental laws.
20.2 WASTE AND TAILINGS DISPOSAL, SITE MONITORING, WATER MANAGEMENT, ENVIRONMENTAL MANAGEMENT PLANS
20.2.1 TAILINGS STORAGE FACILITY
The tailings are deposited in a dry stack tailing storage facility ("TSF"). Prior to transport to the tailings storage facility a filter press removes 80% of the moisture from the process tailings. The dry material produced by the filter press is transported and deposited in the TSF, which is underlain by an impermeable membrane over which a drainage system was constructed. The drainage system of the tailings dam has the function of collecting the infiltration and runoff water in the tailings. The system is composed of a network of HDPE pipes (perforated and non-perforated) distributed under the stored tailings and a drainage blanket consisting of gravel and a geomembrane protection material in addition to a geocomposite to optimize drainage to the piping system. The main drainage system consists of 8" diameter pipes and the secondary network consists of 6" diameter pipes in addition to the geocomposite (SiteDrain). Solutions collected are contained within the process flow circuit.
To prevent contamination of surface water that could then infiltrate to groundwater, all surface storm flows around the TSF are captured through drainage channels around the perimeter of the area, the channels include water velocity dissipators and filters that mitigate any current force and corresponding sediment drag. A trapezoidal cross-section interceptor channel captures the waters flowing towards the tailings storage facility, preventing this water from flowing into the tailings.
|
20.2.2 WASTE ROCK PILES
Waste rock is stored in unlined rock piles adjacent to the open pit. Drainage channels were built to intercept runoff water and lead it to natural drains, thus preventing the contact of surface waters with the pit and rock piles, mitigating the environmental impact on groundwater. Drainage basins that capture the diverted runoff are lined with geotextile with soil or gravel to minimize groundwater infiltration and erosion. The physical sizing of the basins provide sufficient capacity to allow the adequate drainage of runoff water, minimizing the impact on the water resource.
20.2.3 SURFACE WATER MANAGEMENT
The surface water management plan addresses two types of water inputs: those of direct contribution, being the runoffs concentrated within the pit and waste rock dumps; and those of indirect contribution, the waters generated by runoff in the natural basins surrounding the site that have discharge at some point along the project constructions.
For the determination of the input flow values, the areas with the highest input, both direct and indirect recharge, were selected. The effluent points where more than two tributary areas converge were determined to define the most critical flow values and to size the hydraulic sections based on the most unfavorable situation. The worst-case flow was calculated both inside and outside the site, resulting in a design flow value of 5.92 m3/s and a maximum calculated design value for indirect recharge basins of 0.704 m3/s. Industry standard surface water and erosion measured are used, and are based on the designed flow criteria. Control features include:
/ Diversion canals comprising profiled triangular section ditches, lined with backfill material and compacted by mechanical means.
/ Safety ditches.
/ Perimeter drains and lateral drains.
/ Energy dissipators in flow zones constructed of concrete, wood, or gabion structures,
20.2.4 GROUND WATER MANAGEMENT
20.2.4.1 PROCESS PLANT
Drainage diversion canals are built around the site of operations and processing, preventing surface runoff from site mixing with mine water or process wastewater. The mining plant has a wastewater containment system, which prevents infiltration of contaminated water into the groundwater by recycling any fugitive water back into the process flow stream. Containment structures secondary to the site occupied by the cyanide leach tanks were constructed consisting of a concrete floor at the base of the leach tanks, with a slope oriented towards a repumping pit to return solutions to the process flow. All fuel storage areas are waterproofed and tank areas have protective containment basins.
|
20.2.4.2 TAILINGS STORAGE FACILITY
The base of the tailings storage facility is an impermeable liner. Drainage diversion canals are built around the TSF area to divert surface runoff that could eventually infiltrate groundwater. The diverted water is prevented from contact with tailings. A trapezoidal cross-section interceptor channel captures the waters that flow toward the tailings facility. The interceptor channel includes water speed dissipators and filters that mitigate current force and corresponding sediment dragging.
20.2.4.3 PITS AND WASTE ROCK PILES
Drainage channels were built to intercept runoff water and lead it to natural drains. Drainage weirs are covered with geotextile with soil or gravel to minimize erosion and infiltration into groundwater.
20.2.5 AIR QUALITY MANAGEMENT
The main air quality environmental impacts caused by the project are linked to exhaust, dust, and noise emissions during construction and operation. Dust is created at all stages of the mining process including clearing of the site, construction of access and circulation roads, extraction, blasting, crushing, grinding and transportation. Despite the best attempts at dust control, there are areas in every mining operation where there are high concentrations of dust. A considerable part of the dust is made up of large particles, with a diameter exceeding 10 microns. This coarse dust usually settles by gravity a few hundred meters from the source. Smaller particle fractions (PM10) can be carried by the wind in dust clouds and can be deposited in or near populated areas.
Emissions of particulate air and gaseous air pollutants related to exhaust from vehicles and machinery include emissions of particulate matter (including PM10 emissions), carbon monoxide, unburned hydrocarbons (volatile organic compounds), and nitrogen oxides and sulfate dioxide resulting from fuel combustion in vehicles, heavy equipment (including crushers and mills), and mining-related generators.
The air quality management plan is designed to mitigate the increase in noise (acoustic impact), dust, and gases generated by the construction, mining, and processing activities the project.
|
20.2.5.1 MEASURES TO COUNTERACT NOISE
The activities of extracting the mineral by means of explosives and its loading and milling are main generators of noise, which, however, as they take place in specific areas, far from population centers and/or sensitive homes, are manageable. The following mitigating measures have been allocated:
/ Safety equipment required to work in the pit areas will be used, such as: ear muffs, headphones, etc.
/ The use of equipment and machinery is restricted, preventing them from moving to unauthorized sectors that may affect the nearest native communities.
/ Noise monitoring is carried out periodically in the work area and surroundings to identify critical points.
/ Mufflers and noise dampening systems are installed on all motorized equipment, including heavy equipment.
/ Audiometry will be performed on personnel.
/ The schedule of activities will be restricted, as far as possible, to the daytime period. The same will be done in the case of vehicular traffic or equipment mobilization.
20.2.5.2 MEASURES TO COUNTERACT PARTICULATE MATTER AND GASES
Particulate and gaseous emissions will be mitigated, or their effects muted, by various means, including:
/ Permanent monitoring of PM10 and 2.5μ particles.
/ In the extraction areas, dumps and ore transfer roads, wetting will be carried out when conditions require it and at the frequencies demanded to control fugitive dust.
/ Personal protective equipment will be utilized.
/ Modern vehicles, equipment and machinery will be used with an optimal degree of regulation of their fuel supply and emission systems to ensure the best combustion, limit combustion gas emissions and avoid the generation of "black smoke".
/ Regular periodic maintenance control tasks will be carried out on machinery and vehicles to prevent the emission of incomplete combustion products and/or noise.
/ Only the soil movement that is strictly necessary will be carried out. Soil movements should be carried out in a planned manner in order to avoid unnecessary movements.
/ Traffic speed will be limited on internal roads, access roads and surrounding populated areas.
/ The burning of waste of all kinds is prohibited.
|
20.2.6 CYANIDE MANAGEMENT PLAN
Industry standard management of cyanide is practiced, with key components of the plan being:
/ Tanks and pipes are identified by painting them in a color that complies with ANSI Z535 (American National Standards Institute: Product Safety Signs and Labels) and labeling them with the name of the flow they conduct.
/ Operating procedures are established that clearly indicate care to be taken with cyanide dosages and pH control at values to ensure that hydrogen cyanide will not be formed.
/ Hydrogen cyanide (or hydrocyanic acid) detectors are installed, and rigorously maintained and calibrated.
/ Containments secondary to the site occupied by the cyanide leach tanks were constructed, consisting of a concrete floor at the base of the leach tanks, with a slope oriented towards a pumping pit to return the possible solution to the process.
/ Emergency plans are in place to control any leaks or spills of cyanide solution or pulp. An emergency kit for spills and an emergency kit for cyanide poisoning is maintained.
/ Eye showers and bath showers are installed, where anyone affected by poisoning can be treated.
/ All installations (tanks, pipes, secondary containment, civil, electrical, mechanical works) have quality tests to ensure their proper functioning.
/ The residues of the cyanide packaging are rinsed and neutralized with sodium hypochlorite, prior to deposit and confinement.
/ All cyanides are stored in hermetically sealed containers.
/ Containers for cyanide are for exclusive use.
/ Plant stockpiles and delivery areas that are located within storage areas are designed to contain 110 percent of the tank contents in the event of a spill or tank failure.
/ In process areas where cyanide is used, the antidote Amyl Nitrite is available.
/ The storage areas for cyanide are labeled with warning signs including first aid instructions, have access restricted to only authorized personne, are equipped with inert dust extinguishers, and are kept in perfect order and cleanliness.
/ Only properly trained and authorized personnel use and handle cyanide and they are instructed of the risk to which they are exposed and the precautionary measures to be taken.
|
20.2.7 SOLID WASTE MANAGEMENT
20.2.7.1 HAZARDOUS WASTES
These are wastes that, due to their physical, chemical and/or toxicological characteristics, represent a risk of immediate and/or potential harm to human health and the environment. Hazardous waste includes: containers of hazardous substances (lubricants, oils, solvents), batteries, greases, used oils and lubricants, absorbent cloths and rags contaminated with liquids with hazardous characteristics, contaminated soil, oil filters, and aerosols.
Sodium cyanide is packaged in polypropylene maxi bags, which are covered with an outer polyethylene bag, to prevent the action of ambient humidity, the escape of dust, and accidental contact with water. All this set is inside a laminated wood box. Only the material that has been in contact with sodium cyanide is classified as hazardous waste.
Key practices of the hazardous waste management plan include:
/ All hazardous materials (fuels, oils, among others) will be stored in properly identified places and respecting the indications of their Safety Data Sheets ("SDS").
/ Storage and handling of hazardous materials will be carried out in accordance with local regulations for each material.
/ Storage places will have fire prevention and containment systems.
/ The places of storage and handling of hazardous materials must have the respective SDS available in printed, legible Spanish language versions.
/ Personnel in charge of storing and handling hazardous materials will receive specific training on health and safety issues on each hazardous material, including the personal protective equipment required in accordance with the SDS and risk analysis.
/ All hazardous materials containers and containers shall be properly marked and labeled according to international standards, including the NFPA diamond.
/ Disposal of cyanide packaging must comply with applicable legislation, and the following practices:
» Each container, once emptied, must be carefully checked, inspecting the interior to ensure that it is empty.
» The polyethylene bag must be separated from the polypropylene bag.
» The residues of the cyanide packaging will be rinsed and neutralized with sodium hypochlorite, prior to its deposit and confinement.
|
» Bags must be rinsed with clean water (not process) and the resulting water must be introduced into the metallurgical process.
» Clean and detoxified bags may be to an appropriate recycling center or detoxified bags may be deposited in the tailings.
20.2.7.2 NON HAZARDOUS WASTE
Non hazardous waste includes wastes generated in different production activities. This waste can be rags, scrap metal, electrical cables, plastics, cement, wood, cardboard, and any materials that have not had any contact with hazardous substances. It also includes the waste that is generated as a result of daily camp and personnel support activities. This waste can be food scraps, plastics, paper, cardboard, cans, glass, and packaging of consumer products in general (food, personal hygiene). Within these, biodegradable waste (food scraps, paper and cardboard) that can be disposed of in cells or micro-landfills or incinerated are distinguished.
Colored containers will be installed in accordance with environmental regulations, which must be labeled with their coding or name of the waste to encourage recycling. Such containers shall be made of plastic and airtight. Solid waste management will be carried out taking into account the type and volume of waste generated and conforming to the existing legal framework related to solid waste management. including:
/ Decree 45-2005, National Policy on Integrated Solid Waste Management (2005-2023).
/ Technical Standards NTON 05 014-01 (Environmental Technical Standard for the Management, Treatment and Final Disposal of Non-Hazardous Solid Waste).
/ NTON 05 015-01 (Nicaraguan Mandatory Technical Standard for the Management and Disposal of Hazardous Solid Waste).
20.2.8 SITE MONITORING
Nicoz has developed an Environmental Monitoring Plan that complies with national legislation that requires its execution and reporting to the competent environmental authorities, the Ministry of Energy and Mines (MEM) and the Ministry of Environment and Natural Resources (MARENA). The objective of the monitoring program is to provide information that demonstrates that the potential impacts, and management measures and related programs, comply with acceptable standards and limits and therefore are not generating adverse effects on the surrounding environment. The San Albino project's monitoring plan complies with Nicaraguan environmental regulations including:
/ Surface Water Quality Monitoring, Nicaragua Standards, Monitoring of the quality of the industrial effluent, resulting from the processing process, in accordance with Decree 33-95 "Provisions for the control of pollution from the discharges of industrial, domestic and industrial waters.
/ Soil Monitoring, Nicaragua Standards.
|
/ Monitoring of air quality and gaseous emissions. NTON Environmental Technical Standard for Air Quality.
/ Environmental Noise Monitoring, Nicaragua Standards.
Monitoring is ongoing during the period of active operation and will continue after project closure in accordance with a comprehensive strategy which will be agreed upon with the authorities of MARENA, MEM and the Municipal Environmental Unit. The closure activities for the operation stage will apply within the definition of abandonment or partial closure, in accordance with Law 387, Special Law on Mining Exploration and Exploitation.
20.3 PERMITTING
Mineral exploration and exploitation in Nicaragua must comply with national and local regulations. The San Albino project is governed by the following:
1. Political Constitution of Nicaragua
2. Law 641 "Code of Criminal Procedure"
3. Law 185 "Labor Code"
4. Law 217 "General Law of the Environment and Natural Resources and its Reform Law 647
5. Law 40 and Law 261 "Law of Municipalities of Nicaragua" and its Reform
6. Law 387 "Special Law on Exploration and Exploitation of Mines" and its Regulations
7. Law 620 "General Law of National Waters"
8. Law 475 "Law of Citizen Participation"
9. Law 618 "General Law on Occupational Health and Safety"
10. Decree 33-95 "Provisions for the discharge of domestic, industrial and agricultural wastewater"
11. Decree 76-2006 "Environmental Assessment System"
12. Decree 39-2011 "Regulation of the Hydrocarbons Supply Law"
The San Albino project has received all local and Federal permits needed to explore, construct, mine, and process the San Albino deposit, and the mine has been operating in compliance with the permit conditions since 2021. The key permits authorized include:
/ Administrative Resolution No. DGCA-P0040-1111-030-2012, (San Albino-Murra Geological Exploration) and a subsequent modification and expansion of permitted activities granted on April 28, 2021 that allows the company to conduct exploration work including diamond drilling, trenching, soil sampling and geological mapping.
/ Administrative Resolution DGCA/P0030/0615/007/2017 which authorizes the development, construction, and operation of up to a 500 tonnes per day operation at the San Albino gold deposit.
|
/ Administrative Resolution DGCA-180620-P0267-1 which amended the environmental permit granted in 2017 to allow for the processing of up to 1,000 tpd at the San Albino gold project. The amendment is initially effective for a period of five years and can be renewed indefinitely so long as the Company complies with the conditions set forth by MARENA. All other provisions contained in the environmental permit granted in 2017 remain in force and are fully applicable apart from the increased throughput from 500tpd to 1,000tpd. Processing of any material sourced from the Las Conchitas deposit can be done at the existing operating San Albino plant under the terms of the current permit.
/ Administrative Resolution DGCA-P0028-0812-023-2013, (Geological Exploration El Jicaro) authorizes drilling of 331 diamond drillholes or 100,000m and 400 trenches with dimensions of 50m to 70m long, 2m deep and 1m wide and is valid until May 20, 2026.
/ Administrative Resolution DGCA-270521-P1536/036/2021, (Geological Exploration La Segoviana) The permit is valid until 2031 and is renewable for up to an additional 20 years. The permit authorizes drilling to 1,100,000m as follows: 500,000m of diamond drilling; 300,000m of reverse circulation drilling; and 300,000m of blast hole drilling. The Company is also permitted to carry out up to 32,500m of trenching.
/ Administrative Resolution DGCA-270521-P1536/036/2021, (Geological Exploration La Segoviana), authorizing exploration of the La Segoviana concession.
/ Administrative Resolution DGCA-260221-P1177/-25/2021, (Geological Exploration Potrerillos). The permit is valid until 2031 and is renewable for up to an additional 20 years. It authorizes drilling up to 800,000m as follows: 250,000m of diamond drilling; 250,000m of reverse circulation drilling; and 300,000m of blast hole drilling. The Company is also permitted to carry out up to 12,000m of trenching.
Mining of deposits at Las Conchitas will require approval of a new EIS. On June 28, 2023 MARENA issued to Nicoz a Letter of No Objection MEM-VM-EMC-004-06-2023 which comprises the environmental permit necessary for bulk sample mining of the Las Conchitas deposit(s) and forms the legal basis under which the Ministry of Energy and Mines and the National Police allow the use of industry standard blasting methods for the bulk mining. Appropriate notice of use of blasting agents was made to both agencies on 16 August 2023. This bulk sampling is ongoing while the EIS for large-scale mining of deposits at Las Conchitas is under review. The Las Conchitas EIS was received by MARENA on 11 July 2023. The Municipality of El Jicaro has authorized Nicoz to temporarily close municipal roads and to create alternate access roads as required for exploitation of deposits at Las Conchitas.
The Ministry of the Environment has not required posting of reclamation bonds.
|
20.4 SOCIAL AND COMMUNITY IMPACT
20.4.1 BACKGROUND
The area of direct influence of the project is within the municipal limits of El Jícaro, in Region I, Nueva Segovia. The municipality is bordered: to the north, by the municipality of Jalapa; to the south, by the municipality of Quilalí and the municipalities of San Juan de Río Coco and Telpaneca in the Department of Madriz; to the east, with the municipality of Murra; and to the west, with the municipalities of Ciudad Antigua and San Fernando. The Territorial Extension of the Municipality of El Jícaro is 428.78 km2 and it is the third largest Municipality in Nueva Segovia.
20.4.2 POPULATION AND DEMOGRAPHICS
The municipality of El Jícaro has a population of 31,739 inhabitants distributed in six neighborhoods and 73 communities in 12 districts. The urban population of the municipality of El Jícaro is 9,343 equivalent to 29.44% and the rural population is 22,396 equivalent to 70.56% inhabitants. Population density is 74 inhabitants per km2. Approximately 51% of the population is male, 49% is female. Approximately 42% pf the population is under 15 years old.
20.4.3 INFRASTRUCTURE AND PUBLIC SERVICES
20.4.3.1 EDUCATION
There are 64 primary schools and 2 secondary schools, in the urban and rural areas. In the urban area there are 2 primary schools and a secondary school. In rural areas, 62 primary schools and one secondary school.
20.4.3.2 HEALTH
The Nicaraguan Ministry of Health, MINSA, provides health care services at the primary hospitalization level and clinical care level in the communities, at the El Jícaro Health Center or the Ocotal Hospital,
20.4.3.3 ELECTRICAL POWER
Grid sourced electric service exists only in the communities that are close to the urban areas, the rest of the communities use gas-based lighting, candles, lamps, and to a lesser extent solar panels.
20.4.3.4 TELECOMMUNICATIONS
In the El Jicaro Municipality there are 314 home telephone connections, of which 305 correspond to the urban area of El Jícaro and 9 home connections in Susucayán. The Municipal Mayor's Office has a tele-fax. Claro and Movistar compete in the communications market and provide cellular service in portions of the project area. It is estimated that the two companies have more than 19,530 cell phone customers in the municipality.
|
20.4.3.5 SANITARY DRINKING WATER
Currently the El Jicaro municipality has good drinking water service.
20.4.3.6 ROADS
The municipality of El Jícaro has a road network of approximately 107 km of intra-community road length that connects neighboring municipalities, 30% of which is flexible pavement (cobblestone), and the remaining 70% is macadam. The tertiary road network of 130 km have been substantially renewed in recent years, including the roads that link the communities throughout the municipality
20.4.4 COMMUNITY AND GOVERNMENT
Communities in the project area have social similarities. Each community is divided into sectors that have mostly dispersed housing. Most homes are built of wood, bricks, and tile. Homes are basic and have a kitchen, living room and sleeping rooms. Hammocks are visible in many houses. Most of the houses have a latrine and some have plumbed bathrooms.
Domestic water comes from private wells, streams, springs, and shallow wells dug on the banks of the river. Some families chlorinate at the individual level.
Food preparation is carried out on traditional wood stoves that generate heavy consumption of firewood. Homes do not have fireplaces. Firewood is collected from family farms and in the case of those who do not have it, it is extracted from neighboring farms. The diet of these communities, although very limited, is based on basic grains such as corn, rice and beans. On some occasions they supplement with protein using the domestic animals they raise such as chickens, ducks, pigs.
The communities have access roads which are in poor condition. Some communities during the wet season are cut off by flooding and deterioration of the roads. The main means of transport are horses, motorcycles, bicycles, and walking. There is no public transportation.
Older established families typically have 3 or more children, however, the new generations are made up of an average of 1 to 2 children per household. The communities have a high level of overcrowding, 2 to 3 families per house. Most couples live together in a common-law union. It is common in all communities to have the majority of inhabitants having some type of extended family kinship. People are quite hospitable and very open to conversation. The clothing used is that of a farmer or a housewife, however, they have some special clothing for when they go out to the village, another community or some activity. Although public spaces are limited, the main sports they play are soccer and baseball. The most common religions are: Catholic, Adventist, Evangelical, the predominant being Catholic.
|
At the community level governance is by an institutional political system implemented by the local political leader, who is the most influential.
Federal Government institutions present in the municipality include: MINED (Ministry of Education) with responsibility for primary and secondary education; MINSA, the provider of health care services at the level of primary hospitalization and clinical care in the smaller communities; the National Police in charge of citizen security with emphasis on maintaining public order; the Local Court, in which the cases brought forth by local prosecutorial authorities are adjudicated; Municipal Office of Identification (Supreme Electoral Council) responsible for providing citizen identification; ENACAL, the government entity that provides potable water service in urban areas; INSS, the Federal Social Security agency.
Other institutions serving the community are; MIA FAMILIA, a social services agency assisting families; and COOPERATIVA SANTIAGO and FUNDENUSE, microfinance institutions and cooperatives that provide credit services in support of small and medium-sized industry, as well as consulting services.
20.4.5 ECONOMIC ACTIVITY, INCOME, MARGINALIZATION
20.4.5.1 ECONOMIC ACTIVITY
The main sources of employment in the El Jicaro Municipio are traditional family farming, occasional agricultural labor, and employment for mining exploration activities or artisanal mining.
It is traditional for parents to inculcate in children and young people to work from a very early age.
The man fulfills the role of family production and of bringing money home; while the woman is in charge of domestic chores and the care of the family. In some cases, the woman migrates abroad and is responsible for sending the money home, although more typically it is the man who emigrates and repatriates funds.
Agriculture is subsistence level, the main items are corn and beans. The production cycles are May to July and August to September, depending on the crop. The crops are destined for self-consumption and on a very small scale for sale. Those who manage to market do so locally or in grocery stores located in the urban area or in the market of Jalapa, Ocotal, Murra and El Jícaro.
|
Some families have cows for their own consumption, however, there are landowners, who generally do not live in the community, who develop dual-purpose cattle farming for commercial purposes.
Artisanal and small-scale mining activity is high.
Some landowners associate with other producers and excavate to extract brush that is sold in Chinandega and León.
The Nicaraguan Institute of Territorial Studies, through the territorial planning project, legalized all properties. However, there are currently many families that do not have legal documentation since the tradition is that parents name their children as heirs verbally and property rights are not legally transferred after the father dies until there is common agreement between the heirs.
The economic well being of the inhabitants of the communities of El Jobo, San Pablo, San Albino, Las Conchitas and El Jícaro rests mostly on a single member of the family, although in some two people work. Typically the head of the household works outside the home, and is a male figure, whereas the woman performs other functions from the home.
20.4.5.2 INCOME AND MARGINALIZATION
According to the Unmet Needs method applied in the preparation of the Municipal Extreme Poverty Map, based on the measurement of 5 indices for the classification of households in some situation of poverty (overcrowding, inadequate housing, insufficient services, low education, and economic dependence), the urban areas of the Municipality have an average poverty rate of 59%. Rural poverty continues to be more extensive and deeper than urban poverty, with average poverty rate of 88%.
20.4.6 SOCIAL MANAGEMENT SYSTEM, MITIGATION OF NEGATIVE IMPACTS, COMMUNITY AGREEMENTS
20.4.6.1 SOCIAL MANAGEMENT
The company has a Community Relations Action Plan that addresses programs for mitigating and managing social impacts related to the project. Each measure is aimed at managing and strengthening communication channels with the community and key stakeholders, providing information about the positive impacts of the project.
Respect for and non-impairment of the rights of communities located within the influence area and the municipality are guaranteed. This includes the right to control and use land, clean water, a safe environment, and a secure way of life, as well as fair compensation in case of losses or impacts to private property.
|
The San Albino project helps stimulate the economy in the municipality through the mining value chain, generating income for small and medium-sized companies and contractors that provide goods and services. Additionally, social projects are carried out in the communities, fostering synergy with residents and their municipal governments.
In this context, the company has a Sustainability Strategy throughout the project lifecycle, based on three main pillars: ensuring the safety and well-being of employees, protecting the environment, and contributing to the development of the communities where it operates. The company endeavors to practice good community relations, promoting and strengthening acceptance, transparency, and trust between the population and Nicoz Resources, helping the development of exploitation operations.
20.4.6.2 GENERAL GUIDELINES OF THE COMMUNITY RELATIONS PLAN
The objective of the community relations plan is to contribute to long-term regional development, hand in hand with the community and local authorities, promoting sustainable community investment programs in education, health, culture, sports, local organization, and others. Community engagement is created by:
/ House to House Visits (presentation on the exploration activity). Communication and consultation with the population allows the implementation of processes that help to manage the company's activities and operations in the area in a socially appropriate manner, through an efficient and transparent relationship with the stakeholders and local population present in the areas of influence of the project.
/ Visits to Property Owners. Before and during the execution of project-related activities, a process of consultation and permission management will be carried out for access to the area of interest. This process involves visiting each homeowner, explaining in detail the nature of each project activity, addressing any social and environmental concerns that may arise. If the property owner wishes to learn more about the project tasks, a field visit program will be developed to define the negotiation process for buying or selling, as applicable.
/ Temporary Local Employment. For operational tasks, based on the availability of labor, the company will work with individuals from the community or the surrounding area. The search for available personnel will extend radially to cover the available positions. NICOZ RESOURCES S.A ("Nico") will ensure that hiring complies with Labor Code Law 185, Hygiene and Safety Law 618, and includes enrollment in Social Security through the INSS."
20.4.6.3 GUIDELINES FOR COMPENSATION FOR LAND USE
The land where the exploitation activities will be carried out will belong to the company, which is why mechanisms have been established for purchase and sale agreements with the community. This will be defined and negotiated between the communities and Nicoz Resources, avoiding subsequent social conflicts, for which the acquired properties are annexed. Local labor will also be hired to perform operational tasks according to their competencies to execute and supervise the assigned work.
|
20.4.6.4 COMMUNITY AGREEMENTS
The company has maintained a positive collaborative relationship with the communities in which it operates and has received all local community approvals and permits necessary for exploration, development construction, and operation of the San Albino mine.
20.4.6.5 COMMUNITY BENEFITS
Benefits accrued to the community include:
1. Payment of project taxes to the municipality A contribution to the municipality's coffers occurs via payment of taxes. This is a positive effect as generation of income for the municipality contributes effectively and significantly to local development.
2. Generation of jobs at the local level. During the project's lifespan, an estimated average of 378 direct jobs per year is expected. Of the current workforce, 18% are female employees, distributed across management, operational, and administrative positions. The age range of current employees spans from 20 to 50 years, with some older individuals. These positions are being distributed across areas such as Administration, Industrial Safety & Environment, Electromechanical Maintenance, Heavy Equipment Operators, and others. Local hiring that meets the requirements for each operational position has been prioritized and will continue to be prioritized. Additionally, there are over 200 indirect jobs generated from mine-related activities, including rentals, hotels, restaurants, grocery stores, pharmacies, hardware stores, and dining establishments.
3. Provision of firewood to community members. The trees that will be removed in the area of operation will be made available to community members for use as firewood. Villagers will not have to have their own resources for access to firewood, and the felling of trees in other areas will also be avoided.
4. Contracting of community services. Transport services will be contracted for the cuttings/seedlings to be planted in areas to be reforested. These services will be provided by community members. The local mining value chain will be revitalized, directly benefiting the sustainability economy of the community.
5. Strengthen people's capacities in road safety education at the community level. Nicoz Resources will continue to implement road safety education in the community through this project with the purpose of reducing the risk of accidents due to the use of machinery in the locality. Community members reduce their vulnerability by strengthening their knowledge in an adequate road safety education.
|
6. Protection of community water sources. The recharge areas of community water sources will be protected through the remediation plan. Communities reduce their vulnerability to the effects of climate variability.
7. Emergency Transportations. Nicoz Resources will have available a light emergency vehicle to transport community members in case of emergencies. This action is beneficial because it could contribute to the rapid transfer of patients to the hospital in Ocotal.
8. Scholarship Program for Inhabitants Who Wish to Improve Themselves. Nicoz Resources has supported the education of young people with a desire to excel, whether they are intermediate technicians or professional level
9. Road rehabilitation. Improvement of public access near the work area. A safe roadway will be maintained.
10. Sustainable Development Projects Training. Education and assistance and tools to generate new business ventures in the municipality will contribute to socio-economic development.
11. Forest Fire Commission Training. The company will support training that will improve the hygiene and safety of the community.
12. First Aid Commission Training. The company will support first aid training that will improve the safety of the community.
13. Education. The company sponsors the training and education of the school population through formal public education to involve parents in education.
14. Promotion of sport. The company sponsors programs to integrate young people into sport and foment healthy recreation.
15. School beautification. The company sponsors reforestation and embellishment with ornamental plants at community schools.
16. Support in social works. Tripartite work between the community, the company and the institutions with the company providing monetary or material support to social agencies.
17. Training of farmers. The company sponsors training related to crop improvements, technical assistance, and vermiculture to promote best production practices.
18. Succession Plans and Advancement Opportunity for Employees. The company will encourage and support talented workers so that they can prepare themselves in academic terms and aspire to job growth and obtain better economic income.
20.4.7 SUMMARY STATEMENT ON SOCIAL AND COMMUNITY ISSUES THAT COULD MATERIALLY IMPACT DEVELOPMENT OF MINERAL RESOURCES
No social or community issues were identified that would impact Mako's ability to develop the Mineral Resources at the San Albino Project. Mako has obtained all necessary community approvals to construct and operate the San Albino mine and has been mining since 2021.
|
20.5 MINE CLOSURE
It will be necessary to properly close the San Albino mining site. All surface facilities and associated facilities will be dismantled and all extraneous material will be removed. The affected area must be rehabilitated as close as reasonably possible to its original state. This will include re-contouring of the site and subsequent revegetation and reforestation of the area using forest species typical of the area, following the guidelines of the Erosion Control and Revegetation Plan.
20.5.1 CLOSURE PLAN FOR THE MINERAL PROCESSING PLANT
It is important to note that some materials or facilities could potentially be reused by other mining operations, individuals and/or community groups in the Project area. For this reason, it is possible that before carrying out the dismantling tasks, actions are carried out aimed at the transfer or donation of such materials to institutions or communities interested in making use of these materials. However, under no circumstances should these materials include hazards to the recipients.
The closure of the mineral beneficiation plant installed in the community San Albino in the municipality of El Jicaro includes all the technologies that are required to achieve physical security and long-term environmental protection in the vicinity of the project facilities. The range of activities for closure may include from minimal grading to improve surface water diversion and runoff to full grading, hedge placement and revegetation (if applicable).
The Closure Plan covers all decommissioning activities that will be carried out to restore environmentally disturbed or impacted areas, as a way to mitigate negative effects after the end of the project's useful life. It also contemplates an ecological, morphological and biological restoration of the affected biotic and abiotic resources, trying to return them to the characteristics they had before the project began.
The objective of shutting down and dismantling these facilities is to protect the environment from the possible impacts that could occur when the project ceases to operate.
20.5.2 CLOSURE PLAN FOR MINE WASTE AND TAILINGS, SITE MONITORING AND WATER MANAGEMENT
20.5.2.1 MINE CLOSURE - OBLIGATIONS OF THE PROJECT MANAGEMENT
Nicoz must commit six months before closing the project activities, to inform the General Directorate of Mines of the Ministry of Energy and Mines, MARENA and the Municipal Mayor's Office of El Jícaro, in a timely manner, about the closure of operations and its consequences, whether positive or negative. Nicoz must develop a timetable for the implementation of the activities detailed in this plan.
|
20.5.2.2 CONSIDERATIONS FOR PROJECT CLOSURE
/ Physical and chemical nature of solid and liquid waste;
/ Topographical, climatic and hydrogeological conditions of the area;
/ Surface and groundwater conditions;
/ Potential for extreme events such as landslides;
/ Engineering design of industrial buildings; and
/ Required land use after closure activities.
20.5.2.3 ACTIONS WITHIN THE CLOSURE PLAN
/ Orderly dismantling of the various components of the infrastructure, separating those that can be recovered (reused or recyclable) from those that will be submitted to final disposal in the municipal landfill or disposed of in the site destined for the disposal of debris;
/ Dismantled timber structures, when they do not have an economic value, will be chopped up and used as organic matter for soils or left for use by local inhabitants as an energy material. Metal components will be evaluated prior to decision-making. The reusable ones will be marketed to those who show interest in their use and those identified as "scrap" will be marketed with the companies that collect this waste;
/ Once all the facilities have been dismantled, the surface of the land will be subjected to a process of leveling and revegetation with native species. No exotic species will be introduced into the area;
/ Maintenance of slope stability in the storm drainage area; and
/ Recontouring of access roads, which will require that the soil surface must be conditioned with the slope and shape of the natural terrain, avoiding the formation of erosive processes during the final finish.
20.5.2.4 AREA REVEGETATION (IF APPLICABLE)
/ Revegetation will include areas of dismantled buildings for the purpose of stabilizing the surface by vegetation or other means, as soon as practicable, in order to reduce soil erosion caused by wind or water, as well as to reduce environmental liabilities; and
/ The plant component of the topsoil will need the following general specifications:
» Perennials adapted to the local environment;
» Resistance to humidity and extreme temperatures;
» Roots that do not break the barrier against infiltration, if any;
|
» Be able to grow vigorously in nutrient-poor soil with minimal nutrient addition;
» Sufficient plant density to minimize cover erosion; and
» Be able to survive and operate with little to no maintenance.
20.5.2.5 IMPLEMENTATION AND MONITORING OF THE CLOSURE PLAN
The implementation of the closure plan will be the duty of the Environmental Unit of Nicoz, which will execute it in close coordination with the Territorial Delegation of MARENA and the municipality of Jícaro.
20.5.2.6 CLOSURE ASSESSMENT
The purpose is to present an assessment of closure and rehabilitation/recovery activities based on the results of post-closure monitoring programs. The results of the monitoring programs should be compared with the predictions of the performance evaluation. This must be done periodically, so that Nicoz can be absolved from future liability. MARENA will be able to grant absolution of liability once it is shown that a landform is self- sustaining and capable of supporting the desired end use of the land. In such a case, the responsibility for maintenance for the proposer may cease as determined by the environmental authority. The evaluation of the closure plan shall include the following:
/ Physical Stability;
/ Geochemical Stability;
/ Biological Stability; and
/ Social Programs
20.5.2.7 TAILINGS STORAGE FACILITY CLOSURE PLAN
The Closure Plan includes a set of measures that will be applied at the end of the useful life of the tailings structure, in order to restore the area and return as far as possible, as a minimum, the natural characteristics prior to the execution of the Project.
The Tailings Storage Facility Closure Plan will include the development of control and maintenance activities, aimed at providing the dry stacked tailings with adequate conditions for the safety of both the facility itself and people, as well as the protection of the environment. The Tailings Storage Facility Closure Plan is a planning instrument that incorporates measures aimed at restoring the environment, to the extent that technical feasibility allows it, complying with the requirements of current environmental regulations.
For the formulation of this plan, it has been considered that the design of the tailings storage facility must include closure objectives in advance, in order to make the activity sensitive to the environment and avoid
|
extremely high closure costs that negatively influence the overall economics of the San Albino Mine Project and Nicoz.
20.5.2.8 GUIDELINES
Nicoz must submit to MARENA, the municipal mayor's office of El Jícaro and the General Directorate of Mines of the Ministry of Energy and Mines, a Final Closure Plan for review and approval, within eight months after its decision to conclude the activities of disposal of the mining tailings in the facility built for this purpose.
20.5.2.9 OBLIGATIONS
Nicoz. must inform the national, regional and municipal authorities and members of the communities located in the area of influence of the Project in a timely manner about the conclusion of the activities of the "San Albino Mine" Project, which includes the installation and operation of the tailings storage facility. This will also include the orderly dismantling of the Project's facilities, being able to sell them as scrap metal and transfer equipment and premises, complying with the relevant legal provisions.
20.5.2.10 CLOSURE AND ABANDONMENT PLAN PROCEDURE
This plan considers the actions to be carried out after the completion of all mineral exploitation and processing activities. The components subject to closure shall consist of all infrastructure linked to the tailings storage facility, access roads and ancillary structures. Nicoz for the execution of the plan, for which the resources to be used will be personnel, machinery and equipment. The execution time will be that allocated by Nicoz for the dismantling of the work, in accordance with the guidelines of the Environmental Institutions linked to the closure.
20.5.2.11 BUDGET AND ESTIMATED COSTS
Nicoz will allocate annual budget items for the financing of the activities established in the mine closure, which will include all investments, such as direct and indirect expenses, supervision, contingencies and benefits of contractors, as well as complementary costs. Cost estimates will include all those associated with progressive activities (such as revegetation, recontouring, monitoring and supervision, etc.) with an accuracy level of at least +/-20%. The current closure budget as of September 2023 is presented in Table 20-1.
|
Table 20-1 San Albino Mine Closure Program - September 2023
| SAN ALBINO MINE CLOSURE PROGRAM - SEPTEMBER 2023 | |
| Estimated Costs $ | |
| Demolition and Removal of Structures | 397,934.45 |
| Decontamination | 35,736.35 |
| Revegetation & Recontouring | 1,434,695.59 |
| Closure Monitoring | 137,883.23 |
| Sub Total | 2,006,249.62 |
| Contingency (10%) | 200,624.96 |
| Administration (2%) | 40,124.99 |
| T O T A L | 2,247,000 |
20.5.2.12 ACTIVITIES TO BE DEVELOPED
Nicoz will be responsible for the following monitoring, closure and post -closure activities: Inspection of the stability of the slopes, and of the topographically recontoured areas, as well as the rehabilitation areas for closure, in order to assess whether additional activities are required to complete the rehabilitation of these facilities;
/ Physical-chemical sampling of the material deposited in the tailings storage facility;
/ Monitoring of reforestation activities for at least three years;
/ Grazing activities and forest fires will be monitored to ensure that rehabilitated areas are not degraded by overgrazing and fire. Good use of the land by nearby communities and the property owner will ensure that vegetation is successfully established. Otherwise, there is a risk that land could be degraded by actions unrelated to mining-related activities;
/ Inspections to verify the effectiveness of containment facilities and to verify the absence of contamination in soils due to closure activities; and
The development of the project will be under the responsibility of the Environmental Unit of Nicoz.
20.5.2.13 PERIODIC REPORTS
Nicoz will prepare periodic progressive rehabilitation and monitoring reports documenting the progress of the closure and rehabilitation measures to be implemented, as well as the results of the monitoring program for the components of the project that have undergone closure work. These reports will be submitted monthly for the duration of the closure to MARENA Ocotal delegation, General Directorate of Mines of the Ministry of Energy and Mines and the Municipal Environmental Unit of Jícaro, this includes a final report of the closure works until the granting of the Final Closure Certificate of the area subject to said activity.
|
The Rehabilitation and Monitoring Reports shall include the following:
/ A summary of the progress of the closure activities presented in the approved closure plan;
/ Closure and rehabilitation work carried out during the prior six months, including technical specifications and performance indicators;
/ Comparison between the scheduled phase-out activities of the closure plan with the work actually done during the prior six months;
/ Results of the monitoring program for those components of the tailings dam that have already been closed during the current or previous periods, including a performance evaluation and corrective actions to be taken in the event that performance objectives are not achieved; and
/ The proposed closing work for the next period.
20.5.2.14 CLOSURE EXECUTION SCHEDULE
The total duration of the closure is estimated to be three years. The final closure stage will last one year, followed by two years of active maintenance to ensure the physical and chemical stability of the project site, as well as the reforestation of the area impacted by the tailings storage facility.
|
21.0 CAPITAL AND OPERATING COSTS (ITEM 21)
The San Albino project is currently in production. The capital costs presented here form the LOM budgeting for the project. Operating costs presented show the actual costs incurred during September 2021 to September 2023 and are current through the effective date of this report.
21.1 CAPITAL COSTS
Initial capital required to place San Albino into production has been completed. As of the effective date, there is not sufficient information to complete a sustaining capital cost estimate. This will be subject to future studies.
21.2 OPERATING COSTS
Operating costs reported in this section are based on actual costs from September 2021 through the September 2023. Table 21-1 shows a summary of the cost per tonne processed and the cost per tonne mined.
Table 21-1 Operating Cost Summary
| Cost $/tonne | ||
| Operating Costs | Processed | Mined |
| Mining | $ 89.45 | $ 3.23 |
| Processing | $ 65.17 | NA |
| Indirect/G&A | $ 20.76 | NA |
| Total | $ 175.38 | NA |
21.2.1 MINE OPERATING COSTS
Actual mine operating costs from September 2021 through September 2023 are detailed in Table 21-2. These costs reflect contract mining for drilling, loading, blasting, and auxiliary equipment. Contract management costs result from personnel, supplies, and light vehicle costs for personnel that manage the contractor. The diesel costs shown are actual diesel costs and have fluctuated over time.
|
Table 21-2 Actual Mining Costs
| Mining Cost | $/tonne Mined | |
| Mine General Operations | $ | 0.23 |
| Drilling and Blasting | $ | 0.41 |
| Loading | $ | 0.31 |
| Ore Haulage | $ | 0.04 |
| Waste Haulage | $ | 0.78 |
| Auxiliary Equipment | $ | 0.65 |
| Contractor Admin Charges | $ | 0.37 |
| Diesel Consumption | $ | 0.45 |
| Total Mining Cost | $ | 3.23 |
21.2.2 PROCESS OPERATING COSTS
Actual process operating costs from September 2021 through September 2023 are detailed in Table 21-3. The costs are organized by operational work area. The labor costs and cost for consumables required for each work area are included in the detailed costs for each area.
Table 21-3 Actual Processing Costs
| Process Cost | $/tonne Processed | |
| Crushing | $ | 2.50 |
| Milling | $ | 8.11 |
| Leaching (CIL) | $ | 8.68 |
| Tails & Detox | $ | 14.58 |
| Carbon & Handling | $ | 4.72 |
| Refinery | $ | 1.88 |
| Laboratory | $ | 4.92 |
| Power Generation | $ | 14.32 |
| Maintenance area | $ | 5.47 |
| Total Processing Costs | $ | 65.17 |
21.2.3 G&A OPERATING COSTS
Actual indirect and G&A operating costs from September 2021 through September 2023 are detailed in Table 21-4.
|
Table 21-4 Actual Indirect and G&A Costs
| Indirect Costs / G&A | $/tonne Processed | |
| Community Relations | $ | 1.10 |
| Finance | $ | 2.38 |
| Human Resources | $ | 1.18 |
| IT | $ | 0.79 |
| General Management Mine Site | $ | 6.28 |
| Mine administration | $ | 0.25 |
| Purchasing - Supply chain | $ | 1.23 |
| Warehouse | $ | 0.28 |
| Safety & Enviromental | $ | 4.29 |
| Legal | $ | 0.33 |
| Managua Office | $ | 2.62 |
| Total Indirect /G&A Costs | $ | 20.76 |
In addition, Mako pays the Nicaraguan government a 3% royalty on all revenue from the sale of gold and silver.
|
22.0 ECONOMIC ANALYSIS (ITEM 22)
Mako has not included information under this section on the basis that it is a "producing issuer" as such term is defined in NI 43-101 and the technical report does not include a material expansion of current production.
|
23.0 ADJACENT PROPERTIES (ITEM 23)
There is neither commercial production nor serious exploration on adjacent properties that would affect the conclusions or interpretations of this report.
|
24.0 OTHER RELEVANT DATA AND INFORMATION (ITEM 24)
There is no other information necessary to make the technical report understandable and not misleading
|
25.0 INTERPRETATION AND CONCLUSIONS (ITEM 25)
The work done to date at the San Albino project has provided reliable data on which to base resource estimates and future exploration. The authors reviewed the project data, including Mako's drillhole database and geologic interpretations, and Ristorcelli and Gray visited the project site multiple times, most recently in March 2023. The authors believe that the data provided by Mako, as well as the geological interpretations derived from the data, are accurate and reasonably represent the geology and mineralization at the San Albino project, which includes the Las Conchitas resource area. When data was found to be unreliable, these were expunged from use in modeling and estimation. The authors are not aware of any significant risks or uncertainties that could reasonably be expected to affect the reliability or confidence in the exploration information as applied to the estimated mineral resources.
The mineralization at the San Albino project is best interpreted in the context of an "orogenic gold" deposit model (e.g., Goldfarb and Groves, 2015). The veins at the San Albino and Las Conchitas deposits share most of the important characteristics of orogenic gold deposits. The gold-bearing veins are hosted in lower greenschist-facies metamorphic rocks and their geometries indicate that veins formed in response to contractional deformation. Other features that are distinctive of orogenic deposits present in the San Albino system include ribbon-textured shear veins containing milky quartz, visible gold, relatively high Au:Ag ratios, low percentages of base metal sulfides including galena and sphalerite, and the presence of placer gold.
The resource estimates took several factors into account. Mineralized vein location is predictable in that drilling intersects the structure close to where it is predicted, but vein correlations between holes at Las Conchitas cannot be made as confidently as at the San Albino deposit because the veins are not as persistent or strong. Nevertheless, there is confidence in general in the interpretations of the structures. The style of mineralization at the project is well understood, and the deposits are open ended down dip and along strike. Some risk is imparted by the moderate core recoveries observed in the veins, although this style of mineralization does not necessarily lend itself to biases from differential core recovery. Nevertheless, there are indications that core recovery did not affect the grades until recoveries dropped below about 45% and those samples were eliminated from use in the estimates.
Classification of the resources considered adequacy and reliability of sampling, geologic understanding, results of quality control analyses, geologic complication, and apparent grade continuity. A Measured classification was permitted only in the San Albino vein, because there is a very good understanding of the San Albino vein geology and because there is extensive drilling and trench channel sampling.
|
Mining dilution is an important factor for the deposits at Las Conchitas and more so than at San Albino because the veins are in some places so thin that the dilution can render them uneconomic. Mining at Las Conchitas, like at San Albino, requires detailed grade control to maintain grade but Mako has demonstrated its ability to perform this well. In many places the veins have visually distinct hanging wall and footwall contacts, which help with grade control.
The estimated San Albino open pit resources include 0.5m rind of dilution on the hanging wall and 0.5m rind of dilution the footwall of each vein. The estimated Las Conchitas open pit resources include 0.4m rind of dilution on the hanging wall and 0.4m rind of dilution the footwall of each vein. The dilution grade is derived from the halo mineralization in the footwall and hanging wall or, if halo mineralization is absent, unmineralized material. In all cases, the dilution grade is taken from the estimate and is not a single grade applied globally. It is expected that dilution during underground mining will be greater because of ground conditions, shallow dip, minimum mining height, less grade control data, and therefore less control on locating hanging wall and footwall.
The authors believe that the San Albino project, inclusive of the Las Conchitas resources, comprises a project of merit that warrants additional exploration and development work. Known veins at Las Conchitas are open down dip and along strike, which suggests significant potential to expand the resources estimated in this report. Additionally, the stacked nature and even distribution of the veins parallel to the regional foliation provide a proven exploration strategy.
The San Albino project benefits from a team of mining professionals that have spent multiple years working on the project, successfully mining a narrow vein, open pit deposit as San Albino that is similar to the resource defined at Las Conchitas. The technical team has shown a commitment to collecting quality data and innovative thinking toward developing the project.
Any skepticism that might have existed with respect to a) the ability to estimate thin high-grade veins and b) mineability of the thin but high-grade veins has been quashed by Mako's production practices and results. Mako's grade control is exceptional and any other grade control method would certainly result in a mine failure. Reconciliations between prior estimates and production are considered good: reported production is 5% less gold and 8% less silver than was estimated. Mine production reported 9% more tonnes with decreased grades of 15% for gold and 19% for silver.
|
26.0 RECOMMENDATIONS (ITEM 26)
The authors believe that the San Albino project, inclusive of Las Conchitas, is a project of merit and warrants the proposed programs and level of expenditures outlined below. The San Albino and Las Conchitas deposits contain a series of stacked gold-silver bearing veins hosted in metamorphic rocks. These veins are open down dip and along strike, with significant potential to expand the resources estimated for this report. The project should continue to be evaluated on multiple fronts to further characterize the nature of these deposits and seek to expand the size of the resources. Additionally, the stacked nature and even distribution of the veins parallel to the regional foliation provide a proven exploration strategy for regional exploration. The project has multiple target areas at various stages of development that should be advanced simultaneously as outlined below. The cost estimate for the recommended program is presented in Table 26-1. The total recommended plan is estimated to cost $6,300,000.
26.1 SAN ALBINO
The mineral resources estimated in the San Albino, Arras, and Naranjo vein systems, detailed in this report, are open down dip, where underground mining will be the most likely method of exploitation, and to a lesser extent along strike where open pit mining will be the most likely method of exploitation. However, most of the drilling recommended is for better defining those areas planned for production.
26.1.1 SAN ALBINO AREA PRE-DEVELOPMENT DRILLING
Drill confirmation into Inferred resources lying within the open pit resource shell is recommended at the SW pit area because the proposed pit bottoms in Inferred resources. Additionally, infill drilling should be conducted in the West Pit area for the potential pushback west of the Mine Creek fault. RC drilling is considered sufficient to increase the level of confidence prior to mining.
There remains potential to mine some veins using underground mining methods. The authors recommend evaluating those areas lying within optimized stope resource shells in SW pit area, Naranjo vein near the tailings storage facility, Arras, and northwest portion of West Pit, then perform infill drilling and detailed engineering. Diamond drilling would confirm resource locations and give a more accurate estimate of grade distributions, while also providing geotechnical data for detailed underground mine design.
Costs are expected to be $980,000.
|
26.1.2 SAN ALBINO AREA EXPLORATION DRILLING
Exploration potential remains along strike of San Albino on the east side of El Jobo Creek near the El Jobo tunnel core shack. This area deserves a small exploration program.
Costs are expected to be $180,000.
26.2 LAS CONCHITAS AREA
Mako successfully defined resources from their exploration program at Las Conchitas. Because the discovery and development were so recent, additional drilling is still needed to upgrade at least some of the Inferred resources to Indicated. Additional drilling internal to the existing drilling and along strike and downdip presents a strong probability that the resources will increase. Consequently, the authors believe that additional infill drilling is justified and is recommended.
26.2.1 LAS CONCHITAS AREA PRE-DEVELOPMENT DRILLING
The mine is planning to collect several bulk samples in the Las Conchitas area prior to mining. It is recommended that they also complete close-spaced confirmation RC drilling in the areas identified for bulk samples (North and South Las Conchitas areas). Drill confirmation and expansion drilling is also recommended in Central Las Conchitas.
Costs are expected to be $480,000
26.2.2 LAS CONCHITAS AREA EXPLORATION DRILLING
Exploration and confirmation drilling within the proposed optimized pit resource shell is recommended to test extensions of the high-grade mineralized blocks and mineralization trends already identified. Exploration drilling should test extensions of known mineralized trends outside the currently proposed ultimate pit boundary, and to identify new zones. Initial RC drilling with follow-up diamond drilling is recommended. Costs are expected to be $2,700,000.
26.3 OTHER AREAS
The region in and around the San Albino project area contains substantial potential to find additional resources. In fact, Mako succeeded in replacing resources that have been mined since production began in May 2021. Given that background and the numerous known prospects and vein showings in the district, extensive regional exploration is warranted and suggested. The authors recommend that Mako continue advancing and prioritizing early stage regional exploration targets through prospecting, geological mapping, and sampling with the objective of identifying areas for initial RC drilling. Three crews of three geologists and helpers are
|
recommended. The expected cost for this task is $36,000. This work will be followed by initial RC drill testing of several targets with objective of advancing to second RC or diamond drill program in Phase II. Costs are expected to be $1,960,000.
Table 26-1 Mako Mining Corp. Cost Estimate for the Recommended Program
| Category | Objective | $/Units | Units | Quantity | USD |
| San Albino: Pre-Development Drilling |
SW Pit area - open pit | 80 | meter | 2,000 | $160,000 |
| West Pit area - open pit | 80 | meter | 500 | $40,000 | |
| Drilling for underground development | 180 | meter | 3,600 | $648,000 | |
| Engineering for underground development | 200 | hours | 200 | $40,000 | |
| Contingency | 10% | $88,800 | |||
| Subtotal (rounded to 10,000) | $980,000 | ||||
| San Albino: Exploration Drilling | East of El Jobo Creek | 80 | meter | 2,000 | $160,000 |
| Contingency | 15% | $24,000 | |||
| Subtotal (rounded to 10,000) | $180,000 | ||||
| Las Conchitas: Pre-Development Drilling |
Bulk sample area - pit | 80 | meter | 500 | $40,000 |
| Central zone - open pit | 80 | meter | 5,000 | $400,000 | |
| Contingency | 10% | $44,000 | |||
| Subtotal (rounded to 10,000) | $480,000 | ||||
| Las Conchitas: Exploration Drilling |
Outside open pit resource shell - RC | 80 | meter | 10,000 | $800,000 |
| Outside open pit resource shell - Core | 180 | meter | 2,500 | $450,000 | |
| Within open pit resource shell - RC | 80 | meter | 7,000 | $560,000 | |
| Within open pit resource shell - Core | 180 | meter | 3,000 | $540,000 | |
| Contingency | 15% | $352,500 | |||
| Subtotal (rounded to 10,000) | $2,700,000 | ||||
| Regional Exploration | Surface exploration | 12 | crew months | 3,000 | $36,000 |
| Exploration drilling | 80 | meter | 20,000 | $1,600,000 | |
| Contingency | 20% | $327,200 | |||
| Subtotal (rounded to 10,000) | $1,960,000 | ||||
| Total (rounded to 100,000) | 6,300,000 |
26.4 PHASE II
Success at San Albino, Las Conchitas, and other areas is defined, respectively, as finding additional resources, defining a resource, and discovering deposits deserving follow-up drilling. Given historic successes it is likely that follow-up work would include additional drilling if not economic studies on the newly discovered resources and prospects. Approximate costs could be at least as large as Phase I is currently recommended.
|
27.0 REFERENCES (ITEM 27)
Bierlein, F. P., Groves, D. I. & Cawood, P. A., 2009. Metallogeny of accretionary orogens - The connection between lithospheric: Ore Geology Reviews, Volume 36, pp. 282-292.
Burianek, D. & Dolnicek, Z., 2011. Metamorphic evolution of the contact aureole of the Dipilto Batholith, Eastern Chortis Terrane, Nicaragua: Journal of Geosciences, Volume 56, pp. 9-26.
Climate-Data.org, 2020. El Jicaro Climate (Nicaragua). [Online] Available at: https://en.climate-data.org/north- america/nicaragua/nueva-segovia/el-jicaro-30561/[Accessed 1 October 2020].
English, L., 2009. Final Report on the San Albino-Murra Concession: Condor Resources Plc.
Ginto Consulting Inc., 2020. San Albino Gold Project, Nueva Segovia, Nicaragua, Mineral Resource Estimation of the San Albino Deposit.
Goldfarb, R. J. et al., 2005. Distribution, Character, and Genesis of Gold Deposits in Metamorphic Terranes. In: Economic Geology 100th Anniversary Volume: Society of Economic Geologists, pp. 407-450.
Goldfarb, R. J. & Groves, D. I., 2015. Orogenic gold: Common or evolving fluid and metal sources: Lithos, Volume 233, pp. 2-26.
Gray, 2023, San Albino Mine, Conchitas, and Exploration Review, 30Mar2023, private report prepared for Mako Mining, 95p.
Gray, M., 2019. San Albino project, Nicaragua, Multiple Vein Formation Events - Implications for Exploration and Development Strategies: Resource Geosciences Inc.
Grillo, G, 2023, Generalities of the Las Conchitas deposit. Geological, Structural and Mineralogical Aspects, private report prepared for Mako Mining, 43p.
Groves, D. et al., 1998. Orogenic gold deposits: A proposed classification in the context: Ore Geology Reviews, Volume 13, pp. 7-27.
Goerse, G., 1996. Western Mining Corporation Monthly Technical Report-January 1996. EMSA's files.
Janin, C., 1934. Report on San Albino Gold Mines situated in Nueva Segovia - Nicaragua, San Francisco.
Kowalchuk, J., 2011. Technical Report Exploration Summary San Albino-Murra Gold Concession, El Jicaro Area, Dept. Nueva Segovia, Republic of Nicaragua: JMK Geological Services.
Mann, P., 2007. Overview of the Tectonic History of Northern Central America, Geological and tectonic development of the Caribbean plate boundary in northern Central America: Geological Society of America Special Paper 428, pp. 1-19.
McBirney, A., and Williams, H., 1965. Volcanic History of Nicaragua: Berkeley, University of California Press, Volume 55, 73p.
|
Monecke, T., Frieman, B., and Reynolds, T., 2022, Vein Paragenesis and Environment of Formation of the San Albino Mine and Related Prospects, Nicaragua, private report prepared for Mako Mining, 15p.3.03.0
Montgomery, M., 2008. Arras Project, Nicaragua, Independent Resource Report for Condor Resources Plc., Geosure Geological Consultants.
Nicaragua 2005 National Census, Eighth Census of Population, Fourth Census of Dwellings, National Institute of Statistics and Censuses.
Nicoz Resources SA, 2016, Estudio de Impacto Ambiental (EIA) Proyecto Mina San Albino, Nicoz Resources, S.A. 2016, Federal permitting document, 480p.
Nicoz Resources SA, 2023, Estudio de Impacto Ambiental (EIA) Proyecto Deposito Las Conchitas y Obras Complementarias, Explotación Minería Metallica, Empresa Nicoz Resources, S.A. July 2023, Federal permitting document, 412p
Peale, R., 1948. Report on San Albino Gold Situated in Nueva Segovia, Nicaragua, San Francisco.
Price, B. J., 2009. Technical Report, San Albino-Murra Gold Concession for Golden Reign Resources Ltd, B.J. Price Geological Consultants Inc.
Puritch, E. et al., 2015. Resource Estimate and Preliminary Economic Assessment on the San Albino Deposit, San Albino-Murra Concession, and El Jicaro Concession, Republic of Nicaragua for Golden Reign Resources Ltd., P&E Mining Consultants Inc.
Puritch, E. et al., 2013. Technical Report and Resource Estimate on the San Albino Deposit, San Albino-Murra Property, Republic of Nicaragua, P&E Mining Consultants Inc.
Ristorcelli, Steven, 2023. Site Visit Report, San Albino and Las Conchitas Projects, Nueva Segovia, Nicaragua, March 31, 2023, private report prepared for Mako Mining, 16p.
Ristorcelli, Steven and Unger, Derick, 2020. Site Visit Report, San Albino Project, Nueva Segovia, Nicaragua. February 28, 2020, private report prepared by Mine Development Associates, a division of RESPEC, for Mako Mining Corp.
Ristorcelli, Steven, C.P.G., Unger, Derick, C.P.G., MacFarlane, Ross, P. Eng., November 25, 2020, Technical Report and Estimate of Mineral Resources for The San Albino Project, Nueva Segovia, Nicaragua, for Mako Mining Corp.
Roberts, R. J. & Irving, E. M., 1957. Mineral Deposits of Central America, Washington: United States Government Printing Office.
Rogers, R. D., Mann, P. & Emmet, P. A., 2007. Tectonic terranes of the Chortis block based on integration of regional aeromagnetic and geologic data; Geological and tectonic development of the Caribbean plate boundary in northern Central America: Geological Society of America Special Paper 428, pp. 65-88.
|
Sundblad, K., Cumming, G. L. & Krstic, D., 1991. Lead Isotope Evidence for the Formation of Epithermal Gold Quartz Veins in the Chortis Block, Nicaragua: Economic Geology, Volume 86, pp. 944-959.
Viland, J. C., Henry, B., Calix, R. & Diaz, C., 1996. Late Jurassic deformation of Honduras, Proposals for a revised regional stratigraphy: Journal of South American Earth Sciences, Volume 9, pp. 153-160.
28.0 DATE AND SIGNATURE PAGE
| Effective Date of report: | October 11, 2023 | ||
| Completion Date of amended report: | June 10, 2024 | ||
| "Steven J. Ristorcelli" | Date Signed: | ||
| Steven J. Ristorcelli, C.P.G. | June 10, 2024 | ||
| "Peter Ronning" | Date Signed: | ||
| Peter A. Ronning, P.Eng. | June 10, 2024 | ||
| "Matthew Gray" | Date Signed: | ||
| Dr. Matthew D. Gray, Ph.D., C.P.G. | June 10, 2024 | ||
| "John Rust" | Date Signed: | ||
| John Rust, Registered Member, SME | June 10, 2024 | ||
| "Brian Ray" | Date Signed: | ||
| Brian Ray, P. Geo. | June 10, 2024 | ||
| "Thomas Dyer" | Date Signed: | ||
| Thomas Dyer, P. Eng. | June 10, 2024 | ||
|
29.0 CERTIFICATE OF QUALIFIED PERSONS
STEVEN RISTORCELLI, C. P. G.
I, Steven Ristorcelli, C. P. G., of 393 Fricke Ct., Gardnerville, Nevada, USA, hereby certify that:
I am a consulting geologist doing business as a sole practitioner.
I am one of the authors of the report entitled "Amended Technical Report and Estimate of Mineral Resources For the San AlbinoaAnd Las Cochitas Deposits Nueva Segovia, Nicaragua" (the "Technical Report"), prepared for Mako Mining Corp. with an Effective Date of October 11, 2023 and an Amendment date of June 10, 2024.
I graduated with a Bachelor of Science degree in Geology from Colorado State University in 1977 and a Master of Science degree in Geology from the University of New Mexico in 1980. I am a Certified Professional Geologist (#10257) with the American Institute of Professional Geologists. I have worked as a geologist continuously for 45 years since graduation from undergraduate university. During that time, I have been engaged in the exploration, definition, and modeling of dozens of epithermal gold-silver deposits in North America, Central America and South America, and have estimated the mineral resources for many such deposits.
I visited the San Albino project from February 18 through February 21, 2020, and again March 16 through March 22, 2023.
I take responsibility for Section 1.5, 1.11, 2.0, 10.0, 11.0, 11.3.4, 12.1, 12.3, 14, 24.0, and 25.0, all subject to the comments in Section 3.0.
I am independent of Mako Mining Corp. and all their subsidiaries as defined in Section 1.5 of NI 43-101 and in Section 1.5 of the Companion Policy to NI 43-101.
I have read the definition of "qualified person" set out in National Instrument 43-101 ("NI 43-101") and certify that by reason of my education, affiliation with a professional association (as defined in NI 43-101) and past relevant work experience, I fulfill the requirements to be a "qualified person" for the purposes of NI 43-101.
I have had prior involvement with the property as an independent consultant having estimated resources reported in 2020, but none prior to that engagement.
I have read National Instrument 43-101 and Form 43-101F1, and the Technical Report has been prepared in compliance with that instrument and form.
As of the effective date of this report, to the best of my knowledge, information and belief, the parts of this Technical Report that I am responsible for contain all the scientific and technical information that is required to be disclosed to make this Technical Report not misleading.
Dated this 10th day of June, 2024
"S Ristorcelli"
Signature of Qualified Person, Steven Ristorcelli, C. P. G.
|
MATTHEW GRAY, C.P.G.
I, Dr. Matthew D. Gray, Ph.D., C.P.G. #10688, of Rio Rico, Arizona, USA, Geologist at Resource Geosciences Incorporated, as an author of this report entitled "Amended Technical Report and Estimate of Mineral Resources For the San Albino and Las Conchitas deposits Nueva Segovia, Nicaragua" with Effective Date of October 11, 2023 and an Amendment date of June 10, 2024 (the Technical Report"), prepared for Mako Mining Corp. (the "Issuer") do hereby certify that:
1. I am employed as a geologist at Resource Geosciences Incorporated, an independent consulting geosciences firm, whose address is 765A Dorotea Ct, Rio Rico, Arizona, 85648 USA.
2. I am a Certified Professional Geologist (#10688) with the American Institute of Professional Geologists since 2003, a Member and Fellow of the Society of Economic Geologists since 1987, and my qualifications include experience applicable to the subject matter of the Technical Report. In particular, I am a graduate of the Colorado School of Mines (Ph.D., Geology with Minor in Mineral Economics, 1994; B.Sc., Geological Engineering, 1985) and the University of Arizona (M.Sc., Geosciences, 1988) and I have practiced my profession continuously since 1988. Most of my professional practice has focused on exploration for metallic mineral deposits, the creation of resource models, and the economic development of gold and copper deposits.
3. I am familiar with National Instrument 43-101 - Standards of Disclosure for Mineral Projects ("NI 43-101") and by reason of education, experience and professional registration I fulfill the requirements of a "qualified person" as defined in NI 43-101.
4. I visited the San Albino property for a total of 30 days during the periods 1 to 9 May 2019, 12 to 17 November 2019, 12 to 21 February 2020, and 16 to 21 March 2023.
5. I am solely responsible for Sections 1.0, 1.1, 1.2, 1.3, 1.9, 3, 4, 5, 6, 7, 8, 9, 10.3.1.1, 10.4, 10.5, 10.6, 12.4, 20.1, 20.3, 20.4, 23, 26, and 27.
6. I am independent of the Issuer as described in section 1.5 of NI 43-101.
7. I have had prior involvement with the property that is the subject of the Technical Report, having provided geologic and exploration consulting services at the project on a consulting basis beginning in 2019.
8. I have read NI 43-101 and the Technical Report has been prepared in compliance with NI 43-101.
9. As of the effective date of the Technical Report, to the best of my knowledge, information and belief, the Technical Report contains all scientific and technical information that is required to be disclosed to make the Technical Report not misleading.
Dated this 10th day of June, 2024
"Matthew Gray"
Dr. Matthew D. Gray, Ph.D., C.P.G. #10688
Geologist
Resource Geosciences Incorporated
|
JOHN RUST (REGISTERED MEMBER SME)
I, John Rust of 4748 West Saguaro Drive, Eagle, Idaho, USA, hereby certify that:
I am a consulting metallurgical engineer working as Mako's chief metallurgist part-time in addition to doing consulting work for other companies in the industry.
I am one of the authors of the report entitled "Amended Technical Report and Estimate of Mineral Resources For the San Albino and Las Cochitas Deposits Nueva Segovia, Nicaragua" (the "Technical Report"), prepared for Mako Mining Corp. with an Effective Date of October 11, 2023 and an Amendment Date of June 10, 2024. I take full responsibility for Sections 1.4, 1.7, 1.8, 1.10, 13, 17, 18, 19, 20.2, 20.5, 21, subject to the comments in Section 3.0.
I graduated with a Bachelor of Science degree in Metallurgical Engineering from the South Dakota School of Mines and Technology in 1984. I am a registered member of SME (#02796650).
I have worked as a metallurgical engineer continuously for 33 years since graduation from undergraduate university. During that time, I have been engaged in the mill operational support and supervision, technical support and supervision for both operations and consulting/engineering companies involved in precious metal and base metal mineral extraction. I have been involved with both operating sites and development projects in North America, Central America and South America.
I have read the definition of "qualified person" set out in National Instrument 43-101 ("NI 43-101") and certify that by reason of my education, affiliation with a professional association (as defined in NI 43-101) and past relevant work experience, I fulfill the requirements to be a "qualified person" for the purposes of NI 43-101.
I visited the San Albino project from April 14 through 21, 2022, June 25 through July 1, 2022 and again January 25 through 29, 2023.
I am not independent of Mako Mining Corp. and all their subsidiaries as defined in Section 1.5 of NI 43-101 and in Section 1.5 of the Companion Policy to NI 43-101.
I have not had prior involvement with the property before 2021.
I have read National Instrument 43-101 and Form 43-101F1, and the Technical Report has been prepared in compliance with that instrument and form.
As of the effective date of this report, to the best of my knowledge, information and belief, the parts of this Technical Report that I am responsible for contain all the scientific and technical information that is required to be disclosed to make this Technical Report not misleading.
Dated this 10th day June, 2024
"John Rust"
Signature of Qualified Person
John Rust, registered member SME #02796650P
|
Thomas L. Dyer, P.E., SME RM
This certificate applies to the report entitled: "Amended Technical Report and Estimate of Mineral Resources For the San Albino and Las Conchitas Deposits Nueva Segovia, Nicaragua" (Technical Report), effective date October 11, 2023 and amended on June 10, 2024.
I, Thomas L. Dyer, P.E., do hereby certify that:
1) I am a Principal Engineer with RESPEC LLC, with a business address at 210 S. Rock Blvd., Reno, NV USA.
2) I graduated with a B.S. degree in Mine Engineering in 1996 from the South Dakota School of Mines and Technology. I have worked as a Mining Engineer for a total of 28 years since my graduation. My relevant experience includes 11 years of Engineering in an operating open pit mine including underground studies. This operations experience included increasing responsibilities obtaining the position of Chief Engineer. Since that time I have worked as a Consulting Mining Engineer for numerous open pit and underground projects including Preliminary Economic Assessments, Prefeasibility, and Feasibility studies. I am a P.E. in Nevada (No. 15729) and am a Registered Member of SME (#4029995RM) in good standing.
3) I have read the definition of "qualified person" set out in National Instrument 43-101 - Standards of Disclosure for Mineral Projects (NI 43-101) and certify that by reason of my education, affiliation with a professional association (as defined in NI 43-101) and past relevant work experience, I fulfill the requirements to be a "qualified person" within the meaning of
NI 43-101.
4) I have not visited the property which is the subject of the Technical Report .
5) I am responsible for Sections 1.6, 15, and 16 of the Technical Report.
6) I am independent of the issuer Mako Mining Corp. according to Section 1.5 of NI 43-101.
7) II have previously completed pit optimizations for definition of resources.
8) I have read NI 43-101, Form 43-101F1 - Technical Report, 43-101CP - Standards of Disclosure for Mineral Projects, and the Technical Report has been prepared to be compliant with such instrument, form, and companion policy.
9) As of the effective date of the Technical Report, to the best of my knowledge, information and belief, the portions of the Technical Report for which I am responsible contain all scientific and technical information that is required to be disclosed to make the Technical Report not misleading.
10) I consent to the filing of the Technical Report with any securities regulatory authority, stock exchange and other regulatory authority and any publications by them, including electronic publication in the public company files on their websites accessible by the public.
Dated this 10th day of June, 2024.
Signed/Sealed "/s/ Thomas L. Dyer"
Signature of Qualified Person
Thomas L. Dyer, P.E., SME RM