 |
Page |
Table of Contents
| 1.0 SUMMARY | 1 |
| 1.1 GENERAL INFORMATION | 1 |
| 1.2 PROPERTY LOCATION, DESCRIPTION AND OWNERSHIP | 1 |
| 1.2.1 Bankruptcy and Change of Ownership | 2 |
| 1.3 ACCESSIBILITY, CLIMATE, PHYSIOGRAPHY, LOCAL RESOURCES AND INFRASTRUCTURE | 2 |
| 1.3.1 Accessibility | 2 |
| 1.3.2 Climate | 3 |
| 1.3.3 Physiography | 3 |
| 1.3.4 Local Resources and Infrastructure | 3 |
| 1.4 HISTORY AND EXPLORATION/DRILLING PROGRAMS | 4 |
| 1.4.1 Discovery and Early Mining History (1863 to 1935) | 4 |
| 1.4.2 Previous Exploration and Development (1982 to 2009) | 5 |
| 1.4.3 Operating Phases of the Moss Mine under Northern Vertex Mining Corporation (2013 to 2021) | 5 |
| 1.4.4 Exploration and Operation of Moss Mine under Elevation Gold Mining Corp July, 2021 to 2024 | 6 |
| 1.5 GEOLOGICAL SETTING AND MINERALIZATION | 7 |
| 1.5.1 Regional Geology | 7 |
| 1.5.2 Host Rocks | 7 |
| 1.5.3 Mineralization | 8 |
| 1.6 METALLURGICAL TESTING AND MINERAL PROCESSING | 8 |
| 1.7 MINERAL RESOURCE ESTIMATE | 9 |
| 1.7.1 Introduction | 9 |
| 1.7.2 Drill Hole Database | 9 |
| 1.7.3 Geological Model | 9 |
| 1.7.4 Exploratory Data Analysis | 10 |
| 1.7.5 Composites | 10 |
| 1.7.6 Density | 10 |
| 1.7.7 Block Model | 11 |
| 1.7.8 Gold Grade Estimation Parameters | 11 |
| 1.7.9 Silver Grade Estimation Parameters | 11 |
| 1.7.10 Classification of Mineral Resources | 12 |
| 1.7.11 Reasonable Prospects of Eventual Economic Extraction | 14 |
| 1.7.12 Mineral Resource Estimation Tabulation | 14 |
| 1.8 CONCLUSIONS | 16 |
| 1.8.1 Risks and Opportunities | 16 |
| 1.9 BUDGETS AND RECOMMENDATIONS | 18 |
| 1.9.1 Mine Geology/Exploration Budget | 18 |
| 1.9.2 Regional Exploration Budget | 18 |
| 1.9.3 Further Recommendations | 20 |
| 2.0 INTRODUCTION | 21 |
| 2.1 TERMS OF REFERENCE | 21 |
| 2.2 DISCUSSIONS, MEETINGS, SITE VISIT AND QUALIFIED PERSONS | 21 |
| 2.3 SOURCES OF INFORMATION | 22 |
|
Page |
| 2.4 UNITS OF MEASUREMENT AND ABBREVIATIONS | 23 |
| 3.0 RELIANCE ON OTHER EXPERTS | 26 |
| 4.0 PROPERTY DESCRIPTION AND LOCATION | 27 |
| 4.1 MOSS PROJECT LOCATION | 27 |
| 4.2 MINERAL TENURE AND OWNERSHIP | 28 |
| 4.2.1 Golden Vertex Corp. (Golden Vertex) | 28 |
| 4.2.2 Bankruptcy and Change of Ownership | 33 |
| 4.3 ROYALTIES | 34 |
| 4.3.1 MinQuest Inc. | 34 |
| 4.3.2 Greenwood Agreement | 36 |
| 4.3.3 La Cuesta International Inc. (La Cuesta or LCI) | 36 |
| 4.3.4 Patriot Gold. | 36 |
| 4.4 PROPERTY ACCESS | 36 |
| 4.5 HISTORIC LIABILITIES | 37 |
| 4.5.1 Phase I Liabilities | 37 |
| 4.5.2 Permits | 37 |
| 4.6 QP COMMENTS | 38 |
| 5.0 ACCESSIBILITY, CLIMATE, LOCAL RESOURCES, INFRASTRUCTURE AND PHYSIOGRAPHY | 39 |
| 5.1 ACCESSIBILITY | 39 |
| 5.2 CLIMATE | 39 |
| 5.3 LOCAL RESOURCES AND INFRASTRUCTURE | 39 |
| 5.3.1 Surface Rights, Power, Water and Personnel | 39 |
| 5.4 PHYSIOGRAPHY | 40 |
| 5.4.1 Topography, Elevation and Vegetation | 40 |
| 6.0 HISTORY | 41 |
| 6.1 PROPERTY HISTORY | 41 |
| 6.1.1 Discovery and Early Mining History (1863 to 1935) | 41 |
| 6.1.2 Previous Exploration and Development (1982 to 2009) | 42 |
| 6.1.3 Historical Production | 43 |
| 6.2 OPERATING PHASES OF THE MOSS MINE UNDER NORTHERN VERTEX MINING CORPORATION (2013 TO 2021) | 44 |
| 6.2.1 Phase 1 Project Description | 44 |
| 6.2.2 Phase II Project Description | 44 |
| 6.2.3 Phase III | 44 |
| 6.3 EXPLORATION AND OPERATION OF MOSS MINE UNDER ELEVATION GOLD MINING CORP JULY, 2021 TO 2024 | 45 |
| 6.3.1 Operations and Production by Elevation Gold Mining Corp. During the Period July 1, 2021 to 2024 | 46 |
| 6.4 CORPORATE OWNERSHIP OF THE MOSS MINE PROJECT 2011 TO PRESENT | 46 |
| 6.5 MINERAL RESOURCE ESTIMATES | 47 |
| 6.6 EXPLORATION BY ELEVATION GOLD OUTSIDE OF THE MOSS MINE | 47 |
| 6.6.1 West Oatman | 47 |
| 6.6.2 Florence Hill | 49 |
|
Page |
| 7.0 GEOLOGICAL SETTING AND MINERALIZATION | 52 |
| 7.1 SOURCES OF INFORMATION | 52 |
| 7.2 REGIONAL SETTING | 52 |
| 7.3 HOST ROCKS | 53 |
| 7.4 MINERALIZATION | 53 |
| 7.4.1 Moss Vein System | 56 |
| 7.4.2 West Extension of the Moss Vein | 56 |
| 7.4.3 Morphology of the Moss Vein | 59 |
| 7.4.4 Ruth Vein | 60 |
| 7.4.5 Gold-Silver Mineralization | 61 |
| 7.5 OXIDATION | 65 |
| 7.6 STRUCTURAL GEOLOGY | 66 |
| 7.6.1 Faults | 66 |
| 7.6.2 Dikes | 66 |
| 7.7 CURRENT GEOLOGICAL CONCEPTS | 67 |
| 8.0 DEPOSIT TYPES | 71 |
| 9.0 EXPLORATION | 74 |
| 9.1 INTRODUCTION | 74 |
| 9.2 PREVIOUS OWNERS AND OPERATORS (1982 TO 2009) | 74 |
| 9.3 NVMC/GVC (2011 THROUGH 2015) | 74 |
| 9.3.1 2011 Exploration Program | 74 |
| 9.3.2 2012 Exploration Program | 74 |
| 9.3.3 2013/2014 Exploration Program | 74 |
| 9.3.4 2016 Mapping and Sampling | 77 |
| 9.3.5 2017 Mapping and Sampling | 78 |
| 9.3.6 2020 Mapping and Sampling | 78 |
| 9.3.7 2021 Mapping and Sampling | 78 |
| 9.3.8 2021 Multi-Spectral Survey | 78 |
| 9.3.9 Land Expansion | 80 |
| 10.0 DRILLING | 81 |
| 10.1 LEGACY DRILLING | 81 |
| 10.2 NORTHERN VERTEX DRILLING 2019 TO 2021 | 83 |
| 10.3 ELEVATION GOLD MINING CORP. DRILLING FROM 2022 TO 2024 | 86 |
| 10.3.1 Reynolds Pit | 91 |
| 10.3.2 West Extension | 92 |
| 10.3.3 West Pit | 93 |
| 10.3.4 Centre Pit | 94 |
| 10.4 QP COMMENTS | 94 |
| 11.0 SAMPLE PREPARATION, ANALYSES AND SECURITY | 96 |
| 11.1 GENERAL INFORMATION | 96 |
| 11.2 SAMPLE COLLECTION AND SECURITY | 96 |
| 11.2.1 2011 to 2013 Reverse Circulation Samples | 96 |
| 11.2.2 2011 to 2013 Core samples | 96 |
|
Page |
| 11.2.3 2012 Percussion Samples | 97 |
| 11.2.4 2016 to 2017 | 98 |
| 11.2.5 2019 to 2023 | 98 |
| 11.3 SAMPLE PREPARATION AND ANALYSIS | 98 |
| 11.3.1 2011 to 2013 Samples | 98 |
| 11.3.2 2016 to 2017 Samples | 99 |
| 11.3.3 2019 to 2023 Samples | 99 |
| 11.4 QUALITY ASSURANCE / QUALITY CONTROL RESULTS | 100 |
| 11.4.1 QA/QC Results 2011 | 100 |
| 11.4.2 QA/QC Results 2012 | 100 |
| 11.4.3 QA/QC Results 2013 | 100 |
| 11.4.4 QA/QC Results 2020 | 102 |
| 11.4.5 QA/QC Results 2021 | 102 |
| 11.4.6 QA/QC Results 2022 | 102 |
| 11.4.7 QA/QC Results 2023 | 102 |
| 11.5 QUALIFIED PERSON'S COMMENTS | 104 |
| 12.0 DATA VERIFICATION | 105 |
| 12.1 DRILL HOLE DATABASE | 105 |
| 12.2 REVIEW OF DRILL HOLE COLLAR ELEVATIONS | 107 |
| 12.3 REVIEW OF THE DOWN-HOLE SURVEY DATA | 107 |
| 12.4 VALIDATION OF ASSAYS | 107 |
| 12.5 RC HOLE ASSAY STATISTICAL ANALYSIS | 108 |
| 12.6 PERCUSSION HOLE ASSY STATISTICAL ANALYSIS | 110 |
| 12.7 COMPARISON OF ASSAYS BY LABORATORY | 112 |
| 12.8 INDEPENDENT VERIFICATION SAMPLES | 114 |
| 12.9 QUALIFIED PERSON SITE INSPECTION | 115 |
| 12.10 QUALIFIED PERSON OPINION | 116 |
| 13.0 MINERAL PROCESSING AND METALLURGICAL TESTING | 117 |
| 13.1 INTRODUCTION | 117 |
| 13.2 METALLURGICAL TESTWORK | 117 |
| 13.2.1 Historical Testwork | 117 |
| 13.2.2 2023 Testwork | 118 |
| 13.2.3 2025 Testwork | 120 |
| 13.3 PRODUCTION RECONCILIATION | 120 |
| 13.3.1 Operational Gold Recovery Performance | 120 |
| 13.3.2 Operational Silver Recovery Performance | 121 |
| 13.4 CONCLUSIONS AND RECOMMENDATIONS | 122 |
| 14.0 MINERAL RESOURCE ESTIMATES | 124 |
| 14.1 INTRODUCTION | 124 |
| 14.2 DRILL HOLE DATABASE | 124 |
| 14.3 GEOLOGICAL MODEL | 125 |
| 14.4 EXPLORATORY DATA ANALYSIS | 127 |
| 14.4.1 Assays | 127 |
| 14.4.2 Composites | 128 |
|
Page |
| 14.4.3 Grade Capping | 130 |
| 14.4.4 Contact Analysis | 133 |
| 14.4.5 Density | 134 |
| 14.5 SPATIAL ANALYSIS - VARIOGRAPHY | 135 |
| 14.5.1 Gold Grade Variography | 135 |
| 14.5.2 Silver Grade Variography | 136 |
| 14.6 BLOCK MODEL | 139 |
| 14.6.1 Gold Grade Estimation Parameters | 139 |
| 14.6.2 Silver Grade Estimation Parameters | 140 |
| 14.6.3 Density Model | 141 |
| 14.6.4 Block Model Validation | 142 |
| 14.7 MINERAL RESOURCES | 151 |
| 14.7.2 Reasonable Prospects of Eventual Economic Extraction | 156 |
| 14.7.3 Mineral Resource Tabulation | 156 |
| 14.7.4 Comparison with 2021 Mineral Resource Estimate | 159 |
| 15.0 MINERAL RESERVE ESTIMATES | 162 |
| 16.0 MINING METHODS | 162 |
| 17.0 RECOVERY METHODS | 162 |
| 18.0 PROJECT INFRASTRUCTURE | 162 |
| 19.0 MARKET STUDIES AND CONTRACTS | 162 |
| 20.0 ENVIRONMENTAL STUDIES, PERMITTING AND SOCIAL OR COMMUNITY IMPACT | 162 |
| 21.0 CAPITAL AND OPERATING COSTS | 162 |
| 22.0 ECONOMIC ANALYSIS | 162 |
| 23.0 ADJACENT PROPERTIES | 163 |
| 23.1.1 Gold Road Mine (Gold Road Inc.) | 163 |
| 23.1.2 Gold Chain Project (Westpoint Gold Corp.) | 165 |
| 23.1.3 Secret Pass Project (Northern Lights Resource Corp.) | 166 |
| 24.0 OTHER RELEVANT DATA AND INFORMATION | 167 |
| 24.1 MINING METHODS | 167 |
| 24.1.1 Mine Design | 167 |
| 24.1.2 Design Parameters | 167 |
| 24.1.3 Mining Pit Phase Progression | 168 |
| 24.1.4 Mine Production Schedule | 168 |
| 24.1.5 Waste Storage | 168 |
| 24.2 RECOVERY METHODS | 168 |
| 24.3 PROJECT INFRASTRUCTURE | 168 |
| 24.4 ENVIRONMENTAL STUDIES, PERMITTING AND SOCIAL OR COMMUNITY IMPACT | 169 |
| 24.4.1 Environmental | 169 |
|
Page |
| 24.4.2 Permitting | 170 |
| 25.0 INTERPRETATION AND CONCLUSIONS | 171 |
| 25.1 CONCLUSIONS | 171 |
| 25.2 METALLURGICAL TESTWORK AND PROCESSING | 171 |
| 25.3 MINERAL RESOURCE ESTIMATE | 172 |
| 25.3.1 Introduction | 172 |
| 25.3.2 Drill Hole Database | 172 |
| 25.3.3 Geological Model | 172 |
| 25.3.4 Exploratory Data Analysis | 173 |
| 25.3.5 Composites | 173 |
| 25.3.6 Density | 173 |
| 25.3.7 Block Model | 174 |
| 25.3.8 Gold Grade Estimation Parameters | 174 |
| 25.3.9 Silver Grade Estimation Parameters | 175 |
| 25.3.10 Classification of Mineral Resources | 175 |
| 25.3.11 Reasonable Prospects of Eventual Economic Extraction | 177 |
| 25.3.12 Mineral Resource Estimation Tabulation | 177 |
| 25.4 RISKS AND OPPORTUNITIES | 179 |
| 26.0 RECOMMENDATIONS | 181 |
| 26.1 MINE GEOLOGY/EXPLORATION BUDGET | 181 |
| 26.2 REGIONAL EXPLORATION BUDGET | 181 |
| 26.3 FURTHER RECOMMENDATIONS | 183 |
| 27.0 REFERENCES | 184 |
| 27.1 GENERAL PUBLICATIONS AND REPORT REFERENCES | 184 |
| 27.2 WEBSITE REFERENCES | 187 |
| 28.0 DATE AND SIGNATURE PAGE | 188 |
| 29.0 CERTIFICATES OF AUTHORS | 189 |
APPENDICES
| APPENDIX 1: GLOSSARY OF MINING TERMS | End of report |
|
Page |
| Table 1.1 Summary of Exploration and Development Work Carried Out by Previous Owners and Operators on the Moss Mine Project (the 15 patented lode claims) to 2009 | 5 |
| Table 1.2 Summary of Parameters for Mineral Resources Pit Resource Shell | 14 |
| Table 1.3 2025 Mineral Resource Estimate Sensitivity Analysis for a Series of Cut-Off Grades* | 15 |
| Table 1.4 Summary of 2025 Mineral Resource Estimate by Classification Category* | 16 |
| Table 1.5 Risks and Opportunities at the Moss Mine Project | 17 |
| Table 1.6 Budget Summary for the Moss Mine Geology and Exploration Program | 18 |
| Table 1.7 Regional Exploration Recommended Budget - Phase 1 | 19 |
| Table 1.8 Regional Exploration Recommended Budget - Phase 2 | 19 |
| Table 2.1 Qualified Persons, Areas of Responsibility and Site Visits | 22 |
| Table 2.2 Units and Abbreviations | 24 |
| Table 4.1 List of Moss Mine Area Patented Claim Parcels (located in T20N R20W) | 29 |
| Table 4.2 Location of Three Additional State Exploration Leases | 33 |
| Table 6.1 Summary of Exploration and Development Work Carried Out by Previous Owners and Operators on the Moss Mine Project (the 15 patented lode claims) to 2009 | 42 |
| Table 6.2 Summary of Drilling at Moss Mine July, 2021 to 2024 | 45 |
| Table 6.3 Elevation Gold Production at Moss Mine during the Period July 1, 2021 to June 30, 2024 | 46 |
| Table 6.4 West Oatman Drilling History and Highlights | 49 |
| Table 7.1 A Summary of Microscopic Gold Particle Size Analysis, Moss Vein Material (Baum & Lherbier, 1990) | 63 |
| Table 8.1 Comparison of Moss Deposit Characteristics with Typical Low Sulfidation Epithermal Gold Deposits | 72 |
| Table 10.1 Summary of Drilling Statistics for Moss Mine Project | 82 |
| Table 10.2 Drill Hole Collars for 2022 to 2024 Drilling at Moss Mine Project | 88 |
| Table 10.3 Summary of Significant Intercepts Reynolds Pit Area | 91 |
| Table 10.4 Summat of Significant Intercepts West Extension Area | 92 |
|
Page |
| Table 10.5 Summary of Significant Assay Intercepts West Pit Area | 93 |
| Table 10.6 Summary of Significant Assay Intercepts Centre Pit | 94 |
| Table 11.1 Summary of CRM and Blank QA/QC Results | 101 |
| Table 12.1 Distribution of the Samples in the New Database that did not Match the DataShed Sample Assays by Drill Hole | 108 |
| Table 13.1 Moss Monthly Column Test Gold Data 2022 and 2023 | 119 |
| Table 13.2 Moss Monthly Column Test Silver Data 2022 and 2023 | 119 |
| Table 13.3 Recommended Metals Recoveries | 122 |
| Table 14.1 Summary of Drill Hole Database inside Block Model Limits | 124 |
| Table 14.2 Treatment of Missing Sample Intervals | 127 |
| Table 14.3 Summary Statistics for Original and In-filled Sample Intervals for Gold | 128 |
| Table 14.4 Summary Statistics for Original and In-filled Sample Intervals for Silver | 128 |
| Table 14.5 Summary Statistics and Capping Grades for Gold (oz/ton) by Domain | 132 |
| Table 14.6 Summary Statistics and Capping Grades for Silver (oz/ton) by Domain | 132 |
| Table 14.7 Summary of Boundary Conditions for Grade Estimation | 134 |
| Table 14.8 Semi-Variogram Models for Gold by Domain | 136 |
| Table 14.9 Semi-Variogram Models for Silver by Domain | 136 |
| Table 14.10 Block Model Definition for Moss Mine Project | 139 |
| Table 14.11 Kriging Plan for Gold Grades - Pass 3 Parameters | 140 |
| Table 14.12 Kriging Plan for Silver Grades - Pass 3 Parameters | 141 |
| Table 14.13 Summary Statistics for Estimated Gold Grades by Domain | 142 |
| Table 14.14 Summary Statistics for Estimated Silver Grades by Domain | 143 |
| Table 14.15 Summary Statistics for Block Model Estimates - Volume-Variance Assessment | 144 |
| Table 14.16 Summary Statistics for Block Model Estimates - Corrected Volume-Variance | 145 |
| Table 14.17 Comparison of Blasthole and Drill Hole Block Models | 149 |
| Table 14.18 Summary Statistics Comparing Relative Measures of Confidence in Block Grades | 155 |
|
Page |
| Table 14.19 Summary of Parameters for Mineral Resources Pit Resource Shell | 156 |
| Table 14.20 2025 Mineral Resource Estimate Sensitivity Analysis for a Series of Cut-Off Grades* | 158 |
| Table 14.21 Summary of 2025 Mineral Resource Estimate by Classification Category* | 159 |
| Table 14.22 Comparison of Mineral Resource Estimation Parameters for 2021 and 2025 | 159 |
| Table 14.23 Moss Mine Project - Mineral Resources, July 1, 2021 | 161 |
| Table 25.1 Summary of Parameters for Mineral Resources Pit Resource Shell | 177 |
| Table 25.2 2025 Mineral Resource Estimate Sensitivity Analysis for a Series of Cut-Off Grades* | 178 |
| Table 25.3 Summary of 2025 Mineral Resource Estimate by Classification Category* | 179 |
| Table 25.4 Risks and Opportunities at the Moss Mine Project | 180 |
| Table 26.1 Budget Summary for the Moss Mine Geology and Exploration Program | 181 |
| Table 26.2 Regional Exploration Recommended Budget - Phase 1 | 182 |
| Table 26.3 Regional Exploration Recommended Budget - Phase 2 | 182 |
|
Page |
List of Figures
| Figure 4.1 Location of the Moss Mone | 27 |
| Figure 4.2 Location Plan for the 15 Moss Patented Claims (Reserve Pit Outline in Red) (Source: IMC, 2021) | 30 |
| Figure 4.3 Land Position of Golden Vertex | 32 |
| Figure 4.4 Moss Project Legacy Claims | 35 |
| Figure 6.1 Historical Photograph of the Allen Shaft at Moss Mine, 1920-1921 | 42 |
| Figure 6.2 West Oatman Location Map | 48 |
| Figure 6.3 Florence Hill/Grapevine Location Map | 51 |
| Figure 7.1 Geology and Exploration Areas around the Moss Mine | 54 |
| Figure 7.2 Geology and Exploration Areas along the Moss Vein | 55 |
| Figure 7.3 Mid-West Extension Geology and Rock-Chip Gold (in ppb) | 58 |
| Figure 7.4 Occurrence of Gold/Electrum Grains* | 63 |
| Figure 7.5 Paragenesis of the Moss Deposit | 64 |
| Figure 7.6 Cut Core from Drill Hole AR204C at 385 ft Downhole (272 ft vertical depth), Showing Partial Oxidation (brown limonite) in the Moss Vein | 65 |
| Figure 7.7 Moss and Ruth Veins relative to Canyon Fault | 68 |
| Figure 7.8 Moss Stockwork and Reynolds Zone | 69 |
| Figure 7.9 Cross-Section for the Reynolds Zone showing the Flatter Attitude Looking West (Azimuth 280°) | 70 |
| Figure 8.1 Examples of bladed calcite partially replacing quartz (evidence of boiling) in HQ- diameter (2.5") diamond core drill holes: Right a) AR-165C at 213 ft; Left b) AR21-410C at 781 ft (with purple fluorite) | 72 |
| Figure 9.1 Key Exploration Target Areas on the Moss Property | 75 |
| Figure 9.2 Total Magnetic Intensity and Structural Interpretation | 76 |
| Figure 9.3 Map of Moss Project Area showing the Property Boundary, Gold/Silver Occurrences, Veins, Structures, and Alteration Mapping from the PhotoSat Hyperspectral Survey. | 79 |
| Figure 10.1 Plan Map of Drilling at the Moss Mine Project | 87 |
|
Page |
| Figure 11.1 Duplicate Laboratory Assay Checks of Duplicate Gold Assays | 103 |
| Figure 11.2 Duplicate Preparation Assay Checks of Duplicate Gold Assays | 103 |
| Figure 12.1 Breakdown of the Moss Mine Assays by Laboratory | 105 |
| Figure 12.2 Breakdown of the Moss Mine Assays by Drill hole Type | 106 |
| Figure 12.3 Comparison of Closest Pairs between RC and DDH Assays up to 10 Feet Apart | 109 |
| Figure 12.4 Comparison of Twin Holes - AR-113R (RC) versus WW-06 (DDH) | 110 |
| Figure 12.5 Comparison of Closest Pairs between PERC and DDH Assays up to 10 Feet Apart | 111 |
| Figure 12.6 Comparison of Twin Holes - AR-163C (DDH) versus 3_00B (PERC) | 111 |
| Figure 12.7 Comparison of Assay Pairs 10 Feet Apart for MDB versus Inspectorate | 112 |
| Figure 12.8 Comparison of Assay Pairs 10 Feet Apart for Chemex versus Inspectorate | 113 |
| Figure 12.9 Comparison of Assay Pairs 10 Feet Apart for Chemex versus Skyline | 113 |
| Figure 12.10 Photograph of Sample Pulps Submitted for Assay to Skyline Laboratories | 114 |
| Figure 12.11 Pass/Fail Graph for Duplicate Sample Assays | 115 |
| Figure 13.1 Cumulative Operational Performance Data for Gold | 121 |
| Figure 13.2 Cumulative Operational Performance Data for Silver | 122 |
| Figure 14.1 Plan View of the Geological Domains | 126 |
| Figure 14.2 Sectional View at 6,000 ft Northwest of the Geological Domains | 126 |
| Figure 14.3 Ten Foot Composite Summary Statistics for Gold Grade by Domain | 129 |
| Figure 14.4 Ten Foot Composite Summary Statistics for Silver Grade by Domain | 129 |
| Figure 14.5 Log-Probability Plot of Gold Grade 10 Foot Composites for Domain 7 - Moss Vein | 131 |
| Figure 14.6 Decile Analysis of Gold Grade 10 Foot Composites for Domain 7 - Moss Vein | 131 |
| Figure 14.7 Contact Plot between East Stockwork (4) and Moss Vein (7) for Gold Gra | 133 |
| Figure 14.8 Semi-Variogram Maps, Dir. Semi-Variograms and Fitted Models for Au Domain 04 | 135 |
| Figure 14.9 9 Experimental Semi-Variogram and Fitted Model for Gold Grades | 137 |
| Figure 14.10 Experimental Semi-Variogram and Fitted Model for Silver Grades | 138 |
|
Page |
| Figure 14.11 Swath Plot of Gold Grades for Domain 4 | 144 |
| Figure 14.12 Grade-Tonnage Curve - for all Block Gold Grade Estimates | 146 |
| Figure 14.13 Plan View at the 1,710 Foot Elevation. of Gold Block Grade Estimates | 147 |
| Figure 14.14 Section 6,000 Feet NW - Block Gold Grade Estimates | 147 |
| Figure 14.15 Section 7,000 Feet NW - Block Gold Grade Estimates | 148 |
| Figure 14.16 Section 11,000 Feet NW - Block Gold Grade Estimates | 148 |
| Figure 14.17 Cross-Section at 6,000 Feet NW of Blasthole Block Model Gold Grades | 150 |
| Figure 14.18 Cross Section at 6,000 Feet NW of Drill Hole Block Model Gold Grades | 150 |
| Figure 14.19 Plan View at 1,910 Foot Elevation of the Classification of the Blocks before Smoothing | 154 |
| Figure 14.20 Plan View at 1,910 Foot Elevation of the Classification of the Blocks After Smoothing | 154 |
| Figure 14.21 Plan view of Pit19 at US $2500/oz Gold Mineral Resource Shell with Drill Hole Traces | 157 |
| Figure 23.1 Location of Projects Adjacent to Moss Mine | 164 |
| Figure 23.2 Westpoint's Tyro Main Zone showing the Historical Mining Cut and Stockwork* | 165 |
| Figure 23.3 Drilling Highlights of Westpoint's Tyro Main Zone* | 166 |
|
Mako Mining Corp. |
1.0 SUMMARY
1.1 General Information
Micon International Limited (Micon) has been retained by Mako Mining Corp. (Mako) to prepare a an NI 43-101 Technical Report for the Moss Mine Project (Moss Mine Project or the Project) located in the Oatman Mining District, Mohave County, Arizona, in order to disclose the 2025 Mineral Resource Estimate (MRE) in accordance with National Instrument 43-101 Standards of Disclosure for Mineral Projects (NI 43-101).
This report may disclose technical information, the presentation of which requires the Qualified Persons (QPs) to derive sub-totals, totals and weighted averages that inherently involve a degree of rounding and, consequently, introduce a margin of error. Where these occur, the QPs do not consider them to be material.
The conclusions and recommendations of this report reflect the QPs' best independent judgment in light of the information available to them at the time of writing. Micon and the QPs reserve the right, but will not be obliged, to revise this report and conclusions if additional information becomes known to them subsequent to the date of this report. Use of this report acknowledges acceptance of the foregoing conditions.
This report is intended to be used by Mako subject to the terms and conditions of its agreement with Micon. That agreement permits Mako to file this report publicly as a Technical Report pursuant to applicable securities legislation.
Micon and the QPs are independent of Mako as defined under Section 1.5 of NI 43-101. Neither Micon nor the individual QPs have, nor have they previously had, any material interest in Mako and its related entities. The relationship with Mako is solely a professional association between the client and the independent consultants. This report is prepared in return for fees based upon agreed commercial rates and the payment of these fees is in no way contingent on the results of this report.
Micon and the QPs are pleased to acknowledge the helpful cooperation of Mako management, personnel and consulting field staff, all of whom made any and all data requested available and responded openly and helpfully to all questions, queries and requests for material.
1.2 Property Location, Description and Ownership
The Moss Mine Project is located at latitude 35°5'49" N and longitude 114°26'43" W, which is about 10 miles east from Bullhead City, Arizona, along Silver Creek Road. Bullhead City, Arizona is about 90 miles southeast from Las Vegas, Nevada.
The initial ownership in the Moss Mine Project was acquired by Golden Vertex Corp. (Golden Vertex), a subsidiary of Northern Vertex Mining Corporation (Norther Vertex Mining or NVMC) through an option agreement with Patriot Gold Corp. ( Patriot Gold) to acquire a 70% interest in 2011 and a subsequent purchase agreement with Patriot in 2016 to acquire a full 100% interest in the Moss Mine Project subject to a royalty agreement.
|
Mako Mining Corp. |
In 2021, Golden Vertex purchased ten patented claims (McCullough Patents) in northern T19N R20W covering 109.4 ac. These patented claims are owned as fee simple property by Golden Vertex. The claim boundaries were surveyed at the time of patenting and recorded as Mineral Survey 3349. They were recorded with Mohave County as Parcels 221-04-002 and 221-05-001.
On Sept 24, 2021, Northern Vertex Mining changed its name to Elevation Gold Mining Corp. (Elevation Gold or EGMC). They also consolidated shares 6:1 at the same time.
1.2.1 Bankruptcy and Change of Ownership
On August 1, 2024, Elevation Gold obtained an order (the "Initial Order") of the Supreme Court of British Columbia (the "Canadian Court") granting it creditor protection under the Companies' Creditors Arrangement Act (the "CCAA"). Under the Initial Order, KSV Restructuring Inc. (the "Monitor") was appointed as the monitor of Elevation Gold. In order to obtain similar protection in the United States, a petition under chapter 15 of the US Bankruptcy Code was filed with the US Bankruptcy Court for the District of Arizona.
Additionally on the same date, Golden Vertex announced that it was ceasing active mining but intended to continue the operation of the beneficiation facilities.
On December 31, 2024, Elevation Gold announced the completion of the sale of Moss Mine with an arm's length purchaser, EG Acquisition LLC. ("EGA"), in respect of the purchase and sale of certain of Elevation's assets, including the outstanding common shares of Golden Vertex, which held the Moss Mine located in Arizona. The Canadian Approval Order was subject to recognition by the U.S. Court in the Chapter 15 Proceedings. The US Recognition Hearing was heard on December 23, 2024, and the US Approval Order was entered on December 30, 2024. The Transaction was also approved by the TSX Venture Exchange subject to approval by the U.S. Court.
On March 27, 2025, Mako Mining Corp. (Mako) announced the completion of the purchase of the Moss Mine.
The acquisition was completed pursuant to the terms of an interest purchase agreement dated March 26, 2025, between Mako US Corp. as buyer, Wexford EG Acquisition LLC as vendor, EGA as target and Mako as buyer guarantor, pursuant to which Mako US acquired 100% of the ownership interests in EGA, a private company controlled by Mako's controlling shareholder, Wexford Capital LP (collectively with its managed funds, "Wexford") that acquired 100% of the shares of Golden Vertex, the operating subsidiary of the Moss mine, under a CCAA proceeding and related Chapter 15 proceeding in the United States (the "Bankruptcy Process") on December 31, 2024.
1.3 Accessibility, Climate, Physiography, Local Resources and Infrastructure
1.3.1 Accessibility
The nearest cities to the Moss Mine Project are Bullhead City, Arizona (10 miles west) and Laughlin, Nevada (14 miles northwest) which are separated north-south by the Colorado River.
Las Vegas, Nevada is the nearest major city to the Moss Mine Project, which is approximately 90 miles (1.5 hours) northwest of Bullhead City, Arizona. From McCarran International Airport in Las Vegas, Interstate Highways 215, 11 and US Highway 95 lead to State Highway 163 into the Laughlin-Bullhead City area and are good quality paved roads. Moss Mine can be reached by traveling about 10 miles via Bullhead Parkway east on the Silver Creek Road (an improved dirt road).
|
Mako Mining Corp. |
Approximately seven miles east of the Moss Mine Project area is the small town of Oatman, Arizona. Oatman is a historical gold mining town that hosted three underground gold mines in the late 1800s and early 1900s.
1.3.2 Climate
The climate in the general Moss Mine Project area is classified as desert. The Project lies within the Holdridge Life Classification zone it is in a warm temperate latitudinal region, pre-montane to lower montane altitudinal zone and a desert humidity province. There are no climatic constraints on the operating season, although daytime temperatures can exceed 110ºF during June, July and August. Heatwaves with temperatures in excess of 120ºF are not uncommon. Lows average about 44ºF in the winter months, with recorded lows of 24ºF. The average annual rainfall in Bullhead City is six inches (data from www.usclimatedata.com). No rain may fall for months, heavy rainfalls may occur during the monsoon season, which is between July and September.
1.3.3 Physiography
The Moss Mine Project area is located in the Black Mountain Range in the southern part of the Basin-and-Range topographic province, 10 miles east of Bullhead City, Arizona.
Elevations across the Moss Project area vary from approximately 2,160 ft to 2,690 ft above sea level. The Moss vein forms a prominent east-west ridge across the northern portion of the block of 15 patented lode claims.
The local project area is drained by erosional features that drain to Silver Creek Wash located one mile south of the block of 15 patented lode claims, which is dry for most of the year, and drains southwest and then west into the Colorado River. Vegetation is generally sparse; comprised of bunch grass, sagebrush and various species of cacti. The Fort Mojave Indian Tribe and other private companies have created an agricultural community that covers several square miles in the fertile fields of Mohave Valley and Fort Mohave, to the immediate south of Bullhead City and west of the project area. The main crops are cotton and alfalfa.
1.3.4 Local Resources and Infrastructure
The Moss Mine Project was an active mine which was fully permitted and maintained the surface rights necessary to operate. Although the mine began production using diesel- powered generators, the mine has installed line power from Mohave Electric Co-Operative (the local power utility) which became operational as of mid-September, 2020.
The principal water source for mine operations is from wells drilled on the Moss Mine property. Additional water sources occur from water seepage into the open pits. Make up water is trucked to site, when necessary.
|
Mako Mining Corp. |
There are sufficient services within the Bullhead City-Laughlin area to provide supplies, services and manpower to the mine. Technical and management roles can be filled by suitable professionals from mining groups throughout the Western US.
1.4 History and Exploration/Drilling Programs
1.4.1 Discovery and Early Mining History (1863 to 1935)
The Moss Mine Project was discovered in 1863 by John Moss (1839-1880). At the time, it was reported to be the first major gold discovery in Mohave County. The larger San Francisco Mining District of Mohave County was established in 1864 (Malach, 1977).
The available records show that John Moss was made aware of the Moss Mine area by stories about soldiers from nearby Fort Mojave prospecting for and finding gold. A popular, alternative account of the Moss vein discovery is that Chief Irataba of the Mojave Tribe led Moss to what became known as the Moss vein outcrop. Whatever the case, John Moss' name appeared on the first recorded mining claim called the Moss Lode, under the ownership of the San Francisco Gold and Silver Company. The initial gold discovery at Moss was extremely high grade. Lausen (1931) reported that, "From a hole only ten ft in diameter, $240,000 is said to have been taken out.", from a site immediately to the east of the later site of Allen Shaft. The extremely high-grade ore was likely the result of near- surface enrichment, creating coarse free gold. Later mining near the high-grade pocket found coarse gold flakes and wire gold along with iron and manganese oxides in vugs (Lausen, 1931).
The available records show that Moss sold the Moss Lode to Dahrean Black and that it was later sold to the Gold Giant Mining and Milling Company of Los Angeles. The area around the glory hole was explored by numerous holes and tunnels, but no other substantial quantities of gold are reported to have been found. Ransome (USGS Bulletin 743 - Preliminary Report 1923) stated that $240,000 worth of gold (approximately 12,000 ounces) was recovered by Moss.
Following its abandonment in 1866, there was little mining activity in the district until the discovery of the regionally famous Gold Road Vein in 1901. The town of Vivian was founded in that year; its name was changed to Oatman in 1908. In 1906, the Tip Top and Ben Harrison mineralized shoots were discovered. In 1915 and 1916 the Big Jim, Aztec and United Eastern mineralized bodies were discovered on the Tom Reed Vein. Mining activity increased and the population of Oatman grew to a reported 10,000 (today referred to as the Oatman gold mining boom, 1915 to 1917). By the mid-1920s the population of Oatman had fallen to a few hundred. In 1933, an increase in the gold price from US$20 to US$35 per ounce resulted in a brief flurry of activity, but all the local mines were closed by 1942 (Ransome, 1923; Sherman & Sherman, 1969; Varney, 1994).
Historical underground mine plans of the Moss Mine in GVC's database are dated May 10, 1915 by Gold Road Mines Co. of Gold Road, Arizona, and September 25, 1920 by the Moss Mines Co. of Gold Road, Arizona. These show the Allen Shaft and levels at 60 ft, 75 ft, 125 ft and 220 ft. The plans show that Moss Mine was operating between 1915 and 1920.
The available records show that the Ruth Mine was accessed by a 60º degree incline shaft to drifts on the 100-ft, 200-ft and 300-ft Levels. Activity appears to have continued through to mid-1935, by which time approximately 600 ft of drifting is reported to have been completed.
|
Mako Mining Corp. |
1.4.2 Previous Exploration and Development (1982 to 2009)
Table 1.1 summarizes the work carried out on the Moss Mine Project by previous owners and operators, up to and including Patriot Gold's last exploration program in 2009.
Table 1.1
Summary of Exploration and Development Work Carried Out by Previous Owners and Operators on the Moss Mine Project (the 15 patented lode claims) to 2009
| Company | Date | Work Completed | Comments |
| Moss Mine | 1860 to 1920 | Surface holes and underground mining | 12,000 oz of gold reported to have been extracted |
| Ruth Mine | 1900? to 1935 | Underground mining | Approx. 24,400 t of mineralized material extracted |
| BF Minerals | 1982 | 54 rotary air trac holes, four reverse circulation ("RC") holes for a total of approximately 6,190 ft | Only assayed Moss Vein material. |
| Harrison Minerals | 1987 to 1988 (exact dates unknown) | Rehabilitated Allen Shaft and deepened it to 300 ft | Constructed headframe in 1987, reportedly left broken mineralized material in stopes, 3,000 to 5,000 short tons trucked to Tyrol mill. |
| Billiton Minerals | 1990 | 21 RC holes for a total of 6,925 ft | Preliminary analysis of gold and silver deportment, preliminary metallurgical tests. |
| Magma Copper Company | 1991 | 21 RC holes for a total of 9,890 ft | Developed local geological maps. Metallurgical testwork carried out by McClelland Laboratories. |
| Reynolds Metals Explorations, Inc. | 1991 | 11 holes for 4,865 ft, plus two RC holes 500 ft | Collar coordinates are not available. |
| Golconda Resources | 1993 | 19 RC holes for a total of 3,058 ft | |
| Addwest Minerals International Ltd. | 1996 to 1997 | 30 RC holes for a total of 8,217 ft plus six diamond holes for a total of 1,667 ft | Developed a new geological model. |
| Patriot Gold Corporation | 2004 to 2009 | 43 RC holes for a total of 11,807 ft plus 12 diamond holes for a total of 6,846 ft | Consolidated the land position, carried out geological studies and surveys. Contracted Metcon Research to carry out metallurgical testwork. |
1.4.3 Operating Phases of the Moss Mine under Northern Vertex Mining Corporation (2013 to 2021)
1.4.3.1 Phase I
The Phase I pilot heap operations were carried out in 2013 and 2014 to test the metallurgical parameters for commercial operations. The Phase I facilities included an open pit, heap leach pad, barren and pregnant solution ponds, a carbon recovery plant, and ancillary facilities such as an onsite laboratory, onsite diesel power, a medical/safety office and a general office trailer.
|
Mako Mining Corp. |
The heap leach stage of the operation was carried out from August 2013 to September 2014. During this period, a weak cyanide solution was applied to the top of the heap using drip irrigation. Solutions were recovered to a pregnant solution pond and then circulated through conventional carbon columns. The loaded pregnant carbon was then shipped offsite to a stripping facility to recover the precious metals. The stripped carbon was then returned to the Moss project site for re-use.
1.4.3.2 Phase II
Phase II of the Project was based on the 2015 Feasibility Study (and NI 43-101 Technical Report dated June 2015) that involved mining and processing material wholly contained within the patented claim boundaries, which could be accessed without trespass onto adjacent public lands administered by the BLM. The necessary permits and capital were obtained and Phase II commenced construction in late 2017 with eventual operation during 2018 that consisted of mining, crushing, agglomeration and stacking of ore onto a conventional heap leach pad. Commercial production was declared as of September, 2018. Gold and silver recovery were achieved by a Merrill Crowe process to produce doré bars at the Project site.
The operation was designed for a five-year mine life based on a throughput of 5,000 tons per day.
1.4.3.3 Phase III
Phase III of the Project, which was based on the November, 2017 Technical Report, extended operations onto the adjacent federal lands administered by the Bureau of Land Management (BLM). This third phase allowed Northern Vertex Mining to take full advantage of the estimated Measured and Indicated mineral resources. The third phase necessitated an expanded waste rock facility to accommodate the additional waste rock as well as an expanded heap leach pad to treat the additional mineralized material.
BLM issued a Decision Record and Finding of No Significant Impact (FONSI) regarding GoldenVertex's Mine Plan of Operation on March 18, 2020 based on analysis provided in the Phase III Moss Mine Expansion and Exploration Project Environmental Assessment (EA).
1.4.4 Exploration and Operation of Moss Mine under Elevation Gold Mining Corp July, 2021 to 2024
During the period 2021 to 2022, drilling at the Moss Mine focused on infill and expansion drilling within or near the planned pits. The table below shows the areas, objectives and highlights of significant drill intersects. This drilling extended the known mineralization at depth and along strike to the west in 4 areas. In addition, 7 condemnation holes were drilled in the Rattan area for the 3B leach pad. Several of these holes had intervals above the cut-off grade, however, not enough to justify applying for new permits to move the proposed leach pad.
On March 16, 2023, Elevation Gold announced an intersection of a 100.6 m thick zone with an average grade of 0.5 g/t Au at the Reynolds area. Subsequent drilling of 50 RC drill holes accounting for 23,990m were drilled in the Reynolds area and continued to identify a wide mineralized zone. The geology in the Reynolds area is distinct from the main Moss vein area as it is the only mineralization identified to date that is hosted in volcanic rocks as opposed to intrusive rocks. In addition, no coherent quartz veins were identified in the RC drilling.
|
Mako Mining Corp. |
1.5 Geological Setting and Mineralization
1.5.1 Regional Geology
In a regional structural context, the Oatman district lies in the transition zone between the stable Colorado Plateau on the north and disrupted terrane of the highly extended Basin and Range on the south. Although the area is broken into north-south trending ranges and valleys typical of the Basin and Range, extension is minor.
The Oatman mining district lies within a large Tertiary volcanic field, developed on a basement of Precambrian granitic and metasedimentary rocks. A batholitic body of trachytic magma invaded the volcanic field to the northwest of Oatman, culminating in massive pyroclastic eruptions of the Peach Springs tuff, resulting in collapse of the roof of the batholith and formation of the huge Silver Creek caldera at ~18.8 Ma (Ferguson et al., 2013). The Peach Springs tuff fills the caldera; its outflow ash-flow sheet extends for more than 100 miles from the caldera, covering more than 15,440 square miles across northwest Arizona and California (Pamukcu, et al, 1986). The main Oatman district lies just outside of the caldera rim, where mineralization is hosted in pre-caldera intermediate composition lava flows; whereas Moss lies inside the caldera and is hosted in intra-caldera tuffs and intrusions.
1.5.2 Host Rocks
The dominant host rock of the Moss deposit is the Moss porphyry, a polyphase monzonite to quartz monzonite porphyry, which intrudes the Peach Springs tuff. Typical Moss porphyry contains coarse grained (4 mm to 10 mm) plagioclase and biotite phenocrysts with lesser hornblende in a very fine-grained groundmass of quartz and feldspar. The Moss stock contains several phases, including equigranular quartz monzonite to monzodiorite, and more felsic phases. Within the project area, the porphyry has undergone weak early propylitic and potassic alteration, characterized by potassic feldspar partially replacing plagioclase feldspar. Sparsely porphyritic feldspar porphyry and rhyolite porphyry to aplite dikes with quartz eyes crosscut the porphyry and the volcanic wall rocks and constitute minor host rocks. Late (post-mineral) micro-gabbro to basalt dikes cut all units along north-trending faults.
The easternmost portion of the Project area and the western portions of the claims, west of the West Pit, are underlain by the Peach Springs tuff, (formerly the Alcyone Formation), consisting of volcanic tuffs, flows, and minor volcaniclastic sediments filling the caldera. In the project area, the Peach Springs tuff is a thick, highly variable unit composed dominantly of several welded trachytic ash-flow tuff sheets separated by coarse volcaniclastic sediments, debris flows, and volcanic breccias. Lithic-rich welded tuff is common.
Locally, large-foundered blocks of Precambrian granite, representing landslide deposits from the caldera walls, occur within the tuff. Welded tuffs within the Peach Springs tuff are competent units capable of hosting both persistent veins and stockworks.
|
Mako Mining Corp. |
The Times granite, a fine-to medium grained leucogranite, forms an irregular intrusion centred to the south of Silver Creek. Age relations between the Moss porphyry and the Times granite are uncertain; the two intrusions appear to intermingle in several places. The granite is a host rock at the West Oatman prospect.
1.5.3 Mineralization
Gold-silver mineralization in the West Oatman district occurs as high-level low-sulfidation epithermal veins and stockworks. The mineralization is very similar to that of the main Oatman mining district. The Moss Vein may represent the western extension of the Gold Road vein on the north end of the Oatman district.
Three main veins and their associated stockworks host the bulk of mineralization defined to date at Moss:
1) The Moss Vein and its extensions to the west and east of the resource area.
2) The Ruth Vein to the immediate south of the Moss Vein.
3) The West Oatman Vein, lying about one mile to the south of the Moss Vein.
1.6 Metallurgical Testing and Mineral processing
The Moss Mine utilizes conventional crushing to approximately P90 6.3 mm (¼ inch), followed by valley-fill heap leaching. Gold and silver are recovered from pregnant leach solution using a Merrill-Crowe zinc cementation process, with doré bars produced on site. The nominal processing rate is 5,500 short tons per day.
Metallurgical testwork has been conducted on an ongoing basis and includes bottle roll tests (weekly) and column leach tests (monthly) using representative crushed ore composites. Historical column testwork reported average gold recoveries of approximately 80% at laboratory scale, with recommended scale-up adjustments resulting in estimated operational recoveries of 75-77% gold and 40-43% silver. Testing demonstrated that gold recovery was relatively consistent and characterized by rapid early leaching followed by slower diffusion-controlled recovery. Silver recoveries were more variable and exhibit slower leach kinetics.
Column test results from 2022-2023 showed average gold recoveries of approximately 74% over average leach periods of about 107 days, with results generally consistent with commercial heap leach performance. Silver recoveries during the same period averaged approximately 25%, with greater variability observed. Operational reconciliation data from 2018 through 2024 indicate cumulative recovery factors of approximately 75% for gold and 40% for silver, which are consistent with testwork results and production history.
The mine has generated substantial operating data since commencing production in 2018, providing a strong empirical basis for recovery forecasting. No deleterious elements affecting metallurgical performance have been identified to date.
|
Mako Mining Corp. |
Based on historical testwork, ongoing metallurgical programs, and production reconciliation, the recommended metallurgical recovery assumptions for use in this Technical Report are 75% for gold and 33% for silver.
Continued metallurgical monitoring, statistical correlation between bottle roll and column results, extended column testing to determine ultimate recoveries, and additional investigation into silver recovery variability are recommended to maintain confidence in long-term recovery projections.
1.7 Mineral Resource Estimate
1.7.1 Introduction
The mineral resource estimate was carried out by Chris Keech, P.Geo., Principal Geologist of CGK Consulting Services Inc (CGK) using MineSight® version 15.4 software for the development of the block model gold and silver block grade estimates and Geostokos Toolkit® for variography analysis of the composited gold and silver grades. Mr. Keech is a Qualified Person and is independent of Mako as defined by NI 43-101.
The mineral resources estimate for the Moss Mine Project has been carried out in accordance with the CIM's "Estimation of Mineral Resources and Mineral Reserves Best Practice Guidelines" (November 2019). The mineral resources have been generated from drill hole data the interpretation of a geological model that identifies the spatial distribution of the gold and silver grades. The interpolation parameters have been defined based on the drill hole data and the geological interpretation and geostatistical analysis of that data.
The mineral resources have been classified by proximity to data locations and the quality of the data and have been reported in accordance with CIM's "Standards on Mineral Resources and Reserves" (May 2014) as required by NI 43-101.
1.7.2 Drill Hole Database
The drill hole data inside the block model area consists of 1,169 drill holes totalling 452,086 ft of drilling with 87,471 sample intervals. RC drilling has contributed more than 55% of the drill holes and more than 81% of the sample intervals to the drill hole database inside the block model limits. Next are the core drill holes, which have contributed 11% of the holes and 12% of the sample intervals. The remaining 33% of the drill holes are short rotary holes which account for 6% of the sample intervals.
1.7.3 Geological Model
The Geological Block Model was constructed based on four wireframe solids that represent the Stockwork mineralization, the Moss Vein, the Ruth Vein and a higher-grade Reynolds Stockwork mineralization. This interpretation was developed by Mr. Gary Wong, P.Eng of PDM Technical Services Ltd. on Northwest facing cross-section. In addition to these wireframe solids, two surfaces were also considered, one representing the Canyon fault and the other representing the geological contact between the Intrusive rocks in the east with the Volcanic rocks in the west.
This geological interpretation was used to code the block model and develop 10 geological domains.
|
Mako Mining Corp. |
The Stockwork mineralization has been divided into three domains, East Stockwork Intrusive, West Stockwork Intrusive and Volcanic Stockwork Intrusive. Inside the East Stockwork, lies the Ruth and Moss Veins. The Moss Vein dips steeply to the south, while the Ruth Vein dips moderately to the north. Both veins are enveloped by the Stockwork style mineralization.
The drill hole assays were coded using the block model to assign the geological codes that were used to carry out the Exploratory Data Analysis and Variography.
1.7.4 Exploratory Data Analysis
Statistical and graphical summaries of the gold and silver grades were produced to understand the distribution of the grades in the deposit. The statistical and graphical summaries include histograms, log-probability plots, side-by-side boxplots, scatterplots, decile analysis plots and contact plots. The assays were separated by mineralised zone to examine the distribution of the gold and silver assay grades. The results of this analysis were used to develop the estimation parameters.
1.7.5 Composites
Analysis of the sample lengths shows that 87% of the assays inside the block model area are 5 ft in length. Compositing the drill hole assay intervals provides a common sample support for the estimation algorithm. The selected bench height for the block model is 20 ft and often a half bench height (10 ft) is a good choice for a composite length, as there is some variance reduction, but not too much, and there is a reduction in the number of data to be used by the estimation algorithm. Therefore, a 10 ft composite length was chosen for the estimation of gold and silver grades. The compositing started at the collar of the hole and proceeded at 10 ft regular intervals down the drill holes.
1.7.6 Density
A total of 506 specific gravity determinations were performed on drill core samples collected from material within the mineralized zones. These determinations were performed by ALS Chemex laboratory using unsealed immersion technique to measure the weight of each sample in air and in water (ALS Chemex standard OA-GRA08).
Previous work with the 506 SG determinations has shown that material within 40 ft of the surface has a lower dry bulk density of 2.51 g/cm and that material below 40 ft depth has a higher dry bulk density of 2.58 g/cm.
However, a tonnage factor of 12.35 cu-ft/short ton has been used by Moss Mine since the mine opened, and this factor has proven to be sufficiently accurate to be considered reliable in estimating the mined tonnage. This is equivalent to a dry density of 2.59 g/cm.
Consequently, for this mineral resource estimate, the QP for this section of the report recommends continuing the use of 12.35 cu-ft/short ton as the tonnage factor for estimating all in-situ tonnage estimated in the block model.
|
Mako Mining Corp. |
1.7.7 Block Model
A 3D block model was constructed using MineSight® 15.4 software with the dimensions shown in Table 14.10. The block size was chosen to reflect a potential selective mining unit (SMU) of 20 ft x 20 ft x 20 ft, given the anticipated open-pit mining scenario. The block model covers an area of approximately 10,000 ft by 4,000 ft in plan view, and approximately 2,200 ft vertically. The block model coordinates are in local coordinates, which are based on Arizona State Plane West Zone, 0203; UTM 12.
The estimation of gold and silver grades was carried out using ordinary kriging in MineSight® 15.4 software using a three-pass search strategy to use the most local 10ft composite data to a block location being estimated
1.7.8 Gold Grade Estimation Parameters
The following is a summary of the parameters used to estimate the block gold grades by domain in the block model.
• Capped gold grade 10 ft composites were used for ordinary kriging into the blocks in the model for domains 1, 2, 3, 4, 5, 6, 7, 8, 9, 10.
• In addition to capping the 10 ft gold composite grades, an outlier restriction of 40 ft was used for domains 1, 2, 3, and 10; and an outlier restriction of 60 ft was used for domains 4, 5 and 9 (Stockwork). The grade thresholds for the outlier restriction were taken from the Decile Analysis results. No outlier restrictions were used for domains 6, 7 and 8 (Ruth and Moss Veins).
• Geological boundaries are based on the domain wireframes, and the domain codes were assigned to the block model and used to control the selection of the 10 ft composites and the blocks to be estimated. There was no sharing of composites across the domain boundaries.
• Spatial 3D mathematical models were fitted to the experimental semi-variograms for each of the domains and used for ordinary kriging of the blocks in the model.
• A three-pass search strategy was used with the ranges based on the drill hole spacing and semi-variogram models. The search ellipsoids were expanded to ensure a reasonable amount of the blocks in each domain were estimated.
• A minimum of four and maximum of 16 composites were required to make a block estimate, with a maximum of four from a single drill hole for pass 1.
• A minimum of eight and maximum of 16 composites were required to make a block estimate, with a maximum of four from a single drill hole for pass 2.
• A minimum of 12 and maximum of 16 composites were required to make a block estimate, with a maximum of four from a single drill hole for pass 3.
1.7.9 Silver Grade Estimation Parameters
The following is a summary of the parameters used to estimate the block silver grades by domain in the block model.
• Capped silver grade 10ft composites were used for ordinary kriging into the blocks in the model for domains 1, 2, 3, 4, 5, 6, 7, 8, 9, 10.
|
Mako Mining Corp. |
• In addition to capping the 10ft silver composite grades, an outlier restriction of 40ft was used for domains 1, 2, 3, and 10; and an outlier restriction of 60ft was used for domains 4, 5 and 9 (Stockwork). The grade thresholds for the outlier restriction were taken from the Decile Analysis results. No outlier restrictions were used for domains 6, 7 and 8 (Ruth and Moss Veins).
• Geological boundaries are based on the domain wireframes, and the domain codes were assigned to the block model and used to control the selection of the 10ft composites and the blocks to be estimated. There was no sharing of composites across the domain boundaries.
• Spatial 3D mathematical models were fitted to the experimental semi-variograms for each of the domains and used for ordinary kriging of the blocks in the model.
• A three-pass search strategy was used with the ranges based on the drill hole spacing and semi-variogram models. The search ellipsoids were expanded to ensure a reasonable amount of the blocks in each domain were estimated.
• A minimum of four and maximum of 16 composites were required to make a block estimate, with a maximum of four from a single drill hole for pass 1.
• A minimum of eight and maximum of 16 composites were required to make a block estimate, with a maximum of four from a single drill hole for pass 2.
• A minimum of 12 and maximum of 16 composites were required to make a block estimate, with a maximum of four from a single drill hole for pass 3.
1.7.10 Classification of Mineral Resources
To classify the block model grade estimates for the Moss Mine Project into the mineral resource categories of measured, indicated, and inferred, a statistical approach is employed to develop a classification scheme that complies with the CIM Best Practice Guidelines and NI 43-101 Regulations for the reporting of Mineral Resources and Mineral Reserves.
The underlying philosophy of this approach is to quantify the uncertainty of estimated contained metal in quarterly and yearly production. The uncertainty (or reliability) of estimation is a function of the spatial variability of the mineralization and the sample spacing.
Once the spatial variability of the mineralization is quantified through some type of spatial correlation function (semi-variogram, correlogram, etc.), it is possible to estimate the uncertainty of estimation for different sampling spacing and patterns over the two time periods.
A drill hole spacing study is carried out to determine the sample spacing and pattern that allows yearly production to be predicted to within 15% with a 90% confidence. This forms the basis for classifying indicated resources.
In a similar way the pattern and spacing are developed to form the basis for classifying measured resources. (The exact procedure for determining the confidence limits and grid spacing is given in Davis, B. M., Some Methods of Producing Interval Estimates for Global and Local Resources, SME preprint 97-5, 4 p.)
For the Moss Mine Project, measured material is considered known within ±15% with a 90% confidence a quarterly production period, and indicated material is considered known within ±15% with a 90% confidence for an annual production period. The methodology considers an idealised block representing a one-month production period. Then a series of grids of different drill hole spacings are used to krige the idealized block to calculate the kriging variance. The idealized block for a one-month production period is approximately a panel of 430 ft by 430 ft by 20 ft. The kriging variance needs to be adjusted by the square of the CV to obtain a relative variance as normalized semi-vairogram models were used to krige the panel. The kriging variance is then divided by 3 to get the quarterly production variance and by 12 to get the annual production variance. This gives the sample spacing for the measured and indicated categories.
|
Mako Mining Corp. |
The sample spacing information is then translated into a set of proximity of drill hole sampling-based classification rules. A 75 ft by 75 ft drill hole spacing would be sufficient to predict the block grade estimates within ±15% 90% of the time on a quarterly basis. This material would be considered as measured. A 200 ft by 200 ft drill hole spacing would be sufficient to predict the block grade estimates within ±15% 90% of the time on an annual basis. This material would be considered as indicated.
The rules used to delineate the mineral resources are defined as follows:
• Measured - minimum of 3 holes inside a 60 ft radius
• Indicated - minimum of 3 holes inside a 160 ft radius or a minimum of 2 holes inside a radius of 80ft or a minimum of one hole inside a radius of 50 ft.
• Inferred - are the remaining estimates up to 600 ft search radius.
The resulting codification of the block in the model was then smoothed looking for continuous clusters of blocks that are measured or indicated to remove any possible "spotted dog" effect. The "spotted dog" effect is the term used to describe isolated areas of measured or indicated material that is caused by the classification rules and isolated drill holes. Figure 14.19 displays a plan view of the classification as coded based on the rules listed above. Figure 14.20 displays a plan view after removing the isolated patches of measured and indicated material.
Summary statistics of the amount of data and distance to that data were generated to confirm the reliability of block gold grade estimates. Table 14.18 display summary statistics for the comparative confidence in the block model estimates including: the number of informed octants (NOCT), the number of drill holes used for a block estimate (NHOL), the number of composites used for a block estimate (NCMP), the distance to the nearest composite (NDIST), the average distances to the composites (ADIST), the distance to the farthest composite (FDIST), the kriging variance (OKVAR), the slope of regression (OKSLP) and the kriging efficiency (OKEFF).
A typical measured block gold grade estimate is informed by 16 composites from 5 drill holes in 5 octants with an average distance of 79.5 ft, kriging variance of 0.2176, a slope of regression of 0.9345, and a kriging efficiency of 68.4%.
A typical indicated block gold grade estimate is informed by 15 composites from 5 drill holes in 5 octants with an average distance of 140.3 ft, kriging variance of 0.3192, a slope of regression of 0.8791, and a kriging efficiency of 53.2%.
|
Mako Mining Corp. |
A typical inferred block gold grade estimate is informed by 9 composites from 3 drill holes in 3 octants with an average distance of 342.3 ft, kriging variance of 0.6835, a slope of regression of 0.4645, and a kriging efficiency of -8.4%.
1.7.11 Reasonable Prospects of Eventual Economic Extraction
To meet the CIM requirements of reasonable prospects of eventual economic extraction, an optimized pit shell was used to limit the mineral resources estimate at depth. A mineral resource pit shell limit was built by GVC using MineSight software by means of a Lerchs-Grossmann pit design method using the parameters listed in Table 1.2. The pit ("solid PIT19 $2500 MII") was optimized using material classified as measured indicated and inferred.
Table 1.2
Summary of Parameters for Mineral Resources Pit Resource Shell
| Description | Open Pit Shell |
| Mining Cost (US$/ton) | $3.18 |
| Mining Fill Cost (US$/ton) | $1.91 |
| Processing Cost (US$/ore ton) | $5.81 |
| G&A Cost (US$/ore ton) | $0.77 |
| Refinery Services and logistics Cost ($US/ore ton) | $0.28 |
| Gold Price (US$/oz) | $2,500 |
| Silver Price (US$/oz) | $29.20 |
| Royalties (%) | 0% |
| Gold Recovery Factor (%) | 75% |
| Silver Recovery Factor (%) | 33% |
| Pit Slope - Constant (degrees) | 55° |
| Breakeven Cut-off Grade (Au oz/ton) | 0.005 |
1.7.12 Mineral Resource Estimation Tabulation
The mineral resource estimate was completed by Mr. Chris Keech, P.Geo., a Qualified Person as defined in NI 43-101 and who is independent of Golden Vertex Corp., the limiting pit shell for the mineral resources estimate was developed by Mr. G. Vejar, Senior Mine Engineer of Mako. The open pit mineral resources are stated within the mineral resource pit shell and below the previously mined surface.
The measured and indicated mineral resources are inclusive of those mineral resources modified to produce mineral reserves. The mineral resource figures have been rounded to reflect that they are estimates. Mineral resources that are not mineral reserves do not have demonstrated economic viability. The estimate of mineral resources may be materially affected by environmental, permitting, legal, title, taxation, socio-political, marketing, or other relevant issues. The Qualified Person for this section of the report is not aware of any issues that would materially affect the estimate of the mineral resources as of the date of this report.
There has been insufficient exploration to define the inferred resources as an indicated or measured mineral resources. It is uncertain if further exploration will result in upgrading them to an indicated or measured mineral resources category
|
Mako Mining Corp. |
The mineral resource pit shell was developed using the parameters listed in Table 1.2.
Table 1.3 presents a summary of the open pit mineral resources inside the mineral resource pit shell at a series of cut-off grades. The breakeven gold cut-off grade is calculated by Golden Vertex to be 0.005 oz/ton Au. Table 1.4 presents a summary of the mineral resources inside the mineral resource pit shell at the 0.005 oz/ton Au cut-off by the mineral resource categories.
The open pit mineral resources for the Moss Mine Project are estimated to be 62.9 Mtons of measured and indicated material grading 0.0103 oz/ton Au and 0.1081 oz/ton Ag for a total of 646 koz of gold and 6.8 Moz silver. There are additional inferred open pit mineral resources, which are estimated to be 13.6 Mtons grading 0.0090 oz/ton Au and 0.0427 oz/ton Ag for a total of 122 koz of gold and 0.58 Moz silver.
Table 1.3
2025 Mineral Resource Estimate Sensitivity Analysis for a Series of Cut-Off Grades*
|
Category |
Cutoff oz/ton AuEq. |
k tons |
AuEq oz/t |
Au oz/t |
Ag oz/t |
Au (koz) |
Ag (koz) |
|
Measured |
>= 0.0030 |
14,302 |
0.0093 |
0.0088 |
0.1091 |
126 |
1,560 |
|
>= 0.0040 |
12,423 |
0.0102 |
0.0096 |
0.1203 |
119 |
1,494 |
|
|
>= 0.0050 |
10,527 |
0.0113 |
0.0106 |
0.1330 |
112 |
1,400 |
|
|
>= 0.0060 |
8,525 |
0.0126 |
0.0119 |
0.1489 |
101 |
1,269 |
|
|
>= 0.0070 |
6,696 |
0.0143 |
0.0135 |
0.1682 |
90 |
1,126 |
|
|
Indicated |
>= 0.0030 |
67,370 |
0.0092 |
0.0087 |
0.0896 |
586 |
6,036 |
|
>= 0.0040 |
60,133 |
0.0099 |
0.0094 |
0.0957 |
565 |
5,755 |
|
|
>= 0.0050 |
52,383 |
0.0107 |
0.0102 |
0.1031 |
534 |
5,401 |
|
|
>= 0.0060 |
44,282 |
0.0116 |
0.0111 |
0.1125 |
492 |
4,982 |
|
|
>= 0.0070 |
36,136 |
0.0128 |
0.0122 |
0.1251 |
441 |
4,521 |
|
|
Measured and Indicated |
>= 0.0030 |
81,672 |
0.0092 |
0.0087 |
0.0930 |
712 |
7,597 |
|
>= 0.0040 |
72,556 |
0.0100 |
0.0094 |
0.0999 |
685 |
7,249 |
|
|
>= 0.0050 |
62,910 |
0.0108 |
0.0103 |
0.1081 |
646 |
6,801 |
|
|
>= 0.0060 |
52,807 |
0.0118 |
0.0112 |
0.1184 |
593 |
6,251 |
|
|
>= 0.0070 |
42,832 |
0.0130 |
0.0124 |
0.1318 |
531 |
5,647 |
|
|
Inferred |
>= 0.0030 |
17,178 |
0.0081 |
0.0079 |
0.0404 |
136 |
694 |
|
>= 0.0040 |
15,322 |
0.0087 |
0.0085 |
0.0417 |
130 |
639 |
|
|
>= 0.0050 |
13,587 |
0.0092 |
0.0090 |
0.0427 |
122 |
580 |
|
|
>= 0.0060 |
11,573 |
0.0099 |
0.0096 |
0.0440 |
111 |
509 |
|
|
>= 0.0070 |
9,280 |
0.0107 |
0.0105 |
0.0463 |
97 |
430 |
*Notes: Mineral resources are estimated in conformance with the CIM mineral resource definitions referred to in NI 43-101 Standards of Disclosure for Mineral Projects. This mineral resource estimate covers the Moss Mine Project. Mineral resources that are not mineral reserves do not have demonstrated economic viability. The quantity and grade of the reported inferred mineral resources in this estimation are conceptual in nature and are estimated based on limited geological evidence and sampling. Geological evidence is sufficient to imply but not verify geological and grade or quality continuity. For these reasons, an inferred mineral resource has a lower level of confidence than an indicated mineral resource, however it is reasonably expected that most of the inferred mineral resources could be upgraded to indicated mineral resources with continued exploration. Mineral resources are reported within an optimized constraining shell using a gold price of US$2,500/oz and a silver price of US$29.2/oz with a gold recovery of 75% and a silver recovery of 33%. Gold grades were estimated using 10ft capped composites within 10 geological domains using ordinary kriging. Summation errors may occur in the tabulated results due to rounding.
|
Mako Mining Corp. |
Table 1.4
Summary of 2025 Mineral Resource Estimate by Classification Category*
|
Category |
Cut-off oz/ton AuEq. |
k tons |
AuEq oz/t |
Au oz/t |
Ag oz/t |
Au (koz) |
Ag (koz) |
|
Measured |
0.005 |
10,527 |
0.0113 |
0.0106 |
0.1330 |
112 |
1,400 |
|
Indicated |
0.005 |
52,383 |
0.0107 |
0.0102 |
0.1031 |
534 |
5,401 |
|
Measured + Indicated |
0.005 |
62,910 |
0.0108 |
0.0103 |
0.1081 |
646 |
6,801 |
|
Inferred |
0.005 |
13,587 |
0.0092 |
0.0090 |
0.0427 |
122 |
580 |
*Notes: Mineral resources are estimated in conformance with the CIM mineral resource definitions referred to in NI 43-101 Standards of Disclosure for Mineral Projects. This mineral resource estimate covers the Moss Mine Project. Mineral resources that are not mineral reserves do not have demonstrated economic viability. The quantity and grade of the reported inferred mineral resources in this estimation are conceptual in nature and are estimated based on limited geological evidence and sampling. Geological evidence is sufficient to imply but not verify geological and grade or quality continuity. For these reasons, an inferred mineral resource has a lower level of confidence than an indicated mineral resource, however it is reasonably expected that most of the inferred mineral resources could be upgraded to indicated mineral resources with continued exploration. Mineral resources are reported within an optimized constraining shell using a gold price of US$2,500/oz and a silver price of US$29.2/oz with a gold recovery of 75% and a silver recovery of 33%. Gold grades were estimated using 10ft capped composites within 10 geological domains using ordinary kriging. Summation errors may occur in the tabulated results due to rounding.
1.8 Conclusions
Mako has acquired the Moss Mine Project out of bankruptcy and the updated resource estimate indicates that there are sufficient resources at the mine site for the operation along with good exploration potential in the immediate district from which to pursue secondary mining areas should further exploration prove the existence of economic mineralization.
The QP notes that since the Oatman Mining District is well known for its production history, there should be further zones of economic mineralization waiting to be fully defined by well-run exploration programs given the recent sustained rise in metal prices.
Mako is also in the process of bringing the Moss Mine Project back into full production as it has been refining the geological database and the geological model along with test mining various areas since acquiring the Project. The current mineral resources will most likely be used as the basis upon which Mako revises the production mine plan as it looks to revive full production at the Moss Mine Project.
This report may disclose technical information, the presentation of which requires the Qualified Persons (QPs) to derive sub-totals, totals and weighted averages that inherently involve a degree of rounding and, consequently, introduce a margin of error. Where these occur, the QPs do not consider them to be material.
1.8.1 Risks and Opportunities
All mineral resource projects have a degree of uncertainty or risk associated with them which can be due to technical, environmental, permitting, legal, title, taxation, socio-economic, marketing and political factors, among others. All mineral resource projects also present their own opportunities. Table 1.5 outlines some of the Moss Mine Project risks, their potential impact and possible means of mitigation. Table 1.5 also outlines some of the Moss Mine Project opportunities and potential benefits.
|
Mako Mining Corp. |
Table 1.5
Risks and Opportunities at the Moss Mine Project
| Risk | Description and Potential Impact | Possible Risk Mitigation |
| Local grade continuity. | Poor grade continuity. | Further develop and extend the structural model to other areas on the Moss Mine Project. Use the structural model in designing the drilling programs. |
| Local density variability. | Misrepresentation of the in-situ tonnes, which also affects the in-situ metal content estimate. | It is recommended to develop a procedure of collecting density measurements spatially throughout the deposit at regular intervals and implement their use in future mineralization models. |
| Geologic Interpretation. | If geologic interpretation and assumptions (geometry and continuity) used are inaccurate, then there is a potential lack of gold grade or mineralization continuity. | Continue infill drilling to upgrade mineral inventory to the Measured and Indicated categories. |
| Void Locations. | If technical knowledge of the historic mine infrastructure is incomplete, then this deficiency could lead to local inaccuracies of the mineral resources and potential safety exposures | Conduct drilling and surveys to validate void locations and document intersected workings and refine void management plan. |
| Metallurgical recoveries might be overstated as they are based on limited testwork. | Gold recovery might be lower than what is currently being assumed. A lower recovery will increase the economic cut-off grade. | Conduct additional metallurgical tests. |
| Difficulty in attracting experienced professionals. | Technical work quality will be impacted and/or delayed. | Refine recruitment and retention planning and/or make use of consultants. |
| Conceptual mine plans are based on limited geotechnical testwork. | Mining methods and dimensions selected might be different than what is currently being assumed. | Incorporate more comprehensive geotechnical data from drilling. Conduct additional geotechnical assessment and analysis. |
| Opportunities | Explanation | Potential Benefit |
| Surface and underground exploration drilling. | Potential to identify additional prospects and mineral resources. | Adding mineral resources increases the economic value of the mining project. |
| Potential improvement in metallurgical recoveries. | Additional metallurgical testwork can be performed to determine if recovery can be improved through ore sorting, flotation or cyanidation. | Lower capital and operating costs. |
| Potential improvement in mining assumptions. | Geotechnical analysis may determine mining methods and dimensions can be improved. | Improved mining assumptions may lower costs and reduce the cut-off grade for the mineral resource estimation. |
|
Mako Mining Corp. |
1.9 Budgets and Recommendations
1.9.1 Mine Geology/Exploration Budget
The current pits will require laybacks to access the additional resources that have been identified. It is recommended to complete a diamond drilling campaign and collect geotechnical information from several key areas and complete a geotechnical assessment of the pits. In addition, detailed mapping of the core is recommended, especially in the Reynolds pit area to determine the geologic controls at Reynolds. This logging should be augmented with a core scanning method to collect hyperspectral information which can be used in the regional exploration program. The recommended budget for the mine geology and exploration program is summarized in Table 1.6.
Table 1.6
Budget Summary for the Moss Mine Geology and Exploration Program
|
Description |
|
Cost $ US |
|
|
Drilling Costs |
Sub-Total: |
$778,185 |
|
|
|
Mobilization and De-mobilization |
|
$30,000 |
|
|
Direct Drilling Costs (4,650 ft @ $67/ft) |
|
$311,085 |
|
|
Drilling Support Costs (estimate/foot = $94) |
|
$437,100 |
|
Geotechnical Study Phase 1 |
Sub-Total: |
$38,065 |
|
|
|
Site Visit |
|
$11,049 |
|
|
Representative Field Mapping |
|
$11,329 |
|
|
Reporting |
|
$12,624 |
|
|
Administration and Project Management |
|
$3,063 |
|
Geotechnical Study Phase 2 |
Sub-Total: |
$172,001 |
|
|
|
Geotechnical Core Logging |
|
$44,803 |
|
|
Televiewer Processing/Reconciliation |
|
$10,428 |
|
|
Laboratory Testing Program |
|
$17,568 |
|
|
Develop and Update Geotechnical model |
|
$29,726 |
|
|
Geotechnical Analysis |
|
$31,539 |
|
|
Preparation of Report |
|
$31,666 |
|
|
Administrative and Project Management |
|
$6,271 |
|
|
|
Total: |
$988,251 |
1.9.2 Regional Exploration Budget
The regional geology at the Moss Mine Project is very permissive of the potential to make multiple, additional discoveries. Systematic exploration of the large land package at the Moss Mine Project will require multiple years of phased exploration programs. The initial program should consist of detailed geological mapping and sampling of outcropping vein/ breccia zones using multi-element geochemistry. During this program, samples should be taken for hyperspectral analysis. Target areas should be prioritized by sample results and proximity to the mine. Data should be entered into an Access database.
|
Mako Mining Corp. |
Once several targets have been identified they should be drilled in a Phase 1 drilling program (Table 1.7), then depending on results, advance to a more detailed drilling program in Phase 2 (Table 1.8).
Table 1.7
Regional Exploration Recommended Budget - Phase 1
|
Description - Phase 1 |
Cost $ US |
||
|
Phase 1 Target Definition |
Sub-Total: |
$108,000 |
|
|
|
Modeling & Mapping - Geological Consulting |
|
$50,000 |
|
|
Access Database |
|
$8,000 |
|
|
Hyperspectral Scanning |
|
$50,000 |
|
Phase 1 Direct Drilling Costs |
Sub-Total: |
$668,050 |
|
|
|
Environmental & Safety |
|
$1,361 |
|
|
Direct Diamond Drilling Cost |
|
$571,494 |
|
|
Laboratory - Assays |
|
$58,974 |
|
|
Upgrade Core Logging & Storage Facility |
|
$32,100 |
|
|
Welding, Compressor etc. |
|
$4,121 |
|
Phase 1 Drilling Support |
Sub-Total: |
$212,160 |
|
|
|
Workforce (Consultants) |
|
$156,000 |
|
|
Travel Expense - Airfare, Rail, Mileage |
|
$19,999 |
|
|
Site Preparation |
|
$34,961 |
|
|
Machinery & Equipment Maintenance |
|
$480 |
|
|
Mechanical Parts - By Inventory |
|
$720 |
|
Phase 1 Office Costs |
Sub-Total: |
$30,041 |
|
|
|
Office Logistics & Supplies |
|
$30,041 |
|
|
Phase 1 Sub-Total: |
$1,018,251 |
|
Table 1.8
Regional Exploration Recommended Budget - Phase 2
|
Description - Phase 2 |
Cost $ US |
||
|
Phase 2 Direct Drilling Costs |
Sub-Total: |
$953,925 |
|
|
|
Environmental & Safety |
|
$2,041 |
|
|
Direct Diamond Drilling Cost |
|
$857,241 |
|
|
Laboratory - Assays |
|
$88,462 |
|
|
Welding, Compressor etc. |
|
$6,181 |
|
Phase 2 Drilling Support |
Sub-Total: |
$318,240 |
|
|
|
Workforce (Consultants) |
|
$234,000 |
|
|
Travel Expense - Airfare, Rail, Mileage |
|
$29,999 |
|
|
Site Preparation |
|
$52,441 |
|
|
Machinery & Equipment Maintenance |
|
$720 |
|
|
Mechanical Parts - By Inventory |
|
$1,080 |
|
Phase 2 Office Costs |
Sub-Total: |
$45,061 |
|
|
|
Office Logistics & Supplies |
|
$45,061 |
|
|
Phase 2 Sub-Total: |
$1,317,226 |
|
|
|
Total Phase 1 + Phase 2 |
$2,335,477 |
|
|
Mako Mining Corp. |
The budget presented in Table 1.6, Table 1.7 and Table 1.8 summarizes Mako's estimated costs for completing the work at the Moss Mine Project as well as potentially two phases of regional exploration program.
It is the opinion of the QPs that all of the recommended work is warranted and that only the location of the actual drilling needs to be re-evaluated, as assay results are obtained from the drilling as the program progresses. The QPs appreciate that the nature of the programs and expenditures may change as further studies are undertaken, and that the final expenditures and results may not be the same as originally proposed. The QPs believe that the second phase of the regional exploration may change depending on the results obtained during the first phase of drilling and that Mako revisits the estimated budget for the second phase prior to execution of the second phase.
The QPs are of the opinion that the recommended work program and proposed expenditures are appropriate and well thought out. The QPs believe that the proposed budget reasonably reflects the type and amount of the contemplated activities, at this time.
1.9.3 Further Recommendations
In addition to the above exploration and drilling programs at the Moss Mine Project and regionally the QPs make the following recommendations:
1) Continue to conduct infill and exploration drilling at the Moss Mine Project and update the resource estimates as drill campaigns are completed.
2) Conduct periodical Acid-Base testing to ensure there is no acid drainage issues at the Moss Mine Project and any secondary mineralized zones that are subject to exploration.
3) Conduct further metallurgical testwork on any secondary mineralized zones that are subject to exploration as various zones may have different recoveries based upon the mineralization found within each zone.
|
Mako Mining Corp. |
2.0 INTRODUCTION
2.1 Terms of Reference
Micon International Limited (Micon) has been retained by Mako Mining Corp. (Mako) to prepare a an NI 43-101 Technical Report for the Moss Mine Project (Moss Mine Project or the Project) located in the Oatman Mining District, Mohave County, Arizona, in order to disclose the 2025 Mineral Resource Estimate (MRE) in accordance with National Instrument 43-101 Standards of Disclosure for Mineral Projects (NI 43-101).
This report may disclose technical information, the presentation of which requires the Qualified Persons (QPs) to derive sub-totals, totals and weighted averages that inherently involve a degree of rounding and, consequently, introduce a margin of error. Where these occur, the QPs do not consider them to be material.
The conclusions and recommendations of this report reflect the QPs' best independent judgment in light of the information available to them at the time of writing. Micon and the QPs reserve the right, but will not be obliged, to revise this report and conclusions if additional information becomes known to them subsequent to the date of this report. Use of this report acknowledges acceptance of the foregoing conditions.
This report is intended to be used by Mako subject to the terms and conditions of its agreement with Micon. That agreement permits Mako to file this report as a Technical Report on SEDAR+ (www.sedarplus.ca) pursuant to applicable Canadian securities legislation.
Micon and the QPs are independent of Mako as defined under Section 1.5 of NI 43-101. Neither Micon nor the individual QPs have, nor have they previously had, any material interest in Mako and its related entities. The relationship with Mako is solely a professional association between the client and the independent consultants. This report is prepared in return for fees based upon agreed commercial rates and the payment of these fees is in no way contingent on the results of this report.
Micon and the QPs are pleased to acknowledge the helpful cooperation of Mako management, personnel and consulting field staff, all of whom made any and all data requested available and responded openly and helpfully to all questions, queries and requests for material.
2.2 Discussions, meetings, Site Visit and Qualified Persons
In order to undertake the Technical Report for the Moss Mine Project, the QPs of this Technical Report held a number of discussions and meetings with Makos' personnel and contractors, to discuss details relevant to any historical exploration programs and production from the mineral concessions as well as the general geology and mineralization types. The discussions were held via email and phone calls, as well as Microsoft Teams meetings. The discussions were open, frank and at no time was information withheld or not available to the QPs.
A site visit by Micon personnel was conducted from May 27, 2025 to May 29, 2025 with May 28, 2025 a full day on site. Mr. Gary Wong, P.Eng., visited the site between July 14, 2025 to July 16, 2025.
|
Mako Mining Corp. |
Prior to the 2025 site visit, the objectives of that visit were discussed between Mako's personnel and the QPs.
Mr. Gary Wong, P.Eng., visited the site between July 14 to July 16. Mr. Wong is the principal consulting geologist for PDM Technical Services Ltd. He is independent of Mako and its subsidiary Golden Vertex. During this visit, the open pit areas, the leach pad, the mine office, the core logging facilities, and the core and sample storage areas were toured. A number of holes representative of the different zones were also visited, as well as core photographs of other zones which were not readily accessible. Finally, the three-dimensional models of the mineralized zones were reviewed with the Golden Vertex staff.
The QPs responsible for the preparation of this report and their areas of responsibility and site visits are summarized in Table 2.1.
Table 2.1
Qualified Persons, Areas of Responsibility and Site Visits
| Company | Qualified Person | Title | Area of Responsibility | Site Visit |
| Micon International Limited | William J. Lewis, B.Sc., P.Geo. | Principal Geologist | Sections 1.1 to 1.3, 1.8, 1.9, 2, 3, 4, 5, 24, 25.1, 25.4, 26 and 27 | None |
| Richard M. Gowans, P.Eng. | Principal Metallurgist | Sections 1.6, 13 and 25.2 | May 27, 2025, to May 29, 2025 | |
| CGK Consulting Services Inc. | Chris Keech, P.Geo. | Principal Geologist | Sections 1.7, 10.0, 11.0, 12.1-3, 12.5-8,12.10, 14.0 and 25.3 | None |
| PDM Technical Services Ltd. | (Gary) Yee-Yuen Wong, P.Eng. | Geological Services Consultant | Sections 1.4, 1.5, 6.0, 7.0, 8.0, 9.0, 12.4, 12.9, and 23.0 | July 14, 2025, to July 16, 2025 |
| NI 43-101 Sections not applicable to this report | 15,16,17,18,19,20,21 and 22 | |||
2.3 Sources of Information
The review of the Moss Mine Project has been based on published material researched by the QPs, as well as data, professional opinions and unpublished material submitted by the professional staff of Mako or its subsidiaries and consultants. Much of these data came from reports prepared for Golden Vertex or prior holders of the Project and provided by Mako. The reference sources for this report are identified in Section 27.0.
The descriptions of geology, mineralization and exploration used in this report are taken from reports prepared by various organizations and companies or their contracted consultants, as well as from various government and academic publications. The conclusions of this report use, in part, data available in published and unpublished reports supplied by the companies which have conducted exploration on the property, and information supplied by Mako. The information provided to Mako was supplied by reputable companies and the QPs have no reason to doubt its validity. The QPs have used the information where it has been verified through their own review and discussions.
|
Mako Mining Corp. |
Some of the figures and tables for this report were reproduced or derived from reports on the Project written by various individuals and/or supplied to the QPs by Mako. Several of the photographs were taken during the May and June, 2025 site visits. In cases where photographs, figures or tables were supplied by other individuals, or Mako, the source is referenced below that item. Figures or tables generated by the QPs are generally unreferenced.
The principal sources of information for this report are:
Data and transcripts supplied by Mako.
Published reports and production data from other issuers.
Observations made during the site visits by the QPs.
Review of various reports and maps produced by Mako personnel and/or consultants, and review of technical papers produced in various journals.
Discussions with Mako management and staff familiar with the property.
Personal knowledge about gold deposits in similar geological environments.
In the preparation of this report, the QPs used a variety of unpublished company data, as well as corporate news releases, geological reports, geological maps and mineral claim maps, sourced from various government agencies. The principal sources of technical information have been the reports provided by Mako. Valuable site-specific information was provided by the employees and consulting geologists of Mako.
It should be noted that historical documents use the term "ore" and "reserves" as the Project has seen past production. Where appropriate, these are retained in this report in quotation marks. However, these terms should be understood within the historical context and do not denote economic mineralization or mineral reserves as set out in NI 43-101 or the Definition Standards of the Canadian Institute of Mining, Metallurgy and Petroleum.
2.4 Units of Measurement and Abbreviations
In this report, currency amounts are stated in Canadian (CAD) or US (US$) dollars. Quantities are generally stated in the American measurement system of feet, miles etc. However, for mineral resource reporting the Système International d'Unités (SI) metric units, the standard Canadian and international practice, including metric tons (tonnes, t) and kilograms (kg) for weight, kilometres (km) or metres (m) for distance, hectares (ha) for area, grams (g) and grams per tonne (g/t) for precious metal grades. Precious metal grades may also be reported in parts per million (ppm) or parts per billion (ppb), and quantities may be reported in troy ounces (oz).
Historical data may be reported in American measurement units, including short tons (tons) for weight, feet (ft) for distance and ounces per short ton (oz/ton) for precious metal grades.
Abbreviations used in this report are identified in Table 2.2. Appendix I contains a glossary of mining and other related terms that are potentially used in this report.
|
Mako Mining Corp. |
Table 2.2
Units and Abbreviations
| Name | Abbreviation |
| Addwest Minerals International Ltd. | Addwest |
| Air Track | AT |
| BHL LLC. | BHL |
| Bureau of Land Management | BLM |
| Canadian Institute of Mining, Metallurgy and Petroleum | CIM |
| Canadian National Instrument 43-101 | NI 43-101 |
| Canadian Standards Association | CSA |
| Carbon in leach | CIL |
| Centimetre(s) | cm |
| Cornerstone Land Surveying, Inc. | Cornerstone |
| Cubic feet per minute | cfm |
| Day | d |
| Degree(s) | ° |
| Degrees Celsius | °C |
| Diamond Core | Core |
| Digital elevation model | DEM |
| Dollar(s), Canadian and US | $, Cdn $ and US$ |
| EG Acquisition LLC | EGA |
| Elevation Gold Mining Corporation (EGMC) | Elevation Gold or EGMC |
| Feet or Foot | ft |
| Golden Vertex Corp. | Golden Vertex or GVC |
| Gram(s) | g |
| Grams per metric tonne | g/t |
| Greater than | > |
| Hectare(s) | ha |
| Independent Mining Consultants Inc. | Independent Mining or IMC |
| Induced polarization | IP |
| Kilogram(s) | kg |
| Kilometre(s) | km |
| La Cuesta International Inc. | La Cuesta or LCI |
| Lerchs-Grossman | LG |
| Less than | < |
| Litre(s) | l |
| Long-hole | LH |
| Mako Mining Corp. | Mako Mining Corp. |
| Maverix Metals Inc. | Maverix |
| Metre(s) | m |
| Metres above sea level | masl |
| Micon International Limited | Micon |
| Million tonnes | Mt |
| Million ounces | Moz |
| Million years | Ma |
| Million metric tonnes per year | Mt/y |
|
Mako Mining Corp. |
| Name | Abbreviation |
| Milligram(s) | mg |
| Millimetre(s) | mm |
| MinQuest Inc. | MinQuest |
| Net Smelter Return | NSR |
| Nomad Royalty Company | Nomad |
| Northern Vertex Mining Corporation | Northern Vertex Mining or NVMC |
| Not available/applicable | n.a. |
| Ounces | oz |
| Ounces per year | oz/y |
| Parts per billion | ppb |
| Parts per million | ppm |
| Patriot Gold Corp. | Patriot Gold |
| Percent(age) | % |
| Quality Assurance/Quality Control | QA/QC |
| Reverse Circulation | RC |
| Right-of-Way | ROW |
| Sandstorm Gold Ltd. | Sandstorm |
| Second | s |
| Securities and Exchange Commission | SEC |
| Specific gravity | SG |
| System for Electronic Document Analysis and Retrieval | SEDAR |
| Système International d'Unités | SI |
| Three-dimension | 3D |
| Tonne (metric) | t |
| Tonnes (metric) per day | t/d |
| Trisura Guarantee Insurance Company | Trisura |
| Universal Transverse Mercator | UTM |
| Valkyrie Royalty Inc. | Valkyrie |
| Wexford Capital LP | collectively with its managed funds, "Wexford", |
| Year | y |
|
Mako Mining Corp. |
3.0 RELIANCE ON OTHER EXPERTS
In this Technical Report, discussions regarding royalties, permitting, taxation and environmental matters in Sections 4.2 to 4.5 are based on material originally provided by Mako.
Micon's QPs are not qualified to comment on matters regarding royalties, permitting, taxation and environmental matters in Sections 4.2 to 4.5 of this Technical Report and have relied on the representations and documentation provided by Mako for such discussions.
The QPs offer no legal opinion as to the validity of the title to the mineral concessions claimed by Mako and therefore, have relied on information provided by Mako.
|
Mako Mining Corp. |
4.0 PROPERTY DESCRIPTION AND LOCATION
4.1 Moss Project Location
The Moss Mine Project is located at latitude 35°5'49" N and longitude 114°26'43" W, which is about 10 miles east from Bullhead City, Arizona, along Silver Creek Road. Bullhead City, Arizona is about 90 miles southeast from Las Vegas, Nevada. The location of the Moss Mine Project is shown in Figure 4.1.
Figure 4.1
Location of the Moss Mone
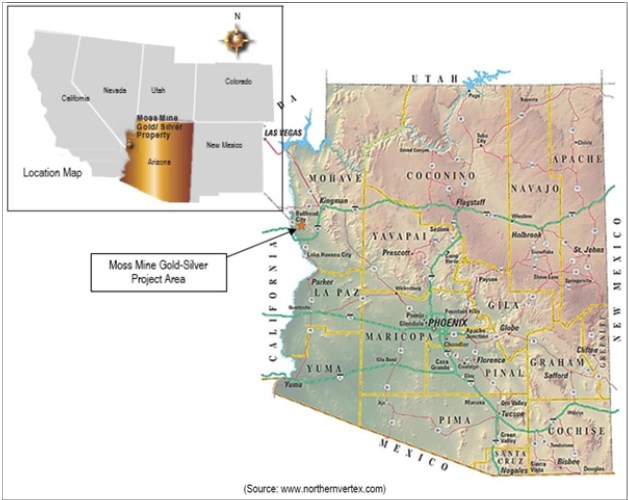
Figure extracted from the July, 2021 Technical Report.
|
Mako Mining Corp. |
4.2 Mineral Tenure and Ownership
4.2.1 Golden Vertex Corp. (Golden Vertex)
The initial ownership in the Moss Mine Project was acquired by Golden Vertex Corp., a subsidiary of Northern Vertex Mining Corporation (Northern Vertex Mining), through an option agreement with Patriot Gold Corp. (Patriot Gold) to acquire a 70% interest in 2011 and a subsequent purchase agreement with Patriot Gold in 2016 to acquire a full 100% interest in the Moss Mine Project subject to a royalty agreement.
The Moss Mine Project area comprises approximately 41,760 acres(ac) consisting of:
254.1 ac in 15 contiguous patented claims (Moss) in T20N R20W owned by Golden Vertex.
117.4 ac in 7 contiguous patented claims (Ivanhoe) in T19N R20W owned by Golden Vertex.
109.4 ac in 10 contiguous patented claims (McCullough) in T19N R20W owned by Golden Vertex.
Approximately 40,212 ac in 2,087 unpatented lode claims.
Two Arizona State exploration leases; 08-119642 covering an area of 529.7 ac in T20N R20W section 32 and 8-119834, covering an area of 537.8 ac in T19N R20W section 16.
The maximum lode claim size is 1,500 feet by 600 feet = 20.66 acres. Irregularities in boundaries, overlaps and fractions decrease this maximum size. The net total area of the unpatented lode claims is based on estimates only. The estimate should not be considered definitive or an absolute value; and is stated for information purposes only. This is emphasized because only the patented lode claim boundaries have been surveyed by a registered land surveyor. The net areas of the unpatented claims are estimates only, supplied by Golden Vertex.
A list of the 15 Moss patented claims in T20N R20W is provided in Table 4.1. The claim boundaries have been surveyed and a certified record of the survey was recorded by Eric L. Stephan (Registered Land Surveyor #29274) of Cornerstone Land Surveying, Inc., (Cornerstone) located at Bullhead City, Arizona 86439, which is dated February 29, 2012. A map of the Moss patented claims is shown in Figure 4.2.
|
Mako Mining Corp. |
Table 4.1
List of Moss Mine Area Patented Claim Parcels (located in T20N R20W)
| Claim Name | Mineral Survey | Section | Date of Location |
Date of Amended Location |
Date of Mineral Survey |
Claim Area (ac) |
| Key No. 1 Key No. 2 |
MS4484 MS4484 |
19 19 |
Unknown Unknown |
Not Applicable Not Applicable |
April, 1959 April, 1959 |
19.25 20.56 |
| California Moss Lot 37 (Greenwood) |
MS182 | 19, 30 |
Unknown |
Not Applicable |
Before October, 1888 | 20.26 |
| California Moss Lot 38 (Gintoff) |
MS796 | 19, 20, 29, 30 |
Feb 2, 1882 | Not Applicable | Before October, 1888 | 20.38 |
| Moss Millsite Divide Keystone Wedge Ruth Extension Omega Ruth Rattan Extension Rattan Partnership Mascot Empire |
MS4484 MS4484 MS4484 MS4485 MS4484 MS2213 MS4485 MS857 MS4485 MS4485 MS4485 |
19 19 19, 30 29, 30 19, 30 30 30 30 30 30 30 |
Unknown Unknown Unknown July 2, 1929 Unknown Oct 15, 1888 July 2, 1929 July 19, 1886 June 27, 1958 June 27, 1958 June 27, 1958 |
Not Applicable Not Applicable Not Applicable June 27, 1958 Not Applicable Not Applicable June 27, 1958 Not Applicable June 27, 1958 June 27, 1958 June 27, 1958 |
April, 1959 April, 1959 April, 1959 April, 1959 April, 1959 February, 1906 April, 1959 October, 1888 April, 1959 April, 1959 April, 1959 |
13.61 4.72 10.00 19.22 20.48 18.11 20.66 20.71 5.88 20.66 19.54 |
| Total: | 254.04 |
|
Mako Mining Corp. |
Figure 4.2
Location Plan for the 15 Moss Patented Claims (Reserve Pit Outline in Red) (Source: IMC, 2021)
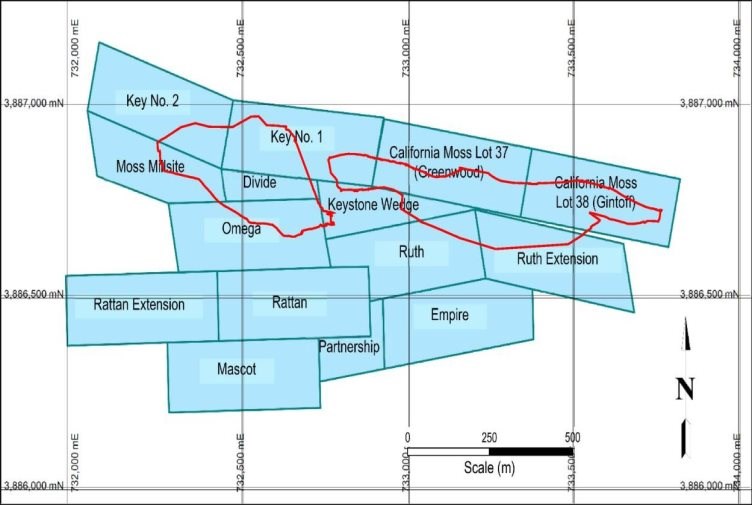
Source: Independent Mining Consultants Inc., 2021.
|
Mako Mining Corp. |
The initial involvement of Golden Vertex in the Oatman Mining District was entering into an option agreement with Patriot Gold to acquire a 70% interest in the 15 patented Moss Mine claims that included the former producing Moss mine and Ruth mine. The 15 claims are included in 5 parcels recorded with the County.
Parcel # 213-05-004 - T20N R20W Section 19 & 30, PM, San Francisco Mining District- Patented Claims Divide; Key #1; Key #2; Keystone Wedge; Moss Millsite; & Omega; MS 4484 containing 88.62 ac.
Parcel # 213-05-005 - T20N R20W Section 19 & 30, PM, San Francisco Mining District- Patented Claim California Moss Lot 37 Greenwood MS 182 containing 20.26 acres.
Parcel # 213-05-005 - T20N R20W Section 19, 20, 29, & 30, PM, San Francisco Mining District- Patented Claim California Moss Lot 38 Gintoff MS 796 containing 20.38 acres.
Parcel # 213-09-001 - T20N R20W Section 8, PM San Francisco Mining District- Patented Claims Rattan; Ruth containing 38.651 acres MS 3262.
Parcel # 213-09-002 - T20N R20W Section 29 & 30, PM San Francisco Mining District- Patented Claims Empire; Partnership; Rattan Ext.; Mascot; Ruth Ext.; containing 85.9 acres MS 3262.
Golden Vertex also holds seven patented claims (Ivanhoe Patents) in central T19N R20W covering 117.4 acres. The patented claims are owned as fee-simple property by Golden Vertex. They are labeled in Figure 4.3. The claim boundaries have not been recently surveyed, however they were surveyed at the time of patenting and recorded as Mineral Survey 3262. They were recorded with Mohave County as Parcels 221-07-005 and 221-08-001.
Parcel # 221-07-005 - T19N R20W Section 8, PM San Francisco Mining District Ivanhoe #1, Ivanhoe Fraction, Nancy Lee Fraction, Nancy Lee #2 - MS 3262 containing 57.44 ac.
Parcel # 221-08-001 - T19N R20W Section 9, PM San Francisco Mining District: Ivanhoe #2, Ivanhoe #3, Nancy Lee #1, MS 3262 containing 60 ac.
In 2021, Golden Vertex purchased ten patented claims (McCullough Patents) in northern T19N R20W covering 109.4 ac. The patented claims are owned as fee-simple property by Golden Vertex. They are labeled in Figure 4.3. The claim boundaries have not been recently surveyed, however they were surveyed at the time of patenting and recorded as Mineral Survey 3349. They were recorded with Mohave County as Parcels 221-04-002 and 221-05-001.
Parcel #221-04-002 - T19N R20W Section 4 PM San Francisco Mining District, Buckeye, Grace Jr., Keynote, Keynote Fraction MS 3349.
Parcel #221-05-001-T19N R20W Section 5 PM, San Francisco Mining District, Little Horse, McCullough Fraction, Hardy, John McCullough, McKenzie, Mascot MS 3349.
Figure 4.3 provides a map of Golden Vertex's land position.
|
Mako Mining Corp. |
Figure 4.3
Land Position of Golden Vertex
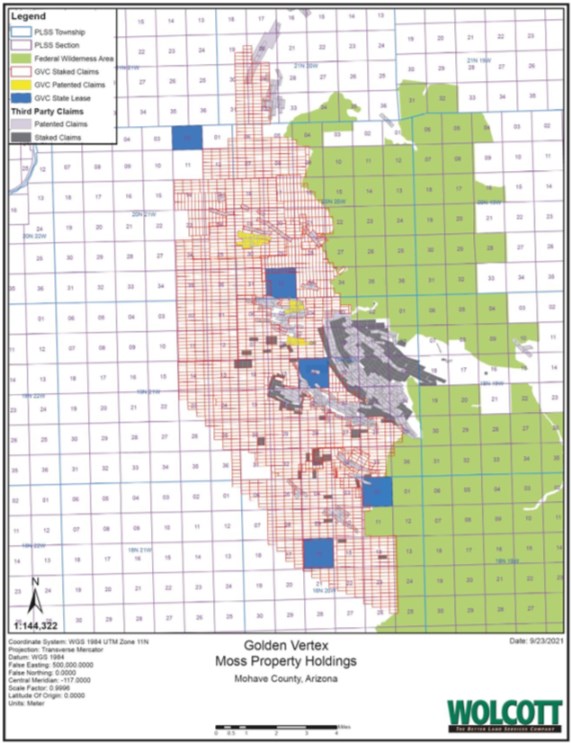
Figure extracted from the July, 2021 Technical Report.
|
Mako Mining Corp. |
Applications for three additional Arizona State Land Department exploration permits were made and were accepted on August 25, 2021. These three state Exploration Leases that were accepted in August, 2021 are the most northern one and the two most southern ones on the figure. The locations of the three additional state Exploration Leases are provided in Table 4.2.
Table 4.2
Location of Three Additional State Exploration Leases
|
Permit # |
Township |
Range |
Section |
Area |
|
08-121938 |
T18N |
R20W |
Sec 16 |
640 Acres |
|
08-121939 |
T18N |
R20W |
Sec 2 |
603.48 Acres |
|
08-121940 |
T20N |
R21W |
Sec 2 |
511.36 Acres |
There are patented claims owned by third parties within the Townships where the GVC mineral properties are located in T21N R20W, T20N R20W, T20N R21W, T19N R20W, T19N R21W, T18N R20W and T18N R21W, and are shown in dark grey on Figure 4.3. These patented claims are considered fee simple property, and title to the surface and mineral rights are held by the respective patented claim owners. No part of an unpatented claim that overlaps patented property is valid.
In 2021, Golden Vertex initiated an extensive claim staking project that nearly tripled the Golden Vertex land position in the Oatman Mining District. An additional 1,549 claims were staked and filed with the BLM, bringing the total mineral rights area up to approximately 41,760 acres.
On Sept 24, 2021, Northern Vertex Mining changed its name to Elevation Gold Mining Corp. (Elevation Gold or EGMC). They also consolidated shares 6:1 at the same time.
4.2.2 Bankruptcy and Change of Ownership
On August 1, 2024, Elevation Gold obtained an order (the "Initial Order") of the Supreme Court of British Columbia (the "Canadian Court") granting it creditor protection under the Companies' Creditors Arrangement Act (the "CCAA"). Under the Initial Order, KSV Restructuring Inc. (the "Monitor") was appointed as the monitor of the Company. In order to obtain similar protection in the United States, a petition under chapter 15 of the US Bankruptcy Code was filed with the US Bankruptcy Court for the District of Arizona.
Additionally on the same date, Golden Vertex announced that it was ceasing active mining but intended to continue the operation of the beneficiation facilities.
On December 31, 2024, Elevation Gold announced the completion of the sale of Moss Mine with an arm's length purchaser, EG Acquisition LLC, ("EGA"), in respect of the purchase and sale of certain of Elevation Gold's assets, including the outstanding common shares of Golden Vertex, which held the Moss Mine located in Arizona. The Canadian Approval Order was subject to recognition by the U.S. Court in the Chapter 15 Proceedings. The US Recognition Hearing was heard on December 23, 2024, and the US Approval Order was entered on December 30, 2024. The Transaction was also approved by the TSX Venture Exchange subject to approval by the U.S. Court.
|
Mako Mining Corp. |
On March 27, 2025, Mako Mining Corp announced the completion of the purchase of the Moss Mine.
The acquisition was completed pursuant to the terms of an interest purchase agreement dated March 26, 2025, between Mako US Corp. as buyer, Wexford EG Acquisition LLC as vendor, EGA as target and Mako as buyer guarantor, pursuant to which Mako US acquired 100% of the ownership interests in EGA, a private company controlled by Mako's controlling shareholder, Wexford Capital LP (collectively with its managed funds, "Wexford"), that acquired 100% of the shares of Golden Vertex, the operating subsidiary of the Moss mine, under a CCAA proceeding and related Chapter 15 proceeding in the United States (the "Bankruptcy Process") on December 31, 2024.
4.3 Royalties
Prior to bankruptcy, the Moss Mine Project had six agreements with landowners that were subject to royalties. As a result of the bankruptcy proceedings, two agreements were eliminated, and four survived, however two of the surviving agreements are still being litigated in the bankruptcy court.
Both the BHL Finders agreement and the Maverix Silver Stream have been eliminated, while the Minquest and Patriot Gold agreements are still in litigation. The Greenwood and La Cuesta agreements remain in good standing.
The legacy claims and royalty boundaries for Golden Vertex are shown in Figure 4.4 for reference in the following discussion on royalties.
4.3.1 MinQuest Inc.
MinQuest Inc. (MinQuest) assembled the patented Moss Mine claims and staked an additional 63 unpatented claims. In 2018, this land package was transferred to Patriot Gold for payments and a royalty. In March, 2018, Golden Vertex was notified by MinQuest that this royalty was transferred to Great Basin Royalty LLC. In mid-September, 2020, GVC was notified that Great Basin Royalty LLC. had transferred the royalty to Valkyrie Royalty Inc. (Valkyrie). On September 28, 2020, Nomad Royalty Company (Nomad) announced that it had purchased all the outstanding shares of Valkyrie, then on August 15, 2022 Sandstorm Gold Royalties announced it purchased all of the Nomad outstanding shares. On October 20, Royal Gold purchased all of the outstanding shares of Sandstorm.
Pursuant to the MinQuest Agreement, Royal Gold will receive:
a 3% net smelter return (NSR) royalty in respect of any and all production from the 63 unpatented lode claims listed in the MinQuest Agreement and on public lands within one mile of the outer perimeter of the then present (2010) claim boundary.
a 1% NSR royalty on any and all production from the seven patented lode claims to which no other royalties apply: and
an over-riding 0.5% NSR royalty on any and all production from those patented lode claims with other royalty interests (limited to the California Moss Lot 37 [Greenwood] lode claim, under the terms of the Greenwood Agreement [Sub-Section 4.3.2]).
This boundary line is shown in Figure 4.4 above as the smaller blue envelope line.
|
Mako Mining Corp. |
Figure 4.4
Moss Project Legacy Claims
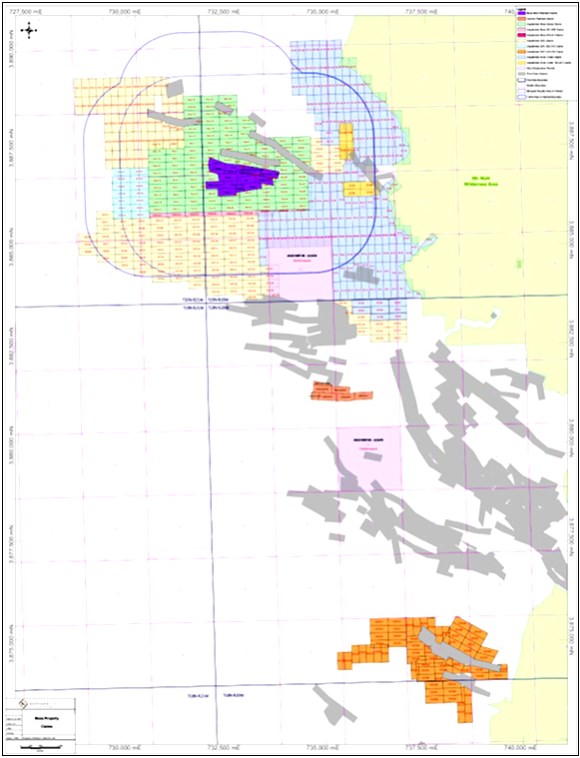 Figure extracted from the July, 2021 Technical Report. |
|
Mako Mining Corp. |
This agreement is still in litigation in the bankruptcy court.
4.3.2 Greenwood Agreement
The California Moss Lot 37 (Greenwood) claim is subject to a Purchase Agreement between Patriot Gold and various parties referred to as the Greenwood Agreement that is dated March 2004. The purchase price of US$150,000 was paid by Patriot Gold, in addition to which a 3% NSR royalty is payable to the original owners, on gold and silver produced from the claim. In addition, and as defined above, a royalty of 0.5% is payable to MinQuest (now Nomad) in respect of the California Moss Lot 37 (Greenwood) claim and all other patented claims in which the original vendors have a royalty interest.
The Greenwood Agreement remains valid following the bankruptcy.
4.3.3 La Cuesta International Inc. (La Cuesta or LCI)
Pursuant to the terms of the La Cuesta Agreement, EGMC will pay La Cuesta a 1.5% NSR royalty on any gold or silver production from the area covered by the Silver Creek claims, plus an additional 0.5% NSR royalty on any third-party claims within the Area of Influence. The Area of Influence includes the State Exploration Permit covering T20N R20W Section 32, and the patented claims within the boundaries of the Silver Creek claims. Quarterly Advance Royalty payments have been made to LCI and are deductible from future royalty payments. The Silver creek claims are shown in blue on the easterly side of the land package shown in Figure 4.4.
The La Cuesta Agreement remains valid following the bankruptcy.
4.3.4 Patriot Gold.
In accordance with the terms of the 2016 purchase agreement with Patriot Gold, EGMC will pay a 3.0% NSR royalty on all gold and silver production from the patented and unpatented claims covered by the 2011 Patriot Gold Agreement. The extent of the royalty properties boundary line is the larger blue envelope shown in Figure 4.4.
The Patriot Gold Agreement is still in litigation in the bankruptcy court.
4.4 Property Access
Access to the properties is provided by State and County roads:
On the north side by State Highway 68 from Bullhead City and Kingman, which crosses the claim package.
In the central portion from Bullhead City by Silver Creek Road (County Route 10)
In the south-central portion by Boundary Cone Road from Fort Mohave (County Route 153)
In the south via historic Route 66 from Golden Shores, Oatman and Kingman.
|
Mako Mining Corp. |
Access from Silver Creek Road to the actual Moss Mine operations is via the County recognized Moss Mine Access Road, aka BLM Route 7717. The Bureau of Land Management (BLM) has granted Right-of-Way (ROW) permits and leases expiring on December 31, 2047, allowing GVC to re- construct the road onto adjacent BLM land to meet AASHTO Tier IV standards and to construct and operate the 24.9/14.4 KV powerline to the Moss Mine Project.
4.5 Historic Liabilities
The Moss Mine Project site has been disturbed by previous historical mining activities dating back to the late 1800's. These activities are separate from the Phase I activities carried out by NVMC in 2013 and 2014.
There are no known environmental liabilities at the site from the historical activities. The Moss ores do not contain measurable quantities of sulfides and hence, there are no acid drainage issues. The previous activities have not resulted in the stockpiling or disposal of any hazardous substances.
There was a gold stamp mill erected on site in 1909 and the ruins of the mill can be seen today. The historical milling included the use of mercury amalgam, and a small stockpile of tailings is thought to contain measurable quantities of mercury. Golden Vertex was able to encapsulate these tailings in place under provisions of the 1980 Bevill Amendment to Public Law 96-482 in advance of the Phase II site grading which later buried the material.
4.5.1 Phase I Liabilities
The Phase I heap and associated facilities, such as the barren and pregnant ponds, have been dismantled and re-purposed as part of the Phase II development.
The spent ore from the Phase I heap was first detoxified, and subsequent testing proved the material was inert and met Arizona drinking water standards. In accordance with Arizona Department of Environmental Quality permit requirements, this material was used as leach pad liner bedding under the Phase II leach pad. The Phase I leach pad and pond liners were then removed and buried in the Phase II waste dump.
The remainder of the Phase I facilities (the carbon columns, tanks, and solution piping) were sold and shipped to a buyer in Mexico and the former Phase I laboratory structures were retrofitted for use in Phase II.
4.5.2 Permits
Current operating permits are discussed in Section 20. There are no identified issues that would prevent EGMC from achieving all permits and authorizations required to commence construction and operations of the project based on the data that has been collected to date.
|
Mako Mining Corp. |
4.6 QP Comments
The QPs are unaware of any other outstanding environmental liabilities at the Moss Mine Project, other than those normally associated with possessing a formerly operating mine in the USA. The existing environmental conditions, liabilities and remediation have been described where required by NI 43-101 regulations. These statements are provided for information purposes only and the QPs offer no opinion in this regard.
QPs are unaware of any other significant factors or risks that may affect access, title or the right or ability of Mako to perform work on the Moss Mine Project.
Other than those discussed previously, the QPs are not aware of any royalties, back-in rights, payments or other agreements and encumbrances which apply to the Moss Mine Project that are not discussed in this section or other sections of this Technical Report.
|
Mako Mining Corp. |
5.0 ACCESSIBILITY, CLIMATE, LOCAL RESOURCES, INFRASTRUCTURE AND PHYSIOGRAPHY
5.1 Accessibility
The nearest cities to the Moss Mine Project are Bullhead City, Arizona (10 miles west) and Laughlin, Nevada (14 miles northwest) which are separated north-south by the Colorado River. According to the 2020 census, Bullhead City has a population of approximately 41,300 people with approximately 100,000 people living in the Laughlin-Bullhead City area.
Las Vegas, Nevada is the nearest major city to the Moss Mine Project, which is approximately 90 miles (1.5 hours) northwest of Bullhead City, Arizona (Figure 4.1). According to the 2020 census, Las Vegas has a population of about 662,000 people. From McCarran International Airport in Las Vegas, Interstate Highways 215, 11 and US Highway 95 lead to State Highway 163 into the Laughlin-Bullhead City area and are good quality paved roads. Moss Mine can be reached by traveling about 10 miles via Bullhead Parkway east on the Silver Creek Road (an improved dirt road).
Chartered flights can be arranged from McCarran International Airport at Las Vegas to the Laughlin-Bullhead City Airport. The nearest railway station is at Needles, California, which is approximately 25 miles to the southwest of Moss Mine.
Kingman, Arizona, approximately 37 miles due east of Bullhead City, is the Mohave County seat. Kingman and the surrounding area have a population of approximately 31,000.
Kingman is about 200 miles northwest from Phoenix, Arizona, the state capital Phoenix has a population of about 1.7 million people based on the 2020 census estimate.
Approximately seven miles east of the Moss Mine Project area is the small town of Oatman, Arizona. According to the 2020 census Oatman had a population of 43 people. Oatman is a historical gold mining town that hosted three underground gold mines in the late 1800s and early 1900s, producing over two million ounces of gold. During the gold mining boom, Oatman had a population estimated at 10,000. The Gold Road Mine underground mine is currently in production in Oatman.
5.2 Climate
The climate in the general Moss Mine Project area is classified as desert. In the Holdridge Life Classification zone it is in a warm temperate latitudinal region, pre-montane to lower montane altitudinal zone and a desert humidity province. There are no climatic constraints on the operating season, although daytime temperatures can exceed 110 ºF during June, July and August. Heatwaves with temperatures in excess of 120 ºF are not uncommon. Lows average about 44 ºF in the winter months, with recorded lows of 24 ºF. The average annual rainfall in Bullhead City is six inches (data from www.usclimatedata.com). No rain may fall for months, heavy rainfalls may occur during the monsoon season, which is between July and September.
5.3 Local Resources and Infrastructure
5.3.1 Surface Rights, Power, Water and Personnel
The Moss Mine Project was an active mine which was fully permitted and maintained the surface rights necessary to operate. Although the mine began production using diesel- powered generators, the mine has installed line power from Mohave Electric Co-Operative (the local power utility) which became operational as of mid-September 2020.
|
Mako Mining Corp. |
The principal water source for mine operations is from wells drilled on the Moss Mine property. Additional water sources occur from water seepage into the open pits. Make up water is trucked to site, when necessary.
There are sufficient services within the Bullhead City-Laughlin area to provide supplies, services and manpower to the mine. Technical and management roles can be filled by suitable professionals from mining groups throughout the Western US.
5.4 Physiography
5.4.1 Topography, Elevation and Vegetation
The Moss Mine Project area is located in the Black Mountain Range in the southern part of the Basin-and-Range topographic province, 10 miles east of Bullhead City, Arizona.
Elevations across the Moss Project area vary from approximately 2,160 ft to 2,690 ft above sea level. The Moss vein forms a prominent east-west ridge across the northern portion of the block of 15 patented lode claims.
The local project area is drained by erosional features that drain to Silver Creek Wash located one mile south of the block of 15 patented lode claims, which is dry for most of the year, and drains southwest and then west into the Colorado River. Vegetation is generally sparse; comprised of bunch grass, sagebrush and various species of cacti. The Fort Mojave Indian Tribe and other private companies have created an agricultural community that covers several square miles in the fertile fields of Mohave Valley and Fort Mohave, to the immediate south of Bullhead City and west of the project area. The main crops are cotton and alfalfa.
|
Mako Mining Corp. |
6.0 HISTORY
Parts of this section were extracted from the previous 2017 and 2021 Technical Reports and updated where applicable.
6.1 Property History
6.1.1 Discovery and Early Mining History (1863 to 1935)
The Moss Mine Project was discovered in 1863 by John Moss (1839-1880). At the time, it was reported to be the first major gold discovery in Mohave County. The larger San Francisco Mining District of Mohave County was established in 1864 (Malach, 1977).
The available records show that John Moss was made aware of the Moss Mine area by stories about soldiers from nearby Fort Mojave prospecting for and finding gold. A popular, alternative account of the Moss vein discovery is that Chief Irataba of the Mojave Tribe led Moss to what became known as the Moss vein outcrop. Whatever the case, John Moss' name appeared on the first recorded mining claim called the Moss Lode, under the ownership of the San Francisco Gold and Silver Company. The initial gold discovery at Moss was extremely high grade. Lausen (1931) reported that, "From a hole only ten ft in diameter, $240,000 is said to have been taken out.", from a site immediately to the east of the later site of Allen Shaft (Figure 6.1). The extremely high-grade ore was likely the result of near- surface enrichment, creating coarse free gold. Later mining near the high-grade pocket found coarse gold flakes and wire gold along with iron and manganese oxides in vugs (Lausen, 1931).
The available records show that Moss sold the Moss Lode to Dahrean Black and that it was later sold to the Gold Giant Mining and Milling Company of Los Angeles. The area around the glory hole was explored by numerous holes and tunnels, but no other substantial quantities of gold are reported to have been found. Ransome (USGS Bulletin 743 - Preliminary Report 1923) stated that $240,000 worth of gold (approximately 12,000 ounces) was recovered by Moss.
Following its abandonment in 1866, there was little mining activity in the district until the discovery of the regionally famous Gold Road Vein in 1901. The town of Vivian was founded in that year; its name was changed to Oatman in 1908. In 1906, the Tip Top and Ben Harrison mineralized shoots were discovered. In 1915 and 1916 the Big Jim, Aztec and United Eastern mineralized bodies were discovered on the Tom Reed Vein. Mining activity increased and the population of Oatman grew to a reported 10,000 (today referred to as the Oatman gold mining boom, 1915 to 1917). By the mid-1920s the population of Oatman had fallen to a few hundred. In 1933, an increase in the gold price from US$20 to US$35 per ounce resulted in a brief flurry of activity, but all the local mines were closed by 1942 (Ransome, 1923; Sherman & Sherman, 1969; Varney, 1994).
Historical underground mine plans of the Moss Mine in GVC's database are dated May 10, 1915 by Gold Road Mines Co. of Gold Road, Arizona, and September 25, 1920 by the Moss Mines Co. of Gold Road, Arizona. These show the Allen Shaft (Figure 6.1) and levels at 60 ft, 75 ft, 125 ft and 220 ft. The plans show that Moss Mine was operating between 1915 and 1920.
|
Mako Mining Corp. |
The available records show that the Ruth Mine was accessed by a 60º degree incline shaft to drifts on the 100-ft, 200-ft and 300-ft Levels. Activity appears to have continued through to mid-1935, by which time approximately 600 ft of drifting is reported to have been completed.
Figure 6.1
Historical Photograph of the Allen Shaft at Moss Mine, 1920-1921
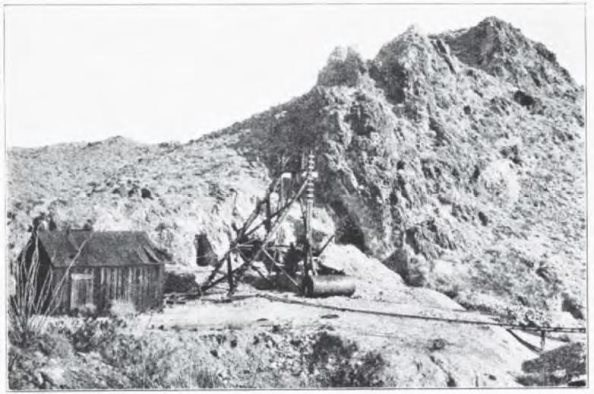 Source: Copied from Ransome, 1923, Plate IX-B Source: Copied from Ransome, 1923, Plate IX-B |
6.1.2 Previous Exploration and Development (1982 to 2009)
Table 6.1 summarizes the work carried out on the Moss Mine Project by previous owners and operators, up to and including Patriot Gold's last exploration program in 2009.
Table 6.1
Summary of Exploration and Development Work Carried Out by Previous Owners and Operators on the Moss Mine Project (the 15 patented lode claims) to 2009
| Company | Date | Work Completed | Comments |
| Moss Mine | 1860 to 1920 | Surface holes and underground mining | 12,000 oz of gold reported to have been extracted |
| Ruth Mine | 1900? to 1935 | Underground mining | Approx. 24,400 t of mineralized material extracted |
| BF Minerals | 1982 | 54 rotary air trac holes, four reverse circulation ("RC") holes for a total of approximately 6,190 ft | Only assayed Moss Vein material. |
|
Mako Mining Corp. |
| Company | Date | Work Completed | Comments |
| Harrison Minerals | 1987 to 1988 (exact dates unknown) | Rehabilitated Allen Shaft and deepened it to 300 ft | Constructed headframe in 1987, reportedly left broken mineralized material in stopes, 3,000 to 5,000 short tons trucked to Tyrol mill. |
| Billiton Minerals | 1990 | 21 RC holes for a total of 6,925 ft | Preliminary analysis of gold and silver deportment, preliminary metallurgical tests. |
| Magma Copper Company | 1991 | 21 RC holes for a total of 9,890 ft | Developed local geological maps. Metallurgical testwork carried out by McClelland Laboratories. |
| Reynolds Metals Explorations, Inc. | 1991 | 11 holes for 4,865 ft, plus two RC holes 500 ft | Collar coordinates are not available. |
| Golconda Resources | 1993 | 19 RC holes for a total of 3,058 ft | |
| Addwest Minerals International Ltd. | 1996 to 1997 | 30 RC holes for a total of 8,217 ft plus six diamond holes for a total of 1,667 ft | Developed a new geological model. |
| Patriot Gold Corporation | 2004 to 2009 | 43 RC holes for a total of 11,807 ft plus 12 diamond holes for a total of 6,846 ft | Consolidated the land position, carried out geological studies and surveys. Contracted Metcon Research to carry out metallurgical testwork. |
6.1.3 Historical Production
Production details for the historical Moss mine are limited. A total of some 12,000 oz of gold is estimated to have been produced prior to 1920, and in 1988 a total of between 3,000 and 5,000 tons were extracted and hauled to Tyro Mill in Mohave County.
The available records for Ruth mine suggest that prior to 1907, 'several hundred tons' of mineralized material had been extracted, for processing at Hardyville. During the Oatman boom the mine was extended and, according to Ross Barkley, mine superintendent in the 1930s, approximately 25,000 tons were mined on the 100 Level. Mining ceased when a geological fault was encountered.
When the mine changed hands in 1935 shipments totalling 500 short tons at US$9.45/ton were made in February, along with 900 tons at US$13.00/ton in March and 1,200 tons at US$14.00/ton in April. For the gold price prevailing at the time (US$35/oz), the production records outlined suggest gold grades of between approximately 0.262 oz/ton and 0.408 oz/ton for the extracted material, hence selective high grading along what were known as pay shoots (i.e. high-grade zones of mineralized material).
|
Mako Mining Corp. |
6.2 Operating Phases of the Moss Mine under Northern Vertex Mining Corporation (2013 to 2021)
6.2.1 Phase 1 Project Description
The Phase I pilot heap operations were carried out in 2013 and 2014 to test the metallurgical parameters for commercial operations. The Phase I facilities included an open pit, heap leach pad, barren and pregnant solution ponds, a carbon recovery plant, and ancillary facilities such as an onsite laboratory, onsite diesel power, a medical/safety office and a general office trailer.
During Phase I, some 193,000 tons of material was mined from the Phase I open pit using conventional drill and blast mining methods. Roughly 124,000 tons was crushed to minus ¼ inch (6 mm), agglomerated with cement, and placed on the heap leach pad with a radial stacker. The material was placed in one 33 ft lift.
The mining, crushing, agglomeration and stacking was carried out by a Contractor using mobile equipment. The operation was overseen and managed by Golden Vertex personnel.
The heap leach stage of the operation was carried out from August 2013 to September 2014. During this period, a weak cyanide solution was applied to the top of the heap using drip irrigation. Solutions were recovered to a pregnant solution pond and then circulated through conventional carbon columns. The loaded pregnant carbon was then shipped offsite to a stripping facility to recover the precious metals. The stripped carbon was then returned to the Moss project site for re-use.
Approximately 4,150 ounces of gold were recovered during the pilot heap operations representing 82% recovery to doré bar.
6.2.2 Phase II Project Description
Phase II of the Project was based on the 2015 Feasibility Study (and NI 43-101 Technical Report dated June 2015) that involved mining and processing material wholly contained within the patented claim boundaries, which could be accessed without trespass onto adjacent public lands administered by the BLM. The necessary permits and capital were obtained and Phase II commenced construction in late 2017 with eventual operation during 2018 that consisted of mining, crushing, agglomeration and stacking of ore onto a conventional heap leach pad. Commercial production was declared as of September, 2018. Gold and silver recovery were achieved by a Merrill Crowe process to produce doré bars at the project site.
The operation was designed for a five-year mine life based on a throughput of 5,000 tons per day.
6.2.3 Phase III
Phase III of the project, which was based on the November, 2017 Technical Report, extended operations onto the adjacent federal lands administered by the BLM. This third phase allowed NVMC to take full advantage of the estimated Measured and Indicated mineral resources. The third phase necessitated an expanded waste rock facility to accommodate the additional waste rock as well as an expanded heap leach pad to treat the additional mineralized material.
|
Mako Mining Corp. |
BLM issued a Decision Record and Finding of No Significant Impact (FONSI) regarding GVC's Mine Plan of Operation on March 18, 2020 based on analysis provided in the Phase III Moss Mine Expansion and Exploration Project Environmental Assessment (EA).
Since the start of Phase II, Moss mine has produced about 7,918,000 tons of ore and recovered 101,400 oz of gold and 753,700 oz of silver as of June 30, 2021.
On Sept 24, 2021, Northern Vertex Mining Corporation (NVMC) changed its name to Elevation Gold Mining Corp (EGMC). They also consolidated shares 6:1 at the same time.
6.3 Exploration and Operation of Moss Mine under Elevation Gold Mining Corp July, 2021 to 2024
During the period 2021 to 2022, drilling at the Moss Mine focused on infill and expansion drilling within or near the planned pits. The table below shows the areas, objectives and highlights of significant drill intersects. This drilling extended the known mineralization at depth and along strike to the west in 4 areas. In addition, 7 condemnation holes were drilled in the Rattan area for the 3B leach pad. Several of these holes had intervals above the cut-off grade, however, not enough to justify applying for new permits to move the proposed leach pad.
On March 16, 2023, Elevation Gold announced an intersect of a 100.6 m thick zone with an average grade of 0.5 g/t Au at Reynolds. Subsequent drilling of 50 RC drill holes accounting for 23,990m were drilled in the Reynolds area and continued to identify a wide mineralized zone. The geology in the Reynolds area is distinct from the main Moss vein area as it is the only mineralization identified to date that is hosted in volcanic rocks as opposed to intrusive rocks. In addition, no coherent quartz veins were identified in the RC drilling. (Discussed further in Section 7.7)
Table 6.2
Summary of Drilling at Moss Mine July, 2021 to 2024
| Area | Number of Drill Holes |
Metres Drilled |
Objective | Highlights |
| Centre Pit | 13 | 11,515 | Infill & extension at depth | 47.8 m @ 0.63 g/t Au and 3.79 g/t Ag 53.3m @ 0.49 g/t Au and 4.24 g/t Ag |
| West Extension | 26 | 22,880 | Extension to west | 61.0m @ 0.54 g/t Au and 5.1 g/t Ag 155.5m @ 0.31 g/t and 1.0 g/t Ag |
| West Pit | 20 | 15,520 | Infill & extension at depth | 147.8m @ 0.31 g/t Au and 5.6 g/t Ag 108.2m @0.46 g/t Au and 4.72 g/t Ag |
| Ruth Vein | 9 | 5,900 | Infill & extension at depth | 38.1m @1.43 g/t Au and 19.22 Ag 195.1m @ 0.40 g/t Au and 5.54 g/t Ag |
| Rattan | 7 | 5,150 | Condemnation | 24.4m @ 0.41 g/t Au and 1.33 g/t Ag 79.3m @ 0.37 g/t Au and 2.0 g/t Ag |
| Sub Total: | 75 | 60,965 | ||
| Reynolds | 50 | 23,990 | Identified new resources | 225.6m @ 0.56 g/t Au and 2.77 g/t Ag 88.4m @ 0.59 g/t Au and 3.68 g/t Ag |
| Total: | 125 | 84,955 |
|
Mako Mining Corp. |
In the Early 1990's Reynolds Metals drilled several holes in this area. The holes were drilled vertically and only reached depths of approximately 122 m. Most of these holes intersected low-grade gold mineralization interpreted to be associated with stockwork veining.
6.3.1 Operations and Production by Elevation Gold Mining Corp. During the Period July 1, 2021 to 2024
Elevation's Mine Plan of Operation that was approved March 2020 included a permitted mine pit and stockpile in the Reynolds area. In February, 2024, the Reynolds area was incorporated into the Elevation Gold's mining plans following the approval of an amendment to the mine plan of operations which allowed for a reallocation of 38 acres to the Reynolds pit area and relocation of the barren rock stockpile, and leach pad to accommodate the development of the Reynolds pit.
During the Second Quarter of 2024, all production at Moss mine came from the Reynolds Pit which consisted of 696,373 tonnes grading 0.35 g/t Au resulting in the production of 6,380 ounces of gold.
Production reported by Elevation Gold in press releases during the period July 1, 2021- June 30, 2024 is shown in Table 6.3.
Table 6.3
Elevation Gold Production at Moss Mine during the Period July 1, 2021 to June 30, 2024
| Year/Description | 2024 (6 Months to June 30) |
2023 (12 Months) |
2022 (12 Months) |
2021 (6 Months from July 1) |
| Ore Tonnes Mined (t) | 1,281,282 | 2,747,220 | 2,963,038 | 1,421,413 |
| Ore Tonnes Stacked (t) | 1,351,027 | 2,798,293 | 2,976,281 | 1,424,816 |
| Gold Grade (g/t) | 0.38 | 0.47 | 0.45 | 0.40 |
| Gold Produced (oz) | 12,683 | 31,047 | 31,094 | 13,265 |
| Gold Ounces sold (oz) | 12,920 | 31,063 | 31,666 | 13,009 |
6.4 Corporate Ownership of the Moss Mine Project 2011 to Present
The initial ownership in the Moss Mine Project was acquired by Golden Vertex, a subsidiary of Northern Vertex Mining, through an option agreement with Patriot Gold Corp. to acquire a 70% interest in 2011 and a subsequent purchase agreement with Patriot in 2016 to acquire a full 100% interest in the Moss Mine Project subject to a royalty agreement.
In 2021, Golden Vertex purchased ten patented claims (McCullough Patents) in northern T19N R20W covering 109.4 ac. These patented claims are owned as fee simple property by Golden Vertex. The claim boundaries were surveyed at the time of patenting and recorded as Mineral Survey 3349. They were recorded with Mohave County as Parcels 221-04-002 and 221-05-001.
On Sept 24, 2021, Northern Vertex Mining changed its name to Elevation Gold Mining Corp. (Elevation Gold or EGMC). They also consolidated shares 6:1 at the same time.
|
Mako Mining Corp. |
On August 1, 2024, Elevation Gold Mining Corp obtained an order (the "Initial Order") of the Supreme Court of British Columbia (the "Canadian Court") granting it creditor protection under the Companies' Creditors Arrangement Act (the "CCAA"). Under the Initial Order, KSV Restructuring Inc. (the "Monitor") was appointed as the monitor of the Company. In order to obtain similar protection in the United States, a petition under chapter 15 of the US Bankruptcy Code was filed with the US Bankruptcy Court for the District of Arizona.
Additionally on the same date, the Golden Vertex announced that it was ceasing active mining but intended to continue the operation of the beneficiation facilities.
On December 31, 2024, Elevation Gold announced the completion of the sale of Moss Mine with an arm's length purchaser, EG Acquisition LLC. ("EGA"), in respect of the purchase and sale of certain of Elevation's assets, including the outstanding common shares of Golden Vertex Corp., which held the Moss Mine located in Arizona. The Canadian Approval Order was subject to recognition by the U.S. Court in the Chapter 15 Proceedings. The US Recognition Hearing was heard on December 23, 2024, and the US Approval Order was entered on December 30, 2024. The Transaction was also approved by the TSX Venture Exchange subject to approval by the U.S. Court.
On March 27, 2025, Mako Mining Corp announced the completion of the purchase of the Moss Mine.
The acquisition was completed pursuant to the terms of an interest purchase agreement dated March 26, 2025, between Mako US Corp. as buyer, Wexford EG Acquisition LLC as vendor, EGA as target and Mako as buyer guarantor, pursuant to which Mako US acquired 100% of the ownership interests in EGA, a private company controlled by Mako's controlling shareholder, Wexford Capital LP (collectively with its managed funds, "Wexford"), that acquired 100% of the shares of Golden Vertex Corp. (Golden Vertex or GVC), the operating subsidiary of the Moss mine, under a CCAA proceeding and related Chapter 15 proceeding in the United States (the "Bankruptcy Process") on December 31, 2024.
6.5 Mineral Resource Estimates
A number of previous mineral resource estimates have been conducted on the Moss Mine Property. However, the previous resources estimates will not be discussed here as they have all been superseded by the current mineral resource estimate disclosed in Section 14 of this Technical Report.
6.6 Exploration by Elevation Gold outside of the Moss Mine
6.6.1 West Oatman
West Oatman is a bulk tonnage exploration target located 2.3 km south of the Moss Mine see Figure 6.2. Mineralization has been observed along a 4.5 km strike of the West Oatman fault/vein system. The West Oatman vein system is interpreted to be an extension of the Gold Road structure to the southeast. The West Oatman vein system is similar to the Moss vein system that is currently being mined.
Results from mapping, sampling and drilling indicate that the West Oatman vein system is potentially mineralized over a strike length of at least one kilometre, with the host structure striking 290 degrees and dipping approximately 65 degrees to the northeast. Vein, stockwork and breccia widths vary from less than a meter to approximately 30-50 meters in width in breccia-filled dilation zones.
|
Mako Mining Corp. |
Figure 6.2
West Oatman Location Map
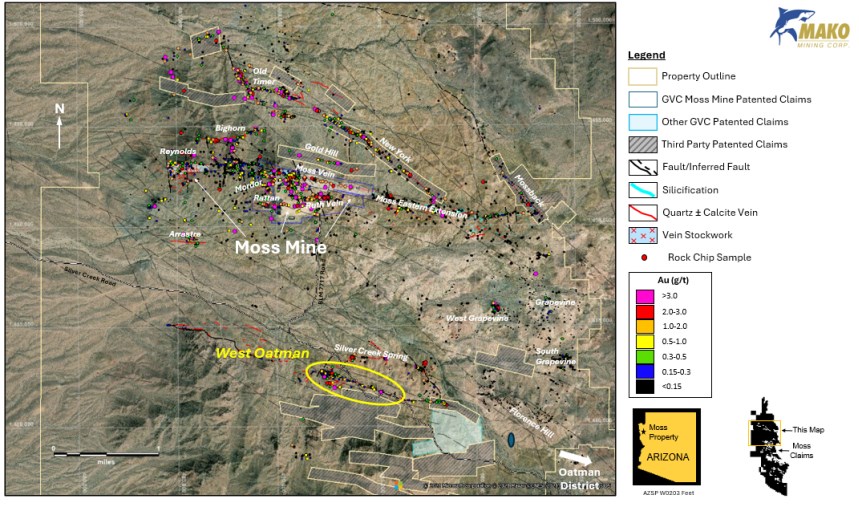
Figure supplied by Mako Mining Corp. and dated February, 2026.
|
Mako Mining Corp. |
Approximately 3,400 m of drilling have been completed in 40 holes at West Oatman. The drilling was accomplished in 5 drilling campaigns by 3 different companies. Of the 3,400 m of total drilling, 1,946 m in 26 holes were diamond drillholes and 5,030 m in 14 holes were reverse circulation holes. Table 6.4 below shows the meterage for each of the different companies and highlights of the drilling. Additional details and assay results of the drilling are available from Northern Vertex's press releases dated May 11, 2021 and September 8, 2021. The press releases are available Makos's website under "Archives - Moss Mine"
The drilling completed to date indicates that the West Oatman system is analogous to the Moss Mine and is considered to be a high priority for additional drilling to define potential resources.
Table 6.4
West Oatman Drilling History and Highlights
| Company | Year | Number of Drill Holes |
Type of Drilling |
Metres Drilled |
Highlights1 |
| Grubstake Mining Co. | 1961 | 6 | DD | 277 | NA |
| Reynolds Metals | 1992 | 13 | RC | 1,412 | 24.4m @ 0.72 g/t Au 42.7m @ 0.89 g/t Au |
| Northern Vertex | 2017 | 13 | DD | 895 | 35.4m @ 0.84 g/t Au and 2.83 g/t Ag, 47.2m @ 0.32 g/t Au and 2.8 g/t Ag |
| Northern Vertex | 2020 | 1 | RC | 122 | 53.3m @ 0.81 Au and 14.8 Ag |
| Northern Vertex | 2021 | 7 | DD | 774 | 36.0m @ 0.36 g/t Au and 1.6 g/t Ag, 68.6m @ 0.25 g/t Au and 2.33 g/t Ag |
| Total: | 40 | 3,480 |
Note: 1 True thickness ranges between approximately 42% (for vertical drillholes) and approximately 91% (for -50 degrees inclined drillholes) of the reported interval thickness.
6.6.2 Florence Hill
Geologic description in this section is taken from two press releases by Elevation Gold: May 31, 2022, "Elevation Gold Announces Inaugural Drilling at the Florence Hill Exploration Target" and November 11, 2022, "Elevation Gold Provides Update on Florence Hill Exploration Project". Assays for this program are from the Elevation Gold master database on site. Results were not released in a press release.
In 2022, 3,141 m in 5 diamond holes were drilled in the Florence Hill/Grapevine area. Three of the holes were in the Florence Hill area, two holes in the Grapevine and South Grapevine areas and one hole tested the Hardy Vein (Figure 6.3).
The Florence Hill exploration target is located approximately 4.5 km to the southeast of the Moss Mine. The target consists of an approximately 1.75 km long by 1.0 km-wide zone of intensely advanced argillic altered lava dome dacite and rhyolite intrusive and volcaniclastic rocks along the margin of the Silver Creek caldera. WNW- and NW-trending structures, including those hosting the West Oatman and Silver Creek Springs exploration targets (within a kilometre to the west), and the Gold Road Mine (approximately 2.5 km to the southeast) appear to intersect the caldera margin structure in the Florence Hill area.
|
Mako Mining Corp. |
These structures are steeply (>80 degrees) southwest dipping in the Florence Hill exploration target area. The intense advanced argillic alteration includes kaolinite and alunite with minor dickite and pyrophyllite and is associated with geophysical magnetic lows and anomalous mercury along the WNW and NW-trending structures. Intense and locally vuggy silica alteration occurs in gently northeast-dipping ignimbrite horizons in the uppermost part of Florence Hill, with localized development of gold-absent incipient quartz stockwork veining. The various geological features noted in the Florence Hill exploration target are interpreted as being indicative of the uppermost parts of a fully preserved large-scale structurally controlled hydrothermal, possibly low- to intermediate sulphidation epithermal system.
The 3 drill holes at Florence Hill intersected fault-hosted epithermal veining in the upper +300 m, including several intermittent vein stockwork zones in the first 30 meters, followed by variably altered volcanic and intrusive host rock to depth of drilling. Assay results from the three holes did not have any significant gold or silver intersects.
Deeper in the holes, hydrothermal alteration displays an apparent transition to higher temperature porphyry-style alteration (propylitic to phyllic), accompanied by an increase in alteration intensity, with depth, however no significant base metal intervals were identified in the assay results.
Two holes were drilled in the Grapevine area, located approximately 2,300 m from the main Florence Hill exploration target. The Grapevine targets are characterized by steep quartz veining cutting stockwork associated with jarosite, quartz, kaolinite, and sericite. Assay results did not identify any significant gold, silver or base metal intervals in the Grapevine area.
The Hardy vein is located about 700 m southwest of the West Oatman area on a patented claim owned by the Company. Several epithermal quartz-calcite vein systems outcrop in the area. The single hole drilled in this area intersected 4.7 m at 0.45 g/t Au and 2.5 g/t Ag at 184.6 m downhole.
|
Mako Mining Corp. |
Figure 6.3
Florence Hill/Grapevine Location Map
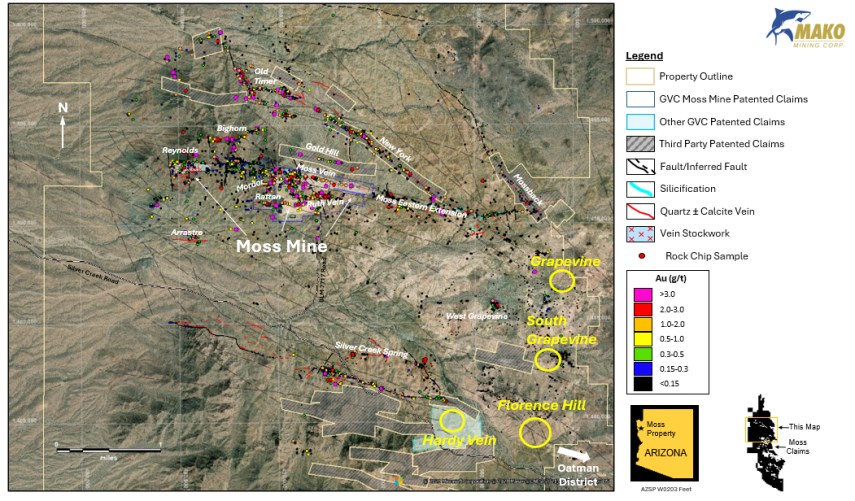
Figure supplied by Mako Mining Corp. and dated February, 2026.
|
Mako Mining Corp. |
7.0 GEOLOGICAL SETTING AND MINERALIZATION
7.1 Sources of Information
This section of the report updates the information from the 2021 Technical Report, which was based on the 2014 Technical Report. For background on the geology of the Moss Mine Project and Oatman mining district, the reader is referred to the 2021 Technical Report. Sections 7.2 through 7.6 are completely drawn from the 2021 Technical Report while Section 7.7 discusses recent observations and current thinking on the deposit.
The geology and mineralization of the Oatman district and the Moss mine and vicinity were initially studied by Schrader (1909), Ransome (1923) and Lausen 1931). More recent studies are found in published reports by Dewitt, et al (1986) and Clifton, et al (1980). Consultants for GVC and previous explorers have studied the deposit and its geology. Results are found in unpublished reports by Baum and Lherbier (1990), Hudson (2011), Brownlee (2014), Cuffney (2016), Cuffney and Eastwood (2013), and Larson (2013, 2015).
The Moss Mine Project lies within the western part of the Oatman mining district. The regional geology of the mining district was mapped by Ransome (1923), Lausen (1931), and Thorson (1971). Ferguson and Pearthree et al (2017) mapped the Oatman 7 ½' quadrangle, including the area surrounding the Moss Mine Project, at 1:24,000 scale, providing a modern framework for the geological setting of the project area. The Moss claim block was mapped by Eastwood (2011) for MinQuest, and the Moss patented claims were mapped in detail (1:1500 scale) by Cuffney (2013). Portions of the unpatented Moss and Silver Creek claim blocks were mapped by Cuffney (2018, 2020).
7.2 Regional Setting
In a regional structural context, the Oatman district lies in the transition zone between the stable Colorado Plateau on the north and disrupted terrane of the highly extended Basin and Range on the south. Although the area is broken into north-south trending ranges and valleys typical of the Basin and Range, extension is minor.
The Oatman mining district lies within a large Tertiary volcanic field, developed on a basement of Precambrian granitic and metasedimentary rocks. A batholitic body of trachytic magma invaded the volcanic field to the northwest of Oatman, culminating in massive pyroclastic eruptions of the Peach Springs tuff, resulting in collapse of the roof of the batholith and formation of the huge Silver Creek caldera at ~18.8 Ma (Ferguson et al., 2013). The Peach Springs tuff fills the caldera; its outflow ash-flow sheet extends for more than 100 miles from the caldera, covering more than 15,440 square miles across northwest Arizona and California (Pamukcu, et al, 1986). The main Oatman district lies just outside of the caldera rim, where mineralization is hosted in pre-caldera intermediate composition lava flows; whereas Moss lies inside the caldera and is hosted in intra-caldera tuffs and intrusions.
Calderas are often excellent loci of epithermal precious metals deposits due to the combination of deep-seated structures (concentric and radial fractures), permeable volcanic and volcaniclastic host rocks, intrusive activity, and abundant water for development of hydrothermal fluids. Examples include Round Mountain, NV, Silverton, CO, Goldfield, NV, and Creede, CO. The main Oatman mining district, lying immediately to the east-southeast of the Moss Mine, produced more than two million ounces of gold from northwest to west- northwest-trending epithermal quartz-calcite veins. Several mines contained bonanza grade ores shoots averaging more than 1 oz/t gold.
|
Mako Mining Corp. |
7.3 Host Rocks
The dominant host rock of the Moss deposit is the Moss porphyry, a polyphase monzonite to quartz monzonite porphyry, which intrudes the Peach Springs tuff. Typical Moss porphyry contains coarse grained (4 mm to 10 mm) plagioclase and biotite phenocrysts with lesser hornblende in a very fine-grained groundmass of quartz and feldspar. The Moss stock contains several phases, including equigranular quartz monzonite to monzodiorite, and more felsic phases. Within the project area, the porphyry has undergone weak early propylitic and potassic alteration, characterized by potassic feldspar partially replacing plagioclase feldspar. Sparsely porphyritic feldspar porphyry and rhyolite porphyry to aplite dikes with quartz eyes crosscut the porphyry and the volcanic wall rocks and constitute minor host rocks. Late (post-mineral) micro-gabbro to basalt dikes cut all units along north-trending faults.
The easternmost portion of the Project area and the western portions of the claims, west of the West Pit, are underlain by the Peach Springs tuff, (formerly the Alcyone Formation), consisting of volcanic tuffs, flows, and minor volcaniclastic sediments filling the caldera. In the project area, the Peach Springs tuff is a thick, highly variable unit composed dominantly of several welded trachytic ash-flow tuff sheets separated by coarse volcaniclastic sediments, debris flows, and volcanic breccias. Lithic-rich welded tuff is common.
Locally, large-foundered blocks of Precambrian granite, representing landslide deposits from the caldera walls, occur within the tuff. Welded tuffs within the Peach Springs tuff are competent units capable of hosting both persistent veins and stockworks.
The Times granite, a fine-to medium grained leucogranite, forms an irregular intrusion centred to the south of Silver Creek. Age relations between the Moss porphyry and the Times granite are uncertain; the two intrusions appear to intermingle in several places. The granite is a host rock at the West Oatman prospect.
7.4 Mineralization
Gold-silver mineralization in the West Oatman district occurs as high-level low-sulfidation epithermal veins and stockworks. The mineralization is very similar to that of the main Oatman mining district. The Moss Vein may represent the western extension of the Gold Road vein on the north end of the Oatman district (Figure 7.1 and Figure 7.2).
Three main veins and their associated stockworks host the bulk of mineralization defined to date at Moss:
1) the Moss Vein and its extensions to the west and east of the resource area.
2) the Ruth Vein to the immediate south of the Moss Vein.
3) the West Oatman Vein, lying about one mile to the south of the Moss Vein.
|
Mako Mining Corp. |
Figure 7.1
Geology and Exploration Areas around the Moss Mine
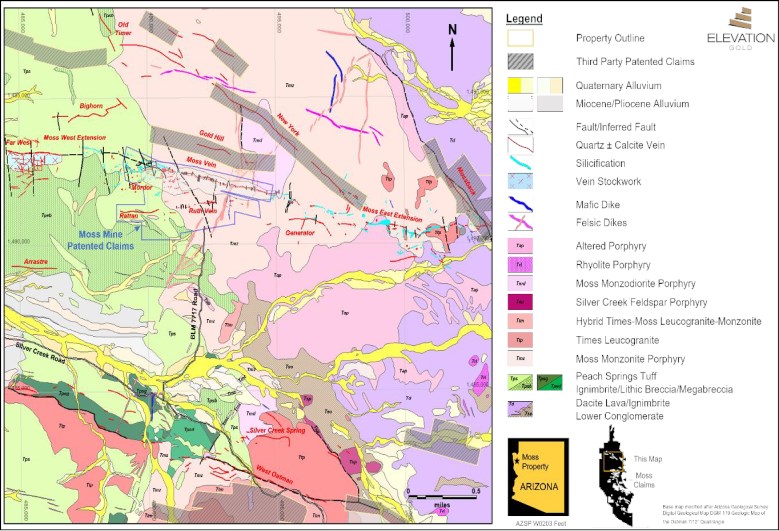
Figure supplied by Mako Mining Corp. and dated February, 2026.
|
Mako Mining Corp. |
Figure 7.2
Geology and Exploration Areas along the Moss Vein
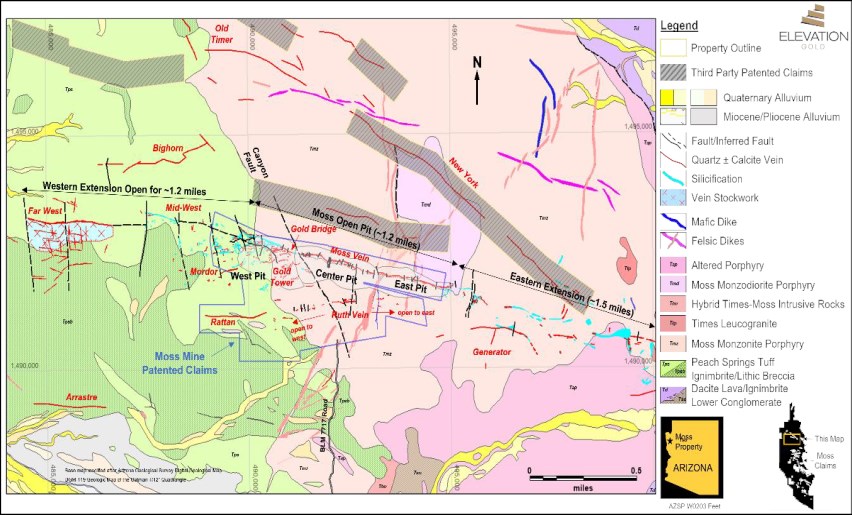
Figure supplied by Mako Mining Corp. and dated February, 2026.
|
Mako Mining Corp. |
7.4.1 Moss Vein System
The Moss Vein system extends for 3.90 miles in a roughly east-west direction across the Moss/Silver Creek claim block. The vein has been divided into three sections for exploration and mining purposes:
the Main Moss Vein/resource area (Moss Open Pit, West Pit), comprising 1.2 miles of the Moss vein on the patented mining claims.
the Eastern Extension, extending for. 1.5 miles eastward from the east end of the open pit to the east end of the Silver Creek claims where the vein intersects the NNW- trending Mossback Vein.
the Western Extension of the Moss Vein, extending for 1.20 miles from the west end of the West Pit to the Far West prospect., including the Cliffs of Mordor/Mordor Vein and the Mid-West target.
In the central part of the resource area, within the Moss Open Pit, the Moss Vein strikes east- southeast (~96° azimuth) and dips steeply (~70°) to the south. The Ruth Vein and other small veins in the hanging wall of the Moss vein are antithetic veins dipping to the north.
Geological mapping combined with review of the Moss Mine Project drill hole logs and assay database indicate the potential for exploitation of other mineralized veins and stockwork zones between the Moss and Ruth Veins.
7.4.2 West Extension of the Moss Vein
The Moss vein can be followed for 1.20 miles west of the West Pit and is expressed on surface as quartz+/-calcite veining, stockwork veining, or silicification along trend of the vein.
Four mineralized areas within the West Extension are discussed separately: West Pit, Mordor, Mid-West Extension, and Far West
7.4.2.1 West Pit
The West Pit mineralization is part of the main Moss Vein/resource area.
Strong gold-silver mineralization follows the Moss Vein to the west across the Canyon fault, a major north-northwest linear. The structure of the Moss vein crosses the Canyon fault apparently without change in orientation, and although it appears as if there is little displacement across the fault, potential movement along the fault is being tested with additional drilling. Movement along the Canyon fault may pre-date the Moss vein; drill testing will confirm whether post-mineral movement is minor.
The West Pit, an expansion of the original Moss open pit for about 1,200 feet to the west, and the associated Gold Bridge and Gold Tower targets lie immediately west of the Canyon fault. The nature of the Moss vein changes across the fault. Massive quartz-calcite veining typical of the Moss vein is only locally developed. Replacement silicification cut by quartz-calcite veining is more common. Widespread strong silicification marks the footwall of the structure. Several thin north-dipping antithetic quartz veins, silicified zones, and zones of stockwork veining occur in the hanging wall of the Moss structure. The West Extension has been interpreted as being a zone of horse-tailing of the Moss vein.
|
Mako Mining Corp. |
The stockwork associated with the West Pit/Gold Bridge/Gold Tower is wider and more extensive than that on the hanging wall of the main Moss Vein - up to 400 feet wide.
Accordingly, gold-silver grade is lower than in the Moss Vein and associated stockworks in the Moss Open Pit.
7.4.2.2 Cliffs of Mordor/Mordor Vein
The rugged cliff terrain west of the topographic crest of the West Pit is informally named the Cliffs of Mordor. Stockwork and vein mineralization continues west of the pit but has until recently been difficult to access and drill due to the rugged topography. Pioneering in the West Pit has created the opportunity for drilling from various flat benches within the pit as it develops. The host rock changes from the Moss porphyry to welded tuffs of the Peach Springs tuff west of the West Pit boundary. The tuffs are competent host rocks capable of propagating both veins and stockwork mineralization, as manifest in the presence of numerous veins in outcrop to the west of the current mine.
A well-defined quartz-calcite vein, the Mordor vein, crops out along the base of the cliffs, just west of the leach pads. The vein strikes 260° and dips 50° to the north in outcrop and can be followed for about 400 feet along strike. Continuous-chip samples collected across the 5 foot-width of the vein ranged from 0.079 oz/ton Au to 0.286 oz/ton Au.
7.4.2.3 Mid-West Extension
To the west of the Cliffs of Mordor, about 1,800 feet to 2,300 feet west of the West Pit, the Moss Vein crops out as a rib of replacement silicification with minor white quartz veining for about 1,000 feet of strike length. Several prospect pits and one short adit are remnants of historic exploration of the vein.
Fairly low gold values have been obtained from rock-chip samples of the vein structure. Only five of 48 samples assaying >0.02 oz/ton Au, with a maximum of 0.0575 oz/ton Au. Despite the weak expression of the Moss vein and the relatively low surface gold values. Drilling by Reynolds Metals in 1991 defined a broad area of thick low-grade gold, including a section of 370 feet assaying 0.0127 oz/t Au in hole WO 91-07. This drillhole intersected hanging wall stockwork veining above the Moss Vein but does not appear to have been drilled deep enough to intersect the Moss Vein. The Mid-West Extension is considered a primary target for future resource expansion
|
Mako Mining Corp. |
Figure 7.3
Mid-West Extension Geology and Rock-Chip Gold (in ppb)
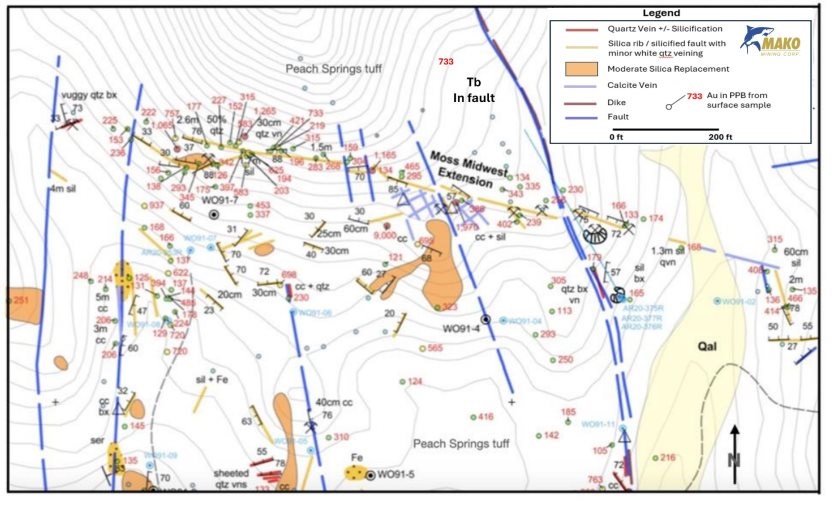
Figure supplied by Mako Mining Corp. and dated February, 2026.
|
Mako Mining Corp. |
7.4.2.4 Far West
The Far West extension of the Moss Vein comprises the westernmost exposures of the vein system. Following a gap of about 1,500 feet lacking surface expression of the Moss Vein, the structure reappears as a broad zone of stockwork veining with quartz-calcite+/-fluorite veins
extending for about 2,000 feet along the steep south flank of a large hill (the Black Fin). Additional subvertical veining is present on the back side of this hill. Several small prospect pits and a long adit have been driven into the vein/stockwork. Lac Minerals drilled seven reverse-circulation holes in 1989, which intersected multiple thin zones of gold mineralization. It is possible that the Black Fin area is similar to the Cliffs of Mordor area (see Section 7.4.2.2), with extensive stockwork veining and silicification in the hanging wall to the Moss Vein; the silicification resulting in the development of significant topographic highs.
The Far West prospect is considered a good exploration target for long-term resource expansion. However, rugged topography and distance from current operations render it a somewhat lower priority target at this stage.
7.4.3 Morphology of the Moss Vein
The Moss vein strikes S84E and dips an average of 70º to the south (096/70 using the right- hand rule). The pre-mining expression of the vein was a series of low west-northwest- trending hogbacks, with the vein footwall defining the north side of the ridges.
The Moss Vein is a fissure-filling vein, best described as a "breccia vein". The vein is a primary hydrothermal breccia, as opposed to a brecciated vein produced by post-mineral faulting, although some post-vein brecciation does occur. The Moss Vein occupies a major fault zone that was periodically opened during episodic boiling events, which deposited quartz together with and/or alternating with calcite. Explosive breccias and boiling textures are common. Some of the pulses also deposited gold and silver. The main vein varies with decreasing quartz-calcite matrix from nearly solid white vuggy quartz and/or calcite (usually quartz-calcite mixtures) with occasional colloform banding, through quartz-calcite vein with abundant floating clasts of wall rock (breccia vein), to brecciated wall rock veined and cemented by quartz-calcite stockworks. In places, the Moss Vein consists only of stockwork veining.
The hanging wall of the vein contains scattered thin quartz-calcite veins and breccia veins over a zone measuring several tens of feet up to 100 feet wide, creating thick zones of low- grade mineralization. Quartz-calcite veining in the hanging wall may occur either as thin planar veins (often quartz veins with calcite cores), irregular veins with sinuous borders, or highly irregular breccia infillings. Significant gold mineralization can occur in stockwork zones with only a few percent of visible quartz-calcite veinlets.
The vein and hanging wall stockwork zone pinch and swell both along strike and down dip, probably reflecting dilatant zones developed along subtle bends in the vein structure.
The footwall contact is normally a fairly sharp well-defined contact between vein and porphyry wall rock with few or no veinlets. The contact varies in nature from a sharp contact between intact fissure-filling vein and wall rock to a fault contact with brecciated vein juxtaposed against footwall Moss porphyry host rock. Locally, quartz-calcite stringers carrying low-grade precious metal values extend for 10 to 15 feet into the footwall wall rock. Mineralized footwall zones may be associated with dilational flexure zones. In contrast, the position of the upper contact of the hanging wall stockwork is a less well-defined contact, picked predominantly on the basis of gold assays as vein density in the hanging wall gradually decreases.
|
Mako Mining Corp. |
Locally, the Moss Vein has been subjected to later movement within and across the fault along which the vein developed. This movement has created locally brecciated portions of the vein, both at the footwall contact and internal to the vein. Late post-mineral calcite often cements these tectonic breccias. The Moss Vein displays a variety of styles, ranging from massive quartz-calcite veining with bladed calcite and small vugs, colloform banded quartz and quartz-calcite veining, breccia veining with wall rock clasts floating in quartz-calcite matrix, to stockworks veining cementing brecciated wallrock.
7.4.4 Ruth Vein
The Ruth Vein is an epithermal quartz-calcite vein, similar and subparallel to the Moss Vein, lying about 650 feet to the south of Moss in the central area and dipping about 60 degrees north toward the Moss vein. The Ruth Vein was a former producer and is credited with about 25,000 tons of ore mined between 1900 and 1935 (see section 6.1.3).
The vein crops out as a four to six-foot-wide solid quartz+/-calcite vein, extending from the shaft at the old mill site near the present mine office to two shafts lying about 600 feet to the east. The shafts serviced workings developed in a high-grade (~0.35 oz/ton Au, 2.0 oz/ton Ag) ore shoot that raked about 45 degrees to the east.
East of the shafts, there is no surface expression of the Ruth vein for about 500 feet along strike. On the east side of the wide north-trending felsic dike, the Ruth structure reappears and can be followed for another 350 feet to the east as a series of scattered ENE-aligned small prospect pits exposing 2-inch to 10-inch-thick north-dipping quartz veins (~ 254/67; right-hand rule strike and dip).
West of the mill site - across the Canyon fault - the Ruth Vein can be followed for about 800 feet to the west-southwest as weak veining or stockworks exposed in a few prospect pits and roadcuts. The Ruth Vein has about 2,250 feet of exposed strike length.
The main productive area of the Ruth Vein strikes nearly east-west and dips north at 50-70 degrees (267/50-70). The east and west extensions have more northeasterly trends with an orientation of approximately 255/65. The change in orientation causes the Ruth Vein to diverge from the Moss Vein west of the Canyon fault and to converge towards the Moss Vein east of the eastern shafts.
There is no surface expression of the Ruth Vein beyond the last prospect pit 850 feet east of the eastern shafts. However, in the Eastern Extension area, off the patented claims, a similar north-dipping quartz/-calcite +/-fluorite vein, which is subparallel to the Moss Vein, crops out about 600 feet south of the Moss vein. Informally named the Generator vein, this vein may represent the eastern extension of the Ruth vein.
Although no petrographic studies have been conducted on Ruth Vein material, macroscopic study of outcrops, drill core, and drill chips suggest similarity to the Moss Vein. The Ruth Vein varies from a single four-to-six-foot-wide vein, through zones of one-to-six-inch-wide quartz+/-calcite veins intermixed with wall rock to stockworks of thin quartz+/-calcite veinlets. Overall, the Ruth Vein is smaller and less well developed than the Moss Vein. The Ruth Vein also exhibits less vugginess with finer vugs than are typical of the Moss Vein. No bladed calcite or colloform veining has been noted in drill core from the Ruth Vein, but only a small amount of core has been inspected to date. Silver: gold ratios are similar to the Moss Vein, suggesting similar ore mineralogy.
|
Mako Mining Corp. |
Locally along the vein, mineralized stockwork zones with white quartz-calcite veinlets comprising 10% to 30% of the rock occur both above and below the main Ruth Vein.
7.4.5 Gold-Silver Mineralization
7.4.5.1 Vein Minerology
The mineralogy of the Moss Vein system as currently explored is simple and the ore is nearly void of all deleterious elements. Key elements of the ore are:
Gangue consists of quartz and calcite with minor fluorite locally occurring as late- stage veins and vug fillings.
Gold mineralization is predominantly in the form of very fine-grained native gold and silver-rich native gold grading to electrum (an alloy of gold and silver with Ag:Au >1:5).
Silver occurs as electrum and within the silver-rich gold. Minor native silver has also been identified. In addition, minor amounts of very fine grained, grey to black sulfides (dominantly acanthite, Ag2S) are present as disseminations and occasionally in very thin grey bands in unoxidized or weakly oxidized parts of the veins. The silver minerals bring the overall Ag:Au ratio of the deposit to approximately 8:1.
Base metals (Cu, Pb, Zn) are very low, especially in the upper parts of the system, but show a slight increase with depth, consistent with low-sulfidation epithermal veins.
No arsenic or antimony minerals occur.
Mercury is negligible.
7.4.5.2 Mode of Gold/Silver Occurrence
Petrographic study by Hudson (2011) identified native gold and electrum and tentatively identified acanthite (Ag2S). Larson (2013, 2015) positively identified acanthite as well as minor native silver and found that gold and electrum occur in the following modes, in order of abundance:
Grains interstitial to quartz grains or in small vugs in quartz (most common).
Grains on or within goethite, after oxidized pyrite (common).
Grains encapsulated in pyrite (rare).
|
Mako Mining Corp. |
Larson (2015) reports, "Overall, quartz is the host for all of the metallics…. with this generalization that quartz is the dominant host, the most common site(s) for precipitation of gold or acanthite are in open spaces such as vugs and intergranular between quartz grains." Such occurrence lends to good leach recoveries following secondary crushing, since the rock tends to break along quartz grain boundaries, rather than across them.
The Moss Vein contains a very small amount of sulphide minerals, principally pyrite (<1% by volume). Although pyrite is only a very small component of the rock, pyrite was found to co- precipitate with quartz and electrum, and Larson (2015) writes, "Pyrite is present in small amounts in most of the samples, goethite formed by the oxidation of pyrite and usually retaining the shape of the original pyrite is in half of the sections. Of these, pyrite or goethite actually host (encapsulate) some of the electrum in five of the samples." Nearly all the pyrite has been oxidized to goethite within the current limits of mining.
The mode of occurrence of gold within the Moss Vein appears to be variable (Figure 7.4). Hudson (2011) determined that all the gold grains identified in the three core samples he studied were encapsulated in calcite. In contrast, Larson (2013, 2015), who studied a broader group of 18 sections of core spanning 3,500 ft of strike length and 860 ft of vertical extent of the Moss Vein, found only one occurrence of gold encapsulated in calcite, although several electrum grains were located adjacent to calcite grains. Baum & Lherbier (1990) estimated that 64% of electrum grains in sample 444-1-2 were associated with hydrous iron oxides (goethite), 26% were associated with quartz-calcite gangue, and 10% of gold grains were encapsulated in pyrite grains.
7.4.5.3 Gold Grain Size
Gold/electrum is dominantly very fine grained, but some exceptions occur. Larson (2013) found that most gold/electrum grains were very small with a range of 3 microns to 70 microns in diameter. Measurements made by the author of 48 grains of electrum from Larson's (2015) photomicrographs indicate a range in maximum grain dimension from 2 to 98 microns, with an average of 23 microns. Hudson found only very fine grains of gold/electrum with all grains measuring <10 microns in one polished section and all grains measuring <20 microns in another.
Baum & Lherbier (1990) studied two composite chip samples from Billiton's reverse- circulation drill holes. They found a large variation in grain size between the two composites, with one sample containing mostly very fine-grained particles (81% <20 microns) and only 2% of grains measuring >100 microns. The second sample had significantly more coarse grains with 46% of grains being >20 microns and 18% measuring >100 microns to a maximum of 300 microns. Table 7.1 shows that between 60% and 90% of the gold grains studied by Baum & Lherbier are less than 50 microns (or 0.05 mm) in diameter.
 |
Mako Mining Corp. |
Figure 7.4
Occurrence of Gold/Electrum Grains*
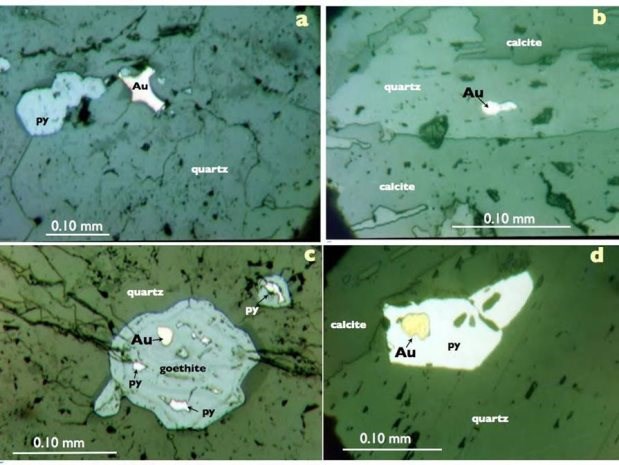
*Notes: a) gold filling interstices between quartz grains, (AR 141c at 21.5' downhole), gold grain is 98 microns across - the largest grain found by Larson (2015); b) gold encapsulated within quartz (AR 169c at 139.5' downhole), gold grain measures ~16 microns across; c) gold within goethite after oxidized pyrite (AR 204c at 443.5' downhole) in fractured quartz, gold grain measures 19x12 microns; d) gold encapsulated in fresh pyrite (AR 201c at 749' downhole), gold grain measures ~28 microns across (note great depth of sample).
Table 7.1
A Summary of Microscopic Gold Particle Size Analysis, Moss Vein Material (Baum & Lherbier, 1990)
|
Gran Size |
Percent of Gold Grains in Sample |
||
|
Microns |
Millimetres |
Sample 444-1-2 |
Sample 444-3 |
|
<5 |
<0.005 |
60% |
21% |
|
5-20 |
0.005-0.02 |
21% |
15% |
|
20-50 |
0.02-0.05 |
10% |
24% |
|
50-100 |
0.05-0.1 |
7% |
22% |
|
>100 |
> 0.1 |
2% |
18% |
|
Total: |
- |
100% |
100% |
Table Compiled from information contained in Baum & Lherbier, 1990
|
Mako Mining Corp. |
7.4.5.4 Paragenetic Sequence
Petrographic work by Larson (2013, 2015) shed additional light on the alteration and mineralogical/paragenetic associations of gold-silver mineralization at Moss. Important observations include:
Widespread early propylitic (chlorite, epidote, calcite) and potassic (K-feldspar replacing plagioclase, magnetite veinlets and disseminations) affected the Moss porphyry and its wall rocks throughout the project area.
Ore stage alteration is limited to several phases of quartz and calcite precipitation in open spaces.
Small amounts of pyrite were deposited with quartz, both before and during ore-stage gold-silver mineralization.
Acanthite postdates most pyrite, occurring as rims on pyrite or infilling fractures in pyrite.
Very minor base metals mineralization (chalcopyrite, galena, sphalerite) narrowly predates precious metals deposition (evidenced by acanthite rimming and replacing sphalerite).
Acanthite is more resistant to oxidation than pyrite (which is earlier and often fractured), often surviving as unaltered acanthite within goethite after oxidized pyrite.
Late calcite occurs as post-mineral breccia infillings.
Figure 7.5 presents a revised paragenetic sequence of alteration and mineralization, based on logging of drill core and Larson's petrographic observations and interpretations.
Figure 7.5
Paragenesis of the Moss Deposit
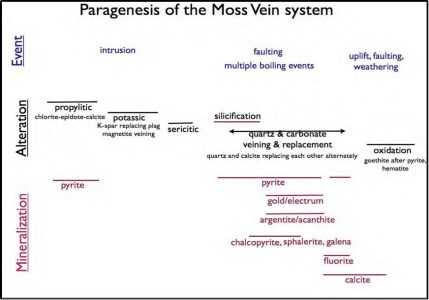
|
Mako Mining Corp. |
7.5 Oxidation
Partial oxidation appears to be relatively deep along the Moss Vein. Oxidation in and around the Moss Mine tends to be deeper along the Moss Vein than outside of it. This is largely due to structural permeability created by brecciation within the vein due to post-mineral movement during reactivation along the vein structure and at intersections with northerly- trending cross-faults. The vuggy nature of much of the vein also contributes to local porosity and permeability. The Moss Vein forms a local aquifer along which oxygenated waters have moved as the water table fluctuated over time.
Except for the Moss Vein and a few other major structures, the REDOX zone corresponds roughly to the present water table. However, oxidation tends to extend deeper into the Moss Vein and its hanging wall stockworks (e.g., Figure 7.6). Cuffney and Eastwood (2013) state, "The REDOX zone at Moss is not a simple boundary and is not related to the present static water table" and "It is not uncommon for the vein to be oxidized to depths in excess of 500 ft (152 m), with unoxidized and thin, partially oxidized zones in the hanging wall." The authors further state, "The drill holes show that the water level is between 40 to 150 ft (12.2 m and 45.7 m) below surface. There is ample evidence of oxidized rock below the water level in several of the core holes. The fact that oxidation is deeper than the present water table is interpreted to indicate that oxidation is related to a lower water table in the past, and that the water table has risen to its present level after oxidation took place".
Figure 7.6
Cut Core from Drill Hole AR204C at 385 ft Downhole (272 ft vertical depth), Showing Partial Oxidation
(brown limonite) in the Moss Vein
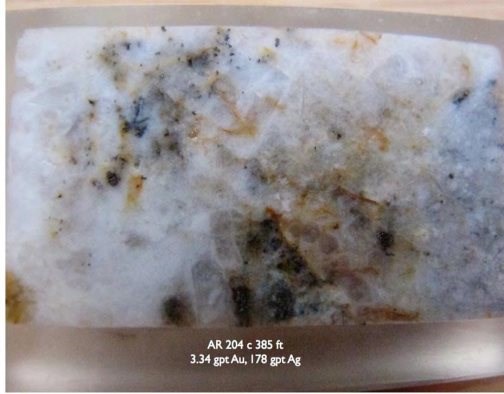
Hudson (2011) states that 'the depth of oxidation can be in excess of 300 to 500 ft (91 m to 152 m)'. A similar finding is detailed in a mining report by geologist M. C. Godbe III to BF Minerals (April 26, 1982) who states, "The Moss Mine was developed over a vertical range from surface to the 300 level. All (of the mined mineralized material was) within the oxidized zone". Drilling by GVC shows oxidation well below the present water table (~140 ft below the shaft collar), and partial oxidation (limonite on fractures) occurs locally to more than 800 ft below the present surface.
|
Mako Mining Corp. |
7.6 Structural Geology
7.6.1 Faults
The Moss Vein follows a major west-northwest structure, which crosses the mine property and extends for at least another mile to the west beyond the Project area and 1.5 miles to the east as shown in Figure 7.2.
The northwest-trending Canyon fault forms the boundary between the main Moss Vein and the West Extension. Despite being a large through-going structure, the Canyon fault appears to displace the Moss Vein from the West Extension by a very small amount. This is being tested with additional drilling from the West Pit.
Within the project area, a series of small north-to-north-northwest trending faults offset the Moss Vein. A total of 27 faults cutting across the Moss Vein have been mapped. A relative chronology was compiled based on surface topology and the interactions of the faults with adjoining intersecting faults. Fewer cross-faults have been identified in the West Extension area.
Field measurements show that 24 of the mapped faults off-setting the Moss vein have dips that are equal to or greater than 80º (the exceptions are Fault 3 that dips at 50º, Fault 12 that dips at 65º and Fault 24 that dips at 40º). All the faults, except the Canyon fault and the four faults that trend a few degrees east of north, displace the Moss vein by small amounts in the left-lateral direction. This offset may be due to true left-lateral offset, or to vertical offset down to the east, producing the apparent left-lateral offset of the south dipping Moss vein.
7.6.2 Dikes
Four different types of dikes have been identified through geological mapping:
Feldspar porphyry dykes with minor quartz (medium grained feldspar phenocrysts with occasional quartz in a fine grained, sugary/aplitic to aphanitic groundmass);
Aplite dykes (thin aphyric to sparsely porphyritic dikes with a sugary/aplitic groundmass - may be a chilled version of the feldspar dikes);
Feldspar-biotite dykes (large feldspar and fine- to medium-grained biotite phenocrysts in an aphanitic groundmass); and
Mafic dikes (dark brown, aphanitic to finely crystalline basalt to micro-gabbro dikes, which are weakly chloritized).
|
Mako Mining Corp. |
With the exception of the mafic dikes, which are late post-mineral feeders to basalt flows, the dikes predate the Moss vein, as evidenced by the development of Moss Vein-related stockworks within each type of dike. The post-mineral mafic dikes tend to invade the small north-trending faults, which offset the Moss Vein.
7.7 Current Geological Concepts
The current model is based on concepts diverging somewhat from the previous thinking on this deposit. The following observation are based on a site visit conducted by Gray (2025) of Resource Geosciences Incorporated, Mako staff observations, and the modelling exercise completed by Gary Wong, P.Eng. There are some very distinct characteristics to this deposit, which were not modelled previously. The following are the main salient points:
1. The main feature dividing the deposit is the NW trending Canyon fault. West of this fault, there is no evidence of a Ruth vein/structure, nor is there evidence of a coherent Moss Vein.
2. The Moss Vein has two different expressions: high grade quartz carbonate lode veins and low-grade quartz stockwork. The west side of the Canyon Fault only contains a very small portion of the Ruth structure. This is suspected because of point 3.
3. The higher-grade material and the veins have only been observed in the intrusive Moss Porphyry. To the west of the Canyon Fault are mainly volcanic rocks (Peach Spring Tuff). There is a fundamental change from the intrusive to the volcanic rocks which is not well understood but all evidence points to an absence of major veining and lower grade in the volcanics, however the mineralized intervals are typically wider and more continuous than those observed to the east of the Canyon Fault.
4. The Moss vein does not continue west to the Reynolds area. The previously modelled steeply dipping features have not been observed in Reynolds. Instead, the mineralization controls appear to be much flatter lying (approximately dipping 30 degrees to the southwest), possibly associated with bedding features in the tuff. This is very apparent in the grade model and as such, potential for shallow mineralization is very high. Unfortunately, there is currently no diamond drilling to gain an understanding of the controls in that area, only reverse circulation drilling. Future diamond drilling programs should shed light on this feature.
Figures 7.7. to 7.8 show the relative positions of the features described. Figure 7.9 shows a cross-section of the Reynolds zone illustrating the flatter attitude of the zone looking west (azimuth 280°).
|
Mako Mining Corp. |
Figure 7.7
Moss and Ruth Veins relative to Canyon Fault
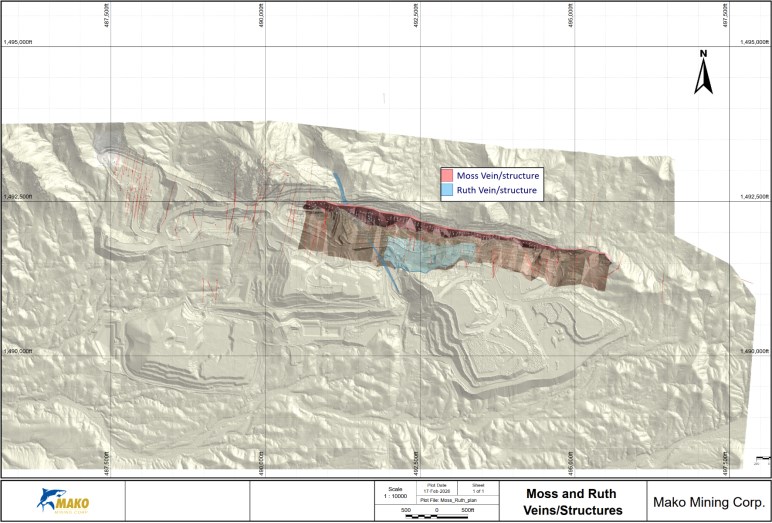 |
| Source: Mako, January, 2026. |
|
Mako Mining Corp. |
Figure 7.8
Moss Stockwork and Reynolds Zone
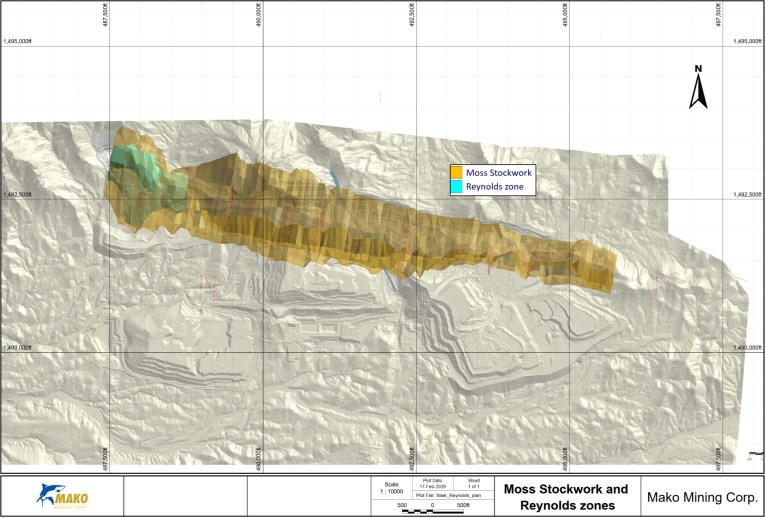 |
| Source: Mako, January, 2026. |
|
Mako Mining Corp. |
Figure 7.9
Cross-Section for the Reynolds Zone showing the Flatter Attitude Looking West (Azimuth 280°)
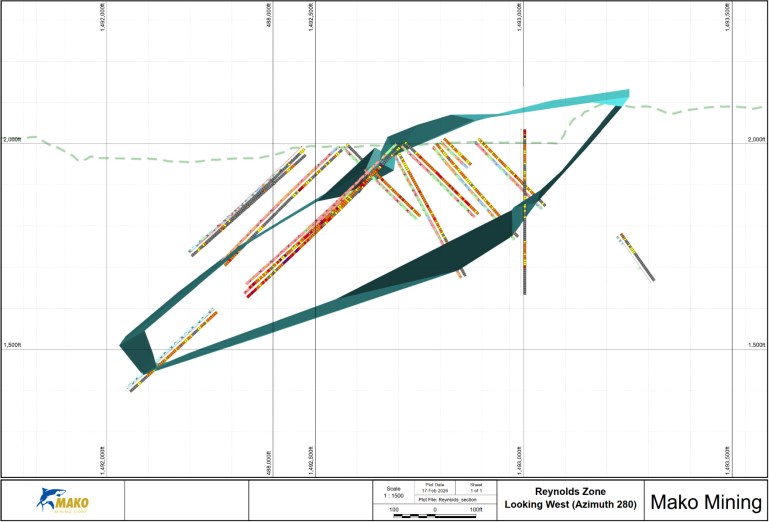 |
| Source: Mako, January, 2026. |
|
Mako Mining Corp. |
8.0 DEPOSIT TYPES
This section is taken from the 2021 Technical Report as no significant studies have been done since that time.
The Moss deposit is a steeply dipping (average 70˚) quartz-calcite vein and stockwork system, which extends over a strike length of approximately one mile in the resource area (Moss Open Pit and West Pit), but can be traced for 3.9 miles in total length.
The Moss Vein system is considered a high level, low-sulfidation (adularia-sericite) epithermal gold-silver deposit in the classification of Heald et al (1987) and White and Hedenquist (1995). Low sulfidation epithermal deposits form from hydrothermal waters in the relatively near-surface environment, typically within 1.5 km of the earth's surface (Taylor, 2007). They are commonly found associated with magmatism and volcanism, but are somewhat distal (vertically or laterally) from the actual centre of magmatism, in environments where meteoric waters have mixed with and diluted magmatic waters.
Epithermal deposits comprise one of three sub-types: high sulfidation; intermediate sulfidation; and low sulfidation. Each sub-type is identified by characteristic alteration and ore-stage mineral assemblages, occurrences, textures and suites of associated geochemical elements. The designation of high sulfidation vs low sulfidation is based on the sulfidation state of the ore-stage sulfide suite, not the abundance of sulfides in the ore. However, precious metals mineralization at Moss is characterized by a low sulfidation suite of minerals and a very low sulfide content (<1%) as well.
The quartz-calcite vein textures at Moss (massive, breccia, vuggy, colloform), are typical of low sulfidation epithermal veins. Gold occurs as very fine native gold and electrum, and silver typically occurs as electrum and very fine grained acanthite, similar to other low- sulfidation precious metals deposits.
The very low (usually trace) levels of base metals in the Moss ores are also consistent with high-level low-sulfidation gold deposits. Alteration related to main-stage precious metals mineralization is confined to silicification and minor sericitization of wall rock adjacent to the veins.
The Moss mineralization differs from typical low-sulfidation precious metals deposits in its lack of adularia (possibly present, but not yet positively identified) and lack of deleterious elements such as arsenic, antimony, and mercury.
Table 8-1 summarizes the characteristics of the Moss Vein system and compares them to characteristics of typical high-level low-sulfidation precious metals deposits.
The high level of emplacement of the Moss mineralization is evidenced by the very fine grain size of ore-stage minerals (gold, silver, electrum, acanthite) and the highly vuggy nature of much of the vein. No paleosurface or near surface features, such as silica sinters, chalcedony or a steam-heated acid leach cap, are preserved in the Moss project area. This indicates that the top of the hydrothermal system has been eroded, thereby exposing the gold depositional zone. Larson (2015) notes that much of the quartz in the Moss Vein was likely deposited as chalcedony or opal, which later converted to fine-grained quartz. This would place the upper part of the Moss Vein system only slightly below the surficial hot-spring zone.
|
Mako Mining Corp. |
Table 8.1
Comparison of Moss Deposit Characteristics with Typical Low Sulfidation Epithermal Gold Deposits
| Characteristics | Moss Vein System | Typical Low Sulfidation Epithermal |
| Mineralization form | Vein and stockwork | Veins and stockworks, minor disseminations |
| Geological setting | Volcanic centre (Intra-caldera) | Above or adjacent to magmatic centre |
| Host rocks | shallow-level intrusion and Intra-caldera volcanics | Dominantly volcanic and epiclastic sediments |
| Alteration | Silicification, minor argillic | silicification, narrow argillic, illite, adularia |
| Vein textures | vuggy, breccia, colloform | Open space/cavity filling, bands/colloform, breccias, druses |
| Gangue minerals | quartz, calcite, fluorite | Quartz, chalcedony, calcite, adularia |
Ore minerals |
native Au & Ag, electrum, acanthite | Native Au and Ag, electrum, minorsphalerite, chalcopyrite, galena |
| Elemental associations | Au, Ag (Zn, Cu) | Au, Ag, Zn, Pb, (Cu, As, Sb, Hg, Se, Te) |
Bladed calcite, which is common in the Moss deposit, is indicative of the boiling zone of the hydrothermal fluid, where calcite and quartz co-precipitate, after which calcite is partially replaced by quartz. The boiling zone is the main locus of gold deposition, since boiling destabilizes gold-bearing hydrothermal solutions, causing precipitation of gold. The boiling zone within the Moss Vein, as defined by the occurrence of bladed calcite and quartz replacing bladed calcite as shown in Figure 8.1, extends over a vertical extent of more than 500 ft (150 m) and likely continues much deeper (Cuffney, 2015).
Figure 8.1
Examples of bladed calcite partially replacing quartz (evidence of boiling) in HQ- diameter (2.5") diamond
core drill holes: Right a) AR-165C at 213 ft; Left b) AR21-410C at 781 ft (with purple fluorite)
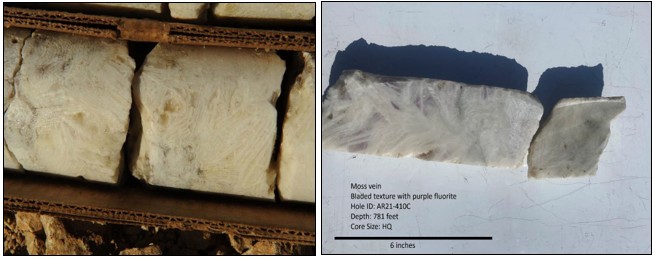 |
| Figure supplied by Gary Wong and dated February, 2026. |
Bladed calcite replaced by quartz is common on the east side of the Canyon fault (central pit), extending from surface to a depth of 500 feet below surface. On the west side of the Canyon fault (West Pit/West Extension) bladed calcite is less common and is first seen in core at a depth of 600 feet (Cuffney, 2015). This relationship suggests that the Canyon fault may be a reverse fault with the west side down dropped. More search for boiling textures in outcrop and drill samples will be needed to test this theory. Larson (2015) also noted that some quartz in the Moss vein in the central pit area showed textures indicative of replacement of chalcedony by higher temperature quartz. This also argues for a high-level setting on the east side of the fault.
|
Mako Mining Corp. |
In many epithermal deposits, precious metals grades above the boiling zone can be low, but bonanza grades often occur at the boiling zone. Although the overall grade of the Moss deposit is low, several pods of high-grade mineralization have been found in modern exploration and during mining of the Phase I bulk sample. A small shoot of very high-grade gold was reportedly mined in the early days of the mine, yielding nearly 10,000 ounces of gold valued at $200,000 at $20.67/oz, from a small (10 ft diameter x 10 ft deep) shaft (Malach, 1977). In addition to the Moss Vein, a number of high-level veins throughout the Moss property present good opportunity for discovery of bonanza-grade ore shoots beneath outcrops that yield only low gold and silver values.
The spectacular bonanza ore shoots of the Tom Reed, United Eastern, and Ben Harrison mines at Oatman were blind ore bodies, whose surface expression was narrow argillic (illitic) alteration halos along structures. The argillic alteration blooms were barren but rapidly changed to high-grade (>0.25 opt Au) ore. An exception is the Tip Top orebody, which lies about 100 feet below a surface outcrop of silicified latite laced with quartz and calcite veins, very similar to portions of the Moss Vein. The ore shoots at Oatman were characterized by abrupt tops and bottoms corresponding to the boiling zone, extending over a vertical interval of about 1,200 feet - from about 2,600 feet down to 1,400 feet elevation. The Gold Road vein, north of the main district, cropped out on surface and has a vertical extent of at least 2,000 feet (3.300 feet down to ~1,200 feet elevation) with current exploration testing the bottom of mineralization. The Moss vein mineralization, although overall much lower grade than the Oatman ore shoots, fits the elevation range of the Oatman mineralization and boiling zone well - extending from about 2,300 feet down to at least 900 feet elevation.
The Silver Creek claims contain both a low-sulfidation epithermal precious metals vein system and a high-sulfidation mineralization system. The latter is characterized by widespread strong argillic to advanced argillic alteration and silica caps. High-sulfidation systems are developed in close proximity to magmatic centres, often porphyry copper-gold systems; and are characterized by magmatic hydrothermal waters. Ore morphology varies from veins to breccias and breccia pipes. Very high-grade bonanza gold deposits can form within the boiling zone. Important examples include Goldfield, NV; El Indio, Chile; and Yanacocha, Peru.
|
Mako Mining Corp. |
9.0 EXPLORATION
9.1 Introduction
The exploration program summary in this section has been extracted from the 2021 Technical Report, which updates the synopsis from the 2014 Technical Report. A map showing the key exploration target areas is shown in Figure 9.1.
9.2 Previous Owners and Operators (1982 to 2009)
Exploration by previous owners and operators on the Moss Mine property is summarized in Section 6.1.
9.3 NVMC/GVC (2011 through 2015)
9.3.1 2011 Exploration Program
The main focus of the NVMC's 2011 (Now EGMC) exploration program was an infill and confirmation drilling program described in Section 10.2. In addition, a surface rock-chip sampling program was carried out to test for extensions to the Moss Vein. The results are presented in the NVMC's news release dated May 10, 2011.
9.3.2 2012 Exploration Program
In 2012, NVMC's exploration effort on the Moss Mine Property was again focused on drilling the western Moss Vein extension, west of the Canyon fault, and on infill drilling in the main Moss vein area (described in Section 10.2). NVMC also carried out a channel sampling program at five-foot intervals across the backs/inverts/crowns of the accessible drifts and crosscuts of the historical underground workings in the vicinity of the Allen Shaft (see Section 6.1).
The channel sample data supplement those compiled by previous owners and operators of the Moss Mine Property. The reader is referred to the 2014 Technical Report for details and results of the sampling program.
9.3.3 2013/2014 Exploration Program
In addition to the 2013-2014 drilling program described in Section 10.2, NVMC contracted an airborne magnetic survey conducted by Precision GeoSurveys, Inc. of Vancouver, B.C. Figure 9.2 provides a summary of the results of the airborne magnetic survey and its interpretation.
The results show that magnetics surveys are an effective method of identifying potential mineralized structures on the Moss Mine Project area - both magnetic highs and lows correspond with known mineralized structures, including the Moss vein and at least nine sub- parallel structural zones.
To follow-up the magnetic survey results, NVMC initiated a geological mapping and sampling program on both the Moss claims and the Silver Creek claim block in September 2014 to 'identify and prioritize areas for future drilling where new resources may be discovered'.
|
Mako Mining Corp. |
Figure 9.1
Key Exploration Target Areas on the Moss Property
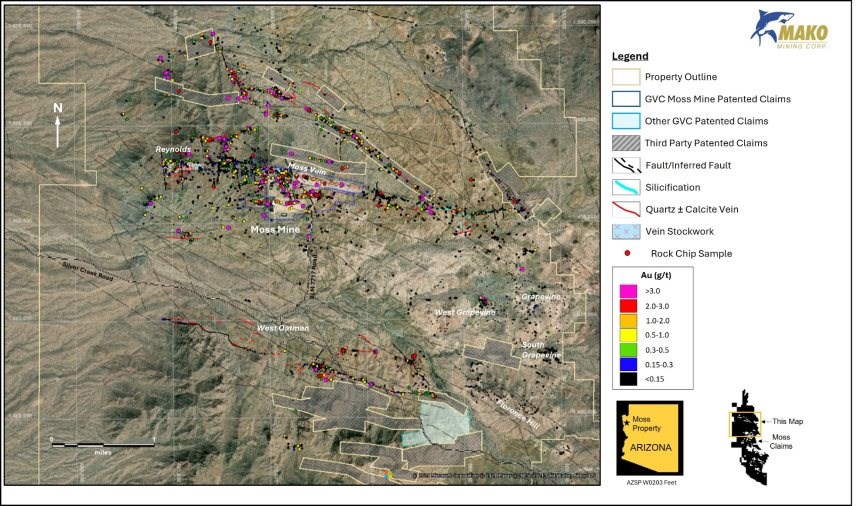 |
| Source: Mako, January, 2026. |
|
Mako Mining Corp. |
Figure 9.2
Total Magnetic Intensity and Structural Interpretation
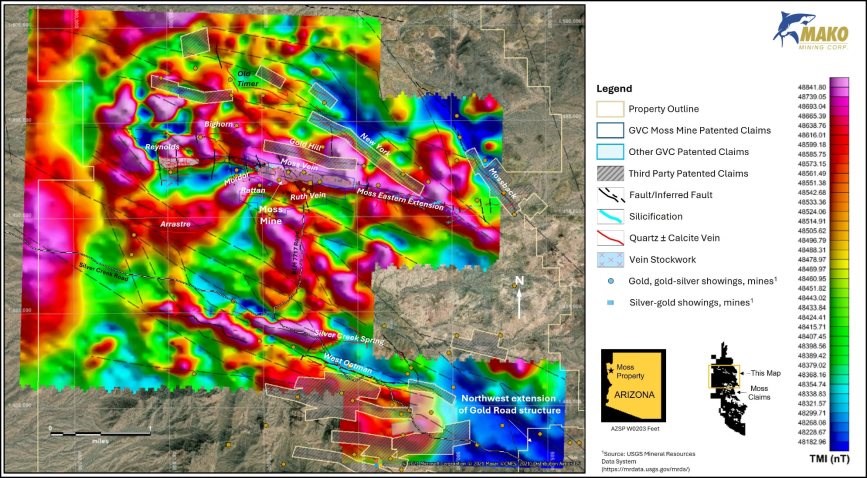 |
| Source: Mako, January, 2026. |
|
Mako Mining Corp. |
Mapping and rock-chip sampling focused on identification of epithermal veins and stockwork zones. Several vein exposures on the property are auriferous at surface with others showing alteration and trace elements that indicate their surface expression is above the boiling zone where gold might be found lower in the system. Samples were collected by professional prospectors under the direction of the Qualified Person. The key target areas defined by the 2015 exploration program consisted of:
The West Oatman Vein System - This vein system is defined by a fault striking N70W mapped for a distance of three miles. The system is similar to the Moss vein system with both well-developed veins and quartz-calcite breccias and stockwork zones. Rock-chip samples from a systematic program of 143 samples (both grab and 1-meter chips) averaged 0.018 oz/ton Au with several samples assaying between 0.115 and 0.239 oz/ton Au.
The Silver Creek Spring Vein System - This vein system trends N80W for 0.75 miles and contains several historic shafts and surface diggings exposing quartz-calcite- fluorite veining. Surface vein exposures are up to 16 ft wide.
The Old Timer Vein System - This historic vein system has a strike length of 3,300 ft, trending S80E. It is a series of en-echelon quartz-calcite +/- fluorite veins that appear to splay off the NNW-trending Canyon Fault similar to the setting of the Moss deposit. Forty-three of 95 rock-chip samples from the system were highly mineralized, containing 0.032 opt Au to 0.592 opt Au.
The Grapevine and Florence Hill System - A series of silica-capped hills underlain by strongly clay altered volcanic rocks were mapped on the Silver Creek claims. The silica caps are replacements of host volcanic rocks. Quartz veins are rare, but some narrow veins have highly anomalous gold values in the 0.015 to 0.030 oz/ton Au range with two very high samples (0.342 oz/ton and 0.531 oz/ton Au) collected at West Grapevine. Preliminary mapping shows that NNE to NNW-trending silicified ribs cut the strongly clay altered volcanic rocks. Anomalous gold, molybdenum and fluorine were detected in the silica ribs in previous work. Preliminary indications are that surface alteration and mineralization are at a high level in the epithermal depositional system. The boiling or gold zone could be at some depth below the surface rock exposures.
Results of the exploration program, including significant assays, can be found in the NVMC's press release of March 24, 2015.
9.3.4 2016 Mapping and Sampling
Follow-up geological mapping and rock-chip sampling was conducted at the Grapevine West, Florence Hill, and Old Timer prospects in June-July, 2016. The Arrastre and Far West areas were also evaluated. Further follow-up was conducted in October. The results from the 2015 and 2016 exploration program were used to develop drilling targets for the 2017 Exploration Program.
|
Mako Mining Corp. |
9.3.5 2017 Mapping and Sampling
Additional mapping and rock-chip sampling was conducted in 2017 in conjunction with the Phase IV drilling program. New high-grade zones were defined at Old Timer West, Rattan Extension, and the Mordor (West Extension) veins. All these areas are outside of the resource area.
9.3.6 2020 Mapping and Sampling
The area west of the leach pads and south of the western extension of the Moss vein - the 3A/3B leach pad area - was mapped and sampled by the author prior to condemnation for the leach pad expansion. Several small quartz-calcite veins, some with good boiling textures (bladed calcite) and fluorite filling vugs, were mapped and sampled. A condemnation drilling program was designed to test structural and geochemical targets generated from the fieldwork.
Scattered weak gold mineralization in surface outcrops and thin intercepts in the shallow drill holes confirmed vein-type mineralization in the area, but the potential to develop a resource was deemed insufficient to prevent use of the area for leach pads.
9.3.7 2021 Mapping and Sampling
Rock chip sampling targeted apparent structure-hosted veins (as seen from Google Earth Pro) to the north of the Moss vein system, along the northwestern extension of the Mossback area, as well as follow-up sampling on hyperspectral (see Section 9.2.8) buddingtonite and kaolinite anomalies in the West Grapevine and Florence Hill areas. A total of 86 samples were collected as part of this program. The sampling confirmed the presence of a mercury and arsenic anomaly over the West Grapevine and Florence Hill areas and indicated the presence of gold mineralization in previously untested veins along the Mossback and northern structures (up to 0.028 oz/ton gold). Additional exploration is being planned for these areas.
9.3.8 2021 Multi-Spectral Survey
Northern Vertex contracted PhotoSat Information Ltd of Vancouver, B.C., to conduct a hyperspectral satellite imaging survey of the Moss/Silver Creek claims using the WorldView-3 satellite (Figure 9.3). In mineral exploration, hyperspectral imaging is used to identify structure and areas of potential mineralization, based on alteration introducing clay, iron oxide, and silica minerals.
PhotoSat's technology uses Short Wave Infrared bands to identify silicification, both in narrow zones of silicification related to Moss-style vein/stockwork mineralization, and as broader zones of silica replacement associated with high-sulfidation precious-metals systems such as occur on the Silver Creek claims. The survey identifies clay minerals and differentiates between low-temperature clays and high-temperature clays (alunite, dickite, etc.) associated with high-sulfidation systems.
|
Mako Mining Corp. |
Figure 9.3
Map of Moss Project Area showing the Property Boundary, Gold/Silver Occurrences, Veins, Structures, and Alteration Mapping from the PhotoSat Hyperspectral Survey.
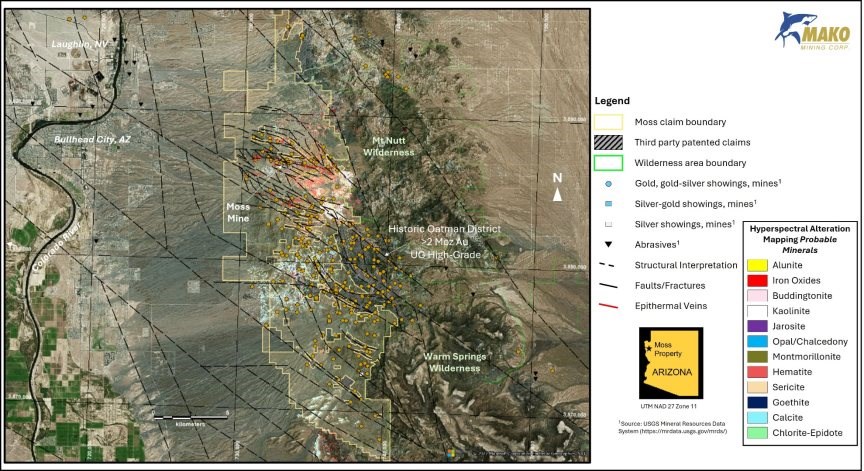 |
| Source: Mako, January, 2026. |
|
Mako Mining Corp. |
The hyperspectral survey at Moss identified numerous areas of alteration that are worthy of follow-up exploration. Of particular note is the Florence Hill area on the Silver Creek claims. At Florence Hill, the survey shows a large cap of silicification lying on high-temperature clay alteration, a scenario typical of intrusion-related high-sulfidation gold-silver systems such as Goldfield, NV and Yanacocha, Peru. High mercury assays argue for a high level of exposure above a potentially large, high-grade gold-silver deposit.
9.3.9 Land Expansion
During the first half of 2021, Northern Vertex Mining (now EGMC) expanded the land holdings at Moss Mine Project from 19 square miles to 68.4 square miles through claim staking and land acquisition (Figure 9.3 and Section 4). The expanded land position covers numerous old mine workings, prospects, veins, extensions of mineralized structures, and gold/silver occurrences within the Oatman District and its extensions.
Systematic exploration of the expanded land position is planned following data compilation and review of hyperspectral data.
|
Mako Mining Corp. |
10.0 DRILLING
Drilling at the Moss Mine Project has been conducted since 1982, as described in previous Technical Reports, issued from 2011 to 2015, 2017 and 2021. The following section is a summary of the information presented in these reports which also includes a summary of the 2022 to 2024 drilling results.
10.1 Legacy Drilling
A total of 69,648 ft in 261 drill holes has been carried out on the project by previous companies. Different drilling methods have been utilized, including Air Track (AT), Long-hole (LH), Reverse Circulation (RC) and Diamond Core (Core).
The collar coordinates for this drilling have been taken from old reports and plans. In 2011, Northern Vertex Mining, surveyed the collars that could be located in the field using a differential GPS. These drill holes do not have any down-the-hole directional surveys. This is not considered a significant issue as most of these holes are short and drill hole deviations would be minor for these holes.
In 1982, BF Minerals carried out the drilling of 54 Air Track holes and 4 RC holes totalling 6,190 ft of drilling in the Central Pit and West Pit areas targeting the Moss Vein. In 1989, Lac Minerals (USA) drilled 7 RC holes totalling 3,125 ft in the Far West area. In 1990, Billiton carried out the drilling of 21 RC holes totalling 6,925 ft in the Centre Pit, East Pit and West Pit areas, targeting the Moss Vein. In 1991, Reynolds Metals drilled 11 holes totalling 4,865 ft in the Reynolds Pit area. In 1991, Magna Copper carried out the drilling of 21 RC holes totalling 9,890 ft in the Centre Pit and East Pit areas, again targeting the Moss Vein. In 1992, Golconda Resources carried out the drilling of 17 RC holes totalling 2,698 ft of drilling in the Centre Pit and East Pit areas, again targeting the Moss Vein.
In 1996, Addwest Minerals International Ltd. (Addwest) carried out the drilling of 30 RC holes totalling 8,217 ft again targeting the Moss Vein in the Centre Pit area. This was followed up in 1998 by the drilling of 15 Long-holes totalling 434 ft in the Centre Pit area. The LH98-1 to LH98-15 holes completed by Addwest in 1998 were drilled as up-holes in the historical underground workings. In each case, the holes were drilled to explore the Moss Vein, based on knowledge of its attitude and extent from field mapping and related geological fieldwork.
Patriot Gold carried out drilling campaigns in 2004, 2005, 2007 and in 2009 on the Project. In 2004, they drilled 35 RC holes totalling 7,542 ft in the East Pit area. In 2005, they drilled 7 RC holes totalling 3,675 ft also in the East Pit area. In 2007, they drilled 6 Core holes totalling 3,916 ft in the Centre Pit area and in 2009 they drilled 6 Core holes totalling 2,929 ft in the East Pit area.
Table 10.1 presents a summary of the drilling conducted on the Project.
|
Mako Mining Corp. |
Table 10.1
Summary of Drilling Statistics for Moss Mine Project
| Company | Year | Air Track | Long Hole | Percussion | RC | Core | Total | ||||||
| No. of Holes |
Total Footage (ft) |
No. of Holes | Total Footage (ft) |
No. of Holes |
Total Footage (ft) |
No. of Holes |
Total Footage (ft) |
No. of Holes | Total Footage (ft) |
Total Holes |
Total Footage |
||
| BF Minerals | 1982 | 54 | 4,720 | 4 | 1,470 | 58 | 6,190 | ||||||
| Lac Minerals | 1989 | 7 | 3,125 | 7 | 3,125 | ||||||||
| Billiton Minerals | 1990 | 21 | 6,925 | 21 | 6,925 | ||||||||
| Magna Copper | 1991 | 21 | 9,890 | 21 | 9,890 | ||||||||
| Reynolds Metals | 1991 | 11 | 4865 | 11 | 4,865 | ||||||||
| Unknown | 1991 | 2 | 500 | 2 | 500 | ||||||||
| Unknown | 1992 | 19 | 7,075 | 19 | 7,075 | ||||||||
| Golconda Resources | 1993 | 17 | 2,698 | 17 | 2,698 | ||||||||
| Addwest Minerals | 1996 | 30 | 8,217 | 6 | 1,667 | 36 | 9,884 | ||||||
| Addwest Minerals | 1998 | 15 | 434 | 15 | 434 | ||||||||
| Patriot Gold | 2004 | 35 | 7,542 | 35 | 7,542 | ||||||||
| Patriot Gold | 2005 | 7 | 3,675 | 7 | 3,675 | ||||||||
| Patriot Gold | 2007 | 6 | 3,916 | 6 | 3,916 | ||||||||
| Patriot Gold | 2009 | 6 | 2,929 | 6 | 2,929 | ||||||||
| Sub-total: | 54 | 4,720 | 15 | 434 | 174 | 55,982 | 18 | 8,512 | 261 | 69,648 | |||
| Northern Vertex | 2011 | 74 | 28,517 | 10 | 2,601 | 84 | 31,118 | ||||||
| Northern Vertex | 2012 | 318 | 27,143 | 2 | 745 | 38 | 12,226 | 358 | 40,114 | ||||
| Northern Vertex | 2013 | 27 | 2,012 | 13 | 7,115 | 36 | 14,512 | 76 | 23,639 | ||||
| Northern Vertex | 2016 | 2 | 2,336 | 2 | 2,336 | ||||||||
| Northern Vertex | 2017 | 20 | 4,716 | 20 | 4,716 | ||||||||
| Northern Vertex | 2019 | 29 | 14,025 | 29 | 14,025 | ||||||||
| Northern Vertex | 2020 | 146 | 69,960 | 6 | 4,659 | 152 | 74,619 | ||||||
| Northern Vertex | 2021 | 149 | 116,645 | 30 | 22,756 | 179 | 139,401 | ||||||
| Northern Vertex | 2022 | 81 | 65,700 | 2 | 5,475 | 83 | 71,175 | ||||||
| Northern Vertex | 2023 | 25 | 13,235 | 3 | 4,829 | 28 | 18,064 | ||||||
| Northern Vertex | 2024 | 19 | 6,020 | 19 | 6,020 | ||||||||
| Sub-total: | 345 | 29,155 | 540 | 324,298 | 145 | 71,774 | 1,030 | 425,227 | |||||
| Total: | 54 | 4,720 | 15 | 434 | 345 | 29,155 | 714 | 380,280 | 163 | 80,285 | 1,291 | 494,874 | |
|
Mako Mining Corp. |
10.2 Northern Vertex Drilling 2019 to 2021
Northern Vertex has carried out a series of drilling Phases since February, 2011, across the Moss Mine Project. The Phase 1 2011 drilling program was supervised by MinQuest with Northern Vertex Corp. (Northern Vertex) personnel supervising all subsequent drilling phases.
In 2011, during Phase 1, Northern Vertex drilled 54 RC holes totalling 20,555 ft of drilling and 10 core holes totalling 2,601 ft targeting the Centre and East Pit areas.
Later in 2011 and to 2013, during Phase 2, Northern Vertex drilled 21 RC holes totalling 8,537ft of drilling and 74 core holes totalling 26,738 ft of drilling in the West, Centre and East Pit areas.
The collars of all the Phase One to Phase Three drillholes were surveyed by Northern Vertex personnel, using a differential GPS. The locations of individual collars are marked by a plastic pipe set in and concreted into the top of the drillhole, with an adjacent metal rod or wooden stake set in concrete and marked with flagging tape. Each collar monument is marked with the drillhole number, azimuth and inclination. The collar co-ordinates were verified as part of a larger due diligence program that included the holes drilled by previous owners and operators of the Moss Mine Project.
Downhole directional surveys were carried out by Northern Vertex personnel using a Reflex EZ-Trac tool. Downhole surveys were carried out for 21 RC and diamond Core holes during the Phase 1 program, 17 RC and Core holes in the Phase 2 program and 42 Core holes for the Phase 3 program.
Percussion drilling was carried out between October and December, 2012, using a tracked, Atlas Copco ECM 590 drill rig with a 3" hole diameter. All holes were vertical and were generally drilled to a maximum of 96 ft, as holes deeper than 100 ft are considered water wells in Arizona and require a well permit from the state. Holes were stopped short if they hit old workings, water or heavily fractured ground. A total of 187 holes were drilled for resource infill on the Moss Vein. A total of 28 holes were drilled to investigate mineralization on the west side of the Canyon Fault / Dike where the low-grade metallurgical sample was taken, and possible extensions of the Moss vein across the Canyon Fault. A total of 50 condemnation holes were drilled in the area proposed for waste rock storage in the Ruth and Ruth Dump areas. As well, 7 condemnation holes were drilled in the Rattan area. Five other percussion holes were drilled by a truck-mounted rig supplied by Drilltech, two for water monitoring (MW2012-1 to MW2012-3) and two water wells (WaterWell-1 and 2).
In 2016, two water wells totalling 2,336 ft were drilled and sampled, one in the Centre pit area and the other in East Pit area. The sampling of these holes is not considered reliable, and they have been excluded from the Mineral Resource Estimation.
In 2017, 20 Core holes were drilled totalling 4,716 ft in the West Extension, West Oatman, and Old Timer areas. The West Oatman and Old Timer drilling is not situated on the Moss Vein mineralized trend, and these holes are not considered for the Mineral Resource Estimate.
The 2018 program consisted of thirty-one 94-ft-deep percussion holes drilled into the hanging wall of the Mordor vein in the West Extension area. Twenty-four of the holes encountered strong vein and stockwork gold-silver mineralization. The drilling results were used to guide deeper reverse-circulation drilling in 2020. The percussion drilling and sampling from this program is not considered to meet CIM best practice guidelines and none of this exploration drilling was used for Mineral Resource Estimation.
|
Mako Mining Corp. |
The 2019 drilling program, an infill drilling program in the West Pit area, commenced on September 3, 2019, and concluded on November 13, 2019. Longyear Drilling Company completed 29 reverse-circulation drill holes totalling 14,025 feet using a track-mounted MPD-1500 drill rig. The objectives of the program were to confirm continuity of mineralization, to upgrade Inferred resources to Indicated or Measured resources, and to potentially extend the open pit design at depth and to the south.
Twenty-five of the 29 drill holes encountered significant stockwork gold-silver mineralization, with most holes having multiple intercepts. In addition to confirming continuity of mineralization and upgrading resource categories, the program was successful in proving mineralization beneath the planned pit bottom. For example, hole AR-226R intersected 140 ft grading 0.024 oz/ton Au, 0.41 oz/ton Ag, starting 120 ft below the planned pit bottom, indicating potential to expand the resource at depth.
The 2020-2021 drilling program was designed to accomplish several goals:
1) To add resource ounces in the current pit area and expand the mineral resource to the west (Gold Bridge, Gold Tower, West Pit targets).
2) To discover higher-grade gold mineralization within and adjacent to the current open pit in order to increase average mining grade (Ruth Vein, Moss-Ruth intersection).
3) To extend mineralization below the current pit bottom and expand the mineral resources at depth.
4) To make new discoveries along strike of the Moss Vein and at new targets separate from the Moss Vein (West Extension, Mid-West Extension, East Extension and West Oatman).
In 2020, a total of 146 RC holes totalling 69,960 ft and 6 Core holes totalling 4,659 ft were drilled to test the goals listed above. Then in 2021, a total of 149 RC holes totalling 116,645 ft and 30 Core holes totalling 22,756 ft were completed to test the goals listed above. The results of this drilling were encouraging.
The West Pit, Gold Bridge and Gold Tower drill holes intersected multiple zones of stockwork mineralization throughout the length of the holes.
Drilling along the projection of the Ruth Vein discovered a second high-grade zone about 500 ft to the east of the shafts, where hole AR20-313R intersected 20 ft grading 0.285 oz/ton Au, 1.06 oz/ton Ag, including five feet grading 0.735 oz/ton Au and 2.49 oz/ton Ag.
The encouraging results of the early drilling at Ruth spurred a program of systematic drilling of the vein. However, drilling was hampered by the logistical challenges of establishing drilling platforms in a narrow open pit mine with active mining and blasting. It was necessary to drill multiple holes at varying angles from a limited number of pads. Several holes were drilled through waste dumps. Many holes were drilled at oblique angles to both the dip and strike of the vein, creating exaggerated apparent mineralized intercepts.
|
Mako Mining Corp. |
In drill holes, the Ruth Vein ranges from a narrow (five feet) vein with no adjacent mineralization to a vein with thick zones of adjacent stockwork mineralization. Stockwork vein zones also occur both above and below the Ruth Vein. Most holes intersected multiple mineralized zones.
Higher grades occur both within the core of the Ruth Vein and locally as thin intervals within stockwork zones in both the footwall and hanging wall. Rare pockets of high- grade gold have been drilled, but drilling density is insufficient to define coherent "mineralized shoots".
Defining mineralization beneath the limit of previous drilling and expanding the resource to depth below the planned open pit bottom were goals of the 2020-2021 drilling programs. Twenty-one angled drill holes: 11 reverse-circulation, and 10 core, were drilled from south to north to test the deep Moss vein and the intersection of the Ruth and Moss veins. One deep reverse-circulation hole (AR20-315R) was drilled at -85° to the south to test the Moss-Ruth intersection. Drill lengths ranged from 660 ft to 1,355 ft, reaching vertical depths of up to 1,170 ft below the surface. Significant precious-metals mineralization was encountered to depths of up to 950 ft beneath the surface (AR20-315R).
Due to the oblique orientation of drill holes to the Moss vein, several drill holes have exaggerated mineralized intervals, for example AR20-315R intersected 360 ft grading 0.023 opt Au from 605 ft to 965 ft, but corrected for obliquity to the vein, the true thickness of the mineralized zone is about 165 ft. That is thicker than normal for the Moss vein and hanging wall stockwork, suggesting thickening with depth as the intersection with the Ruth vein is approached.
Drilling to date shows no indication of bonanza grades at the vein intersection, but sections of moderate grade mineralization in the Moss vein have been drilled to depths in excess of 900 ft. For example, hole AR21-441R drilled a true thickness of 17 ft grading 0.058 oz/ton Au at a vertical depth of 738 ft to 810 ft, and hole AR20-315R drilled 13 feet grading 0.054 oz/ton Au at a vertical depth of 897 ft to 946 ft.
Drilling in the East Extension area focused on following the Moss vein and its hanging wall stockworks eastward from the open pit/patented claim boundary. Twenty-one reverse- circulation holes were drilled over a strike length of 700 ft. Five shallow (150 ft to 350 ft long) drill holes angled into the projection of the Moss vein immediately east of the open pit did not encounter significant mineralization. However, two holes just east of the shallow drilling intersected thick moderate-grade gold-silver. AR21-425R intersected 75 ft grading 0.0309 oz/ton Au, 0.58 oz/ton Ag and AR21- 425R intersected 75 ft grading 0.058 oz/ton Au, 0.069 oz/ton Ag. The apparent gap in mineralization may be due to insufficient drilling or the shallow depth of drill holes, or it could be due to a fault offset of the vein to the north, steepening or overturning of the vein, or a barren compressional zone between mineralized extensional zones along the vein. Infill drilling is needed to evaluate this area.
The West Extension follows the Moss vein structure west of the West Pit to the eastern limit of the Moss claim block. Mineralized areas include the Mordor cliffs, the Mordor vein, Mid-West Extension, and Far West Extension. Two RC holes, AR20-251R and AR 20-252R were drilled along the base of the Mordor cliffs. AR20-252R, about 1,500 ft west of the West Pit, was located too far to the south and did not reach the Moss stockwork zone. AR20-251R, about 1,300 ft west of the West Pit, intersected two mineralized zones; 20 ft grading.0.027 oz/ton Au, 0.011 oz/ton Ag between 40 ft to 60 ft downhole and 80 ft grading 0.010 oz/ton Au, 0.04 oz/ton Ag between 175 to 255 ft downhole.
|
Mako Mining Corp. |
At the Midwest Extension, centred about 2,300 ft west of the west end of the West Pit, one reverse circulation hole was drilled to test for bulk tonnage gold mineralization and to verify results from Reynolds Metals' drilling in 1991. Drill Hole AR21-253R, a 400-ft vertical reverse circulation hole, drilled in the northwest part of the target area, intersected four zones of mineralization between the surface and a depth of 390 ft:
• 150 ft grading 0.009 oz/ton Au, 0.04 oz/ton Ag from 50 ft to 200 ft downhole.
• 15 ft grading 0.013 oz/ton Au, 0.04 oz/ton Ag from 225 ft to 240 ft downhole.
• 10 ft grading 0.034 oz/ton Au, 0.02 oz/ton Ag from 310 to 320 ft downhole.
• 15 ft grading 0.016 oz/ton Au, 0.02 oz/ton Ag from 375 ft to 390 ft downhole.
Results of AR21-253R confirm the existence of thick sections of low-grade gold at Midwest Extension, verify results from Reynold's Metals' 1991 drilling, and suggest good potential for a bulk-tonnage gold deposit at shallow depth.
One reverse-circulation hole was drilled at the West Oatman target, a vein/breccia system lying about one mile south of the Moss mine on the south side of Silver Creek Wash. Drill hole AR21-259R was a vertical hole drilled as an offset to Reynolds Metals' hole BW 92-10, which encountered 145 feet grading 0.016 oz/ton gold. AR20-259R intersected 175 feet grading 0.024 oz/ton gold and 0.431 oz/ton silver including 60 feet grading 0.0452 oz/ton gold and 1.03 oz/ton silver, about 50 feet downdip of BW 92-10. The drill results suggest significant thickening and increase in grade with depth in the West Oatman system.
A drilling program to follow up the results of hole AR20-259R is planned. The drilling will expand upon previous drilling by Reynolds Metals and 13 core holes drilled by Northern Vertex in 2017.
10.3 Elevation Gold Mining Corp. Drilling from 2022 to 2024
The 2022 to 2024 drilling was carried out over various targets on the Moss Mine Project. A total of 125 RC holes totalling 84,955ft of drilling targeted the Centre Pit, East Extension, Rattan, Reynolds Pit, West Extension and West Pit areas. Four Core holes totalling 8,777.5ft were drilled at Florence Hill, with one Core hole totalling 1,526ft drilled at Grapevine.
There were 50 drill holes totalling 23,990 ft drilled at the Reynolds Pit, with 26 totalling 22,880 ft at the West Extension and 20 holes totalling 15,520 ft at the West Pit area. Additional drilling was carried out at Centre Pit, with 13 holes totalling 11,515 ft. There were 9 RC holes totalling 5,900 ft drilled at the East Extension and 7 drill holes totalling 5,150 ft drilled at Rattan.
Figure 10.1 displays the locations of the 2022 to 2024 drill holes as red drill hole traces and the older drilling as black drill hole traces. Table 10.2 lists the drill hole collar locations for the 2022 to 2024 drilling at the Moss Mine Project.
|
Mako Mining Corp. |
Figure 10.1
Plan Map of Drilling at the Moss Mine Project
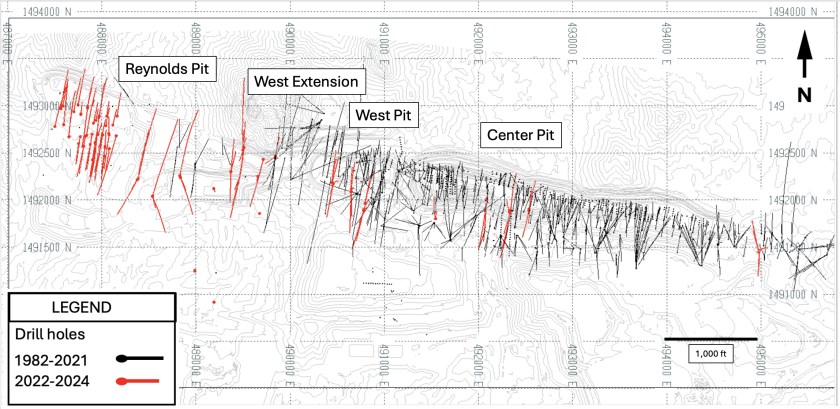 |
| C.Keech, CGK Consulting Services Inc, 2025. |
|
Mako Mining Corp. |
Table 10.2
Drill Hole Collars for 2022 to 2024 Drilling at Moss Mine Project
| Hole ID | Easting ft |
Northing ft |
RL ft |
Max Depth ft |
Azimuth (°) |
Dip (°) | Year Drilled |
Drill Hole Type |
Target Area |
Company | Assay Laboratory |
| AR22-567R | 488,987.6 | 1,491,245.0 | 1,961.5 | 600 | 178.6 | -45.2 | 2022 | RC | Rattan | Northern Vertex | Skyline |
| AR22-568R | 488,987.6 | 1,491,249.4 | 1,961.5 | 800 | 177.7 | -70.3 | 2022 | RC | Rattan | Northern Vertex | Skyline |
| AR22-569R | 488,987.6 | 1,491,251.0 | 1,961.3 | 1,000 | 171.4 | -85.4 | 2022 | RC | Rattan | Northern Vertex | Skyline |
| AR22-576R | 490,647.0 | 1,492,084.0 | 2,241.1 | 800 | 180.9 | -60.4 | 2022 | RC | West Pit | Northern Vertex | Skyline |
| AR22-577R | 490,646.7 | 1,492,086.0 | 2,241.4 | 1,000 | 178.1 | -80.1 | 2022 | RC | West Pit | Northern Vertex | Skyline |
| AR22-578R | 490,648.6 | 1,492,088.3 | 2,241.4 | 745 | 359.3 | -70.8 | 2022 | RC | West Pit | Northern Vertex | Skyline |
| AR22-579R | 494,977.3 | 1,491,444.8 | 2,138.0 | 1,000 | 352.0 | -85.4 | 2022 | RC | East Extension | Northern Vertex | Skyline |
| AR22-580R | 494,977.1 | 1,491,445.0 | 2,138.0 | 800 | 345.6 | -78.6 | 2022 | RC | East Extension | Northern Vertex | Skyline |
| AR22-581R | 494,977.2 | 1,491,444.8 | 2,137.7 | 700 | 344.5 | -71.6 | 2022 | RC | East Extension | Northern Vertex | Skyline |
| AR22-582R | 494,976.8 | 1,491,447.0 | 2,137.8 | 600 | 345.7 | -61.3 | 2022 | RC | East Extension | Northern Vertex | Skyline |
| AR22-583R | 494,976.8 | 1,491,446.0 | 2,137.8 | 500 | 347.4 | -46.7 | 2022 | RC | East Extension | Northern Vertex | Skyline |
| AR22-584R | 490,778.2 | 1,491,885.0 | 2,238.6 | 600 | 194.5 | -45.6 | 2022 | RC | West Pit | Northern Vertex | Skyline |
| AR22-585R | 490,779.5 | 1,491,888.9 | 2,239.3 | 700 | 193.4 | -64.1 | 2022 | RC | West Pit | Northern Vertex | Skyline |
| AR22-586R | 490,779.9 | 1,491,890.0 | 2,238.9 | 800 | 197.6 | -81.3 | 2022 | RC | West Pit | Northern Vertex | Skyline |
| AR22-587R | 490,780.1 | 1,491,893.0 | 2,239.1 | 900 | 17.7 | -88.5 | 2022 | RC | West Pit | Northern Vertex | Skyline |
| AR22-588R | 490,780.6 | 1,491,894.0 | 2,238.4 | 730 | 18.2 | -81.5 | 2022 | RC | West Pit | Northern Vertex | Skyline |
| AR22-592R | 494,978.9 | 1,491,463.0 | 2,138.7 | 800 | 48.2 | -84.7 | 2022 | RC | East Extension | Northern Vertex | Skyline |
| AR22-593R | 494,978.9 | 1,491,461.0 | 2,138.6 | 600 | 177.8 | -76.4 | 2022 | RC | East Extension | Northern Vertex | Skyline |
| AR22-594R | 494,978.9 | 1,491,459.0 | 2,138.6 | 500 | 180.2 | -61.1 | 2022 | RC | East Extension | Northern Vertex | Skyline |
| AR22-595R | 494,978.9 | 1,491,458.0 | 2,138.6 | 400 | 180.2 | -45.9 | 2022 | RC | East Extension | Northern Vertex | Skyline |
| AR22-596R | 489,509.1 | 1,492,560.0 | 2,249.4 | 1,200 | 191.3 | -86.0 | 2022 | RC | West Extension | Northern Vertex | Skyline |
| AR22-597R | 489,509.2 | 1,492,559.0 | 2,249.3 | 1,200 | 184.9 | -65.8 | 2022 | RC | West Extension | Northern Vertex | Skyline |
| AR22-598R | 489,508.3 | 1,492,557.2 | 2,249.1 | 1,200 | 187.0 | -56.7 | 2022 | RC | West Extension | Northern Vertex | Skyline |
| AR22-599R | 489,508.0 | 1,492,554.9 | 2,249.0 | 1,200 | 186.4 | -47.5 | 2022 | RC | West Extension | Northern Vertex | Skyline |
| AR22-600R | 488,376.4 | 1,492,213.1 | 1,987.0 | 600 | 208.2 | -45.9 | 2022 | RC | West Extension | Northern Vertex | Skyline |
| AR22-601R | 488,383.0 | 1,492,224.8 | 1,987.6 | 600 | 208.3 | -80.9 | 2022 | RC | West Extension | Northern Vertex | Skyline |
| AR22-602R | 488,385.9 | 1,492,230.2 | 1,987.5 | 1,200 | 12.9 | -46.6 | 2022 | RC | West Extension | Northern Vertex | Skyline |
| AR22-603R | 488,384.8 | 1,492,226.5 | 1,987.6 | 1,200 | 11.9 | -61.4 | 2022 | RC | West Extension | Northern Vertex | Skyline |
| AR22-604R | 488,384.8 | 1,492,225.5 | 1,987.8 | 800 | 12.0 | -75.4 | 2022 | RC | West Extension | Northern Vertex | Skyline |
| AR22-605R | 489,508.5 | 1,492,554.0 | 2,256.2 | 1,110 | 357.3 | -85.0 | 2022 | RC | West Extension | Northern Vertex | Skyline |
| AR22-606R | 489,508.9 | 1,492,554.0 | 2,248.5 | 765 | 358.2 | -76.3 | 2022 | RC | West Extension | Northern Vertex | Skyline |
| AR22-607R | 489,508.2 | 1,492,555.6 | 2,249.5 | 600 | 1.4 | -60.5 | 2022 | RC | West Extension | Northern Vertex | Skyline |
| AR22-608R | 489,498.9 | 1,492,528.0 | 2,220.1 | 1,145 | 358.3 | -45.7 | 2022 | RC | West Extension | Northern Vertex | Skyline |
| AR22-609R | 488,539.3 | 1,492,035.1 | 1,972.6 | 600 | 157.7 | -45.4 | 2022 | RC | West Extension | Northern Vertex | Skyline |
| AR22-610R | 488,537.1 | 1,492,039.8 | 1,972.6 | 600 | 163.6 | -81.1 | 2022 | RC | West Extension | Northern Vertex | Skyline |
| AR22-611R | 488,541.4 | 1,492,044.0 | 1,972.7 | 1,200 | 15.0 | -46.5 | 2022 | RC | West Extension | Northern Vertex | Skyline |
| AR22-612R | 490,456.6 | 1,492,174.9 | 2,220.5 | 1,200 | 49.0 | -83.8 | 2022 | RC | West Pit | Northern Vertex | Skyline |
| AR22-613R | 490,456.2 | 1,492,175.7 | 2,219.2 | 650 | 192.2 | -81.6 | 2022 | RC | West Pit | Northern Vertex | Skyline |
| AR22-614R | 490,455.8 | 1,492,174.0 | 2,219.3 | 550 | 189.7 | -65.9 | 2022 | RC | West Pit | Northern Vertex | Skyline |
| AR22-615R | 490,455.3 | 1,492,170.0 | 2,219.3 | 500 | 189.3 | -45.8 | 2022 | RC | West Pit | Northern Vertex | Skyline |
| AR22-616R | 488,835.5 | 1,492,237.0 | 2,011.8 | 600 | 158.8 | -45.6 | 2022 | RC | West Extension | Northern Vertex | Skyline |
| AR22-617R | 488,832.3 | 1,492,245.0 | 2,012.8 | 800 | 153.3 | -80.5 | 2022 | RC | West Extension | Northern Vertex | Skyline |
|
Mako Mining Corp. |
| Hole ID | Easting ft |
Northing ft |
RL ft |
Max Depth ft |
Azimuth (°) |
Dip (°) | Year Drilled |
Drill Hole Type |
Target Area |
Company | Assay Laboratory |
| AR22-618R | 488,828.4 | 1,492,257.0 | 2,012.2 | 1,200 | 11.6 | -46.5 | 2022 | RC | West Extension | Northern Vertex | Skyline |
| AR22-619R | 489,674.6 | 1,491,857.0 | 2,064.0 | 600 | 191.5 | -49.9 | 2022 | RC | Rattan | Northern Vertex | Skyline |
| AR22-620R | 489,841.8 | 1,492,442.0 | 2,219.5 | 1,000 | 7.3 | -80.3 | 2022 | RC | West Extension | Northern Vertex | Skyline |
| AR22-621R | 489,500.6 | 1,492,529.0 | 2,219.9 | 1,200 | 181.4 | -74.1 | 2022 | RC | West Extension | Northern Vertex | Skyline |
| AR22-622R | 489,841.9 | 1,492,463.0 | 2,195.3 | 1,200 | 162.5 | -89.0 | 2022 | RC | West Pit | Northern Vertex | Skyline |
| AR22-623R | 489,191.2 | 1,490,915.0 | 1,960.6 | 1,050 | 340.4 | -80.1 | 2022 | RC | Rattan | Northern Vertex | Skyline |
| AR22-624R | 489,192.2 | 1,490,915.0 | 1,960.6 | 650 | 338.7 | -66.0 | 2022 | RC | Rattan | Northern Vertex | Skyline |
| AR22-625R | 489,193.2 | 1,490,915.0 | 1,960.6 | 450 | 336.8 | -45.0 | 2022 | RC | Rattan | Northern Vertex | Skyline |
| AR22-626R | 492,535.9 | 1,491,887.8 | 1,961.8 | 800 | 10.3 | -71.5 | 2022 | RC | Centre Pit | Northern Vertex | Skyline |
| AR22-627R | 492,535.8 | 1,491,889.1 | 1,962.0 | 1,000 | 11.4 | -80.1 | 2022 | RC | Centre Pit | Northern Vertex | Skyline |
| AR22-628R | 492,536.2 | 1,491,907.0 | 1,961.5 | 900 | 184.5 | -80.3 | 2022 | RC | Centre Pit | Northern Vertex | Skyline |
| AR22-629R | 492,535.6 | 1,491,907.3 | 1,961.7 | 800 | 188.9 | -65.5 | 2022 | RC | Centre Pit | Northern Vertex | Skyline |
| AR22-630R | 489,714.0 | 1,492,430.0 | 2,219.6 | 745 | 193.0 | -44.2 | 2022 | RC | West Pit | Northern Vertex | Skyline |
| AR22-631R | 492,340.3 | 1,491,881.0 | 1,962.5 | 800 | 5.6 | -59.9 | 2022 | RC | Centre Pit | Northern Vertex | Skyline |
| AR22-632R | 492,327.4 | 1,491,886.0 | 1,962.8 | 1,200 | 348.7 | -87.2 | 2022 | RC | Centre Pit | Northern Vertex | Skyline |
| AR22-633R | 492,331.0 | 1,491,871.0 | 1,962.5 | 1,115 | 183.8 | -80.6 | 2022 | RC | Centre Pit | Northern Vertex | Skyline |
| AR22-634R | 492,331.1 | 1,491,865.0 | 1,962.6 | 800 | 186.1 | -44.8 | 2022 | RC | Centre Pit | Northern Vertex | Skyline |
| AR22-635R | 492,331.2 | 1,491,869.5 | 1,962.5 | 800 | 185.4 | -61.6 | 2022 | RC | Centre Pit | Northern Vertex | Skyline |
| AR22-636R | 490,649.3 | 1,492,114.0 | 2,199.5 | 800 | 5.6 | -70.3 | 2022 | RC | West Pit | Northern Vertex | Skyline |
| AR22-637R | 490,445.2 | 1,492,183.0 | 2,199.7 | 800 | 12.8 | -74.9 | 2022 | RC | West Pit | Northern Vertex | Skyline |
| AR22-638R | 490,445.1 | 1,492,184.0 | 2,199.9 | 600 | 6.9 | -66.1 | 2022 | RC | West Pit | Northern Vertex | Skyline |
| AR22-639R | 490,445.0 | 1,492,187.2 | 2,199.7 | 500 | 4.4 | -44.1 | 2022 | RC | West Pit | Northern Vertex | Skyline |
| AR22-640R | 492,087.6 | 1,492,012.0 | 1,935.0 | 800 | 187.1 | -45.2 | 2022 | RC | Centre Pit | Northern Vertex | Skyline |
| AR22-641R | 492,088.4 | 1,492,014.0 | 1,934.7 | 800 | 183.7 | -57.4 | 2022 | RC | Centre Pit | Northern Vertex | Skyline |
| AR22-642R | 489,370.8 | 1,492,302.1 | 2,143.9 | 800 | 6.1 | -65.2 | 2022 | RC | West Extension | Northern Vertex | Skyline |
| AR22-643R | 489,370.8 | 1,492,301.1 | 2,143.9 | 1,000 | 12.9 | -80.5 | 2022 | RC | West Extension | Northern Vertex | Skyline |
| AR22-644R | 490,798.3 | 1,491,968.2 | 2,178.7 | 900 | 8.9 | -70.8 | 2022 | RC | West Pit | Northern Vertex | Skyline |
| AR22-645R | 490,797.3 | 1,491,964.2 | 2,179.2 | 800 | 10.4 | -64.2 | 2022 | RC | West Pit | Northern Vertex | Skyline |
| AR22-646R | 489,369.3 | 1,492,299.3 | 2,143.6 | 500 | 180.5 | -47.8 | 2022 | RC | West Extension | Northern Vertex | Skyline |
| AR22-647R | 487,748.7 | 1,493,008.5 | 2,050.9 | 600 | 10.1 | -44.7 | 2022 | RC | Reynolds Pit | Northern Vertex | Skyline |
| AR22-648R | 487,703.2 | 1,492,937.5 | 2,039.0 | 700 | 9.7 | -56.3 | 2022 | RC | Reynolds Pit | Northern Vertex | Skyline |
| AR22-649R | 487,650.2 | 1,492,671.9 | 1,993.8 | 750 | 4.1 | -45.2 | 2022 | RC | Reynolds Pit | Northern Vertex | Skyline |
| AR22-650R | 487,650.3 | 1,492,669.5 | 1,993.6 | 745 | 4.3 | -57.7 | 2022 | RC | Reynolds Pit | Northern Vertex | Skyline |
| AR22-651R | 487,849.0 | 1,492,989.7 | 2,032.4 | 500 | 9.4 | -45.5 | 2022 | RC | Reynolds Pit | Northern Vertex | Skyline |
| AR22-652R | 487,847.9 | 1,492,985.7 | 2,032.1 | 600 | 10.3 | -66.3 | 2022 | RC | Reynolds Pit | Northern Vertex | Skyline |
| AR22-653R | 487,839.2 | 1,492,688.3 | 2,003.5 | 800 | 8.1 | -45.7 | 2022 | RC | Reynolds Pit | Northern Vertex | Skyline |
| AR22-654R | 487,838.6 | 1,492,684.6 | 2,003.4 | 900 | 7.7 | -61.7 | 2022 | RC | Reynolds Pit | Northern Vertex | Skyline |
| AR22-655R | 487,848.5 | 1,492,974.9 | 2,031.2 | 700 | 186.6 | -46.0 | 2022 | RC | Reynolds Pit | Northern Vertex | Skyline |
| AR22-656R | 487,824.7 | 1,492,676.3 | 2,002.5 | 700 | 188.7 | -45.5 | 2022 | RC | Reynolds Pit | Northern Vertex | Skyline |
| FH22-001C | 502,618.0 | 1,479,179.0 | 2,387.0 | 3,615 | 34.8 | -44.4 | 2022 | DDH | Florence Hill | Northern Vertex | Skyline |
| FH22-002C | 501,980.5 | 1,478,643.8 | 1,869.5 | 1,860 | 42.8 | -43.2 | 2022 | DDH | Florence Hill | Northern Vertex | Skyline |
| AR23-657R | 487,565.0 | 1,492,970.9 | 2,026.0 | 600 | 9.0 | -45.1 | 2023 | RC | Reynolds Pit | Northern Vertex | Skyline |
| AR23-658R | 487,565.4 | 1,492,966.8 | 2,025.5 | 600 | 7.9 | -65.8 | 2023 | RC | Reynolds Pit | Northern Vertex | Skyline |
| AR23-659R | 487,501.4 | 1,492,780.4 | 1,997.8 | 800 | 14.3 | -63.5 | 2023 | RC | Reynolds Pit | Northern Vertex | Skyline |
| AR23-660R | 487,973.0 | 1,492,891.4 | 2,014.6 | 600 | 9.6 | -45.8 | 2023 | RC | Reynolds Pit | Northern Vertex | Skyline |
| AR23-661R | 487,971.2 | 1,492,885.3 | 2,014.0 | 700 | 9.5 | -60.4 | 2023 | RC | Reynolds Pit | Northern Vertex | Skyline |
|
Mako Mining Corp. |
| Hole ID | Easting ft |
Northing ft |
RL ft |
Max Depth ft |
Azimuth (°) |
Dip (°) | Year Drilled |
Drill Hole Type |
Target Area |
Company | Assay Laboratory |
|
AR23-662R |
487,967.0 |
1,492,874.4 |
2,013.7 |
900 |
186.9 |
-45.7 |
2023 |
RC |
Reynolds Pit |
Northern Vertex |
Skyline |
|
AR23-663R |
488,153.4 |
1,492,681.3 |
2,012.2 |
900 |
195.7 |
-45.0 |
2023 |
RC |
Reynolds Pit |
Northern Vertex |
Skyline |
|
AR23-664R |
491,546.1 |
1,491,800.9 |
2,149.1 |
900 |
0.2 |
-87.0 |
2023 |
RC |
Centre Pit |
Northern Vertex |
Skyline |
|
AR23-665R |
491,543.2 |
1,491,800.8 |
2,149.3 |
800 |
346.6 |
-69.3 |
2023 |
RC |
Centre Pit |
Northern Vertex |
Skyline |
|
AR23-666R |
488,080.1 |
1,492,545.2 |
2,004.5 |
360 |
189.6 |
-44.6 |
2023 |
RC |
Reynolds Pit |
Northern Vertex |
Skyline |
|
AR23-667R |
488,032.8 |
1,492,557.0 |
1,991.3 |
400 |
187.5 |
-43.8 |
2023 |
RC |
Reynolds Pit |
Northern Vertex |
Skyline |
|
AR23-668R |
487,975.4 |
1,492,563.0 |
1,976.4 |
400 |
188.1 |
-45.7 |
2023 |
RC |
Reynolds Pit |
Northern Vertex |
Skyline |
|
AR23-669R |
487,932.0 |
1,492,597.5 |
1,972.9 |
505 |
188.5 |
-43.7 |
2023 |
RC |
Reynolds Pit |
Northern Vertex |
Skyline |
|
AR23-670R |
487,877.3 |
1,492,589.6 |
1,984.9 |
400 |
189.6 |
-45.5 |
2023 |
RC |
Reynolds Pit |
Northern Vertex |
Skyline |
|
AR23-671R |
487,807.1 |
1,492,569.0 |
1,983.9 |
400 |
188.0 |
-43.1 |
2023 |
RC |
Reynolds Pit |
Northern Vertex |
Skyline |
|
AR23-672R |
487,753.5 |
1,492,598.2 |
1,986.2 |
300 |
188.4 |
-43.9 |
2023 |
RC |
Reynolds Pit |
Northern Vertex |
Skyline |
|
AR23-673R |
488,077.8 |
1,492,692.2 |
1,997.0 |
500 |
190.7 |
-45.6 |
2023 |
RC |
Reynolds Pit |
Northern Vertex |
Skyline |
|
AR23-674R |
488,009.5 |
1,492,692.1 |
1,981.4 |
500 |
190.4 |
-46.4 |
2023 |
RC |
Reynolds Pit |
Northern Vertex |
Skyline |
|
AR23-675R |
487,896.5 |
1,492,698.5 |
2,000.2 |
500 |
188.8 |
-43.5 |
2023 |
RC |
Reynolds Pit |
Northern Vertex |
Skyline |
|
AR23-676R |
487,769.2 |
1,492,673.0 |
1,999.6 |
400 |
187.8 |
-44.4 |
2023 |
RC |
Reynolds Pit |
Northern Vertex |
Skyline |
|
AR23-677R |
487,911.2 |
1,492,433.7 |
1,958.2 |
300 |
188.9 |
-45.3 |
2023 |
RC |
Reynolds Pit |
Northern Vertex |
Skyline |
|
AR23-678R |
487,901.2 |
1,492,427.3 |
1,956.2 |
400 |
7.3 |
-64.8 |
2023 |
RC |
Reynolds Pit |
Northern Vertex |
Skyline |
|
AR23-679R |
487,921.4 |
1,492,517.2 |
1,964.0 |
350 |
190.3 |
-43.6 |
2023 |
RC |
Reynolds Pit |
Northern Vertex |
Skyline |
|
AR23-680R |
487,967.8 |
1,492,479.0 |
1,979.0 |
370 |
187.7 |
-42.5 |
2023 |
RC |
Reynolds Pit |
Northern Vertex |
Skyline |
|
AR23-681R |
488,025.7 |
1,492,465.6 |
1,992.7 |
350 |
187.4 |
-44.7 |
2023 |
RC |
Reynolds Pit |
Northern Vertex |
Skyline |
|
FH23-003C |
503,406.3 |
1,483,076.4 |
2,005.0 |
2,005 |
162.3 |
-45.0 |
2023 |
DDH |
Florence Hill |
Northern Vertex |
Skyline |
|
GV22-001C |
504,089.5 |
1,486,921.3 |
2,365.9 |
1,526 |
135.0 |
-45.0 |
2023 |
DDH |
Grapevine |
Northern Vertex |
Skyline |
|
HV22-001C |
498,235.2 |
1,479,927.5 |
2,493.9 |
1,298 |
162.5 |
-46.0 |
2023 |
DDH |
Florence Hill |
Northern Vertex |
Skyline |
|
AR23-682R |
487,927.2 |
1,492,516.0 |
1,968.4 |
340 |
7.0 |
-66.7 |
2024 |
RC |
Reynolds Pit |
Northern Vertex |
Skyline |
|
AR23-683R |
487,978.7 |
1,492,568.4 |
1,976.7 |
330 |
8.1 |
-65.2 |
2024 |
RC |
Reynolds Pit |
Northern Vertex |
Skyline |
|
AR23-684R |
487,928.3 |
1,492,606.8 |
1,975.9 |
400 |
10.0 |
-60.0 |
2024 |
RC |
Reynolds Pit |
Northern Vertex |
Skyline |
|
AR23-685R |
488,004.4 |
1,492,696.2 |
1,982.1 |
350 |
11.8 |
-62.0 |
2024 |
RC |
Reynolds Pit |
Northern Vertex |
Skyline |
|
AR23-686R |
488,073.2 |
1,492,705.9 |
1,996.4 |
250 |
1.7 |
-43.9 |
2024 |
RC |
Reynolds Pit |
Northern Vertex |
Skyline |
|
AR23-687R |
488,032.4 |
1,492,569.3 |
1,991.8 |
250 |
3.7 |
-45.3 |
2024 |
RC |
Reynolds Pit |
Northern Vertex |
Skyline |
|
AR23-688R |
488,053.0 |
1,492,891.2 |
2,005.4 |
230 |
8.1 |
-45.9 |
2024 |
RC |
Reynolds Pit |
Northern Vertex |
Skyline |
|
AR23-689R |
488,040.9 |
1,492,788.8 |
1,993.4 |
300 |
12.4 |
-49.9 |
2024 |
RC |
Reynolds Pit |
Northern Vertex |
Skyline |
|
AR23-690R |
488,117.2 |
1,492,795.3 |
2,005.5 |
240 |
11.9 |
-44.6 |
2024 |
RC |
Reynolds Pit |
Northern Vertex |
Skyline |
|
AR23-691R |
488,162.8 |
1,492,890.6 |
2,028.7 |
350 |
7.3 |
-43.1 |
2024 |
RC |
Reynolds Pit |
Northern Vertex |
Skyline |
|
AR23-692R |
487,777.6 |
1,492,914.1 |
2,022.1 |
200 |
7.8 |
-50.8 |
2024 |
RC |
Reynolds Pit |
Northern Vertex |
Skyline |
|
AR23-693R |
487,935.2 |
1,492,844.6 |
2,003.3 |
250 |
11.2 |
-60.8 |
2024 |
RC |
Reynolds Pit |
Northern Vertex |
Skyline |
|
AR23-694R |
487,911.5 |
1,492,815.1 |
1,996.8 |
320 |
11.8 |
-46.2 |
2024 |
RC |
Reynolds Pit |
Northern Vertex |
Skyline |
|
AR23-695R |
487,586.6 |
1,492,997.2 |
2,031.8 |
400 |
9.7 |
-44.0 |
2024 |
RC |
Reynolds Pit |
Northern Vertex |
Skyline |
|
AR23-696R |
487,595.5 |
1,492,798.3 |
2,004.9 |
600 |
5.9 |
-43.4 |
2024 |
RC |
Reynolds Pit |
Northern Vertex |
Skyline |
|
AR23-697R |
487,776.5 |
1,492,908.7 |
2,021.1 |
350 |
223.5 |
-88.4 |
2024 |
RC |
Reynolds Pit |
Northern Vertex |
Skyline |
|
AR23-698R |
487,961.2 |
1,492,694.3 |
1,985.0 |
300 |
17.7 |
-65.6 |
2024 |
RC |
Reynolds Pit |
Northern Vertex |
Skyline |
|
AR23-699R |
489,188.7 |
1,492,121.1 |
2,019.4 |
280 |
155.4 |
-81.8 |
2024 |
RC |
West Extension |
Northern Vertex |
Skyline |
|
AR23-700R |
489,655.5 |
1,492,250.3 |
2,021.0 |
280 |
191.1 |
-80.2 |
2024 |
RC |
West Extension |
Northern Vertex |
Skyline |
|
Mako Mining Corp. |
10.3.1 Reynolds Pit
The results of the RC drilling in Reynolds pit area include a total of 54 mineralized intercepts that have a drilled length greater than 60 ft with a minimum grade of 0.005 oz/t Au. The best intersection was drilled in hole AR22-647R, which cut 330 ft grading 0.0116 oz/t Au and 0.0501 oz/t Ag from 10 ft to 340 ft downhole. Table 10.3 summarizes the significant assay intercepts for the Reynolds pit area.
Table 10.3
Summary of Significant Intercepts Reynolds Pit Area
|
DH-ID |
From (ft) |
To (ft) |
Length (ft) |
Au (oz/t) |
Ag (oz/t) |
Target |
|
AR22-647R |
10 |
340 |
330 |
0.0116 |
0.0501 |
Reynolds Pit |
|
AR22-648R |
90 |
260 |
170 |
0.0092 |
0.0386 |
Reynolds Pit |
|
AR22-648R |
305 |
445 |
140 |
0.0187 |
0.0614 |
Reynolds Pit |
|
AR22-649R |
220 |
375 |
155 |
0.0094 |
0.0547 |
Reynolds Pit |
|
AR22-649R |
420 |
485 |
65 |
0.0080 |
0.0325 |
Reynolds Pit |
|
AR22-650R |
215 |
285 |
70 |
0.0078 |
0.0244 |
Reynolds Pit |
|
AR22-650R |
305 |
410 |
105 |
0.0085 |
0.0304 |
Reynolds Pit |
|
AR22-650R |
435 |
510 |
75 |
0.0107 |
0.0572 |
Reynolds Pit |
|
AR22-651R |
0 |
180 |
180 |
0.0098 |
0.0608 |
Reynolds Pit |
|
AR22-652R |
55 |
150 |
95 |
0.0085 |
0.0560 |
Reynolds Pit |
|
AR22-652R |
295 |
445 |
150 |
0.0087 |
0.0301 |
Reynolds Pit |
|
AR22-653R |
140 |
335 |
195 |
0.0120 |
0.0514 |
Reynolds Pit |
|
AR22-653R |
360 |
515 |
155 |
0.0067 |
0.0313 |
Reynolds Pit |
|
AR22-654R |
165 |
445 |
280 |
0.0156 |
0.0601 |
Reynolds Pit |
|
AR22-655R |
0 |
80 |
80 |
0.0077 |
0.0290 |
Reynolds Pit |
|
AR22-655R |
345 |
420 |
75 |
0.0123 |
0.0272 |
Reynolds Pit |
|
AR22-655R |
530 |
600 |
70 |
0.0073 |
0.0385 |
Reynolds Pit |
|
AR22-656R |
360 |
470 |
110 |
0.0155 |
0.0878 |
Reynolds Pit |
|
AR22-656R |
495 |
585 |
90 |
0.0136 |
0.1324 |
Reynolds Pit |
|
AR22-656R |
610 |
700 |
90 |
0.0067 |
0.0307 |
Reynolds Pit |
|
AR23-657R |
50 |
405 |
355 |
0.0098 |
0.0472 |
Reynolds Pit |
|
AR23-658R |
65 |
340 |
275 |
0.0102 |
0.0437 |
Reynolds Pit |
|
AR23-659R |
145 |
215 |
70 |
0.0074 |
0.0219 |
Reynolds Pit |
|
AR23-660R |
20 |
200 |
180 |
0.0100 |
0.0342 |
Reynolds Pit |
|
AR23-661R |
15 |
185 |
170 |
0.0093 |
0.0473 |
Reynolds Pit |
|
AR23-662R |
70 |
900 |
830 |
0.0151 |
0.0738 |
Reynolds Pit |
|
AR23-663R |
100 |
250 |
150 |
0.0102 |
0.0469 |
Reynolds Pit |
|
AR23-663R |
415 |
645 |
230 |
0.0092 |
0.0587 |
Reynolds Pit |
|
AR23-663R |
700 |
845 |
145 |
0.0069 |
0.0184 |
Reynolds Pit |
|
AR23-667R |
310 |
400 |
90 |
0.0084 |
0.1411 |
Reynolds Pit |
|
AR23-668R |
270 |
345 |
75 |
0.0148 |
0.1332 |
Reynolds Pit |
|
AR23-673R |
60 |
500 |
440 |
0.0122 |
0.1065 |
Reynolds Pit |
|
AR23-674R |
165 |
400 |
235 |
0.0162 |
0.1141 |
Reynolds Pit |
|
AR23-674R |
430 |
500 |
70 |
0.0193 |
0.0892 |
Reynolds Pit |
|
AR23-675R |
265 |
500 |
235 |
0.0091 |
0.1036 |
Reynolds Pit |
|
AR23-678R |
155 |
400 |
245 |
0.0155 |
0.0666 |
Reynolds Pit |
|
Mako Mining Corp. |
|
DH-ID |
From (ft) |
To (ft) |
Length (ft) |
Au (oz/t) |
Ag (oz/t) |
Target |
|
AR23-682R |
110 |
340 |
230 |
0.0144 |
0.0562 |
Reynolds Pit |
|
AR23-683R |
55 |
330 |
275 |
0.0102 |
0.0630 |
Reynolds Pit |
|
AR23-684R |
105 |
340 |
235 |
0.0145 |
0.0567 |
Reynolds Pit |
|
AR23-685R |
30 |
230 |
200 |
0.0095 |
0.0514 |
Reynolds Pit |
|
AR23-686R |
40 |
250 |
210 |
0.0123 |
0.0422 |
Reynolds Pit |
|
AR23-687R |
60 |
250 |
190 |
0.0111 |
0.0566 |
Reynolds Pit |
|
AR23-688R |
0 |
230 |
230 |
0.0077 |
0.0484 |
Reynolds Pit |
|
AR23-689R |
50 |
120 |
70 |
0.0067 |
0.0296 |
Reynolds Pit |
|
AR23-689R |
140 |
300 |
160 |
0.0082 |
0.0563 |
Reynolds Pit |
|
AR23-690R |
0 |
240 |
240 |
0.0073 |
0.0340 |
Reynolds Pit |
|
AR23-691R |
80 |
195 |
115 |
0.0084 |
0.0472 |
Reynolds Pit |
|
AR23-692R |
0 |
200 |
200 |
0.0108 |
0.0490 |
Reynolds Pit |
|
AR23-693R |
40 |
165 |
125 |
0.0129 |
0.0413 |
Reynolds Pit |
|
AR23-694R |
55 |
265 |
210 |
0.0110 |
0.0478 |
Reynolds Pit |
|
AR23-695R |
35 |
355 |
320 |
0.0085 |
0.0511 |
Reynolds Pit |
|
AR23-696R |
160 |
460 |
300 |
0.0089 |
0.0467 |
Reynolds Pit |
|
AR23-697R |
60 |
350 |
290 |
0.0093 |
0.0538 |
Reynolds Pit |
|
AR23-698R |
65 |
235 |
170 |
0.0099 |
0.0545 |
Reynolds Pit |
10.3.2 West Extension
The results of the RC drilling in the West Extension area include a total of 27 mineralized intercepts that have a drilled length greater than 60 ft with a minimum grade of 0.005 oz/t Au. The best intersection was drilled in hole AR22-621R, which cut 380 ft grading 0.0116 oz/t Au and 0.0279 oz/t Ag from 730 ft to 1,110 ft downhole. Table 10.4 presents a summary of the significant assay intercepts for the West Extension area.
Table 10.4
Summat of Significant Intercepts West Extension Area
|
DH-ID |
From (ft) |
To (ft) |
Length (ft) |
Au (oz/t) |
Ag (oz/t) |
Target |
|
AR22-596R |
50 |
350 |
300 |
0.0073 |
0.0216 |
West Extension |
|
AR22-597R |
125 |
230 |
105 |
0.0079 |
0.0435 |
West Extension |
|
AR22-597R |
625 |
695 |
70 |
0.0113 |
0.0183 |
West Extension |
|
AR22-599R |
40 |
110 |
70 |
0.0072 |
0.0417 |
West Extension |
|
AR22-599R |
200 |
295 |
95 |
0.0114 |
0.0771 |
West Extension |
|
AR22-599R |
420 |
510 |
90 |
0.0102 |
0.0833 |
West Extension |
|
AR22-602R |
420 |
560 |
140 |
0.0096 |
0.0188 |
West Extension |
|
AR22-603R |
395 |
530 |
135 |
0.0069 |
0.0331 |
West Extension |
|
AR22-604R |
350 |
415 |
65 |
0.0072 |
0.0221 |
West Extension |
|
AR22-605R |
5 |
285 |
280 |
0.0105 |
0.0380 |
West Extension |
|
AR22-605R |
320 |
440 |
120 |
0.0093 |
0.0210 |
West Extension |
|
AR22-605R |
465 |
530 |
65 |
0.0070 |
0.0287 |
West Extension |
|
AR22-606R |
0 |
230 |
230 |
0.0141 |
0.0344 |
West Extension |
|
AR22-606R |
305 |
370 |
65 |
0.0127 |
0.0278 |
West Extension |
|
AR22-607R |
25 |
275 |
250 |
0.0100 |
0.0306 |
West Extension |
|
AR22-608R |
0 |
310 |
310 |
0.0102 |
0.0276 |
West Extension |
|
Mako Mining Corp. |
|
DH-ID |
From (ft) |
To (ft) |
Length (ft) |
Au (oz/t) |
Ag (oz/t) |
Target |
|
AR22-611R |
370 |
470 |
100 |
0.0072 |
0.0484 |
West Extension |
|
AR22-611R |
565 |
640 |
75 |
0.0054 |
0.0227 |
West Extension |
|
AR22-616R |
205 |
290 |
85 |
0.0111 |
0.0410 |
West Extension |
|
AR22-617R |
180 |
340 |
160 |
0.0100 |
0.0883 |
West Extension |
|
AR22-620R |
0 |
125 |
125 |
0.0150 |
0.1321 |
West Extension |
|
AR22-621R |
45 |
140 |
95 |
0.0074 |
0.0316 |
West Extension |
|
AR22-621R |
730 |
1110 |
380 |
0.0116 |
0.0279 |
West Extension |
|
AR22-643R |
425 |
605 |
180 |
0.0111 |
0.0218 |
West Extension |
|
AR23-699R |
45 |
110 |
65 |
0.0152 |
0.0554 |
West Extension |
|
AR23-699R |
180 |
245 |
65 |
0.0119 |
0.0399 |
West Extension |
|
AR23-700R |
45 |
280 |
235 |
0.0078 |
0.0479 |
West Extension |
10.3.3 West Pit
The results of the RC drilling in the West pit area include a total of 27 mineralized intercepts that have a drilled length greater than 60 ft with a minimum grade of 0.005 oz/t Au. The best intersection was drilled in hole AR22-622R, which cut 475 ft grading 0.0103 oz/t Au and 0.0421 oz/t Ag from 0 ft to 475 ft downhole. Table 10.5 summarizes the significant assay intercepts in the West pit area.
Table 10.5
Summary of Significant Assay Intercepts West Pit Area
|
DH-ID |
From (ft) |
To (ft) |
Length (ft) |
Au (oz/t) |
Ag (oz/t) |
Target |
|
AR22-576R |
175 |
270 |
95 |
0.0082 |
0.0282 |
West Pit |
|
AR22-577R |
0 |
65 |
65 |
0.0208 |
0.0346 |
West Pit |
|
AR22-577R |
95 |
160 |
65 |
0.0061 |
0.0285 |
West Pit |
|
AR22-578R |
5 |
70 |
65 |
0.0170 |
0.0545 |
West Pit |
|
AR22-578R |
280 |
355 |
75 |
0.0086 |
0.2267 |
West Pit |
|
AR22-578R |
410 |
540 |
130 |
0.0078 |
0.0956 |
West Pit |
|
AR22-585R |
105 |
350 |
245 |
0.0066 |
0.0072 |
West Pit |
|
AR22-612R |
0 |
295 |
295 |
0.0120 |
0.1513 |
West Pit |
|
AR22-612R |
440 |
620 |
180 |
0.0071 |
0.1074 |
West Pit |
|
AR22-613R |
0 |
210 |
210 |
0.0152 |
0.1520 |
West Pit |
|
AR22-613R |
325 |
405 |
80 |
0.0115 |
0.2689 |
West Pit |
|
AR22-614R |
0 |
150 |
150 |
0.0113 |
0.1548 |
West Pit |
|
AR22-614R |
225 |
295 |
70 |
0.0055 |
0.0321 |
West Pit |
|
AR22-615R |
0 |
105 |
105 |
0.0110 |
0.0685 |
West Pit |
|
AR22-615R |
160 |
280 |
120 |
0.0118 |
0.0430 |
West Pit |
|
AR22-622R |
0 |
475 |
475 |
0.0103 |
0.0421 |
West Pit |
|
AR22-630R |
50 |
410 |
360 |
0.0088 |
0.0511 |
West Pit |
|
AR22-636R |
0 |
70 |
70 |
0.0152 |
0.0706 |
West Pit |
|
AR22-636R |
100 |
185 |
85 |
0.0086 |
0.1067 |
West Pit |
|
AR22-636R |
250 |
325 |
75 |
0.0134 |
0.4875 |
West Pit |
|
AR22-636R |
355 |
460 |
105 |
0.0079 |
0.0917 |
West Pit |
|
AR22-637R |
0 |
70 |
70 |
0.0317 |
0.1725 |
West Pit |
|
AR22-637R |
90 |
355 |
265 |
0.0097 |
0.1368 |
West Pit |
|
AR22-638R |
75 |
280 |
205 |
0.0090 |
0.1559 |
West Pit |
|
Mako Mining Corp. |
|
DH-ID |
From (ft) |
To (ft) |
Length (ft) |
Au (oz/t) |
Ag (oz/t) |
Target |
|
AR22-639R |
0 |
320 |
320 |
0.0139 |
0.1246 |
West Pit |
|
AR22-644R |
275 |
385 |
110 |
0.0093 |
0.1965 |
West Pit |
|
AR22-645R |
245 |
355 |
110 |
0.0117 |
0.3353 |
West Pit |
10.3.4 Centre Pit
The results of the RC drilling in the Centre pit area include a total of 17 mineralized intercepts that have a drilled length greater than 60 ft with a minimum grade of 0.005 oz/t Au. The best intersection was drilled in hole AR22-631R, which cut 95 ft grading 0.0376 oz/t Au and 0.695 oz/t Ag from 205 ft to 300 ft downhole. Table 10.6 summarizes the significant intercepts for the Centre Pit area.
Table 10.6
Summary of Significant Assay Intercepts Centre Pit
|
DH-ID |
From (ft) |
To (ft) |
Length (ft) |
Au (opt) |
Ag (opt) |
Target |
|
AR22-626R |
240 |
305 |
65 |
0.0315 |
0.6908 |
Centre Pit |
|
AR22-627R |
300 |
405 |
105 |
0.0149 |
0.2920 |
Centre Pit |
|
AR22-628R |
290 |
390 |
100 |
0.0066 |
0.0840 |
Centre Pit |
|
AR22-628R |
455 |
675 |
220 |
0.0145 |
0.2179 |
Centre Pit |
|
AR22-629R |
165 |
330 |
165 |
0.0067 |
0.1364 |
Centre Pit |
|
AR22-629R |
465 |
575 |
110 |
0.0106 |
0.0707 |
Centre Pit |
|
AR22-629R |
720 |
800 |
80 |
0.0059 |
0.0357 |
Centre Pit |
|
AR22-631R |
205 |
300 |
95 |
0.0376 |
0.6945 |
Centre Pit |
|
AR22-632R |
320 |
575 |
255 |
0.0134 |
0.2303 |
Centre Pit |
|
AR22-633R |
455 |
640 |
185 |
0.0109 |
0.1016 |
Centre Pit |
|
AR22-633R |
660 |
740 |
80 |
0.0075 |
0.1834 |
Centre Pit |
|
AR22-633R |
770 |
840 |
70 |
0.0124 |
0.1842 |
Centre Pit |
|
AR22-635R |
475 |
620 |
145 |
0.0159 |
0.0323 |
Centre Pit |
|
AR22-635R |
680 |
750 |
70 |
0.0151 |
0.0327 |
Centre Pit |
|
AR22-640R |
295 |
375 |
80 |
0.0258 |
0.1511 |
Centre Pit |
|
AR22-641R |
305 |
490 |
185 |
0.0138 |
0.1194 |
Centre Pit |
|
AR23-664R |
0 |
110 |
110 |
0.0130 |
0.1366 |
Centre Pit |
For Table 10.3 to Table 10.6 the reader should note that; the true width of the economic mineralization for each intersection has not been determined, as the true width of the economic mineralization depends on the angle at which the drill hole intersects the mineralization, the current parameters used to determine the economic cut-off grade and the 3D model interpretation of the veins and mineralization. Therefore, the true width of the mineralization can change over time and the true width of the mineralization for each interval is linked to the current block model, the parameters used to determine the MRE and that the true width of the mineralized intervals do not necessarily represent the overall true width of the mineral deposit as a whole.
10.4 QP Comments
The Qualified Person for this section of the report believes that the drilling, sampling and assaying are satisfactory for this type of deposit and style of gold mineralization and that the sample handling and chain of custody, as documented, meet standard industry practice. Therefore, the QP for this section of the report believes that the drill hole data is sufficiently accurate to be considered reliable and is suitable for the use in the estimation of mineral resources and mineral reserves.
|
Mako Mining Corp. |
As well, the Qualified Person for this section of the report believes that the exploration and drilling programs provide sufficient information for the estimation and classification of Mineral Resources.
|
Mako Mining Corp. |
11.0 SAMPLE PREPARATION, ANALYSES AND SECURITY
11.1 General Information
There is no information on the sample preparation, analysis or security for the legacy drilling and sampling information prior to 2011.
Information on sample preparation and Quality Assurance/Quality Control (QA/QC) protocols is only available for drilling completed by Northern Vertex Mining Corporation and Golden Vertex Corporation. Detailed information on sampling methods and preparation for exploration drilling performed are summarized below based on seven Technical Reports carried out from 2011 to 2015, 2017, and 2021 listed in the References of this report.
11.2 Sample Collection and Security
11.2.1 2011 to 2013 Reverse Circulation Samples
For Phase 1 drilling, drill holes from AR-57R to AR-119R, the reverse circulation cuttings were sampled and analysed in 5 ft increments over the entire drill hole length, with sample weighting between 5 lbs and 10 lbs recovered in olefin bags. Samples were removed from the drill site each day and placed in secure storage. From there the samples were shipped via UPS to ALS Chemex of Reno, Nevada, USA. Each shipment also included a coarse crushed blank and low to medium gold grade standard reference material (SRM).
For Phase 2 drilling, drill holes AR-120R to AR-138R, the sampling protocol was the same except that the samples were shipped for assay to the Inspectorate America Corporation laboratory in Sparks, Nevada.
For Phase 3 drilling the reverse circulation cuttings were sampled and analysed in 5 ft increments over the entire drill hole. Cuttings were collected via a rotating splitter mounted on the drill to give a sample ranging from 7 to 10 pounds that was collected in an olefin bag inside a bucket. The samples were labelled with the hole number and footage. Samples to be assayed were removed from the drill site each day and placed in secure storage. From there they were shipped to the Inspectorate America Corporation laboratory in Sparks, Nevada for assay. Before shipment, a coarse crushed blank, low and medium gold content standards were added to the sample batch for each hole.
11.2.2 2011 to 2013 Core samples
For Phase 1 drilling the HQ size core was drilled and collected in 10 ft lengths in core boxes, with intervals marked with wooden blocks every 2 to 3 ft. The core was logged on site by a MinQuest contract geologist who marked sample intervals not to exceed 5 feet. The logged and marked core was transported from the project site by the geologist to secure storage in Reno. Geotechnical logging was carried out by an engineer before the core was sampled. The core was sawn in half under the supervision of a project geologist, with one‐half of the split sawn in half again using a core saw. One‐quarter core was sampled on the intervals marked by the geologist, placed in olefin bags, labelled with hole number and footage, blanks and standards were added and sent to the ALS Chemex of Reno Nevada for preparation and analysis. The remaining three‐quarter core was kept in secure storage until used for metallurgical testing.
|
Mako Mining Corp. |
For Phase 2 drilling the HQ size core was drilled and collected in 10 ft lengths in paper core boxes. Intervals were marked with wooden blocks every 2 to 3 feet. The core was logged on site by a MinQuest contract geologist who marked sample intervals not to exceed 5 ft. The logged and marked core was transported from the project site by the geologist to secure storage in Reno. After detailed geotechnical logging by an engineer the core was sawn in half under the supervision of a project geologist. One half of the core was sampled on the intervals marked by the geologist, placed in olefin bags, labeled with a consecutive sample number, blanks and standards added and sent to the Inspectorate America Corporation laboratory in Sparks, Nevada for assay for preparation and analysis. The remaining one-half core is kept in secure storage until required for metallurgical testing.
In the Phase 2 and 3 programs the core was transported from the Moss Mine Project site by a Northern Vertex employee to a secure core logging and storage warehouse in Bullhead City, Arizona rented by Northern Vertex. The core was logged by a Northern Vertex geologist and sample intervals were marked not to exceed 5 ft. After detailed geotechnical logging, the core was sawn under the supervision of a project geologist. The core was split in half using a core saw. One half of the core was sampled on the intervals marked by the geologist, placed in olefin bags, labelled with a consecutive sample number, blanks and standards added and sent to the geochemical lab for preparation and analysis. The remaining one-half core is kept in secure storage until required for metallurgical testing. Core from the Phase 2 and 3 programs is stored in the Northern Vertex warehouse in Bullhead City, Arizona. Northern Vertex is in the process of recovering samples from the Phase 1 program stored by MinQuest in Reno, Nevada in order to store all samples at Northern Vertex's storage in Bullhead City.
11.2.3 2012 Percussion Samples
Percussion drilling was carried out by an Atlas Copco ECM 590 drill rig powered by a Cummins 220 horsepower (HP) Tier III diesel engine, with an on board, (250 cubic feet per minute (CFM)), 140 pounds per square inch (psi) compressor supplying flushing air. The on-board, hydraulically powered dust collector was mounted on the starboard side of the rig, with a 5 inch (12.7 cm) spiral suction hose connected to an adjustable sliding "boot" below the centralizer on the feed mast, through a drill mast mounted venturi. The boot could be lowered to form a seal around the drill collar. Coarse cuttings, accounting for about 80% of the total cuttings, were discharged from the forward venturi, and the remaining 20%, comprising the fine fraction, were discharged from the dust collector itself. Polythene sample bags (18 in x 24 in) were attached to both the forward venturi discharge and the dust collector discharge to ensure 100% sample collection. The hole diameter was 3 in. The initial drill rod (T-51 thread = 51 mm diameter) in the string was 14 ft long, allowing for 12 ft to be in the hole and 2 ft from the centralizer clamping device to the hole collar. Subsequent drill rods were 12 ft long. The sample interval was set at 6 ft, allowing a sample to be collected at the mid-point of the drill rod and when the next rod was added. At the end of each sample interval, the driller would cease penetration, continue to flush with air for 10 seconds with the dust collector on, then shut off the flushing air and the dust collector suction, thereby allowing both the dust collector and venturi to fully discharge. The quantity of drill cuttings in each sample was about 50 lbs (22.7 kg). The coarse and fine sample from each interval was combined and then split on-site using a Jones riffle splitter. The final two splits from each sample interval were kept, with one sent for assay and the second stored on site in the 65 ft level crosscut. A screened sample was saved in chip trays from each interval. Additional splits from about 5% of the sample intervals were also saved to provide duplicates for assay. Certified Standard Reference Materials (CSRM) and blanks were also inserted into the samples for QA/QC. The samples were boxed and sent by UPS courier to the Inspectorate laboratory in Sparks, Nevada for sample preparation and assay. The maximum depth of the holes was 96 feet (29 m), as holes deeper than 100 feet (30.4 m) are considered water wells in Arizona and require a well permit from the state. If a hole hit water, drilling was stopped as water causes cuttings to stick to the drill rods resulting in possible contamination between intervals. Six core holes were twinned with percussion holes to ensure that representative samples were being collected by the percussion drilling.
|
Mako Mining Corp. |
11.2.4 2016 to 2017
The diamond core and reverse circulation drilling program (Phase 4) carried out between 2016 to 2017 was supervised by Consulting Geologist Mr. Robert Cuffney. The sampling and procedures followed those outlined above for the 2013 core and RC drilling program.
11.2.5 2019 to 2023
The diamond core and reverse circulation drilling carried out in 2019, (Phase 6), was also supervised by Consulting Geologist Mr. Robert Cuffney. The sampling and procedures followed those outlined above for the 2013 core and RC drilling program. The samples collected during this program were submitted to Skyline Assayers and Laboratories (Skyline) of Tucson, Arizona. The QAQC program consisted of the insertion of Certified Reference Material (CRM), a blank and a field duplicate for every 30 samples submitted for assay.
The diamond core and RC drilling carried out from 2020 to 2023 was carried out by Mr. Chris White, Senior Geologist at Moss Mine.
RC samples were collected at five-foot intervals by the drilling crew using a wet rotary splitter. Field notes were recorded for each sampling, including what was sampled and how the sample was taken. The samples were collected in bags, with a sample tag assigned to the bag. The samples were delivered to a secure on-site location prior to being picked up by a Skyline representative.
Core from the drill rig is pulled from the core barrel by the drill crew and broken into lengths that fit into the core boxes. The depth of the core is labeled by the drillers when it is placed in the core box. The core is logged and cut by the geologists in the core shed. Half-core is sampled on five to 10-foot intervals, with the half-core placed in bags with a sample tag. The samples are delivered to a secure on-site location prior to being picked up by a Skyline representative.
11.3 Sample Preparation and Analysis
11.3.1 2011 to 2013 Samples
The Phase 1 drilling samples were sent to the ALS Chemex laboratory in Reno, which is now part of ALS Global. This laboratory is ISO 9001:2008 and ISO 10725 certified. The laboratory is independent of Northern Vertex. The core samples were prepared by crushing in a jaw crusher, riffle splitting, and pulverizing. All samples were analysed for gold and silver. Gold was analysed by fire assay on a 30 g sample and atomic adsorption spectrophotometry (AAS) finish (method AA23). Samples over the maximum detection limit of 10 g/t Au were rerun by fire assay on a 30g sample with gravimetric finish (method Au‐GRA21). Silver was analysed by multi‐acid digestion (hydrofluoric acid, nitric acid and perchloric acid, with a hydrochloric acid leach) and AAS finish (method AA61). Samples over the maximum detection limit of 100 g/t Ag were rerun by the same method with a higher limit of detection for ore grade samples (method Ag‐AA62). The core samples were also analysed for 33 additional elements (Ag, Al, As, Ba, Be, Bi, Ca, Cd, Co, Cr, Cu, Fe, Ga, K, La, Mg, Mn, Mo, Na, Ni, P, Pb, S, Sb, Sc, Sr, Th, Ti, Tl, U, V, W and Zn) by four acid "near‐total" digestion and inductively coupled plasma atomic emission spectrometer (ICP‐AES) finish (method ME‐ICP61).
|
Mako Mining Corp. |
The Phase 2 and Phase 3 drilling samples were sent to the Inspectorate America Corporation laboratory in Sparks, Nevada. This is a Bureau Veritas Group Company and is ISO 9001:2008 certified. The laboratory is independent of Northern Vertex.
The reverse circulation cuttings, percussion samples and core samples were prepared by drying for up to 24 hours, crushing in a jaw crusher to >70% passing minus 10 mesh, riffle splitting of about 250 g, and pulverizing the split to >85% passing minus 200 mesh (method SP-RX-2K). The samples were analysed for gold by fire assay on a 1 assay ton (30 g) sample and atomic adsorption spectrophotometry (AAS) finish, with a detection range of 0.005 to 10.0 ppm (method Au-1AT-AA). Samples above the upper limit of detection were re-assayed by fire assay on a 1 assay ton sample with gravimetric finish, with a detection range of 1 to 1,000 ppm (method Au-1AT-GV).
For reverse circulation samples, silver was analysed as part of a multielement 30 element package (Ag, Al*, As, Ba*, Bi, Ca*, Cd, Co, Cr*, Cu, Fe, K*, La*, Mg*, Mn, Mo, Na*, Ni, P*, Pb, S, Sb, Sc*, Sr*, Ti*, Tl, V, W*, Zn and Zr*) by 4-acid "near-total" digestion and inductively coupled plasma atomic emission spectrometer (ICP-AES) finish (method 30-4A-TR). For the elements marked with an asterisk (*) Inspectorate advise that results are semi-quantitative due to being only partially leached in aqua regia or lost to volatility in 4-acid digestion. For core samples, silver was analysed by aqua regia digestion and AAS finish, with a detection range of 0.1 to 200 ppm (method Ag-AR-TR).
11.3.2 2016 to 2017 Samples
Samples of core or RC cuttings were shipped to Inspectorate Laboratories in Sparks, Nevada, where they were dried, crushed, and pulverized to 85% passing 200-mesh sieve. The pulps were assayed for gold using a 30-gram aliquot by fire assay ("FA"), with an atomic absorption ("AA") finish. For those assays above a threshold of 0.292 oz/ton (10 g/t) for gold were rerun using a gravimetric finish. The pulps were also analysed for 35 elements, including silver, with at 0.25-gram split using a four-acid digestion ICP-ES analysis. The Inspectorate Laboratory is independent of the company and meets the requirements of International ISO 9001:2008 standards.
11.3.3 2019 to 2023 Samples
All assays completed from 2019 and later were performed by Skyline in Tucson, Arizona. Rock samples are dried, crushed and pulverized to 95% passing through a 150-mesh sieve. The pulps are assayed for gold using a 30-gram aliquot by fire assay ("FA") with an atomic absorption ("AA") finish. Assays above certain threshold limits for both gold and silver (5 g/t for gold and 100 g/t for silver, 0.146 oz/ton gold and 2.92 oz/ton silver) are rerun using a gravimetric procedure.
Rejects and pulps are stored at GVC's warehouse in Bullhead City, Arizona, for future reference.
|
Mako Mining Corp. |
11.4 Quality Assurance / Quality Control Results
The quality assurance and quality control (QA/QC) protocols include the insertion of certified reference material (CRM), blanks and duplicates in the assays sample stream along with replicate analyses. The QA/QC results was monitored by the Project Geologist using a spreadsheet in which a written QA/QC log was maintained to indicate problems, actions taken, and resolutions. CRM were monitored by type and by laboratory certificate. If an assay returned for a CRM was outside three standard deviations of the expected value, then the CRM and at least one sample either side were re-assayed. Blanks were monitored in a spreadsheet, and intervals were re-assayed if there was an anomalous assay result. Table 11.1 below presents the results for CRM and blanks assay results by drilling phase and year.
The CRM results have been reviewed and assessed using a process performance chart that displays the expected value of the CRM and upper and lower limits shown as a whisker plot. The average grade of the CRM and upper and lower control limits are also displayed on the graph. If assay results are beyond the upper or lower control limit, then the results are considered a failure. Table 11.1 shows the number of failures and the percentage of failures, if any.
11.4.1 QA/QC Results 2011
There are three CRM materials that were used to assess the accuracy and precision of the assays for the 2011 drilling program. There is good agreement between the CRM expected value and assay results for these three CRMs. The blank results also indicate that there is good agreement between the expected value and assay results. The results of these QA/QC assays demonstrate that the assays by ALS Chemex are sufficiently accurate to be reliable.
11.4.2 QA/QC Results 2012
There are three CRM materials that were used to assess the accuracy and precision of the assays for the 2012 drilling program. There is good agreement between the CRM expected value and assay results for these three CRMs. The blank (CDN-BL-9) results also indicate that there is good agreement between the expected value and assay results. The results of these QA/QC assays demonstrate that the assays by Inspectorate are sufficiently accurate to be reliable.
11.4.3 QA/QC Results 2013
There are seven CRM materials that were used to assess the accuracy and precision of the assays for the 2013 drilling program. There is good agreement between the CRM expected value and assay results for these seven CRMs. The blank (CDN-BL-10) results also indicate that there is good agreement between the expected value and assay results. The results of these QA/QC assays demonstrate that the assays by Inspectorate are sufficiently accurate to be reliable.
|
Mako Mining Corp. |
Table 11.1
Summary of CRM and Blank QA/QC Results
| Year | Assay Lab | Method | Metal | CRM Source | CRM | Expected Value Au (g/t) | 95% Confidence Limits 2 Standard Deviations |
No of Assays | Avg. Assay Au (g/t) | Accuracy (%) | No. of Failures | % of Failures |
| 2011 | ALS Chemex | FA/AA | Au (g/t) | CDN | GS-P7B | 0.710 | 0.070 | 29 | 0.705 | -0.70% | 1 | 3.4% |
| 2011 | ALS Chemex | FA/AA | Au (g/t) | CDN | GS-1G | 1.140 | 0.090 | 52 | 1.165 | 2.19% | 1 | 1.9% |
| 2011 | ALS Chemex | FA/AA | Au (g/t) | CDN | GS-2G | 2.260 | 0.190 | 51 | 2.383 | 5.43% | 1 | 2.0% |
| 2011 | ALS Chemex | FA/AA | Au (g/t) | MinQuest | Blank | 0.005 | 0.002 | 85 | 0.004 | 1 | 1.2% | |
| 2012 | Inspectorate | FA/AA | Au (g/t) | CDN | GS-2J | 2.360 | 0.200 | 28 | 2.441 | 3.41% | 0 | 0.0% |
| 2012 | Inspectorate | FA/AA | Au (g/t) | CDN | GS-7E | 0.766 | 0.086 | 36 | 0.779 | 1.63% | 2 | 5.6% |
| 2012 | Inspectorate | FA/AA | Au (g/t) | CDN | ME-15 | 1.386 | 0.102 | 35 | 1.327 | -4.26% | 3 | 8.6% |
| 2012 | Inspectorate | FA/AA | Au (g/t) | CDN | BL-9 | 0.005 | 0.002 | 30 | 0.004 | 2 | 6.7% | |
| 2013 | Inspectorate | FA/AA | Au (g/t) | CDN | GS-1K | 0.867 | 0.098 | 31 | 0.812 | -6.37% | 0 | 0.0% |
| 2013 | Inspectorate | FA/AA | Au (g/t) | CDN | GS-1L | 1.160 | 0.100 | 48 | 1.151 | -0.75% | 1 | 2.1% |
| 2013 | Inspectorate | FA/AA | Au (g/t) | CDN | GS-1P5E | 1.520 | 0.110 | 32 | 1.499 | -1.39% | 0 | 0.0% |
| 2013 | Inspectorate | FA/AA | Au (g/t) | CDN | GS-2J | 2.360 | 0.200 | 11 | 2.287 | -3.09% | 0 | 0.0% |
| 2013 | Inspectorate | FA/AA | Au (g/t) | CDN | GS-2M | 2.210 | 0.244 | 41 | 2.292 | 3.73% | 0 | 0.0% |
| 2013 | Inspectorate | FA/AA | Au (g/t) | CDN | GS-5H | 3.880 | 0.280 | 30 | 3.774 | -2.73% | 1 | 3.3% |
| 2013 | Inspectorate | FA/AA | Au (g/t) | CDN | GS-9A | 9.310 | 0.690 | 28 | 9.202 | -1.17% | 2 | 7.1% |
| 2013 | Inspectorate | FA/AA | Au (g/t) | CDN | GS-P7H | 0.799 | 0.050 | 54 | 0.799 | -0.06% | 2 | 3.7% |
| 2013 | Inspectorate | FA/AA | Au (g/t) | CDN | BL-10 | 0.005 | 0.002 | 129 | 0.003 | 2 | 1.6% | |
| 2020 | Skyline | FA/AA | Au (g/t) | CDN | GS-3U | 3.290 | 0.260 | 37 | 3.349 | 1.81% | 0 | 0.0% |
| 2020 | Skyline | FA/AA | Au (g/t) | CDN | GS-6C | 5.950 | 0.480 | 49 | 6.137 | 3.14% | 4 | 8.2% |
| 2020 | Skyline | FA/AA | Au (g/t) | CDN | GS-9C | 8.970 | 0.360 | 36 | 8.807 | -1.82% | 0 | 0.0% |
| 2020 | Skyline | FA/AA | Au (g/t) | CDN | GS-P4H | 0.400 | 0.040 | 374 | 0.434 | 8.50% | 4 | 1.1% |
| 2020 | Skyline | FA/AA | Au (g/t) | CDN | GS-P4J | 0.479 | 0.049 | 111 | 0.491 | 2.40% | 3 | 2.7% |
| 2020 | Skyline | FA/AA | Au (g/t) | CDN | GS-P5E | 0.655 | 0.062 | 58 | 0.658 | 0.50% | 2 | 3.4% |
| 2020 | Skyline | FA/AA | Au (g/t) | MEG | Au.12.23 | 0.298 | 0.010 | 79 | 0.282 | -5.30% | 4 | 5.1% |
| 2020 | Skyline | FA/AA | Au (g/t) | CDN | BL-10 | 0.005 | 0.002 | 318 | 0.003 | 1 | 0.3% | |
| 2021 | Skyline | FA/AA | Au (g/t) | CDN | GS-3U | 3.290 | 0.260 | 106 | 3.320 | 0.92% | 0 | 0.0% |
| 2021 | Skyline | FA/AA | Au (g/t) | CDN | GS-P4J | 0.479 | 0.049 | 226 | 0.529 | 10.44% | 3 | 1.3% |
| 2021 | Skyline | FA/AA | Au (g/t) | CDN | GS-P6C | 0.767 | 0.078 | 51 | 0.834 | 8.79% | 5 | 9.8% |
| 2021 | Skyline | FA/AA | Au (g/t) | CDN | GS-P6D | 0.769 | 0.047 | 139 | 0.843 | 9.57% | 0 | 0.0% |
| 2021 | Skyline | FA/AA | Au (g/t) | CDN | BL-10 | 0.005 | 0.002 | 306 | 0.004 | 1 | 0.3% | |
| 2022 | Skyline | FA/AA | Au (g/t) | CDN | CGS-26 | 1.640 | 0.110 | 57 | 1.663 | 1.40% | 0 | 0.0% |
| 2022 | Skyline | FA/AA | Au (g/t) | CDN | CM-15 | 1.253 | 0.118 | 13 | 1.348 | 7.56% | 0 | 0.0% |
| 2022 | Skyline | FA/AA | Au (g/t) | CDN | CM-19 | 2.110 | 0.220 | 44 | 2.192 | 3.91% | 0 | 0.0% |
| 2022 | Skyline | FA/AA | Au (g/t) | CDN | CM-22 | 0.718 | 0.072 | 66 | 0.736 | 2.48% | 0 | 0.0% |
| 2022 | Skyline | FA/AA | Au (g/t) | CDN | CM-42 | 0.576 | 0.050 | 12 | 0.599 | 3.96% | 0 | 0.0% |
| 2022 | Skyline | FA/AA | Au (g/t) | CDN | GS-3U | 3.290 | 0.260 | 36 | 3.379 | 2.71% | 0 | 0.0% |
| 2022 | Skyline | FA/AA | Au (g/t) | CDN | GS-P4J | 0.479 | 0.049 | 78 | 0.517 | 7.91% | 0 | 0.0% |
| 2022 | Skyline | FA/AA | Au (g/t) | CDN | GS-P6D | 0.769 | 0.093 | 14 | 0.852 | 10.74% | 0 | 0.0% |
|
Mako Mining Corp. |
11.4.4 QA/QC Results 2020
There are seven CRM materials that were used to assess the accuracy and precision of the assays for the 2020 drilling program. There is good agreement between the CRM expected value and assay results for these seven CRMs. The blank (CDN-BL-10) results also indicated that there is good agreement between the expected value and assay results. The results of these QA/QC assays demonstrate that the assays by Skyline are sufficiently accurate to be reliable.
11.4.5 QA/QC Results 2021
There are four CRM materials that were used to assess the accuracy and precision of the assays for the 2021 drilling program. There is good agreement between the CRM expected value and assay results for these four CRMs. The blank (CDN-BL-10) results also indicate that there is good agreement between the expected value and assay results. The results of these QA/QC assays demonstrate that the assays by Skyline are sufficiently accurate to be reliable.
11.4.6 QA/QC Results 2022
There are eight CRM materials that were used to assess the accuracy and precision of the assays for the 2022 drilling program. There is good agreement between the CRM expected value and assay results for these eight CRMs. The results of these QA/QC assays demonstrate that the assays by Skyline are sufficiently accurate to be reliable.
11.4.7 QA/QC Results 2023
The QA/QC assessment was carried out using two sets of duplicate samples. The laboratory check samples are duplicate assays on pulp samples. Figure 11.1 displays a duplicate pass/fail chart at two scales. The means of the assay results are similar between the first and second assay results. There are 8 duplicate failures, which represents only 3.2% of the data. This error rate is considered acceptable.
The preparation duplicate samples are duplicate assays on sample reject material. Figure 11.2 displays a duplicate pass/fail chart at two scales. The means of the two assays are similar, and the error rate is also low at 2.9%.
From these results the assays produced by Skyline Assay laboratories are sufficiently accurate to be considered reliable.
|
Mako Mining Corp. |
Figure 11.1
Duplicate Laboratory Assay Checks of Duplicate Gold Assays
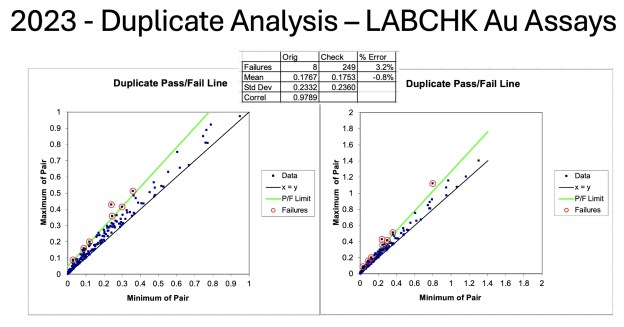
Figure 11.2
Duplicate Preparation Assay Checks of Duplicate Gold Assays
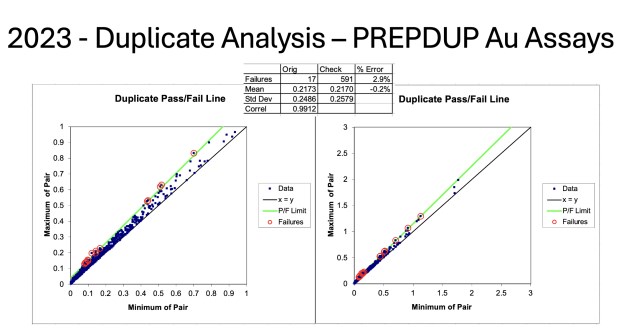
|
Mako Mining Corp. |
11.5 Qualified Person's Comments
The Qualified Person for this section of the report believes that the preparation and analysis of the samples are satisfactory for this type of deposit and style of gold mineralization and that the sample handling and chain of custody, as documented, meet standard industry practice.
The Qualified Person for this section of the Technical Report has reviewed the QA/QC program and deems it to be in accordance with standard industry practice and CIM's "Exploration Best Practice Guidelines". Both Northern Vertex and Golden Vertex personnel and their consultants have taken reasonable measures to ensure the sample analysis completed is sufficiently accurate and precise such that the assays can be considered as reliable and suitable for use in the estimation of mineral resources.
As well, the Qualified Person for this section of the report believes that the exploration and drilling programs provide sufficient information for the estimation and classification of Mineral Resources.
|
Mako Mining Corp. |
12.0 DATA VERIFICATION
12.1 Drill Hole Database
The drill hole database for the Mineral Resource Estimate is based on the database initially developed by Northern Vertex Mining Corp who compiled the legacy collar and assay data provided by Patriot Gold Corp., which includes scanned copies of all legacy data sources, into the Moss Mine Master Database. Northern Vertex and later Golden Vertex Corp. managed the database and added additional data as it was collected between 2011 to the present. In addition, the drill hole data files compiled for the IMC 2021 mineral resource estimate, which was provided as a series of Excel spreadsheets, were also used to help verify the Moss Mine Database. Several comparisons were carried out using the two different sources of information and a final database was constructed in Micromine. This information was then exported as series of Excel files consisting of collars, surveys, assays and geology that were used to build a MineSight datafile for data analysis and mineral resource estimation.
There are a total of 1,625 drill holes totalling 499,821.5 ft. The database contains different drill hole types, including AT (air track), CH (channel samples), DDH (core), LH (long-hole), PERC (percussion), RC (reverse circulation), TR (trench samples). The data has been collected from 1920 to 2024, and several different assay laboratories have been used to assay the sample data. The data from 1920 to 1998 does not have a defined assay laboratory and will be referred to as legacy data and is coded as the Moss DH Master Database (MDB).
The principal commercial laboratories, which are independent of the issuer, are ALS Chemex (CHEM), Inspectorate (INSP), and Skyline (SKYL). Samples collected after 2004 have been assayed by these three laboratories and have suitable QA/QC programs. Figure 12.1 shows a breakdown of the assay results by laboratory. Skyline contributes 68% of the assays in the database, while Inspectorate and ALS Chemex contribute 10% and 11% respectively. That is a total of 89% of the assays in the database were carried out by these three independent assay laboratories.
Figure 12.1
Breakdown of the Moss Mine Assays by Laboratory
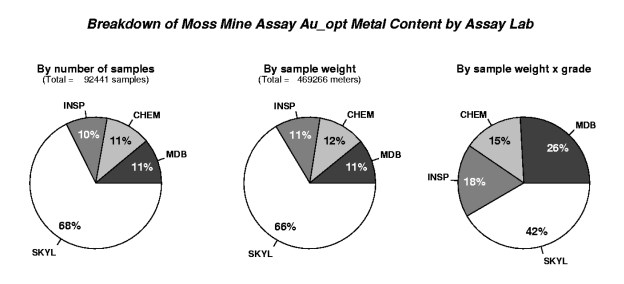
|
Mako Mining Corp. |
There is a total of 1,165 RC, DDH, and PERC drill holes inside the area that define the block model, totalling 465,056.9 ft. The majority of the drill holes in the database are RC holes totalling 372,250 ft in 688 drill holes, followed by PERC holes totalling 29,153 ft in 343 holes, and lastly there are DDH holes totalling 63,654 ft in 134 drill holes. RC drilling represents 79% of the drill hole data in the database, followed by 15% of the drilling by DDH and only 5% of the drilling by PERC. That represents 99% of the database is made of these three drilling methods. Figure 12.2 shows a breakdown of the assay results by drill hole type.
Figure 12.2
Breakdown of the Moss Mine Assays by Drill hole Type
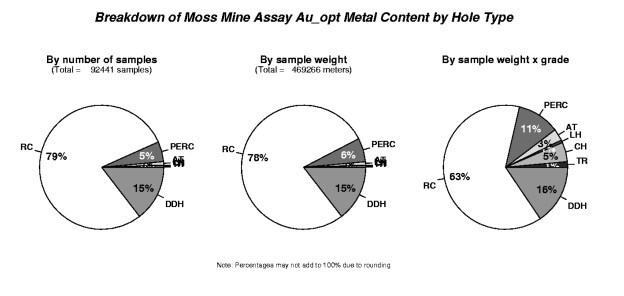
While the drill hole data obtained from IMC for their 2021 Mineral Resource Estimate was previously verified by checking the data entry against selected original laboratory certificates, evaluated the precision by an analysis of duplicate sample assays, evaluated cross contamination by analysis of blank sample assays, evaluated the accuracy of the assays by review of the standard reference material inserted into the sample stream, and evaluated the different sample types, drilling methods, and time periods using a nearest neighbour analysis. The IMC QP found that the drill hole database was sufficiently accurate and precise for use in the estimation of Mineral Resources and Mineral Reserves.
Since the 2021 Mineral Resource Estimate by IMC, there have been an additional 130 drill holes totalling 95,348 ft added to the database. As there are many new drill holes in the database along with the different time periods, drilling methods and assay laboratories, it was felt that additional analysis was required to verify the drill hole database. This was carried out using a series of statistical and graphical summaries to confirm the reliability of the different sample types, using a nearest neighbour approach. As well, there are a series of twin drill holes that will be examined. A spot check of the assay results in the database versus the original signed assay certificates from the independent assay laboratories was also carried out.
In addition to the verification listed above, the drill hole collar elevations were checked against the digital original topography surface file, the down-hole surveys were examined for sudden large deviations that might represent errors in either data entry or data measurement. Any anomalous results were investigated to determine if any results are material to the reliability of the drill hole database.
|
Mako Mining Corp. |
12.2 Review of Drill Hole Collar Elevations
The drill hole collars were compared against the pre-mining surface topography file provided by GVC, "MossMineGO.00t_Surf.msr". Drill hole types of DDH, RC and PERC, as well as only holes drilled prior to mining on the property were considered in this comparison. There is a total of 425 drill holes considered that show an average deviation between the elevation entered in the drill hole database against the pre-mining surface elevation of an average of 3.5 ft. This difference is considered acceptable for this comparison. It is the opinion of the Qualified Person for this section of the report, that the drill hole collar elevations are sufficiently accurate to be considered reliable.
12.3 Review of the Down-Hole Survey Data
The down-hole surveys were examined for sudden changes in azimuth or dip that could represent an error in the survey. There is a total of 8,948 down-hole survey measurements for the 1,625 drill holes. The results of the survey deviation analysis indicated that only 83 measurements exceed the limits, which represents less than one percent of all the surveys. These possible survey issues were examined, and these surveys were found to be acceptable. It is the opinion of the QP for this section of the report, that the down-hole surveys are sufficiently accurate to be considered reliable.
12.4 Validation of Assays
Assay certificate validation of the Skyline Assayers and Laboratories (Skyline) work on the 2021 - 2023 drill hole samples taken after the 2021 Technical Report was undertaken by Qualified Person Gary Wong, P.Eng. The methodology, results and an opinion of the validation is provided below.
Assays from 2021 onwards were provided to Gary Wong, P.Eng., directly by Skyline. The files were provided in comma separated value (csv), Microsoft Excel (xls and xlsx) and Portable Document Format (PDF). The Excel files (xls or xlsc depending on what format was available) were used to create a new database by Doug Roquet of Spatial Engineering, who is independent of Golden Vertex. The results are:
653 assay sheets imported.
15 assay sheets not matched.
53,997 samples matched with drill samples.
The 15 unmatched assays are assumed to be from samples which are not drill core. With this database, a comparison query was created against the merged database used in the estimation (the original DataShed database). A total of 261 samples in the new database did not match the DataShed sample assays. They come from 14 different drill holes. After visual inspection, it was determined that 2 of the holes are from outside of the study area. Removing the samples from these holes leaves 259 samples which have different assays than the DataShed assays.
Table 12.1 shows the distribution of the samples the new database that did not match the DataShed sample assays, by drill hole:
|
Mako Mining Corp. |
Table 12.1
Distribution of the Samples in the New Database that did not Match the DataShed Sample Assays by Drill Hole
|
Hole ID |
In model area |
Values different |
|
AR21-532R_EEXT |
y |
98 |
|
AR22-579R |
y |
1 |
|
AR22-580R |
y |
2 |
|
AR22-567R |
n |
1 |
|
AR22-655R |
y |
68 |
|
AR23-691R |
y |
40 |
|
AR23-692R |
y |
40 |
|
AR23-695R |
y |
1 |
|
AR20-286R |
y |
3 |
|
AR21-548R |
y |
3 |
|
AR20-259R |
n |
1 |
|
AR21-554R |
y |
1 |
|
AR21-555R |
y |
1 |
|
AR22-613R |
y |
1 |
In hole AR21-532R_EEXT, it was discovered that there are 2 sets of assay certificates, one reported in November 2021 and another in December 2021. There is no documentation of why there are 2 sets and what criteria was used to merge the assays. For all the other holes in the study area, there is no evidence of a second set of assays, so the source of the changes is unknown.
For the remaining holes, in the estimated block model, only holes AR22-655R, AR23-692R, AR23-695R, AR21-554R, AR21-555R and AR22-613R are situated where there is significant mineralization. The others were outside of the mineralized zones. Out of these 6 holes, holes AR22-655R and AR23-692R account for 108 of the samples.
Based on the fact that these problem assays account for 0.4% of the total number of new assays, it is concluded that without better evidence to effect changes in the database, the differences are immaterial for the purpose of this study.
12.5 RC Hole Assay Statistical Analysis
There were three methods to assess the reliability of the RC drill holes, statistical analysis of the down-hole trends for contamination (cyclicity and decay analysis), closest pairs analysis between the RC drill hole gold assays and DDH drill hold gold assays, and a review of the twin holes.
The down-hole trend analysis searches for examples where high-grade intercepts may be smeared down hole. This assessment considers looking at sample intervals that show higher grade intercepts at different sample positions in the hole (cyclicity analysis) and searching for high-grade intervals that are smeared down-hole by using the accumulated relative difference (decay analysis). The results of these statistical checks indicates that there is no significant down-hole smearing of the gold grade assays.
|
Mako Mining Corp. |
The closest sample analysis was carried out using all pairs of assays between the RC and DDH that are 10 ft apart. The paired data is then analysed using statistical and graphical summaries. Figure 12.3 shows side-by-side boxplots and summary statistics on the upper left of the figure. The average grades of the RC and DDH gold assays are similar, 0.028 opt Au versus 0.027 opt Au, respectively. The scatterplots at both the arithmetic and logarithmic scale show low correlation, with a rank correlation of 0.336. However, the quantile-quantile plots show that the RC and DDH assays have a similar distribution as the points plot along the 1:1 line (in solid black).
Figure 12.3
Comparison of Closest Pairs between RC and DDH Assays up to 10 Feet Apart
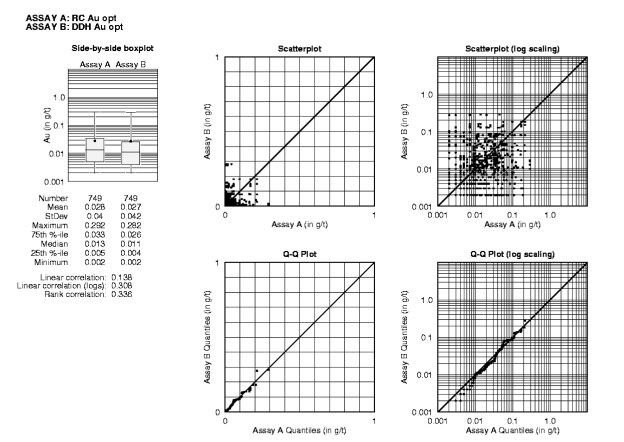
The twin drill hole gold assays were plotted on a down-hole trace and a cumulative grade thickness trace for RC hole (AR-113R) and DDH hole (WW-06). The result of this analysis demonstrates that the RC and DDH holes show sufficiently similar behaviour for the gold assays. Figure 12.4 shows the drill hole trace of RC hole AR-113R and DDH hole WW-06. The average gold grade for the drill holes is shown at the top of drill hole profile plot on the left. The graph on the right shows the cumulative grade thickness (opt * ft) for each of the drill holes. This plot shows that there is similar metal down the hole.
The QP for this section of the report believes that from the results of these statistical and graphical summaries, it appears that the RC and DDH data are sufficiently similar that they can be pooled together and are sufficiently reliable that they can be used for Mineral Resource Estimation.
|
Mako Mining Corp. |
Figure 12.4
Comparison of Twin Holes - AR-113R (RC) versus WW-06 (DDH)
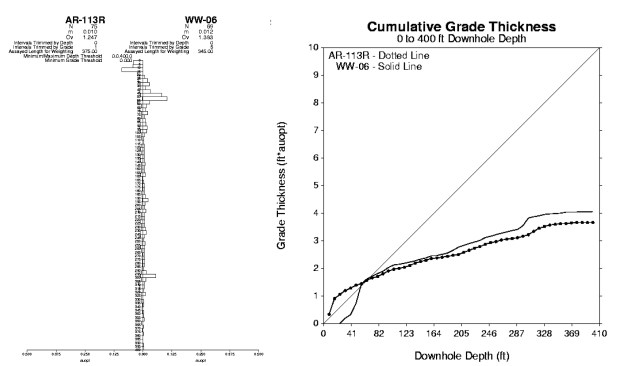
12.6 Percussion Hole Assy Statistical Analysis
There are three methods to assess the reliability of the PERC drill holes, statistical analysis of the down-hole trends for contamination (cyclicity and decay analysis), closest pairs analysis between the RC drill hole gold assays and DDH drill hold gold assays, and a review of the twin holes.
The down-hole trend analysis searches for examples where high-grade intercepts may be smeared down hole. This assessment considers looking at sample intervals that show higher grade intercepts at different sample positions in the hole (cyclicity analysis) and searching for high-grade intervals that are smeared down-hole by using the accumulated relative difference (decay analysis). The results of these statistical checks indicates that there is no significant down-hole smearing of the gold grade assays.
The closest sample analysis was carried out using all pairs of assays between the RC and DDH that are 10 ft apart. The paired data is then analysed using statistical and graphical summaries. Figure 12.5 shows side-by-side boxplots and summary statistics on the upper left of the figure. The average grades of the PERC and DDH gold assays are similar, 0.013 opt Au versus 0.013 opt Au, respectively. The scatterplots at both the arithmetic and logarithmic scale show low correlation, with a rank correlation of 0.623. However, the quantile-quantile plots show that the RC and DDH assays have a similar distribution as the points plot along the 1:1 line (in solid black).
|
Mako Mining Corp. |
Figure 12.5
Comparison of Closest Pairs between PERC and DDH Assays up to 10 Feet Apart
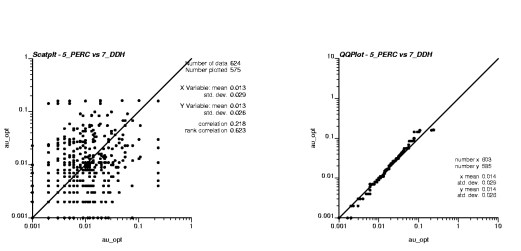
The twin drill hole gold assays were plotted on a down-hole trace and a cumulative grade thickness trace for DDH hole (AR-164C) and PERC hole (3_00B). The result of this analysis demonstrates that the PERC and DDH holes show sufficiently similar behaviour for the gold assays. Figure 12.6 shows the drill hole trace of DDH hole AR-164C and PREC hole 3_00B. The average gold grade for the drill holes is shown at the top of drill hole profile plot on the left. The graph on the right shows the cumulative grade thickness (opt * ft) for each of the drill holes. This plot shows that there is similar metal down the hole.
Figure 12.6
Comparison of Twin Holes - AR-163C (DDH) versus 3_00B (PERC)
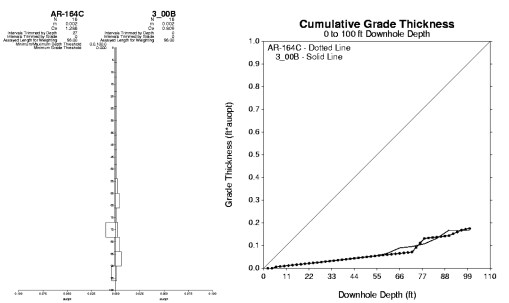
|
Mako Mining Corp. |
The QP for this section of the report believes that from the results of these statistical and graphical summaries, it appears that the PERC and DDH data are sufficiently similar that they can be pooled together and are sufficiently reliable that they can be used for Mineral Resource Estimation.
12.7 Comparison of Assays by Laboratory
The closest sample analysis was carried out using all pairs of assays between the four different assay sources, the Moss Mine Master Database (MDB), ALS Chemex (Chemex), Inspectorate (Inspectorate) and Skyline (Skyline) that are 10 ft apart. The paired data is then analysed using statistical and graphical summaries.
Figure 12.7 shows a comparison of the MDB assays versus the Inspectorate assays as a scatterplot using a log-log scale with the summary statistics on the lefthand side of the figure and as a quantile-quantile plot, with the 1:1 line shown as a solid black line, in the righthand side of the figure. The mean grades are somewhat different, but there is a good rank correlation between the assay pairs at 0.705. The QQ plot shows that the points are situated close to the 1:1 line, meaning the gold assays have a similar distribution.
Figure 12.7
Comparison of Assay Pairs 10 Feet Apart for MDB versus Inspectorate
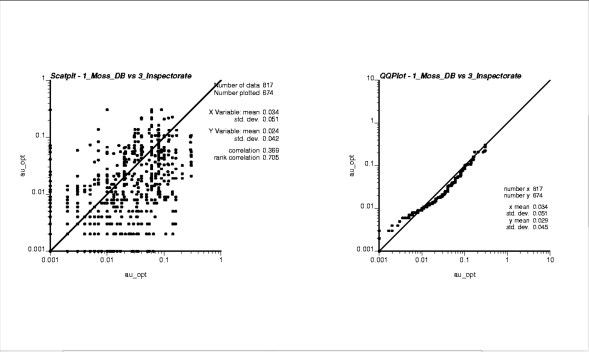
Figure 12.8 shows a comparison of the Chemex assays versus the Inspectorate assays as a scatterplot using a log-log scale with the summary statistics on the lefthand side of the figure and as a quantile-quantile plot, with the 1:1 line shown as a solid black line, in the righthand side of the figure. The mean grades are similar and there is a good rank correlation between the assay pairs at 0.556. The QQ plot shows that the points are situated close to the 1:1 line, meaning the gold assays have a similar distribution.
|
Mako Mining Corp. |
Figure 12.8
Comparison of Assay Pairs 10 Feet Apart for Chemex versus Inspectorate
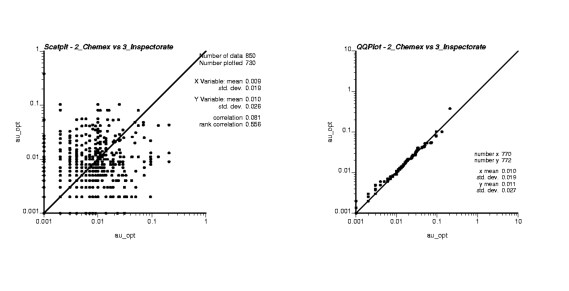
Figure 12.9 shows a comparison of the Chemex assays versus the Skyline assays as a scatterplot using a log-log scale with the summary statistics on the lefthand side of the figure and as a quantile-quantile plot, with the 1:1 line shown as a solid black line, in the righthand side of the figure. The mean grades are similar and there is a good rank correlation between the assay pairs at 0.624. The QQ plot shows that the points are situated close to the 1:1 line, meaning the gold assays have a similar distribution.
Figure 12.9
Comparison of Assay Pairs 10 Feet Apart for Chemex versus Skyline
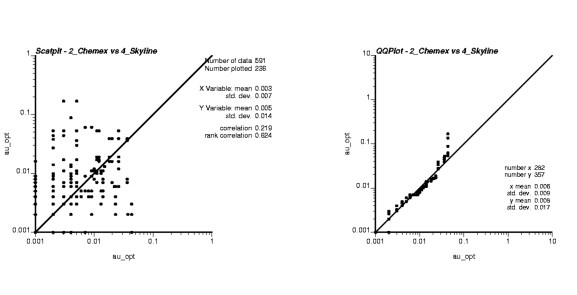
|
Mako Mining Corp. |
The QP for this section of the report is of the opinion, that based on these statistical and graphical summaries, that the assays from the various independent laboratories are sufficiently similar that they can be pooled together for use in the estimation of mineral resources.
12.8 Independent Verification Samples
During the site visit to the Moss Mine Project, independent verification samples were collected by Mr. Gary Wong, P.Eng., who meets the definition of a QP as defined by NI 43-101. Mr. Wong collected 26 pulp samples, from drilling carried out in 2021 and 2022 by Golden Vertex and that were assayed by Skyline Laboratories of Tucson, Arizona, USA (Figure 12.10). These data verification samples help to establish the integrity and accuracy of the data that will be used for the estimation of mineral resources.
The 26 pulp samples were submitted to Skyline Laboratories and were assayed using the FA-03 methodology, that uses a fire assay with a gravimetric finish and a range of 0.03 to 1,000 g/t. The independent sample assay results were paired with the information for the same samples in the Moss Mine drill hole database and statistical and graphical summaries were used to assess the results.
Figure 12.10
Photograph of Sample Pulps Submitted for Assay to Skyline Laboratories

There are a total of 26 re-assay results, 8 of which are above the acceptance criteria. That is there are 8 failures and represents a failure rate of 30%, which is outside the acceptable range for duplicate samples (Figure 12.11). While the linear correlation looks strong, this is due to the high-grade sample pair, which have similar assay grades. The results of this analysis indicate that there is a high degree of variability in the gold content of the samples. Therefore, with a limited number of assay results (26) there are likely not enough assays to produce meaningful results using this statistical approach. With only 26 assays we should look to see if the global means of the two sample assay data sets are similar. This can be done using a two-sample t-test.
|
Mako Mining Corp. |
The two-sample t-test considers the original assays as one set of samples and the re-assays as another set of samples from the same statistical population. The t-test checks to see whether the difference between the two means is significant or not. The t-test calculation is given as follows were, m represents the average, and s represents the standard deviation, and n the number of samples.
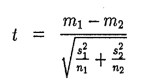
The t-statistics is 0.42, which is well inside the -2 to +2 acceptance criteria, meaning that there is no significant difference between the average grades of the two assay data sets.
While there is significant variability between the original and re-assay results, there does not appear to be a significant difference between the means of the two assay data sets. Therefore, the QP for this section of the report believes that the re-assays appear to be sufficiently similar to the to the original assays and support the reliability of the assay results in the drill hole database.
Figure 12.11
Pass/Fail Graph for Duplicate Sample Assays
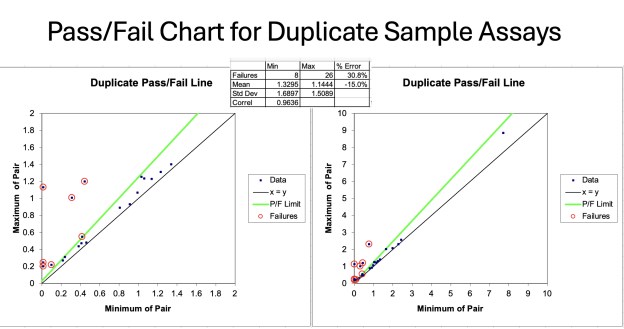 |
| C. Keech, CGK Consulting Services, 2025. |
12.9 Qualified Person Site Inspection
Qualified Person Gary Wong, P.Eng., visited the site between July 14 to July 16. Mr. Wong is the principal consulting geologist for PDM Technical Services Ltd. He is independent of Mako. During this visit, the open pit areas, the leach pad, the mine office, the core logging facilities, and the core and sample storage areas were toured. A number of holes representative of the different zones were also visited, as well as core photographs of other zones which were not readily accessible. Finally, the three-dimensional models of the mineralized zones were reviewed with the Mako staff.
|
Mako Mining Corp. |
12.10 Qualified Person Opinion
The Qualified Persons for this section of the report are of the opinion that based on the site visit, the results of the independent verification samples and the various studies using statistical and graphical summaries that the database has been developed in accordance with industry standards and practices, and that the data is sufficiently accurate to be considered reliable and suitable for use for mineral resource estimation. The Qualified Persons are also of the opinion that the database is representative and adequate to support the estimation of mineral resources for the Moss Mine Project.
|
Mako Mining Corp. |
13.0 MINERAL PROCESSING AND METALLURGICAL TESTING
13.1 Introduction
The metallurgical testwork and operating results for the Moss Mine Project have been reviewed by Richard Gowans P.Eng., a Principal Metallurgist with Micon International and a Qualified Person.
The process used at the Moss Mine comprises crushing to 90% passing 6.3 mm (¼ inch) and conventional valley fill heap leaching. Gold and silver are extracted from pregnant solution using a Merrill Crowe plant (zinc cementation) and the precipitate from this process is dried, mixed with fluxes and fed to a furnace to produce gold-silver doré bars, the final product of the metallurgical processing facility. The design capacity of the process plant is 5,500 short tons per day.
13.2 Metallurgical Testwork
Metallurgical testing completed prior to this reporting period is documented in earlier NI 43-101 technical reports, including "NI 43-101 Technical Report Preliminary Economic Analysis Phase III, Mine Life Extension, Mohave County, Arizona" dated November 22, 2017, and "Technical Report on the Mineral Resource, Mineral Reserve, and Mine Plan for the Moss Mine" dated October 8, 2021.
Metallurgical testwork forms the basis for evaluating heap leach performance, defining recovery expectations, and identifying potential processing risks. At the Moss Mine, Golden Vertex Corp. (GVC) has implemented an ongoing metallurgical program consisting primarily of bottle roll and column leach tests conducted on representative crushed ore samples. These tests are designed to replicate operating conditions at the mine and provide data for recovery forecasting, reagent consumption, and leach kinetics.
Mine Technical Services Ltd. (MTS) independently reviewed column leach and bottle roll test data generated between July, 2020 and May, 2023, along with the associated standard operating procedures used by the Moss Mine team. MTS prepared a memorandum presenting the results of their metallurgical accounting review for the period from January 1, 2023, to December 31, 2023, and their findings have been incorporated into this section.
13.2.1 Historical Testwork
Column leach testing reported in the "Technical Report on the Mineral Resource, Mineral Reserve, and Mine Plan for the Moss Mine" dated October 8, 2021, was conducted on monthly composite samples collected from the crushing plant and considered representative of material placed on the heap leach pads. Gold recoveries ranged from approximately 72% to 94%, with an average of about 80%, while silver recoveries ranged from approximately 21% to 60%, averaging about 43%. Recoveries were calculated using back-calculated head grades and reflect laboratory-scale performance.
The report further recommended applying typical scale-up discount factors of approximately 3% to 5% to account for operational inefficiencies in full-scale heap leach operations, resulting in estimated gold recoveries of approximately 75% to 77% and silver recoveries of approximately 40% to 43%. Although silver recoveries may increase with extended leach cycles, the additional solution volumes required to achieve materially higher recoveries may not be economically justified.
|
Mako Mining Corp. |
The October 8, 2021 NI 43-101 Technical Report recommended that ongoing metallurgical testing be conducted to confirm recoveries for future production material and to further evaluate mineralogy, size-by-size recovery, deleterious elements, crush size, and the relationship between grade and recovery. This work was advised to support reliable recovery projections as mining progresses to lower-grade material and to ensure that metallurgical performance assumptions remain valid over the life of mine.
13.2.2 2023 Testwork
The metallurgical testwork results discussed below are based on the Mine Technical Services Ltd. (MTS) memorandum dated January 31, 2024, entitled "Moss Mine 2023 Year-End Metallurgical Accounting Review."
Column leach and bottle roll testing programs provide the primary basis for evaluating heap leach metallurgical performance and identifying recovery constraints at the Moss Mine. GVC conducts bottle roll tests on a weekly basis and column leach tests on a monthly basis using representative crushed ore samples, approximately P90 of 6.5 mm (1/4-inch), collected from the crushing circuit. MTS reviewed column leach test results generated between July, 2020 and May, 2023, along with associated standard operating procedures (SOPs), to assess the reliability of metallurgical performance projections and their applicability to commercial heap leach operations.
Monthly composite column samples were prepared using as-received crush sizes and were leached under cyanide concentrations and irrigation rates consistent with operating conditions. Although the nominal leach cycle specified in the Standard Operating Procedure (SOP) was 150 days, test durations may may been extended based on leach kinetics; however, most columns were terminated prior to complete leaching. As a result, ultimate recoveries achieved under extended leach conditions may have exceeded those reported from laboratory testing. Gold recoveries from monthly column tests conducted during 2020-2021, as reported in the MTS memorandum, ranged from approximately 54.6% to 88.2%. Table 13.1 summarizes selected column leach testwork results for gold recovery available as of January, 2024.
The table indicates an average gold recovery of 73.6% after around 107 days of leaching, with recovery values ranging between approximately 66% and 80%.
Gold leach kinetics observed during column testing were characteristic of ores containing both fully liberated gold and partially encapsulated gold. A substantial proportion of gold was leached early in the cycle, followed by a prolonged period of slower recovery controlled by diffusion processes. This behaviour indicates that finer crushing and longer leach cycles are probably beneficial to maximizing gold recovery, which was consistent with performance observed on the commercial heap leach pad. Six-month averages of gold recovery for composite samples have remained relatively stable since October 2020, ranging between approximately 70% and 74.7%, and are consistent with historical test results and commercial operating performance.
Silver recoveries have exhibited substantially greater variability than gold, ranging from approximately 12% to 60% in column tests, with an average of approximately 27.5% since October, 2020. Table 13.2 summarizes the selected column leach testwork results for silver recovery available as of January, 2024.
|
Mako Mining Corp. |
Table 13.1
Moss Monthly Column Test Gold Data 2022 and 2023
| Composite Sample | Head Au | Solution/ Ore Ratio |
Days under Leach |
Recovery Au, % |
|
| g/t | opt | ||||
| June, 2022 (Col 56) | 0.48 | 0.0141 | 9.68 | 124 | 69.67 |
| July, 2022 (Col 57) | 0.57 | 0.0165 | 7.13 | 124 | 66.44 |
| August - September 2022 (Col 60) | 0.57 | 0.0167 | 8.64 | 125 | 69.31 |
| August - September 2022 (Col 61) | 0.54 | 0.0158 | 3.76 | 126 | 69.98 |
| September - October 2022 (Col 62) | 0.40 | 0.0116 | 7.40 | 118 | 70.24 |
| November, 2022 (Col 63) | 0.46 | 0.0133 | 8.57 | 114 | 77.41 |
| December, 2022 (Col 64) | 0.53 | 0.0156 | 5.75 | 114 | 77.51 |
| January, 2023 (Col 65) | 0.47 | 0.0136 | 5.21 | 107 | 70.78 |
| February, 2023 (Col 66) | 0.49 | 0.0142 | 8.16 | 164 | 80.03 |
| March, 2023 (Col 67) | 0.26 | 0.0075 | 5.94 | 128 | 76.59 |
| April, 2023 (Col 68) | 0.40 | 0.0117 | 6.77 | 128 | 76.73 |
| May, 2023 (Col 69) | 0.53 | 0.0154 | 6.91 | 110 | 77.50 |
| June, 2023 (Col 70) | 0.40 | 0.0116 | 12.12 | 127 | 76.87 |
| Period Average | 73.77 | ||||
Table 13.2
Moss Monthly Column Test Silver Data 2022 and 2023
| Composite Sample | Head Ag | Solution/ Ore Ratio |
Days under Leach |
Recovery Ag, % |
|
| g/t | opt | ||||
| June, 2022 (Col 56) | 12.58 | 0.367 | 9.68 | 124 | 16.18 |
| July, 2022 (Col 57) | 13.57 | 0.396 | 7.13 | 124 | 16.67 |
| August - September 2022 (Col 60) | 8.48 | 0.247 | 8.64 | 125 | 29.25 |
| August - September 2022 (Col 61) | 7.23 | 0.211 | 3.76 | 126 | 32.97 |
| September - October 2022 (Col 62) | 7.45 | 0.217 | 7.40 | 118 | 26.73 |
| November, 2022 (Col 63) | 10.66 | 0.311 | 8.57 | 114 | 48.12 |
| December, 2022 (Col 64) | 6.85 | 0.200 | 5.75 | 114 | 25.56 |
| January, 2023 (Col 65) | 8.22 | 0.240 | 5.21 | 107 | 24.12 |
| February, 2023 (Col 66) | 10.87 | 0.317 | 8.16 | 164 | 18.89 |
| March, 2023 (Col 67) | 7.96 | 0.232 | 5.94 | 128 | 18.37 |
| April, 2023 (Col 68) | 17.92 | 0.523 | 6.77 | 128 | 12.38 |
| May, 2023 (Col 69) | 24.32 | 0.709 | 12.12 | 108 | 33.55 |
| June, 2023 (Col 70) | 7.76 | 0.226 | 12.12 | 127 | 32.72 |
| Period Average | 25.23 | ||||
The causes of this variability have not been conclusively identified, introducing uncertainty into silver recovery forecasting and reconciliation. In contrast to gold, silver exhibits minimal early-stage leaching and is characterized by a prolonged slow leach phase, with recoveries continuing to increase at the time many column tests were terminated. This behaviour suggests that silver extraction is significantly more time- and solution-intensive than gold extraction and that practical operating constraints may limit achievable recoveries.
Despite this variability, silver recoveries from column testing summarized in Table 13.2 are generally consistent with recoveries observed in commercial heap leach operations.
|
Mako Mining Corp. |
13.2.3 2025 Testwork
No off-site metallurgical test programs were conducted by GVC in 2025. All metallurgical work during 2025 was performed on site and consisted of monthly crushed-ore column leach tests, initiated in October 2025 and continuing through the date of this report.
Recent metallurgical testing has primarily focused on assessing the metallurgical response of monthly composites taken from the crushing plant through column leach tests. The test work has been performed by site personnel and the associated assaying has been performed at the on-site assay facility.
To date, no deleterious elements have been observed in the ore processed at the Moss Mine, and their impact on metallurgical recovery has not been identified.
13.3 Production Reconciliation
This section presents a production reconciliation for the Moss Mine based on operational data provided by the GVC. The analysis primarily relies on information compiled in the Excel file "ProductionV10 (Protected) 02022026", which includes daily reports, ore placement records, and metal production data from the Merrill-Crowe plant. The variables used in this assessment, including placed gold and silver ounces and plant-recovered metal for both metals, have been reviewed for completeness and consistency and are considered robust for the purpose of evaluating metallurgical performance. The primary objective of this section is to compare observed recovery factors for gold and silver at the operating mine. Recovery factors are derived by comparing the amount of gold and silver placed on the leach pads with the metal produced by the Merrill-Crowe plant, as recorded in the daily reports. The consistency of reporting, cross-checks with monthly production summaries, and the volume of historical operational data support the reliability of the inputs used in this reconciliation.
13.3.1 Operational Gold Recovery Performance
Figure 13.1 shows the Moss Mine performance based on gold placed on the leach pads versus gold recovered at the Merrill-Crowe plant over the period from 2018 to the end of Q2 2024.
The data series demonstrate good correlation, and the trend line has a coefficient of approximately 0.75, suggesting an operational recovery factor of around 75%.
Another factor to consider is the recoverable gold inventory, which is relatively stable and estimated to be below 16,000 ounces; this estimate is based on the provided operational data and the findings reported by MTS in their memorandum dated January 31, 2024, entitled "Moss Mine 2023 Year-End Metallurgical Accounting Review." Accounting for this inventory could increase the estimated ultimate metallurgical recovery by approximately 1 to 2 percentage points.
|
Mako Mining Corp. |
Figure 13.1
Cumulative Operational Performance Data for Gold
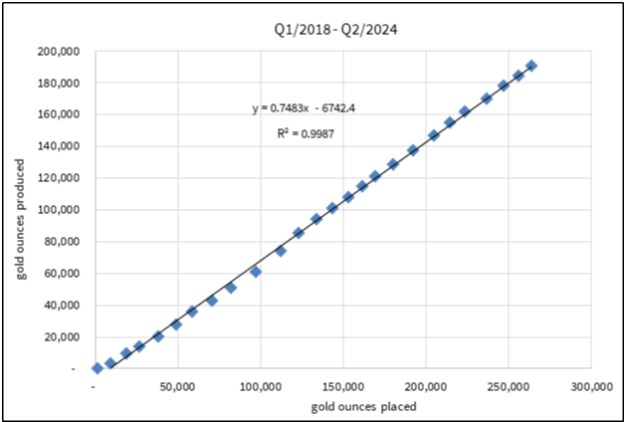
13.3.2 Operational Silver Recovery Performance
Figure 13.2 shows the Moss Mine performance based on silver ounces placed on the leach pads versus silver ounces recovered at the Merrill-Crowe plant over the period from 2018 to the end of October 2024.
The data series demonstrate a reasonable correlation, and the trend line has a coefficient of approximately 0.40, suggesting an operational recovery factor of around 40%.
Another factor to consider is the recoverable silver inventory, which is relatively stable and estimated to be below 230,000 ounces; this estimate is based on the provided operational data and the findings reported by MTS in their memorandum dated January 31, 2024, entitled "Moss Mine 2023 Year-End Metallurgical Accounting Review." Accounting for this inventory could increase the estimated ultimate metallurgical recovery by approximately 1 percentage point.
|
Mako Mining Corp. |
Figure 13.2
Cumulative Operational Performance Data for Silver
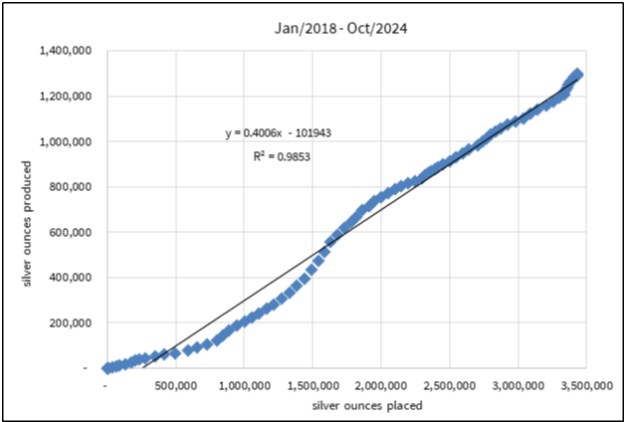
13.4 Conclusions and Recommendations
Overall, the column leach test results demonstrate consistent gold recoveries and stable leach kinetics that are representative of commercial heap leach performance at the Moss Mine. The Moss Mine has been in operation since 2018 and has generated a substantial body of operating data, supplemented by ongoing column leach and bottle roll testwork, which together provide a strong empirical basis for projecting metallurgical recoveries. While silver recoveries remain more variable and generally lower, the results support the metallurgical recovery assumptions used in production forecasting.
Based on the testwork described above and the received operational data, the Qualified Person (QP) recommends using the following gold recoveries for this Technical Report.
Table 13.3
Recommended Metals Recoveries
|
Process Criterion |
Gold |
Silver |
|
Process Recovery, % |
75 |
40 |
|
Mako Mining Corp. |
It should be noted that future metallurgical recoveries may differ if the characteristics of the run-of-mine ore, including grade, mineralogy, or the presence of deleterious elements, vary from the material represented in the current operational dataset. Ongoing assessment of the relationship between ore characteristics and metal recovery will help ensure that recovery assumptions remain valid under changing ore characteristics. Continued monitoring and periodic metallurgical testing are recommended to confirm recovery performance, refine scale-up factors, and improve confidence in long-term gold and silver recovery projections.
It is recommended that further testing be undertaken at a metallurgical laboratory and that the test program include the following:
It is recommended that a statistical analysis be performed to define the relationship between bottle roll test results and column leach recoveries for both gold and silver. This analysis should consider the different ore types expected to be processed at the Moss Mine, including variations in grade, mineralogy, and particle size. Establishing such correlations will enable the mine to better forecast metal recoveries from early-stage bottle roll tests, support operational planning, optimize heap construction and leach cycles, and improve reagent management.
Selected column tests should be leached to completion beyond the nominal period to determine ultimate recoveries for gold and silver. Complete column tests will provide more accurate data for scale-up to commercial operations, support reconciliation of actual versus projected recoveries, and improve confidence in metallurgical assumptions used for production forecasting.
Given variability observed in silver recoveries, further testwork is recommended to better understand the factors controlling silver extraction. This may include extended leach tests, detailed mineralogical characterization, and correlation with ore types. Improved understanding of silver recovery kinetics will enhance reconciliation accuracy and support operational planning for reagent use, solution management, and heap leach performance optimization.
|
Mako Mining Corp. |
14.0 MINERAL RESOURCE ESTIMATES
14.1 Introduction
The mineral resource estimate was carried out by Chris Keech, P.Geo., Principal Geologist of CGK Consulting Services Inc (CGK) using MineSight® version 15.4 software for the development of the block model gold and silver block grade estimates and Geostokos Toolkit® for variography analysis of the composited gold and silver grades. Mr. Keech is a Qualified Person and is independent of Mako as defined by NI 43-101.
The mineral resources estimate for the Moss Mine Project has been carried out in accordance with the CIM's "Estimation of Mineral Resources and Mineral Reserves Best Practice Guidelines" (November 2019). The mineral resources have been generated from drill hole data the interpretation of a geological model that identifies the spatial distribution of the gold and silver grades. The interpolation parameters have been defined based on the drill hole data and the geological interpretation and geostatistical analysis of that data.
The mineral resources have been classified by proximity to data locations and the quality of the data and have been reported in accordance with CIM's "Standards on Mineral Resources and Reserves" (May 2014) as required by NI 43-101.
14.2 Drill Hole Database
The drill hole data inside the block model area consists of 1,169 drill holes totalling 452,086 ft of drilling with 87,471 sample intervals. RC drilling has contributed more than 55% of the drill holes and more than 81% of the sample intervals to the drill hole database inside the block model limits. Next are the core drill holes, which have contributed 11% of the holes and 12% of the sample intervals. The remaining 33% of the drill holes are short rotary holes which account for 6% of the sample intervals. Table 14.1 summarizes the drilling by year and drilling type.
Table 14.1
Summary of Drill Hole Database inside Block Model Limits
| Air Track Holes (AT) |
Percussion Holes (PERC) |
Reverse Circulation Holes (RC) |
Core Holes (DDH) |
Total | ||||||
| Year | No. of Holes |
No. of Assays |
No. of Holes |
No. of Assays |
No. of Holes |
No. of Assays |
No. of Holes |
No. of Assays |
No. of Holes |
No. of Assays |
| 1982 | 54 | 867 | 3 | 234 | 57 | 1,101 | ||||
| 1990 | 21 | 1,385 | 21 | 1,385 | ||||||
| 1991 | 28 | 2,351 | 28 | 2,351 | ||||||
| 1992 | 3 | 500 | 3 | 500 | ||||||
| 1993 | 17 | 540 | 17 | 540 | ||||||
| 1996 | 30 | 1,644 | 6 | 349 | 36 | 1,993 | ||||
| 2004 | 35 | 1,509 | 35 | 1,509 | ||||||
|
Mako Mining Corp. |
| Air Track Holes (AT) |
Percussion Holes (PERC) |
Reverse Circulation Holes (RC) |
Core Holes (DDH) |
Total | ||||||
| Year | No. of Holes |
No. of Assays |
No. of Holes |
No. of Assays |
No. of Holes |
No. of Assays |
No. of Holes |
No. of Assays |
No. of Holes |
No. of Assays |
| 2005 | 7 | 452 | 7 | 452 | ||||||
| 2007 | 6 | 329 | 6 | 329 | ||||||
| 2009 | 6 | 217 | 6 | 217 | ||||||
| 2011 | 72 | 5,642 | 10 | 517 | 82 | 6,159 | ||||
| 2012 | 333 | 4,670 | 38 | 2,461 | 371 | 7,131 | ||||
| 2013 | 35 | 2,409 | 35 | 2,409 | ||||||
| 2017 | 3 | 146 | 3 | 146 | ||||||
| 2019 | 29 | 2,808 | 29 | 2,808 | ||||||
| 2020 | 130 | 13,411 | 6 | 880 | 136 | 14,291 | ||||
| 2021 | 149 | 23,283 | 23 | 2,934 | 172 | 26,217 | ||||
| 2022 | 81 | 13,826 | 81 | 13,826 | ||||||
| 2023 | 25 | 2,806 | 25 | 2,806 | ||||||
| 2024 | 19 | 1,301 | 19 | 1,301 | ||||||
| Total: | 54 | 867 | 333 | 4,670 | 649 | 71,692 | 133 | 10,242 | 1,169 | 87,471 |
14.3 Geological Model
The Geological Block Model was constructed based on four wireframe solids that represent the Stockwork mineralization, the Moss Vein, the Ruth Vein and a higher-grade Reynolds Stockwork mineralization. This interpretation was developed by Mr. Gary Wong, P.Eng of PDM Technical Services Ltd. on Northwest facing cross-section. In addition to these wireframe solids, two surfaces were also considered, one representing the Canyon fault and the other representing the geological contact between the Intrusive rocks in the east with the Volcanic rocks in the west.
This geological interpretation was used to code the block model and develop 10 geological domains. Figure 14.1 displays a plan view of the geological model with the 10 geological domains. Figure 14.2 displays a northwest facing vertical cross-section at 6,000 ft northwest (NW). The dip of the Moss and Ruth Veins, along with the dip of the Stockwork can be seen.
The Stockwork mineralization has been divided into three domains, East Stockwork Intrusive, West Stockwork Intrusive and Volcanic Stockwork Intrusive. Inside the East Stockwork, lies the Ruth and Moss Veins. The Moss Vein dips steeply to the south, while the Ruth Vein dips moderately to the north. Both veins are enveloped by the Stockwork style mineralization.
The drill hole assays were coded using the block model to assign the geological codes that were used to carry out the Exploratory Data Analysis and Variography.
|
Mako Mining Corp. |
Figure 14.1
Plan View of the Geological Domains
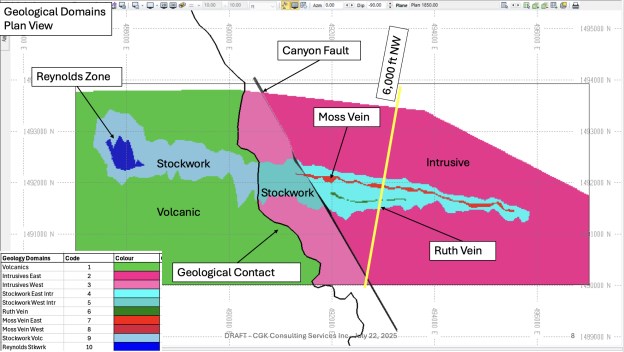 |
| C. Keech, CGK Consulting Services, 2025. |
Figure 14.2
Sectional View at 6,000 ft Northwest of the Geological Domains
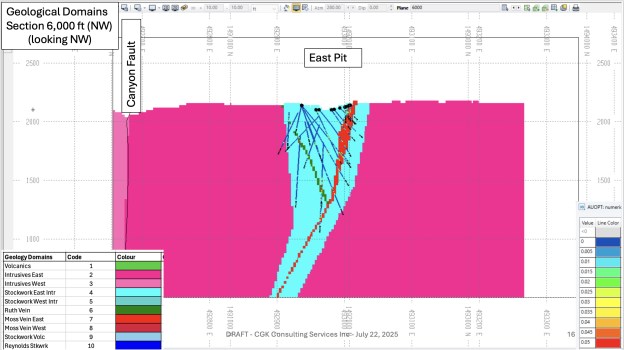 |
| C. Keech, CGK Consulting Services, 2025. |
 |
Mako Mining Corp. |
14.4 Exploratory Data Analysis
Statistical and graphical summaries of the gold and silver grades were produced to understand the distribution of the grades in the deposit. The statistical and graphical summaries include histograms, log-probability plots, side-by-side boxplots, scatterplots, decile analysis plots and contact plots. The assays were separated by mineralised zone to examine the distribution of the gold and silver assay grades. The results of this analysis were used to develop the estimation parameters.
14.4.1 Assays
The assay sample lengths vary from 0.01 ft to 12 ft, with the most common length being 5 ft in length (87% of the data). There are shorter sample intervals that have some high-grade intercepts, which indicates that some samples were taken under geological control, not just at regular 5 ft. Therefore, the outlier assessment and grade capping will be carried out on the composited or regularized data.
There are some sample intervals that have not been assayed, that is they have been given a missing data code of -1.0. These intervals are thought to be low-grade and assaying this material was not required. The approach to infilling these missing sample intervals was to take the average of the assays above and below the sample interval with the missing assay. This adjustment affected 125 sample intervals for gold. There were an additional 845 sample intervals for gold that were assigned a grade of zero, to ensure that when composites are made, there is no smearing of the assays into the un-assayed material. There are still 434 intervals that are missing gold grades and 2,274 intervals that are missing silver grades. Table 14.2 shows a breakdown of the treatment of the sample intervals that are missing assays.
There are minor changes to average grades of the gold and silver assays with the treatment of the missing or un-assayed sample intervals. Tables 14.3 and 14.4 present the summary statistics before and after the treatment of the missing sample intervals.
Table 14.2
Treatment of Missing Sample Intervals
| Database Flag | Au Intervals | Ag Intervals | Description |
| -1 | 86,067 | 84,179 | No changes |
| 0 | 434 | 2,274 | Remains as original value (missing) |
| 1 | 125 | 147 | Infilled with neighbours |
| 2 | 845 | 871 | Assigned a zero grade |
| Total | 87,471 | 87,471 |
|
Mako Mining Corp. |
Table 14.3
Summary Statistics for Original and In-filled Sample Intervals for Gold
| AU (OPT) | AU1 (OPT) | Differences | |||||||
| Domain | No of Data |
Average | CV | No of Data |
Average | CV | No of Data |
% Diff Avg |
% Diff CV |
| 1_Volc | 5,814 | 0.0014 | 4.6878 | 5,849 | 0.0014 | 4.7202 | 35 | 0.0% | 0.7% |
| 2_E_Intr | 5,722 | 0.0008 | 6.7860 | 5,982 | 0.0007 | 7.1661 | 260 | -12.5% | 5.6% |
| 3_W_Intr | 1,421 | 0.0007 | 2.1376 | 1,423 | 0.0006 | 2.1403 | 2 | -14.3% | 0.1% |
| 4_E_Stkwrk | 36,896 | 0.0047 | 3.2237 | 37,433 | 0.0044 | 3.3059 | 537 | -6.4% | 2.5% |
| 5_W_Strkwrk | 15,710 | 0.0068 | 1.7266 | 15,809 | 0.0067 | 1.7366 | 99 | -1.5% | 0.6% |
| 6_Ruthvn | 521 | 0.0281 | 3.6612 | 522 | 0.0262 | 3.7959 | 1 | -6.8% | 3.7% |
| 7_Mossvn_E | 4,805 | 0.0310 | 1.6461 | 4,821 | 0.0296 | 1.6959 | 16 | -4.5% | 3.0% |
| 8_Mossvn_W | 87 | 0.0055 | 0.8478 | 87 | 0.0055 | 0.8478 | 0 | 0.0% | 0.0% |
| 9_Volc_Stkwrk | 12,465 | 0.0057 | 1.5761 | 12,483 | 0.0057 | 1.5764 | 18 | 0.0% | 0.0% |
| 10_Reyn_Stkwrk | 2,691 | 0.0098 | 0.9659 | 2,693 | 0.0098 | 0.9672 | 2 | 0.0% | 0.1% |
Table 14.4
Summary Statistics for Original and In-filled Sample Intervals for Silver
| AG (OPT) | AG1 (OPT) | Differences | |||||||
| Domain | No of Data |
Average | CV | No of Data |
Average | CV | No of Data |
% Diff Avg |
% Diff CV |
| 1_Volc | 5,552 | 0.0180 | 4.0500 | 5,587 | 0.0180 | 4.0790 | 35 | 0.0% | 0.7% |
| 2_E_Intr | 5,722 | 0.0220 | 3.4700 | 5,982 | 0.0200 | 3.6720 | 260 | -9.1% | 5.8% |
| 3_W_Intr | 1,421 | 0.0120 | 2.1530 | 1,423 | 0.0120 | 2.1550 | 2 | 0.0% | 0.1% |
| 4_E_Stkwrk | 36,710 | 0.0650 | 6.8350 | 37,299 | 0.0620 | 6.9720 | 589 | -4.6% | 2.0% |
| 5_W_Strkwrk | 15,087 | 0.0730 | 2.0620 | 15,177 | 0.0730 | 2.0670 | 90 | 0.0% | 0.2% |
| 6_Ruthvn | 521 | 0.2670 | 3.7910 | 522 | 0.2500 | 3.9300 | 1 | -6.4% | 3.7% |
| 7_Mossvn_E | 4,670 | 0.3790 | 1.7220 | 4,691 | 0.3620 | 1.7720 | 21 | -4.5% | 2.9% |
| 8_Mossvn_W | 87 | 0.0270 | 1.3530 | 87 | 0.0270 | 1.3530 | 0 | 0.0% | 0.0% |
| 9_Volc_Stkwrk | 12,001 | 0.0490 | 2.2230 | 12,019 | 0.0490 | 2.2230 | 18 | 0.0% | 0.0% |
| 10_Reyn_Stkwrk | 2,444 | 0.0580 | 1.6930 | 2,446 | 0.0580 | 1.6950 | 2 | 0.0% | 0.1% |
14.4.2 Composites
Analysis of the samples lengths shows that 87% of the assays inside the block model area are 5 ft in length. Compositing the drill hole assay intervals provide a common sample support for the estimation algorithm. The selected bench height for the block model is 20 ft and often a half bench height (10 ft) is a good choice for a composite length, as there is some variance reduction, but not too much, and there is a reduction in the number of data to be used by the estimation algorithm. Therefore, a 10 ft composite length was chosen for the estimation of gold and silver grades. The compositing started at the collar of the hole and proceeded at 10 ft regular intervals down the drill holes.
|
Mako Mining Corp. |
Figure 14.3 displays a side-by-side box plot of the gold grades that have been composited to 10 ft lengths by geological domain.
Figure 14.4 displays a side-by-side box plot of the silver grades that have been composited to 10 ft lengths by geological domain.
Figure 14.3
Ten Foot Composite Summary Statistics for Gold Grade by Domain
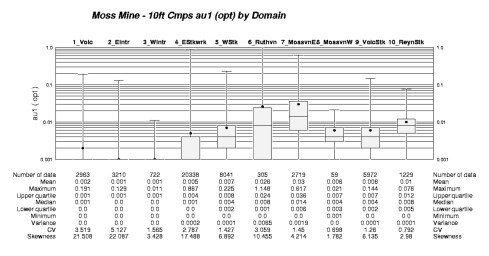
Figure 14.4
Ten Foot Composite Summary Statistics for Silver Grade by Domain
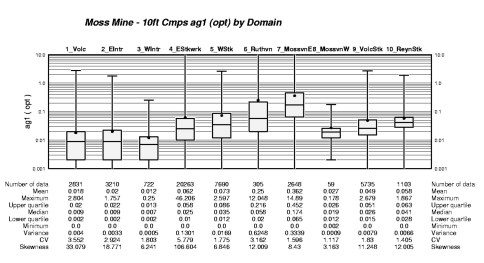
|
Mako Mining Corp. |
14.4.3 Grade Capping
The assessment of outlier values, that might require adjustment, or capping was carried out using statistical and graphical summaries, including log-probability plots, and decile analysis. A series of possible capping thresholds were considered using the following criteria:
All assays greater than the standard deviation, plus the mean value, are reduced to the sum of the standard deviation, plus the mean value.
All assays greater than four or five times the mean value are reduced to four or five times the mean value.
All assays greater than the value at which a ragged tail begins on the log probability plot are reduced to that value.
Decile analysis, reduce all assays from percentiles with more than 10% of the total metal value to the highest value of the next lowest percentile.
For decile analysis, after I.S. Parish, 1997, recommends the following criteria to establish a capping threshold.
If the top decile has more than 40% of the metal, cutting the high assays may be warranted.
If the top -decile (90% to 100%) has more than twice the metal content of the 80% to 90% decile, cutting may also be appropriate
If the top percentile (or the top two or more percentiles each) has greater than 10% of the total metal content, then cutting (clipping, capping, top-cutting, upper-cutting or adjusting) is warranted.
Decile analysis, reduce all assays from percentiles with more than 10% of the total metal value to the highest value of the next lowest percentile.
The above criteria were considered, and a capping threshold was selected based on the assessment of both the summary statistics, log-probability plots and decile analysis.
Figure 14.5 displays a log-probability plot for the gold 10 ft composites in Domain 7 - Moss Vein. This graph shows three grade distributions in the 10ft gold composites. Two of these distributions are highlighted with a red line showing the trend of the gold grade distributions. The highest-grade distribution is highlighted with a green ellipse indicating the outlier grades.
Figure 14.6 displays a decile analysis plot for the 10ft composite gold grades for Domain 7 - Moss Vein. The upper decile contains more that 40% of the metal and grade capping is warranted. The capping threshold based on the decile analysis would be 0.193 oz/ton.
Comparing this capping threshold to the distribution shown in Figure 14.5, it was decided to select a capping threshold of 0.30 oz/ton Au was chosen for the Domain 7 - Moss Vein gold grades.
|
Mako Mining Corp. |
Figure 14.5
Log-Probability Plot of Gold Grade 10 Foot Composites for Domain 7 - Moss Vein
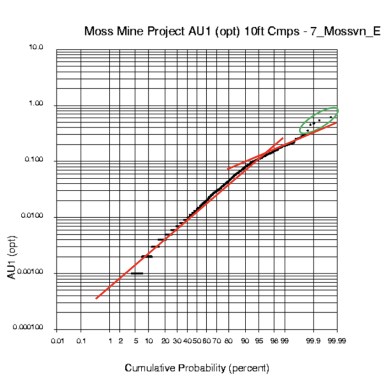
Figure 14.6
Decile Analysis of Gold Grade 10 Foot Composites for Domain 7 - Moss Vein
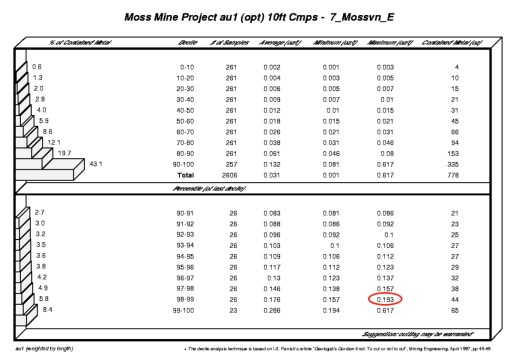
|
Mako Mining Corp. |
This assessment process was employed for all the Domains for both Gold and Silver 10 ft composite grades. Table 14.5 presents the capping thresholds for gold and Table 14.6 presents the capping thresholds for silver.
Table 14.5
Summary Statistics and Capping Grades for Gold (oz/ton) by Domain
|
Domain |
No. of |
Avg |
CV |
Cap |
No. |
Cap Avg |
Cap CV |
Avg |
CV Ratio |
|
1_Volc |
2,963 |
0.0015 |
3.5185 |
0.0500 |
4.0 |
0.0014 |
2.3515 |
0.9333 |
0.66832 |
|
2_E_Intr |
3,210 |
0.0008 |
5.1267 |
0.0300 |
6.0 |
0.0007 |
3.0016 |
0.8750 |
0.58548 |
|
3_W_Intr |
7,22 |
0.0007 |
1.5653 |
0.0090 |
4.0 |
0.0007 |
1.5410 |
1.0000 |
0.98448 |
|
4_E_Stkwrk |
2,0338 |
0.0045 |
2.7869 |
0.2000 |
6.0 |
0.0045 |
2.4993 |
1.0000 |
0.89680 |
|
5_W_Strkwrk |
8,041 |
0.0068 |
1.4269 |
0.1000 |
7.0 |
0.0068 |
1.3292 |
1.0000 |
0.93153 |
|
6_Ruthvn |
305 |
0.0264 |
3.0591 |
0.2000 |
4.0 |
0.0216 |
1.6703 |
0.8182 |
0.54601 |
|
7_Mossvn_E |
2,719 |
0.0297 |
1.4500 |
0.3000 |
5.0 |
0.0294 |
1.3558 |
0.9899 |
0.93503 |
|
8_Mossvn_W |
59 |
0.0056 |
0.6984 |
0.0200 |
1.0 |
0.0056 |
0.6879 |
1.0000 |
0.98497 |
|
9_Volc_Stkwrk |
5,972 |
0.0058 |
1.2604 |
0.1000 |
3.0 |
0.0058 |
1.2306 |
1.0000 |
0.97636 |
|
10_Reyn_Stkwrk |
1,229 |
0.0099 |
0.7916 |
0.1000 |
0.0 |
0.0099 |
0.7916 |
1.0000 |
1.00000 |
Table 14.5 shows the uncapped average gold grade for Domain7 of 0.0297 oz/ton with a coefficient of variation (CV) of 1.45. A total of 5 composites were capped which results in a reduction of the average 0.0294 oz/ton, about 1% of metal and a reduction of the CV of approximately 7%.
Table 14.6 shows the uncapped average silver grade for Domain 7 of 1.5956 oz/ton with a coefficient of variation (CV) of 1.694. A total of 1 composite was capped which results in a reduction of the average 1.4317 oz/ton, about 11% of metal and a reduction of the CV of approximately 15%.
Table 14.6
Summary Statistics and Capping Grades for Silver (oz/ton) by Domain
|
Domain |
No. of |
Avg |
CV |
Cap |
No. |
Cap Avg |
Cap CV |
Avg |
CV Ratio |
|
1_Volc |
2,831 |
0.0178 |
3.5520 |
0.4000 |
4.0 |
0.0166 |
1.7026 |
0.9326 |
0.47934 |
|
2_E_Intr |
3,210 |
0.0195 |
2.9239 |
0.3000 |
11.0 |
0.0179 |
1.5832 |
0.9179 |
0.54147 |
|
3_W_Intr |
722 |
0.0120 |
1.8031 |
0.2000 |
2.0 |
0.0119 |
1.7547 |
0.9917 |
0.97316 |
|
4_E_Stkwrk |
20,263 |
0.0623 |
5.7797 |
3.0000 |
3.0 |
0.0598 |
2.2320 |
0.9599 |
0.38618 |
|
5_W_Strkwrk |
7,690 |
0.0733 |
1.7754 |
2.0000 |
3.0 |
0.0732 |
1.7544 |
0.9986 |
0.98817 |
|
6_Ruthvn |
305 |
0.2499 |
3.1624 |
3.0000 |
1.0 |
0.2180 |
1.8331 |
0.8723 |
0.57965 |
|
7_Mossvn_E |
2,648 |
1.5956 |
1.6941 |
6.0000 |
1.0 |
0.3586 |
1.4317 |
0.2247 |
0.84511 |
|
8_Mossvn_W |
59 |
0.0270 |
1.1171 |
0.1500 |
1.0 |
0.0265 |
1.0468 |
0.9815 |
0.93707 |
|
9_Volc_Stkwrk |
5,735 |
0.0486 |
1.8074 |
1.5000 |
3.0 |
0.0483 |
1.6999 |
0.9938 |
0.94052 |
|
10_Reyn_Stkwrk |
1,103 |
0.0578 |
1.4047 |
0.8000 |
1.0 |
0.0570 |
1.1286 |
0.9862 |
0.80345 |
|
Mako Mining Corp. |
14.4.4 Contact Analysis
Contact analysis plots are used to assess the behaviour of the gold and silver grades across the boundary of two different geological domains. For the Moss Mine, it is the boundaries between the mineralised domains, Stockwork, Ruth Vein, and Moss Vein, and the unmineralized domains of Volcanic and Intrusive that are important. As well, the contact between the Stockwork and Ruth and Moss Veins are also important to understand.
Contact Plots by domain examine the boundary conditions where there could be sharing of composites across a geological contact (soft) or no sharing of composites across a geological contact (hard) for block model grade interpolation. Consideration is given to the behaviour of the grades close to the contact and to the average grade for each geological domain.
Figure 14.7 shows an example of a contact plot comparing the 10ft gold composites across domain 4, East Stockwork, and domain 7, Moss Vein. The average gold grade in domain 4 is 0.0046 oz/ton, while the average grade in domain 7 is 0.0294 oz/ton. This is a grade ratio of about 6 times. The behaviour of the line graph near the contact shows a sudden increase in grade across the geological contact. From this graph and statistical summaries, it appears that there should not be any sharing of 10ft gold grade composites across this boundary for block model grade estimation. That is the contact should be a hard boundary.
Figure 14.7
Contact Plot between East Stockwork (4) and Moss Vein (7) for Gold Gra
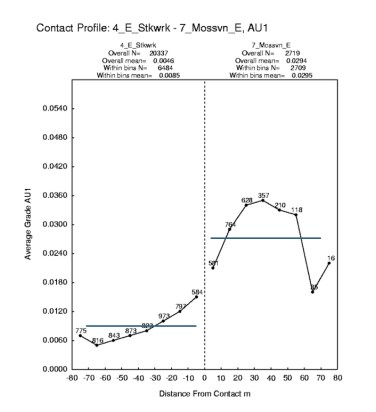
|
Mako Mining Corp. |
Table 14.7 presents a summary of the results of the contact plot analysis for the 10 ft composite gold grades. In general, the contacts are principally hard boundaries, that is no sharing of gold grades across the geological domain boundaries. While there are three contacts that could be considered soft, it was decided that there was no benefit in sharing the gold grades across these boundaries for block model gold and silver grade estimation.
Table 14.7
Summary of Boundary Conditions for Grade Estimation
|
Domain 1 |
Domain 2 |
Avg 1 Au |
Avg 2 Au |
Avg. |
Possible |
Final |
|
1_Volc |
9_Volc_Stkwrk |
0.0015 |
0.0058 |
3.87 |
Hard |
Hard |
|
9_Volc_Stkwrk |
10_Reyn_Stkwrk |
0.0058 |
0.0099 |
1.71 |
Hard |
Hard |
|
1_Volc |
3_W_Intr |
0.0015 |
0.0007 |
2.14 |
Hard |
Hard |
|
9_Volc_Stkwrk |
5_W_Strkwrk |
0.0058 |
0.0068 |
1.17 |
Soft |
Hard |
|
3_W_Intr |
2_E_Intr |
0.0060 |
0.0070 |
1.17 |
Soft |
Hard |
|
3_W_Intr |
5_W_Strkwrk |
0.0007 |
0.0068 |
9.71 |
Hard |
Hard |
|
5_W_Strkwrk |
4_E_Stkwrk |
0.0068 |
0.0046 |
1.48 |
Hard |
Hard |
|
5_W_Strkwrk |
8_Mossvn_W |
0.0068 |
0.0056 |
1.21 |
Soft |
Hard |
|
8_Mossvn_W |
7_Mossvn_E |
0.0053 |
0.0294 |
5.55 |
Hard |
Hard |
|
2_E_Intr |
4_E_Stkwrk |
0.0009 |
0.0046 |
5.11 |
Hard |
Hard |
|
4_E_Stkwrk |
6_Ruthvn |
0.0046 |
0.0265 |
5.76 |
Hard |
Hard |
|
4_E_Stkwrk |
7_Mossvn_E |
0.0046 |
0.0294 |
6.39 |
Hard |
Hard |
14.4.5 Density
A total of 506 specific gravity determinations were performed on drill core samples collected from material within the mineralized zones. These determinations were performed by ALS Chemex laboratory using unsealed immersion technique to measure the weight of each sample in air and in water (ALS Chemex standard OA-GRA08).
Previous work with the 506 SG determinations has shown that material within 40 ft of the surface has a lower dry bulk density of 2.51 g/cm and that material below 40 ft depth has a higher dry bulk density of 2.58 g/cm.
However, a tonnage factor of 12.35 cu-ft/short ton has been used by Moss Mine since the mine opened, and this factor has proven to be sufficiently accurate to be considered reliable in estimating the mined tonnage. This is equivalent to a dry density of 2.59 g/cm.
Consequently, for this mineral resource estimate, the QP for this section of the report recommends continuing the use of 12.35 cu-ft/short ton as the tonnage factor for estimating all in-situ tonnage estimated in the block model.
|
Mako Mining Corp. |
14.5 Spatial Analysis - Variography
The spatial data analysis was carried out using Geostokos Toolkit® software using traditional semi-variogams on the log of gold and the log of silver. Taking the logarithm of highly skewed gold and silver grades, produces more stable semi-variograms. The experimental semi-variograms were computed for the principal compass directions using an angular tolerance of -+/- 22.5 degrees, with a lag of 20 ft for 50 lags. Semi-variogram models were developed for each of the geological domain and the directions of continuity observed from the semi-variograms was used to establish the search strategy and kriging plan for the estimation of gold and silver block grade estimates in the block model.
Figure 14.8 displays an example of the experimental semi-variograms and fitted model for geological domain 4, East Intrusive Stockwork, for 10 ft composited gold grades. The semi-variogram maps are shown at the top and to the left of the fitted semi-variograms. From the semi-variogram maps the mineralization trends just north of west, with a moderate dip to the south. This directional anisotropy was fitted to the directional semi-variograms as shown in the lower-left part of Figure 14.8.
This methodology was employed for all domains and for both gold and silver using the 10 ft composites.
Figure 14.8
Semi-Variogram Maps, Dir. Semi-Variograms and Fitted Models for Au Domain 04
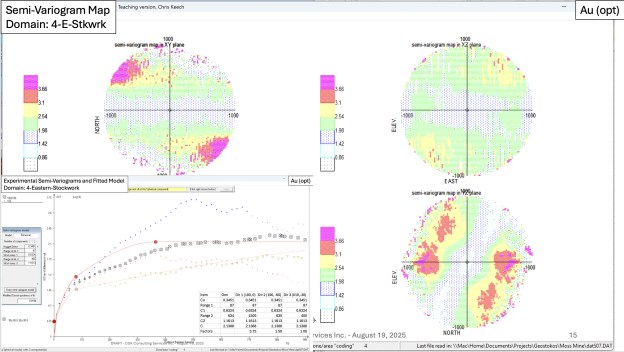 |
| C. Keech, CGK Consulting Services, 2025. |
14.5.1 Gold Grade Variography
Table 14.8 presents a summary of the semi-variogram models for gold developed for each of the 10 geological domains. These semi-variogram models for gold have been normalized to a sill of 1.0 for convenience. This normalization will not affect the shape of the semi-variogram models. Each experimental semi-variogram for gold has been fitted with a nugget effect and two spherical models. The ranges are given in feet, and the rotation convention is (ZXY, LRL) in degrees and follows the order Z, X, Y using the left, right, left rotation directions. Dips are negative downwards.
|
Mako Mining Corp. |
Table 14.8
Semi-Variogram Models for Gold by Domain
| AU - Normalized | Co | C1 | C2 | C | a11 | a12 | a13 | a21 | a22 | a23 | rot1 | rot2 | rot3 |
| 1_Volc | 0.2757 | 0.2667 | 0.4576 | 1.0000 | 60 | 60 | 60 | 400 | 400 | 100 | 100 | 0 | -90 |
| 2_E_Intr | 0.2860 | 0.2182 | 0.4958 | 1.0000 | 200 | 170 | 150 | 1500 | 1500 | 450 | 100 | 0 | -80 |
| 3_W_Intr | 0.2115 | 0.2571 | 0.5314 | 1.0000 | 22 | 22 | 22 | 500 | 500 | 250 | 100 | 0 | -90 |
| 4_E_Stkwrk | 0.1614 | 0.2957 | 0.5430 | 1.0000 | 87 | 87 | 87 | 1500 | 635 | 400 | 100 | 0 | -60 |
| 5_W_Strkwrk | 0.2134 | 0.3146 | 0.4720 | 1.0000 | 55 | 55 | 55 | 2000 | 690 | 400 | 100 | 0 | -60 |
| 6_Ruthvn | 0.2452 | 0.2542 | 0.5006 | 1.0000 | 300 | 85 | 300 | 1500 | 1500 | 685 | 280 | 0 | -60 |
| 7_Mossvn_E | 0.2809 | 0.5594 | 0.1596 | 1.0000 | 80 | 40 | 80 | 600 | 600 | 165 | 100 | 0 | -60 |
| 8_Mossvn_W | 0.1616 | 0.3393 | 0.4991 | 1.0000 | 52 | 26 | 52 | 230 | 230 | 115 | 100 | 0 | -60 |
| 9_Volc_Stkwrk | 0.2578 | 0.2146 | 0.5276 | 1.0000 | 66 | 66 | 66 | 900 | 900 | 325 | 100 | 0 | -45 |
| 10_Reyn_Stkwrk | 0.3374 | 0.2781 | 0.3845 | 1.0000 | 150 | 40 | 80 | 500 | 230 | 100 | 135 | 0 | -45 |
Figure 14.9 shows the experimental semi-variograms with their fitted models for each of the 10 domains.
14.5.2 Silver Grade Variography
Table 14.9 presents a summary of the semi-variogram models for silver developed for each of the 10 geological domains. These semi-variogram models for silver have been normalized to a sill of 1.0 for convenience. This normalization will not affect the shape of the semi-variogram models. Each experimental semi-variogram for silver has been fitted with a nugget effect and two spherical models. The ranges are given in feet, and the rotation convention is (ZXY, LRL) in degrees and follows the order Z, X, Y using the left, right, left rotation directions. Dips are negative downwards.
Table 14.9
Semi-Variogram Models for Silver by Domain
| AG1 | Co | C1 | C2 | C | a11 | a12 | a13 | a21 | a22 | a23 | rot1 | rot2 | rot3 |
| 1_Volc | 0.2132 | 0.5331 | 0.2537 | 1.0000 | 200 | 200 | 105 | 875 | 875 | 220 | 100 | 0 | -90 |
| 2_E_Intr | 0.2245 | 0.2296 | 0.5459 | 1.0000 | 100 | 100 | 20 | 600 | 600 | 150 | 100 | 0 | -80 |
| 3_W_Intr | 0.2842 | 0.1456 | 0.5702 | 1.0000 | 400 | 400 | 187 | 900 | 900 | 510 | 100 | 0 | -90 |
| 4_E_Stkwrk | 0.1419 | 0.3269 | 0.5312 | 1.0000 | 120 | 90 | 60 | 1100 | 515 | 275 | 100 | 0 | -60 |
| 5_W_Strkwrk | 0.1835 | 0.0581 | 0.7584 | 1.0000 | 70 | 70 | 70 | 1200 | 575 | 375 | 100 | 0 | -60 |
| 6_Ruthvn | 0.4895 | 0.1566 | 0.3540 | 1.0000 | 300 | 100 | 115 | 1500 | 750 | 400 | 280 | 0 | -60 |
| 7_Mossvn_E | 0.2750 | 0.4463 | 0.2787 | 1.0000 | 40 | 20 | 40 | 300 | 300 | 100 | 100 | 0 | -60 |
|
Mako Mining Corp. |
| AG1 | Co | C1 | C2 | C | a11 | a12 | a13 | a21 | a22 | a23 | rot1 | rot2 | rot3 |
| 8_Mossvn_W | 0.2988 | 0.1960 | 0.5052 | 1.0000 | 98 | 45 | 98 | 475 | 475 | 250 | 100 | 0 | -60 |
| 9_Volc_Stkwrk | 0.2459 | 0.2541 | 0.5000 | 1.0000 | 150 | 95 | 150 | 1000 | 1000 | 450 | 100 | 0 | -45 |
| 10_Reyn_Stkwrk | 0.2608 | 0.3662 | 0.3730 | 1.0000 | 200 | 40 | 40 | 1500 | 800 | 250 | 135 | 0 | -45 |
Figure 14.10 displays the experimental semi-variograms with their fitted models for each of the 10 domains.
Figure 14.9
9 Experimental Semi-Variogram and Fitted Model for Gold Grades
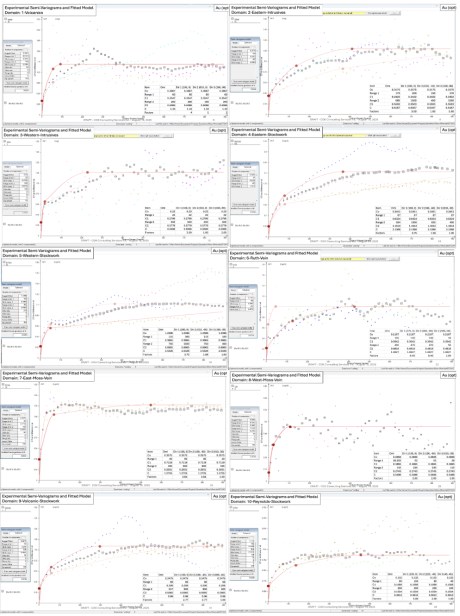 |
| C. Keech, CGK Consulting Services, 2025. |
|
Mako Mining Corp. |
Figure 14.10
Experimental Semi-Variogram and Fitted Model for Silver Grades
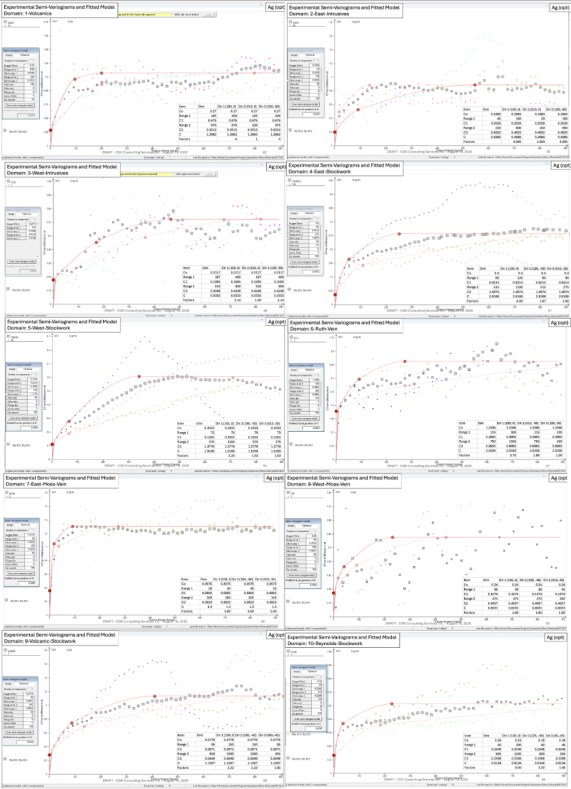 |
| C. Keech, CGK Consulting Services, 2025 |
|
Mako Mining Corp. |
14.6 Block Model
A 3D block model was constructed using MineSight® 15.4 software with the dimensions shown in Table 14.10. The block size was chosen to reflect a potential selective mining unit (SMU) of 20 ft x 20 ft x 20 ft, given the anticipated open-pit mining scenario. The block model covers an area of approximately 10,000 ft by 4,000 ft in plan view, and approximately 2,200 ft vertically. The block model coordinates are in local coordinates, which are based on Arizona State Plane West Zone, 0203; UTM 12.
The estimation of gold and silver grades was carried out using ordinary kriging in MineSight® 15.4 software using a three-pass search strategy to use the most local 10ft composite data to a block location being estimated.
Table 14.10
Block Model Definition for Moss Mine Project
|
|
Minimum (ft) |
Maximum (ft) |
Unit Block Size (ft) |
Number of Blocks |
|
Easting |
487,010.00 |
497,010.00 |
20 ft |
500 |
|
Northing |
1,490,010.00 |
1,493,930.00 |
20 ft |
196 |
|
Elevation |
500.00 |
2,720.00 |
20 ft |
99 |
14.6.1 Gold Grade Estimation Parameters
The following is a summary of the parameters used to estimate the block gold grades by domain in the block model.
• Capped gold grade 10 ft composites were used for ordinary kriging into the blocks in the model for domains 1, 2, 3, 4, 5, 6, 7, 8, 9, 10.
• In addition to capping the 10 ft gold composite grades, an outlier restriction of 40 ft was used for domains 1, 2, 3, and 10; and an outlier restriction of 60 ft was used for domains 4, 5 and 9 (Stockwork). The grade thresholds for the outlier restriction were taken from the Decile Analysis results. No outlier restrictions were used for domains 6, 7 and 8 (Ruth and Moss Veins).
• Geological boundaries are based on the domain wireframes, and the domain codes were assigned to the block model and used to control the selection of the 10 ft composites and the blocks to be estimated. There was no sharing of composites across the domain boundaries.
• Spatial 3D mathematical models were fitted to the experimental semi-variograms for each of the domains and used for ordinary kriging of the blocks in the model.
• A three-pass search strategy was used with the ranges based on the drill hole spacing and semi-variogram models. The search ellipsoids were expanded to ensure a reasonable amount of the blocks in each domain were estimated.
• A minimum of four and maximum of 16 composites were required to make a block estimate, with a maximum of four from a single drill hole for pass 1.
• A minimum of eight and maximum of 16 composites were required to make a block estimate, with a maximum of four from a single drill hole for pass 2.
|
Mako Mining Corp. |
• A minimum of 12 and maximum of 16 composites were required to make a block estimate, with a maximum of four from a single drill hole for pass 3.
Table 14.11
Kriging Plan for Gold Grades - Pass 3 Parameters
| DOMAIN | D01 | D02 | D03 | D04 | D05 | D06 | D07 | D08 | D09 | D10 |
| MIN CMP | 12 | 12 | 12 | 12 | 12 | 12 | 12 | 12 | 12 | 12 |
| MAX CMP | 16 | 16 | 16 | 16 | 16 | 16 | 16 | 16 | 16 | 16 |
| MAX PER HOLE | 4 | 4 | 4 | 4 | 4 | 4 | 4 | 4 | 4 | 4 |
| MAX PER OCT | 4 | 4 | 4 | 4 | 4 | 4 | 4 | 4 | 4 | 4 |
| SRCH - MAJOR | 200 | 200 | 200 | 200 | 200 | 200 | 200 | 200 | 200 | 200 |
| SRCH - MINOR | 200 | 200 | 200 | 200 | 200 | 200 | 200 | 200 | 200 | 200 |
| SRCH - VERTICAL | 100 | 100 | 100 | 100 | 100 | 100 | 100 | 100 | 100 | 100 |
| ROT1 - Z | 100 | 100 | 100 | 100 | 100 | 280 | 100 | 100 | 100 | 135 |
| ROT2 - X | 0 | 0 | 0 | 0 | 0 | 0 | 0 | 0 | 0 | 0 |
| ROT3 - Y | -90 | -80 | -90 | -60 | -60 | -60 | -60 | -60 | -45 | -45 |
| OUTLIER CUTOFF | 0.023 | 0.022 | 0.009 | 0.063 | 0.047 | 0.397 | 0.193 | 0.021 | 0.033 | 0.044 |
| OUTLIER DISTANCE | 40 | 40 | 40 | 60 | 60 | 1000 | 1000 | 1000 | 60 | 60 |
| VARIOGRAM FILE | 1-AU.PAR | 2-AU.PAR | 3-AU.PAR | 4-AU.PAR | 5-AU.PAR | 6-AU.PAR | 7-AU.PAR | 8-AU.PAR | 9-AU.PAR | 10-AU.PAR |
| BLOCK DOMAIN | 1 | 2 | 3 | 4 | 5 | 6 | 7 | 8 | 9 | 10 |
| COMPOSITE DOMAIN | 1 | 2 | 3 | 4 | 5 | 6 | 7 | 8 | 9 | 10 |
Note: The rotation convention is (ZXY, LRL) in degrees and follows the order Z, X, Y using the left, right, left rotation directions. Dips are negative downwards.
14.6.2 Silver Grade Estimation Parameters
The following is a summary of the parameters used to estimate the block silver grades by domain in the block model.
• Capped silver grade 10ft composites were used for ordinary kriging into the blocks in the model for domains 1, 2, 3, 4, 5, 6, 7, 8, 9, 10.
• In addition to capping the 10ft silver composite grades, an outlier restriction of 40ft was used for domains 1, 2, 3, and 10; and an outlier restriction of 60ft was used for domains 4, 5 and 9 (Stockwork). The grade thresholds for the outlier restriction were taken from the Decile Analysis results. No outlier restrictions were used for domains 6, 7 and 8 (Ruth and Moss Veins).
• Geological boundaries are based on the domain wireframes, and the domain codes were assigned to the block model and used to control the selection of the 10ft composites and the blocks to be estimated. There was no sharing of composites across the domain boundaries.
|
Mako Mining Corp. |
• Spatial 3D mathematical models were fitted to the experimental semi-variograms for each of the domains and used for ordinary kriging of the blocks in the model.
• A three-pass search strategy was used with the ranges based on the drill hole spacing and semi-variogram models. The search ellipsoids were expanded to ensure a reasonable amount of the blocks in each domain were estimated.
• A minimum of four and maximum of 16 composites were required to make a block estimate, with a maximum of four from a single drill hole for pass 1.
• A minimum of eight and maximum of 16 composites were required to make a block estimate, with a maximum of four from a single drill hole for pass 2.
• A minimum of 12 and maximum of 16 composites were required to make a block estimate, with a maximum of four from a single drill hole for pass 3.
Table 14.12
Kriging Plan for Silver Grades - Pass 3 Parameters
| DOMAIN | D01 | D02 | D03 | D04 | D05 | D06 | D07 | D08 | D09 | D10 |
| MIN CMP | 12 | 12 | 12 | 12 | 12 | 12 | 12 | 12 | 12 | 12 |
| MAX CMP | 16 | 16 | 16 | 16 | 16 | 16 | 16 | 16 | 16 | 16 |
| MAX PER HOLE | 4 | 4 | 4 | 4 | 4 | 4 | 4 | 4 | 4 | 4 |
| MAX PER OCT | 4 | 4 | 4 | 4 | 4 | 4 | 4 | 4 | 4 | 4 |
| SRCH - MAJOR | 200 | 200 | 200 | 200 | 200 | 200 | 200 | 200 | 200 | 200 |
| SRCH - MINOR | 200 | 200 | 200 | 200 | 200 | 200 | 200 | 200 | 200 | 200 |
| SRCH - VERTICAL | 100 | 100 | 100 | 100 | 100 | 100 | 100 | 100 | 100 | 100 |
| ROT1 - Z | 100 | 100 | 100 | 100 | 100 | 280 | 100 | 100 | 100 | 135 |
| ROT2 - X | 0 | 0 | 0 | 0 | 0 | 0 | 0 | 0 | 0 | 0 |
| ROT3 - Y | -90 | -80 | -90 | -60 | -60 | -60 | -60 | -60 | -45 | -45 |
| OUTLIER CUTOFF | 0.121 | 0.13 | 0.121 | 0.656 | 0.57 | 2.485 | 2.491 | 0.117 | 0.375 | 0.595 |
| OUTLIER DISTANCE | 40 | 40 | 40 | 60 | 60 | 1000 | 1000 | 1000 | 60 | 60 |
| VARIOGRAM FILE | 1-AG.PAR | 2-AG.PAR | 3-AG.PAR | 4-AG.PAR | 5-AG.PAR | 6-AG.PAR | 7-AG.PAR | 8-AG.PAR | 9-AG.PAR | 10-AG.PAR |
| BLOCK DOMAIN | 1 | 2 | 3 | 4 | 5 | 6 | 7 | 8 | 9 | 10 |
| COMPOSITE DOMAIN | 1 | 2 | 3 | 4 | 5 | 6 | 7 | 8 | 9 | 10 |
14.6.3 Density Model
A constant tonnage factor of 12.35 cu-ft/short ton was used for estimating all in-situ tonnage estimated in the block model.
|
Mako Mining Corp. |
14.6.4 Block Model Validation
The block model gold and silver grade estimates were validated using a series of statistical and graphical methods. These include a check of the global average using the nearest neighbour (NN) block grade estimates, compared with the inverse distance squared (ID2) and ordinary kriged (OK) block grade estimates, a check of the global trends using swath plots, a volume-variance check to determine the variability of the block grade estimates, and a visual validation in plan and section to confirm that the estimates honoured the composite grades, domain and zone boundary conditions and the kriging plan.
14.6.4.1 Global Average Validation
The global average for the gold and silver block grade estimates should be the same for the three different estimation methodologies, OK, ID2, and NN. Table 14.13 presents summary statistics by geological domain for the kriged block gold grade estimates (AUOK), the inverse distance squared (AUID) block gold grade estimates and the nearest neighbour block gold grade estimates (AUNN). There is good agreement between the overall average grades between the AUNN and AUOK and acceptable agreement between the average grades for each estimation methodology for each geological domain. Therefore, the block model grade gold estimates pass this assessment.
Table 14.13
Summary Statistics for Estimated Gold Grades by Domain
| Mean | Std. Dev. | AUOK/AUNN | |||||||
| Domain | No of Blks | % Estm | AUOK | AUID | AUNN | AUOK | AUID | AUNN | Mean |
| 1 | 413502 | 11.1% | 0.0011 | 0.0011 | 0.0012 | 0.0011 | 0.0011 | 0.0020 | 0.917 |
| 2 | 549458 | 10.0% | 0.0008 | 0.0008 | 0.0007 | 0.0008 | 0.0008 | 0.0016 | 1.143 |
| 3 | 148976 | 18.1% | 0.0010 | 0.0009 | 0.0011 | 0.0009 | 0.0008 | 0.0017 | 0.909 |
| 4 | 306562 | 97.6% | 0.0037 | 0.0037 | 0.0036 | 0.0043 | 0.0044 | 0.0074 | 1.028 |
| 5 | 132586 | 98.5% | 0.0046 | 0.0046 | 0.0048 | 0.0034 | 0.0038 | 0.0064 | 0.958 |
| 6 | 2522 | 100% | 0.0237 | 0.0246 | 0.0235 | 0.0154 | 0.0182 | 0.0320 | 1.009 |
| 7 | 27349 | 88.2% | 0.0214 | 0.0218 | 0.0205 | 0.0177 | 0.0196 | 0.0316 | 1.044 |
| 8 | 1665 | 81.8% | 0.0039 | 0.0038 | 0.0041 | 0.0020 | 0.0022 | 0.0023 | 0.951 |
| 9 | 284501 | 94.8% | 0.0050 | 0.0050 | 0.0052 | 0.0030 | 0.0032 | 0.0057 | 0.962 |
| 10 | 22702 | 99.2% | 0.0092 | 0.0092 | 0.0089 | 0.0035 | 0.0038 | 0.0073 | 1.034 |
| TOTAL | 1889823 | 17.4% | 0.0027 | 0.0027 | 0.0027 | 0.0045 | 0.0047 | 0.0066 | 1.000 |
Table 14.13 presents summary statistics by geological domain for the kriged block silver grade estimates (AGOK), the inverse distance squared (AGID) block silver grade estimates and the nearest neighbour block silver grade estimates (AGNN). There is good agreement between the overall average grades between the AGNN and AGOK and acceptable agreement between the average grades for each estimation methodology and for each geological domain. Therefore, the block model silver grade estimates pass this assessment.
|
Mako Mining Corp. |
Table 14.14
Summary Statistics for Estimated Silver Grades by Domain
|
|
Mean |
Std. Dev. |
AUOK/AUNN |
||||||
|
Domain |
No of Blks |
% Estm |
AGOK |
AGID |
AGNN |
AGOK |
AGID |
AGNN |
Mean |
|
1 |
387,615 |
10.4% |
0.0105 |
0.0105 |
0.0109 |
0.0066 |
0.0071 |
0.0127 |
0.963 |
|
2 |
549,140 |
10.0% |
0.0143 |
0.0140 |
0.0137 |
0.0110 |
0.0113 |
0.0180 |
1.044 |
|
3 |
148,870 |
18.1% |
0.0101 |
0.0099 |
0.0117 |
0.0067 |
0.0067 |
0.0158 |
0.863 |
|
4 |
306,479 |
97.6% |
0.0473 |
0.0475 |
0.0469 |
0.0554 |
0.0575 |
0.0975 |
1.009 |
|
5 |
132,522 |
98.5% |
0.0429 |
0.0433 |
0.0436 |
0.0537 |
0.0567 |
0.0891 |
0.984 |
|
6 |
2,522 |
100% |
0.2671 |
0.2706 |
0.2254 |
0.1841 |
0.2223 |
0.3495 |
1.185 |
|
7 |
27,349 |
88.2% |
0.3068 |
0.3133 |
0.2914 |
0.2627 |
0.3165 |
0.4715 |
1.053 |
|
8 |
1,650 |
81.0% |
0.0148 |
0.0146 |
0.0131 |
0.0143 |
0.0156 |
0.0162 |
1.130 |
|
9 |
284,501 |
94.8% |
0.0363 |
0.0361 |
0.0370 |
0.0287 |
0.0307 |
0.0517 |
0.981 |
|
10 |
22,702 |
99.2% |
0.0514 |
0.0514 |
0.0511 |
0.0210 |
0.0232 |
0.0463 |
1.006 |
|
TOTAL |
1,863,350 |
17.1% |
0.0291 |
0.0291 |
0.0289 |
0.0583 |
0.0635 |
0.0863 |
1.007 |
14.6.4.2 Swathplots
Swath plots were generated to determine if the block model gold grade estimates honoured the local trends in gold grade. A swath is the average of the nearest neighbour gold estimates (AUNN) and ordinary kriged gold grade estimates (AUOK) for collections of blocks. The swath width is 100 ft or five blocks in easting, 100 ft or 5 blocks in northing, and 40 ft or two blocks in elevation. The average swath grade is then plotted versus the easting, northing, and elevation coordinates. There should be reasonable agreement between the trends of the two block grade estimates.
Figure 14.11 displays a series of swath plots for gold for Domain 4 - East Intrusive Stockwork. The left-hand graph shows the swath plot in Easting, the centre graph shows the swath plot in Northing, and the right-hand graph shows the swath plot by elevation. In general, there is good agreement between the nearest neighbour block gold grade estimates and the ordinary kriged block gold grade estimates. That is, the global trend for gold in Domain is honoured by the kriging plan.
Swath plots were generated for both gold and silver for each domain and assessed to ensure that the grade trends were honoured. The results of the swath plot analysis shows that there is good agreement for both the gold and silver block grade estimates.
14.6.4.3 Volume Variance
It is important to assess the block model gold grade estimate variability to determine if the variability reflects the variability of the proposed Selective Mining Unit (SMU) of 20 ft by 20 ft by 20 ft. The ideal variability of the gold block grade estimates is determined from nearest neighbour gold block grade estimates which are corrected to SMU variability using a methodology known as the indirect lognormal correction (ILC). The ILC corrected block gold grade estimates (ILCAU) become the reference point to which the ordinary kriged gold block grade estimates can be compared.
|
Mako Mining Corp. |
Figure 14.11
Swath Plot of Gold Grades for Domain 4
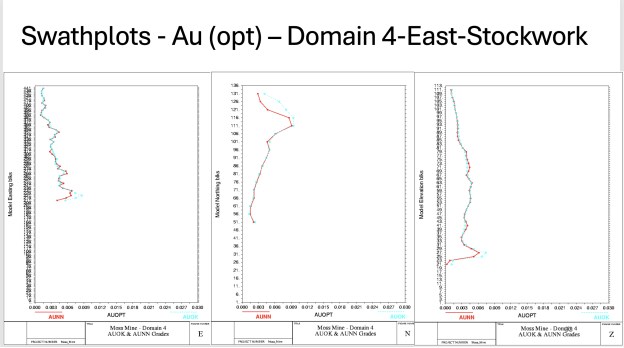 |
| C. Keech, CGK Consulting Services, 2025. |
If there was perfect selectivity at the 20 ft by 20 ft by 20 ft block size, then the expectation would be to have the variability of the AUOK estimates be the same as the ILCAU estimates. However, there will also be some mixing of material at the block edges so there will be some dilution, which will result in the AUOK estimates being less variable than the ILCAU estimates. A target difference in ratio between the AUOK and ILCAU estimates is 0.85. Table 14.15 shows the summary statistics for the AUOK, AUNN, and ILCAU block gold grade estimates. The overall ratio between the AUOK and ILCAU estimates is 0.776, which indicates the kriged estimates are likely over-smoothed and will likely need a volume-variance adjustment to make the kriged estimates more variable.
Table 14.16 displays summary statistics for the variance corrected block gold grade estimates (AUOPT). A correction was tailored to the block grade estimates of each domain to arrive at an overall variance ratio of 0.83, which is considered acceptable for this style of mineralization and the planned level of selection in the open-pit mining methodology.
Table 14.15
Summary Statistics for Block Model Estimates - Volume-Variance Assessment
|
|
|
Mean |
Std. Dev. |
AUOK/LCAU |
AUOK/ILCAU |
|||||
|
Domain |
No. of Blks |
% Estm |
AUOK |
AUNN |
ILCAU |
AUOK |
AUNN |
ILCAU |
Ave. |
Std. Dev |
|
1 |
413,502 |
11.1% |
0.0011 |
0.0012 |
0.0011 |
0.0011 |
0.0020 |
0.0014 |
1.0000 |
0.786 |
|
2 |
549,458 |
10.0% |
0.0008 |
0.0007 |
0.0008 |
0.0008 |
0.0016 |
0.0014 |
1.0000 |
0.571 |
|
3 |
148,976 |
18.1% |
0.0010 |
0.0011 |
0.0010 |
0.0009 |
0.0017 |
0.0012 |
1.0000 |
0.750 |
|
Mako Mining Corp. |
|
|
|
Mean |
Std. Dev. |
AUOK/LCAU |
AUOK/ILCAU |
|||||
|
Domain |
No. of Blks |
% Estm |
AUOK |
AUNN |
ILCAU |
AUOK |
AUNN |
ILCAU |
Ave. |
Std. Dev |
|
4 |
306,562 |
97.6% |
0.0037 |
0.0036 |
0.0038 |
0.0043 |
0.0074 |
0.0068 |
1.0270 |
0.632 |
|
5 |
132,586 |
98.5% |
0.0046 |
0.0048 |
0.0046 |
0.0034 |
0.0064 |
0.0051 |
1.0000 |
0.667 |
|
6 |
2,522 |
100% |
0.0237 |
0.0235 |
0.0235 |
0.0154 |
0.0320 |
0.0289 |
0.9916 |
0.533 |
|
7 |
27,349 |
88.2% |
0.0214 |
0.0205 |
0.0205 |
0.0177 |
0.0316 |
0.0257 |
0.9579 |
0.689 |
|
8 |
1,665 |
81.8% |
0.0039 |
0.0041 |
0.0039 |
0.0020 |
0.0023 |
0.0017 |
1.0000 |
1.176 |
|
9 |
284,501 |
94.8% |
0.0050 |
0.0052 |
0.0050 |
0.0030 |
0.0057 |
0.0046 |
1.0000 |
0.652 |
|
10 |
22,702 |
99.2% |
0.0092 |
0.0089 |
0.0091 |
0.0035 |
0.0073 |
0.0056 |
0.9891 |
0.625 |
|
TOTAL |
1,889,823 |
17.4% |
0.0027 |
0.0027 |
0.0027 |
0.0045 |
0.0066 |
0.0058 |
1.0000 |
0.776 |
Table 14.16
Summary Statistics for Block Model Estimates - Corrected Volume-Variance
| Mean | Std. Dev. | AUOPT/ILCAU | AUOPT/ILCAU | |||||||
| Domain | No. of Blks | % Estm | AUOK | ILCAU | AUOPT | AUOK | ILCAU | AUOPT | Mean | Std. Dev |
| 1 | 413,502 | 11.1% | 0.0011 | 0.0011 | 0.0012 | 0.0011 | 0.0014 | 0.0010 | 1.091 | 0.714 |
| 2 | 549,458 | 10.0% | 0.0008 | 0.0008 | 0.0008 | 0.0008 | 0.0014 | 0.0010 | 1.000 | 0.714 |
| 3 | 148,976 | 18.1% | 0.0010 | 0.0010 | 0.0010 | 0.0009 | 0.0012 | 0.0008 | 1.000 | 0.667 |
| 4 | 306562 | 97.6% | 0.0037 | 0.0038 | 0.0038 | 0.0043 | 0.0068 | 0.0052 | 1.000 | 0.765 |
| 5 | 132,586 | 98.5% | 0.0046 | 0.0046 | 0.0046 | 0.0034 | 0.0051 | 0.0039 | 1.000 | 0.765 |
| 6 | 2,522 | 100% | 0.0237 | 0.0235 | 0.0236 | 0.0154 | 0.0289 | 0.0209 | 1.004 | 0.723 |
| 7 | 27,349 | 88.2% | 0.0214 | 0.0205 | 0.0211 | 0.0177 | 0.0257 | 0.0191 | 1.029 | 0.743 |
| 8 | 1,665 | 81.8% | 0.0039 | 0.0039 | 0.0039 | 0.0020 | 0.0017 | 0.0013 | 1.000 | 0.765 |
| 9 | 284,501 | 94.8% | 0.0050 | 0.0050 | 0.0050 | 0.0030 | 0.0046 | 0.0034 | 1.000 | 0.739 |
| 10 | 22,702 | 99.2% | 0.0092 | 0.0091 | 0.0091 | 0.0035 | 0.0056 | 0.0043 | 1.000 | 0.768 |
| TOTAL | 1,889,823 | 17.4% | 0.0027 | 0.0027 | 0.0027 | 0.0045 | 0.0058 | 0.0048 | 1.000 | 0.828 |
Figure 14.11 displays grade-tonnage curves for the perfect selection of the ILCAU in black, the AUOK smoothed estimates in red, and the variance corrected block gold grade estimates in green. The graphs shows that the variance corrected block gold grade estimates have a higher average grade and fewer tonnes at the same cutoff grades from 0.002 oz/ton Au to 0.010 oz/ton Au, which is what was desired. From the grade-tonnage curves in Figure 14.11, it appears that there is an appropriate amount of variability in the AUOPT block gold grade estimates to be appropriate for a 20 ft by 20 ft by 20 ft SMU, including some dilution.
|
Mako Mining Corp. |
Figure 14.12
Grade-Tonnage Curve - for all Block Gold Grade Estimates
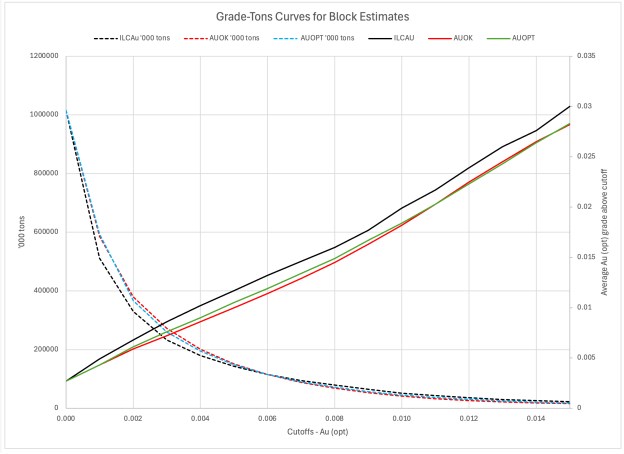
14.6.4.4 Visual Validation
A series of plans and sections were generated to compare the block gold and silver grade estimates with the 10 ft capped gold and silver composites. This was done to confirm that the block model gold and silver estimates honoured the composite grades, domain boundaries and the kriging plan.
Figure 14.13 displays a plan view at 1,710 ft elevation showing the block gold grade estimates and the section lines. Figures 14.14 to 14.16 display northwest facing cross-sections of block gold grade estimates and 10 ft gold composites. There is good agreement between the 10 ft gold composites and the block gold grade estimates. From these figures, it appears that the hard-boundary conditions and the kriging plan search strategy are working as intended.
|
Mako Mining Corp. |
Figure 14.13
Plan View at the 1,710 Foot Elevation. of Gold Block Grade Estimates
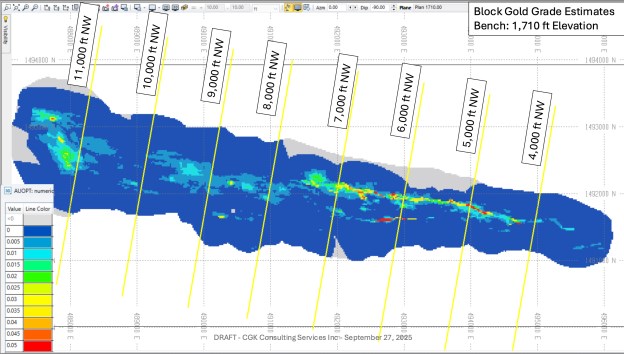 |
| C. Keech, CGK Consulting Services, 2025. |
Figure 14.14
Section 6,000 Feet NW - Block Gold Grade Estimates
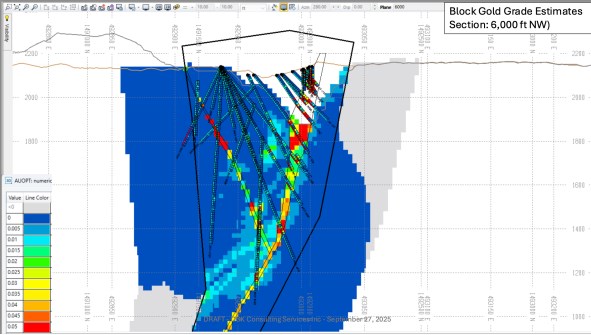 |
| C. Keech, CGK Consulting Services, 2025. |
|
Mako Mining Corp. |
Figure 14.15
Section 7,000 Feet NW - Block Gold Grade Estimates
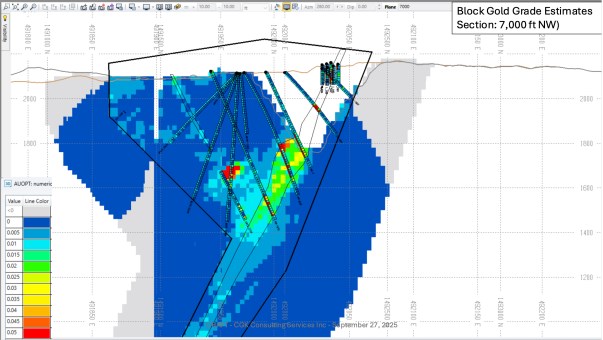 |
| C. Keech, CGK Consulting Services, 2025. |
Figure 14.16
Section 11,000 Feet NW - Block Gold Grade Estimates
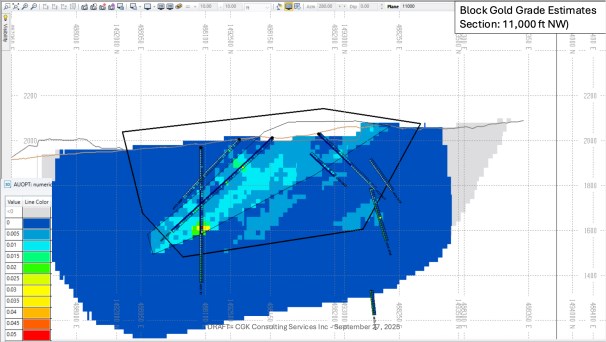 |
| C. Keech, CGK Consulting Services, 2025. |
|
Mako Mining Corp. |
14.6.4.5 Blasthole Model
To help validate the block gold grade estimates, the blasthole data was imported into MineSight and a blasthole block model gold grade estimate was made using an inverse squared distance methodology. Then a comparison was made between the grade and tons forecast by the blasthole model and the grade and tons forecast by the drill hole block grade estimates.
Table 14.17 presents the results of tabulation at various cutoffs. At the 0.005 oz/ton Au cutoff, the blasthole block model estimates 31 million tons grading 0.0149 oz/ton Au, while the drill hole block model estimates 34.6 million tons grading 0.0136 oz/ton Au. That is the drill hole block model estimates more tons at a lower grade but does estimate close to the contained metal estimated by the blasthole model.
Table 14.17
Comparison of Blasthole and Drill Hole Block Models
| CUT-OFFS AU OZ/TON |
000 TONS |
BHAU | CUT- OFFS AU OZ/TON |
000 TONS | AUOPT | 000 TONS RATIO |
GRADE RATIO |
METAL RATIO |
| >= 0.001 | 49,543 | 0.0104 | >= 0.001 | 49,484 | 0.0104 | 0.9988 | 1.0000 | 0.9988 |
| >= 0.002 | 44,303 | 0.0114 | >= 0.002 | 45,821 | 0.0111 | 1.0343 | 0.9737 | 1.0070 |
| >= 0.003 | 39,764 | 0.0125 | >= 0.003 | 42,376 | 0.0118 | 1.0657 | 0.9440 | 1.0060 |
| >= 0.004 | 35,306 | 0.0136 | >= 0.004 | 38,577 | 0.0126 | 1.0926 | 0.9265 | 1.0123 |
| >= 0.005 | 31,049 | 0.0149 | >= 0.005 | 34,645 | 0.0136 | 1.1158 | 0.9128 | 1.0185 |
| >= 0.006 | 26,949 | 0.0163 | >= 0.006 | 30,372 | 0.0147 | 1.1270 | 0.9018 | 1.0164 |
| >= 0.007 | 23,190 | 0.0179 | >= 0.007 | 25,814 | 0.0162 | 1.1132 | 0.9050 | 1.0074 |
| >= 0.008 | 19,885 | 0.0196 | >= 0.008 | 21,872 | 0.0177 | 1.0999 | 0.9031 | 0.9933 |
| >= 0.009 | 16,999 | 0.0215 | >= 0.009 | 18,180 | 0.0196 | 1.0695 | 0.9116 | 0.9750 |
| >= 0.010 | 14,514 | 0.0236 | >= 0.010 | 15,455 | 0.0214 | 1.0648 | 0.9068 | 0.9656 |
| >= 0.011 | 12,475 | 0.0257 | >= 0.011 | 13,118 | 0.0234 | 1.0515 | 0.9105 | 0.9574 |
| >= 0.012 | 10,791 | 0.0280 | >= 0.012 | 11,175 | 0.0255 | 1.0356 | 0.9107 | 0.9431 |
| >= 0.013 | 9,428 | 0.0302 | >= 0.013 | 9,648 | 0.0275 | 1.0233 | 0.9106 | 0.9318 |
| >= 0.014 | 8,353 | 0.0324 | >= 0.014 | 8,498 | 0.0294 | 1.0174 | 0.9074 | 0.9232 |
| >= 0.015 | 7,434 | 0.0346 | >= 0.015 | 7,520 | 0.0314 | 1.0116 | 0.9075 | 0.9180 |
Figures 14.17 and 14.18 display block gold grade estimates with the former showing the blasthole block model gold grade estimates and the later showing the drill hole block model gold grade estimates. A visual comparison between the two shows that the block grade estimates are reasonably similar.
The QP for this section of the report feels that this comparison is acceptable based on the similar amount of estimated contained metal and the similarity of the block grade estimates shown in Figures 14.17 and 14.18.
|
Mako Mining Corp. |
Figure 14.17
Cross-Section at 6,000 Feet NW of Blasthole Block Model Gold Grades
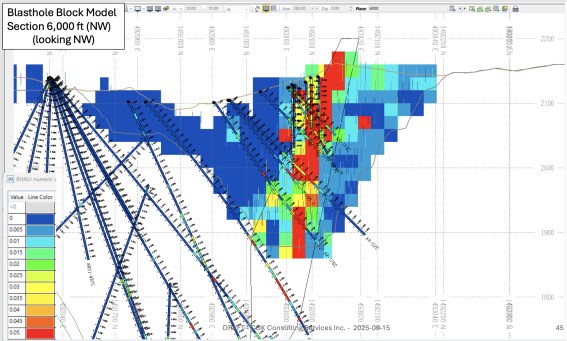 |
| C. Keech, CGK Consulting Services, 2025. |
Figure 14.18
Cross Section at 6,000 Feet NW of Drill Hole Block Model Gold Grades
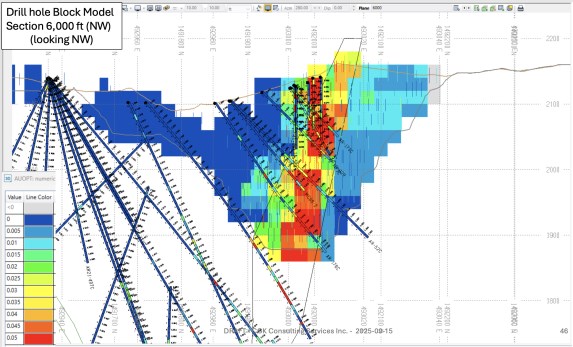 |
| C. Keech, CGK Consulting Services, 2025. |
|
Mako Mining Corp. |
14.7 Mineral Resources
The classification of the current mineral resources estimate for the Moss Mine Project has been carried out in accordance with the May 2014 CIM standards and definitions, as required under NI 43-101 regulations. The CIM standards and definitions are described below.
Mineral resources are sub-divided, in order of increasing geological confidence, into "inferred", "indicated" and "measured" categories. An inferred mineral resource has a lower level of confidence than that applied to an indicated mineral resource. An indicated mineral resource has a higher level of confidence than an inferred mineral resource but has a lower level of confidence than a measured mineral resource.
A "mineral resource" is a concentration or occurrence of solid material of economic interest in or on the Earth's crust in such form, grade, quality, and quantity that there are reasonable prospects for eventual economic extraction. The location, quantity, grade or quality, continuity and other geological characteristics of a mineral resource are known, estimated, or interpreted from specific geological evidence and knowledge, including sampling. Material of economic interest refers to diamonds, natural solid inorganic material, or natural solid fossilised organic material including base and precious metals, coal, and industrial minerals.
The term "mineral resource" covers mineralisation and natural material of intrinsic economic interest which has been identified and estimated through exploration and sampling and within which mineral reserves may subsequently be defined by the consideration and application of modifying factors.
The phrase "reasonable prospects for eventual economic extraction" implies a judgement by the Qualified Person in respect of the technical and economic factors likely to influence the prospect of economic extraction. Interpretation of the word "eventual" in this context may vary depending on the commodity or mineral involved. For example, for some coal, iron, potash deposits and other bulk minerals or commodities, it may be reasonable to envisage 'eventual economic extraction' as covering periods more than 50 years. However, for many gold deposits, application of the concept would normally be restricted to perhaps 10 to 15 years, and frequently to much shorter periods.
The definitions below for the classification of mineral resources were adopted by the CIM Council on May 10, 2014.
An "inferred mineral resource" is that part of a mineral resource for which quantity and grade or quality are estimated on the basis of limited geological evidence and sampling. Geological evidence is sufficient to imply but not verify geological and grade or quality continuity. An inferred mineral resource has a lower level of confidence than an indicated mineral resource and must not be converted to a mineral reserve. It is reasonably expected that the majority of inferred mineral resources could be upgraded to indicated mineral resources with continued exploration.
An "indicated mineral resource" is that part of a mineral resource for which quantity, grade or quality, densities, shape, and physical characteristics are estimated with sufficient confidence to allow the application of modifying factors in sufficient detail to support mine planning and evaluation of the economic viability of the deposit. Geological evidence is derived from adequately detailed and reliable exploration, sampling and testing and is sufficient to assume geological and grade or quality continuity between points of observation. An indicated mineral resource has a lower level of confidence than that applying to a measured mineral resource and may only be converted to a probable mineral reserve.
|
Mako Mining Corp. |
A "measured mineral resource" is that part of a mineral resource for which quantity, grade or quality, densities, shape, and physical characteristics are estimated with confidence sufficient to allow the application of modifying factors to support detailed mine planning and final evaluation of the economic viability of the deposit. Geological evidence is derived from detailed and reliable exploration, sampling and testing and is sufficient to confirm geological and grade or quality continuity between points of observation A measured mineral resource has a higher level of confidence than that applying to either an indicated mineral resource or an inferred mineral resource. It may be converted to a proven mineral reserve or to a probable mineral reserve.
"Modifying factors" are considerations used to convert mineral resources to mineral reserves. These include, but are not restricted to, mining, processing, metallurgical, infrastructure, economic, marketing, legal, environmental, social, and governmental factors.
14.7.1 Classification of Mineral Resources
To classify the block model grade estimates for the Moss Mine Project into the mineral resource categories of measured, indicated, and inferred, a statistical approach is employed to develop a classification scheme that complies with the CIM Best Practice Guidelines and NI 43-101 Regulations for the reporting of Mineral Resources and Mineral Reserves.
The underlying philosophy of this approach is to quantify the uncertainty of estimated contained metal in quarterly and yearly production. The uncertainty (or reliability) of estimation is a function of the spatial variability of the mineralization and the sample spacing.
Once the spatial variability of the mineralization is quantified through some type of spatial correlation function (semi-variogram, correlogram, etc.), it is possible to estimate the uncertainty of estimation for different sampling spacing and patterns over the two time periods.
A drill hole spacing study is carried out to determine the sample spacing and pattern that allows yearly production to be predicted to within 15% with a 90% confidence. This forms the basis for classifying indicated resources.
In a similar way the pattern and spacing are developed to form the basis for classifying measured resources. (The exact procedure for determining the confidence limits and grid spacing is given in Davis, B. M., Some Methods of Producing Interval Estimates for Global and Local Resources, SME preprint 97-5, 4 p.)
For the Moss Mine Project, measured material is considered known within ±15% with a 90% confidence for a quarterly production period, and indicated material is considered known within ±15% with a 90% confidence for an annual production period. The methodology considers an idealised block representing a one-month production period. Then a series of grids of different drill hole spacings are used to krige the idealized block to calculate the kriging variance. The idealized block for a one-month production period is approximately a panel of 430 ft by 430 ft by 20 ft. The kriging variance needs to be adjusted by the square of the CV to obtain a relative variance as normalized semi-variogram models were used to krige the panel. The kriging variance is then divided by 3 to get the quarterly production variance and by 12 to get the annual production variance. This gives the sample spacing for the measured and indicated categories.
|
Mako Mining Corp. |
The sample spacing information is then translated into a set of proximity of drill hole sampling-based classification rules. A 75 ft by 75 ft drill hole spacing would be sufficient to predict the block grade estimates within ±15% 90% of the time on a quarterly basis. This material would be considered as measured. A 200 ft by 200 ft drill hole spacing would be sufficient to predict the block grade estimates within ±15% 90% of the time on an annual basis. This material would be considered as indicated.
The rules used to delineate the mineral resources are defined as follows:
• Measured - minimum of 3 holes inside a 60 ft radius
• Indicated - minimum of 3 holes inside a 160 ft radius or a minimum of 2 holes inside a radius of 80ft or a minimum of one hole inside a radius of 50 ft.
• Inferred - are the remaining estimates up to 600 ft search radius.
The resulting codification of the block in the model was then smoothed looking for continuous clusters of blocks that are measured or indicated to remove any possible "spotted dog" effect. The "spotted dog" effect is the term used to describe isolated areas of measured or indicated material that is caused by the classification rules and isolated drill holes. Figure 14.19 displays a plan view of the classification as coded based on the rules listed above. Figure 14.20 displays a plan view after removing the isolated patches of measured and indicated material.
Summary statistics of the amount of data and distance to that data were generated to confirm the reliability of block gold grade estimates. Table 14.18 display summary statistics for the comparative confidence in the block model estimates including: the number of informed octants (NOCT), the number of drill holes used for a block estimate (NHOL), the number of composites used for a block estimate (NCMP), the distance to the nearest composite (NDIST), the average distances to the composites (ADIST), the distance to the farthest composite (FDIST), the kriging variance (OKVAR), the slope of regression (OKSLP) and the kriging efficiency (OKEFF).
A typical measured block gold grade estimate is informed by 16 composites from 5 drill holes in 5 octants with an average distance of 79.5 ft, kriging variance of 0.2176, a slope of regression of 0.9345, and a kriging efficiency of 68.4%.
A typical indicated block gold grade estimate is informed by 15 composites from 5 drill holes in 5 octants with an average distance of 140.3 ft, kriging variance of 0.3192, a slope of regression of 0.8791, and a kriging efficiency of 53.2%.
A typical inferred block gold grade estimate is informed by 9 composites from 3 drill holes in 3 octants with an average distance of 342.3 ft, kriging variance of 0.6835, a slope of regression of 0.4645, and a kriging efficiency of -8.4%.
|
Mako Mining Corp. |
Figure 14.19
Plan View at 1,910 Foot Elevation of the Classification of the Blocks before Smoothing
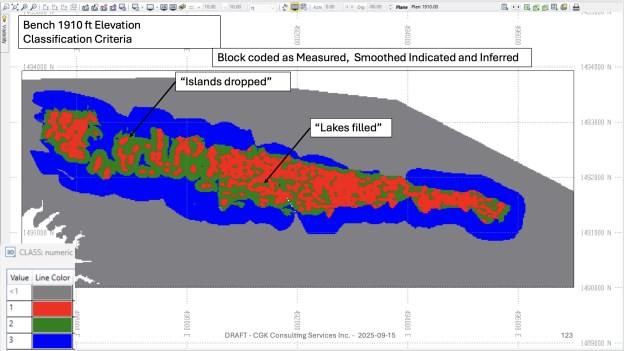 |
| C. Keech, CGK Consulting Services, 2025. |
Figure 14.20
Plan View at 1,910 Foot Elevation of the Classification of the Blocks After Smoothing
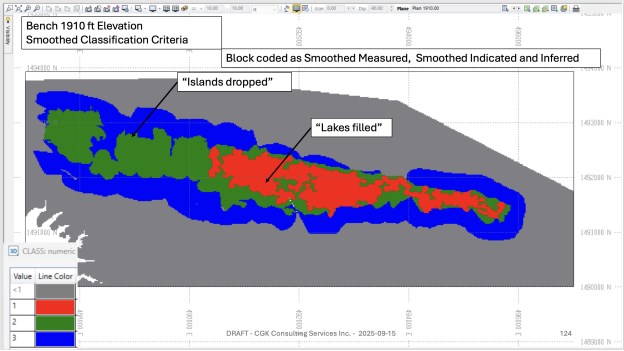 |
| C. Keech, CGK Consulting Services, 2025. |
|
Mako Mining Corp. |
Table 14.18
Summary Statistics Comparing Relative Measures of Confidence in Block Grades
|
CLASS |
No. of Blocks |
% of Blocks |
AUOPT |
AGOPT |
NOCT |
NHOL |
NCMP |
NDIST |
ADIST |
FDIST |
OKVAR |
OKSLP |
OKEFF |
|
1-meas. |
94,203 |
5.0% |
0.0076 |
0.0891 |
5 |
5 |
16 |
37.0 |
79.5 |
124.1 |
0.2176 |
0.9345 |
68.39% |
|
2-ind. |
348,934 |
18.5% |
0.0052 |
0.0578 |
5 |
5 |
15 |
76.2 |
140.3 |
207.4 |
0.3192 |
0.8791 |
53.22% |
|
3-inf. |
1,446,707 |
76.6% |
0.0018 |
0.018 |
3 |
3 |
9 |
281.3 |
342.3 |
405.3 |
0.6835 |
0.4645 |
-8.44% |
|
Total |
1,889,844 |
100.0% |
0.0027 |
0.0289 |
3 |
3 |
11 |
231.3 |
291.9 |
354.8 |
0.593 |
0.5645 |
6.77 |
|
Mako Mining Corp. |
14.7.2 Reasonable Prospects of Eventual Economic Extraction
To meet the CIM requirements of reasonable prospects of eventual economic extraction, an optimized pit shell was used to limit the mineral resources estimate at depth. A mineral resource pit shell limit was built by GVC using MineSight software by means of a Lerchs-Grossmann pit design method using the parameters listed in Table 14.19. The pit ("solid PIT19 $2500 MII") was optimized using material classified as measured indicated and inferred.
Table 14.19
Summary of Parameters for Mineral Resources Pit Resource Shell
| Description | Open Pit Shell |
| Mining Cost (US$/ton) | $3.18 |
| Mining Fill Cost (US$/ton) | $1.91 |
| Processing Cost (US$/ore ton) | $5.81 |
| G&A Cost (US$/ore ton) | $0.77 |
| Refinery Services and logistics Cost ($US/ore ton) | $0.28 |
| Gold Price (US$/oz) | $2,500 |
| Silver Price (US$/oz) | $29.20 |
| Royalties (%) | 0% |
| Gold Recovery Factor (%) | 75% |
| Silver Recovery Factor (%) | 33% |
| Pit Slope - Constant (degrees) | 55° |
| Breakeven Cut-off Grade (Au oz/ton) | 0.005 |
14.7.3 Mineral Resource Tabulation
The mineral resource estimate was completed by Mr. Chris Keech, P.Geo., a Qualified Person as defined in NI 43-101 and who is independent of Golden Vertex Corp., the limiting pit shell for the mineral resources estimate was developed by Mr. G. Vejar, Senior Mine Engineer of Mako Mining Corp. The open pit mineral resources are stated within the mineral resource pit shell and below the previously mined surface.
The measured and indicated mineral resources are inclusive of those mineral resources modified to produce mineral reserves. The mineral resource figures have been rounded to reflect that they are estimates. Mineral resources that are not mineral reserves do not have demonstrated economic viability. The estimate of mineral resources may be materially affected by environmental, permitting, legal, title, taxation, socio-political, marketing, or other relevant issues. The Qualified Person for this section of the report is not aware of any issues that would materially affect the estimate of the mineral resources as of the date of this report.
|
Mako Mining Corp. |
There has been insufficient exploration to define the inferred resources as an indicated or measured mineral resources. It is uncertain if further exploration will result in upgrading them to an indicated or measured mineral resources category
Figure 14.21 displays a plan view of the contours of the mineral resource pit shell and the drill hole traces. This mineral resource pit shell was developed using the parameters listed in Table 14.19.
Table 14.20 presents a summary of the open pit mineral resources inside the mineral resource pit shell at a series of cut-off grades. The breakeven gold cut-off grade is calculated by GVC to be 0.005 oz/ton Au. Table 14.21 presents a summary of the mineral resources inside the mineral resource pit shell at the 0.005 oz/ton Au cut-off by the mineral resource categories.
The open pit mineral resources for the Moss Mine Project are estimated to be 62.9 Mtons of measured and indicated material grading 0.0103 oz/ton Au and 0.1081 oz/ton Ag for a total of 646 koz of gold and 6.8 Moz silver. There are additional inferred open pit mineral resources, which are estimated to be 13.6 Mtons grading 0.0090 oz/ton Au and 0.0427 oz/ton Ag for a total of 122 koz of gold and 0.58 Moz silver.
Figure 14.21
Plan view of Pit19 at US $2500/oz Gold Mineral Resource Shell with Drill Hole Traces
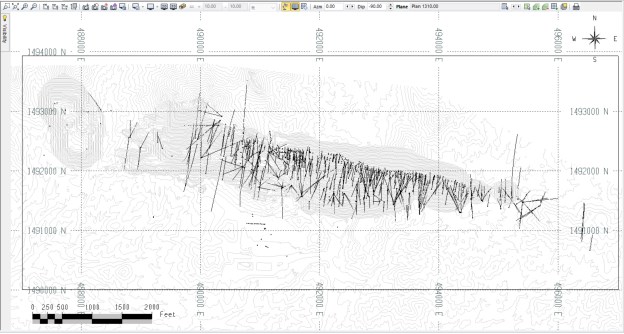 |
| C. Keech, CGK Consulting Services, 2025. |
|
Mako Mining Corp. |
Table 14.20
2025 Mineral Resource Estimate Sensitivity Analysis for a Series of Cut-Off Grades*
| Category | Cutoff oz/ton AuEq. |
k tons | AuEq oz/t |
Au oz/t |
Ag oz/t |
Au (koz) |
Ag (koz) |
| Measured | >= 0.0030 | 14,302 | 0.0093 | 0.0088 | 0.1091 | 126 | 1,560 |
| >= 0.0040 | 12,423 | 0.0102 | 0.0096 | 0.1203 | 119 | 1,494 | |
| >= 0.0050 | 10,527 | 0.0113 | 0.0106 | 0.1330 | 112 | 1,400 | |
| >= 0.0060 | 8,525 | 0.0126 | 0.0119 | 0.1489 | 101 | 1,269 | |
| >= 0.0070 | 6,696 | 0.0143 | 0.0135 | 0.1682 | 90 | 1,126 | |
| Indicated | >= 0.0030 | 67,370 | 0.0092 | 0.0087 | 0.0896 | 586 | 6,036 |
| >= 0.0040 | 60,133 | 0.0099 | 0.0094 | 0.0957 | 565 | 5,755 | |
| >= 0.0050 | 52,383 | 0.0107 | 0.0102 | 0.1031 | 534 | 5,401 | |
| >= 0.0060 | 44,282 | 0.0116 | 0.0111 | 0.1125 | 492 | 4,982 | |
| >= 0.0070 | 36,136 | 0.0128 | 0.0122 | 0.1251 | 441 | 4,521 | |
| Measured and Indicated | >= 0.0030 | 81,672 | 0.0092 | 0.0087 | 0.0930 | 712 | 7,597 |
| >= 0.0040 | 72,556 | 0.0100 | 0.0094 | 0.0999 | 685 | 7,249 | |
| >= 0.0050 | 62,910 | 0.0108 | 0.0103 | 0.1081 | 646 | 6,801 | |
| >= 0.0060 | 52,807 | 0.0118 | 0.0112 | 0.1184 | 593 | 6,251 | |
| >= 0.0070 | 42,832 | 0.0130 | 0.0124 | 0.1318 | 531 | 5,647 | |
| Inferred | >= 0.0030 | 17,178 | 0.0081 | 0.0079 | 0.0404 | 136 | 694 |
| >= 0.0040 | 15,322 | 0.0087 | 0.0085 | 0.0417 | 130 | 639 | |
| >= 0.0050 | 13,587 | 0.0092 | 0.0090 | 0.0427 | 122 | 580 | |
| >= 0.0060 | 11,573 | 0.0099 | 0.0096 | 0.0440 | 111 | 509 | |
| >= 0.0070 | 9,280 | 0.0107 | 0.0105 | 0.0463 | 97 | 430 |
*Notes: Mineral resources are estimated in conformance with the CIM mineral resource definitions referred to in NI 43-101 Standards of Disclosure for Mineral Projects. This mineral resource estimate covers the Moss Mine Project. Mineral resources that are not mineral reserves do not have demonstrated economic viability. The quantity and grade of the reported inferred mineral resources in this estimation are conceptual in nature and are estimated based on limited geological evidence and sampling. Geological evidence is sufficient to imply but not verify geological and grade or quality continuity. For these reasons, an inferred mineral resource has a lower level of confidence than an indicated mineral resource, however it is reasonably expected that most of the inferred mineral resources could be upgraded to indicated mineral resources with continued exploration. Mineral resources are reported within an optimized constraining shell using a gold price of US$2,500/oz and a silver price of US$29.2/oz with a gold recovery of 75% and a silver recovery of 33%. Gold grades were estimated using 10ft capped composites within 10 geological domains using ordinary kriging. Summation errors may occur in the tabulated results due to rounding.
|
Mako Mining Corp. |
Table 14.21
Summary of 2025 Mineral Resource Estimate by Classification Category*
|
Category |
Cut-off |
k tons |
AuEq |
Au oz/t |
Ag oz/t |
Au |
Ag |
|
Measured |
0.005 |
10,527 |
0.0113 |
0.0106 |
0.1330 |
112 |
1,400 |
|
Indicated |
0.005 |
52,383 |
0.0107 |
0.0102 |
0.1031 |
534 |
5,401 |
|
Measured + Indicated |
0.005 |
62,910 |
0.0108 |
0.0103 |
0.1081 |
646 |
6,801 |
|
Inferred |
0.005 |
13,587 |
0.0092 |
0.0090 |
0.0427 |
122 |
580 |
*Notes: Mineral resources are estimated in conformance with the CIM mineral resource definitions referred to in NI 43-101 Standards of Disclosure for Mineral Projects. This mineral resource estimate covers the Moss Mine Project. Mineral resources that are not mineral reserves do not have demonstrated economic viability. The quantity and grade of the reported inferred mineral resources in this estimation are conceptual in nature and are estimated based on limited geological evidence and sampling. Geological evidence is sufficient to imply but not verify geological and grade or quality continuity. For these reasons, an inferred mineral resource has a lower level of confidence than an indicated mineral resource, however it is reasonably expected that most of the inferred mineral resources could be upgraded to indicated mineral resources with continued exploration. Mineral resources are reported within an optimized constraining shell using a gold price of US$2,500/oz and a silver price of US$29.2/oz with a gold recovery of 75% and a silver recovery of 33%. Gold grades were estimated using 10ft capped composites within 10 geological domains using ordinary kriging. Summation errors may occur in the tabulated results due to rounding.
14.7.4 Comparison with 2021 Mineral Resource Estimate
The following is a summary comparison between the IMC estimation parameters completed in 2021 and updated estimation parameters for the December, 2025, by Mako Mining Corp.
Table 14.22 displays a summary of the estimation parameters and modifying factors for the mineral resources pit shells.
Table 14.22
Comparison of Mineral Resource Estimation Parameters for 2021 and 2025
| ITEMS | 2021 | 2025 | Comments |
| No. of Drill holes | 912 drill holes | 1,169 drill holes | additional drilling, mostly to the west in Reynolds pit area |
| Missing Data | no treatment | missing assays were assigned either an average of neighbours or a zero grade prior to compositing. | will reduce any possible smearing of gold or silver grades |
| Geology wireframes | Moss Vein, Ruth Vein, Stockwork Veins, Canyon Fault | Moss Vein, Ruth Vein, Reynolds Stockwork, Stockwork, Canyon Fault, Volcanic/Intrusive Contact | Moss and Ruth Veins more restricted to eastern area |
| Geological Domains | 6 | 10 | 2025 has more geological domains |
| Geological Domains | East_MV, East_RV, East_Stkwrk, West_MV, West_RV, West_Stkwrk | 1_Volc, 2_E_Intr, 3_W_Intr, 4_E_Stkwrk, 5_W_Strkwrk, 6_Ruthvn, 7_Mossvn_E, 8_Mossvn_W, 9_Volc_Stkwrk, 10_Reyn_Stkwrk | better control for grade interpolation |
|
Mako Mining Corp. |
| ITEMS | 2021 | 2025 | Comments |
| Grade Capping Au | from 0.3 to 0.1 o/t Au applied to assays (151 capped assays) | applies to 10ft composites from 0.005 to 0.30 o/t Au (40 composites capped) | removes less gold metal |
| Grade Capping Ag | from 1.46 to 2.92 o/t Ag applied to assays (92 capped assays) | applies to 10ft composites from 0.12 to 2.5 o/t Au (30 composites capped) | removes less silver metal |
| Compositing | 20 ft bench composites | Composite 10 ft run-length composites - (1/2 bench height) | smaller composites - less smoothing in estimation |
| Semi-Variograms | 280 degrees ranges of 150 ft to 200 ft | 280 degrees with dips ranging from 90 to 40 degrees | orientations better reflect shallower orientations |
| Grade Estimation | Inverse Distance cubed (ID3) | Ordinary Kriging, post variance correction | kriging uses semi-variogram model weighting; variance correction to match desired SMU |
| Boundaries | Hard boundaries | Hard Boundaries | same approach |
| Search restrictions | 0.060 o/t Au and 1.0 oz/ton Ag (55 ft) | 40 ft to 60ft Au > 0.05 oz/ton and Ag > 0.60 oz/ton | similar |
| 2-pass search method | pass1: 200x 150x 100 , min=3, max=10, max per hole 2; pass2: 240 x 180 x 120 ; min=1, max=10, max per hole 2 | pass1: 600x600x300, min 4, max 16, max 4 per hole; pass2: 400x400x200 min=8, max=16, max per hole 4; pass3: 200x200x100 min=12, max=16, max per hole 4 | 2025 estimate has larger search radii; more data used for block grade estimation |
| Classification | meas, < 75ft avg. distance, min 9 cmps, 4 holes; indicated < 150 avg. distance, min 3 cmps, 2 holes | meas: min 3 holes inside 60 ft radius, 3 holes in 160 ft radius or 2 hole inside 80 ft radius or 1 hole inside 50 ft radius; smoothed using conclus.f | similar ranges; smoothing with conclus. f reduces the "spotted dog" effect |
| Modifying Factors | Mining Cost $2.89 Mine Fill Cost $1.77 Process Cost $4.18 G&A Cost $1.77 Gold Recovery 77% Silver Recovery 43% Gold Price $1,800 US/oz Silver Price $22 US/oz Cutoff .0045 oz/ton Au |
Mining Cost $3.18 Mine Fill Cost $1.91 Process Cost $5.81 G&A Cost $0.77 Gold Recovery 77% Silver Recovery 43% Gold Price $2,500 US/oz Silver Price $29.2 US/oz Cutoff 0.005 AuEq oz/ton |
Significant increase in metal prices on the revenue side and increase costs on the operating side. There is some of a balance here. Same metal recoveries, with different economic cutoffs |
| Pit Slope | North Wall 63° South Wall 45° Fill Material 37° |
Constant Angle 55° | Variable angle versus constant angle. |
|
Mako Mining Corp. |
Table 14.23
Moss Mine Project - Mineral Resources, July 1, 2021
| Category | cutoff oz/ton Au | k tons | Au opt | Ag opt | Au (koz) | Ag (koz) |
| Measured | 0.0045 | 9,257 | 0.0120 | 0.0150 | 107 | 1,389 |
| Indicated | 0.0045 | 33,576 | 0.0110 | 0.1300 | 383 | 4,365 |
| Meas+Ind. | 0.0045 | 42,833 | 0.0110 | 0.1300 | 490 | 5,754 |
| Inferred | 0.0045 | 7,233 | 0.0100 | 0.1300 | 74 | 940 |
The 2021 Mineral Resource model estimated a total of 490,000 oz. Au in the measured and indicated category as shown in Table 14.23. While the 2025 Mineral Resource model estimates 646,000 oz. Au in the measured and indicated category. This is an increase of approximately 156,000 oz. or approximately a 30% increase in the estimated measured and indicated mineral resources.
The reason for this increase in estimated mineral resources in the 2025 estimate is due to the additional 257 drill holes, principally drilled on the western half of the project area, with specific focus on the Reynolds Area. This additional drill hole information has allowed for improved modelling of the Moss and Ruth veins, along with an improvement in the modelling of the Stockwork, especially in the Reynolds area (Reynolds Stockwork).
|
Mako Mining Corp. |
INAPPLICABLE SECTIONS
The following sections of an NI 43-101 Technical Report are not applicable to this report.
15.0 MINERAL RESERVE ESTIMATES
16.0 MINING METHODS
17.0 RECOVERY METHODS
18.0 PROJECT INFRASTRUCTURE
19.0 MARKET STUDIES AND CONTRACTS
20.0 ENVIRONMENTAL STUDIES, PERMITTING AND SOCIAL OR COMMUNITY IMPACT
21.0 CAPITAL AND OPERATING COSTS
22.0 ECONOMIC ANALYSIS
|
Mako Mining Corp. |
23.0 ADJACENT PROPERTIES
The following information was taken from the 2021 Technical Report. It has been updated using public sources i.e. websites and press releases. The websites for the individual companies are indicated below. The QP has been unable to verify the information in this section and the following information is not necessarily indicative of the mineralization on the property that is the subject of this Technical Report.
Mohave County, Arizona has a long history of precious metal production from epithermal veins (e.g., Goldroad and the Oatman Mining District (cornerstone-environmental.com)). The historic Gold Road Mine is currently in the process of being re-activated, the Mine is located about 5 miles east of the Moss Mine. The district around Moss and Gold Road is currently an active area of exploration area with two other projects currently drilling (Figure 23.1).
23.1.1 Gold Road Mine (Gold Road Inc.)
The Gold Road Mine is located in the Oatman mining District which is reported to be the oldest mining district in Arizona, producing over 2 million ounces of gold from 1863 until 1940. The Gold Road Mine is reported to have produced about 746,000 ounces of the total district production.
The Gold Road Mine was placed back into production by Aura Minerals, Inc. (Aura, www.auraminerals.com) achieving commercial production in December of 2020; however, it announced that had sold the mine on July 27, 2022, citing geological challenges and lower than expected grades.
Rodrigo Barbosa, President and CEO of Aura, commented:
"We knew the risks involved on Gold Road Acquisition, which was that it did not have gold reserves and only resources, and that is why we decided to start small, assume a non-recourse debt, and, over the years, generate cash from the operation to reinvest and grow it to over 50k Oz. Unfortunately, the geological risks materialized. We did not find the expected grades and the operations did not generate cash to reinvest and grow. Although it remains interesting geological potential, it would require significant additional cash and time (several years) in exploration."
Gold Road was acquired by a Canadian private company, "Gold Road Inc." May 28, 2025. The New company re-started the plant on September 11, 2025 and produced the first gold pour from re-processed tailings on October 23, 2025. The company is planning to re-start underground mining in 2026 and possibly take the company public with an IPO in 2026 (www.goldroadusa.com)
Arizona Gold & Silver Inc. (Arizona Gold & Silver) is exploring the Philadelphia property, located about 6 miles north of the Moss Mine. Arizona Gold & Silver reports drilling high grade gold and silver epithermal vein intercepts along the approximately 2-mile-long Philadelphia Vein in the Arabian Mine Fault (www.arizonagoldsilver.com).
Arizona Gold & Silver has completed over 155 drill holes. Reported high grade intervals include: 9.04 g/t Au and 34.0 g/t Ag over 20.4 m, and typical high-grade intercepts range from 10-30 g/t Au over 0.7 to 1.5 m. Additionally, several wide, low-grade intersects are reported: 1.34 g/t Au over 115m and 1.57 g/t Au over 104 m. Approximately 80 acres of the 3,300 acres have been explored to date. The project is 100% owned/controlled by Arizona Gold & Silver.
|
Mako Mining Corp. |
Figure 23.1
Location of Projects Adjacent to Moss Mine
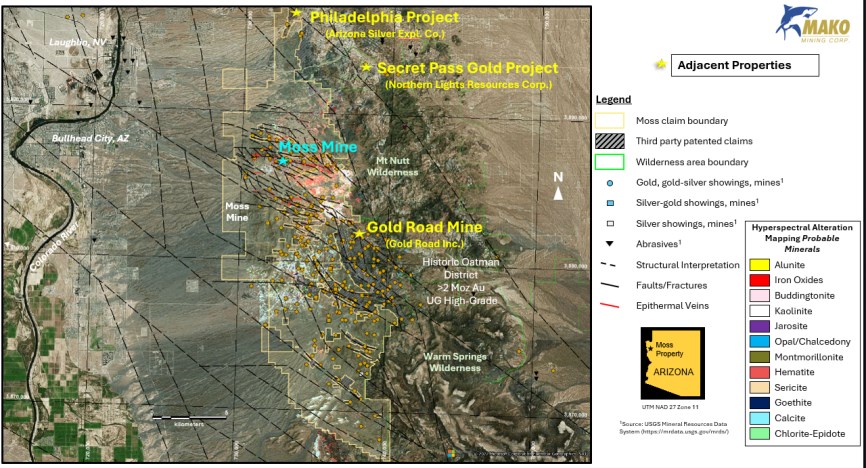
Source: Mako, January, 2026.
|
Mako Mining Corp. |
23.1.2 Gold Chain Project (Westpoint Gold Corp.)
Westpoint Gold Corp. (Westpoint, formerly Gold79 Mines Ltd.) is exploring the Gold Chain Project which is located between three to five miles north of the Philadelphia project and approximately 11 miles north of the Moss Mine (see Figure 6). Westpoint has identified 3 main exploration areas detailed below (www.westpointgold.com).
The Main target and the focus of drilling to date is the Tyro vein system, which extends for approximately 3.4 km. The Tyro Vein system is a low sulfidation epithermal vein/stockwork zone. The main zone had limited open cut mining in the 1980s, which exposed the stockwork nature of the vein in this area (Figure 23.2). Highlight of intersections are shown in Figure 23.3.
The other exploration targets are the Banner-sheep Trail Trend which is described as a +15 km mineralized structural corridor with multiple historical high-grade underground mines. Recent sampling in this area returned 15 samples > 10 g/t Au.
The third exploration target is the Frisco Graben Trend An area defined by geophysics, mapping and sampling that measures 750 m x 4 km with potential for a low sulfidation epithermal precious metal system.
At of the effective date of this report, Westpoint was planning to raise +$20 million for exploration and advancement of the Gold Chain Project.
Figure 23.2
Westpoint's Tyro Main Zone showing the Historical Mining Cut and Stockwork*
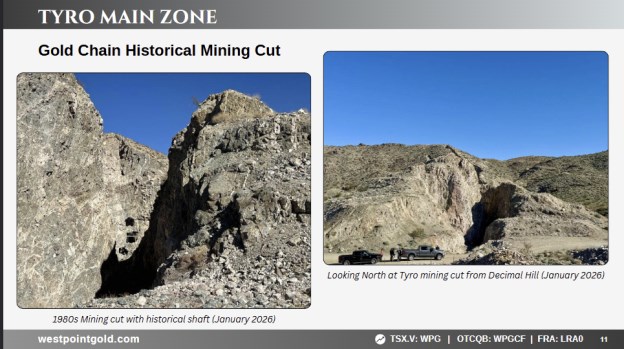 |
| *Note: Figure taken from Westpoint's corporate presentation. |
|
Mako Mining Corp. |
Figure 23.3
Drilling Highlights of Westpoint's Tyro Main Zone*
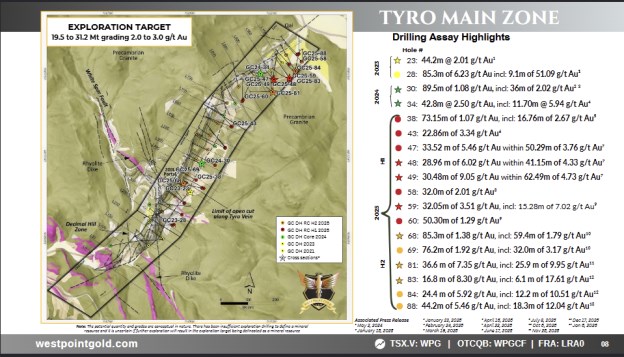 |
| *Note: Figure taken from Westpoint's corporate presentation. |
23.1.3 Secret Pass Project (Northern Lights Resource Corp.)
Northern Lights Resources Corp. is exploring the Secret Pass Project located 6-7 miles northeast of the Moss Mine (Figure 23.1). There has been historic drilling at Secret Pass that is reported to have intersected epithermal and/or detachment fault-associated oxide gold and silver mineralization (https://www.northernlightsresources.com).
Approximately 14,000 metres were drilled in 126 drill holes by Santa Fe Mining Incorporated (Santa Fe Mining) and Fischer-Watt Mining Company (Fischer-Watt) between 1984 and 1991. In 2022, Northern Lights drilled 610 m in four diamond holes and identified a mineralized zone that extends approximately 245 m along strike to a depth of 180 m. The width of the zone varies between 7.6 m to 86 m, with an average with of about 36 m. Grades within this zone range between 2.8 and 40.4 g/t Au with a weighted average grade of 5.0 g/t Au.
Northern Lights is intending to continue to explore the property.
|
Mako Mining Corp. |
24.0 OTHER RELEVANT DATA AND INFORMATION
This section discusses the previous mining, processing and environmental aspects of the Moss Mine Project which was an operating mine until the previous operator went into insolvency. The majority of the discussions were extracted from the previous July 1, 2021, Technical Report and updated where necessary.
Mako has acquired the Moss Mine Project out of bankruptcy and is in the process of bringing the Moss Mine Project back into full production as it has been refining the geological database and the geological model along with test mining various areas since acquiring the Project. The current mineral resources, as disclosed in Section 14 of this Technical Report, will most likely be used as the basis upon which Mako revises the production mine plan as it looks to revive full production at the Moss Mine Project.
24.1 Mining Methods
The Moss deposit was mined by conventional open pit hard rock mining methods by contract miner McCoy and Sons Inc. ("McCoy") with drilling and blasting subcontracted to WESCO. The original mine plan was based on a continuation of contract mining.
Mining of the deposit was accomplished with 70 ton to 100-ton rigid frame haul trucks and front-end loaders. Excavators were used for loading in areas where dilution could be an issue at ore-waste boundaries. Mining geometries were designed with nominal 200 ft operating widths to allow for equipment operating room. Mining occurred at 20-ft bench heights, and the pit configuration was triple benched with catch benches every vertical 60 ft.
24.1.1 Mine Design
A total of four phase or pushback designs were developed to achieve the ultimate pit design. The Phase designs were practical expansions of the mine excavation that incorporate haul road designs, operating room for equipment and all practical mining requirements.
24.1.2 Design Parameters
The pit slope angles were based on recommendations from a March, 2017, report from Golder and Associates Inc. "Pit Slope Design Recommendations Moss Gold-Silver Project". The Golder report recommended that 55° interramp angles (70° bench face angle with 20 ft catch benches every vertical 60 ft) would be achievable. The report also mentioned that with excellent pre-split blasting results, the bench face angle can be increased from 70° to 80° resulting in an interramp angle of 63°.
The blasting operator achieved at least 80° bench face angles from pre-split blasting on the north side of the pit (footwall). The same results were not achieved on the south side of the pit (hanging wall). An interramp angle of 63° was used in phase designs on the north side of the pit, and an interramp angle of 55° was used on the south side of the pit based on the Golder report and discussions with the site as to how the mine was operating.
|
Mako Mining Corp. |
24.1.3 Mining Pit Phase Progression
The pit phase progression was to occur in the order of least expensive gold ounces to mine to most expensive. The crusher location and the leach pad both south of the pit were to be left undisturbed by the phase designs.
24.1.4 Mine Production Schedule
The mine production schedule was based on the phase designs and the planned crusher feed rate. Sufficient waste was to be moved during the mine life to assure continued release of the required 11,000 tons per day ("t/d") process feed material. The cutoff grade of was estimated to be 0.006 oz/ton gold.
The crusher location is directly south of the central pit with a surge stockpile located at the crusher pocket. The crusher pocket was not large enough for trucks to direct dump into the crusher and all material was to be stockpiled and fed to the crusher with a CAT 988 front-end loader.
24.1.5 Waste Storage
The waste storage area is directly south of the east pit. Some of the historical waste was to be rehandled in the mining of Phase 3. The mine plan placed waste rock further south and higher than the configuration of the waste dump at the time.
The waste dump was to be constructed in 50 ft lifts at an angle of 2.5:1; with the angle to be achieved by leaving a 60 ft step-back every 50 ft lift.
24.2 Recovery Methods
The Moss Mine extracted gold and silver from the ore via heap leaching. The mined ore was crushed and conveyed to heaps where it is stacked. Following stacking, the leach pads were irrigated with dilute sodium cyanide solution. Gold and silver were dissolved as the sodium cyanide solution passes through the leach pads. The solution (referred to as pregnant solution) exited the leach pads and flowed to a pregnant solution pond. From the pregnant solution pond, the solution passed through a Merrill-Crowe plant where the gold and silver was precipitated out of solution using zinc powder. The precipitate was filtered, dried, and smelted to produce doré bars.
The following discussion presents a summary process flowsheet along with a process description. Also presented is a summary of process statistics from the operation.
24.3 Project Infrastructure
As the Moss Mine has been in production, sufficient infrastructure existed to produce gold and silver.
A power transmission line was constructed (approximately 11 miles) from Bullhead City to the mine site. The 24.9 kV power line was energized through Mohave Electrical Co- operative on September 9, 2020, allowing the mine to go off diesel power generation. However, a few of the diesel generators remained on site for backup.
|
Mako Mining Corp. |
The total water demand at the mine site averaged about 225 gallons per minute (gpm). During peak periods water demand ranged from about 200 gpm up to 300 gpm. The principal source for the water supply was from pumped groundwater as well as pit de-watering. Make-up water demand was seasonal due to variations in the temperature, humidity and precipitation during the year. Make up water was trucked to site, when necessary.
All administration and support offices were located at the mine site. A warehouse was located off Silver Creek Road within Bullhead City limits. The warehouse was a 1,500 square foot building with a two-acre laydown yard.
Access to the fenced mine site was through a gate which was monitored 24-hours a day by site security personnel. Visitors were required to sign in and out and a badge system was installed for access to the site by authorized personnel.
There were no maintenance workshops or a truck shop for the mining contractor on site. However, an area on the existing waste rock facility was provided for the mining contractor to perform equipment maintenance.
Blasthole samples were prepared and analysed on site. The existing assay laboratory was housed in a shipping container for sample preparation. Two wooden sheds (12 x 32 ft) were retro-fitted to house the wet assay and fire assay laboratories. The laboratory was capable of processing about 160-180 samples per day during two shifts.
Goden Vertex provided company vans to transport personnel to and from the mine site. Employee parking was available at the warehouse in Bullhead City as there was limited parking at the mine site.
24.4 Environmental Studies, Permitting and Social or Community Impact
The Moss Mine authorized mining and processing facilities are located on patented lode claims (private lands), Arizona State lands, and unpatented lode claims on public lands administered by the BLM. A significant body of environmental and socio- economic work was conducted to support the Phase III Moss Mine Expansion and Exploration Project, approved by BLM on March 18, 2020, as the Moss Mine expanded from private lands to BLM administered lands.
The work was developed to support operational permit applications and as long as the operation did not exceed BLM-approved facility footprints, the entirety of the information was valid and credible for this analysis. The work, which included baseline data assessments and geochemical analysis, was supplemented continuously in conformance with applicable permit monitoring and reporting requirements while the mine operated.
There were no identified issues that would have prevent the mine from achieving any authorizations that were required to develop the resource to extend the mine life based on the data that had been collected to date.
24.4.1 Environmental
Key issues identified during BLM environmental analyses included air quality (dust emissions); biological resources including springs and riparian vegetation; bats and wildlife use and management; habitat corridors and fragmentation; special status species habitat and use; vegetation and invasive species; cultural and tribal resources; noise; public access and recreation; socioeconomics; visual resources; groundwater resources; and cumulative impacts.
|
Mako Mining Corp. |
A baseline study program was completed in response to these key issues that supported the completion of the recently completed multiple Federal and State agency permitting and approval process.
24.4.2 Permitting
All land use and facility operating permits were in place to operate the Moss Mine. The following agencies served as Cooperating Agencies with BLM during the Phase III plan review and impact assessment processes: Arizona Department of Environmental Quality ("ADEQ"), Arizona Game and Fish Department, City of Bullhead City, Mohave County, and Fort Mojave Indian Tribe. The Arizona State Mine Inspector ("ASMI") oversees the reclamation plan on private lands.
|
Mako Mining Corp. |
25.0 INTERPRETATION AND CONCLUSIONS
25.1 Conclusions
Mako has acquired the Moss Mine Project out of bankruptcy and the updated resource estimate indicates that there are sufficient resources at the mine site for the operation along with good exploration potential in the immediate district from which to pursue secondary mining areas should further exploration prove the existence of economic mineralization.
The QP notes that since the Oatman Mining District is well known for its production history, there should be further zones of economic mineralization waiting to be fully defined by well-run exploration programs given the recent sustained rise in metal prices.
Mako is also in the process of bringing the Moss Mine Project back into full production as it has been refining the geological database and the geological model along with test mining various areas since acquiring the Project. The current mineral resources will most likely be used as the basis upon which Mako revises the production mineplan as it looks to revive full production at the Moss Mine Project.
This report may disclose technical information, the presentation of which requires the Qualified Persons (QPs) to derive sub-totals, totals and weighted averages that inherently involve a degree of rounding and, consequently, introduce a margin of error. Where these occur, the QPs do not consider them to be material.
25.2 Metallurgical Testwork and Processing
The metallurgical testwork and operating performance at the Moss Mine demonstrate that the selected crushing and heap leach processing method is appropriate for the ore types mined to date. Laboratory column testing, bottle roll programs, and production reconciliation data show generally consistent gold recoveries and acceptable correlation between predicted and actual performance. Operational recoveries of approximately 75% for gold and 40% for silver are supported by both historical testwork and cumulative production data.
Gold recovery performance is stable and predictable, with leach kinetics consistent with partial encapsulation and diffusion-controlled extraction during later stages of leaching. Silver recovery is more variable and exhibits slower leach kinetics, resulting in greater uncertainty in forecasting; however, observed operational performance supports the recovery assumptions applied in this report.
The substantial operating history since 2018 provides a strong empirical basis for metallurgical recovery projections. No deleterious elements have been identified that materially impact processing performance under current operating conditions. The metallurgical database is considered sufficient to support the recovery assumptions used in this Technical Report.
To maintain and enhance confidence in long-term recovery projections, the following is recommended:
|
Mako Mining Corp. |
Perform statistical correlation analysis between bottle roll and column leach results to improve recovery forecasting at the operational level.
Conduct selected extended-duration column tests to determine ultimate gold and silver recoveries beyond nominal leach periods.
Undertake additional investigation into silver recovery variability, including mineralogical characterization and leach kinetics assessment, to refine recovery projections.
These recommendations are intended to support ongoing reconciliation, optimize heap leach performance, and ensure that recovery assumptions remain valid as ore characteristics evolve over the life of mine.
25.3 Mineral Resource Estimate
25.3.1 Introduction
The mineral resource estimate was carried out by Chris Keech, P.Geo., Principal Geologist of CGK Consulting Services Inc (CGK) using MineSight® version 15.4 software for the development of the block model gold and silver block grade estimates and Geostokos Toolkit® for variography analysis of the composited gold and silver grades. Mr. Keech is a Qualified Person and is independent of Mako as defined by NI 43-101.
The mineral resources estimate for the Moss Mine Project has been carried out in accordance with the CIM's "Estimation of Mineral Resources and Mineral Reserves Best Practice Guidelines" (November 2019). The mineral resources have been generated from drill hole data the interpretation of a geological model that identifies the spatial distribution of the gold and silver grades. The interpolation parameters have been defined based on the drill hole data and the geological interpretation and geostatistical analysis of that data.
The mineral resources have been classified by proximity to data locations and the quality of the data and have been reported in accordance with CIM's "Standards on Mineral Resources and Reserves" (May 2014) as required by NI 43-101.
25.3.2 Drill Hole Database
The drill hole data inside the block model area consists of 1,169 drill holes totalling 452,086 ft of drilling with 87,471 sample intervals. RC drilling has contributed more than 55% of the drill holes and more than 81% of the sample intervals to the drill hole database inside the block model limits. Next are the core drill holes, which have contributed 11% of the holes and 12% of the sample intervals. The remaining 33% of the drill holes are short rotary holes which account for 6% of the sample intervals.
25.3.3 Geological Model
The Geological Block Model was constructed based on four wireframe solids that represent the Stockwork mineralization, the Moss Vein, the Ruth Vein and a higher-grade Reynolds Stockwork mineralization. This interpretation was developed by Mr. Gary Wong, P.Eng of PDM Technical Services Ltd. on Northwest facing cross-section. In addition to these wireframe solids, two surfaces were also considered, one representing the Canyon fault and the other representing the geological contact between the Intrusive rocks in the east with the Volcanic rocks in the west.
|
Mako Mining Corp. |
This geological interpretation was used to code the block model and develop 10 geological domains.
The Stockwork mineralization has been divided into three domains, East Stockwork Intrusive, West Stockwork Intrusive and Volcanic Stockwork Intrusive. Inside the East Stockwork, lies the Ruth and Moss Veins. The Moss Vein dips steeply to the south, while the Ruth Vein dips moderately to the north. Both veins are enveloped by the Stockwork style mineralization.
The drill hole assays were coded using the block model to assign the geological codes that were used to carry out the Exploratory Data Analysis and Variography.
25.3.4 Exploratory Data Analysis
Statistical and graphical summaries of the gold and silver grades were produced to understand the distribution of the grades in the deposit. The statistical and graphical summaries include histograms, log-probability plots, side-by-side boxplots, scatterplots, decile analysis plots and contact plots. The assays were separated by mineralised zone to examine the distribution of the gold and silver assay grades. The results of this analysis were used to develop the estimation parameters.
25.3.5 Composites
Analysis of the samples lengths shows that 87% of the assays inside the block model area are 5 ft in length. Compositing the drill hole assay intervals provide a common sample support for the estimation algorithm. The selected bench height for the block model is 20 ft and often a half bench height (10 ft) is a good choice for a composite length, as there is some variance reduction, but not too much, and there is a reduction in the number of data to be used by the estimation algorithm. Therefore, a 10 ft composite length was chosen for the estimation of gold and silver grades. The compositing started at the collar of the hole and proceeded at 10 ft regular intervals down the drill holes.
25.3.6 Density
A total of 506 specific gravity determinations were performed on drill core samples collected from material within the mineralized zones. These determinations were performed by ALS Chemex laboratory using unsealed immersion technique to measure the weight of each sample in air and in water (ALS Chemex standard OA-GRA08).
Previous work with the 506 SG determinations has shown that material within 40 ft of the surface has a lower dry bulk density of 2.51 g/cm and that material below 40 ft depth has a higher dry bulk density of 2.58 g/cm.
However, a tonnage factor of 12.35 cu-ft/short ton has been used by Moss Mine since the mine opened, and this factor has proven to be sufficiently accurate to be considered reliable in estimating the mined tonnage. This is equivalent to a dry density of 2.59 g/cm.
|
Mako Mining Corp. |
Consequently, for this mineral resource estimate, the QP for this section of the report recommends continuing the use of 12.35 cu-ft/short ton as the tonnage factor for estimating all in-situ tonnage estimated in the block model.
25.3.7 Block Model
A 3D block model was constructed using MineSight® 15.4 software with the dimensions shown in Table 14.10. The block size was chosen to reflect a potential selective mining unit (SMU) of 20 ft x 20 ft x 20 ft, given the anticipated open-pit mining scenario. The block model covers an area of approximately 10,000 ft by 4,000 ft in plan view, and approximately 2,200 ft vertically. The block model coordinates are in local coordinates, which are based on Arizona State Plane West Zone, 0203; UTM 12.
The estimation of gold and silver grades was carried out using ordinary kriging in MineSight® 15.4 software using a three-pass search strategy to use the most local 10ft composite data to a block location being estimated.
25.3.8 Gold Grade Estimation Parameters
The following is a summary of the parameters used to estimate the block gold grades by domain in the block model.
• Capped gold grade 10 ft composites were used for ordinary kriging into the blocks in the model for domains 1, 2, 3, 4, 5, 6, 7, 8, 9, 10.
• In addition to capping the 10 ft gold composite grades, an outlier restriction of 40 ft was used for domains 1, 2, 3, and 10; and an outlier restriction of 60 ft was used for domains 4, 5 and 9 (Stockwork). The grade thresholds for the outlier restriction were taken from the Decile Analysis results. No outlier restrictions were used for domains 6, 7 and 8 (Ruth and Moss Veins).
• Geological boundaries are based on the domain wireframes, and the domain codes were assigned to the block model and used to control the selection of the 10 ft composites and the blocks to be estimated. There was no sharing of composites across the domain boundaries.
• Spatial 3D mathematical models were fitted to the experimental semi-variograms for each of the domains and used for ordinary kriging of the blocks in the model.
• A three-pass search strategy was used with the ranges based on the drill hole spacing and semi-variogram models. The search ellipsoids were expanded to ensure a reasonable amount of the blocks in each domain were estimated.
• A minimum of four and maximum of 16 composites were required to make a block estimate, with a maximum of four from a single drill hole for pass 1.
• A minimum of eight and maximum of 16 composites were required to make a block estimate, with a maximum of four from a single drill hole for pass 2.
• A minimum of 12 and maximum of 16 composites were required to make a block estimate, with a maximum of four from a single drill hole for pass 3.
|
Mako Mining Corp. |
25.3.9 Silver Grade Estimation Parameters
The following is a summary of the parameters used to estimate the block silver grades by domain in the block model.
• Capped silver grade 10ft composites were used for ordinary kriging into the blocks in the model for domains 1, 2, 3, 4, 5, 6, 7, 8, 9, 10.
• In addition to capping the 10ft silver composite grades, an outlier restriction of 40ft was used for domains 1, 2, 3, and 10; and an outlier restriction of 60ft was used for domains 4, 5 and 9 (Stockwork). The grade thresholds for the outlier restriction were taken from the Decile Analysis results. No outlier restrictions were used for domains 6, 7 and 8 (Ruth and Moss Veins).
• Geological boundaries are based on the domain wireframes, and the domain codes were assigned to the block model and used to control the selection of the 10ft composites and the blocks to be estimated. There was no sharing of composites across the domain boundaries.
• Spatial 3D mathematical models were fitted to the experimental semi-variograms for each of the domains and used for ordinary kriging of the blocks in the model.
• A three-pass search strategy was used with the ranges based on the drill hole spacing and semi-variogram models. The search ellipsoids were expanded to ensure a reasonable amount of the blocks in each domain were estimated.
• A minimum of four and maximum of 16 composites were required to make a block estimate, with a maximum of four from a single drill hole for pass 1.
• A minimum of eight and maximum of 16 composites were required to make a block estimate, with a maximum of four from a single drill hole for pass 2.
• A minimum of 12 and maximum of 16 composites were required to make a block estimate, with a maximum of four from a single drill hole for pass 3.
25.3.10 Classification of Mineral Resources
To classify the block model grade estimates for the Moss Mine Project into the mineral resource categories of measured, indicated, and inferred, a statistical approach is employed to develop a classification scheme that complies with the CIM Best Practice Guidelines and NI 43-101 Regulations for the reporting of Mineral Resources and Mineral Reserves.
The underlying philosophy of this approach is to quantify the uncertainty of estimated contained metal in quarterly and yearly production. The uncertainty (or reliability) of estimation is a function of the spatial variability of the mineralization and the sample spacing.
Once the spatial variability of the mineralization is quantified through some type of spatial correlation function (semi-variogram, correlogram, etc.), it is possible to estimate the uncertainty of estimation for different sampling spacing and patterns over the two time periods.
A drill hole spacing study is carried out to determine the sample spacing and pattern that allows yearly production to be predicted to within 15% with a 90% confidence. This forms the basis for classifying indicated resources.
|
Mako Mining Corp. |
In a similar way the pattern and spacing are developed to form the basis for classifying measured resources. (The exact procedure for determining the confidence limits and grid spacing is given in Davis, B. M., Some Methods of Producing Interval Estimates for Global and Local Resources, SME preprint 97-5, 4 p.)
For the Moss Mine Project, measured material is considered known within ±15% with a 90% confidence a quarterly production period, and indicated material is considered known within ±15% with a 90% confidence for an annual production period. The methodology considers an idealised block representing a one-month production period. Then a series of grids of different drill hole spacings are used to krige the idealized block to calculate the kriging variance. The idealized block for a one-month production period is approximately a panel of 430 ft by 430 ft by 20 ft. The kriging variance needs to be adjusted by the square of the CV to obtain a relative variance as normalized semi-variogram models were used to krige the panel. The kriging variance is then divided by the 3 to get the quarterly production variance and by 12 to get the annual production variance. This gives the sample spacing for the measured and indicated categories.
The sample spacing information is then translated into a set of proximity of drill hole sampling-based classification rules. A 75 ft by 75 ft drill hole spacing would be sufficient to predict the block grade estimates within ±15% 90% of the time on a quarterly basis. This material would be considered as measured. A 200 ft by 200 ft drill hole spacing would be sufficient to predict the block grade estimates within ±15% 90% of the time on an annual basis. This material would be considered as indicated.
The rules used to delineate the mineral resources are defined as follows:
• Measured - minimum of 3 holes inside a 60 ft radius
• Indicated - minimum of 3 holes inside a 160 ft radius or a minimum of 2 holes inside a radius of 80ft or a minimum of one hole inside a radius of 50 ft.
• Inferred - are the remaining estimates up to 600 ft search radius.
The resulting codification of the block in the mode was then smoothed looking for continuous clusters of blocks that are measured or indicated to remove any possible "spotted dog" effect. The "spotted dog" effect is the term used to describe isolated areas of measured or indicated material that is caused by the classification rules and isolated drill holes. Figure 14.19 displays a plan view of the classification as coded based on the rules listed above. Figure 14.20 displays a plan view after removing the isolated patches of measured and indicated material.
Summary statistics of the amount of data and distance to that data were generated to confirm the reliability of block gold grade estimates. Table 14.18 display summary statistics for the comparative confidence in the block model estimates including: the number of informed octants (NOCT), the number of drill holes used for a block estimate (NHOL), the number of composites used for a block estimate (NCMP), the distance to the nearest composite (NDIST), the average distances to the composites (ADIST), the distance to the farthest composite (FDIST), the kriging variance (OKVAR), the slope of regression (OKSLP) and the kriging efficiency (OKEFF).
|
Mako Mining Corp. |
A typical measured block gold grade estimate is informed by 16 composites from 5 drill holes in 5 octants with an average distance of 79.5 ft, kriging variance of 0.2176, a slope of regression of 0.9345, and a kriging efficiency of 68.4%.
A typical indicated block gold grade estimate is informed by 15 composites from 5 drill holes in 5 octants with an average distance of 140.3 ft, kriging variance of 0.3192, a slope of regression of 0.8791, and a kriging efficiency of 53.2%.
A typical inferred block gold grade estimate is informed by 9 composites from 3 drill holes in 3 octants with an average distance of 342.3 ft, kriging variance of 0.6835, a slope of regression of 0.4645, and a kriging efficiency of -8.4%.
25.3.11 Reasonable Prospects of Eventual Economic Extraction
To meet the CIM requirements of reasonable prospects of eventual economic extraction, an optimized pit shell was used to limit the mineral resources estimate at depth. A mineral resource pit shell limit was built by GVC using MineSight software by means of a Lerchs-Grossmann pit design method using the parameters listed in Table 25.1. The pit ("solid PIT19 $2500 MII") was optimized using material classified as measured indicated and inferred.
Table 25.1
Summary of Parameters for Mineral Resources Pit Resource Shell
| Description | Open Pit Shell |
| Mining Cost (US$/ton) | $3.18 |
| Mining Fill Cost (US$/ton) | $1.91 |
| Processing Cost (US$/ore ton) | $5.81 |
| G&A Cost (US$/ore ton) | $0.77 |
| Refinery Services and logistics Cost ($US/ore ton) | $0.28 |
| Gold Price (US$/oz) | $2,500 |
| Silver Price (US$/oz) | $29.20 |
| Royalties (%) | 0% |
| Gold Recovery Factor (%) | 75% |
| Silver Recovery Factor (%) | 33% |
| Pit Slope - Constant (degrees) | 55° |
| Breakeven Cut-off Grade (Au oz/ton) | 0.005 |
25.3.12 Mineral Resource Estimation Tabulation
The mineral resource estimate was completed by Mr. Chris Keech, P.Geo., a Qualified Person as defined in NI 43-101 and who is independent of Golden Vertex Corp., the limiting pit shell for the mineral resources estimate was developed by Mr. G. Vejar, Senior Mine Engineer of Mako. The open pit mineral resources are stated within the mineral resource pit shell and below the previously mined surface.
|
Mako Mining Corp. |
The measured and indicated mineral resources are inclusive of those mineral resources modified to produce mineral reserves. The mineral resource figures have been rounded to reflect that they are estimates. Mineral resources that are not mineral reserves do not have demonstrated economic viability. The estimate of mineral resources may be materially affected by environmental, permitting, legal, title, taxation, socio-political, marketing, or other relevant issues. The Qualified Person for this section of the report is not aware of any issues that would materially affect the estimate of the mineral resources as of the date of this report.
There has been insufficient exploration to define the inferred resources as an indicated or measured mineral resources. It is uncertain if further exploration will result in upgrading them to an indicated or measured mineral resources category
The mineral resource pit shell was developed using the parameters list in Table 25.1
Table 25.2 presents a summary of the open pit mineral resources inside the mineral resource pit shell at a series of cut-off grades. The breakeven gold cut-off grade is calculated by Golden Vertex to be 0.005 oz/ton Au. Table 25.3 presents a summary of the mineral resources inside the mineral resource pit shell at the 0.005 oz/ton Au cut-off by the mineral resource categories.
The open pit mineral resources for the Moss Mine Project are estimated to be 62.9 Mtons of measured and indicated material grading 0.0103 oz/ton Au and 0.1081 oz/ton Ag for a total of 646 koz of gold and 6.8 Moz silver. There are additional inferred open pit mineral resources, which are estimated to be 13.6 Mtons grading 0.0090 oz/ton Au and 0.0427 oz/ton Ag for a total of 122 koz of gold and 0.58 Moz silver.
Table 25.2
2025 Mineral Resource Estimate Sensitivity Analysis for a Series of Cut-Off Grades*
| Category | Cutoff oz/ton AuEq. |
k tons | AuEq oz/t |
Au oz/t |
Ag oz/t |
Au (koz) |
Ag (koz) |
| Measured | >= 0.0030 | 14,302 | 0.0093 | 0.0088 | 0.1091 | 126 | 1,560 |
| >= 0.0040 | 12,423 | 0.0102 | 0.0096 | 0.1203 | 119 | 1,494 | |
| >= 0.0050 | 10,527 | 0.0113 | 0.0106 | 0.1330 | 112 | 1,400 | |
| >= 0.0060 | 8,525 | 0.0126 | 0.0119 | 0.1489 | 101 | 1,269 | |
| >= 0.0070 | 6,696 | 0.0143 | 0.0135 | 0.1682 | 90 | 1,126 | |
| Indicated | >= 0.0030 | 67,370 | 0.0092 | 0.0087 | 0.0896 | 586 | 6,036 |
| >= 0.0040 | 60,133 | 0.0099 | 0.0094 | 0.0957 | 565 | 5,755 | |
| >= 0.0050 | 52,383 | 0.0107 | 0.0102 | 0.1031 | 534 | 5,401 | |
| >= 0.0060 | 44,282 | 0.0116 | 0.0111 | 0.1125 | 492 | 4,982 | |
| >= 0.0070 | 36,136 | 0.0128 | 0.0122 | 0.1251 | 441 | 4,521 | |
| Measured and Indicated | >= 0.0030 | 81,672 | 0.0092 | 0.0087 | 0.0930 | 712 | 7,597 |
| >= 0.0040 | 72,556 | 0.0100 | 0.0094 | 0.0999 | 685 | 7,249 | |
| >= 0.0050 | 62,910 | 0.0108 | 0.0103 | 0.1081 | 646 | 6,801 | |
| >= 0.0060 | 52,807 | 0.0118 | 0.0112 | 0.1184 | 593 | 6,251 | |
| >= 0.0070 | 42,832 | 0.0130 | 0.0124 | 0.1318 | 531 | 5,647 |
|
Mako Mining Corp. |
| Category | Cutoff oz/ton AuEq. |
k tons | AuEq oz/t |
Au oz/t | Ag oz/t | Au (koz) |
Ag (koz) |
|
Inferred |
>= 0.0030 |
17,178 |
0.0081 |
0.0079 |
0.0404 |
136 |
694 |
|
>= 0.0040 |
15,322 |
0.0087 |
0.0085 |
0.0417 |
130 |
639 |
|
|
>= 0.0050 |
13,587 |
0.0092 |
0.0090 |
0.0427 |
122 |
580 |
|
|
>= 0.0060 |
11,573 |
0.0099 |
0.0096 |
0.0440 |
111 |
509 |
|
|
>= 0.0070 |
9,280 |
0.0107 |
0.0105 |
0.0463 |
97 |
430 |
*Notes: Mineral resources are estimated in conformance with the CIM mineral resource definitions referred to in NI 43-101 Standards of Disclosure for Mineral Projects. This mineral resource estimate covers the Moss Mine Project. Mineral resources that are not mineral reserves do not have demonstrated economic viability. The quantity and grade of the reported inferred mineral resources in this estimation are conceptual in nature and are estimated based on limited geological evidence and sampling. Geological evidence is sufficient to imply but not verify geological and grade or quality continuity. For these reasons, an inferred mineral resource has a lower level of confidence than an indicated mineral resource, however it is reasonably expected that most of the inferred mineral resources could be upgraded to indicated mineral resources with continued exploration. Mineral resources are reported within an optimized constraining shell using a gold price of US$2,500/oz and a silver price of US$29.2/oz with a gold recovery of 75% and a silver recovery of 33%. Gold grades were estimated using 10ft capped composites within 10 geological domains using ordinary kriging. Summation errors may occur in the tabulated results due to rounding.
Table 25.3
Summary of 2025 Mineral Resource Estimate by Classification Category*
|
Category |
Cut-off |
k tons |
AuEq |
Au oz/t |
Ag oz/t |
Au |
Ag |
|
Measured |
0.005 |
10,527 |
0.0113 |
0.0106 |
0.1330 |
112 |
1,400 |
|
Indicated |
0.005 |
52,383 |
0.0107 |
0.0102 |
0.1031 |
534 |
5,401 |
|
Measured + Indicated |
0.005 |
62,910 |
0.0108 |
0.0103 |
0.1081 |
646 |
6,801 |
|
Inferred |
0.005 |
13,587 |
0.0092 |
0.0090 |
0.0427 |
122 |
580 |
*Notes: Mineral resources are estimated in conformance with the CIM mineral resource definitions referred to in NI 43-101 Standards of Disclosure for Mineral Projects. This mineral resource estimate covers the Moss Mine Project. Mineral resources that are not mineral reserves do not have demonstrated economic viability. The quantity and grade of the reported inferred mineral resources in this estimation are conceptual in nature and are estimated based on limited geological evidence and sampling. Geological evidence is sufficient to imply but not verify geological and grade or quality continuity. For these reasons, an inferred mineral resource has a lower level of confidence than an indicated mineral resource, however it is reasonably expected that most of the inferred mineral resources could be upgraded to indicated mineral resources with continued exploration. Mineral resources are reported within an optimized constraining shell using a gold price of US$2,500/oz and a silver price of US$29.2/oz with a gold recovery of 75% and a silver recovery of 33%. Gold grades were estimated using 10ft capped composites within 10 geological domains using ordinary kriging. Summation errors may occur in the tabulated results due to rounding.
25.4 Risks and Opportunities
All mineral resource projects have a degree of uncertainty or risk associated with them which can be due to technical, environmental, permitting, legal, title, taxation, socio-economic, marketing and political factors, among others. All mineral resource projects also present their own opportunities. Table 25.4 outlines some of the Moss Mine Project risks, their potential impact and possible means of mitigation. Table 25.4 also outlines some of the Moss Mine Project opportunities and potential benefits.
|
Mako Mining Corp. |
Table 25.4
Risks and Opportunities at the Moss Mine Project
| Risk | Description and Potential Impact | Possible Risk Mitigation |
| Local grade continuity. | Poor grade continuity. | Further develop and extend the structural model to other areas on the Moss Mine Project. Use the structural model in designing the drilling programs. |
| Local density variability. | Misrepresentation of the in-situ tonnes, which also affects the in-situ metal content estimate. | It is recommended to develop a procedure of collecting density measurements spatially throughout the deposit at regular intervals and implement their use in future mineralization models. |
| Geologic Interpretation. | If geologic interpretation and assumptions (geometry and continuity) used are inaccurate, then there is a potential lack of gold grade or mineralization continuity. | Continue infill drilling to upgrade mineral inventory to the Measured and Indicated categories. |
| Void Locations. | If technical knowledge of the historic mine infrastructure is incomplete, then this deficiency could lead to local inaccuracies of the mineral resources and potential safety exposures | Conduct drilling and surveys to validate void locations and document intersected workings and refine void management plan. |
| Metallurgical recoveries might be overstated as they are based on limited testwork. | Gold recovery might be lower than what is currently being assumed. A lower recovery will increase the economic cut-off grade. | Conduct additional metallurgical tests. |
| Difficulty in attracting experienced professionals. | Technical work quality will be impacted and/or delayed. | Refine recruitment and retention planning and/or make use of consultants. |
| Conceptual mine plans are based on limited geotechnical testwork. | Mining methods and dimensions selected might be different than what is currently being assumed. | Incorporate more comprehensive geotechnical data from drilling. Conduct additional geotechnical assessment and analysis. |
| Opportunities | Explanation | Potential Benefit |
| Surface and underground exploration drilling. | Potential to identify additional prospects and mineral resources. | Adding mineral resources increases the economic value of the mining project. |
| Potential improvement in metallurgical recoveries. | Additional metallurgical testwork can be performed to determine if recovery can be improved through ore sorting, flotation or cyanidation. | Lower capital and operating costs. |
| Potential improvement in mining assumptions. | Geotechnical analysis may determine mining methods and dimensions can be improved. | Improved mining assumptions may lower costs and reduce the cut-off grade for the mineral resource estimation. |
|
Mako Mining Corp. |
26.0 RECOMMENDATIONS
26.1 Mine Geology/Exploration Budget
The current pits will require laybacks to access the additional resources that have been identified. It is recommended to complete a diamond drilling campaign and collect geotechnical information from several key areas and complete a geotechnical assessment of the pits. In addition, detailed mapping of the core is recommended, especially in the Reynolds pit area to determine the geologic controls at Reynolds. This logging should be augmented with a core scanning method to collect hyperspectral information which can be used in the regional exploration program. The recommended budget for the mine geology and exploration program is summarized in Table 26.1.
Table 26.1
Budget Summary for the Moss Mine Geology and Exploration Program
|
Description |
|
Cost $ US |
|
|
Drilling Costs |
Sub-Total: |
$778,185 |
|
|
|
Mobilization and De-mobilization |
|
$30,000 |
|
|
Direct Drilling Costs (4,650 ft @ $67/ft) |
|
$311,085 |
|
|
Drilling Support Costs (estimate/foot = $94) |
|
$437,100 |
|
Geotechnical Study Phase 1 |
Sub-Total: |
$38,065 |
|
|
|
Site Visit |
|
$11,049 |
|
|
Representative Field Mapping |
|
$11,329 |
|
|
Reporting |
|
$12,624 |
|
|
Administration and Project Management |
|
$3,063 |
|
Geotechnical Study Phase 2 |
Sub-Total: |
$172,001 |
|
|
|
Geotechnical Core Logging |
|
$44,803 |
|
|
Televiewer Processing/Reconciliation |
|
$10,428 |
|
|
Laboratory Testing Program |
|
$17,568 |
|
|
Develop and Update Geotechnical model |
|
$29,726 |
|
|
Geotechnical Analysis |
|
$31,539 |
|
|
Preparation of Report |
|
$31,666 |
|
|
Administrative and Project Management |
|
$6,271 |
|
|
|
Total: |
$988,251 |
26.2 Regional Exploration Budget
The regional geology at the Moss Mine Project is very permissive of the potential to make multiple, additional discoveries. Systematic exploration of the large land package at the Moss Mine Project will require multiple years of phased exploration programs. The initial program should consist of detailed geological mapping and sampling of outcropping vein/ breccia zones using multi-element geochemistry. During this program, samples should be taken for hyperspectral analysis. Target areas should be prioritized by sample results and proximity to the mine. Data should be entered into an Access database.
|
Mako Mining Corp. |
Once several targets have been identified they should be drilled in a Phase 1 drilling program (Table 26.2), then depending on results, advance to a more detailed drilling program in Phase 2 (Table 26.3).
Table 26.2
Regional Exploration Recommended Budget - Phase 1
| Description - Phase 1 | Cost $ US | ||
| Phase 1 Target Definition | Sub-Total: | $108,000 | |
| Modeling & Mapping - Geological Consulting | $50,000 | ||
| Access Database | $8,000 | ||
| Hyperspectral Scanning | $50,000 | ||
| Phase 1 Direct Drilling Costs | Sub-Total: | $668,050 | |
| Environmental & Safety | $1,361 | ||
| Direct Diamond Drilling Cost | $571,494 | ||
| Laboratory - Assays | $58,974 | ||
| Upgrade Core Logging & Storage Facility | $32,100 | ||
| Welding, Compressor etc. | $4,121 | ||
| Phase 1 Drilling Support | Sub-Total: | $212,160 | |
| Workforce (Consultants) | $156,000 | ||
| Travel Expense - Airfare, Rail, Mileage | $19,999 | ||
| Site Preparation | $34,961 | ||
| Machinery & Equipment Maintenance | $480 | ||
| Mechanical Parts - By Inventory | $720 | ||
| Phase 1 Office Costs | Sub-Total: | $30,041 | |
| Office Logistics & Supplies | $30,041 | ||
| Phase 1 Sub-Total: | $1,018,251 | ||
Table 26.3
Regional Exploration Recommended Budget - Phase 2
|
Description - Phase 2 |
Cost $ US |
||
|
Phase 2 Direct Drilling Costs |
Sub-Total: |
$953,925 |
|
|
|
Environmental & Safety |
|
$2,041 |
|
|
Direct Diamond Drilling Cost |
|
$857,241 |
|
|
Laboratory - Assays |
|
$88,462 |
|
|
Welding, Compressor etc. |
|
$6,181 |
|
Phase 2 Drilling Support |
Sub-Total: |
$318,240 |
|
|
|
Workforce (Consultants) |
|
$234,000 |
|
|
Travel Expense - Airfare, Rail, Mileage |
|
$29,999 |
|
|
Site Preparation |
|
$52,441 |
|
|
Machinery & Equipment Maintenance |
|
$720 |
|
|
Mechanical Parts - By Inventory |
|
$1,080 |
|
Phase 2 Office Costs |
Sub-Total: |
$45,061 |
|
|
|
Office Logistics & Supplies |
|
$45,061 |
|
|
Phase 2 Sub-Total: |
$1,317,226 |
|
|
|
Total Phase 1 + Phase 2: |
$2,335,477 |
|
|
Mako Mining Corp. |
The budget presented in Table 26.1, Table 26.2 and Table 26.3 summarizes Mako's estimated costs for completing the work at the Moss Mine as well as potentially two phases of regional exploration program.
It is the opinion of the QPs that all of the recommended work is warranted and that only the location of the actual drilling needs to be re-evaluated, as assay results are obtained from the drilling as the program progresses. The QPs appreciate that the nature of the programs and expenditures may change as the further studies are undertaken, and that the final expenditures and results may not be the same as originally proposed. The QPs believes that second phase of the regional exploration may change depending on the results obtained during the first phase of drilling and that Mako revisits the estimated budget for the second phase prior to execution of the second phase.
The QPs are of the opinion that the recommended work program and proposed expenditures are appropriate and well thought out. The QPs believe that the proposed budget reasonably reflects the type and amount of the contemplated activities, at this time.
26.3 Further Recommendations
In addition to the above exploration and drilling programs at the Moss Mine Project and regionally the QPs make the following recommendations:
1) Continue to conduct infill and exploration drilling at the Moss Mine Project and update the resource estimates as drill campaigns are completed.
2) Conduct periodical Acid-Base testing to ensure there is no acid drainage issues at the Moss Mine Project and any secondary mineralized zones that are subject to exploration.
3) Conduct further metallurgical testwork on any secondary mineralized zones that are subject to exploration as various zones may have different recoveries based upon the mineralization found within each zone.
|
Mako Mining Corp. |
27.0 REFERENCES
27.1 General Publications and Report References
Addwest Minerals International Ltd., (June, 1997), Moss Mine Project, Arizona, Company report.
Arizona Department of Environmental Quality, (2013), Moss Mine Pilot Project, Permit Determination No. 57435.
Baum, W. and Lherbier, L.W., (December 17, 1990), Cyanide Leach Tests and Mineralogical Characterization of Gold Ore Samples from the Moss Mine Project, Consultancy report to Billiton Minerals.
Berry, K., (December 6, 2018), Northern Vertex Press Release: "Northern Vertex Partners with Maverix On US$20 Million Stream Increases Fully Subscribed Private Placement to US$8 Million Announces Retirement Of Sprott Senior Debt"
Bureau of Land Management, (December, 2014), Various reports secured online (www.blm.gov) relating to NVMC's claims.
Brownlee, D., (August 23, 2014), Report on Geological Model, Moss Project, Arizona, USA.
Brownlee, D., (December 31, 2013), Verification of Golden Vertex Corp., Moss Mine Drill Hole Database.
Clifton, C.G., Buchanan, L.J., and Durning, W.P., (1980), Exploration procedure and controls of mineralization in the Oatman mining district, Oatman, Arizona, Society of Mining Engineers of AIME preprint #80-143.
Cuffney, R.G., (2013), Moss vein - Phase II pit geological map 1:1500, unpublished geological map for Golden Vertex Corp.
Cuffney, R.G., (2015), Moss project, gold and silver mineralogical associations, unpublished consultant's report for Golden Vertex Corp.
Cuffney, R.G., (2016), Report on the Moss-Silver Creek 2016 Exploration Program, unpublished geological map for Golden Vertex Corp.
Cuffney, R.G., (2020), Geological map of the 3A/3B leach pad area 1:1500, unpublished consultant's report for Golden Vertex Corp.
Cuffney, R.G, and Eastwood, D.A.,(February, 2013), Moss Mine Project Logging Guide.
Dewitt, E, Thorson, J.P., and Smith, R.C., (1986), Geology and gold deposits of the Oatman district, northwestern Arizona. U.S. Geological Survey Open File Report OF 86-0638.
Durning, W.P. and Buchanan, L.J., (1984), The Geology and Mineral Deposits of Oatman, Arizona, Arizona Geological Society Digest, Vol. 15, pp.141-158.
|
Mako Mining Corp. |
Eastwood, D.A., (2011), Moss claims - Geology and geochemistry, unpublished geological report for MinQuest.
Ferguson, C.A., McIntosh, W.C., and Miller, C.F., (2013), Silver Creek caldera - The tectonically dismembered source of the Peach Spring Tuff, Geology, 41:3-6.
Ferguson, C.A., Pearthree, P.A., Johnson, B.J., Guynn, G., and McCosby, J.B., (2017), Geologic Map of the Oatman 7 ½' Quadrangle, Mohave County, Arizona, Arizona Geological Survey Digital Geologic Map 119.
Godden, S.J., (November 23, 2014), Consultancy report to Golden Vertex Corporation, Moss Mine Gold-Silver Project, Mineralogical and Metallurgical Review.
Godden, S.J., (October 9, 2014), Consultancy report to Golden Vertex Corporation, Moss Mine Gold-Silver Project, 2013 to 2014 Mineral Resource Estimates' Reconciliation (Summary).
Godden, S.J., (October 22, 2014), Consultancy report to Golden Vertex Corporation, Moss Mine Gold-Silver Project, Phase I Heap Leach Metallurgical Performance and Gold Recovery Analysis.
Godden, S.J., (October 27, 2014), Consultancy report to Golden Vertex Corporation, Moss Mine Gold-Silver Project, Updated Phase I Reconciliation - Extracted Material to 2014 Mineral Resource Model.
Golder Associates, Inc. (March 10, 2017), Pit slope Design Recommendations, Mos Gold- Silver Project, Mohave County, Arizona.
Heald, P., Foley, N.K. and Hayba, D.O., (1987), Comparative Anatomy of Volcanic-Hosted Epithermal Deposits: Acid-Sulfate and Adularia-Sericite Types, Economic Geology, Vol. 82, pp.1-26.
Henley, R.W. and Ellis, A.J., (1983), Geothermal Systems Ancient and Modern: A Geochemical Review. Earth-Science Reviews, Vol. 19, pp. 1-50.
Hudson, D. M., (September, 2011), Petrography of selected samples from the Moss Mine, Mojave County, Arizona, Consultancy report for Kappes, Cassiday & Associates, Reno, Nevada.
John, D.A., (2001), Miocene and Early Pliocene Epithermal Gold-Silver Deposits in the Northern Great Basin, Western United States: Characteristics, Distribution, and Relationship to Magmatism. Economic Geology, Vol. 96, pp. 1827-1853.
Kappes, Cassiday & Associates, (March, 2011), Consultancy report to Patriot Gold Corporation, Moss Mine, Report on Metallurgical Testwork.
Kappes, Cassiday & Associates, (November, 2012), Consultancy report to Patriot Gold Corporation, Moss Mine Project, Report on Metallurgical Testwork.
Kappes, Cassiday & Associates, (July 30, 2012), Consultancy report to Golden Vertex Corporation, Moss Mine, Report on Metallurgical Testwork.
Larson, L.T., (2013), Petrographic report on polished thin sections from Moss mine project, Arizona, unpublished consulting report for Golden Vertex Corp.
|
Mako Mining Corp. |
Larson, L.T., (2015), Petrographic report on 14 polished thin sections from Moss mine project, Arizona, unpublished consulting report for Golden Vertex Corp.
Lausen, C., (1931), Geology and ore deposits of the Oatman and Katherine districts, Arizona, Arizona Bureau of Mines Bull.131.
M3, (November 22, 2017), NI 43-101 Technical Report, Preliminary Economic Analysis, Moss Gold-Silver Project Phase III, Mine Life Extension, Mohave County, Arizona, USA, prepared for Northern Vertex Mining Corp.
M3, (July 13, 2015), NI 43-101 Technical Report, Feasibility Study for Moss Gold-Silver Project, Mohave County, Arizona, USA, prepared for Northern Vertex Mining Corp.
Malach, R., (1977), Adventurer John Moss: Gold Discovery in Mohave County, Kingman, Arizona, Mohave County Board of Supervisors.
McClelland Laboratories, Inc., (May 29, 1991), Direct Agitation Cyanidation Testwork - Moss Bulk Ore and Cuttings Samples, Consultancy report to Magma Copper Company.
McClelland Laboratories, Inc., (January 29, 1992), Direct Agitation Cyanidation Testwork - Moss Cuttings Intervals, Consultancy report to Magma Copper Company.
McClelland Laboratories, Inc., (February 11, 2013), Heap Leach Amenability Evaluation - Various Crusher Product Ore Samples from the Moss Project, Consultancy report to Northern Vertex Mining Corporation.
McClelland Laboratories, Inc., (April 26, 2013), Heap Leach Amenability Evaluation - Lower Grade Moss Composite, 2 x Thru Rolls #2, Consultancy report to Northern Vertex Mining Corporation.
Metcon Research, (June, 2008), Crush Size Study - Locked Cycle Column Leach on Oxide Composite, Consultancy report to Patriot Gold Corporation.
MineFill Services, Inc., (December 30, 2014), Technical Report on the 2014 Mineral Resource Update - Moss Mine Gold-Silver Project, Mohave County, Arizona, USA for Northern Vertex Mining Corporation.
Pamukcu, A.S., Carley, T.L., Gualda, G.A.R., Miller, C.F., and Ferguson, C.A., (2013), The evolution of the Peach Springs giant magma body: evidence from accessory mineral textures and compositions, bulk pumice and glass geochemistry, and rhyolite MELTS modelling, Jour. Petrology vol 54, No. 6, pp. 1109-1148.
Ransome, F.L., (1923), Geology of the Oatman Gold District, Arizona, USGS Bulletin 743.
Richey, Jacob R., Cuffney, Robert G., House, Adam, and Young, John, (October 8, 2021), Technical Report on the Mineral Resource, Mineral Reserve, and Mine Plan for the Moss Mine, prepared for Elevation Gold Mining Corporation.
Schrader, F.C., (1909), Mineral Deposits of the Cerbat Range, Black Mountains and Grand Wash Cliffs, Mohave County, Arizona, USGS Bulletin 397.
|
Mako Mining Corp. |
Sherman, J.E. & Sherman, B.H., (January 2002, (1969)), Ghost Towns of Arizona, University of Oklahoma Press, 10th printing.
Sillitoe, R.H., (1980), Rifting, Bimodal Volcanism, and Bonanza Gold Veins, Society of Economic Geologists Newsletter, No. 48, pp. 24-26.
Taylor, B.E., (2007), Epithermal Gold Deposits, in Goodfellow, W.D., ed., Mineral Deposits of Canada: A Synthesis of Major Deposit-Types, District Metallogeny, the Evolution of Geological Provinces, and Exploration Methods: Geological Association of Canada, Mineral Deposits Division, Special Publication No. 5, pp. 113-139.
Thomas, D.A., (October 03, 2014), Consultancy report to Golden Vertex Corp., 2014 Model Reconciliation to 2013 PEA Model.
Thomas, D.A., (October 24, 2014), Consultancy report to Golden Vertex Corp., Moss Mine Project, 2014 Mineral Resource Update.
Tshabrun, D. Cuffney, R, Kay, C. Young, J, (10 November, 2020) Technical Report on the Mineral Resource Estimate Update for the Moss Mine, Arizona USA, Internal Document not released to the public.
Varney, P. (1994), Arizona Ghost Towns and Mining Camps: a travel guide to history, Arizona Highways, 10th edition 2010.
White, N.C. and Hedenquist, J.W., (1995), Epithermal gold deposits, styles, characteristics, and exploration, Society of Economic Geologists Newsletter 23.
Whittington, J.R.H., (March 24, 2015), Northern Vertex Press Release: "Results of property wide mapping and surface Sampling Program on the Moss and Silver Creek claims highlight the discovery of several promising gold bearing structures as targets for future exploration activities"
27.2 Website References
Mako Mining Corp. https://makominingcorp.com/
|
Mako Mining Corp. |
28.0 DATE AND SIGNATURE PAGE
The independent Qualified Persons for this report are:
| Micon International Limited | |
| "William J. Lewis" {signed and sealed as of the report date} | |
| William J. Lewis, P.Geo. | Report Date: February 27, 2026. |
| Principal Geologist | Effective Date: December 18, 2025. |
| "Richard Gowans" {signed and sealed as of the report date} | |
| Richard M. Gowans, P.Eng. | Report Date: February 27, 2026. |
| Principal Metallurgist | Effective Date: December 18, 2025. |
| CGK Consulting Services Inc. | |
| "Chris Keech" {signed and sealed as of the report date} | |
| Chris Keech, P.Geo. | Report Date: February 27, 2026. |
| Principal Geologist | Effective Date: December 18, 2025. |
| PDM Technical Services Ltd. | |
| "(Gary) Yee-Yuen Wong" {signed and sealed as of the report date} | |
| (Gary) Yee-Yuen Wong, P.Eng | Report Date: February 27, 2026. |
| Geological Services Consultant | Effective Date: December 18, 2025. |
|
Mako Mining Corp. |
29.0 CERTIFICATES OF AUTHORS
|
Mako Mining Corp. |
CERTIFICATE OF AUTHOR
William J. Lewis, B.Sc, P.Geo
As the co-author of this report for Mako Mining Corp. entitled "NI 43-101 Technical Report for the 2025 Mineral Resource Estimate for the Moss Mine Project, Oatman Mining District, Mohave County, Arizona, USA" dated February 27, 2026, with an effective date of December 18, 2025, I, William J. Lewis do hereby certify that:
1. I am employed as a Principal Geologist by, and carried out this assignment for, Micon International Limited, Suite 501, 212 King Street West, Toronto, Ontario M5H 1K5, tel. (416) 362-5135, e-mail wlewis@micon-international.com.
2. This certificate applies to the Technical Report titled "NI 43-101 Technical Report for the 2025 Mineral Resource Estimate for the Moss Mine Project, Oatman Mining District, Mohave County, Arizona, USA" dated February 27, 2026, with an effective date of December 18, 2025.
3. I hold the following academic qualifications:
B.Sc. (Geology) University of British Columbia 1985.
4. I am a registered Professional Geoscientist with the Association of Professional Engineers and Geoscientists of Manitoba (membership # 20480); as well, I am a member in good standing of several other technical associations and societies, including:
5. I have worked as a geologist in the minerals industry for over 40 years.
6. I am familiar with NI 43-101 and, by reason of education, experience and professional registration, I fulfil the requirements of a Qualified Person as defined in NI 43-101. My work experience includes 4 years as an exploration geologist looking for gold and base metal deposits, more than 11 years as a mine geologist in underground mines and 25 years as a surficial geologist and consulting geologist on precious and base metals and industrial minerals.
7. I have read NI 43-101 and this Technical Report has been prepared in compliance with the instrument.
8. I have not visited the Moss Mine Project.
9. This is the first Technical Report I have written or co-authored for the mineral property that is the subject of this Technical Report and have not had any prior involvement in the Moss Mine Project.
10. I am independent Mako Mining Corp. and its subsidiaries according to the definition described in NI 43-101 and the Companion Policy 43-101 CP.
11. I am responsible for Sections 1.1 to 1.3, 1.8, 1.9, 2, 3, 4, 5, 24, 25.1, 25.4, 26 and 27 of this Technical Report with Sections 15 through 22 not applicable to this Technical Report.
12. As of the date of this certificate, to the best of my knowledge, information and belief, the Technical Report contains all scientific and technical information that is required to be disclosed to make this technical report not misleading.
Report Dated this 27th day of February, 2026 with an effective date of December 18, 2025.
"William J. Lewis" {signed and sealed as of the report date}
William J. Lewis, B.Sc., P.Geo.
Principal Geologist, Micon International Limited
|
Mako Mining Corp. |
CERTIFICATE OF AUTHOR
Richard M. Gowans, P.Eng.
As the co-author of this report for Mako Mining Corp. entitled "NI 43-101 Technical Report for the 2025 Mineral Resource Estimate for the Moss Mine Project, Oatman Mining District, Mohave County, Arizona, USA" dated February 27, 2026, with an effective date of December 18, 2025, I, Richard Gowans do hereby certify that:
1. I am employed as Principal Metallurgist by, and carried out this assignment for, Micon International Limited, Suite 501, 212 King Street West, Toronto, Ontario M5H 1K5, tel. (416) 362-5135, e-mail rgowans@micon-international.com.
2. This certificate applies to the Technical Report titled "NI 43-101 Technical Report for the 2025 Mineral Resource Estimate for the Moss Mine Project, Oatman Mining District, Mohave County, Arizona, USA" dated February 27, 2026, with an effective date of December 18, 2025.
3. I hold the following academic qualifications:
B.Sc. (Hons) Minerals Engineering, The University of Birmingham, U.K. 1980.
4. I am a registered Professional Engineer of Ontario (membership number 90529389); as well, I am a member in good standing of the Canadian Institute of Mining, Metallurgy and Petroleum.
5. I am familiar with NI 43-101 and, by reason of education, experience and professional registration, fulfil the requirements of a Qualified Person as defined in NI 43-101. My work experience includes over 30 years of the management of technical studies and design of numerous metallurgical testwork programs and metallurgical processing plants.
6. I have read NI 43-101, and this Technical Report has been prepared in compliance with the instrument.
7. I have visited the Moss Mine Project.
8. I have not participated in the preparation of prior Technical Reports on the Moss Mine Project and have not had any prior involvement in the Moss Mine Project.
9. I am independent of Mako Mining Corp. and its related entities, as defined in Section 1.5 of NI 43-101.
10. I am responsible for Sections 1.6, 13 and 25.2 of this Technical Report with Sections 15 through 22 not applicable to this Technical Report.
11. As of the date of this certificate, to the best of my knowledge, information and belief, the Technical Report contains all scientific and technical information that is required to be disclosed to make this technical report not misleading.
Report Dated this 27th day of February, 2026 with an effective date of December 18, 2025.
"Richard M. Gowans" {signed and sealed as of the report date}
Richard Gowans P.Eng.
Principal Metallurgist, Micon International Limited
|
Mako Mining Corp. |
CERTIFICATE OF QUALIFIED PERSON
Christopher Keech, P.Geo.
As the co-author of this report for Mako Mining Corp. entitled "NI 43-101 Technical Report for the 2025 Mineral Resource Estimate for the Moss Mine Project, Oatman Mining District, Mohave County, Arizona, USA" dated February 27, 2026, with an effective date of December 18, 2025, I, Christopher Keech, P.Geo., as a co-author of the Technical Report, do hereby certify that:
1. I am employed as Principal Geologist with CGK Consulting Services Inc. located at 601-1501 Foster Street, White Rock, BC, V4B 0C3.
2. This certificate applies to the technical report entitled, "N.I. 43-101 Technical Report for the 2025 Mineral Resource Estimate on the Moss Mine Gold Project, Arizona, USA" with an effective date of December 18, 2025, and a report date of February 27, 2026 (the "Technical Report").
3. My qualifications and relevant experiences are that:
4. I graduated with a B.Sc. in Geology from McMaster University in 1980.
5. I am a member in good standing of Engineers and Geoscientists of British Columbia (Membership No. 27185). In addition, CGK Consulting Services Inc. has a Permit to Practice in British Columbia, Canada, Permit No. 1002379.
6. I have worked as a professional geologist in the mining sector continuously for 45 years, including 11 years as an exploration geologist, 19 years as a resource geologist with several mining companies and 15 years as a geological consultant specialising in the estimation of mineral resources. My relevant experience for the purpose of this Technical Report includes the estimation of gold mineral resources for greenstone-hosted, and epithermal gold deposits at development properties and operating mines in Canada, USA, Brazil, Honduras, Venezuela, and Tanzania. In addition, I hold a Citation in Geostatistics from the University of Alberta (2004).
7. I have read the definition of the Qualified Person set out in National Instrument 43-101 (N.I. 43-101) and certify that by reason of my education, affiliation with a professional association and past relevant work experience, I fulfil the requirements to be a Qualified Person for the purposes of N.I. 43-101.
8. I have not visited the Moss Mine Gold Project property.
9. I am the co-author of this report and responsible for Sections 1.7, 10.0, 11.0, 12.1 to 12.3, 12.5 to 12.8, 12.10, 14.0 and 25.3 of this Technical Report with Sections 15 through 22 not applicable to this Technical Report.
10. I am independent of Mako Mining Corp. and its related entities, as defined in Section 1.5 of NI 43-101.
11. I have not had prior involvement with the property that is the subject of the Technical Report.
12. I have read N.I. 43-101 and those parts of the Technical Report for which I am responsible have been prepared in compliance with that instrument.
13. As of the date of the certificate, to the best of my knowledge, information and belief, the Technical Report contains all material scientific and technical information that is required to be disclosed to make the Technical Report not misleading.
Report Dated this 27th day of February, 2026 with an effective date of December 18, 2025.
"Christopher Keech" {signed and sealed as of the report date}-
Name: Christopher Keech, P.Geo.
Principal Geologist, CGK Consulting Services Inc.
|
Mako Mining Corp. |
CERTFICATE OF QUALIFIED PERSON
(Gary) Yee-Yuen Wong, P.Eng.
As the co-author of this report for Mako Mining Corp. entitled "NI 43-101 Technical Report for the 2025 Mineral Resource Estimate for the Moss Mine Project, Oatman Mining District, Mohave County, Arizona, USA" dated February 27, 2026, with an effective date of December 18, 2025, I, (Gary) Yee-Yuen Wong, P.Eng., do hereby certify that:
1) I am a Geological Engineer and presently a Geological Services Consultant for PDM Technical Services Ltd., a British Columbia corporation with a business address of 5992 Patrick Street, Burnaby, B.C., Canada. V5J 3B7
2) This certificate applies to "NI 43-101 Technical Report for the 2025 Mineral Resource Estimate for the Moss Mine Project, Oatman Mining District, Mohave County, Arizona, USA" dated February 27, 2026, with an effective date of December 18, 2025.
3) I am a graduate of the University of British Columbia with a Bachelor of Applied Science in Geological Engineering in 1987. I am a registered Professional Engineer with the Engineers and Geoscientists of the Province of British Columbia (licence # 19528) and Northwest Territories and Nunavut Association of Professional Engineers and Geoscientists (registration #L5270).
4) I have practiced my profession from 1987 to 1999, during which time I worked for Placer Dome Inc., then from 2009 to 2011 for Oro Mining Ltd. From 2011 to present, I have been a consultant for PDM Technical Services Ltd. As a result of my education, experience and professional associations, I am a "Qualified Person" as defined by National Instrument 43-101. I have over 27 years of international experience in the exploration and estimation of mineral resources, from grassroots exploration, to advanced resource delineation programs, to using geostatistical techniques on different gold, copper and molybdenum systems. Deposit types I have experience in include porphyry copper-gold, Pre-Cambrian lode, and epithermal vein systems in North and South America, and Africa. I have also 3 years of experience as a production geologist at an operating porphyry molybdenum mine.
5) I personally inspected the property and the relevant drill core for three (3) days from July 14, 2025 to July 16, 2025.
6) I am responsible for Sections 1.4, 1.5, 6.0, 7.0, 8.0, 9.0, 12.4, 12.9 and 23.0 of this Technical Report with Sections 15 through 22 not applicable to this Technical Report.
7) I am independent of Mako Mining Corp. and its related entities as outlined in section 1.5 of the National Instrument 43-101.
8) I have read and understand the terms of National Instrument 43-101 and its companion documents and those parts of the Technical Report for which I am responsible have been prepared in compliance with NI 43-101.
9) I certify that as of the date of the certificate, to the best of my knowledge, information and belief, the technical report contains all scientific and technical information that is required to be disclosed to make the technical report not misleading.
Report Dated this 27th day of February, 2026 with an effective date of December 18, 2025.
"(Gary) Yee-Yuen Wong" {signed and sealed as of the report date}
(Gary) Yee-Yuen Wong, P.Eng. license #19528
Geological Services Consultant, PDM Technical Services Ltd.
|
Mako Mining Corp. |
APPENDIX 1
GLOSSARY OF MINING TERMS
|
Mako Mining Corp. |
The following is a glossary of certain mining terms that may be used in this Technical Report.
| A | |
| Assay | A chemical test performed on a sample of ores or minerals to determine the amount of valuable metals contained. |
| B | |
| Base metal | Any non-precious metal (e.g., copper, lead, zinc, nickel, etc.). |
| Bulk mining | Any large-scale, mechanized method of mining involving many thousands of tonnes of ore being brought to surface per day. |
| Bulk sample | A large sample of mineralized rock, frequently hundreds of tonnes, selected in such a manner as to be representative of the potential orebody being sampled. The sample is usually used to determine metallurgical characteristics. |
| By-product | A secondary metal or mineral product recovered in the milling process. |
| C | |
| Channel sample | A sample composed of pieces of vein or mineral deposit that have been cut out of a small trench or channel, usually about 10 cm wide and 2 cm deep. |
| Chip sample | A method of sampling a rock exposure whereby a regular series of small chips of rock is broken off along a line across the face. |
| CIM Standards | The CIM Definition Standards on Mineral Resources and Mineral Reserves adopted by CIM Council from time to time. The most recent update adopted by the CIM Council is effective as of May 10, 2014. |
| CIM | The Canadian Institute of Mining, Metallurgy and Petroleum. |
| Concentrate | A fine, powdery product of the milling process containing a high percentage of valuable metal. |
| Contact | A geological term used to describe the line or plane along which two different rock formations meet. |
| Core | The long cylindrical piece of rock, about an inch in diameter, brought to surface by diamond drilling. |
| Core sample | One or several pieces of whole or split parts of core selected as a sample for analysis or assay. |
| Cross-cut | A horizontal opening driven from a shaft and (or near) right angles to the strike of a vein or other orebody. The term is also used to signify that a drill hole is crossing the mineralization at or near right angles to it. |
| Cut-off grade | The lowest grade of mineralized rock that qualifies as ore grade in a given deposit and is also used as the lowest grade below which the mineralized rock currently cannot be profitably exploited. Cut-off grades vary between deposits depending upon the amenability of ore to gold extraction and upon costs of production. |
|
Mako Mining Corp. |
| D | |
| Deposit | An informal term for an accumulation of mineralization or other valuable earth material of any origin. |
| Development drilling | Drilling to establish accurate estimates of mineral resources or reserves usually in an operating mine or advanced project. |
| Dilution | Rock that is, by necessity, removed along with the ore in the mining process, subsequently lowering the grade of the ore. |
| Dip | The angle at which a vein, structure or rock bed is inclined from the horizontal as measured at right angles to the strike. |
| E | |
| Epithermal | Hydrothermal mineral deposit formed within one kilometre of the earth's surface, in the temperature range of 50 to 200°C. |
| Epithermal deposit | A mineral deposit consisting of veins and replacement bodies, usually in volcanic or sedimentary rocks, containing precious metals or, more rarely, base metals. |
| Exploration | Prospecting, sampling, mapping, diamond drilling and other work involved in searching for ore. |
| F | |
| Face | The end of a drift, crosscut or stope in which work is taking place. |
| Fault | A break in the Earth's crust caused by tectonic forces which have moved the rock on one side with respect to the other. |
| Flotation | A milling process in which valuable mineral particles are induced to become attached to bubbles and float as others sink. |
| Fold | Any bending or wrinkling of rock strata. |
| Footwall | The rock on the underside of a vein or mineralized structure or deposit. |
| Foran | Foran Mining Corporation, including, unless the context otherwise requires, the Company's subsidiaries. |
| Fracture | A break in the rock, the opening of which allows mineral-bearing solutions to enter. A "cross-fracture" is a minor break extending at more-or-less right angles to the direction of the principal fractures. |
| G | |
| Grade | Term used to indicate the concentration of an economically desirable mineral or element in its host rock as a function of its relative mass. With gold, this term may be expressed as grams per tonne (g/t) or ounces per tonne (opt). |
|
Mako Mining Corp. |
| H | |
| Hangingwall | The rock on the upper side of a vein or mineral deposit. |
| High grade | Rich mineralization or ore. As a verb, it refers to selective mining of the best ore in a deposit. |
| Host rock | The rock surrounding an ore deposit. |
| Hydrothermal | Processes associated with heated or superheated water, especially mineralization or alteration. |
| I | |
| Indicated Mineral Resource | An Indicated Mineral Resource is that part of a Mineral Resource for which quantity, grade or quality, densities, shape and physical characteristics are estimated with sufficient confidence to allow the application of Modifying Factors in sufficient detail to support mine planning and evaluation of the economic viability of the deposit. Geological evidence is derived from adequately detailed and reliable exploration, sampling and testing and is sufficient to assume geological and grade or quality continuity between points of observation. An Indicated Mineral Resource has a lower level of confidence than that applying to a Measured Mineral Resource and may only be converted to a Probable Mineral Reserve. |
| Inferred Mineral Resource | An Inferred Mineral Resource is that part of a Mineral Resource for which quantity and grade or quality are estimated on the basis of limited geological evidence and sampling. Geological evidence is sufficient to imply but not verify geological and grade or quality continuity. An Inferred Mineral Resource has a lower level of confidence than that applying to an Indicated Mineral Resource and must not be converted to a Mineral Reserve. It is reasonably expected that the majority of Inferred Mineral Resources could be upgraded to Indicated Mineral Resources with continued exploration. |
| Intrusive | A body of igneous rock formed by the consolidation of magma intruded into another rock. |
| K | |
| km | Abbreviation for kilometre(s). One kilometre is equal to 0.62 miles. |
| L | |
| Leaching | The separation, selective removal or dissolving-out of soluble constituents from a rock or ore body by the natural actions of percolating solutions. |
| Level | The horizontal openings on a working horizon in a mine; it is customary to work mines from a shaft, establishing levels at regular intervals, generally about 50 m or more apart. |
|
Mako Mining Corp. |
| M | |
| m | Abbreviation for metre(s). One metre is equal to 3.28 feet. |
| Massive Sulphide Deposit | Any mass of unusually abundant metallic sulphide minerals, e.g. a Kuroko deposit |
| Measured Mineral Resource | A Measured Mineral Resource is that part of a Mineral Resource for which quantity, grade or quality, densities, shape, and physical characteristics are estimated with confidence sufficient to allow the application of Modifying Factors to support detailed mine planning and final evaluation of the economic viability of the deposit. Geological evidence is derived from detailed and reliable exploration, sampling and testing and is sufficient to confirm geological and grade or quality continuity between points of observation. A Measured Mineral Resource has a higher level of confidence than that applying to either an Indicated Mineral Resource or an Inferred Mineral Resource. It may be converted to a Proven Mineral Reserve or to a Probable Mineral Reserve. |
| Metallurgy | The science and art of separating metals and metallic minerals from their ores by mechanical and chemical processes. |
| Metamorphic | Affected by physical, chemical, and structural processes imposed by depth in the earth's crust. |
| Mill | A plant in which ore is treated, and metals are recovered or prepared for smelting also, a revolving drum used for the grinding of ores in preparation for treatment. |
| Mine | An excavation beneath the surface of the ground from which mineral matter of value is extracted. |
| Mineral | A naturally occurring homogeneous substance having definite physical properties and chemical composition and, if formed under favourable conditions, a definite crystal form. |
| Mineral Concession/ Claim/Permit |
That portion of public mineral lands which a party has staked or marked out in accordance with federal or state mining laws to acquire the right to explore for and exploit the minerals under the surface. |
| Mineralization | The process or processes by which mineral or minerals are introduced into a rock, resulting in a valuable or potentially valuable deposit. |
| Mineral Resource | A Mineral Resource is a concentration or occurrence of solid material of economic interest in or on the Earth's crust in such form, grade or quality and quantity that there are reasonable prospects for eventual economic extraction. The location, quantity, grade or quality, continuity and other geological characteristics of a Mineral Resource are known, estimated or interpreted from specific geological evidence and knowledge, including sampling. Material of economic interest refers to diamonds, natural solid inorganic material, or natural solid fossilized organic material including base and precious metals, coal, and industrial minerals. The term mineral resource used in this report is a Canadian mining term as defined in accordance with NI 43-101 - Standards of Disclosure for Mineral Projects under the guidelines set out in the Canadian Institute of Mining, Metallurgy and Petroleum (the CIM), Standards on Mineral Resource and Mineral Reserves Definitions and guidelines adopted by the CIM Council on December 11, 2005 and recently updated as of May 10, 2014 (the CIM Standards). |
|
Mako Mining Corp. |
| Mineral Reserve | A Mineral Reserve is the economically mineable part of a Measured and/or Indicated Mineral Resource. It includes diluting materials and allowances for losses, which may occur when the material is mined or extracted and is defined by studies at Pre-Feasibility or Feasibility level as appropriate that include application of Modifying Factors. Such studies demonstrate that, at the time of reporting, extraction could reasonably be justified. The reference point at which Mineral Reserves are defined, usually the point where the ore is delivered to the processing plant, must be stated. It is important that, in all situations where the reference point is different, such as for a saleable product, a clarifying statement is included to ensure that the reader is fully informed as to what is being reported. The public disclosure of a Mineral Reserve must be demonstrated by a Pre-Feasibility Study or Feasibility Study. |
| N | |
| Net Smelter Return | A payment made by a producer of metals based on the value of the gross metal production from the property, less deduction of certain limited costs including smelting, refining, transportation and insurance costs. |
| NI 43-101 | National Instrument 43-101 is a national instrument for the Standards of Disclosure for Mineral Projects within Canada. The Instrument is a codified set of rules and guidelines for reporting and displaying information related to mineral properties owned by, or explored by, companies which report these results on stock exchanges within Canada. This includes foreign-owned mining entities who trade on stock exchanges overseen by the Canadian Securities Administrators (CSA), even if they only trade on Over The Counter (OTC) derivatives or other instrumented securities. The NI 43-101 rules and guidelines were updated as of June 30, 2011. |
| O | |
| Open Pit/Cut | A form of mining operation designed to extract minerals that lie near the surface. Waste or overburden is first removed, and the mineral is broken and loaded for processing. The mining of metalliferous ores by surface-mining methods is commonly designated as open-pit mining as distinguished from strip mining of coal and the quarrying of other non-metallic materials, such as limestone and building stone. |
| Outcrop | An exposure of rock or mineral deposit that can be seen on surface, that is, not covered by soil or water. |
| Oxidation | A chemical reaction caused by exposure to oxygen that results in a change in the chemical composition of a mineral. |
|
Mako Mining Corp. |
| P | |
| Plant | A building or group of buildings in which a process or function is carried out; at a mine site it will include warehouses, hoisting equipment, compressors, maintenance shops, offices and the mill or concentrator. |
| Probable Reserve | A Probable Mineral Reserve is the economically mineable part of an Indicated, and in some circumstances, a Measured Mineral Resource. The confidence in the Modifying Factors applying to a Probable Mineral Reserve is lower than that applying to a Proven Mineral Reserve. |
| Proven Reserve | A Proven Mineral Reserve is the economically mineable part of a Measured Mineral Resource. A Proven Mineral Reserve implies a high degree of confidence in the Modifying Factors. |
| Pyrite | A common, pale-bronze or brass-yellow, mineral composed of iron and sulphur. Pyrite has a brilliant metallic luster and has been mistaken for gold. Pyrite is the most wide-spread and abundant of the sulfide minerals and occurs in all kinds of rocks. |
| Q | |
| Qualified Person | Conforms to that definition under NI 43-101 for an individual: (a) to be an engineer or geoscientist with a university degree, or equivalent accreditation, in an area of geoscience, or engineering, related to mineral exploration or mining; (b) has at least five years' experience in mineral exploration, mine development or operation or mineral project assessment, or any combination of these, that is relevant to his or her professional degree or area of practice; (c) to have experience relevant to the subject matter of the mineral project and the technical report; (d) is in good standing with a professional association; and (e) in the case of a professional association in a foreign jurisdiction, has a membership designation that (i) requires attainment of a position of responsibility in their profession that requires the exercise of independent judgement; and (ii) requires (A.) a favourable confidential peer evaluation of the individual's character, professional judgement, experience, and ethical fitness; or (B.) a recommendation for membership by at least two peers, and demonstrated prominence or expertise in the field of mineral exploration or mining. |
| R | |
| Reclamation | The restoration of a site after mining or exploration activity is completed. |
| S | |
| Shoot | A concentration of mineral values; that part of a vein or zone carrying values of ore grade. |
| Stockpile | Broken ore heaped on surface, pending treatment or shipment. |
|
Mako Mining Corp. |
| Strike | The direction, or bearing from true north, of a vein or rock formation measure on a horizontal surface. |
| Stringer | A narrow vein or irregular filament of a mineral or minerals traversing a rock mass. |
| T | |
| Terrain | A terrain in geology, in full a tectonostratigraphic terrain, is a fragment of crustal material formed on, or broken off from, one tectonic plate and accreted or "sutured" to crust lying on another plate. |
| Tonne | A metric ton of 1,000 kilograms (2,205 pounds). |
| U | |
| Underground Mining |
Is the process of extracting rock from underground using a network of tunnels and openings, often called stopes. This mining is generally more expensive with lower production rates due to the use of smaller equipment than open pit/ open cast mining at the surface. |
| V | |
| Vein | A fissure, fault or crack in a rock filled by minerals that have travelled upwards from some deep source. |
| Volcanogenic | Formed by processes directly connected with volcanism: specif., said of mineral deposits (massive sulphides, exhalites, banded iron formations) considered to have been produced through volcanic agencies and demonstrably associated with volcanic phenomena. |
| W | |
| Wall rocks | Rock units on either side of an orebody. The hanging wall and footwall rocks of a mineral deposit or orebody. |
| Waste | Unmineralized, or sometimes mineralized, rock that is not minable at a profit. |
| Working(s) | May be a shaft, quarry, level, open-cut, open pit, or stope etc. Usually noted in the plural. |
| Z | |
| Zone | An area of distinct mineralization. |