
MAKO MINING CORP.
ANNUAL INFORMATION FORM
FOR THE YEAR ENDED DECEMBER 31, 2025
April 29, 2026
TABLE OF CONTENTS
GENERAL INFORMATION
Date of Information and Presentation
All information in this Annual Information Form ("AIF") is as of April 28, 2026, unless otherwise indicated. In this AIF, references to the "Company", "Mako", "we" or "our" refers to Mako Mining Corp.
Cautionary Note Regarding Forward-Looking Information
This AIF contains "forward-looking information" under applicable Canadian securities legislation. Except for statements of historical fact relating to the Company, information contained herein constitutes forward-looking information, including, but not limited to, any information as to the Company's strategy, objectives, plans or future financial or operating performance. Forward-looking statements are characterized by words such as "plan", "expect", "budget", "target", "project", "intend", "believe", "anticipate", "estimate" and other similar words or negative versions thereof, or statements that certain events or conditions "may", "will", "should", "would" or "could" occur. In particular, forward-looking information included in this AIF includes, without limitation, statements with respect to:
Forward-looking information is based on the opinions, assumptions and estimates of management considered reasonable at the date the statements are made, and is inherently subject to a variety of risks and uncertainties and other known and unknown factors that could cause actual events or results to differ materially from those projected in the forward-looking information. These factors include: higher risk of economic or technical failure due to the fact that Mako did not base its production decision for any of its mines on a feasibility study of mineral reserves demonstrating economic and technical viability for the project; any preliminary economic assessment on the Company's projects is preliminary in nature, and includes inferred mineral resources that are considered too speculative geologically to have the economic considerations applied to them that would enable them to be categorized as mineral reserves, and there is no certain that the preliminary economic assessment will be realized; the impact of economic and political conditions; the Company's dependence on products produced from its key mining assets; fluctuating price of gold; risks relating to the exploration, development and operation of mineral properties, including but not limited to adverse environmental and climatic conditions, unusual and unexpected geologic conditions and equipment failures; risks relating to operating in emerging markets, particularly Nicaragua and South America, including risk of government expropriation or nationalization of mining operations; health, safety and environmental risks and hazards to which the Company's operations are subject; the Company's ability to maintain or increase present level of gold production; counterparty, credit, liquidity and interest rate risks and access to financing; cost and availability of commodities; increases in costs of production, such as fuel, steel, power, labour and other consumables; risks associated with infectious diseases; uncertainty in the estimation of mineral resources; factors that may affect the Company's future production estimates, including but not limited to the quality of ore, production costs, infrastructure and availability of workforce and equipment; risks relating to the partial ownerships and/or joint ventures at the Company's operations; reliance on the Company's existing infrastructure and supply chains at the Company's operating mines; risks relating to the acquisition, holding and renewal of title to mining rights and permits, and changes to the mining legislative and regulatory regimes in the Company's operating jurisdictions; changes and the implementation of new sanctions impacting the Company's business; limitations on insurance coverage; risks relating to illegal and artisanal mining; the Company's compliance with anti-corruption laws; risks relating to the development, construction and start-up of new mines, including but not limited to the availability and performance of contractors and suppliers, the receipt of required governmental approvals and permits, and cost overruns; risks relating to acquisitions and divestures; title disputes or claims; risks relating to the termination of mining rights; risks relating to security and human rights; risks associated with processing and metallurgical recoveries; risks related to enforcing legal rights in foreign jurisdictions; risks related to the continuance or escalation of international military conflicts, including the conflict between Ukraine and Russia, the U.S. government intervention in Venezuela, the United States and Israeli strikes on Iran, and other conflicts in the Middle East; risks related to the enforcement of any security interests granted over the asset of the Company; competition in the precious metals mining industry; risks related to the Company's ability to service its debt obligations; fluctuating currency exchange rates (including the United States Dollar, the Nicaraguan Córdoba and the Guyanese dollar exchange rates); the values of assets and liabilities based on projected future conditions and potential impairment charges; risks related to shareholder activism; timing and possible outcome of pending and outstanding litigation or disputes; taxation risks; scrutiny from non-governmental organizations; labour and employment relations; risks related to third-party contractor arrangements; repatriation of funds from foreign subsidiaries; risks related to community relations; risks related to relying on local advisors and consultants in foreign jurisdictions; the impact of global financial, economic and political conditions, global liquidity, interest rates, inflation and other factors on the Company's results of operations and market price of the Company's common shares; risks associated with financial projections; force majeure events; the Company's plans with respect to the payment of dividends; transactions that may result in dilution to the Company's common shares; future sales of common shares by existing shareholders; the Company's dependence on key management personnel and executives; changes to the Company's director and executive compensation program; possible conflicts of interest of directors and officers of the Company; the reliability of the Company's disclosure and internal controls; compliance with international ESG disclosure standards and best practices; vulnerability of information systems including cyber attacks; as well as those risk factors discussed or referred to herein.
Although the Company has attempted to identify important factors that could cause actual actions, events or results to differ materially from those described in forward-looking information, there may be other factors that could cause actions, events or results to not be as anticipated, estimated or intended. There can be no assurance that forward-looking information will prove to be accurate, as actual results and future events could differ materially from those anticipated in such statements.
The Company undertakes no obligation to update forward-looking information if circumstances or management's estimates, assumptions or opinions should change, except as required by applicable law. The reader is cautioned not to place undue reliance on forward-looking information. The forward-looking information contained herein is presented for the purpose of assisting investors in understanding the Company's business, plans and objectives as of the dates presented and may not be appropriate for other purposes.
Cautionary Note to U.S. Readers Concerning Estimates of Mineral Reserves and Resources
The Mineral Reserve and Mineral Resource estimates in this AIF and any documents incorporated by reference herein have been disclosed in accordance with National Instrument 43-101 - Standards of Disclosure for Mineral Projects ("NI 43-101"), which differs from the requirements of the U.S. Securities and Exchange Commission (the "SEC"), and information with respect to mineralization and Mineral Reserves and Mineral Resources contained herein may not be directly comparable to similar information disclosed by U.S. companies.
The terms "Measured Mineral Resources", "Indicated Mineral Resources" and "Inferred Mineral Resources", "Proven Mineral Reserves", "Probable Mineral Reserves", "Measured Mineral Resources", "Indicated Mineral Resources" and "Inferred Mineral Resources" in this AIF are defined by the Canadian Institute of Mining, Metallurgy and Petroleum ("CIM") and the CIM Definition Standards for Mineral Resources & Mineral Reserves adopted by the CIM Council which differ from the requirements subpart 1300 of Regulation S-K and the applicable rules and regulation of the SEC ("Subpart 1300").
U.S. readers should not assume that any part or all of the mineralization in Measured Mineral Resources, Indicated Mineral Resources and Inferred Mineral Resources will ever be converted into a higher category of Mineral Resources or into Mineral Reserves. Mineralization described using these terms has a greater amount of uncertainty as to its existence and feasibility than mineralization that has been characterized as reserves. Accordingly, U.S. readers are cautioned not to assume that any Measured Mineral Resources, Indicated Mineral Resources, or Inferred Mineral Resources that the Company reports are or will be economically or legally mineable. Further, "Inferred Mineral Resources" have a greater amount of uncertainty as to their existence and as to whether they can be mined legally or economically. Therefore, U.S. readers are also cautioned not to assume that all or any part of the "Inferred Mineral Resources" exist. There is no assurance that any Mineral Reserves or Mineral Resources that the Company may report as "Proven Mineral Reserves", "Probable Mineral Reserves", "Measured Mineral Resources", "Indicated Mineral Resources" and "Inferred Mineral Resources" under NI 43-101 would be the same had the Company prepared the reserve or resource estimates under the standards adopted under Subpart 1300.
Mineral Resources are not Mineral Reserves, and do not have demonstrated economic viability, but do have reasonable prospects for economic extraction. Measured and Indicated Mineral Resources are sufficiently well defined to allow geological and grade continuity to be reasonably assumed and permit the application of technical and economic parameters in assessing the economic viability of the Mineral Resource. Inferred Mineral Resources are estimated on limited information not sufficient to verify geological and grade continuity or to allow technical and economic parameters to be applied. Inferred Mineral Resources are too speculative geologically to have economic considerations applied to them to enable them to be categorized as Mineral Reserves. There is no certainty that Mineral Resources of any classification can be upgraded to Mineral Reserves through continued exploration.
The Company's Mineral Reserve and Mineral Resource figures are estimates and the Company can provide no assurances that the indicated levels of mineral will be produced or that the Company will receive the price assumed in determining its Mineral Reserves. Such estimates are expressions of judgment based on knowledge, mining experience, analysis of drilling results and industry practices. Valid estimates made at a given time may significantly change when new information becomes available. While the Company believes that these Mineral Reserve and Mineral Resource Estimates are well established and the best estimates of the Company's management, by their nature Mineral Reserve and Mineral Resource Estimates are imprecise and depend, to a certain extent, upon the analysis of drilling results and statistical inferences which may ultimately prove unreliable. If the Company's Mineral Reserve or Mineral Reserve Estimates are inaccurate or are reduced in the future, this could have an adverse effect on the Company's future cash flows, earnings, results of operations and financial condition.
Currency and Exchange Rate Information
This AIF contains references to both United States dollars and Canadian dollars. All dollar amounts referenced, unless otherwise indicated, are expressed in United States dollars. Canadian dollars are referred to as "Canadian dollars" or "C$".
The closing, high, low and average exchange rates for United States dollars in terms of Canadian dollars for the years ended December 31, 2025, December 31, 2024 and December 31, 2023, based on the closing rates reported by the Bank of Canada, were as follows:
| Year-Ended December 31 | |||
| 2025 | 2024 | 2023 | |
| Closing | C$1.3706 | C$1.4389 | C$1.3226 |
| High | C$1.4603 | C$1.4416 | C$1.3875 |
| Low | C$1.3558 | C$1.3316 | C$1.3128 |
| Average(1) | C$1.3978 | C$1.3700 | C$1.3497 |
Note:
(1) Calculated as an average of the daily close rates for each period.
On April 28, 2026, the Bank of Canada daily rate of exchange was $1.00 = C$1.3678 or C$1.00 = $0.73.
Financial Information
Unless otherwise noted, financial information is presented in accordance with International Financial Reporting Standards as issued by the International Accounting Standards Board (IASB) ("IFRS Accounting Standards") and include some amounts that are based on management's estimates and judgement.
Non-IFRS Financial Performance Measures
In this AIF, the Company uses certain non-IFRS financial performance measures, including development capital expenditures, sustaining capital expenditures, free cash flow, after tax free cash flows and total capital costs, which are not measures recognized under IFRS and do not have a standardized meaning prescribed by IFRS.
The measures are intended to provide investors with additional information and should not be considered in isolation or as a substitute for measures of performance prepared in accordance with IFRS. In the gold mining industry, these are commonly used performance measures, however, these measures do not have any standardized meaning prescribed under the IFRS and therefore may not be comparable to other issuers. The Company believes that, in addition to conventional measures prepared in accordance with IFRS, certain investors use this information to evaluate the Company’s underlying performance of its core operations and its ability to generate cash flow.
Development Capital Expenditures
Development capital expenditures represents the spending at new projects and/or expenditures at an existing operation that is undertaken with the intention to increase production levels or increase the mine life.
Sustaining Capital Expenditures
Sustaining capital expenditures are expenditures incurred during a production phase to sustain and maintain the existing assets so they can achieve constant expected levels of production from which the Company will derive economic benefits. Sustaining capital expenditures include expenditure for assets to retain their existing productive capacity as well as to enhance performance and reliability of the operations.
Free Cash Flow
Free cash flows are revenues net of operating costs, royalties, capital expenditures and cash taxes.
After-tax free cash flows
After-tax free cash flows are revenues net of operating costs, royalties, capital expenditures and cash taxes.
Total Capital Costs
Total capital costs for the Eagle Mountain Project including pre-production capital expenditures for Phase 1 and Phase 2, and sustaining capital expenditures.
Scientific and Technical Information
Mineral Resources that are not Mineral Reserves do not have demonstrated economic viability. The estimates of Mineral Resources presented in this AIF may be affected by environmental, permitting, legal, title, taxation, sociopolitical, marketing and other relevant modifying factors. The Company's current technical reports, which are available under the Company's profile at www.sedarplus.ca, contain further details regarding Mineral Resource estimates, classification, reporting parameters, key assumptions and risks for each of the Company's material mineral properties.
Unless otherwise stated in this AIF and with the relevant terms defined herein, all scientific and technical information in respect of San Albino, the Moss Mine, the Eagle Mountain Project and the Mt. Hamilton Project has been reviewed and approved by the authors of the San Albino Report, the Moss Mine Report, the Eagle Mountain Report and the Mt. Hamilton Report, respectively (as hereinafter defined below). All other scientific and technical information related to mineral projects of the Company, other than Eagle Mountain, has been reviewed and approved by Mr. John Rust, Chief Metallurgist of Mako, and all other scientific and technical information related to Engle Mountain has been reviewed and approved by Mr. Eric Fier, Non-Executive Chairman of Mako. See "Interests of Experts".
Unless otherwise indicated, the estimated Mineral Resources for the Company's mines and mineral projects set forth herein have been estimated in accordance with the 2014 Canadian Institute of Mining, Metallurgy and Petroleum Definition Standards for Mineral Resources and Mineral Reserves (the "CIM Standards"). The following definitions are reproduced from the CIM Standards:
The term "Mineral Resource" means a concentration or occurrence of solid material of economic interest in or on the Earth's crust in such form, grade or quality and quantity that there are reasonable prospects for eventual economic extraction. The location, quantity, grade or quality, continuity and other geological characteristics of a Mineral Resource are known, estimated or interpreted from specific geological evidence and knowledge, including sampling. Material of economic interest refers to diamonds, natural solid inorganic material, or natural solid fossilized organic material including base and precious metals, coal, and industrial minerals. Mineral Resources are subdivided, in order of increasing geological confidence, into Inferred, Indicated and Measured categories.
The term "Inferred Mineral Resource" means that part of a Mineral Resource for which quantity and grade or quality are estimated on the basis of limited geological evidence and sampling. Geological evidence is sufficient to imply but not verify geological and grade or quality continuity. An Inferred Mineral Resource is based on limited information and sampling gathered through appropriate sampling techniques from locations such as outcrops, trenches, pits, workings and drill holes.
The term "Indicated Mineral Resource" means that part of a Mineral Resource for which quantity, grade or quality, densities, shape and physical characteristics are estimated with sufficient confidence to allow the application of Modifying Factors (as defined herein) in sufficient detail to support mine planning and evaluation of the economic viability of the deposit. Geological evidence is derived from adequately detailed and reliable exploration, sampling and testing and is sufficient to assume geological and grade or quality continuity between points of observation.
The term "Measured Mineral Resource" means that part of a Mineral Resource for which quantity, grade or quality, densities, shape, and physical characteristics are estimated with confidence sufficient to allow the application of Modifying Factors to support detailed mine planning and final evaluation of the economic viability of the deposit. Geological evidence is derived from detailed and reliable exploration, sampling and testing and is sufficient to confirm geological and grade or quality continuity between points of observation.
The term "Mineral Reserve" means the economically mineable part of a Measured and/or Indicated Mineral Resource. It includes diluting materials and allowances for losses, which may occur when the material is mined or extracted and is defined by studies at pre-feasibility or feasibility level as appropriate that include application of Modifying Factors. Such studies demonstrate that, at the time of reporting, extraction could reasonably be justified. Mineral Reserves are subdivided, in order of increasing confidence, into Probable Mineral Reserves (as defined herein) and Proven Mineral Reserves (as defined herein). Mineral Reserves are inclusive of diluting material that will be mined in conjunction with the Mineral Reserves and delivered to the treatment plant or equivalent facility.
The term "Probable Mineral Reserve" means the economically mineable part of an Indicated, and in some circumstances, a Measured Mineral Resource. The confidence in the Modifying Factors applying to a Probable Mineral Reserve is lower than that applying to a Proven Mineral Reserve. Probable Mineral Reserve estimates must be demonstrated to be economic, at the time of reporting, by at least a pre-feasibility study.
The term "Proven Mineral Reserve" means the economically mineable part of a Measured Mineral Resource. A Proven Mineral Reserve implies a high degree of confidence in the Modifying Factors. Proven Mineral Reserve estimates must be demonstrated to be economic, at the time of reporting, by at least a pre-feasibility study.
The term "Modifying Factors" means considerations used to convert Mineral Resources to Mineral Reserves. These include, but are not restricted to, mining, processing, metallurgical, infrastructure, economic, marketing, legal, environmental, social and governmental factors.
CORPORATE STRUCTURE
The Company was incorporated in the Territory of Yukon under the Business Corporations Act (Yukon) on April 1, 2004. The Company was discontinued under the Business Corporations Act (Yukon) and continued under the Business Corporations Act (British Columbia) on November 14, 2007. Effective November 9, 2018, the Company changed its name from "Golden Reign Resources Ltd." to "Mako Mining Corp." following the completion of its acquisition of Marlin Gold Mines Ltd. In 2019, the Company changed its year end from April 30 to December 31. On March 8, 2023, the Company completed a share consolidation of its common shares on a ten to one basis.
Mako's head and registered office is located at 838 West Hastings Street, Suite 700, Vancouver, British Columbia V6C 0A6.
The Company is listed for trading on the TSX Venture Exchange (the "TSXV") under the symbol "MKO" and on the Nasdaq Stock Market LLC ("Nasdaq") under the symbol "MAKO".
The table below sets forth the Company's subsidiaries as at the date of this AIF, together with the jurisdiction of incorporation of each company and the percentage of voting securities beneficially owned, controlled or directed, directly or indirectly, by the Company.
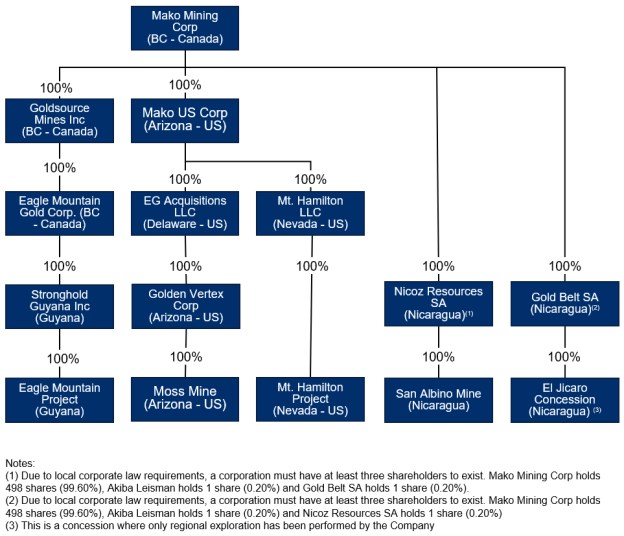
GENERAL DEVELOPMENT OF THE BUSINESS
Overview of the Business
Mako is a Canadian-based emerging gold producer with a portfolio that includes the producing San Albino Mine in Nueva Segovia, Nicaragua, together with the Moss Mine, the Eagle Mountain Project and the Mt. Hamilton Project, as described below, and several exploration properties, including the San Albino-Murra, Potrerillos, La Segoviana, El Jicaro and Tiburon exploration projects in Nicaragua. Mako plans to continue to build on this base through expansion and optimization initiatives at existing operating mines, development of new mines, the advancement of its exploration properties and, as appropriate, by targeting other opportunities.
Mako operates its mines and projects under common corporate oversight. Within this structure, Mako's material properties consist of the following:
San Albino gold mine (100% ownership), an open-pit mine located in the Nueva Segovia, Nicaragua consisting of the San Albino gold deposit and the Las Conchitas gold deposit (the "San Albino Mine" or "San Albino");
Moss gold mine (100% ownership), an open-pit mine located in Oatman Mining District of Mohave County, Arizona, in the United States of America ("USA") that the Company is in the stage of ramping up mining at (the "Moss Mine" or "Moss");
Eagle Mountain project (100% ownership), a preliminary economic assessment ("PEA") stage project located in Guyana, South America (the "Eagle Mountain Project"); and
Mt. Hamilton gold-silver project (100% ownership), a gold-silver project located in White Pine County, Nevada, USA (the "Mt. Hamilton Project").
Further information about the Company and its mines and mineral projects can be found under the Company's profile on SEDAR+ at www.sedarplus.ca and on the Company's website at www.makominingcorp.com.
Three-Year History
The following events contributed materially to the development of the Company's business over the past three financial years.
Silver Stream to Sailfish
On March 1, 2023, the Company announced that it had signed a binding letter of intent with Sailfish Royalty Corp. ("Sailfish") to provide a 24-month silver stream to Sailfish for cash consideration of $6,000,000 payable by Sailfish to Mako on the closing of the initial silver stream transaction and an option to Sailfish, exercisable at the discretion of Sailfish on or after 12 months following the closing of the initial silver stream upon payment of additional cash consideration of $1,000,000, to purchase subsequent silver produced from the San Albino mine, or from concessions currently owned by Mako and processed through Mako's San Albino processing facility, until silver production is no longer economically viable as mutually agreed between Mako and Sailfish (the "Sailfish Stream Transaction"). The Sailfish Stream Transaction closed May 25, 2023.
Sailfish Silver Loan
On March 2, 2023, the Company announced that it had reached an agreement with Sailfish whereby the remaining seven payments of the outstanding gold-linked loan entered into on August 27, 2021 (the "Sailfish Silver Loan") will be made in physical silver.
Share Consolidation
On March 8, 2023, the Company completed a consolidation of its common shares on a ten-for-one basis.
Amendments to Wexford Loan
On May 25, 2023, the Company announced that the maturity date for the repayment of all remaining principal and accrued interest owing by Mako under a loan from Wexford Catalyst Trading Limited, Wexford Spectrum Trading Limited and Debello Trading Limited (the "Wexford Loan"), which had $6.9 million of principal remaining outstanding, had been extended for an additional year to March 31, 2025, with no additional costs to shareholders. No fees, or other compensation, was provided to the lenders for this twelve-month extension.
On August 22, 2023, the Wexford Loan was increased by $2 million (the maturity date of which had been previously extended to March 31, 2024).
2023 Normal Course Issuer Bid
On November 7, 2023, the Company commenced a normal course issuer bid ("NCIB") whereby the Company approved the purchase of up to a maximum of 3,290,929 common shares in the capital of the Company. During the year ended December 31, 2023, the Company purchased 267,600 common shares for $412,994, which common shares were cancelled.
San Albino Technical Report
On December 6, 2023, the Company filed an independent technical report supporting the results of an updated mineral resource estimate for the Company's San Albino Mine (which was subsequently amended - see "Updated San Albino Technical Report").
Graduation to Tier 1 of TSXV
On January 19, 2024, the Company announced that it had been approved for graduation to Tier 1 issuer status by the TSXV, which became effective January 23, 2024.
GR Silver Settlement and Release Agreement
On February 15, 2024, the Company entered into an agreement (the "Settlement and Release Agreement") with GR Silver Mines Ltd. ("GR Silver") and its subsidiary companies (collectively, the "GR Silver Parties") to settle all outstanding reclamation and rehabilitation obligations of Mako, among other obligations and liabilities related to the previously sold La Trinidad mine facilities, under the terms of the share purchase agreement dated as of January 29, 2021 and indemnity agreement dated March 31, 2021 (the "2021 Sale Agreements") related to the sale of Mako's Mexican operations to GR Silver in March 2021. Pursuant to the terms of the Settlement and Release Agreement, in consideration for the payment by Mako to GR Silver of a total of $960,000, satisfied by payment of $500,000 cash and the issuance and delivery to GR Silver of 296,710 common shares of Mako at a deemed price of $2.1007 per share on March 27, 2024, all then-existing and future undertakings, covenants, obligations and indemnities of Mako and any of the GR Silver Parties under the terms of the 2021 Sale Agreements were terminated and released in full and are of no further force or effect.
Acquisition of Goldsource Mines Inc. and Board and Management Changes
On March 26, 2024, the Company announced that it had entered into an arrangement agreement (the "Arrangement Agreement"), pursuant to which Mako agreed to acquire all of the issued and outstanding common shares (the "Goldsource Shares") of Goldsource Mines Inc. ("Goldsource") in exchange for common shares of Mako, by way of a plan of arrangement (the "Goldsource Transaction"). Pursuant to the terms and conditions of the Arrangement Agreement, the holders of the issued and outstanding Goldsource Shares were to receive 0.2200 of a common share of Mako for each Goldsource Share held (the "Exchange Ratio"). Goldsource stock options that were outstanding immediately prior to the completion of the Goldsource Transaction were to immediately vest and be exchanged for replacement options of Mako exercisable to acquire Mako common shares in accordance with the Exchange Ratio. Outstanding warrants of Goldsource were to become exercisable, based on the Exchange Ratio, to purchase Mako common shares on substantially the same terms and conditions. The Goldsource Transaction was to be carried out by way of a court-approved plan of arrangement under the Business Corporations Act (British Columbia). On July 3, 2024, the Company completed the Goldsource Transaction, acquiring 100% of the Eagle Mountain Project in Guyana. Upon closing of the Goldsource Transaction, Rael Lipson stepped down as director of the Company, and Laurie Gaborit filled the vacancy on the Mako board. In addition, Millie Paredes stepped down as Chief Financial Officer and Corporate Secretary of the Company, and was succeeded by Ezequiel Sirotinsky, and Frank Powell was promoted from Senior Exploration Manager to Vice President of Exploration. Finally, Eric Fier was appointed Chairman of the Board and John Hick was appointed Lead Director.
Updated San Albino Technical Report
On June 13, 2024, Mako announced that, in connection with comments received from the British Columbia Securities Commission with respect to a technical compliance review, it filed an amended technical report dated as of June 10, 2024, with an effective date of October 11, 2023 titled "Amended technical report and Estimate of Mineral Resources for the San Albino Project Comprised of the San Albino and Las Conchitas Deposits, Nueva Segovia, Nicaragua" (the "San Albino Technical Report"). The key amendments, in addition to certain other amendments as are outlined in the San Albino Technical Report, include the addition of Sections 16 through 21 of Form 43-101F1 under NI 43-101 in respect of the San Albino Project's mining and recovery methods, project infrastructure, market studies, environmental studies, and capital and operating costs. The additional Sections 16 through 21 address disclosure requirements under 43-101F1 pertaining to an "advanced property", which is defined under NI 43-101 as a property that has mineral reserves or mineral resources where the potential economic viability is supported by a pre-feasibility or a feasibility study, or mineral resources supported by a preliminary economic assessment. The Company submitted the technical report in 2023 without sections 16-21 following guidance given at the time. The Company included this additional disclosure in respect of the San Albino Project, as a fully operational mine, at the BCSC's request. No changes were made to the resource estimates for the San Albino Project in the San Albino Technical Report.
2024 Normal Course Issuer Bid
On November 19, 2024, the Company commenced a new NCIB whereby the Company announced its intention to purchase up to an aggregate of 3,956,485 common shares of the Company, representing 5% of the common shares issued and outstanding as of that date. Purchases under the NCIB were to end no later than November 18, 2025. During the year ended December 31, 2024, the Company purchased 1,996,900 common shares of the Company for $4,698,613 and such common shares were cancelled.
Acquisition of Moss Mine
On December 31, 2024, the Company announced that it had entered into a non-binding letter of intent to acquire 100% of the issued and outstanding common shares of EG Acquisition LLC ("EGA"), a private corporation created and controlled by Mako's controlling shareholder, Wexford Capital LP ("Wexford"), established solely to acquire the Moss Mine (the "Moss Mine Transaction"). EGA proposed to complete the acquisition of the Moss Mine through its acquisition of 100% of the common shares of Golden Vertex Corp. ("GVC"), which held direct ownership of the Moss Mine. Each of EGA and GVC were to become wholly-owned subsidiaries of Mako as a result of the Moss Mine Transaction. The purchase price for the Moss Mine Transaction was to be all cash in the range of $4.9 million up to $ 6.4 million, depending on whether certain royalties are extinguished pursuant to a court-approved sale process under the Companies' Creditors Arrangement Act (the "CCAA") and Chapter 15 of Title 11 of the United States Code under which EGA was acquiring the Moss Mine, the terms of which included, among other things, the elimination of over $60 million of liabilities associated with the Moss Mine.
On February 24, 2025, the Company announced that it had received conditional approval from the TSXV for the Moss Mine Transaction. The Company also announced updated deal terms for the Moss Mine Transaction. While the previously announced non-binding term sheet for the Moss Mine Transaction contemplated a purchase price of between $4.9 million and $6.4 million, dependent on whether certain royalties are extinguished, all the net cashflow derived from gold and silver sales since December 31, 2024 were now to accrue to the benefit of Mako. In addition, Mako was expected to receive approximately $1.5 million in cash collateral from Trisura Guarantee Insurance Company in connection with the renegotiation of certain environmental reclamation bonds at the Moss Mine, which would have the impact of lowering the effective purchase price of the Moss Mine Transaction by such amount. On March 27, 2025, the Company announced that it had completed the Moss Mine Acquisition.
Appointment of President of the Company
On April 22, 2025, the Company announced the appointment of Steve Parsons as President of Mako. Mr. Parsons was previously acting as President of Goldsource following completion of Mako's acquisition of Goldsource on July 3, 2024.
Acquisition of Elevation Gold Mining Indebtedness
On July 3, 2025, the Company announced that it had acquired for $1.8 million in cash approximately $49.5 million in indebtedness owing by Elevation Gold Mining Corporation ("Elevation") and affiliated companies to Maverix Metals Inc., a subsidiary of Triple Flag Precious Metals Corp., the secured creditor of Elevation under the CCAA proceedings before the Supreme Court of British Columbia. Mako completed the acquisition of the debt and all related security pursuant to the terms of an assignment and assumption agreement executed on July 2, 2025.
Intention to Listing on Nasdaq
On July 3, 2025, the Company announced that it was advancing a listing application to apply to list its common shares on the Nasdaq. See "Recent Developments".
Board Changes
On July 3, 2025, the Company announced that Mr. John Pontius stepped down from the board and Mr. Asheef Lalani was appointed to fill the vacancy.
Binding Agreements to Acquire Mt. Hamilton Project
On September 30, 2025, the Company announced the entering into of a binding term sheet with Sailfish Royalty Corp. ("Sailfish") to acquire the Mt. Hamilton Project (the "Mt Hamilton Acquisition") located in White Pine County, Nevada, USA, through the acquisition by Mako US Corp. ("Mako US") of 100% of Mt. Hamilton LLC ("MH LLC"), the direct owner of the Mt. Hamilton Project, Mako US Corp. through a series of transactions. Sailfish was to acquire MH LLC on an arm's length basis from Mt. Hamilton Holdings LLC, following receipt of $40 million non-revolving bridge finance facility from Wexford, and subsequently transfer the interests in MH LLC to Mako in consideration for a corporate gold stream, to be secured (the "Stream") and a 2% net smelter return (the "Royalty") royalty on the Mt. Hamilton Project from Mako.
On November 26, 2025, the Company announced the entering into of a definitive purchase and sale agreement with Sailfish providing for the Mt. Hamilton Acquisition. In connection with the Mt. Hamilton Acquisition, Mako also entered into a definitive gold purchase agreement to grant to Sailfish the Stream and a definitive royalty agreement (the "Royalty Agreement") to grant to Sailfish the Royalty on the Mt. Hamilton Project, which were to take effect upon completion of the transfer of and closing on legal title to MH LLC. See "Recent Developments".
2025 LIFE Offering
On October 16, 2025, the Company announced that it had entered into an agreement with a syndicate of underwriters (the "Underwriters") led by Stifel Nicolaus Canada Inc. ("Stifel") and Cantor Fitzgerald Canada Corporation in connection with a "bought deal" private placement offering of 4,375,000 common shares of the Company (the "Offered Shares") at a price of C$8.00 per Offered Share (the "Issue Price") for gross proceeds to the Company of C$35,000,000 (the "Brokered Offering"), with the Offered Shares to be issued pursuant to the Listed Issuer Financing Exemption pursuant to Part 5A of National Instrument 45-106 - Prospectus Exemptions, as amended by Coordinated Blanket Order 45- 935 - Exemptions from Certain Conditions of the Listed Issuer Financing Exemption. The Company granted to the Underwriters an option, exercisable up to 48 hours prior to the closing date, to purchase for resale up to an additional 15% of the Offered Shares to be sold under the Brokered Offering at the Issue Price. The Company also announced that funds managed by Wexford have indicated an intention to subscribe for 1,875,000 common shares of the Company in a concurrent non-brokered private placement, on substantially the same terms as the Brokered Offering (the "Non-Brokered Offering", and together with the Brokered Offering, the "Offering") for gross proceeds to the Company of up to C$15,000,000. The Offering closed on October 28, 2025.
2025 Normal Course Issuer Bid
On December 3, 2025, the Company announced that the TSXV had accepted its new NCIB to purchase up to an aggregate of 4,350,450 common shares of the Company, representing 5% of the 87,009,006 common shares issued and outstanding on the date thereof. Purchases of common shares of the Company under the NCIB are to end no later than December 7, 2026.
Recent Developments
Updated Mineral Resource Estimate at Moss Mine
On January 26, 2026, the Company announced the results of an updated mineral resource estimate completed by Micon International Limited, PDM Technical Services Ltd. and CGK Consulting Services Inc., for the Moss Mine, and advising that a technical report for the updated mineral resource estimate in accordance NI 43-101 would be filed under the Company's SEDAR+ profile at www.sedarplus.ca within 45 days of the news release. The Moss Mine contains an estimated Measured and Indicated open pit mineral resource of 57.07 million tonnes averaging 0.35 g/t gold and 3.7 g/t silver for a total of 646,000 ounces of gold and 6.8 million ounces of silver at a 0.17 g/t AuEq1 cutoff. There is an additional estimated Inferred open pit mineral resource of 12.3 million tonnes averaging 0.31 g/t gold and 1.46 g/t silver for a total of 122,000 ounces of gold and 580,000 ounces of silver. Gold equivalent ounces ("AuEq") were calculated using silver and gold price assumptions and metallurgical recoveries mentioned below which resulted in a silver to gold ratio of 194.6:1. These mineral resources are reported within an optimized constraining open pit shell considering a gold price of $2,500/oz and a silver price of $29.2/oz with a gold recovery of 75% and a silver recovery of 33%. The effective date for the Mineral Resource Estimate is December 18, 2025. The Company is working on advancing the project toward a Mineral Reserve Estimate and updated project economics, which is currently expected to be completed during the second quarter of 2026.
Amended and Restated Definitive Agreements and Closing of Mt. Hamilton Acquisition
On February 18, 2026, the Company announced that in connection with the Mt. Hamilton Acquisition, the parties entered into an amendment and restatement (the "Amended Purchase Agreement") of the purchase and sale agreement of November 26, 2025, an amendment and restatement (the "Amended Gold Purchase Agreement") of the gold purchase agreement dated November 26, 2025, and a termination (the "Royalty Termination Agreement") of the Royalty Agreement dated November 26, 2025. The amendments to the consideration payable to Sailfish were made in order to preserve maximum flexibility for Mako to develop the Mt. Hamilton Project and derisk the impact of encumbrances over potential future development scenarios more broadly. The Amended Purchase Agreement reflects the elimination of the proposed grant of the Royalty on the Mt. Hamilton Project to Sailfish, and the removal of the Mt. Hamilton Project from the secured corporate level gold stream proposed to be granted to Sailfish, subject to and conditional on closing, and, in lieu of the elimination of the Royalty, proposes the grant of an additional secured corporate level gold steam for a term of 72 months following the initial 60-month gold stream under the terms of the Amended Gold Purchase Agreement, as further detailed below. No substantive changes were made to the representations, warranties, covenants, termination provisions and fallback sale provisions contemplated under the original purchase and sale agreement other than in relation to removing the Royalty and obligations related thereto. As contemplated under the original gold purchase agreement, the Amended Gold Purchase Agreement contemplates that the Company will sell to Sailfish an amount of refined gold, from any of its projects, other than the Mt. Hamilton Project, during the initial 60-month stream term following completion of the Mt. Hamilton Acquisition (the "Initial Stream Term"), equal to 341.7 troy ounces per month, subject to adjustment to ensure that the amount of refined gold per month will not be (the "Adjustment Formula"): (i) less than the equivalent of $738,000 (after deduction of the acquisition price paid by Sailfish to the Company in accordance with the stream gold price), which is equivalent to $2,700/oz Refined Gold; and (ii) more than the equivalent of $1,011,333.33 (after deduction of the acquisition price paid by Sailfish to the Company in accordance with the stream gold price), which is equivalent to $3,700/oz refined gold free and clear of any and all encumbrances. The amount of payable gold for each monthly delivery during the Initial Steam Term will be adjusted upward or downward based on the application of the Adjustment Formula. The Amended Gold Purchase Agreement also provides for an additional gold stream for a term of 72 months following the Initial Stream Term (the "Additional Stream Term"), during which the Company has agreed to sell to Sailfish an amount of refined gold from any of its projects, other than the Mt. Hamilton Project, equal to 100 troy ounces per month, not subject to the Adjustment Formula, free and clear of any and all encumbrances. As contemplated under the original gold purchase agreement, for each ounce of deliverable gold, Sailfish will pay to the Company 20% of the London p.m. fixed price for refined gold in United States dollars, as determined by the London Bullion Market Association (or any successor association or body) on the date of delivery of such deliverable gold. Mako also continues to have the right to source monthly mineral deliveries under each stream by way of the purchase of gold credits or by way of the delivery of gold equivalent ounces. The obligations under the Amended Gold Purchase Agreement will take effect and commence upon and subject to closing of the transfer of legal title to MH LLC from Sailfish to Mako, at which time the Initial Stream Term will commence, and the Additional Stream Term will not commence until following satisfaction of the Initial Stream Term. The amended stream will be secured against all present and after-acquired property of Mako, in addition to specific guarantees and pledges relating to an encumbrance by Sailfish over the Mt. Hamilton Project. The deemed purchase price of the amended gold stream is $40 million, with such deemed purchase price satisfied through the transfer of legal title to Mt. Hamilton LLC from Sailfish to Mako. The completion of the transfer of legal title to MH LL and the closing of the Mt. Hamilton Acquisition occurred on March 23, 2026.
Filing of Moss Mine Technical Report
On March 10, 2026, the Company announced the filing of the Moss Mine technical report for the updated mineral resource estimate announced January 26, 2026.
Completion of Nasdaq Listing
On March 30, 2026, the common shares of the Company were listed and commenced trading on the Nasdaq.
DESCRIPTION OF THE BUSINESS
General
The Company is a gold mining, development, and exploration company continued under the BCBCA. The Company's principal asset is the San Albino Mine, located in Nueva Segovia, Nicaragua, which ranks among the highest-grade open pit gold mines globally. Commercial production at San Albino commenced in July 2021.
In addition to its Nicaraguan operations, the Company owns the Eagle Mountain Project in Guyana, South America, the Moss Mine, in Mohave County, Arizona, United States, and the Mt. Hamilton Project in Nevada, United States. The Eagle Mountain Project is currently in the PEA stage, with active engineering, environmental, and permitting activities underway. The Moss Mine was acquired during the year ended December 31, 2025, and legal ownership of the Mt. Hamilton Project was acquired during the current financial year by the Company's wholly-owned subsidiary Mako US Corp. See "General Development of the Business - Three Year History".
The material properties of the Company as of date of this AIF, were as follows:
| Property | Location | Property ownership |
| San Albino Mine | Nicaragua | 100% |
| Eagle Mountain Project | Guayana | 100% |
| Moss Mine | USA | 100% |
| Mt. Hamilton Project | USA | 100% |
Principal Product
The Company's principal product is gold, with gold production forming substantially all of the Company's revenues. The Company's total gold equivalent production in 2025 was derived from its San Albino Mine in Nicaragua (100%). The Company's consolidated revenue from the sale of gold was approximately $148.5 million in 2025 and $92.1 million in 2024.
There is a global market into which any gold produced could be sold and, as a result, the Company is not dependent on a particular regarding the sale of any gold produced.
Specialized Skill and Knowledge
The Company's business requires specialized skills and knowledge, including in the areas of mining, environmental permitting, engineering, geology, drilling, metallurgy, construction, community engagement, government relations, logistical planning, project management and implementation of exploration and development programs as well as legal compliance, finance and accounting. The Company competes with numerous other companies for the recruitment and retention of qualified employees and consultants in such fields. To date, the Company has been able to meet its staffing requirements, though it remains exposed to risks related to the loss of key personnel and the availability of skilled labour. See "Risk Factors" for more information.
Competitive Conditions
The mineral exploration and development industry is highly competitive. The Company competes with other entities with greater financial and technical resources for the acquisition of mineral properties, skilled labour, equipment, and services. The Company's ability to grow its asset base and maintain operations depends on its operational success, financial capacity, and ability to attract investment. External factors such as commodity price volatility, inflation, and geopolitical developments may also impact competitiveness. See "Risk Factors" for more information.
Components
The Company utilizes critical components such as water, diesel fuel, drilling consumables, and electrical power in its operations. These components are currently readily available in the jurisdictions where the Company operates. However, international trade restrictions, tariffs, or supply chain disruptions may affect the availability or cost of these inputs. See "Risk Factors" for more information.
Cycles
The Company's business is not significantly cyclical or seasonal, although fluctuations in gold prices, input costs, and investor sentiment may influence financial performance.
Economic Dependence
The Company is not substantially dependent on any single commercial contract or group of contracts with suppliers or contractors. It maintains diversified relationships across its supply chain. However, the Company is exposed to risks related to the repatriation of earnings from foreign jurisdictions and potential changes in trade regulations. See "Risk Factors" for more information.
Changes to Contracts
It is not expected that the Company's business will be materially affected in the current financial year by the renegotiation or termination of any contracts or sub-contracts.
Environmental Protection
The Company's operations are subject to environmental regulations in the jurisdictions in which it operates. San Albino is designed as a zero-discharge facility, recycling all process water and utilizing dry stack tailings to minimize environmental impact. The Company adheres to applicable environmental laws and implements best practices in waste management, emissions control, and site reclamation.
Employees and Contractors
As of the date hereof, the Company employs approximately 460 full-time employees across its operations. In addition, the Company engages geologists, engineers, and other consultants on a contract basis as required. The Company has not experienced significant difficulty in attracting and retaining qualified personnel. However, no assurance can be given that the Company will be able to retain a sufficient number of qualified employees and contractors when necessary. See "Risk Factors" for more information.
Social and Environmental Practices
Protecting the environment and maintaining a social license with the communities in which the Company operates is integral to the success of the Company. The Company's approach to social and environmental standards is informed by both the legal guidelines in the jurisdictions in which the Company operates, as well as by a commitment to best practice management. In connection with the latter, the Company is guided by the following principles and practices:
The Company's current exploration and development activities are, and any future exploration or development projects will be, subject to environmental laws and regulations in the jurisdictions in which it operates. These laws address such matters as protection of the natural environment, employee health and safety, waste disposal, remediation of environmental sites, reclamation, control of toxic substances, air and water quality and emissions standards.
Marketing
Gold is a precious metal that is traded on global markets, with benchmark prices generally based on the London gold market. Gold has two principal uses: fabrication and bullion investment. Fabricated gold has a wide variety of end uses, including jewelry manufacturing (the largest fabrication component), electronics, dentistry, industrial and decorative uses, medals, medallions, and official coins. Gold bullion is held primarily as a store of value and a safeguard against devaluation of paper assets denominated in fiat currencies. Mako sells all of its refined gold to refiners and precious metal traders.
Foreign Operations and Disclosure Relating to Ontario Securities Commission Requirements for Companies Operating in Emerging Markets
Due to the risks inherent in mineral production and the desire to organize and structure its affairs in a tax efficient manner, the Company holds its material properties in Nicaragua and Guyana, which are considered emerging markets, in separate corporate entities (through local subsidiary companies in Nicaragua and Guyana).
The risks of the corporate structure of the Company and its foreign subsidiaries are risks that are typical and inherent for companies who have material assets and property interests held indirectly through foreign subsidiaries and located in foreign jurisdictions.
The Company's business and operations in emerging markets are exposed to various levels of political, economic and other risks and uncertainties associated with operating in a foreign jurisdiction such as difference in laws, business cultures and practices, banking systems and internal control over financial reporting. See below under "Risk Factors".
The Company has implemented a system of corporate governance, internal controls over financial reporting and disclosure controls and procedures that apply at all levels of the Company and its subsidiaries. These systems are overseen by the Company's board of directors and its committees, and implemented by the Company's senior management. The relevant features of these systems are set out below.
Control over Foreign Subsidiaries
The Company controls its foreign subsidiaries in Nicaragua and Guyana by virtue of corporate oversight and by its ownership of 100% of the shares issued by such entities (note that one share of each Nicaraguan subsidiary is held by the Company's Chief Executive Officer in connection with Nicaraguan corporate law requirements). The Company's management has the (i) power to appoint and dismiss, at any time, any and all of the foreign subsidiaries' officers and directors, (ii) power to instruct the foreign subsidiaries' officers to pursue business activities in accordance with the Company's wishes, and (iii) legal right, as a shareholder, to require the officers of each such foreign subsidiaries to comply with their obligations. The Company can also enforce its rights by way of various shareholder remedies available to it under local laws. As a result, the management of the Company can effectively align its business objectives with those of the foreign subsidiaries and implement such objectives at the subsidiary level.
Ownership and Property Interests
For San Albino, the mining project has been owned for many years and the mine site has been in operation for six years and the Company has a complete understanding of its ownership of property interests or assets. For Eagle Mountain, current management have been active at progressing all ownership matters in order to continue exploration and advance the project.
All exploration and development activities are governed by applicable conventions and permits that are authorized by the state. For Moss Mine and Mt. Hamilton, these properties have been recently acquired. As it relates to permits, data is kept current by dedicated personnel for each project in the form of permit registers and same are shared on an ongoing basis with corporate headquarters. Furthermore, external counsel title opinions are requested periodically in connection with transactions undertaken.
Further ownership details with respect to each property are described in the respective technical reports filed under the Company's profile at www.sedarplus.ca.
Board and Management Expertise
Several of the Company's directors and senior officers have at least five years of experience in senior leadership positions either with the Company or other entities with foreign operations within emerging markets. As a result of their tenure, these officers and directors have gained experience conducting business in emerging jurisdictions in Central America and Latin America. See "Directors and Officers" for further information on the senior officers' and directors' experience.
In addition, the board of directors, through its corporate governance practices, receives management and technical updates in connection with the foreign subsidiaries and operations, and in so doing, maintains effective oversight of the business and operations. Further, the Company's directors and senior officers are given the opportunity, on a periodic basis, to visit the Company's operations in Nicaragua and Guyana to ensure effective control and management of the Company's foreign operations. During these visits they have access to local employees, government officials and business persons; such interactions enhance the visiting directors' and officers' knowledge of local culture and business practices.
Internal Control Over Financial Reporting and Funds
The Company maintains internal control over financial reporting with respect to its operations in Nicaragua and Guyana by taking various measures. Certain of the Company's management team members have the relevant language proficiency (Spanish), local cultural understanding and relevant work experience in the Company's operating jurisdiction which facilitates better understanding and oversight of the Company's operations in Nicaragua and Guyana in the context of internal controls over financial reporting.
Differences in banking systems and controls between Canada and Nicaragua and Guyana are addressed by having stringent controls over cash in the local locations; especially over access to cash, cash disbursements, appropriate authorization levels in Nicaragua and Guyana.
The difference in cultures and practices between Canada and Nicaragua and Guyana are addressed by employing competent staff in Canada, in Nicaragua and in Guyana who are familiar with the local laws, business culture and standard practices, have local language proficiency, are experienced in working in Nicaragua and in Guyana and in dealing with the government authorities; and have experience and knowledge of the local banking systems.
The foreign subsidiaries also have established practices, protocols and routines in place for the distribution of excess cash to Mako. Furthermore, the opening and closing of bank accounts in the name of a foreign subsidiary is controlled, overseen and approved by the Company's Chief Financial Officer. The Company ensures the flow of funds between Canada and Nicaragua and Canada and Guyana, as intended, by: (i) appointing common officers of the Company and the foreign subsidiaries; and (ii) involving the Company's Chief Financial Officer in hiring key finance personnel in Nicaragua and Guyana.
Communication
The Company maintains open communication with its foreign operations through senior and non-senior officers who are fluent in Spanish and English. The primary language used in management and board meetings is English and material documents relating to the Company that are provided to the board of directors are in English. Although the Company does not currently have a formal communication plan, it has implemented several communications policies, including Timely Disclosure, Confidentiality and Insider Trading Policy. To date, the Company has not experienced any communication-related issues.
Records
The minute books and corporate records and documents of the Nicaraguan subsidiaries and Guyanese subsidiaries are maintained at the local office of the applicable local subsidiary, and with the relevant governmental or regulatory body in each applicable jurisdiction in which the entity's office is located. The custodians of such documents report directly to the Company's senior management team to ensure continued oversight.
MATERIAL MINERAL PROPERTIES
Eagle Mountain Project
The following summary is extracted in part from, and qualified in its entirety with reference to, the full text of the technical report entitled "Preliminary Economic Assessment for the Eagle Mountain Gold Project, Guyana" with an effective date of January 16, 2024 and a report date of March 1, 2024 (the "Eagle Mountain Technical Report") prepared by Nigel Fung, P. Eng., Leon McGarry, B. SC., P.Geo., Antoine Berton, Soutex, P. Eng., and Rolf Schmitt, P. Geo., each of which is independent of the Company and a qualified person as defined by NI 43-101. Readers are encouraged to review the full text of the Eagle Mountain Technical Report, available for review under the Company's SEDAR+ profile at www.sedarplus.ca and on the Company's website at www.makominingcorp.com. This technical report supports the scientific and technical information with respect to the Eagle Mountain Gold project set out in this AIF. All capitalized terms not otherwise defined in this summary are defined in the Eagle Mountain Technical Report. The PEA is preliminary in nature and includes inferred mineral resources that are considered too speculative geologically to have the economic considerations applied to them that would enable them to be categorized as mineral reserves, and there is no certainty that the preliminary economic assessment will be realized. Mineral resources that are not mineral reserves do not have demonstrated economic viability. For additional information see the full Eagle Mountain Technical Report. See "Interests of Experts".
Property Description and Location
The Eagle Mountain Gold Project is located in west-central Guyana, approximately 200 kilometres south-southwest of Georgetown, the capital of Guyana, between latitudes of 573,600 N and 581,500 N and longitudes of 261,000 E and 271,800 E (UTM WGS84, Zone 21N).
The Eagle Mountain Property, a 5,050-hectare area, includes Goldsource's 100%-owned Eagle Mountain Prospecting License 04/2024 ("EMPL") totaling 4,784 hectares (with the exception of certain third-party lands legally held or occupied therein) and Kilroy Mining Inc.'s ("Kilroy") Medium-scale Mining Permit K-60/MP/000/2014 totaling 254 acres on which Stronghold has a long-term lease.
Within the EMPL there are third-party small-scale claims ("artisanal claims") that predate the Company's Property. The Artisanal Claims licensed or recommended for license total about 123 hectares (305 acres). Additionally, one medium scale permit (referred to as Bishop Growler) is in the central-eastern part of the EMPL, northeast of the Eagle Mountain resource area. This was under an option and purchase agreement by Goldsource in 2018/19 that has since expired. Two of the small-scale permits, purchased by Kilroy Mining Inc., are controlled by Goldsource. In addition, Goldsource has an option and purchase agreement to acquire a 100% interest in a third small-scale permit, the Ann Mining Claim. None of the permits outside of Goldsource's agreements contain any of the Mineral Resources as defined in the April 2022 MRE nor do they influence the proposed infrastructure. As any small or medium-scale mining permit is required under Guyana law to be held by a Guyanese national, Stronghold entered into agreements with Kilroy, a private arm's length Guyanese company, pursuant to which Stronghold and Kilroy will jointly operate the Kilroy permit area, granted in July 2014 on a 254-ha portion of the EMPL. Kilroy has granted to Stronghold the exclusive right to conduct mining operations on the medium-scale permit area and any additional areas acquired by Kilroy. Stronghold will fund all expenditures and receive 100% of all revenues, subject to applicable government royalties and a 2% net smelter return ("NSR") royalty to Kilroy. The 2% NSR royalty to Kilroy would not be applicable if the EMPL is converted to a large-scale mining license.
Goldsource has increased the performance bond to US$253,000, held by the Guyana Geology and Mines Commission ("GGMC"), for exploration permits on the Eagle Mountain Gold Project, discussed in the section below entitled "Exploration, Development and Production".
Accessibility, Climate, Local Resources, Infrastructure and Physiography
The Project is located approximately 8 kilometres south of Mahdia Township, Campbelltown, and the Mahdia commercial airstrip. Mahdia has a population of approximately 3,000 inhabitants and is the administrative capital of Potaro-Siparuni Region 8. Mahdia can be accessed by road from Georgetown in six to eight hours, a distance of approximately 310 kilometres. The road is paved from Georgetown to Linden (109 kilometres). A wide laterite road extends between Linden and Mabura (122 kilometres). This section is currently being upgraded to an asphalt/concrete surface. From there an all-weather unpaved road connects Mabura to Mahdia. On this section, access can be challenging during the rainy season, and there are only limited days in the year in which travel is restricted. The Mahdia airstrip is hard surfaced and is suitable for small commercial and charter passenger aircraft. Unpaved roads and tracks from Mahdia provide access to and within the EMPL.
There is a local hospital, school, gas station, and several mechanical shops, restaurants, and two hotels/guest houses. The area is powered by diesel generated power and a recently completed solar farm. Mahdia and surrounds have cell phone coverage by both major cell phone companies in Guyana. The Amalia Falls area, approximately 50 kilometres west-northwest of the EMPL, is currently being assessed for large-scale 165 MW hydroelectric power generation.
The Company has two 500 kVA and one 120 kVA diesel generators on site, installed to provide power to the inactive gravity pilot plant and the exploration camp. Potable water is available from multiple small creeks which spring on Eagle Mountain and a few small rivers within the EMPL.
The local economy is dominated by small-scale mining activities. A labor force familiar with open pit mining is available to draw upon for any future mining activities. Several large gold mining operations are currently active in Guyana and suitable skilled personnel should be available with limited reliance on expatriates.
Goldsource's current field activities are supported by a 65-man capacity exploration camp and offices on the Property. Supplies are partly sourced from Georgetown and partly from Mahdia.
The camp has an established satellite internet link. Cell phone coverage is limited. Dirt tracks have been constructed to facilitate exploration and related activities.
Project History
The Eagle Mountain Gold Project and adjacent Mahdia Valley areas to the north were previously held by Golden Star Resources Ltd ("GSR"). Between 1998 and 2002, GSR had an agreement with Cambior Inc. ("Cambior") to explore the Eagle Mountain Property through a joint venture company, Omai Gold Mines Ltd. ("OGML") which operated the historical Omai Gold Mine, 45 kilometres northeast of the EMPL. GSR sold its interest in OGML to Cambior in 2002. Cambior became part of IAMGOLD Corporation ("IAMGOLD") in 2006 with OGML becoming a 95%-owned subsidiary of IAMGOLD (the remaining 5% held by the Republic of Guyana). In 2010, Eagle Mountain Gold Inc. ("EMGI"), which was called Stronghold Metals Inc. (TSX-V listed entity) at that time, executed an Option Agreement with OGML and IAMGOLD to earn into EMPL subject to certain cash payments, exploration expenditure and stock issuances to IAMGOLD. In January 2012, EMGI vested at 50% in the Project and the EMPL was transferred from OGML to EMGI.
The Option and Joint Venture Agreement was amended and restated in 2012 when Stronghold Metals Inc. vested at 50% interest in EMGI and changed its name to Eagle Mountain Gold Corp. ("EMGC"). In February 2013, EMGC exercised its option to acquire the remaining 50% interest in EMGI and the Project from OGML, giving EMGC 100% ownership of EMGI and the Property. Subsequently, on August 9, 2013, a new three-year prospecting license (PL20/2013) was issued to EMGC's 100% Guyanese subsidiary, Stronghold Guyana Inc., which was in turn renewed on October 18, 2019 and September 30, 2024. In February 2014, an amalgamation transaction between Goldsource and EMGC was concluded, resulting in a 100% interest of EMPL by Goldsource.
Alluvial gold has been exploited in the Eagle Mountain area since at least 1884. Tunnels and shafts exploited hard-rock gold in the time period encompassing the world wars, and dredging was carried out in the Mahdia River and Minnehaha Creek up to 1948. Several phases of exploration were carried out in the Eagle Mountain area during the latter half of the 20th century, including:
• Anaconda British Guiana Mines Ltd ("Anaconda") (1947-1948) carried out geological mapping, diamond drilling, tunnelling and shaft sinking;
• Guyana Geological Survey (1964-1965, 1970-1973, and 1980), who completed a soil geochemical sampling program, pitting and diamond drilling;
• GSR (1986-1997), who carried out a multi-element drainage sample geochemical survey, soil and auger sampling, surface geophysics, trenching, and limited diamond drilling;
• OGML/Cambior (1998-2004), who carried out diamond drilling, auger sampling and surveying; and
• OMGL/IAMGOLD (2006-2009), who compiled a digital GIS database incorporating all available historical data, a regional multi-element drainage sampling program, auger sampling and geological mapping, fixed-wing airborne radiometric and magnetometer surveys, three dimensional (3D) induced polarization (IP) and resistivity surveys, and diamond drilling.
MREs were previously completed by IAMGOLD Technical Services and Exploration Guyana Group (ITS) in 2009 and audited by ACA Howe International Limited ("ACA Howe") in 2010, as well as in 2012 (re-reported in 2014) by ACA Howe on behalf of EMGC, and most recently in 2021 and 2022 by CSA Global (now ERM) on behalf of the Company. These MRE reports are filed on SEDAR+ (http://www.sedarplus.ca).
Geology and Mineralization
The Eagle Mountain Gold Project occurs in the northern part of the Guiana Shield, an area of Paleoproterozoic greenstone belts and associated tonalite-trondhjemite-granodiorite ("TTG") intrusive belts, deformed in the Trans-Amazonian Orogeny which records the convergence and collision between the Archean nuclei of the Amazonian Craton and the West African Craton between 2.2 Ga and 1.9 Ga (Kronnenber et al., 2016).
The greenstone-TTG terrain is intruded by Paleoproterozoic basic intrusions of the Avanavero Large Igneous Province which postdate the Trans-Amazonian Orogeny. The northern Guiana Shield shares close similarities with the more widely explored Birimian of the West African Shield, where numerous >2 Moz gold deposits are known (Voicu et al., 1999; Bassoo and Murphy, 2018).
The Property is underlain by metavolcanic and metasedimentary rocks intruded by a composite granodiorite pluton that hosts the gold mineralization at the Eagle Mountain deposit. At the Salbora deposit, mineralization is within metavolcanic rocks adjacent to a northeast-trending monzonite dyke.
A large diabase to gabbro-norite sill, which is part of the Avanavero Suite, intrudes the granodiorite pluton and metavolcanic-sedimentary sequence and forms the ridge and cliffs at the top of Eagle Mountain. Associated dikes are oriented 120° and are estimated to be less than 10 metres thick.
The sequence has been deformed and folded in the Trans-Amazonian Orogeny and metamorphosed at greenschist facies. A system of low-angle, west-dipping thrust faults at the Eagle Mountain deposit and upright, north-south to northwest-southeast trending faults and breccias at the Salbora deposit are associated with this event and with gold mineralization. Younger northwest to north-northwest trending faults crosscut and offset the shallow dipping structures at the Eagle Mountain deposit.
The shallow-dipping faults in granodiorite at the Eagle Mountain deposit range from narrow highly silicic altered zones to broader zones of pervasive deformation and fracturing. These fault zones are silicified and chlorite altered with disseminated pyrite and associated gold mineralization. The steep breccia zones at the Salbora deposit are also affected by chloritic alteration, silicification disseminated pyrite and associated gold mineralization.
At the Eagle Mountain deposit, the mineralized fault zones vary from 1 metre to 40 metres in thickness separated by 10 to 100 metres of unmineralized granite. At the Salbora deposit, gold mineralization within steep breccia zones coalesces near surface into a broad, sub-horizontal zone of mineralization. Gold mainly occurs as very fine disseminations of native gold within and associated with pyrite.
The Eagle Mountain deposit is modelled as a series of tabular, sub-horizontal to shallowly dipping zones. The variable thickness of each of the mineralized zones appears to be associated with deformation zones that split into several subparallel deformation zones, thereby broadening the zone of alteration and mineralization.
At Salbora, gold mineralization occurs within and adjacent to sub-vertical, north-south trending breccia zones that are generally a few centimeters to a few metres in thickness. Near the surface, these breccia zones appear to coalesce into broad, sub-horizontal zones of brecciation with mineralization occurring over tens of metres. Breccias are developed in a tholeiitic mafic volcanic and altered granitoid adjacent to a monzonite intrusion. Mineralization is associated with silicification, chloritic alteration and pyrite.
The Eagle Mountain and Salbora areas have been affected by tropical saprolite weathering to a depth of 10 to 50 metres. Gold mineralization at the Eagle Mountain deposit (particularly Zones 1 and 2) have been heavily weathered and occurs largely within saprolite derived from granitoid-hosted deformation zone material, consisting of clay-rich material hosting very fine disseminated gold grains.
Exploration
Exploration-related work carried out at the Eagle Mountain Project between 2011 and 2023 by Goldsource (including work conducted between 2011 and 2013 by EMGC) includes infrastructure improvements, environmental data collection, topographic surveys, line cutting, trench and outcrop sampling, hand auger sampling, ground geophysical surveys, and reprocessing of existing geophysical data.
Trench and outcrop channel sampling within the EMPL used samples equivalent to NQ-sized core collected at 1-metre intervals or according to identified geological intervals. Hand auger saprolite sampling programs were carried out in 2015 and 2017-2018 along cut lines at 25 metre or 50 metre pre-marked stations using a "Dutch" type hand auger with 1-metre samples collected by compositing four samples collected every 25 cm, to a maximum depth of 6 metres.
Trenching of an auger anomaly in the Salbora area resulted in an intersection of 123 metres grading 1.96 g/t gold, which was followed up with drilling two (2) diamond drill core holes that were the Salbora "discovery holes".
In 2019 and 2020, a ground geophysical survey (gradient array, pole-dipole IP, and ground magnetics) was conducted in an area of approximately 7.5 km2 surrounding Salbora. Follow-up drill testing of IP/resistivity targets resulted in the discovery of several targets around the Salbora deposit.
In 2019, Goldsource retained Geophysics One Inc. of Ontario, Canada, to re-process and re interpret a historical airborne Terraquest (fixed wing) magnetic and radiometric survey, flown by IAMGOLD in 2007. The survey covers the western half of the Eagle Mountain Prospecting License (EMPL) (inclusive of the Salbora deposit) and was flown at 100-metre line spacing. The interpretation of this dataset provided structural and lithological information for the area and defined several targets for ground follow-up exploration work. The same year, Goldsource retained Matrix Geotechnologies Inc. ("Matrix") of Ontario, Canada to complete ground geophysical surveys at the Project. The geophysical surveys covered an area of approximately 5 km2 surrounding the Salbora deposit and consisted of a gradient array IP spaced at 100 metres for a total length of 39.5 kilometres, eight pole-dipole IP cross sections with a total length of 10.5 kilometres, and ground magnetics over the same grid at 25-metre spacing. During Q1, 2020, Goldsource completed an additional 62 line-km of gradient array IP, 62 line-km of high-resolution ground magnetic survey, and 10 line-km of pole-dipole IP over selected targets.
The ground geophysical survey defined at least five moderate-to-strong IP targets based on the signal of the Salbora deposit.
Drilling
In 2011, 76 HQ/NQ diamond drill holes totaling 10,727 metres were focused on infill and step-out drilling at the Eagle Mountain deposit to confirm previous results and to upgrade the Inferred Resources to Indicated Resources. In 2017 and 2018, drilling focused on shallow saprolitic material using a Geoprobe® 540 direct push drill rig. A total of 257 holes (2,729 metres) were drilled during that period. Between 2018 and 2021, 449 HQ/NQ diamond drill core holes totaling 58,528 metres were completed for infill and expansion of the Mineral Resource at the Eagle Mountain deposit, as well as identification and delineation of additional deposits within the Project area. This information was included in the April 2022 MRE.
Core sampling procedures were similar for 2011 and 2018-2023 diamond drilling, with core retrieved using conventional wireline techniques, placed in plastic core boxes, and transported to the core facility where it was cleaned, marked, logged, photographed, and sampled to a minimum interval of 30 centimeters and a maximum of 1.5 metres. Sample details were recorded in a ticket book, one side placed in the sample bag and the second part stapled on the box.
Saprolitic samples were split with a spatula and fresh core with a core saw. Half the core was placed into sample bags with an assay tag and half returned to the core box. A quality assurance/quality control ("QA/QC") sample (either a blank, a certified reference material ("CRM"), or a duplicate) was inserted every 15 samples. Core logging and sampling was completed either by or under the onsite supervision of a Goldsource geologist.
For the 2017-2018 programs, Geoprobe drill core sampling, samples were placed in core trays inside plastic tubing. Upon delivery to the core shed, the tubing was removed using a tube cutter and the sample was split by using a knife or putty knife. Each sample was 1 metre in length.
Following analysis, digital assay files provided by the laboratory were merged with a "from" and "to" interval file created by Goldsource, with the sample number linking the two files. This methodology limits data entry errors to sample numbering, as well as the "from" and "to" specifications.
Core recovery for diamond drilling and Geoprobe drilling was generally very good with an average of 91.4% in saprolite and 97.1 % in fresh rock. The qualified person, Leon McGarry, is confident there are no sampling or recovery factors that would negatively affect the sampling procedures. Overall, core sampling methods are to industry standards for mineralization of this type.
Upon completion, drill hole collar coordinates and elevations were surveyed in Universal Transverse Mercator (UTM) coordinates, Zone 21N (PSAD 56 datum). The drill contractor completed downhole directional surveys on all diamond drill holes at approximately 50-metre intervals using a single shot digital survey tool.
Data Verification, Sampling Preparation, Analysis and Security
Samples from the 2011 diamond drilling program were prepared at Acme Analytical Laboratories ("Acme"), Georgetown, Guyana and sample pulps were forwarded to Acme Santiago, Chile for gold assay and to Acme Vancouver, Canada for multi-element analyses. Gold analyses were carried out using gold fire assay and AA finish. Sample preparations followed industry best practices and the analytical methods used are routine. Umpire check assays were completed at Activation Laboratories Ltd ("Actlabs") in Georgetown. The laboratory is independent of the Company and does not have any relationship with the Company, including common directors, officers, or insider ownership.
Samples from the 2017-2018 Geoprobe drilling and the 2018-2021 diamond drilling programs were prepared, and gold fire assays with AA finish were completed at Actlabs, Georgetown. Sample pulps were forwarded to the Actlabs in Ancaster, Canada for multi-element analyses using instrumental neutron activation analysis ("INAA") and inductively coupled plasma ("ICP") with atomic emission spectrometry, where necessary. Sample preparations followed industry best practices and the analytical methods used are routine. Umpire QAQC check assays were completed at MS Analytical Guyana ("MSA") in Georgetown using gold fire assay and AAS finish.
Bulk density tests (150) were carried out in 2011 on a variety of fresh and saprolitic, mineralized and non-mineralized rock types. In 2020-2021, additional bulk density tests 1,360) were carried out at MSA in Georgetown on various mineralized and unmineralized core samples. The water displacement method was used for both 2011 and 2020-21 tests and porous samples were coated with wax. A further 21 saprolite and 40 fresh rock density tests were completed during the 2022-2023 drill campaigns.
The Company is using the April 2022 MRE (assay cut-off date of December 31, 2021) for the PEA.
The QAQC programs included CRM samples, blank samples, core duplicate, coarse duplicate samples, and pulp duplicate samples. During the 2011 program, CRMs were used at an average insertion frequency of 2.3%. During the 2017-2021 programs, CRMs were used at an average insertion frequency of 2.6%. Results for most CRMs show no significant negative or positive bias at the CRM grades evaluated. During the 2017-2021 programs, a total of 1,202 CRM samples were inserted at an average insertion frequency of 2.7%. Blank samples returned below the detection limit or very low values, indicating very little contamination with the exception of a few outliers. A total of 342 quarter-core field duplicates, and 478 pulp duplicates were submitted between 2017 and 2021 at an average insertion frequency of 1.9%. Duplicates showed good repeatability. An umpire lab, MSA, completed a total of 262 quarter-core duplicate analyses and a total of 481 repeat analysis of pulps at an average insertion frequency of 1.7%. For this 2017- 2021 period, QAQC samples represented 9% of all assays in the exploration database.
Qualified Person, P. Eng. Nigel Fung, has validated drill hole positions, reviewed drill core, inspected geology, reviewed core logging, sampling and preparation facilities, and documentation related to drilling, sampling, and assaying. Specific core identified by the April 2022 MRE Qualified Person, Leon McGarry, was pulled and inspected, photographed, and filmed with verbal explanations and description given by Kevin Pickett, Chief Geologist of Goldsource for later review and reference. Analytical facilities at Actlabs and MSA in Georgetown, Guyana, were not inspected.
No samples were collected for additional laboratory verification; however, mineralized intervals were inspected and compared with assay values for confirmation of mineralization.
The quality of the assay results is considered reliable and adequate for the estimation of Mineral Resources. The data available are a reasonable and accurate representation of the Eagle Mountain Gold Project and are of sufficient quality to provide the basis for the conclusions and recommendations reached in this technical report.
Mineral Processing and Metallurgical Testing
In 1989, Metallurgical studies completed by GSR were limited to desliming and gravity gold recovery testwork. The preliminary results indicated that the majority of gold does not appear to be amenable to the gravity recovery method. Additional testwork showed that desliming achieves a feed volume reduction of up to 81% with a high gold recovery to the sands fraction (+90%). It was predicted that desliming could be an important pre-concentration step, but gravity recovery reached only 24%.
In 1991, GSR carried out additional gold gravity testwork at Lakefield Research using a Falcon concentrator. Nine gravity tests were completed with an average gold recovery of between 33% and 42% of the total gold content.
In 2009, OGML submitted four samples of mineralized saprolite (Kilroy Sap, Millionaire Sap, Zion Sap, and Saddle Sap) and four mineralized fresh rock (Kilroy, Millionaire, Zion, and Saddle) from the Eagle Mountain deposit to SGS in Lakefield, Ontario for testwork to establish the nature of the gold occurrence. The testwork involved sample characterization using head analyses, mineralogy and grindability studies and an investigation of the amenability of the samples to gold recovery/extraction utilizing gravity separation and cyanide leaching. Gold recoveries using cyanide leaching (cyanidation) averaged over 90% for both the saprolite and fresh rock samples.
In 2018, testwork was completed on 22 saprolite samples from different mineralized zones at Eagle Mountain with additional samples of gravity plant tailings and the plus 2 mm stockpile. Five saprolite composites were generated together with a combined master composite. Sample characterization (assaying, sizing, mineralogy, and gold deportment) and grindability testing were followed by gravity separation and cyanidation testwork. With grinding and gravity concentration followed by cyanidation, the five saprolite composites produced elevated gold recoveries ranging from 94.8% to 97.7% with a relatively coarse grind size (p80 averaging 164 microns). The +2 mm stockpile and plant tailings material produced gold recoveries of 93.6% and 87.4%, respectively.
In April 2022, 26 samples (9 saprolite and 17 fresh rock) totaling 750 kg were collected from diamond drill core from the Eagle Mountain and Salbora deposits as well as the Toucan and Powis prospects. The samples were shipped to SGS Canada Inc. ("SGS") for additional metallurgical testwork. All saprolite and fresh rock samples were submitted for grindability testwork, including Bond ball mill work index and abrasion index tests to be used for plant design work (equipment selection and sizing). Four (4) saprolite and five (5) fresh rock composites were prepared for gold recovery and grind size optimization testwork. Standard cyanide bottle roll tests were completed on gravity tailings for the saprolite and fresh rock composites. For the saprolite composites, tests were also completed on whole ore (no gravity concentration) to enable a coarse feed size in the bottle roll tests. For all saprolite composites, the testwork returned high gold recoveries, including with a coarse grind size of 80% passing 166 microns. Fresh rock gold recoveries were also high averaging 92% for the main Eagle Mountain deposit at a p80 of approximately 80 microns. At a similar grind size, the gold recoveries for the Salbora deposit and Toucan prospect averaged 85%. Higher recoveries were generated with finer grinding.
Mineral Resource Estimate
Mineral Resources are reported in adherence to National Instrument 43-101 Standards of Disclosure for Mineral Projects (Canadian Securities Administrators, 2011), and to the Canadian Institute of Mining, Metallurgy and Petroleum (CIM) Definition Standards on Minerals Resources and Reserves (CIM Council, 2014). The MRE has an effective date of April 7, 2022, and is summarized by Mineral Resource category in the table below.
The drill hole data used for the April 2022 MRE in this study is derived from a data export provided by Goldsource via email with a cut-off date of December 31, 2021, for 75,269 metres of core drilling (772 holes) and 533 metres of auger drilling (158 holes). Only 19% of this subset was carried out by other companies (1997-2009). The MRE includes the Eagle Mountain and Salbora deposits and the Powis, Toucan and Ann targets.
Mineral Resources are constrained by a pit shell generated using a Whittle optimization with block values estimated using the same price, metal recovery, and cost assumptions used to define the reporting cut-off grades (see the notes to the table below), and assuming a maximum pit slope angle of 45°.
| Classification | Material | Cut-Off Grade |
Tonnes | Gold | Gold |
| (g/t) | (Mt) | (g/t) | (oz) | ||
| Eagle Mountain | |||||
| Indicated | Saprolite and Transition | 0.30 | 11.93 | 0.99 | 381 |
| Fresh | 0.50 | 17.15 | 1.24 | 682 | |
| All | 29.08 | 1.14 | 1,063 | ||
| Inferred | Saprolite and Transition | 0.30 | 5.86 | 0.68 | 131 |
| Fresh | 0.50 | 11.34 | 1.12 | 407 | |
| All | 17.20 | 0.97 | 538 | ||
| Salbora | |||||
| Indicated | Saprolite and Transition | 0.30 | 0.55 | 2.09 | 37 |
| Fresh | 0.50 | 1.50 | 1.74 | 84 | |
| All | 2.05 | 1.83 | 121 | ||
| Inferred | Saprolite and Transition | 0.30 | 0.24 | 0.87 | 8 |
| Fresh | 0.50 | 0.96 | 1.15 | 35 | |
| All | 1.20 | 1.13 | 44 | ||
| Eagle Mountain Project Total | |||||
| Indicated | Saprolite and Transition | 0.30 | 12.48 | 1.04 | 417 |
| Fresh | 0.50 | 18.66 | 1.28 | 766 | |
| All | 31.13 | 1.18 | 1,183 | ||
| Inferred | Saprolite and Transition | 0.30 | 6.10 | 0.71 | 139 |
| Fresh | 0.50 | 12.30 | 1.12 | 443 | |
| All | 18.40 | 0.98 | 582 | ||
Notes:
1) Numbers have been rounded to reflect the precision of the MRE. Totals may vary due to rounding.
2) Gold cut-off grade has been calculated based on a gold price of US$1,600/oz, mining costs of US$1.5/t for saprolite and US$2.0/t for fresh rock, processing costs of US$6.0/t for saprolite and US$12.0/t for fresh rock, and mine-site administration costs of US$3.0/t. Metallurgical recoveries of 95% are based on prior testwork.
3) Mineral Resources conform to NI 43-101, and the 2019 CIM Estimation of Mineral Resources & Mineral Reserves Best Practice Guidelines and 2014 CIM Definition Standards for Mineral Resources & Mineral Reserves.
4) The Company is not aware of any metallurgical, environmental, permitting, legal, title, taxation, socio-economic, marketing or political factors that might materially affect these Mineral Resource estimates.
5) Mineral Resources are not Mineral Reserves as they do not have demonstrated economic viability. An Inferred Mineral Resource has a lower level of confidence than that applying to an Indicated Mineral Resource and must not be converted to a Mineral Reserve. The quantity and grade of reported Inferred Resources in this Mineral Resource estimate are uncertain in nature and there has been insufficient exploration to define these Inferred Resources as Indicated or Measured Resources; however, it is reasonably expected that the majority of Inferred Mineral Resources could be upgraded to Indicated Mineral Resources with continued exploration.
Mineral Reserve Estimate
There is no Mineral Reserves estimate for the Eagle Mountain Project as per NI 43-101 guidelines.
PEA Conceptual Life of Mine Plan
The conceptual Life of Mine ("LOM") plan for the Eagle Mountain and Salbora deposits, as set out in the 2024 PEA, proposes a phased development plan to establish gold production from shallow open pits. Phase 1, estimated at 4.5 years, considers initial gold production from saprolite mineralization during which time most of the mining will be "free dig", not requiring blasting. This is followed by Phase 2 in which gold production will be derived from a blend of fresh rock, transition rock and saprolite mineralization for an estimated 10.5 years for an estimated mine life of 15 years.
Phase 2, which considers a higher-grade subset of the April 2022 fresh rock Mineral Resources, will require drilling and blasting of the fresh rock and transition rock to facilitate mining, material handling and processing.
For both Phase 1 and Phase 2, mill feed rates are estimated at 1.815 Mtpa (5,000 tpd), with Phase 2 designed to process up to 4,250 tpd of fresh and transition rock with the balance being made up with saprolite mill feed. The conceptual mine plan is designed to maintain mill feed rates through Phases 1 and 2. The tonnes and grade of the PEA mine plan are compared to the 2022 MRE in the table below.
| Classification | April 2022 MRE | 2024 PEA Conceptual Plan | Net Conversion of Tonnes (%) |
||
| Tonnes (Mt) |
In-situ Grade (g/t) |
Tonnes (Mt) |
Mill Head Grade (g/t) |
||
| Indicated | |||||
| Sap and Trans | 12.5 | 1.04 | 11.3 | 1.08 | 90 |
| Fresh | 18.7 | 1.28 | 8.7 | 1.58 | 47 |
| All Indicated | 31.1 | 1.18 | 20.0 | 1.30 | 64 |
| Inferred | |||||
| Sap and Trans | 6.1 | 0.71 | 3.1 | 0.92 | 51 |
| Fresh | 12.3 | 1.12 | 4.1 | 1.32 | 33 |
| All Inferred | 18.4 | 0.98 | 7.2 | 1.15 | 39 |
Notes:
1) Numbers have been rounded to reflect the precision of the MRE. Totals may vary due to rounding.
2) For the 2024 PEA conceptual LOM plan, transition rock Indicated and Inferred resources were grouped with fresh rock mineral resources and mined/processed in Phase 2.
3) For the April 2022 MRE, the transition rock mineral resources were grouped with saprolite mineral resources.
4) Refer to the footnotes below the table under the heading "Mineral Resource Estimates" above.
Overall conversion of Mineral Resources into mill feed for the 2024 PEA conceptual LOM plan is 55%. From the 31.1 Mt of Indicated Resource and 18.4 Mt of Inferred Resource, a total of 27.2 Mt of Indicated and Inferred Mineral Resources are accounted for as mill feed in the LOM plan with an average grade of 1.26 g/t of gold.
The yearly mining schedule by rock type, mill feed grade, and strip ratio are summarized in the figure below.
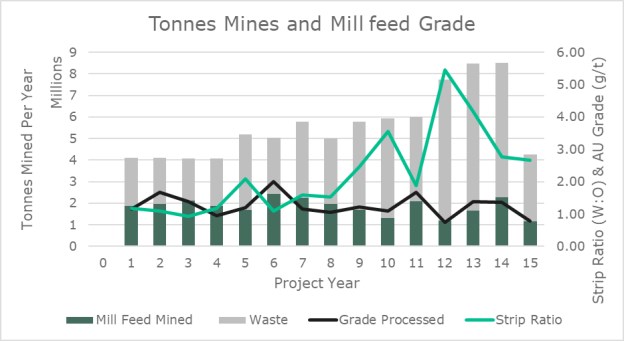
The annual gold production and tonnes processed by rock type is presented in the figure below.
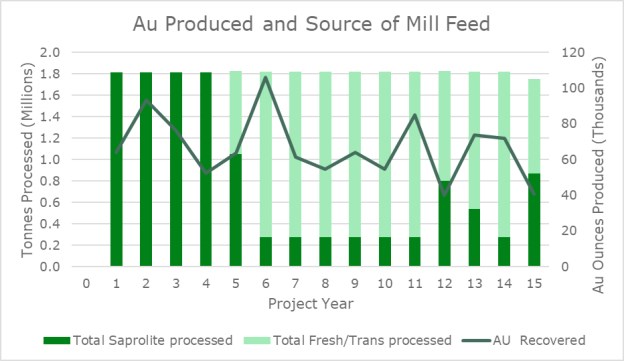
PEA Mining Plan
The mining method will use traditional load and haul methods using hydraulic excavators, and/or wheel loaders as appropriate to the terrain and depending on the major production equipment available from the contract miner selected for the Project.
The mined material will be hauled from the bench to either the processing plant, the Run of Mine ("ROM") stockpiles, or the waste dump depending on the material type.
The haul trucks appropriate for the hilly saprolitic terrain are articulated dump trucks ("ADT"). This type of haul truck has been used on site in the past (during the pilot plant operation). The haul trucks envisioned are Caterpillar 740 (36 metric tonne) model or equivalent from alternative manufacturers.
Ancillary equipment, such as bulldozers, motor graders, and water trucks will be extensively used to maintain haul roads, ramps, and waste dumps.
Other support vehicles will include maintenance, fuel, and lube trucks to support the primary fleets.
Smaller excavators and dozers will be used to maintain ditches, berms, and culverts on and around haul roads as well as to manage surface water drainage throughout the entire mine site including around stockpiles, waste dumps and all tailings infrastructure.
In Phase 2, drill and blast operation for fresh rock will be implemented and will require open pit drill rigs.
PEA Processing Plan
The 2018 and 2022 testwork provides the basis for the PEA Design Criteria as developed by Soutex. Overall, the metallurgical testwork that was carried out is sufficient in its coverage of the Mineral Resource areas and its scope of analysis to provide confidence in the figures presented and the values selected as design criteria for a PEA-level study.
A constant tails recovery method used for the PEA production and cash flow models predicts an average recovery for gold that is within 1.0% of the gold recovery assumption used for the pit optimization and mine scheduling analyses.
The process plant is designed to process 5,000 tpd of gold-bearing mill feed.
Phase 1, a low capital expenditure designed for the treatment of saprolite material, employs a carbon-in-leach ("CIL") plant featuring two leach tanks, five CIL tanks, scrubber, ball mill, cyclones, and a gravity concentrator, among many other components.
Coarse and bulk materials mined in Phase 1 will be stockpiled and processed in Phase 2. For the purpose of the PEA, all transition material is treated with the fresh rock in Phase 2.
Phase 1 mechanical equipment include:
• Apron Feeder;
• Grizzly;
• Scrubber;
• Double-Deck, Gravity, Trash, Safety, Loaded Carbon and Carbon Sizing Screens;
• Ball Mill;
• Cyclones;
• Gravity Concentrator;
• Gravity Table;
• Leach Tanks;
• CIL Tanks;
• Interstage Screens;
• Acid Wash Column;
• Carbon Stripping Column;
• Carbon Regeneration Kiln;
• Electrowinning Cells;
• Gold Furnace;
• Reagent Systems; and
• All Associated Conveyors, Pumps, and Screens.
During Phase 2, primarily fresh rock mill feed will be processed, necessitating key additional equipment such as a primary crusher, semi-autogenous grinding ("SAG") mill, thickener, and secondary cone crusher to accommodate the harder material. The configuration of the Phase 2 flowsheet is capable of processing 5,000 tpd, including up to 4,250 tpd of fresh and/or transition rock with softer saprolite making up the difference.
The Phase 2 flowsheet adds the following mechanical equipment to crush and grind transition and fresh rock mill feed down to a size suitable for the CIL process.
• Hard Rock Grizzly Feeder;
• Primary Jaw Crusher;
• Stockpile Reclaim Apron Feeder;
• SAG Mill;
• Secondary Cone Crusher;
• Additional Conveyors;
• Thickener; and
• Additional Screens.
PEA Project Infrastructure
The PEA plan proposed the following infrastructure for the Eagle Mountain Project:
• Processing Plant;
• Laboratory /Testing Facility;
• Waste Dumps;
• Tailings Storage Facilities;
• Stockpile Pads
• Haul Roads;
• Offices;
• Warehouse;
• Maintenance Shop, Wash Bay, and Laydown Area;
• Fuel Storage Facility;
• Water Storage and Water Treatment Facilities;
• Surface Water Management System (ditches and culverts);
• Sedimentation Ponds; and
• Accommodation Village (Camp).
The PEA assumes that power generation facilities will be provided by an Independent Power Producer on a power-by-the-hour basis for which the cost of mobilization and setup are estimated at US$0.17/kWh in addition to the cost of fuel required to power the generators for a total estimated cost of at US$0.37/kWh. Fuel supply for the generators and mobile equipment will need to be negotiated with local suppliers, including those currently supplying Mahdia and Campbelltown with gasoline and diesel fuel.
Satellite internet and commercial mobile phone services are currently available at the Eagle Mountain Gold Project. The system can be easily upgraded with the installation of a simple service mast by the local telecom company.
Roads at the mine site will require upgrading, with grading and bridge work, to support light vehicles and heavy equipment. These roads will be separate from the mine haul roads.
Mine haul roads outside of the in-pit roads will be built as needed to provide haulage connections between the mined pits and the storage dump/s as well as the processing plant.
Camp requirements will be made available to accommodate the portion of the workforce that does not come from or live in Mahdia and/or Campbelltown, 8 kilometres to the north. The camp will provide accommodations for over 250 persons, and all necessities for their comfort (kitchen, dining hall, fitness/recreation amenities, showers/toilets, security, etc.)
The Project will favor patronizing local business and accommodations to the extent that the local community desires and permits.
PEA Environmental Baseline Studies
A number of biodiversity baseline assessments were conducted by independent consultants within the relevant western half of the EMPL covering the MRE area and the proposed area for mine development. In the 2021 biodiversity study, no endemic, rare, or threatened plants, birds, or habitats were found in the Project area. However, several fish, mammal, amphibian and bird species were identified as "Vulnerable" or "Near Threatened". Two amphibian species were categorized as "Threatened". No "rare" species were identified. The 2021 study in addition to further baseline studies will be used to assess impacts and development risk mitigation measures as part of the Environmental Management Plan ("EMP") and/or Environmental Impact Assessment studies ("EIA").
Water quality sampling studies were conducted in 2013, covering the entire project area. During both studies, wet and dry seasons were analyzed. The water quality in the project area is generally representative of similar environments in Guyana, with some streams showing variable sediment loads due to seasonal rain events and, in areas, due to historical mining. However, most streams exhibit characteristics of the natural environment.
Additional studies will be required for the EIA. The assessment of impacts will take into consideration applicable mitigation measures and follow-up programs. The Company will engage in formal public consultations, scoping meetings and will need to comply with the requirements for mine development, mine operations and mine site closure and rehabilitation, established by the regulatory authorities in Guyana.
The Qualified Person, Rolf Schmitt, was unaware of any environmental, permitting, legal, title, taxation, socio-economic, marketing, and political or other relevant issues that could potentially materially affect the PEA and the Eagle Mountain Project as of the date of the PEA.
PEA Capital Costs
Phase 1 and Phase 2 pre-production capex estimates for the processing plant were based on budget quotes from manufacturers for large mechanical equipment and quotes from recently constructed and under-construction projects (basis 2022-2023) for other plant/auxiliary equipment. Non-plant and other development capex are derived from both benchmarking analyses using comparable projects and calculation-derived estimates for certain earthmoving activities. Development capex includes a contingency of 15%.
Over the 15-year mine life, total capital costs1 for the Project, including pre-production capital expenditures (“CAPEX”) for Phase 1 and Phase 2, and sustaining CAPEX1, are estimated at US$295.6 million (see table below).
The pre-production capital cost for Phase 1 of the Project is estimated at US$95.6 million. It includes indirect costs, owner's costs, and working capital.
The pre-production capital cost for Phase 2, to be incurred in Years 4 and 5, is estimated at US$46.6 million and includes indirect costs, owner's costs, and working capital.
The total sustaining capital costs1 to be expended over the LOM is estimated at US$133.4 million.
The total capital cost1 of reclamation is estimated at US$20.0 million.
| CAPEX Description | Year | Cost (US$M) |
| Pre-production Phase 1 - Direct Costs | 0 | 65.0 |
| Pre-production Phase 1 - Indirects and Owners Costs | 0 | 30.5 |
| Phase 2 - Direct Costs | 4 & 5 | 32.3 |
| Phase 2 - Indirects and Owners Costs | 4 & 5 | 14.3 |
| Sustaining Costs1 (LOM) | 2-15 | 133.4 |
| Reclamation | 15+ | 20.0 |
| Total CAPEX | 295.6 |
PEA Operating Costs
Operating costs have been determined based on benchmarking analyses using similar sized saprolite and fresh rock operations with adjustments for local conditions. For unit processing cost determinations, the average blend (ratio of fresh rock to saprolite) for the LOM was used to estimate power draw and reagent consumptions.
Total on-site operating costs over the LOM are estimated at US$786 million or US$28.88/t processed (see table below).
| Description | Total Cost (US$M) | Unit Cost (US$) | Unit |
| Mining | 202 | 2.40 | US$/t mined |
| 7.40 | US$/t processed | ||
| Processing | 448 | 16.47 | US$/t processed |
| Rehandle | 4 | 0.13 | US$/t processed |
| G&A | 123 | 4.50 | US$/t processed |
| Other | 8 | 0.28 | US$/t processed |
| Rent | 1 | 0.03 | US$/t processed |
| Contractor Mobilization | 2 | 0.07 | US$/t processed |
| Total | 786 | 28.88 | US$/t processed |
_________________________
1 Non-IFRS Measure. See “Non-IFRS Financial Performance Measures”.
1) The unit mining and processing costs for saprolite are estimated at US$2.10/t mined and US$11.10/t processed, respectively.
2) The unit mining and processing costs for fresh and transition rock are US$2.75/t mined and US$21.00/t processed, respectively.
PEA Economic Analysis
The economic analysis of the Eagle Mountain Project is based on the PEA production and cost models developed for Phase 1 and Phase 2 and LOM construction, operating, and reclamation plans. The models include the major components of each phase, including open pits, CIL processing plant, and all supporting infrastructure, such as haul roads, waste rock dumps and tailings storage facilities.
The economic analysis uses a DCF model which applies all Phase 1 pre-production capital costs at the end of Year 0, and all revenues, operating costs and sustaining capital1 at the end of the year in which they occur.
The annual estimates for metal sales (revenue), costs (operating and capital costs), and pre-tax free cash flow are illustrated in the figure below.
PEA Annual Estimates For Revenue, Costs, And Pre-Tax Free Cash Flow2 (Gold Price Of US$1,850/Oz)
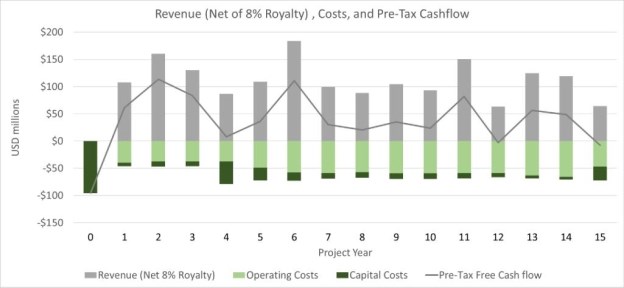 |
| Note: Revenue is reported net of 8% federal royalty. |
The DCF's incremental and cumulative free cash flow2 before and after-tax are presented in the figure below.
After-tax free cash flows3 are defined as revenues net of operating costs, royalties, capital expenditures and cash taxes. After-tax free cash flows, Net Present Value ("NPV"), and Internal Rate of Return ("IRR") exclude tax loss pools in Guyana, which can be carried forward to offset taxable income in future years.
_________________________
2 Non-IFRS measure. See “Non-IFRS Financial Performance Measures”.
3 Non-IFRS measure. See “Non-IFRS Financial Performance Measures”.
This PEA is preliminary in nature, it includes inferred mineral resources that are considered too speculative geologically to have the economic considerations applied to them that would enable them to be categorized as Mineral Reserves, and there is no certainty that the preliminary economic assessment will be realized.
PEA Annual Estimates for Incremental And Cumulative Free Cash Flow3 Pre- And After-Tax (Gold Price Of US$1,850/Oz)
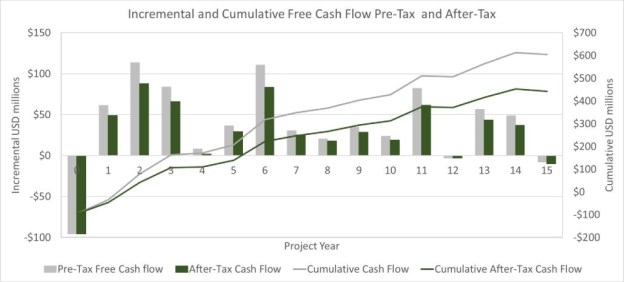
The assumed gold price for the Base-Case economic analysis is US$1,850/oz.
The cumulative undiscounted free cash flow3 for the Project is estimated at US$605 million and US$443 million on pre-tax and after-tax bases, respectively.
The estimated pre-tax and after-tax NPV for the DCF at 5%, 8%, and 10% discount rates are presented in the table below.
PEA Pre-Tax And After-Tax NPV For 5%, 8%, And 10% Discount Rates (Gold Price Of US$1,850/Oz)
| Parameter | Unit | Base Case Value | Value | Value |
| Discount Rate | % | 5% | 8% | 10% |
| Pre-Tax NPV | US$ M | 406 | 326 | 284 |
| After-Tax NPV | US$ M | 292 | 232 | 200 |
The PEA for the Eagle Mountain Project has a pre-tax IRR of 75% and an after-tax IRR of 57%
The estimated payback period of the Phase 1 pre-production CAPEX is 1.5 years based on the forecast after-tax cash flows4 at the Base Case gold price assumption of US$1,850/oz.
After-tax cash flows4 in Years 1.5 to 4.0, after the Phase 1 payback period, are estimated to exceed the pre-production capital costs for Phase 2.
_________________________
4 Non-IFRS measure. See “Non-IFRS Financial Performance Measures”.
Sensitivity
The sensitivity of the after-tax NPV and after-tax IRR to unit operating costs for mining and processing, CAPEX, and gold price are presented in the figures below.
After-Tax NPV% Sensitivity To Change In Parameters
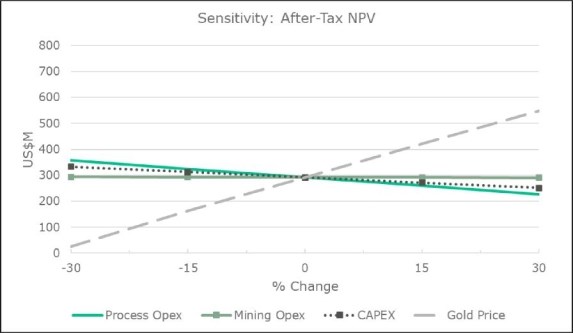
After-Tax IRR Sensitivity To Change In Parameters
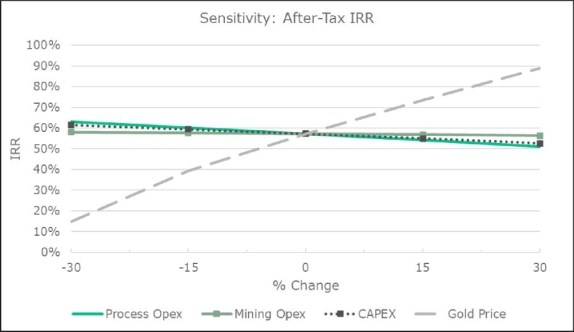
PEA Conclusions
The positive results of the PEA for the Eagle Mountain Gold Project, as expressed by NPV and IRR, justify its further evaluation by advancing to a pre-feasibility study. The QPs noted the following interpretations and conclusions in their respective areas of expertise, based upon the review of data available for this Project.
Data Verification and Mineral Resources
There is a good understanding of the gold mineralization's geology and the nature on the Project. Additional exploration is warranted to potentially increase the Mineral Resource base.
The sample collection, preparation, analytical, and security procedures, as well as the QA/QC program as designed and implemented by Goldsource are adequate, and the assay results within the database are suitable for use in Mineral Resource estimation.
The QA/QC program indicates good precision, negligible sample contamination, and potential low bias for gold at the assay laboratory.
PEA Market Studies and Contracts
Gold markets are extremely mature global markets with trading at multiple locations around the world 24 hours a day. Gold production from the Eagle Mountain Project is expected to be sold on the spot market. The terms and conditions will be consistent with standard industry practices. Doré bars will be shipped from site to Georgetown by air and then on to the Guyana Gold Board.
As of November 13, 2023, the consensus long-term forecast from eight recognized investment institutions was US$1,957.27. The gold price used in the parameters for both the MRE and optimized pit shell upon which the PEA mine plan is based was US$1,600/oz. The gold price used in the cash flow model built from the PEA mine plan was US$1,850/oz.
Project Risks and Opportunities as Defined in the PEA
The Project is subject to risks that are typical to all mining projects as well as specific risks for this Project. These risks, as defined in the 2024 PEA and described below.
Geology and Mineral Resources:
• The geological models have achieved a foundational level of understanding and will evolve with additional drilling. Future infill drilling is intended to convert Inferred Resources to the Indicated classification.
• The QA/QC program supporting the sample database as executed by Goldsource is adequate; however, improvements are warranted for the QAQC protocol; and
• Mineral Resources that are not Mineral Reserves do not currently demonstrate economic viability. The increase in confirmatory drilling and drilling density will allow for the conversion of Inferred Resources to Indicated category, and the eventual establishment of Mineral Reserves.
Mining and Infrastructure:
• Information on rock mechanics, geotechnical properties and hydrogeology was not available at the time of the PEA; and
• Detailed engineering of required site infrastructure was not complete at the time of the PEA.
Mineral Processing:
• Prospects along the north-south Salbora-Powis trend, such as Salbora and Toucan exhibit lower gold recoveries via cyanidation. Additional variability testwork should be completed to evaluate opportunities for higher recoveries via finer grinding; and
• Mill operating costs, particularly for fresh rock, are sensitive to power rates. There is an opportunity to the potential for cheaper power sources, which could result in a lower milling unit costs.
Infrastructure:
• Detailed engineering of plant infrastructure is not completed;
• Site power availability and study are to be confirmed from local power supplier;
• Tailings and water management require additional studies;
• Water balance and load balance have not been developed;
• Insufficient geochemistry data to identify sources terms;
• Tailings facility location used in PEA has not been optimized nor confirmed; and
• Groundwater and seepage flow from the tailings facility have not been modelled.
Regulatory:
• The Project's realization and/or schedule is dependent upon securing the necessary permits or approvals; and
• The submittal and approval of the closure plan by the regulating authorities are conditional to the release of the mining lease and the beginning of mining operations.
Capital and Operation Costs:
• Detailed engineering and construction sequencing for the TSF has not been completed; and
• Price escalation is not included.
Rehabilitation and Closure:
• The Project waste rock is assumed to be NPAG and non-metal leaching, and no engineered cover is included in the closure cost estimate; and
• Detailed closure plans and costs are to be developed during the next study level.
Exploration, Development and Production
Exploration
Since the effective date of the mineral resource estimate at Eagle Mountain, there has been additional drilling to expand and infill the resource which was not included in the estimation, along with property wide exploration and condemnation drilling.
During 2021, twelve (12) diamond drill holes, totaling 1930.5m, were completed in an exploration target outside of the resource area, which were not included in the current mineral resource estimate.
Between January 1, 2022, and February 28, 2026, a total of 178 diamond drill holes totaling 13,119m have been completed in areas of infill and exploration targets on the Eagle Mountain Project. In addition, the project has conducted three phases of geotechnical drilling on proposed pit walls and potential infrastructure locations, such as the tailings storage facilities, the waste rock storage facilities and potential plant location. A total of 59 geotechnical drill holes have been completed totaling 2,277.8m.
Development (Permitting)
Regarding the regulatory process for environmental authorization, on March 25, 2026, the Company submitted to the Guyana EPA the ESIA report. The ESIA reflects the project's baseline studies for environmental, social, cultural, engineering, community engagement as well as expected impacts and mitigation measures. Surface disturbances have and will be minimized, and best management practices will be used to minimize lasting project impact.
Public notice of the ESIA filing will initiate the 60-day public comment period, which will include stakeholder disclosure meetings. Once all comments are satisfactorily addressed and the final ESIA submitted, the EPA will make a determination on the ESIA approval with the issuance of the Environmental Authorization issued thereafter. The Company anticipates filing of the final ESIA in the second half of 2026.
Receipt of ESIA approval from the Guyana EPA is a precondition for receipt of a Large-Scale Mining License. A mining license granted by the Guyana Geology and Mines Commission is required before mining and processing of gold mineralization can commence. A Large-Scale Mining License would cover the Kilroy Mining Permit, all or part of the EMPL and any relevant small-scale claims.
For the engineering and project design programs, 2026 activities will include further geotechnical drilling using the Company-owned drill rig in the areas planned for mine tailings, waste dumps, and the processing plant. As well, activities will include preparations for infill and expansion drilling, focusing on mineralization below the pit outlines defined in the 2024 PEA, and drilling to generate samples for follow-up metallurgical tests, with a focus on generating additional hardness data and the associated mill design parameters for the deeper fresh rock mineralization in the Eagle Mountain deposit.
The following table shows the current licenses.
| License Name/Number | Ownership/Agreement | Grant Date | Expiry Date |
| Eagle Mountain Prospecting License (EMPL) PL# 04/2024 |
Stronghold Guyana Inc. (100% Guyanese subsidiary of Goldsource Mines Inc) | 30-Sep-24 | 30-Sep-27 |
| Kilroy Mining Medium Scale Mining Permit (MSMP) #K-60/MP/000/2014 |
Kilroy Mining Inc. (100%). Under agreement with Stronghold Guyana Inc. for 100% control subject to 2% Royalty | 17-Jul-24 | 17-Jul-29 |
| HO#21/213/1995, Small Scale Mining Claim, known as Ann SSMC | Mark Crawford (Guyanese). Under Option and Purchase Agreement, dated Oct 20, 2020, for 100%. On Apr 4, 2024, the terms were amended to extend the option period for two additional years, expiring on Oct 20, 2026, | 21-Dec-98 | N/A as long as fees paid annually |
Goldsource has increased the performance bond, held by the Guyana Geology and Mines Commission ("GGMC"), for exploration permits on the Eagle Mountain Gold Project to US$253,000 and $100,000 Guyanese dollars (September 30, 2025). The size of the EMPL is sufficiently large for the conceptual mine plan as well as the proposed infrastructure, including the tailings storage areas, waste disposal areas, and processing plant site.
Currently, there is no information available regarding any correspondence, complaints (whether formal or informal), lawsuits, notices, orders or demands that have been received by or served upon the Companies by relevant environmental authorities, protective agencies or third parties in relation to the Mining Properties, including the Lands that are held by virtue of the mining permit and claim licenses.
Furthermore, there have been no actions or claims made against the Companies or relating to the mining properties, including the Lands held by virtue of the Mining Permit and Claim Licenses.
Production
There has been no production on the Eagle Mountain Project to date.
San Albino
The following summary is extracted in part from, and qualified in its entirety with reference to, the full text of the the technical report entitled "Amended Technical Report and Estimate of Mineral Resources for the San Albino Project Comprising the San Albino and Las Conchitas Deposits, Nueva Segovia, Nicaragua, Revision 13 Report RSI(RNO)-M0206-24002" with a report date of June 10, 2024 and an effective date of October 11, 2023 (the "San Albino Technical Report") prepared by Steven Ristorcelli, Peter Ronning, Matthew Gray, John Rust, Brian Ray, and Thomas Dyer, who are each Qualified persons as defined by NI 43-101. With the exception of Mr. Rust, the Qualified persons have no affiliations with Mako, or their subsidiaries, except that of independent consultant/client relationships. Readers are encouraged to review the full text of the San Albino Technical Report, available for review under the Company's website at www.makominingcorp.com. This technical report supports the scientific and technical information with respect to the San Albino project set out in this AIF. All capitalized terms not otherwise defined in this summary are defined in the San Albino Technical Report. See "Interests of Experts".
Property Description and Ownership
The San Albino mining property is located in Nueva Segovia Department of the Republic of Nicaragua, 227km north of the city of Managua, and approximately 15km southeast of the northern border of Nicaragua with Honduras. Within the property, the San Albino gold deposit (the "San Albino deposit") is currently being mined by Mako and is located at Latitude 13° 41' 23"N and Longitude 86° 06' 04"W (597,200E, 1,513,600N, UTM Zone 16, WGS 84 Datum). The Las Conchitas deposit is located 0.5km south of the San Albino open pit. The San Albino property consists of four contiguous mining concessions referred to as: 1) San Albino-Murra, 2) El Jicaro, 3) La Segoviana, and 4) Potrerillos concessions, respectively, and comprise a total of 18,816.72 hectares (188.17km2 ).
Mako, indirectly through their subsidiary, Nicoz Resources, S.A., holds a 100% interest in the San AlbinoMurra, La Segoviana and Potrerillos concessions. Mako, indirectly through their subsidiary, Gold Belt, S.A., holds a 100% interest in the El Jicaro concession. Annual fee payments on the mineral concessions are required on a semi-annual basis, payable in January and July each year. The payments escalate from $0.25 per hectare to $8.00 per hectare over the first 10 years and are $12.00 per hectare thereafter. Concession fees and taxes have been paid in full to December 31, 2023. The annual holding costs for all four concessions are estimated at $185,420.
Mako has purchased the surface rights over 100% of the area covering the San Albino deposit. Additional surface rights were purchased to cover all the area permitted for processing infrastructure and mining activities, as well as additional properties at the Las Conchitas area. The Company has acquired surface rights totaling 915.584 manzanas (645.127 hectares) in 92 individual properties. The Company is currently negotiating the purchase of additional properties on future exploration areas.
Exploration and Mining History
Gold-bearing quartz vein mineralization was discovered at the San Albino project area around 1790 by Spaniards who initially mined gold at the San Albino deposit from an open pit and subsequently by underground methods. Flooding eventually stopped the early work. From 1885 to 1926 and possibly into the 1930s, the property was worked by several operators. In 1922 to 1926, Charles Butters, an American metallurgist, built a mill on site. In 1926, the operation was seized by Augusto Sandino, leader of the Nicaraguan revolution.
The first modern-era exploration was conducted by Western Mining starting in 1996 on the Quilali-Murra exploration concession. Work included stream-sediment and rock chip sampling, as well as soil sampling along trails and footpaths. Two vertical core holes were drilled to shallow depths. Beginning in 1997 through 2006, Resources and Mining S.A. ("REMISA") controlled the property and focused its efforts on the historical San Albino mine. REMISA reopened historical cross-cuts but could not reach the main drift. A soil survey was completed and shallow core drilling was conducted from the hanging wall of the mineralized structure. During the second half of 2003, Pila Gold Ltd. ("Pila") identified and mapped showings of mineralization, collected rock samples, soil samples, and silt samples from the San Albino vein and adjacent Murra area. Additionally, Pila hand-excavated and sampled 24 trenches. Most work was concentrated around the Las Conchitas target and the historical San Albino mine. In 2006 to early 2009, Condor Gold Plc. ("Condor") explored the San Albino and Arras veins. Condor collected 2,398 samples from 75 trenches and a total of 694 samples were taken from 82 road cuts. Condor mapped or inspected 246m along eight adits from which 246 samples were taken. Twenty-two reverse circulation ("RC") drillholes and two core holes (2,754m) were drilled at the Arras and San Albino veins. In 2009, Golden Reign Resources Ltd. ("Golden Reign") acquired the San Albino-Murra concession. In 2018, Golden Reign merged with Marlin Gold Mining Ltd. to form Mako. Exploration at the San Albino project area has been ongoing since it was acquired by Golden Reign (now Mako).
Geological Setting, Mineralization and Deposit Types
Regional Geology
Northwestern Nicaragua, which includes the San Albino project area, is partly underlain by arc-related sedimentary rocks. These strata are included into the Chortis Block ("CB"), which includes pre-Cenozoic basement rocks ranging in age from Proterozoic through middle Mesozoic in neighboring Honduras, El Salvador, and Guatemala. The CB includes the only exposed cratonic basement of the Caribbean Plate (Rogers et al., 2007). Regional correlations suggest some CB strata were deposited along the continental margin of the North American plate after its separation with South America (Burianek and Dolnicek, 2011).
The eastern part of the CB in southern Honduras and adjacent northwestern Nicaragua comprises a regionally metamorphosed Jurassic sedimentary sequence that also includes tectonic inliers as old as Paleozoic (Mann, 2007). The eastern CB is separated from older rocks of the central CB in Honduras by the northeast-striking Guayape fault, a major Quaternary sinistral-slip fault. Regional metamorphism in the eastern CB ranges from lower greenschist through amphibolite facies, although the youngest strata commonly lack metamorphic textures. An important and widely distributed unit in the Honduras part of the eastern CB is the Middle Jurassic Agua Fría Formation, which is at least 1.7km thick and consists of metamorphosed marine turbidites, as well as conglomerate and sandstone, and scarce carbonate strata. The Agua Fría was subsequently correlated by Burianek and Dolnicek (2011) with rocks exposed in northwestern Nicaragua, including the San Albino project area. Viland et al. (1996) suggests regional metamorphism and contractional deformation in the Agua Fría Formation predate late Cretaceous overlap strata (Mann, 2007; Rogers et al., 2007).
Rocks of the eastern CB in northern Nicaragua were intruded by Cretaceous granitic rocks including the >800km2 Dipilto batholith, which yielded variable isotopic ages of between 83 and 140 Ma (Rogers et al., 2007; Burianek and Dolnicek, 2011). Importantly, the oldest batholith age constrains deformation and regional metamorphism in the intruded wall rocks to between late Jurassic and earliest Cretaceous (Rogers et al., 2007). Cretaceous granitoids of northern Nicaragua range from cordierite-bearing granite to calc-alkaline tonalite and granodiorite with less abundant diorite and gabbro. A contact metamorphic aureole up to a few kilometers wide extends beyond the Dipilto batholith, further obscuring original wall rock textures and making correlation difficult.
Rocks of the CB and Cretaceous plutons are largely buried by thick and laterally extensive arc-related volcanic rocks of Neogene age in northwestern Nicaragua, except for some areas of Nueva Segovia. Neogene volcanic rocks comprise a continuous northwest-trending belt about 80km wide in western Nicaragua that lies about 40km east of the modern volcanic arc. The two arcs are separated by the Nicaraguan Depression, a major arc-parallel valley (McBirney and Williams, 1965). Volcano-sedimentary rocks associated with Neogene volcanism extend over a much broader region of the country. Equivalent volcanic and volcaniclastic rocks unconformably overlie deformed and metamorphosed rocks of the CB about 15km southeast of the San Albino project.
The regional geologic setting of the property is shown in the map below. The gold deposits of the San Albino project are situated ~three kilometers east of the east-central edge of the exposed Dipilto batholith.
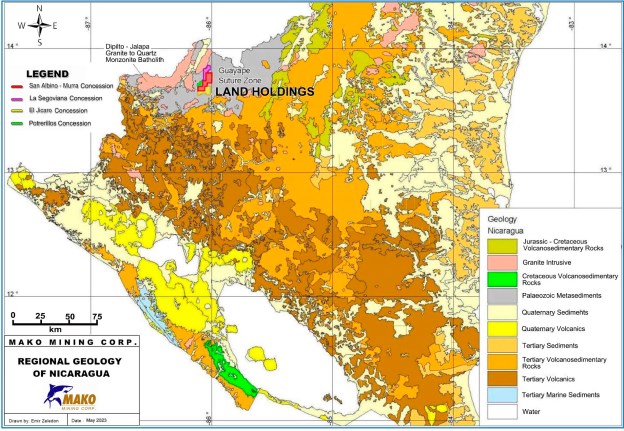
Local and Property Geology
The San Albino property is situated in mountainous terrain along the southeast flank of the Dipilto-Jalapa Mountains, the highest range in Nicaragua. The core of the range consists of granitoids of the Dipilto batholith. On the flanks of the range, west and north of the property, the Dipilto batholith intruded phyllite and carbonaceous schist. These deformed and variably metamorphosed, originally fine-grained basinal strata underlie most of the property and have been assigned to the probably Paleozoic Palacaguina Formation and related units (Sundblad et al., 1991) or, more recently, to the mid-Jurassic Agua Fría Formation and equivalent units (Rogers et al., 2007; Burianek and Dolnicek, 2011; Viland et al., 1996).
Nearly all of the property is underlain by schist and phyllite that Mako geologists assign to the Agua Fría Formation. The phyllite likely is of volcaniclastic derivation (Kowalchuk, 2011).
Rocks at the project consist of black, occasionally carbonaceous argillite or metapelite (i.e., locally termed "graphitic schist") derived from shale protoliths. We use the term carbonaceous argillite instead of graphitic schist in describing unoxidized host rocks in the San Albino and Las Conchitas area based on preliminary metallurgical testing that indicates most carbon is of lower maturity than graphite (Puritch et al., 2015). Outboard of the historical mine areas and argillite exposures, quartz-muscovite phyllite (i.e., locally termed "gray phyllite") is predominant.
Southeast vergent folds and thrusts have been recognized within the meta-sedimentary rocks of the San Albino property. Regional metamorphism and deformation are thought to predate the Dipilto batholith (Rogers et al., 2007; Burianek and Dolnicek, 2011). The schistose foliation is attributed to shortening that preceded emplacement of the Dipilto batholith.
The earliest structures affecting metamorphic rocks in the immediate San Albino deposit area include: 1) northeast-striking, shallowly to moderately northwest-dipping faults and more broadly distributed shear zones; 2) subparallel open to tight folds, and 3) steeply dipping northeast- and northwest-striking faults These observations were originally reported by Goerse (1996) and were later summarized in Kowalchuk (2011).
The meta-sedimentary rocks at the San Albino deposit are cut by dikes of intermediate composition that strike, in part to the northeast, subparallel to the prevailing foliation in the meta-sedimentary rocks and to the contact with the Dipilto batholith. However, the age and relationships of these dikes to exposed granitic rocks of the Dipilto batholith and to the regional metamorphism and deformation are not known.
Mineralization - San Albino Deposit
Mining at the historical San Albino mine occurred on three separate vein systems: Arras, Naranjo, and San Albino. Subsequent exploration drilling and mine development by Mako confirmed that the three gold-bearing vein systems exhibit down dip continuity and comprise a stacked set of subparallel veins, with a regular spacing of about 90m between the veins). The shear-hosted quartz veins dip on average about 40° northwest, but dips range from nearly flat to about 60°. Veins pinch-and-swell (i.e., boudinage) in both their dip and strike directions but, commonly, thicker shear-hosted vein intervals and higher-grade gold in workings of the historical San Albino mine appear to be in "flats" flanking antiformal fold hinges or "crests" in the foliation.
Low- and moderate-angle faults control the distribution of gold-bearing quartz veins. At the San Albino project, quartz-bearing shear zones up to several meters thick are stacked in subparallel fashion (e.g., San Albino, Naranjo, and Arras veins) to comprise the San Albino deposit. The separation between shears averages just under 100m. The shear-related veins and their enclosing faults have anastomosing, pinch-and-swell geometries. The continuity between shear zones and metamorphic foliation is consistent with a thrust geometry.
Quartz veins at the San Albino deposit have distinctive characteristics according to Gray (2019), who distinguished six vein types based on their mineralogy, texture, and geographic location. Observations made during the March 2023 review led to a re-assessment of conclusions reached in 2019 about vein styles and mineralization events. New observations confirm that contrasting textural, mineralogic, and geochemical characteristics are evidence of multiple vein forming events, of which two types at the San Albino deposit are gold mineralized and of significance to the mineral resource (Gray, 2023):
1. Quartz Sulfide ("QS") veins: multi-stage crack-seal veins, gold and silver mineralized, late syn-deformation, weakly deformed, concordant, banded, styolitic. San Albino is archetype and Arras and Naranjo belong to this vein type. These are early stage compact quartz veins described as mottled grey-white, with color variation sometimes defining weak banding; styolitic banding or ribbon vein texture is almost always present (Figure 7-4, Figure 7-5), most commonly at margins; visible gold is common as submillimeter scale blebs in quartz not associated with microfractures or sulfides.
2. Sulfide Veins and Stringer ("SVS") comprises later Au-Ag-Pb-(Zn) mineralization. SVS occurs as sulfide bands, stringers, and impregnations in fractured, earlier-stage QS quartz veins (Figure 7-6); as sulfide impregnations in breccia and gouge zones in hangingwall (most often) and footwall (not common) in tectonized vein zones sometimes without appreciable quartz veining; and as sulfide bands or veins; relatively Ag rich, Au:Ag <1. Visible gold may be present as discrete blebs contained in quartz or less commonly in sulfides.
3-D Rendering of the San Albino Deposit veins
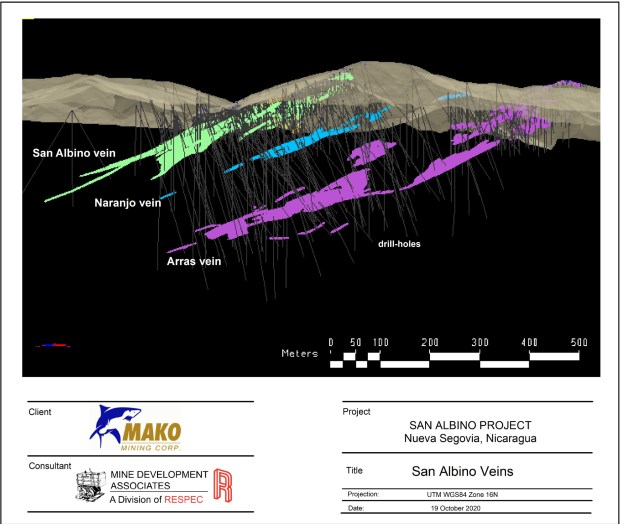
Mineralization - Las Conchitas
Mineralization at the Las Conchitas deposit is related to veins of the same mineralogic and structural style as those described at the San Albino deposit. In drillcore exposures mineralized zones from the two deposits are indistinguishable from each other. Both comprise early compact quartz veins (QS veins) and later Au-Ag-Pb-(Zn) mineralization (SVS). However, drillcore exposures indicate that many of the mineralized zones at Las Conchitas have undergone the same imbricate faulting observed at San Albino but with a greater thickness and degree of tectonic brecciation and cataclasis.
Grillo (2023) observed that the main gold-bearing structures have well developed hangingwall and footwall zones defined by breccias that correspond to boundaries of the low angle fault zones that controlled vein emplacement, and that felsic and andesitic dikes intrude the schists with two preferred orientations, northwest to southeast and east-northeast to west-southwest. The dikes are unmineralized and unfoliated thus appear to be relatively late features unrelated to mineralization.
Mineral Deposit Type
The mineralization in the San Albino project area is best interpreted in the context of an "orogenic gold" deposit model based on the association of gold mineralization with metamorphic host rocks, the textures and mineralogy of the San Albino and Las Conchitas veins, the wallrock alteration, and the "gold-only" character of mineralization. The veins are hosted in lower greenschist-facies metamorphic rocks, and their geometries indicate that veins formed in response to contractional deformation. Other common orogenic gold deposit features present in the San Albino system include ribbon-textured shear veins containing milky quartz, visible gold, relatively high Au:Ag ratios, and low percentages of base metal sulfides.
Exploration
San Albino-Murra Concession
Exploration work began on the San Albino-Murra concession in 2009 and is ongoing as of the date of this report, primarily focused at and around the San Albino deposit. In 2019, Mako conducted an induced potential and resistivity ("IP/Res") survey at the San Albino deposit. The IP/Res survey was carried out by Investigaciones Geologicas y Geofisicas S.A. ("I GEOS") of Managua using an ABEM Terrameter LS (Lund System). Approximately 15.2 line-kilometers were surveyed on lines oriented NE-SW and spaced 10m apart. The objective of the survey was to determine whether IP and/or resistivity could be used to define: 1) historical dumps and workings, 2) mineralized veins and 3) faults and fractured rock. Results of the survey were mixed, there is not a clear IP and/or resistivity response for the mineralized veins; historical dumps and workings had a marginal response, while faults and fractured rock had a clear response.
San Albino-Murra Concession Mapping and Surface Sampling
Since 2009, Mako has completed mapping covering the entire concession at 1:20,000 scale and has collected surface samples in the concession. This total number of samples includes 8,194 surface samples (grab, float, channel and underground), 6,278 soil samples covering an area of around 23km2, and 17,212 channel samples from exploration pits and trenches, nearly evenly split between the San Albino and Las Conchitas deposit areas. The results of the surface rock chip sampling are shown in Figure 9-1 and rendered immaterial in the area of the resources since so many trench and channel samples were taken. The channel sample results are, in some cases, used in the estimation of resources at the San Albino and Las Conchitas deposits.
Numerous surface exposures of veins at the San Albino and Las Conchitas deposits have been developed by trenching, which makes channel sampling a useful exploration and delineation technique. Mako has completed channel sampling of 761 trenches and exploration pits as summarized in Table 9-1; see Section 10.0 for the locations of the channel samples which are shown, together with drillhole collars, in Figure 10-1 and Figure 10-3. Channel samples generally ranged from 0.5 to 3m in length and averaged 1.5m.
Channel samples collected by Mako from trenches and exploration pits were collected carefully and are well documented. The authors believe the channel samples are representative and of generally adequate quality to use for resource modeling, subject to those exclusions discussed in the technical report (Section 12.2 and Section 14.0. The relevant results are summarized in Section 14.2.8 and 14.2.9. Channel sampling procedures are discussed in Section 11.1.1.)
San Albino-Murra Concession Underground Sampling
Mako has had limited access to the historical San Albino mine workings via four adits on the 150, 200, 300 and 400 levels. All of the tunnels had collapsed blocking access to the veins and mineralization. Mako conducted a small amount of channel sampling outside the mineralized zones. Existing and recorded historical underground sampling was more useful, although these historical data are not in the resource database and were not used in estimation. At the Arras tunnel 3, Mako collected 31 samples over a 10m to 15m strike length.
El Jicaro Concession
The El Jicaro concession was acquired by Mako in early 2012. Initial work by Mako consisted of mapping and sampling. Multiple areas with exposed gold mineralized veins and vein float were identified. An auger soil sampling program was conducted over an area of 15.17km2 (covering approximately half of concession) and 3,414 soil samples were collected in total. In late 2015, a trenching program was conducted at the historical El Golfo mine area. A total of seven trenches totaling 134m in length, and seven exploration pits across 50m, were excavated by hand, from which a total of 292 samples were collected and assayed. Three diamond core drillholes were completed in 2022, totaling 410.1m.
Potrerillos Concession
The Potrerillos concession was acquired in 2019. Preliminary geological mapping, sampling and prospect evaluation has been conducted. A graphical summary of assay results and locations of gold mineralized rock chip and float samples are shown in Figure 9-1. Seven diamond core drillholes were completed in 2022, totaling 1,098.7m.
La Segoviana Concession
The La Segoviana concession was acquired in 2020. Prospect evaluation and limited surface sampling began in 2023. Mapping and sampling of seven trenches and pits has been completed, including collection of 386 samples for assay. Diamond core drilling of the concession commenced in 2023.
Drilling
A total of 194,076m have been drilled in 2,284 diamond core and RC holes since 1996 in the San Albino and Las Conchitas deposits and nearby prospects as summarized in the table below.
| Company | Project or Concession |
Years | Meters | Holes | ||||
| Core | RC | All | Core | RC | All | |||
| Historic Drilling (Prior to Golden Reign) | ||||||||
| Western Mining Corp | 1996-1997 | 52 | - | 52 | 2 | - | 2 | |
| Resources and Mining S.A. | 1997-2005 | n/a | n/a | n/a | n/a | n/a | n/a | |
| Condor Resources | 2006-2008 | 2,754 | - | 2,754 | 24 | - | 24 | |
| Company | Project or Concession |
Years | Meters | Holes | ||||
| Core | RC | All | Core | RC | All | |||
| Drilling by Golden Reign and Mako | ||||||||
| Golden Reign / Mako | San Albino | 2010-2022 | 105,033 | 4,205 | 109,238 | 1,232 | 200 | 1,432 |
| Golden Reign / Mako | Las Conchitas | 2011-2023 | 78,640 | 4,074 | 82,174 | 718 | 109 | 827 |
| Mako | Jicaro | 2022 | 410 | - | 410 | 3 | - | 3 |
| Mako | Potrerillos | 2022 | 1,099 | - | 1,099 | 7 | - | 7 |
| Mako | La Segoviana | 2023 | 1,155 | - | 1,155 | 15 | - | 15 |
| Golden Reign / Mako | Total | 186,337 | 8,279 | 194,076 | 1,975 | 309 | 2,284 | |
Historical Drilling by Western Mining Corp. and Resources and Mining S.A.
Western Mining attempted to drill two core holes using a JKS Boyles Winkie drill rig. However, that small drill rig was under-powered for the drilling conditions encountered. The first core hole only reached a depth of 29m and the second only reached 23m.
REMISA (also known as "EMSA") drilled an unknown number of shallow core holes. The drill rig was reported to be under-powered and unable to reach target depths.
Historical Drilling by Condor Gold PLC.
Condor drilled a total of 24 RC holes, of which two were finished with core tails (English, 2009). The San Albino vein was tested by three holes totaling 283m. In the Arras area, 21 RC holes were drilled with two having core tails for a total of 2,471m of drilling. Condor's drilling was conducted using a UDR650 drill.
Drilling - Mako Mining Corp 1996 - Oct 11, 2023 (Effective date of San Albino Technical Report)
San Albino
Mako (then Golden Reign) began drilling at San Albino in 2010 and since then until the end of 2022 a total of 109,238m have been drilled in 1,432 core and RC holes in the San Albino deposit area.
From 2010 through 2013, 226 core holes were drilled totaling 41,164m. All drilling utilized HQ size core. Drilling in 2010 was completed by R&R Drilling of Honduras using a Longyear Super 38 man-portable drill. In the years 2011 through 2013, drilling was performed by Canchi Perforaciones de Nicaragua, S.A. using a JS 1500 self-propelled drill.
No drilling was conducted in 2014 or 2015. Drilling resumed in 2016 with 266 holes totaling 6,560m. This included 75 core holes totaling 3,320m; 56 of these holes were drilled for metallurgical samples. Exploration holes were drilled with HQ size core and metallurgy holes were drilled with PQ size core. Exploration and metallurgical core drilling were performed by Canchi Perforaciones de Nicaragua, S.A. using a JS 1500 self propelled drill. RC methods were used to drill 191 holes for 3,240m. The RC drilling was conducted by Continental Drilling S.A. of Nicaragua using a MPD 1000 track-mounted RC drill using a five-inch tricone bit or face-discharge hammer.
No drilling was done in 2017 or 2018.
Drilling resumed in 2019 and continued through 2022. Drilling during 2019-2022 was conducted by three drilling contractors:
During 2019-2022, 931 core holes comprising 60,549m were drilled at San Albino. In 2022 nine RC holes were drilled comprising 965m. However, the nine RC holes, while included in the San Albino database, are spatially separated from the resource by more than 100m, do not influence the modeling of the resource and do not contribute to the gold or silver estimates of the resource.
San Albino Norte
In 2022 Mako drilled 8 diamond drillholes, SA22-588 to SA22-595, totaling 1,452.9m at the San Albino Norte prospect in the San Albino-Murra concession. Drillhole SA22-588 intersected a 0.5m interval from 213.5 to 214.0m that assayed 8.92g Au/t and 38.4g Ag/t, and a 0.5m interval from 215.0 to 215.5m that assayed 1.12g Au/t and 0.4g Ag/t. True width of these intercepts is unknown. The remaining six drillholes failed to intersect gold mineralization greater than 1g Au/t. These eight drillholes are in the database used for estimating the San Albino resources presented in this report, but they were testing exploration targets outside of the San Albino and Las Conchitas resource areas and they are not used in estimation of the resources.
Las Conchitas Area
Diamond core drilling commenced in the Las Conchitas area in 2011. As of the effective date of the Las Conchitas database (July 11, 2023), 78,640m have been drilled in 718 core holes. In addition, 109 RC drill holes were completed in 2023 for a total of 4,074m, which were neither audited nor used in modeling or estimation.
El Jicaro Concession
In 2022 Mako drilled four diamond drillholes totaling 495.5m at the Tivo prospect in the El Jicaro concession. Drillholes EJ22-01 and EJ22-02 each intersected a weakly gold anomalous (< 1 g Au/t) breccia and vein zone over downhole widths of 1.0 and 0.5m respectively, with true width undetermined. Drillhole EJ22-03 did not hit any reportable gold mineralization above 0.1g Au/t. Drillhole LC22-499 was collared in the San Albino-Murra concession on the boundary of the El Jicaro concession, north of the Tivo prospect, but was angle drilled into the El Jicaro concession testing the Tivo prospect, and intersected a 1.0m mineralized interval from 13.40 to 14.40m that assayed 2.04g Au/t and 1.7g Ag/t and a 0.5m interval from 15.0 to 15.5m that assayed 3.52g Au/t and 3.1g Ag/t. True widths are unknown. All four of these drillholes were testing exploration targets outside of the San Albino and Las Conchitas areas and they are not used in estimation of resources presented in this report.
Potrerillos Concession
In 2022 Mako drilled seven diamond drillholes totaling 1,098.7m at the Piedras Negras prospect in the Potrerillos concession. Drillhole PO22-05 intersected 13.5g Au/t and 7.3g Ag/t over a 1.20m interval from 42.30 to 43.50m, with estimated true width of 1.1m. The other drillholes intersected weakly gold anomalous (<1 g Au/t) breccia and vein zones over widths of 0.7 to 1.5m. True thicknesses are unknown. These seven drillholes were testing exploration targets outside of the San Albino and Las Conchitas areas and they are not used in estimation of resources presented in this report.
La Segoviana Concession
In 2023 Mako drilled 15 diamond drillholes totaling 1,154.9m at the La Reforma, La Reforma West, San Luis and Minas America prospects in the La Segoviana concession. Assay results of vein intercepts calculated using a 1g Au/t cutoff are summarized in the table below. These 15 drillholes were testing exploration targets outside of the San Albino and Las Conchitas areas and they are not used in estimation of resources presented in this report.
| Location | Drillhole | From (m) |
To (m) | Width (m) |
Estimated True Width (m) |
g Au/t | g Ag/t |
| La Reforma | LS23-01 | No intercept greater than 1 g Au/t | |||||
| La Reforma | LS23-02 | 26.8 | 27.8 | 1.0 | 1.0 | 1.22 | 3.3 |
| San Luis | LS23-03 | 41.8 | 43.0 | 1.2 | 1.1 | 6.06 | 9.2 |
| San Luis | LS23-03 | 77.7 | 78.4 | 0.7 | 0.6 | 2.08 | 26.2 |
| San Luis | LS23-04 | 51.9 | 52.8 | 0.9 | 0.6 | 1.41 | 0.7 |
| San Luis | LS23-04 | 52.8 | 53.1 | 0.3 | 0.2 | 1.23 | 0.7 |
| San Luis | LS23-04 | 53.1 | 53.6 | 0.5 | 0.3 | 171.70 | 116.0 |
| San Luis | LS23-04 | 53.6 | 54.0 | 0.4 | 0.3 | 1.73 | 3.6 |
| San Luis | LS23-05 | 74.3 | 75.3 | 1.0 | 0.7 | 1.96 | 1.5 |
| San Luis | LS23-06 | 21.5 | 22.4 | 0.9 | 0.8 | 1.42 | 1.1 |
| San Luis | LS23-07 | 31.4 | 34.3 | 2.9 | 2.6 | 2.31 | 2.4 |
| Minas America | LS23-08 | 38.6 | 40.8 | 2.2 | 2.0 | 1.94 | 26.2 |
| Minas America | LS23-09 | No intercept greater than 1 g Au/t | |||||
| Minas America | LS23-10 | 38.6 | 40.8 | 2.2 | 2.0 | 1.94 | 26.2 |
| Minas America | LS23-10 | 44.2 | 44.6 | 0.4 | 0.4 | 2.75 | 20.5 |
| La Reforma | LS23-11 | 32.5 | 34.6 | 2.1 | 1.9 | 6.97 | 7.0 |
| La Reforma | LS23-12 | 21.0 | 23.7 | 2.7 | 2.4 | 4.11 | 6.0 |
| La Reforma West | LS23-13 | No intercept greater than 1 g Au/t | |||||
| La Reforma West | LS23-14 | hit void | |||||
| La Reforma West | LS23-15 | 48.4 | 49.5 | 1.1 | 1.0 | 6.14 | 4.7 |
Sampling, Analysis and Data Verification
Sample Preparation
Channel Samples of Exploration Pits and Trenches
Numerous channel samples have been collected at San Albino and Las Conchitas from vein exposures created by digging pits or trenches. During a site inspection at San Albino in 2020 it was observed that the channel sample sites were carefully marked with spray paint to indicate the area of each sample (Ristorcelli et al., 2020).
Channel samples were collected using a saw when possible. If the area to be sampled was broken or very soft material, a chisel was used. In the years 2010-2012 locations were originally surveyed using a handheld GPS. Beginning in 2013, locations were surveyed using a total station and trench beginning and end locations from 2010-2012 were resurveyed using a total station. Samples were collected in multiple orientations, depending on location and exposure, including vertically, parallel to the dip of the vein, and across the true thickness of the vein. When possible, a vein exposure was excavated in a hand-dug exploration pit of less than 2m depth and width to expose the vein in all three dimensions. Individual samples were typically about 1.0m in length, 5cm wide and approximately 3cm in depth, collected along each channel from visible veins and separately from adjacent sheared wallrock. Each sample was placed in its entirety in a sample bag and the sample numbers and type of material were recorded. Each channel sample location was photographed and logged. In some cases, one or both of the trench walls were mapped and in all cases plan maps of the trenches were made.
Reverse Circulation Drilling Samples
RC drilling at the San Albino deposit was done in 2016, during which 191 RC holes were drilled, and in 2022, during which 9 RC holes were drilled. In 2016 drilling was done without water injection using either a five inch tricone bit or center-return hammer and bit. Sample intervals were 1m in length in 2016. Samples were double bagged with a sample tag inserted into the bag then zip-tied shut. RC field duplicate samples were collected every 20 intervals by splitting the total sample in half with a riffle splitter and then splitting one half again so the original and duplicate each represented one quarter of the total sample.
The nine holes of RC drilling done in 2022 were not done using the same protocols as in 2016. A two-meter sample interval was used, samples were processed by Mako's mine laboratory rather than an independent lab and normal QA/QC protocols were not consistently applied. Although the holes are included in the San Albino database, they are spatially separated from the resource by more than 100 meters, do not influence the modeling of the resource and do not contribute to the gold or silver estimates of the resource.
Core Drilling Samples
Core samples were transported from the drill site to the core logging facility in the nearby town of El Jicaro by Company personnel. Core was then logged, photographed wet and dry, and marked for sampling by the geologists. In the mineralized zones, the geologists used wax pencils to indicate the start and end point of the sample interval by marking the core perpendicular to the core axis. To prevent bias in the sampling, the geologists rotated the core in the core box so that the foliation dipped toward the geologist. A cut line was then drawn down the center of the core, parallel to the core axis. The half of core on the right side of the cut line was always sampled and the left side was always retained for reference. Samples generally did not extend across geologic breaks with special attention given to separating quartz veins from the surrounding hanging wall and footwall zones. Sample lengths were limited to a minimum of 0.5m so smaller zones of texturally distinct vein were often included together in one sample. Outside the mineralized zones, the samples were generally taken on 1.5m intervals. During the 2020 site visit (Ristorcelli et. al., 2020) the authors reviewed sample selections on the drill core being logged and found it to be reasonable. Sample intervals were dominantly 1.0m long, in the better mineralized areas, or 1.5m long, in the clearly unmineralized areas. Samples were placed in sample bags and assigned a sample number from preprinted sample tags. A portion of the sample tag with the sample number was placed in the bag and a portion retained. Mako staff recorded the drillhole number and depth intervals that corresponded to each sample number. Sample bags were then closed with ties and placed in much larger sample sacks labeled with the first and last sample number contained in each sack.
Sample Security
At the time of the 2020 site visit (Ristorcelli et. al., 2020), the drill and channel samples were being picked up at Mako's El Jicaro core logging facility by the Bureau Veritas laboratory personnel and transported by truck to Managua for sample preparation and analysis at the Bureau Veritas laboratories in Nicaragua and/or Canada. Ristorcelli and Unger (2020) observed that Mako's core logging facility in El Jicaro had 24-hour security personnel and that previously logged and sampled core was stored at a separate secure warehouse.
In 2023 Mr. Ristorcelli observed that security arrangements were the same as they had been in 2020.
In 2010, samples were shipped via United Parcel Service ("UPS") to Inspectorate's preparation facility in Guatemala. The samples were first transported directly to the UPS facility in Managua, Nicaragua accompanied by a Golden Reign representative. Currently, and in years 2011-2019, samples are transported from the drill or channel sample site to the logging facility in El Jicaro under the supervision of a Mako geologist. Samples are stored at the logging facility in El Jicaro until a representative from Bureau Veritas or its subsidiaries picks up the samples, or occasionally, the samples are transported to the laboratory by a Company representative. Samples are delivered to the laboratory on a weekly basis. On the day of delivery, samples are loaded into the transportation vehicle and the vehicle is locked. The transportation vehicle then drives directly to the laboratory in Managua without stopping.
Sample Analysis
All Mako's assays of rock and drill samples from the San Albino and Las Conchitas projects were carried out by Bureau Veritas laboratories, or by labs that were eventually absorbed by Bureau Veritas, Acme Labs and Inspectorate, herein collectively referred to as "Bureau Veritas". Bureau Veritas and its subsidiaries are 80 RSI(RNO)-1006 certified commercial laboratories independent of Mako and its subsidiaries.
In 2010, samples were prepared in Guatemala at a sample preparation facility operated by Inspectorate. In the following years, the samples were prepared in the Bureau Veritas preparation laboratory in Managua, Nicaragua where they were crushed, split to 1.0kg or less with a riffle splitter, and the splits were pulverized until 85% of the material passed a 200-mesh screen. An extra "wash" of barren silica material was run through the crusher between each sample. The pulverized "pulps" were then shipped by air freight to Bureau Veritas' assay laboratory in Vancouver, Canada for assaying. In addition to gold and silver, multiple elements including As, Ca, Cu, Fe, Mo, Ni, Pb, S, Sb, and Zn were analyzed using aqua regia digestion and inductively coupled plasma ("ICP").
In 2010, analyses for silver were completed using aqua regia digestion followed by ICP analysis. Testing was also completed for ore-grade levels of zinc and lead using a four-acid digestion followed by atomic absorption ("AA") analysis. In 2011, gold was determined by fire assay using a metallic screening at 150 mesh with a nominal pulp weight of 500g. Gold analyses of the coarse and fine fractions were done by fire assay fusion with an AA finish. Analyses for silver were initially completed using an aqua regia digestion followed by ICP analyses. In cases where silver exceeded the upper detection limit of 100g Ag/t, the sample was re-analyzed using AA following aqua regia digestion. Analyses were also completed for over-limit ore-grade levels of zinc and lead using aqua regia digestion with an AA finish.
In 2012, gold was analyzed at Inspectorate using either metallic-screen fire assays as in 2011 or fire assay fusion of a 30g aliquot with AA finish. Gold assays greater than 10g Au/t on the 30g pulps were then analyzed by fire assay fusion with a gravimetric finish. Analyses for silver were initially completed using an aqua regia digestion followed by ICP analyses. In cases where silver exceeded the upper detection limit of 100g Ag/t, the sample was re-analyzed using AA following aqua regia digestion. Analyses were also completed for ore-grade levels of zinc and lead using aqua regia digestion with an AA finish.
In 2013 and 2014, the samples were analyzed at Acme Labs in Vancouver, Canada, also a subsidiary of Bureau Veritas, who apparently took over the facilities previously operated by Inspectorate in Managua, Nicaragua. Sample preparation work was completed primarily in Managua and occasionally in Vancouver. Gold analyses were completed in Vancouver by 30g fire assay fusion with AA finish; samples with greater than 10g Au/t were re-analyzed using fire assay fusion with a gravimetric finish. Additionally, some samples were analyzed for gold using metallic-screen fire assays at 150-mesh size with a nominal pulp weight of 500g. Silver was analyzed using aqua regia digestion followed by ICP. In cases where silver exceeded the upper detection limit of 100g Ag/t, the sample was re-analyzed using aqua regia digestion followed by either ICP or fire assay fusion with a gravimetric finish. Analyses were completed for ore-grade levels of lead using aqua regia digestion with an AA finish.
The author, Mr. Steven J. Ristorcelli, C.P.G., independent consulting geologist, did not find any records showing that drilling or channel samples were analyzed in the year 2015. In 2016, 2017, and 2018, samples were delivered to the Bureau Veritas facility in Managua, Nicaragua. Gold analyses were completed at the Bureau Veritas facilities in Vancouver, Canada by 30g fire assay fusion with AA finish. Samples that exceeded 10g Au/t were re-analyzed using fire assay fusion followed by a gravimetric finish. Additionally, some samples were analyzed for gold using metallic-screen fire assays at 150-mesh size with a nominal pulp weight of 500g. Silver was analyzed using aqua regia digestion followed by ICP. In cases where silver exceeded the upper detection limit of 100g Ag/t, the sample was re-analyzed using aqua regia digestion followed by either ICP or fire assay fusion with a gravimetric finish.
In 2019 through 2022, Mako's samples were delivered to the Bureau Veritas facility in Managua, Nicaragua. Gold analyses were completed at the Bureau Veritas facilities in Vancouver, Canada by 30g fire assay fusion with AA finish. Samples that exceeded 10g/t Au were re-analyzed using fire assay fusion with a gravimetric finish. Additionally, some samples were analyzed using metallic-screen fire assays at 150-mesh size with a nominal pulp weight of 500g. Silver was analyzed using aqua regia digestion followed by ICP. In cases where silver exceeded the upper detection limit of 100g Ag/t, the sample was re-analyzed using aqua regia digestion followed by either ICP or fire assay fusion with a gravimetric finish.
A total of 23,450 samples from San Albino in 212 batches were sent for analysis. The batches range in size from 8 to 199 samples and this number includes the QA/QC samples inserted in the batches: certified reference material (standard), blank and coarse duplicate.
Quality Assurance / Quality Control
Mako used well-known certified laboratories for all sample preparation and analyses. Sample preparation, analysis, security and QA/QC data collection have been and are done well and provide the project with a reliable set of analytical data.
Although some issues have been noted in the data for gold and silver analyses of the blanks, the overall performance of the labs used by Mako is better than most and is acceptable. The data support the use of Mako's data for gold and silver as described in Section 14.3 of this report.
Metallurgical Testing and Mineral Processing
Based on the recent metallurgical test work completed in 2020, the selected processing approach for material from the San Albino deposit includes milling of the material followed by cyanide extraction of gold and silver using a carbon-in-leach ("CIL") plant, which yielded optimized overall recoveries ranging from 86.1% to 96.9%, depending on the mineralization type and despite the presence of carbonaceous material in the samples. Tests were completed in 2016 through 2020 and were designed to confirm conclusions from work done in 2013 and 2014, as well as provide further design parameters for the mill flowsheet and the associated mill operations and tailings management. Overall, the latest programs supported conclusions of previous process development work and the current mill design parameters. Gravity recoveries averaged 36.3% with higher gravity recoveries possible when higher-grade material is processed through the plant.
Samples from the Las Conchitas deposit were collected, composited and tested in the metallurgical laboratory at the San Albino mill in 2022. The 2022 testing was completed as variability testing to verify processing Las Conchitas material using the existing milling circuit at San Albino would produce similar results as had been experienced when processing material from the San Albino deposit. The results from the 2022 test program indicates Las Conchitas mineralization can be expected to perform similar to the San Albino deposit; however, these results should be used as an indication of potential processing results only. Confirmation testing to verify results at a third-party laboratory is recommended.
Feed samples from the existing mill facility were collected and tested in the laboratory at the San Albino mine site. The testing parameters used in the laboratory were adjusted until the results from laboratory testing closely matched the results from the operating facility. These testing parameters were used for the testing of the Las Conchitas composites. The test results from the composites closely matched the results from the operating mill when the mill processed feed material of similar organic carbon content.
There are also plans to complete test pits from several of the Las Conchitas veins and process the material through the San Albino mill to further support the expectation of Las Conchitas material's performance being similar that of San Albino material. No further testing of samples from the San Albino deposit were completed in 2022.
Both San Albino and Las Conchitas deposits contain three major mineralization types: weathered, transition, and fresh. When processing these mineralization types from the San Albino mine through the San Albino mill, the average gold recoveries were: oxide 94%, transition 86% and fresh 79%. Preg-rob potential present in the various types is the primary reason for the lower recovery in the transition and fresh mineralization types compared to the weathered material.
Mineral Resource Estimate
The effective date of the San Albino resource estimate is August 18, 2023. The effective date of the Las Conchitas resource estimate is October 11, 2023.
Both the San Albino and Las Conchitas deposits were initially modeled on sections spaced 10m apart and looking N40OE (95 sections at San Albino and 159 sections at Las Conchitas). Logged geology (including angles to core axes), core photographs, and gold grades were utilized to model vein mineralization and halo mineralization. The halo mineralization was typically separated into hanging wall and footwall zones. These sectional interpretations were reviewed by Mako geologists and modifications were made until there was a mutually agreed-upon interpretation. These interpretations were used to code the database for domain and vein name. Unreliable data (such as obviously incorrect locations, less than 45% core recovery, and RC drill results) were eliminated. After evaluating each vein's assays statistically, capping levels were defined and assigned, and then compositing was done to one meter lengths respecting the vein and halo boundaries. The cross section interpretations were snapped to the drill holes in three dimensions, sliced vertically along N40OE long sections, and reinterpreted on one meter intervals. These long sections were then treated as solids for coding the block model.
San Albino has three main groups of veins - San Albino, Naranjo, and Arras - each with multiple splays. Las Conchitas has 16 veins, each of which was modeled and estimated separately. A polygonal estimate was completed for each area to anticipate its size and grade, and to be a check on the estimates. The one meter composites were used to estimate gold and silver grades using inverse-distance cubed, kriging, and nearest neighbor methods. Multiple estimates were made to evaluate sensitivity to and optimization of estimation parameters. While the three types of estimates (and the polygonal estimate) were used to check each other, the reported estimate used inverse-distance cubed.
The block models are rotated 40O to respect the strike of the deposits. Block sizes are one meter high by two meters long by one meter across strike. Gold and silver grades were estimated for the veins, halos, and the unmineralized material. Vein grades were diluted depending on the material types adjacent to the vein by any or all of the footwall halo, hanging wall halo, or unmineralized material. For open pit resources, San Albino was assigned a 0.5m dilution rind on both the top and the bottom of the veins, while at Las Conchitas a 0.4m dilution rind on both the top and the bottom of the veins was applied. A thinner dilution rind was applied at Conchitas because actual productions shows that dilution can be smaller than 0.5m on the hanging wall. Because little engineering work has been done for underground mining, the underground resources reported are block diluted.
The QP, Mr. Steven J. Ristorcelli, C.P.G., independent consulting geologist, has used his judgment with respect to the technical and economic factors likely to influence the "prospects for eventual economic extraction" and the estimates listed in the tables below fulfill that requirement. The San Albino deposit and Las Conchitas deposit mineral resources are based on potential open pit as well as potential underground mining scenarios.
Technical and economic factors likely to influence the "reasonable prospects for eventual economic extraction" were evaluated using the best judgment of the author responsible for this section of the report. For evaluating the open pit potential, a series of optimized pits were run using variable gold prices and parameters. The accepted open pit mining cost was $3/t, processing cost $65/t, and costs of mining, ore processing, and administrative ("G&A") cost $2/t. Metallurgical recoveries of gold used in the pit optimizations were 83%, 90%, and 95% for fresh rock, transition, and oxide material, respectively. Silver was not considered in the optimizations. For evaluating the potential for underground mining, a series of stope optimizations were run at variable cutoffs. For the reporting cutoff grade of 4.0g Au/t, an average underground mining cost of $144/t, processing cost of $65/t, and G&A of $2/t were assumed. Underground resources are those at or above the 4.0g Au/t cutoff lying within the 3.0g Au/t optimized stopes. The factors used in defining cutoff grades for open pit and underground are based on a gold price of $1,750/oz.
Classification of the resources considered adequacy and reliability of sampling, geologic understanding, results of quality control analyses, geologic complication, and apparent grade continuity. The tables below present the estimates of San Albino, Las Conchitas, and combined for the San Albino project totals. There are some estimated resources in the historic mine dumps, all of which are classified as Inferred.
All Veins in San Albino Deposit: Open Pit, Underground, and Dump Resources:
| Classification | Cutoff (1) | Tonnes | Gold | Gold | Silver | Silver | ||||||||||
| (Mt) | (g/t) | (oz) | (g/t) | (oz) | ||||||||||||
| All measured | Variable | 47,200 | 9.88 | 15,000 | 17.80 | 27,000 | ||||||||||
| All indicated | Variable | 251,600 | 12.10 | 97,900 | 21.00 | 169,700 | ||||||||||
| All measured and indicated | Variable | 298,800 | 11.75 | 112,900 | 20.50 | 196,700 | ||||||||||
| All inferred | Variable | 240,800 | 10.53 | 81,500 | 15.40 | 119,200 |
Notes:
(1) Variable cutoffs are 1.5g Au/t for open pit and 4.0 Au/t for underground
All Veins in Las Conchitas Deposit: Open Pit, Underground, and Dump resources:
| Classification | Cutoff (1) | Tonnes | Gold | Gold | Silver | Silver | ||||||||||
| (Mt) | (g/t) | (oz) | (g/t) | (oz) | ||||||||||||
| All indicated | Variable | 371,300 | 11.50 | 137,300 | 13.30 | 158,300 | ||||||||||
| All inferred | Variable | 142,500 | 10.56 | 48,400 | 13.80 | 63,400 |
Notes:
(1) Variable cutoffs are 1.5g Au/t for open pit and 4.0 Au/t for underground
All Veins in San Albino Deposit: Open Pit, Underground, and Dump resources:
| Classification | Cutoff (1) | Tonnes | Gold | Gold | Silver | Silver | ||||||||||
| (Mt) | (g/t) | (oz) | (g/t) | (oz) | ||||||||||||
| All measured | Variable | 47,200 | 9.88 | 15,000 | 17.80 | 27,000 | ||||||||||
| All indicated | Variable | 622,900 | 11.74 | 235,200 | 16.40 | 328,000 | ||||||||||
| All measured and indicated | Variable | 670,100 | 11.61 | 250,200 | 16.50 | 355,000 | ||||||||||
| All inferred | Variable | 383,300 | 10.54 | 129,900 | 14.80 | 182,600 |
Notes:
(1) Variable cutoffs are 1.5g Au/t for open pit and 4.0 Au/t for underground
The exploration procedures, sampling, and data derived from Mako's work are high quality and can be used with confidence to support the resource estimate. Confidence in vein correlations between holes varies by vein, and veins have been modeled accordingly. The veins at Las Conchitas, for example, were generally projected less far than those at San Albino because they appear to be less continuous. It is expected that infill drilling at Las Conchitas may well increase the defined resources.
Mineral reserve estimates and mining methods
Reserves
There are no Reserves at San Albino because the mine plan used to put the project into production is based on material including Inferred. The mine production has had good reconciliation (within 10% as of the Effective Date) with the Inferred material as well as Measured and Indicated.
Mining methods
Mining for the San Albino project includes the San Albino deposit and no current mine plans have been assumed for the Las Conchitas deposit. The methodology used for mine planning includes:
Pit optimizations and subsequent pit designs are based on the economic parameters shown in the table below. Silver price used is $25/oz Ag.
Economic Parameters for Pit Optimizations:
| Mining costs | $/t mined | ||
| Waste mining reference cost | 3.00 | ||
| Above COG mining reference cost | 3.00 | ||
| Total reference mining costs | 3.00 | ||
| Process based costs | $/t ore stacked | ||
| Process cost | 65.00 | ||
| Selling cost and credits | 2.00 | ||
| General and administrative | 2.00 | ||
| Total ore based costs | 69.00 | ||
| Other economic parameters | |||
| Au price | 1750US$/oz | ||
| Au oxide recovery | 95.00% | ||
| Au mixed recovery | 90.00% | ||
| Au sulphide recovery | 83.00% | ||
| Au oxide recovery | 60.00% | ||
| Ag mixed recovery | 55.00% | ||
| Ag sulphide recovery | 50.00% | ||
| Average Au recovery | 89.30% |
The resource is presented as a diluted vein with a 0.5m rind along the hanging wall and footwall. Effectively, all estimated vein material is above cutoff so all vein material and the 1m of total dilution is mineable.
Actual production from July 2021 through September 2023 totals over 11,139,000 tonnes with 401,000 tonnes of material from pits and 90,000 of historic dump material sent to the mill.
Processing
The process plant at San Albino has been in operation since the second quarter of 2021 and utilizes a conventional processing flowsheet that is proven in industry. Run of Mine ("ROM") ore is delivered to the process plant stockpile adjacent to the crushing circuit. The ore is stockpiled separately by gold grade and preg-robing potential (due to organic carbon) to maximize the mill performance.
A front-end loader feeds a two-stage crushing circuit that reduces the ROM feed material to 80% passing 3/8in. The crushed ore is conveyed to the grinding circuit for further size reduction to 75% passing 200 mesh. A Knelson gravity concentrator is located within the grinding circuit to produce a concentrate stream containing the coarse-gold fraction. The concentrate stream reports to an Intense Cyanidation Unit ("ICU") located in the refinery where the coarse gold is leached into solution and recovered into a precipitant in a dedicated electrowinning circuit.
The product from the grinding circuit is thickened and leached in a series of five carbon-in-leach ("CIL") tanks. The loaded carbon is pumped from the first CIL tank to the carbon handling circuit. In the carbon circuit the gold is stripped from the carbon using a hot caustic solution and recovered from solution into a precipitant using a dedicated electrowinning circuit. After stripping the carbon is regenerated and returned to the fifth CIL tank. The precipitant from the ICU electrowinning circuit and from the carbon stripping circuit are poured into doré bars for transport to final refining off site. The precipitate from the two streams are treated identically but kept separate for accounting reasons.
The slurry exiting the fifth CIL tank is circuit tails. The cyanide remaining in the slurry is treated to levels safe for the environment. The slurry is then filtered with the solid filtrate conveyed and stacked in the tailings storage facility. The solution filtered from the slurry is returned to the processing circuit.
Project infrastructure
The main infrastructure supporting the operation of the San Albino mine is located near the process facility with a few installations located near operating mine pits and ore stockpiles. A list of these installations is given below:
The mine generates all required electrical power on site using diesel powered generators. Four 1000KW generators are on site with two operating continuously and an additional generator started to handle the in-rush resulting in mill start-ups. After a mill start-up, the third generator is shut down when the mill is operating at steady state.
The tailings storage facility is designed to accept dry solid tails from the process plant. The slurry tails are filtered to remove excess solution and delivered to the storage facility by conveyors. A dozer is used to distribute the tails in thin lifts throughout the facility. The facility has been designed to contain 1.87 million tonnes of solid tails and is to be constructed in three phases. The first phase was completed before mill start-up in 2021 with 434,000 tons of tails deposited to date. Subsequent phases are to be constructed as available capacity requires.
Water is pumped from the nearby Jicaro River to supply the facility with all fresh water and fire-suppressant water requirements. Bottled water is used to supply all potable water requirements on site. Only the water entrained with the filtered tails is sent to the tailings storage facility. All other water used in the processing facility returned to the mill to minimize fresh-water requirements.
Environmental and social impact
No environmental, social, or community issues were identified that would impact Mako's ability to develop the Mineral Resources at the San Albino Project. Mako has obtained all necessary permits to construct and operate the San Albino mine and has been mining since 2021.
Capital and operating costs
The initial capital required to place the San Albino mine into production have been completed. As of the effective date, there is not sufficient information to complete a sustaining capital cost estimate. This will subject to future studies.
A summary of actual operating costs are given in the following table:
Operating Cost Summary
| Processed | Mined | |||||
| $/tonne | $/tonne | |||||
| Mining | 89.45 | 3.23 | ||||
| Processing | 65.17 | - | ||||
| Indirect general and administrative | 20.76 | - | ||||
| 175.38 | 3.23 |
Conclusions, Interpretations, and Recommendations
The San Albino project benefits from a team of mining professionals that have spent multiple years working on the project, successfully mining a narrow vein, open pit deposit at San Albino that is similar to the geology and resource defined at Las Conchitas. The technical team has shown a commitment to collecting quality data and innovative thinking toward developing the project.
The authors are not aware of any significant risks or uncertainties that could reasonably be expected to affect the reliability or confidence in the exploration information as applied to the estimated mineral resources.
The San Albino project, inclusive of Las Conchitas, is a project of merit and warrants the proposed programs and level of expenditures outlined below. These veins are open down dip and along strike, with significant potential to expand the resources estimated for this report. Additionally, the stacked nature and even distribution of the veins parallel to the regional foliation provide a proven exploration strategy for regional exploration. The recommended program is broken down into the San Albino area, Las Conchitas area, and regional exploration is shown in the table below. The total recommended plan is estimated to cost $6,300,000.
Budget for recommended work program:
| US$ | |||
| San Albino: Pre-development drilling | 980,000 | ||
| San Albino: Exploration drilling | 180,000 | ||
| Las Conchitas: Pre-development drilling | 480,000 | ||
| Las Conchitas: Exploration drilling | 2,700,000 | ||
| Regional exploration | 1,960,000 | ||
| Total (rounded to US$100,000) | 6,300,000 |
Success at San Albino, Las Conchitas, or other concessions is defined, respectively, as finding additional resources, defining a resource, or discovering deposits deserving follow-up drilling. Given historic successes it is likely that follow-up work would include additional drilling if not economic studies on the newly discovered resources and prospects. Approximate costs could be at least as large as the currently recommended Phase I costs.
Exploration, Development and Production
Exploration
Since the last reported mineral resource estimate ("MRE"), with an effective date of October 11, 2023, the Company has completed comprehensive, multi-objective drilling programs designed to expand mineral resources and mine life, increase geological confidence of existing structures, test new gold and silver targets and collect engineering data to support studies for both open pit and underground mine development.
Between October 11, 2023 and April 29, 2026, the Company completed approximately 160,350m in 1,790 RC and diamond drill holes, including 93 combined RC and diamond drill holes (6,057m of RC and 7,455.4m of diamond drilling).
Most of the drilling targeted extensions of high-grade gold bearing veins, amenable to both open pit and underground mining methods. Drilling was completed with the objectives of gaining a higher level of confidence of the grade and geometry of gold mineralization within the permitted ultimate pit.
The Company completed 934 RC drill holes totalling 86,158m, and 58 diamond/combination drill holes, totalling 4,242m testing extensions of the high-grade gold mineralization. In addition, the Company completed 322 RC drill holes, totalling 18,535m to confirm geological interpretation and orientation of the gold bearing zones that are used to optimize pit shells and/or underground mine design, and 20 geotechnical diamond drill holes totalling 2,286.5m for optimizing pit and portal design.
Within the same period, the Company initiated a regional drilling campaign testing 11 high-grade gold targets identified though reconnaissance sampling of underground historical and recent artisanal workings, as well as, from surface exposures and dumps. The Company completed 425 drill holes totalling 31,317m of RC and 16,668.2m of diamond drilling. Most of RC drilling (6,931m) and all diamond drilling were conducted primarily around the historical El Golfo Mine (covering approximately 2 square kilometres) and confirmed the existence of high-grade gold mineralization that may be similar in both size and grade to that of the Las Conchitas and San Albino Gold Deposits, which are located approximately 1 kilometre and 3 kilometres, respectively, immediately to the north.
The Company continued with a reconnaissance exploration program covering the Company's entire 188 square kilometre land package and includes geological mapping and sampling of exposed mineralized veins, local mine dumps, and, where safely accessible, underground workings. The main objective of the reconnaissance exploration program is to collect key structural data of mineralized veins, extend previously exposed high-grade gold mineralization and prioritize drilling targets.
Development
Since the technical report, Mako has developed the Las Conchitas deposit located approximately 5 km south of the San Albino process plant. Currently all the mining is focussed on the Las Conchitas area.
Production
During the period Oct 1, 2023, to March 31, 2026 San Albino mined 1,239,304 tonnes, of which 52,526 tonnes were mineralized, resulting in 118,771 ounces Au mined at an average grade of 7.15 g/t Au and 140,236 ounces Ag at an average grade of 8.45 g/t Ag. Details of mining at San Albino during this period are shown in the table below:
| MINE SCHEDULE | Parameter/Unit Costs | Oct - Dec 2023 | Year 2024 | Year 2025 | Jan - Mar 2026 | Total | |
| Total Mined | Open Pit Ore | Metric Tonnes | 52,526 | 203,992 | 209,656 | 50,233 | 516,406 |
| Au Grade | g/t | 8.160 | 7.448 | 6.469 | 7.763 | 7.154 | |
| Ag Grade | g/t | 9.498 | 10.049 | 6.804 | 7.715 | 8.448 | |
| Au Contained Oz | Oz | 13,780 | 48,850 | 43,603 | 12,538 | 118,771 | |
| Ag Contained Oz | Oz | 16,039 | 65,904 | 45,861 | 12,460 | 140,263 | |
| Mine Waste | Metric Tonnes | 1,186,779 | 7,541,350 | 9,273,407 | 2,203,947 | 20,205,482 | |
| Total Tonnes | Metric Tonnes | 1,239,304 | 7,745,342 | 9,483,062 | 2,254,180 | 20,721,888 | |
| SR | 22.6 | 37.0 | 44.2 | 43.9 | 39.1 | ||
During the same period 526,538 tonnes were processed through the plant producing 97,379 ounces of gold at 5.72 g/t Au and 97,845 ounces of Ag at 5.78 g/t Ag. Details of production from the process plant are shown below:
| Process Plant production | Parameter/Unit Costs | Oct - Dec 2023 | Year 2024 | Year 2025 | Jan - Mar 2026 | Total | |
| Total Mined | Ore Processed | Metric Tonnes | 51,745 | 208,267 | 212,887 | 53,638 | 526,538 |
| Au Grade | g/t | 6.953 | 5.865 | 5.245 | 6.170 | 5.752 | |
| Ag Grade | g/t | 4.952 | 6.256 | 5.496 | 5.857 | 5.780 | |
| Recovered Au | Oz | 11,567 | 39,275 | 35,897 | 10,640 | 97,379 | |
| Recovered Au | Oz | 8,238 | 41,892 | 37,614 | 10,100 | 97,845 | |
Moss Mine
The following summary is extracted in part from, and qualified in its entirety with reference to, the full text of the technical report entitled "NI 43-101 Technical Report for the 2025 Mineral Resource Estimate for the Moss Mine Project, Oatman Mining District, Mohave County, Arizona, USA" with a report date of February 27, 2026 and an effective date of December 18, 2025 (the "Moss Mine Technical Report"), prepared by William J. Lewis, Richard M. Gowans, Christopher Keech, and (Gary) Yee-Yeun Wong, each of which is independent of the Company. The authors, by virtue of their education, experience and professional association, are considered Qualified persons as defined in the NI 43-101 standard and are members in good standing of recognized professional organizations. Readers are encouraged to review the full text of the Moss Mine technical report, available for review under the Company's website at www.makominingcorp.com. The Moss Mine Technical Report supports the scientific and technical information in relation to the Moss Mine set out in this AIF. All capitalized terms not otherwise defined in this summary are defined in the Moss Mine Technical Report. See "Interests of Experts".
Project Description, Location and Access
The Moss Mine Project is located at latitude 35°5'49" N and longitude 114°26'43" W, which is about 10 miles east from Bullhead City, Arizona, along Silver Creek Road. Bullhead City, Arizona is about 90 miles southeast from Las Vegas, Nevada.
The initial ownership in the Moss Mine Project was acquired by Golden Vertex Corp. ("Golden Vertex"), a subsidiary of Northern Vertex Mining Corporation ("NVMC") through an option agreement with Patriot Gold Corp. ("Patriot Gold") to acquire a 70% interest in 2011 and a subsequent purchase agreement with Patriot in 2016 to acquire a full 100% interest in the Moss Mine Project subject to a royalty agreement.
In 2021, Golden Vertex purchased ten patented claims in northern T19N R20W covering 109.4 ac. These patented claims are owned as fee simple property by Golden Vertex. The claim boundaries were surveyed at the time of patenting and recorded as Mineral Survey 3349. They were recorded with Mohave County as Parcels 221-04-002 and 221-05-001.
On Sept 24, 2021, Northern Vertex Mining changed its name to Elevation Gold Mining Corp. ("Elevation Gold" or "EGMC"). They also consolidated shares 6:1 at the same time.
Bankruptcy and Change of Ownership
On August 1, 2024, Elevation Gold obtained an order (the "Initial Order") of the Supreme Court of British Columbia granting it creditor protection under the Companies' Creditors Arrangement Act (the "CCAA"). Under the Initial Order, KSV Restructuring Inc. was appointed as the monitor of Elevation Gold. In order to obtain similar protection in the United States, a petition under chapter 15 of the US Bankruptcy Code was filed with the US Bankruptcy Court for the District of Arizona.
Additionally on the same date, Golden Vertex announced that it was ceasing active mining but intended to continue the operation of the beneficiation facilities.
On December 31, 2024, Elevation Gold announced the completion of the sale of Moss Mine with an arm's length purchaser, EG Acquisition LLC. ("EGA"), in respect of the purchase and sale of certain of Elevation's assets, including the outstanding common shares of Golden Vertex, which held the Moss Mine located in Arizona. The Canadian Approval Order was subject to recognition by the U.S. Court in the Chapter 15 Proceedings. The US Recognition Hearing was heard on December 23, 2024, and the US Approval Order was entered on December 30, 2024. The transaction was also approved by the TSX Venture Exchange subject to approval by the U.S. Court.
On March 27, 2025, Mako announced the completion of the purchase of the Moss Mine.
The acquisition was completed pursuant to the terms of an interest purchase agreement dated March 26, 2025, between Mako US Corp. as buyer, Wexford EG Acquisition LLC as vendor, EGA as target and Mako as buyer guarantor, pursuant to which Mako US acquired 100% of the ownership interests in EGA, a private company controlled by Mako's controlling shareholder, Wexford Capital LP (collectively with its managed funds, "Wexford") that acquired 100% of the shares of Golden Vertex, the operating subsidiary of the Moss mine, under a CCAA proceeding and related Chapter 15 proceeding in the United States on December 31, 2024.
Royalties
Prior to bankruptcy, the Moss Mine Project had six agreements with landowners that were subject to royalties. As a result of the bankruptcy proceedings, two agreements were eliminated, and four survived, however two of the surviving agreements are still being litigated in the bankruptcy court.
Both the BHL Finders agreement and the Maverix Silver Stream have been eliminated, while the Minquest and Patriot Gold agreements are still in litigation. The Greenwood and La Cuesta agreements remain in good standing.
MinQuest Inc. ("MinQuest") assembled the patented Moss Mine claims and staked an additional 63 unpatented claims. In 2018, this land package was transferred to Patriot Gold for payments and a royalty. In March, 2018, Golden Vertex was notified by MinQuest that this royalty was transferred to Great Basin Royalty LLC. In mid-September, 2020, GVC was notified that Great Basin Royalty LLC. had transferred the royalty to Valkyrie Royalty Inc. ("Valkyrie"). On September 28, 2020, Nomad Royalty Company ("Nomad") announced that it had purchased all the outstanding shares of Valkyrie, then on August 15, 2022 Sandstorm Gold Royalties announced it purchased all of the Nomad outstanding shares. On October 20, Royal Gold purchased all of the outstanding shares of Sandstorm.
Pursuant to the MinQuest Agreement, Royal Gold will receive:
The MinQuest Agreement is still in litigation in the bankruptcy court.
The California Moss Lot 37 (Greenwood) claim is subject to a Purchase Agreement between Patriot Gold and various parties referred to as the Greenwood Agreement that is dated March 2004. The purchase price of US$150,000 was paid by Patriot Gold, in addition to which a 3% NSR royalty is payable to the original owners, on gold and silver produced from the claim. In addition, and as defined above, a royalty of 0.5% is payable to MinQuest (now Nomad) in respect of the California Moss Lot 37 (Greenwood) claim and all other patented claims in which the original vendors have a royalty interest.
The Greenwood Agreement remains valid following the bankruptcy.
Pursuant to the terms of the La Cuesta Agreement, EGMC will pay La Cuesta a 1.5% NSR royalty on any gold or silver production from the area covered by the Silver Creek claims, plus an additional 0.5% NSR royalty on any third-party claims within the Area of Influence. The Area of Influence includes the State Exploration Permit covering T20N R20W Section 32, and the patented claims within the boundaries of the Silver Creek claims. Quarterly Advance Royalty payments have been made to LCI and are deductible from future royalty payments. The Silver creek claims are shown in blue on the easterly side of the land package shown in Figure 4.4.
The La Cuesta Agreement remains valid following the bankruptcy.
In accordance with the terms of the 2016 purchase agreement with Patriot Gold, EGMC will pay a 3.0% NSR royalty on all gold and silver production from the patented and unpatented claims covered by the 2011 Patriot Gold Agreement. The extent of the royalty properties boundary line is the larger blue envelope shown in Figure 4.4.
The Patriot Gold Agreement is still in litigation in the bankruptcy court.
Accessibility
The nearest cities to the Moss Mine Project are Bullhead City, Arizona (10 miles west) and Laughlin, Nevada (14 miles northwest) which are separated north-south by the Colorado River.
Las Vegas, Nevada is the nearest major city to the Moss Mine Project, which is approximately 90 miles (1.5 hours) northwest of Bullhead City, Arizona. From McCarran International Airport in Las Vegas, Interstate Highways 215, 11 and US Highway 95 lead to State Highway 163 into the Laughlin-Bullhead City area and are good quality paved roads. Moss Mine can be reached by traveling about 10 miles via Bullhead Parkway east on the Silver Creek Road (an improved dirt road).
Approximately seven miles east of the Moss Mine Project area is the small town of Oatman, Arizona. Oatman is a historical gold mining town that hosted three underground gold mines in the late 1800s and early 1900s.
Historic Liabilities
The Moss Mine Project site has been disturbed by previous historical mining activities dating back to the late 1800's. These activities are separate from the Phase I activities carried out by NVMC in 2013 and 2014.
There are no known environmental liabilities at the site from the historical activities. The Moss ores do not contain measurable quantities of sulfides and hence, there are no acid drainage issues. The previous activities have not resulted in the stockpiling or disposal of any hazardous substances.
There was a gold stamp mill erected on site in 1909 and the ruins of the mill can be seen today. The historical milling included the use of mercury amalgam, and a small stockpile of tailings is thought to contain measurable quantities of mercury. Golden Vertex was able to encapsulate these tailings in place under provisions of the 1980 Bevill Amendment to Public Law 96-482 in advance of the Phase II site grading which later buried the material.
The QPs are unaware of any other outstanding environmental liabilities at the Moss Mine Project, other than those normally associated with possessing a formerly operating mine in the USA. The existing environmental conditions, liabilities and remediation have been described where required by NI 43-101 regulations. These statements are provided for information purposes only and the QPs offer no opinion in this regard.
The QPs are unaware of any other significant factors or risks that may affect access, title or the right or ability of Mako to perform work on the Moss Mine Project.
History
Discovery and Early Mining History (1863 to 1935)
The Moss Mine Project was discovered in 1863 by John Moss (1839-1880). At the time, it was reported to be the first major gold discovery in Mohave County. The larger San Francisco Mining District of Mohave County was established in 1864.
The available records show that John Moss was made aware of the Moss Mine area by stories about soldiers from nearby Fort Mojave prospecting for and finding gold. A popular, alternative account of the Moss vein discovery is that Chief Irataba of the Mojave Tribe led Moss to what became known as the Moss vein outcrop. Whatever the case, John Moss' name appeared on the first recorded mining claim called the Moss Lode, under the ownership of the San Francisco Gold and Silver Company. The initial gold discovery at Moss was extremely high grade. Lausen (1931) reported that, "From a hole only ten ft in diameter, $240,000 is said to have been taken out.", from a site immediately to the east of the later site of Allen Shaft. The extremely high-grade ore was likely the result of near- surface enrichment, creating coarse free gold. Later mining near the high-grade pocket found coarse gold flakes and wire gold along with iron and manganese oxides in vugs.
The available records show that Moss sold the Moss Lode to Dahrean Black and that it was later sold to the Gold Giant Mining and Milling Company of Los Angeles. The area around the glory hole was explored by numerous holes and tunnels, but no other substantial quantities of gold are reported to have been found. Ransome (USGS Bulletin 743 - Preliminary Report 1923) stated that $240,000 worth of gold (approximately 12,000 ounces) was recovered by Moss.
Following its abandonment in 1866, there was little mining activity in the district until the discovery of the regionally famous Gold Road Vein in 1901. The town of Vivian was founded in that year; its name was changed to Oatman in 1908. In 1906, the Tip Top and Ben Harrison mineralized shoots were discovered. In 1915 and 1916 the Big Jim, Aztec and United Eastern mineralized bodies were discovered on the Tom Reed Vein. Mining activity increased and the population of Oatman grew to a reported 10,000 (today referred to as the Oatman gold mining boom, 1915 to 1917). By the mid-1920s the population of Oatman had fallen to a few hundred. In 1933, an increase in the gold price from US$20 to US$35 per ounce resulted in a brief flurry of activity, but all the local mines were closed by 1942.
Historical underground mine plans of the Moss Mine in GVC's database are dated May 10, 1915 by Gold Road Mines Co. of Gold Road, Arizona, and September 25, 1920 by the Moss Mines Co. of Gold Road, Arizona. These show the Allen Shaft and levels at 60 ft, 75 ft, 125 ft and 220 ft. The plans show that Moss Mine was operating between 1915 and 1920.
The available records show that the Ruth Mine was accessed by a 60º degree incline shaft to drifts on the 100-ft, 200-ft and 300-ft Levels. Activity appears to have continued through to mid-1935, by which time approximately 600 ft of drifting is reported to have been completed.
Previous Exploration and Development (1982 to 2009)
The table below summarizes the work carried out on the Moss Mine Project by previous owners and operators, up to and including Patriot Gold's last exploration program in 2009.
Summary of Exploration and Development Work Carried Out by Previous Owners and Operators on the Moss Mine Project (the 15 patented lode claims) to 2009
| Company | Date | Work Completed | Comments |
| Moss Mine | 1860 to 1920 | Surface holes and underground mining | 12,000 oz of gold reported to have been extracted |
| Ruth Mine | 1900? to 1935 | Underground mining | Approx. 24,400 t of mineralized material extracted |
| BF Minerals | 1982 | 54 rotary air trac holes, four reverse circulation holes for a total of approximately 6,190 ft | Only assayed Moss Vein material. |
| Harrison Minerals | 1987 to 1988 (exact dates unknown) | Rehabilitated Allen Shaft and deepened it to 300 ft | Constructed headframe in 1987, reportedly left broken mineralized material in stopes, 3,000 to 5,000 short tons trucked to Tyrol mill. |
| Company | Date | Work Completed | Comments |
| Billiton Minerals | 1990 | 21 RC holes for a total of 6,925 ft | Preliminary analysis of gold and silver deportment, preliminary metallurgical tests. |
| Magma Copper Company | 1991 | 21 RC holes for a total of 9,890 ft | Developed local geological maps. Metallurgical testwork carried out by McClelland Laboratories. |
| Reynolds Metals Explorations, Inc. |
1991 | 11 holes for 4,865 ft, plus two RC holes 500 ft | Collar coordinates are not available. |
| Golconda Resources |
1993 | 19 RC holes for a total of 3,058 ft | |
| Addwest Minerals International Ltd. | 1996 to 1997 | 30 RC holes for a total of 8,217 ft plus six diamond holes for a total of 1,667 ft | Developed a new geological model. |
| Patriot Gold Corporation |
2004 to 2009 | 43 RC holes for a total of 11,807 ft plus 12 diamond holes for a total of 6,846 ft | Consolidated the land position, carried out geological studies and surveys. Contracted Metcon Research to carry out metallurgical testwork. |
Operating Phases of the Moss Mine under Northern Vertex Mining Corporation (2013 to 2021)
Phase I
The Phase I pilot heap operations were carried out in 2013 and 2014 to test the metallurgical parameters for commercial operations. The Phase I facilities included an open pit, heap leach pad, barren and pregnant solution ponds, a carbon recovery plant, and ancillary facilities such as an onsite laboratory, onsite diesel power, a medical/safety office and a general office trailer.
The heap leach stage of the operation was carried out from August 2013 to September 2014. During this period, a weak cyanide solution was applied to the top of the heap using drip irrigation. Solutions were recovered to a pregnant solution pond and then circulated through conventional carbon columns. The loaded pregnant carbon was then shipped offsite to a stripping facility to recover the precious metals. The stripped carbon was then returned to the Moss project site for re-use.
Phase II
Phase II of the Project was based on the 2015 Feasibility Study (and NI 43-101 technical report dated June 2015) that involved mining and processing material wholly contained within the patented claim boundaries, which could be accessed without trespass onto adjacent public lands administered by the Bureau of Land Management ("BLM"). The necessary permits and capital were obtained and Phase II commenced construction in late 2017 with eventual operation during 2018 that consisted of mining, crushing, agglomeration and stacking of ore onto a conventional heap leach pad. Commercial production was declared as of September, 2018. Gold and silver recovery were achieved by a Merrill Crowe process to produce doré bars at the Project site.
The operation was designed for a five-year mine life based on a throughput of 5,000 tons per day.
Phase III
Phase III of the Project, which was based on the November, 2017 technical report, extended operations onto the adjacent federal lands administered by the BLM. This third phase allowed Northern Vertex Mining to take full advantage of the estimated Measured and Indicated mineral resources. The third phase necessitated an expanded waste rock facility to accommodate the additional waste rock as well as an expanded heap leach pad to treat the additional mineralized material.
BLM issued a Decision Record and Finding of No Significant Impact regarding GoldenVertex's Mine Plan of Operation on March 18, 2020 based on analysis provided in the Phase III Moss Mine Expansion and Exploration Project Environmental Assessment.
Exploration and Operation of Moss Mine under Elevation Gold Mining Corp July, 2021 to 2024
During the period 2021 to 2022, drilling at the Moss Mine focused on infill and expansion drilling within or near the planned pits. The table below shows the areas, objectives and highlights of significant drill intersects. This drilling extended the known mineralization at depth and along strike to the west in 4 areas. In addition, 7 condemnation holes were drilled in the Rattan area for the 3B leach pad. Several of these holes had intervals above the cut-off grade, however, not enough to justify applying for new permits to move the proposed leach pad.
On March 16, 2023, Elevation Gold announced an intersection of a 100.6 m thick zone with an average grade of 0.5 g/t Au at the Reynolds area. Subsequent drilling of 50 RC drill holes accounting for 23,990m were drilled in the Reynolds area and continued to identify a wide mineralized zone. The geology in the Reynolds area is distinct from the main Moss vein area as it is the only mineralization identified to date that is hosted in volcanic rocks as opposed to intrusive rocks. In addition, no coherent quartz veins were identified in the RC drilling.
Geological Setting, Mineralization and Deposit Types
Regional Geology
In a regional structural context, the Oatman district lies in the transition zone between the stable Colorado Plateau on the north and disrupted terrane of the highly extended Basin and Range on the south. Although the area is broken into north-south trending ranges and valleys typical of the Basin and Range, extension is minor.
The Oatman mining district lies within a large Tertiary volcanic field, developed on a basement of Precambrian granitic and metasedimentary rocks. A batholitic body of trachytic magma invaded the volcanic field to the northwest of Oatman, culminating in massive pyroclastic eruptions of the Peach Springs tuff, resulting in collapse of the roof of the batholith and formation of the huge Silver Creek caldera at ~18.8 Ma. The Peach Springs tuff fills the caldera; its outflow ash-flow sheet extends for more than 100 miles from the caldera, covering more than 15,440 square miles across northwest Arizona and California. The main Oatman district lies just outside of the caldera rim, where mineralization is hosted in pre-caldera intermediate composition lava flows; whereas Moss lies inside the caldera and is hosted in intra-caldera tuffs and intrusions.
Local and Property Geology
The dominant host rock of the Moss deposit is the Moss porphyry, a polyphase monzonite to quartz monzonite porphyry, which intrudes the Peach Springs tuff. Typical Moss porphyry contains coarse grained (4 mm to 10 mm) plagioclase and biotite phenocrysts with lesser hornblende in a very fine-grained groundmass of quartz and feldspar. The Moss stock contains several phases, including equigranular quartz monzonite to monzodiorite, and more felsic phases. Within the project area, the porphyry has undergone weak early propylitic and potassic alteration, characterized by potassic feldspar partially replacing plagioclase feldspar. Sparsely porphyritic feldspar porphyry and rhyolite porphyry to aplite dikes with quartz eyes, crosscut the porphyry and the volcanic wall rocks and constitute minor host rocks. Late (post-mineral) micro-gabbro to basalt dikes cut all units along north-trending faults.
The easternmost portion of the Project area and the western portions of the claims, west of the West Pit, are underlain by the Peach Springs tuff, (formerly the Alcyone Formation), consisting of volcanic tuffs, flows, and minor volcaniclastic sediments filling the caldera. In the project area, the Peach Springs tuff is a thick, highly variable unit composed dominantly of several welded trachytic ash-flow tuff sheets separated by coarse volcaniclastic sediments, debris flows, and volcanic breccias. Lithic-rich welded tuff is common.
Locally, large-foundered blocks of Precambrian granite, representing landslide deposits from the caldera walls, occur within the tuff. Welded tuffs within the Peach Springs tuff are competent units capable of hosting both persistent veins and stockworks.
The Times granite, a fine-to medium grained leucogranite, forms an irregular intrusion centred to the south of Silver Creek. Age relations between the Moss porphyry and the Times granite are uncertain; the two intrusions appear to intermingle in several places. The granite is a host rock at the West Oatman prospect.
Mineralization
Gold-silver mineralization in the West Oatman district occurs as high-level low-sulfidation epithermal veins and stockworks. The mineralization is very similar to that of the main Oatman mining district. The Moss Vein may represent the western extension of the Gold Road vein on the north end of the Oatman district.
Three main veins and their associated stockworks host the bulk of mineralization defined to date at Moss:
1) The Moss Vein and its extensions to the west and east of the resource area.
2) The Ruth Vein to the immediate south of the Moss Vein.
3) The West Oatman Vein, lying about one mile to the south of the Moss Vein.
The Moss Vein is a S84E striking, steeply dipping (average 70˚) quartz-calcite vein and stockwork system, which extends over a strike length of approximately one mile in the resource area (Moss Open Pit and West Pit), but can be traced for 3.9 miles in total length.
The Ruth Vein is an epithermal quartz-calcite vein, similar and subparallel to the Moss Vein, lying about 650 feet to the south of the Moss Vein in the central area and dipping about 60 degrees north toward the Moss Vein.
The West Oatman Vein is like the Moss vein and is potentially mineralized over a strike length of at least one kilometer, with the host structure striking 290 degrees and dipping approximately 65 degrees to the northeast. Vein, stockwork and breccia widths vary from less than a meter to approximately 30-50 meters in width in breccia-filled dilation zones.
Mineral Deposit Type
The Moss Vein system is considered a high level, low-sulfidation (adularia-sericite) epithermal gold-silver deposit in the classification of Heald et al (1987) and White and Hedenquist (1995). Low sulfidation epithermal deposits form from hydrothermal waters in the relatively near-surface environment, typically within 1.5 km of the earth's surface (Taylor, 2007). They are commonly found associated with magmatism and volcanism but are somewhat distal (vertically or laterally) from the actual centre of magmatism, in environments where meteoric waters have mixed with and diluted magmatic waters.
Exploration
Mako has not conducted any exploration programs at Moss since the project was acquired.
Drilling
A total of 69,648 ft in 261 drill holes has been carried out on the project by previous companies. Different drilling methods have been utilized, including Air Track (AT), Long-hole (LH), RC and Diamond Core. The collar coordinates for this drilling have been taken from old reports and plans. In 2011, Northern Vertex Mining, surveyed the collars that could be located in the field using a differential GPS. These drill holes do not have any down-the-hole directional surveys. This is not considered a significant issue as most of these holes are short and drill hole deviations would be minor for these holes.
In 1982, BF Minerals carried out the drilling of 54 Air Track holes and 4 RC holes totalling 6,190 ft of drilling in the Central Pit and West Pit areas targeting the Moss Vein. In 1989, Lac Minerals (USA) drilled 7 RC holes totalling 3,125 ft in the Far West area. In 1990, Billiton carried out the drilling of 21 RC holes totalling 6,925 ft in the Centre Pit, East Pit and West Pit areas, targeting the Moss Vein. In 1991, Reynolds Metals drilled 11 holes totalling 4,865 ft in the Reynolds Pit area. In 1991, Magna Copper carried out the drilling of 21 RC holes totalling 9,890 ft in the Centre Pit and East Pit areas, again targeting the Moss Vein. In 1992, Golconda Resources carried out the drilling of 17 RC holes totalling 2,698 ft of drilling in the Centre Pit and East Pit areas, again targeting the Moss Vein.
In 1996, Addwest Minerals International Ltd. (Addwest) carried out the drilling of 30 RC holes totalling 8,217 ft again targeting the Moss Vein in the Centre Pit area. This was followed up in 1998 by the drilling of 15 Long-holes totalling 434 ft in the Centre Pit area. The LH98-1 to LH98-15 holes completed by Addwest in 1998 were drilled as up-holes in the historical underground workings. In each case, the holes were drilled to explore the Moss Vein, based on knowledge of its attitude and extent from field mapping and related geological fieldwork.
Patriot Gold carried out drilling campaigns in 2004, 2005, 2007 and in 2009 on the Project. In 2004, they drilled 35 RC holes totalling 7,542 ft in the East Pit area. In 2005, they drilled 7 RC holes totalling 3,675 ft also in the East Pit area. In 2007, they drilled 6 Core holes totalling 3,916 ft in the Centre Pit area and in 2009 they drilled 6 Core holes totalling 2,929 ft in the East Pit area.
Northern Vertex has carried out a series of drilling Phases since February, 2011, across the Moss Mine Project. The Phase 1 2011 drilling program was supervised by MinQuest with Northern Vertex Corp. (Northern Vertex) personnel supervising all subsequent drilling phases.
In 2011, during Phase 1, Northern Vertex drilled 54 RC holes totalling 20,555 ft of drilling and 10 core holes totalling 2,601 ft targeting the Centre and East Pit areas.
Later in 2011 and to 2013, during Phase 2, Northern Vertex drilled 21 RC holes totalling 8,537ft of drilling and 74 core holes totalling 26,738 ft of drilling in the West, Centre and East Pit areas.
The collars of all the Phase One to Phase Three drillholes were surveyed by Northern Vertex personnel, using a differential GPS. The locations of individual collars are marked by a plastic pipe set in and concreted into the top of the drillhole, with an adjacent metal rod or wooden stake set in concrete and marked with flagging tape. Each collar monument is marked with the drillhole number, azimuth and inclination. The collar co-ordinates were verified as part of a larger due diligence program that included the holes drilled by previous owners and operators of the Moss Mine Project.
Downhole directional surveys were carried out by Northern Vertex personnel using a Reflex EZ-Trac tool. Downhole surveys were carried out for 21 RC and diamond Core holes during the Phase 1 program, 17 RC and Core holes in the Phase 2 program and 42 Core holes for the Phase 3 program.
Percussion drilling was carried out between October and December, 2012, using a tracked, Atlas Copco ECM 590 drill rig with a 3" hole diameter. All holes were vertical and were generally drilled to a maximum of 96 ft, as holes deeper than 100 ft are considered water wells in Arizona and require a well permit from the state. Holes were stopped short if they hit old workings, water or heavily fractured ground. A total of 187 holes were drilled for resource infill on the Moss Vein. A total of 28 holes were drilled to investigate mineralization on the west side of the Canyon Fault / Dike where the low-grade metallurgical sample was taken, and possible extensions of the Moss vein across the Canyon Fault. A total of 50 condemnation holes were drilled in the area proposed for waste rock storage in the Ruth and Ruth Dump areas. As well, 7 condemnation holes were drilled in the Rattan area. Five other percussion holes were drilled by a truck-mounted rig supplied by Drilltech, two for water monitoring (MW2012-1 to MW2012-3) and two water wells (WaterWell-1 and 2).
In 2016, two water wells totalling 2,336 ft were drilled and sampled, one in the Centre pit area and the other in East Pit area. The sampling of these holes is not considered reliable, and they have been excluded from the Mineral Resource Estimation.
In 2017, 20 Core holes were drilled totalling 4,716 ft in the West Extension, West Oatman, and Old Timer areas. The West Oatman and Old Timer drilling is not situated on the Moss Vein mineralized trend, and these holes are not considered for the Mineral Resource Estimate.
The 2018 program consisted of thirty-one 94-ft-deep percussion holes drilled into the hanging wall of the Mordor vein in the West Extension area. Twenty-four of the holes encountered strong vein and stockwork gold-silver mineralization. The drilling results were used to guide deeper reverse-circulation drilling in 2020. The percussion drilling and sampling from this program is not considered to meet CIM best practice guidelines and none of this exploration drilling was used for Mineral Resource Estimation.
The 2019 drilling program, an infill drilling program in the West Pit area, commenced on September 3, 2019, and concluded on November 13, 2019. Longyear Drilling Company completed 29 reverse-circulation drill holes totalling 14,025 feet using a track-mounted MPD-1500 drill rig. The objectives of the program were to confirm continuity of mineralization, to upgrade Inferred resources to Indicated or Measured resources, and to potentially extend the open pit design at depth and to the south.
Twenty-five of the 29 drill holes encountered significant stockwork gold-silver mineralization, with most holes having multiple intercepts. In addition to confirming continuity of mineralization and upgrading resource categories, the program was successful in proving mineralization beneath the planned pit bottom. For example, hole AR-226R intersected 140 ft grading 0.024 oz/ton Au, 0.41 oz/ton Ag, starting 120 ft below the planned pit bottom, indicating potential to expand the resource at depth.
In 2020, a total of 146 RC holes totalling 69,960 ft and 6 Core holes totalling 4,659 ft were drilled to test the goals listed above. Then in 2021, a total of 149 RC holes totalling 116,645 ft and 30 Core holes totalling 22,756 ft were completed to test the goals listed above. The results of this drilling were encouraging.
The West Pit, Gold Bridge and Gold Tower drill holes intersected multiple zones of stockwork mineralization throughout the length of the holes. Drilling along the projection of the Ruth Vein discovered a second high-grade zone about 500 ft to the east of the shafts, where hole AR20-313R intersected 20 ft grading 0.285 oz/ton Au, 1.06 oz/ton Ag, including five feet grading 0.735 oz/ton Au and 2.49 oz/ton Ag.
The encouraging results of the early drilling at Ruth spurred a program of systematic drilling of the vein. However, drilling was hampered by the logistical challenges of establishing drilling platforms in a narrow open pit mine with active mining and blasting. It was necessary to drill multiple holes at varying angles from a limited number of pads. Several holes were drilled through waste dumps. Many holes were drilled at oblique angles to both the dip and strike of the vein, creating exaggerated apparent mineralized intercepts.
In drill holes, the Ruth Vein ranges from a narrow (five feet) vein with no adjacent mineralization to a vein with thick zones of adjacent stockwork mineralization. Stockwork vein zones also occur both above and below the Ruth Vein. Most holes intersected multiple mineralized zones.
Higher grades occur both within the core of the Ruth Vein and locally as thin intervals within stockwork zones in both the footwall and hanging wall. Rare pockets of high- grade gold have been drilled, but drilling density is insufficient to define coherent "mineralized shoots".
Defining mineralization beneath the limit of previous drilling and expanding the resource to depth below the planned open pit bottom were goals of the 2020-2021 drilling programs. Twenty-one angled drill holes: 11 reverse-circulation, and 10 core, were drilled from south to north to test the deep Moss vein and the intersection of the Ruth and Moss veins. One deep reverse-circulation hole (AR20-315R) was drilled at -85° to the south to test the Moss-Ruth intersection. Drill lengths ranged from 660 ft to 1,355 ft, reaching vertical depths of up to 1,170 ft below the surface. Significant precious-metals mineralization was encountered to depths of up to 950 ft beneath the surface (AR20-315R).
Due to the oblique orientation of drill holes to the Moss vein, several drill holes have exaggerated mineralized intervals, for example AR20-315R intersected 360 ft grading 0.023 opt Au from 605 ft to 965ft, but corrected for obliquity to the vein, the true thickness of the mineralized zone is about 165 ft. That is thicker than normal for the Moss vein and hanging wall stockwork, suggesting thickening with depth as the intersection with the Ruth vein is approached.
Drilling to date shows no indication of bonanza grades at the vein intersection, but sections of moderate grade mineralization in the Moss vein have been drilled to depths in excess of 900 ft. For example, hole AR21-441R drilled a true thickness of 17 ft grading 0.058 oz/ton Au at a vertical depth of 738 ft to 810 ft, and hole AR20-315R drilled 13 feet grading 0.054 oz/ton Au at a vertical depth of 897 ft to 946 ft.
Drilling in the East Extension area focused on following the Moss vein and its hanging wall stockworks eastward from the open pit/patented claim boundary. Twenty-one reverse- circulation holes were drilled over a strike length of 700 ft. Five shallow (150 ft to 350 ft long) drill holes angled into the projection of the Moss vein immediately east of the open pit did not encounter significant mineralization. However, two holes just east of the shallow drilling intersected thick moderate-grade gold-silver. AR21-425R intersected 75 ft grading 0.0309 oz/ton Au, 0.58 oz/ton Ag and AR21- 425R intersected 75 ft grading 0.058 oz/ton Au, 0.069 oz/ton Ag. The apparent gap in mineralization may be due to insufficient drilling or the shallow depth of drill holes, or it could be due to a fault offset of the vein to the north, steepening or overturning of the vein, or a barren compressional zone between mineralized extensional zones along the vein. Infill drilling is needed to evaluate this area.
The West Extension follows the Moss vein structure west of the West Pit to the eastern limit of the Moss claim block. Mineralized areas include the Mordor cliffs, the Mordor vein, Mid-West Extension, and Far West Extension. Two RC holes, AR20-251R and AR 20-252R were drilled along the base of the Mordor cliffs. AR20-252R, about 1,500 ft west of the West Pit, was located too far to the south and did not reach the Moss stockwork zone. AR20-251R, about 1,300 ft west of the West Pit, intersected two mineralized zones; 20 ft grading.0.027 oz/ton Au, 0.011 oz/ton Ag between 40 ft to 60 ft downhole and 80 ft grading 0.010 oz/ton Au, 0.04 oz/ton Ag between 175 to 255 ft downhole.
At the Midwest Extension, centred about 2,300 ft west of the west end of the West Pit, one reverse circulation hole was drilled to test for bulk tonnage gold mineralization and to verify results from Reynolds Metals' drilling in 1991. Drill Hole AR21-253R, a 400-ft vertical reverse circulation hole, drilled in the northwest part of the target area, intersected four zones of mineralization between the surface and a depth of 390 ft including: 150 ft grading 0.009 oz/ton Au, 0.04 oz/ton Ag from 50 ft to 200 ft downhole; 15 ft grading 0.013 oz/ton Au, 0.04 oz/ton Ag from 225 ft to 240 ft downhole; 10 ft grading 0.034 oz/ton Au, 0.02 oz/ton Ag from 310 to 320 ft downhole; and 15 ft grading 0.016 oz/ton Au, 0.02 oz/ton Ag from 375 ft to 390 ft downhole.
Results of AR21-253R confirm the existence of thick sections of low-grade gold at Midwest Extension, verify results from Reynold's Metals' 1991 drilling, and suggest good potential for a bulk-tonnage gold deposit at shallow depth.
One reverse-circulation hole was drilled at the West Oatman target, a vein/breccia system lying about one mile south of the Moss mine on the south side of Silver Creek Wash. Drill hole AR21-259R was a vertical hole drilled as an offset to Reynolds Metals' hole BW 92-10, which encountered 145 feet grading 0.016 oz/ton gold. AR20-259R intersected 175 feet grading 0.024 oz/ton gold and 0.431 oz/ton silver including 60 feet grading 0.0452 oz/ton gold and 1.03 oz/ton silver, about 50 feet downdip of BW 92-10. The drill results suggest significant thickening and increase in grade with depth in the West Oatman system.
A drilling program to follow up the results of hole AR20-259R is planned. The drilling will expand upon previous drilling by Reynolds Metals and 13 core holes drilled by Northern Vertex in 2017.
The 2022 to 2024 drilling was carried out over various targets on the Moss Mine Project. A total of 125 RC holes totalling 84,955ft of drilling targeted the Centre Pit, East Extension, Rattan, Reynolds Pit, West Extension and West Pit areas. Four Core holes totalling 8,777.5ft were drilled at Florence Hill, with one Core hole totalling 1,526ft drilled at Grapevine. There were 50 drill holes totalling 23,990 ft drilled at the Reynolds Pit, with 26 totalling 22,880 ft at the West Extension and 20 holes totalling 15,520 ft at the West Pit area. Additional drilling was carried out at Centre Pit, with 13 holes totalling 11,515 ft. There were 9 RC holes totalling 5,900 ft drilled at the East Extension and 7 drill holes totalling 5,150 ft drilled at Rattan.
The results of the RC drilling in Reynolds pit area include a total of 54 mineralized intercepts that have a drilled length greater than 60 ft with a minimum grade of 0.005 oz/t Au. The best intersection was drilled in hole AR22-647R, which cut 330 ft grading 0.0116 oz/t Au and 0.0501 oz/t Ag from 10 ft to 340 ft downhole.
The results of the RC drilling in the West Extension area include a total of 27 mineralized intercepts that have a drilled length greater than 60 ft with a minimum grade of 0.005 oz/t Au. The best intersection was drilled in hole AR22-621R, which cut 380 ft grading 0.0116 oz/t Au and 0.0279 oz/t Ag from 730 ft to 1,110 ft downhole.
The results of the RC drilling in the West pit area include a total of 27 mineralized intercepts that have a drilled length greater than 60 ft with a minimum grade of 0.005 oz/t Au. The best intersection was drilled in hole AR22-622R, which cut 475 ft grading 0.0103 oz/t Au and 0.0421 oz/t Ag from 0 ft to 475 ft downhole.
The results of the RC drilling in the Centre pit area include a total of 17 mineralized intercepts that have a drilled length greater than 60 ft with a minimum grade of 0.005 oz/t Au. The best intersection was drilled in hole AR22-631R, which cut 95 ft grading 0.0376 oz/t Au and 0.695 oz/t Ag from 205 ft to 300 ft downhole.
Sampling, Analysis and Data Verification
Sample Collection and Security
For Phase 1 RC drilling, drill holes from AR-57R to AR-119R, the reverse circulation cuttings were sampled and analysed in 5 ft increments over the entire drill hole length, with sample weighting between 5 lbs and 10 lbs recovered in olefin bags. Samples were removed from the drill site each day and placed in secure storage. From there the samples were shipped via UPS to ALS Chemex of Reno, Nevada, USA. Each shipment also included a coarse crushed blank and low to medium gold grade standard reference material (SRM).
For Phase 2 RC drilling, drill holes AR-120R to AR-138R, the sampling protocol was the same except that the samples were shipped for assay to the Inspectorate America Corporation laboratory in Sparks, Nevada.
For Phase 3 RC drilling the reverse circulation cuttings were sampled and analysed in 5 ft increments over the entire drill hole. Cuttings were collected via a rotating splitter mounted on the drill to give a sample ranging from 7 to 10 pounds that was collected in an olefin bag inside a bucket. The samples were labelled with the hole number and footage. Samples to be assayed were removed from the drill site each day and placed in secure storage. From there they were shipped to the Inspectorate America Corporation laboratory in Sparks, Nevada for assay. Before shipment, a coarse crushed blank, low and medium gold content standards were added to the sample batch for each hole.
For Phase 1 core drilling, the HQ size core was drilled and collected in 10 ft lengths in core boxes, with intervals marked with wooden blocks every 2 to 3 ft. The core was logged on site by a MinQuest contract geologist who marked sample intervals not to exceed 5 feet. The logged and marked core was transported from the project site by the geologist to secure storage in Reno. Geotechnical logging was carried out by an engineer before the core was sampled. The core was sawn in half under the supervision of a project geologist, with one‐half of the split sawn in half again using a core saw. One‐ quarter core was sampled on the intervals marked by the geologist, placed in olefin bags, labelled with hole number and footage, blanks and standards were added and sent to the ALS Chemex of Reno Nevada for preparation and analysis. The remaining three‐quarter core was kept in secure storage until used for metallurgical testing.
For Phase 2 core drilling, the HQ size core was drilled and collected in 10 ft lengths in paper core boxes. Intervals were marked with wooden blocks every 2 to 3 feet. The core was logged on site by a MinQuest contract geologist who marked sample intervals not to exceed 5 ft. The logged and marked core was transported from the project site by the geologist to secure storage in Reno. After detailed geotechnical logging by an engineer the core was sawn in half under the supervision of a project geologist. One half of the core was sampled on the intervals marked by the geologist, placed in olefin bags, labeled with a consecutive sample number, blanks and standards added and sent to the Inspectorate America Corporation laboratory in Sparks, Nevada for assay for preparation and analysis. The remaining one-half core is kept in secure storage until required for metallurgical testing.
In the Phase 2 and 3 core drilling programs, the core was transported from the Moss Mine Project site by a Northern Vertex employee to a secure core logging and storage warehouse in Bullhead City, Arizona rented by Northern Vertex. The core was logged by a Northern Vertex geologist and sample intervals were marked not to exceed 5 ft. After detailed geotechnical logging, the core was sawn under the supervision of a project geologist. The core was split in half using a core saw. One half of the core was sampled on the intervals marked by the geologist, placed in olefin bags, labelled with a consecutive sample number, blanks and standards added and sent to the geochemical lab for preparation and analysis. The remaining one-half core is kept in secure storage until required for metallurgical testing. Core from the Phase 2 and 3 programs is stored in the Northern Vertex warehouse in Bullhead City, Arizona. Northern Vertex is in the process of recovering samples from the Phase 1 program stored by MinQuest in Reno, Nevada in order to store all samples at Northern Vertex's storage in Bullhead City.
The 2012 Percussion drilling was carried out by an Atlas Copco ECM 590 drill rig powered by a Cummins 220 horsepower (HP) Tier III diesel engine, with an on board, (250 cubic feet per minute (CFM)), 140 pounds per square inch (psi) compressor supplying flushing air. The on-board, hydraulically powered dust collector was mounted on the starboard side of the rig, with a 5 inch (12.7 cm) spiral suction hose connected to an adjustable sliding "boot" below the centralizer on the feed mast, through a drill mast mounted venturi. The boot could be lowered to form a seal around the drill collar. Coarse cuttings, accounting for about 80% of the total cuttings, were discharged from the forward venturi, and the remaining 20%, comprising the fine fraction, were discharged from the dust collector itself. Polythene sample bags (18 in x 24 in) were attached to both the forward venturi discharge and the dust collector discharge to ensure 100% sample collection. The hole diameter was 3 in. The initial drill rod (T-51 thread = 51 mm diameter) in the string was 14 ft long, allowing for 12 ft to be in the hole and 2 ft from the centralizer clamping device to the hole collar. Subsequent drill rods were 12 ft long. The sample interval was set at 6 ft, allowing a sample to be collected at the mid-point of the drill rod and when the next rod was added. At the end of each sample interval, the driller would cease penetration, continue to flush with air for 10 seconds with the dust collector on, then shut off the flushing air and the dust collector suction, thereby allowing both the dust collector and venturi to fully discharge. The quantity of drill cuttings in each sample was about 50 lbs (22.7 kg). The coarse and fine sample from each interval was combined and then split on-site using a Jones riffle splitter. The final two splits from each sample interval were kept, with one sent for assay and the second stored on site in the 65 ft level crosscut. A screened sample was saved in chip trays from each interval. Additional splits from about 5% of the sample intervals were also saved to provide duplicates for assay. Certified Standard Reference Materials (CSRM) and blanks were also inserted into the samples for QA/QC. The samples were boxed and sent by UPS courier to the Inspectorate laboratory in Sparks, Nevada for sample preparation and assay. The maximum depth of the holes was 96 feet (29 m), as holes deeper than 100 feet (30.4 m) are considered water wells in Arizona and require a well permit from the state. If a hole hit water, drilling was stopped as water causes cuttings to stick to the drill rods resulting in possible contamination between intervals. Six core holes were twinned with percussion holes to ensure that representative samples were being collected by the percussion drilling
The diamond core and reverse circulation drilling program (Phase 4) carried out between 2016 to 2017 was supervised by Consulting Geologist Mr. Robert Cuffney. The sampling and procedures followed those outlined above for the 2013 core and RC drilling program.
The diamond core and reverse circulation drilling carried out in 2019, (Phase 6), was also supervised by Consulting Geologist Mr. Robert Cuffney. The sampling and procedures followed those outlined above for the 2013 core and RC drilling program. The samples collected during this program were submitted to Skyline Assayers and Laboratories (Skyline) of Tucson, Arizona. The QA/QC program consisted of the insertion of Certified Reference Material (CRM), a blank and a field duplicate for every 30 samples submitted for assay.
The diamond core and RC drilling carried out from 2020 to 2023 was carried out by Mr. Chris White, Senior Geologist at Moss Mine.
The 2020 to 2023 RC samples were collected at five-foot intervals by the drilling crew using a wet rotary splitter. Field notes were recorded for each sampling, including what was sampled and how the sample was taken. The samples were collected in bags, with a sample tag assigned to the bag. The samples were delivered to a secure on-site location prior to being picked up by a Skyline representative.
The 2020 to 2023 core from the drill rig was pulled from the core barrel by the drill crew and broken into lengths that fit into the core boxes. The depth of the core is labeled by the drillers when it is placed in the core box. The core is logged and cut by the geologists in the core shed. Half-core is sampled on five to 10-foot intervals, with the half-core placed in bags with a sample tag. The samples are delivered to a secure on-site location prior to being picked up by a Skyline representative.
Sample Preparation and Analysis
The Phase 1 drilling samples were sent to the ALS Chemex laboratory in Reno, which is now part of ALS Global. This laboratory is ISO 9001:2008 and ISO 10725 certified. The laboratory is independent of Northern Vertex. The core samples were prepared by crushing in a jaw crusher, riffle splitting, and pulverizing. All samples were analysed for gold and silver. Gold was analysed by fire assay on a 30 g sample and atomic adsorption spectrophotometry (AAS) finish (method AA23). Samples over the maximum detection limit of 10 g/t Au were rerun by fire assay on a 30g sample with gravimetric finish (method Au‐GRA21). Silver was analysed by multi‐acid digestion (hydrofluoric acid, nitric acid and perchloric acid, with a hydrochloric acid leach) and AAS finish (method AA61). Samples over the maximum detection limit of 100 g/t Ag were rerun by the same method with a higher limit of detection for ore grade samples (method Ag‐AA62). The core samples were also analysed for 33 additional elements (Ag, Al, As, Ba, Be, Bi, Ca, Cd, Co, Cr, Cu, Fe, Ga, K, La, Mg, Mn, Mo, Na, Ni, P, Pb, S, Sb, Sc, Sr, Th, Ti, Tl, U, V, W and Zn) by four acid "near‐total" digestion and inductively coupled plasma atomic emission spectrometer (ICP‐AES) finish (method ME‐ICP61).
The Phase 2 and Phase 3 drilling samples were sent to the Inspectorate America Corporation laboratory in Sparks, Nevada. This is a Bureau Veritas Group Company and is ISO 9001:2008 certified. The laboratory is independent of Northern Vertex.
The reverse circulation cuttings, percussion samples and core samples were prepared by drying for up to 24 hours, crushing in a jaw crusher to >70% passing minus 10 mesh, riffle splitting of about 250 g, and pulverizing the split to >85% passing minus 200 mesh (method SP-RX-2K). The samples were analysed for gold by fire assay on a 1 assay ton (30 g) sample and atomic adsorption spectrophotometry (AAS) finish, with a detection range of 0.005 to 10.0 ppm (method Au-1AT-AA). Samples above the upper limit of detection were re-assayed by fire assay on a 1 assay ton sample with gravimetric finish, with a detection range of 1 to 1,000 ppm (method Au-1AT-GV).
For reverse circulation samples, silver was analysed as part of a multielement 30 element package (Ag, Al*, As, Ba*, Bi, Ca*, Cd, Co, Cr*, Cu, Fe, K*, La*, Mg*, Mn, Mo, Na*, Ni, P*, Pb, S, Sb, Sc*, Sr*, Ti*, Tl, V, W*, Zn and Zr*) by 4-acid "near-total" digestion and inductively coupled plasma atomic emission spectrometer (ICP-AES) finish (method 30-4A-TR). For the elements marked with an asterisk (*) Inspectorate advise that results are semi-quantitative due to being only partially leached in aqua regia or lost to volatility in 4-acid digestion. For core samples, silver was analysed by aqua regia digestion and AAS finish, with a detection range of 0.1 to 200 ppm (method Ag-AR-TR).
Samples of core or RC cuttings from 2019 to 2023 were shipped to Inspectorate Laboratories in Sparks, Nevada, where they were dried, crushed, and pulverized to 85% passing 200-mesh sieve. The pulps were assayed for gold using a 30-gram aliquot by fire assay ("FA"), with an atomic absorption ("AA") finish. For those assays above a threshold of 0.292 oz/ton (10 g/t) for gold were rerun using a gravimetric finish. The pulps were also analysed for 35 elements, including silver, with at 0.25-gram split using a four-acid digestion ICP-ES analysis. The Inspectorate Laboratory is independent of the company and meets the requirements of International ISO 9001:2008 standards. Rejects and pulps are stored at GVC's warehouse in Bullhead City, Arizona, for future reference.
Quality Control and Quality Assurance
The QA/QC protocols include the insertion of certified reference material (CRM), blanks and duplicates in the assays sample stream along with replicate analyses. The QA/QC results was monitored by the Project Geologist using a spreadsheet in which a written QA/QC log was maintained to indicate problems, actions taken, and resolutions. CRM were monitored by type and by laboratory certificate. If an assay returned for a CRM was outside three standard deviations of the expected value, then the CRM and at least one sample either side were re-assayed. Blanks were monitored in a spreadsheet, and intervals were re-assayed if there was an anomalous assay result.
There are three CRM materials that were used to assess the accuracy and precision of the assays for the 2011 drilling program. There is good agreement between the CRM expected value and assay results for these three CRMs. The blank results also indicate that there is good agreement between the expected value and assay results. The results of these QA/QC assays demonstrate that the assays by ALS Chemex are sufficiently accurate to be reliable.
There are three CRM materials that were used to assess the accuracy and precision of the assays for the 2012 drilling program. There is good agreement between the CRM expected value and assay results for these three CRMs. The blank (CDN-BL-9) results also indicate that there is good agreement between the expected value and assay results. The results of these QA/QC assays demonstrate that the assays by Inspectorate are sufficiently accurate to be reliable.
There are seven CRM materials that were used to assess the accuracy and precision of the assays for the 2013 drilling program. There is good agreement between the CRM expected value and assay results for these seven CRMs. The blank (CDN-BL-10) results also indicate that there is good agreement between the expected value and assay results. The results of these QA/QC assays demonstrate that the assays by Inspectorate are sufficiently accurate to be reliable.
There are seven CRM materials that were used to assess the accuracy and precision of the assays for the 2020 drilling program. There is good agreement between the CRM expected value and assay results for these seven CRMs. The blank (CDN-BL-10) results also indicated that there is good agreement between the expected value and assay results. The results of these QA/QC assays demonstrate that the assays by Skyline are sufficiently accurate to be reliable.
There are four CRM materials that were used to assess the accuracy and precision of the assays for the 2021 drilling program. There is good agreement between the CRM expected value and assay results for these four CRMs. The blank (CDN-BL-10) results also indicate that there is good agreement between the expected value and assay results. The results of these QA/QC assays demonstrate that the assays by Skyline are sufficiently accurate to be reliable.
There are eight CRM materials that were used to assess the accuracy and precision of the assays for the 2022 drilling program. There is good agreement between the CRM expected value and assay results for these eight CRMs. The results of these QA/QC assays demonstrate that the assays by Skyline are sufficiently accurate to be reliable.
The QA/QC assessment for 2023 was carried out using two sets of duplicate samples. The laboratory check samples are duplicate assays on pulp samples. The means of the assay results are similar between the first and second assay results. There are 8 duplicate failures, which represents only 3.2% of the data. This error rate is considered acceptable. The preparation duplicate samples are duplicate assays on sample reject material. The means of the two assays are similar, and the error rate is also low at 2.9%. From these results the assays produced by Skyline Assay laboratories for the 2023 samples are sufficiently accurate to be considered reliable.
Data Verification
The drill hole database for the Mineral Resource Estimate is based on the database initially developed by Northern Vertex Mining Corp who compiled the legacy collar and assay data provided by Patriot Gold Corp., which includes scanned copies of all legacy data sources, into the Moss Mine Master Database. Northern Vertex and later Golden Vertex Corp. managed the database and added additional data as it was collected between 2011 to the present. In addition, the IMC verified drill hole data files compiled for the IMC 2021 mineral resource estimate, which was provided as a series of Excel spreadsheets, were used to help verify the Moss Mine Database. Several comparisons were carried out using the two different sources of information and a final database was constructed in Micromine. This information was then exported as a series of Excel files consisting of collars, surveys, assays and geology that were used to build a MineSight datafile for data analysis and mineral resource estimation.
In addition to the verification listed above, the drill hole collar elevations were checked against the digital original topography surface file, the down-hole surveys were examined for sudden large deviations that might represent errors in either data entry or data measurement. Any anomalous results were investigated to determine if any results are material to the reliability of the drill hole database.
Assay certificate validation of the Skyline Assayers and Laboratories (Skyline) work on the 2021-2023 drill hole samples taken after the 2021 technical report was undertaken by Qualified Person Gary Wong, P.Eng. Assays from 2021 onwards were provided to Gary Wong, P.Eng., directly by Skyline. The files were provided in comma separated value (csv), Microsoft Excel (xls and xlsx) and Portable Document Format (PDF). The Excel files (xls or xlsx depending on what format was available) were used to create a new database by Doug Roquet of Spatial Engineering, who is independent of Golden Vertex. The results are:
• 653 assay sheets imported.
• 15 assay sheets not matched.
• 53,997 samples matched with drill samples.
The 15 unmatched assay sheets are assumed to be from samples which are not drill core. With this database, a comparison query was created against the merged database used in the estimation (the original DataShed database). A total of 261 samples in the new database did not match the DataShed sample assays. They come from 14 different drill holes. After visual inspection, it was determined that 2 of the holes are from outside of the study area. Removing the samples from these holes leaves 259 samples which have different assays than the DataShed assays.
Since these problem assays account for 0.4% of the total number of new assays, the QP concludes that the differences are immaterial for the purpose of this mineral resource estimate.
A series of statistical and graphical summaries were used to assess the reliability of the RC and Percussion samples, including an analysis of twin drill holes. The result of this analysis demonstrates that the sampling and assays are sufficiently accurate to be considered reliable.
During the site visit to the Moss Mine Project, independent verification samples were collected by Mr. Gary Wong, P.Eng. Mr. Wong collected 26 pulp samples, from drilling carried out in 2021 and 2022 by Golden Vertex and that were assayed by Skyline Laboratories of Tucson, Arizona, USA. These verification samples help to establish the integrity and accuracy of the data that will be used for the estimation of mineral resources. The 26 pulp samples were submitted to Skyline Laboratories and were assayed using the FA-03 methodology, which uses a fire assay with a gravimetric finish and a range of 0.03 to 1,000 g/t. The independent sample assay results were paired with the information for the same samples in the Moss Mine drill hole database and statistical and graphical summaries were used to assess the results.
While there is significant variability between the original and re-assay results, there does not appear to be a significant difference between the means of the two assay data sets, the re-assays appear to be sufficiently similar to the original assays and support the reliability of the assay results in the drill hole database.
Mineral Processing and Metallurgical Testing
The Moss Mine utilizes conventional crushing to approximately P90 6.3 mm (¼ inch), followed by valley-fill heap leaching. Gold and silver are recovered from pregnant leach solution using a Merrill-Crowe zinc cementation process, with doré bars produced on site. The nominal processing rate is 5,500 short tons per day.
Metallurgical testwork has been conducted on an ongoing basis and includes bottle roll tests (weekly) and column leach tests (monthly) using representative crushed ore composites. Historical column testwork reported average gold recoveries of approximately 80% at laboratory scale, with recommended scale-up adjustments resulting in estimated operational recoveries of 75-77% gold and 40-43% silver. Testing demonstrated that gold recovery was relatively consistent and characterized by rapid early leaching followed by slower diffusion-controlled recovery. Silver recoveries were more variable and exhibit slower leach kinetics.
Column test results from 2022-2023 showed average gold recoveries of approximately 74% over average leach periods of about 107 days, with results generally consistent with commercial heap leach performance. Silver recoveries during the same period averaged approximately 25%, with greater variability observed. Operational reconciliation data from 2018 through 2024 indicate cumulative recovery factors of approximately 75% for gold and 40% for silver, which are consistent with testwork results and production history.
The mine has generated substantial operating data since commencing production in 2018, providing a strong empirical basis for recovery forecasting. No deleterious elements affecting metallurgical performance have been identified to date.
Based on historical testwork, ongoing metallurgical programs, and production reconciliation, the recommended metallurgical recovery assumptions for use in the Moss Mine Technical Report are 75% for gold and 33% for silver.
Continued metallurgical monitoring, statistical correlation between bottle roll and column results, extended column testing to determine ultimate recoveries, and additional investigation into silver recovery variability are recommended to maintain confidence in long-term recovery projections.
Mineral Resource Estimate
Introduction
The mineral resource estimate was carried out by Chris Keech, P.Geo., Principal Geologist of CGK Consulting Services Inc (CGK) using MineSight® version 15.4 software for the development of the block model gold and silver block grade estimates and Geostokos Toolkit® for variography analysis of the composited gold and silver grades. Mr. Keech is a Qualified person and is independent of Mako as defined by NI 43-101.
The mineral resources estimate for the Moss Mine Project has been carried out in accordance with the CIM's "Estimation of Mineral Resources and Mineral Reserves Best Practice Guidelines" (November 2019). The mineral resources have been generated from drill hole data the interpretation of a geological model that identifies the spatial distribution of the gold and silver grades. The interpolation parameters have been defined based on the drill hole data and the geological interpretation and geostatistical analysis of that data.
The mineral resources have been classified by proximity to data locations and the quality of the data and have been reported in accordance with CIM's "Standards on Mineral Resources and Reserves" (May 2014) as required by NI 43-101.
Drill Hole Database
The drill hole data inside the block model area consists of 1,169 drill holes totalling 452,086 ft of drilling with 87,471 sample intervals. RC drilling has contributed more than 55% of the drill holes and more than 81% of the sample intervals to the drill hole database inside the block model limits. Next are the core drill holes, which have contributed 11% of the holes and 12% of the sample intervals. The remaining 33% of the drill holes are short rotary holes which account for 6% of the sample intervals.
Geological Model
The Geological Block Model was constructed based on four wireframe solids that represent the Stockwork mineralization, the Moss Vein, the Ruth Vein and a higher-grade Reynolds Stockwork mineralization. This interpretation was developed by Mr. Gary Wong, P.Eng of PDM Technical Services Ltd. on Northwest facing cross-section. In addition to these wireframe solids, two surfaces were also considered, one representing the Canyon fault and the other representing the geological contact between the Intrusive rocks in the east with the Volcanic rocks in the west.
This geological interpretation was used to code the block model and develop 10 geological domains.
The Stockwork mineralization has been divided into three domains, East Stockwork Intrusive, West Stockwork Intrusive and Volcanic Stockwork Intrusive. Inside the East Stockwork, lies the Ruth and Moss Veins. The Moss Vein dips steeply to the south, while the Ruth Vein dips moderately to the north. Both veins are enveloped by the Stockwork style mineralization.
The drill hole assays were coded using the block model to assign the geological codes that were used to carry out the Exploratory Data Analysis and Variography.
Exploratory Data Analysis
Statistical and graphical summaries of the gold and silver grades were produced to understand the distribution of the grades in the deposit. The statistical and graphical summaries include histograms, log-probability plots, side-by-side boxplots, scatterplots, decile analysis plots and contact plots. The assays were separated by mineralised zone to examine the distribution of the gold and silver assay grades. The results of this analysis were used to develop the estimation parameters.
Composites
Analysis of the sample lengths shows that 87% of the assays inside the block model area are 5 ft in length. Compositing the drill hole assay intervals provides a common sample support for the estimation algorithm. The selected bench height for the block model is 20 ft and often a half bench height (10 ft) is a good choice for a composite length, as there is some variance reduction, but not too much, and there is a reduction in the number of data to be used by the estimation algorithm. Therefore, a 10 ft composite length was chosen for the estimation of gold and silver grades. The compositing started at the collar of the hole and proceeded at 10 ft regular intervals down the drill holes.
Density
A total of 506 specific gravity determinations were performed on drill core samples collected from material within the mineralized zones. These determinations were performed by ALS Chemex laboratory using unsealed immersion technique to measure the weight of each sample in air and in water (ALS Chemex standard OA-GRA08).
Previous work with the 506 SG determinations has shown that material within 40 ft of the surface has a lower dry bulk density of 2.51 g/cm and that material below 40 ft depth has a higher dry bulk density of 2.58 g/cm.
However, a tonnage factor of 12.35 cu-ft/short ton has been used by Moss Mine since the mine opened, and this factor has proven to be sufficiently accurate to be considered reliable in estimating the mined tonnage. This is equivalent to a dry density of 2.59 g/cm.
Consequently, for this mineral resource estimate, the QP for this section of the report recommends continuing the use of 12.35 cu-ft/short ton as the tonnage factor for estimating all in-situ tonnage estimated in the block model.
Block Model
A 3D block model was constructed using MineSight® 15.4 software with the dimensions shown in Table 14.10 in the Moss Mine Technical Report. The block size was chosen to reflect a potential selective mining unit (SMU) of 20 ft x 20 ft x 20 ft, given the anticipated open-pit mining scenario. The block model covers an area of approximately 10,000 ft by 4,000 ft in plan view, and approximately 2,200 ft vertically. The block model coordinates are in local coordinates, which are based on Arizona State Plane West Zone, 0203; UTM 12.
The estimation of gold and silver grades was carried out using ordinary kriging in MineSight® 15.4 software using a three-pass search strategy to use the most local 10ft composite data to a block location being estimated
Gold Grade Estimation Parameters
The following is a summary of the parameters used to estimate the block gold grades by domain in the block model.
Silver Grade Estimation Parameters
The following is a summary of the parameters used to estimate the block silver grades by domain in the block model.
Classification of Mineral Resources
To classify the block model grade estimates for the Moss Mine Project into the mineral resource categories of measured, indicated, and inferred, a statistical approach is employed to develop a classification scheme that complies with the CIM Best Practice Guidelines and NI 43-101 Regulations for the reporting of Mineral Resources and Mineral Reserves.
The underlying philosophy of this approach is to quantify the uncertainty of estimated contained metal in quarterly and yearly production. The uncertainty (or reliability) of estimation is a function of the spatial variability of the mineralization and the sample spacing.
Once the spatial variability of the mineralization is quantified through some type of spatial correlation function (semi-variogram, correlogram, etc.), it is possible to estimate the uncertainty of estimation for different sampling spacing and patterns over the two time periods.
A drill hole spacing study is carried out to determine the sample spacing and pattern that allows yearly production to be predicted to within 15% with a 90% confidence. This forms the basis for classifying indicated resources.
In a similar way the pattern and spacing are developed to form the basis for classifying measured resources.
For the Moss Mine Project, measured material is considered known within ±15% with a 90% confidence a quarterly production period, and indicated material is considered known within ±15% with a 90% confidence for an annual production period. The methodology considers an idealised block representing a one-month production period. Then a series of grids of different drill hole spacings are used to krige the idealized block to calculate the kriging variance. The idealized block for a one-month production period is approximately a panel of 430 ft by 430 ft by 20 ft. The kriging variance needs to be adjusted by the square of the CV to obtain a relative variance as normalized semi-vairogram models were used to krige the panel. The kriging variance is then divided by 3 to get the quarterly production variance and by 12 to get the annual production variance. This gives the sample spacing for the measured and indicated categories.
The sample spacing information is then translated into a set of proximity of drill hole sampling-based classification rules. A 75 ft by 75 ft drill hole spacing would be sufficient to predict the block grade estimates within ±15% 90% of the time on a quarterly basis. This material would be considered as measured. A 200 ft by 200 ft drill hole spacing would be sufficient to predict the block grade estimates within ±15% 90% of the time on an annual basis. This material would be considered as indicated.
The rules used to delineate the mineral resources are defined as follows:
Measured - minimum of 3 holes inside a 60 ft radius
Indicated - minimum of 3 holes inside a 160 ft radius or a minimum of 2 holes inside a radius of 80ft or a minimum of one hole inside a radius of 50 ft.
Inferred - are the remaining estimates up to 600 ft search radius.
The resulting codification of the block in the model was then smoothed looking for continuous clusters of blocks that are measured or indicated to remove any possible "spotted dog" effect. The "spotted dog" effect is the term used to describe isolated areas of measured or indicated material that is caused by the classification rules and isolated drill holes.
Summary statistics of the amount of data and distance to that data were generated to confirm the reliability of block gold grade estimates. Table 14.18 in the Moss Mine Technical Report displays summary statistics for the comparative confidence in the block model estimates including: the number of informed octants (NOCT), the number of drill holes used for a block estimate (NHOL), the number of composites used for a block estimate (NCMP), the distance to the nearest composite (NDIST), the average distances to the composites (ADIST), the distance to the farthest composite (FDIST), the kriging variance (OKVAR), the slope of regression (OKSLP) and the kriging efficiency (OKEFF).
A typical measured block gold grade estimate is informed by 16 composites from 5 drill holes in 5 octants with an average distance of 79.5 ft, kriging variance of 0.2176, a slope of regression of 0.9345, and a kriging efficiency of 68.4%.
A typical indicated block gold grade estimate is informed by 15 composites from 5 drill holes in 5 octants with an average distance of 140.3 ft, kriging variance of 0.3192, a slope of regression of 0.8791, and a kriging efficiency of 53.2%.
A typical inferred block gold grade estimate is informed by 9 composites from 3 drill holes in 3 octants with an average distance of 342.3 ft, kriging variance of 0.6835, a slope of regression of 0.4645, and a kriging efficiency of -8.4%.
Reasonable Prospects of Eventual Economic Extraction
To meet the CIM requirements of reasonable prospects of eventual economic extraction, an optimized pit shell was used to limit the mineral resources estimate at depth. A mineral resource pit shell limit was built by GVC using MineSight software by means of a Lerchs-Grossmann pit design method using the parameters listed in the table below. The pit ("solid PIT19 $2500 MII") was optimized using material classified as measured indicated and inferred.
Summary of Parameters for Mineral Resources Pit Resource Shell
| Description | Open Pit Shell |
| Mining Cost (US$/ton) | $3.18 |
| Mining Fill Cost (US$/ton) | $1.91 |
| Processing Cost (US$/ore ton) | $5.81 |
| G&A Cost (US$/ore ton) | $0.77 |
| Refinery Services and logistics Cost ($US/ore ton) | $0.28 |
| Gold Price (US$/oz) | $2,500 |
| Silver Price (US$/oz) | $29.20 |
| Royalties (%) | 0% |
| Gold Recovery Factor (%) | 75% |
| Silver Recovery Factor (%) | 33% |
| Pit Slope - Constant (degrees) | 55° |
| Breakeven Cut-off Grade (Au oz/ton) | 0.005 |
Mineral Resource Estimation Tabulation
The mineral resource estimate, having an effective date of December 18, 2025, was completed by Mr. Chris Keech, P.Geo., a Qualified person as defined in NI 43-101 and who is independent of Golden Vertex Corp., the limiting pit shell for the mineral resources estimate was developed by Mr. G. Vejar, Senior Mine Engineer of Mako. The open pit mineral resources are stated within the mineral resource pit shell and below the previously mined surface.
The measured and indicated mineral resources are inclusive of those mineral resources modified to produce mineral reserves. The mineral resource figures have been rounded to reflect that they are estimates. Mineral resources that are not mineral reserves do not have demonstrated economic viability. The estimate of mineral resources may be materially affected by environmental, permitting, legal, title, taxation, socio-political, marketing, or other relevant issues. The Qualified person for this section of the report is not aware of any issues that would materially affect the estimate of the mineral resources as of the date of this report.
There has been insufficient exploration to define the inferred resources as an indicated or measured mineral resources. It is uncertain if further exploration will result in upgrading them to an indicated or measured mineral resources category
The mineral resource pit shell was developed using the parameters listed in the table above.
The table below presents a summary of the open pit mineral resources inside the mineral resource pit shell at a series of cut-off grades. The breakeven gold cut-off grade is calculated by Golden Vertex to be 0.005 oz/ton Au.
The open pit mineral resources for the Moss Mine Project are estimated to be 62.9 Mtons of measured and indicated material grading 0.0103 oz/ton Au and 0.1081 oz/ton Ag for a total of 646 koz of gold and 6.8 Moz silver. There are additional inferred open pit mineral resources, which are estimated to be 13.6 Mtons grading 0.0090 oz/ton Au and 0.0427 oz/ton Ag for a total of 122 koz of gold and 0.58 Moz silver.
2025 Mineral Resource Estimate Sensitivity Analysis for a Series of Cut-Off Grades*
| Category | Cutoff oz/ton AuEq. |
k tons | AuEq oz/t |
Au oz/t |
Ag oz/t |
Au (koz) |
Ag (koz) |
| Measured | >= 0.0030 | 14,302 | 0.0093 | 0.0088 | 0.1091 | 126 | 1,560 |
| >= 0.0040 | 12,423 | 0.0102 | 0.0096 | 0.1203 | 119 | 1,494 | |
| >= 0.0050 | 10,527 | 0.0113 | 0.0106 | 0.1330 | 112 | 1,400 | |
| >= 0.0060 | 8,525 | 0.0126 | 0.0119 | 0.1489 | 101 | 1,269 | |
| >= 0.0070 | 6,696 | 0.0143 | 0.0135 | 0.1682 | 90 | 1,126 | |
| Indicated | >= 0.0030 | 67,370 | 0.0092 | 0.0087 | 0.0896 | 586 | 6,036 |
| >= 0.0040 | 60,133 | 0.0099 | 0.0094 | 0.0957 | 565 | 5,755 | |
| >= 0.0050 | 52,383 | 0.0107 | 0.0102 | 0.1031 | 534 | 5,401 | |
| >= 0.0060 | 44,282 | 0.0116 | 0.0111 | 0.1125 | 492 | 4,982 | |
| >= 0.0070 | 36,136 | 0.0128 | 0.0122 | 0.1251 | 441 | 4,521 | |
| Measured and Indicated |
>= 0.0030 | 81,672 | 0.0092 | 0.0087 | 0.0930 | 712 | 7,597 |
| >= 0.0040 | 72,556 | 0.0100 | 0.0094 | 0.0999 | 685 | 7,249 | |
| >= 0.0050 | 62,910 | 0.0108 | 0.0103 | 0.1081 | 646 | 6,801 | |
| >= 0.0060 | 52,807 | 0.0118 | 0.0112 | 0.1184 | 593 | 6,251 | |
| >= 0.0070 | 42,832 | 0.0130 | 0.0124 | 0.1318 | 531 | 5,647 | |
| Inferred | >= 0.0030 | 17,178 | 0.0081 | 0.0079 | 0.0404 | 136 | 694 |
| >= 0.0040 | 15,322 | 0.0087 | 0.0085 | 0.0417 | 130 | 639 | |
| >= 0.0050 | 13,587 | 0.0092 | 0.0090 | 0.0427 | 122 | 580 | |
| >= 0.0060 | 11,573 | 0.0099 | 0.0096 | 0.0440 | 111 | 509 | |
| >= 0.0070 | 9,280 | 0.0107 | 0.0105 | 0.0463 | 97 | 430 |
*Notes: Mineral resources are estimated in conformance with the CIM mineral resource definitions referred to in NI 43-101 Standards of Disclosure for Mineral Projects. This mineral resource estimate covers the Moss Mine Project. Mineral resources that are not mineral reserves do not have demonstrated economic viability. The quantity and grade of the reported inferred mineral resources in this estimation are conceptual in nature and are estimated based on limited geological evidence and sampling. Geological evidence is sufficient to imply but not verify geological and grade or quality continuity. For these reasons, an inferred mineral resource has a lower level of confidence than an indicated mineral resource, however it is reasonably expected that most of the inferred mineral resources could be upgraded to indicated mineral resources with continued exploration. Mineral resources are reported within an optimized constraining shell using a gold price of US$2,500/oz and a silver price of US$29.2/oz with a gold recovery of 75% and a silver recovery of 33%. Gold grades were estimated using 10ft capped composites within 10 geological domains using ordinary kriging. Summation errors may occur in the tabulated results due to rounding.
The table below presents a summary of the mineral resources inside the mineral resource pit shell at the 0.005 oz/ton Au cut-off by the mineral resource categories.
Summary of 2025 Mineral Resource Estimate by Classification Category*
| Category | Cut-off oz/ton AuEq. |
k tons | AuEq oz/t |
Au oz/t | Ag oz/t | Au (koz) |
Ag (koz) |
| Measured | 0.005 | 10,527 | 0.0113 | 0.0106 | 0.1330 | 112 | 1,400 |
| Indicated | 0.005 | 52,383 | 0.0107 | 0.0102 | 0.1031 | 534 | 5,401 |
| Measured + Indicated | 0.005 | 62,910 | 0.0108 | 0.0103 | 0.1081 | 646 | 6,801 |
| Inferred | 0.005 | 13,587 | 0.0092 | 0.0090 | 0.0427 | 122 | 580 |
*Notes: Mineral resources are estimated in conformance with the CIM mineral resource definitions referred to in NI 43-101 Standards of Disclosure for Mineral Projects. This mineral resource estimate covers the Moss Mine Project. Mineral resources that are not mineral reserves do not have demonstrated economic viability. The quantity and grade of the reported inferred mineral resources in this estimation are conceptual in nature and are estimated based on limited geological evidence and sampling. Geological evidence is sufficient to imply but not verify geological and grade or quality continuity. For these reasons, an inferred mineral resource has a lower level of confidence than an indicated mineral resource, however it is reasonably expected that most of the inferred mineral resources could be upgraded to indicated mineral resources with continued exploration. Mineral resources are reported within an optimized constraining shell using a gold price of US$2,500/oz and a silver price of US$29.2/oz with a gold recovery of 75% and a silver recovery of 33%. Gold grades were estimated using 10ft capped composites within 10 geological domains using ordinary kriging. Summation errors may occur in the tabulated results due to rounding.
Conclusions
Mako has acquired the Moss Mine Project out of bankruptcy and the updated resource estimate indicates that there are sufficient resources at the mine site for the operation along with good exploration potential in the immediate district from which to pursue secondary mining areas should further exploration prove the existence of economic mineralization.
The QP, William J. Lewis, Bsc., PGeo, notes that since the Oatman Mining District is well known for its production history, there should be further zones of economic mineralization waiting to be fully defined by well-run exploration programs given the recent sustained rise in metal prices.
Mako is also in the process of bringing the Moss Mine Project back into full production as it has been refining the geological database and the geological model along with test mining various areas since acquiring the Project. The current mineral resources will most likely be used as the basis upon which Mako revises the production mine plan as it looks to revive full production at the Moss Mine Project.
This report may disclose technical information, the presentation of which requires the QPs to derive sub-totals, totals and weighted averages that inherently involve a degree of rounding and, consequently, introduce a margin of error. Where these occur, the QPs do not consider them to be material.
Risks and Opportunities
All mineral resource projects have a degree of uncertainty or risk associated with them which can be due to technical, environmental, permitting, legal, title, taxation, socio-economic, marketing and political factors, among others. All mineral resource projects also present their own opportunities. The table below outlines some of the Moss Mine Project risks, their potential impact and possible means of mitigation. The table below also outlines some of the Moss Mine Project opportunities and potential benefits.
Risks and Opportunities at the Moss Mine Project
| Risk | Description and Potential Impact | Possible Risk Mitigation |
| Local grade continuity. | Poor grade continuity. | Further develop and extend the structural model to other areas on the Moss Mine Project. Use the structural model in designing the drilling programs. |
| Local density variability. | Misrepresentation of the in-situ tonnes, which also affects the in-situ metal content estimate. | It is recommended to develop a procedure of collecting density measurements spatially throughout the deposit at regular intervals and implement their use in future mineralization models. |
| Geologic Interpretation. | If geologic interpretation and assumptions (geometry and continuity) used are inaccurate, then there is a potential lack of gold grade or mineralization continuity. | Continue infill drilling to upgrade mineral inventory to the Measured and Indicated categories. |
| Void Locations. | If technical knowledge of the historic mine infrastructure is incomplete, then this deficiency could lead to local inaccuracies of the mineral resources and potential safety exposures | Conduct drilling and surveys to validate void locations and document intersected workings and refine void management plan. |
| Metallurgical recoveries might be overstated as they are based on limited testwork. | Gold recovery might be lower than what is currently being assumed. A lower recovery will increase the economic cut-off grade. | Conduct additional metallurgical tests. |
| Difficulty in attracting experienced professionals. | Technical work quality will be impacted and/or delayed. | Refine recruitment and retention planning and/or make use of consultants. |
| Conceptual mine plans are based on limited geotechnical testwork. | Mining methods and dimensions selected might be different than what is currently being assumed. | Incorporate more comprehensive geotechnical data from drilling. Conduct additional geotechnical assessment and analysis. |
| Opportunities | Explanation | Potential Benefit |
| Surface and underground exploration drilling. | Potential to identify additional prospects and mineral resources. | Adding mineral resources increases the economic value of the mining project. |
| Potential improvement in metallurgical recoveries. | Additional metallurgical testwork can be performed to determine if recovery can be improved through ore sorting, flotation or cyanidation. | Lower capital and operating costs. |
| Potential improvement in mining assumptions. | Geotechnical analysis may determine mining methods and dimensions can be improved. | Improved mining assumptions may lower costs and reduce the cut-off grade for the mineral resource estimation. |
Budgets and Recommendations
Mine Geology/Exploration Budget
The current pits will require laybacks to access the additional resources that have been identified. It is recommended to complete a diamond drilling campaign and collect geotechnical information from several key areas and complete a geotechnical assessment of the pits. In addition, detailed mapping of the core is recommended, especially in the Reynolds pit area to determine the geologic controls at Reynolds. This logging should be augmented with a core scanning method to collect hyperspectral information which can be used in the regional exploration program. The recommended budget for the mine geology and exploration program is summarized in the table below.
Budget Summary for the Moss Mine Geology and Exploration Program
| Description | Cost $ US | ||
| Drilling Costs | Sub-Total: | $778,185 | |
| Mobilization and De-mobilization | $30,000 | ||
| Direct Drilling Costs (4,650 ft @ $67/ft) | $311,085 | ||
| Drilling Support Costs (estimate/foot = $94) | $437,100 | ||
| Geotechnical Study Phase 1 | Sub-Total: | $38,065 | |
| Site Visit | $11,049 | ||
| Representative Field Mapping | $11,329 | ||
| Reporting | $12,624 | ||
| Administration and Project Management | $3,063 | ||
| Geotechnical Study Phase 2 | Sub-Total: | $172,001 | |
| Geotechnical Core Logging | $44,803 | ||
| Televiewer Processing/Reconciliation | $10,428 | ||
| Laboratory Testing Program | $17,568 | ||
| Develop and Update Geotechnical model | $29,726 | ||
| Geotechnical Analysis | $31,539 | ||
| Preparation of Report | $31,666 | ||
| Administrative and Project Management | $6,271 | ||
| Total: | $988,251 | ||
Regional Exploration Budget
The regional geology at the Moss Mine Project is very permissive of the potential to make multiple, additional discoveries. Systematic exploration of the large land package at the Moss Mine Project will require multiple years of phased exploration programs. The initial program should consist of detailed geological mapping and sampling of outcropping vein/ breccia zones using multi-element geochemistry. During this program, samples should be taken for hyperspectral analysis. Target areas should be prioritized by sample results and proximity to the mine. Data should be entered into an Access database.
Once several targets have been identified they should be drilled in a Phase 1 drilling program, then depending on results, advance to a more detailed drilling program in Phase 2.
Regional Exploration Recommended Budget - Phase 1
| Description - Phase 1 | Cost $ US | ||
| Phase 1 Target Definition | Sub-Total: | $108,000 | |
| Modeling & Mapping - Geological Consulting | $50,000 | ||
| Access Database | $8,000 | ||
| Hyperspectral Scanning | $50,000 | ||
| Phase 1 Direct Drilling Costs | Sub-Total: | $668,050 | |
| Environmental & Safety | $1,361 | ||
| Direct Diamond Drilling Cost | $571,494 | ||
| Laboratory - Assays | $58,974 | ||
| Upgrade Core Logging & Storage Facility | $32,100 | ||
| Welding, Compressor etc. | $4,121 | ||
| Phase 1 Drilling Support | Sub-Total: | $212,160 | |
| Workforce (Consultants) | $156,000 | ||
| Travel Expense - Airfare, Rail, Mileage | $19,999 | ||
| Site Preparation | $34,961 | ||
| Machinery & Equipment Maintenance | $480 | ||
| Mechanical Parts - By Inventory | $720 | ||
| Phase 1 Office Costs | Sub-Total: | $30,041 | |
| Office Logistics & Supplies | $30,041 | ||
| Phase 1 Sub-Total: | $1,018,251 | ||
Regional Exploration Recommended Budget - Phase 2
| Description - Phase 2 | Cost $ US | ||
| Phase 2 Direct Drilling Costs | Sub-Total: | $953,925 | |
| Environmental & Safety | $2,041 | ||
| Direct Diamond Drilling Cost | $857,241 | ||
| Laboratory - Assays | $88,462 | ||
| Welding, Compressor etc. | $6,181 | ||
| Phase 2 Drilling Support | Sub-Total: | $318,240 | |
| Workforce (Consultants) | $234,000 | ||
| Travel Expense - Airfare, Rail, Mileage | $29,999 | ||
| Site Preparation | $52,441 | ||
| Machinery & Equipment Maintenance | $720 | ||
| Mechanical Parts - By Inventory | $1,080 | ||
| Phase 2 Office Costs | Sub-Total: | $45,061 | |
| Office Logistics & Supplies | $45,061 | ||
| Phase 2 Sub-Total: | $1,317,226 | ||
| Total Phase 1 + Phase 2 | $2,335,477 | ||
The budget presented in the above three tables summarize Mako's estimated costs for completing the work at the Moss Mine Project as well as potentially two phases of regional exploration program.
It is the opinion of the QPs that all of the recommended work is warranted and that only the location of the actual drilling needs to be re-evaluated, as assay results are obtained from the drilling as the program progresses. The QPs appreciate that the nature of the programs and expenditures may change as further studies are undertaken, and that the final expenditures and results may not be the same as originally proposed. The QPs believe that the second phase of the regional exploration may change depending on the results obtained during the first phase of drilling and that Mako revisits the estimated budget for the second phase prior to execution of the second phase.
The QPs are of the opinion that the recommended work program and proposed expenditures are appropriate and well thought out. The QPs believe that the proposed budget reasonably reflects the type and amount of the contemplated activities, at this time.
Further Recommendations
In addition to the above exploration and drilling programs at the Moss Mine Project and regionally the QPs make the following recommendations:
1) Continue to conduct infill and exploration drilling at the Moss Mine Project and update the resource estimates as drill campaigns are completed.
2) Conduct periodical Acid-Base testing to ensure there is no acid drainage issues at the Moss Mine Project and any secondary mineralized zones that are subject to exploration.
3) Conduct further metallurgical testwork on any secondary mineralized zones that are subject to exploration as various zones may have different recoveries based upon the mineralization found within each zone.
Exploration, Development and Production
Exploration
Since the property was acquired by Mako there has been limited exploration consisting of some field mapping and sampling to the east of the Moss mine. Mako plans to continue mapping, sampling and data compilation outside of the mine area to identify drill targets.
Development
During the period December 1, 2025, to March 31, 2026, Mako moved the haul road in the Central pit enabling mining to resume in this pit and continued to move towards steady state production.
Production
During the period December 1, 2025, to March 31, 2026, the Moss Mine extracted a total of 1,918,195 tonnes of which 686,347 tonnes were mineralized and this resulted in placing 6,546 ounces of gold and 41,261 ounces of silver on the leach pad.
Mt. Hamilton Project
The following summary is extracted in part from, and qualified in its entirety with reference to, the full text of the technical report entitled "NI 43-101 Technical Report on the Mt. Hamilton Property, White Pine County, Nevada, USA" with an effective date of November 10, 2025 and a report date of November 17, 2025 (the "Mt. Hamilton Technical Report") prepared by Mr. Michael B. Dufresne, M.Sc., P.Geol., P.Geo. and Mr. Andrew J. Turner, B.Sc., P.Geol., P.Geo. both Principals and Senior Consulting Geologists with APEX; Mr. David Frost, FAusIMM, Vice President Process Engineering, DRA; and Mr. James N. Gray, P. Geo., Advantage Geoservices. The Qualified persons have no affiliations with Mako, or their subsidiaries, except that of independent consultant/client relationships. Readers are encouraged to review the full text of the Mt. Hamilton Technical Report, available for review under the Company's profile on SEDAR+ at www.sedarplus.ca. All capitalized terms not otherwise defined in this summary are defined in the Mt. Hamilton Technical Report. See "Interests of Experts".
Property Location, Description, and Access
The Property is comprised of two parcels of fee simple land totaling 240 acres (ac), nine surveyed patented mining claims, totaling 121.376 ac, and 302 unpatented federal mining claims totaling approximately 4,530 ac. The mining claims are located in Sections 5, 6, 7, 8, 9, 10, 15, 16, 17, 18, 20, 21, 22, 27, 28, 29, 33 and 34, Township 16 North, Range 57 East, Mount Diablo Meridian, White Pine County, Nevada. The fee parcels are located within Sections 19 and 20 of that same township. The holding costs for the Mt. Hamilton Property in 2025 totaled $687,126.48 including taxes, BLM fees and various Lease payments.
The Mt. Hamilton Property is owned by MH-LLC, a limited liability corporation registered in the state of Nevada. The MH-LLC land position consists of both private property (fee lands and patented mineral claims) and unpatented mining claims on federal (public) land. MH-LLC controls the Property through direct ownership and through various lease agreements. The Property is subject to a number of royalty obligations discussed below.
GAMI (Monte) Royalty
Pursuant to an Option Agreement dated September 8, 2011, by and between Great American Minerals, Inc. (GAMI) and MH-LLC, GAMI retained a 3% NSR royalty on all gold and silver and a 2% NSR on all other minerals and ores produced from the Monte Claims (the GAMI Royalty). The GAMI Royalty also imposes an annual advance royalty payment of the greater of (i) $33,000 or (ii) the cash equivalent of 33 ounces of gold based on the average gold price for the 30 days preceding the payment due date. This advance royalty is payable each year until the first day of the month following expiration of the first consecutive three-month period within which milling or leaching (or other treatment) of ores produced from the Monte Claims has yielded concentrate of commercial doré. All advance royalties paid are recoverable as a credit against the GAMI Royalty. As of December 31, 2025, MH-LLC has paid $1,090,261.55 in advance royalty payments. The GAMI Royalty is currently payable to Osisko Mining (USA) Inc. The GAMI Royalty rate can be reduced within one year after MH-LLC completes a bankable feasibility study or commences commercial production to 1% on all minerals by paying the royalty holder $2,000,000.
Sandstorm Royalty
Pursuant to a NSR Royalty Agreement dated June 11, 2012, by and among Solitario, MH-LLC and Sandstorm Gold Ltd. (Sandstorm), and an Agreement Regarding Additional Property of the same date by and among the same parties, Sandstorm received or is entitled to receive a 2.4% NSR royalty on any gold and silver (or other products) mined from 266 of the Property's 302 unpatented mining claims, from all 9 of the Property's patented mining claims, and from the Henkle-Buchanan Parcel, which properties are located in various sections of Township 16 North, Range 57 East, Mount Diablo Meridian (the "Sandstorm Royalty").
Henkle-Buchanan Royalty
Pursuant to a NSR Royalty Agreement dated January 27, 2012, by and between MH-LLC and Henkle- Buchanan Group (HBG), HBG received a 1.5% NSR royalty on the Henkle-Buchanan Parcel comprising the SE4 of Section 20, Township 16 North, Range 57 East, Mount Diablo Meridian (the Henkle-Buchanan Royalty).
Sailfish Royalty
On September 30, 2025, it was announced that Mako Mining and Sailfish entered into a binding term sheet to acquire the Mt. Hamilton Property through acquisition of MH-LLC. Sailfish will acquire MH-LLC from a third party pursuant to a purchase agreement dated September 27, 2025, and subsequently transferring MH-LLC to Mako in exchange for a five-year gold stream and a 2 per cent (%) NSR Royalty. Effective February 14, 2026, Mako entered into an Amended and Restated Purchase and Sale Agreement, a Termination Agreement in connection with the Royalty and an Amended and Restated Gold Purchase Agreement in connection with amending the consideration payable for the acquisition of MH-LLC , including terminating the Royalty and enter into an additional 72 month gold stream. See "General Development of the Business - Three Year History".
The Mt. Hamilton Property is located approximately equidistant from the communities of Eureka (to the west) and Ely (to the east). Access to the site from these communities is about an hour by car along paved and gravel roads. The primary access to the site is south from U.S. Highway 50 traveling approximately 10 miles (mi) south along White Pine County Road 5, then east along the Seligman haul road approximately 5 mi to the Property site. On the Property, the main haul road, and some additional roads from the former mine, remain open. All roads off U.S. Highway 50 are gravel.
Geological Setting, Mineralization and Deposit Types
Regional Geology
The Mt. Hamilton Property is located within the White Pine Mining District of the White Pine Mountain Range. The range is underlain by a thick sequence of Paleozoic strata consisting predominantly of shallow marine carbonate and clastic rocks ranging in age from Cambrian through Permian. Paleozoic strata are overlain locally by Tertiary volcanic rocks, volcaniclastic strata, and younger sedimentary rocks. The only exposures of plutonic rocks in the White Pine Range are two granitic stocks of Cretaceous age, the Seligman and Monte Cristo stocks, which are both present on the Property.
The area has undergone several complex deformational events forming the north-striking Hoppe Spring anticline, along which the main portion of the deposit is located, and the Silver Bell anticline to the southwest.
Property Geology
Within the Property area, shales and calcareous shales are altered to fine-grained, pale green, diopsidequartz-potassium feldspar hornfels assemblages proximal to the Seligman stock. This assemblage grades outward to zones dominated by calcite-tremolite-diopside-potassic feldspar ± silica, followed by an outermost fine-grained biotite-quartz hornfels. Skarn assemblages overprint and crosscut the hornfels. The transition is marked by increasing iron content in the pyroxene and the formation of andraditic garnet.
Epithermal alteration within the Property area varies in intensity and occurrence, and includes argillization, propylitization, and the presence of quartz veins. Localized zones of argillic alteration occur along the margins of the stock, along faults throughout the stock, and in association with late dikes. Within the igneous units, argillic alteration is characterized by feldspar minerals altered to kaolinite and montmorillonite. Propylitic alteration is additionally associated with the intrusive units but is typically more pervasive than the argillic alteration. Propylitic alteration is characterized by mafic minerals of the stock and dikes altered to chlorite, epidote, and calcite. Quartz and calcite veins less than (<) 1 to 2 feet (ft) thick and containing minor gold and silver grades, are associated with the epithermal alteration and occur at the Seligman, Centennial, and Seligman Stock (Igneous) deposits.
Mineralization
Mineralization at Mt. Hamilton is characterized by an early polymetallic molybdenum-copper-tungsten (± gold-silver) skarn-related phase and a late gold-silver epithermal overprint. Gold and silver mineralization at Mt. Hamilton predominantly intersected from surface to a depth of 730 ft, occurs within a broad north trending zone of anomalous gold and is hosted in three contiguous deposits known as Seligman, Seligman Stock (Igneous), and Centennial. High- and low-angle faults along with skarn assemblages developed along lithologic contacts are interpreted as the main controls to mineralization. Gold and silver are predominantly hosted within garnet-pyroxene and pyroxene-tremolite-quartz-potassic assemblages, and quartz veins. Gold predominantly occurs as free gold, in association with sulfide minerals (pyrite and arsenopyrite), in association with oxide minerals (hematite and goethite), disseminated with clay, and encapsulated within quartz. Myers et al. (1991) observed that sulfide-sulfosalt-bearing quartz veins cut both the skarn and stock and are closely associated with retrograde skarn zones. The veins vary in thickness from <1 to 30 ft and are continuous over an area measuring 2,000 by 4,500 ft. These quartz veins may be gold-silver-bearing and contain sphalerite, galena, pyrite, covellite, bornite, stibnite, chalcopyrite, iron oxides, and minor tetrahedrite, bournonite and jamesonite.
Seligman Deposit
Precious metal mineralization at Seligman is laterally continuous and spans an area approximately 3,400 ft long, 2,000 ft wide and extends to a depth of 530 ft, though it is more commonly <100 ft below surface. The deposit has an overall shallow plunge (15 degrees (º)) to the north. Mineralization is interpreted to be controlled by skarn developed along the contact between the Hamburg Dolomite and Dunderberg Shale and by high-angle faults.
Centennial Deposit
Gold and silver mineralization at Centennial is laterally continuous and spans an area of 2,400 ft long, 1,600 ft wide, and extends to a depth of 730 ft below surface. Mineralization is hosted by skarn and hornfels units within the Secret Canyon and Dunderberg Shale. Intense mineralization typically occurs at the contact between the different units. Gold mineralization is typically associated with a sub-horizontal (10º to 20º), laterally continuous, highly oxidized, and variably silica altered and brecciated zones. The zone has a shallow dip to the south-southeast and has been interpreted to be controlled by a low-angle structure by previous workers. The zones are dominated by goethite-quartz assemblages and represent "Type 2" retrograde alteration.
Seligman Stock (Igneous) Deposit
Gold and silver mineralization within the Seligman Stock (Igneous) is laterally continuous over an area approximately 4,200 ft long, 1,400 ft wide, and on average extends to a depth of 450 ft below surface. Mineralization is hosted within the endoskarn, along structures, veins, and breccias within the main stock. The mineralized zone transitions from sub-horizontal in the northern portion of the stock, to shallowly east dipping (25º) in the central portion, to shallowly west-dipping (10 º to 15º) in the southern portion. The deposit has an overall shallow plunge (15 º) to the north.
Historical Exploration
The Mt. Hamilton site has a long history of precious and base metal mineral exploration and development dating back to 1865 and the discovery of gold at Monte Cristo Springs and silver at Treasure Hill-Hamilton area in 1868.
The most recent mining was completed by Rea Gold Corp. ("Rea Gold") in 1994 with production from the Seligman deposit. Rea Gold ceased mining in June 1997 but continued leaching until declaring bankruptcy in Canadian Bankruptcy Court in November 1997. During this period an approximate total of 99,500 oz Au and 207,500 oz Ag were produced via a heap leach operation.
The table below outlines the Exploration history at Mt. Hamilton for gold, tungsten copper and molybdenum.
|
Year |
Um. |
Summary of Exploration |
|
1865 |
Unknown |
• Gold discovered at Monte Cristo Springs in 1865. • Silver discovered at Treasure Hill-Hamilton area in 1868. |
|
1956 |
Unknown |
• An unknown company completed four churn holes (1,720 ft). |
|
1956-1989 |
Union Carbide Corp. ("Union Carbide") |
• Conducted exploration for W-Cu-Mo mineralization. • Drilled 72 core holes - including partial mud rotary and reverse circulation pre-collars (84,994 ft), and one mud rotary (1,240 ft). |
|
1968-1982 |
Phillips |
• Conducted exploration for W-Cu-Mo mineralization. • Drilled 24 RC holes (9,050 ft), 51 core holes (80,981.5 ft), and one unknown hole type (275 ft). • Conducted pre-feasibility study (historical) on the Mt. Hamilton Tungsten project. |
|
1984-1993 |
Northern Illinois Coal, Oil and Resources Mineral Ventures ("NICOR") / Westmont |
• NICOR renamed to Westmont Gold Inc. (Westmont). Westmont entered into joint venture with Phillips and Queenstake Resources Ltd to explore for open-pit mineable Au/Ag mineralization. • 1989 Westmont identifies Seligman and Centennial Au/Ag deposits. 1993 property transferred to MHMC, a Westmont subsidiary. • Drilled 338 RC holes (128,173 ft) and 37 core holes (12,852.7 ft). • Historical resource estimate completed by Pincock, Allan and Holt. • Conducted soil/rock sampling over property. • Completed Feasibility Study Update in 1991 (historical). |
|
1994-1997 |
Rea Gold |
• Acquired MHMC and began production of Seligman deposit. Production ceased in June 1997 due to operational issues and low gold prices, and Rea Gold filed for bankruptcy (in Canada) in November 1997. • MHMC forced into bankruptcy when the State of Nevada rescinded their cyanide permit. • Drilled 507 RC holes (139,626 ft), six core holes (2,386 ft), and 10 conventional-BH holes (850 ft). • Zonge conducted IP/Resistivity survey in 1994. • Conducted additional soil/rock sampling. • Mineral Resources Development Inc. (MRDI) completed 58 density determinations from four core holes. • Mine Reserves Associates completed Model and Mine Planning report. |
|
2002 |
US Bankruptcy Trustee |
• Failed to pay annual claim maintenance fees for unpatented lode claims within Property. Claims lapsed. |
|
Year |
Um. |
Summary of Exploration |
|
2002-2003 |
Centennial |
• Staked unpatented lode claims covering Centennial Deposit and purchased all patented mining claims and Fee lands though a US Bankruptcy Court process. |
|
2003-2007 |
Augusta |
• Acquired leasehold interest in property from Centennial through its 100% owned subsidiary Diamond Hill Minerals. • Drilled six core holes (9,187.4 ft). • Roscoe Postle Associates ("RPA") prepared NI 43-101 Technical Report for Augusta (Wallis et al., 2005). |
|
2007-2008 |
Ivanna (Ely Gold & Silver, Inc.) |
• Acquired 100% of shares of Diamond Hill Minerals and changed name to Ely Gold & Minerals, Inc ("Ely" in 2008. • Drilled five core holes (2,241 ft). • RPA prepared NI 43-101 report for Ivana. |
|
2010-2014 |
Solitario Exploration & Royalty Corp (Solitario) |
• Signed Letter of Intent with Ely Gold to earn up to an 80% interest in Ely's Mt. Hamilton gold Property in August 2010. In December 2010 Solitario and Ely Gold enter into an LLC Operating Agreement and form Mt. Hamilton LLC (MH-LLC) which holds 100% of the Mt. Hamilton property assets. In November 2013 Ely Gold makes final payments pursuant to the Augusta Agreement. • Drilled 48 RC holes (20,365 ft) and 26 core holes (12,049.9 ft). • SRK completed a PEA on Centennial deposit in 2009 (SRK Consulting, 2009; historical), followed by a resource update on Centennial and Seligman deposits in 2012 (SRK Consulting, 2012; historical). • SRK completed a feasibility study (historical) on Centennial and Seligman deposits in 2014 (SRK Consulting, 2014). • SRK completed 22 bulk density determinations from nine core holes. |
|
2015 |
Waterton Precious Metals Bid Corp |
• Waterton Global Resources acquired the Mt. Hamilton Property from Solitario and Ely Gold in November of 2015. Waterton Nevada Splitter, LLC (WNS) acquired 100% of the membership interests of MH-LLC on June 30, 2016. |
In addition to the gold targets, the Mt. Hamilton Property hosts a skarn-related tungsten-copper-molybdenum target defined by 10,000 ft of historical drilling. The tungsten target is situated below, and is independent of, the Mt. Hamilton MRE. Tungsten is listed in the United States Geological Survey (USGS) 2025 draft list of critical minerals (United States Geological Survey, 2025). Tungsten is a critical metal with uses in the national security, defense, and advanced industrial applications. Early skarn-related tungsten-copper-molybdenum mineralization has not been explored since 1984 and remains an upside opportunity.
Production History
The table below provides a summary of the known production history at Mt. Hamilton.
| Year | Company | Comment |
| 1868-1878 | Unknown | $20 to $40 million silver recovered from Treasure Hill ($25-$51 million)1 |
| 1995 | Rea Gold | 52,000 oz Au, 100,000 oz Ag |
| 1996 | Rea Gold | 35,000 oz Au, 71,500 oz Ag |
| 1997 | Rea Gold | 12,500 oz Au, 36,000 oz Ag |
| 1 Calculated from average Au/Ag ratio between 1868-1878 of 16.32 with Au price of $20.67/oz (Officer and Williamson, 2020) | ||
Historical Estimates
The following table summarizes historical Mineral Resource and Mineral Reserve Estimates for the Property calculated by previous operators between 2005 and 2014. The historical MREs and reserves summarized in this section were calculated by Scott Wilson Roscoe Postle & Associates ("RPA") in 2008, and SRK Consulting ("SRK") in 2009, 2010, 2012, 2014 (Kaunda, 2012; Pennington et al., 2012, 2014).
The historical estimates summarized in the Table below were prepared by previous operators in accordance with the version of the CIM Definition Standards for Mineral Resources and Mineral Reserves in effect at the time of resource estimation and disclosed in accordance with National Instrument 43-101 Standards of Disclosure for Mineral Projects. However, most of the historical MREs and reserves were calculated prior to the implementation of the standards set forth in NI 43-101 and CIM Definition Standards for Mineral Resources and Mineral Reserves (May 2014) and CIM Estimation of Mineral Resources & Mineral Reserves Best Practices Guidelines (November 2019). Mr. Turner has reviewed the information in this section, as well as that within the cited references, and has determined that it is suitable for disclosure.
Mr. Turner has not done sufficient work to classify any of the historical estimates discussed in this section as current Mineral Resources or Mineral Reserves. Mr. Turner has referred to these estimates as "historical resources" and the reader is cautioned not to treat them, or any part of them, as current Mineral Resources or Mineral Reserves. The historical resources summarized below have been included in this Report to demonstrate the mineral potential of the Property, and to provide the reader with a complete history of the Property. These historical resource estimates were not completed by Mako Mining or Sailfish. Mako Mining and Sailfish are not treating the historical estimates as current mineral resources.
A current Mineral Resource Estimate prepared in accordance with NI 43-101 and CIM guidance for Mt. Hamilton is presented below in this document and supersedes the historical MREs summarized in this section.
| Author | Year | Cut-Off Grade (opt Au) |
Tons ('000s) |
Grade (opt Au) |
Contained Au (oz) |
Grade (opt Ag) |
Contained Ag (oz) |
Resource Classification |
Estimation Method |
Block Size (ft) |
Capping (opt Au) |
Sample Selection (min, max, max per hole) |
Comp-osite Length (ft) |
Classification Range |
| RPA | 20081 | 0.016 | 12,300 | 0.034 | 415,200 | 0.177 | 2,175,000 | Inferred | OK | 25x25x10 | 0.36 (samples) | Unknown | 10 | Inferred: > 50 ft from single hole with one composite |
| SRK | 20092 | 0.009 | 760 | 0.039 | 29,640 | 0.130 | 98,800 | Measured | ID3 | 25x25x10 | 0.36 (samples) | 2,8,2 | 10 | Measured: <25 min 8 comps; Indicated: ≤ 90, ≥ 2 comps; Inferred: <50, <2 comps |
| 11,857 | 0.030 | 355,710 | 0.145 | 1,719,265 | Indicated | |||||||||
| 12,617 | 0.031 | 385,350 | 0.144 | 1,818,065 | Measured and Indicated | |||||||||
| 1,491 | 0.012 | 17,892 | 0.122 | 181,902 | Inferred | |||||||||
| SRK | 20103 | 0.0065 | 823 | 0.037 | 30,000 | 0.129 | 106,000 | Measured | ID3 | 25x25x10 | 0.36 (samples) | 2,8,2 | 10 | Measured: <25 min 8 comps; Indicated: ≤ 90, ≥ 2 comps; Inferred: <50, <2 comps |
| 13,534 | 0.028 | 379,000 | 0.153 | 2,071,000 | Indicated | |||||||||
| 14,357 | 0.029 | 409,000 | 0.152 | 2,177,000 | Measured and Indicated | |||||||||
| 3,369 | 0.01 | 34,000 | 0.129 | 435,000 | Inferred |
| Author | Year | Cut-Off Grade (opt Au) |
Tons ('000s) |
Grade (opt Au) |
Contained Au (oz) |
Grade (opt Ag) |
Contained Ag (oz) |
Resource Classification |
Estimation Method |
Block Size (ft) |
Capping (opt Au) |
Sample Selection (min, max, max per hole) |
Comp-osite Length (ft) |
Classification Range |
| SRK | 2012 | 0.006 | 9234 | 0.032 | 29,300 | 0.155 | 142,700 | Proven | Lerchs-Grossman pit optimization | |||||
| 21,6044 | 0.021 | 457,800 | 0.134 | 2,884,300 | Probable | |||||||||
| 22,5274 | 0.022 | 487,100 | 0.134 | 3,028,200 | Proven and Probable | |||||||||
| 9185 | 0.032 | 29,524 | 0.155 | 142,152 | Measured | ID2 | 20x20x20 | 0.36 (samples) | 3,2,2 | 20 | M&I: Min 3 comps, Max 2 comps/hole; Inferred: Min 2 comps, Max 2 comps/hole | |||
| 22,7325 | 0.022 | 497,330 | 0.132 | 3,010,471 | Indicated | |||||||||
| 23,6505 | 0.022 | 526,854 | 0.133 | 3,152,624 | Measured and Indicated | |||||||||
| 3,4545 | 0.018 | 60,859 | 0.079 | 273,457 | Inferred | |||||||||
| 6,9506 | 0.022 | 154,388 | 0.097 | 676,665 | Indicated | ID2 | 20x20x20 | Skn/Ox - 0.50; Skn/Sulf - 0.27; All Intrusives - 0.10 (samples) | 2,8,1 | 20 | Indicated: min two drillholes, 100 ft; Inferred: Min one hole, 200 ft | |||
| 3,7706 | 0.021 | 78,044 | 0.144 | 543,671 | Inferred | |||||||||
| SRK | 20147,8 | 0.006 | 1,240 | 0.029 | 36,600 | 0.198 | 245,800 | Proven | Lerchs-Grossman pit optimization | 20x20x10 | Varies by mineral domain from 0.06 to 0.56 | Min (4,3,1) varied based on search ellipse range, 8, 1 | 10 | Measured: ≤ 50 ft, min 3 comps from 3 holes; Indicated: ≤ 120, min 2 comps from 2 holes; Inferred: ≤ 350, min 1 comp |
| 21,260 | 0.024 | 508,800 | 0.198 | 4,213,800 | Probable | |||||||||
| 22,500 | 0.024 | 545,400 | 0.198 | 4,459,600 | Proven and Probable | |||||||||
| 1,427 | 0.030 | 42,000 | 0.209 | 299,000 | Measured | ID2 ID2 |
||||||||
| 32,283 | 0.021 | 685,000 | 0.194 | 6,271,000 | Indicated | |||||||||
| 33,710 | 0.022 | 727,000 | 0.195 | 6,569,000 | Measured and Indicated | |||||||||
| 6,721 | 0.018 | 119,000 | 0.171 | 1,153,000 | Inferred |
111 | Page
| Author | Year | Cut-Off Grade (opt Au) |
Tons ('000s) |
Grade (opt Au) |
Contained Au (oz) |
Grade (opt Ag) |
Contained Ag (oz) |
Resource Classification |
Estimation Method |
Block Size (ft) |
Capping (opt Au) |
Sample Selection (min, max, max per hole) |
Comp-osite Length (ft) |
Classification Range |
| 1 Historical Resource for the Centennial deposit was based on assumptions of $5/ton trucking and processing costs, 75% metallurgical recovery, and $400/oz Au. 2 Historical Resources for the Centennial deposit contained within an economic pit. WhittleTM v.4.1.3 software used to generate a Lerchs Grossman pit optimization using US$ 750/oz Au, US$ 10/oz Ag, $1.75/ton mining, $3.50/t processing, $0.75/t G&A, 70% Au recovery, 40% Ag recovery, 5.5% NSR. 3 Historical Resources for the Centennial deposit contained within an economic pit. WhittleTM v.4.1.3 software used to generate a Lerchs Grossman pit optimization using US$ 900/oz Au, US$ 15/oz Ag, $1.75/ton mining, $3.50/t processing, $0.75/t G&A, 75% Au recovery, 40% Ag recovery. 4 Historical Reserves for Centennial deposit defined using WhittleTM pit optimization software at US$1,200/oz Au, US$ 20/oz Ag, average Au and Ag recovery of 75%; operating costs of $1.75/t mineralized material mined, $1.61/t waste mined, $3.59/t mineralized material processed, and $0.72/t G&A. Source: Kaunda (2012). 5 Historical Resources for Centennial deposit contained within an economic pit. WhittleTM v.4.1.3 software used to generate a Lerchs Grossman pit optimization using US$ 1600/oz Au, US$ 40/oz Ag, $5.81/ton for mining, processing, and G&A, 75% Au recovery, 30% Ag recovery, 1% NSR. Source: Kaunda (2012). 6 Historical Resources for Seligman deposit contained within an economic pit. WhittleTM v.4.1.3 software used to generate a Lerchs Grossman pit optimization using US$ 1500/oz Au, US$ 20/oz Ag, $6.45/ton for mining, processing, and G&A, 70% Au recovery in skarn, 65% Au recovery in igneous, and 35% Ag recovery, 3.4% NSR. Source: Kaunda (2012). 7 Historical Reserves for Centennial and Seligman deposits combined. Lerch Grossman pit optimization based on US$ 1,300/oz Au, US$ 20/oz Ag, 76% Au recovery, 39% Ag recovery. Source: Pennington et al. (2014). 8 Historical Resources for Centennial and Seligman deposits combined. Lerch Grossman pit optimization based on US$ 1,300/oz Au, US$ 19.60/oz Ag, 76% Au recovery, 39% Ag recovery, US$ 2.06/t mining cost for Seligman, US$ 1.64/t mining cost Centennial, US$ 4.95/t processing cost. Source: Pennington et al. (2014). |
||||||||||||||
Source: Compiled by APEX (2025)
Exploration
Mako has not conducted any exploration on the Mt. Hamilton property.
Drilling
MH-LLC has not conducted any drilling at the Property, and no drilling has been conducted since 2012. The Mt. Hamilton drillhole database (as of October 4, 2020) contains 1,138 holes, predominantly RC and core, totaling 507,611.5 ft (excludes 20 holes totaling 11,013.2 ft with no collar coordinate details). A nominal drillhole spacing is approximately 135 ft for the Seligman deposit, and 100 ft for the Centennial deposit.
The table below provides a summary of the historical drilling completed on the property.
| Core* | RC | Mud Rotary | Churn or Unknown1 Type |
Blast | Total | ||||||||
| Year(s) | Company | No. | Footage | No. | Footage | No. | Footage | No. | Footage | No. | Footage | No. | Footage |
| 1956 | Unknown | 4 | 1,720.0 | 4 | 1,720.0 | ||||||||
| 1956-1989 | Union Carbide | 72 | 84,994.4 | 1 | 1,240.0 | 73 | 86,234.4 | ||||||
| 1973-1984 | Phillips | 51 | 80,981.5 | 24 | 9,050.0 | 11 | 275.01 | 76 | 90,306.5 | ||||
| 1984-1994 | Westmont | 37 | 12,852.7 | 338 | 128,173.0 | 375 | 141,025.7 | ||||||
| 1994-1997 | Rea Gold | 6 | 2,386.0 | 507 | 139,626.0 | 10 | 850.0 | 523 | 142,862.0 | ||||
| 2006-2007 | Augusta | 6 | 9,187.4 | 6 | 9,187.4 | ||||||||
| 2008 | Ely Gold | 5 | 2,241.0 | 5 | 2,241.0 | ||||||||
| 2010-2012 | Solitario | 26 | 12,049.9 | 48 | 20,365.0 | 74 | 32,414.9 | ||||||
| Unknown | Unknown | 2 | 1,620.0 | 2 | 1,620.0 | ||||||||
| Total | 203 | 204,692.9 | 919 | 298,834.0 | 1 | 1,240.0 | 5 | 1,995.0 | 10 | 850.0 | 1,138 | 507,611.9 | |
Union Carbide (1956-1989)
Union Carbide drilled 72 exploration core holes totaling 84,994.4 ft, with 49 holes (or 68%) drilled vertically. Inclined holes were drilled with azimuths ranging from 035º to 137º and inclinations ranging from 45º to 79º.
Phillips (1973-1984)
Phillips drilled 51 vertical exploration core holes totaling 80,981 ft. The holes include all core, as well as mud rotary or reverse circulation with core tails. In addition, Phillips drilled 24 vertical RC holes totaling 9,050 ft.
Westmont (1984-1994)
Westmont completed 37 core holes totaling 12,852.7 ft for resource definition, metallurgical test work and twinning of RC holes. Thirty holes (81%) were vertical and seven holes (19%) were inclined, with azimuths ranging from 33º to 235º, and inclinations from 45º to 75º.
In addition, Westmont drilled 338 resource definition and twin RC holes totaling 128,173 ft. Most of the holes (297 holes, or 88%) were drilled vertically with the remainder (41 holes, or 12%) drilled with azimuths ranging from 004º to 330º and inclinations from 45º to 75º.
Rea Gold (1994-1997)
Rea drilled six exploration and metallurgical core holes totaling 2,386 ft. Five of the holes were vertical and one was inclined at 69.5º with an azimuth of 042º. Most of the drilling completed by Rea were RC holes where 507 resource definition and twin RC holes totaling 139,626 ft were drilled. Most of the holes (400 holes accounting for 79%) were drilled vertically with the remainder (107 holes accounting for 21%) drilled on bearings ranging from 17º to 353º with inclinations from 41º to 81º.
Rea compared 10 RC holes that were twinned by either other RC or core holes to compare downhole grade distributions within mineralized zones. Comparison of the twinned holes indicated that the mineralized zones intersected by the original holes were intersected in approximately the same place in the twin holes (MRDI, 1997). The exception was the 87034-87034D pair, where mineralization in the RC hole was not well replicated in the twin core hole. Overall, the twinned holes showed a good correlation between the locations of the mineralized zones intersected in the original holes (MRDI, 1997).
Augusta (2006 -2007)
Augusta completed six exploration core holes totaling 9,187.4 ft at the Monte Cristo target. Four holes were drilled vertically with the two inclined holes having azimuths of 205º to 345º with inclinations of 80º.
Ely Gold (2008)
Ely Gold drilled five vertical resource definition, exploration, and metallurgical core holes totaling 2,241 ft.
Solitario (2010-2013)
Between 2010 and 2012 Solitario completed 24 core holes totaling 11,243.9 ft, which were drilled for resource definition, metallurgical testing, and geotechnical purposes. Ten holes (or 42%) were drilled vertically, the remaining 14 holes (or 58%) were inclined with azimuths ranging from 045º to 294º and inclinations of 50º to 84º
In 2013, Solitario drilled two core holes totaling 806 ft for geotechnical purposes related to the planned mineralized material underpass.
In addition, Solitario drilled 48 RC holes totaling 20,365 ft for resource definition and metallurgical test work. Holes were drilled vertically (17 holes, or 35.5%) or inclined (31 holes, or 64.5%) with azimuths ranging from 004º to 358º and inclinations ranging from 47º to 86º.
Data Verification, Sampling Preparation, Analysis and Security
RC samples were collected on 5 ft intervals and core holes were also predominantly sampled on 5 ft intervals with locally adjusted intervals based on lithological, alteration and mineralization changes.
Samples were prepared and analysed by accredited laboratories that included Chemex Labs Inc. ("Chemex"), American Assay Laboratories and Cone Geochemical Incorporated, as well as at the mine site between 1994 and 1997 when Rea Gold operated. QA/QC samples were inserted for most drilling campaigns with the majority of the footage including blanks, certified reference materials (CRMs), and duplicates. Such laboratories are independent of the Company.
APEX conducted a review of the available analytical data, including QA/QC data, and it is of the opinion of the APEX QPs that the sample preparation, security, and analytical procedures adopted meet accepted industry standards and are adequate to ensure overall data quality.
Data Verification
In 2019, APEX and MH-LLC conducted significant data entry and verification of the drillhole database including examination of original drill logs, analytical certificates, collar surveys, downhole surveys, geological logs and data, density measurements and a significant validation effort regarding the analytical database. The data verification campaign included the identification and addition of data from approximately 80 drillholes that were not previously included in the database. Any errors or omissions found were corrected in the database. As a result of the data verification campaign, it is the opinion of the APEX QPs that the Mt. Hamilton drillhole geological and analytical database is sufficiently complete, verified and validated.
Metallurgy
Metallurgical testwork confirms that material from the Centennial, Seligman, and Seligman Stock (Igneous) deposits are amenable to a conventional heap leach processing flowsheet. Metallurgical interpretation for these deposits is based on data provided by MH-LLC. The processing plan would envision mineralized material from all three deposits being crushed to 5/8 inch before being stacked by a mobile conveyor system and heap leached; cement agglomeration would not be required given the crushed material's good permeability characteristics. Solubilized gold and silver would be recovered from the leachate using zinc cementation in a Merrill-Crowe processing circuit; precious metal precipitate would subsequently be smelted to produce doré on-site.
Mineral Resource Estimate
The MRE described in this Report was completed by James Gray, P. Geo, Advantage Geoservices, using Geovia GEMS® software. The MRE was prepared and classified in accordance with the CIM Definition Standards for Mineral Resources and Mineral Reserves (CIM, 2014). The resource estimate is based on a total of 886 drillholes completed between 1973 and 2012.
The MRE utilized a 30 x 30 x 15 ft block model, which is appropriate for an open pit mining scenario, that covered the entire drilling area, which was divided into three areas to be used as partial controls on the estimation process: Seligman, Centennial and Seligman Stock (Igneous). An indicator interpolation was used to separate blocks within the modelled volume into mineralized versus background (low-grade) domains. Log probability plots of gold assay data within the block model limits indicated a break between two grade populations at 0.07 ppm Au (0.002 ounce per short ton (oz/ton)). Estimation of indicators was carried out in a single pass by Area, by ordinary kriging. Gold and silver variography was completed separately within each of the two indicator interpolated domains (mineralized vs background) within each of the three resource "Areas".
The drillhole database comprised 61,264 samples that were composited to 5 ft resulting in 61,104 composites. Capping limits were determined statistically and applied separately for gold and silver values within each of the six domains. A total of 442 density measurements were used to determine average density values for oxidized and unoxidized rock in the three main resource areas. Gold and silver grades were assigned to blocks within each of the six domains by ordinary kriging. An outlier restriction was used in the background domains to lessen the impact of the high-grade composites. Grades at which the restriction was applied (0.029 oz/ton Au and 0.437 oz/ton Ag) were selected based on probability plots of the combined low grade composites.
The MRE is classified based on spatial parameters related to drill density and configuration, and the generation of an optimized pit. Blocks were initially classified as Inferred where estimated by two or more holes, or by a single hole within 100 ft. Indicated blocks are estimated by three or more holes and if the third closest hole is within 150 ft or the closest within 50 ft. Measured blocks are estimated by 11 or more holes in pass one, and the average of the three closest holes is no more than 75 ft, or the closest hole is within 25 ft.
As with the estimation domains discussed above, the 'indicator interpolation with threshold limit evaluation' technique was also used to classify blocks as either oxidized or unoxidized, which was utilized with respect to application of metal recoveries during the pit optimization process. As a result of this exercise, it is the opinion of the QP that the Mt. Hamilton MRE tabulated below demonstrates reasonable prospects for eventual economic extraction.
The 2025 Mineral Resource Estimate for the Mt. Hamilton Property is presented in the table below.
The Mineral Resource Estimate for the Mt. Hamilton Property with an effective data of September 23, 2025 is as follows:
| Category | Tons | Au | Ag | Oz Au | Oz Ag | ||||||||||
| (millions) | (oz/ton) | (oz/ton) | (thousands) | (thousands) | |||||||||||
| Measured | 21 | 0.022 | 0.165 | 454 | 3,473 | ||||||||||
| Indicated | 8.09 | 0.015 | 0.169 | 124 | 1,366 | ||||||||||
| M&l | 29.09 | 0.02 | 0.166 | 578 | 4,839 | ||||||||||
| Inferred | 1.46 | 0.015 | 0.178 | 21 | 260 |
Notes:
1. The MRE was completed by Mr. James Gray, P. Geo, of Advantage Geoservices Ltd.
2. Mineral Resources are not Mineral Reserves and do not have demonstrated economic viability.
3. Mineral Resources are the portion of the Mt Hamilton deposit that have reasonable prospects of eventual economic extraction by open pit mining method and processed by Au-Ag heap leaching.
4. Mineral Resources are constrained oxide and sulfide mineralization inside a conceptual open pit shell. The main parameters for pit shell construction are metal prices of $2,400/oz Au and $28/oz Ag, variable recovery for Au and Ag for oxide and sulfide mineralization by Area, open pit mining costs of $3.30/ton, heap leach processing costs of $4.50/ton, general and administrative costs of $1.65/ton processed, pit slope angles of 50° and a 2.4% royalty.
5. Mineral Resources are shown above a 0.006 oz/ton Au cut-off grade. This is a marginal cut-off grade that generates sufficient revenue to cover conceptual processing, general and off-site costs given metallurgical recovery and long-range metal prices for Au and Ag.
6. Units are imperial tons.
7. Numbers have been rounded as required by reporting guidelines and may result in apparent summation differences.
8. Mineral Resources were prepared in accordance with the CIM Definition Standards for Mineral Resources and Mineral Reserves (2014) and CIM MRMR Best Practice Guidelines (2019).
9. The QP is not aware of any known metallurgical, environmental, permitting, legal, title, taxation, socio-economic, marketing, political or other similar factors which could materially affect the stated Mineral Resources.
Conclusions and Recommendations
Conclusions
Based on a comprehensive review of available information, historical data, and the Updated 2025 MRE, the Authors conclude that the Mt. Hamilton Property is a property of merit prospective for the discovery of additional gold and silver, and polymetallic molybdenum-copper-tungsten (± gold-silver) mineralization. This conclusion is supported by the following:
Risks and Uncertainties
Potential risks and uncertainties related to the MRE include the following:
Furthermore, with any exploration project there exists potential risks and uncertainties. The Company will attempt to reduce risk/uncertainty through effective project management, engaging technical experts and developing contingency plans. Potential risks include changes in the price of gold and silver, availability of investment capital, changes in government regulations, community engagement and socio-economic community relations, permitting and legal challenge risks and general environment concerns.
There is no guarantee that further exploration of the Property will result in the discovery of additional mineralization or an economic mineral deposit. Nevertheless, in the opinion of the Authors, there are no significant risks or uncertainties, other than those mentioned above, that could reasonably be expected to affect the reliability or confidence in the currently available exploration information with respect to the Mt. Hamilton Property.
Opportunities
Potential opportunities related to the MRE, and the Mt. Hamilton Property include the following:
Recommendations
As a property of merit, a 2-phase work program is recommended to delineate additional precious metal mineralization at Mt. Hamilton to support future Mineral Resource expansion, test the tungsten-copper molybdenum potential of the Property, and move towards potential production.
Recommended activities for Phase 1 include:
Phase 2 exploration is contingent on the positive results of Phase 1 and should include the following:
The estimated cost of the Phase 2 exploration program for the Property totals US$5,100,000, not including contingency funds or taxes.
Collectively, the estimated cost of the recommended work programs for the Property totals US$7,300,000, not including contingency funds or taxes (please see the table below).
Proposed Budget for Proposed Exploration at the Mt. Hamilton Property:
| Phase | Item | Approximate cost |
| US$ | ||
| Phase 1 | All in cost for core drilling (7 PQ-sized diamond holes) | 1,900,000 |
| Ongoing Structural and Lithological Modelling | 100,000 | |
| Geological Mapping and Sampling | 200,000 | |
| 2,200,000 | ||
| Phase 2 | All in cost for RC drilling (25,000 ft) | 3,800,000 |
| Archived pulp sample investigation and historical core review. | 100,000 | |
| Geochemical Sampling (soils) | 200,000 | |
| Geophysical Survey | 250,000 | |
| Metallurgical Test Work | 500,000 | |
| Mineral Resource Estimate and PEA Technical Report | 250,000 | |
| 5,100,000 | ||
| Phase 1 & 2 | 7,300,000 |
Exploration, Development and Production
Exploration
No exploration or production has been conducted on the Mt. Hamilton property since the technical report.
Development
Limited development of Mt. Hamilton was initiated in March with the transport of heavy equipment to site to begin road building activities.
Production
There has not been any production by Mako at Mt. Hamilton.
RISK FACTORS
The Company is exposed to a variety of risks in the normal course of operations that could significantly affect its performance and could cause its actual results to differ in material respects from its anticipated results. These risks are discussed below and are in addition to those outlined elsewhere in this AIF and in the Company's filings with the Canadian securities regulatory authorities, including the Company's Management's Discussion and Analysis of Financial Condition and Results of Operations for the year ended December 31, 2025 available under the Company's profile on SEDAR+ at www.sedarplus.ca and EDGAR at www.sec.gov. Additional risks not currently known to the Company, or that the Company currently deems immaterial, may also impair the Company's operations.
Uncertainty of Mineral Resources and Mineral Reserves
Mineral Resources for the Company's properties, contained herein and in the respective technical reports for such properties and in other public filings of the Company available on SEDAR+ at www.sedarplus.ca, are estimates of the size and grade of deposits based on sampling and on certain assumptions and parameters. Mineral Resources published by Mako are estimates only and no assurance can be given that the anticipated tonnages and grades will be achieved or that the indicated level of recovery will be realized.
Inferred Mineral Resources are considered too speculative geologically to have the economic considerations applied to them that would enable them to be characterized as Mineral Reserves, and there is no certainty that the PEA or Mineral Resource estimates will be realized. Mineral Resources that are not Mineral Reserves do not have demonstrated economic viability. There is no assurance that Mineral Resources will be upgraded to Mineral Reserves as a result of continued exploration.
Until resources are actually mined and processed, the quantities of mineralization and metal grades must be considered as estimates only. Additionally, as the Company has not declared any Mineral Reserves at any of its mining or mineral projects, there is an increased risk that the expectations outlined in the Company's various technical reports may not be realized. There are numerous risks related to Mineral Resources, including many factors beyond the Company's control. Such estimation is a subjective process, and the accuracy of any Mineral Resource estimate is a function of the quantity and quality of available data and of the assumptions made and judgments used in engineering and geological interpretation.
The gold grade recovered may differ from the estimated grades of the Mineral Resources. Prolonged declines in the market price of gold may render mineralization containing relatively lower grades of gold mineralization uneconomic to exploit and could materially impact the Company's financial position and operations, including resulting in increased net losses and reduced cash flow.
Potential Border Conflict
The Company's business could be adversely affected by the ongoing border controversy between Guyana and the Bolivarian Republic of Venezuela. The internationally recognized border between Guyana and Venezuela was established in 1899 by an arbitration panel. Importantly, the territory of Guyana has been continuously administered and controlled by Guyana since that time. The Venezuelan government claims that the Essequibo territory, a large area within Guyana that is west of the Essequibo River extending to the border of Venezuela, belongs to Venezuela. On December 3, 2023, the government of Venezuela held a consultative referendum over control of the Essequibo territory. The results of the referendum, including Venezuela's unilateral claim over the Essequibo territory and disregard for the jurisdiction of the International Court of Justice ("ICJ") in this matter have been widely discredited. The ICJ decided unanimously that "pending a final decision in the case, the Bolivarian Republic of Venezuela shall refrain from taking any action which would modify the situation that currently prevails in the territory in dispute, whereby the Co-operative Republic of Guyana administers and exercises control over that area". On December 14, 2023, officials from Venezuela and Guyana signed the Argyle Accord, which declared that force would not be used by either country and controversies between the two countries would be resolved in accordance with international law. The Company's Eagle Mountain Gold Project falls within this Essequibo area, the sovereign territory of Guyana. The Company's activities at Eagle Mountain, including exploration, technical and environmental studies, along with ongoing coordination with governmental agencies, remain unaffected by recent events, though the Company will continue to monitor the situation closely. Uncertainty caused by the political conflict may negatively impact the Company's financial position, financial performance, cash flows, and its ability to raise capital. The impacts of the conflict on the Company's planned exploration activities, including technical and engineering studies, cannot be reasonably estimated at this time.
Exploration, Development and Production Risks
An investment in the common shares of the Company is speculative due to the nature of the Company's involvement in the acquisition, exploration, evaluation, and, if warranted, development and production of minerals. Mineral exploration involves a high degree of risk and there is no assurance that expenditures made on future exploration by the Company will result in new discoveries in commercial quantities to return a profit from production. The exploration for and development of mineral deposits involves significant risks that even a combination of careful evaluation, experience and knowledge may not eliminate. While the discovery of an ore body may result in substantial rewards, few properties that are explored are ultimately developed into producing mines and no assurance can be given that minerals will be discovered in sufficient quantities or having sufficient grade to justify commercial operations or that funds required for development can be obtained on a timely basis. Major expenses may be required to locate and establish Mineral Reserves, to develop metallurgical processes and to construct mining and processing facilities at a particular site. The Company cannot give any assurance that its exploration and development programs and properties will result in the discovery, development or production of a commercially viable ore body or yield Mineral Reserves. Whether a mineral deposit will be commercially viable depends on numerous factors, including, but not limited to:
• the interpretation of geological data obtained from drill holes and other sampling techniques;
• the attributes of the deposit, such as size, grade, metallurgy and proximity to infrastructure;
• the cost of power and water;
• metal prices which are highly cyclical;
• fluctuations in inflation and currency exchange rates;
• higher input commodity and labour costs;
• the cost of operations and processing equipment; and
• government regulations, including regulations relating to prices, taxes, royalties, land tenure, land use, allowable production, importing and exporting of minerals, sanctions and environmental protection.
The Company's exploration projects are also subject to the issuance of necessary permits and other governmental approvals and receipt of adequate financing. The exact effect of these factors cannot be accurately predicted, but the combination of these factors may adversely affect the Company's business. In addition, as a result of the substantial expenditures involved in development projects, developments are prone to material cost overruns versus budget. The capital expenditures and time required to develop new mines are considerable and changes in cost or construction schedules can significantly increase both the time and capital required to build the mine. The project development schedules are also dependent on obtaining the governmental approvals necessary for the operation of a mine. Substantial expenditures are required to build mining and processing facilities for new properties. The timeline to obtain these government approvals is often beyond an entity's expectations. It is not unusual in the mining industry for new mining operations to experience unexpected problems during the start-up phase, resulting in delays and requiring more capital than anticipated. The combination of these factors may result in the Company's inability to develop its non-producing properties in the future, to achieve estimated production, revenue or cost levels, or to receive an adequate return on invested capital, which could have a material adverse effect on the Company's business, results of operations and financial condition. While the Company has several identified exploration prospects, management will continue to evaluate prospects on an ongoing basis in a manner consistent with industry standards. The long-term success of the Company depends on its ability to find, develop and commercially produce Mineral Resources or Mineral Reserves.
Additional Funding Requirements
From time to time, the Company may require additional financing to carry out its exploration and development activities, as well as for any future acquisitions. Failure to obtain such financing on a timely basis could cause the Company to forfeit its interest in certain properties, miss certain acquisition opportunities, delay or indefinite postponement of further exploration and development of its projects with the possible loss of such properties, and reduce or terminate its operations. If the Company's future revenues decrease due to lower commodity prices or otherwise, it will affect the Company's ability to expend the necessary capital to maintain its production. If the Company's future cash flow from operations is not sufficient to satisfy its capital expenditure requirements, there can be no assurance that additional debt or equity financing will be available to meet these requirements or be available on favourable terms. The Company may issue securities on less than favourable terms to raise sufficient capital to fund its business plans. Any transaction involving the issuance of equity securities or securities convertible into common shares would result in dilution, possibly substantial, to present and prospective holders of common shares.
Fluctuations in the Price of Gold
Gold is a commodity whose price is determined based on world demand, supply and other factors, all of which are beyond the control of the Company. World prices for gold have fluctuated widely in recent years. The volatility of mineral prices represents a substantial risk which no amount of planning or technical expertise can fully eliminate. Metal prices are affected by numerous factors beyond the control of the Company, including international economic and political trends, expectations of inflation, currency exchange fluctuations, interest rates and global or regional consumption patterns, speculative activities and increased production due to improved mining and production methods. The supply of and demand for metals are affected by various factors, including political events, economic conditions and production costs in major producing regions. There can be no assurance that the price of any commodities will be such that any of the properties in which the Company has, or has the right to acquire, an interest may be mined at a profit.
Current and future price declines could cause commercial production or the development of new mines to be impracticable. If gold prices decline significantly, or decline for an extended period of time, the Company might not be able to continue the Company's operations, develop the Company's properties, or fulfill the Company's obligations under the Company's permits and licenses, or under the Company's agreements. This could result in the Company losing its interest in some or all of its properties, or being forced to cease operations or development activities or to abandon or sell properties, which could have a significant negative effect on the Company's profitability and cash flow.
Surface Rights and Access
Although the Company acquires the rights to some or all of the minerals in the ground subject to the mineral tenures that it acquires, or has a right to acquire, in most cases it does not thereby acquire any rights to, or ownership of, the surface to the areas covered by its mineral tenures. It is necessary to negotiate surface access or to purchase the surface rights if long-term access is required. There can be no guarantee that, despite having the right at law to access the surface and carry on mining activities, the Company will be able to negotiate satisfactory agreements with any such existing landowners/occupiers for such access or purchase of such surface rights, and therefore it may be unable to carry out planned mining activities. In addition, in circumstances where such access is denied, or no agreement can be reached, the Company may need to rely on the assistance of local officials or the courts in such jurisdiction the outcomes of which cannot be predicted with any certainty. The inability of the Company to secure surface access or purchase required surface rights could materially and adversely affect the timing, cost or overall ability of the Company to develop mineral deposits it may locate.
Political, Economic and Other Risks
The Company's exploration, development and production activities are conducted in Nicaragua, Guyana, and the United States and, as such, the Company's operations are exposed to various levels of political, economic and other risks and uncertainties. These risks and uncertainties include, but are not limited to, fluctuations in currency exchange rates; high rates of inflation; labour unrest; the risks of war; expropriation and nationalization; environmental controls and permitting; restrictions on the use of land and natural resources; renegotiation or nullification of existing concessions, licenses, permits and contracts; illegal mining; changes in taxation policies; restrictions on foreign exchange; corruption; changing political conditions; changes in mining and social policies, including the introduction of new or amended mining, environmental or water laws, as well as sanctions, trade measures or other diplomatic actions; currency controls and governmental regulations that favour or require the awarding of contracts to local contractors or require foreign contractors to employ citizens of, or purchase supplies from, a particular jurisdiction or require equity participation by local citizens; and other risks arising out of foreign sovereignty issues. Nicaragua and Guyana are developing countries and the Company's mineral exploration and mining activities may be affected in varying degrees by political instability and governmental legislation and regulations relating to foreign investment and the mining industry. Changes, if any, in mining or investment policies or shifts in political attitude in Nicaragua, Guyana or the United States, may adversely affect the Company's operations or profitability.
Operations may be affected in varying degrees by:
• government regulations with respect to, but not limited to, restrictions on production, price controls, exchange controls, export controls, currency remittance, income or other taxes, expropriation of property, foreign investment, sanctions, maintenance of claims, environmental legislation, land use, land claims of local people, local content and ownership, water use and mine safety; and
• the lack of certainty with respect to foreign legal systems, which may not be immune from the influence of political pressure, corruption or other factors that are inconsistent with the rule of law.
Failure to comply with applicable laws, regulations, and permitting requirements may result in enforcement actions thereunder, including orders issued by regulatory or judicial authorities causing operations to cease or be curtailed, and may include corrective measures requiring capital expenditures, installation of additional equipment, or remedial actions. The occurrence of these various factors and uncertainties cannot be accurately predicted and could have an adverse effect on the Company's business, financial condition and results of operations. Furthermore, in the event of a dispute arising from the Company's activities, the Company may be subject to the exclusive jurisdiction of courts or arbitral proceedings outside of North America which could unexpectedly and adversely affect the outcome of a dispute.
Availability of Infrastructure, Energy and Other Commodities
Mining, processing, development and exploration activities depend, to one degree or another, on adequate infrastructure. Reliable roads, bridges, power sources and water supply are important determinants which affect capital and operating costs. The Company's inability to secure adequate water and power resources, as well as other events outside of the Company's control, such as unusual or infrequent weather phenomena, sabotage, community, or government or other interference in the maintenance or provision of such infrastructure, could adversely affect the Company's operations, financial condition and results of operations.
Profitability is affected by the market prices and availability of commodities that the Company uses or consumes for the Company's operations and planned development projects. Prices for commodities like diesel fuel, electricity, steel, concrete, and chemicals (including cyanide) can be volatile, and changes can be material, occur over short periods of time and be affected by factors beyond the Company's control. The Company's operations depend on suppliers to meet those needs. Higher costs for construction materials like steel and concrete could affect the timing and cost of the Company's planned development projects. Higher worldwide demand for critical resources like input commodities, drilling equipment, tires and skilled labour could affect the Company's ability to acquire them and lead to delays in delivery and unanticipated cost increases, which could have an effect on the Company's operating costs, capital expenditures and production schedules.
Changes in costs of the Company's mining and processing operations could occur as a result of unforeseen events, including international and local economic and political events, including, without limitation, the continuance or escalation of international military conflicts, including the conflict between Ukraine and Russia, the U.S. government intervention in Venezuela, the United States and Israeli strikes on Iran, and other conflicts in the Middle East, which have and/or may continue to result in increased prices for a variety of commodities and which could have other long-term effects on the global economy, other changes in commodity prices, increased costs and scarcity of labour, and could result in changes in profitability or Mineral Reserve estimates.
As a result, the Company's operations will be subject to a number of risks, some of which are outside of the Company's control, including negotiating agreements with suppliers and contractors on acceptable terms, the inability to replace a supplier or contractor and its equipment, raw materials or services in the event that either party terminates the agreement, interruption of operations or increased costs in the event that a supplier or contractor ceases its business due to insolvency or other unforeseen events and failure of a supplier or contractor to perform under its agreement with us. The occurrence of one or more of these risks could have a material adverse effect on the Company's business, results of operations and financial condition.
Exploration and Mining Risks
Mining operations generally involve a high degree of risk. The Company's operations are subject to all the hazards and risks normally encountered in the exploration, development and production of gold, including: unusual and unexpected geologic formations; seismic activity; rock bursts; cave-ins or slides; flooding; pit wall failure; periodic interruption due to inclement or hazardous weather conditions; and other conditions involved in the drilling and removal of material, any of which could result in damage to, or destruction of, mines and other producing facilities, personal injury or death, damage to property, environmental damage and possible legal liability. Milling operations are subject to hazards such as fire, equipment failure or failure of retaining dams around tailings disposal areas, which may result in environmental pollution and consequent liability.
The economics of developing mineral properties is affected by many factors including the cost of operations, variations of the grade of mineralization mined, fluctuations in the price of gold or other minerals produced, costs of processing equipment and such other factors as government regulations, including regulations relating to royalties, allowable production, importing and exporting of minerals and environmental protection. In addition, the grade of mineralization ultimately mined may differ from that indicated by drilling results and Mineral Resource estimates and such differences could be material. Short-term factors, such as the need for orderly development of ore bodies or the processing of new or different grades, may have an adverse effect on mining operations and on the results of operations. There can be no assurance that minerals recovered in small scale laboratory tests will be duplicated in large scale tests under on-site conditions or in production scale operations. Material changes in geological resources, grades, stripping ratios or recovery rates may affect the economic viability of projects. Additionally, the Company estimates the future mine life of its mines. The Company can give no assurance that its mine life estimates will be achieved. Failure to achieve this estimate could have an adverse impact on the Company's future cash flows, earnings, results of operations and financial condition.
Competition
The mining industry is intensely competitive in all of its phases and the Company competes with many companies possessing greater financial and technical resources. Competition in the mining industry is primarily for the following: mineral-rich properties which can be developed and produced economically; technical expertise to find, develop, and manage such properties; labour to operate the properties; and capital for the purpose of funding such properties. Many competitors not only explore for and mine precious metals, but also conduct refining and marketing operations on a world-wide basis. Such competition may result in us being unable to: acquire desired properties; recruit or retain qualified employees; or obtain the capital necessary to fund its operations and develop its properties. Existing or future competition in the mining industry could materially adversely affect the Company's prospects for mineral exploration and success in the future. Furthermore, increased competition could result in increased costs and lower prices for metal and minerals produced which, in turn, could reduce profitability. Consequently, the Company's revenues, operations and financial condition could be materially adversely affected.
Availability of Equipment and Access Restrictions
Natural resource exploration and development activities are dependent on the availability of drilling and related equipment in the particular areas where such activities will be conducted. Demand for such limited equipment or access restrictions may affect the availability of such equipment to the Company and may delay exploration and development activities.
Uninsured or Uninsurable Risks
Exploration, development and mining operations involve various hazards, including environmental hazards, industrial accidents, labour disputes, metallurgical and other processing problems, unusual or unexpected rock formations, structural cave-ins, ground or slope failures, flooding, fires, metal losses and periodic interruptions due to inclement or hazardous weather conditions. These risks could result in damage to or destruction of mineral properties, facilities or other property, personal injury, environmental damage, delays in operations, increased cost of operations, monetary losses and possible legal liability. Although the Company maintains insurance to protect against certain risks in such amounts as the Company considers to be reasonable, the Company's insurance will not cover all the potential risks associated with the Company's operations and insurance coverage may not continue to be available or may not be adequate to cover any resulting liability. It is not always possible to obtain insurance against all risks and the Company may decide not to insure against certain risks because of high premiums or other reasons. Moreover, insurance against risks such as loss of title to mineral property, environmental pollution or other hazards as a result of exploration and production is not generally available to us or to other companies in the mining industry on acceptable terms. Losses from these events may cause us to incur significant costs that could have a material adverse effect upon the Company's financial performance and results of operations.
Currency Risk
The Company's primary assets and operations are located in Nicaragua and Guyana, which use local currency, the Córdoba and the Guyanese dollar, respectively, and the United States dollar almost interchangeably. The United States dollar is the functional currency of Nicaraguan subsidiaries as well as the Company's United States subsidiaries. The Guyanese dollar is the functional currency of the Company's Guyanese subsidiaries. The functional currency of Mako is the United States dollar. Determination of functional currency may involve certain judgments to identify the primary economic environment. Management reconsiders the functional currency of its entities if there is a change in events and conditions which determine the primary economic environment.
As a result, the Company has foreign currency exposure. The three main types of foreign exchange risk the face can be categorized as follows:
• Transaction exposure: the Company's operations incur costs in different currencies. This creates exposure at the operational level, which may affect the Company's profitability as exchange rates fluctuate. The Company does not undertake steps to mitigate transactional volatility in Guyanese dollars or Nicaraguan Córdoba;
• Exposure to currency risk: the Company is exposed to currency risk through a portion of assets and liabilities denominated in currencies other than the Canadian dollar: cash and cash equivalents, trade and other receivables, trade and other payables, reclamation and closure costs obligations, warrants and gross balance exposure; and
• Translation exposure: the Company's functional and reporting currency is the United States dollar. The Company's operations have assets and liabilities denominated in either the Nicaraguan Córdoba or United States dollars, with translation foreign exchange gains and losses included from these balances in the determination of profit or loss. Therefore, as the exchange rates between the United States Dollar and Nicaraguan Córdoba fluctuate, the Company will experience foreign exchange gains and losses, which can have a significant impact on the Company's consolidated operating results. The exchange rate between the Córdoba and the United States dollar varies according to a pattern set by the Nicaraguan Central Bank. The Córdoba has been annually devalued versus the United States dollar by means of a crawling peg mechanism.
As a result, fluctuations in currency exchange rates could significantly affect the Company's business, financial condition, results of operations and liquidity.
Global Financial Conditions Can Reduce Share Prices and Limit Access to Financing
In recent years, global financial markets have been characterized by extreme volatility impacting many industries, including the mining industry. Global financial conditions remain subject to sudden and rapid destabilizations in response to future economic shocks, as government authorities may have limited resources to respond to future crises. A sudden or prolonged slowdown in the financial markets or other economic conditions, including but not limited to, consumer spending, employment rates, business conditions, inflation, fuel and energy costs, consumer debt levels, lack of available credit, the state of the financial markets, interest rates and tax rates, may adversely affect the Company's growth and profitability. Future economic shocks may be precipitated by numerous causes, including, but not limited to, material changes in the price of oil and other commodities, the volatility of metal prices, governmental policies, geopolitical instability, war, terrorism, the devaluation and volatility of global stock markets and natural disasters. Any sudden or rapid destabilization of global economic conditions could impact the Company's ability to obtain equity or debt financing in the future on terms favorable to the Company or at all. In such an event, the Company's operations and financial condition could be adversely impacted.
International Conflicts
International conflicts and other geopolitical tensions and events, including war, military action, terrorism, trade disputes and international responses thereto have historically led to, and may in the future lead to, uncertainty or volatility in global commodity and financial markets and supply chains. Russia's invasion of Ukraine in 2022 has led to sanctions being levied against Russia by the international community and may result in additional sanctions or other international action, any of which may have a destabilizing effect on commodity prices, supply chains and global economies more broadly. In 2023, Israel and Hamas, the terrorist organization and current ruling political party in the Gaza Strip, engaged in a series of violent exchanges, primarily in southern Israel and the Gaza Strip. In addition, in 2026, the United States and Israel struck Iran and the United States has intervened in Venezuela. These events have resulted in a significant increase in tension in the region and may have far reaching effects on the global economy. Volatility in commodity prices and supply chain disruptions may adversely affect the Company's business, financial condition and results of operations. The extent and duration of the current conflicts in the Ukraine and Israel and related international action cannot be accurately predicted at this time and the effects of such conflict may magnify the impact of the other risks identified in this short form prospectus, including those relating to commodity price volatility and global financial conditions. The outcome of these conflicts is uncertain, and these conflicts may escalate and may result in escalated tensions within and outside of Eastern Europe and the Middle East, respectively. This could result in significant disruption of supplies of oil and natural gas from the region and could cause a significant worldwide supply shortage of oil and natural gas and have a significant impact on worldwide prices of oil and natural gas. A lack of supply of energy and high prices of oil and natural gas could have a significant adverse impact on the world economy. The situation is rapidly changing and unforeseeable impacts, including on the Company's shareholders and counterparties on which the Company relies and transacts with, may materialize and may have an adverse effect on the Company's operations and trading price of its common shares.
Infectious Diseases
Emerging infectious diseases or the threat of outbreaks of viruses or other contagions or epidemic diseases could have a material adverse effect on the Company by causing operational and supply chain delays and disruptions (including as a result of government regulation and prevention measures), labour shortages and shutdowns, social unrest, breach of material contracts and customer agreements, government or regulatory actions or inactions, increased insurance premiums, decreased demand or the inability to sell and deliver precious metals, declines in the price of precious metals, delays in permitting or approvals, governmental disruptions, capital markets volatility, or other unknown but potentially significant impacts. In addition, governments may impose strict emergencies measures in response to the threat or existence of an infectious disease. At this time, the Company cannot accurately predict what effects these conditions will have on mining operations or financial results, including due to uncertainties relating to the ultimate geographic spread of the virus, the severity of the disease, the duration of the outbreak, and the length of the travel restrictions and business closures that have been or may be imposed by the governments of impacted countries. In addition, a significant outbreak of contagious diseases in the human population (such as the COVID-19 example) could result in a widespread health crisis that could adversely affect the economies and financial markets of many countries, resulting in an economic downturn that could result in a material adverse effect on commodity prices, demand for metals, investor confidence, and general financial market liquidity, all of which may adversely affect the Company's business and the market price of the Company's common shares. Accordingly, any outbreak or threat of an outbreak of an epidemic disease or similar public health emergency could have a material adverse effect on the Company's business, financial condition and results of operations.
Nature and Climatic Condition Risk
The Company and the mining industry are facing continued geotechnical challenges, which could adversely impact the Company's production and profitability. Unanticipated adverse geotechnical and hydrological conditions, such as landslides, droughts, pit wall failures and rock fragility may occur in the future and such events may not be detected in advance. Geotechnical instabilities and adverse climatic conditions can be difficult to predict and are often affected by risks and hazards outside of the Company's control, such as seismic activity, severe weather, including hurricanes, with considerable rainfall, which may lead to periodic floods, mudslides and wall instability, which could potentially result in slippage of material or a tailings dam failure. Geotechnical failures could result in limited or restricted access to mine sites, suspension of operations, government investigations, increased monitoring costs, remediation costs, loss of mineralization and other impacts including financial liability, which could cause the Company's projects to be less profitable than currently anticipated and could result in a material adverse effect on the Company's results of operations and financial position.
Furthermore, the occurrence of physical climate change events may result in substantial costs to respond to the event and/or recover from the event, and to prevent recurrent damage, through either the modification of, or addition to, existing infrastructure at the Company's operations. The scientific community has predicted an increase, over time, in the frequency and severity of extraordinary or catastrophic natural phenomena as a result of climate change. The Company can provide no assurance that it will be able to predict, respond to, measure, monitor or manage the risks posed as a result.
In addition, as climate change is increasingly perceived as an international and community concern, stakeholders may increase demands for emissions reductions and call-upon mining companies to better manage their consumption of climate-relevant resources. Physical climate change events, and the trend toward more stringent regulations aimed at reducing the effects of climate change, could impact the Company's decisions to pursue future opportunities, or maintain existing operations, which could have an adverse effect on its business and future operations. The Company can provide no assurance that efforts to mitigate the risks of climate changes will be effective and that the physical risks of climate change will not have an adverse effect on its operations and profitability.
Closure and Reclamation Costs
The Company reviews and reassesses its reclamation obligations based on periodically updated life of mine estimates as well as rehabilitation and closure plans. Such reclamation obligations include infrastructure decommissioning, site preparation and revegetation, maintenance, and post-closure monitoring. Provisions for decommissioning and reclamation have been created based on the Company's internal estimates. Assumptions, based on the current economic environment, have been made which management believes are a reasonable basis upon which to estimate the Company's future liability. These estimates take into account any material changes to the assumptions that occur when reviewed regularly by management. Estimates are reviewed annually and are based on current regulatory requirements. Significant changes in estimates of contamination, restoration standards and techniques will result in changes to provisions from year to year. Actual rehabilitation costs will ultimately depend on future market prices for the rehabilitation costs that will reflect the market condition at the time the rehabilitation costs are actually incurred.
The costs of performing the decommissioning and reclamation must be funded by the Company's operations. These costs can be significant and are subject to change. The Company cannot predict what level of decommissioning and reclamation may be required in the future by regulators. If the Company is required to comply with significant additional regulations or if the actual cost of future decommissioning and reclamation is significantly higher than current estimates, this could have an adverse impact on the Company's future cash flow, earnings, results of operations and financial condition.
Litigation Risk
All industries, including the mining industry, are subject to legal claims, with and without merit. The Company may be, from time to time, involved in various claims, legal proceedings and complaints arising in the ordinary course of business. In addition, companies like Mako that have experienced volatility in their share price have been subjected to class action securities litigation by shareholders. Defense and settlement costs can be substantial, even for claims that are without merit. Due to the inherent uncertainty of the litigation process, the litigation process could take away from management time and effort and the resolution of any particular legal proceeding to which the Company may become subject could have a material adverse effect on the Company's business, results of operations and financial position. See also "Legal Proceedings and Regulatory Actions".
Potential Volatility of Market Price of Common Shares
Securities traded on the TSXV and Nasdaq have, from time to time, experienced significant price and volume fluctuations unrelated to the operating performance of particular companies. These broad market fluctuations may adversely affect the market price of the common shares. In addition, the market price of the common shares is likely to be highly volatile. Factors such as metals prices, the average volume of shares traded, announcements by competitors, variations in the operating results of the Company, divergence in financial results from analysts' expectations, changes in earnings estimates by stock market analysts, changes in the business prospects for the Company, general economic conditions, changes in resource estimates, results of exploration, changes in results of mining operations, legislative changes, and other events and factors outside of the Company's control.
The Company is unable to predict whether substantial amounts of common shares will be sold in the open market. Any sales of substantial amounts of common shares in the public market, or the perception that such sales might occur, could materially and adversely affect the market price of the common shares.
Controlling Shareholder Risk
Currently, over 40% of the common shares, and certain convertible securities of the Company, are owned, directly or indirectly, by private investment funds controlled by Wexford, the Company's controlling shareholder. There is no guarantee that the position of Wexford or its affiliates will always coincide with the opinion and interests of the management of the Company or the minor shareholders. Any disagreement or difference of opinion between Wexford and the Company or its minor shareholders could have a material adverse effect on the common shares and on the business of the Company generally.
Conflict of Interest of Management
Certain of the Company's directors and officers also serve as directors, officers and/or advisors of and to other companies involved in natural resource exploration and development, including the Company's controlling shareholder Wexford. In addition, the Company has a services contract with Tes-Oro Mining Group, LLC, which company is owned by the Chief Operating Officer of the Company, for certain mine engineering and other services for which the Chief Operating Officer has oversight. There exists the possibility for such directors and officers to be in a position of conflict. The Company expects that any decision made by any of such directors and officers relating to the Company will be made in accordance with their duties and obligations to deal fairly and in good faith with the Company and its stakeholders, but there can be no assurance in this regard. In addition, each of the directors is required to declare his or her interests in any particular matter, and to refrain from voting on any such matter in which such director may have a conflict of interest, in accordance with the Business Corporations Act (British Columbia).
Reliance on Operators and Key Employees
The success of the Company's operations is largely dependent upon the performance of the Company's key officers, employees and consultants. Locating and developing mineral deposits depends on a number of factors, not the least of which is the technical skill of the exploration, development and production personnel involved. Failure to retain key personnel or to attract or retain additional key individuals with necessary skills to continue to develop the Company's projects and business could have a materially adverse impact upon the Company's success. The Company does not have any key man insurance policies with respect to any of the Company's directors, officers or key employees and have no current plans to do so. In assessing the risk of an investment in the Company's, potential investors should realize that they are relying on the experience, judgment, discretion, integrity and good faith of the management of the Company.
Title Matters
The acquisition of title to mineral properties is a very detailed and time-consuming process. Title to, and the area of, mineral concessions may be disputed. Although the Company believes it has taken reasonable measures to ensure proper title to its properties, there is no guarantee that title to any of its properties will not be challenged or impaired. Third parties may have valid claims underlying portions of the Company's interests.
Relationships with Local Communities
The Company is committed to working constructively with local communities, government agencies and Indigenous groups to ensure that its activities are conducted in a culturally and environmentally sensitive manner; however, the risk of any negative relationship with local communities could result in opposition to the Company's projects and such opposition could result in material delays in obtaining key operating permits or make certain projects inaccessible to its personnel. The Company believes its activities can provide valuable benefits to surrounding communities, in terms of direct employment, training and skills development and other benefits associated with ongoing community support. In addition, the Company seeks to maintain its partnerships and relationships with local communities in a variety of ways.
Notwithstanding the Company's ongoing efforts, local communities and stakeholders could become dissatisfied with its activities or the level of benefits provided, which could result in civil unrest, protests, direct action or campaigns against it. Any such occurrence could materially and adversely affect the Company's business, financial condition or results of operations.
Reclamation Estimates and Obligations
It is difficult to determine the exact cost amounts which will be required to complete all land reclamation activities in connection with the properties in which the Company holds an interest. Reclamation bonds and other forms of financial assurance represent only a portion of the total amount of money that will be spent on reclamation activities over the life of a mine. Accordingly, it may be necessary to revise planned expenditures and operating plans in order to fund reclamation activities. Such costs may have a material adverse impact upon the financial condition and results of operations of the Company.
Residency of Directors, Officers and Others
A number of the directors and officers of the Company reside outside of Canada. Substantially all of the assets of these persons, and the Company, are located outside of Canada. As a result, it may not be possible for investors to effect services of process within Canada upon these directors or officers. It may also not be possible to enforce against certain of the Company's directors and officers, and certain experts named herein, as judgments obtained in Canadian courts are predicated upon civil liability provisions of applicable securities laws in Canada.
Absence of Dividends
The Company has never paid a dividend on its common shares, and does not expect to do so in the foreseeable future. Any future determination to pay dividends will be at the discretion of the board of directors of the Company and will depend upon the capital requirements of the Company, results of operations and such other factors as the board of directors considers relevant. Accordingly, it is likely that investors will not receive any return on their investment in the common shares other than possible capital gains.
Use of Derivatives
From time to time, the Company may use certain derivative products to manage the risks associated with metal price volatility, changes in other commodity input prices, interest rates, foreign currency exchange rates and energy prices. The use of derivative instruments involves certain inherent risks including: (i) credit risk - the risk that the creditworthiness of a counterparty may adversely affect its ability to perform its payment and other obligations under its agreement with the Company or adversely affect the financial and other terms the counterparty is able to offer the Company; (ii) market liquidity risk - the risk that the Company has entered into a derivative position that cannot be closed out quickly, by either liquidating such derivative instrument or by establishing an offsetting position; and (iii) unrealized mark-to-market risk - the risk that, in respect of certain derivative products, an adverse change in market prices for commodities, currencies or interest rates will result in the Company incurring an unrealized mark-to-market loss in respect of such derivative products.
Obligations as a Public Company
The Company's business is subject to evolving corporate governance and public disclosure regulations that may from time to time increase both the Company's compliance costs and the risk of non-compliance, which could adversely impact the price of the common shares. The Company is subject to changing rules and regulations promulgated by a number of governmental and self regulated organizations, including, but not limited to, the Canadian Securities Administrators, the TSXV, the SEC, Nasdaq, and the International Accounting Standards Board. These rules and regulations continue to evolve in scope and complexity creating many new requirements. The Company's efforts to comply with such legislation could result in increased general and administration expenses and a diversion of management time and attention from revenue-generating activities to compliance activities.
Application of Anti-Bribery Laws
The Company is required to comply with anti-corruption and anti-bribery laws, including the Canadian Corruption of Foreign Public Officials Act, as well as similar laws in Nicaragua, Guyana and the United States. If the Company or any of its representatives becomes subject to an enforcement action or is found to be in violation of any such laws, significant penalties, fines and/or sanctions may be imposed on the Company, and the Company's global reputation could be impacted, any of which could have a material adverse effect on the Company. Failure to comply with the applicable legislation and other similar foreign laws could expose the Company and its senior management to civil and/or criminal penalties, other sanctions and remedial measures, legal expenses and reputational damage, all of which could materially and adversely affect the Company's business, financial condition and results of operations. Likewise, any investigation of any alleged violations of the applicable anti-corruption legislation by Canadian or foreign authorities could also have an adverse impact on the Company's business, financial condition and results of operations.
In addition, the Extractive Sector Transparency Measures Act ("ESTMA"), which became effective June 1, 2015, requires public disclosure of payments to governments by mining and oil and gas companies engaged in the commercial development of oil, gas and minerals who are either publicly listed in Canada or with business or assets in Canada. Mandatory annual reporting is required for extractive companies with respect to payments made to foreign and domestic governments at all levels, including entities established by two or more governments. ESTMA requires reporting on the payments of any taxes, royalties, fees, production entitlements, bonuses, dividends, infrastructure improvement payments, and any other prescribed payment over $100,000. Failure to report, false reporting or structuring payments to avoid reporting may result in fines, If the Company becomes subject to an enforcement action or is in violation of ESTMA, this may result in significant penalties, fines and/or sanctions, which may have a material adverse effect on the Company's reputation.
Failure to meet TSXV's and Nasdaq's Continued Listing Requirements
If the Company fails to satisfy the continued listing requirements of the TSXV and/or the Nasdaq, such as corporate governance requirements or the minimum closing bid price requirement, the TSXV and/or the Nasdaq may take steps to delist the common shares. Such a delisting would likely have a negative effect on the price of the common shares and would impair shareholders' ability to sell or purchase its common shares when they wish to do so.
As a Foreign Private Issuer, the Company is Subject to Different U.S. Securities Laws and Rules than a U.S. Domestic Issuer
The Company is a "foreign private issuer", under applicable U.S. federal securities laws, and is, therefore, not subject to the same requirements that are imposed upon U.S. domestic issuers by the SEC. Under the U.S. Exchange Act, the Company is subject to reporting obligations that, in certain respects, are less detailed and less frequent than those of U.S. domestic reporting companies. As a result, the Company does not file the same reports that a U.S. domestic issuer would file with the SEC, although the Company is required to file with or furnish to the SEC the continuous disclosure documents that it is required to file in Canada under Canadian securities laws.
In addition, the Company's officers, directors, and principal shareholders are currently exempt from the reporting and short- swing profit recovery provisions of Section 16 of the U.S. Exchange Act. Therefore, the Company's shareholders may not know on as timely a basis when the Company's officers, directors and principal shareholders purchase or sell common shares, as the reporting periods under the corresponding Canadian insider reporting requirements are longer.
As a foreign private issuer, the Company is exempt from the rules and regulations under the U.S. Exchange Act related to the furnishing and content of proxy statements. The Company is also exempt from Regulation FD, which prohibits issuers from making selective disclosures of material non-public information. While the Company complies with the corresponding requirements relating to proxy statements and disclosure of material non-public information under Canadian securities laws, these requirements differ from those under the U.S. Exchange Act and Regulation FD and shareholders should not expect to receive the same information at the same time as such information is provided by U.S. domestic companies. In addition, the Company may not be required under the U.S. Exchange Act to file annual and quarterly reports with the SEC as promptly as U.S. domestic companies whose securities are registered under the U.S. Exchange Act. In addition, as a foreign private issuer, the Company has the option to follow certain Canadian corporate governance practices, except to the extent that such laws would be contrary to U.S. securities laws, and provided that the Company disclose the requirements it is not following and describe the Canadian practices it follows instead. The Company has elected and may in the future elect to follow home country practices in Canada with regard to certain corporate governance matters. As a result, the Company's shareholders may not have the same protections afforded to shareholders of U.S. domestic companies that are subject to all corporate governance requirements.
The Company may lose its Foreign Private Issuer Status in the Future
The Company may in the future lose its foreign private issuer status if a majority of its common shares are held in the U.S. and if the Company fails to meet the additional requirements necessary to avoid loss of its foreign private issuer status. The regulatory and compliance costs under U.S. federal securities laws as a U.S. domestic issuer may be significantly more than the costs incurred as a Canadian foreign private issuer eligible to use the Multi-Jurisdictional Disclosure System ("MJDS"). If the Company is not a foreign private issuer, it would not be eligible to use the MJDS or other foreign issuer forms and would be required to file periodic and current reports and registration statements on U.S. domestic issuer forms with the SEC, which are more detailed and extensive than the forms available to a foreign private issuer, and would be required to file financial statements prepared in accordance with United States generally accepted accounting principles. In addition, the Company may lose the ability to rely upon exemptions from Nasdaq corporate governance requirements that are available to foreign private issuers.
The Company Relies Upon Certain Accommodations Available to It as an "Emerging Growth Company"
The Company is an "emerging growth company" as defined in section 3(a) of the U.S. Exchange Act (as amended by the JOBS Act, enacted on April 5, 2012), and the Company will continue to qualify as an emerging growth company until the earliest to occur of: (a) the last day of the fiscal year during which the Company has total annual gross revenues of $1,235,000,000 (as such amount is indexed for inflation every five years by the SEC) or more; (b) the last day of the fiscal year of the Company following the fifth anniversary of the date of the first sale of common equity securities of the Company pursuant to an effective registration statement under the U.S. Securities Act of 1933, as amended; (c) the date on which the Company has, during the previous three year period, issued more than $1,000,000,000 in non-convertible debt; and (d) the date on which the Company is deemed to be a "large accelerated filer", as defined in Rule 12b-2 under the U.S. Exchange Act. The Company will qualify as a large accelerated filer (and would cease to be an emerging growth company) at such time when on the last business day of its second fiscal quarter of such year the aggregate worldwide market value of its common equity held by non-affiliates will be $700,000,000 or more. For so long as the Company remains an emerging growth company, it is permitted to and intends to rely upon exemptions from certain disclosure requirements that are applicable to other public companies that are not emerging growth companies. These exemptions include not being required to comply with the auditor attestation requirements of Section 404 of the Sarbanes-Oxley Act. The Company cannot predict whether investors will find the common shares less attractive because the Company relies upon certain of these exemptions. If some investors find the common shares less attractive as a result, there may be a less active trading market for the common shares and the common share price may be more volatile. On the other hand, if the Company no longer qualifies as an emerging growth company, the Company would be required to divert additional management time and attention from the Company's development and other business activities and incur increased legal and financial costs to comply with the additional associated reporting requirements, which could negatively impact the Company's business, financial condition and results of operations.
Information Technology Systems Risk
The Company's information technology systems are subject to disruption, damage or failure from various causes, including, but are not limited to, computer viruses, security breaches, cyber-attacks, natural disasters and defects in design. The Company could also be adversely affected by system or network disruptions if new or upgraded information technology systems are defective, not installed properly or not properly integrated into the Company's operations. Incidents involving cyber security are evolving and include, without limitation, malicious software, attempts to gain unauthorized access to data and other electronic security breaches that could lead to disruptions in systems, unauthorized release of confidential or otherwise protected information and the corruption of data. Various measures have been implemented to manage the Company's risks related to its information technology systems and network disruptions. However, given the unpredictable nature, timing and scope of information technology system disruptions, the Company could potentially be subject to operational delays, the compromising of confidential or otherwise protected information, destruction or corruption of data, security breaches, other manipulation or improper use of its systems and networks or financial losses, any of which could have a material adverse effect on the Company's cash flows, reputation, financial condition or results of operations.
Reputational Risk
As a result of the increased usage and the speed and global reach of social media and other web-based tools used to generate, publish and discuss user-generated content and to connect with other users, companies today are at much greater risk of losing control over how they are perceived in the marketplace. Damage to the Company's reputation can be the result of the actual or perceived occurrence of any number of events, and could include any negative publicity, whether true or not. The Company places a great emphasis on protecting its image and reputation, but the Company does not ultimately have direct control over how it is perceived by others. Reputation loss may lead to increased challenges in developing and maintaining community relations, decreased investor confidence and an impediment to the Company's overall ability to advance its projects, thereby having a material adverse impact on financial performance, cash flows and growth prospects.
DIVIDENDS PAYMENTS AND DIVIDEND POLICY
The Company does not have any current intentions to pay dividends on its common shares. The Company intends to retain its future earnings, if any, to fund the development and growth of its business. There are no restrictions in the articles of the Company or elsewhere which prevent the Company from paying dividends. However, the Company has not historically paid any dividends and does not anticipate paying any dividends in the near future. Any decision to pay dividends on any common shares of the Company will be made by the board of directors on the basis of the Company's earnings, financial requirements and other factors existing at such future time, including, but not limited to, commodity prices, production levels (if any), capital expenditure requirements, debt service requirements (if any), operating costs, royalty burdens, foreign exchange rates and the satisfaction of the liquidity and solvency tests imposed by the BCBCA for the declaration and payment of dividends.
DESCRIPTION OF CAPITAL STRUCTURE
The Company is authorized to issue an unlimited number of common shares without par value. As of the date of the AIF, there were 87,564,647 common shares issued and outstanding.
The holders of the common shares of the Company have the right to one vote per common share at any meeting of shareholders, to receive any dividend declared by the board of directors, and to receive on a pro rata basis the remaining property of the Company on its dissolution, liquidation, winding up or other distribution of its assets or property among its shareholders for the purpose of winding up its affairs. The common shares do not contain any pre-emptive subscription, redemption or conversion rights.
In addition, the Company has also granted stock options, restricted share units and deferred share units under its current Omnibus Incentive Plan which incentive securities, upon vesting, may be exercisable for or settled, as applicable, for Common Shares.
MARKET FOR SECURITIES
Trading Price and Volume
The Company's common shares are listed and posted for trading on the TSXV under the symbol "MKO" and on the Nasdaq under the symbol "MAKO", with the TSXV being the primary trading market. The following table sets forth information relating to the monthly trading of the common shares on the TSXV for the financial year ended December 31, 2025.
| Month | Low (C$) | High (C$) | Volume (#) |
| January 2025 | 3.20 | 3.85 | 1,052,700 |
| February 2025 | 3.71 | 4.20 | 810,000 |
| March 2025 | 3.71 | 4.30 | 953,800 |
| April 2025 | 3.70 | 4.70 | 1,469,900 |
| May 2025 | 4.29 | 4.92 | 1,110,600 |
| June 2025 | 4.87 | 5.39 | 2,045,100 |
| July 2025 | 5.01 | 5.57 | 1,784,900 |
| August 2025 | 5.06 | 6.25 | 1,890,500 |
| September 2025 | 6.27 | 8.18 | 1,869,000 |
| October 2025 | 7.22 | 8.76 | 3,517,600 |
| November 2025 | 7.01 | 8.00 | 1,719,400 |
| December 2025 | 7.47 | 8.45 | 2,135,300 |
DIRECTORS AND OFFICERS
The following table sets forth, for each director and executive officer of the Company, the name, province or state and country of residence, the currently-held position with the Company, the period(s) during which any director has served as a director of the Company, the principal occupation during the five preceding years, and the number and percentage of common shares of the Company beneficially owned by the director and executive officers of the Company as a group, as of the date hereof. All directors of the Company hold office until the next annual meeting of shareholders of the Company or until their successors are elected or appointed.
| Name, Residence and Position Presently Held |
Principal Occupation (for last five years) | Term Served as Director |
| Mario Caron (1) (3) Ontario, Canada Director |
Corporate director; Lead director of Falco Resources Ltd. since December 2025; Chairman of New Molly LLC. from 2016 to 2023; Chairman of New Millenium Iron Corp. from June 2017 to December 2020, and Interim Chief Executive Officer of New Millenium Iron Corp. from March 2019 to December 2020. | June 5, 2020 |
| Nathan Eric Fier(3) British Columbia, Canada Director and Non-Executive Chairman |
Chief Executive Officer of SilverCrest Metals Inc., a mineral exploration and production company since 2015; and President of Maverick Mining Consultants Inc., a management consulting company since July 2001; Former Executive Chairman of Goldsource Mines Inc. from January to July 2024. | July 3, 2024 |
| Laurence (Laurie) Gaborit(2) (3) Ontario, Canada Director |
Chief Executive Officer of LG IRServices Inc., an investor relations consulting firm, since July 2019; Vice President Investor Relations of Dore Copper Mining Corp. (a mineral exploration and development company) from September 2020 to December 2024; Vice President Investor Relations of Detour Gold Corporation (a mineral exploration and production company) from January 2007 to June 2019. | July 3, 2024 |
| John Hick(1) (2) Ontario, Canada Director |
Corporate director | November 9, 2018 |
| Paul Jacobi Connecticut, USA Director |
Partner at Wexford Capital LP, a private investment firm | July 29, 2019 |
| Akiba Leisman(3) Connecticut, USA Director and Chief Executive Officer |
Chief Executive Officer of the Company | July 11, 2014 |
| Name, Residence and Position Presently Held |
Principal Occupation (for last five years) | Term Served as Director |
| Asheef Lalani (1) (2) Ontario, Canada Director |
Chief Investment Officer at Berczy Park Capital | July 2, 2025 |
| Steve Parsons Ontario, Canada President |
Chief Executive Officer of Goldsource Mines Inc., a mineral exploration company, from November 2020 to July 2024; President of Goldsource Mines Inc. from July 2024 to April 2025; President of Mako from April 2025 to present. | N/A |
| Ezequiel Sirotinsky Panama City, Panama CFO and Corporate Secretary |
Senior Finance Manager at Calibre Mining Corp. from May 2020 until April 2024; CFO and Corporate Secretary at the Company from June 2024 to present. | N/A |
| Paolo Durand Lima, Peru Vice President, Corporate Development |
Associate Vice President, Corporate Development at the Company from November 2021 until March 2022; Vice President of Corporate Development at the Company from March 2022 to present. | N/A |
| Jesse Munoz Arizona, USA Chief Operating Officer |
Chief Operating Officer at the Company since November 2018. | N/A |
| Frank Powell Colorado, USA Vice President, Exploration |
Senior Exploration Manager from January 2019 to June 2024; Vice President of Exploration from June 2024 to present. | N/A |
As at the date of this AIF, the directors and executive officers of the Company, as a group, beneficially owned, or controlled or directed, directly or indirectly, an aggregate of 2,574,016 Common Shares, representing approximately 2.94% of the issued and outstanding Common Shares as at the date of this AIF. The information as to the number of Common Shares beneficially owned, or controlled or directed, not being within the knowledge of the Company, has been furnished by the respective directors and officers of the Company individually.
Below is a biography of each of the directors and officers of the Company:
Mario Caron - Director
Mr. Mario Caron is a mining executive with over 40 years of wide-ranging international experience in the mining industry in senior executive and board positions. Mr. Caron is currently Lead Director of Falco Resources Ltd. From 2016 to 2023, he was the Chairman of New Moly LLC. (formerly known as Alloycorp Mining Inc.), which held a molybdenum deposit in British Columbia. He also acted as Chairman and Interim Chief Executive Officer of New Millenium Iron Corp. From November 2011 to July 2013, he served as Chief Executive Officer and a director of Aldridge Minerals Inc., developing a polymetallic massive sulfide deposit in Turkey. Previously, Mr. Caron served as a senior executive and directors for various publicly listed companies developing projects in Africa and South-East Asia. Mr. Caron is a past (retired) member of the Québec Order of Engineers and the Association of Professional Engineers of Ontario.
Nathan Eric Fier - Chairman
Mr. Fier is a Certified Professional Geologist and Engineer with over 30 years of experience in the international mining industry including exploration, acquisition, development and production of numerous mining projects in Guyana, Chile, Brazil, Central America, Mexico and Peru. He has in-depth knowledge of project evaluation and management, reserve estimation and economic analysis, construction, as well as operations management. Mr. Fier previously worked as Chief Geologist with Pegasus Gold Corp., Senior Engineer & Manager with Newmont Mining Corp., Project Manager with Eldorado Gold Corp. and Chief Operating Officer of Goldsource Mines Inc. Prior to the formation of SilverCrest Metals he was a co-founder and Chief Operating Officer of SilverCrest Mines Inc.
Laurence (Laurie) Gaborit - Director
Laurie Gaborit has over 30 years of combined work experience in mineral exploration, investor relations and corporate communications. Ms. Gaborit is currently the Chief Executive Officer of her own consulting firm, LG IRServices Inc. Prior Ms. Gaborit held the position of VP Investor Relations at Dore Copper and Detour Gold Corporation. As a key member of Detour Gold's management team, she participated in the company's initial public offering in 2007 and its transformation from exploration company to intermediate gold producer within a seven-year period, during which time Detour Gold's market capitalization increased from $120 million to over $3 billion.
John Hick - Lead Director
Mr. Hick has considerable experience in both senior management and director capacities with a number of public companies over the last 42 years, prior to which he was actively engaged in the practice of law in Ontario. Mr. Hick is currently President and Chief Executive Officer of his own consulting firm, John W. W. Hick Consultants Inc. During his career, he has also been the President and/or Chief Executive Officer of the following public companies where he has direct involvement in and responsibilities for the financial results and reporting of such companies: Medoro Resources Ltd., Grafton Group Limited, TVX Gold Inc., Geomaque Explorations Ltd., Defiance Mining Corporation and Rio Narcea Gold Mines Ltd. In addition to serving as a director, he has served on the audit committees of a number of public companies.
Paul Jacobi - Director
Paul joined Wexford in 1996 and focuses on Wexford's private equity energy investments. From 1995-96, Paul worked for Moody's Investors Services as an analyst covering the investment banking and asset management industries. From 1993-95, he was employed by Kidder Peabody & Co. as a senior financial analyst in the investment banking group. From 1988-93, Paul worked for KPMG Peat Marwick as an audit manager in the financial services practice. He holds a BS in accounting from Villanova University and is a Certified Public Accountant.
Akiba Leisman - Chief Executive Officer and Director
Akiba Leisman serves as the CEO and a Director of Mako Mining Corp. Previously, Akiba was Executive Chairman and Interim CEO of Marlin Gold Mining Ltd., leading the company through the spinout of Sailfish Royalty Corp. and the acquisition of Marlin by Golden Reign Resources Ltd. to form Mako. He also serves as the Executive Chairman and a Director of Sailfish, a Director at Bonterra Resources Inc. and as a consultant at Wexford Capital LP. Prior to Wexford, he was a Senior Analyst at Red Kite Capital Management for the Mine Finance funds where he was responsible for senior secured investments on metal mining assets. Previously, he was an Associate at Standard Bank working in the Structured Commodity Products and Mine Finance groups. Akiba has an MBA from New York University, and a B.S. in Chemical Engineering from Carnegie Mellon University.
Asheef Lalani - Director
Asheef Lalani serves as an independent director to the board of Sailfish Royalty Corp. Mr. Lalani graduated from the University of Waterloo with a Bachelor of Mathematics and Masters of Accounting, earned the CA/CPA designation in 2002 and is a CFA charterholder since 2003. Asheef first started his career with PricewaterhouseCoopers in 1998 and went on to become a portfolio manager at UBS Securities. Currently, Mr. Lalani is the Chief Investment Officer at Berczy Park Capital, a private family office in Toronto, Canada.
Steve Parsons - President
Mr. Parsons is an accomplished mining and capital markets professional with 25 years of combined capital markets, mine operations and senior executive expertise. Mr. Parsons spent 14 years in the investment industry, with the majority of that time as a Senior Equity Analyst at National Bank Financial and Wellington West Capital Markets, focussed on precious metals and precious metal companies. He has previously served as Senior Vice President, Investor Relations at Yamana Gold Inc., as well as Chief Executive Officer of Goldsource Mines Inc. prior to Goldsource Mines being acquired by Mako Mining Corp. in July 2024, following which Mr. Parsons acted as President of Goldsource Mines until his appointment as President of Mako Mining Corp. in April 2025. Mr. Parsons holds a Bachelor of Applied Science (Mining Engineering) from Queen's University and is a registered Professional Engineer in the province of Ontario.
Ezequiel Sirotinsky - CFO and Corporate Secretary
Ezequiel Sirotinsky serves as the CFO and Corporate Secretary of Mako Mining Corp. Ezequiel is a professional in accounting and finance with over 25 years of senior level experience in the mining industry, working in Argentina, Colombia and Central America (Nicaragua and Panama). Prior to joining Mako Mining, Ezequiel has held several senior positions with gold and silver producers such as Calibre Mining, AngloGold Ashanti, Silver Standard Resources and other mid-tier and junior mining companies. He is experienced with IFRS and regulatory financial reporting, treasury management, corporate financing, budgeting and forecasting, tax planning, compliance and auditing. He received a CPA degree from the University of Buenos Aires (Argentina) and a postgraduate diploma in human resources management from the School of Business of the University of Cape Town (South Africa) and is fluent in English and Spanish.
Paolo Durand - Vice President, Corporate Development
Mr. Durand has more than 12 years of combined Banking, Financial Control & Budgeting, and Business Development expertise in the mining sector. He previously served as Corporate Head of Cost & Budget with Minsur SA (a major Peruvian producer of tin and precious metals) and pioneered the Corporate Financial Planning area at Sierra Metals Inc. Prior to Sierra Metals, he worked as Business Development Manager with Minera Volcan and as Senior Equity Research Analyst with Credicorp Capital in Perú. Mr. Durand was also part of the Investment Banking Summer Program at Lehman Brothers in New York in 2008. He received a double degree in Economics (B.A) and Corporate Financial Management (B.B.A) at St. Mary's University, TX as well as an MBA from HEC, Paris.
Jesse Munoz - Chief Operating Officer
Jesse Munoz serves as Chief Operating Officer of Mako Mining Corp. and has over 39 years of experience working in the domestic and international mining sector. His successful career has included construction and start-up in both surface and underground mine projects, with attention to exceptional safety records. He has a diverse background and has focused primarily on production and the processing side of operations. He has extensive knowledge in conventional milling, heap leaching, agglomeration, crushing, refining, and both carbon adsorption and Merrill-Crowe recovery systems. Jesse's bilingual and bi-cultural capabilities have proven extremely valuable while working in various Latin American countries.
Frank Powell - Vice President, Exploration
Frank Powell has over 40 years of exploration experience globally, including 24 years in senior management with both major and junior gold exploration/mining companies such as Placer Dome, Oro Gold Ltd, Mako Mining Corp. Frank's career spans the sector from grass-roots to feasibility studies where he has lead teams in the acquisition, discovery, quantification and optimization of gold and platinum resources including: Las Cristinas, Venezuela; South Deeps, South Africa; Getchell Gold Mine, Nevada USA, Moss Gold Mine, Arizona USA; La Trinidad, Mexico; Sedibelo Platinum, South Africa and San Albino, Nicaragua. Frank holds a B.Sc. Geological Engineering at Colorado School of Mines.
Corporate Cease Trade Orders, Bankruptcies, Penalties or Sanctions
No director or executive officer of the Company is, as at the date hereof, or has been, within the 10 years before the date hereof, a director, chief executive officer or chief financial officer of any company that:
1. was the subject, while the proposed director was acting in the capacity as director, CEO or CFO of such company, of a cease trade or similar order or an order that denied the relevant company access to any exemption under securities legislation, that was in effect for a period of more than 30 consecutive days; or
2. was subject to a cease trade or similar order or an order that denied the relevant company access to any exemption under securities legislation, that was in effect for a period of more than 30 consecutive days, that was issued after the proposed director ceased to be a director, CEO or CFO but which resulted from an event that occurred while the proposed director was acting in the capacity as director, CEO or CFO of such company;
Other than as described below, no director or executive officer of the Company, or a shareholder holding a sufficient number of securities of the Company to affect materially the control of the Company:
1. is, as at the date hereof, or has been within 10 years before the date hereof, a director or executive officer of any company (including the Company) that, while that person was acting in that capacity, or within a year of that person ceasing to act in that capacity, became bankrupt, made a proposal under any legislation relating to bankruptcy or insolvency or was subject to or instituted any proceedings, arrangement or compromise with creditors or had a receiver, receiver manager or trustee appointed to hold its assets; or
2. has, within the 10 years before the date hereof, become bankrupt, made a proposal under any legislation relating to bankruptcy or insolvency, or become subject to or instituted any proceedings, arrangement or compromise with creditors, or had a receiver, receiver manager or trustee appointed to hold the assets of the proposed director, executive officer or shareholder; or
3. has been subject to any penalties or sanctions imposed by a court relating to securities legislation or by a securities regulatory authority or has entered into a settlement agreement with a securities regulatory authority; or
4. has been subject to any penalties or sanctions imposed by a court or regulatory body that would likely be considered important to a reasonable investor in making an investment decision.
On November 15, 2023, the Superior Court of Québec issued an initial order under the Companies' Creditors Arrangement Act ("CCAA") in respect of Monarch Mining Corporation ("Monarch"), a publicly listed company of which Laurie Gaborit was a director. Ms. Gaborit resigned her position as director of Monarch on November 15, 2023 following the announcement. Monarch was subsequently placed under the protection of the CCAA, and on June 30, 2025, the Superior Court of Québec issued an order terminating the CCAA proceedings upon issuance of a certificate of the monitor under the CCAA proceedings confirming the completion of the final stages of administration of the CCAA proceedings.
No director or executive officer of the Company, or a shareholder holding a sufficient number of securities of the Company to affect materially the control of the Company has been subject to any penalties or sanctions imposed by a court relating to securities legislation or by a securities regulatory authority or has entered into a settlement agreement with a securities regulatory authority, or has been subject to any other penalties or sanctions imposed by a court or regulatory body that would likely be considered important to a reasonable Shareholder in deciding whether to vote for a proposed director.
Conflicts of Interest
To the best of the Company's knowledge, and other than as disclosed herein, there are no known existing or potential conflicts of interest between the Company or any of its subsidiaries and any directors or officers of the Company or any of its subsidiaries, except that certain of the directors and officers serve as directors and officers of other public or private companies and therefore it is possible that a conflict may arise between their duties as a director or officer of the Company and their duties as a director or officer of such other companies.
The directors and officers of the Company are required by law to act honestly and in good faith with a view to the best interests of the Company and to disclose any interests that they may have in any project or opportunity of the Company. If a conflict of interest arises at a meeting of the board, any director in a conflict is required to disclose his interest and abstain from voting on such matter in accordance with the BCBCA.
LEGAL PROCEEDINGS AND REGULATORY ACTIONS
There are no material legal proceedings that the Company is or was a party to, or that any of the Company's property is or was the subject of, during the most recently completed financial year and there are no such legal proceedings that the Company knows to be contemplated.
There were no penalties or sanctions imposed against the Company by a court relating to securities legislation or by a securities regulatory authority during the most recently completed financial year; any other penalties or sanctions imposed by a court or regulatory body against the Company that would likely be considered important to a reasonable investor in making an investment decision; and no settlement agreements that the Company entered into before a court relating to securities legislation or with a securities regulatory authority during the most recently completed financial year.
INTERESTS OF MANAGEMENT AND OTHERS IN MATERIAL TRANSACTIONS
No director, executive officer or beneficial holder of 10% or more of the common shares of the Company, or any associate or affiliate thereof, had any interest, direct or indirect, in any transaction within the three most recently completed financial years or during the current financial year that has materially affected or is reasonably expected to materially affect the Company.
TRANSFER AGENTS AND REGISTRARS
The registrar and transfer agent for the Company's Common Shares is Computershare Investor Services Inc. at its office in Vancouver, British Columbia.
MATERIAL CONTRACTS
Except for contracts entered into in the ordinary course of business, no other material contracts have been entered into by Mako during the financial year ended December 31, 2025 or before such time which are still in effect.
INTERESTS OF EXPERTS
The San Albino Technical Report was prepared by or under the supervision of each of Steven Ristorcelli, C.P.G., John Rust, Registered Member, SME, Peter Ronning, P.Eng., Thomas Dyer, P.E., Matthew Gray, C.P.G., and Brian Ray, P. Geo. of Respec Company LLC, each of whom is a qualified person within the meaning of NI 43-101. See "Description of the Business - Material Mineral Properties.
The Eagle Mountain Technical Report was prepared by or under the supervision of each of Nigel Fung, P. Eng., Leon McGarry, B. SC., P.Geo., Antoine Berton, Soutex, P. Eng., and Rolf Schmitt, P. Geo., each of whom is a qualified person within the meaning of NI 43-101. See "Description of the Business - Material Mineral Properties.
The Moss Mine Technical Report was prepared by or under the supervision of each of William J. Lewis, P.Geo and Richard M. Gowans, P.Eng of Micon International Limited, Christopher Keech, P.Geo of CGK Consulting Services Inc., and (Gary) Yee-Yuen Wong, P.Eng of PDM Technical Services Ltd., each of whom is a qualified person within the meaning of NI 43-101. See "Description of the Business -Material Mineral Properties.
The Mt. Hamilton Technical Report was prepared by or under the supervision of each of Michael B. Dufresne, P. Geo and Andrew Turner, P. Geo of APEX Geoscience, David Frost, FAusIMM of DRA Americas Inc., and James N. Gray, P. Geo of Advantage Geoservices Ltd., each of whom is a qualified person within the meaning of NI 43-101. See "Description of the Business - Material Mineral Properties.
The above-noted qualified persons have confirmed that they have not received, do not hold, nor do they expect to receive, any interest in the securities or other property of Mako or its affiliates or associates, or less than 1% of the securities of the Company.
Eric Fier, CPG, P.Eng, a qualified person within the meaning of NI 43-101, is responsible for all scientific and technical disclosure set out in the AIF in respect of the Eagle Mountain Project, other than information summarized from the Eagle Mountain Technical Report, and is not independent within the meaning of NI 43-101 as he is Chairman of Mako. Mr. Fier owns, directly or indirectly, less than 1% of the securities of the Company.
John Rust, a qualified person within the meaning of NI 43-101, is responsible for all scientific and technical disclosure set out in the AIF in respect of San Albino Project, the Moss Mine and the Mt. Hamilton Mine, other than information summarized from the San Albino Technical Report, the Moss Mine Technical Report and the Mt. Hamilton Technical Report, and is not independent within the meaning of NI 43-101 as he is Chief Metallurgist of Mako. Mr. Rust owns, directly or indirectly, less than 1% of the securities of the Company.
The Company's independent registered public accounting firm is PricewaterhouseCoopers LLP, Chartered Professional Accountants, who have issued a Report of Independent Registered Public Accounting Firm dated March 31, 2026, in respect of the Company's consolidated financial statements as at December 31, 2025, and December 31, 2024 and for each of the years then ended. PricewaterhouseCoopers LLP has advised that they are independent with respect to the Corporation within the meaning of the relevant rules and related interpretations prescribed by the relevant professional bodies in Canada, including the CPABC Code of Professional Conduct and any applicable legislation or regulations, as well as the rules of the US Securities and Exchange Commission (SEC) and the Public Company Accounting Oversight Board (PCAOB) on auditor independence.
AUDIT COMMITTEE
Audit Committee Charter
In accordance with applicable Canadian securities legislation and, in particular, NI 52-110, information with respect to the Company's Audit Committee is contained below.
The Audit Committee is responsible for monitoring the Company's systems and procedures for financial reporting and internal control, reviewing certain public disclosure documents and monitoring the performance and independence of the Company's external auditors. The Audit Committee is also responsible for reviewing the Company's annual audited financial statements, unaudited quarterly financial statements and management's discussion and analysis of financial results of operations for both annual and interim financial statements and review of related operations prior to their approval by the full board of directors of the Company. The full text of the Audit Committee's charter is attached hereto as Schedule "A".
Composition of the Audit Committee
As of the date hereof, the Audit Committee of the Company consists of John Hick (Chair), Mario Caron, and Asheef Lalani, each of whom are "independent" and "financially literate" within the meaning of NI 52-110.
NI 52-110 provides that a member of an audit committee is "independent" if the member has no direct or indirect material relationship with the Company, which could, in the view of the board, reasonably interfere with the exercise of the member's independent judgment. NI 52-110 also provides that an individual is "financially literate" if he or she has the ability to read and understand a set of financial statements that present a breadth and level of complexity of accounting issues that are generally comparable to the breadth and complexity of the issues that can reasonably be expected to be raised by the Company's financial statements.
Relevant Education and Experience
John Hick (Chair) - Mr. Hick has considerable experience in both senior management and director capacities with a number of public companies over the last 42 years, prior to which he was actively engaged in the practice of law in Ontario. Mr. Hick is currently President and Chief Executive Officer of his own consulting firm, John W. W. Hick Consultants Inc. During his career, he has also been the President and/or Chief Executive Officer of the following public companies where he has direct involvement in and responsibilities for the financial results and reporting of such companies: Medoro Resources Ltd., Grafton Group Limited, TVX Gold Inc., Geomaque Explorations Ltd., Defiance Mining Corporation and Rio Narcea Gold Mines Ltd. In addition to serving as a director, he has served on the audit committees of a number of public companies and is currently serving on the audit committee of Premium Nickel Resources Ltd.
Mario Caron - Mr. Mario Caron is a mining executive with over 40 years of experience in the mining industry in senior executive and board positions. His experience was gained nationally and internationally. During his career, Mr. Caron served on several audit committees and is currently a member of the audit committee of Falco Resources Ltd., a TSXV listed company. Mr. Caron received his Bachelor of Engineering, Mining at McGill University and is a retired member of the Ordre des ingénieurs du Québec and the Association of Professional Engineers of Ontario.
Asheef Lalani - Mr. Asheef Lalani is a CFA charterholder and previously qualified as a chartered accountant, and holds a Bachelor of Mathematics (honours) in math accountancy and a Master of Accounting from the University of Waterloo. Mr. Lalani is currently chief investment officer at Canadian based family office Berczy Park Capital and a director at Sailfish Royalty Corp., and has previously held various positions in Toronto and New York at UBS Securities, and was previously a senior audit associate at PricewaterhouseCoopers LLP.
Reliance on Certain Exemptions
At no time since the commencement of the Company's most recently completed financial year has the Company relied on the exemptions in Section 2.4, 6.1 or an exemption from NI 52-110, in whole or in part, granted under Part 8 of NI 52-110.
Audit Committee Oversight
Since the commencement of the Company's most recently completed financial year, the Audit Committee of the Company has not made any recommendations to the Board to nominate or compensate any external auditor which were not adopted by the Board.
Pre-Approval Policies and Procedures
The Audit Committee's charter sets out responsibilities regarding the provision of non-audit services by the Company's external auditors. This policy encourages consideration of whether the provision of services other than audit services is compatible with maintaining the auditor's independence and requires Audit Committee pre-approval of permitted audit and audit-related services.
External Auditor Services Fees
The Audit Committee has reviewed the nature and amount of the non-audit services provided by the external auditors to the Company to ensure auditor independence. The aggregate fees billed by the Company's independent auditors in connection with each of the last two fiscal years ended December 31, 2025 and 2024 are as follows:
| Year Ended | Audit Fees(1) | Audit Related Fees |
Tax Fees(2) | All Other Fees(3) |
| 2025 | 796,732 | Nil | 279,585 | 5,073 |
| 2024 | 421,805 | Nil | 55,786 | 64,568 |
Notes:
(1) The aggregate fees billed by the Company’s auditors for assurance services in connection with the audit and review of the Company’s annual and quarterly consolidated financial statements, respectively.
(2) The aggregate fees billed for professional services rendered by the Company’s auditors for tax compliance, tax advice and tax planning.
(3) "All Other Fees” include all other non-audit services.
ADDITIONAL INFORMATION
Additional information relating to the Company may be found under the Company's SEDAR+ profile at www.sedarplus.ca and under the Company's EDGAR profile at www.sec.gov.
Additional information, including directors' and officers' remuneration and indebtedness, principal holders of the Company's securities and securities authorized for issuance under equity compensation plans is contained in the Company's management information circular dated August 21, 2025 and filed in connection with the annual and special general meeting of shareholders held on September 30, 2025.
Additional financial information is provided in the Company's annual financial statements and MD&A for the year ended December 31, 2025 and 2024, each of which is available under the Company's SEDAR+ profile at www.sedarplus.ca and under the Company's EDGAR profile at www.sec.gov.
SCHEDULE A
AUDIT COMMITTEE CHARTER
MANDATE
The primary function of the Audit Committee is to oversee the Company's accounting and financial reporting processes and the audit of the Company's financial statements. Consistent with this function, the Audit Committee will encourage continuous improvement of, and should foster adherence to, the Company's policies, procedures and practices at all levels. The Audit Committee's primary duties and responsibilities are to:
COMPOSITION
The Audit Committee shall be comprised of three directors as determined by the Board, each of whom shall meet the criteria for independence set forth in National Instrument 52-110 - Audit Committees and Rule 10A-3(b)(1) under the U.S. Exchange Act of 1934 and be free from any relationship that, in the opinion of the Board, would interfere with the exercise of his or her independent judgment as a member of the Audit Committee. No member of the Audit Committee can have participated in the preparation of the Company's or any of its subsidiaries' financial statements at any time during the past three years.
At least one member of the Audit Committee shall have accounting or related financial management expertise. All members of the Audit Committee that are not financially literate will work towards becoming financially literate to obtain a working familiarity with basic finance and accounting practices. For the purposes of the Company's Charter, the definition of "financially literate" is the ability to read and understand a set of financial statements that present a breadth and level of complexity of accounting issues that are generally comparable to the breadth and complexity of the issues that can presumably be expected to be raised by the Company's financial statements.
The members of the Audit Committee shall be elected by the Board at its first meeting following the annual shareholders' meeting. Unless a Chair is elected by the full Board, the members of the Audit Committee may designate a Chair by a majority vote of the full Committee membership.
MEETINGS
The Audit Committee shall meet a least quarterly, or more frequently as circumstances dictate. As part of its job to foster open communication, the Audit Committee will meet at least annually with the CFO and the independent auditors in separate sessions.
The Corporate Secretary shall be the Committee Secretary unless otherwise determined by the Committee. Committee meetings and proceedings must be duly documented, filed, kept and shall be maintained with the records of the Company.
Responsibilities and Duties
To fulfill its responsibilities and duties, the Committee shall:
Documents/Reports Review
(a) Review and update the Audit Committee Charter annually.
(b) Review the Company's financial statements, MD&A and any annual and interim earnings, press releases before the Company publicly discloses this information and any reports or other financial information (including quarterly financial statements), which are submitted to any governmental body, or to the public, including any certification, report, opinion, or review rendered by the independent auditors.
Independent Auditors
(a) (1) Select and retain an independent registered public accounting firm to act as the Company's independent auditors for the purpose of auditing the Company's annual financial statements, books, records, accounts and internal controls over financial reporting, subject to ratification by the Company's stockholders of the selection of the independent auditors, (2) set the compensation of the Company's independent auditors, (3) oversee the work done by the Company's independent auditors, and (4) terminate the Company's independent auditors, if necessary.
(b) Select, retain, compensate, oversee and terminate, if necessary, any other registered public accounting firm engaged for the purpose of preparing or issuing an audit report or performing other audit, review or attest services for the Company.
(c) Obtain annually, a formal written statement of independent auditors setting forth all relationships between the independent auditors and the Company and any of its subsidiaries, consistent with Independence Standards Board Standard 1.
(d) Review and discuss with the independent auditors any disclosed relationships or services that may impact the objectivity and independence of the independent auditors.
(e) Take appropriate action to oversee the independence of the independent auditors.
(f) At each meeting, consult with the independent auditors, without the presence of management, about the quality of the Company's accounting principles, internal controls and the completeness and accuracy of the Company's financial statements.
(g) Review and approve the Company's hiring policies regarding partners, employees and former partners and employees of the present and former independent auditors of the Company.
(h) Review with management and the independent auditors the audit plan for the year-end financial statements and intended template for such statements.
(i) Review and pre-approve all audit and audit-related services and the fees and other compensation related thereto, and any non-audit services, provided by the Company's external auditors. The pre-approval requirement is waived with respect to the provision of non-audit services if:
(1) the aggregate amount of all such non-audit services provided to the Company constitutes not more than five percent of the total amount of revenues paid by the Company to its independent auditors during the fiscal year in which the non-audit services are provided;
(2) such services were not recognized by the Company at the time of the engagement to be non-audit services; and
(3) such services are promptly brought to the attention of the Audit Committee by the Company and approved prior to the completion of the audit by the Audit Committee or by one or more members of the Audit Committee who are members of the Board to whom authority to grant such approvals has been delegated by the Audit Committee.
Financial Reporting Processes
(a) In consultation with the independent auditors, review with management the integrity of the Company's financial reporting process, both internal and external.
(b) Consider the independent auditors' judgments about the quality and appropriateness of the Company's accounting principles as applied in its financial reporting.
(c) Consider and approve, if appropriate, changes to the Company's auditing and accounting principles and practices as suggested by the independent auditors and management.
(d) Review significant judgments made by management in the preparation of the financial statements and the view of the independent auditors as to appropriateness of such judgments.
(e) Following completion of the annual audit, review separately with management and the independent auditors any significant difficulties encountered during the course of the audit, including any restrictions on the scope of work or access to required information.
(f) Review any significant disagreement among management and the independent auditors in connection with the preparation of the financial statements.
(g) Review with the independent auditors and management the extent to which changes and improvements in financial or accounting practices have been implemented.
(h) Review any complaints or concerns about any questionable accounting, internal accounting controls or auditing matters.
(i) Review certification process.
(j) Establish and oversee procedures for the receipt, retention and treatment of complaints received by the Company regarding accounting, internal accounting controls or auditing matters and the confidential, anonymous submission by Company employees of concerns regarding questionable accounting or auditing matters
Risk Management
(a) Review, at least annually, and more frequently, if necessary, the Company's policies for risk assessment and risk management (the identification, monitoring, and mitigation of risks).
(b) Inquire of management and the independent auditor about significant business, political, financial and control risks or exposure to such risk.
(c) Request the independent auditor's opinion of management's assessment of significant risks facing the Company and how effectively they are being managed or controlled.
(d) Assess the effectiveness of the over-all process for identifying principal business risks and report thereon to the Board.
Related Party Transactions
If requested by the Chief Financial Officer, review and oversee any transaction with a related party (as defined in Multilateral Instrument 61-101 - Protection of Minority Security Holders in Special Transactions), and any other potential conflict of interest, and approve, ratify or disapprove such transaction, as applicable, in accordance with Company's Related Party Transactions Policy.
Other
The Committee shall have the authority, in its sole discretion, to retain and obtain the advice and assistance of independent outside counsel, accountants and such other experts and advisors as it deems necessary to fulfill its duties and responsibilities under this Charter.
The Committee shall set the compensation, and oversee the work, of any outside counsel and other advisors. The Committee shall receive appropriate funding from the Company, as determined by the Committee in its capacity as a committee of the Board, for the payment of compensation to the Company's independent auditors, any other accounting firm engaged to perform services for the Company, any outside counsel and any other experts or advisors to the Committee.
The Committee shall have the authority to delegate any of its responsibilities, along with the authority to take action in relation to such responsibilities, to one or more subcommittees as the Committee may deem appropriate in its sole discretion.
The Committee shall conduct an annual evaluation of the performance of its duties under this Charter and shall present the results of the evaluation to the Board. The Committee shall conduct this evaluation in such manner as it deems appropriate.