| W a l m a r t – H o w e l l , M I NYSE: PINE - Investor Presentation - 4Q 2025 |
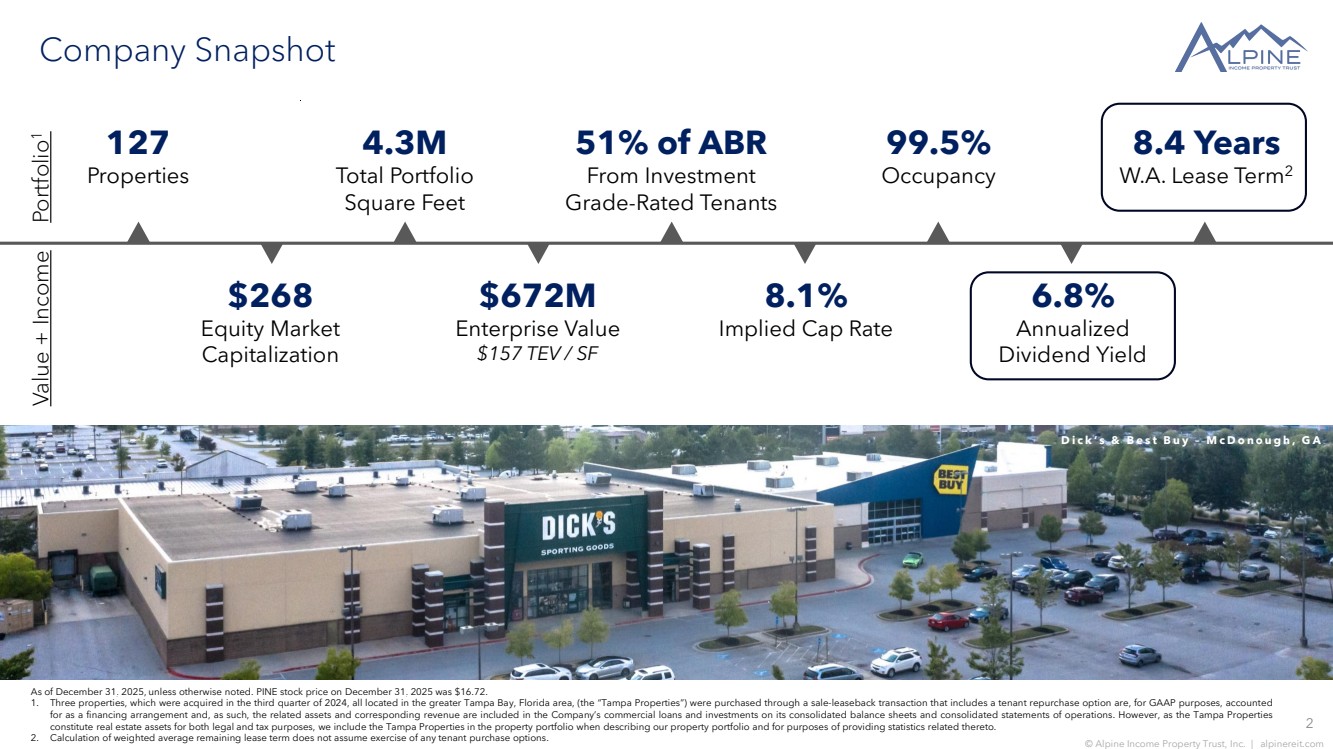
| 2 © Alpine Income Property Trust, Inc. | alpinereit.com As of December 31, 2025, unless otherwise noted. PINE stock price on December 31, 2025 was $16.72. 1. Three properties, which were acquired in the third quarter of 2024, all located in the greater Tampa Bay, Florida area, (the “Tampa Properties”) were purchased through a sale-leaseback transaction that includes a tenant repurchase option are, for GAAP purposes, accounted for as a financing arrangement and, as such, the related assets and corresponding revenue are included in the Company’s commercial loans and investments on its consolidated balance sheets and consolidated statements of operations. However, as the Tampa Properties constitute real estate assets for both legal and tax purposes, we include the Tampa Properties in the property portfolio when describing our property portfolio and for purposes of providing statistics related thereto. 2. Calculation of weighted average remaining lease term does not assume exercise of any tenant purchase options. 127 Properties $672M Enterprise Value $157 TEV / SF 4.3M Total Portfolio Square Feet 8.1% Implied Cap Rate 99.5% Occupancy 51% of ABR From Investment Grade-Rated Tenants 6.8% Annualized Dividend Yield $268 Equity Market Capitalization Portfolio1 Value + Income 8.4 Years W.A. Lease Term2 Company Snapshot D i c k ’ s & B e s t B u y – M c D o n o u g h , G A |
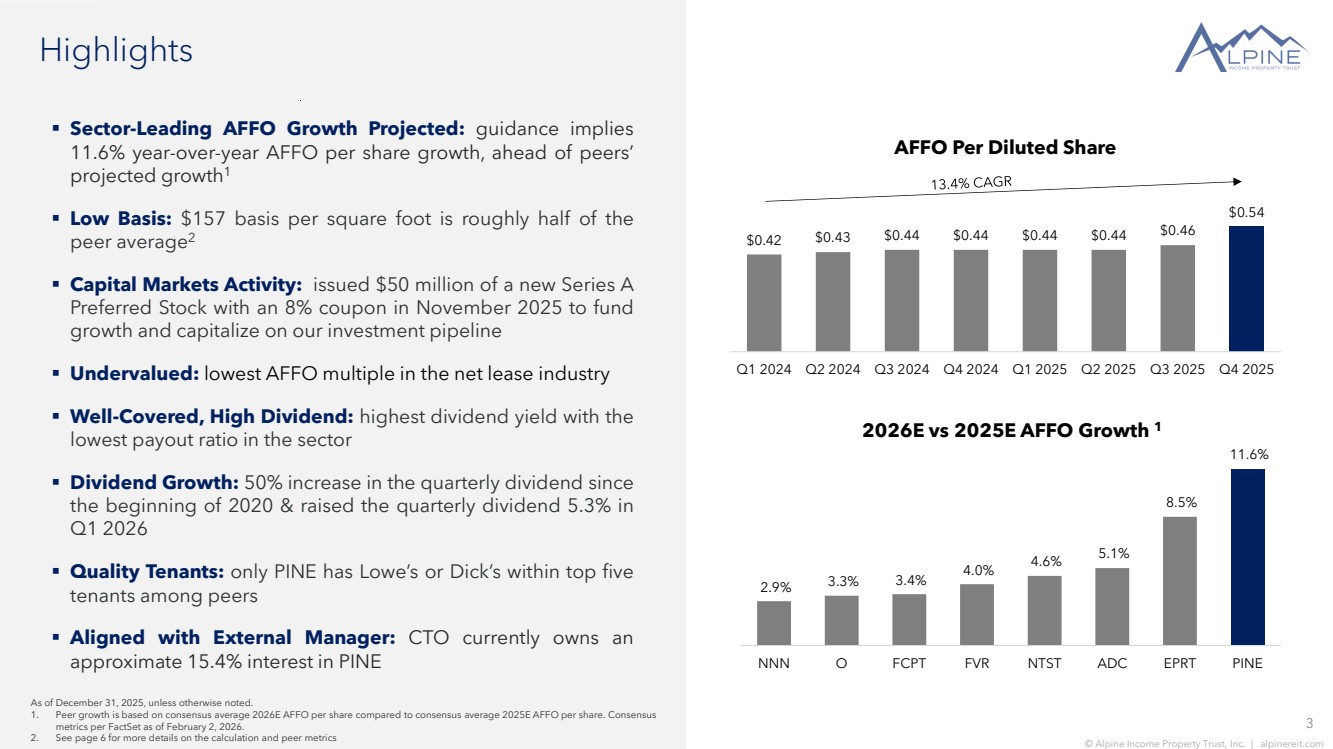
| 3 © Alpine Income Property Trust, Inc. | alpinereit.com $0.42 $0.43 $0.44 $0.44 $0.44 $0.44 $0.46 $0.54 Q1 2024 Q2 2024 Q3 2024 Q4 2024 Q1 2025 Q2 2025 Q3 2025 Q4 2025 AFFO Per Diluted Share Highlights As of December 31, 2025, unless otherwise noted. 1. Peer growth is based on consensus average 2026E AFFO per share compared to consensus average 2025E AFFO per share. Consensus metrics per FactSet as of February 2, 2026. 2. See page 6 for more details on the calculation and peer metrics ▪ Sector-Leading AFFO Growth Projected: guidance implies 11.6% year-over-year AFFO per share growth, ahead of peers’ projected growth1 ▪ Low Basis: $157 basis per square foot is roughly half of the peer average2 ▪ Capital Markets Activity: issued $50 million of a new Series A Preferred Stock with an 8% coupon in November 2025 to fund growth and capitalize on our investment pipeline ▪ Undervalued: lowest AFFO multiple in the net lease industry ▪ Well-Covered, High Dividend: highest dividend yield with the lowest payout ratio in the sector ▪ Dividend Growth: 50% increase in the quarterly dividend since the beginning of 2020 & raised the quarterly dividend 5.3% in Q1 2026 ▪ Quality Tenants: only PINE has Lowe’s or Dick’s within top five tenants among peers ▪ Aligned with External Manager: CTO currently owns an approximate 15.4% interest in PINE 2.9% 3.3% 3.4% 4.0% 4.6% 5.1% 8.5% 11.6% NNN O FCPT FVR NTST ADC EPRT PINE 2026E vs 2025E AFFO Growth 1 |
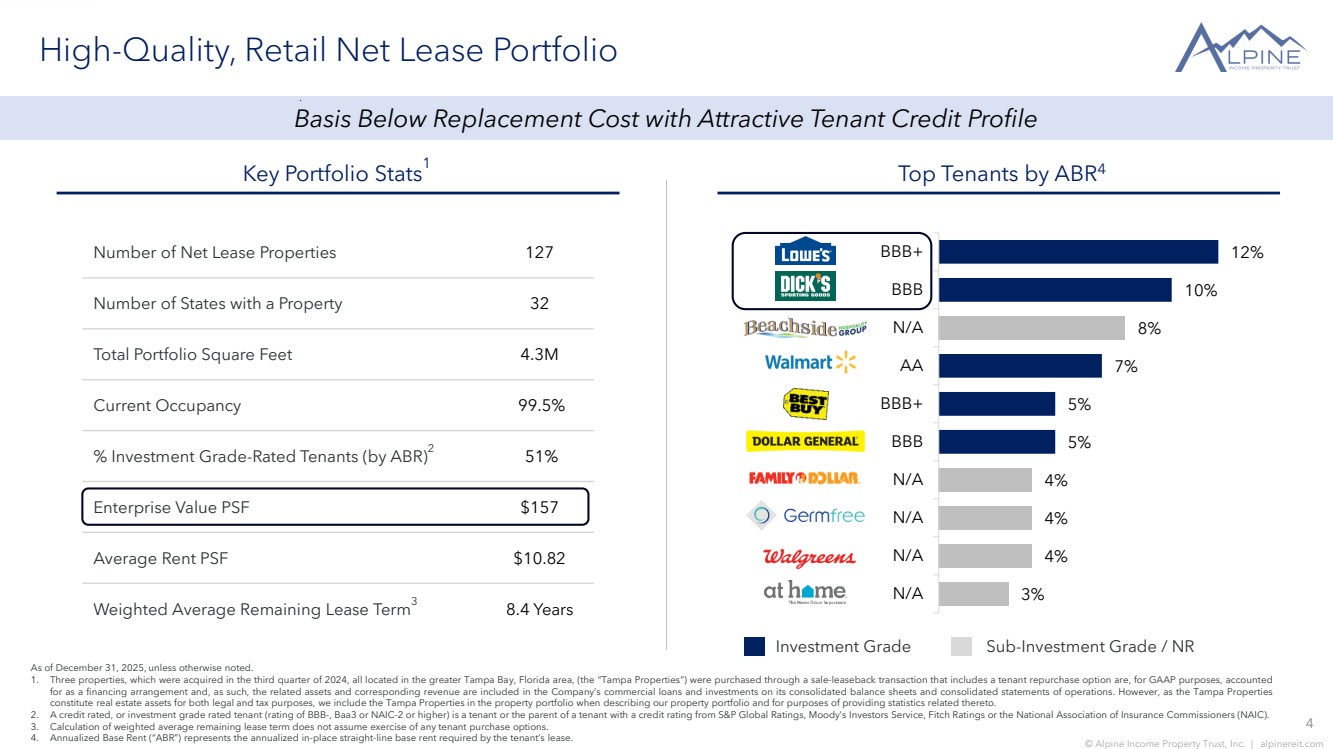
| 4 © Alpine Income Property Trust, Inc. | alpinereit.com 12% 10% 8% 7% 5% 5% 4% 4% 4% 3% BBB+ BBB N/A AA BBB+ BBB N/A N/A N/A N/A High-Quality, Retail Net Lease Portfolio Number of Net Lease Properties 127 Number of States with a Property 32 Total Portfolio Square Feet 4.3M Current Occupancy 99.5% % Investment Grade-Rated Tenants (by ABR)2 51% Enterprise Value PSF $157 Average Rent PSF $10.82 Weighted Average Remaining Lease Term3 8.4 Years Key Portfolio Stats1 Top Tenants by ABR4 Investment Grade Sub-Investment Grade / NR As of December 31, 2025, unless otherwise noted. 1. Three properties, which were acquired in the third quarter of 2024, all located in the greater Tampa Bay, Florida area, (the “Tampa Properties”) were purchased through a sale-leaseback transaction that includes a tenant repurchase option are, for GAAP purposes, accounted for as a financing arrangement and, as such, the related assets and corresponding revenue are included in the Company’s commercial loans and investments on its consolidated balance sheets and consolidated statements of operations. However, as the Tampa Properties constitute real estate assets for both legal and tax purposes, we include the Tampa Properties in the property portfolio when describing our property portfolio and for purposes of providing statistics related thereto. 2. A credit rated, or investment grade rated tenant (rating of BBB-, Baa3 or NAIC-2 or higher) is a tenant or the parent of a tenant with a credit rating from S&P Global Ratings, Moody’s Investors Service, Fitch Ratings or the National Association of Insurance Commissioners (NAIC). 3. Calculation of weighted average remaining lease term does not assume exercise of any tenant purchase options. 4. Annualized Base Rent (“ABR”) represents the annualized in-place straight-line base rent required by the tenant’s lease. Basis Below Replacement Cost with Attractive Tenant Credit Profile |
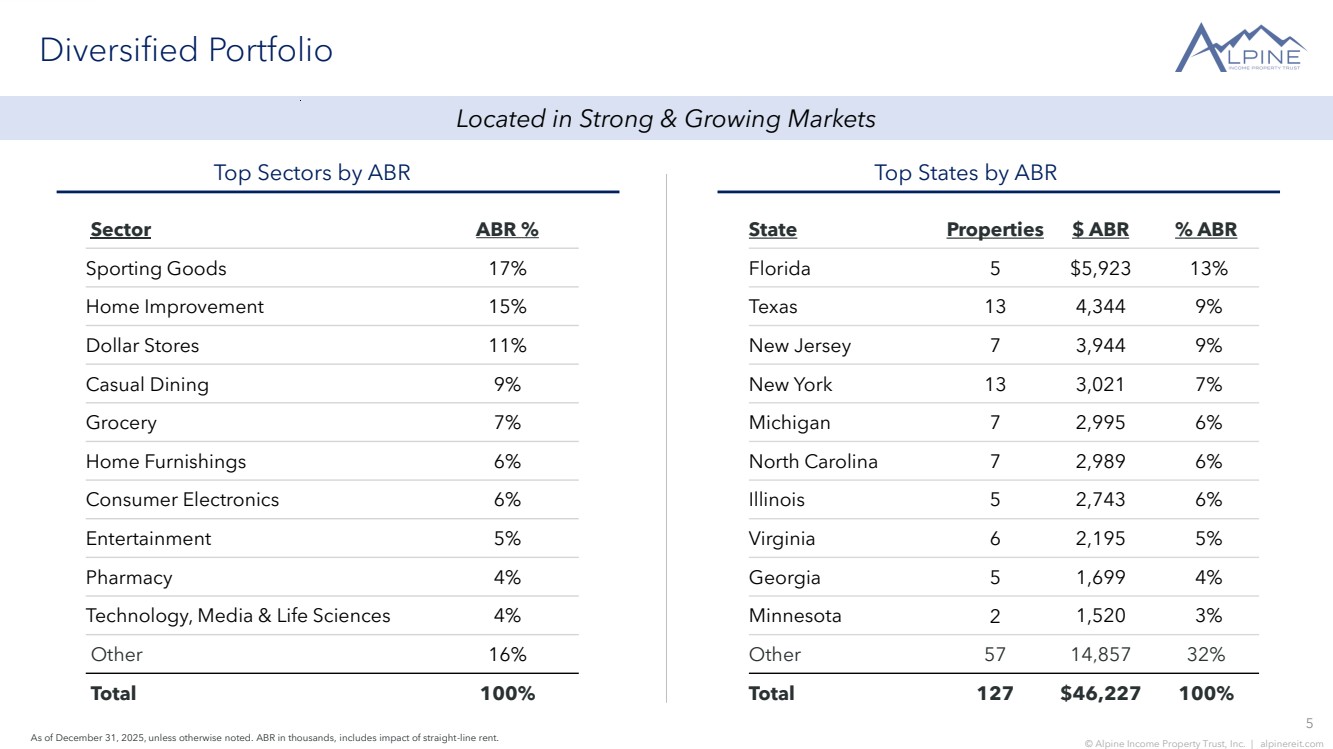
| 5 © Alpine Income Property Trust, Inc. | alpinereit.com Sector ABR % Sporting Goods 17% Home Improvement 15% Dollar Stores 11% Casual Dining 9% Grocery 7% Home Furnishings 6% Consumer Electronics 6% Entertainment 5% Pharmacy 4% Technology, Media & Life Sciences 4% Other 16% Total 100% Diversified Portfolio Top States by ABR As of December 31, 2025, unless otherwise noted. ABR in thousands, includes impact of straight-line rent. Top Sectors by ABR State Properties $ ABR % ABR Florida 5 $5,923 13% Texas 13 4,344 9% New Jersey 7 3,944 9% New York 13 3,021 7% Michigan 7 2,995 6% North Carolina 7 2,989 6% Illinois 5 2,743 6% Virginia 6 2,195 5% Georgia 5 1,699 4% Minnesota 2 1,520 3% Other 57 14,857 32% Total 127 $46,227 100% Located in Strong & Growing Markets |
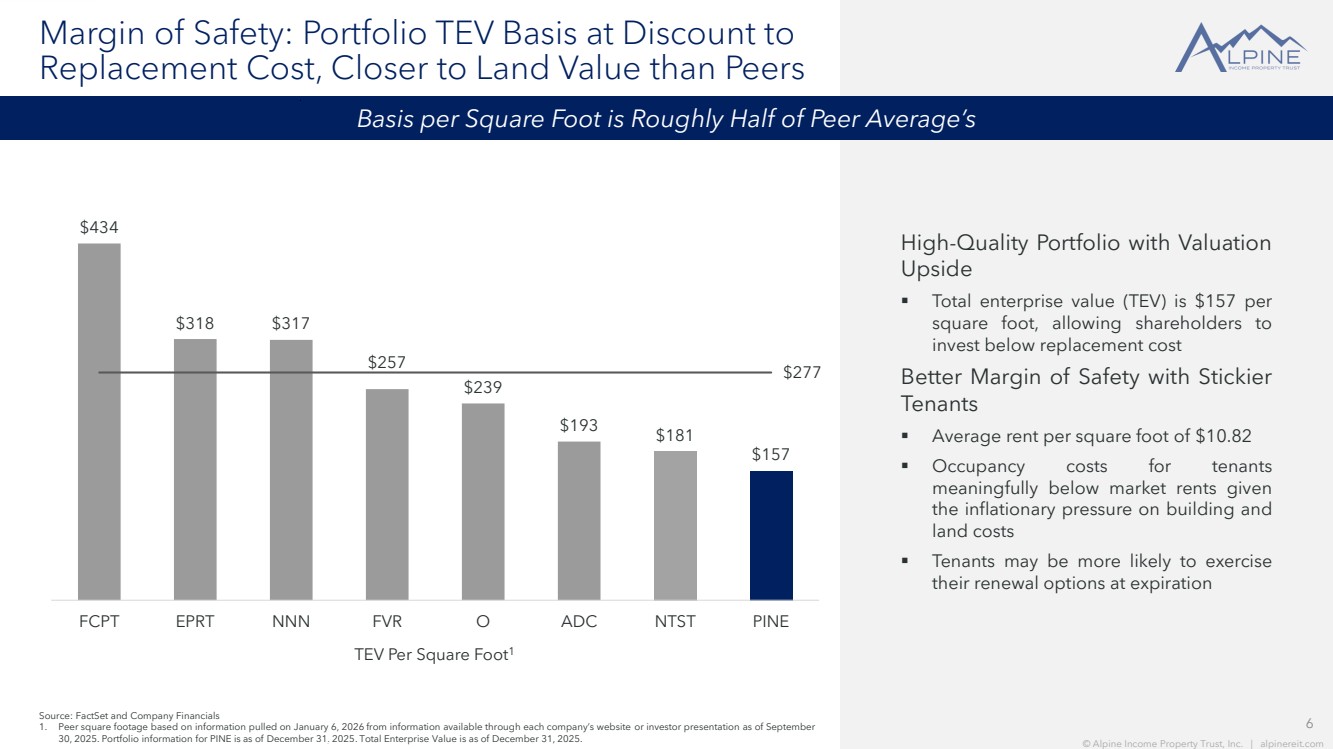
| 6 © Alpine Income Property Trust, Inc. | alpinereit.com $434 $318 $317 $257 $239 $193 $181 $157 $277 FCPT EPRT NNN FVR O ADC NTST PINE Margin of Safety: Portfolio TEV Basis at Discount to Replacement Cost, Closer to Land Value than Peers High-Quality Portfolio with Valuation Upside ▪ Total enterprise value (TEV) is $157 per square foot, allowing shareholders to invest below replacement cost Better Margin of Safety with Stickier Tenants ▪ Average rent per square foot of $10.82 ▪ Occupancy costs for tenants meaningfully below market rents given the inflationary pressure on building and land costs ▪ Tenants may be more likely to exercise their renewal options at expiration Source: FactSet and Company Financials 1. Peer square footage based on information pulled on January 6, 2026 from information available through each company’s website or investor presentation as of September 30, 2025. Portfolio information for PINE is as of December 31, 2025. Total Enterprise Value is as of December 31, 2025. TEV Per Square Foot1 6 © Alpine Income Property Trust, Inc. | alpinereit.com Basis per Square Foot is Roughly Half of Peer Average’s |
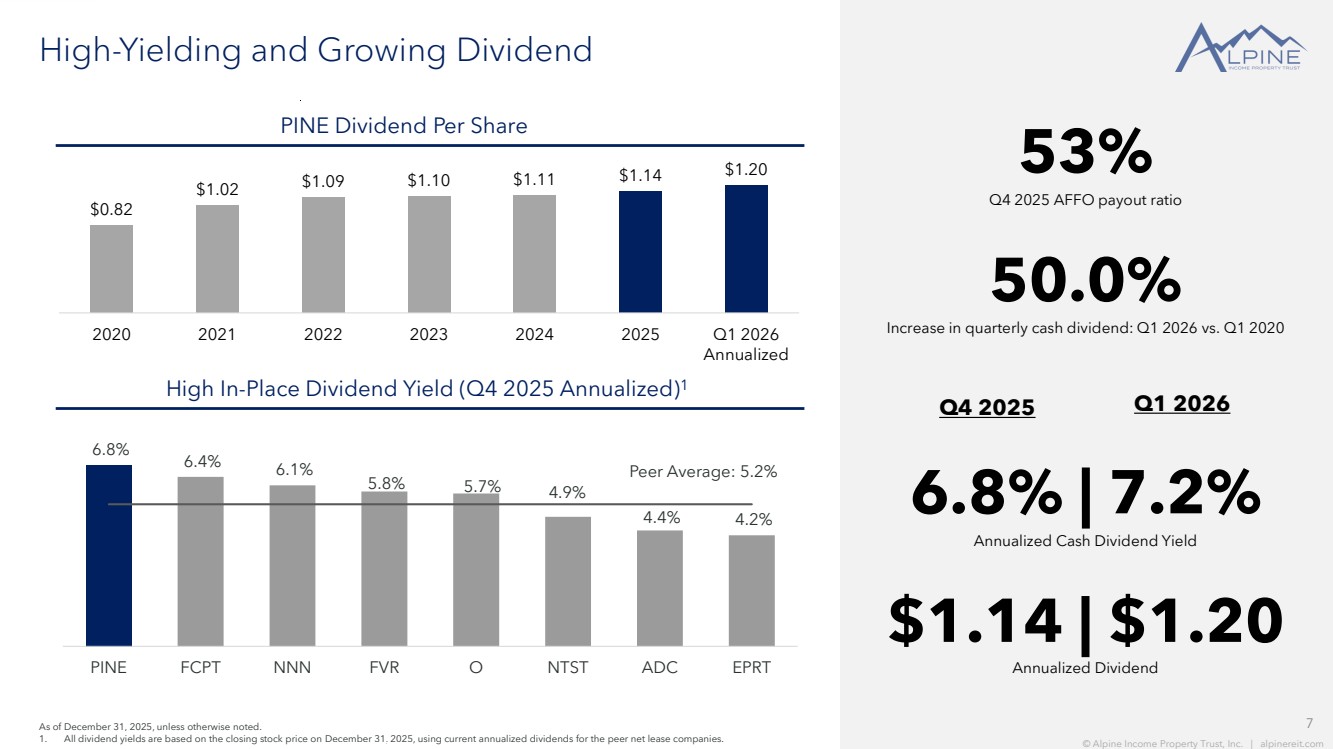
| 7 © Alpine Income Property Trust, Inc. | alpinereit.com Annualized Cash Dividend Yield 6.8% | 7.2% As of December 31, 2025, unless otherwise noted. 1. All dividend yields are based on the closing stock price on December 31, 2025, using current annualized dividends for the peer net lease companies. Annualized Dividend $1.14 | $1.20 High In-Place Dividend Yield (Q4 2025 Annualized)1 7 © Alpine Income Property Trust, Inc. | alpinereit.com Q4 2025 AFFO payout ratio 53% PINE Dividend Per Share High-Yielding and Growing Dividend $0.82 $1.02 $1.09 $1.10 $1.11 $1.14 $1.20 2020 2021 2022 2023 2024 2025 Q1 2026 Annualized 6.8% 6.4% 6.1% 5.8% 5.7% 4.9% 4.4% 4.2% Peer Average: 5.2% PINE FCPT NNN FVR O NTST ADC EPRT Increase in quarterly cash dividend: Q1 2026 vs. Q1 2020 50.0% Q4 2025 Q1 2026 |
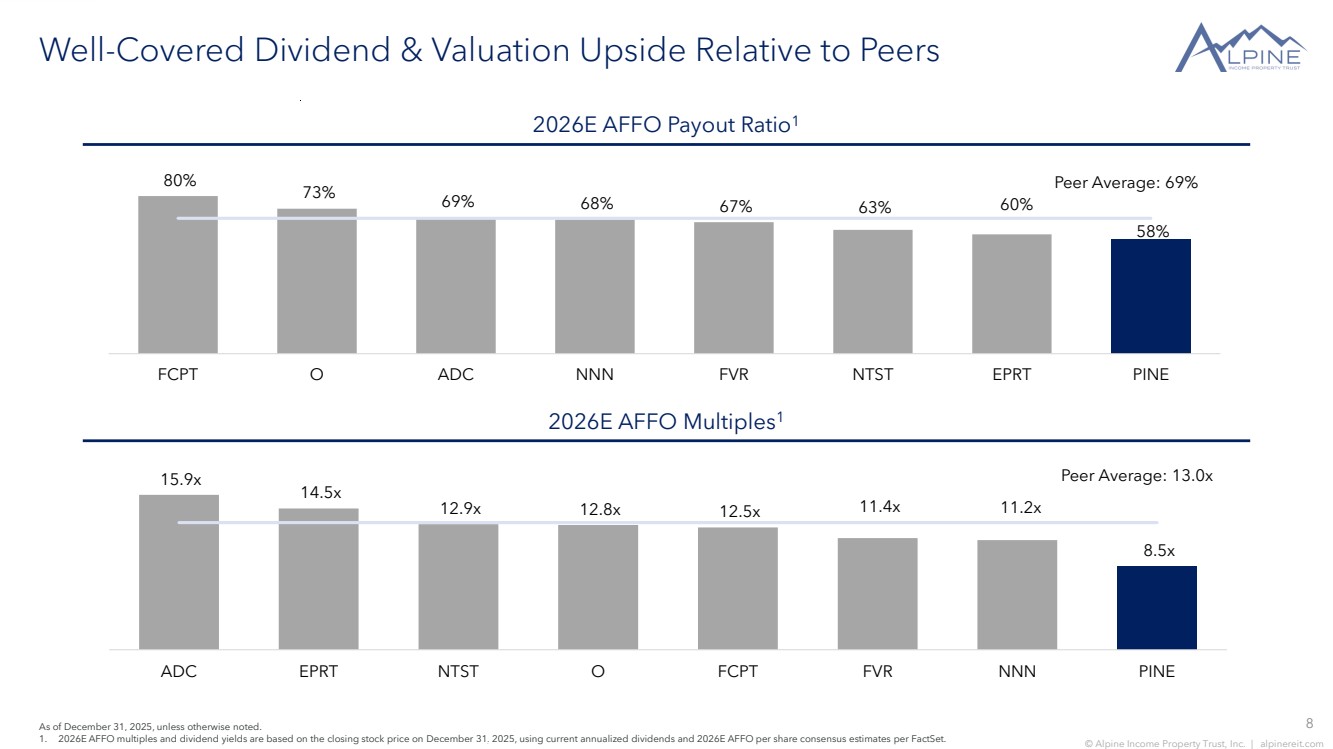
| 8 © Alpine Income Property Trust, Inc. | alpinereit.com 80% 73% 69% 68% 67% 63% 60% 58% Peer Average: 69% FCPT O ADC NNN FVR NTST EPRT PINE 15.9x 14.5x 12.9x 12.8x 12.5x 11.4x 11.2x 8.5x Peer Average: 13.0x ADC EPRT NTST O FCPT FVR NNN PINE Well-Covered Dividend & Valuation Upside Relative to Peers 2026E AFFO Multiples1 2026E AFFO Payout Ratio1 As of December 31, 2025, unless otherwise noted. 1. 2026E AFFO multiples and dividend yields are based on the closing stock price on December 31, 2025, using current annualized dividends and 2026E AFFO per share consensus estimates per FactSet. |
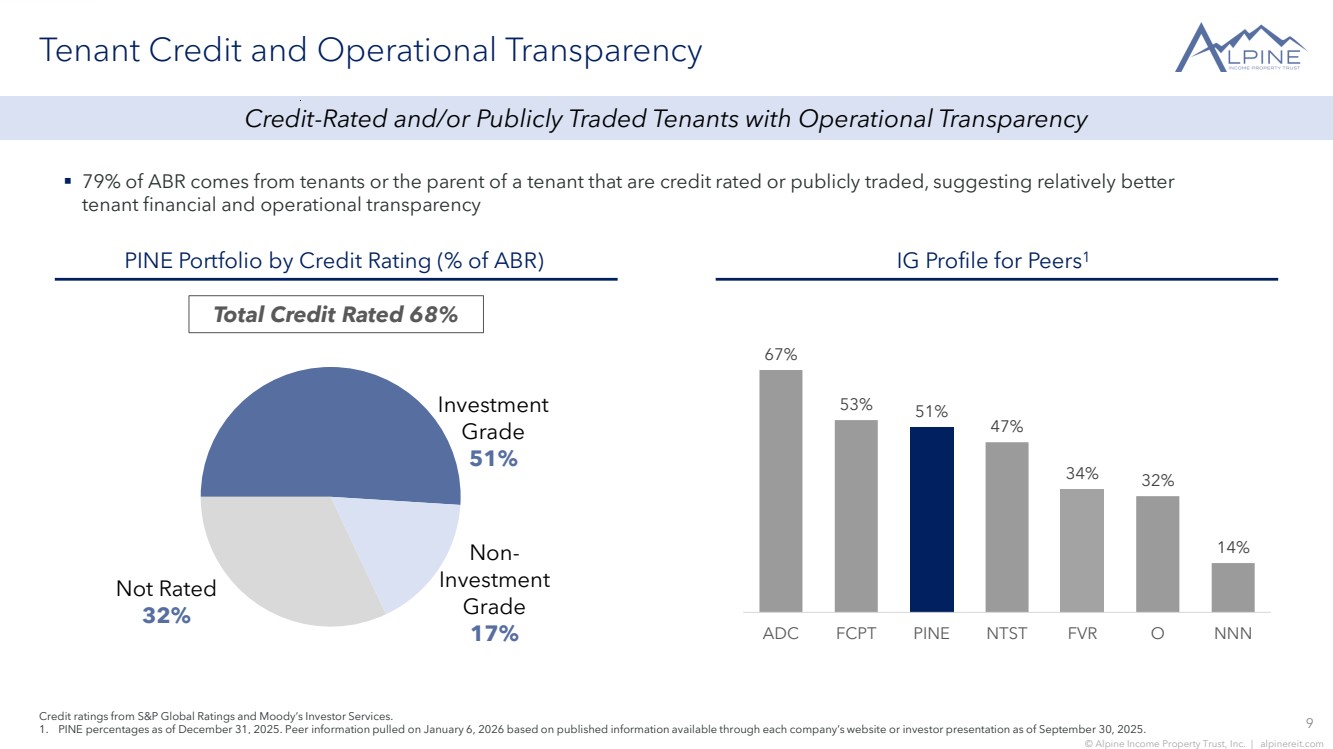
| 9 © Alpine Income Property Trust, Inc. | alpinereit.com Investment Grade 51% Non-Investment Grade 17% Not Rated 32% Tenant Credit and Operational Transparency ▪ 79% of ABR comes from tenants or the parent of a tenant that are credit rated or publicly traded, suggesting relatively better tenant financial and operational transparency Credit ratings from S&P Global Ratings and Moody’s Investor Services. 1. PINE percentages as of December 31, 2025. Peer information pulled on January 6, 2026 based on published information available through each company’s website or investor presentation as of September 30, 2025. IG Profile for Peers1 PINE Portfolio by Credit Rating (% of ABR) Total Credit Rated 68% Credit-Rated and/or Publicly Traded Tenants with Operational Transparency 14% 32% 34% 47% 51% 53% 67% ADC FCPT PINE NTST FVR O NNN |
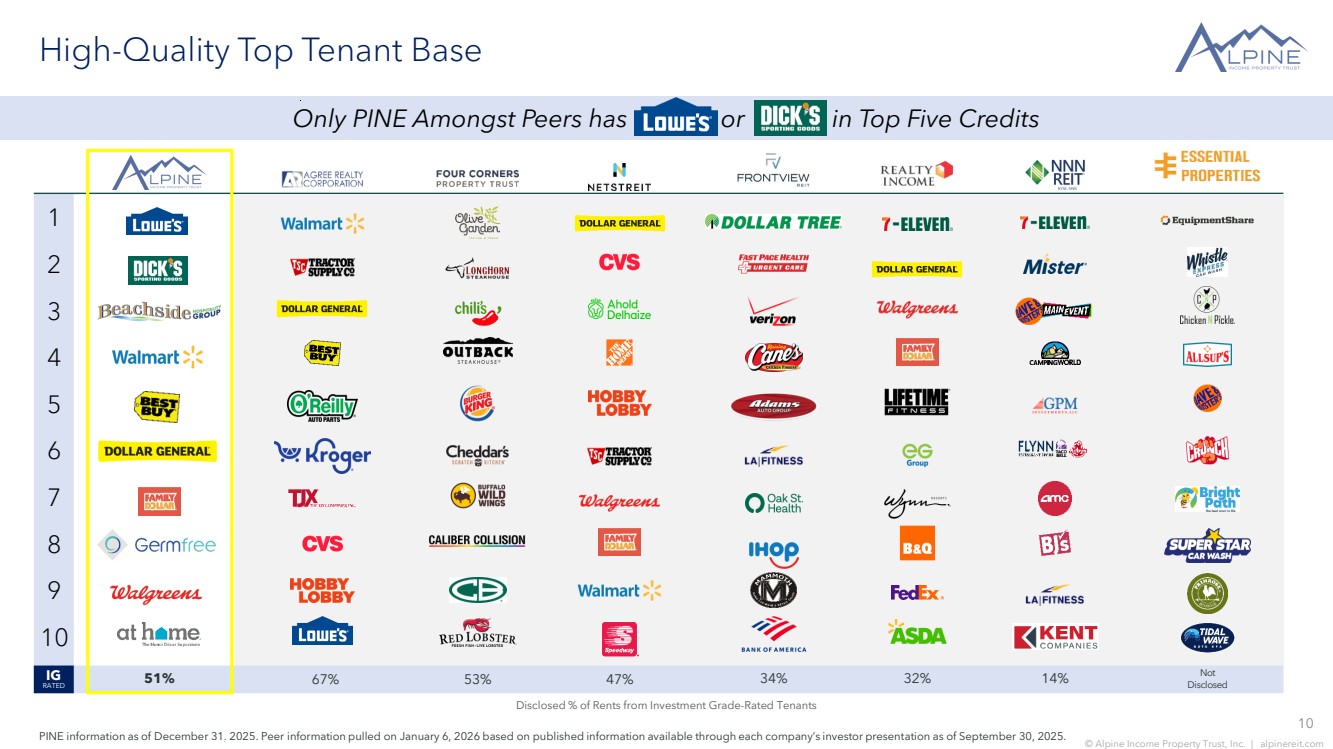
| 10 © Alpine Income Property Trust, Inc. | alpinereit.com 1 2 3 4 5 6 7 8 9 10 High-Quality Top Tenant Base Disclosed % of Rents from Investment Grade-Rated Tenants IG RATED PINE information as of December 31, 2025. Peer information pulled on January 6, 2026 based on published information available through each company’s investor presentation as of September 30, 2025. Only PINE Amongst Peers has or in Top Five Credits 51% 67% 53% 47% 34% 32% 14% Not Disclosed |
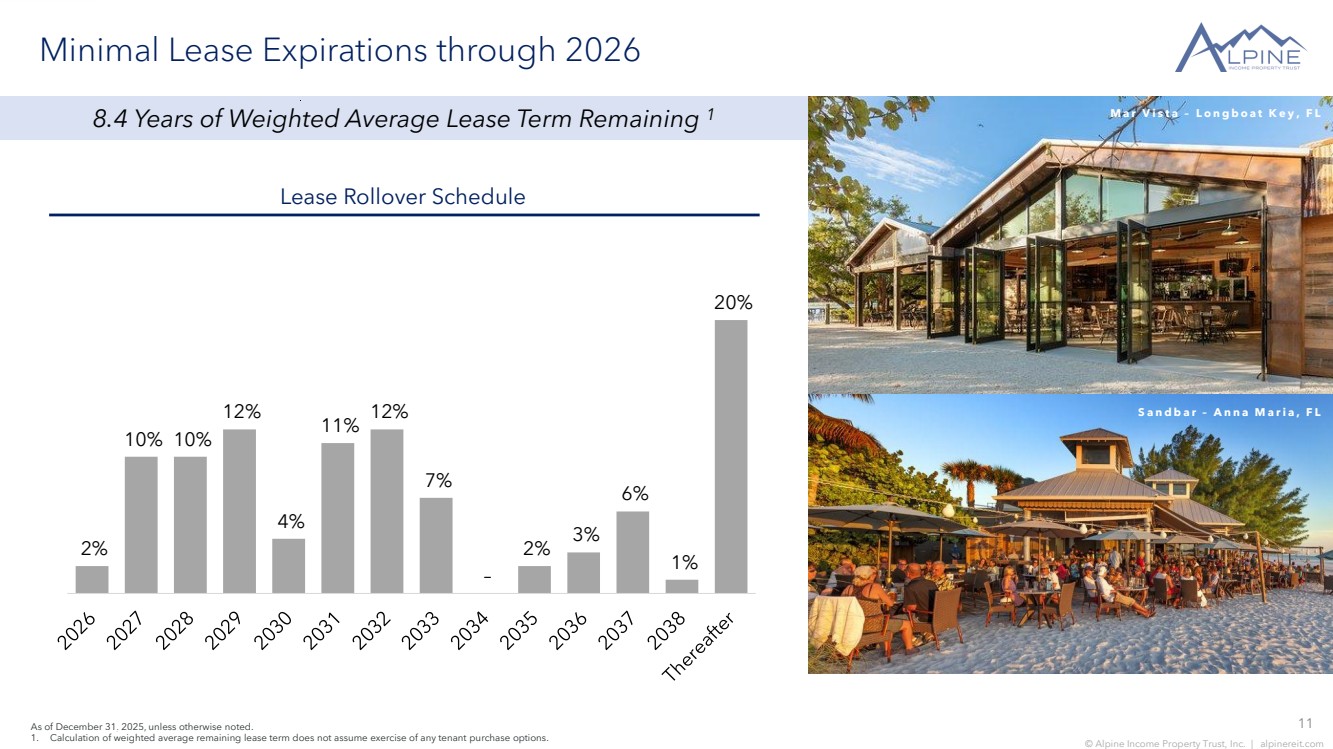
| 11 © Alpine Income Property Trust, Inc. | alpinereit.com 2% 10% 10% 12% 4% 11% 12% 7% – 2% 3% 6% 1% 20% Minimal Lease Expirations through 2026 Lease Rollover Schedule As of December 31, 2025, unless otherwise noted. 1. Calculation of weighted average remaining lease term does not assume exercise of any tenant purchase options. 8.4 Years of Weighted Average Lease Term Remaining 1 M a r V i s t a – L o n g b o a t K e y , F L S a n d b a r – A n n a M a r i a , F L |
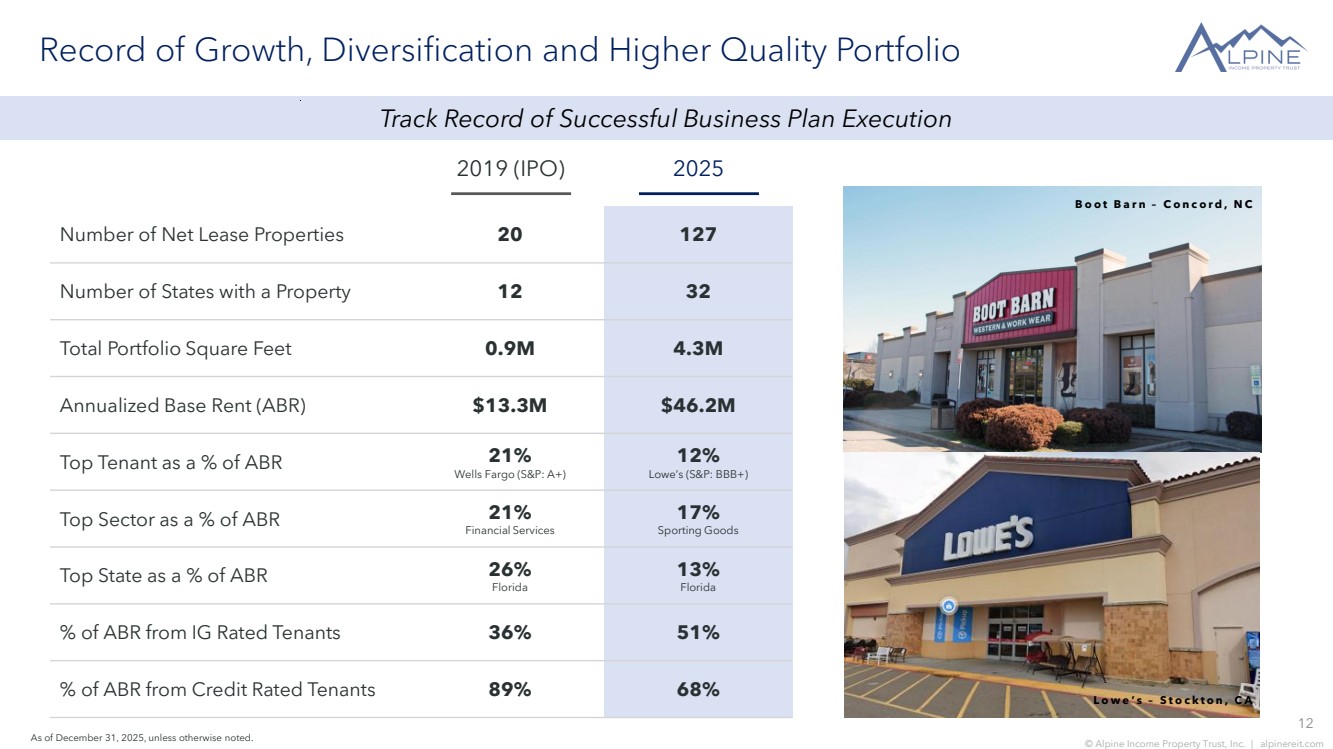
| 12 © Alpine Income Property Trust, Inc. | alpinereit.com Record of Growth, Diversification and Higher Quality Portfolio 2019 (IPO) Number of Net Lease Properties 20 127 Number of States with a Property 12 32 Total Portfolio Square Feet 0.9M 4.3M Annualized Base Rent (ABR) $13.3M $46.2M Top Tenant as a % of ABR 21% Wells Fargo (S&P: A+) 12% Lowe’s (S&P: BBB+) Top Sector as a % of ABR 21% Financial Services 17% Sporting Goods Top State as a % of ABR 26% Florida 13% Florida % of ABR from IG Rated Tenants 36% 51% % of ABR from Credit Rated Tenants 89% 68% 2025 Track Record of Successful Business Plan Execution As of December 31, 2025, unless otherwise noted. B o o t B a r n – C o n c o r d , N C L o w e ’ s – S t o c k t o n , C A |
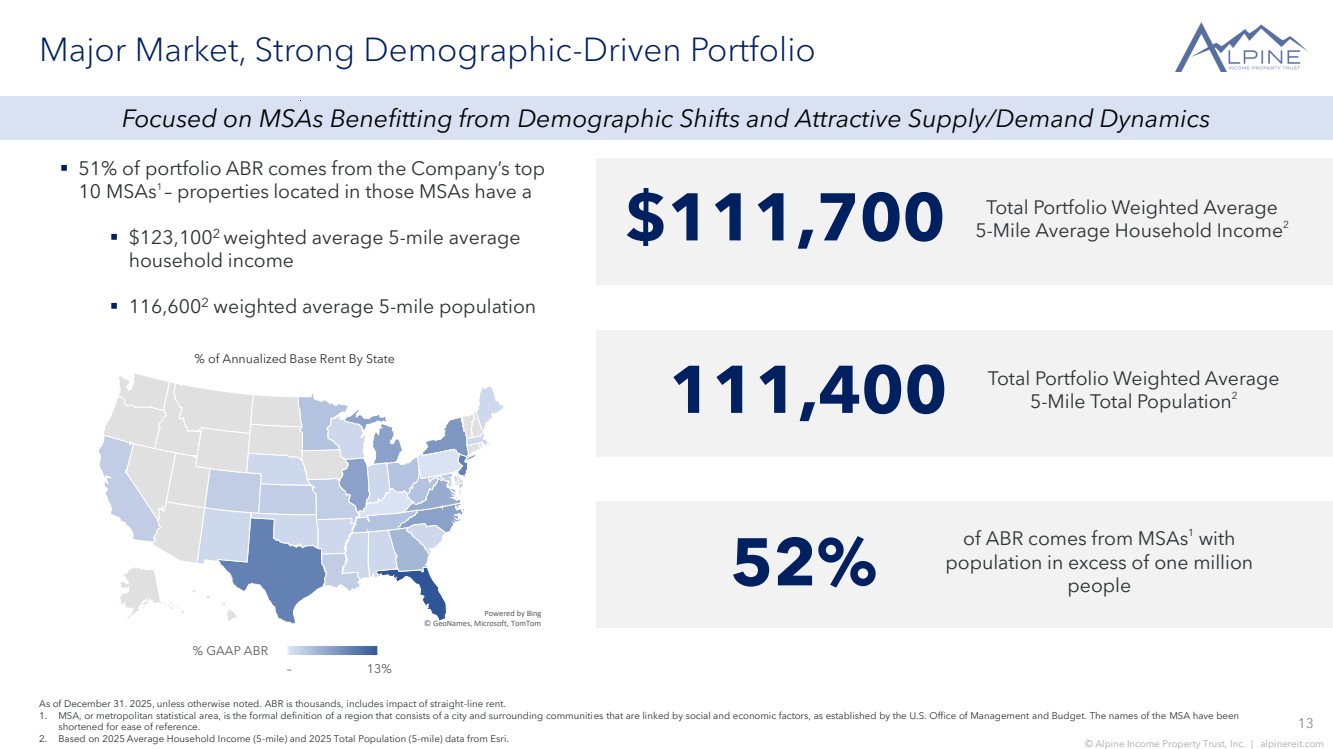
| 13 © Alpine Income Property Trust, Inc. | alpinereit.com © GeoNames, Microsoft, TomTom Powered by Bing – 13% % GAAP ABR Major Market, Strong Demographic-Driven Portfolio ▪ 51% of portfolio ABR comes from the Company’s top 10 MSAs1 – properties located in those MSAs have a ▪ $123,1002 weighted average 5-mile average household income ▪ 116,6002 weighted average 5-mile population % of Annualized Base Rent By State As of December 31, 2025, unless otherwise noted. ABR is thousands, includes impact of straight-line rent. 1. MSA, or metropolitan statistical area, is the formal definition of a region that consists of a city and surrounding communities that are linked by social and economic factors, as established by the U.S. Office of Management and Budget. The names of the MSA have been shortened for ease of reference. 2. Based on 2025 Average Household Income (5-mile) and 2025 Total Population (5-mile) data from Esri. $111,700 Total Portfolio Weighted Average 5-Mile Average Household Income2 111,400 Total Portfolio Weighted Average 5-Mile Total Population2 Focused on MSAs Benefitting from Demographic Shifts and Attractive Supply/Demand Dynamics 52% of ABR comes from MSAs1 with population in excess of one million people |
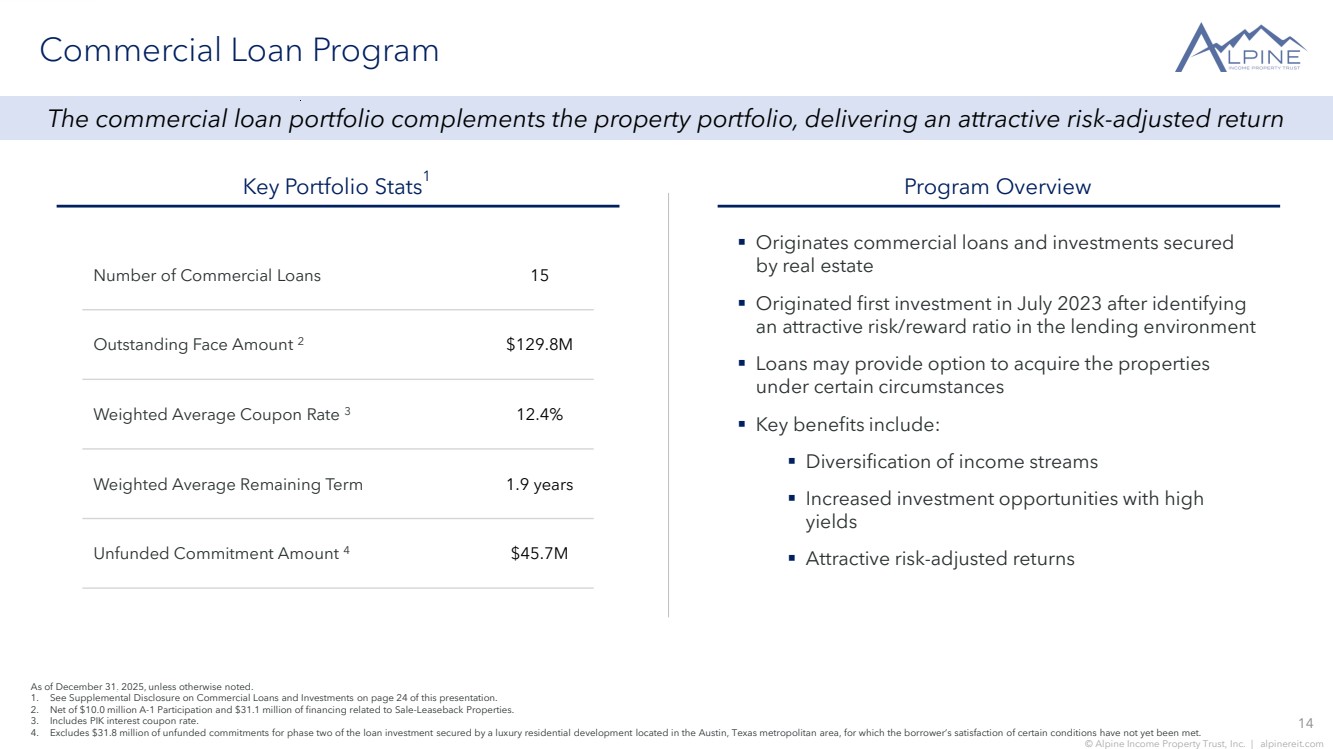
| 14 © Alpine Income Property Trust, Inc. | alpinereit.com Commercial Loan Program Number of Commercial Loans 15 Outstanding Face Amount 2 $129.8M Weighted Average Coupon Rate 3 12.4% Weighted Average Remaining Term 1.9 years Unfunded Commitment Amount 4 $45.7M Key Portfolio Stats1 Program Overview As of December 31, 2025, unless otherwise noted. 1. See Supplemental Disclosure on Commercial Loans and Investments on page 24 of this presentation. 2. Net of $10.0 million A-1 Participation and $31.1 million of financing related to Sale-Leaseback Properties. 3. Includes PIK interest coupon rate. 4. Excludes $31.8 million of unfunded commitments for phase two of the loan investment secured by a luxury residential development located in the Austin, Texas metropolitan area, for which the borrower’s satisfaction of certain conditions have not yet been met. The commercial loan portfolio complements the property portfolio, delivering an attractive risk-adjusted return ▪ Originates commercial loans and investments secured by real estate ▪ Originated first investment in July 2023 after identifying an attractive risk/reward ratio in the lending environment ▪ Loans may provide option to acquire the properties under certain circumstances ▪ Key benefits include: ▪ Diversification of income streams ▪ Increased investment opportunities with high yields ▪ Attractive risk-adjusted returns |
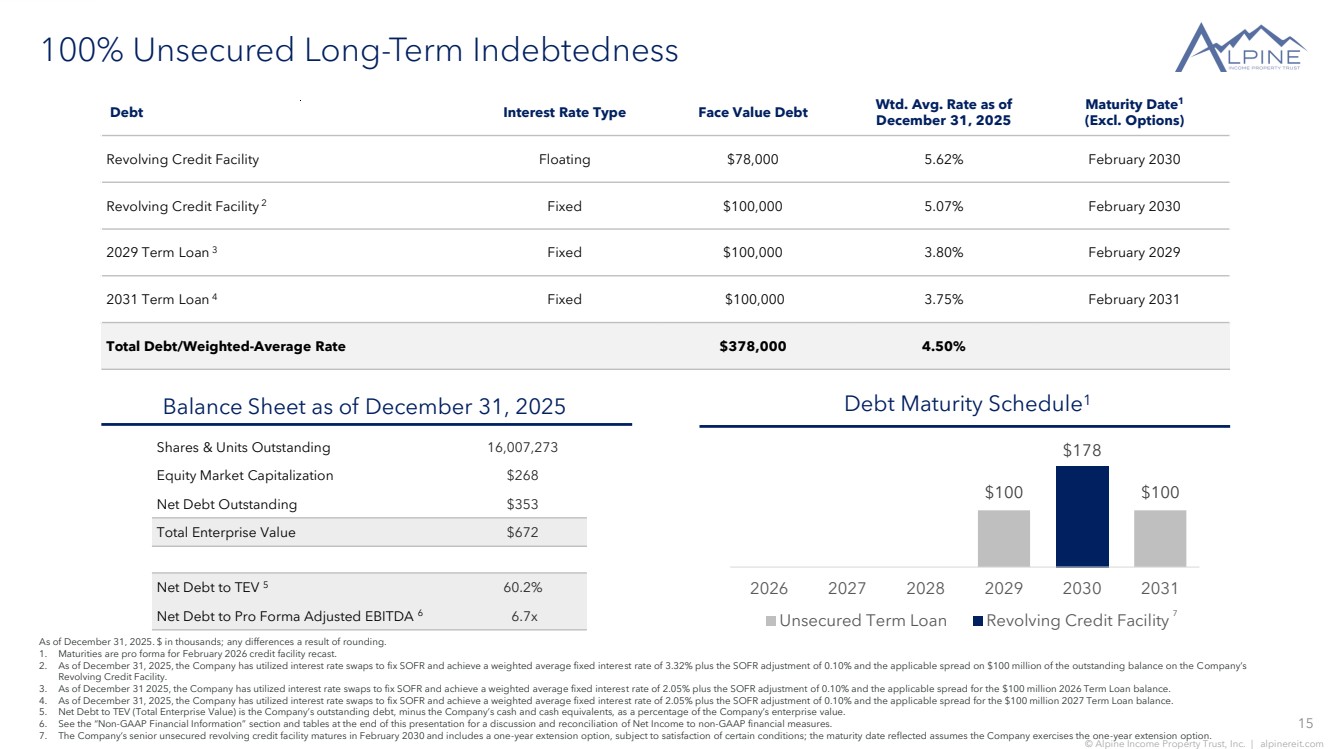
| 15 © Alpine Income Property Trust, Inc. | alpinereit.com $100 $100 $178 2026 2027 2028 2029 2030 2031 Unsecured Term Loan Revolving Credit Facility 100% Unsecured Long-Term Indebtedness Debt Maturity Schedule1 7 As of December 31, 2025. $ in thousands; any differences a result of rounding. 1. Maturities are pro forma for February 2026 credit facility recast. 2. As of December 31, 2025, the Company has utilized interest rate swaps to fix SOFR and achieve a weighted average fixed interest rate of 3.32% plus the SOFR adjustment of 0.10% and the applicable spread on $100 million of the outstanding balance on the Company’s Revolving Credit Facility. 3. As of December 31 2025, the Company has utilized interest rate swaps to fix SOFR and achieve a weighted average fixed interest rate of 2.05% plus the SOFR adjustment of 0.10% and the applicable spread for the $100 million 2026 Term Loan balance. 4. As of December 31, 2025, the Company has utilized interest rate swaps to fix SOFR and achieve a weighted average fixed interest rate of 2.05% plus the SOFR adjustment of 0.10% and the applicable spread for the $100 million 2027 Term Loan balance. 5. Net Debt to TEV (Total Enterprise Value) is the Company’s outstanding debt, minus the Company’s cash and cash equivalents, as a percentage of the Company’s enterprise value. 6. See the “Non-GAAP Financial Information” section and tables at the end of this presentation for a discussion and reconciliation of Net Income to non-GAAP financial measures. 7. The Company’s senior unsecured revolving credit facility matures in February 2030 and includes a one-year extension option, subject to satisfaction of certain conditions; the maturity date reflected assumes the Company exercises the one-year extension option. Balance Sheet as of December 31, 2025 Debt Interest Rate Type Face Value Debt Wtd. Avg. Rate as of December 31, 2025 Maturity Date1 (Excl. Options) Revolving Credit Facility Floating $78,000 5.62% February 2030 Revolving Credit Facility 2 Fixed $100,000 5.07% February 2030 2029 Term Loan 3 Fixed $100,000 3.80% February 2029 2031 Term Loan 4 Fixed $100,000 3.75% February 2031 Total Debt/Weighted-Average Rate $378,000 4.50% Shares & Units Outstanding 16,007,273 Equity Market Capitalization $268 Net Debt Outstanding $353 Total Enterprise Value $672 Net Debt to TEV 5 60.2% Net Debt to Pro Forma Adjusted EBITDA 6 6.7x |
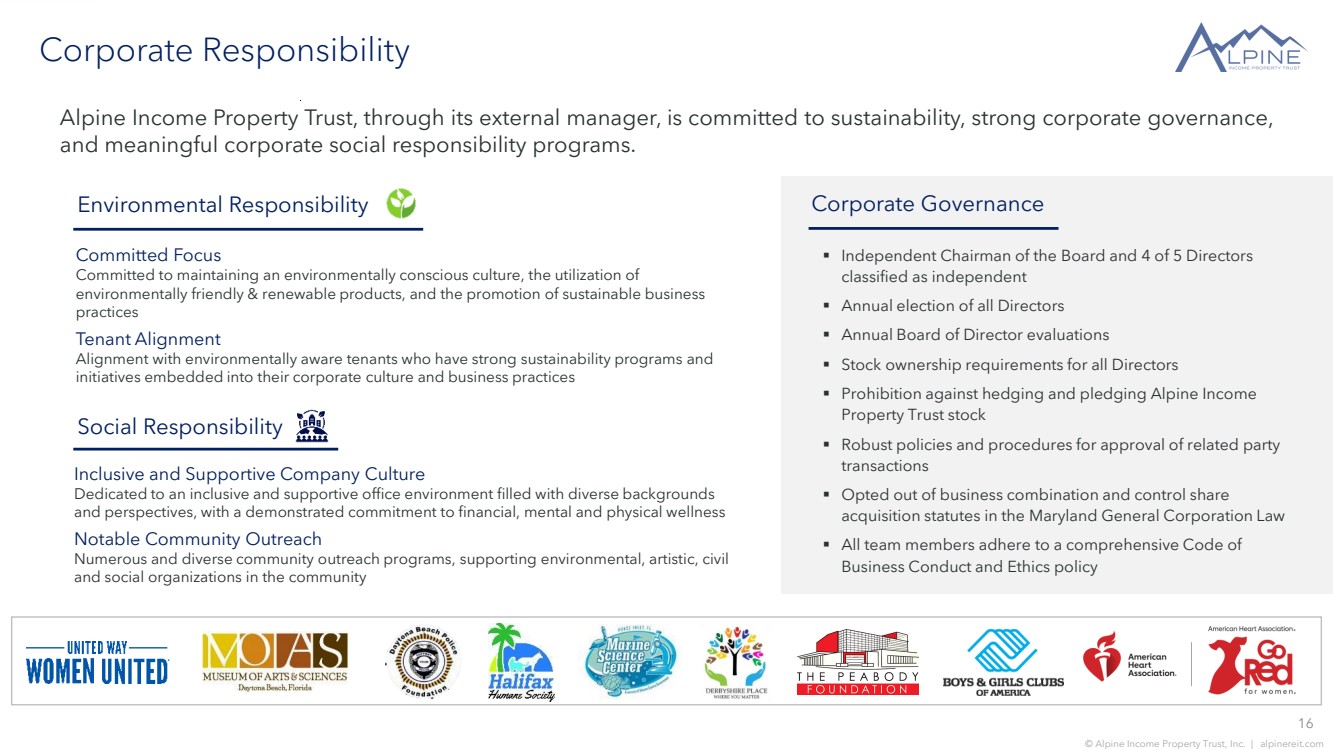
| 16 © Alpine Income Property Trust, Inc. | alpinereit.com Corporate Responsibility Alpine Income Property Trust, through its external manager, is committed to sustainability, strong corporate governance, and meaningful corporate social responsibility programs. Committed Focus Committed to maintaining an environmentally conscious culture, the utilization of environmentally friendly & renewable products, and the promotion of sustainable business practices Tenant Alignment Alignment with environmentally aware tenants who have strong sustainability programs and initiatives embedded into their corporate culture and business practices Social Responsibility Environmental Responsibility Corporate Governance ▪ Independent Chairman of the Board and 4 of 5 Directors classified as independent ▪ Annual election of all Directors ▪ Annual Board of Director evaluations ▪ Stock ownership requirements for all Directors ▪ Prohibition against hedging and pledging Alpine Income Property Trust stock ▪ Robust policies and procedures for approval of related party transactions ▪ Opted out of business combination and control share acquisition statutes in the Maryland General Corporation Law ▪ All team members adhere to a comprehensive Code of Business Conduct and Ethics policy Inclusive and Supportive Company Culture Dedicated to an inclusive and supportive office environment filled with diverse backgrounds and perspectives, with a demonstrated commitment to financial, mental and physical wellness Notable Community Outreach Numerous and diverse community outreach programs, supporting environmental, artistic, civil and social organizations in the community |
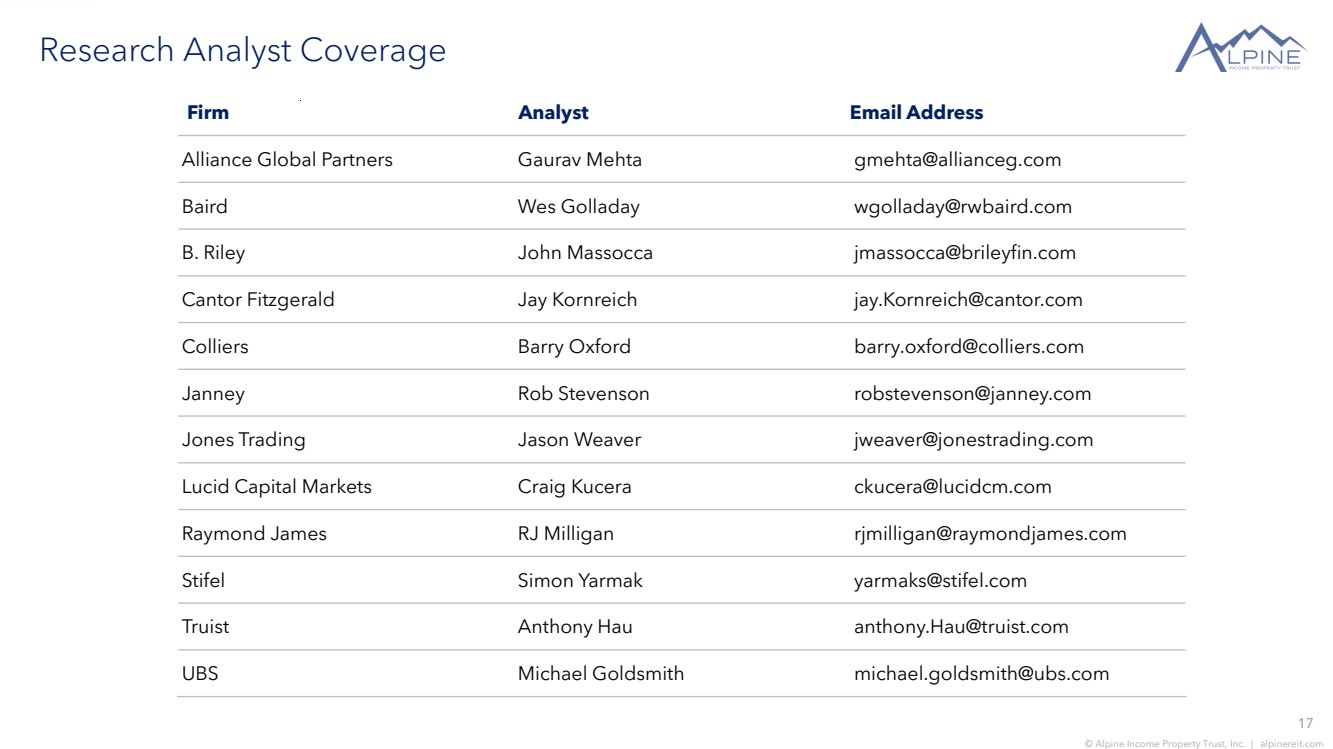
| 17 © Alpine Income Property Trust, Inc. | alpinereit.com Research Analyst Coverage Firm Analyst Email Address Alliance Global Partners Gaurav Mehta gmehta@allianceg.com Baird Wes Golladay wgolladay@rwbaird.com B. Riley John Massocca jmassocca@brileyfin.com Cantor Fitzgerald Jay Kornreich jay.Kornreich@cantor.com Colliers Barry Oxford barry.oxford@colliers.com Janney Rob Stevenson robstevenson@janney.com Jones Trading Jason Weaver jweaver@jonestrading.com Lucid Capital Markets Craig Kucera ckucera@lucidcm.com Raymond James RJ Milligan rjmilligan@raymondjames.com Stifel Simon Yarmak yarmaks@stifel.com Truist Anthony Hau anthony.Hau@truist.com UBS Michael Goldsmith michael.goldsmith@ubs.com |
| 18 © Alpine Income Property Trust, Inc. | alpinereit.com Disclaimer This presentation may contain “forward-looking statements.” Forward-looking statements include statements that may be identified by words such as “could,” “may,” “might,” “will,” “likely,” “anticipates,” “intends,” “plans,” “seeks,” “believes,” “estimates,” “expects,” “continues,” “projects” and similar references to future periods, or by the inclusion of forecasts or projections. Forward-looking statements are based on the Company’s current expectations and assumptions regarding capital market conditions, the Company’s business, the economy and other future conditions. Because forward-looking statements relate to the future, by their nature, they are subject to inherent uncertainties, risks and changes in circumstances that are difficult to predict. As a result, the Company’s actual results may differ materially from those contemplated by the forward-looking statements. Important factors that could cause actual results to differ materially from those in the forward-looking statements include general business and economic conditions, continued volatility and uncertainty in the credit markets and broader financial markets, tariffs and international trade policies, risks inherent in the real estate business, including tenant or borrower defaults, potential liability relating to environmental matters, credit risk associated with the Company investing in commercial loans and investments, illiquidity of real estate investments and potential damages from natural disasters, the impact of epidemics or pandemics on the Company’s business and the businesses of its tenants and borrowers and the impact of such epidemics or pandemics on the U.S. economy and market conditions generally, other factors affecting the Company’s business or the businesses of its tenants and borrowers that are beyond the control of the Company or its tenants or borrowers, and the factors set forth under “Risk Factors” in the Company’s Annual Report on Form 10-K for the year ended December 31, 2025 and other risks and uncertainties discussed from time to time in the Company’s filings with the U.S. Securities and Exchange Commission. Any forward-looking statement made in this press release speaks only as of the date on which it is made. The Company undertakes no obligation to publicly update or revise any forward-looking statement, whether as a result of new information, future developments or otherwise. References in this presentation: 1. All information is as of December 31, 2025, unless otherwise noted and any differences in calculations are assumed to be a function of rounding. 2. Annualized Base Rent ("ABR" or "Rent") represents annualized in-place straight-line base rent pursuant to GAAP. The statistics based on ABR are calculated based on our portfolio as of December 31, 2025. 3. Dividends are set by the Board of Directors and declared on a quarterly basis and there can be no assurances as to the likelihood or amount of dividends in the future. 4. The Company defines an Investment Grade (“IG”) Rated Tenant as a tenant or the parent of a tenant with a credit rating from S&P Global Ratings, Moody’s Investors Service, Fitch Ratings or the National Association of Insurance Commissioners of Baa3, BBB-, or NAIC-2 or higher. If applicable, in the event of a split rating between S&P Global Ratings and Moody’s Investors Services, the Company utilizes the higher of the two ratings as its reference point as to whether a tenant is defined as an Investment Grade Rated Tenant. Credit ratings utilized in this presentation are those available from S&P Global Ratings and/or Moody’s Investors Service, as applicable, as of December 31, 2025. 5. The Company defines a Credit Rated Tenant as a tenant or the parent of a tenant with a credit rating from S&P Global Ratings, Moody’s Investors Service, Fitch Ratings or the National Association of Insurance Commissioners. |
| 19 © Alpine Income Property Trust, Inc. | alpinereit.com Non-GAAP Financial Information Our reported results are presented in accordance with accounting principles generally accepted in the United States of America (“GAAP”). We also disclose Funds From Operations (“FFO”), Adjusted Funds From Operations (“AFFO”), and Pro Forma Earnings Before Interest, Taxes, Depreciation and Amortization (“Pro Forma Adjusted EBITDA”), all of which are non-GAAP financial measures. We believe these non-GAAP financial measures are useful to investors because they are widely accepted industry measures used by analysts and investors to compare the operating performance of REITs. FFO, AFFO, and Pro Forma Adjusted EBITDA do not represent cash generated from operating activities and are not necessarily indicative of cash available to fund cash requirements; accordingly, they should not be considered alternatives to net income or loss as a performance measure or cash flows from operations as reported on our statement of cash flows as a liquidity measure and should be considered in addition to, and not in lieu of, GAAP financial measures. We compute FFO in accordance with the definition adopted by the Board of Governors of the National Association of Real Estate Investment Trusts, or NAREIT. NAREIT defines FFO as GAAP net income or loss adjusted to exclude real estate related depreciation and amortization, as well as extraordinary items (as defined by GAAP) such as net gain or loss from sales of depreciable real estate assets, impairment write-downs associated with depreciable real estate assets and impairments associated with the implementation of current expected credit losses on commercial loans and investments at the time of origination, including the pro rata share of such adjustments of unconsolidated subsidiaries. To derive AFFO, we further modify the NAREIT computation of FFO to include other adjustments to GAAP net income related to non-cash revenues and expenses such as loss on extinguishment of debt, amortization of above- and below-market lease related intangibles, straight-line rental revenue, amortization of deferred financing costs, non-cash compensation, and other non-cash adjustments to income or expense. Such items may cause short-term fluctuations in net income or loss but have no impact on operating cash flows or long-term operating performance. We use AFFO as one measure of our performance when we formulate corporate goals. To derive Pro Forma Adjusted EBITDA, GAAP net income or loss is adjusted to exclude extraordinary items (as defined by GAAP), net gain or loss from sales of depreciable real estate assets, impairment write-downs associated with depreciable real estate assets and impairments associated with the implementation of current expected credit losses on commercial loans and investments at the time of origination and/or payoff, and real estate related depreciation and amortization including the pro rata share of such adjustments of unconsolidated subsidiaries, non-cash revenues and expenses such as straight-line rental revenue, amortization of deferred financing costs, loss on extinguishment of debt, above- and below-market lease related intangibles, non-cash compensation, other non-cash income or expense, and other non-recurring items such as disposition management fees and commission fees. Cash interest expense is also excluded from Pro Forma Adjusted EBITDA, and GAAP net income or loss is adjusted for the annualized impact of acquisitions, dispositions and other similar activities. FFO is used by management, investors and analysts to facilitate meaningful comparisons of operating performance between periods and among our peers primarily because it excludes the effect of real estate depreciation and amortization and net gains or losses on sales, which are based on historical costs and implicitly assume that the value of real estate diminishes predictably over time, rather than fluctuating based on existing market conditions. We believe that AFFO is an additional useful supplemental measure for investors to consider because it will help them to better assess our operating performance without the distortions created by other non-cash revenues or expenses. We also believe that Pro Forma Adjusted EBITDA is an additional useful supplemental measure for investors to consider as it allows for a better assessment of our operating performance without the distortions created by other non-cash revenues, expenses or certain effects of the Company’s capital structure on our operating performance. FFO, AFFO, and Pro Forma Adjusted EBITDA may not be comparable to similarly titled measures employed by other companies. GAAP requires that the Sale-Leaseback Properties and the value of participation obligations interests sold (the “Participation Obligations Sold”) for which sale accounting was not achieved be accounted for as financing arrangements. Accordingly, for GAAP purposes, the Sale-Leaseback Properties and Participation Obligations Sold are included in the Company’s Commercial Loans and Investments segment. However, for statistical purposes, the Company excludes the Sale-Leaseback Properties and the Participation Obligations. Please see page 24 of this presentation for further details. We believe that the Supplemental Disclosure on Commercial Loans and Investments is an additional useful measure for investors to consider because it will help them to better assess the performance of our Commercial Loan Portfolio. |
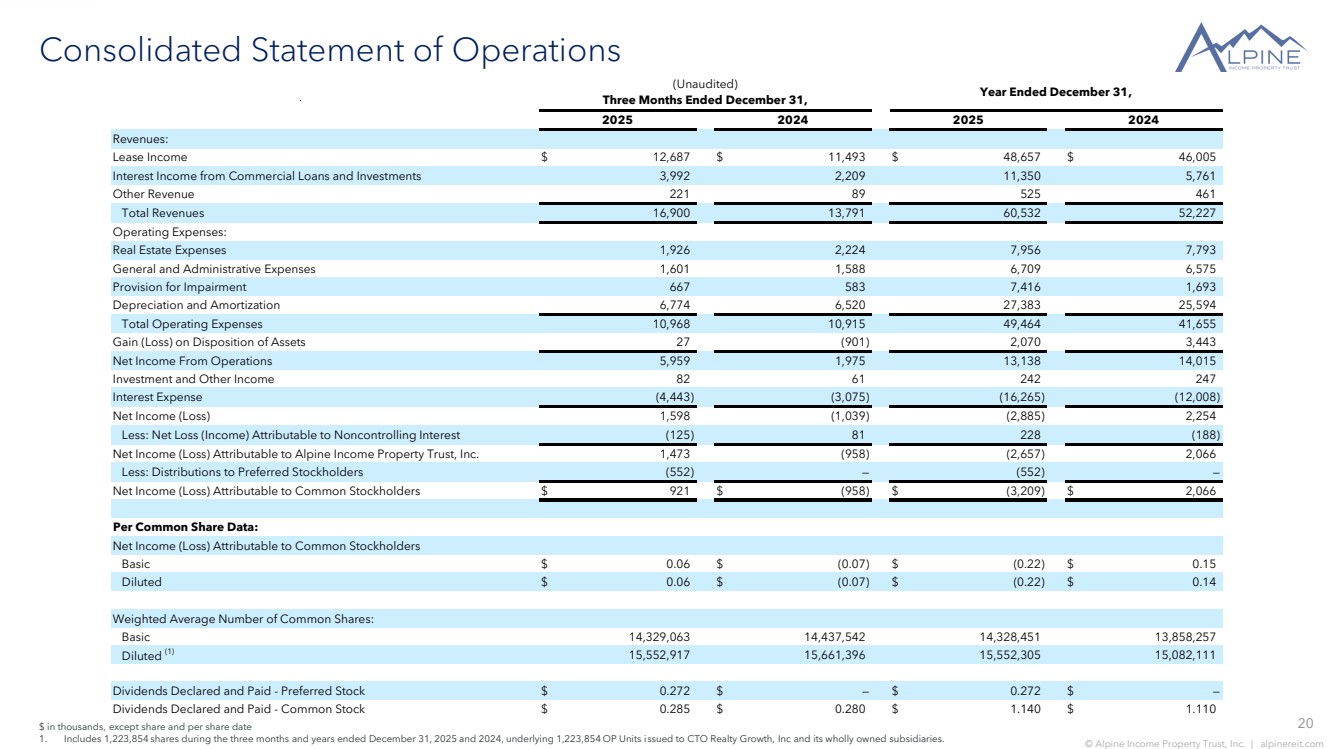
| 20 © Alpine Income Property Trust, Inc. | alpinereit.com Consolidated Statement of Operations $ in thousands, except share and per share date 1. Includes 1,223,854 shares during the three months and years ended December 31, 2025 and 2024, underlying 1,223,854 OP Units issued to CTO Realty Growth, Inc and its wholly owned subsidiaries. Revenues: Lease Income $ 12,687 $ 11,493 $ 48,657 $ 46,005 Interest Income from Commercial Loans and Investments 3,992 2,209 11,350 5,761 Other Revenue 221 89 525 461 Total Revenues 16,900 13,791 60,532 52,227 Operating Expenses: Real Estate Expenses 1,926 2,224 7,956 7,793 General and Administrative Expenses 1,601 1,588 6,709 6,575 Provision for Impairment 667 583 7,416 1,693 Depreciation and Amortization 6,774 6,520 27,383 25,594 Total Operating Expenses 10,968 10,915 49,464 41,655 Gain (Loss) on Disposition of Assets 27 (901) 2,070 3,443 Net Income From Operations 5,959 1,975 13,138 14,015 Investment and Other Income 82 61 242 247 Interest Expense (4,443) (3,075) (16,265) (12,008) Net Income (Loss) 1,598 (1,039) (2,885) 2,254 Less: Net Loss (Income) Attributable to Noncontrolling Interest (125) 81 228 (188) Net Income (Loss) Attributable to Alpine Income Property Trust, Inc. 1,473 (958) (2,657) 2,066 Less: Distributions to Preferred Stockholders (552) — (552) — Net Income (Loss) Attributable to Common Stockholders $ 921 $ (958) $ (3,209) $ 2,066 Per Common Share Data: Net Income (Loss) Attributable to Common Stockholders Basic $ 0.06 $ (0.07) $ (0.22) $ 0.15 Diluted $ 0.06 $ (0.07) $ (0.22) $ 0.14 Weighted Average Number of Common Shares: Basic 14,329,063 14,437,542 14,328,451 13,858,257 Diluted (1) 15,552,917 15,661,396 15,552,305 15,082,111 Dividends Declared and Paid - Preferred Stock $ 0.272 $ — $ 0.272 $ — Dividends Declared and Paid - Common Stock $ 0.285 $ 0.280 $ 1.140 $ 1.110 Year Ended December 31, 2025 2024 2025 2024 (Unaudited) Three Months Ended December 31, |
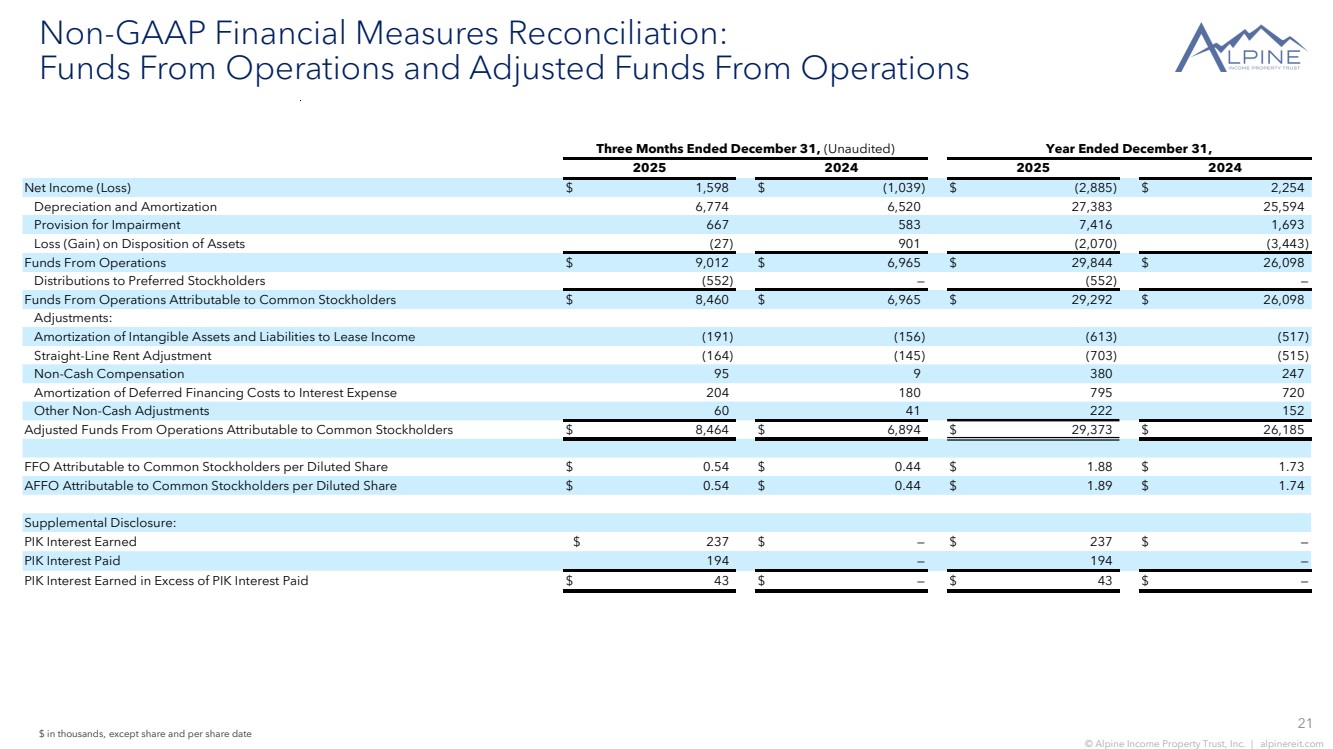
| 21 © Alpine Income Property Trust, Inc. | alpinereit.com Non-GAAP Financial Measures Reconciliation: Funds From Operations and Adjusted Funds From Operations $ in thousands, except share and per share date Net Income (Loss) $ 1,598 $ (1,039) $ (2,885) $ 2,254 Depreciation and Amortization 6,774 6,520 27,383 25,594 Provision for Impairment 667 583 7,416 1,693 Loss (Gain) on Disposition of Assets (27) 901 (2,070) (3,443) Funds From Operations $ 9,012 $ 6,965 $ 29,844 $ 26,098 Distributions to Preferred Stockholders (552) — (552) — Funds From Operations Attributable to Common Stockholders $ 8,460 $ 6,965 $ 29,292 $ 26,098 Adjustments: Amortization of Intangible Assets and Liabilities to Lease Income (191) (156) (613) (517) Straight-Line Rent Adjustment (164) (145) (703) (515) Non-Cash Compensation 95 9 380 247 Amortization of Deferred Financing Costs to Interest Expense 204 180 795 720 Other Non-Cash Adjustments 60 41 222 152 Adjusted Funds From Operations Attributable to Common Stockholders $ 8,464 $ 6,894 $ 29,373 $ 26,185 FFO Attributable to Common Stockholders per Diluted Share $ 0.54 $ 0.44 $ 1.88 $ 1.73 AFFO Attributable to Common Stockholders per Diluted Share $ 0.54 $ 0.44 $ 1.89 $ 1.74 Supplemental Disclosure: PIK Interest Earned $ 237 $ — $ 237 $ — PIK Interest Paid 194 — 194 — PIK Interest Earned in Excess of PIK Interest Paid $ 43 $ — $ 43 $ — 2024 2025 2024 Three Months Ended December 31, (Unaudited) Year Ended December 31, 2025 |
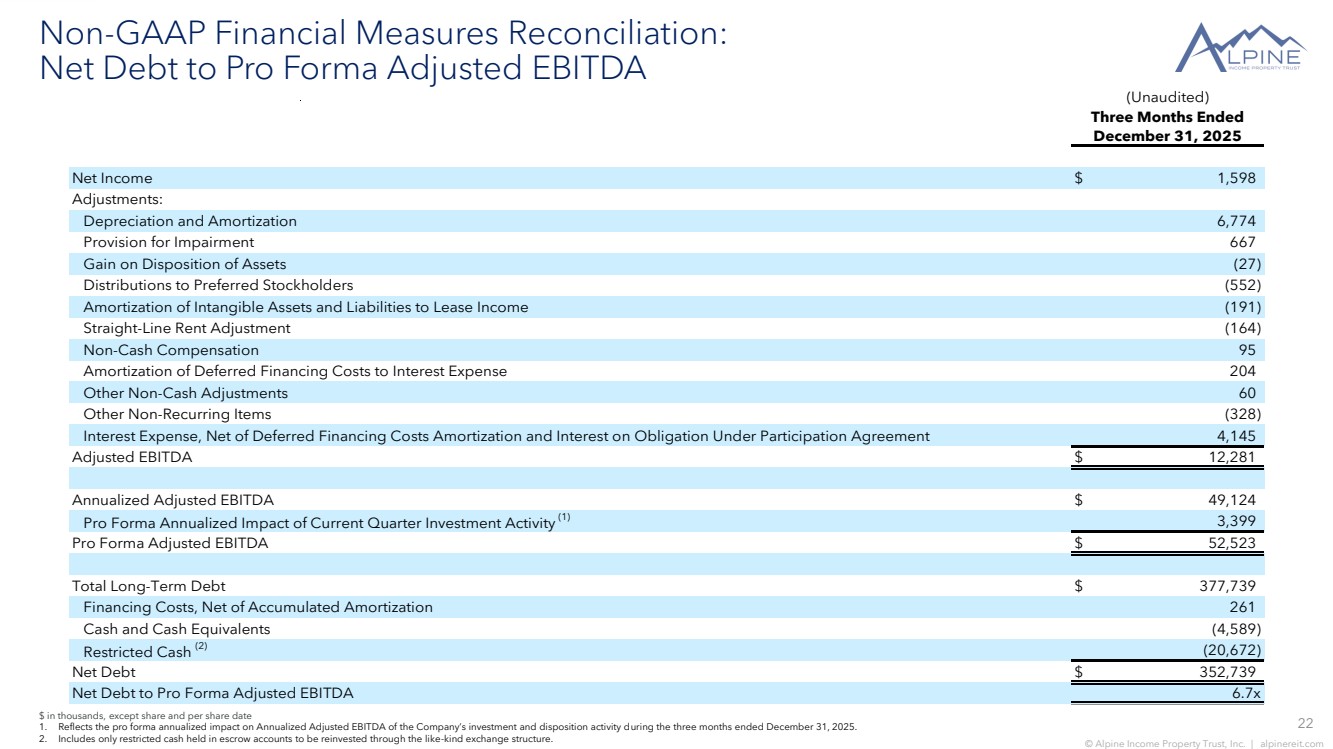
| 22 © Alpine Income Property Trust, Inc. | alpinereit.com $ in thousands, except share and per share date 1. Reflects the pro forma annualized impact on Annualized Adjusted EBITDA of the Company’s investment and disposition activity during the three months ended December 31, 2025. 2. Includes only restricted cash held in escrow accounts to be reinvested through the like-kind exchange structure. Non-GAAP Financial Measures Reconciliation: Net Debt to Pro Forma Adjusted EBITDA Net Income $ 1,598 Adjustments: Depreciation and Amortization 6,774 Provision for Impairment 667 Gain on Disposition of Assets (27) Distributions to Preferred Stockholders (552) Amortization of Intangible Assets and Liabilities to Lease Income (191) Straight-Line Rent Adjustment (164) Non-Cash Compensation 95 Amortization of Deferred Financing Costs to Interest Expense 204 Other Non-Cash Adjustments 60 Other Non-Recurring Items (328) Interest Expense, Net of Deferred Financing Costs Amortization and Interest on Obligation Under Participation Agreement 4,145 Adjusted EBITDA $ 12,281 Annualized Adjusted EBITDA $ 49,124 Pro Forma Annualized Impact of Current Quarter Investment Activity (1) 3,399 Pro Forma Adjusted EBITDA $ 52,523 Total Long-Term Debt $ 377,739 Financing Costs, Net of Accumulated Amortization 261 Cash and Cash Equivalents (4,589) Restricted Cash (2) (20,672) Net Debt $ 352,739 Net Debt to Pro Forma Adjusted EBITDA 6.7x (Unaudited) Three Months Ended December 31, 2025 |
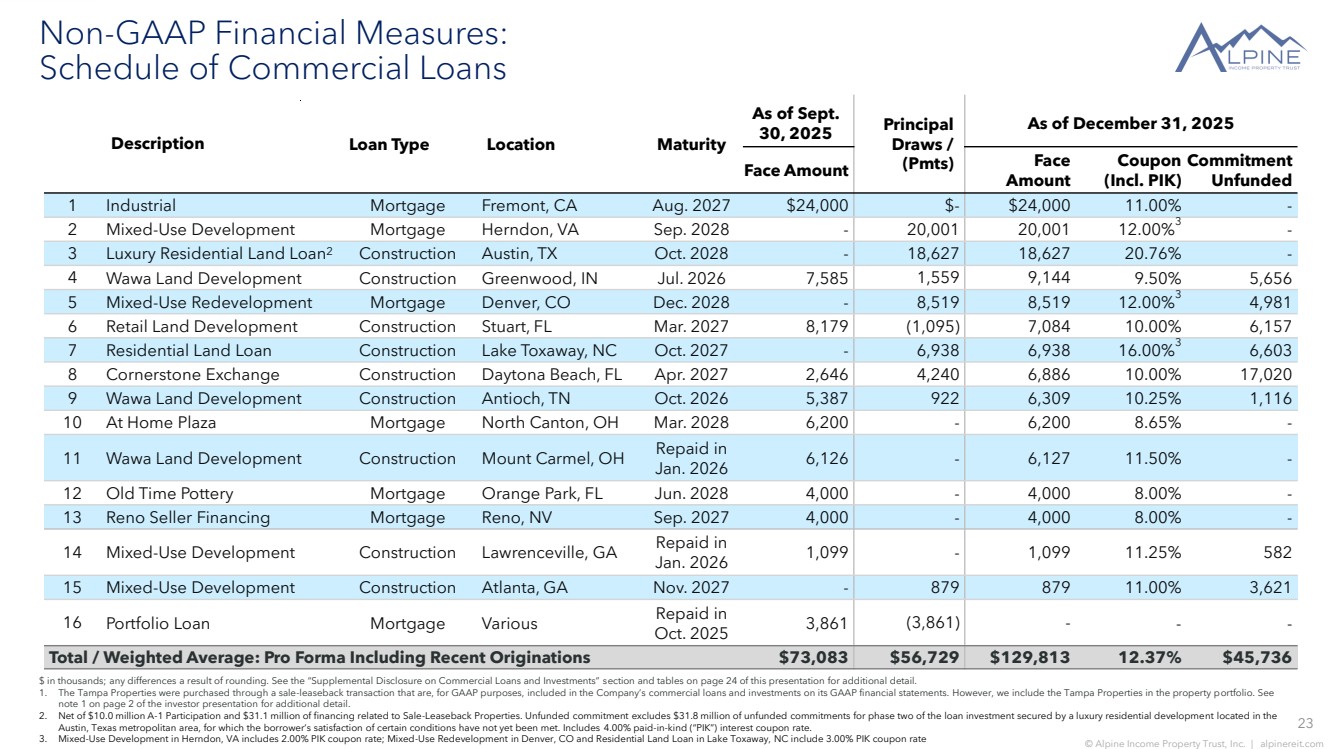
| 23 © Alpine Income Property Trust, Inc. | alpinereit.com Non-GAAP Financial Measures: Schedule of Commercial Loans $ in thousands; any differences a result of rounding. See the “Supplemental Disclosure on Commercial Loans and Investments” section and tables on page 24 of this presentation for additional detail. 1. The Tampa Properties were purchased through a sale-leaseback transaction that are, for GAAP purposes, included in the Company’s commercial loans and investments on its GAAP financial statements. However, we include the Tampa Properties in the property portfolio. See note 1 on page 2 of the investor presentation for additional detail. 2. Net of $10.0 million A-1 Participation and $31.1 million of financing related to Sale-Leaseback Properties. Unfunded commitment excludes $31.8 million of unfunded commitments for phase two of the loan investment secured by a luxury residential development located in the Austin, Texas metropolitan area, for which the borrower’s satisfaction of certain conditions have not yet been met. Includes 4.00% paid-in-kind (“PIK”) interest coupon rate. 3. Mixed-Use Development in Herndon, VA includes 2.00% PIK coupon rate; Mixed-Use Redevelopment in Denver, CO and Residential Land Loan in Lake Toxaway, NC include 3.00% PIK coupon rate Description Loan Type Location Maturity As of Sept. 30, 2025 Principal Draws / (Pmts) As of December 31, 2025 Face Amount Face Amount Coupon (Incl. PIK) Commitment Unfunded 1 Industrial Mortgage Fremont, CA Aug. 2027 $24,000 $- $24,000 11.00% - 2 Mixed-Use Development Mortgage Herndon, VA Sep. 2028 - 20,001 20,001 12.00%3 - 3 Luxury Residential Land Loan2 Construction Austin, TX Oct. 2028 - 18,627 18,627 20.76% - 4 Wawa Land Development Construction Greenwood, IN Jul. 2026 7,585 1,559 9,144 9.50% 5,656 5 Mixed-Use Redevelopment Mortgage Denver, CO Dec. 2028 - 8,519 8,519 12.00%3 4,981 6 Retail Land Development Construction Stuart, FL Mar. 2027 8,179 (1,095) 7,084 10.00% 6,157 7 Residential Land Loan Construction Lake Toxaway, NC Oct. 2027 - 6,938 6,938 16.00%3 6,603 8 Cornerstone Exchange Construction Daytona Beach, FL Apr. 2027 2,646 4,240 6,886 10.00% 17,020 9 Wawa Land Development Construction Antioch, TN Oct. 2026 5,387 922 6,309 10.25% 1,116 10 At Home Plaza Mortgage North Canton, OH Mar. 2028 6,200 - 6,200 8.65% - 11 Wawa Land Development Construction Mount Carmel, OH Repaid in Jan. 2026 6,126 - 6,127 11.50% - 12 Old Time Pottery Mortgage Orange Park, FL Jun. 2028 4,000 - 4,000 8.00% - 13 Reno Seller Financing Mortgage Reno, NV Sep. 2027 4,000 - 4,000 8.00% - 14 Mixed-Use Development Construction Lawrenceville, GA Repaid in Jan. 2026 1,099 - 1,099 11.25% 582 15 Mixed-Use Development Construction Atlanta, GA Nov. 2027 - 879 879 11.00% 3,621 16 Portfolio Loan Mortgage Various Repaid in Oct. 2025 3,861 (3,861) - - - Total / Weighted Average: Pro Forma Including Recent Originations $73,083 $56,729 $129,813 12.37% $45,736 |
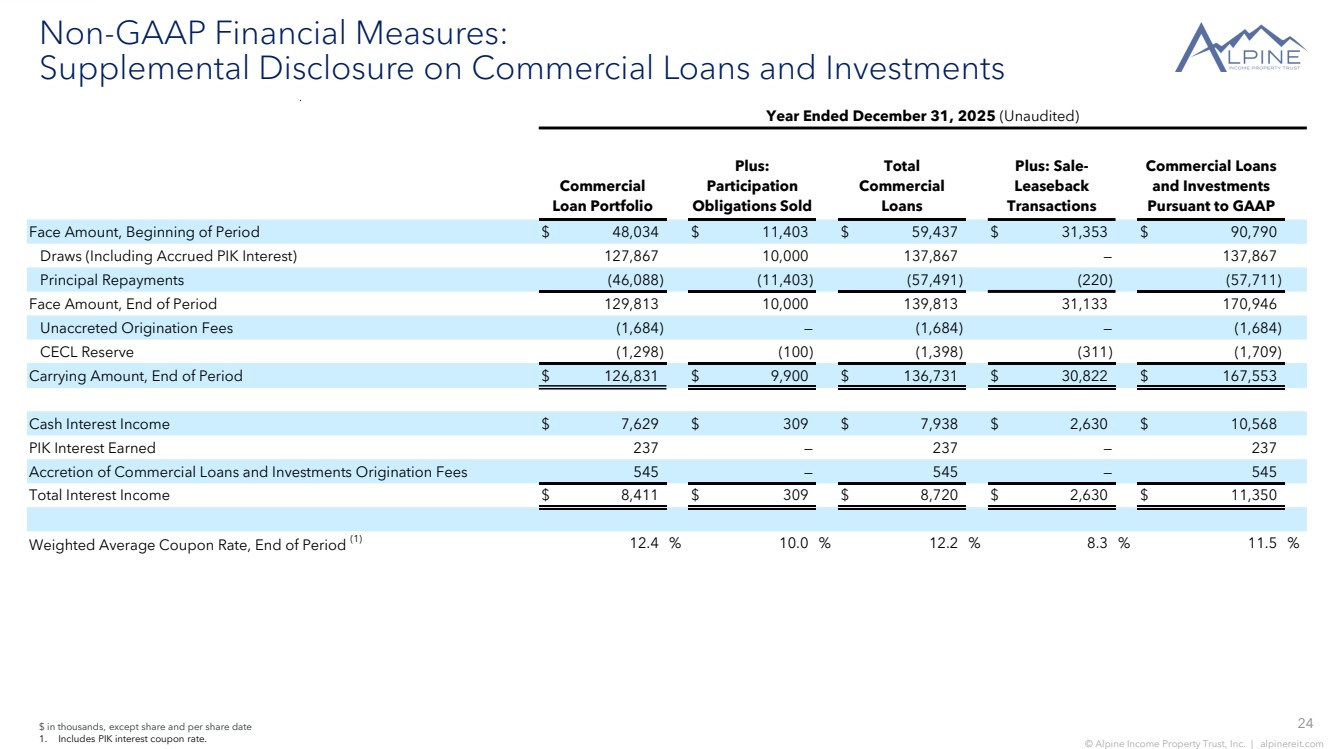
| 24 © Alpine Income Property Trust, Inc. | alpinereit.com $ in thousands, except share and per share date 1. Includes PIK interest coupon rate. Non-GAAP Financial Measures: Supplemental Disclosure on Commercial Loans and Investments Face Amount, Beginning of Period $ 48,034 $ 11,403 $ 59,437 $ 31,353 $ 90,790 Draws (Including Accrued PIK Interest) 127,867 10,000 137,867 — 137,867 Principal Repayments (46,088) (11,403) (57,491) (220) (57,711) Face Amount, End of Period 129,813 10,000 139,813 31,133 170,946 Unaccreted Origination Fees (1,684) — (1,684) — (1,684) CECL Reserve (1,298) (100) (1,398) (311) (1,709) Carrying Amount, End of Period $ 126,831 $ 9,900 $ 136,731 $ 30,822 $ 167,553 Cash Interest Income $ 7,629 $ 309 $ 7,938 $ 2,630 $ 10,568 PIK Interest Earned 237 — 237 — 237 Accretion of Commercial Loans and Investments Origination Fees 545 — 545 — 545 Total Interest Income $ 8,411 $ 309 $ 8,720 $ 2,630 $ 11,350 Weighted Average Coupon Rate, End of Period (1) 12.4 % 10.0 % 12.2 % 8.3 % 11.5 % Year Ended December 31, 2025 (Unaudited) Commercial Loan Portfolio Plus: Participation Obligations Sold Total Commercial Loans Plus: Sale-Leaseback Transactions Commercial Loans and Investments Pursuant to GAAP |
| Investor Inquiries: ir@alpinereit.com |