Please wait
JOHANNESBURG, 20 February 2026: Sibanye Stillwater Limited (Sibanye-Stillwater or the Group) (JSE: SSW and NYSE: SBSW) is pleased to report operating and financial results for the six months ended 31 December 2025, and condensed consolidated financial statements for the year ended 31 December 2025.
SALIENT FEATURES FOR THE SIX MONTHS AND YEAR ENDED 31 DECEMBER 2025 •Continued safety improvement with Group SIFR and TRIFR at lowest recorded levels
•Revenue for 2025 increased by 14% year-on-year to R129.7 billion (US$7.3 billion)
•281% increase in HEPS to 244 SA cents (14 US cents), lower basic loss per share of 183 SA cents (10 US cents) mainly due to impairments
•Normalised earnings1 for H2 2025 377% higher than for H1 2025, comprising 83% of full year normalised earnings
•Dividend of R3.7 billion (US$213 million) or R1.31 per share (32.68 US cents per ADR) declared, consistent with dividend policy and representing a 2.1%2 yield
•Group adjusted EBITDA1 of R37.8 billion (US$2.1 billion) increased by 189% year-on-year
•Balance sheet leverage lower y-on-y – net debt : adjusted EBITDA1 of 0.59x at 31 Dec 2025 and ample liquidity and flexibility
•Solid operational performance with all operations achieving annual guidance
•Favourable precious metals tailwinds drive improved profitability
•Renewable energy leader in SA mining – R93.2m savings and 316,440 tCO₂ avoided emissions3
–From 2028, the 765MW portfolio expected to deliver >R1bn annual cost savings and reduce emissions3 by 2.63m tCO₂e annually
•Staged start up of Keliber lithium project approved – completion of high capital construction phase and commencement of mining in Q1 2026
1 See "Non-IFRS measures" for more information on the metrics presented by Sibanye-Stillwater 2 Based on the closing share price of R63.76 at 17 February 2026
3 Conversion factor used of 1.08 tCO2e/MWh
| | | | | | | | | | | | | | | | | | | | | | | | | | | | | | | | | | | | | | | | | | | | |
| US dollar | | | | | | SA rand |
| Year ended | Six months ended | | | | | | Six months ended | Year ended |
| Dec 2024 | Dec 2025 | Dec 2024 | Jun 2025 | Dec 2025 | | KEY STATISTICS | | Dec 2025 | Jun 2025 | Dec 2024 | Dec 2025 | Dec 2024 |
| | | | | | GROUP | | | | | | |
| (398) | (288) | (8) | (194) | (94) | US$m | Basic earnings | Rm | (1,580) | (3,591) | 38 | (5,171) | (7,297) |
| 99 | 387 | 85 | 292 | 94 | US$m | Headline earnings | Rm | 1,540 | 5,372 | 1,543 | 6,912 | 1,817 |
| 715 | 2,115 | 360 | 818 | 1,297 | US$m | Adjusted EBITDA1,10 | Rm | 22,727 | 15,073 | 6,440 | 37,800 | 13,088 |
| (311) | (264) | | 61 | (211) | (53) | | US$m | (Loss)/profit for the period | Rm | (833) | | (3,906) | 1,291 | (4,739) | | (5,710) |
| 18.32 | | 17.88 | 17.92 | | 18.39 | | 17.38 | R/US$ | Average exchange rate using daily closing rate | | | | | | |
| | | | | | | | | | | | | | |
| TABLE OF CONTENTS | Page | | Stock data for the six months ended 31 December 2025 |
| | | | |
| | | Number of shares in issue | |
| | | - at 31 December 2025 | 2,830,567,264 |
| | | - weighted average | 2,830,567,264 |
| | | Free Float | 99 | % |
| | | Bloomberg/Reuters | SSWSJ/SSWJ.J |
| | | | |
Notes to the condensed consolidated financial statements | | | JSE Limited - (SSW) | |
| | | Price range per ordinary share (High/Low) | R32.64 to R64.70 |
| | | Average daily volume | 21,571,894 |
| | | | |
| | | NYSE - (SBSW); one ADR represents four ordinary shares | |
| | | Price range per ADR (High/Low) | US$7.27 to US$15.70 |
| | | Average daily volume | 7,601,834 |
| | | | |
| | | | |
Sibanye-Stillwater Operating and financial results | Six months and year ended 31 December 2025 1
| | | | | | | | | | | | | | | | | | | | | | | | | | | | | | | | | | | | | | | | | | | | |
| US dollar | | | | | | SA rand |
| Year ended | Six months ended | | | | | | Six months ended | Year ended |
| Dec 2024 | Dec 2025 | Dec 2024 | Jun 2025 | Dec 2025 | | KEY STATISTICS | | Dec 2025 | Jun 2025 | Dec 2024 | Dec 2025 | Dec 2024 |
| | | | | SOUTHERN AFRICA (SA) OPERATIONS | | | | | |
| | | | | | SA PGM operations | | | | | | |
| 1,738,946 | | 1,724,778 | | 910,486 | | 804,252 | | 920,526 | | oz | 4E PGM production2,3 | kg | 28,632 | | 25,015 | | 28,319 | | 53,647 | | 54,087 | |
| 1,322 | | 1,740 | | 1,333 | | 1,429 | | 2,009 | | US$/4Eoz | Average basket price | R/4Eoz | 34,914 | | 26,283 | | 23,892 | | 31,110 | | 24,213 | |
| 407 | | 933 | | 152 | | 260 | | 673 | | US$m | Adjusted EBITDA10 | Rm | 11,904 | | 4,778 | | 2,633 | | 16,682 | | 7,399 | |
| 1,198 | | 1,353 | | 1,245 | | 1,299 | | 1,407 | | US$/4Eoz | All-in sustaining cost4,10 | R/4Eoz | 24,457 | | 23,892 | | 22,317 | | 24,193 | | 21,948 | |
| | | | | | SA gold operations | | | | | | |
| 704,583 | | 632,341 | | 360,474 | | 300,191 | | 332,149 | | oz | Gold produced | kg | 10,331 | | 9,337 | | 11,212 | | 19,668 | | 21,915 | |
| 2,378 | | 3,379 | | 2,560 | | 3,049 | | 3,706 | | US$/oz | Average gold price | R/kg | 2,070,774 | | 1,802,580 | | 1,474,973 | | 1,942,194 | | 1,400,468 | |
| 323 | | 700 | | 206 | | 260 | | 440 | | US$m | Adjusted EBITDA10 | Rm | 7,696 | | 4,809 | | 3,631 | | 12,505 | | 5,832 | |
| 2,126 | | 2,509 | | 2,175 | | 2,430 | | 2,589 | | US$/oz | All-in sustaining cost4,10 | R/kg | 1,446,794 | | 1,436,817 | | 1,253,083 | | 1,442,063 | | 1,251,810 | |
| | | | | INTERNATIONAL OPERATIONS | | | | | |
| | | | | | US PGM underground operations | | | | | | |
| 425,842 | | 284,069 | | 187,703 | | 141,124 | | 142,945 | | oz | 2E PGM production2,5 | kg | 4,446 | | 4,389 | | 5,838 | | 8,836 | | 13,245 | |
| 988 | | 1,195 | | 1,001 | | 985 | | 1,380 | | US$/2Eoz | Average basket price | R/2Eoz | 23,978 | | 18,114 | | 17,942 | | 21,367 | | 18,097 | |
| (9) | | 249 | | (36) | | 151 | | 98 | | US$m | Adjusted EBITDA10 | Rm | 1,669 | | 2,775 | | (599) | | 4,444 | | (111) | |
| 1,206 | | 1,203 | | 1,182 | | 1,207 | | 1,198 | | US$/2Eoz | All-in sustaining cost4,6,10 | R/2Eoz | 20,819 | | 22,200 | | 21,185 | | 21,516 | | 22,096 | |
| | | | | | Recycling7 | | | | | | |
| 32 | | 228 | | 24 | | 147 | | 81 | | US$m | Adjusted EBITDA10 | Rm | 1,371 | | 2,707 | | 441 | | 4,078 | | 594 | |
| | | | | | Sandouville nickel refinery | | | | | | |
| (41) | | (33) | | (26) | | (17) | | (16) | | US$m | Adjusted EBITDA10 | Rm | (280) | | (310) | | (443) | | (590) | | (723) | |
| | | | | | Century zinc retreatment operation | | | | | | |
| 82 | | 101 | | 40 | | 51 | | 49 | | ktZn | Payable zinc production8 | ktZn | 49 | | 51 | | 40 | | 101 | | 82 | |
| 2,678 | | 2,717 | | 2,898 | | 2,626 | | 2,812 | | US$/tZn | Average equivalent zinc concentrate price9 | R/tZn | 48,878 | | 48,294 | | 51,931 | | 48,584 | | 49,046 | |
| 34 | | 88 | | 53 | | 36 | | 52 | | US$m | Adjusted EBITDA10 | Rm | 925 | | 657 | | 992 | | 1,582 | | 641 | |
| 2,317 | | 1,921 | | 2,413 | | 1,762 | | 2,094 | | US$/tZn | All-in sustaining cost4,10 | R/tZn | 36,399 | | 32,411 | | 43,244 | | 34,356 | | 42,446 | |
1The Group reports adjusted earnings before interest, taxes, depreciation and amortisation (EBITDA) based on the formula included in the facility agreements for compliance with the debt covenant formula. Adjusted EBITDA may not be comparable to similarly titled measures of other companies. Adjusted EBITDA is not a measure of performance under IFRS Accounting Standards and should be considered in addition to and not as a substitute for any other measure of financial performance and liquidity. For a reconciliation of profit/(loss) before royalties and tax to adjusted EBITDA, see note 12.1 of the condensed consolidated financial statements
2The Platinum Group Metals (PGM) production in the SA operations is principally platinum, palladium, rhodium and gold, referred to as 4E (3PGM+Au) and measured at the concentrator, and the US underground operations is principally platinum and palladium, referred to as 2E (2PGM)
3The SA PGM production excludes the production associated with the PoC from third parties. For a reconciliation of the production and third party PoC, refer to the "Reconciliation of operating cost excluding third party PoC for Total SA PGM operations and Marikana" sections
4See "Salient features and cost benchmarks" sections for the definition of All-in sustaining cost (AISC). The SA PGM All-in sustaining cost excludes the production and costs associated with the purchase of concentrate (PoC) from third parties
5The US PGM operations’ underground production is converted to metric tonnes and kilograms, and financial performance is translated to SA rand (rand)
6The US PGM operations’ All-in sustaining cost for the six months and year ended 31 December 2024 were adjusted to include the Section 45X Advance Manufacturing Production Credits. For the six months ended 31 December 2024, R699 million (US$39 million) was recognised and for the year ended 31December 2024 R1,255 (US$71 million) was recognised related to mining costs. During the six months ended 30 June 2025 the US PGM operations recognised R2,466 million (US$139 million) which relates to mining costs incurred for the years ended 31 December 2024 and 31 December 2023
7Recycling includes Reldan Pennsylvania (PA) site, Metallix North Carolina (NC) site and Columbus recycling site. The acquisition of the PA site was concluded on 15 March 2024 and the acquisition of NC site was concluded on 4 September 2025. The year ended 31 December 2024 only includes the results of the PA site since acquisition and the year ended December 2025, includes the NC site results since acquisition
8Payable zinc production is the payable quantity of zinc metal produced after applying smelter content deductions
9Average equivalent zinc concentrate price is the total zinc sales revenue recognised at the price expected to be received excluding the fair value adjustments divided by the payable zinc metal sold
10Adjusted EBITDA and AISC are not measures of performance under IFRS and should not be considered in isolation or as substitutes for measures of financial performance prepared in accordance with IFRS. See "Non-IFRS measures" for more information on the metrics presented by Sibanye-Stillwater. The Adjusted EBITDA amount in US$m for the six months ended 31 December 2025 is calculated using the Adjusted EBITDA amount in US$m for the year ended 31 December 2025 less the Adjusted EBITDA amount in US$m for the six months ended 30 June 2025 Sibanye-Stillwater Operating and financial results | Six months and year ended 31 December 2025 2
STATEMENT BY RICHARD STEWART, CHIEF EXECUTIVE OFFICER OF SIBANYE-STILLWATER Sibanye-Stillwater ended 2025 in a position of strengthened financial and operational performance, with positive momentum continuing during 2026. During the second half of the year, the Group successfully navigated its leadership transition. This included the presentation of a refreshed strategy, structured to look beyond short‑term turbulence and emphasise long‑term value creation, driven by structural demand for metals critical to global economic and energy transitions.
This was achieved against an exceptionally volatile global backdrop, marked by geopolitical tension, shifting supply chains and accompanying record swings in commodity prices. Global competition for critical minerals intensified, driving many commodity prices sharply higher during 2025. Gold reached an all‑time high spot price of US$5,595/oz in late January 2026, while platinum, palladium and rhodium all recorded substantial gains amid heightened global uncertainty and constrained supply dynamics. Lithium prices rebounded sharply in the fourth quarter, driven by regulatory restrictions on higher cost local supply and restocking in China and persistent supply‑side tightness, though some moderation emerged into early 2026. Heading into 2026, commodity markets will remain a defining feature of the operating context.
The resolution of overhanging matters for the Group during the fourth quarter, including the Appian court case and settling South African gold wage agreements, as well as some key operational decisions including shortening the Kloof life of mine, the commencement of phased startup of the Keliber lithium project and focus on internal organic growth projects, has set a clear, simplified and stable operating platform for 2026. These actions however, combined with volatile commodity prices, have resulted in a complex set of financial results for 2025.
Looking through the volatility of 2025, the business fundamentals are pleasing. All Group operations other than the SA gold operations delivered on or exceeded market guidance and costs were well managed across the Group, with some commendable cost performances. Improved operational delivery, combined with the higher commodity price tailwinds, underpinned materially improved fundamental financial performance and pleasingly a return to dividend payments.
With sustained higher commodity prices, disciplined capital allocation and improving operational stability, we expect continued improvement in earnings and balance‑sheet resilience, providing a solid foundation as the Group enters 2026.
Safety
Safety remained the Group’s leading priority throughout 2025, with significant progress across leading and lagging indicators. The Total Recordable Injury Frequency Rate (TRIFR) improved by 13% to 3.78, marking the first time the Group achieved a year‑end rate below the milestone target of 4. Serious Injury Frequency Rate (SIFR) and Lost Time Injury Frequency Rate (LTIFR) also reached their best levels since 2013, improving to 2.19 and 3.36 respectively.
Despite these improvements, six fatalities tragically occurred during 2025, with three occurring in the second half of 2025. On behalf of the Board and management our sincere condolences go the families and friends of Mr. Xavier, Ms. Jozana, Ms. Matsolo, Mr. Hanson, Mr. Ramaila and Mr. Klaas. Eliminating fatal incidents remains our utmost priority and a drive on our Fatal Elimination Program in 2026 will focus on safety behaviours through compliance, management routines and critically, implementing safe behaviour through our culture of care.
Operational update
The proactive repositioning of our operations over the past few years, has resulted in greater operational stability and consistency with performance improved across most operations, where our operating teams have demonstrated strong operational resilience, effective cost control, and significant financial leverage to commodity prices in 2025. In particular the SA PGM and gold operations delivered substantial earnings uplift while the US PGM operations returned to profitability following strategic restructuring and the benefit of US Section 45X Advanced Manufacturing Production credits.
The SA PGM operations delivered a steady performance, producing 1,797,928 4E ounces including attributable volumes and purchased concentrate, in line with guidance. This was despite a decline in surface production of 29%, largely due to heavy rainfall and the transition between tailings storage facilities. AISC (excluding PoC and Mimosa) rose 10% to R24,193/4Eoz (US$1,353/4Eoz), mainly due to sharply higher royalty payments linked to rising PGM prices, and increased sustaining capital. The increasing PGM prices during H2 2025, drove a 125% increase in adjusted EBITDA to R16.7 billion (US$933 million).
The SA gold operations faced operational challenges during 2025, most notably the Kloof operations, where seismicity and infrastructure constraints resulted in the cessation of certain mining areas for safety reasons and an associated material underperformance relative to the operational plan. Revised mine planning and the exclusion of high grade isolated high‑risk mining areas, reflect the Group’s commitment to safe, sustainable mining practices. As a result, gold production from the SA gold operations (including DRDGOLD) declined 10% year‑on‑year to 19,668kg (632,341oz). The SA gold operations remain highly operationally geared: the 39% increase in the rand gold price year-on-year, more than offset the 14% decline in gold sold, underpinning a 114% increase in adjusted EBITDA to R12.5 billion (US$700 million).
Significant improvements and advancements have been made across all our international operations. The benefits of the 2024 restructuring programme were evident in the performance of the US PGM operations which exceeded guidance for 2025, delivering 284,069 2Eoz, and AISC of US$1,203/2Eoz (R21,516/2Eoz), meaningfully below plan. The Recycling business, strengthened by the Metallix acquisition, continued to demonstrate enhanced scale, flexibility and margin resilience, contributed a significant adjusted EBITDA of US$228 million (R4.1 billion) for the year.
The Keliber lithium project advanced substantially during the year, with €299m in capital expenditure incurred, and it has been extremely pleasing to witness the nearing completion of the Group's first greenfield project. The construction phase is approaching completion and the first mining blast was taken in February 2026. A staged startup has been adopted to mitigate risks associated with evolving lithium‑market conditions while maintaining strategic optionality.
Finally, the Century zinc operation in Australia delivered a strong recovery, with production rising 22% to 101kt and AISC improving by 17% to US$1,921/tZn (R34,356/tZn). Adjusted EBITDA rose to US$88 million (US$1.6 billion) due to improved production stability, zinc price support, and reduced treatment charges.
Financial update
Despite the complex financial accounting matters, driven primarily by impairments, the Appian settlement, fair value losses, and higher share‑based payment expenses, the Group's core operational financial performance reflected a significant and pleasing turnaround. Group revenue rose 16% to R129.7 billion (US$7.3 billion), while adjusted EBITDA increased to R37.8 billion (US$2.1 billion) for 2025, a 189%
Sibanye-Stillwater Operating and financial results | Six months and year ended 31 December 2025 3
year‑on‑year improvement. Notwithstanding the payment of the Appian legal settlement of US$215 million (R3.6 billion) in December 2025 funded from internal resources, and an increase in the Keliber debt facility, net debt decreased to R22.1 billion (from R23.4 billion in 2024). As a result of the significant increase in Group profitability, net debt:adjusted EBITDA declined to 0.59x at the end of 2025, well below our comfort level of 1 times net debt: adjusted EBITDA.
Most pleasing was the significant increase in operational cash flow throughout the Group. Notional free cash flow (NFCF) for the Group increased by R12.4 billion year-on-year. Year-on-year operational NFCF improved across the SA PGM operations (+R5.7 billion), the SA gold operations (+R4.8 billion), the US PGM operations and recycling (+R3.4 billion) and the Century retreatment operation (+R966 million). European operations NFCF year-on-year was negative at R6.6 billion but improved from negative R7.4 billion due to lower Keliber capex and the transition of Sandouville to care and maintenance.
On the basis of significantly improved normalised earnings1 of R10.6 billion (US$591 million) for 2025, the Board declared a full year dividend of R3.7 billion (US$213 million) or R1.31 per share (32.68 US cents per ADR), representing 35% of normalised earnings, the higher end of the Group’s dividend policy.
1 Normalised earnings is not a measure of performance under IFRS Accounting Standards. As a result it should not be considered in isolation or as alternatives to any other measure of financial performance presented in accordance with IFRS Accounting Standards. See note 10 of the condensed consolidated financial statements for the definition and reconciliation of normalised earnings
Strategic update
Strategic progress continued across multiple fronts. In the United States, preliminary antidumping duties of 132.83% have been announced on Russian palladium imports, in response to the antidumping and countervailing duty petitions filed by Sibanye-Stillwater together with the United Steelworkers Union in July 2025.
Significant progress has been made on several fronts in our sustainability strategy, but extremely pleasing is the solidifying of our position as the largest contracted private renewable energy off-taker in the SA mining industry, with 765MW of renewable energy having been secured. This not only contributes to an anticipated 41% decline in our greenhouse gas emissions by 2028, but is also expected to provide a more than R1 billion saving per annum on energy costs.
A refreshed strategy was presented to the market on 29 January 2026 in which the Group will focus on creating a high-performing, future-focused metals business. The priorities to unlock unrealised value include:
•Simplification of operating model and asset portfolio to enhance accountability, agility and management focus
•Performance excellence through holistic improvement to drive higher margins
•Growth focused on value creation that is anchored in returns and unlocking organic value as a priority
•Capital allocation through a disciplined framework prioritising returns and securing sustainability
Delivering on our strategy will ensure resilience for the Group in navigating through multi-metal pricing cycles and a rapidly changing macro environment.
Conclusion
Looking ahead, Sibanye-Stillwater enters 2026 with positive momentum, supported by strong commodity‑price leverage, improved operational stability, a stable balance sheet and advancing high‑quality organic growth opportunities. While volatility is expected to persist, disciplined execution of the Group’s strategic pillars of safe operational excellence, capital discipline, portfolio simplification and cultural renewal will remain the core enablers of long‑term value creation.
OPERATING GUIDANCE FOR 2026*
| | | | | | | | | | | | | | |
2026 Annual guidance | Production | All-in sustaining cost | Total capital |
SA operations | SA PGM operations (4E PGMs) | 1.65 - 1.75Moz3,4 | R26,500 - 27,500/4Eoz (US$1,453 - 1,508/4Eoz)² | R8bn (US$439m)² (incl. R1.79bn (US$98m) for project capital) |
SA gold operations (excl. DRDGOLD) | 13,700 - 14,700kg (440 - 473koz) | R1,620k - 1,730k/kg (US$2,855 - 3,049/oz)² | R2.8bn (US$154m)² |
International operations | US PGM operations (2E mined) | 280 - 300koz | US$1,520 - 1,580/2Eoz¹ Including Section 45X: US$1,360 - 1,420/2Eoz | US$125m - US$135m (incl. US$6m growth) (R2.3bn - R2.5bn incl. R109m growth)² |
Recycling (Columbus, PA and NC) (PGM autocats, industrial and e-waste precious metals bearing waste) | 400 - 420koz (gold equivalent ounces)5 | n/a | US$12.2m (R223m)² |
Keliber lithium project | 15k - 20k tonnes of spodumene concentrate | n/a | €180m - €190m6 (R3.7bn – R3.9bn))² (incl. €90m (R1.8bn) for project capital) |
Century zinc operations | 86.3k - 98.3k tonnes (payable) | A$3,400 – 3,800/t (R42,160 – 47,120/t)² (US$2,311 - 2,583/t)² | A$5 - A$5.5m (US$3,4m – US$3.7m, R62m - R68.2m)² |
Source: Company forecasts, Note: Guidance does not take into account the impact of unplanned events
* As at 20 February 2026
1.US PGM AISC are impacted by tax and royalties paid based on PGM prices, current guidance was based on spot 2E PGM prices of US$1,180/oz; By product credit assumptions of Rh US$4,800/oz and gold US$2,500/oz
2.Estimates are converted at an exchange rate of R18.24/US$, R20.43/€ and R12.40/A$
3.SA PGM operations production guidance includes third party PoC and 50% attributable production from Mimosa
4.SA PGM operations AISC excludes the purchase cost of third party PoC and Mimosa costs and capital (equity accounted)
5.Gold equivalent ounce production calculated using the following metal pricing: Au US$2,506/oz, Ag US$38/oz, Pt US$1,150/oz, Pd US$1,050, Ir US$4,000/oz, Rh US$4,800/oz, Ru US$500/oz and Cu US$4.4/lb
6.2026 guided capital includes construction phase start-up capital, sustaining cost and capitalised cost. The current production profile includes the Syväjärvi and Rapasaari open pit mining areas
RICHARD STEWART
CHIEF EXECUTIVE OFFICER
Sibanye-Stillwater Operating and financial results | Six months and year ended 31 December 2025 4
SIBANYE-STILLWATER GROUP SAFETY AND OPERATING REVIEW SAFETY
Safety has been a core value for the Group and is our first priority. It is therefore pleasing to note that several of our operations continue to record improving trends in leading safety indicators and achieve globally leading injury rates, confirming ongoing progress in risk reduction. However, unacceptable risks remain in certain areas, and we continue to experience tragic incidents despite our efforts. Our commitment to ensuring a safe work environment and zero harm is unwavering.
For the first time, the Group recorded a year-end Total Recordable Injury Frequency Rate (TRIFR) below the milestone target of 4, achieving a rate of 3.78 in 2025 and improving 13% year-on-year. The Serious and Lost Time Injury Frequency Rates (SIFR and LTIFR) were also the best average numbers recorded since inception in 2013, improving by 1% to 2.19 and 13% to 3.36 respectively, when compared to 2024. In addition, there has been a consistent decline in high potential incidents (HPIs), 44% lower in 2025 than 2024 with HPI's declining from an average 52 per month in 2022, when this was first monitored to 10 per month in 2025. The Group fatal injury frequency rate (FIFR) (per million hours worked) improved from 0.051 in 2024, to 0.037 for 2025.
Notwithstanding the progress being made, in addition to the five colleagues already mourned, during Q4 2025, a tragic incident on 5 November 2025 resulted in the passing of a colleague, Mr Nkosana Klaas, a winch operator at Marikana East 3 shaft, from a fall of ground incident. This incident is being investigated with relevant stakeholders to understand the root causes and specify risk mitigation measures for implementation. The Board and management of Sibanye-Stillwater extend their sincere condolences to the loved ones, families and friends of our deceased colleagues, and support has been provided to the families of the deceased.
We remain committed to advancing our safe behaviour programme for the South African (SA) operations. This initiative is strategically structured across two tiers to ensure cultural transformation at both leadership and supervisory levels effectively drives and reinforces positive safety behaviours throughout the organisation. The consistent and improved reporting of near-miss incidents in recent years has significantly improved risk awareness, operational transparency, and employee confidence in the reporting process. This reflects positively on our proactive risk management and the establishment of a culture rooted in trust and transparency.
We continue to promote a bottom-up safety culture, empowering all employees to halt unsafe work. As at end of 2025, 85% of unsafe work stoppages were executed by frontline employees. This represents an improvement on the 81% stoppages achieved by 2024 year-end.
OPERATING REVIEW
Southern Africa (SA) operations
SA PGM operations
The SA PGM operations delivered consistent operational performance for 2025 with PGM production of 1,797,928 4Eoz (including attributable production from Mimosa and third-party purchase of concentrate (PoC)), within annual guidance of 1.75 to 1.85 million 4Eoz and consistent year-on-year.
Since 2020, the first full year after the acquisition of Lonmin in June 2019, PGM production from the SA PGM operations has been stable at between 1.73 and 1.83 million 4Eoz. Annual production and cost guidance has consistently been met, enabling continued improvement in cost and competitive positioning relative to peers, evident in an ongoing shift from the fourth quartile of the PGM industry cost curves, towards the second quartile.
PGM production (excluding PoC) of 1,724,778 4Eoz was consistent with 2024 despite a significant decline in surface production. Underground mining production increased by 2% (30,569 4Eoz) to 1,616,545 4Eoz in 2025, primarily as a result of improved production from the Rustenburg mechanised mining operations, particularly the Bathopele shaft, and more stable production compared with 2024, which was impacted by production disruptions at the Siphumelele shaft (affected by the shaft infrastructure incident) and Kroondal operation (illegal strike action). Underground production from the Marikana operations declined due to safety related stoppages (particularly at the high production Saffy shaft which produced 15% (31,040 4Eoz) less year-on-year), partially offset by the ramp up at the K4 shaft where production increased by 28,944 4Eoz to 99,605 4Eoz. Surface production declined by 29% to 108,233 4Eoz due to the impact of high rainfall in H1 2025, and declining production from the end of life of Rustenburg Waterval West TSF and Marikana ETD1 transitioning to ETD2 tailings storage facility (TSF) in November 2025. A comprehensive assessment on potential for long life production from surface sources at Rustenburg is underway. Third party PoC of 73,150 4Eoz for 2025 was 24% lower than for 2024, in line with third party contractual agreements.
AISC (excluding third party PoC and Mimosa) for 2025 of R24,193/4Eoz (US$1,353/4Eoz) was within annual guidance of R23,500 to R24,500/4Eoz (US$1288 to US$1,343/4Eoz), but was 10% higher than for 2024, primarily due to higher royalties which increased by 261% to R765 million (US$43 million) as a result of increased revenue and profitability from increasing PGM prices, and a 12% increase in sustaining capital year-on-year to R2.9 billion (US$160 million). An inventory increase of R2.5 billion (US$152 million) for 2025 was the result of an increase of 43,318 4Eoz in saleable metal at the Rustenburg operation, mainly due to the timing of sales and build up in saleable metal inventory as a result of the Kroondal PoC contract with Valterra converting to a toll agreement on 1 September 2024, increase in the weighted average cost of metal in process and the reversal during 2025 of the previously recognised provision for net realisable value of inventory (R851 million) following higher metal prices during 2025. By-product credits of R11.7 billion (US$655 million) for 2025 partially offset these increases, reducing AISC by R6,969/4Eoz (US$390/4Eoz), consistent with the reduction of by-product credits of R6,817/4Eoz (US$372/4Eoz) for 2024.
Chrome credits comprised 41% of total by-product credits for 2025 (decreasing from 52% for 2024) due to lower chrome production, sales and prices, offset by higher ruthenium prices and increased iridium volumes sold. AISC (including PoC) for 2025 increased by 11% to R24,312/4Eoz (US$1,360/4Eoz) due to a 6% increase in PoC purchase cost as a result of higher PGM prices.
Total capital expenditure for 2025 of R5.9 billion (US$329 million) was lower than guidance of R6.5 billion (US$356 million). Project capital decreased by 16% to R675 million (US$38 million), due to the completion of expenditure for a reflux classifier plant at Rustenburg during 2024, and a 10% decline in project capital at K4 project to R590 million (US$33 million) in line with the ramp-up plan. Project capital of R675 million (US$38 million) was below guidance of R1.4 billion (US$78 million) primarily due to the withdrawal from the planned purchase of a third party processing plant and deferred spending on the Marikana K4 and Siphumelele projects. Ore reserve development (ORD) capital was 5% lower year-on-year, however sustaining capital increased by 12% to R2.9 billion (US$160 million) primarily for replacement and upgrades of essential equipment at the mining operations and infrastructure upgrades at the Precious Metals Refinery (PMR).
Sibanye-Stillwater Operating and financial results | Six months and year ended 31 December 2025 5
The sharp rally in PGM prices from May 2025 resulted in the average 4E PGM basket price increasing by 28% to R31,110/4Eoz (US$1,740/4Eoz) year-on-year and underpinned by the stable operational performance, drove a 125% increase in adjusted EBITDA to R16.7 billion (US$933 million) for 2025 relative to the previous year, illustrating the significant leverage of the SA PGM operations to increasing prices. The 4E PGM basket price has increased further during 2026 averaging R47,262/4Eoz (US$2,916/4Eoz) year-to-date (YTD), 35% higher than the H2 2025 average basket price. Despite a general correction in metal prices at the end January 2026, the basket price has stabilised at about R44,424/4Eoz (US$2,778/4Eoz), and with fundamental drivers remaining supportive, suggests potential for further earnings and cash flow gains during 2026.
Attributable production from Mimosa decreased by 5% year-on-year to 117,019 4Eoz primarily due to concentrator downtime due to power outages, which affected recoveries. AISC increased by 11% to US$1,280/4Eoz (R22,894/4Eoz) primarily due to lower production.
SA gold operations
Despite significant operational challenges which persisted throughout the year at Kloof, and short term production constraints affecting Driefontein and Beatrix, these mature operations continue to deliver significant value for the Group and all its stakeholders well beyond the life of mine (LOM) planned at the end of 2012. Buoyed by the continued increase in the gold price, the SA gold operations delivered materially better financial results for 2025.
The SA gold operations are highly leveraged to the gold price and generated significantly higher earnings and cash flow for 2025 despite lower gold production for 2025. The average gold price received by the SA gold operations (including DRDGOLD) increased by 39% to R1,942,194/kg (42% to US$3,379/oz) which resulted in adjusted EBITDA for the SA gold operations (including DRDGOLD) increasing by 114% to R12.5 billion (US$700 million) year-on-year. The SA gold operations contributed 33% to 2025 Group adjusted EBITDA, 61% higher than the previous highest annual adjusted EBITDA of R7.8 billion (US$472 million) for 2020. The outlook for the gold price for 2026 remains positive, supported by global economic and socio-political uncertainty and fractured international relations. The spot gold price has increased by approximately 9% to R2.5 million/kg (US$4,900/oz) for 2026 YTD, approximately 21% higher than the average for H2 2025. Should the gold price maintain current levels or higher during 2026, earnings and cashflow from the SA gold operations are likely to increase significantly.
Gold production from the SA gold operations (excluding DRDGOLD) of 15,066kg (484,383oz) was within revised guidance of 15,000 to 16,000kg (480 to 514koz) for the year, but 11% lower than for 2024. Guidance was revised in Q2 2025 following significant operational disruptions at the Kloof operation compounded by elevated seismicity in high grade Isolated Blocks of Ground (IBGs) areas, necessitating the withdrawal and relocation of crews to the Driefontein operation and the removal of these IBGs from the production plans due to safety concerns. Due to these constraints, production from Kloof, declined by 31% (1,518kg/48,805oz) year-on-year to 3,374kg (108,477oz). The removal of higher grade IBGs due to increased seismicity exceeding safety risk tolerance levels and ongoing production constraints resulted in a rebasing of the LOM plans and a significant reduction in reserves. The safety of our employees and colleagues is our first and overarching priority, and the increased safety risk associated with increased seismicity in the high grade IBGs, prompted a difficult decision which has led to the Kloof LOM reducing to one year from eight years previously.
Gold production from the Driefontein operation increased by 3% to 7,216kg (232,000oz) year-on-year as operational delivery recovered in H2 2025 following the fire in the 5 shaft pump station and safety related stoppage experienced in H1 2025. Gold production at Beatrix decreased by 5% year-on-year to 3,582kg (115,164oz) mainly due to throughput constraints experienced at the Beatrix plant.
Gold production (including DRDGOLD) in 2025 decreased by 10% to 19,668kg (632,341oz) year-on-year, primarily due to a 8% decline in DRDGOLD production.
AISC for the SA gold operations (excluding DRDGOLD) for 2025 increased by 17% to R1,576,859/kg (US$2,743/oz), due to a 16% decrease in gold sold year-on-year to 14,442kg (464,321oz), ORD capital expenditure which increased by 3% to R2.9 billion (US$164 million) and sustaining capital expenditure which increased by 12% to R776 million (US$43 million). Despite lower production, ORD has focussed on strategic development of secondary reefs to sustain production and maintain flexibility at Kloof and Driefontein whilst sustaining capital has focussed on maintaining sustainable mining infrastructure. Similarly for 2025, AISC for the SA gold operations (including DRDGOLD) increased by 15% to R1,442,063/kg (US$2,509/oz).
Total capital expenditure from the SA gold operations (excluding DRDGOLD) decreased by 4% to R3.7 billion (US$208 million). Project capital expenditure decreased from R354 million (US$19 million) for 2024 to R13 million (US$1 million) for 2025 mainly due to the Burnstone project being placed on care and maintenance during H1 2024. Capital expenditure at DRDGOLD remained elevated due to expenditure on the Far West Gold Recoveries (FWGR) facility but decreased by 12% to R3.0 billion (US$166 million) primarily due to a 15% decrease in project capital expenditure as detailed below.
In December 2025, a three-year wage agreement was concluded with the representative unions at the SA gold operations. The agreement is effective for three years from 1 July 2025 to 30 June 2028, which should allow increased management focus on operational delivery.
Production from DRDGOLD declined by 8% for 2025 to 4,602kg (147,958oz) primarily driven by a 12% decline in yield reflecting a transition to lower grade material from the Driefontein tailings storage facilities (TSFs). Operating costs were well controlled with lower electricity costs from the commissioning of the renewable energy project which was commissioned in November 2024. AISC of R1,076,310/kg (US$1,872/oz) was 14% higher year-on-year, primarily due to less gold sold and a 26% increase in sustaining capital expenditure. Project capital expenditure decreased by 15% to R2.7 billion (US$149 million) due to the completion of the renewable energy project. Adjusted EBITDA from DRDGOLD of R4.4 billion (US$248 million) for 2025 increased by 75% to R4.4 billion (US$248 million) year-on-year, due to the 40% increase in the rand gold price received to R1,967,881/kg (US$3,423/oz).
International operations
US PGM operations
The US PGM operations delivered a successful operational and financial performance in 2025 post the restructuring undertaken from Q4 2024 in which the Stillwater West mine was put on care and maintenance. Stable production, lower operating cost and capital expenditure year-on-year, the recognition of Section 45X credits and improved 2E PGM basket prices contributed towards a turnaround in the performance for 2025 and significant reduction in losses compared to 2024. The improved profitability in 2025 sets a solid platform to further optimise operations and set up the US PGM business for long term success.
In accordance with the restructuring plan mined 2E PGM production for 2025 of 284,069 2Eoz was 33% lower year-on-year, exceeding the upper end of guidance of 270,000 2Eoz for the year. 2E PGM sold for 2025 of 283,622 2Eoz was in line with production.
The average 2E PGM basket price for 2025 increased by 21% to US$1,195/2Eoz (R21,367/2Eoz), with PGM prices rallying sharply during H2 2025. Improved PGM basket pricing and total Section 45X credit benefits of US$185 million (R3.3 billion) resulted in adjusted EBITDA for 2025
Sibanye-Stillwater Operating and financial results | Six months and year ended 31 December 2025 6
of US$249 million (R4.4 billion). Even without the Section 45X credit benefit, the US PGM operations contributed positively to the Group with adjusted EBITDA (excluding Section 45X credits) of US$64 million (R1.2 billion), a significant change in the financial performance compared to the US$9 million (R111 million) adjusted EBITDA loss for 2024.
Total operating cost for 2025 was well controlled declining by 30% to US$289 million (R5.2 billion) as planned and consistent with the reduced production profile. Operating cost includes the benefit of Section 45X credit legislation, with Section 45X credits of US$46 million (R801 million) recognised for 2025, and US$139 million (R2.5 billion) recognised during 2025 related to the combined 2023 and 2024 financial years.
AISC of US$1,203/2Eoz (R21,516/2Eoz) (including Section 45X credits) for 2025 was well below annual guidance of US$1,320/2Eoz. AISC (excluding Section 45X credits recognised for 2025) would have been US$162/2Eoz (R2,820/2Eoz) higher at US$1,365/2Eoz.
Total capital expenditure of US$96 million (R1.7 billion) was below guidance of US$100 million (R1.8 billion) and 38% lower year-on-year in line with the Q4 2024 restructuring plan. Project capital expenditure decreased by 52% to US$8 million (R135 million) for 2025. Sustaining capital expenditure increased in H2 2025 due to the delivery of new mining and support fleet to replace less efficient fleet as part of the strategic mechanisation initiatives.
The improvement in the PGM basket price and profitable performance in H2 2025 has eased near term pressure on the US PGM operations but has not diminished the focus to set up the US PGM business for the long term and establish a pathway to reduce costs to a sustainable AISC of US$1,000/2Eoz (in 2024 real terms, excluding Section 45X credits). We expect to provide further detail on the pathway to AISC of US$1,000/2Eoz at an investor day planned to be held in 2026.
Recycling
The US Recycling operations comprise Reldan Pennsylvania (PA), Metallix North Carolina (NC) acquired on 4 September 2025, and Columbus autocat recycling sites (Columbus), now operating under a unified leadership structure with integration of NC progressing well and synergies being realised across logistics, technology, technical capability and the expanding autocat value proposition. Going forward, all three sites will be reported as the US Recycling segment.
The combined Recycling operations recorded adjusted EBITDA of US$228 million (R4.1 billion) for 2025, contributing 11% to the Group adjusted EBITDA (including Section 45X credits).
PGM recycling operation (Columbus site)
Total PGM ounces fed for 2025 of 308,617 3Eoz were 2% lower year-on-year. Unfed inventory on hand has normalised to 52 tonnes at year end from the 147 tonnes at the end of H1 2025 .
The average 3E PGM basket price increased by 9% year-on-year to US$1,383/3Eoz (R24,728/3Eoz), primarily driven by higher rhodium prices. This increase was lower than the 21% rise in the 2E basket price achieved in the underground operations, reflecting the typical 2–3 month pricing lag in Recycling, where prices are fixed with customers at the time of delivery. Adjusted EBITDA increased by 857% to US$163 million (R2.9 billion) largely driven by the recognition of Section 45X credits.
Pennsylvania site (PA) (previously Reldan recycling)
Favourable metal pricing, strong manufacturing-sector demand, effective integration into the Sibanye-Stillwater Group and early benefits from the integration of the NC facility, enhancing the efficient processing of precious metal-bearing industrial waste, enabled PA to increase its profit and cash contribution to the Group.
For 2025 the PA site sold 138,977 oz gold, 2,031,547 oz silver, 17,697 oz platinum, 24,103 oz palladium and 3.1 million lbs of copper and processed 8.9 million lbs of industrial scrap. PA site's 2025 adjusted EBITDA was US$65 million (R1.2 billion), up from the US$15 million (R268 million) in 2024 which only included 10 months of Reldan since acquisition.
North Carolina site (NC) (previously Metallix recycling)
The acquisition of Metallix was concluded on 4 September 2025 and is expected to enhance the Group's recycling footprint adding processing capacity, logistics capability and technical skills. For the four months ended 31 December 2025, NC contributed revenue of US$93 million (R1,658 million).
The integration of NC into the Sibanye-Stillwater Group is underway. At acquisition, an accounting fair value adjustment of US$28 million (R501 million) was recognised to inventory on hand. This adjustment was subsequently expensed through cost of sales as the related inventory was sold, resulting in the NC site recording an adjusted EBITDA loss of US$10 million (R181 million) for the four months up to 31 December 2025.
European operations
Keliber lithium project
The Keliber lithium project is an advanced, fully integrated lithium development project located in Finland.
Construction activities at the Keliber lithium project progressed according to plan during 2025 with completion of the construction phase planned during Q1 2026.
Project capital expenditure for H2 2025 was €148 million (R2.7 billion), including capitalised interest of €8 million (R225 million) and other capitalised expenditure outside the project’s initial forecast scope (such as exploration). Full‑year 2025 capital expenditure totalled €299 million (R5.8 billion), consistent with the 2025 annual guidance of €300 million (R5.9 billion). At the end of December 2025, total project capital expenditure for the construction phase amounted to €693 million (R14.1 billion) (excluding capitalised interest and exploration) and in line with the revised capital forecast of €783 million (R15.9 billion) in 2024 real terms.
As communicated in January 2026, following a detailed multidisciplinary assessment of various project start up scenarios during H2 2025, Sibanye-Stillwater and its partner, Finnish Minerals Group, agreed that a staged startup for the Keliber lithium project was the most responsible approach.
Despite encouraging improvements in lithium prices during the fourth quarter of 2025 and into early 2026, the longevity of these price levels is yet to be confirmed. Staged commissioning of the mine, concentrator, and refinery reduces ramp-up risk by prioritising operational readiness in the mining and concentrating stages before determining the appropriate timing for refinery commissioning. This approach also preserves financing flexibility by enabling the deferral of capital expenditure and refinery ramp-up costs, depending on
Sibanye-Stillwater Operating and financial results | Six months and year ended 31 December 2025 7
lithium market developments and broader market conditions. The first stage of the project start up began during Q1 2026, with the first blast at the Syväjärvi open pit mining area on 11 February 2026.
* Amounts are translated at the average rate of R20.17/€ for 2025 and project expenditure to date, R20.08/€ for H2 2025 and R19.80/€ for the 2025 guidance
Sandouville nickel refinery
The Sandouville nickel refinery received the last nickel matte in January 2025 and subsequently ramped down production. Various cleaning and closure activities were undertaken during the year and the site was placed on care and maintenance as of January 2026.
An adjusted EBITDA loss of US$33 million (R590 million) was incurred for 2025 compared to a loss of US$41 million (R723 million) in 2024. Financial losses are expected to reduce in 2026 with estimated care and maintenance costs of US$12 million (R215 million) for 2026.
The GalliCam pre-feasibility study (PFS) to assess the potential conversion of the Sandouville plant to produce pCAM continued in 2025. GalliCam pre-feasibility costs of US$9 million (R161 million) were expensed in 2025 against guidance of US$11 million (R195 million) for 2025. The study will continue into 2026, with a decision on progressing the project to be evaluated by the end of H1 2026.
Australian operations
Century tailings retreatment operation
The Century zinc retreatment operation delivered a strong operational and financial performance, exceeding metal production guidance and AISC cost guidance for 2025. Production in 2025 was stable, having returned to normal levels when compared to 2024, which was impacted by a heavy wet season and damaged pipeline infrastructure from a regional bushfire in Q4 2024. Numerous wet-season resilience measures implemented in recent years, including the satellite slurry-winning pontoons, expanded dewatering infrastructure, enhanced debris removal systems and water diversion bunds, collectively reduced operational disruption and improved production consistency.
Production from the Century operations increased by 22% to 101 kilotonnes (kt) of payable zinc metal for 2025, compared to 82 kt in 2024. All-in sustaining costs (AISC) for 2025 were 17% lower to US$1,921/tZn (R34,356/tZn), compared to US$2,317/tZn and (R42,446/tZn) in 2024 due to increased production, disciplined cost control and a more predictable maintenance profile.
Adjusted EBITDA for the Century operations for 2025 was US$88 million (R1.6 billion), 160% higher compared to US$34 million (R641 million) in 2024, having benefitted considerably from improved production, higher zinc metal prices and lower treatment charges in 2025. The average equivalent zinc price increased by 1% to US$2,717/tZn (R48,584/tZn) in 2025 from US$2,678/tZn (R49,046/tZn) in 2024.
Total capital expenditure for 2025 decreased by 39% to US$6 million (R114 million) compared to US$10 million (R192 million) in 2024, due to once off infrastructure expenditure in 2024 post the bushfire recovery, and the five yearly scheduled maintenance overhaul for the Century transhipment vessel, the Wunma. Sustaining capital expenditure during 2025 focused on maintaining asset integrity, strengthening operational resilience and ensuring the long-term reliability of critical infrastructure. Project capital expenditure in 2025 of US$3 million (R55 million) was due to spend and capitalisation of costs relating to the phosphate feasibility study that commenced in 2025.
We expect the strong operational performance in 2025 to continue in 2026, positioning the Century operations well to benefit from an environment of supportive zinc metal pricing and low treatment charges.
Options to leverage the existing infrastructure (processing plant, pipeline, camp and port facilities) and extend the life of the assets beyond the current zinc retreatment operations continue to be actively explored. This includes opportunities to potentially utilise the Century infrastructure to access the extensive, largely undeveloped phosphate resources in the region. A feasibility study (AACE Class 2 Estimate) is expected to be completed during H1 2026.
Mt Lyell copper project
The Mt Lyell feasibility study (AACE Class 2 Estimate) was completed at the end of 2025. The work undertaken during the year allowed the declaration of a 1,053Mlb copper Mineral Reserve at 31 December 2025. Progression of any further study work and a final investment decision to be evaluated in accordance with the Group's capital allocation framework and subject to final board approval.
Project capital amounted to US$4 million (R66 million) in 2025 due to spend and capitalisation of the Mt Lyell feasibility study costs.
* Amounts are translated at the average rate R11.52/A$ and R17.88/US$ for 2025
Sibanye-Stillwater Operating and financial results | Six months and year ended 31 December 2025 8
FINANCIAL REVIEW OF THE SIBANYE-STILLWATER GROUP Group financial performance
The financial review commentary compares the H2 2025 reporting period to H2 2024 reporting period for income statement items and 31 December 2025 to 30 June 2025 for statement of financial position items.
Group revenue for H2 2025 increased by 32% to R74,910 million mainly due to higher commodity prices received at all operations except the Century operations, partially offset by lower sales volumes at the SA gold, US PGM and Century operations. Group cost of sales, before amortisation and depreciation increased by 4% to R50,165 million mainly due to the inclusion of costs from the NC recycling site (Metallix), partially offset by lower cost of sales at the Sandouville nickel refinery and lower sales volumes. The increase in net impairments recognised, higher share-based payment expenses, lower other income received, higher other costs, net loss on financial instruments, higher transaction costs and higher royalties and taxes together with the higher cost of sales resulted in a 165% decrease in the Group loss for H2 2025 of R833 million. Group adjusted EBITDA for H2 2025 increased by 253% or R16,287 million to R22,727 million.
Revenue
Group revenue for H2 2025 increased by 32% or R17,985 million to R74,910 million. Group revenue benefited from increased commodity prices and the inclusion of the NC recycling site, which is consolidated with the PA recycling site (Reldan), partially offset by lower sales volumes at SA gold, US PGM and Century operations and Sandouville which ramped down and ceased production. Consequently, the impact of both higher commodity prices and higher volumes resulted in higher revenue at the SA PGM operations of R11,366 million while higher gold prices resulted higher revenue at the SA gold operations of R4,304 million. The higher commodity prices combined with NC recycling revenue also resulted in higher revenue for PA recycling of R4,300 million.
Cost of sales, before amortisation and depreciation
Group cost of sales before amortisation and depreciation for H2 2025 increased by 4% or R1,828 million to R50,165 million. This was mainly due to the inclusion of costs from the NC recycling site which resulted in a net increase in costs at the combined recycling operations of R3,715 million and for the SA PGM operations, mainly due to higher volumes sold. Notably, cost of sales before amortisation and depreciation at the US PGM underground operations decreased by R2,508 million or 53%,due to a 32% decrease in volumes sold by the US PGM operations as they were repositioned for a lower cost structure. Section 45X advanced manufacturing production credits recognised for H2 2025 were R441 million (US$26 million). Additionally, cost of sales before amortisation and depreciation at the Sandouville nickel refinery decreased by R1,450 million or 99%, due to the termination of nickel production and preparation towards placing Sandouville in care and maintenance.
Loss for the period
Loss for H2 2025 increased by 165% from a profit of R1,291 million to a loss of R833 million, due to higher net impairments raised (Keliber and Kloof, discussed later in this section), higher share-based payment expenses of R1,385 million (a function of the higher share price), higher transaction costs (which included the Appian legal settlement of R3,565 million - see note 13 of the condensed consolidated financial statements), movement in net loss on financial instruments of R7,340 million (mainly due to higher fair value losses recognised relating to the Burnstone debt and other BEE related liabilities), lower other income of R434 million, higher other costs of R179 million and higher royalties and taxes of R626 million and R2,522 million (due to increased profitability). The decrease in other income was mainly due to no onerous supply contract provision utilisation/change in estimate for the Sandouville nickel refinery. The loss for H2 2025 was partially offset by the profit from the share of results of equity accounted investees of R693 million, mainly related to a higher profit from Mimosa.
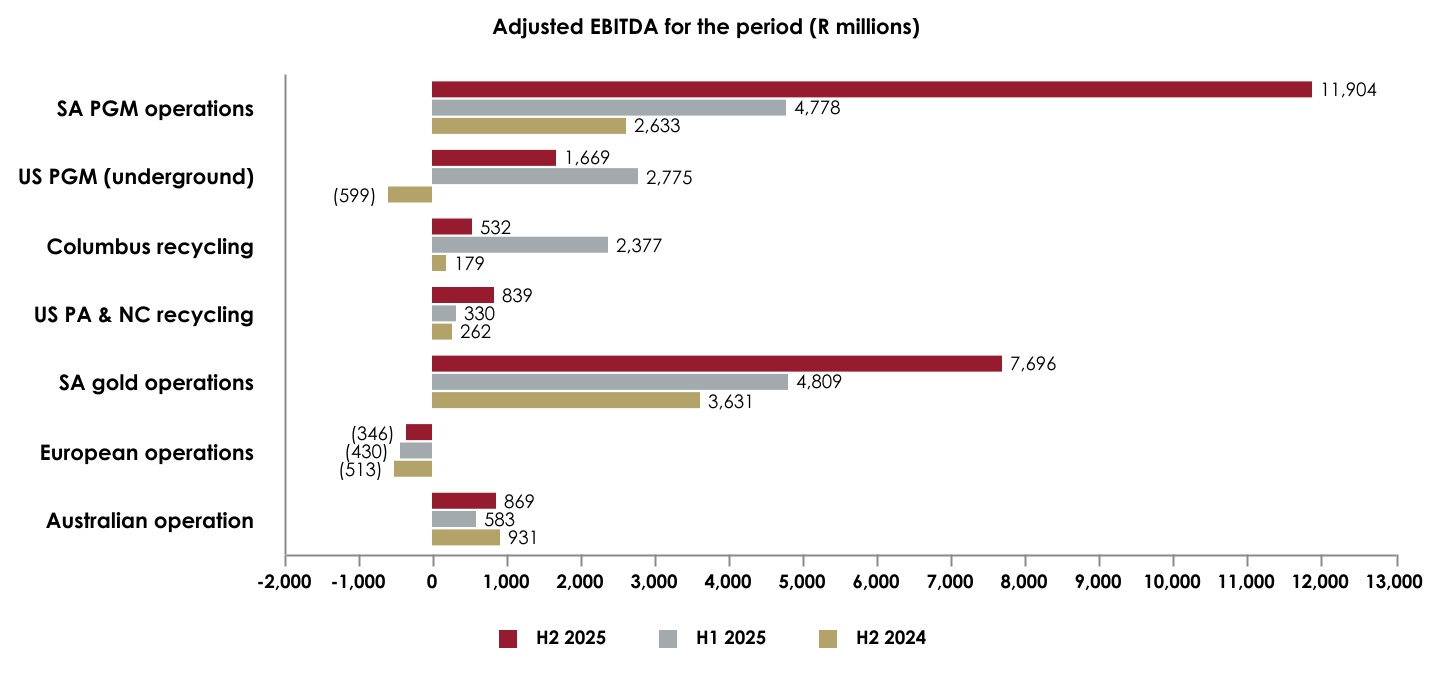
Adjusted EBITDA
Adjusted EBITDA includes other cash costs, care and maintenance costs; lease payments and corporate social investment costs (see note 19 of the condensed consolidated financial statements for a reconciliation of profit before royalties, carbon tax and tax to adjusted EBITDA). Care and maintenance costs for H2 2025 were R1,099 million.
The (Loss)/profit and Adjusted EBITDA are shown in the graphs below:
The (Loss)/profit in the graph above includes the impairment losses recognised/reversed during the H2 2025 period, which are discussed under the impairments section further below.
Sibanye-Stillwater Operating and financial results | Six months and year ended 31 December 2025 9
Adjusted EBITDA is shown in the graph below:
 Interest Income
Interest income increased by R293 million to R882 million mainly due to Section 45X interest accrued at the US PGM and Columbus recycling operations of R142 million and R127 million, respectively and R21 million higher interest received on average cash balances.
Finance expense
Finance expense increased by R168 million to R2,447 million mainly due to a R387 million increase in the unwinding of the finance costs on the deferred revenue transactions. See note 4 of the condensed consolidated financial statements for further detail of finance expenses.
Loss on financial instruments
The loss on financial instruments of R3,403 million for H2 2025 compared with the gain of R3,937 million for H2 2024, represents a period-on-period net loss of R7,340 million. The net loss for H2 2025 is mainly attributable to a change in estimated cash flows/fair value loss on the Burnstone project debt of R1,805 million after increased long-term gold prices and fair value losses on hedge contracts for gold of R958 million, attributable to the record high gold prices during 2025. Also included in the loss for H2 2025 was fair value adjustment on the PA recycling metal borrowing of R461 million, fair value losses on the (Rustenburg and Marikana operations BEE cash-settled) share-based payment obligations (and the Marikana dividend obligation) of R289 million, fair value losses on hedge contracts for zinc of R66 million, partially offset by reduced cash flows of the Keliber dividend obligation of R290 million and other investments of R20 million. See note 5 of the condensed consolidated financial statements for a breakdown of the loss on financial instruments.
Impairments
At 31 December 2025, the Group recognised net impairments of R4,341 million due to:
•a further decrease in the long-term forecasted lithium hydroxide price compared to 30 June 2025 and a decision to proceed with a phased start-up profile resulting in a decrease in the recoverable amount as at 31 December 2025, and resulted in an impairment of property, plant and equipment amounting to R2,460 million at Keliber
•a decrease in the life of mine as a result of logistical constraints, seismicity and safety concerns to access higher grade areas, that resulted in a decrease in the recoverable amount at 31 December 2025 and resulted in an impairment of property, plant and equipment amounting to R3,779 million at Kloof
•an higher gold price outlook and sustained operational improvements at the Beatrix and Driefontein operations translated to an increase in the expected future net cash flows and recoverable amounts at Beatrix, Driefontein and Burnstone that resulted in an increase in their carrying values of of property, plant and equipment, and led to a reversal in previously recognised impairment losses amounting to R1,923 million
See note 7 of the condensed consolidated financial statements for additional information on impairments.
Mining and income tax
Mining and income tax of R2,843 million for H2 2025 increased by R2,522 million compared with the R321 million for H2 2024. Current tax increased by R1,202 million to R2,109 million in H2 2025 from R907 million in H2 2024, mainly due to higher current tax at the SA PGM Marikana (R308 million) and Rustenburg operations (R1,009 million). The deferred taxation expense increased from R586 million income in H2 2024 to an expense of R734 million in H2 2025, representing a net movement of R1,320 million. The increase in deferred taxation expense in H2 2025 mainly related to deferred tax on property, plant and equipment at DRDGOLD Limited and Western Platinum Proprietary Limited, due to redeeming capital for tax purposes, as a result of higher profitability. The capital for Western Platinum Proprietary Limited incorporate the project capital expenditure from the K4 project.
Cash and liquidity
The Group’s cash balance (excluding cash of Burnstone1) decreased by 18% from R20,966 million at 30 June 2025 to R17,129 million at 31 December 2025. The Appian settlement of R3,607 million was paid on 9 December 2025 from existing cash resources. Group liquidity was R40,057 million (30 June 2025: R46,932 million), comprising R17,129 million of cash and cash equivalents (30 June 2025: R20,966 million) and R22,928 million of undrawn facilities (30 June 2025: R25,966 million). The outstanding Rand RCF was settled subsequent to 31 December 2025.
1.The Burnstone debt is securitised and therefore has no recourse to Sibanye-Stillwater and as such Sibanye-Stillwater reports Gross debt, Net debt and Cash excluding the amounts that belong to Burnstone
Sibanye-Stillwater Operating and financial results | Six months and year ended 31 December 2025 10
Borrowings and net debt
Gross debt1 decreased by 2% from R40,157 million at 30 June 2025 to R39,252 million at 31 December 2025. Burnstone debt amounted to R4,005 million (30 June 2025: R2,254 million). The decrease in gross debt was mainly due to a net decrease of R2,797 million on US dollar denominated debt due to a 7% stronger rand since 30 June 2025, a decrease in the Rand RCF of R500 million, partially offset by a drawdown on the Keliber financing facility of R1,374 million. Net debt was R22,123 million at 31 December 2025 (30 June 2025: R19,191 million) and increased by R2,932 million due to the Appian settlement of R3,607 million from existing cash resources and a partial repayment on the Rand RCF loan. Refer to note 12 of the condensed consolidated financial statements for a roll forward of the gross debt for the six months ended 31 December 2025.
1.The Burnstone debt is securitised and therefore has no recourse to Sibanye-Stillwater and as such Sibanye-Stillwater reports Gross debt, Net debt and Cash excluding the amounts that relates to Burnstone
The graph below illustrates the Group's gross debt/cash/net debt for H2 2025, H1 2025 and H2 2024:
Cash flow analysis
Notional free cash flow
Sibanye-Stillwater defines notional free cash flow as adjusted EBITDA, less non cash revenue relating to streaming transactions and deferred prepayments, non cash government grants and accrued taxes and royalties, and includes other non-routine cash items such as legal dispute settlements and realised hedges.
The following table shows the calculation of notional free cash flow:
| | | | | | | | | | | | | | | | | | | | |
| | | | | | |
Figures in million - SA rand | | Six months ended | Year ended |
| | Dec 2025 | June 2025 | Dec 2024 | Dec 2025 | Dec 2024 |
| Adjusted EBITDA | | 22,727 | 15,073 | 6,440 | 37,800 | 13,088 |
| Adjusted for non-cash items: | | | | | | |
| Deferred revenue released - Streaming | | (473) | (659) | (286) | (1,132) | (455) |
| Deferred revenue released - Prepays | | (467) | (1,201) | (406) | (1,668) | (406) |
| Section 45X grant not yet received | | (832) | (5,053) | — | (5,885) | — |
| Tax and royalties (accrued) | | (3,035) | (527) | (1,209) | (3,562) | (1,961) |
| Other non-routine cash items: | | | | | | |
| Legal settlement payment to Appian | | (3,565) | — | (115) | (3,565) | (115) |
| Early settlement payment on onerous contract | | (29) | (16) | (665) | (45) | (665) |
| Realised hedges | | (1,274) | (333) | (247) | (1,607) | (314) |
| | 13,052 | 7,284 | 3,512 | 20,336 | 9,172 |
| Property. plant and equipment additions | | (10,769) | (9,538) | (10,422) | (20,307) | (21,569) |
| Notional free cash flow | | 2,283 | (2,254) | (6,910) | 29 | (12,397) |
Notional free cash flow, defined and reconciled above, is not a measure of performance under IFRS Accounting Standards. As a result, it should not be considered in isolation or as alternatives to any other measure of financial performance presented in accordance with IFRS Accounting Standards
For a reconciliation between notional free cash flow and net cash from operating activities, see pages 63 and 64.
The following table shows the notional free cash flow per operating segment:
| | | | | | | | | | | | | | | | | | | | |
| | | | | | |
Figures in million - SA rand | | Six months ended | Year ended |
| | Dec 2025 | June 2025 | Dec 2024 | Dec 2025 | Dec 2024 |
US PGM operations | | 232 | (1,063) | (1,952) | (831) | (3,375) |
US PA & NC recycling operations | | 739 | 273 | 151 | 1,012 | 133 |
| SA PGM operations | | 5,405 | 441 | (1,331) | 5,846 | 136 |
| SA gold operations | | 2,146 | 1,078 | 164 | 3,224 | (1,608) |
| European operations | | (3,242) | (3,330) | (4,354) | (6,572) | (7,449) |
| Australian operation | | 587 | 409 | 628 | 996 | 30 |
| | 5,867 | (2,192) | (6,694) | 3,675 | (12,133) |
| Group corporate | | (3,584) | (62) | (216) | (3,646) | (264) |
| Notional free cash flow | | 2,283 | (2,254) | (6,910) | 29 | (12,397) |
Notional free cash flow, reconciled above, is not a measure of performance under IFRS Accounting Standards. As a result, it should not be considered in isolation or as alternatives to any other measure of financial performance presented in accordance with IFRS Accounting Standards
Sibanye-Stillwater Operating and financial results | Six months and year ended 31 December 2025 11
The US PGM operations notional free cash flow for H2 2025 of R232 million compared to negative notional free cash flow for H2 2024 of R1,952 million. The increase in notional free cash flow for H2 2025 was mainly due an increase in adjusted EBITDA due to lower cost of sales of R1,917 million, lower revenue of R274 million mainly due to 32% lower 2E sales volumes in line with the restructured US PGM production profile and lower cash additions to property, plant and equipment of R208 million.
The US PA & NC recycling operations generated notional free cash flow of R739 million compared to notional free cash flow for H2 2024 of R151 million, mainly due to the addition of the NC recycling site (Metallix), partially offset by higher cash additions to property, plant and equipment of R39 million.
The SA PGM operations generated notional free cash flow of R5,405 million compared to negative notional free cash flow for H2 2024 of R1,331 million, due to 8% higher sales volumes and 46% higher 3E PGM basket price received during H2 2025 which resulted in R11,366 million higher revenue, partially offset by higher cost of sales of R2,224 million and higher taxes and royalties accrued of R2,653 million due to higher profitability.
The SA gold operations generated notional free cash flow of R2,146 million compared to notional free cash flow of R164 million in H2 2024, mainly due to the 40% higher gold price received during H2 2025 which resulted in R4,304 million higher revenue, partially offset by 8% lower volumes and the losses realised on the gold hedge contracts of R566 million and higher cash additions to property, plant and equipment of R938 million.
The European operations incurred negative notional free cash flow of R3,242 million compared to negative notional free cash flow for H2 2024 of R4,354 million, mainly attributable to capital expenditure on the Keliber lithium project of R2,735 million (H2 2024: R3,533 million), a decrease in the Sandouville adjusted EBITDA loss to R280 million in H2 2025 (H2 2024: R443 million) due to being placed on care and maintenance during H2 2025 and the settlement of a key contract of R665 million paid during H2 2024.
The Century operation generated notional free cash flow of R587 million compared to notional free cash flow for H2 2024 of R628 million, mainly due to the impact of lower sales recognised due to shipping constraints and a 6% lower zinc concentrate price.
DIVIDENDS
The Sibanye-Stillwater board of directors has declared and approved a cash dividend of 131 SA cents per ordinary share (US 8.17 cents* per share or US 32.68 cents* per ADR) or approximately R3,697 million (US$231 million*) in respect of the six months ended 31 December 2025 (Final dividend). The Board applied the solvency and liquidity test and reasonably concluded that the Company and Group is and will be solvent and liquid as required by the Companies Act in South Africa, before and immediately after completing the proposed distribution.
The Group’s dividend policy is to return between 25% to 35% of normalised earnings to shareholders and after due consideration of future requirements the dividend may be increased beyond these levels. The Board, consistently considers normalised earnings in determining what value will be distributed to shareholders. The Board believes normalised earnings provides useful information to investors regarding the extent to which results of operations may affect shareholder returns. Normalised earnings is defined as earnings attributable to the owners of Sibanye-Stillwater excluding gains and losses on financial instruments and foreign exchange differences, impairments and related compensation, gain/loss on disposal of property, plant and equipment, occupational healthcare expenses, restructuring costs, transactions costs, share-based payment expenses on B-BBEE transactions, gains on acquisitions, net other business development costs, share of results of equity-accounted investees, all after tax and the impact of non-controlling interest, and changes in the estimated deferred tax rate.
The total dividend declared of 131 SA cents (Final dividend: 131 SA cents and Interim dividend: 0 SA cents) equates to 35% of normalised earnings for the year ended 31 December 2025.
The final dividend will be subject to Dividends Withholding Tax. In accordance with paragraph 7.23 of the JSE Listings Requirements the following additional information is disclosed:
•The dividend has been declared out of income reserves
•The local Dividends Withholding Tax rate is 20% (twenty per centum)
•The gross local dividend amount is 131.0000 SA cents per ordinary share for shareholders exempt from the Dividends Tax
•The net local dividend amount is 104.8000 SA cents (80% of 131 SA cents) per ordinary share for shareholders liable to pay the Dividends Withholding Tax
•Sibanye-Stillwater currently has 2,830,567,264 ordinary shares in issue
•Sibanye-Stillwater’s income tax reference number is 9723 182 169
Shareholders are advised of the following dates in respect of the final dividend:
Final dividend: 131 SA cents per share
Declaration date: Friday, 20 February 2026
Last date to trade cum dividend: Tuesday, 17 March 2026
Shares commence trading ex-dividend: Wednesday, 18 March 2026
Record date: Friday, 20 March 2026
Payment of dividend: Monday, 23 March 2026
Please note that share certificates may not be dematerialised or rematerialised between Wednesday, 18 March 2026 and Friday, 20 March 2026 both dates inclusive.
To holders of American Depositary Receipts (ADRs):
•Each ADR represents 4 ordinary shares;
•ADRs trade ex-dividend on the New York Stock Exchange (NYSE): Thursday, 19 March 2026;
•Record Friday, 20 March 2026;
•Approximate date of currency conversion: Monday, 23 March 2026; and
•Approximate payment date of dividend: Monday, 6 April 2026
Assuming an exchange rate of R16.0348/US$1*, the dividend payable on an ADR is equivalent to 26.14 United States cents for Shareholders liable to pay dividend withholding tax. However, the actual rate of payment will depend on the exchange rate on the date for currency conversion.
* Based on an exchange rate of R16.0348/US$ at 17 February 2025 from Equity RT. However, the actual rate of payment will depend on the exchange rate on the date for currency conversion
MINERAL RESOURCES AND MINERAL RESERVES
Sibanye-Stillwater Operating and financial results | Six months and year ended 31 December 2025 12
On 17 February 2025, Sibanye-Stillwater reported an update of its Mineral Resources and Mineral Reserves as at 31 December 2025, the salient points of which are summarised below.
•4E PGM Mineral Resources of 138.2Moz (-4.5%) and Mineral Reserves of 29.4Moz (+4.7%) at our SA PGM operations
–The inclusion of the Marikana E4 mechanised UG2 project Mineral Reserves added +2.9Moz to Mineral Reserves following the completion of a feasibility study
•2E PGM Mineral Resources of 57.5Moz (+2.8%) and Mineral Reserves of 19.4Moz (+2.1%) at our US PGM operations
•Gold Mineral Resources of 25.2Moz (-31.7%) and Mineral Reserves of 9.4Moz (-6.3%) at our SA gold operations (including DRDGOLD) and development projects (including Burnstone)
–At the Kloof operation, production constraints, including geotechnical considerations which led to the removal of isolated blocks of ground, have impacted the economic viability of the operation, leading to a writedown of the majority of the Mineral Reserves (-1.4Moz)
•Uranium Oxide (U3O8) Mineral Resources of 33.1Mlb (-44.1%) and Mineral Reserves of 25.2Mlb at our SA gold operations
–The maiden uranium Mineral Reserve is based on the completion of the Cooke TSF feasibility study
–The reduction in Mineral Resources is informed by the conversion to Mineral Reserves
•Lithium Mineral Resources of 263kt lithium carbonate equivalent (LCE) (-38.0%) and Mineral Reserves of 248kt (unchanged)
–The change in Mineral Resource is informed by the disposal of our interest in Ioneer Ltd (-201kt) and an updated Mineral Resource estimate at the Keliber lithium project (+40kt) in Finland following successful exploration
•Zinc Mineral Resources of 568kt (unchanged year-on-year) and Mineral Reserves of 308kt (-44.2%)
–Informed by the ongoing depletion of the tailings Mineral Reserve at the Century operation, which now has ~18 months of reserve life left
•Copper Mineral Resources of 5,006kt (-37.3%) and Mineral Reserves of 478kt
–At the Mt Lyell copper project in Tasmania, Australia, the completion of the feasibility study has resulted in a maiden Mineral Reserve under Sibanye-Stillwater. This also informed a reduction in Mineral Resources at Mt Lyell
–At the Altar project in Argentina, a reduction in project ownership (40% to 20%) following a further earn-in by Aldebaran Resources, has resulted in an attributable Mineral Resource reduction (-2,478kt)
Sibanye-Stillwater is preparing, and will file with the United States Securities and Exchange Commission (SEC), updated technical report summaries as required by Subpart 1300 of Regulation S-K with its 2025 annual report on Form 20-F.
CHANGE IN BOARD OF DIRECTORS
Changes to the Board of Sibanye Stillwater Limited during the six-month period ended 31 December 2025 include Dr Lindiwe Mthimunye who has been appointed as an Independent Non-Executive Director of the Company on 26 August 2025. In addition, Mr Neal Froneman has retired as Chief Executive Officer (CEO) and executive director of the Group, effective 30 September 2025 and Dr Richard Stewart has assumed the role of CEO of the Group effective 1 October 2025.
Sibanye-Stillwater Operating and financial results | Six months and year ended 31 December 2025 13
SALIENT FEATURES AND COST BENCHMARKS – SIX MONTHS US and SA PGM operations
| | | | | | | | | | | | | | | | | | | | | | | | | | | | | | | | | | | | | | |
| | | | |
| | | US PGM operations | Total SA PGM operations2 | Rustenburg including Kroondal10 | Marikana2 | Plat Mile | Mimosa |
| | | Under- ground1 | Total | Under-
ground | Surface | Under-
ground | Surface | Under-
ground | Surface | Surface | Attribu-table |
| Production | | | | | | | | | | | | |
| Tonnes milled/treated | kt | Dec 2025 | 395 | | 19,185 | | 9,858 | | 9,327 | | 5,861 | | 2,614 | | 3,262 | | 1,746 | | 4,967 | | 735 | |
| | Jun 2025 | 365 | | 17,311 | | 8,702 | | 8,609 | | 5,139 | | 2,591 | | 2,840 | | 1,569 | | 4,449 | | 723 | |
| | Dec 2024 | 510 | | 18,035 | | 9,244 | | 8,790 | | 5,304 | | 2,630 | | 3,207 | | 1,984 | | 4,176 | | 734 | |
| Plant head grade | g/t | Dec 2025 | 12.36 | | 2.12 | | 3.23 | | 0.94 | | 2.95 | | 1.17 | | 3.69 | | 1.22 | | 0.72 | | 3.38 | |
| | Jun 2025 | 13.32 | | 2.04 | | 3.18 | | 0.89 | | 2.87 | | 1.03 | | 3.70 | | 1.16 | | 0.72 | | 3.39 | |
| | Dec 2024 | 12.65 | | 2.16 | | 3.30 | | 0.96 | | 2.94 | | 1.05 | | 3.87 | | 1.11 | | 0.83 | | 3.39 | |
| Plant recoveries | % | Dec 2025 | 91.02 | | 70.73 | | 84.63 | | 19.20 | | 84.93 | | 25.15 | | 86.90 | | 17.74 | | 15.00 | | 72.60 | |
| | Jun 2025 | 90.68 | | 70.84 | | 84.32 | | 21.96 | | 84.10 | | 31.42 | | 86.51 | | 20.65 | | 14.63 | | 74.98 | |
| | Dec 2024 | 90.42 | | 72.70 | | 85.13 | | 27.86 | | 85.06 | | 38.19 | | 87.17 | | 26.46 | | 20.58 | | 76.25 | |
| Yield | g/t | Dec 2025 | 11.25 | | 1.49 | | 2.73 | | 0.18 | | 2.51 | | 0.29 | | 3.21 | | 0.22 | | 0.11 | | 2.45 | |
| | Jun 2025 | 12.08 | | 1.45 | | 2.68 | | 0.20 | | 2.41 | | 0.32 | | 3.20 | | 0.24 | | 0.11 | | 2.54 | |
| | Dec 2024 | 11.44 | | 1.57 | | 2.81 | | 0.27 | | 2.50 | | 0.40 | | 3.37 | | 0.29 | | 0.17 | | 2.58 | |
PGM production3 | 4Eoz - 2Eoz | Dec 2025 | 142,945 | | 920,526 | | 866,395 | | 54,131 | | 472,090 | | 24,736 | | 336,340 | | 12,154 | | 17,241 | | 57,965 | |
| | Jun 2025 | 141,124 | | 804,252 | | 750,150 | | 54,102 | | 398,791 | | 26,956 | | 292,305 | | 12,084 | | 15,062 | | 59,054 | |
| | Dec 2024 | 187,703 | | 910,486 | | 834,912 | | 75,574 | | 426,120 | | 33,906 | | 347,821 | | 18,735 | | 22,933 | | 60,971 | |
PGM sold4 | 4Eoz - 2Eoz | Dec 2025 | 150,516 | | 930,549 | | | | 426,568 | | 24,105 | | 392,690 | 17,241 | | 69,945 | |
| | Jun 2025 | 133,106 | | 797,039 | | | | 375,792 | | 26,863 | | 340,367 | 15,062 | | 38,955 | |
| | Dec 2024 | 220,456 | | 858,355 | | | | 325,369 | | 41,846 | | 408,858 | 22,933 | | 59,349 | |
Price and costs5 | | | | | | | | | | | |
Average PGM basket price6 | R/4Eoz - R/2Eoz | Dec 2025 | 23,978 | | 34,914 | | | | 35,231 | | 32,339 | | 34,807 | 32,872 | | 31,831 | |
| | Jun 2025 | 18,114 | | 26,283 | | | | 26,548 | | 24,133 | | 26,245 | 24,239 | | 24,227 | |
| | Dec 2024 | 17,942 | | 23,892 | | | | 24,070 | | 22,386 | | 23,965 | 22,238 | | 22,162 | |
| US$/4Eoz - US$/2Eoz | Dec 2025 | 1,380 | | 2,009 | | | | 2,027 | | 1,861 | | 2,003 | 1,891 | | 1,831 | |
| | Jun 2025 | 985 | | 1,429 | | | | 1,444 | | 1,312 | | 1,427 | 1,318 | | 1,317 | |
| | Dec 2024 | 1,001 | | 1,333 | | | | 1,343 | | 1,249 | | 1,337 | 1,241 | | 1,237 | |
Operating cost7,9 | R/t | Dec 2025 | 6,193 | | 1,203 | | | | 2,006 | | 259 | 1,870 | 80 | | 1,801 | |
| | Jun 2025 | 7,453 | | 1,164 | | | | 2,011 | | 257 | | 1,812 | 72 | | 1,733 | |
| | Dec 2024 | 6,647 | | 1,159 | | | | 1,992 | | 254 | | 1,634 | 82 | | 1,675 | |
| US$/t | Dec 2025 | 356 | | 69 | | | | 115 | | 15 | | 108 | 5 | | 104 | |
| | Jun 2025 | 405 | | 63 | | | | 109 | | 14 | | 99 | 4 | | 94 | |
| | Dec 2024 | 371 | | 65 | | | | 111 | | 14 | | 91 | 5 | | 93 | |
| R/4Eoz - R/2Eoz | Dec 2025 | 17,125 | | 25,733 | | | | 24,902 | | 27,329 | | 26,873 | 23,143 | | 22,824 | |
| | Jun 2025 | 19,281 | | 25,915 | | | | 25,916 | | 24,670 | | 26,253 | 21,312 | | 21,201 | |
| | Dec 2024 | 18,069 | | 23,608 | | | | 24,791 | | 19,731 | | 23,137 | 14,869 | | 20,157 | |
| US$/4Eoz - US$/2Eoz | Dec 2025 | 985 | | 1,481 | | | | 1,433 | | 1,572 | | 1,546 | 1,332 | | 1,313 | |
| | Jun 2025 | 1,048 | | 1,409 | | | | 1,409 | | 1,341 | | 1,428 | 1,159 | | 1,153 | |
| | Dec 2024 | 1,008 | | 1,317 | | | | 1,383 | | 1,101 | | 1,291 | 830 | | 1,125 | |
All-in sustaining cost7,8,9 | R/4Eoz - R/2Eoz | Dec 2025 | 20,819 | | 24,457 | | | | 24,071 | 25,280 | 19,024 | | 23,859 | |
| | Jun 2025 | 22,200 | | 23,892 | | | | 24,308 | 23,700 | 15,934 | | 21,946 | |
| | Dec 2024 | 21,185 | | 22,317 | | | | 22,729 | 22,673 | 8,198 | | 20,616 | |
| US$/4Eoz - US$/2Eoz | Dec 2025 | 1,198 | | 1,407 | | | | 1,385 | 1,455 | 1,095 | | 1,373 | |
| | Jun 2025 | 1,207 | | 1,299 | | | | 1,322 | 1,289 | 866 | | 1,193 | |
| | Dec 2024 | 1,182 | | 1,245 | | | | 1,268 | 1,265 | 457 | | 1,150 |
All-in cost7,8,9 | R/4Eoz - R/2Eoz | Dec 2025 | 21,449 | | 24,849 | | | | 24,139 | 26,170 | 19,024 | | 23,859 | |
| | Jun 2025 | 22,895 | | 24,338 | | | | 24,362 | 24,718 | 15,934 | | 21,946 | |
| | Dec 2024 | 22,064 | | 22,754 | | | | 22,777 | 23,598 | 8,285 | | 20,616 | |
| US$/4Eoz - US$/2Eoz | Dec 2025 | 1,234 | | 1,430 | | | | 1,389 | 1,506 | 1,095 | | 1,373 | |
| | Jun 2025 | 1,245 | | 1,323 | | | | 1,325 | 1,344 | 866 | | 1,193 | |
| | Dec 2024 | 1,231 | | 1,270 | | | | 1,271 | 1,317 | 462 | | 1,150 | |
Capital expenditure5 | | | | | | | | | | |
| Ore reserve development | Rm | Dec 2025 | 598 | | 1,248 | | | | 397 | 851 | — | | — | |
| | Jun 2025 | 614 | | 1,095 | | | | 349 | 746 | — | | — | |
| | Dec 2024 | 701 | | 1,297 | | | | 383 | 914 | — | | — | |
| Sustaining capital | Rm | Dec 2025 | 242 | | 1,746 | | | | 930 | 792 | 24 | | 198 | |
| | Jun 2025 | 121 | | 1,120 | | | | 549 | 561 | 10 | | 160 | |
| | Dec 2024 | 220 | | 1,637 | | | | 870 | 736 | 31 | | 256 | |
| Project capital | Rm | Dec 2025 | 41 | | 343 | | | | 34 | 309 | — | | — | |
| | Jun 2025 | 94 | | 332 | | | | 23 | 309 | — | | — | |
| | Dec 2024 | 157 | | 362 | | | | 22 | 330 | 2 | | — | |
| Total capital expenditure | Rm | Dec 2025 | 881 | | 3,337 | | | | 1,361 | 1,952 | 24 | | 198 | |
| | Jun 2025 | 829 | | 2,547 | | | | 921 | 1,616 | 10 | | 160 | |
| | Dec 2024 | 1,078 | | 3,296 | | | | 1,275 | 1,980 | 33 | | 256 | |
| US$m | Dec 2025 | 51 | | 192 | | | | 78 | 112 | 1 | | 11 | |
| | Jun 2025 | 45 | | 138 | | | | 50 | 88 | 1 | | 9 | |
| | Dec 2024 | 60 | | 184 | | | | 71 | 110 | 2 | | 14 | |
Average exchange rate for the six months ended 31 December 2025, 30 June 2025 and 31 December 2024 was R17.38/US$, R18.39/US$ and R17.92/US$, respectively
Figures may not add as they are rounded independently
1The US PGM operations’ underground production is converted to metric tonnes and kilograms, and financial performance is translated into rand
2Total SA PGM operations and Marikana excludes the production and costs associated with the purchase of concentrate (PoC) from third parties. For a reconciliation of the Operating cost, AISC and AIC excluding third party PoC, refer to “Reconciliation of operating cost excluding third party PoC for Total SA PGM operations and Marikana - Six Months” and “Reconciliation of AISC and AIC excluding third party PoC for Total SA PGM operations and Marikana – Six Months”
Sibanye-Stillwater Operating and financial results | Six months and year ended 31 December 2025 14
3The Platinum Group Metals (PGM) production in the SA operations is principally platinum, palladium, rhodium and gold, referred to as 4E (3PGM+Au) and measured at the concentrator, and in the US underground operations is principally platinum and palladium, referred to as 2E (2PGM)
4PGM sold includes the third party PoC ounces sold
5Total SA PGM operations’ unit cost benchmarks and capital expenditure exclude the financial results of Mimosa, which is equity accounted and excluded from revenue and cost of sales
6The average PGM basket price is the PGM revenue per 4E/2E ounce, prior to a purchase of concentrate adjustment
7Operating cost, All-in sustaining costs and All-in costs are not measures of performance under IFRS Accounting Standards and should not be considered in isolation or as substitutes for measures of financial performance prepared in accordance with IFRS Accounting Standards. See "Non-IFRS measures" for more information on the metrics presented by Sibanye-Stillwater
8All-in cost excludes income tax, costs associated with merger and acquisition activities, working capital, impairments, financing costs, one-time severance charges and items needed to normalise earnings. For a reconciliation of cost of sales, before amortisation and depreciation to All-in cost, see “All-in costs - Six months”
9The US PGM operations’ operating cost, AISC and AIC for the six months ended 31 December 2024 were adjusted to include Section 45X Advance Manufacturing Production Credits. During the six months ended 30 June 2025 the US PGM operations recognised R699 million (US$39 million) which relates to mining costs for the six months ended 31 December 2024 (R2,466 million (US$139 million) which relates to mining costs incurred for the years ended 31 December 2024 and 31 December 2023)
10Rustenburg is now presented to include the underground production and costs for Kroondal for all metrics relating to the six months ended 31 December 2024
Sibanye-Stillwater Operating and financial results | Six months and year ended 31 December 2025 15
SALIENT FEATURES AND COST BENCHMARKS – SIX MONTHS (continued) SA gold operations
| | | | | | | | | | | | | | | | | | | | | | | | | | | | | | | | | | | | | | | | | |
| | | SA OPERATIONS |
| | | Total SA gold | Driefontein | Kloof | Beatrix | Cooke | DRDGOLD |
| | | Total | Under-
ground | Surface | Under-
ground | Surface | Under-
ground | Surface | Under-
ground | Surface | Surface | Surface |
| Production | | | | | | | | | | | | | |
| Tonnes milled/treated | kt | Dec 2025 | 16,135 | | 1,693 | | 14,442 | | 538 | | — | | 451 | | 134 | | 704 | | — | | 1,852 | | 12,456 | |
| | Jun 2025 | 16,680 | | 1,515 | | 15,164 | | 522 | | 1 | | 389 | | 334 | | 604 | | 1 | | 2,132 | | 12,698 | |
| | Dec 2024 | 17,725 | | 1,859 | | 15,866 | | 578 | | 4 | | 587 | | 574 | | 694 | | 19 | | 2,353 | | 12,916 | |
| Yield | g/t | Dec 2025 | 0.64 | | 4.39 | | 0.20 | | 7.48 | | — | | 3.30 | | 1.04 | | 2.73 | | — | | 0.22 | | 0.19 | |
| | Jun 2025 | 0.56 | | 4.26 | | 0.19 | | 6.11 | | — | | 4.12 | | 0.42 | | 2.74 | | — | | 0.22 | | 0.18 | |
| | Dec 2024 | 0.63 | | 4.23 | | 0.21 | | 5.99 | | 0.50 | | 4.05 | | 0.33 | | 2.92 | | 0.21 | | 0.25 | | 0.20 | |
| Gold produced | kg | Dec 2025 | 10,331 | | 7,440 | | 2,891 | | 4,024 | | — | | 1,490 | | 139 | | 1,926 | | — | | 415 | | 2,337 | |
| | Jun 2025 | 9,337 | | 6,453 | | 2,884 | | 3,192 | | — | | 1,605 | | 140 | | 1,656 | | — | | 479 | | 2,265 | |
| | Dec 2024 | 11,212 | | 7,874 | | 3,338 | | 3,466 | | 2 | | 2,378 | | 189 | | 2,030 | | 4 | | 579 | | 2,564 | |
| oz | Dec 2025 | 332,149 | | 239,202 | | 92,948 | | 129,375 | | — | | 47,905 | | 4,469 | | 61,922 | | — | | 13,343 | | 75,136 | |
| | Jun 2025 | 300,191 | | 207,469 | | 92,723 | | 102,625 | | — | | 51,602 | | 4,501 | | 53,242 | | — | | 15,400 | | 72,821 | |
| | Dec 2024 | 360,474 | | 253,155 | | 107,319 | | 111,434 | | 64 | | 76,454 | | 6,076 | | 65,266 | | 129 | | 18,615 | | 82,434 | |
| Gold sold | kg | Dec 2025 | 9,933 | | 7,035 | | 2,898 | | 3,848 | | — | | 1,439 | | 84 | | 1,748 | | — | | 426 | | 2,388 | |
| | Jun 2025 | 9,148 | | 6,279 | | 2,869 | | 3,024 | | 4 | | 1,579 | | 155 | | 1,676 | | — | | 459 | | 2,251 | |
| | Dec 2024 | 11,028 | | 7,691 | | 3,337 | | 3,401 | | 3 | | 2,356 | | 197 | | 1,934 | | 4 | | 566 | | 2,567 | |
| oz | Dec 2025 | 319,353 | | 226,180 | | 93,173 | | 123,716 | | — | | 46,265 | | 2,701 | | 56,199 | | — | | 13,696 | | 76,776 | |
| | Jun 2025 | 294,115 | | 201,874 | | 92,240 | | 97,224 | | 129 | | 50,766 | | 4,983 | | 53,885 | | — | | 14,757 | | 72,371 | |
| | Dec 2024 | 354,558 | | 247,271 | | 107,287 | | 109,345 | | 96 | | 75,747 | | 6,334 | | 62,180 | | 129 | | 18,197 | | 82,531 | |
| Price and costs | | | | | | | | | | | | | |
| Gold price received | R/kg | Dec 2025 | 2,070,774 | | | | 1,884,875 | 1,610,637 | 1,914,760 | 2,044,601 | 2,115,997 | |
| | Jun 2025 | 1,802,580 | | | | 1,769,155 | 1,737,601 | 1,748,807 | 1,779,956 | 1,810,751 | |
| | Dec 2024 | 1,474,973 | | | | 1,420,388 | 1,405,797 | 1,436,017 | 1,471,731 | 1,481,106 | |
| US$/oz | Dec 2025 | 3,706 | | | | 3,373 | 2,882 | 3,427 | 3,659 | 3,787 | |
| | Jun 2025 | 3,049 | | | | 2,992 | 2,939 | 2,958 | 3,010 | 3,063 | |
| | Dec 2024 | 2,560 | | | | 2,465 | 2,440 | 2,492 | 2,554 | 2,571 | |
Operating cost1,4 | R/t | Dec 2025 | 778 | | 5,464 | | 229 | | 7,273 | | — | | 6,463 | | 262 | | 3,442 | | — | | 477 | | 191 | |
| | Jun 2025 | 698 | | 5,618 | | 206 | | 6,758 | | — | | 7,284 | | 447 | | 3,556 | | — | | 344 | | 177 | |
| | Dec 2024 | 665 | | 4,546 | | 211 | | 5,992 | | — | | 4,794 | | 413 | | 3,132 | | 361 | | 332 | | 179 | |
| US$/t | Dec 2025 | 45 | | 314 | | 13 | | 418 | | — | | 372 | | 15 | | 198 | | — | | 27 | | 11 | |
| | Jun 2025 | 38 | | 305 | | 11 | | 367 | | — | | 396 | | 24 | | 193 | | — | | 19 | | 10 | |
| | Dec 2024 | 37 | | 254 | | 12 | | 334 | | — | | 268 | | 23 | | 175 | | 20 | | 19 | | 10 | |
| R/kg | Dec 2025 | 1,215,178 | | 1,243,414 | | 1,142,511 | | 972,167 | | — | | 1,956,376 | | 251,799 | | 1,258,567 | | — | | 2,127,711 | | 1,020,539 |
| | Jun 2025 | 1,246,653 | | 1,319,231 | | 1,084,258 | | 1,105,890 | | — | | 1,766,978 | | 1,064,286 | | 1,296,498 | | — | | 1,532,359 | | 990,728 | |
| | Dec 2024 | 1,051,909 | | 1,073,533 | | 1,000,899 | | 999,711 | | — | | 1,183,347 | | 1,253,968 | | 1,070,936 | | 1,750,000 | | 1,350,604 | | 902,886 | |
| US$/oz | Dec 2025 | 2,175 | | 2,225 | | 2,045 | | 1,740 | | — | | 3,501 | | 451 | | 2,252 | | — | | 3,808 | | 1,826 | |
| | Jun 2025 | 2,108 | | 2,231 | | 1,834 | | 1,870 | | — | | 2,989 | | 1,800 | | 2,193 | | — | | 2,592 | | 1,676 | |
| | Dec 2024 | 1,826 | | 1,863 | | 1,737 | | 1,735 | | — | | 2,054 | | 2,176 | | 1,859 | | 3,037 | | 2,344 | | 1,567 | |
All-in sustaining cost1,2 | R/kg | Dec 2025 | 1,446,794 | | | | 1,316,788 | 2,279,711 | 1,461,670 | 2,133,803 | 1,075,377 | |
| | Jun 2025 | 1,436,817 | | | | 1,406,209 | 1,980,969 | 1,372,912 | 1,677,560 | 1,075,966 | |
| | Dec 2024 | 1,253,083 | | | | 1,306,110 | 1,464,552 | 1,235,810 | 1,416,961 | 958,707 | |
| US$/oz | Dec 2025 | 2,589 | | | | 2,357 | 4,080 | 2,616 | 3,819 | 1,925 | |
| | Jun 2025 | 2,430 | | | | 2,378 | 3,350 | 2,322 | 2,837 | 1,820 | |
| | Dec 2024 | 2,175 | | | | 2,267 | 2,542 | 2,145 | 2,459 | 1,664 | |
All-in cost1,2 | R/kg | Dec 2025 | 1,607,772 | | | | 1,316,788 | 2,279,711 | 1,461,670 | 2,133,803 | 1,732,831 | |
| | Jun 2025 | 1,552,908 | | | | 1,406,209 | 1,980,969 | 1,372,912 | 1,677,560 | 1,565,971 | |
| | Dec 2024 | 1,334,784 | | | | 1,306,110 | 1,464,552 | 1,235,810 | 1,416,961 | 1,268,796 | |
| US$/oz | Dec 2025 | 2,877 | | | | 2,357 | 4,080 | 2,616 | 3,819 | 3,101 | |
| | Jun 2025 | 2,626 | | | | 2,378 | 3,350 | 2,322 | 2,837 | 2,649 | |
| | Dec 2024 | 2,317 | | | | 2,267 | 2,542 | 2,145 | 2,459 | 2,202 | |
| Capital expenditure | | | | | | | | | | |
| Ore reserve development | Rm | Dec 2025 | 1,571 | | | | 877 | 548 | 146 | — | | — | |
| | Jun 2025 | 1,361 | | | | 822 | 433 | 106 | — | | — | |
| | Dec 2024 | 1,432 | | | | 844 | 487 | 101 | — | | — | |
| Sustaining capital | Rm | Dec 2025 | 598 | | | | 265 | 143 | 71 | — | | 119 | |
| | Jun 2025 | 481 | | | | 149 | 108 | 40 | — | | 184 | |
| | Dec 2024 | 516 | | | | 202 | 141 | 56 | — | | 117 | |
Project capital3 | Rm | Dec 2025 | 1,583 | | | | — | — | — | — | | 1,570 | |
| | Jun 2025 | 1,103 | | | | — | — | — | — | | 1,103 | |
| | Dec 2024 | 865 | | | | — | — | — | — | | 796 | |
Total capital expenditure3 | Rm | Dec 2025 | 3,752 | | | | 1,142 | 691 | 217 | — | | 1,689 | |
| | Jun 2025 | 2,944 | | | | 971 | 541 | 146 | — | | 1,287 | |
| | Dec 2024 | 2,813 | | | | 1,046 | 628 | 157 | — | | 913 | |
| US$m | Dec 2025 | 216 | | | | 66 | 40 | 12 | — | | 97 | |
| | Jun 2025 | 160 | | | | 53 | 29 | 8 | — | | 70 | |
| | Dec 2024 | 157 | | | | 58 | 35 | 9 | — | | 51 | |
Average exchange rate for the six months ended 31 December 2025, 30 June 2025 and 31 December 2024 was R17.38/US$, R18.39/US$ and R17.92/US$, respectively
Figures may not add as they are rounded independently
1Operating cost, All-in sustaining costs and All-in costs are not measures of performance under IFRS and should not be considered in isolation or as substitutes for measures of financial performance prepared in accordance with IFRS. See "Non-IFRS measures" for more information on the metrics presented by Sibanye-Stillwater
2All-in cost excludes income tax, costs associated with merger and acquisition activities, working capital, impairments, financing costs, one-time severance charges and items needed to normalise earnings. For a reconciliation of cost of sales before amortisation and depreciation to All-in cost, see “All-in costs – Six months”
3Project capital expenditure for the six months ended 31 December 2025 and 31 December 2024 includes corporate capital expenditure of R13 million (US$1 million)and R69 million (US$4 million), respectively, the majority of which relates to Burnstone project
Sibanye-Stillwater Operating and financial results | Six months and year ended 31 December 2025 16
SALIENT FEATURES AND COST BENCHMARKS – SIX MONTHS (continued)Australian operations | | | | | | | | | | | |
Century zinc retreatment operation |
| Production | | | |
| Ore mined and processed | kt | Dec 2025 | 4,123 | |
| | Jun 2025 | 4,087 | |
| | Dec 2024 | 3,311 | |
| Zinc ore grade processed | % | Dec 2025 | 2.86 | |
| | Jun 2025 | 2.99 | |
| | Dec 2024 | 2.99 | |
| Plant recoveries | % | Dec 2025 | 50.65 | |
| | Jun 2025 | 50.62 | |
| | Dec 2024 | 49.27 | |
Concentrate produced1 | kt | Dec 2025 | 130 | |
| | Jun 2025 | 132 | |
| | Dec 2024 | 108 | |
Concentrate zinc grade2 | % | Dec 2025 | 45.98 | |
| | Jun 2025 | 46.86 | |
| | Dec 2024 | 45.20 | |
Zinc in concentrate produced3 | kt | Dec 2025 | 60 | |
| | Jun 2025 | 62 | |
| | Dec 2024 | 49 | |
Payable zinc production4 | kt | Dec 2025 | 49 | |
| | Jun 2025 | 51 | |
| | Dec 2024 | 40 | |
Payable zinc sales5 | kt | Dec 2025 | 45 | |
| | Jun 2025 | 46 | |
| | Dec 2024 | 51 | |
| Price and costs | | | |
Average equivalent zinc concentrate price6 | R/tZn | Dec 2025 | 48,878 | |
| | Jun 2025 | 48,294 | |
| | Dec 2024 | 51,931 | |
| US$/tZn | Dec 2025 | 2,812 | |
| | Jun 2025 | 2,626 | |
| | Dec 2024 | 2,898 | |
All-in sustaining cost7,8 | R/tZn | Dec 2025 | 36,399 | |
| | Jun 2025 | 32,411 | |
| | Dec 2024 | 43,244 | |
| US$/tZn | Dec 2025 | 2,094 | |
| | Jun 2025 | 1,762 | |
| | Dec 2024 | 2,413 | |
All-in cost7,8 | R/tZn | Dec 2025 | 37,291 | |
| | Jun 2025 | 32,665 | |
| | Dec 2024 | 43,418 | |
| US$/tZn | Dec 2025 | 2,146 | |
| | Jun 2025 | 1,776 | |
| | Dec 2024 | 2,423 | |
| Capital expenditure | | | |
| Sustaining capital | Rm | Dec 2025 | 38 | |
| | Jun 2025 | 21 | |
| | Dec 2024 | 151 | |
| Project capital | Rm | Dec 2025 | 43 | |
| | Jun 2025 | 12 | |
| | Dec 2024 | 5 | |
| Total capital expenditure | Rm | Dec 2025 | 81 | |
| | Jun 2025 | 33 | |
| | Dec 2024 | 156 | |
| US$m | Dec 2025 | 5 | |
| | Jun 2025 | 2 | |
| | Dec 2024 | 9 | |
Average exchange rate for the six months ended 31 December 2025, 30 June 2025 and 31 December 2024 was R17.38/US$, R18.39/US$ and R17.92/US$, respectively
Figures may not add as they are rounded independently
1Concentrate produced contains zinc, lead, silver and waste material, which is exported as a relatively dry product
2Concentrate zinc grade is the percentage of zinc contained in the concentrate produced
3Zinc in concentrate produced is the zinc metal contained in the concentrate produced
4Payable zinc production is the payable quantity of zinc metal produced after applying smelter content deductions
5Payable zinc sales is the payable quantity of zinc metal sold after applying smelter content deductions
6Average equivalent zinc concentrate price is the total zinc sales revenue recognised at the price expected to be received excluding the fair value adjustments divided by the payable zinc sales
7All-in sustaining costs and all-in costs are not measures of performance under IFRS and should not be considered in isolation or as substitutes for measures of financial performance prepared in accordance with IFRS. See ""Non-IFRS measures" for more information on the metrics presented by Sibanye-Stillwater
8All-in cost excludes income tax, costs associated with merger and acquisition activities, working capital, impairments, financing costs, one-time severance charges and items needed to normalise earnings. For a reconciliation of cost of sales, before amortisation and depreciation to All-in cost, see “All-in costs - Six months”
Sibanye-Stillwater Operating and financial results | Six months and year ended 31 December 2025 17
CONDENSED CONSOLIDATED FINANCIAL STATEMENTS | | |
The condensed consolidated financial statements for the year and six months ended 31 December 2025 was prepared by Sibanye-Stillwater's Group financial reporting team headed by Henning Opperman (CA (SA)). This process was supervised by the Group's Chief Financial Officer, Charl Keyter and approved by the Sibanye-Stillwater board of directors. |
Condensed consolidated income statement
Figures are in millions unless otherwise stated
| | | | | | | | | | | | | | | | | | | | | | | | | | | | | | | | | | | |
| US dollar | | | SA rand |
| Year ended | Six months ended | | | Six months ended | Year ended |
| Unaudited | Unaudited | Unaudited | Unaudited | Unaudited | | | Unaudited | Unaudited | Unaudited | Unaudited | Audited |
| Dec 2024 | Dec 2025 | Dec 2024 | Jun 2025 | Dec 2025 | | Notes | Dec 2025 | Jun 2025 | Dec 2024 | Dec 2025 | Dec 2024 |
| 6,121 | 7,253 | 3,172 | 2,978 | 4,275 | Revenue | 3 | 74,910 | 54,767 | 56,925 | 129,677 | 112,129 |
| (5,743) | (5,470) | (2,955) | (2,310) | (3,160) | Cost of sales | | (55,314) | (42,492) | (53,013) | (97,806) | (105,208) |
| (5,262) | (4,946) | (2,695) | (2,081) | (2,865) | Cost of sales, before amortisation and depreciation | | (50,165) | (38,274) | (48,337) | (88,439) | (96,398) |
| (481) | (524) | (260) | (229) | (295) | Amortisation and depreciation | | (5,149) | (4,218) | (4,676) | (9,367) | (8,810) |
| | | | | | | | | | | |
| 378 | 1,783 | 217 | 668 | 1,115 | | | 19,596 | 12,275 | 3,912 | 31,871 | 6,921 |
| 73 | 88 | 33 | 37 | 51 | Interest income | | 882 | 686 | 588 | 1,568 | 1,337 |
| (250) | (280) | (128) | (139) | (141) | Finance expense | 4 | (2,447) | (2,553) | (2,279) | (5,000) | (4,571) |
| (14) | (118) | (7) | (33) | (85) | Share-based payment expenses | 14 | (1,499) | (615) | (114) | (2,114) | (251) |
| 297 | (212) | 217 | (21) | (191) | (Loss)/gain on financial instruments | 5 | (3,403) | (391) | 3,937 | (3,794) | 5,433 |
| (12) | 9 | (11) | 9 | — | (Loss)/gain on foreign exchange differences | | (6) | 161 | (202) | 155 | (215) |
| 12 | 19 | 5 | (23) | 42 | Share of results of equity-accounted investees after tax | | 769 | (432) | 76 | 337 | 212 |
| (258) | (269) | (164) | (90) | (179) | Other costs | 6.1 | (3,150) | (1,659) | (2,971) | (4,809) | (4,722) |
| 144 | 77 | 66 | 35 | 42 | Other income | 6.2 | 741 | 639 | 1,175 | 1,380 | 2,630 |
| 3 | (1) | 1 | 1 | (2) | (Loss)/gain on disposal of property, plant and equipment | | (30) | 16 | 20 | (14) | 55 |
| (501) | (783) | (94) | (526) | (257) | Impairments and reversal of impairments | 7 | (4,341) | (9,666) | (1,549) | (14,007) | (9,173) |
| 4 | (3) | 4 | — | (3) | Occupational healthcare obligation (expense)/gain | | (46) | (3) | 77 | (49) | 76 |
| (30) | (14) | (14) | (13) | (1) | Restructuring costs | | (5) | (242) | (250) | (247) | (550) |
| (46) | (254) | (28) | (23) | (231) | Transaction and project costs | 13 | (4,125) | (418) | (505) | (4,543) | (851) |
| (200) | 42 | 97 | (118) | 160 | Profit/(loss) before royalties, carbon tax and tax | | 2,936 | (2,202) | 1,915 | 734 | (3,669) |
| (30) | (64) | (17) | (12) | (52) | Royalties | | (928) | (217) | (302) | (1,145) | (543) |
| — | — | — | — | — | Carbon tax | | 2 | (2) | (1) | — | (2) |
| (230) | (22) | 80 | (130) | 108 | Profit/(loss) before tax | | 2,010 | (2,421) | 1,612 | (411) | (4,214) |
| (81) | (242) | (19) | (81) | (161) | Mining and income tax | 8 | (2,843) | (1,485) | (321) | (4,328) | (1,496) |
| (77) | (135) | (50) | (17) | (118) | - Current tax | | (2,109) | (309) | (907) | (2,418) | (1,418) |
| (4) | (107) | 31 | (64) | (43) | - Deferred tax | | (734) | (1,176) | 586 | (1,910) | (78) |
| | | | | | | | | | | |
| (311) | (264) | 61 | (211) | (53) | (Loss)/profit for the period | | (833) | (3,906) | 1,291 | (4,739) | (5,710) |
| | | | | (Loss)/profit for the period attributable to: | | | | | | |
| (398) | (288) | (8) | (194) | (94) | - Owners of Sibanye-Stillwater | | (1,580) | (3,591) | 38 | (5,171) | (7,297) |
| 87 | 24 | 69 | (17) | 41 | - Non-controlling interests (NCI) | | 747 | (315) | 1,253 | 432 | 1,587 |
| | | | | Earnings per ordinary share (cents) | | | | | | |
| (14) | (10) | — | (7) | (3) | Basic earnings per share | 9.1 | (56) | (127) | 1 | (183) | (258) |
| (14) | (10) | — | (7) | (3) | Diluted earnings per share | 9.2 | (56) | (127) | 1 | (183) | (258) |
| 2,830,567 | 2,830,567 | 2,830,567 | 2,830,567 | 2,830,567 | Weighted average number of shares ('000) | 9.1 | 2,830,567 | 2,830,567 | 2,830,567 | 2,830,567 | 2,830,567 |
| 2,830,567 | 2,830,567 | 2,830,567 | 2,830,567 | 2,830,567 | Diluted weighted average number of shares ('000) | 9.2 | 2,830,567 | 2,830,567 | 2,830,567 | 2,830,567 | 2,830,567 |
| 18.32 | 17.88 | 17.92 | 18.39 | 17.38 | Average R/US$ rate | | | | | | |
Condensed consolidated statement of other comprehensive income (OCI)
Figures are in millions unless otherwise stated
| | | | | | | | | | | | | | | | | | | | | | | | | | | | | | | | |
| US dollar | | SA rand |
| Year ended | Six months ended | | Six months ended | Year ended |
| Unaudited | Unaudited | Unaudited | Unaudited | Unaudited | | Unaudited | Unaudited | Unaudited | Unaudited | Audited |
| Dec 2024 | Dec 2025 | Dec 2024 | Jun 2025 | Dec 2025 | | Dec 2025 | Jun 2025 | Dec 2024 | Dec 2025 | Dec 2024 |
| (311) | (264) | 61 | (211) | (53) | (Loss)/profit for the period | (833) | (3,906) | 1,291 | (4,739) | (5,710) |
| 9 | 373 | (15) | 140 | 233 | Other comprehensive income, net of tax | 839 | 67 | 396 | 906 | 538 |
| — | — | — | — | — | Foreign currency translation adjustments1 | 17 | (6) | 266 | 11 | 255 |
| 15 | 50 | 7 | 4 | 46 | Fair value adjustment on other investments2 | 822 | 73 | 130 | 895 | 283 |
| (6) | 323 | (22) | 136 | 187 | Currency translation adjustments3 | — | — | — | — | — |
| | | | | | | | | | |
| (302) | 109 | 46 | (71) | 180 | Total comprehensive income | 6 | (3,839) | 1,687 | (3,833) | (5,172) |
| | | | | Total comprehensive income attributable to: | | | | | |
| (389) | 78 | (23) | (59) | 137 | - Owners of Sibanye-Stillwater | (769) | (3,619) | 434 | (4,388) | (6,769) |
| 87 | 31 | 69 | (12) | 43 | - Non-controlling interests | 775 | (220) | 1,253 | 555 | 1,597 |
| 18.32 | 17.88 | 17.92 | 18.39 | 17.38 | Average R/US$ rate | | | | | |
1 These gains and losses will be reclassified to profit or loss upon disposal of the underlying operations
2 These gains and losses will never be reclassified to profit or loss
3 These gains and losses relate to the convenience translation of the SA rand amounts to US dollar and will never be reclassified to profit or loss
Sibanye-Stillwater Operating and financial results | Six months and year ended 31 December 2025 18
Condensed consolidated statement of financial position
Figures are in millions unless otherwise stated
| | | | | | | | | | | | | | | | | | | | | | | |
| US dollar | | | SA rand |
| Unaudited | Unaudited | Unaudited | | | Unaudited | Unaudited | Revised - unaudited1 |
| Dec 2024 | Jun 2025 | Dec 2025 | | Notes | Dec 2025 | Jun 2025 | Dec 2024 |
| 4,780 | 4,745 | 5,370 | Non-current assets | | 88,984 | 84,325 | 89,679 |
| 3,566 | 3,512 | 3,882 | Property, plant and equipment | | 64,320 | 62,416 | 66,906 |
| 8 | 16 | 32 | Right-of-use assets | | 532 | 283 | 156 |
| 115 | 112 | 119 | Goodwill and other intangibles | | 1,973 | 1,994 | 2,154 |
| 390 | 357 | 396 | Equity-accounted investments | | 6,560 | 6,341 | 7,323 |
| 187 | 184 | 258 | Other investments | | 4,271 | 3,275 | 3,507 |
| 357 | 388 | 441 | Environmental rehabilitation obligation funds | | 7,307 | 6,887 | 6,691 |
| 26 | 51 | 116 | Other receivables | 19 | 1,928 | 904 | 491 |
| 131 | 125 | 126 | Deferred tax assets | | 2,093 | 2,225 | 2,451 |
| 2,580 | 3,397 | 3,667 | Current assets | | 60,753 | 60,374 | 48,409 |
| 1,362 | 1,595 | 1,900 | Inventories | | 31,480 | 28,335 | 25,549 |
| 305 | 319 | 411 | Trade and other receivables | | 6,811 | 5,668 | 5,722 |
| 8 | 274 | 291 | Other receivables | 19 | 4,816 | 4,876 | 156 |
| 46 | 10 | 26 | Tax receivable | | 438 | 178 | 863 |
| 855 | 1,182 | 1,037 | Cash and cash equivalents | | 17,178 | 21,012 | 16,049 |
| 4 | 17 | 2 | Assets held for sale | 17 | 30 | 305 | 70 |
| | | | | | | |
| 7,360 | 8,142 | 9,037 | Total assets | | 149,737 | 144,699 | 138,088 |
| 2,573 | 2,497 | 2,667 | Total equity | | 44,167 | 44,345 | 48,289 |
| 3,672 | 4,471 | 4,309 | Non-current liabilities | | 71,412 | 79,456 | 68,848 |
| 2,193 | 2,371 | 1,922 | Borrowings | 12 | 31,855 | 42,136 | 41,135 |
| 11 | 15 | 29 | Lease liabilities | | 481 | 262 | 203 |
| 636 | 684 | 852 | Environmental rehabilitation obligation and other provisions | 13 | 14,117 | 12,151 | 11,922 |
| 18 | 17 | 13 | Occupational healthcare obligation | | 211 | 305 | 334 |
| 90 | 112 | 163 | Cash-settled share-based payment obligations | 14 | 2,704 | 1,999 | 1,686 |
| 97 | 97 | 85 | Other payables | 15 | 1,402 | 1,729 | 1,815 |
| 372 | 853 | 854 | Deferred revenue | 16 | 14,158 | 15,166 | 6,983 |
| 1 | 1 | 1 | Tax and royalties payable | | 14 | 12 | 13 |
| 254 | 321 | 390 | Deferred tax liabilities | | 6,470 | 5,696 | 4,757 |
| 1,115 | 1,174 | 2,061 | Current Liabilities | | 34,158 | 20,898 | 20,951 |
| 29 | 15 | 688 | Borrowings | 12 | 11,402 | 275 | 552 |
| 17 | 11 | 10 | Environmental rehabilitation obligation and other provisions | 13 | 161 | 203 | 327 |
| 9 | 10 | 10 | Lease liabilities | | 166 | 185 | 175 |
| — | 2 | 10 | Occupational healthcare obligation | | 173 | 31 | 2 |
| 6 | 26 | 56 | Cash-settled share-based payment obligations | 14 | 935 | 457 | 121 |
| 832 | 875 | 1,011 | Trade and other payables | | 16,756 | 15,557 | 15,604 |
| 92 | 128 | 138 | Other payables | 15 | 2,279 | 2,274 | 1,730 |
| 88 | 63 | 73 | Deferred revenue | 16 | 1,204 | 1,119 | 1,660 |
| 18 | 18 | 36 | Tax and royalties payable | | 602 | 327 | 329 |
| 24 | 26 | 29 | Liabilities associated with assets held for sale | 17 | 480 | 470 | 451 |
| | | | | | | |
| 7,360 | 8,142 | 9,037 | Total equity and liabilities | | 149,737 | 144,699 | 138,088 |
| 18.76 | 17.77 | 16.57 | Closing R/US$ rate | | | | |
1 See note 11.2 for the impact of the finalisation of the Reldan purchase price allocation in terms of IFRS 3
Sibanye-Stillwater Operating and financial results | Six months and year ended 31 December 2025 19
Condensed consolidated statement of cash flows
Figures are in millions unless otherwise stated
| | | | | | | | | | | | | | | | | | | | | | | | | | | | | | | | | | | |
| US dollar | | | SA rand |
| Year ended | Six months ended | | | Six months ended | Year ended |
| Unaudited | Unaudited | Unaudited | Unaudited | Unaudited | | | Unaudited | Unaudited | Unaudited | Unaudited | Audited |
| Dec 2024 | Dec 2025 | Dec 2024 | Jun 2025 | Dec 2025 | | Notes | Dec 2025 | Jun 2025 | Dec 2024 | Dec 2025 | Dec 2024 |
| | | | | Cash flows from operating activities | | | | | | |
| 241 | 766 | 57 | 178 | 588 | Cash generated by operations | | 10,415 | 3,277 | 971 | 13,692 | 4,414 |
| 181 | 601 | 150 | 548 | 53 | Deferred revenue advance received | 16 | 668 | 10,077 | 2,729 | 10,745 | 3,307 |
| (41) | (36) | (8) | (4) | (32) | Cash-settled share-based payments paid | | (567) | (82) | (125) | (649) | (751) |
| (2) | — | — | — | — | Payment of Marikana dividend obligation | | — | — | — | — | (38) |
| (2) | — | — | — | — | Additional deferred/contingent payments relating to acquisition of a business | | — | — | — | — | (44) |
| 374 | 127 | 263 | 28 | 99 | Change in working capital | | 1,751 | 522 | 4,766 | 2,273 | 6,853 |
| 751 | 1,458 | 462 | 750 | 708 | | | 12,267 | 13,794 | 8,341 | 26,061 | 13,741 |
| 48 | 47 | 19 | 26 | 21 | Interest received | | 377 | 472 | 339 | 849 | 882 |
| (115) | (131) | (60) | (64) | (67) | Interest paid | | (1,160) | (1,177) | (1,069) | (2,337) | (2,101) |
| (43) | (74) | (16) | (21) | (53) | Royalties paid | | (933) | (387) | (282) | (1,320) | (784) |
| — | 24 | — | 22 | 2 | Royalties refunded | | 33 | 398 | — | 431 | — |
| (79) | (138) | (46) | (13) | (125) | Tax paid | | (2,233) | (231) | (826) | (2,464) | (1,452) |
| — | 27 | — | 24 | 3 | Tax refunded | | 52 | 437 | — | 489 | — |
| (9) | (17) | (4) | (7) | (10) | Dividends paid | | (173) | (129) | (87) | (302) | (173) |
| 553 | 1,196 | 355 | 717 | 479 | Net cash from operating activities | | 8,230 | 13,177 | 6,416 | 21,407 | 10,113 |
| | | | | | | | | | | |
| | | | | Cash flow from investing activities | | | | | | |
| (1,177) | (1,136) | (582) | (519) | (617) | Additions to property, plant and equipment | | (10,769) | (9,538) | (10,422) | (20,307) | (21,569) |
| 7 | 9 | 5 | 5 | 4 | Proceeds on disposal of property, plant and equipment | | 69 | 94 | 90 | 163 | 129 |
| (147) | (111) | — | (5) | (106) | Acquisition of subsidiaries, net of cash acquired | 11 | (1,894) | (96) | — | (1,990) | (2,690) |
| 22 | 23 | 17 | 15 | 8 | Dividends received | | 144 | 274 | 312 | 418 | 402 |
| (25) | (48) | (17) | (18) | (30) | Additions to other investments | | (527) | (323) | (315) | (850) | (465) |
| 25 | 43 | 18 | 28 | 15 | Disposals of other investments | | 259 | 506 | 327 | 765 | 457 |
| (1) | — | — | — | — | Loans advanced to investee | | — | — | (2) | — | (26) |
| — | 1 | — | 1 | — | Repayment of loan from investee | | — | 21 | — | 21 | — |
| — | 18 | — | — | 18 | Proceeds on sale of assets held for sale | 17 | 318 | — | — | 318 | — |
| (2) | (5) | (2) | (5) | — | Acquisition of equity-accounted investment | | — | (91) | (35) | (91) | (35) |
| (15) | (9) | (12) | — | (9) | Contributions to environmental rehabilitation funds | | (154) | (4) | (208) | (158) | (273) |
| (16) | — | (5) | — | — | Payment of deferred/contingent payment | | — | — | (93) | — | (292) |
| 1 | 1 | 1 | — | 1 | Proceeds from environmental rehabilitation funds | | 18 | 1 | 23 | 19 | 24 |
| (1,328) | (1,214) | (577) | (498) | (716) | Net cash used in investing activities | | (12,536) | (9,156) | (10,323) | (21,692) | (24,338) |
| | | | | | | | | | | |
| | | | | Cash flow from financing activities | | | | | | |
| 452 | 443 | 383 | 168 | 275 | Loans raised | 12 | 4,828 | 3,084 | 6,983 | 7,912 | 8,278 |
| (182) | (273) | (141) | (83) | (190) | Loans repaid | 12 | (3,355) | (1,528) | (2,571) | (4,883) | (3,335) |
| (11) | (13) | (5) | (6) | (7) | Lease payments | | (125) | (103) | (92) | (228) | (208) |
| — | (3) | — | — | (3) | Acquisition of NCI | | (45) | — | — | (45) | — |
| 259 | 154 | 237 | 79 | 75 | Net cash from financing activities | | 1,303 | 1,453 | 4,320 | 2,756 | 4,735 |
| | | | | | | | | | | |
| (516) | 136 | 15 | 298 | (162) | Net (decrease)/increase in cash and cash equivalents | | (3,003) | 5,474 | 413 | 2,471 | (9,490) |
| (5) | 46 | (4) | 29 | 17 | Effect of exchange rate fluctuations on cash held | | (831) | (511) | 76 | (1,342) | (21) |
| 1,376 | 855 | 844 | 855 | 1,182 | Cash and cash equivalents at beginning of the period | | 21,012 | 16,049 | 15,560 | 16,049 | 25,560 |
| 855 | 1,037 | 855 | 1,182 | 1,037 | Cash and cash equivalents at end of the period | | 17,178 | 21,012 | 16,049 | 17,178 | 16,049 |
| 18.32 | 17.88 | 17.92 | 18.39 | 17.38 | Average R/US$ rate | | | | | | |
| 18.76 | 16.57 | 18.76 | 17.77 | 16.57 | Closing R/US$ rate | | | | | | |
Sibanye-Stillwater Operating and financial results | Six months and year ended 31 December 2025 20
Condensed consolidated statement of changes in equity
Figures are in millions unless otherwise stated
| | | | | | | | | | | | | | | | | | | | | | | | | | | | | | | | | | | | | | | | | |
| US dollar | | | SA rand |
| Stated capital | Re- organisation reserve | Other reserves | Accum-
ulated
loss | Non-
controlling interests | Total
equity | | | Total
equity | Non-
controlling interests | Accum-
ulated
loss | Other reserves | Re- organisation reserve | Stated capital |
| 1,361 | 2,599 | (67) | (1,301) | 185 | 2,777 | Balance at 31 December 2023 (Audited) | | 51,607 | 2,877 | (8,470) | 12,552 | 23,001 | 21,647 |
| — | — | 8 | (398) | 88 | (302) | Total comprehensive income for the period | | (5,172) | 1,597 | (7,297) | 528 | — | — |
| — | — | — | (398) | 87 | (311) | (Loss)/profit for the period | | (5,710) | 1,587 | (7,297) | — | — | — |
| — | — | 8 | — | 1 | 9 | Other comprehensive income, net of tax | | 538 | 10 | — | 528 | — | — |
| — | — | — | — | (9) | (9) | Dividends paid | | (173) | (173) | — | — | — | — |
| — | — | — | — | — | — | Equity-settled share-based payments | | 18 | 9 | — | 9 | — | — |
| — | — | — | 107 | — | 107 | Recognition of derivative financial instrument in equity | | 2,009 | — | 2,009 | — | — | — |
| — | — | 3 | (3) | — | — | Transfer between reserves | | — | — | (59) | 59 | — | — |
| 1,361 | 2,599 | (56) | (1,595) | 264 | 2,573 | Balance at 31 December 2024 (Audited) | | 48,289 | 4,310 | (13,817) | 13,148 | 23,001 | 21,647 |
| — | — | 366 | (288) | 31 | 109 | Total comprehensive income for the period | | (3,833) | 555 | (5,171) | 783 | — | — |
| — | — | — | (288) | 24 | (264) | (Loss)/profit for the period | | (4,739) | 432 | (5,171) | — | — | — |
| — | — | 366 | — | 7 | 373 | Other comprehensive income, net of tax | | 906 | 123 | — | 783 | — | — |
| — | — | — | — | (17) | (17) | Dividends paid | | (302) | (302) | — | — | — | — |
| — | — | 2 | — | 2 | 4 | Equity-settled share-based payments | | 58 | 29 | — | 29 | — | — |
| — | — | — | (5) | 3 | (2) | Transactions with DRDGOLD shareholders | | (45) | 49 | (94) | — | — | — |
| 1,361 | 2,599 | 312 | (1,888) | 283 | 2,667 | Balance at 31 December 2025 (Unaudited) | | 44,167 | 4,641 | (19,082) | 13,960 | 23,001 | 21,647 |
Sibanye-Stillwater Operating and financial results | Six months and year ended 31 December 2025 21
Notes to the condensed consolidated financial statements
1. Basis of accounting and preparation
The condensed consolidated financial statements are prepared in accordance with the JSE Listings Requirements for condensed consolidated financial statements and the requirements of the Companies Act of South Africa. The JSE Listings Requirements require condensed financial statements to be prepared in accordance with framework concepts, and the measurement and recognition requirements of IFRS Accounting Standards as issued by the International Accounting Standards Board (IASB), and the South African Institute of Chartered Accountants Financial Reporting Guides as issued by the Accounting Practices Committee and Financial Pronouncements as issued by the Financial Reporting Standards Council and to also, as a minimum, contain information required by IAS 34 Interim Financial Reporting. The accounting policies applied in the preparation of these condensed consolidated financial statements are in terms of IFRS Accounting Standards and are consistent with those applied in the previous consolidated annual financial statements, included in the 31 December 2024 annual financial report.
The condensed consolidated income statement, and statements of other comprehensive income and cash flows for the six months ended
31 December 2024 were not reviewed by the Company’s external auditor and were prepared by subtracting the condensed consolidated financial statements for the six months ended 30 June 2024 from the audited comprehensive consolidated financial statements for the year ended 31 December 2024. The condensed consolidated income statement, and statements of other comprehensive income and cash flows for the six months ended 31 December 2025 have not been reviewed by the Company’s external auditor and were prepared by subtracting the condensed consolidated financial statements for the six months ended 30 June 2025 from the condensed consolidated financial statements for the year ended 31 December 2025.
The translation of the primary statements into US dollar is based on the average exchange rate for the period for the condensed consolidated income statement, statements of other comprehensive income and cash flows, and the period-end closing exchange rate for the statement of financial position. Exchange differences on translation are accounted for in the condensed consolidated statement of other comprehensive income. This information is provided as supplementary information only and has not been reviewed by the Company's external auditor.
1.1 Standards, interpretations and amendments to published standards effective on 1 January 2025 and those issued but not yet effective
The amendments to published standards effective on 1 January 2025 and adopted by the Sibanye Stillwater Limited (Sibanye-Stillwater) group (the Group) did not have a material effect on the Group’s condensed consolidated financial statements for the year ended 31 December 2025. Standards, interpretations and amendments to published standards not yet effective on 1 January 2025 are not expected to have a material effect on the Group, except for the presentation and disclosure impact of IFRS 18 Presentation and Disclosure in Financial Statements which is currently being assessed.
Sibanye-Stillwater Operating and financial results | Six months and year ended 31 December 2025 22
2. Segment reporting
During H2 2025, management updated the internal financial reporting to the chief operating decision maker by reporting adjusted EBITDA (previously net profit/loss) as the main and only measure of financial performance for operating segments. The Group therefore updated the structure of the segment reporting, including representation of all comparative information, to reflect this change in internal reporting.
Figures are in millions
| | | | | | | | | | | | | | | | | | | | | | | | | | | | | | | | | | | | | | | | | | | | | | | | | | | | | | | | |
| For the year ended 31 Dec 2025 (Unaudited) | For the year ended 31 Dec 2024 (Audited) |
| GROUP | SOUTHERN AFRICA OPERATIONS | INTERNATIONAL AND RECYCLING OPERATIONS | GROUP | GROUP | SOUTHERN AFRICA OPERATIONS | INTERNATIONAL AND RECYCLING OPERATIONS | GROUP |
| SA rand | Total | Total SA
operations | Total
SA PGM | Total
SA gold | Total international operations | Total US operations | Total EU operations | Total AUS operations | Corporate1 | Total | Total SA
operations | Total
SA PGM | Total
SA gold | Total international operations | Total US operations | Total EU operations | Total AUS operations | Corporate1 |
| Revenue | 129,677 | 97,942 | 60,883 | 37,059 | 32,304 | 27,114 | 518 | 4,672 | (569) | 112,129 | 82,402 | 51,257 | 31,145 | 29,854 | 23,087 | 2,784 | 3,983 | (127) |
| Underground | 90,364 | 84,166 | 58,381 | 25,785 | 6,718 | 6,718 | — | — | (520) | 78,867 | 69,787 | 48,314 | 21,473 | 9,207 | 9,207 | — | — | (127) |
| Surface | 18,448 | 13,776 | 2,502 | 11,274 | 4,672 | — | — | 4,672 | — | 16,598 | 12,615 | 2,943 | 9,672 | 3,983 | — | — | 3,983 | — |
| Recycling/processing | 20,865 | — | — | — | 20,914 | 20,396 | 518 | — | (49) | 16,664 | — | — | — | 16,664 | 13,880 | 2,784 | — | — |
Cost of sales, before amortisation and depreciation | (88,439) | (66,202) | (43,214) | (22,988) | (22,268) | (18,440) | (767) | (3,061) | 31 | (96,398) | (66,560) | (42,963) | (23,597) | (29,838) | (23,128) | (3,384) | (3,326) | — |
| Underground | (59,899) | (57,750) | (41,137) | (16,613) | (2,149) | (2,149) | — | — | — | (67,784) | (57,936) | (40,994) | (16,942) | (9,848) | (9,848) | — | — | — |
| Surface | (11,513) | (8,452) | (2,077) | (6,375) | (3,061) | — | — | (3,061) | — | (11,950) | (8,624) | (1,969) | (6,655) | (3,326) | — | — | (3,326) | — |
| Recycling/processing | (17,027) | — | — | — | (17,058) | (16,291) | (767) | — | 31 | (16,664) | — | — | — | (16,664) | (13,280) | (3,384) | — | — |
| | | | | | | | | | | | | | | | | | |
Adjusted EBITDA2 | 37,800 | 29,187 | 16,682 | 12,505 | 9,198 | 8,522 | (776) | 1,452 | (585) | 13,088 | 13,231 | 7,399 | 5,832 | 126 | 483 | (878) | 521 | (269) |
| | note 2.1 | note 2.2 | | | note 2.1 | note 2.2 | |
1Group corporate includes items to reconcile segment data to condensed consolidated financial statement totals, such as intercompany eliminations, the Wheaton Stream and Franco-Nevada transactions and mainly includes corporate transaction and finance costs
2See note 20 for a reconciliation of the Group's profit before royalties, carbon tax and tax to adjusted EBITDA
Figures are in millions
| | | | | | | | | | | | | | | | | | | | | | | | | | | | | | | | | | | | | | | | | | | | | | | | | | | | | | | | | | | | | | | | | | | | | | | | | | | | | | | | | | | |
| For the six months ended 31 Dec 2025 (Unaudited) | For the six months ended 30 Jun 2025 (Unaudited) | For the six months ended 31 Dec 2024 (Unaudited) |
| GROUP | SOUTHERN AFRICA OPERATIONS | INTERNATIONAL AND RECYCLING OPERATIONS | GROUP | GROUP | SOUTHERN AFRICA OPERATIONS | INTERNATIONAL AND RECYCLING OPERATIONS | GROUP | GROUP | SOUTHERN AFRICA OPERATIONS | INTERNATIONAL AND RECYCLING OPERATIONS | GROUP |
| SA rand | Total | Total SA
operations | Total
SA PGM | Total
SA gold | Total international operations | Total US operations | Total EU operations | Total AUS operations | Corporate1 | Total | Total SA
operations | Total
SA PGM | Total
SA gold | Total international operations | Total US operations | Total EU operations | Total AUS operations | Corporate1 | Total | Total SA
operations | Total
SA PGM | Total
SA gold | Total international operations | Total US operations | Total EU operations | Total AUS operations | Corporate1 |
| Revenue | 74,910 | 56,543 | 35,974 | 20,569 | 18,843 | 16,287 | 28 | 2,528 | (476) | 54,767 | 41,399 | 24,909 | 16,490 | 13,461 | 10,827 | 490 | 2,144 | (93) | 56,925 | 40,873 | 24,608 | 16,265 | 16,039 | 12,261 | 1,099 | 2,679 | 13 |
| Underground | 52,581 | 49,037 | 34,567 | 14,470 | 3,971 | 3,971 | — | — | (427) | 37,783 | 35,129 | 23,814 | 11,315 | 2,747 | 2,747 | — | — | (93) | 38,887 | 34,517 | 23,184 | 11,333 | 4,357 | 4,357 | — | — | 13 |
| Surface | 10,034 | 7,506 | 1,407 | 6,099 | 2,528 | — | — | 2,528 | — | 8,414 | 6,270 | 1,095 | 5,175 | 2,144 | — | — | 2,144 | — | 9,035 | 6,356 | 1,424 | 4,932 | 2,679 | — | — | 2,679 | — |
| Recycling/processing | 12,295 | — | — | — | 12,344 | 12,316 | 28 | — | (49) | 8,570 | — | — | — | 8,570 | 8,080 | 490 | — | — | 9,003 | — | — | — | 9,003 | 7,904 | 1,099 | — | — |
Cost of sales, before amortisation and depreciation | (50,165) | (35,419) | (23,564) | (11,855) | (14,777) | (13,153) | (20) | (1,604) | 31 | (38,274) | (30,783) | (19,650) | (11,133) | (7,491) | (5,287) | (747) | (1,457) | — | (48,337) | (32,954) | (21,340) | (11,614) | (15,383) | (12,187) | (1,470) | (1,726) | — |
| Underground | (33,227) | (31,008) | (22,455) | (8,553) | (2,219) | (2,219) | — | — | — | (26,672) | (26,742) | (18,682) | (8,060) | 70 | 70 | — | — | — | (33,349) | (28,622) | (20,328) | (8,294) | (4,727) | (4,727) | — | — | — |
| Surface | (6,015) | (4,411) | (1,109) | (3,302) | (1,604) | — | — | (1,604) | — | (5,498) | (4,041) | (968) | (3,073) | (1,457) | — | — | (1,457) | — | (6,058) | (4,332) | (1,012) | (3,320) | (1,726) | — | — | (1,726) | — |
| Recycling/processing | (10,923) | — | — | — | (10,954) | (10,934) | (20) | — | 31 | (6,104) | — | — | — | (6,104) | (5,357) | (747) | — | — | (8,930) | — | — | — | (8,930) | (7,460) | (1,470) | — | — |
| | | | | | | | | | | | | | | | | | | | | | | | | | | |
| Adjusted EBITDA | 22,727 | 19,600 | 11,904 | 7,696 | 3,563 | 3,040 | (346) | 869 | (436) | 15,073 | 9,587 | 4,778 | 4,809 | 5,635 | 5,482 | (430) | 583 | (149) | 6,440 | 6,264 | 2,633 | 3,631 | 260 | (158) | (513) | 931 | (84) |
| | note 2.1 | note 2.2 | | | note 2.1 | note 2.2 | | | note 2.1 | note 2.2 | |
1Group corporate includes items to reconcile segment data to condensed consolidated financial statement totals, such as intercompany eliminations, the Wheaton Stream and Franco-Nevada transactions and mainly includes corporate transaction and finance costs
2.1 SA operations
Figures are in millions
| | | | | | | | | | | | | | | | | | | | | | | | | | | | | | | | | | | | | | | | | |
| For the year ended 31 Dec 2025 (Unaudited) |
| SA OPERATIONS |
| PRIMARY MINING | SECONDARY MINING | |
| SA rand | Total SA
Operations | Total
SA PGM | Rusten-
burg | Marikana | Platinum
Mile | Mimosa | Corporate and re- conciling items1 | Total
SA gold | Drie-
fontein | Kloof | Beatrix | DRD-
GOLD | Corporate and re- conciling items1 |
| Revenue | 97,942 | 60,883 | 31,292 | 28,342 | 1,249 | 3,613 | (3,613) | 37,059 | 12,610 | 5,466 | 6,278 | 9,129 | 3,576 |
| Underground | 84,166 | 58,381 | 29,705 | 28,342 | 334 | 3,613 | (3,613) | 25,785 | 12,603 | 5,015 | 6,278 | — | 1,889 |
| Surface | 13,776 | 2,502 | 1,587 | — | 915 | — | — | 11,274 | 7 | 451 | — | 9,129 | 1,687 |
| Recycling/processing | — | — | — | — | — | — | — | — | — | — | — | — | — |
Cost of sales, before amortisation and depreciation | (66,202) | (43,214) | (21,921) | (20,369) | (924) | (2,531) | 2,531 | (22,988) | (6,961) | (5,594) | (4,229) | (4,649) | (1,555) |
| Underground | (57,750) | (41,137) | (20,564) | (20,369) | (204) | (2,531) | 2,531 | (16,613) | (6,961) | (5,423) | (4,229) | — | — |
| Surface | (8,452) | (2,077) | (1,357) | — | (720) | — | — | (6,375) | — | (171) | — | (4,649) | (1,555) |
| Recycling/processing | — | — | — | — | — | — | — | — | — | — | — | — | — |
| | | | | | | | | | | | | |
| Adjusted EBITDA | 29,187 | 16,682 | 9,265 | 7,452 | 179 | 1,085 | (1,299) | 12,505 | 5,607 | (190) | 2,012 | 4,438 | 638 |
| | | | | | | | | | | | | |
Capital expenditure | | | | | | | | | | | | | |
| Sustaining capital expenditure | (3,946) | (2,867) | (1,479) | (1,353) | (35) | (358) | 358 | (1,079) | (414) | (251) | (111) | (303) | — |
| Ore reserve development | (5,275) | (2,344) | (747) | (1,597) | — | — | — | (2,931) | (1,699) | (981) | (251) | — | — |
| Growth projects | (3,362) | (675) | (57) | (618) | — | — | — | (2,687) | — | — | — | (2,673) | (14) |
| Total capital expenditure | (12,583) | (5,886) | (2,283) | (3,568) | (35) | (358) | 358 | (6,697) | (2,113) | (1,232) | (362) | (2,976) | (14) |
| | | | | | | | | | | | | |
The following items are disclosed per segment in accordance with IFRS Accounting Standards |
| Amortisation and depreciation | (7,855) | (4,203) | (2,007) | (2,100) | (47) | (412) | 363 | (3,652) | (1,994) | (717) | (363) | (392) | (186) |
| Finance expense | (1,866) | (772) | (2,284) | (424) | — | (58) | 1,994 | (1,094) | (140) | (186) | (122) | (69) | (577) |
| (Impairments)/reversal of impairments | (1,919) | (63) | — | — | — | (599) | 536 | (1,856) | 166 | (3,779) | 449 | — | 1,308 |
1Corporate and reconciling items represent the items to reconcile segment data to condensed consolidated financial statement totals, such as intercompany eliminations and share of results of equity-accounted investees after tax. This does not represent a separate segment as it does not generate revenue
Sibanye-Stillwater Operating and financial results | Six months and year ended 31 December 2025 23
Figures are in millions
| | | | | | | | | | | | | | | | | | | | | | | | | | | | | | | | | | | | | | | | | | | | |
| For the year ended 31 Dec 2024 (Audited) |
| SA OPERATIONS |
| PRIMARY MINING | SECONDARY MINING | |
| SA rand | Total SA
Operations | Total
SA PGM | Rusten-
burg | Marikana | Kroondal | Platinum
Mile | Mimosa | Corporate and re- conciling items1 | Total
SA gold | Drie-
fontein | Kloof | Beatrix | DRD-
GOLD | Corporate and re- conciling items1 |
| Revenue | 82,402 | 51,257 | 19,515 | 25,311 | 5,182 | 1,249 | 3,104 | (3,104) | 31,145 | 9,848 | 6,769 | 5,329 | 7,068 | 2,131 |
| Underground | 69,787 | 48,314 | 17,469 | 25,311 | 5,182 | 352 | 3,104 | (3,104) | 21,473 | 9,759 | 5,970 | 5,310 | — | 434 |
| Surface | 12,615 | 2,943 | 2,046 | — | — | 897 | — | — | 9,672 | 89 | 799 | 19 | 7,068 | 1,697 |
| Recycling | — | — | — | — | — | — | — | — | — | — | — | — | — | — |
Cost of sales, before amortisation and depreciation2 | (66,560) | (42,963) | (16,601) | (20,912) | (4,624) | (826) | (2,483) | 2,483 | (23,597) | (6,948) | (6,326) | (4,260) | (4,484) | (1,579) |
| Underground | (57,936) | (40,994) | (15,292) | (20,912) | (4,624) | (166) | (2,483) | 2,483 | (16,942) | (6,933) | (5,774) | (4,235) | — | — |
| Surface | (8,624) | (1,969) | (1,309) | — | — | (660) | — | — | (6,655) | (15) | (552) | (25) | (4,484) | (1,579) |
| Recycling | — | — | — | — | — | — | — | — | — | — | — | — | — | — |
| | | | | | | | | | | | | | |
Adjusted EBITDA | 13,231 | 7,399 | 2,951 | 3,752 | 441 | 187 | 619 | (551) | 5,832 | 2,840 | 68 | 1,027 | 2,542 | (645) |
| | | | | | | | | | | | | | |
Capital expenditure | | | | | | | | | | | | | | |
| Sustaining capital expenditure | (3,497) | (2,566) | (903) | (1,118) | (503) | (42) | (548) | 548 | (931) | (380) | (247) | (64) | (240) | — |
| Ore reserve development | (5,309) | (2,472) | (699) | (1,773) | — | — | — | — | (2,837) | (1,663) | (932) | (242) | — | — |
| Growth projects | (4,292) | (807) | (101) | (680) | — | (18) | — | (8) | (3,485) | — | — | — | (3,131) | (354) |
| Total capital expenditure | (13,098) | (5,845) | (1,703) | (3,571) | (503) | (60) | (548) | 540 | (7,253) | (2,043) | (1,179) | (306) | (3,371) | (354) |
| | | | | | | | | | | | | | |
The following items are disclosed per segment in accordance with IFRS Accounting Standards |
| Amortisation and depreciation | (6,547) | (3,647) | (1,162) | (1,884) | (487) | (43) | (334) | 263 | (2,900) | (1,380) | (788) | (395) | (312) | (25) |
| Finance expense | (1,948) | (611) | (3,240) | (392) | (131) | — | (45) | 3,197 | (1,337) | (260) | (294) | (193) | (78) | (512) |
| Impairments | (17) | (124) | — | (112) | 9 | — | (26) | 5 | 107 | — | — | — | — | 107 |
1Corporate and reconciling items represent the items to reconcile segment data to condensed consolidated financial statement totals, such as intercompany eliminations and share of results of equity-accounted investees after tax. This does not represent a separate segment as it does not generate revenue
2Included in cost of sales, before amortisation and depreciation is total write-down of inventory to net realisable value amounting to R1,010 million. This write-down mainly relates to PGM in process and PGM finished goods of R728 million and R266 million, respectively, of which R588 million, R264 million and R61 million, relates to relates to Rustenburg, Kroondal and Marikana, respectively
Figures in million
| | | | | | | | | | | | | | | | | | | | | | | | | | | | | | | | | | | | | | | | | |
| For the six months ended 31 Dec 2025 (Unaudited) |
| SA OPERATIONS |
| PRIMARY MINING | SECONDARY MINING | |
| SA rand | Total SA
Operations | Total
SA PGM | Rusten-
burg | Marikana | Platinum
Mile | Mimosa | Corporate and re- conciling items1 | Total SA gold | Drie-
fontein | Kloof | Beatrix | DRD-
GOLD | Corporate and re- conciling items1 |
| Revenue | 56,543 | 35,974 | 18,759 | 16,497 | 718 | 2,604 | (2,604) | 20,569 | 7,253 | 2,453 | 3,347 | 5,053 | 2,463 |
| Underground | 49,037 | 34,567 | 17,920 | 16,497 | 150 | 2,604 | (2,604) | 14,470 | 7,253 | 2,277 | 3,347 | — | 1,593 |
| Surface | 7,506 | 1,407 | 839 | — | 568 | — | — | 6,099 | — | 176 | — | 5,053 | 870 |
| Recycling/processing | — | — | — | — | — | — | — | — | — | — | — | — | — |
Cost of sales, before amortisation and depreciation | (35,419) | (23,564) | (11,690) | (11,388) | (487) | (1,618) | 1,619 | (11,855) | (3,676) | (2,734) | (2,164) | (2,432) | (849) |
| Underground | (31,008) | (22,455) | (10,980) | (11,388) | (88) | (1,618) | 1,619 | (8,553) | (3,676) | (2,713) | (2,164) | — | — |
| Surface | (4,411) | (1,109) | (710) | — | (399) | — | — | (3,302) | — | (21) | — | (2,432) | (849) |
| Recycling/processing | — | — | — | — | — | — | — | — | — | — | — | — | — |
| | | | | | | | | | | | | |
| Adjusted EBITDA | 19,600 | 11,904 | 7,052 | 4,900 | 126 | 988 | (1,162) | 7,696 | 3,562 | (309) | 1,162 | 2,597 | 684 |
| | | | | | | | | | | | | |
Capital expenditure | | | | | | | | | | | | | |
| Sustaining capital expenditure | (2,345) | (1,747) | (930) | (792) | (25) | (198) | 198 | (598) | (265) | (143) | (71) | (119) | — |
| Ore reserve development | (2,819) | (1,249) | (398) | (851) | — | — | — | (1,570) | (877) | (548) | (145) | — | — |
| Growth projects | (1,927) | (343) | (34) | (309) | — | — | — | (1,584) | — | — | — | (1,570) | (14) |
| Total capital expenditure | (7,091) | (3,339) | (1,362) | (1,952) | (25) | (198) | 198 | (3,752) | (1,142) | (691) | (216) | (1,689) | (14) |
| | | | | | | | | | | | | |
The following items are disclosed per segment in accordance with IFRS Accounting Standards |
| Amortisation and depreciation | (4,318) | (2,270) | (1,087) | (1,131) | (24) | (180) | 152 | (2,048) | (1,127) | (343) | (201) | (206) | (171) |
| Finance expense | (855) | (364) | (1,103) | (226) | — | (41) | 1,006 | (491) | (66) | (86) | (60) | (34) | (245) |
| (Impairments)/reversal of impairments | (1,855) | 1 | — | — | — | — | 1 | (1,856) | 166 | (3,779) | 449 | — | 1,308 |
1Corporate and reconciling items represent the items to reconcile segment data to condensed consolidated financial statement totals, such as intercompany eliminations and share of results of equity-accounted investees after tax. This does not represent a separate segment
as it does not generate revenue
Sibanye-Stillwater Operating and financial results | Six months and year ended 31 December 2025 24
Figures in millions | | | | | | | | | | | | | | | | | | | | | | | | | | | | | | | | | | | | | | | | | |
| For the six months ended 30 Jun 2025 (Unaudited) |
| SA OPERATIONS |
| PRIMARY MINING | SECONDARY MINING | |
| SA rand | Total SA
Operations | Total
SA PGM | Rusten-
burg | Marikana | Platinum
Mile | Mimosa | Corporate and re- conciling items1 | Total
SA gold | Drie-
fontein | Kloof | Beatrix | DRD-
GOLD | Corporate and re- conciling items1 |
| Revenue | 41,399 | 24,909 | 12,533 | 11,845 | 531 | 1,009 | (1,009) | 16,490 | 5,357 | 3,013 | 2,931 | 4,076 | 1,113 |
| Underground | 35,129 | 23,814 | 11,785 | 11,845 | 184 | 1,009 | (1,009) | 11,315 | 5,350 | 2,738 | 2,931 | — | 296 |
| Surface | 6,270 | 1,095 | 748 | — | 347 | — | — | 5,175 | 7 | 275 | — | 4,076 | 817 |
| Recycling | — | — | — | — | — | — | — | — | — | — | — | — | — |
Cost of sales, before amortisation and depreciation | (30,783) | (19,650) | (10,231) | (8,981) | (437) | (913) | 912 | (11,133) | (3,285) | (2,860) | (2,065) | (2,217) | (706) |
| Underground | (26,742) | (18,682) | (9,584) | (8,981) | (116) | (913) | 912 | (8,060) | (3,285) | (2,710) | (2,065) | — | — |
| Surface | (4,041) | (968) | (647) | — | (321) | — | — | (3,073) | — | (150) | — | (2,217) | (706) |
| Recycling | — | — | — | — | — | — | — | — | — | — | — | — | — |
| | | | | | | | | | | | | |
| Adjusted EBITDA | 9,587 | 4,778 | 2,213 | 2,552 | 53 | 97 | (137) | 4,809 | 2,045 | 119 | 850 | 1,841 | (46) |
| | | | | | | | | | | | | |
Capital expenditure | | | | | | | | | | | | | |
| Sustaining capital expenditure | (1,601) | (1,120) | (549) | (561) | (10) | (160) | 160 | (481) | (149) | (108) | (40) | (184) | — |
| Ore reserve development | (2,456) | (1,095) | (349) | (746) | — | — | — | (1,361) | (822) | (433) | (106) | — | — |
| Growth projects | (1,435) | (332) | (23) | (309) | — | — | — | (1,103) | — | — | — | (1,103) | — |
| Total capital expenditure | (5,492) | (2,547) | (921) | (1,616) | (10) | (160) | 160 | (2,945) | (971) | (541) | (146) | (1,287) | — |
| | | | | | | | | | | | | |
The following items are disclosed per segment in accordance with IFRS Accounting Standards |
| Amortisation and depreciation | (3,537) | (1,933) | (920) | (969) | (23) | (232) | 211 | (1,604) | (867) | (374) | (162) | (186) | (15) |
| Finance expense | (1,011) | (408) | (1,181) | (198) | — | (17) | 988 | (603) | (74) | (100) | (62) | (35) | (332) |
| (Impairments)/reversal of impairments | (64) | (64) | — | — | — | (599) | 535 | — | — | — | — | — | — |
1Corporate and reconciling items represent the items to reconcile segment data to condensed consolidated financial statement totals, such as intercompany eliminations and share of results of equity-accounted investees after tax. This does not represent a separate segment as it does not generate revenue
Figures are in millions
| | | | | | | | | | | | | | | | | | | | | | | | | | | | | | | | | | | | | | | | | | | | |
| For the six months ended 31 Dec 2024 (Unaudited) |
| SA OPERATIONS |
| PRIMARY MINING | SECONDARY MINING | |
| SA rand | Total SA
Operations | Total
SA PGM | Rusten-
burg | Marikana | Kroondal | Platinum
Mile | Mimosa | Corporate and re- conciling items1 | Total
SA gold | Drie-
fontein | Kloof | Beatrix | DRD-
GOLD | Corporate and re- conciling items1 |
| Revenue | 40,873 | 24,608 | 9,540 | 12,628 | 1,755 | 685 | 1,557 | (1,557) | 16,265 | 4,835 | 3,589 | 2,783 | 3,802 | 1,256 |
| Underground | 34,517 | 23,184 | 8,556 | 12,628 | 1,755 | 245 | 1,557 | (1,557) | 11,333 | 4,830 | 3,303 | 2,777 | — | 423 |
| Surface | 6,356 | 1,424 | 984 | — | — | 440 | — | — | 4,932 | 5 | 286 | 6 | 3,802 | 833 |
| Recycling | — | — | — | — | — | — | — | — | — | — | — | — | — | — |
Cost of sales, before amortisation and depreciation2 | (32,954) | (21,340) | (8,419) | (11,005) | (1,479) | (437) | (1,223) | 1,223 | (11,614) | (3,358) | (3,057) | (2,128) | (2,324) | (747) |
| Underground | (28,622) | (20,328) | (7,748) | (11,005) | (1,479) | (96) | (1,223) | 1,223 | (8,294) | (3,358) | (2,815) | (2,121) | — | — |
| Surface | (4,332) | (1,012) | (671) | — | — | (341) | — | — | (3,320) | — | (242) | (7) | (2,324) | (747) |
| Recycling | — | — | — | — | — | — | — | — | — | — | — | — | — | — |
| | | | | | | | | | | | | | |
| Adjusted EBITDA | 6,264 | 2,633 | 1,128 | 1,154 | 219 | 108 | 330 | (306) | 3,631 | 1,440 | 412 | 634 | 1,458 | (313) |
| | | | | | | | | | | | | | |
Capital expenditure | | | | | | | | | | | | | | |
| Sustaining capital expenditure | (2,153) | (1,637) | (556) | (736) | (314) | (31) | (256) | 256 | (516) | (202) | (141) | (56) | (117) | — |
| Ore reserve development | (2,729) | (1,297) | (383) | (914) | — | — | — | — | (1,432) | (844) | (487) | (101) | — | — |
| Growth projects | (1,229) | (363) | (22) | (330) | — | (3) | — | (8) | (866) | — | — | — | (796) | (70) |
| Total capital expenditure | (6,111) | (3,297) | (961) | (1,980) | (314) | (34) | (256) | 248 | (2,814) | (1,046) | (628) | (157) | (913) | (70) |
| | | | | | | | | | | | | | |
The following items are disclosed per segment in accordance with IFRS Accounting Standards |
| Amortisation and depreciation | (3,587) | (1,947) | (610) | (1,020) | (256) | (23) | (184) | 146 | (1,640) | (722) | (473) | (219) | (214) | (12) |
| Finance expense | (1,014) | (331) | (1,517) | (214) | (65) | — | (25) | 1,490 | (683) | (127) | (154) | (93) | (38) | (271) |
| (Impairments)/reversal of impairments | 106 | (1) | — | — | 20 | — | — | (21) | 107 | — | — | — | — | 107 |
1Corporate and reconciling items represent the items to reconcile segment data to condensed consolidated financial statement totals, such as intercompany eliminations and share of results of equity-accounted investees after tax. This does not represent a separate segment as it does not generate revenue
2Included in cost of sales, before amortisation and depreciation is total write-down of inventory to net realisable value amounting to R853 million. This write-down mainly relates to PGM in process and PGM finished goods of R630 million and R167 million, respectively, of which R487 million, R264 million and R42 million. relates to Rustenburg, Kroondal and Marikana, respectively
Sibanye-Stillwater Operating and financial results | Six months and year ended 31 December 2025 25
2.2 International and recycling operations
Figures are in millions
| | | | | | | | | | | | | | | | | | | | | | | | | | | | | | | | | | | | | | | | | | | | | | | | | | | | | | | | | | | | | | | | | | | | | | | | | | | | | | | | |
| For the year ended 31 Dec 2025 (Unaudited) | For the year ended 31 Dec 2024 (Audited) |
| | AMERICAS | EUROPE | AUSTRALIA | | AMERICAS | EUROPE | AUSTRALIA |
| | | | PRIMARY MINING | RECYCLING | | | | | SECONDARY MINING | | | | | PRIMARY MINING | RECYCLING | | | | | SECONDARY MINING | |
| SA rand | Total international operations | Total US operations | Total US PGM | US PGM | Total US recycling | Columbus | Pennsylvania site and North Carolina site2 | Total EU operations | Sandouville nickel refinery | Corporate and re- conciling items1 | Total AUS operations | Century operation | Corporate and re- conciling items1 | Total international operations | Total US operations | Total US PGM | US PGM | Total US recycling | Columbus | Pennsylvania site and North Carolina site | Total EU operations | Sandouville nickel refinery | Corporate and re- conciling items1 | Total AUS operations | Century operation | Corporate and re- conciling items1 |
| Revenue | 32,304 | 27,114 | 13,985 | 6,718 | 20,396 | 7,267 | 13,129 | 518 | 518 | — | 4,672 | 4,672 | — | 29,854 | 23,087 | 16,781 | 9,207 | 13,880 | 7,574 | 6,306 | 2,784 | 2,784 | — | 3,983 | 3,983 | — |
| Underground | 6,718 | 6,718 | 6,718 | 6,718 | — | — | — | — | — | — | — | — | — | 9,207 | 9,207 | 9,207 | 9,207 | — | — | — | — | — | — | — | — | — |
| Surface | 4,672 | — | — | — | — | — | — | — | — | — | 4,672 | 4,672 | — | 3,983 | — | — | — | — | — | — | — | — | — | 3,983 | 3,983 | — |
| Recycling/processing | 20,914 | 20,396 | 7,267 | — | 20,396 | 7,267 | 13,129 | 518 | 518 | — | — | — | — | 16,664 | 13,880 | 7,574 | — | 13,880 | 7,574 | 6,306 | 2,784 | 2,784 | — | — | — | — |
Cost of sales, before amortisation and depreciation3 | (22,268) | (18,440) | (6,507) | (2,149) | (16,291) | (4,358) | (11,933) | (767) | (767) | — | (3,061) | (3,061) | — | (29,838) | (23,128) | (17,096) | (9,848) | (13,281) | (7,248) | (6,032) | (3,384) | (3,384) | — | (3,326) | (3,326) | — |
| Underground | (2,149) | (2,149) | (2,149) | (2,149) | — | — | — | — | — | — | — | — | — | (9,848) | (9,848) | (9,848) | (9,848) | — | — | — | — | — | — | — | — | — |
| Surface | (3,061) | — | — | — | — | — | — | — | — | — | (3,061) | (3,061) | — | (3,326) | — | — | — | — | — | — | — | — | — | (3,326) | (3,326) | — |
| Recycling/processing | (17,058) | (16,291) | (4,358) | — | (16,291) | (4,358) | (11,933) | (767) | (767) | — | — | — | — | (16,664) | (13,280) | (7,248) | — | (13,281) | (7,248) | (6,032) | (3,384) | (3,384) | — | — | — | — |
| | | | | | | | | | | | | | | | | | | | | | | | | | |
Adjusted EBITDA | 9,198 | 8,522 | 7,353 | 4,444 | 4,078 | 2,909 | 1,169 | (776) | (590) | (186) | 1,452 | 1,582 | (130) | 126 | 483 | 215 | (111) | 594 | 326 | 268 | (878) | (723) | (155) | 521 | 641 | (120) |
| | | | | | | | | | | | | | | | | | | | | | | | | | |
Capital expenditure | | | | | | | | | | | | | | | | | | | | | | | | | | |
| Sustaining capital expenditure | (505) | (412) | (366) | (363) | (49) | (3) | (46) | (28) | (28) | — | (65) | (59) | (6) | (992) | (633) | (623) | (611) | (22) | (12) | (10) | (173) | (173) | — | (186) | (186) | — |
| Ore reserve development | (1,212) | (1,212) | (1,212) | (1,212) | — | — | — | — | — | — | — | — | — | (1,920) | (1,920) | (1,920) | (1,920) | — | — | — | — | — | — | — | — | — |
| Growth projects | (6,012) | (135) | (135) | (135) | — | — | — | (5,756) | — | (5,756) | (121) | (55) | (66) | (6,528) | (291) | (291) | (291) | — | — | — | (6,221) | — | (6,221) | (16) | (6) | (10) |
| Total capital expenditure | (7,729) | (1,759) | (1,713) | (1,710) | (49) | (3) | (46) | (5,784) | (28) | (5,756) | (186) | (114) | (72) | (9,440) | (2,844) | (2,834) | (2,822) | (22) | (12) | (10) | (6,394) | (173) | (6,221) | (202) | (192) | (10) |
| | | | | | | | | | | | | | | | | | | | | | | | | | |
The following items are disclosed per segment in accordance with IFRS Accounting Standards |
| Amortisation and depreciation | (1,509) | (1,489) | (1,252) | (1,246) | (243) | (6) | (237) | (19) | (2) | (17) | (1) | — | (1) | (2,261) | (2,105) | (1,934) | (1,929) | (176) | (5) | (171) | (38) | (29) | (9) | (118) | (117) | (1) |
| Finance expense | (2,091) | (1,813) | (1,762) | (1,762) | (51) | — | (51) | (93) | (13) | (80) | (185) | (172) | (13) | (2,297) | (1,791) | (1,761) | (1,761) | (30) | — | (30) | (204) | (70) | (134) | (302) | (288) | (14) |
| (Impairments)/reversal of impairments | (12,062) | (4,230) | (4,230) | (4,230) | — | — | — | (7,832) | (28) | (7,804) | — | — | — | (9,156) | (8,824) | (8,824) | (8,824) | — | — | — | (221) | (221) | — | (111) | (4) | (107) |
1Corporate and reconciling items represent the items to reconcile segment data to consolidated financial statement totals, such as intercompany eliminations and share of results of equity-accounted investees after tax. This does not represent a separate segment as it does not generate revenue. Corporate and reconciling items for total EU operations includes Keliber
2 Includes Metallix for the four months ended 31 December 2025 since date of acquisition (see note 11.1)
3Included in cost of sales, before amortisation and depreciation is total write-down of inventory to net realisable value amounting to R1,477 million. This write-down mainly relates to PGM in process and PGM finished goods of R1,171 million and R306 million, respectively,all relating to the US PGM operations as a result of the lower commodity price environment. Included in cost of sales, before amortisation and depreciation for 2024 is total write-down of inventory to net realisable value amounting to R3,774 million. This write-down mainly relates to PGM in process and PGM finished goods of R3,115 million and R659 million, respectively, all relating to the US PGM operations
Figures are in millions
| | | | | | | | | | | | | | | | | | | | | | | | | | | | | | | | | | | | | | | | | |
| For the six months ended 31 Dec 2025 (Unaudited) |
| | AMERICAS | EUROPE | AUSTRALIA |
| | | | PRIMARY MINING | RECYCLING | | | | | SECONDARY MINING | |
| SA rand | Total international operations | Total US operations | Total US PGM | US PGM | Total US recycling | Columbus | Pennsylvania site and North Carolina site | Total EU operations | Sandouville nickel refinery | Corporate and re- conciling items1 | Total AUS operations | Century operation | Corporate and re- conciling items1 |
| Revenue | 18,843 | 16,287 | 7,947 | 3,971 | 12,316 | 3,976 | 8,340 | 28 | 28 | — | 2,528 | 2,528 | — |
| Underground | 3,971 | 3,971 | 3,971 | 3,971 | — | — | — | — | — | — | — | — | — |
| Surface | 2,528 | — | — | — | — | — | — | — | — | — | 2,528 | 2,528 | — |
| Recycling/processing | 12,344 | 12,316 | 3,976 | — | 12,316 | 3,976 | 8,340 | 28 | 28 | — | — | — | — |
Cost of sales, before amortisation and depreciation2 | (14,777) | (13,153) | (5,663) | (2,219) | (10,934) | (3,444) | (7,490) | (20) | (20) | — | (1,604) | (1,604) | — |
| Underground | (2,219) | (2,219) | (2,219) | (2,219) | — | — | — | — | — | — | — | — | — |
| Surface | (1,604) | — | — | — | — | — | — | — | — | — | (1,604) | (1,604) | — |
| Recycling/processing | (10,954) | (10,934) | (3,444) | — | (10,934) | (3,444) | (7,490) | (20) | (20) | — | — | — | — |
| | | | | | | | | | | | | |
| Adjusted EBITDA | 3,563 | 3,040 | 2,201 | 1,669 | 1,371 | 532 | 839 | (346) | (280) | (66) | 869 | 925 | (56) |
| | | | | | | | | | | | | |
Capital expenditure | | | | | | | | | | | | | |
| Sustaining capital expenditure | (329) | (289) | (243) | (242) | (47) | (1) | (46) | — | — | — | (40) | (38) | (2) |
| Ore reserve development | (598) | (598) | (598) | (598) | — | — | — | — | — | — | — | — | — |
| Growth projects | (2,853) | (41) | (41) | (41) | — | — | — | (2,735) | — | (2,735) | (77) | (43) | (34) |
| Total capital expenditure | (3,780) | (928) | (882) | (881) | (47) | (1) | (46) | (2,735) | — | (2,735) | (117) | (81) | (36) |
| | | | | | | | | | | | | |
The following items are disclosed per segment in accordance with IFRS Accounting Standards | | | | | | | | | | | | | |
| Amortisation and depreciation | (828) | (815) | (680) | (677) | (138) | (3) | (135) | (12) | — | (12) | (1) | — | (1) |
| Finance expense | (1,036) | (891) | (862) | (862) | (29) | — | (29) | (56) | (7) | (49) | (89) | (82) | (7) |
| (Impairments)/reversal of impairments | (2,460) | — | — | — | — | — | — | (2,460) | — | (2,460) | — | — | — |
1Corporate and reconciling items represent the items to reconcile segment data to consolidated financial statement totals, such as intercompany eliminations and share of results of equity-accounted investees after tax. This does not represent a separate segment as it does not generate revenue. Corporate and reconciling items for total EU operations includes Keliber
2Included in cost of sales, before amortisation and depreciation is total write-down of inventory to net realisable value amounting to R278 million. This write-down mainly relates to PGM in process and PGM finished goods of R222 million and R56 million, respectively, all relating to the US PGM operations, as a result of the lower commodity price environment
Sibanye-Stillwater Operating and financial results | Six months and year ended 31 December 2025 26
| | | | | | | | | | | | | | | | | | | | | | | | | | | | | | | | | | | | | | | | | |
| For the six months ended 30 Jun 2025 (Unaudited) |
| | AMERICAS | EUROPE | AUSTRALIA |
| | | | PRIMARY MINING | RECYCLING | | | | | SECONDARY MINING | |
| SA rand | Total international operations | Total US operations | Total US PGM | US PGM | Total US recycling | Columbus | Pennsylvania site and North Carolina site | Total EU operations | Sandouville nickel refinery | Corporate and re- conciling items1 | Total AUS operations | Century operation | Corporate and re- conciling items1 |
| Revenue | 13,461 | 10,827 | 6,038 | 2,747 | 8,080 | 3,291 | 4,789 | 490 | 490 | — | 2,144 | 2,144 | — |
| Underground | 2,747 | 2,747 | 2,747 | 2,747 | — | — | — | — | — | — | — | — | — |
| Surface | 2,144 | — | — | — | — | — | — | — | — | — | 2,144 | 2,144 | — |
| Recycling/processing | 8,570 | 8,080 | 3,291 | — | 8,080 | 3,291 | 4,789 | 490 | 490 | — | — | — | — |
Cost of sales, before amortisation and depreciation2 | (7,491) | (5,287) | (844) | 70 | (5,357) | (914) | (4,443) | (747) | (747) | — | (1,457) | (1,457) | — |
| Underground | 70 | 70 | 70 | 70 | — | — | — | — | — | — | — | — | — |
| Surface | (1,457) | — | — | — | — | — | — | — | — | — | (1,457) | (1,457) | — |
| Recycling/processing | (6,104) | (5,357) | (914) | — | (5,357) | (914) | (4,443) | (747) | (747) | — | — | — | — |
| | | | | | | | | | | | | |
| Adjusted EBITDA | 5,635 | 5,482 | 5,152 | 2,775 | 2,707 | 2,377 | 330 | (430) | (310) | (120) | 583 | 657 | (74) |
| | | | | | | | | | | | | |
Capital expenditure | | | | | | | | | | | | | |
| Sustaining capital expenditure | (176) | (123) | (123) | (121) | (2) | (2) | — | (28) | (28) | — | (25) | (21) | (4) |
| Ore reserve development | (614) | (614) | (614) | (614) | — | — | — | — | — | — | — | — | — |
| Growth projects | (3,159) | (94) | (94) | (94) | — | — | — | (3,021) | — | (3,021) | (44) | (12) | (32) |
| Total capital expenditure | (3,949) | (831) | (831) | (829) | (2) | (2) | — | (3,049) | (28) | (3,021) | (69) | (33) | (36) |
| | | | | | | | | | | | | |
The following items are disclosed per segment in accordance with IFRS Accounting Standards | | | | | | | | | | | | | |
| Amortisation and depreciation | (681) | (674) | (572) | (569) | (105) | (3) | (102) | (7) | (2) | (5) | — | — | — |
| Finance expense | (1,055) | (922) | (900) | (900) | (22) | — | (22) | (37) | (6) | (31) | (96) | (90) | (6) |
| (Impairments)/reversal of impairments | (9,602) | (4,230) | (4,230) | (4,230) | — | — | — | (5,372) | (28) | (5,344) | — | — | — |
1Corporate and reconciling items represent the items to reconcile segment data to consolidated financial statement totals, such as intercompany eliminations and share of results of equity-accounted investees after tax. This does not represent a separate segment as it does not generate revenue. Corporate and reconciling items for total EU operations includes Keliber
2Included in cost of sales, before amortisation and depreciation is total write-down of inventory to net realisable value amounting to R1,199 million. This write-down relates to PGM in process and PGM finished goods of R949 million and R250 million, respectively, relating to the US PGM operations
| | | | | | | | | | | | | | | | | | | | | | | | | | | | | | | | | | | | | | | | | |
| For the six months ended 31 Dec 2024 (Unaudited) |
| | AMERICAS | EUROPE | AUSTRALIA |
| | | | PRIMARY MINING | RECYCLING | | | | | SECONDARY MINING | |
| SA rand | Total international operations | Total US operations | US PGM operations | US PGM | Total US recycling | Columbus | Pennsylvania site and North Carolina site | Total EU operations | Sandouville nickel refinery | Corporate and re- conciling items1 | Total AUS operations | Century operation | Corporate and re- conciling items1 |
| Revenue | 16,039 | 12,261 | 8,221 | 4,357 | 7,904 | 3,864 | 4,040 | 1,099 | 1,099 | — | 2,679 | 2,679 | — |
| Underground | 4,357 | 4,357 | 4,357 | 4,357 | — | — | — | — | — | — | — | — | — |
| Surface | 2,679 | — | — | — | — | — | — | — | — | — | 2,679 | 2,679 | — |
| Recycling/processing | 9,003 | 7,904 | 3,864 | — | 7,904 | 3,864 | 4,040 | 1,099 | 1,099 | — | — | — | — |
Cost of sales, before amortisation and depreciation2 | (15,383) | (12,187) | (8,412) | (4,727) | (7,460) | (3,685) | (3,775) | (1,470) | (1,470) | — | (1,726) | (1,726) | — |
| Underground | (4,727) | (4,727) | (4,727) | (4,727) | — | — | — | — | — | — | — | — | — |
| Surface | (1,726) | — | — | — | — | — | — | — | — | — | (1,726) | (1,726) | — |
| Recycling/processing | (8,930) | (7,460) | (3,685) | — | (7,460) | (3,685) | (3,775) | (1,470) | (1,470) | — | — | — | — |
| | | | | | | | | | | | | |
| Adjusted EBITDA | 260 | (158) | (420) | (599) | 441 | 179 | 262 | (513) | (443) | (70) | 931 | 992 | (61) |
| | | | | | | | | | | | | |
Capital expenditure | | | | | | | | | | | | | |
| Sustaining capital expenditure | (456) | (239) | (232) | (220) | (19) | (12) | (7) | (66) | (66) | — | (151) | (151) | — |
| Ore reserve development | (701) | (701) | (701) | (701) | — | — | — | — | — | — | — | — | — |
| Growth projects | (3,689) | (157) | (157) | (157) | — | — | — | (3,533) | — | (3,533) | 1 | (5) | 6 |
| Total capital expenditure | (4,846) | (1,097) | (1,090) | (1,078) | (19) | (12) | (7) | (3,599) | (66) | (3,533) | (150) | (156) | 6 |
| | | | | | | | | | | | | |
| The following items are disclosed per segment in accordance with IFRS Accounting Standards | | | | | | | | |
| Amortisation and depreciation | (1,087) | (1,004) | (904) | (901) | (103) | (3) | (100) | (22) | (17) | (5) | (61) | (61) | — |
| Finance expense | (1,107) | (895) | (876) | (876) | (19) | — | (19) | (95) | (29) | (66) | (117) | (110) | (7) |
| (Impairments)/reversal of impairments | (1,655) | (1,325) | (1,325) | (1,325) | — | — | — | (221) | (221) | — | (109) | (2) | (107) |
1Corporate and reconciling items represent the items to reconcile segment data to consolidated financial statement totals, such as intercompany eliminations and share of results of equity-accounted investees after tax. This does not represent a separate segment as it does not generate revenue. Corporate and reconciling items for total EU operations includes Keliber
2Included in cost of sales, before amortisation and depreciation is total write-down of inventory to net realisable value amounting to R1,857 million. This write-down mainly relates to PGM in process and PGM finished goods of R1,592 million and R265 million, respectively, all relating to the US PGM operations
Sibanye-Stillwater Operating and financial results | Six months and year ended 31 December 2025 27
3. Revenue
The Group’s sources of revenue are:
| | | | | | | | | | | | | | | | | | | | |
Figures in million - SA rand | | Six months ended | Year ended |
| | Unaudited | Unaudited | Unaudited | Unaudited | Audited |
| | Dec 2025 | June 2025 | Dec 2024 | Dec 2025 | Dec 2024 |
Primary mining: | | | | | | |
| Gold mining activities | | 15,516 | 12,414 | 12,463 | 27,930 | 24,077 |
PGM mining activities1 | | 38,787 | 26,781 | 28,588 | 65,568 | 59,682 |
| Nickel refining activities | | 28 | 490 | 1,099 | 518 | 2,784 |
Secondary mining: | | | | | | |
Zinc retreatment operation2 | | 2,406 | 2,357 | 2,781 | 4,763 | 4,220 |
| Gold tailings retreatment | | 5,053 | 4,076 | 3,802 | 9,129 | 7,068 |
Recycling: | | | | | | |
| Columbus site recycling activities | | 3,927 | 3,291 | 3,864 | 7,218 | 7,574 |
| Pennsylvania site and North Carolina site recycling activities | | 8,340 | 4,789 | 4,040 | 13,129 | 6,306 |
Other: | | | | | | |
Stream1 | | 562 | 737 | 345 | 1,299 | 581 |
| Total revenue from contracts with customers | | 74,619 | 54,935 | 56,982 | 129,554 | 112,292 |
Adjustments relating to sales of SA PGM concentrate provisional pricing3 | | 169 | 45 | 45 | 214 | 74 |
Adjustments relating to zinc operation provisional pricing3 | | 122 | (213) | (102) | (91) | (237) |
| Total revenue | | 74,910 | 54,767 | 56,925 | 129,677 | 112,129 |
1 The difference between revenue from PGM mining activities above and total revenue from PGM mining activities as disclosed on the segment report relates to the separate disclosure of revenue from the gold and palladium streaming arrangement with Wheaton Precious Metals International (Wheaton International)(Wheaton stream) and the gold and platinum streaming arrangement with Franco-Nevada (Franco-Nevada stream) in the above. Revenue relating to the Wheaton stream and Franco-Nevada stream is incorporated in the Group corporate segment as described in the segment report (see note 2)
2 The difference between revenue from zinc retreatment operations above and total revenue from zinc retreatment operations on the segment report relates to the separate disclosure of revenue related to adjustments on the provisional pricing on zinc sales
3 These adjustments relate to provisional pricing arrangements resulting in subsequent changes to the amount of revenue recognised
Revenue per geographical region of the relevant operations:
| | | | | | | | | | | | | | | | | | | | |
Figures in million - SA rand | | Six months ended | Year ended |
| | Unaudited | Unaudited | Unaudited | Unaudited | Audited |
| | Dec 2025 | June 2025 | Dec 2024 | Dec 2025 | Dec 2024 |
| Southern Africa (SA) | | 56,543 | 41,399 | 40,873 | 97,942 | 82,402 |
| United States (US) | | 15,811 | 10,734 | 12,274 | 26,545 | 22,960 |
| Europe (EU) | | 28 | 490 | 1,099 | 518 | 2,784 |
| Australia (AUS) | | 2,528 | 2,144 | 2,679 | 4,672 | 3,983 |
| Total revenue | | 74,910 | 54,767 | 56,925 | 129,677 | 112,129 |
Percentage of revenue per segment based on the geographical location of customers purchasing from the Group:
| | | | | | | | | | | | | | | | | |
| Six months ended | Year ended |
| Unaudited | Unaudited | Unaudited | Unaudited | Audited |
| Dec 2025 | June 2025 | Dec 2024 | Dec 2025 | Dec 2024 |
Sibanye-Stillwater Operating and financial results | Six months and year ended 31 December 2025 28
| | | | | | | | | | | | | | | | | |
| Six months ended | Year ended |
| Unaudited | Unaudited | Unaudited | Unaudited | Audited |
| Dec 2025 | June 2025 | Dec 2024 | Dec 2025 | Dec 2024 |
| | |
Zinc retreatment (Australia) |
| | |
Pennsylvania site and North Carolina site recycling (US) |
Sibanye-Stillwater Operating and financial results | Six months and year ended 31 December 2025 29
Revenue generated per product: | | | | | | | | | | | | | | | | | | | | |
Figures in million - SA rand | | Six months ended | Year ended |
| | Unaudited | Unaudited | Unaudited | Unaudited | Audited |
| | Dec 2025 | June 2025 | Dec 2024 | Dec 2025 | Dec 2024 |
| Gold | | 26,855 | 20,836 | 20,018 | 47,691 | 37,138 |
| PGMs | | 41,081 | 27,864 | 28,818 | 68,945 | 59,547 |
| Platinum | | 16,085 | 9,744 | 9,775 | 25,829 | 20,573 |
| Palladium | | 11,279 | 7,835 | 9,550 | 19,114 | 19,919 |
| Rhodium | | 10,292 | 7,681 | 7,306 | 17,973 | 14,747 |
| Iridium | | 2,025 | 1,756 | 1,406 | 3,781 | 2,824 |
| Ruthenium | | 1,400 | 848 | 781 | 2,248 | 1,484 |
| Chrome | | 2,666 | 2,158 | 2,923 | 4,824 | 6,069 |
| Nickel | | 491 | 841 | 1,536 | 1,332 | 3,626 |
| Zinc | | 2,328 | 1,998 | 2,534 | 4,326 | 3,765 |
| Silver | | 1,421 | 725 | 599 | 2,146 | 1,008 |
Other1 | | 68 | 345 | 497 | 413 | 976 |
| Total revenue | | 74,910 | 54,767 | 56,925 | 129,677 | 112,129 |
1 Other primarily includes revenue from cobalt and copper sales
4. Finance expense
| | | | | | | | | | | | | | | | | | | | |
Figures in million - SA rand | | Six months ended | Year ended |
| | Unaudited | Unaudited | Unaudited | Unaudited | Audited |
| Notes | Dec 2025 | June 2025 | Dec 2024 | Dec 2025 | Dec 2024 |
| Interest charge on: | | | | | | |
| Borrowings — interest | 12 | (871) | (922) | (975) | (1,793) | (1,946) |
| - US$1 billion revolving credit facility (RCF) | | (128) | (105) | (123) | (233) | (185) |
| - R6.5 billion RCF | | (110) | (138) | (97) | (248) | (97) |
| - R5.5 billion RCF | | — | — | (93) | — | (319) |
| - 2026 and 2029 Notes | | (442) | (463) | (456) | (905) | (928) |
| - US$ Convertible Bond | | (185) | (195) | (191) | (380) | (389) |
| - Other borrowings | | (6) | (21) | (15) | (27) | (28) |
| Borrowings — unwinding of amortised cost | 12 | (304) | (336) | (355) | (640) | (688) |
| - 2026 and 2029 Notes | | (42) | (59) | (56) | (101) | (98) |
| - Burnstone Debt | | (104) | (117) | (142) | (221) | (284) |
| - US$ Convertible Bond | | (158) | (160) | (149) | (318) | (298) |
| - Other borrowings | | — | — | (8) | — | (8) |
| Lease liabilities | | (23) | (16) | (15) | (39) | (34) |
| Environmental rehabilitation obligation | | (491) | (493) | (453) | (984) | (966) |
| Occupational healthcare obligation | 13 | (17) | (17) | (19) | (34) | (38) |
| Marikana dividend obligation | | (43) | (42) | (96) | (85) | (188) |
Deferred revenue | 16 | (580) | (541) | (208) | (1,121) | (371) |
| Other | | (118) | (186) | (158) | (304) | (340) |
| Total finance expense | | (2,447) | (2,553) | (2,279) | (5,000) | (4,571) |
5. (Loss)/gain on financial instruments
| | | | | | | | | | | | | | | | | | | | |
Figures in million - SA rand | | Six months ended | Year ended |
| | Unaudited | Unaudited | Unaudited | Unaudited | Audited |
| Notes | Dec 2025 | June 2025 | Dec 2024 | Dec 2025 | Dec 2024 |
Fair value (loss)/gain on gold hedge contracts1 | | (958) | (778) | (392) | (1,736) | (448) |
Fair value (loss)/gain on zinc hedge contracts2 | | (66) | 222 | (154) | 156 | (234) |
Fair value gain on derivative financial instrument | 12 | — | — | — | — | 1,733 |
Fair value (loss)/gain on share-based payment obligations | | (289) | (131) | 1,238 | (420) | 814 |
(Loss)/gain on the revised cash flow of the Burnstone Debt3 | 12 | (1,805) | — | 1,053 | (1,805) | 1,053 |
| (Loss)/gain on the revised cash flow of the Marikana dividend obligation | | (1) | 6 | 993 | 5 | 1,046 |
| Fair value gain on contingent consideration (related to the Kroondal acquisition) | | — | — | 270 | — | 396 |
| Gain on the revised cash flow of the Keliber dividend obligation | | 290 | 137 | 811 | 427 | 811 |
| Fair value gain/(loss) on other investments | | 20 | 165 | (8) | 185 | (24) |
| Other | | (594) | (12) | 126 | (606) | 286 |
| Total (loss)/gain on financial instruments | | (3,403) | (391) | 3,937 | (3,794) | 5,433 |
1 On 3 May 2023, Sibanye Gold (Pty) Ltd (SGL) concluded a gold hedge agreement which commenced on 4 May 2023. The agreement was structured at monthly average prices, comprising the delivery of 154,320 ounces of gold over 12 months (12,860 ounces per month) with a zero cost collar which established a floor and cap of R34,214 and R46,050 per ounce, respectively. On 17 November 2023, SGL concluded two additional gold hedge agreements which commenced on 17 November 2023. These agreements were structured at monthly average prices, comprising the delivery of 120,000 and 240,000 ounces of gold over 12 months, respectively. The agreements had a zero cost collar which established a floor of R34,214 per ounce for both agreements and cap of R43,545 and R43,800 per ounce, respectively. On 4 November 2024, SGL concluded a gold hedge agreement, which commenced on 2 December 2024. The agreement is structured at monthly average prices, comprising the delivery of 182,000 ounces of gold over 12 months (14,000 ounces per month) with a zero cost collar which establishes a floor and cap of R45,000 and R58,500 per ounce, respectively. On 9 December 2024, SGL concluded an additional gold hedge agreement, which commenced on 2 January 2025. The agreement is structured at monthly average prices, comprising the delivery of 168,000 ounces of gold over 12 months (14,000 ounces per month) with a zero cost collar which establishes a floor and cap of R45,000 and R54,400 per ounce, respectively. As hedge accounting is not applied, resulting gains or losses are accounted for as gains or losses on financial instruments in profit or loss. The fair value loss is included in the corporate and reconciling items of the SA gold section of the segment report
2 During June 2024, Century concluded two zinc hedge agreements, which both commenced on 1 July 2024. The first agreement was structured at monthly average prices, comprising the delivery of 5,940 tonnes of zinc over 18 months (330 tonnes per month) with a zero cost collar which established a floor and cap of A$4,300 and A$4,830 per tonne, respectively. The second zinc hedge agreement was structured at monthly average prices, comprising the delivery of 30,060 tonnes of zinc over 18 months (1,670 tonnes per month) with a zero cost collar which established a floor and cap of A$4,100 and A$4,340 per tonne, respectively. During November 2024, Century concluded two additional zinc hedge agreements, which both commenced in January 2025. The
Sibanye-Stillwater Operating and financial results | Six months and year ended 31 December 2025 30
first agreement comprised the delivery of 6,000 tonnes of zinc in January 2025 with a zero cost collar which establishes a floor and cap of A$4,150 and A$4,500 per tonne, respectively. The second zinc hedge agreement was structured at monthly average prices, comprising the delivery of 12,000 tonnes of zinc over 12 months (1,000 tonnes per month) with a zero cost collar which established a floor and cap of A$4,200 and A$4,780 per tonne, respectively. During March 2025, Century concluded an additional zinc hedge agreement, which commenced in April 2025. The agreement comprised the delivery of 5,112 tonnes of zinc over 9 months (568 tonnes per month) with a zero cost collar which established a floor and cap of A$4,200 and A$4,950 per tonne, respectively. During H2 2025, Century concluded four additional hedge agreements which all commenced on 1 January 2026. The first agreement comprises the delivery of 3,300 tonnes of zinc over 6 months (550 tonnes per month) with a zero cost collar which established a floor and cap of A$4,250 and A$4,800 per tonne. The second agreement comprises the delivery of 6,000 tonnes of zinc over 6 months (1,000 tonnes per month) with a zero cost collar which established a floor and cap of A$4,200 and A$4,750 per tonne. The third agreement comprises the delivery of 2,700 tonnes of zinc over 6 months (450 tonnes per month) with a zero cost collar which established a floor and cap of A$4,250 and A$4,800 per tonne. The fourth agreement comprises the delivery of 12,000 tonnes of zinc over 6 months (2,000 tonnes per month) with a zero cost collar which established a floor and cap of A$4,300 and A$4,900 per tonne. As hedge accounting is not applied, resulting gains or losses are accounted for as gains or losses on financial instruments in profit or loss
3 The loss on the revised cash flows of the Burnstone Debt relates to the increase in the Burnstone Debt to R4,005 million (30 June 2025 R2,254 million and 31 December 2024 R2,260 million). The repayment terms of the Burnstone Debt is linked to the expected cash flows over the Burnstone life of mine, and the increase in the debt is as a result of the higher gold prices over that expected life. The amount is included in the corporate and reconciling items of the SA gold section of the segment report
6. Other costs and other income
6.1 Other costs
| | | | | | | | | | | | | | | | | | | | |
Figures in million - SA rand | | Six months ended | Year ended |
| | Unaudited | Unaudited | Unaudited | Unaudited | Audited |
| | Dec 2025 | June 2025 | Dec 2024 | Dec 2025 | Dec 2024 |
Care and maintenance1 | | (1,099) | (662) | (830) | (1,761) | (1,609) |
| Corporate and social investment costs | | (190) | (162) | (245) | (352) | (405) |
| Cost incurred on employee and community trusts | | (256) | (108) | (204) | (364) | (204) |
| Exploration costs | | (2) | (2) | (11) | (4) | (36) |
| Non-mining royalties | | 8 | (28) | (47) | (20) | (73) |
| Change in estimate of environmental rehabilitation obligation, and right of recovery receivable and payable | | (798) | — | (248) | (798) | (486) |
| Service entity costs | | (205) | (165) | (306) | (370) | (466) |
| Onerous contract provision | | — | — | (200) | — | (200) |
| Other | | (608) | (532) | (880) | (1,140) | (1,243) |
| Total other costs | | (3,150) | (1,659) | (2,971) | (4,809) | (4,722) |
1 Care and maintenance costs mainly includes Cooke (included in the gold corporate and reconciling segment) amounting to R1,132 million and R652 million for the year and six months ended 31 December 2025, respectively (six months ended 30 June 2025: R480 million, six months ended 31 December 2024: R505 million, year ended 31 December 2024: R970 million), Burnstone (included in the gold corporate and reconciling segment) amounting to R206 million and R117 million for the year and six months ended 31 December 2025, respectively (six months ended 30 June 2025: R89 million, six months ended 31 December 2024: R178 million, twelve months ended 31 December 2024: R194 million) and Sandouville amounting to R194 million for the year and six months ended 31 December 2025, respectively. Care and maintenance costs for the year ended 31 December 2024 also included R340 million (six months ended 31 December 2024: R97 million) and R69 million (six months ended 31 December 2024: R35 million) related to Kloof and Marikana, respectively
6.2 Other income
| | | | | | | | | | | | | | | | | | | | |
Figures in million - SA rand | | Six months ended | Year ended |
| | Unaudited | Unaudited | Unaudited | Unaudited | Audited |
| | Dec 2025 | June 2025 | Dec 2024 | Dec 2025 | Dec 2024 |
| Change in estimate of environmental rehabilitation obligation, and right of recovery receivable and payable | | 205 | 98 | 40 | 303 | 40 |
| Service entity income | | 168 | 154 | 143 | 322 | 307 |
| Sundry income | | 161 | 175 | 235 | 336 | 389 |
| Onerous contract provision utilisation/change in estimate | | — | 124 | 693 | 124 | 1,017 |
| Insurance proceeds | | 186 | 88 | 63 | 274 | 875 |
| Gain/increase in equity-accounted investment | | 5 | — | 1 | 5 | 2 |
| Gain on assets held for sale | | 16 | — | — | 16 | — |
| Total other income | | 741 | 639 | 1,175 | 1,380 | 2,630 |
7. Impairments and reversal of impairments
The Group performed its annual impairment testing, for goodwill and cash-generating units (CGUs) where indicators of impairment existed, at 31 December 2025. The table below is a breakdown of the impairment losses and reversal of previously recognised impairment losses recognised for each period ended.
| | | | | | | | | | | | | | | | | | | | |
Figures in million - SA rand | | Six months ended | Year ended |
| | Unaudited | Unaudited | Unaudited | Unaudited | Audited |
| | Dec 2025 | June 2025 | Dec 2024 | Dec 2025 | Dec 2024 |
Impairment of mining assets and goodwill | | (6,223) | (9,602) | (1,489) | (15,825) | (9,113) |
Impairment of right-of-use assets - mining assets | | (16) | — | (60) | (16) | (60) |
Impairment reversal of mining assets and goodwill | | 1,924 | — | — | 1,924 | — |
Impairment of investment in equity-accounted investee1 | | — | (64) | — | (64) | — |
Other impairment | | (26) | — | — | (26) | — |
| Total impairments and reversal of impairments | | (4,341) | (9,666) | (1,549) | (14,007) | (9,173) |
1 Mimosa's updated life-of-mine at 30 June 2025 indicated above US dollar inflationary increases in working costs and capital costs, and included a Zimbabwean beneficiation tax which resulted in a decrease in the expected future net cash flows from Mimosa. The lower value in use led to an after tax equity-accounted impairment of property, plant and equipment amounting to R535 million and the impairment of the investment in the equity-accounted investee of R64 million, before the impact of deferred tax (net an impairment of R461 million) (see note 9.3) (included in SA PGM on the segment report — see note 2). The weighted average PGM (4E) basket price, nominal discount rate and life-of-mine used in the Mimosa impairment assessment was R25,745/4Eoz, 20.67% and 8 years, respectively. The recoverable amount at 30 June 2025 was determined as R2,208 million
The carrying value of the Kloof CGU was impaired by R3,779 million and the carrying value of the Keliber CGU was impaired by R2,460 million at 31 December 2025 in addition to the R5,344 million recognised at 30 June 2025.
•The impairment recognised at Kloof was due to a decrease in the life of mine as a result of logistical constraints, seismicity and safety concerns to access higher grade areas, that resulted in a decrease in the recoverable amount at 31 December 2025.
•The impairment of Keliber was due to a further decrease in the consensus long-term forecasted lithium hydroxide price compared to 30 June 2025 and the decision to proceed with an extended start-up profile resulting in a decrease in the recoverable amount as at 31 December 2025.
The impairment recognised at 30 June 2025 at the US PGM operations (Stillwater CGU) resulted from the One Big Beautiful Bill Act that was signed into US law and indicates a phase out and termination of Section 45X credits. Under the phase out and termination rules, any applicable critical
Sibanye-Stillwater Operating and financial results | Six months and year ended 31 December 2025 31
mineral produced after 31 December 2030 is phased out with 25% over a period of 4 years commencing from 2031. This resulted in decreased future net cash flows from the US PGM operations and a reduction in value in use at 30 June 2025, and consequently to an impairment of property, plant and equipment of R4,230 million. The impairment recognised on Keliber at 30 June 2025 was due to a decrease in the consensus long-term forecasted lithium hydroxide price and an increased discount rate that resulted in a decrease in the expected future net cash flows from Keliber and the value in use at 30 June 2025, and resulted in an impairment of property, plant and equipment.
The carrying values of Beatrix, Driefontein and Burnstone were increased at 31 December 2025 by a reversal of previously recognised impairment losses of R449 million, R167 million and R1,307 million, respectively. The reversals of impairment resulted from the higher gold price outlook and sustained operational improvements at the Beatrix and Driefontein operations and translated to an increase in the expected future net cash flows and recoverable amounts at Beatrix, Driefontein and Burnstone.
The impairment of mining assets recognised during 2025 relates to the following classes of assets and CGUs:
| | | | | | | | | | | | | | | | | | | | | | | | | | | | | | | | | | | | | | | | | | | | |
Figures in million - SA rand | Six months ended | Year ended |
| Unaudited | Unaudited | Unaudited |
| Dec 2025 | June 2025 | Dec 2025 |
| Keliber | Kloof | Other | Total | Stillwater | Keliber | Kloof | Other | Total | Stillwater | Keliber | Kloof | Other | Total |
Mine development, infrastructure and other | (1,771) | (3,470) | — | (5,241) | (4,230) | (4,929) | — | (28) | (9,187) | (4,230) | (6,700) | (3,470) | (28) | (14,428) |
Land, mineral rights and rehabilitation | (689) | (293) | — | (982) | — | (415) | — | — | (415) | — | (1,104) | (293) | — | (1,397) |
Right-of-use assets | — | (16) | — | (16) | — | — | — | — | — | — | — | (16) | — | (16) |
Total impairments | (2,460) | (3,779) | — | (6,239) | (4,230) | (5,344) | — | (28) | (9,602) | (4,230) | (7,804) | (3,779) | (28) | (15,841) |
The impairment reversals of mining assets recognised during 2025 relates to the following classes of assets and CGUs:
| | | | | | | | | | | | | | |
Figures in million - SA rand | Six months and year ended |
| Unaudited |
| Dec 2025 |
| Beatrix | Driefontein | Burnstone | Total |
Mine development, infrastructure and other | 418 | 152 | 1,307 | 1,877 |
Land, mineral rights and rehabilitation | 31 | 15 | — | 46 |
Total impairments | 449 | 167 | 1,307 | 1,923 |
The assumptions applied in the recoverable amount calculations for the Stillwater, Kloof, Beatrix, Driefontein and Keliber CGUs are set out below:
| | | | | | | | | | | | | | | | | | | | | | | | | | |
| | Unaudited | Unaudited |
| | June 2025 | December 2025 |
| | Stillwater | Keliber | Kloof | Beatrix | Driefontein | Burnstone | Keliber |
Average PGM (2E) basket price1 | US$/2Eoz | 1,118 | — | — | — | — | — | — |
Average lithium hydroxide price1 | US$/t | — | 17,972 | — | — | — | — | 17,475 |
Average gold price1 | R/kg | — | — | 2,295,754 | 1,983,927 | 1,856,994 | 1,670,512 | — |
Inflation rate2 | % | 2.1 | 2.0 | 3.5 | 3.5 | 3.5 | 3.5 | 2.0 |
Nominal discount rate3 | % | 10.56 | 11.19 | 11.68 | 12.76 | 13.52 | 15.22 | 10.14 |
Life-of-mine4,5 | years | 67 | 20 | 1 | 6 | 11 | 23 | 20 |
Recoverable amount6 | R' million | 9,361 | 9,359 | — | 9,341 | 20,581 | 13,039 | 8,925 |
1 The weighted average commodity prices and exchange rate were derived by considering various bank and commodity broker consensus forecasts
2 The inflation rate is based on the expected forecast inflation rate for the geographic region which most affects the CGU's cash flows
3 The nominal discount rate is calculated as the weighted average cost of capital of the CGU
4 Periods longer than five years for inclusion in the impairment test are considered appropriate based on the nature of the operations since a formally approved life-of-mine plan is used to determine cash flows over the life of the mine based on the available reserves
5 In respect of Keliber, if the life-of-mine is not extended meaningfully, it is estimated that the concentrator and refinery will continue with external purchases of spodumene concentrate. A minimum of 6 years post life-of-mine were assumed for external purchase of spodumene concentrate
6 The recoverable amount (fair value less cost of disposal) was estimated using discounted cash flows. The fair value measurement was categorised as a Level 3 fair value based on the inputs in the valuation technique used
Group impairment assumptions
The cash flows are based on the annual life-of-mine plans that takes into account the following:
•Proved and probable ore reserves of the CGU and conversion of resources where appropriate
•Revenue based on consensus forecast commodity prices, and operating costs
•Sustaining capital expenditure estimates over the life-of-mine plan
•Developmental capital expenditure, where applicable
The Group's estimates and assumptions used for the 31 December 2025 impairment calculations include:
| | | | | | | | | | | | | | | | | | | | | | | |
| | Gold operations | PGM operations | Pennsylvania site recycling |
| | Unaudited | Audited | Unaudited | Audited | Unaudited | Audited |
| | Dec 2025 | Dec 2024 | Dec 2025 | Dec 2024 | Dec 2025 | Dec 2024 |
Average gold price2 | R/kg | 1,903,056 | 1,324,530 | | | | |
Average PGM (4E) basket price2 | R/4Eoz | | | 28,890 | | 26,963 | | |
Average PGM (2E) basket price2 | US$/2Eoz | | | 1,134 | | 1,120 | | |
Average gold price2 | US$/oz | | | | | 3,562 | 2,329 |
Average silver price2 | US$/oz | | | | | 44 | 29 |
Nominal discount rate — South Africa3, 4 | % | 11.7 - 13.5 | 14.3 - 15.7 | 13.9 - 16.3 | 21.3 - 21.5 | | |
Nominal discount rate — United States4 | % | | | 11.6 | 13.0 | 13.1 | 15.3 |
Inflation rate — South Africa5 | % | 3.5 | 5.0 | 3.5 | 5.0 | | |
Inflation rate — United States5 | % | | | 2.2 | 2.1 | 2.2 | 2.1 |
Life-of-mine6 | years | 1 - 11 | 4 - 10 | 1 - 66 | 13 - 45 | N/A | N/A |
Sibanye-Stillwater Operating and financial results | Six months and year ended 31 December 2025 32
1 The Keliber impairment assessment at 31 December 2025 applied an average lithium hydroxide price of US$17,475/t (2024: US$18,640/t), nominal discount rate of 10.14% (2024: 9.9%), inflation rate of 2% (2024: 2%) and a life-of-mine of 20 years (2024: 23 years)
2 The average prices and the exchange rate were derived by considering various bank and commodity broker consensus forecasts. The average gold price used in the impairment assessment of the Burnstone project was R1,670,512/kg (2024: R1,189,493/kg). No impairment assessment was performed for Mimosa at 31 December 2025. The weighted average PGM (4E) basket price used for the Mimosa equity-accounted joint venture at 31 December 2024 was R25,433/4Eoz
3 Nominal discount rate for the Burnstone project is 15.2% (2024: 17.5%) and for the equity-accounted joint venture Mimosa at 31 December 2024 was 22.7%
4 The nominal discount rate is calculated as the weighted average cost of capital of the respective CGUs
5 The inflation rate is based on the expected forecast inflation rate in the geographical region which most affects the CGU's cash flows
6 Periods longer than five years are used for determining the recoverable amount and is considered appropriate based on the nature of the operations since a formally approved life-of-mine plan is used to determine cash flows over the life of each mine based on the available reserves
Results of impairment assessments for the Group's CGUs and goodwill allocated to CGUs
No impairment was recognised at 31 December 2025 for the Group's CGUs, other than disclosed above, or any CGUs with allocated goodwill.
8. Mining and income tax
| | | | | | | | | | | | | | | | | | | | |
Figures in million - SA rand | | Six months ended | Year ended |
| | Unaudited | Unaudited | Unaudited | Unaudited | Audited |
| | Dec 2025 | June 2025 | Dec 2024 | Dec 2025 | Dec 2024 |
Tax on profit before tax at maximum South African statutory company tax rate (27%) | | (543) | 654 | (435) | 111 | 1,138 |
| South African gold mining tax formula rate adjustment | | (155) | (14) | 60 | (169) | 41 |
US statutory tax rate adjustment | | (21) | (6) | (9) | (27) | (40) |
US state tax adjustment | | 41 | (17) | 99 | 24 | 365 |
Non-taxable Section 45X credit | | 306 | 1,364 | — | 1,670 | — |
| Non-taxable dividend received | | 4 | 2 | — | 6 | — |
Non-deductible finance expense | | (34) | (67) | (238) | (101) | (320) |
| Non-deductible share-based payments | | (7) | (4) | (4) | (11) | (7) |
| Non-taxable gain on fair value of financial instruments | | 8 | 32 | 1,296 | 40 | 1,196 |
Non-deductible loss on foreign exchange differences | | (7) | (6) | (2) | (13) | (10) |
| Non-taxable share of results of equity-accounted investees | | 208 | (114) | 21 | 94 | 59 |
| Non-deductible impairments | | 5 | (18) | — | (13) | — |
| Non-deductible transaction costs | | (1,001) | (47) | 15 | (1,048) | (62) |
| Tax adjustment in respect of prior periods | | (30) | (16) | (100) | (46) | (81) |
| Net other non-taxable income and non-deductible expenditure | | 462 | 130 | (743) | 592 | (210) |
| Change in estimated deferred tax rate | | (88) | (15) | 577 | (103) | 364 |
Deferred tax assets unrecognised or derecognised1 | | (1,991) | (3,343) | (858) | (5,334) | (3,929) |
| Mining and income tax | | (2,843) | (1,485) | (321) | (4,328) | (1,496) |
| Effective tax rate | | 141 | % | (61 | %) | 20 | % | (1053 | %) | (36 | %) |
1 The amount for the year ended 31 December 2025 relates mainly to unrecognised deferred tax assets at the Stillwater, Keliber, Sandouville, Burnstone and Cooke amounting to R4,968 million. The amount for the year ended 31 December 2024 relates mainly to unrecognised deferred tax assets at the Stillwater and Cooke amounting to R3,847 million
9. Earnings per share
9.1 Basic earnings per share
| | | | | | | | | | | | | | | | | | | | |
| | Six months ended | Year ended |
| | Unaudited | Unaudited | Unaudited | Unaudited | Audited |
| | Dec 2025 | June 2025 | Dec 2024 | Dec 2025 | Dec 2024 |
| Ordinary shares in issue (’000) | | 2,830,567 | 2,830,567 | 2,830,567 | 2,830,567 | 2,830,567 |
| Adjustment for weighting of ordinary shares in issue (’000) | | — | — | — | — | — |
Adjusted weighted average number of shares (’000) | | 2,830,567 | 2,830,567 | 2,830,567 | 2,830,567 | 2,830,567 |
(Loss)/profit attributable to owners of Sibanye-Stillwater (SA rand million) | | (1,580) | (3,591) | 38 | (5,171) | (7,297) |
Basic earnings per share (EPS) (cents) | | (56) | (127) | 1 | (183) | (258) |
9.2 Diluted earnings per share
The vesting of equity-settled share options issued by DRDGOLD and the assumed conversion of the US$ Convertible Bond could potentially dilute basic earnings per share in future through the dilution of earnings attributable to the Group and the increase in ordinary shares in issue, respectively. However, these instruments were anti-dilutive for all periods presented.
9.3 Headline earnings per share
| | | | | | | | | | | | | | | | | | | | |
Figures in million - SA rand unless otherwise stated | | Six months ended | Year ended |
| | Unaudited | Unaudited | Unaudited | Unaudited | Audited |
| | Dec 2025 | June 2025 | Dec 2024 | Dec 2025 | Dec 2024 |
(Loss)/profit attributable to owners of Sibanye-Stillwater | | (1,580) | (3,591) | 38 | (5,171) | (7,297) |
Loss/(gain) on disposal of property, plant and equipment | | 30 | (16) | (20) | 14 | (55) |
| Impairments and reversal of impairments | | 4,341 | 9,666 | 1,549 | 14,007 | 9,173 |
| Impairment recognised by equity-accounted investee, net of tax | | — | 461 | — | 461 | 19 |
| Foreign exchange movement recycled through profit or loss | | 13 | 4 | 29 | 17 | 55 |
| Compensation for losses incurred | | (75) | (67) | (26) | (142) | (26) |
| Gain on assets held for sale | | (16) | — | — | (16) | — |
| Taxation effect of remeasurement items | | (675) | (4) | (27) | (679) | (52) |
| Re-measurement items, attributable to non-controlling interest | | (498) | (1,081) | — | (1,579) | — |
Headline earnings | | 1,540 | 5,372 | 1,543 | 6,912 | 1,817 |
Adjusted weighted average number of shares (’000) | | 2,830,567 | 2,830,567 | 2,830,567 | 2,830,567 | 2,830,567 |
Headline EPS (cents) | | 54 | 190 | 55 | 244 | 64 |
Sibanye-Stillwater Operating and financial results | Six months and year ended 31 December 2025 33
9.4 Diluted headline earnings per share
The assumed conversion of the US$ Convertible Bond was dilutive in respect of headline earnings per share for the twelve months ended 31 December 2025 and the six months ended 30 June 2025, however the convertible bonds were anti-dilutive for all other periods presented.
| | | | | | | | | | | | | | | | | |
Figures in million - SA rand unless otherwise stated | | Six months ended | Year ended |
| | Unaudited | Unaudited | Unaudited | Audited |
| | June 2025 | Dec 2024 | Dec 2025 | Dec 2024 |
| Headline earnings | | 5,372 | 1,543 | 6,912 | 1,817 |
| Adjusted for impact of the US$ Convertible bond: | | 311 | — | 613 | — |
| - Interest charge and unwinding of amortised cost | | 355 | — | 698 | — |
| - Tax effect | | (44) | — | (85) | — |
| Diluted headline earnings | | 5,683 | 1,543 | 7,525 | 1,817 |
| | | | | |
| Adjusted weighted average number of shares ('000) | | 2,830,567 | 2,830,567 | 2,830,567 | 2,830,567 |
| Potential ordinary shares - US$ Convertible Bond ('000) | | 374,056 | — | 374,056 | — |
| Diluted ordinary shares - US$ Convertible Bond ('000) | | 3,204,623 | 2,830,567 | 3,204,623 | 2,830,567 |
Diluted headline EPS (cents) | | 177 | 55 | 235 | 64 |
10. Dividends
Dividend policy
The Group’s dividend policy is to return between 25% to 35% of normalised earnings to shareholders and after due consideration of future requirements the dividend may be increased beyond these levels. The Board, consistently considers normalised earnings in determining what value will be distributed to shareholders. The Board believes normalised earnings provides useful information to investors regarding the extent to which results of operations may affect shareholder returns. Normalised earnings is defined as earnings attributable to the owners of Sibanye-Stillwater excluding gains and losses on financial instruments and foreign exchange differences, impairments and related compensation, gain/loss on disposal of property, plant and equipment, occupational healthcare expenses, restructuring costs, transactions costs, share-based payment expenses on B-BBEE transactions, gains on acquisitions, net other business development costs, share of results of equity-accounted investees, all after tax and the impact of non-controlling interest, and changes in the estimated deferred tax rate.
In line with Sibanye-Stillwater’s dividend policy and its Capital Allocation Framework, the Board of Directors resolved to declare a final dividend of 131 SA cents per share. The dividend amounts to a payout of 35% of normalised earnings for the year ended 31 December 2025.
| | | | | | | | | | | | | | | | | | | | |
Figures in million - SA rand | | Six months ended | Year ended |
| | Unaudited | Unaudited | Unaudited | Unaudited | Audited |
| | Dec 2025 | June 2025 | Dec 2024 | Dec 2025 | Dec 2024 |
| (Loss)/profit attributable to the owners of Sibanye-Stillwater | | (1,580) | (3,591) | 38 | (5,171) | (7,297) |
| Adjusted for: | | | | | | |
| Loss/(gain) on financial instruments | | 3,403 | 391 | (3,937) | 3,794 | (5,433) |
| Loss/(gain) on foreign exchange differences | | 6 | (161) | 202 | (155) | 215 |
| Loss/(gain) on disposal of property, plant and equipment | | 30 | (16) | (20) | 14 | (55) |
| Impairments and reversal of impairments | | 4,341 | 9,666 | 1,549 | 14,007 | 9,173 |
| Restructuring costs | | 5 | 242 | 250 | 247 | 550 |
| Transaction and project costs | | 4,125 | 418 | 505 | 4,543 | 851 |
| Occupational healthcare obligation expense/(gain) | | 46 | 3 | (77) | 49 | (76) |
| Gain/increase in equity-accounted investment | | (5) | — | (1) | (5) | (2) |
| Provision for community costs post closure | | — | — | — | — | 24 |
| Gain on assets held for sale | | (16) | — | — | (16) | — |
| Cyber security costs | | — | — | 67 | — | 67 |
| Change in estimated deferred tax rate | | 88 | 15 | (577) | 103 | (364) |
| Share of results of equity-accounted investees after tax | | (769) | 432 | (76) | (337) | (212) |
| Corporate leadership costs | | 41 | 9 | — | 50 | — |
| Section 45X credits recognised for 2023 and 2024 | | — | (4,403) | — | (4,403) | — |
| Compensation for losses incurred | | (75) | (67) | (26) | (142) | (26) |
| Tax effect of the items adjusted above | | (707) | (168) | 32 | (875) | 332 |
| Non-controlling interest effect of the items listed above | | (202) | (938) | 819 | (1,140) | 793 |
Normalised earnings1 | | 8,731 | 1,832 | (1,252) | 10,563 | (1,460) |
1 Normalised earnings, as defined and reconciled above, is not a measure of performance under IFRS Accounting Standards. As a result, it should not be considered in isolation or as alternatives to any other measure of financial performance presented in accordance with IFRS Accounting Standards
11. Acquisitions
11.1 Metallix Refining (Metallix) business combination
Sibanye-Stillwater concluded the acquisition of Metallix on 4 September 2025 (effective date) by acquiring 100% of the Metallix group of entities for a cash consideration of US$129 million. Metallix operates two processing and recycling operations in Greenville, North Carolina and produces recycled precious metals, including gold, silver and platinum group metals, primarily from industrial waste streams. Metallix has a global customer base, which it services from the United Kingdom and South Korea, in addition to its customers in the United States. Metallix will complement the Group’s US recycling operations in Montana and Reldan in Pennsylvania, adding processing capacity, proprietary technology and knowledge and experience.
Metallix's financial results were consolidated from the effective date. For the four months ended 31 December 2025, Metallix contributed revenue of R1,658 million (US$93 million) and a loss of R334 million (US$19 million) to the Group's results. Ignoring the depreciation of fair value adjustments relating to property, plant and equipment and intangible assets, as well as the fair value adjustment relating to inventory recognised in cost of sales for the four months ended 31 December 2025, Metallix would have contributed approximately R50 million (US$2.8 million) profit. Total revenue and total net loss of the Group for the year ended 31 December 2025 would have been R132,810 million (US$7,428 million) and R4,513 million
Sibanye-Stillwater Operating and financial results | Six months and year ended 31 December 2025 34
(US$252 million) had the acquisition been effective from 1 January 2025, after taking into account amortisation of fair value adjustments to property, plant and equipment, intangible assets and the cost of sales adjustment relating to inventory. In determining these amounts, management assumed that the fair value adjustments that arose on the date of acquisition would be the same if the acquisition occurred on 1 January 2025. The functional currency of Metallix is the US dollar.
The purchase price allocation on the effective date was prepared on a provisional basis in accordance with IFRS 3 Business Combinations (IFRS 3) for, amongst others, inventory, accounts receivable and accounts payable, contingent liabilities, provisions, as well as any resultant deferred tax implications. If new information obtained within one year of the acquisition date, about facts and circumstances that existed at the acquisition date, identifies adjustments to the below amounts or any additional provisions that existed at the date of acquisition, then the accounting for the acquisition will be revised.
Consideration
The fair value of the consideration is as follows:
| | | | | | | | |
Figures in million - SA rand | | |
| | Unaudited |
| | Dec 2025 |
| Consideration paid | | 2,277 |
| Total consideration | | 2,277 |
Metallix acquisition related costs
The Group incurred total acquisition related costs of R175 million for the year ended 31 December 2025 on advisory and legal fees. These costs are recognised as transaction costs in profit or loss during the period in which incurred.
Identified assets acquired and liabilities assumed
The following table summarises the recognised amounts of assets acquired and liabilities assumed at the acquisition date:
| | | | | | | | |
Figures in million - SA rand | | |
| | Unaudited |
| Note | Dec 2025 |
Property, plant and equipment2 | | 653 |
Intangible assets2 | | 162 |
| Other receivables | | 107 |
Inventories2 | | 1,161 |
| Trade and other receivables | | 134 |
Cash and cash equivalents3 | | 383 |
| Other payables | | (38) |
| Deferred tax | | (197) |
| Tax and royalties payable | | (38) |
| Trade and other payables | | (59) |
Fair value of identifiable net assets acquired1 | | 2,268 |
1 Carrying value approximates fair value, except as detailed in footnote 2 below
2 Fair value of assets and liabilities for which the carrying value does not approximate fair value, excluding those not within the IFRS 3 measurement scope, were determined as follows:
•The fair value of property, plant and equipment was determined based on a combination of valuation approaches for specific asset classes. The valuation techniques includes using a market approach (sales comparables)and an indirect cost approach based on indexed historical costs (depreciated replacement cost)
•The fair value of intangible assets was determined based on the relief-from-royalty method which considers the discounted estimated royalty payments that are avoided as a result of ownership as well as an income approach (multi-period excess earnings method) which considers the present value of future net cash flows to value the vendor relationships. A cost approach was used for the valuation of Metallix software as it does not generate cash flows independently
•The fair value of inventories was based on an assessment of net realisable value
3 The transaction results in net cash paid of R1,894 million based on cash and cash equivalents acquired of R383 million and cash consideration paid of R2,277 million
Goodwill
Goodwill arising from the business combination is as follows:
| | | | | | | | |
Figures in million - SA rand | | |
| | Unaudited |
| | Dec 2025 |
| Consideration paid | | 2,277 |
| Fair value of identifiable net assets acquired | | (2,268) |
| Goodwill | | 9 |
The goodwill is attributable to the human capital and the premium paid for the synergies and benefits expected to be derived from the Group's recycling business across the US.
The table below provides a summary of the net cash paid on the acquisition of Metallix during the year ended 31 December 2025:
| | | | | | | | |
Figures in million – SA rand | | |
| | Unaudited |
| | Dec 2025 |
| Metallix acquisition, net of cash acquired | | (1,894) |
| Cash consideration paid | | (2,277) |
| Cash and cash equivalents acquired | | 383 |
Sibanye-Stillwater Operating and financial results | Six months and year ended 31 December 2025 35
11.2 Reldan business combination (revised)
Sibanye-Stillwater successfully concluded the acquisition of the Reldan group of companies (Reldan) on 15 March 2024 by acquiring 100% of the shares and voting interest. Reldan is a recycling group which reprocesses various waste streams to recycle precious metals and is based in Pennsylvania, USA. In addition to Reldan's US operations, it has also established a presence in Mexico and India where it has forged strategic joint ventures with local partners. The acquisition complements the Group's US PGM recycling business in Montana and enhances its exposure to the circular economy. Reldan's financial results were consolidated from the effective date and the functional currency of Reldan is the US dollar.
The purchase price allocation (PPA) for the six months ended 30 June 2024, and year ended 31 December 2024, was prepared on a provisional basis in accordance with IFRS 3. During the 12 month measurement period commencing on the acquisition date, management provisionally revised the initial PPA previously recognised at 30 June 2024 and at 31 December 2024 due to new information obtained in accordance with IFRS 3. For the six months ended 30 June 2025, a final payment amounting to US$5 million (R96 million) was made to the sellers. This relates to a process completed by March 2025, whereby the sellers determined that an additional amount was due to them in terms of the purchase and sales agreement relating to their tax obligations.
The following table summarises the differences from amounts reported at 31 December 2024 due to the final revised PPA:
| | | | | | | | | | | | | | |
Figures in million - SA rand | | | | |
| | Unaudited |
| | Jun 2025 |
| | As previous | As revised | Final payment |
| | | | |
| | | | |
| | | | |
| | | | |
| | | | |
| | | | |
| | | | |
| | | | |
| | | | |
| | | | |
| | | | |
| | | | |
| Fair value of identifiable net assets acquired | | 2,769 | 2,769 | — |
| | | | |
Consideration paid1 | | 2,943 | 3,039 | 96 |
Fair value of NCI put liability2 | | 109 | 109 | — |
| Total consideration | | 3,052 | 3,148 | 96 |
| | | | |
Goodwill3,4,5 | | 283 | 379 | 96 |
1 Cash consideration amounted to US$155.9 million (R2,920 million) paid in 2024. Due to new information obtained, cash consideration paid on the Reldan acquisition increased by US$5 million (R96 million) which was paid by 31 March 2025
2 Related to an NCI put option in respect of an intermediate Reldan holding company which holds an interest in the Indian joint venture operations, and may require the Group to purchase shares from the non-controlling shareholders of Reldan if exercised by the NCI. The put option can be exercised by the NCI between three and five years after the effective date at market price
3 The goodwill is attributable to the human capital and the premium paid for the synergies and benefits expected to be derived from enhancing the Group's recycling business across the US, Mexico and India
4 US tax legislation requires the purchase consideration to be allocated in order to determine future tax deduction. An amount of R1,188 million (US$63 million) is estimated to be deductible for tax purposes in the future
5 The calculation of goodwill, previously amounting to R283 million as revised at 31 December 2024, was finalised at 31 March 2025 based on new information obtained before the 12 months remeasurement period in terms of IFRS 3 was completed. The net adjustments based on the new information obtained resulted in additional goodwill of R96 million recognised in the prior year
12. Borrowings
| | | | | | | | | | | | | | | | | | | | |
Figures in million - SA rand | | Six months ended | Year ended |
| | Unaudited | Unaudited | Unaudited | Unaudited | Audited |
| Notes | Dec 2025 | June 2025 | Dec 2024 | Dec 2025 | Dec 2024 |
Balance at beginning of the period | | 42,411 | 41,687 | 37,316 | 41,687 | 36,618 |
Borrowings acquired on acquisition of subsidiaries | 11 | — | — | — | — | 84 |
| Loans raised | | 4,828 | 3,084 | 6,983 | 7,912 | 8,278 |
| R6.5 billion RCF | | 2,500 | 500 | 1,000 | 3,000 | 1,000 |
| Keliber facility | | 1,983 | 1,868 | 5,618 | 3,851 | 5,618 |
| Other borrowings | | 345 | 716 | 365 | 1,061 | 1,660 |
| Loans repaid | | (3,355) | (1,528) | (2,571) | (4,883) | (3,335) |
| R6.5 billion RCF | | (3,000) | (500) | (2,000) | (3,500) | (2,000) |
| Other borrowings | | (355) | (1,028) | (571) | (1,383) | (1,335) |
| Unwinding of loans recognised at amortised cost | 4 | 304 | 336 | 355 | 640 | 688 |
| Accrued interest | 4 | 871 | 922 | 975 | 1,793 | 1,946 |
| Accrued interest paid | | (1,036) | (1,050) | (993) | (2,086) | (1,947) |
Loss/(gain) on the revised cash flow of the Burnstone Debt | 5 | 1,805 | — | (1,053) | 1,805 | (1,053) |
Borrowing costs capitalised | | 226 | 183 | 64 | 409 | 64 |
(Gain)/loss on foreign exchange differences and foreign currency translation | | (2,797) | (1,223) | 611 | (4,020) | 344 |
Balance at end of the period | | 43,257 | 42,411 | 41,687 | 43,257 | 41,687 |
Borrowings and facilities consist of:
| | | | | | | | | | | | | | | | | | | | |
Figures in million - SA rand | | | | | | |
| | | | Unaudited | Unaudited | Audited |
| | | | Dec 2025 | June 2025 | Dec 2024 |
US$1 billion RCF1 | | | | — | — | — |
R6.5 billion RCF2,3 | | | | 2,500 | 3,000 | 3,000 |
| US$ Convertible Bond | | | | 7,291 | 7,657 | 7,921 |
| 2026 and 2029 Notes | | | | 19,824 | 21,214 | 22,354 |
Burnstone Debt | | | | 4,005 | 2,254 | 2,260 |
Keliber facility | | | | 9,547 | 8,173 | 5,724 |
Other borrowings4 | | | | 90 | 113 | 428 |
| Borrowings | | | | 43,257 | 42,411 | 41,687 |
Current portion of borrowings5 | | | | (11,402) | (275) | (552) |
| Non-current borrowings | | | | 31,855 | 42,136 | 41,135 |
1 The facility is undrawn at 31 December 2025 and at the date of this report
Sibanye-Stillwater Operating and financial results | Six months and year ended 31 December 2025 36
2 The R6.5 billion RCF is affected by the IBOR reform amendments to IFRS Accounting Standards, which came into effect on 1 January 2021. The R6.5 billion RCF is linked to the JIBAR for the foreseeable future and will transition to a new interest rate ((South African Rand Overnight Index Average) (ZARONIA)) prior to the date on which the JIBAR will no longer be available for use. At 31 December 2025, there is no significant impact on the Group as a result of IBOR reform and the Group will assess any potential impact when the facility is transitioned to the ZARONIA
3 During H2 2025, all facility lenders have approved the first one-year extension resulting in the R6.5 billion RCF facility, now maturing in August 2028
4 Other borrowings consist mainly of overnight facilities, working capital and overdraft borrowings facilities at Keliber, Sandouville, Century, Reldan and Metallix
5 This amount includes the 2026 Notes which matures November 2026 (R11,185 million). The Group has commenced with its plan to the refinance these Notes, which are expected to conclude before 30 June 2026
12.1 Capital management
Debt maturity
The following are contractually due, undiscounted cash flows resulting from maturities of borrowings, including interest payments:
| | | | | | | | | | | | | | | | | | | | |
Figures in million - SA rand | | | | | | |
| Total | Within one year | Between one and two years | Between two and three years | Between three and five years | After five years |
| 31 December 2025 | | | | | | |
| Capital | | | | | | |
| R6.5 billion RCF | 2,500 | — | — | 2,500 | — | — |
| 2026 and 2029 Notes | 19,884 | 11,185 | — | — | 8,699 | — |
| US$ Convertible Bond | 8,285 | — | — | 8,285 | — | — |
| Burnstone Debt | 2,707 | — | — | — | 129 | 2,578 |
| Keliber facility | 9,720 | — | 700 | 1,868 | 4,167 | 2,985 |
| Other borrowings | 99 | 14 | 12 | 12 | 26 | 35 |
Interest1 | 15,553 | 1,734 | 1,340 | 1,184 | 1,609 | 9,686 |
1 The interest amount after five years relates mainly to interest payments in respect of certain facilities of the Burnstone debt, which are not subject to fixed repayments. Repayments relate largely to interest charges according to the latest life of mine model
Net debt to adjusted EBITDA
| | | | | | | | | | | | | | | | | | | | |
Figures in million - SA rand | | | | Rolling 12 months |
| | | | Unaudited | Unaudited | Audited |
| | | | Dec 2025 | June 2025 | Dec 2024 |
Adjusted borrowings1 | | | | 39,252 | 40,157 | 39,426 |
Adjusted cash and cash equivalents2 | | | | 17,129 | 20,966 | 16,002 |
Net debt3 | | | | 22,123 | 19,191 | 23,424 |
Adjusted EBITDA4 | | | | 37,800 | 21,513 | 13,088 |
Net debt to adjusted EBITDA (ratio)5 | | | | 0.59 | 0.89 | 1.79 |
1Adjusted borrowings are only those borrowings that have recourse to Sibanye-Stillwater. Borrowings are therefore adjusted to exclude the Burnstone debt
2Cash and cash equivalents exclude cash of Burnstone
3Net debt represents borrowings and bank overdraft less cash and cash equivalents. Borrowings are only those borrowings that have recourse to Sibanye-Stillwater and, therefore, excludes the Burnstone debt. Net debt excludes cash of Burnstone
4See note 20
5Net debt to adjusted EBITDA ratio is a pro forma performance measure and is defined as net debt as of the end of a reporting period divided by adjusted EBITDA of the 12 months ended on the same reporting date. Net debt to adjusted EBITDA is not a measure of performance under IFRS Accounting Standards. As a result, it should not be considered in isolation or as alternatives to any other measure of financial performance presented in accordance with IFRS Accounting Standards
13. Environmental rehabilitation obligation and other provisions
The following table summarises the environmental rehabilitation obligation and other provisions of the Group:
| | | | | | | | | | | | | | |
Figures in million - SA rand | | | | |
| | Unaudited | Unaudited | Audited |
| | Dec 2025 | June 2025 | Dec 2024 |
Environmental rehabilitation obligation1,2 | | 14,000 | 12,034 | 11,805 |
| Other provisions | | 278 | 320 | 444 |
| Balance at the end of the period | | 14,278 | 12,354 | 12,249 |
| Current portion of environmental rehabilitation obligation and other provisions | | (161) | (203) | (327) |
Non-current portion of environmental rehabilitation obligation and other provisions | | 14,117 | 12,151 | 11,922 |
1 Environmental rehabilitation obligations amounting to R480 million at 31 December 2025 (30 June 2025: R470 million, 31 December 2024: R451 million) was classified as liabilities associated with assets held for sale (see note 17)
2 The movement in the environmental rehabilitation obligation is mainly due to the change in key assumptions as illustrated in the table below which includes a decrease in the discount rates from 31 December 2024. The movement is also due to extensive planning at Sandouville for post-closure upon the Sandouville operation being placed in care-and-maintenance and ultimate closure of the plant. The key assumptions included in the environmental rehabilitation calculation at 31 December 2025 are as follows:
| | | | | | | | | | | | | | | | | | | | |
| Inflation rate (%) | Discount rate (%) | Discount period (years) |
| 2025 | 2024 | 2025 | 2024 | 2025 | 2024 |
SA gold operations | 6.5 | | 7.0 | 6.3 - 9.1 | 8.3 - 11.1 | 1 - 26 | 1 - 25 |
SA PGM operations | 6.5 | | 7.0 | 6.3 - 8.9 | 8.3 - 11.1 | 1 - 45 | 1 - 45 |
US PGM operations | 3.5 | | 3.5 | 4.8 | 4.8 | 31 - 66 | 25 - 35 |
European operations | 2.5 | | 2.5 | 2.1 - 3.8 | 2.3 - 3.0 | 1 - 26 | 2 - 23 |
Australian operations | 2.5 | | 2.5 | 4.3 | 3.9 | 1 - 18 | 5 - 19 |
Sibanye-Stillwater Operating and financial results | Six months and year ended 31 December 2025 37
Appian Capital legal settlement
On 26 October 2021, Sibanye-Stillwater entered into share purchase agreements (the Atlantic Nickel SPA and the MVV SPA, respectively (together, the SPAs)) to acquire the Santa Rita nickel mine and Serrote copper mine (together, the Assets) from affiliates of Appian Capital Advisory LLP (Appian). On 9 November 2021, a geotechnical event occurred at the Santa Rita Mine. After becoming aware of the geotechnical event, Sibanye-Stillwater assessed the event and its effect and concluded that the event was and was reasonably expected to be material and adverse to the business, financial condition, results of operations, the properties, assets, liabilities or operations of the Santa Rita Mine. Sibanye-Stillwater therefore considered that a condition to closing under the Atlantic Nickel SPA had not been satisfied. Accordingly, Sibanye-Stillwater gave notice of termination of the Atlantic Nickel SPA on 24 January 2022. As the MVV SPA was conditional on the closing of the Atlantic Nickel SPA, Sibanye-Stillwater also gave notice of termination of the MVV SPA on the same day. On 3 February 2022, Appian sent a letter to Sibanye-Stillwater indicating that it was terminating the SPAs by reason of Sibanye-Stillwater’s wrongful repudiation and/or renunciation of the SPAs.
Legal proceedings commenced in 2024. The first phase of the proceedings related to whether the geotechnical event was, or could reasonably be expected to be, material and adverse (the Liability Trial). In a judgment handed down on 10 October 2024, the Court ruled that the geotechnical event was not, and was not reasonably expected to be, material and adverse, such that Sibanye-Stillwater was not entitled to terminate the SPAs. However, the Court dismissed Appian's claim of wilful misconduct, ruling that the management of Sibanye-Stillwater genuinely believed that it was entitled to terminate the SPAs in the best interests of Sibanye-Stillwater.
The second phase of the proceedings was scheduled to proceed to trial in November 2025 (the Quantum Trial), at which the Court would have determined the damages that Sibanye-Stillwater may be required to pay to Appian. On 10 November 2025, before the Quantum Trial commenced, Sibanye-Stillwater and Appian agreed a commercial settlement of the dispute for a total payment of US$215 million (R3,565 million) (including legal fees). The Group recognised the settlement of the dispute under transaction and project costs on the income statement and included it in Group corporate on the segment report. Some of the legal fees were already settled after the Liability Trial, with the remaining amount settled on 9 December 2025, after South African Reserve Bank approval.
14. Cash-settled share-based payment obligations
The following table summarises the share-based payment obligations of the Group:
| | | | | | | | | | | | | | |
Figures in million - SA rand | | | | |
| | Unaudited | Unaudited | Audited |
| | Dec 2025 | June 2025 | Dec 2024 |
| Cash-settled share-based payment — Rustenburg operation B-BBEE transaction | | 1,453 | 1,385 | 1,286 |
| Cash-settled share-based payment — Marikana B-BBEE transaction | | 494 | 273 | 241 |
| Cash-settled share-based payment — Employee incentive scheme | | 1,692 | 798 | 280 |
| Balance at the end of the period | | 3,639 | 2,456 | 1,807 |
| Current portion of cash-settled share-based payment obligations | | (935) | (457) | (121) |
Non-current portion of cash-settled share-based payment obligations | | 2,704 | 1,999 | 1,686 |
15. Other payables
| | | | | | | | | | | | | | |
Figures in million - SA rand | | |
| | Unaudited | Unaudited | Revised - unaudited |
| | Dec 2025 | June 2025 | Dec 2024 |
| Marikana dividend obligation | | 810 | 766 | 730 |
| Keliber dividend obligation | | — | 298 | 388 |
| Metals borrowings liability | | 1,667 | 1,092 | 855 |
| NCI put liability | | 96 | 103 | 109 |
| Gold and zinc hedge derivative liability | | 468 | 729 | 494 |
| Other non-current payables | | 640 | 1,015 | 969 |
| Other payables | | 3,681 | 4,003 | 3,545 |
| Current portion of other payables | | (2,279) | (2,274) | (1,730) |
| Non-current other payables | | 1,402 | 1,729 | 1,815 |
Metals borrowings liability
The metals borrowings liability relates to precious metals that are borrowed and repaid by the Reldan recycling operations (Pennsylvania site) under a consignment arrangement with a financial institution for working capital cash management purposes, and was acquired by the Group as part of the acquisition of Reldan in 2024. The liability is measured at fair value according to the market borrowing position, with fair value movements recognised in profit or loss.
| | | | | | | | | | | | | | | | | | | | |
Figures in million - SA rand | | Six months ended | Year ended |
| | Unaudited | Unaudited | Unaudited | Unaudited | Audited |
| | Dec 2025 | June 2025 | Dec 2024 | Dec 2025 | Dec 2024 |
| Balance at the beginning of the period | | 1,092 | 855 | — | 855 | — |
| Initial recognition on acquisition of subsidiary | | — | — | 956 | — | 956 |
| Net cash advances/metal credits received | | 4,733 | 3,346 | 4,337 | 8,079 | 4,337 |
| Settlements through delivery of metals | | (4,519) | (3,126) | (4,308) | (7,645) | (4,308) |
| Loss/(gain) on commodity price movements | | 461 | 73 | (136) | 534 | (136) |
| Foreign currency translation reserve | | (100) | (56) | 6 | (156) | 6 |
| Balance at end of the period | | 1,667 | 1,092 | 855 | 1,667 | 855 |
Sibanye-Stillwater Operating and financial results | Six months and year ended 31 December 2025 38
16. Deferred revenue
The table below summarises the total deferred revenue liability of the Group:
| | | | | | | | | | | | | | |
Figures in million - SA rand | | |
| | Unaudited | Unaudited | Audited |
| | Dec 2025 | June 2025 | Dec 2024 |
| Wheaton stream | | 6,174 | 6,131 | 6,164 |
| Franco-Nevada stream | | 8,151 | 8,730 | — |
Gold prepay | | 819 | 1,233 | 1,626 |
Chrome prepay | | — | — | 733 |
| Century deferred proceeds | | 101 | — | — |
| Reldan deferred proceeds | | 117 | 191 | 120 |
| Total deferred revenue at the end of the period | | 15,362 | 16,285 | 8,643 |
| Current portion of deferred revenue | | (1,204) | (1,119) | (1,660) |
| Non-current portion of deferred revenue | | 14,158 | 15,166 | 6,983 |
On 19 December 2024 Sibanye-Stillwater entered into a US$500 million streaming agreement with Franco-Nevada in exchange for the sale of gold and platinum streams with reference to the Marikana, Kroondal, and Rustenburg operations. The last condition precedent was completed during February 2025, after which US$500 million (R9,215 million) upfront cash payment cash was received on 28 February 2025.
The key inputs and assumptions of the Franco-Nevada stream are as follows:
| | | | | | | | |
| Key input | Estimate at period end | Further information |
| Estimated financing rate over life of the arrangement | 8.76% | Rate applied at initial recognition to discount the platinum and gold stream, based on the expected gold and platinum to be delivered (including a determined number of resources). |
| Remaining life of stream | Marikana - 86 years Rustenburg - 106 years
| The life of the stream is based on the approved life-of-mine for Marikana, Rustenburg (excluding Kroondal) and Kroondal plus a determined number of resources. The resources included were determined based on an evaluation of specific mining areas and possible projects at the mining areas. |
| Platinum entitlement percentage | 1% of platinum production | 1% of refined platinum ounces up to delivery of 48,000 ounces, after which it increases to 2.1% of refined platinum ounces up to delivery of 294,000 ounces in aggregate, after which no further platinum is provided. |
| Gold entitlement percentage | 1.1% of 4E PGM production | 1.1% of 4E PGM ounces produced up to delivery of 87,500 ounces of refined gold, after which it decreases to 0.75% of 4E PGM ounces produced up to delivery of 237,000 ounces of refined gold in aggregate, after which it is 80% of refined gold production.
|
| Monthly cash percentage | 5% of spot gold and spot platinum price | The gold cash payment is 5% of the spot gold price until 237,000 refined ounces is delivered after which it increases to 10%. Platinum is fixed at 5% of the spot platinum price over the life of the stream. |
| Allocation of stream between commodities over the expected life of the arrangement | Gold - 69%
Platinum - 31% | The US$500 million prepayment was allocated between gold and platinum at inception of the stream based on forward commodity consensus prices. |
| Covenants reduction date | 28 February 2034 | The covenant reduction date is the date on which the aggregate gold and platinum deliveries under the terms of the stream exceeds US$600 million. Once the covenant reduction date is reached, certain limitations on incurring debt and encumbrances on assets fall away and instances where the production payments are limited to a nominal fixed amount per ounce no longer apply. |
The table below summarises the Franco-Nevada stream:
| | | | | | | | | | | | | | | | | | | | |
Figures in million - SA rand | | Six months ended | Year ended |
| | Unaudited | Unaudited | Unaudited | Unaudited | Audited |
| | Dec 2025 | June 2025 | Dec 2024 | Dec 2025 | Dec 2024 |
Balance at beginning of the period | | 8,730 | — | — | — | — |
Deferred revenue advance received | | — | 9,215 | — | 9,215 | — |
Interest charge | | 373 | 327 | — | 700 | — |
Deferred revenue recognised during the period | | (363) | (488) | — | (851) | — |
| Foreign currency translation | | (589) | (324) | — | (913) | — |
Balance at the end of the period | | 8,151 | 8,730 | — | 8,151 | — |
Current portion of deferred revenue | | (168) | (77) | — | (168) | — |
Non-current portion of deferred revenue | | 7,983 | 8,653 | — | 7,983 | — |
17. Assets and associated liabilities classified as held for sale
During the six months ended 30 June 2025, following the Group's decision to withdraw from the Rhyolite Ridge joint venture agreement, it was decided to sell its investment in ioneer Limited (ioneer). The Group held 145,862,742 shares in ioneer representing 6.19% of their share capital. At 30 June 2025, the investment (R164 million) was classified as held for sale in accordance with the requirements of IFRS 5 Non-current Assets Held for Sale and Discontinued Operations (IFRS 5). The sale of ioneer was effective during H2 2025 with the proceeds on the sale amounting to R186 million.
During the six months ended 30 June 2025, DRDGOLD decided to sell its 50.25% share in Stellar, a renewable energy company developing a solar plant in Limpopo, South Africa. The decision was based on DRDGOLD's decision to focus on its core operating activities. At 30 June 2025, DRDGOLD's investment in Stellar was classified as held for sale in accordance with the requirements of IFRS 5. Property, plant and equipment and
Sibanye-Stillwater Operating and financial results | Six months and year ended 31 December 2025 39
capital prepayments of R105 million and other net assets of R6 million are included in assets held for sale at 30 June 2025. The sale of Stellar was effective during H2 2025 with the proceeds on the sale amounting to R132 million.
The transaction to sell the Beatrix 4 shaft, which forms part of the Beatrix gold operations and includes the Beisa uranium project, to Neo Energy Metals Plc. (Neo Energy) for a total transaction consideration of R500 million, comprising R250 million in cash and R250 million in newly issued shares in Neo Energy was still subject to certain outstanding conditions precedent at the reporting date. The assets and liabilities associated with the transaction remained classified as held for sale in accordance with the requirements of IFRS 5. Neo Energy will assume responsibility for all Beatrix 4 shaft rehabilitation and environmental liabilities, which amounts to a carrying value of R480 million at 31 December 2025. Property, plant and equipment of R30 million relating to the Beatrix 4 shaft disposal is included in assets held for sale at 31 December 2025.
The assets presented as assets held for sale were measured at the lower of the carrying values and fair value less cost to sell.
18. Fair value of financial assets and financial liabilities, and risk management
18.1 Measurement of fair value
The Group uses the following hierarchy for determining and disclosing the fair value of financial instruments:
•Level 1: unadjusted quoted prices in active markets for identical assets or liabilities
•Level 2: inputs other than quoted prices in level 1 that are observable for the asset or liability, either directly (as prices) or indirectly (derived from prices)
•Level 3: inputs for the asset or liability that are not based on observable market data (unobservable inputs)
The following table sets out the Group’s significant financial instruments measured at fair value by level within the fair value hierarchy:
| | | | | | | | | | | | | | | | | | | | | | | | | | | | | |
Figures in million - SA rand | | | | | | | | | |
| Unaudited | Unaudited | Audited |
| Dec 2025 | June 2025 | Dec 2024 |
| Level 1 | Level 2 | Level 3 | Level 1 | Level 2 | Level 3 | Level 1 | Level 2 | Level 3 |
| Financial assets measured at fair value | | | | | | | | | |
Environmental rehabilitation obligation funds1 | — | 3,915 | — | — | 3,878 | — | — | 3,750 | — |
Trade receivables — PGM concentrate sales2 | — | 1,286 | — | — | 1,029 | — | — | 965 | — |
Trade receivables — Zinc provisional price sales2 | — | 84 | — | — | 241 | — | — | 356 | — |
Other investments3 | 1,968 | 752 | 1,287 | 1,307 | 630 | 1,223 | 1,517 | 504 | 1,151 |
Zinc hedge contracts4 | — | — | — | — | 19 | — | — | — | — |
Financial liabilities measured at fair value | | | | | | | | | |
Gold hedge contracts4 | — | 453 | — | — | 729 | — | — | 282 | — |
Zinc hedge contracts4 | — | 15 | — | — | — | — | — | 208 | — |
Other hedge contracts5 | — | 80 | — | — | — | — | — | — | — |
Metals borrowings liability6 | 1,667 | — | — | 1,029 | — | — | 855 | — | — |
1 Environmental rehabilitation obligation funds presented in the condensed consolidated statement of financial position, comprise a fixed income portfolio of bonds, rehabilitation policies, investment in a cell captive as well as fixed and notice deposits. The environmental rehabilitation obligation funds, not measured at amortised cost, are stated at fair value based on the nature of the fund’s investments. For investments measured at fair value classified as level 2, the fair value is determined through valuation techniques that include inputs other than quoted prices in level 1 that are observable for the asset, either directly or indirectly. The valuation techniques applied make reference to the net asset value of the underlying assets in the relevant policy or cell captive, adjusted for any entity-specific risk. These underlying assets comprise predominantly money-market and similar highly liquid investments for which the carrying values approximate fair value
2 The fair value for trade receivables measured at fair value through profit or loss are determined based on ruling market prices, volatilities and interest rates
3 The fair values of listed investments are based on the quoted prices available from the relevant stock exchanges. The carrying amounts of other short-term investment products with short maturity dates approximate fair value. The fair values of non-listed investments are determined through valuation techniques that include inputs that are not based on observable market data. These inputs include price/book ratios as well as marketability and minority shareholding discounts which are impacted by the size of the shareholding. The level 3 balance consists primarily of an investment in Verkor, the value of which is supported by a range of values determined through multi-criteria valuation analysis which includes valuation techniques such as an income valuation approach which indicates the value of Verkor based on its expected future cash flows and trading multiples. These valuation techniques use several key assumptions, including discount rate (8.8%), growth rate (2.5%) and EV multiples. The fair value estimate of Verkor is sensitive to changes in the key assumptions, for example, increases in the market related discount rate and decreases in the growth rate and EV multiples would decrease the fair value if all other inputs remain unchanged. The extent of the fair value changes would depend on how inputs change in relation to each other. The difference between other investments in the statement of financial position and the table above, relates to investments measured at amortised cost, with carrying amounts that approximate fair values
4 The fair value of the gold hedges are determined using a Monte Carlo simulation model based on market forward prices, volatilities and interest rates. Since the SA gold hedge contracts ceased in December 2025, majority of the gold hedge value relates to the contract liability at 31 December 2025, rather than a valuation of existing hedge contracts. The fair value of the zinc hedge is determined by using a Monte Carlo simulation model based on historical zinc market spot and forward prices, volatilities and interest rates and the relevant foreign exchange forward curve data
5 Consists of platinum, palladium and silver hedge contracts and the fair value is determined using a Monte Carlo simulation model based on market forward prices, volatilities and interest rates
6 The fair value of the metals borrowing liability at the reporting date was calculated based on the spot prices of the relevant metals owed to the financial institution
The table below summarises the movement in financial assets and financial liabilities classified as level 3 in the table above:
| | | | | | | | | | | | | | | | | | | | |
Figures in million - SA rand | | Six months ended | Year ended |
| | Unaudited | Unaudited | Unaudited | Unaudited | Audited |
| | Dec 2025 | June 2025 | Dec 2024 | Dec 2025 | Dec 2024 |
Financial assets measured at fair value | | | | | | |
Balance at the beginning of the period | | 1,223 | 1,151 | 1,162 | 1,151 | 1,233 |
Fair value movement recognised in profit or loss | | (34) | 39 | (11) | 5 | (113) |
Fair value movement recognised in other comprehensive income | | 98 | 33 | — | 131 | 31 |
Balance at the end of the period | | 1,287 | 1,223 | 1,151 | 1,287 | 1,151 |
| | | | | | |
Financial liabilities measured at fair value | | | | | | |
Balance at the beginning of the period | | — | — | 1,245 | — | 1,570 |
Fair value movement recognised in profit or loss | | — | — | (270) | — | (396) |
Payments made | | — | — | (975) | — | (1,174) |
Balance at the end of the period | | — | — | — | — | — |
Sibanye-Stillwater Operating and financial results | Six months and year ended 31 December 2025 40
Fair value of financial instruments
The table below shows the fair value and carrying amount of financial instruments where the carrying amount does not approximate fair value:
| | | | | | | | | | | | | | |
Figures in million - SA rand | | | | |
| | Fair Value |
| Carrying value | Level 1 | Level 2 | Level 3 |
| 31 December 2025 (Unaudited) | | | | |
2026 and 2029 Notes1 | 19,824 | 19,367 | — | — |
Burnstone Debt2 | 4,005 | — | — | 4,395 |
US$ Convertible Bond3 | 7,291 | 23,003 | — | — |
Marikana dividend obligation4 | 810 | — | — | 777 |
Keliber dividend obligation4 | — | — | — | — |
| Total | 31,930 | 42,370 | — | 5,172 |
| 30 June 2025 (Unaudited) | | | | |
2026 and 2029 Notes1 | 21,214 | 20,062 | — | — |
Burnstone Debt2 | 2,254 | — | — | 2,162 |
US$ Convertible Bond3 | 7,657 | 13,559 | — | — |
Marikana dividend obligation4 | 766 | — | — | 704 |
Keliber dividend obligation4 | 298 | — | — | 341 |
| Total | 32,189 | 33,621 | — | 3,207 |
| 31 December 2024 (Audited) | | | | |
2026 and 2029 Notes1 | 22,354 | 20,327 | — | — |
Burnstone Debt2 | 2,260 | — | — | 2,235 |
US$ Convertible Bond3 | 7,921 | 8,731 | — | — |
Marikana dividend obligation4 | 730 | — | — | 559 |
Keliber dividend obligation4 | 388 | — | — | 532 |
| Total | 33,653 | 29,058 | — | 3,326 |
1 The fair value is based on the quoted market prices of the notes
2 The fair value of the Burnstone Debt has been derived from discounted cash flow models. These models use several key assumptions, including estimates of future sales volumes, gold prices, operating costs, capital expenditure and discount rate. The Burnstone long-term gold price at 31 December 2025 was R1,670,512/kg (30 June 2025 and 31 December 2024 was R1,189,493/kg) and the discount rate applied was 8.69% (31 December 2024: 9.55%, 30 June 2025: 9.77%). The fair value estimate is sensitive to changes in the key assumptions, for example, increases in the market related discount rate would decrease the fair value if all other inputs remain unchanged. The extent of the fair value changes would depend on how inputs change in relation to each other
3 The fair value at 31 December 2025 represents the quoted price of the US$ Convertible Bond. The fair value of the amortised cost component amounts to R7,990 million (level 2) at 31 December 2025 (30 June 2025: R7,818 million, 31 December 2024: R8,231 million) and is calculated by deducting the fair value of the share conversion option from the quoted price. Following the transfer of the derivative component to equity, it is no longer remeasured to fair value through profit or loss
4 The fair value was calculated by applying a market-related discount rate to expected future cash flows available for dividends
18.2 Risk management activities
Liquidity risk: working capital and going concern assessment
For the year ended 31 December 2025, the Group incurred a loss of R4,739 million (31 December 2024: R5,710 million). As at 31 December 2025 the Group’s current assets exceeded its current liabilities by R26,595 million (31 December 2024: R27,458 million) and the Group’s total assets exceeded its total liabilities by R44,167 million (31 December 2024: R48,289 million). During the year ended 31 December 2025 the Group generated net cash from operating activities of R21,407 million (31 December 2024: R10,113 million).
The Group has committed undrawn debt facilities of R21,255 million at 31 December 2025 (31 December 2024: R26,743 million) and cash balances of R17,178 million (31 December 2024: R16,049 million). The Group’s leverage ratio (net debt to adjusted EBITDA) as at 31 December 2025 was 0.59:1 (31 December 2024 was 1.79:1) and its interest coverage ratio (adjusted EBITDA to net finance charges) was 25.4 (31 December 2024 66:1). The maximum permitted leverage ratio up to 31 December 2025 is 3.0:1 and thereafter 2.5:1. The maximum required interest coverage ratio up to 31 December 2025 is 3.5:1 and 4.0:1 thereafter.
Included under current borrowings on the consolidated statement of financial position is the 2026 Notes, amount to R11,185 million which matures by November 2026. The Group has commenced its planning for the refinancing of these Notes and is expecting to conclude the process before 30 June 2026. In addition, at the date of approving these condensed consolidated financial statements for issue, the US$1 billion RCF and R6.5 billion RCF were totally undrawn. There were no significant events which had a significant negative impact on the Group’s strong liquidity position.
Management believes that the cash forecasted to be generated by operations, cash on hand, the committed unutilised debt facilities as well as its funding plans will enable the Group to continue to meet its obligations as they fall due for a period of at least eighteen months after the reporting date. The condensed consolidated financial statements for the year ended 31 December 2025 have therefore been prepared on a going concern basis.
19. Section 45X Advance Manufacturing Production Credit
The US PGM operations qualifies for an Advanced Manufacturing Production credit amount, equal to 10 percent of the costs incurred with respect to production of certain qualifying critical minerals under the Inflation Reduction Act (IRA) in the US, more specifically the Section 45X Advanced Manufacturing Production (“AMP”) credit. Due to the fact that the US PGM operations outsources the purification of platinum, palladium and rhodium to an unrelated third party refinery, it is required that the US PGM operations must enter into an agreement with the third party that identifies the US PGM operations as the sole party that may claim the credit and both the third party and the US PGM operations signs a certification statement reflecting this agreement.
During the six months ended 30 June 2025, the certification statements relating to the 31 December 2023 and 31 December 2024 financial years were signed by the US PGM operations and the third party refinery. The refining agreement was also subsequently amended to address the certification for the remainder of the contract period. Accordingly, R2,472 million (US$139 million) and R1,931 million (US$109 million) were recognised as income during the year ended 31 December 2025, but in respect of the 2023 and 2024 Section 45X credits, respectively. Section 45X credit income amounting to R1,482 million (US$85 million) was recognised in respect of the year ended 31 December 2025 (R649 million (US$36 million) recognised for the six months ended 30 June 2025). The amounts were recognised as a credit to cost of sales. The related receivable is included in other receivables on the consolidated statement of financial position. The Section 45X credits for 2023 amounted to R1,245 million (US$70 million) and R1,227 million (US$69 million) for the underground mining operations and recycling operations, respectively, and the Section 45X credits for 2024 amounted to R1,220 million (US$69 million) and R711 million (US$40 million) for the underground mining operations and recycling operations, respectively. The Section 45X credits for the year ended 31 December 2025 amounted to R801 million (US$46 million) and R681 million
Sibanye-Stillwater Operating and financial results | Six months and year ended 31 December 2025 41
(US$39 million) for the underground operations and recycling operations, respectively (six months ended 30 June 2025 amounted to R360 million (US$20 million) and R289 million (US$16 million) for the underground operations and recycling operations, respectively).
20. Reconciliation of profit before royalties, carbon tax and tax to adjusted EBITDA
Reconciliation of profit before royalties, carbon tax and tax to adjusted EBITDA
| | | | | | | | | | | | | | | | | | | | |
Figures in million - SA rand | | Six months ended | Year ended |
| | Unaudited | Unaudited | Unaudited | Unaudited | Audited |
| | Dec 2025 | June 2025 | Dec 2024 | Dec 2025 | Dec 2024 |
| Profit/(loss) before royalties, carbon tax and tax | | 2,936 | (2,202) | 1,915 | 734 | (3,669) |
| Adjusted for: | | | | | | |
| Amortisation and depreciation | | 5,149 | 4,218 | 4,676 | 9,367 | 8,810 |
| Interest income | | (882) | (686) | (588) | (1,568) | (1,337) |
| Finance expense | | 2,447 | 2,553 | 2,279 | 5,000 | 4,571 |
| Share-based payments | | 1,499 | 615 | 114 | 2,114 | 251 |
| Loss/(gain) on financial instruments | | 3,403 | 391 | (3,937) | 3,794 | (5,433) |
Loss/(gain) on foreign exchange differences | | 6 | (161) | 202 | (155) | 215 |
| Share of results of equity-accounted investees after tax | | (769) | 432 | (76) | (337) | (212) |
Change in estimate of environmental rehabilitation obligation, and right of recovery receivable and payable | | 593 | (98) | 209 | 495 | 447 |
| Loss/(gain) on disposal of property, plant and equipment | | 30 | (16) | (20) | 14 | (55) |
| Impairments and reversal of impairments | | 4,341 | 9,666 | 1,549 | 14,007 | 9,173 |
| Onerous contract provision | | — | (124) | (493) | (124) | (817) |
| Gain on acquisition | | — | — | — | — | — |
| Restructuring costs | | 5 | 242 | 250 | 247 | 550 |
| Transaction and project costs | | 4,125 | 418 | 505 | 4,543 | 851 |
| Lease payments | | (147) | (120) | (108) | (267) | (244) |
| Occupational healthcare obligation expense/(gain) | | 46 | 3 | (77) | 49 | (76) |
| Compensation for losses incurred | | (75) | (67) | (26) | (142) | (26) |
| Corporate leadership costs | | 41 | 9 | — | 50 | — |
| Provision for community costs post closure | | — | — | — | — | 24 |
| Cyber security costs | | — | — | 67 | — | 67 |
| Gain on assets held for sale | | (16) | — | — | (16) | — |
| Gain/increase in equity-accounted investment | | (5) | — | (1) | (5) | (2) |
Adjusted EBITDA1 | | 22,727 | 15,073 | 6,440 | 37,800 | 13,088 |
1The adjusted earnings before interest, taxes, depreciation and amortisation (EBITDA) calculation is based on the definitions included in the facility agreements for compliance with the debt covenant formula, except for impact of new accounting standards, project finance subsidiaries (Burnstone) and acquisitions, where the facility agreements allow the results from the acquired operations to be annualised. Adjusted EBITDA, as reconciled above, is not a measure of performance under IFRS Accounting Standards. As a result, it should not be considered in isolation or as alternatives to any other measure of financial performance and liquidity presented in accordance with IFRS Accounting Standards
21. Events after the reporting period
There were no significant events which occurred after 31 December 2025 up to the date on which the condensed consolidated financial statements for the six months and year ended 31 December 2025 were authorised for issue.
Sibanye-Stillwater Operating and financial results | Six months and year ended 31 December 2025 42
ALL-IN COSTS – SIX MONTHS US and SA PGM operations
Figures are in rand millions unless otherwise stated
| | | | | | | | | | | | | | | | | | | | | | | | | | | | | |
| | | | |
| | | US PGM operations1 | Total SA PGM operations2 | Rustenburg including Kroondal | Marikana2 | Plat Mile | Mimosa | Corporate |
Cost of sales, before amortisation and depreciation3 | | Dec 2025 | 2,217 | | 23,565 | | 11,690 | | 11,387 | | 488 | | 1,618 | | (1,618) | |
| | Jun 2025 | (70) | | 19,650 | | 10,232 | | 8,981 | | 437 | | 913 | | (913) | |
| | Dec 2024 | 4,723 | | 21,340 | | 9,899 | | 11,004 | | 437 | | 1,223 | | (1,223) | |
Section 45X credit adjustment7 | | Dec 2025 | — | | — | | — | | — | | — | | — | | — | |
| | Jun 2025 | 2,466 | | — | | — | | — | | — | | — | | — | |
| | Dec 2024 | (699) | | — | | — | | — | | — | | — | | — | |
| Royalties | | Dec 2025 | — | | 656 | | 578 | | 78 | | — | | 110 | | (110) | |
| | Jun 2025 | — | | 110 | | 79 | | 31 | | — | | 45 | | (45) | |
| | Dec 2024 | — | | 93 | | 33 | | 60 | | — | | 68 | | (68) | |
| Carbon tax | | Dec 2025 | — | | 2 | | — | | 2 | | — | | — | | — | |
| | Jun 2025 | — | | 1 | | — | | 1 | | — | | — | | — | |
| | Dec 2024 | — | | — | | — | | — | | — | | — | | — | |
| Community costs | | Dec 2025 | — | | 145 | | 47 | | 99 | | — | | — | | — | |
| | Jun 2025 | — | | 119 | | 41 | | 78 | | — | | — | | — | |
| | Dec 2024 | — | | 209 | | 65 | | 144 | | — | | — | | — | |
| Inventory change | | Dec 2025 | 231 | | 1,138 | | 1,378 | | (240) | | — | | (295) | | 295 | |
| | Jun 2025 | 325 | | 1,574 | | 1,314 | | 260 | | — | | 339 | | (339) | |
| | Dec 2024 | (632) | | 893 | | 2,068 | | (1,175) | | — | | 6 | | (6) | |
Share-based payments4 | | Dec 2025 | 53 | | 126 | | 65 | | 61 | | — | | — | | — | |
| | Jun 2025 | (14) | | 30 | | 14 | | 14 | | 1 | | — | | — | |
| | Dec 2024 | 54 | | 116 | | 61 | | 51 | | — | | — | | — | |
Rehabilitation interest and amortisation5 | | Dec 2025 | 16 | | 102 | | 84 | | 18 | | — | | 4 | | (4) | |
| | Jun 2025 | 17 | | 104 | | 75 | | 29 | | — | | 4 | | (4) | |
| | Dec 2024 | 22 | | 42 | | 39 | | 3 | | — | | 4 | | (4) | |
| Leases | | Dec 2025 | — | | 25 | | 10 | | 14 | | 1 | | — | | — | |
| | Jun 2025 | 1 | | 25 | | 9 | | 15 | | 1 | | — | | — | |
| | Dec 2024 | 2 | | 26 | | 9 | | 16 | | 1 | | — | | — | |
| Ore reserve development | | Dec 2025 | 598 | | 1,248 | | 397 | | 851 | | — | | — | | — | |
| | Jun 2025 | 614 | | 1,095 | | 349 | | 746 | | — | | — | | — | |
| | Dec 2024 | 701 | | 1,297 | | 383 | | 914 | | — | | — | | — | |
| Sustaining capital expenditure | | Dec 2025 | 242 | | 1,746 | | 930 | | 792 | | 24 | | 198 | | (198) | |
| | Jun 2025 | 121 | | 1,120 | | 549 | | 561 | | 10 | | 160 | | (160) | |
| | Dec 2024 | 220 | | 1,637 | | 870 | | 736 | | 31 | | 256 | | (256) | |
| Less: By-product credit | | Dec 2025 | (381) | | (6,454) | | (3,220) | | (3,049) | | (185) | | (252) | | 252 | |
| | Jun 2025 | (327) | | (5,258) | | (2,313) | | (2,736) | | (209) | | (165) | | 165 | |
| | Dec 2024 | (414) | | (5,761) | | (2,971) | | (2,509) | | (281) | | (300) | | 300 | |
Total All-in-sustaining costs6 | | Dec 2025 | 2,976 | | 22,299 | | 11,959 | | 10,013 | | 328 | | 1,383 | | (1,383) | |
| | Jun 2025 | 3,133 | | 18,570 | | 10,349 | | 7,980 | | 240 | | 1,296 | | (1,296) | |
| | Dec 2024 | 3,977 | | 19,892 | | 10,456 | | 9,244 | | 188 | | 1,257 | | (1,257) | |
| Plus: Corporate cost, growth and capital expenditure | | Dec 2025 | 90 | | 338 | | 34 | | 310 | | — | | — | | (6) | |
| | Jun 2025 | 98 | | 333 | | 23 | | 310 | | — | | — | | — | |
| | Dec 2024 | 165 | | 371 | | 22 | | 339 | | 2 | | — | | 8 | |
Total All-in-costs6 | | Dec 2025 | 3,066 | | 22,637 | | 11,993 | | 10,323 | | 328 | | 1,383 | | (1,389) | |
| | Jun 2025 | 3,231 | | 18,903 | | 10,372 | | 8,290 | | 240 | | 1,296 | | (1,296) | |
| | Dec 2024 | 4,142 | | 20,263 | | 10,478 | | 9,583 | | 190 | | 1,257 | | (1,249) | |
| PGM production | 4Eoz - 2Eoz | Dec 2025 | 142,945 | | 957,882 | | 496,826 | | 385,850 | | 17,241 | | 57,965 | | — | |
| | Jun 2025 | 141,124 | | 840,046 | | 425,747 | | 340,183 | | 15,062 | | 59,054 | | — | |
| | Dec 2024 | 187,703 | | 956,804 | | 460,026 | | 412,874 | | 22,933 | | 60,971 | | — | |
| kg | Dec 2025 | 4,446 | | 29,793 | | 15,453 | | 12,001 | | 536 | | 1,803 | | — | |
| | Jun 2025 | 4,389 | | 26,128 | | 13,242 | | 10,581 | | 468 | | 1,837 | | — | |
| | Dec 2024 | 5,838 | | 29,760 | | 14,308 | | 12,842 | | 713 | | 1,896 | | — | |
All-in-sustaining cost6 | R/4Eoz - R/2Eoz | Dec 2025 | 20,819 | | 24,779 | | 24,071 | | 25,950 | | 19,024 | | 23,859 | | — | |
| | Jun 2025 | 22,200 | | 23,777 | | 24,308 | | 23,458 | | 15,934 | | 21,946 | | — | |
| | Dec 2024 | 21,185 | | 22,205 | | 22,729 | | 22,389 | | 8,198 | | 20,616 | | — | |
| US$/4Eoz - US$/2Eoz | Dec 2025 | 1,198 | | 1,426 | | 1,385 | | 1,493 | | 1,095 | | 1,373 | | — | |
| | Jun 2025 | 1,207 | | 1,293 | | 1,322 | | 1,276 | | 866 | | 1,193 | | — | |
| | Dec 2024 | 1,182 | | 1,239 | | 1,268 | | 1,249 | | 457 | | 1,150 | | — | |
All-in-cost6 | R/4Eoz - R/2Eoz | Dec 2025 | 21,449 | | 25,155 | | 24,139 | | 26,754 | | 19,024 | | 23,859 | | — | |
| | Jun 2025 | 22,895 | | 24,204 | | 24,362 | | 24,369 | | 15,934 | | 21,946 | | — | |
| | Dec 2024 | 22,064 | | 22,619 | | 22,777 | | 23,210 | | 8,285 | | 20,616 | | — | |
| US$/4Eoz - US$/2Eoz | Dec 2025 | 1,234 | | 1,447 | | 1,389 | | 1,539 | | 1,095 | | 1,373 | | — | |
| | Jun 2025 | 1,245 | | 1,316 | | 1,325 | | 1,325 | | 866 | | 1,193 | | — | |
| | Dec 2024 | 1,231 | | 1,262 | | 1,271 | | 1,295 | | 462 | | 1,150 | | — | |
Average exchange rate for the six months ended 31 December 2025, 30 June 2025 and 31 December 2024 was R17.38/US$, R18.39/US$ and R17.92/US$, respectively
Figures may not add as they are rounded independently
1The US PGM operations’ underground production is converted to metric tonnes and kilograms, and financial performance is translated into SA rand
2The Total SA PGM operations and Marikana includes the production and costs associated with the purchase of concentrate (PoC) from third parties. For a reconciliation of the Operating cost, AISC and AIC excluding third party PoC, refer to “Reconciliation of operating cost excluding third party PoC for Total SA PGM operations and Marikana - Six Months” and “Reconciliation of AISC and AIC excluding third party PoC for Total SA PGM operations and Marikana – Six Months”
3Cost of sales, before amortisation and depreciation includes all mining and processing costs, third party refining costs, corporate general and administrative costs, and permitting costs
4Share-based payments are calculated based on the fair value at grant date and do not include the adjustment of the cash-settled share-based payment obligation to the reporting date fair value
Sibanye-Stillwater Operating and financial results | Six months and year ended 31 December 2025 43
5Rehabilitation includes the interest charge related to the environmental rehabilitation obligation and the amortisation of the related capitalised rehabilitation costs. The interest charge related to the environmental rehabilitation obligation and the amortisation of the capitalised rehabilitation costs reflect the periodic costs of rehabilitation associated with current PGM production
6All-in cost excludes income tax, costs associated with merger and acquisition activities, working capital, impairments, financing costs, one-time severance charges and items needed to normalise earnings. All-in cost is made up of All-in sustaining cost, being the cost to sustain current operations, given as a sub-total in the All-in cost calculation, together with corporate and major capital expenditure associated with growth. All-in sustaining cost per ounce and All-in cost per ounce are calculated by dividing the All-in sustaining cost and All-in cost, respectively, in a period by the total 4E/2E PGM produced (excluding Mimosa) in the same period
7The Inflation Reduction Act Section 45X Advanced Manufacturing Production Credit provides credits to the US PGM operations equal to 10% of production costs incurred for critical minerals produced and sold after December 31, 2022. During the six months ended 30 June 2025 the US PGM operations recognised R699 million (US$39 million) which relates to mining costs for the six months ended 31 December 2024 (R2,466 million (US$139 million) which relates to mining costs incurred for the years ended 31 December 2024 and 31 December 2023). Although these amounts were recognised as a credit against the 30 June 2025 cost of sales, management believes that the cost of sales for the period ended 30 June 2025 should be adjusted with the 2023 and 2024 credits against the period when the mining costs were accrued. It is expected that, because the required certification requirements were addressed in June 2025, the recognition of the credits will now match the related mining cost accruals. Accordingly, total All-in-sustaining costs and total All-in-costs were adjusted to reflect the appropriate amounts which relates to the periods presented above
| | | | | | | | | | | | | | | | | | | | | | | |
Reconciliation of operating cost excluding third party PoC for Total SA PGM operations and Marikana - Six months |
| | Total SA PGM operations | Marikana |
| Rm | Dec 2025 | Jun 2025 | Dec 2024 | Dec 2025 | Jun 2025 | Dec 2024 |
| Cost of sales, before amortisation and depreciation as reported per table above | | 23,565 | | 19,650 | | 21,340 | | 11,387 | | 8,981 | | 11,004 | |
| Inventory change as reported per table above | | 1,138 | | 1,574 | | 893 | | (240) | | 260 | | (1,175) | |
| Less: Chrome cost of sales | | (1,018) | | (851) | | (1,016) | | (293) | | (189) | | (186) | |
| Total operating cost including third party PoC | | 23,685 | | 20,373 | | 21,217 | | 10,854 | | 9,052 | | 9,643 | |
| Less: Purchase cost of PoC | | (1,489) | | (1,061) | | (1,162) | | (1,489) | | (1,061) | | (1,162) | |
| Total operating cost excluding third party PoC | | 22,196 | | 19,312 | | 20,055 | | 9,365 | | 7,991 | | 8,481 | |
| | | | | | | |
| PGM production as reported per table above | 4Eoz- 2Eoz | 957,882 | | 840,046 | | 956,804 | | 385,850 | | 340,183 | | 412,874 | |
| Less: Mimosa production | | (57,965) | | (59,054) | | (60,971) | | — | | — | | — | |
| PGM production excluding Mimosa | | 899,917 | | 780,992 | | 895,833 | | 385,850 | | 340,183 | | 412,874 | |
| Less: PoC production | | (37,356) | | (35,794) | | (46,318) | | (37,356) | | (35,794) | | (46,318) | |
| PGM production excluding Mimosa and third party PoC | | 862,561 | | 745,198 | | 849,515 | | 348,494 | | 304,389 | | 366,556 | |
| | | | | | | |
| PGM production including Mimosa and excluding third party PoC | | 920,526 | | 804,252 | | 910,486 | | 348,494 | | 304,389 | | 366,556 | |
| | | | | | | |
| Tonnes milled/treated | kt | 19,185 | | 17,311 | | 18,035 | | 5,009 | | 4,409 | | 5,191 | |
| Less: Mimosa tonnes | | (735) | | (723) | | (734) | | — | | — | | — | |
| PGM tonnes excluding Mimosa and third party PoC | | 18,451 | | 16,588 | | 17,301 | | 5,009 | | 4,409 | | 5,191 | |
| Operating cost including third party PoC | R/4Eoz-R/2Eoz | 26,319 | | 26,086 | | 23,684 | | 28,130 | | 26,609 | | 23,356 | |
| US$/4Eoz-US$/2Eoz | 1,514 | | 1,418 | | 1,322 | | 1,619 | | 1,447 | | 1,303 | |
| R/t | 1,284 | | 1,228 | | 1,226 | | 2,167 | | 2,053 | | 1,858 | |
| US$/t | 74 | | 67 | | 68 | | 125 | | 112 | | 104 | |
| Operating cost excluding third party PoC | R/4Eoz-R/2Eoz | 25,733 | | 25,915 | | 23,608 | | 26,873 | | 26,253 | | 23,137 | |
| US$/4Eoz-US$/2Eoz | 1,481 | | 1,409 | | 1,317 | | 1,546 | | 1,428 | | 1,291 | |
| R/t | 1,203 | | 1,164 | | 1,159 | | 1,870 | | 1,812 | | 1,634 | |
| US$/t | 69 | | 63 | | 65 | | 108 | | 99 | | 91 | |
| | | | | | | | | | | | | | | | | | | | | | | |
Reconciliation of AISC and AIC excluding third party PoC for Total SA PGM operations and Marikana - Six Months |
| | Total SA PGM operations | Marikana |
| Rm | Dec 2025 | Jun 2025 | Dec 2024 | Dec 2025 | Jun 2025 | Dec 2024 |
| Total All-in-sustaining cost as reported per table above | | 22,299 | | 18,570 | | 19,892 | | 10,013 | | 7,980 | | 9,244 | |
| Less: Purchase cost of PoC | | (1,489) | | (1,061) | | (1,162) | | (1,489) | | (1,061) | | (1,162) | |
| Add: By-product credit of PoC | | 286 | | 295 | | 229 | | 286 | | 295 | | 229 | |
| Total All-in-sustaining cost excluding third party PoC | | 21,096 | | 17,804 | | 18,959 | | 8,810 | | 7,214 | | 8,311 | |
| Plus: Corporate cost, growth and capital expenditure | | 338 | | 333 | | 371 | | 310 | | 310 | | 339 | |
| Total All-in-cost excluding third party PoC | | 21,434 | | 18,137 | | 19,330 | | 9,120 | | 7,524 | | 8,650 | |
| | | | | | | |
| PGM production excluding Mimosa and third party PoC | 4Eoz- 2Eoz | 862,561 | | 745,198 | | 849,515 | | 348,494 | | 304,389 | | 366,556 | |
| | | | | | | |
| All-in-sustaining cost excluding third party PoC | R/4Eoz-R/2Eoz | 24,457 | | 23,892 | | 22,317 | | 25,280 | | 23,700 | | 22,673 | |
| US$/4Eoz-US$/2Eoz | 1,407 | | 1,299 | | 1,245 | | 1,455 | | 1,289 | | 1,265 | |
| | | | | | | |
| All-in-cost excluding third party PoC | R/4Eoz-R/2Eoz | 24,849 | | 24,338 | | 22,754 | | 26,170 | | 24,718 | | 23,598 | |
| US$/4Eoz-US$/2Eoz | 1,430 | | 1,323 | | 1,270 | | 1,506 | | 1,344 | | 1,317 | |
Sibanye-Stillwater Operating and financial results | Six months and year ended 31 December 2025 44
ALL-IN COSTS – SIX MONTHS (continued) SA gold operations
Figures are in rand millions unless otherwise stated
| | | | | | | | | | | | | | | | | | | | | | | | | | | | | |
| | | SA OPERATIONS |
| | | Total SA gold | Driefontein | Kloof | Beatrix | Cooke | DRDGOLD | Corporate |
Cost of sales, before amortisation and depreciation1 | | Dec 2025 | 11,854 | | 3,676 | | 2,734 | | 2,164 | | 849 | | 2,431 | | — | |
| | Jun 2025 | 11,133 | | 3,285 | | 2,860 | | 2,065 | | 706 | | 2,217 | | — | |
| | Dec 2024 | 11,615 | | 3,359 | | 3,057 | | 2,128 | | 747 | | 2,324 | | — | |
| Royalties | | Dec 2025 | 139 | | 221 | | 12 | | 111 | | — | | — | | (205) | |
| | Jun 2025 | 9 | | (7) | | 16 | | 41 | | 4 | | — | | (45) | |
| | Dec 2024 | 59 | | 24 | | 18 | | 43 | | 3 | | — | | (29) | |
| Carbon tax | | Dec 2025 | (3) | | — | | — | | (4) | | — | | 1 | | — | |
| | Jun 2025 | — | | — | | — | | — | | — | | — | | — | |
| | Dec 2024 | — | | — | | — | | — | | — | | — | | — | |
| Community costs | | Dec 2025 | 15 | | — | | — | | — | | — | | 15 | | — | |
| | Jun 2025 | 9 | | — | | — | | — | | — | | 9 | | — | |
| | Dec 2024 | 8 | | — | | — | | — | | — | | 8 | | — | |
Share-based payments2 | | Dec 2025 | 77 | | 21 | | 17 | | 13 | | 1 | | 24 | | 1 | |
| | Jun 2025 | 16 | | 1 | | (2) | | 1 | | 1 | | 16 | | (1) | |
| | Dec 2024 | 72 | | 24 | | 21 | | 11 | | — | | 14 | | 2 | |
Rehabilitation interest and amortisation3 | | Dec 2025 | 115 | | 11 | | 17 | | 46 | | 59 | | (22) | | 4 | |
| | Jun 2025 | 132 | | 12 | | 18 | | 45 | | 59 | | (6) | | 4 | |
| | Dec 2024 | 118 | | (1) | | 13 | | 54 | | 52 | | (3) | | 3 | |
| Leases | | Dec 2025 | 19 | | 2 | | 3 | | 9 | | — | | 5 | | — | |
| | Jun 2025 | 16 | | — | | 5 | | 5 | | — | | 6 | | — | |
| | Dec 2024 | 17 | | — | | 5 | | 4 | | — | | 8 | | — | |
| Ore reserve development | | Dec 2025 | 1,571 | | 877 | | 548 | | 146 | | — | | — | | — | |
| | Jun 2025 | 1,361 | | 822 | | 433 | | 106 | | — | | — | | — | |
| | Dec 2024 | 1,432 | | 844 | | 487 | | 101 | | — | | — | | — | |
| Sustaining capital expenditure | | Dec 2025 | 598 | | 265 | | 143 | | 71 | | — | | 119 | | — | |
| | Jun 2025 | 481 | | 149 | | 108 | | 40 | | — | | 184 | | — | |
| | Dec 2024 | 516 | | 202 | | 141 | | 56 | | — | | 117 | | — | |
| Less: By-product credit | | Dec 2025 | (14) | | (6) | | (2) | | (1) | | — | | (5) | | — | |
| | Jun 2025 | (13) | | (4) | | (3) | | (2) | | — | | (4) | | — | |
| | Dec 2024 | (18) | | (6) | | (3) | | (2) | | — | | (7) | | — | |
Total All-in-sustaining costs4 | | Dec 2025 | 14,371 | | 5,067 | | 3,472 | | 2,555 | | 909 | | 2,568 | | (200) | |
| | Jun 2025 | 13,144 | | 4,258 | | 3,435 | | 2,301 | | 770 | | 2,422 | | (42) | |
| | Dec 2024 | 13,819 | | 4,446 | | 3,739 | | 2,395 | | 802 | | 2,461 | | (24) | |
| Plus: Corporate cost, growth and capital expenditure | | Dec 2025 | 1,599 | | — | | — | | — | | — | | 1,570 | | 29 | |
| | Jun 2025 | 1,062 | | — | | — | | — | | — | | 1,103 | | (41) | |
| | Dec 2024 | 901 | | — | | — | | — | | — | | 796 | | 105 | |
Total All-in-costs4 | | Dec 2025 | 15,970 | | 5,067 | | 3,472 | | 2,555 | | 909 | | 4,138 | | (171) | |
| | Jun 2025 | 14,206 | | 4,258 | | 3,435 | | 2,301 | | 770 | | 3,525 | | (83) | |
| | Dec 2024 | 14,720 | | 4,446 | | 3,739 | | 2,395 | | 802 | | 3,257 | | 81 | |
| Gold sold | kg | Dec 2025 | 9,933 | | 3,848 | | 1,523 | | 1,748 | | 426 | | 2,388 | | — | |
| | Jun 2025 | 9,148 | | 3,028 | | 1,734 | | 1,676 | | 459 | | 2,251 | | — | |
| | Dec 2024 | 11,028 | | 3,404 | | 2,553 | | 1,938 | | 566 | | 2,567 | | — | |
| oz | Dec 2025 | 319,353 | | 123,716 | | 48,966 | | 56,199 | | 13,696 | | 76,776 | | — | |
| | Jun 2025 | 294,115 | | 97,352 | | 55,749 | | 53,885 | | 14,757 | | 72,371 | | — | |
| | Dec 2024 | 354,558 | | 109,441 | | 82,081 | | 62,308 | | 18,197 | | 82,531 | | — | |
All-in-sustaining cost4 | R/kg | Dec 2025 | 1,446,794 | | 1,316,788 | | 2,279,711 | | 1,461,670 | | 2,133,803 | | 1,075,377 | | — | |
| | Jun 2025 | 1,436,817 | | 1,406,209 | | 1,980,969 | | 1,372,912 | | 1,677,560 | | 1,075,966 | | — | |
| | Dec 2024 | 1,253,083 | | 1,306,110 | | 1,464,552 | | 1,235,810 | | 1,416,961 | | 958,707 | | — | |
| All-in-sustaining cost | US$/oz | Dec 2025 | 2,589 | | 2,357 | | 4,080 | | 2,616 | | 3,819 | | 1,925 | | — | |
| | Jun 2025 | 2,430 | | 2,378 | | 3,350 | | 2,322 | | 2,837 | | 1,820 | | — | |
| | Dec 2024 | 2,175 | | 2,267 | | 2,542 | | 2,145 | | 2,459 | | 1,664 | | — | |
All-in-cost4 | R/kg | Dec 2025 | 1,607,772 | | 1,316,788 | | 2,279,711 | | 1,461,670 | | 2,133,803 | | 1,732,831 | | — | |
| | Jun 2025 | 1,552,908 | | 1,406,209 | | 1,980,969 | | 1,372,912 | | 1,677,560 | | 1,565,971 | | — | |
| | Dec 2024 | 1,334,784 | | 1,306,110 | | 1,464,552 | | 1,235,810 | | 1,416,961 | | 1,268,796 | | — | |
| All-in-cost | US$/oz | Dec 2025 | 2,877 | | 2,357 | | 4,080 | | 2,616 | | 3,819 | | 3,101 | | — | |
| | Jun 2025 | 2,626 | | 2,378 | | 3,350 | | 2,322 | | 2,837 | | 2,649 | | — | |
| | Dec 2024 | 2,317 | | 2,267 | | 2,542 | | 2,145 | | 2,459 | | 2,202 | | — | |
Average exchange rate for the six months ended 31 December 2025, 30 June 2025 and 31 December 2024 was R17.38/US$, R18.39/US$ and R17.92/US$, respectively
Figures may not add as they are rounded independently
1Cost of sales, before amortisation and depreciation includes all mining and processing costs, third party refining costs, corporate general and administrative costs, and permitting costs
2Share-based payments are calculated based on the fair value at grant date and do not include the adjustment of the cash-settled share-based payment obligation to the reporting date fair value
3Rehabilitation includes the interest charge related to the environmental rehabilitation obligation and the amortisation of the related capitalised rehabilitation costs. The interest charge related to the environmental rehabilitation obligation and the amortisation of the capitalised rehabilitation costs reflect the periodic costs of rehabilitation associated with current gold production
4All-in cost excludes income tax, costs associated with merger and acquisition activities, working capital, impairments, financing costs, one time severance charges and items needed to normalise earnings. All-in cost is made up of All-in sustaining cost, being the cost to sustain current operations, given as a sub-total in the All-in cost calculation, together with corporate and major capital expenditure associated with growth. All-in sustaining cost per kilogram (and ounce) and All-in cost per kilogram (and ounce) are calculated by dividing the All-in sustaining cost and All-in cost, respectively, in a period by the total gold sold over the same period
Sibanye-Stillwater Operating and financial results | Six months and year ended 31 December 2025 45
ALL-IN COSTS – SIX MONTHS (continued) Australian operations
Figures are in rand millions unless otherwise stated
| | | | | | | | | | | |
| Century zinc retreatment operation |
| | | |
Cost of sales, before amortisation and depreciation1 | | Dec 2025 | 1,604 | |
| | Jun 2025 | 1,457 | |
| | Dec 2024 | 1,727 | |
| Royalties | | Dec 2025 | 133 | |
| | Jun 2025 | 99 | |
| | Dec 2024 | 150 | |
| | | |
| | | |
| | | |
| Community costs | | Dec 2025 | 29 | |
| | Jun 2025 | 33 | |
| | Dec 2024 | 28 | |
| Inventory change | | Dec 2025 | 90 | |
| | Jun 2025 | 108 | |
| | Dec 2024 | (275) | |
Share-based payments2 | | Dec 2025 | 11 | |
| | Jun 2025 | 6 | |
| | Dec 2024 | 4 | |
Rehabilitation interest and amortisation3 | | Dec 2025 | 36 | |
| | Jun 2025 | 37 | |
| | Dec 2024 | 47 | |
| Leases | | Dec 2025 | 55 | |
| | Jun 2025 | 50 | |
| | Dec 2024 | 50 | |
| Sustaining capital expenditure | | Dec 2025 | 38 | |
| | Jun 2025 | 21 | |
| | Dec 2024 | 151 | |
| Less: By-product credit | | Dec 2025 | (199) | |
| | Jun 2025 | (147) | |
| | Dec 2024 | (144) | |
Total All-in-sustaining costs4 | | Dec 2025 | 1,797 | |
| | Jun 2025 | 1,664 | |
| | Dec 2024 | 1,738 | |
| Plus: Corporate cost, growth and capital expenditure | | Dec 2025 | 44 | |
| | Jun 2025 | 13 | |
| | Dec 2024 | 7 | |
Total All-in-costs4 | | Dec 2025 | 1,841 | |
| | Jun 2025 | 1,677 | |
| | Dec 2024 | 1,745 | |
| Payable zinc production | kt | Dec 2025 | 49 | |
| | Jun 2025 | 51 | |
| | Dec 2024 | 40 | |
All-in-sustaining cost4 | R/tZn | Dec 2025 | 36,399 | |
| | Jun 2025 | 32,411 | |
| | Dec 2024 | 43,244 | |
| US$/tZn | Dec 2025 | 2,094 | |
| | Jun 2025 | 1,762 | |
| | Dec 2024 | 2,413 | |
All-in-cost4 | R/tZn | Dec 2025 | 37,291 | |
| | Jun 2025 | 32,665 | |
| | Dec 2024 | 43,418 | |
| US$/tZn | Dec 2025 | 2,146 | |
| | Jun 2025 | 1,776 | |
| | Dec 2024 | 2,423 | |
Average exchange rate for the six months ended 31 December 2025, 30 June 2025 and 31 December 2024 was R17.38/US$, R18.39/US$ and R17.92/US$, respectively
Figures may not add as they are rounded independently
1Cost of sales, before amortisation and depreciation includes all mining and processing costs, corporate general and administrative costs, and permitting costs
2Share-based payments are calculated based on the fair value at grant date and do not include the adjustment of the cash-settled share-based payment obligation to the reporting date fair value
3Rehabilitation includes the interest charge related to the environmental rehabilitation obligation and the amortisation of the related capitalised rehabilitation costs. The interest charge related to the environmental rehabilitation obligation and the amortisation of the capitalised rehabilitation costs reflect the periodic costs of rehabilitation associated with current zinc production
4All-in cost excludes income tax, costs associated with merger and acquisition activities, working capital, impairments, financing costs, one-time severance charges and items needed to normalise earnings. All-in cost is made up of All-in sustaining cost, being the cost to sustain current operations, given as a sub-total in the All-in cost calculation, together with corporate and major capital expenditure associated with growth. All-in sustaining cost per tonne and All-in cost per tonne are calculated by dividing the All-in sustaining cost and All-in cost, respectively, in a period by the total tonnes of payable zinc metal produced the same period
Sibanye-Stillwater Operating and financial results | Six months and year ended 31 December 2025 46
UNIT OPERATING COST – SIX MONTHS US and SA PGM operations
Figures are in rand millions unless otherwise stated
| | | | | | | | | | | | | | | | | | | | | | | | | | | | | | | | |
|
| | | US PGM operations | Total SA PGM operations2,3 | Rustenburg including Kroondal3 | Marikana3 | Plat Mile3 | Mimosa |
| | | Under- ground1 | Total | Under-
ground | Surface | Under-
ground | Surface | Surface | Attribu-table |
| | | | | | | | | | |
| Cost of sales, before amortisation and depreciation | | Dec 2025 | 2,217 | 23,565 | 10,980 | | 710 | | 11,387 | 488 | | 1,618 | |
| | Jun 2025 | (70) | | 19,650 | | 9,585 | | 647 | | 8,981 | 437 | | 913 | |
| | Dec 2024 | 4,723 | | 21,340 | | 9,228 | | 671 | | 11,004 | 437 | | 1,223 | |
Section 45X credit adjustment6 | | Dec 2025 | — | | — | | — | | — | | — | — | | — | |
| | Jun 2025 | 2,466 | | — | | — | | — | | — | — | | — | |
| | Dec 2024 | (699) | | — | | — | | — | | — | — | | — | |
| Inventory change | | Dec 2025 | 231 | | 1,138 | | 1,412 | | (34) | | (240) | — | | (295) | |
| | Jun 2025 | 325 | | 1,574 | | 1,296 | | 18 | | 260 | — | | 339 | |
| | Dec 2024 | (632) | | 893 | | 2,070 | | (2) | | (1,175) | — | | 6 | |
| Less: Chrome cost of sales | | Dec 2025 | — | | (1,018) | | (636) | | — | | (293) | (89) | | — | |
| | Jun 2025 | — | | (851) | | (546) | | — | | (189) | (116) | | — | |
| | Dec 2024 | — | | (1,016) | | (734) | | — | | (186) | (96) | | — | |
| Less: Purchase cost of PoC | | Dec 2025 | — | | (1,489) | | — | | — | | (1,489) | — | | — | |
| | Jun 2025 | — | | (1,061) | | — | | — | | (1,061) | — | | — | |
| | Dec 2024 | — | | (1,162) | | — | | — | | (1,162) | — | | — | |
| Total operating cost excluding third party PoC | | Dec 2025 | 2,448 | | 22,196 | 11,756 | | 676 | | 9,365 | 399 | | 1,323 | |
| | Jun 2025 | 2,721 | | 19,312 | | 10,335 | | 665 | | 7,991 | 321 | | 1,252 | |
| | Dec 2024 | 3,392 | | 20,055 | | 10,564 | | 669 | | 8,481 | 341 | | 1,229 | |
| Tonnes milled/treated excluding third party PoC | kt | Dec 2025 | 395 | | 18,451 | | 5,861 | | 2,614 | | 3,262 | | 1,746 | | 4,967 | | 735 | |
| | Jun 2025 | 365 | | 16,588 | | 5,139 | | 2,591 | | 2,840 | | 1,569 | | 4,449 | | 723 | |
| | Dec 2024 | 510 | | 17,301 | | 5,304 | | 2,630 | | 3,207 | | 1,984 | | 4,176 | | 734 | |
PGM production excluding third party PoC4 | 4Eoz - 2Eoz | Dec 2025 | 142,945 | | 862,561 | 472,090 | | 24,736 | | 348,494 | 17,241 | | 57,965 | |
| | Jun 2025 | 141,124 | | 745,198 | | 398,791 | | 26,956 | | 304,389 | 15,062 | | 59,054 | |
| | Dec 2024 | 187,703 | | 849,515 | | 426,120 | | 33,906 | | 366,556 | 22,933 | | 60,971 | |
Operating cost5 | R/t | Dec 2025 | 6,193 | | 1,203 | | 2,006 | | 259 | | 1,870 | 80 | | 1,801 | |
| | Jun 2025 | 7,453 | | 1,164 | | 2,011 | | 257 | | 1,812 | 72 | | 1,733 | |
| | Dec 2024 | 6,647 | | 1,159 | | 1,992 | | 254 | | 1,634 | 82 | | 1,675 | |
| US$/t | Dec 2025 | 356 | | 69 | | 115 | | 15 | | 108 | 5 | | 104 | |
| | Jun 2025 | 405 | | 63 | | 109 | | 14 | | 99 | 4 | | 94 |
| | Dec 2024 | 371 | | 65 | | 111 | | 14 | | 91 | 5 | | 93 |
| R/4Eoz - R/2Eoz | Dec 2025 | 17,125 | | 25,733 | | 24,902 | | 27,329 | | 26,873 | 23,143 | | 22,824 | |
| | Jun 2025 | 19,281 | | 25,915 | | 25,916 | | 24,670 | | 26,253 | 21,312 | | 21,201 | |
| | Dec 2024 | 18,069 | | 23,608 | | 24,791 | | 19,731 | | 23,137 | 14,869 | | 20,157 | |
| US$/4Eoz - US$/2Eoz | Dec 2025 | 985 | | 1,481 | | 1,433 | | 1,572 | | 1,546 | 1,332 | | 1,313 | |
| | Jun 2025 | 1,048 | | 1,409 | | 1,409 | | 1,341 | | 1,428 | 1,159 | | 1,153 | |
| | Dec 2024 | 1,008 | | 1,317 | | 1,383 | | 1,101 | | 1,291 | 830 | | 1,125 | |
Average exchange rate for the six months ended 31 December 2025, 30 June 2025 and 31 December 2024 was R17.38/US$, R18.39/US$ and R17.92/US$, respectively
Figures may not add as they are rounded independently
1 The US PGM operations’ underground production is converted to metric tonnes and kilograms, and performance is translated into rand. In addition to the US PGM operations’
underground production, the operation treats various recycling material which is excluded from the statistics shown above
2 Total SA PGM operations exclude the results of Mimosa (financial and production results), which is equity accounted
3 Cost of sales, before amortisation and depreciation for Total SA PGM operations, Rustenburg (including Kroondal), Marikana and Platinum Mile includes the Chrome cost of sales which is excluded for operating unit cost calculation purposes as Chrome production is excluded from the concentrate production
4 For a reconciliation of the production excluding Mimosa and third party PoC, refer to “Reconciliation of operating cost excluding third party PoC for Total SA PGM operations and Marikana - Six months”
5 Operating cost is the average cost of production and operating cost per tonne is calculated by dividing the cost of sales, before amortisation and depreciation, adjusted for change in inventory, less chrome- and PoC cost of sales in a period by the tonnes milled/treated in the same period, and operating cost per ounce is calculated by dividing the cost of sales, before amortisation and depreciation, adjusted for change in inventory, less chrome- and PoC cost of sales in a period, by the PGM produced in the same period
6 The US PGM operations’ operating cost for the six months ended 31 December 2024 were adjusted to include the Section 45X Advance Manufacturing Production Credits. During the six months ended 30 June 2025 the US PGM operations recognised R699 million (US$39 million)which relates to mining costs for the six months ended 31 December 2024 (R2,466 million (US$139 million) which relates to mining costs incurred for the years ended 31 December 2024 and 31 December 2023)
Sibanye-Stillwater Operating and financial results | Six months and year ended 31 December 2025 47
UNIT OPERATING COST – SIX MONTHS (continued) SA gold operations
Figures are in rand millions unless otherwise stated
| | | | | | | | | | | | | | | | | | | | | | | | | | | | | | | | | | | | | | | | | |
|
| | | Total SA gold operations | Driefontein | Kloof | Beatrix | Cooke | DRDGOLD |
| | | Total | Under-
ground | Surface | Under-
ground | Surface | Under-
ground | Surface | Under-
ground | Surface | Surface | Surface |
| | | | | | | | | | | | | |
| Cost of sales, before amortisation and depreciation | | Dec 2025 | 11,854 | | 8,553 | | 3,301 | | 3,676 | | — | | 2,713 | | 21 | | 2,164 | | — | | 849 | | 2,431 | |
| | Jun 2025 | 11,133 | | 8,060 | | 3,073 | | 3,285 | | — | | 2,710 | | 150 | | 2,065 | | — | | 706 | | 2,217 | |
| | Dec 2024 | 11,615 | | 8,295 | | 3,320 | | 3,359 | | — | | 2,815 | | 242 | | 2,121 | | 7 | | 747 | | 2,324 | |
| Inventory change | | Dec 2025 | 700 | | 698 | | 2 | | 236 | | — | | 202 | | 14 | | 260 | | — | | 34 | | (46) | |
| | Jun 2025 | 507 | | 453 | | 54 | | 245 | | — | | 126 | | (1) | | 82 | | — | | 28 | | 27 | |
| | Dec 2024 | 179 | | 158 | | 21 | | 106 | | — | | (1) | | (5) | | 53 | | — | | 35 | | (9) | |
| Total operating cost | | Dec 2025 | 12,554 | | 9,251 | | 3,303 | | 3,912 | | — | | 2,915 | | 35 | | 2,424 | | — | | 883 | | 2,385 | |
| | Jun 2025 | 11,640 | | 8,513 | | 3,127 | | 3,530 | | — | | 2,836 | | 149 | | 2,147 | | — | | 734 | | 2,244 | |
| | Dec 2024 | 11,794 | | 8,453 | | 3,341 | | 3,465 | | — | | 2,814 | | 237 | | 2,174 | | 7 | | 782 | | 2,315 | |
| Tonnes milled/treated | kt | Dec 2025 | 16,135 | | 1,693 | | 14,442 | | 538 | | — | | 451 | | 134 | | 704 | | — | | 1,852 | | 12,456 | |
| | Jun 2025 | 16,680 | | 1,515 | | 15,164 | | 522 | | 1 | | 389 | | 334 | | 604 | | 1 | | 2,132 | | 12,698 | |
| | Dec 2024 | 17,725 | | 1,859 | | 15,866 | | 578 | | 4 | | 587 | | 574 | | 694 | | 19 | | 2,353 | | 12,916 | |
| Gold produced | kg | Dec 2025 | 10,331 | | 7,440 | | 2,891 | | 4,024 | | — | | 1,490 | | 139 | | 1,926 | | — | | 415 | | 2,337 | |
| | Jun 2025 | 9,337 | | 6,453 | | 2,884 | | 3,192 | | — | | 1,605 | | 140 | | 1,656 | | — | | 479 | | 2,265 | |
| | Dec 2024 | 11,212 | | 7,874 | | 3,338 | | 3,466 | | 2 | | 2,378 | | 189 | | 2,030 | | 4 | | 579 | | 2,564 | |
| oz | Dec 2025 | 332,149 | | 239,202 | | 92,948 | | 129,375 | | — | | 47,905 | | 4,469 | | 61,922 | | — | | 13,343 | | 75,136 | |
| | Jun 2025 | 300,191 | | 207,469 | | 92,723 | | 102,625 | | — | | 51,602 | | 4,501 | | 53,242 | | — | | 15,400 | | 72,821 | |
| | Dec 2024 | 360,474 | | 253,155 | | 107,319 | | 111,434 | | 64 | | 76,454 | | 6,076 | | 65,266 | | 129 | | 18,615 | | 82,434 | |
Operating cost1 | R/t | Dec 2025 | 778 | | 5,464 | | 229 | | 7,273 | | — | | 6,463 | | 262 | | 3,442 | | — | | 477 | | 191 | |
| | Jun 2025 | 698 | | 5,618 | | 206 | | 6,758 | | — | | 7,284 | | 447 | | 3,556 | | — | | 344 | | 177 | |
| | Dec 2024 | 665 | | 4,546 | | 211 | | 5,992 | | — | | 4,794 | | 413 | | 3,132 | | 361 | | 332 | | 179 | |
| US$/t | Dec 2025 | 45 | | 314 | | 13 | | 418 | | — | | 372 | | 15 | | 198 | | — | | 27 | | 11 | |
| | Jun 2025 | 38 | | 305 | | 11 | | 367 | | — | | 396 | | 24 | | 193 | | — | | 19 | | 10 | |
| | Dec 2024 | 37 | | 254 | | 12 | | 334 | | — | | 268 | | 23 | | 175 | | 20 | | 19 | | 10 | |
| R/kg | Dec 2025 | 1,215,178 | | 1,243,414 | | 1,142,511 | | 972,167 | | — | | 1,956,376 | | 251,799 | | 1,258,567 | | — | | 2,127,711 | | 1,020,539 |
| | Jun 2025 | 1,246,653 | | 1,319,231 | | 1,084,258 | | 1,105,890 | | — | | 1,766,978 | | 1,064,286 | | 1,296,498 | | — | | 1,532,359 | | 990,728 | |
| | Dec 2024 | 1,051,909 | | 1,073,533 | | 1,000,899 | | 999,711 | | — | | 1,183,347 | | 1,253,968 | | 1,070,936 | | 1,750,000 | | 1,350,604 | | 902,886 | |
| US$/oz | Dec 2025 | 2,175 | | 2,225 | | 2,045 | | 1,740 | | — | | 3,501 | | 451 | | 2,252 | | — | | 3,808 | | 1,826 | |
| | Jun 2025 | 2,108 | | 2,231 | | 1,834 | | 1,870 | | — | | 2,989 | | 1,800 | | 2,193 | | — | | 2,592 | | 1,676 | |
| | Dec 2024 | 1,826 | | 1,863 | | 1,737 | | 1,735 | | — | | 2,054 | | 2,176 | | 1,859 | | 3,037 | | 2,344 | | 1,567 | |
Average exchange rate for the six months ended 31 December 2025, 30 June 2025 and 31 December 2024 was R17.38/US$, R18.39/US$ and R17.92/US$, respectively
Figures may not add as they are rounded independently
1 Operating cost is the average cost of production and operating cost per tonne is calculated by dividing the cost of sales, before amortisation and depreciation and change in inventory in a period by the tonnes milled/treated in the same period, and operating cost per kilogram (and ounce) is calculated by dividing the cost of sales, before amortisation and depreciation and change in inventory in a period by the gold produced in the same period
Sibanye-Stillwater Operating and financial results | Six months and year ended 31 December 2025 48
SALIENT FEATURES AND COST BENCHMARKS – YEAR US and SA PGM operations | | | | | | | | | | | | | | | | | | | | | | | | | | | | | | | | | | | | | | |
| | | | |
| | | US PGM operations | Total SA PGM operations2 | Rustenburg including Kroondal10 | Marikana2 | Plat Mile | Mimosa |
| | | Under- ground1 | Total | Under-
ground | Surface | Under-
ground | Surface | Under-
ground | Surface | Surface | Attribu-table |
| Production | | | | | | | | | | | | |
| Tonnes milled/treated | kt | Dec 2025 | 760 | | 36,496 | | 18,560 | | 17,936 | | 11,000 | | 5,205 | | 6,103 | | 3,315 | | 9,416 | | 1,457 | |
| | Dec 2024 | 1,129 | | 35,842 | | 17,947 | | 17,895 | | 10,340 | | 5,370 | | 6,138 | | 4,036 | | 8,489 | | 1,469 | |
| Plant head grade | g/t | Dec 2025 | 12.82 | | 2.08 | | 3.20 | | 0.92 | | 2.91 | | 1.10 | | 3.69 | | 1.19 | | 0.72 | | 3.38 | |
| | Dec 2024 | 12.95 | | 2.08 | | 3.23 | | 0.92 | | 2.90 | | 1.06 | | 3.76 | | 1.01 | | 0.79 | | 3.38 | |
| Plant recoveries | % | Dec 2025 | 90.65 | | 70.67 | | 84.66 | | 20.40 | | 84.62 | | 28.08 | | 86.83 | | 19.11 | | 14.82 | | 73.89 | |
| | Dec 2024 | 90.68 | | 72.55 | | 85.09 | | 28.90 | | 84.93 | | 39.40 | | 86.86 | | 26.52 | | 21.38 | | 76.83 | |
| Yield | g/t | Dec 2025 | 11.62 | | 1.47 | | 2.71 | | 0.19 | | 2.46 | | 0.31 | | 3.20 | | 0.23 | | 0.11 | | 2.50 | |
| | Dec 2024 | 11.74 | | 1.51 | | 2.75 | | 0.27 | | 2.46 | | 0.42 | | 3.27 | | 0.27 | | 0.17 | | 2.60 | |
PGM production3 | 4Eoz - 2Eoz | Dec 2025 | 284,069 | | 1,724,778 | | 1,616,545 | | 108,233 | | 870,881 | | 51,692 | | 628,645 | | 24,238 | | 32,303 | | 117,019 | |
| | Dec 2024 | 425,842 | | 1,738,946 | | 1,585,976 | | 152,970 | | 818,847 | | 72,113 | | 644,490 | | 34,755 | | 46,102 | | 122,639 | |
PGM sold4 | 4Eoz - 2Eoz | Dec 2025 | 283,622 | | 1,727,588 | | | | 802,360 | | 50,968 | | 733,057 | 32,303 | | 108,900 | |
| | Dec 2024 | 461,662 | | 1,807,257 | | | | 719,808 | | 83,024 | | 840,828 | 46,102 | | 117,495 | |
Price and costs5 | | | | | | | | | | | |
Average PGM basket price6 | R/4Eoz - R/2Eoz | Dec 2025 | 21,367 | | 31,110 | | | | 31,476 | | 28,164 | | 30,995 | 29,046 | | 28,116 | |
| | Dec 2024 | 18,097 | | 24,213 | | | | 24,476 | | 22,483 | | 24,230 | 22,468 | | 22,229 | |
| US$/4Eoz - US$/2Eoz | Dec 2025 | 1,195 | | 1,740 | | | | 1,760 | | 1,575 | | 1,733 | 1,624 | | 1,572 | |
| | Dec 2024 | 988 | | 1,322 | | | | 1,336 | | 1,227 | | 1,323 | 1,227 | | 1,214 | |
Operating cost7,9 | R/t | Dec 2025 | 6,797 | | 1,185 | | | | 2,008 | | 258 | | 1,843 | 76 | | 1,767 | |
| | Dec 2024 | 6,727 | | 1,125 | | | | 1,936 | | 249 | | 1,639 | 78 | | 1,696 | |
| US$/t | Dec 2025 | 380 | | 66 | | | | 112 | | 14 | | 103 | 4 | | 99 | |
| | Dec 2024 | 367 | | 61 | | | | 106 | | 14 | | 89 | 4 | | 93 | |
| R/4Eoz - R/2Eoz | Dec 2025 | 18,193 | | 25,816 | | | | 25,364 | | 25,942 | | 26,584 | 22,289 | | 22,005 | |
| | Dec 2024 | 17,828 | | 23,933 | | | | 24,444 | | 18,513 | | 24,545 | 14,316 | | 20,312 | |
| US$/4Eoz - US$/2Eoz | Dec 2025 | 1,017 | | 1,444 | | | | 1,419 | | 1,451 | | 1,487 | 1,247 | | 1,231 | |
| | Dec 2024 | 973 | | 1,307 | | | | 1,335 | | 1,011 | | 1,340 | 782 | | 1,109 | |
All-in sustaining cost7,8,9 | R/4Eoz - R/2Eoz | Dec 2025 | 21,516 | | 24,193 | | | | 24,174 | 24,548 | 17,584 | | 22,894 | |
| | Dec 2024 | 22,096 | | 21,948 | | | | 21,449 | 23,430 | 9,674 | | 21,103 | |
| US$/4Eoz - US$/2Eoz | Dec 2025 | 1,203 | | 1,353 | | | | 1,352 | 1,373 | 983 | | 1,280 | |
| | Dec 2024 | 1,206 | | 1,198 | | | | 1,171 | 1,279 | 528 | | 1,152 | |
All-in cost7,8,9 | R/4Eoz - R/2Eoz | Dec 2025 | 22,178 | | 24,610 | | | | 24,235 | 25,498 | 17,584 | | 22,894 | |
| | Dec 2024 | 22,838 | | 22,465 | | | | 21,562 | 24,473 | 10,065 | | 21,103 | |
| US$/4Eoz - US$/2Eoz | Dec 2025 | 1,240 | | 1,376 | | | | 1,355 | 1,426 | 983 | | 1,280 | |
| | Dec 2024 | 1,247 | | 1,226 | | | | 1,177 | 1,336 | 549 | | 1,152 | |
Capital expenditure5 | | | | | | | | | | | |
| Ore reserve development | Rm | Dec 2025 | 1,212 | | 2,344 | | | | 747 | 1,597 | — | | — | |
| | Dec 2024 | 1,920 | | 2,472 | | | | 699 | 1,773 | — | | — | |
| Sustaining capital | Rm | Dec 2025 | 363 | | 2,867 | | | | 1,479 | 1,353 | 35 | | 358 | |
| | Dec 2024 | 611 | | 2,567 | | | | 1,407 | 1,118 | 42 | | 548 | |
| Project capital | Rm | Dec 2025 | 135 | | 675 | | | | 57 | 618 | — | | — | |
| | Dec 2024 | 291 | | 807 | | | | 101 | 680 | 18 | | — | |
| Total capital expenditure | Rm | Dec 2025 | 1,710 | | 5,886 | | | | 2,283 | 3,568 | 35 | | 358 | |
| | Dec 2024 | 2,822 | | 5,846 | | | | 2,207 | 3,571 | 60 | | 548 | |
| US$m | Dec 2025 | 96 | | 329 | | | | 128 | 200 | 2 | | 20 | |
| | Dec 2024 | 154 | | 319 | | | | 120 | 195 | 3 | | 30 | |
Average exchange rates for the year ended 31 December 2025 and 31 December 2024 were R17.88/US$ and R18.32/US$, respectively
Figures may not add as they are rounded independently
1The US PGM operations’ underground production is converted to metric tonnes and kilograms, and financial performance is translated into rand
2Total SA PGM operations and Marikana excludes the production and costs associated with the purchase of concentrate (PoC) from third parties. For a reconciliation of the Operating cost, AISC and AIC excluding third party PoC, refer to “Reconciliation of operating cost excluding third party PoC for Total SA PGM operations and Marikana - Year” and “Reconciliation of AISC and AIC excluding third party PoC for Total SA PGM operations and Marikana – Year”
3The Platinum Group Metals (PGM) production in the SA operations is principally platinum, palladium, rhodium and gold, referred to as 4E (3PGM+Au) and measured at the concentrator, and in the US underground operations is principally platinum and palladium, referred to as 2E (2PGM)
4PGM sold includes the third party PoC ounces sold
5Total SA PGM operations’ unit cost benchmarks and capital expenditure exclude the financial results of Mimosa, which is equity accounted and excluded from revenue and cost of sales
6The average PGM basket price is the PGM revenue per 4E/2E ounce, prior to a purchase of concentrate adjustment
7Operating cost, All-in sustaining costs and All-in costs are not measures of performance under IFRS Accounting Standards and should not be considered in isolation or as substitutes for measures of financial performance prepared in accordance with IFRS Accounting Standards. See "Non-IFRS measures" for more information on the metrics presented by Sibanye-Stillwater
8All-in cost excludes income tax, costs associated with merger and acquisition activities, working capital, impairments, financing costs, one-time severance charges and items needed to normalise earnings. For a reconciliation of cost of sales, before amortisation and depreciation to All-in cost, see “All-in costs - Six months”
9The US PGM operations’ operating cost, AISC and AIC for the year ended 31 December 2024 were adjusted to include Section 45X Advance Manufacturing Production Credits. During the year ended 31 December 2025 the US PGM operations recognised R2,466 million (US$139 million) which relates to mining costs incurred for the years ended 31 December 2024 and 31 December 2023, respectively
10Rustenburg is now presented to include the underground production and costs for Kroondal for all metrics relating to the year ended 31 December 2024
Sibanye-Stillwater Operating and financial results | Six months and year ended 31 December 2025 49
SALIENT FEATURES AND COST BENCHMARKS – YEAR (continued) SA gold operations
| | | | | | | | | | | | | | | | | | | | | | | | | | | | | | | | | | | | | | | | | |
| | | SA OPERATIONS |
| | | Total SA gold | Driefontein | Kloof | Beatrix | Cooke | DRDGOLD |
| | | Total | Under-
ground | Surface | Under-
ground | Surface | Under-
ground | Surface | Under-
ground | Surface | Surface | Surface |
| Production | | | | | | | | | | | | | |
| Tonnes milled/treated | kt | Dec 2025 | 32,815 | | 3,209 | | 29,607 | | 1,060 | | 1 | | 840 | | 467 | | 1,308 | | 1 | | 3,984 | | 25,154 | |
| | Dec 2024 | 33,522 | | 3,594 | | 29,928 | | 1,152 | | 50 | | 1,147 | | 1,358 | | 1,295 | | 76 | | 4,425 | | 24,019 | |
| Yield | g/t | Dec 2025 | 0.60 | | 4.33 | | 0.20 | | 6.81 | | — | | 3.68 | | 0.60 | | 2.74 | | — | | 0.22 | | 0.18 | |
| | Dec 2024 | 0.65 | | 4.18 | | 0.23 | | 6.05 | | 1.00 | | 3.77 | | 0.42 | | 2.90 | | 0.18 | | 0.28 | | 0.21 | |
| Gold produced | kg | Dec 2025 | 19,668 | | 13,893 | | 5,775 | | 7,216 | | — | | 3,095 | | 279 | | 3,582 | | — | | 894 | | 4,602 | |
| | Dec 2024 | 21,915 | | 15,038 | | 6,877 | | 6,965 | | 50 | | 4,322 | | 570 | | 3,751 | | 14 | | 1,224 | | 5,019 | |
| oz | Dec 2025 | 632,341 | | 446,670 | | 185,671 | | 232,000 | | — | | 99,507 | | 8,970 | | 115,164 | | — | | 28,743 | | 147,958 | |
| | Dec 2024 | 704,583 | | 483,483 | | 221,101 | | 223,930 | | 1,608 | | 138,955 | | 18,326 | | 120,597 | | 450 | | 39,353 | | 161,365 | |
| Gold sold | kg | Dec 2025 | 19,081 | | 13,314 | | 5,767 | | 6,872 | | 4 | | 3,018 | | 239 | | 3,424 | | — | | 885 | | 4,639 | |
| | Dec 2024 | 22,239 | | 15,337 | | 6,902 | | 7,110 | | 66 | | 4,368 | | 584 | | 3,859 | | 14 | | 1,217 | | 5,021 | |
| oz | Dec 2025 | 613,468 | | 428,055 | | 185,413 | | 220,940 | | 129 | | 97,031 | | 7,684 | | 110,084 | | — | | 28,453 | | 149,147 | |
| | Dec 2024 | 715,000 | | 493,096 | | 221,904 | | 228,592 | | 2,122 | | 140,434 | | 18,776 | | 124,070 | | 450 | | 39,127 | | 161,429 | |
| Price and costs | | | | | | | | | | | | | |
| Gold price received | R/kg | Dec 2025 | 1,942,194 | | | | 1,833,915 | 1,678,232 | 1,833,528 | 1,906,215 | 1,967,881 | |
| | Dec 2024 | 1,400,468 | | | | 1,372,352 | 1,366,922 | 1,375,936 | 1,394,412 | 1,407,688 | |
| US$/oz | Dec 2025 | 3,379 | | | | 3,190 | 2,919 | 3,189 | 3,316 | 3,423 | |
| | Dec 2024 | 2,378 | | | | 2,330 | 2,321 | 2,336 | 2,368 | 2,390 | |
Operating cost1 | R/t | Dec 2025 | 737 | | 5,536 | | 217 | | 7,020 | | — | | 6,843 | | 396 | | 3,494 | | — | | 406 | | 184 | |
| | Dec 2024 | 696 | | 4,639 | | 223 | | 5,912 | | 300 | | 4,973 | | 398 | | 3,210 | | 327 | | 364 | | 186 | |
| US$/t | Dec 2025 | 41 | | 310 | | 12 | | 393 | | — | | 383 | | 22 | | 195 | | — | | 23 | | 10 | |
| | Dec 2024 | 38 | | 253 | | 12 | | 323 | | 16 | | 272 | | 22 | | 175 | | 18 | | 20 | | 10 | |
| R/kg | Dec 2025 | 1,230,222 | | 1,278,630 | | 1,113,766 | | 1,031,458 | | — | | 1,858,158 | | 663,082 | | 1,275,824 | | — | | 1,809,843 | | 1,005,867 | |
| | Dec 2024 | 1,065,070 | | 1,108,658 | | 969,754 | | 978,033 | | 300,000 | | 1,319,759 | | 949,123 | | 1,107,971 | | 1,785,714 | | 1,315,359 | | 892,210 | |
| US$/oz | Dec 2025 | 2,140 | | 2,224 | | 1,937 | | 1,794 | | — | | 3,232 | | 1,153 | | 2,219 | | — | | 3,148 | | 1,750 | |
| | Dec 2024 | 1,809 | | 1,883 | | 1,647 | | 1,661 | | 509 | | 2,241 | | 1,612 | | 1,881 | | 3,032 | | 2,234 | | 1,515 | |
All-in sustaining cost1,2 | R/kg | Dec 2025 | 1,442,063 | | | | 1,356,457 | 2,120,970 | 1,417,640 | 1,894,915 | 1,076,310 | |
| | Dec 2024 | 1,251,810 | | | | 1,263,657 | 1,535,137 | 1,225,407 | 1,388,661 | 946,624 | |
| US$/oz | Dec 2025 | 2,509 | | | | 2,360 | 3,690 | 2,466 | 3,296 | 1,872 | |
| | Dec 2024 | 2,126 | | | | 2,146 | 2,607 | 2,081 | 2,358 | 1,607 | |
All-in cost1,2 | R/kg | Dec 2025 | 1,581,468 | | | | 1,356,457 | 2,120,970 | 1,417,640 | 1,894,915 | 1,652,511 | |
| | Dec 2024 | 1,411,619 | | | | 1,263,657 | 1,535,137 | 1,225,407 | 1,388,661 | 1,570,205 | |
| US$/oz | Dec 2025 | 2,751 | | | | 2,360 | 3,690 | 2,466 | 3,296 | 2,875 | |
| | Dec 2024 | 2,397 | | | | 2,146 | 2,607 | 2,081 | 2,358 | 2,666 | |
| Capital expenditure | | | | | | | | | | |
| Ore reserve development | Rm | Dec 2025 | 2,931 | | | | 1,699 | 981 | 251 | — | — | |
| | Dec 2024 | 2,837 | | | | 1,663 | 932 | 242 | — | — | |
| Sustaining capital | Rm | Dec 2025 | 1,079 | | | | 414 | 251 | 111 | — | 303 | |
| | Dec 2024 | 931 | | | | 380 | 247 | 64 | — | 240 | |
Project capital3 | Rm | Dec 2025 | 2,686 | | | | — | — | — | — | 2,673 | |
| | Dec 2024 | 3,485 | | | | — | — | — | — | 3,131 | |
| Total capital expenditure | Rm | Dec 2025 | 6,696 | | | | 2,113 | 1,232 | 362 | — | 2,976 | |
| | Dec 2024 | 7,253 | | | | 2,043 | 1,179 | 306 | — | 3,371 | |
| Total capital expenditure | US$m | Dec 2025 | 374 | | | | 118 | 69 | 20 | — | 166 | |
| | Dec 2024 | 396 | | | | 112 | 64 | 17 | — | 184 | |
Average exchange rates for the year ended 31 December 2025 and 31 December 2024 were R17.88/US$ and R18.32/US$, respectively
Figures may not add as they are rounded independently
1Operating cost, All-in sustaining costs and All-in costs are not measures of performance under IFRS and should not be considered in isolation or as substitutes for measures of financial performance prepared in accordance with IFRS. See "Non-IFRS measures" for more information on the metrics presented by Sibanye-Stillwater
2All-in cost excludes income tax, costs associated with merger and acquisition activities, working capital, impairments, financing costs, one-time severance charges and items needed to normalise earnings. For a reconciliation of cost of sales before amortisation and depreciation to All-in cost, see “All-in costs – Year”
3Project capital expenditure for the years ended 31 December 2025 and 31 December 2024 includes corporate capital expenditure of R13 million (US$1 million) and R354 million (US$19 million), respectively, the majority of which relates to Burnstone project
Sibanye-Stillwater Operating and financial results | Six months and year ended 31 December 2025 50
SALIENT FEATURES AND COST BENCHMARKS – YEAR (continued) Australian operations
| | | | | | | | | | | |
Century zinc retreatment operation |
| Production | | | |
| Ore mined and processed | kt | Dec 2025 | 8,210 | |
| | Dec 2024 | 6,807 | |
| Zinc ore grade processed | % | Dec 2025 | 2.93 | |
| | Dec 2024 | 2.97 | |
| Plant recoveries | % | Dec 2025 | 50.63 | |
| | Dec 2024 | 49.39 | |
Concentrate produced1 | kt | Dec 2025 | 262 | |
| | Dec 2024 | 218 | |
Concentrate zinc grade2 | % | Dec 2025 | 46.42 | |
| | Dec 2024 | 45.78 | |
Zinc in concentrate produced3 | kt | Dec 2025 | 122 | |
| | Dec 2024 | 100 | |
Payable zinc production4 | kt | Dec 2025 | 101 | |
| | Dec 2024 | 82 | |
Payable zinc sales5 | kt | Dec 2025 | 91 | |
| | Dec 2024 | 82 | |
| Price and costs | | | |
Average equivalent zinc concentrate price6 | R/tZn | Dec 2025 | 48,584 | |
| | Dec 2024 | 49,046 | |
| US$/tZn | Dec 2025 | 2,717 | |
| | Dec 2024 | 2,678 | |
All-in sustaining cost7,8 | R/tZn | Dec 2025 | 34,356 | |
| | Dec 2024 | 42,446 | |
| US$/tZn | Dec 2025 | 1,921 | |
| | Dec 2024 | 2,317 | |
All-in cost7,8 | R/tZn | Dec 2025 | 34,912 | |
| | Dec 2024 | 42,617 | |
| US$/tZn | Dec 2025 | 1,953 | |
| | Dec 2024 | 2,327 | |
| Capital expenditure | | | |
| Sustaining capital | Rm | Dec 2025 | 59 | |
| | Dec 2024 | 186 | |
| Project capital | Rm | Dec 2025 | 55 | |
| | Dec 2024 | 6 | |
| Total capital expenditure | Rm | Dec 2025 | 114 | |
| | Dec 2024 | 192 | |
| US$m | Dec 2025 | 6 | |
| | Dec 2024 | 10 | |
Average exchange rates for the year ended 31 December 2025 and 31 December 2024 were R17.88/US$ and R18.32/US$, respectively
Figures may not add as they are rounded independently
1Concentrate produced contains zinc, lead, silver and waste material, which is exported as a relatively dry product
2Concentrate zinc grade is the percentage of zinc contained in the concentrate produced
3Zinc in concentrate produced is the zinc metal contained in the concentrate produced
4Payable zinc production is the payable quantity of zinc metal produced after applying smelter content deductions
5Payable zinc sales is the payable quantity of zinc metal sold after applying smelter content deductions
6Average equivalent zinc concentrate price is the total zinc sales revenue recognised at the price expected to be received excluding the fair value adjustments divided by the payable zinc sales
7All-in sustaining costs and all-in costs are not measures of performance under IFRS and should not be considered in isolation or as substitutes for measures of financial performance prepared in accordance with IFRS. See "Non-IFRS measures" for more information on the metrics presented by Sibanye-Stillwater
8All-in cost excludes income tax, costs associated with merger and acquisition activities, working capital, impairments, financing costs, one-time severance charges and items needed to normalise earnings. For a reconciliation of cost of sales, before amortisation and depreciation to All-in cost, see “All-in costs - Year”
Sibanye-Stillwater Operating and financial results | Six months and year ended 31 December 2025 51
US and SA PGM operations
| | | | | | | | | | | | | | | | | | | | | | | | | | | | | |
| | | | |
| | | US PGM operations1 | Total SA PGM operations2 | Rustenburg including Kroondal | Marikana2 | Plat Mile | Mimosa | Corporate |
Cost of sales, before amortisation and depreciation3 | | Dec 2025 | 2,146 | | 43,214 | | 21,921 | | 20,369 | | 924 | | 2,531 | | (2,531) | |
| | Dec 2024 | 9,846 | | 42,964 | | 21,226 | | 20,912 | | 826 | | 2,483 | | (2,483) | |
Section 45X credit adjustment7 | | Dec 2025 | 2,466 | | | | | | | |
| | Dec 2024 | (1,255) | | | | | | | |
| Royalties | | Dec 2025 | — | | 765 | | 656 | | 109 | | — | | 155 | | (155) | |
| | Dec 2024 | — | | 212 | | 94 | | 117 | | — | | 131 | | (130) | |
| Carbon tax | | Dec 2025 | — | | 3 | | — | | 3 | | — | | — | | — | |
| | Dec 2024 | — | | 1 | | — | | 1 | | — | | — | | — | |
| Community costs | | Dec 2025 | — | | 265 | | 88 | | 177 | | — | | — | | — | |
| | Dec 2024 | — | | 338 | | 106 | | 232 | | — | | — | | — | |
| Inventory change | | Dec 2025 | 556 | | 2,710 | | 2,691 | | 19 | | — | | 44 | | (44) | |
| | Dec 2024 | (999) | | 182 | | 1,621 | | (1,439) | | — | | 8 | | (8) | |
Share-based payments4 | | Dec 2025 | 41 | | 155 | | 79 | | 75 | | 1 | | — | | — | |
| | Dec 2024 | 89 | | 204 | | 103 | | 95 | | 2 | | — | | — | |
Rehabilitation interest and amortisation5 | | Dec 2025 | 34 | | 207 | | 157 | | 50 | | — | | 8 | | (8) | |
| | Dec 2024 | 45 | | 93 | | 75 | | 18 | | — | | 6 | | (6) | |
| Leases | | Dec 2025 | 2 | | 50 | | 19 | | 29 | | 2 | | — | | — | |
| | Dec 2024 | 4 | | 63 | | 24 | | 38 | | 2 | | — | | (1) | |
| Ore reserve development | | Dec 2025 | 1,212 | | 2,344 | | 747 | | 1,597 | | — | | — | | — | |
| | Dec 2024 | 1,920 | | 2,472 | | 699 | | 1,773 | | — | | — | | — | |
| Sustaining capital expenditure | | Dec 2025 | 363 | | 2,867 | | 1,479 | | 1,353 | | 35 | | 358 | | (358) | |
| | Dec 2024 | 611 | | 2,567 | | 1,407 | | 1,118 | | 42 | | 548 | | (548) | |
| Less: By-product credit | | Dec 2025 | (708) | | (11,714) | | (5,535) | | (5,785) | | (394) | | (417) | | 417 | |
| | Dec 2024 | (852) | | (11,676) | | (6,245) | | (5,005) | | (426) | | (588) | | 588 | |
Total All-in-sustaining costs6 | | Dec 2025 | 6,112 | | 40,866 | | 22,302 | | 17,996 | | 568 | | 2,679 | | (2,679) | |
| | Dec 2024 | 9,409 | | 37,420 | | 19,110 | | 17,860 | | 446 | | 2,588 | | (2,588) | |
| Plus: Corporate cost, growth and capital expenditure | | Dec 2025 | 188 | | 670 | | 57 | | 620 | | — | | — | | (7) | |
| | Dec 2024 | 316 | | 835 | | 101 | | 708 | | 18 | | — | | 8 | |
Total All-in-costs6 | | Dec 2025 | 6,300 | | 41,536 | | 22,359 | | 18,616 | | 568 | | 2,679 | | (2,686) | |
| | Dec 2024 | 9,725 | | 38,255 | | 19,211 | | 18,568 | | 464 | | 2,588 | | (2,580) | |
| PGM production | 4Eoz - 2Eoz | Dec 2025 | 284,069 | | 1,797,928 | | 922,573 | | 726,033 | | 32,303 | | 117,019 | | — | |
| | Dec 2024 | 425,842 | | 1,835,410 | | 890,960 | | 775,709 | | 46,102 | | 122,639 | | — | |
| kg | Dec 2025 | 8,836 | | 55,922 | | 28,695 | | 22,582 | | 1,005 | | 3,640 | | — | |
| | Dec 2024 | 13,245 | | 57,088 | | 27,712 | | 24,127 | | 1,434 | | 3,815 | | — | |
All-in-sustaining cost6 | R/4Eoz - R/2Eoz | Dec 2025 | 21,516 | | 24,312 | | 24,174 | | 24,787 | | 17,584 | | 22,894 | | — | |
| | Dec 2024 | 22,096 | | 21,848 | | 21,449 | | 23,024 | | 9,674 | | 21,103 | | — | |
| US$/4Eoz - US$/2Eoz | Dec 2025 | 1,203 | | 1,360 | | 1,352 | | 1,386 | | 983 | | 1,280 | | — | |
| | Dec 2024 | 1,206 | | 1,193 | | 1,171 | | 1,257 | | 528 | | 1,152 | | — | |
All-in-cost6 | R/4Eoz - R/2Eoz | Dec 2025 | 22,178 | | 24,710 | | 24,235 | | 25,641 | | 17,584 | | 22,894 | | — | |
| | Dec 2024 | 22,838 | | 22,335 | | 21,562 | | 23,937 | | 10,065 | | 21,103 | | — | |
| US$/4Eoz - US$/2Eoz | Dec 2025 | 1,240 | | 1,382 | | 1,355 | | 1,434 | | 983 | | 1,280 | | — | |
| | Dec 2024 | 1,247 | | 1,219 | | 1,177 | | 1,307 | | 549 | | 1,152 | | — | |
Average exchange rates for the year ended 31 December 2025 and 31 December 2024 were R17.88/US$ and R18.32/US$, respectively
Figures may not add as they are rounded independently
1The US PGM operations’ underground production is converted to metric tonnes and kilograms, and financial performance is translated into SA rand. In addition to the US PGM operations’ underground production, the operation processes various recycling material, which is excluded from the 2E PGM production, All-in sustaining cost and All-in cost statistics shown
2The Total SA PGM operations and Marikana includes the production and costs associated with the purchase of concentrate (PoC) from third parties. For a reconciliation of the Operating cost, AISC and AIC excluding third party PoC, refer to “Reconciliation of operating cost excluding third party PoC for Total SA PGM operations and Marikana - Year” and “Reconciliation of AISC and AIC excluding third party PoC for Total SA PGM operations and Marikana – Year”
3Cost of sales, before amortisation and depreciation includes all mining and processing costs, third party refining costs, corporate general and administrative costs, and permitting costs
4Share-based payments are calculated based on the fair value at grant date and do not include the adjustment of the cash-settled share-based payment obligation to the reporting date fair value
5Rehabilitation includes the interest charge related to the environmental rehabilitation obligation and the amortisation of the related capitalised rehabilitation costs. The interest charge related to the environmental rehabilitation obligation and the amortisation of the capitalised rehabilitation costs reflect the periodic costs of rehabilitation associated with current PGM production
6All-in cost excludes income tax, costs associated with merger and acquisition activities, working capital, impairments, financing costs, one-time severance charges and items needed to normalise earnings. All-in cost is made up of All-in sustaining cost, being the cost to sustain current operations, given as a sub-total in the All-in cost calculation, together with corporate and major capital expenditure associated with growth. All-in sustaining cost per ounce and All-in cost per ounce are calculated by dividing the All-in sustaining cost and All-in cost, respectively, in a period by the total 4E/2E PGM produced (excluding Mimosa) in the same period
7The Inflation Reduction Act Section 45X Advanced Manufacturing Production Credit provides credits to the US PGM operations equal to 10% of production costs incurred for critical minerals produced and sold after December 31, 2022. During the year ended 31 December 2025 the US PGM operations recognised R2,466 million (US$139 million) which relates to mining costs incurred for the years ended 31 December 2024 and 31 December 2023, respectively . Although these amounts were recognised as a credit against the 30 June 2025 cost of sales, management believes that the cost of sales for the period ended 30 June 2025 should be adjusted with the 2023 and 2024 credits against the period when the mining costs were accrued. It is expected that, because the required certification requirements were addressed in June 2025, the recognition of the credits will now match the related mining cost accruals. Accordingly, total All-in-sustaining costs and total All-in-costs were adjusted to reflect the appropriate amounts which relates to the periods presented above
Sibanye-Stillwater Operating and financial results | Six months and year ended 31 December 2025 52
ALL-IN COSTS – YEAR (continued) | | | | | | | | | | | | | | | | | |
Reconciliation of operating cost excluding third party PoC for Total SA PGM operations and Marikana - Year |
| | Total SA PGM operations | Marikana |
| Rm | Dec 2025 | Dec 2024 | Dec 2025 | Dec 2024 |
| Cost of sales, before amortisation and depreciation as reported per table above | | 43,214 | | 42,964 | | 20,369 | | 20,912 | |
| Inventory change as reported per table above | | 2,710 | | 182 | | 19 | | (1,439) | |
| Less: Chrome cost of sales | | (1,868) | | (2,056) | | (482) | | (394) | |
| Total operating cost including third party PoC | | 44,056 | | 41,090 | | 19,906 | | 19,079 | |
| Less: Purchase cost of PoC | | (2,550) | | (2,407) | | (2,550) | | (2,407) | |
| Total operating cost excluding third party PoC | | 41,506 | | 38,683 | | 17,356 | | 16,672 | |
| | | | | |
| PGM production as reported per table above | 4Eoz- 2Eoz | 1,797,928 | | 1,835,410 | | 726,033 | | 775,709 | |
| Less: Mimosa production | | (117,019) | | (122,639) | | — | | — | |
| PGM production excluding Mimosa | | 1,680,909 | | 1,712,771 | | 726,033 | | 775,709 | |
| Less: PoC production | | (73,150) | | (96,464) | | (73,150) | | (96,464) | |
| PGM production excluding Mimosa and third party PoC | | 1,607,759 | | 1,616,307 | | 652,883 | | 679,245 | |
| | | | | |
| PGM production including Mimosa and excluding third party PoC | | 1,724,778 | | 1,738,946 | | 652,883 | | 679,245 | |
| | | | | |
| Tonnes milled/treated | kt | 36,496 | | 35,842 | | 9,418 | | 10,174 | |
| Less: Mimosa tonnes | | (1,457) | | (1,469) | | — | | — | |
| PGM tonnes excluding Mimosa and third party PoC | | 35,039 | | 34,373 | | 9,418 | | 10,174 | |
| Operating cost including third party PoC | R/4Eoz-R/2Eoz | 26,210 | | 23,990 | | 27,417 | | 24,596 | |
| US$/4Eoz-US$/2Eoz | 1,466 | | 1,310 | | 1,533 | | 1,343 | |
| R/t | 1,257 | | 1,195 | | 2,114 | | 1,875 | |
| US$/t | 70 | | 65 | | 118 | | 102 | |
| Operating cost excluding third party PoC | R/4Eoz-R/2Eoz | 25,816 | | 23,933 | | 26,584 | | 24,545 | |
| US$/4Eoz-US$/2Eoz | 1,444 | | 1,307 | | 1,487 | | 1,340 | |
| R/t | 1,185 | | 1,125 | | 1,843 | | 1,639 | |
| US$/t | 66 | | 61 | | 103 | | 89 | |
| | | | | | | | | | | | | | | | | |
Reconciliation of AISC and AIC excluding third party PoC for Total SA PGM operations and Marikana - Year |
| | Total SA PGM operations | Marikana |
| Rm | Dec 2025 | Dec 2024 | Dec 2025 | Dec 2024 |
| Total All-in-sustaining cost as reported per table above | | 40,866 | | 37,420 | | 17,996 | | 17,860 | |
| Less: Purchase cost of PoC | | (2,550) | | (2,407) | | (2,550) | | (2,407) | |
| Add: By-product credit of PoC | | 581 | | 462 | | 581 | | 462 | |
| Total All-in-sustaining cost excluding third party PoC | | 38,897 | | 35,475 | | 16,027 | | 15,915 | |
| Plus: Corporate cost, growth and capital expenditure | | 670 | | 835 | | 620 | | 708 | |
| Total All-in-cost excluding third party PoC | | 39,567 | | 36,310 | | 16,647 | | 16,623 | |
| | | | | |
| PGM production excluding Mimosa and third party PoC | 4Eoz- 2Eoz | 1,607,759 | | 1,616,307 | | 652,883 | | 679,245 | |
| | | | | |
| All-in-sustaining cost excluding third party PoC | R/4Eoz-R/2Eoz | 24,193 | | 21,948 | | 24,548 | | 23,430 | |
| US$/4Eoz-US$/2Eoz | 1,353 | | 1,198 | | 1,373 | | 1,279 | |
| | | | | |
| All-in-cost excluding third party PoC | R/4Eoz-R/2Eoz | 24,610 | | 22,465 | | 25,498 | | 24,473 | |
| US$/4Eoz-US$/2Eoz | 1,376 | | 1,226 | | 1,426 | | 1,336 | |
Sibanye-Stillwater Operating and financial results | Six months and year ended 31 December 2025 53
ALL-IN COSTS – YEAR (continued) SA gold operations
Figures are in rand millions unless otherwise stated
| | | | | | | | | | | | | | | | | | | | | | | | | | | | | |
| | | Total SA gold | Driefontein | Kloof | Beatrix | Cooke | DRDGOLD | Corporate |
Cost of sales, before amortisation and depreciation1 | | Dec 2025 | 22,988 | | 6,961 | | 5,594 | | 4,229 | | 1,555 | | 4,649 | | — | |
| | Dec 2024 | 23,598 | | 6,949 | | 6,326 | | 4,260 | | 1,579 | | 4,484 | | — | |
| Royalties | | Dec 2025 | 148 | | 215 | | 28 | | 152 | | 3 | | — | | (250) | |
| | Dec 2024 | 115 | | 49 | | 34 | | 56 | | 6 | | — | | (30) | |
| Carbon tax | | Dec 2025 | (3) | | — | | — | | (4) | | — | | 1 | | — | |
| | Dec 2024 | — | | — | | — | | — | | — | | — | | — | |
| Community costs | | Dec 2025 | 25 | | — | | — | | — | | — | | 25 | | — | |
| | Dec 2024 | 13 | | — | | — | | — | | — | | 13 | | — | |
Share-based payments2 | | Dec 2025 | 94 | | 23 | | 15 | | 14 | | 2 | | 40 | | — | |
| | Dec 2024 | 121 | | 39 | | 33 | | 18 | | — | | 27 | | 4 | |
Rehabilitation interest and amortisation3 | | Dec 2025 | 245 | | 23 | | 36 | | 90 | | 117 | | (28) | | 7 | |
| | Dec 2024 | 226 | | (2) | | 25 | | 104 | | 105 | | (12) | | 6 | |
| Leases | | Dec 2025 | 35 | | 2 | | 8 | | 14 | | — | | 11 | | — | |
| | Dec 2024 | 33 | | — | | 9 | | 6 | | — | | 18 | | — | |
| Ore reserve development | | Dec 2025 | 2,931 | | 1,699 | | 981 | | 251 | | — | | — | | — | |
| | Dec 2024 | 2,837 | | 1,663 | | 932 | | 242 | | — | | — | | — | |
| Sustaining capital expenditure | | Dec 2025 | 1,079 | | 414 | | 251 | | 111 | | — | | 303 | | — | |
| | Dec 2024 | 931 | | 380 | | 247 | | 64 | | — | | 240 | | — | |
| Less: By-product credit | | Dec 2025 | (26) | | (10) | | (5) | | (3) | | — | | (8) | | — | |
| | Dec 2024 | (35) | | (10) | | (4) | | (4) | | — | | (17) | | — | |
Total All-in-sustaining costs4 | | Dec 2025 | 27,516 | | 9,327 | | 6,908 | | 4,854 | | 1,677 | | 4,993 | | (243) | |
| | Dec 2024 | 27,839 | | 9,068 | | 7,602 | | 4,746 | | 1,690 | | 4,753 | | (20) | |
| Plus: Corporate cost, growth and capital expenditure | | Dec 2025 | 2,660 | | — | | — | | — | | — | | 2,673 | | (13) | |
| | Dec 2024 | 3,554 | | — | | — | | — | | — | | 3,131 | | 423 | |
Total All-in-costs4 | | Dec 2025 | 30,176 | | 9,327 | | 6,908 | | 4,854 | | 1,677 | | 7,666 | | (256) | |
| | Dec 2024 | 31,393 | | 9,068 | | 7,602 | | 4,746 | | 1,690 | | 7,884 | | 403 | |
| Gold sold | kg | Dec 2025 | 19,081 | | 6,876 | | 3,257 | | 3,424 | | 885 | | 4,639 | | — | |
| | Dec 2024 | 22,239 | | 7,176 | | 4,952 | | 3,873 | | 1,217 | | 5,021 | | — | |
| oz | Dec 2025 | 613,468 | | 221,068 | | 104,715 | | 110,084 | | 28,453 | | 149,147 | | — | |
| | Dec 2024 | 715,000 | | 230,714 | | 159,210 | | 124,520 | | 39,127 | | 161,429 | | — | |
All-in-sustaining cost4 | R/kg | Dec 2025 | 1,442,063 | | 1,356,457 | | 2,120,970 | | 1,417,640 | | 1,894,915 | | 1,076,310 | | — | |
| | Dec 2024 | 1,251,810 | | 1,263,657 | | 1,535,137 | | 1,225,407 | | 1,388,661 | | 946,624 | | — | |
| All-in-sustaining cost | US$/oz | Dec 2025 | 2,509 | | 2,360 | | 3,690 | | 2,466 | | 3,296 | | 1,872 | | — | |
| | Dec 2024 | 2,126 | | 2,146 | | 2,607 | | 2,081 | | 2,358 | | 1,607 | | — | |
All-in-cost4 | R/kg | Dec 2025 | 1,581,468 | | 1,356,457 | | 2,120,970 | | 1,417,640 | | 1,894,915 | | 1,652,511 | | — | |
| | Dec 2024 | 1,411,619 | | 1,263,657 | | 1,535,137 | | 1,225,407 | | 1,388,661 | | 1,570,205 | | — | |
| All-in-cost | US$/oz | Dec 2025 | 2,751 | | 2,360 | | 3,690 | | 2,466 | | 3,296 | | 2,875 | | — | |
| | Dec 2024 | 2,397 | | 2,146 | | 2,607 | | 2,081 | | 2,358 | | 2,666 | | — | |
Average exchange rates for the year ended 31 December 2025 and 31 December 2024 were R17.88/US$ and R18.32/US$, respectively
Figures may not add as they are rounded independently
1 Cost of sales, before amortisation and depreciation includes all mining and processing costs, third party refining costs, corporate general and administrative costs, and permitting costs
1.Share-based payments are calculated based on the fair value at grant date and do not include the adjustment of the cash-settled share-based payment obligation to the reporting date fair value
2.Rehabilitation includes the interest charge related to the environmental rehabilitation obligation and the amortisation of the related capitalised rehabilitation costs. The interest charge related to the environmental rehabilitation obligation and the amortisation of the capitalised rehabilitation costs reflect the periodic costs of rehabilitation associated with current gold production
3.All-in cost excludes income tax, costs associated with merger and acquisition activities, working capital, impairments, financing costs, one time severance charges and items needed to normalise earnings. All-in cost is made up of All-in sustaining cost, being the cost to sustain current operations, given as a sub-total in the All-in cost calculation, together with corporate and major capital expenditure associated with growth. All-in sustaining cost per kilogram (and ounce) and All-in cost per kilogram (and ounce) are calculated by dividing the All-in sustaining cost and All-in cost, respectively, in a period by the total gold sold over the same period
Sibanye-Stillwater Operating and financial results | Six months and year ended 31 December 2025 54
ALL-IN COSTS – YEAR (continued) Australian operations
Figures are in rand millions unless otherwise stated
| | | | | | | | | | | |
Century zinc retreatment operation |
| | | |
Cost of sales, before amortisation and depreciation1 | | Dec 2025 | 3,061 | |
| | Dec 2024 | 3,326 | |
| Royalties | | Dec 2025 | 231 | |
| | Dec 2024 | 216 | |
| | | |
| | | |
| Community costs | | Dec 2025 | 62 | |
| | Dec 2024 | 54 | |
| Inventory change | | Dec 2025 | 198 | |
| | Dec 2024 | (348) | |
Share-based payments2 | | Dec 2025 | 17 | |
| | Dec 2024 | 7 | |
Rehabilitation interest and amortisation3 | | Dec 2025 | 73 | |
| | Dec 2024 | 156 | |
| Leases | | Dec 2025 | 105 | |
| | Dec 2024 | 116 | |
| Sustaining capital expenditure | | Dec 2025 | 59 | |
| | Dec 2024 | 186 | |
| Less: By-product credit | | Dec 2025 | (346) | |
| | Dec 2024 | (218) | |
Total All-in-sustaining costs4 | | Dec 2025 | 3,460 | |
| | Dec 2024 | 3,495 | |
| Plus: Corporate cost, growth and capital expenditure | | Dec 2025 | 56 | |
| | Dec 2024 | 14 | |
Total All-in-costs4 | | Dec 2025 | 3,516 | |
| | Dec 2024 | 3,509 | |
| Payable zinc production | kt | Dec 2025 | 101 | |
| | Dec 2024 | 82 | |
All-in-sustaining cost4 | R/tZn | Dec 2025 | 34,356 | |
| | Dec 2024 | 42,446 | |
| US$/tZn | Dec 2025 | 1,921 | |
| | Dec 2024 | 2,317 | |
All-in-cost4 | R/tZn | Dec 2025 | 34,912 | |
| | Dec 2024 | 42,617 | |
| US$/tZn | Dec 2025 | 1,953 | |
| | Dec 2024 | 2,327 | |
Average exchange rates for the year ended 31 December 2025 and 31 December 2024 were R17.88/US$ and R18.32/US$, respectively
Figures may not add as they are rounded independently
1.Cost of sales, before amortisation and depreciation includes all mining and processing costs, corporate general and administrative costs, and permitting costs
1Share-based payments are calculated based on the fair value at grant date and do not include the adjustment of the cash-settled share-based payment obligation to the reporting date fair value
2Rehabilitation includes the interest charge related to the environmental rehabilitation obligation and the amortisation of the related capitalised rehabilitation costs. The interest charge related to the environmental rehabilitation obligation and the amortisation of the capitalised rehabilitation costs reflect the periodic costs of rehabilitation associated with current zinc production
3All-in cost excludes income tax, costs associated with merger and acquisition activities, working capital, impairments, financing costs, one-time severance charges and items needed to normalise earnings. All-in cost is made up of All-in sustaining cost, being the cost to sustain current operations, given as a sub-total in the All-in cost calculation, together with corporate and major capital expenditure associated with growth. All-in sustaining cost per tonne and All-in cost per tonne are calculated by dividing the All-in sustaining cost and All-in cost, respectively, in a period by the total tonnes of payable zinc metal produced in the same period
Sibanye-Stillwater Operating and financial results | Six months and year ended 31 December 2025 55
UNIT OPERATING COST – YEARUS and SA PGM operations Figures are in rand millions unless otherwise stated
| | | | | | | | | | | | | | | | | | | | | | | | | | | | | | | | |
|
| | | US PGM operations | Total SA PGM operations2,3 | Rustenburg including Kroondal3 | Marikana3 | Plat Mile3 | Mimosa |
| | | Under- ground1 | Total | Under-
ground | Surface | Under-
ground | Surface | Surface | Attribu-table |
| | | | | | | | | | |
| Cost of sales, before amortisation and depreciation | | Dec 2025 | 2,146 | | 43,214 | 20,564 | | 1,357 | | 20,369 | 924 | | 2,531 | |
| | Dec 2024 | 9,846 | | 42,964 | | 19,917 | | 1,309 | | 20,912 | 826 | | 2,483 | |
Section 45X credit adjustment6 | | Dec 2025 | 2,466 | | — | | — | | — | | — | — | | — | |
| | Dec 2024 | (1,255) | | — | | — | | — | | — | — | | — | |
| Inventory change | | Dec 2025 | 556 | | 2,710 | | 2,707 | | (16) | | 19 | — | | 44 | |
| | Dec 2024 | (999) | | 182 | | 1,595 | | 26 | | (1,439) | — | | 8 | |
| Less: Chrome cost of sales | | Dec 2025 | — | | (1,868) | | (1,182) | | — | | (482) | (204) | | — | |
| | Dec 2024 | — | | (2,056) | | (1,496) | | — | | (394) | (166) | | — | |
| Less: Purchase cost of PoC | | Dec 2025 | — | | (2,550) | | — | | — | | (2,550) | — | | — | |
| | Dec 2024 | — | | (2,407) | | — | | — | | (2,407) | — | | — | |
| Total operating cost excluding third party PoC | | Dec 2025 | 5,168 | | 41,506 | 22,089 | | 1,341 | | 17,356 | 720 | | 2,575 | |
| | Dec 2024 | 7,592 | | 38,683 | | 20,016 | | 1,335 | | 16,672 | 660 | | 2,491 | |
| Tonnes milled/treated excluding third party PoC | kt | Dec 2025 | 760 | | 35,039 | | 11,000 | | 5,205 | | 6,103 | | 3,315 | | 9,416 | | 1,457 | |
| | Dec 2024 | 1,129 | | 34,373 | | 10,340 | | 5,370 | | 6,138 | | 4,036 | | 8,489 | | 1,469 | |
PGM production excluding third party PoC4 | 4Eoz - 2Eoz | Dec 2025 | 284,069 | | 1,607,759 | 870,881 | | 51,692 | | 652,883 | 32,303 | | 117,019 | |
| | Dec 2024 | 425,842 | | 1,616,307 | | 818,847 | | 72,113 | | 679,245 | 46,102 | | 122,639 | |
Operating cost5 | R/t | Dec 2025 | 6,797 | | 1,185 | | 2,008 | | 258 | | 1,843 | 76 | | 1,767 | |
| | Dec 2024 | 6,727 | | 1,125 | | 1,936 | | 249 | | 1,639 | 78 | | 1,696 | |
| US$/t | Dec 2025 | 380 | | 66 | | 112 | | 14 | | 103 | 4 | | 99 | |
| | Dec 2024 | 367 | | 61 | | 106 | | 14 | | 89 | 4 | | 93 |
| R/4Eoz - R/2Eoz | Dec 2025 | 18,193 | | 25,816 | | 25,364 | | 25,942 | | 26,584 | 22,289 | | 22,005 | |
| | Dec 2024 | 17,828 | | 23,933 | | 24,444 | | 18,513 | | 24,545 | 14,316 | | 20,312 | |
| US$/4Eoz - US$/2Eoz | Dec 2025 | 1,017 | | 1,444 | | 1,419 | | 1,451 | | 1,487 | 1,247 | | 1,231 | |
| | Dec 2024 | 973 | | 1,307 | | 1,335 | | 1,011 | | 1,340 | 782 | | 1,109 | |
Average exchange rates for the year ended 31 December 2025 and 31 December 2024 were R17.88/US$ and R18.32/US$, respectively
Figures may not add as they are rounded independently
1 The US PGM operations’ underground production is converted to metric tonnes and kilograms, and performance is translated into rand. In addition to the US PGM operations’
underground production, the operation treats various recycling material which is excluded from the statistics shown above
2 Total SA PGM operations exclude the results of Mimosa (financial and production results), which is equity accounted
3 Cost of sales, before amortisation and depreciation for Total SA PGM operations, Rustenburg (including Kroondal), Marikana and Platinum Mile includes the Chrome cost of sales which is excluded for operating unit cost calculation purposes as Chrome production is excluded from the concentrate production
4 For a reconciliation of the production excluding Mimosa and third party PoC, refer to “Reconciliation of operating cost excluding third party PoC for Total SA PGM operations and Marikana - Year”
5 Operating cost is the average cost of production and operating cost per tonne is calculated by dividing the cost of sales, before amortisation and depreciation, adjusted for change in inventory, less chrome- and PoC cost of sales in a period by the tonnes milled/treated in the same period, and operating cost per ounce is calculated by dividing the cost of sales, before amortisation and depreciation, adjusted for change in inventory, less chrome- and PoC cost of sales in a period, by the PGM produced in the same period
6 The US PGM operations’ operating cost for the year ended 31 December 2025 were adjusted to include the Section 45X Advance Manufacturing Production Credits. During the year ended 31 December 2025 the US PGM operations recognised R2,466 million (US$139 million) which relates to mining costs incurred for the years ended 31 December 2024 and 31 December 2023, respectively
Sibanye-Stillwater Operating and financial results | Six months and year ended 31 December 2025 56
UNIT OPERATING COST – YEAR (continued) SA gold operations
Figures are in rand millions unless otherwise stated
| | | | | | | | | | | | | | | | | | | | | | | | | | | | | | | | | | | | | | | | | |
|
| | | Total SA gold operations | Driefontein | Kloof | Beatrix | Cooke | DRDGOLD |
| | | Total | Under-
ground | Surface | Under-
ground | Surface | Under-
ground | Surface | Under-
ground | Surface | Surface | Surface |
| | | | | | | | | | | | | |
| Cost of sales, before amortisation and depreciation | | Dec 2025 | 22,988 | | 16,613 | | 6,375 | | 6,961 | | — | | 5,423 | | 171 | | 4,229 | | — | | 1,555 | | 4,649 | |
| | Dec 2024 | 23,598 | | 16,943 | | 6,655 | | 6,934 | | 15 | | 5,774 | | 552 | | 4,235 | | 25 | | 1,579 | | 4,484 | |
| Inventory change | | Dec 2025 | 1,208 | | 1,151 | | 57 | | 482 | | — | | 328 | | 14 | | 341 | | — | | 63 | | (20) | |
| | Dec 2024 | (257) | | (271) | | 14 | | (122) | | — | | (70) | | (11) | | (79) | | — | | 31 | | (6) | |
| Total operating cost | | Dec 2025 | 24,196 | | 17,764 | | 6,432 | | 7,443 | | — | | 5,751 | | 185 | | 4,570 | | — | | 1,618 | | 4,629 | |
| | Dec 2024 | 23,341 | | 16,672 | | 6,669 | | 6,812 | | 15 | | 5,704 | | 541 | | 4,156 | | 25 | | 1,610 | | 4,478 | |
| Tonnes milled/treated | kt | Dec 2025 | 32,815 | | 3,209 | | 29,607 | | 1,060 | | 1 | | 840 | | 467 | | 1,308 | | 1 | | 3,984 | | 25,154 | |
| | Dec 2024 | 33,522 | | 3,594 | | 29,928 | | 1,152 | | 50 | | 1,147 | | 1,358 | | 1,295 | | 76 | | 4,425 | | 24,019 | |
| Gold produced | kg | Dec 2025 | 19,668 | | 13,893 | | 5,775 | | 7,216 | | — | | 3,095 | | 279 | | 3,582 | | — | | 894 | | 4,602 | |
| | Dec 2024 | 21,915 | | 15,038 | | 6,877 | | 6,965 | | 50 | | 4,322 | | 570 | | 3,751 | | 14 | | 1,224 | | 5,019 | |
| oz | Dec 2025 | 632,341 | | 446,670 | | 185,671 | | 232,000 | | — | | 99,507 | | 8,970 | | 115,164 | | — | | 28,743 | | 147,958 | |
| | Dec 2024 | 704,583 | | 483,483 | | 221,101 | | 223,930 | | 1,608 | | 138,955 | | 18,326 | | 120,597 | | 450 | | 39,353 | | 161,365 | |
Operating cost1 | R/t | Dec 2025 | 737 | | 5,536 | | 217 | | 7,020 | | — | | 6,843 | | 396 | | 3,494 | | — | | 406 | | 184 | |
| | Dec 2024 | 696 | | 4,639 | | 223 | | 5,912 | | 300 | | 4,973 | | 398 | | 3,210 | | 327 | | 364 | | 186 | |
| US$/t | Dec 2025 | 41 | | 310 | | 12 | | 393 | | — | | 383 | | 22 | | 195 | | — | | 23 | | 10 | |
| | Dec 2024 | 38 | | 253 | | 12 | | 323 | | 16 | | 272 | | 22 | | 175 | | 18 | | 20 | | 10 | |
| R/kg | Dec 2025 | 1,230,222 | | 1,278,630 | | 1,113,766 | | 1,031,458 | | — | | 1,858,158 | | 663,082 | | 1,275,824 | | — | | 1,809,843 | | 1,005,867 |
| | Dec 2024 | 1,065,070 | | 1,108,658 | | 969,754 | | 978,033 | | 300,000 | | 1,319,759 | | 949,123 | | 1,107,971 | | 1,785,714 | | 1,315,359 | | 892,210 | |
| US$/oz | Dec 2025 | 2,140 | | 2,224 | | 1,937 | | 1,794 | | — | | 3,232 | | 1,153 | | 2,219 | | — | | 3,148 | | 1,750 | |
| | Dec 2024 | 1,809 | | 1,883 | | 1,647 | | 1,661 | | 509 | | 2,241 | | 1,612 | | 1,881 | | 3,032 | | 2,234 | | 1,515 | |
Average exchange rates for the year ended 31 December 2025 and 31 December 2024 were R17.88/US$ and R18.32/US$, respectively
Figures may not add as they are rounded independently
1 Operating cost is the average cost of production and operating cost per tonne is calculated by dividing the cost of sales, before amortisation and depreciation and change in inventory in a period by the tonnes milled/treated in the same period, and operating cost per kilogram (and ounce) is calculated by dividing the cost of sales, before amortisation and depreciation and change in inventory in a period by the gold produced in the same period
Non-IFRS measures
Sibanye-Stillwater presents certain non-IFRS figures to provide readers with additional financial information that is regularly reviewed by management to assess the operational performance of the Group. These non-IFRS measures should not be considered as alternatives to IFRS Accounting Standards measures, including cost of sales, net operating profit, profit before taxation, cash from operating activities or any other measure of financial performance presented in accordance with IFRS Accounting Standards, and may not be comparable to similarly titled measures of other companies.
The non-IFRS financial measures discussed in this document are listed below:
Sibanye-Stillwater Operating and financial results | Six months and year ended 31 December 2025 57
| | | | | | | | | | | |
Non-IFRS measure | Definition | Purpose why these non-IFRS measures are reported | Reconciled on page |
| | | |
Adjusted EBITDA | Adjusted earnings before interest, tax, depreciation and amortisation, and is reported based on the formula included in Sibanye-Stillwater’s facility agreements for compliance with the debt covenant formula and involves eliminating the effects of various one-time, irregular, and non-recurring items from the standard EBITDA calculation | Used in the calculation of the debt covenant ratio: net debt/(cash) to adjusted EBITDA | 42,60,61,62 |
Notional free cash flow (FCF) | Sibanye-Stillwater defines notional free cash flow as adjusted EBITDA, less non cash revenue relating to streaming transactions and deferred prepayments, non cash government grants and accrued taxes and royalties, and includes other non-routine cash items such as legal dispute settlements and realised hedges. | Report one of the drivers considered by management to illustrate cash available for dividends and other investing activities | 11,63,64 |
All-in sustaining costs (AISC) | Cost of sales before amortisation and depreciation plus additional costs which include community costs, inventory change (PGM operations only), share-based payments, royalties, carbon tax, rehabilitation, leases, ore reserve development (ORD), sustaining capital expenditure and deducting the by-product credit | Developed by the World Gold council for the purpose of the gold mining industry, AISC provides metrics and aims to reflect the full cost to sustain the production and sale of our commodities, and reporting this metric allows for a meaningful comparisons across our operations and different mining companies | 43,44,45,46,52,53,54,55 |
All-in costs (AIC) | AISC plus additional costs relating to corporate and major capital expenditure associated with growth | Developed by the World Gold council for the purpose of the gold mining industry, AIC provides metrics and aims to reflect the full cost to sustain the production and sale of our commodities, after including growth capital, and reporting this metric allows for a meaningful comparisons across our operations and different mining companies | 43,44,45,46,52,53,54,55 |
AISC/AIC per unit | AISC/AIC divided by the total PGM produced/gold sold/payable zinc production | Developed by the World Gold council for the purpose of the gold mining industry, AISC/AIC per unit provides a metric that aims to reflect the full cost to sustain the production and sale, after including growth capital (AIC), of an ounce/kilogram/tonne of commodity and reporting this metric allows for a meaningful comparisons across our operations and different mining companies | 43,44,45,46,52,53,54,55 |
Headline earnings | Calculated based on the requirements set out in SAICA Circular 1/2023 | Reported in compliance with the Johannesburg Stock Exchange (JSE) Listings Requirements | 33 |
Headline earnings per share (HEPS) | Headline earnings divided by the weighted average number of ordinary shares in issue during the year | Reported in compliance with the JSE Listings Requirements | 33 |
Diluted headline earnings per share | Headline earnings divided by the diluted weighted average number of ordinary shares in issue during the year | Reported in compliance with the JSE Listings Requirements | 34 |
Interest coverage ratio | Adjusted EBITDA divided by net contractual finance charges/(income) settled in cash during the period | Report compliance with the debt covenant: interest coverage ratio | 41 |
Net debt/(cash) | Borrowings and bank overdraft less cash and cash equivalents, excluding Burnstone debt, bank overdraft and cash | Used in the calculation of the debt covenant ratio: net debt/(cash) to adjusted EBITDA | 37 |
Net debt/(cash) to adjusted EBITDA (ratio) | Net debt/(cash) as of the end of a reporting period divided by adjusted EBITDA of the last 12 months ended on the same reporting date | Report compliance with the debt covenant: net debt/(cash) to adjusted EBITDA ratio | 37 |
Normalised earnings | Earnings attributable to the owners of Sibanye-Stillwater excluding gains and losses on financial instruments and foreign exchange differences, impairments and related compensation, gain/loss on disposal of property, plant and equipment, occupational healthcare expenses, restructuring costs, transactions costs, share-based payment expenses on B-BBEE transactions, gains on acquisitions, net other business development costs, share of results of equity-accounted investees, all after tax and the impact of non-controlling interest, and changes in the estimated deferred tax rate. | Report the measure used by the Group to determine dividend payments in line with our dividend policy | 34 |
| | | |
Sibanye-Stillwater Operating and financial results | Six months and year ended 31 December 2025 58
| | | | | | | | | | | |
Non-IFRS measure | Definition | Purpose why these non-IFRS measures are reported | Reconciled on page |
| | | |
Operating costs | The average cost of production, and operating cost per tonne is calculated by dividing the cost of sales, before amortisation and depreciation and change in inventory in a period by the tonnes milled/treated in the same period, and operating cost per ounce (and kilograms) is calculated by dividing the cost of sales, before amortisation and depreciation and change in inventory in a period by the gold kilograms produced or PGM 2E and 4E ounces produced in the same period | Report a measure that aims to reflect the operating cost to produce our commodities, and reporting this metric allows for a meaningful comparisons across our operations and different mining companies | 47,48,56,57 |
| | | |
Sibanye-Stillwater Operating and financial results | Six months and year ended 31 December 2025 59
ADJUSTED EBITDA RECONCILIATION – YEARS | | | | | | | | | | | | | | | | | | | | | | | | | | | | | | | | | | | | | | | | | | | | | | | | | | | | | | | | | | | | | | | | | | | | | | | | | | | | | | | | | | | | | | |
| For the year ended 31 Dec 2025 (Reviewed) |
| | SA OPERATIONS | | AMERICAS | | | | | | EUROPE | | | AUSTRALIA | | | |
| GROUP | PRIMARY MINING | SECONDARY MINING | | | | | PRIMARY MINING | RECYCLING | | | | | | | SECONDARY MINING | | GROUP |
| SA rand | Total | Total SA
Operations | Total
SA PGM | Rusten
burg | Marikana | Platinum
Mile | Mimosa | Corporate and re- conciling items1 | Total
SA gold | Drie-
fontein | Kloof | Beatrix | DRD-
GOLD | Corporate and re- conciling items1 | Total international operations | Total US operations | Total US PGM | US PGM | Total US recycling | Columbus | Pennsylvania site and North Carolina site | Total EU operations | Sandouville nickel refinery | Corporate and re- conciling items1 | Total AUS operations | Century zinc retreatment operation | Corporate and re- conciling items1 | Cor- porate1 |
| Reconciliation of profit before royalties, carbon tax and tax to adjusted EBITDA: | | | | | | | | | | | | | | | | | | | | | | | | | | | | |
| (Loss)/profit before royalties, carbon tax and tax | 734 | 14,098 | 10,626 | 7,066 | 4,563 | 102 | (8) | (1,097) | 3,472 | 3,650 | (4,843) | 1,976 | 4,242 | (1,553) | (7,870) | (156) | (36) | (3,066) | 2,910 | 3,030 | (120) | (9,403) | (1,631) | (7,772) | 1,689 | 1,833 | (144) | (5,494) |
| Adjusted for: | | | | | | | | | | | | | | | | | | | | | | | | | | | | |
| Amortisation and depreciation | 9,367 | 7,855 | 4,203 | 2,007 | 2,100 | 47 | 412 | (363) | 3,652 | 1,994 | 717 | 363 | 392 | 186 | 1,509 | 1,489 | 1,252 | 1,246 | 243 | 6 | 237 | 19 | 2 | 17 | 1 | — | 1 | 3 |
| Interest income | (1,568) | (1,028) | (481) | (132) | (287) | (18) | (14) | (30) | (547) | (99) | (80) | (47) | (182) | (139) | (389) | (361) | (351) | (224) | (137) | (127) | (10) | (21) | — | (21) | (7) | (6) | (1) | (151) |
| Finance expense | 5,000 | 1,866 | 772 | 2,284 | 424 | — | 58 | (1,994) | 1,094 | 140 | 186 | 122 | 69 | 577 | 2,091 | 1,813 | 1,762 | 1,762 | 51 | — | 51 | 93 | 13 | 80 | 185 | 172 | 13 | 1,043 |
| Share-based payments | 2,114 | 1,302 | 761 | 398 | 361 | 5 | — | (3) | 541 | 142 | 111 | 83 | 40 | 165 | 798 | 480 | 453 | 453 | 27 | — | 27 | 245 | 42 | 203 | 73 | 73 | — | 14 |
| (Gain)/loss on financial instruments | 3,794 | 3,621 | 366 | (2,463) | 233 | — | 23 | 2,573 | 3,255 | (25) | (21) | (14) | (25) | 3,340 | 151 | 779 | — | — | 779 | — | 779 | (451) | 4 | (455) | (177) | (177) | — | 22 |
| Loss/(gain) on foreign exchange movements | (155) | (15) | 228 | 84 | 94 | 44 | 14 | (8) | (243) | — | — | — | — | (243) | (98) | 44 | 16 | 16 | 28 | — | 28 | (183) | (175) | (8) | 41 | 34 | 7 | (42) |
| Share of results of equity-accounted investees after tax | (337) | (369) | 147 | — | — | — | — | 147 | (516) | — | — | — | — | (516) | 11 | 11 | 7 | 7 | 4 | — | 4 | — | — | — | — | — | — | 21 |
| Change in estimate of environmental rehabilitation obligation | 495 | (40) | 50 | 53 | (4) | — | — | 1 | (90) | — | — | (8) | (98) | 16 | 535 | — | — | — | — | — | — | 729 | 729 | — | (194) | (184) | (10) | — |
| (Gain)/loss on disposal of property, plant and equipment | 14 | (38) | 19 | (26) | (7) | — | 1 | 51 | (57) | (33) | (13) | (14) | 4 | (1) | 52 | 52 | 52 | 52 | — | — | — | — | — | — | — | — | — | — |
| Impairments | 14,007 | 1,919 | 63 | — | — | — | 599 | (536) | 1,856 | (166) | 3,779 | (449) | — | (1,308) | 12,062 | 4,230 | 4,230 | 4,230 | — | — | — | 7,832 | 28 | 7,804 | — | — | — | 26 |
| Occupational healthcare gain | 49 | 49 | — | — | — | — | — | — | 49 | — | — | — | — | 49 | — | — | — | — | — | — | — | — | — | — | — | — | — | — |
| Restructuring costs | 247 | 75 | 9 | 4 | 4 | — | — | 1 | 66 | 6 | 9 | 15 | — | 36 | 172 | 2 | 2 | 2 | — | — | — | 170 | 170 | — | — | — | — | — |
| Transaction and project costs | 4,543 | (1) | (1) | — | — | — | — | (1) | — | — | — | — | — | — | 566 | 189 | 14 | 14 | 175 | — | 175 | 373 | 373 | — | 4 | — | 4 | 3,978 |
| Lease payments | (267) | (126) | (80) | (19) | (29) | (1) | — | (31) | (46) | (2) | (8) | (14) | (11) | (11) | (141) | (3) | (1) | (1) | (2) | — | (2) | (33) | (21) | (12) | (105) | (105) | — | — |
| Onerous contract provision | (124) | — | — | — | — | — | — | — | — | — | — | — | — | — | (124) | — | — | — | — | — | — | (124) | (124) | — | — | — | — | — |
| Corporate leadership costs | 50 | 50 | — | — | — | — | — | — | 50 | — | — | — | — | 50 | — | — | — | — | — | — | — | — | — | — | — | — | — | — |
| Compensation for losses incurred | (142) | (38) | — | — | — | — | — | — | (38) | — | (27) | (1) | — | (10) | (104) | (46) | (46) | (46) | — | — | — | — | — | — | (58) | (58) | — | — |
| Other | — | — | — | 9 | — | — | — | (9) | — | — | — | — | — | — | — | — | — | — | — | — | — | — | — | — | — | — | — | — |
| Gain on increase in equity-accounted investment | (5) | — | — | — | — | — | — | — | — | — | — | — | — | — | — | — | — | — | — | — | — | — | — | — | — | — | — | (5) |
| Gain on assets held for sale | (16) | 7 | — | — | — | — | — | — | 7 | — | — | — | 7 | — | (23) | (1) | (1) | (1) | — | — | — | (22) | — | (22) | — | — | — | — |
| Adjusted EBITDA | 37,800 | 29,187 | 16,682 | 9,265 | 7,452 | 179 | 1,085 | (1,299) | 12,505 | 5,607 | (190) | 2,012 | 4,438 | 638 | 9,198 | 8,522 | 7,353 | 4,444 | 4,078 | 2,909 | 1,169 | (776) | (590) | (186) | 1,452 | 1,582 | (130) | (585) |
1 The SA rand amounts can be translated to US dollar at an average exchange rate of R17.88/US$ which amounts to a profit before royalties, carbon tax and tax of US$42 million (R734 million) and adjusted EBITDA of US$2,115 million (R37,800 million)
2 This measure is not a measure of performance under IFRS Accounting Standards. As a result, it should not be considered in isolation or as alternatives to any other measure of financial performance presented in accordance with IFRS Accounting Standards
| | | | | | | | | | | | | | | | | | | | | | | | | | | | | | | | | | | | | | | | | | | | | | | | | | | | | | | | | | | | | | | | | | | | | | | | | | | | | | | | | | | | | | | | | |
For the year ended 31 Dec 2024 (Audited) |
| | SA OPERATIONS | | AMERICAS | | | | | | EUROPE | | | AUSTRALIA | | | |
| GROUP | PRIMARY MINING | SECONDARY MINING | | | | | PRIMARY MINING | RECYCLING | | | | | | | SECONDARY MINING | | GROUP |
| SA rand | Total | Total SA
Operations | Total
SA PGM | Rusten-
burg | Marikana | Kroondal | Platinum
Mile | Mimosa | Corporate and re- conciling items1 | Total
SA gold | Drie-
fontein | Kloof | Beatrix | DRD-
GOLD | Corporate and re- conciling items1 | Total international operations | Total US operations | Total US PGM | US PGM | Total US recycling | Columbus | Pennsylvania site recycling | Total EU operations | Sandouville nickel refinery | Corporate and re- conciling items1 | Total AUS operations | Century zinc retreatment operation | Corporate and re- conciling items1 | Cor- porate1 |
| Reconciliation of profit before royalties, carbon tax and tax to adjusted EBITDA: | | | | | | | | | | | | | | | | | | | | | | | | | | | | | |
| (Loss)/profit before royalties, carbon tax and tax | (3,669) | 8,131 | 5,177 | 10,480 | 2,572 | (270) | 170 | 90 | (7,865) | 2,954 | 1,284 | (906) | 520 | 2,405 | (349) | (10,633) | (10,454) | (10,474) | (10,795) | 341 | 321 | 20 | — | (531) | 531 | (179) | 77 | (256) | (1,167) |
| Adjusted for: | | | | | | | | | | | | | | | | — | — | | | — | | | | | | | | | |
| Amortisation and depreciation | 8,810 | 6,547 | 3,647 | 1,162 | 1,884 | 487 | 43 | 334 | (263) | 2,900 | 1,380 | 788 | 395 | 312 | 25 | 2,261 | 2,105 | 1,934 | 1,929 | 176 | 5 | 171 | 38 | 29 | 9 | 118 | 117 | 1 | 2 |
| Interest income | (1,337) | (966) | (468) | (86) | (224) | (135) | (23) | (6) | 6 | (498) | (81) | (82) | (46) | (230) | (59) | (368) | (313) | (305) | (305) | (8) | — | (8) | (53) | (1) | (52) | (2) | (1) | (1) | (3) |
| Finance expense | 4,571 | 1,948 | 611 | 3,240 | 392 | 131 | — | 45 | (3,197) | 1,337 | 260 | 294 | 193 | 78 | 512 | 2,297 | 1,791 | 1,761 | 1,761 | 30 | — | 30 | 204 | 70 | 134 | 302 | 288 | 14 | 326 |
| Share-based payments | 251 | 178 | 99 | 31 | 47 | 18 | 1 | — | 2 | 79 | 17 | 12 | 7 | 27 | 16 | 53 | 35 | 35 | 35 | — | — | — | 13 | 7 | 6 | 5 | 5 | — | 20 |
| (Gain)/loss on financial instruments | (5,433) | (3,128) | (2,341) | (11,878) | (1,249) | 2 | — | — | 10,784 | (787) | (19) | (18) | (12) | (19) | (719) | (2,372) | (1,869) | (1,733) | (1,733) | (136) | — | (136) | (772) | (7) | (765) | 269 | 269 | — | 67 |
| (Gain)/loss on foreign exchange movements | 215 | 74 | 53 | (66) | 31 | 73 | (3) | 129 | (111) | 21 | — | — | — | (11) | 32 | 88 | 3 | 5 | 5 | (2) | — | (2) | 97 | 110 | (13) | (12) | (10) | (2) | 53 |
| Share of results of equity-accounted investees after tax | (212) | (230) | 97 | — | — | — | — | — | 97 | (327) | — | — | — | — | (327) | 7 | 7 | — | — | 7 | — | 7 | — | — | — | — | — | — | 11 |
| Change in estimate of environmental rehabilitation obligation, and right of recovery liability and asset | 447 | 450 | 206 | 52 | 12 | 142 | — | — | — | 244 | — | — | (13) | — | 257 | (3) | — | — | — | — | — | — | 23 | 23 | — | (26) | (22) | (4) | — |
| (Gain)/loss on disposal of property, plant and equipment | (55) | (95) | (33) | (17) | (15) | (1) | — | 1 | (1) | (62) | (18) | (17) | (24) | (1) | (2) | 40 | 40 | 40 | 40 | — | — | — | — | — | — | — | — | — | — |
| Impairments | 9,173 | 17 | 124 | — | 112 | (9) | — | 26 | (5) | (107) | — | — | — | — | (107) | 9,156 | 8,824 | 8,824 | 8,824 | — | — | — | 221 | 221 | — | 111 | 4 | 107 | — |
| Occupational healthcare gain | (76) | (76) | — | — | — | — | — | — | — | (76) | — | — | — | — | (76) | — | — | — | — | — | — | — | — | — | — | — | — | — | — |
| Restructuring costs | 550 | 424 | 271 | 47 | 218 | 4 | — | — | 2 | 153 | 14 | 3 | 10 | — | 126 | 126 | 126 | 126 | 126 | — | — | — | — | — | — | — | — | — | — |
| Transaction and project costs | 851 | — | — | — | — | — | — | — | — | — | — | — | — | — | — | 427 | 213 | 26 | 26 | 187 | — | 187 | 193 | 193 | — | 21 | — | 21 | 424 |
| Lease payments | (244) | (97) | (62) | (20) | (38) | (3) | (1) | — | — | (35) | — | (9) | (5) | (19) | (2) | (147) | (6) | (5) | (5) | (1) | — | (1) | (25) | (20) | (5) | (116) | (116) | — | — |
| Cyber costs | 67 | 54 | 18 | 6 | 10 | 2 | — | — | — | 36 | 3 | 3 | 2 | — | 28 | 13 | 7 | 7 | 7 | — | — | — | — | — | — | 6 | 6 | — | — |
| Compensation for losses incurred | (26) | — | — | — | — | — | — | — | — | — | — | — | — | — | — | (26) | (26) | (26) | (26) | — | — | — | — | — | — | — | — | — | — |
| Provision for community costs post closure | 24 | — | — | — | — | — | — | — | — | — | — | — | — | — | — | 24 | — | — | — | — | — | — | — | — | — | 24 | 24 | — | — |
| Onerous contract provision | (817) | — | — | — | — | — | — | — | — | — | — | — | — | — | — | (817) | — | — | — | — | — | — | (817) | (817) | — | — | — | — | — |
| Gain/increase in equity-accounted investment | (2) | — | — | — | — | — | — | — | — | — | — | — | — | — | — | — | — | — | — | — | — | — | — | — | — | — | — | — | (2) |
Adjusted EBITDA1 | 13,088 | 13,231 | 7,399 | 2,951 | 3,752 | 441 | 187 | 619 | (551) | 5,832 | 2,840 | 68 | 1,027 | 2,542 | (645) | 126 | 483 | 215 | (111) | 594 | 326 | 268 | (878) | (723) | (155) | 521 | 641 | (120) | (269) |
1 The SA rand amounts can be translated to US dollar at an average exchange rate of R18.42/US$ which amounts to a loss before royalties, carbon tax and tax of US$200 million (R3,669 million) and adjusted EBITDA of US$715 million (R13,088 million)
Sibanye-Stillwater Operating and financial results | Six months and year ended 31 December 2025 60
ADJUSTED EBITDA RECONCILIATION – SIX MONTHS | | | | | | | | | | | | | | | | | | | | | | | | | | | | | | | | | | | | | | | | | | | | | | | | | | | | | | | | | | | | | | | | | | | | | | | | | | | | | | | | | | | | | | |
For the six months ended 31 December 2025 (Unaudited) |
| | SA OPERATIONS | | AMERICAS | | | | | | EUROPE | | | AUSTRALIA | | | |
| GROUP | PRIMARY MINING | SECONDARY MINING | | | | | PRIMARY MINING | RECYCLING | | | | | | | SECONDARY MINING | | GROUP |
| SA rand | Total | Total SA
Operations | Total
SA PGM | Rusten-
burg | Marikana | Platinum
Mile | Mimosa | Corporate and re- conciling items1 | Total
SA gold | Drie-
fontein | Kloof | Beatrix | DRD-
GOLD | Corporate and re- conciling items1 | Total international operations | Total US operations | Total US PGM | US PGM | Total US recycling | Columbus | Pennsylvania site and North Carolina site | Total EU operations | Sandouville nickel refinery | Corporate and re- conciling items1 | Total AUS operations | Century zinc retreatment operation | Corporate and re- conciling items1 | Cor- porate1 |
Reconciliation of profit/(loss) before royalties, carbon tax and tax to adjusted EBITDA1 | | | | | | | | | | | | | | | | | | | | | | | | | | | | |
Profit/(loss) before royalties, carbon tax and tax1 | 2,936 | 9,946 | 9,007 | 7,997 | 3,147 | 79 | 772 | (2,988) | 939 | 2,510 | (4,502) | 1,352 | 2,449 | (870) | (2,324) | 501 | 735 | 79 | 422 | 656 | (234) | (3,708) | (1,294) | (2,414) | 883 | 945 | (62) | (4,686) |
| Adjusted for: | | | | | | | | | | | | | | | — | — | | | — | | | | | | | | | |
| Amortisation and depreciation | 5,149 | 4,318 | 2,270 | 1,087 | 1,131 | 24 | 180 | (152) | 2,048 | 1,127 | 343 | 201 | 206 | 171 | 828 | 815 | 680 | 677 | 138 | 3 | 135 | 12 | — | 12 | 1 | — | 1 | 3 |
| Interest income | (882) | (451) | (188) | (50) | (106) | (8) | (8) | (16) | (263) | (42) | (40) | (23) | (105) | (53) | (314) | (291) | (287) | (160) | (131) | (127) | (4) | (19) | — | (19) | (4) | (4) | — | (117) |
| Finance expense | 2,447 | 855 | 364 | 1,103 | 226 | — | 41 | (1,006) | 491 | 66 | 86 | 60 | 34 | 245 | 1,036 | 891 | 862 | 862 | 29 | — | 29 | 56 | 7 | 49 | 89 | 82 | 7 | 556 |
| Share-based payments | 1,499 | 908 | 522 | 276 | 252 | 3 | — | (9) | 386 | 98 | 76 | 58 | 24 | 130 | 580 | 355 | 333 | 333 | 22 | — | 22 | 169 | 30 | 139 | 56 | 56 | — | 11 |
| (Gain)/loss on financial instruments | 3,403 | 2,891 | 255 | (3,450) | 209 | — | (2) | 3,498 | 2,636 | (15) | (13) | (9) | (11) | 2,684 | 511 | 706 | — | — | 706 | — | 706 | (258) | — | (258) | 63 | 63 | — | 1 |
| Loss/(gain) on foreign exchange movements | 6 | 13 | 145 | 57 | 61 | 28 | 5 | (6) | (132) | — | — | — | — | (132) | 38 | 31 | 13 | 13 | 18 | — | 18 | (19) | (15) | (4) | 26 | 21 | 5 | (45) |
| Share of results of equity-accounted investees after tax | (769) | (786) | (513) | — | — | — | — | (513) | (273) | — | — | — | — | (273) | — | — | 7 | 7 | (7) | — | (7) | — | — | — | — | — | — | 17 |
| Change in estimate of environmental rehabilitation obligation, and right of recovery liability and asset | 593 | 58 | 50 | 53 | (4) | — | — | 1 | 8 | — | — | (8) | — | 16 | 535 | — | — | — | — | — | — | 729 | 729 | — | (194) | (184) | (10) | — |
| (Gain)/loss on disposal of property, plant and equipment | 30 | 5 | 38 | (12) | (2) | — | — | 52 | (33) | (14) | (9) | (9) | — | (1) | 25 | 25 | 25 | 25 | — | — | — | — | — | — | — | — | — | — |
| Impairments | 4,341 | 1,855 | (1) | — | — | — | — | (1) | 1,856 | (166) | 3,779 | (449) | — | (1,308) | 2,460 | — | — | — | — | — | — | 2,460 | — | 2,460 | — | — | — | 26 |
| Occupational healthcare gain | 46 | 46 | — | — | — | — | — | — | 46 | — | — | — | — | 46 | — | — | — | — | — | — | — | — | — | — | — | — | — | — |
| Restructuring costs | 5 | 5 | — | 1 | — | — | — | (1) | 5 | — | 1 | — | — | 4 | — | — | — | — | — | — | — | — | — | — | — | — | — | — |
| Transaction and project costs | 4,125 | (1) | (1) | — | — | — | — | (1) | — | — | — | — | — | — | 323 | 45 | (130) | (130) | 175 | — | 175 | 274 | 274 | — | 4 | — | 4 | 3,803 |
| Lease payments | (147) | (72) | (44) | (10) | (14) | — | — | (20) | (28) | (2) | (3) | (10) | (7) | (6) | (75) | — | 1 | 1 | (1) | — | (1) | (20) | (11) | (9) | (55) | (54) | (1) | — |
| Onerous contract provision | — | — | — | — | — | — | — | — | — | — | — | — | — | — | — | — | — | — | — | — | — | — | — | — | — | — | — | — |
| Corporate leadership costs | 41 | 41 | — | — | — | — | — | — | 41 | — | — | — | — | 41 | — | — | — | — | — | — | — | — | — | — | — | — | — | — |
| Compensation for losses incurred | (75) | (38) | — | — | — | — | — | — | (38) | — | (27) | (1) | — | (10) | (37) | (37) | (37) | (37) | — | — | — | — | — | — | — | — | — | — |
| Other | — | — | — | — | — | — | — | — | — | — | — | — | — | — | — | — | — | — | — | — | — | — | — | — | — | — | — | — |
| Gain on increase in equity-accounted investment | (5) | — | — | — | — | — | — | — | — | — | — | — | — | — | — | — | — | — | — | — | — | — | — | — | — | — | — | (5) |
| Gain on assets held for sale | (16) | 7 | — | — | — | — | — | — | 7 | — | — | — | 7 | — | (23) | (1) | (1) | (1) | — | — | — | (22) | — | (22) | — | — | — | — |
| Adjusted EBITDA | 22,727 | 19,600 | 11,904 | 7,052 | 4,900 | 126 | 988 | (1,162) | 7,696 | 3,562 | (309) | 1,162 | 2,597 | 684 | 3,563 | 3,040 | 2,201 | 1,669 | 1,371 | 532 | 839 | (346) | (280) | (66) | 869 | 925 | (56) | (436) |
| | | | | | | | | | | | | | | | | | | | | | | | | | | | | | | | | | | | | | | | | | | | | | | | | | | | | | | | | | | | | | | | | | | | | | | | | | | | | | | | | | | | | | |
For the six months ended 30 June 2025 (Unaudited) |
| | SA OPERATIONS | | AMERICAS | | | | | | EUROPE | | | AUSTRALIA | | | |
| GROUP | PRIMARY MINING | SECONDARY MINING | | | | | PRIMARY MINING | RECYCLING | | | | | | | SECONDARY MINING | | GROUP |
| SA rand | Total | Total SA
Operations | Total
SA PGM | Rusten-
burg | Marikana | Platinum
Mile | Mimosa | Corporate and re- conciling items1 | Total
SA gold | Drie-
fontein | Kloof | Beatrix | DRD-
GOLD | Corporate and re- conciling items1 | Total international operations | Total US operations | Total US PGM | US PGM | Total US recycling | Columbus | Pennsylvania site recycling | Total EU operations | Sandouville nickel refinery | Corporate and re- conciling items1 | Total AUS operations | Century zinc retreatment operation | Corporate and re- conciling items1 | Cor- porate1 |
| Reconciliation of profit before royalties, carbon tax and tax to adjusted EBITDA: | | | | | | | | | | | | | | | | | | | | | | | | | | | | |
(Loss)/profit before royalties, carbon tax and tax1 | (2,202) | 4,152 | 1,619 | (931) | 1,416 | 23 | (780) | 1,891 | 2,533 | 1,140 | (341) | 624 | 1,793 | (683) | (5,546) | (657) | (771) | (3,145) | 2,488 | 2,374 | 114 | (5,695) | (337) | (5,358) | 806 | 888 | (82) | (808) |
| Adjusted for: | | | | | | | | | | | | | | | — | — | | | — | | | | | | | | | |
| Amortisation and depreciation | 4,218 | 3,537 | 1,933 | 920 | 969 | 23 | 232 | (211) | 1,604 | 867 | 374 | 162 | 186 | 15 | 681 | 674 | 572 | 569 | 105 | 3 | 102 | 7 | 2 | 5 | — | — | — | — |
| Interest income | (686) | (577) | (293) | (82) | (181) | (10) | (6) | (14) | (284) | (57) | (40) | (24) | (77) | (86) | (75) | (70) | (64) | (64) | (6) | — | (6) | (2) | — | (2) | (3) | (2) | (1) | (34) |
| Finance expense | 2,553 | 1,011 | 408 | 1,181 | 198 | — | 17 | (988) | 603 | 74 | 100 | 62 | 35 | 332 | 1,055 | 922 | 900 | 900 | 22 | — | 22 | 37 | 6 | 31 | 96 | 90 | 6 | 487 |
| Share-based payments | 615 | 394 | 239 | 122 | 109 | 2 | — | 6 | 155 | 44 | 35 | 25 | 16 | 35 | 218 | 125 | 120 | 120 | 5 | — | 5 | 76 | 12 | 64 | 17 | 17 | — | 3 |
| (Gain)/loss on financial instruments | 391 | 730 | 111 | 987 | 24 | — | 25 | (925) | 619 | (10) | (8) | (5) | (14) | 656 | (360) | 73 | — | — | 73 | — | 73 | (193) | 4 | (197) | (240) | (240) | — | 21 |
| Loss/(gain) on foreign exchange movements | (161) | (28) | 83 | 27 | 33 | 16 | 9 | (2) | (111) | — | — | — | — | (111) | (136) | 13 | 3 | 3 | 10 | — | 10 | (164) | (160) | (4) | 15 | 13 | 2 | 3 |
| Share of results of equity-accounted investees after tax | 432 | 417 | 660 | — | — | — | — | 660 | (243) | — | — | — | — | (243) | 11 | 11 | — | — | 11 | — | 11 | — | — | — | — | — | — | 4 |
| Change in estimate of environmental rehabilitation obligation, and right of recovery liability and asset | (98) | (98) | — | — | — | — | — | — | (98) | — | — | — | (98) | — | — | — | — | — | — | — | — | — | — | — | — | — | — | — |
| (Gain)/loss on disposal of property, plant and equipment | (16) | (43) | (19) | (14) | (5) | — | 1 | (1) | (24) | (19) | (4) | (5) | 4 | — | 27 | 27 | 27 | 27 | — | — | — | — | — | — | — | — | — | — |
| Impairments | 9,666 | 64 | 64 | — | — | — | 599 | (535) | — | — | — | — | — | — | 9,602 | 4,230 | 4,230 | 4,230 | — | — | — | 5,372 | 28 | 5,344 | — | — | — | — |
| Occupational healthcare gain | 3 | 3 | — | — | — | — | — | — | 3 | — | — | — | — | 3 | — | — | — | — | — | — | — | — | — | — | — | — | — | — |
| Restructuring costs | 242 | 70 | 9 | 3 | 4 | — | — | 2 | 61 | 6 | 8 | 15 | — | 32 | 172 | 2 | 2 | 2 | — | — | — | 170 | 170 | — | — | — | — | — |
| Transaction and project costs | 418 | — | — | — | — | — | — | — | — | — | — | — | — | — | 243 | 144 | 144 | 144 | — | — | — | 99 | 99 | — | — | — | — | 175 |
| Lease payments | (120) | (54) | (36) | (9) | (15) | (1) | — | (11) | (18) | — | (5) | (4) | (4) | (5) | (66) | (3) | (2) | (2) | (1) | — | (1) | (13) | (10) | (3) | (50) | (51) | 1 | — |
| Onerous contract provision | (124) | — | — | — | — | — | — | — | — | — | — | — | — | — | (124) | — | — | — | — | — | — | (124) | (124) | — | — | — | — | — |
| Corporate leadership costs | 9 | 9 | — | — | — | — | — | — | 9 | — | — | — | — | 9 | — | — | — | — | — | — | — | — | — | — | — | — | — | — |
| Compensation for losses incurred | (67) | | — | | | | | | — | | | | | | (67) | (9) | (9) | (9) | — | | | — | | | (58) | (58) | | |
| Other | — | — | — | 9 | — | — | — | (9) | — | — | — | — | — | — | — | — | — | — | — | — | — | — | — | — | — | — | — | — |
Adjusted EBITDA1 | 15,073 | 9,587 | 4,778 | 2,213 | 2,552 | 53 | 97 | (137) | 4,809 | 2,045 | 119 | 850 | 1,841 | (46) | 5,635 | 5,482 | 5,152 | 2,775 | 2,707 | 2,377 | 330 | (430) | (310) | (120) | 583 | 657 | (74) | (149) |
1 The SA rand amounts can be translated to US dollar at an average exchange rate of R18.39/US$ which amounts to a loss before royalties, carbon tax and tax of US$118 million (R2,202 million) and adjusted EBITDA of US$818 million (R15,073 million)
Sibanye-Stillwater Operating and financial results | Six months and year ended 31 December 2025 61
ADJUSTED EBITDA RECONCILIATION – SIX MONTHS (continued)
| | | | | | | | | | | | | | | | | | | | | | | | | | | | | | | | | | | | | | | | | | | | | | | | | | | | | | | | | | | | | | | | | | | | | | | | | | | | | | | | | | | | | | | | | |
For the six months ended 31 December 2024 (Unaudited) |
| | SA OPERATIONS | | AMERICAS | | | | | | EUROPE | | | AUSTRALIA | | | |
| GROUP | PRIMARY MINING | SECONDARY MINING | | | | | PRIMARY MINING | RECYCLING | | | | | | | SECONDARY MINING | | GROUP |
| SA rand | Total | Total SA
Operations | Total
SA PGM | Rusten-
burg | Marikana | Kroondal | Platinum
Mile | Mimosa | Corporate and re- conciling items1 | Total
SA gold | Drie-
fontein | Kloof | Beatrix | DRD-
GOLD | Corporate and re- conciling items1 | Total international operations | Total US operations | Total US PGM | US PGM | Total US recycling | Columbus | Pennsylvania site recycling | Total EU operations | Sandouville nickel refinery | Corporate and re- conciling items1 | Total AUS operations | Century zinc retreatment operation | Corporate and re- conciling items1 | Cor- porate1 |
| Reconciliation of profit before royalties, carbon tax and tax to adjusted EBITDA: | | | | | | | | | | | | | | | | | | | | | | | | | | | | | |
| Profit/(loss) before royalties, carbon tax and tax | 1,915 | 4,969 | 2,767 | 12,147 | 1,236 | (242) | 102 | 78 | (10,554) | 2,202 | 629 | (155) | 360 | 1,333 | 35 | (2,624) | (3,632) | (3,615) | (3,791) | 159 | 176 | (17) | 232 | (477) | 709 | 776 | 944 | (168) | (430) |
| Adjusted for: | | | | | | | | | | | | | | | | | | | | | | | | | | | | | |
| Amortisation and depreciation | 4,676 | 3,587 | 1,947 | 610 | 1,020 | 256 | 23 | 184 | (146) | 1,640 | 722 | 473 | 219 | 214 | 12 | 1,087 | 1,004 | 904 | 901 | 103 | 3 | 100 | 22 | 17 | 5 | 61 | 61 | — | 2 |
| Interest income | (588) | (460) | (223) | (36) | (111) | (54) | (13) | (4) | (5) | (237) | (41) | (41) | (23) | (124) | (8) | (125) | (93) | (86) | (86) | (7) | — | (7) | (31) | (1) | (30) | (1) | (1) | — | (3) |
| Finance expense | 2,279 | 1,014 | 331 | 1,517 | 214 | 65 | — | 25 | (1,490) | 683 | 127 | 154 | 93 | 38 | 271 | 1,107 | 895 | 876 | 876 | 19 | — | 19 | 95 | 29 | 66 | 117 | 110 | 7 | 158 |
| Share-based payments | 114 | 84 | 45 | 16 | 19 | 9 | 1 | — | — | 39 | 8 | 5 | 3 | 14 | 9 | 19 | 12 | 12 | 12 | — | — | — | 5 | 2 | 3 | 2 | 2 | — | 11 |
| (Gain)/loss on financial instruments | (3,937) | (3,320) | (2,580) | (13,153) | (1,255) | (6) | — | — | 11,834 | (740) | (9) | (11) | (6) | (9) | (705) | (618) | (20) | — | — | (20) | — | (20) | (788) | 13 | (801) | 190 | 190 | — | 1 |
| Loss/(gain) on foreign exchange movements | 202 | 125 | 68 | (32) | 21 | 64 | (5) | 46 | (26) | 57 | — | — | — | — | 57 | 44 | (4) | (2) | (2) | (2) | — | (2) | 62 | 82 | (20) | (14) | (12) | (2) | 33 |
| Share of results of equity-accounted investees after tax | (76) | (83) | 52 | — | — | — | — | — | 52 | (135) | — | — | — | — | (135) | 2 | 2 | — | — | 2 | — | 2 | — | — | — | — | — | — | 5 |
| Change in estimate of environmental rehabilitation obligation, and right of recovery liability and asset | 209 | 450 | 206 | 52 | 12 | 142 | — | — | — | 244 | — | — | (13) | — | 257 | (241) | — | — | — | — | — | — | 23 | 23 | — | (264) | (260) | (4) | — |
| (Gain)/loss on disposal of property, plant and equipment | (20) | (57) | (22) | (10) | (12) | (1) | — | 1 | — | (35) | (13) | (12) | (8) | — | (2) | 37 | 37 | 37 | 37 | — | — | — | — | — | — | — | — | — | — |
| Impairments | 1,549 | (106) | 1 | — | — | (20) | — | — | 21 | (107) | — | — | — | — | (107) | 1,655 | 1,325 | 1,325 | 1,325 | — | — | — | 221 | 221 | — | 109 | 2 | 107 | — |
| Occupational healthcare gain | (77) | (77) | — | — | — | — | — | — | — | (77) | — | — | — | — | (77) | — | — | — | — | — | — | — | — | — | — | — | — | — | — |
| Restructuring costs | 250 | 126 | 47 | 21 | 17 | 7 | — | — | 2 | 79 | 14 | 1 | 10 | — | 54 | 124 | 124 | 124 | 124 | — | — | — | — | — | — | — | — | — | — |
| Transaction and project costs | 505 | — | 1 | — | — | — | — | — | 1 | (1) | — | — | — | — | (1) | 365 | 213 | 26 | 26 | 187 | — | 187 | 152 | 152 | — | — | — | — | 140 |
| Lease payments | (108) | (42) | (25) | (10) | (17) | (3) | — | — | 5 | (17) | — | (5) | (3) | (8) | (1) | (66) | (2) | (2) | (2) | — | — | — | (13) | (11) | (2) | (51) | (50) | (1) | — |
| Onerous contract provision | (493) | — | — | — | — | — | — | — | — | — | — | — | — | — | — | (493) | — | — | — | — | — | — | (493) | (493) | — | — | — | — | — |
| Cyber security costs | 67 | 54 | 18 | 6 | 10 | 2 | — | — | — | 36 | 3 | 3 | 2 | — | 28 | 13 | 7 | 7 | 7 | — | — | — | — | — | — | 6 | 6 | — | — |
| Compensation for losses incurred | (26) | — | — | — | — | — | — | — | — | — | — | — | — | — | — | (26) | (26) | (26) | (26) | — | — | — | — | — | — | — | — | — | — |
| Gain on increase in equity-accounted investment | (1) | — | — | — | — | — | — | — | — | — | — | — | — | — | — | — | — | — | — | — | — | — | — | — | — | — | — | — | (1) |
| Adjusted EBITDA | 6,440 | 6,264 | 2,633 | 1,128 | 1,154 | 219 | 108 | 330 | (306) | 3,631 | 1,440 | 412 | 634 | 1,458 | (313) | 260 | (158) | (420) | (599) | 441 | 179 | 262 | (513) | (443) | (70) | 931 | 992 | (61) | (84) |
Sibanye-Stillwater Operating and financial results | Six months and year ended 31 December 2025 62
RECONCILIATION OF NOTIONAL FREE CASH FLOW TO NET CASH FROM OPERATING ACTIVITIES
| | | | | | | | | | | | | | | | | | | | | | | | | | | | | | | | | | | |
Figures in million - SA rand | For the year ended 31 December 2025 (Unaudited) |
| Group | Total of operations | Southern Africa Operations | International Operations | Total SA PGM | Total SA gold | Total US PGM (including Columbus recycling) | Pennsylvania site and North Carolina site | Total EU operations | Total AUS operations | Corporate |
| Notional free cash flow | 29 | 3,675 | 9,070 | (5,395) | 5,846 | 3,224 | (831) | 1,012 | (6,572) | 996 | (3,646) |
| Adjusted for: | | | | | | | | | | | |
| Property, plant and equipment additions | 20,307 | 20,304 | 12,531 | 7,773 | 5,910 | 6,621 | 1,779 | 46 | 5,762 | 186 | 3 |
| Net royalties, carbon tax and tax paid | (2,865) | (2,855) | (2,675) | (180) | (2,285) | (390) | 286 | (130) | 12 | (348) | (10) |
| Add back of accrued tax and royalties | 3,562 | 3,550 | 3,167 | 383 | 3,015 | 152 | 46 | 112 | (7) | 232 | 12 |
| Cash-settled share-based payments made | (649) | (643) | (433) | (210) | (279) | (154) | (111) | (8) | (71) | (20) | (6) |
| Dividends paid | (302) | (4,760) | (4,669) | (91) | (3,289) | (1,380) | — | — | (91) | — | 4,458 |
| Net interest (including intercompany) | (1,488) | (1,644) | 36 | (1,680) | 17 | 19 | (1,008) | (204) | (413) | (55) | 156 |
| Net working capital (including intercompany) | 2,273 | 2,276 | (4,234) | 6,510 | (5,315) | 1,081 | (1,293) | 7,417 | 578 | (192) | (3) |
| Movement on metals consignment line | (7,645) | (7,645) | — | (7,645) | — | — | — | (7,645) | — | — | — |
| Deferred revenue recognised | (1,421) | (1,421) | — | (1,421) | — | — | — | (420) | — | (1,001) | — |
| Deferred revenue received in advance | 10,745 | 1,530 | — | 1,530 | — | — | — | 433 | — | 1,097 | 9,215 |
| Re-allocation of stream revenue and costs | — | 1,652 | 1,177 | 475 | 1,177 | — | 475 | — | — | — | (1,652) |
| Other items | (1,139) | (651) | (435) | (216) | (196) | (239) | (621) | 306 | (78) | 177 | (488) |
| Net cash from operating activities | 21,407 | 13,368 | 13,535 | (167) | 4,601 | 8,934 | (1,278) | 919 | (880) | 1,072 | 8,039 |
Notional free cash flow, is not a measure of performance under IFRS Accounting Standards. As a result, it should not be considered in isolation or as alternatives to any other measure of financial performance presented in accordance with IFRS Accounting Standards
| | | | | | | | | | | | | | | | | | | | | | | | | | | | | | | | | | | |
Figures in million - SA rand | For the year ended 31 December 2024 (Unaudited) |
| Group | Total of operations | Southern Africa Operations | International Operations | Total SA PGM | Total SA gold | Total US PGM (including Columbus recycling) | Pennsylvania site and North Carolina site | Total EU operations | Total AUS operations | Corporate |
| Notional free cash flow | (12,397) | (12,133) | (1,472) | (10,661) | 136 | (1,608) | (3,375) | 133 | (7,449) | 30 | (264) |
| Adjusted for: | | | | | | | | | | | |
| Property, plant and equipment additions | 21,569 | 21,571 | 12,451 | 9,120 | 5,683 | 6,768 | 2,988 | 10 | 5,905 | 217 | (2) |
| Net royalties, carbon tax and tax paid | (2,235) | (2,215) | (1,849) | (366) | (1,597) | (252) | 15 | (78) | — | (303) | (20) |
| Add back of accrued tax and royalties | 1,961 | 1,951 | 1,587 | 364 | 1,456 | 131 | 21 | 125 | 2 | 216 | 10 |
| Cash-settled share-based payments made | (751) | (742) | (680) | (62) | (626) | (54) | (37) | — | (24) | (1) | (9) |
| Dividends paid | (173) | (47,530) | (47,530) | — | (39,191) | (8,339) | — | — | — | — | 47,357 |
| Net interest (including intercompany) | (1,219) | (1,187) | (75) | (1,112) | 680 | (755) | (847) | (120) | (52) | (93) | (32) |
| Net working capital (including intercompany) | 6,853 | 6,755 | 1,305 | 5,450 | 16,888 | (15,583) | 668 | 4,473 | 79 | 230 | 98 |
| Movement on metals consignment line | (4,308) | (4,308) | — | (4,308) | — | — | — | (4,308) | — | — | — |
| Deferred revenue recognised | (907) | (907) | — | (907) | — | — | — | (245) | — | (662) | — |
| Deferred revenue received in advance | 3,307 | 3,307 | 2,698 | 609 | 905 | 1,793 | — | 243 | — | 366 | — |
| Re-allocation of stream revenue and costs | — | 582 | — | 582 | — | — | 582 | — | — | — | (582) |
| Other items | (1,587) | (1,356) | (863) | (493) | (382) | (481) | (110) | (171) | (242) | 30 | (231) |
| Net cash from operating activities | 10,113 | (36,212) | (34,428) | (1,784) | (16,048) | (18,380) | (95) | 62 | (1,781) | 30 | 46,325 |
| | | | | | | | | | | | | | | | | | | | | | | | | | | | | | | | | | | |
Figures in million - SA rand | For the six months ended 31 December 2025 (Unaudited) |
| Group | Total of operations | Southern Africa Operations | International Operations | Total SA PGM | Total SA gold | Total US PGM (including Columbus recycling) | Pennsylvania site and North Carolina site | Total EU operations | Total AUS operations | Corporate |
| Notional free cash flow | 2,283 | 5,867 | 7,551 | (1,684) | 5,405 | 2,146 | 232 | 739 | (3,242) | 587 | (3,584) |
| Adjusted for: | | | | | | | | | | | |
| Property, plant and equipment additions | 10,769 | 10,768 | 6,876 | 3,892 | 3,194 | 3,682 | 869 | 35 | 2,871 | 117 | 1 |
| Net royalties, carbon tax and tax paid | (3,081) | (3,075) | (2,896) | (179) | (2,488) | (408) | 12 | (50) | 1 | (142) | (6) |
| Add back of accrued tax and royalties | 3,035 | 3,026 | 2,811 | 215 | 2,653 | 158 | 19 | 67 | (4) | 133 | 9 |
| Cash-settled share-based payments made | (567) | (561) | (373) | (188) | (279) | (94) | (89) | (8) | (71) | (20) | (6) |
| Dividends paid | (173) | (263) | (172) | (91) | — | (172) | — | — | (91) | — | 90 |
| Net interest (including intercompany) | (783) | (926) | (6) | (920) | (29) | 23 | (509) | (130) | (250) | (31) | 143 |
| Net working capital (including intercompany) | 1,751 | 1,687 | (1,794) | 3,481 | (1,222) | (572) | (767) | 4,222 | 155 | (129) | 64 |
| Movement on metals consignment line | (4,519) | (4,519) | — | (4,519) | — | — | — | (4,519) | — | — | — |
| Deferred revenue recognised | (631) | (631) | — | (631) | — | — | — | (255) | — | (376) | — |
| Deferred revenue received in advance | 668 | 668 | — | 668 | — | — | — | 189 | — | 479 | — |
| Re-allocation of stream revenue and costs | — | 900 | 649 | 251 | 649 | — | 251 | — | — | — | (900) |
| Other items | (522) | (182) | (210) | 28 | (90) | (120) | (162) | 156 | (49) | 83 | (340) |
| Net cash from operating activities | 8,230 | 12,759 | 12,436 | 323 | 7,793 | 4,643 | (144) | 446 | (680) | 701 | (4,529) |
Sibanye-Stillwater Operating and financial results | Six months and year ended 31 December 2025 63
| | | | | | | | | | | | | | | | | | | | | | | | | | | | | | | | | | | |
Figures in million - SA rand | For the six months ended 30 June 2025 (Unaudited) |
| Group | Total of operations | Southern Africa Operations | International Operations | Total SA PGM | Total SA gold | Total US PGM (including Columbus recycling) | Pennsylvania site and North Carolina site | Total EU operations | Total AUS operations | Corporate |
| Notional free cash flow | (2,254) | (2,192) | 1,519 | (3,711) | 441 | 1,078 | (1,063) | 273 | (3,330) | 409 | (62) |
| Adjusted for: | | | | | | | | | | | |
| Property, plant and equipment additions | 9,538 | 9,536 | 5,655 | 3,881 | 2,716 | 2,939 | 910 | 11 | 2,891 | 69 | 2 |
| Net royalties, carbon tax and tax paid | 216 | 220 | 221 | (1) | 203 | 18 | 274 | (80) | 11 | (206) | (4) |
| Add back of accrued tax and royalties | 527 | 524 | 356 | 168 | 362 | (6) | 27 | 45 | (3) | 99 | 3 |
| Cash-settled share-based payments made | (82) | (82) | (60) | (22) | — | (60) | (22) | — | — | — | — |
| Dividends paid | (129) | (4,497) | (4,497) | — | (3,289) | (1,208) | — | — | — | — | 4,368 |
| Net interest (including intercompany) | (705) | (718) | 42 | (760) | 46 | (4) | (499) | (74) | (163) | (24) | 13 |
| Net working capital (including intercompany) | 522 | 589 | (2,440) | 3,029 | (4,093) | 1,653 | (526) | 3,195 | 423 | (63) | (67) |
| Movement on metals consignment line | (3,126) | (3,126) | — | (3,126) | — | — | — | (3,126) | — | — | — |
| Deferred revenue recognised | (790) | (790) | — | (790) | — | — | — | (165) | — | (625) | — |
| Deferred revenue received in advance | 10,077 | 862 | — | 862 | — | — | — | 244 | — | 618 | 9,215 |
| Re-allocation of stream revenue and costs | — | 752 | 528 | 224 | 528 | — | 224 | — | — | — | (752) |
| Other items | (617) | (469) | (225) | (244) | (106) | (119) | (459) | 150 | (29) | 94 | (148) |
| Net cash from operating activities | 13,177 | 609 | 1,099 | (490) | (3,192) | 4,291 | (1,134) | 473 | (200) | 371 | 12,568 |
| | | | | | | | | | | | | | | | | | | | | | | | | | | | | | | | | | | |
Figures in million - SA rand | For the six months ended 31 December 2024 (Unaudited) |
| Group | Total of operations | Southern Africa Operations | International Operations | Total SA PGM | Total SA gold | Total US PGM (including Columbus recycling) | Pennsylvania site and North Carolina site | Total EU operations | Total AUS operations | Corporate |
| Notional free cash flow | (6,910) | (6,694) | (1,167) | (5,527) | (1,331) | 164 | (1,952) | 151 | (4,354) | 628 | (216) |
| Adjusted for: | | | | | | | | | | | |
| Property, plant and equipment additions | 10,422 | 10,423 | 5,935 | 4,488 | 3,099 | 2,836 | 1,157 | 7 | 3,174 | 150 | (1) |
| Net royalties, carbon tax and tax paid | (1,108) | (1,101) | (820) | (281) | (737) | (83) | (65) | (78) | — | (138) | (7) |
| Add back of accrued tax and royalties | 1,209 | 1,201 | 843 | 358 | 743 | 100 | 102 | 104 | 2 | 150 | 8 |
| Cash-settled share-based payments made | (125) | (116) | (90) | (26) | (58) | (32) | (19) | — | (6) | (1) | (9) |
| Dividends paid | (87) | (47,433) | (47,433) | — | (38,298) | (9,135) | — | — | — | — | 47,346 |
| Net interest (including intercompany) | (730) | (690) | (84) | (606) | 218 | (302) | (460) | (73) | (39) | (34) | (40) |
| Net working capital (including intercompany) | 4,766 | 4,578 | 1,100 | 3,478 | 17,696 | (16,596) | 773 | 2,748 | (275) | 232 | 188 |
| Movement on metals consignment line | (2,645) | (2,645) | — | (2,645) | — | — | — | (2,645) | — | — | — |
| Deferred revenue recognised | (306) | (306) | — | (306) | — | — | — | (128) | — | (178) | — |
| Deferred revenue received in advance | 2,729 | 2,729 | 2,698 | 31 | 905 | 1,793 | — | 155 | — | (124) | — |
| Re-allocation of stream revenue and costs | — | 273 | — | 273 | — | — | 273 | — | — | — | (273) |
| Other items | (799) | (735) | (220) | (515) | (103) | (117) | (22) | (236) | (238) | (19) | (64) |
| Net cash from operating activities | 6,416 | (40,516) | (39,238) | (1,278) | (17,866) | (21,372) | (213) | 5 | (1,736) | 666 | 46,932 |
Sibanye-Stillwater Operating and financial results | Six months and year ended 31 December 2025 64
ADMINISTRATION AND CORPORATE INFORMATION
| | | | | |
SIBANYE STILLWATER LIMITED (SIBANYE-STILLWATER) Incorporated in the Republic of South Africa Registration number 2014/243852/06 Share code: SSW and SBSW Issuer code: SSW ISIN: ZAE000259701 LISTINGS JSE: SSW NYSE: SBSW WEBSITE www.sibanyestillwater.com REGISTERED AND CORPORATE OFFICE Constantia Office Park Bridgeview House, Building 11, Ground floor Cnr 14th Avenue & Hendrik Potgieter Road Weltevreden Park 1709 South Africa Private Bag X5 Westonaria 1780 South Africa Tel: +27 11 278 9600 Fax: +27 11 278 9863 COMPANY SECRETARY Lerato Matlosa Email: lerato.matlosa@sibanyestillwater.com DIRECTORS Dr Vincent Maphai* (Chairman) Dr Richard Stewart (CEO)+ Charl Keyter (CFO) Dr Elaine Dorward-King* Harry Kenyon-Slaney*^ Prof Jeremiah Vilakazi# Dr Lindiwe Mthimunye++ Keith Rayner# Peter Hancock* Philippe Boisseau* Richard Menell# Dr Sindiswa Zilwa* Dr Terence Nombembe* Timothy Cumming# * Independent non-executive # Non-executive ^ Lead independent director + Appointed as executive director 1 March 2025 and as CEO 1 October 2025 ++ Appointed as independent non-executive director 25 August 2025 INVESTOR ENQUIRIES James Wellsted Executive Vice President: Investor Relations and Corporate Affairs Mobile: +27 83 453 4014 Email: james.wellsted@sibanyestillwater.com or ir@sibanyestillwater.com | JSE SPONSOR JP Morgan Equities South Africa Proprietary Limited Registration number 1995/011815/07 1 Fricker Road, Illovo Johannesburg 2196 South Africa Private Bag X9936 Sandton 2146 South Africa AUDITORS BDO Wanderers Office Park 52 Corlett Drive Illovo 2196 South Africa Private Bag X60500 Houghton 2041 South Africa Tel: +27 11 488 1700 AMERICAN DEPOSITARY RECEIPTS TRANSFER AGENT BNY Mellon Shareowner Correspondence (ADSs) Mailing address of agent: Computershare PO Box 43078 Providence, RI 02940-3078 Overnight/certified/registered delivery: Computershare 150 Royall Street, Suite 101 Canton, MA 02021 US toll free: + 1 888 269 2377 Tel: +1 201 680 6825 Email: shrrelations@cpushareownerservices.com Tatyana Vesselovskaya Relationship Manager - BNY Mellon Depositary Receipts Email: tatyana.vesselovskaya@bnymellon.com TRANSFER SECRETARIES SOUTH AFRICA Computershare Investor Services Proprietary Limited Rosebank Towers 15 Biermann Avenue Rosebank 2196 PO Box 61051 Marshalltown 2107 South Africa Tel: +27 11 370 5000 Fax: +27 11 688 5248 |
Sibanye-Stillwater Operating and financial results | Six months and year ended 31 December 2025 65
DISCLAIMER
Forward-looking statements
The information in this report may contain forward-looking statements within the meaning of the “safe harbour” provisions of the United States Private Securities Litigation Reform Act of 1995. These forward-looking statements, including, among others, those relating to Sibanye Stillwater Limited’s (Sibanye-Stillwater or the Group) financial positions, business strategies, business prospects, industry forecasts, production and operational guidance, climate and ESG-related targets and metrics, plans and objectives of management for future operations, are necessarily estimates reflecting the best judgment of the senior management and directors of Sibanye-Stillwater and involve a number of risks and uncertainties that could cause actual results to differ materially from those suggested by the forward-looking statements. As a consequence, these forward-looking statements should be considered in light of various important factors, including those set forth in this report.
All statements other than statements of historical facts included in this report may be forward-looking statements. Forward-looking statements also often use words such as “will”, “would”, “expect”, “forecast”, “potential”, “may”, “could”, “believe”, “aim”, “anticipate”, “target”, “estimate” and words of similar meaning. By their nature, forward-looking statements involve risk and uncertainty because they relate to future events and circumstances and should be considered in light of various important factors, including those set forth in this disclaimer. Readers are cautioned not to place undue reliance on such statements.
The important factors that could cause Sibanye-Stillwater’s actual results, performance or achievements to differ materially from estimates or projections contained in the forward-looking statements include, without limitation, Sibanye-Stillwater’s future financial position, plans, strategies, objectives, capital expenditures, projected costs and anticipated cost savings, financing plans, debt position and ability to reduce debt leverage; economic, business, political and social conditions in South Africa, Zimbabwe, the United States, Europe and elsewhere; plans and objectives of management for future operations; Sibanye-Stillwater’s ability to obtain the benefits of any streaming arrangements or pipeline financing; the ability of Sibanye-Stillwater to comply with loan and other covenants and restrictions and difficulties in obtaining additional financing or refinancing; Sibanye-Stillwater’s ability to service its bond instruments; changes in assumptions underlying Sibanye-Stillwater’s estimation of its Mineral Resources and Mineral Reserves; any failure of a tailings storage facility; the ability to achieve anticipated efficiencies and other cost savings in connection with, and the ability to successfully integrate, past, ongoing and future acquisitions (including Metallix), as well as at existing operations; the ability of Sibanye-Stillwater to complete any ongoing or future acquisitions; the success of Sibanye-Stillwater’s business strategy and exploration and development activities, including any proposed, anticipated or planned expansions into the battery metals or adjacent sectors and estimations or expectations of enterprise value; the ability of Sibanye-Stillwater to comply with requirements that it operate in ways that provide progressive benefits to affected communities; changes in the market price of gold, silver, PGMs, battery metals (e.g., nickel, lithium, copper and zinc) and the cost of power, petroleum fuels, and oil, among other commodities and supply requirements; the occurrence of hazards associated with underground and surface mining; any further downgrade of South Africa’s credit rating; a challenge regarding the title to any of Sibanye-Stillwater’s properties by claimants to land under restitution and other legislation; Sibanye-Stillwater’s ability to implement its strategy and any changes thereto; the outcome of legal challenges to the Group’s mining or other land use rights; the occurrence of labour disputes, disruptions and industrial actions; the availability, terms and deployment of capital or credit; changes in the imposition of industry standards, regulatory costs and relevant government regulations, particularly environmental, sustainability, tax, health and safety regulations and new legislation affecting water, mining, mineral rights and business ownership, including any interpretation thereof which may be subject to dispute; the outcome and consequence of any potential or pending litigation or regulatory proceedings, including in relation to any environmental, health or safety issues; failure to meet ethical standards, including actual or alleged instances of fraud, bribery or corruption; the effect of climate change or other extreme weather events on Sibanye-Stillwater’s business; the concentration of all final refining activity and a large portion of Sibanye-Stillwater’s PGM sales from mine production in the United States with one entity; the identification of a material weakness in disclosure and internal controls over financial reporting; the effect of US tax reform legislation on Sibanye-Stillwater and its subsidiaries; the effect of South African Exchange Control Regulations on Sibanye-Stillwater’s financial flexibility; operating in new geographies and regulatory environments where Sibanye-Stillwater has no previous experience; power disruptions, constraints and cost increases; supply chain disruptions and shortages and increases in the price of production inputs; the regional concentration of Sibanye-Stillwater’s operations; fluctuations in exchange rates, currency devaluations, inflation and other macro-economic monetary policies; the occurrence of temporary stoppages or precautionary suspension of operations at its mines for safety or environmental incidents (including natural disasters) and unplanned maintenance; Sibanye-Stillwater’s ability to hire and retain senior management and employees with sufficient technical and/or production skills across its global operations necessary to meet its labour recruitment and retention goals, as well as its ability to achieve sufficient representation of historically disadvantaged South Africans in its management positions, or maintain required board gender diversity; failure of Sibanye-Stillwater’s information technology, communications and systems, evolving cyber threats to Sibanye-Stillwater's operations and the impact of cybersecurity incidents or breaches; the adequacy of Sibanye-Stillwater’s insurance coverage; social unrest, sickness or natural or man-made disaster in surrounding mining communities, including informal settlements in the vicinity of some of Sibanye-Stillwater’s South African-based operations; and the impact of contagious diseases, including global pandemics.
Further details of potential risks and uncertainties affecting Sibanye-Stillwater are described in Sibanye-Stillwater’s filings with the Johannesburg Stock Exchange and the United States Securities and Exchange Commission, including the 2024 Integrated Report and the Annual Financial Report for the fiscal year ended 31 December 2024 on Form 20-F filed with the United States Securities and Exchange Commission on 25 April 2025 (SEC File no. 333-234096).
These forward-looking statements speak only as of the date of the content. Sibanye-Stillwater expressly disclaims any obligation or undertaking to update or revise any forward-looking statement (except to the extent legally required). These forward-looking statements have not been reviewed or reported on by the Group’s external auditors.
Non-IFRS1 measures
The information contained in this report may contain certain non-IFRS measures, including, among others, adjusted EBITDA, notional free cash flow, AISC, AIC, and normalised earnings. These measures may not be comparable to similarly-titled measures used by other companies and are not measures of Sibanye-Stillwater’s financial performance under IFRS Accounting Standards. These measures should not be considered in isolation or as a substitute for measures of performance prepared in accordance with IFRS Accounting Standards. Sibanye-Stillwater is not providing a reconciliation of the forecast non-IFRS financial information presented in this report because it is unable to provide this reconciliation without unreasonable effort. These forecast non-IFRS financial information presented have not been reviewed or reported on by the Group’s external auditors.
1 IFRS refers to International Financial Reporting Standards Accounting Standards (IFRS Accounting Standards) as issued by the International Accounting Standards Board (IASB)
Websites
References in this document to information on websites (and/or social media sites) are included as an aid to their location and such information is not incorporated in, and does not form part of, this report.
Sibanye-Stillwater Operating and financial results | Six months and year ended 31 December 2025 66