Please wait
JOHANNESBURG, 1 September 2026: Sibanye Stillwater Limited (Sibanye-Stillwater or the Group) (JSE: SSW and NYSE: SBSW) is pleased to report operating results and consolidated interim financial statements for the six months ended 30 June 2026 (H1 2026).
SALIENT FEATURES FOR THE SIX MONTHS ENDED 30 JUNE 2026 (H1 2026) COMPARED WITH 30 JUNE 2025 (H1 2025) (YEAR-ON-YEAR)
•During H1 2026, the Group delivered its best safety performance based on lagging indicators. Tragically, following a fatality-free Q1 2026, the Group experienced a fatal incident at its SA PGM operations and a fatal incident at its SA gold operations. We mourn the loss of three colleagues as a result of these incidents
•Exceptional financial performance, with record revenue of R90bn (US$5.5bn), up 64%, and adjusted EBITDA of R31.8bn (US$1.9bn), up 111%, supported by stable operational delivery and stronger commodity prices
•Significant increase in profitability, generating a profit of R18.8bn (US$1.1bn)
•Record net cash from operating activities of R19.6bn (US$1.2bn), with 45% of adjusted EBITDA converted into notional free cash flow of R14.5bn (US$881m)
•High operating margins from the SA portfolio, with SA PGM and SA gold all-in sustaining cost (AISC) margins of 44% and 32%, respectively
•Disciplined capital allocation resulted in a 20% reduction in gross debt year-on-year to R32.1 billion (US$1.99bn), and an 18% reduction from H2 2025, while net debt halved and net debt to adjusted EBITDA gearing ratio improved to 0.18x
•Strong cash generation supported the declaration of an interim dividend of R5.7bn (US$352m) equivalent to 201 SA cents per share (49.73 US cents per ADR) at upper end of policy range, representing a 6.6% 10 trailing 12-month yield and an 8%10 implied annualised yield based on the interim dividend
•High-return, organic growth investment confirmed for Burnstone (adding >130kozpa gold) and Mt Lyell (adding ~26ktpa copper), in addition to the four SA PGM brownfields projects already in execution, and Keliber ramping up operations with 217.5kt ore mined
| | | | | | | | | | | | | | | | | | | | | | | | | | | | | | | | |
| US dollar | | | | | | SA rand |
| Six months ended | | | | | | Six months ended |
| Jun 2025 | Dec 2025 | Jun 2026 | | KEY STATISTICS | | Jun 2026 | Dec 2025 | Jun 2025 |
| | | | GROUP | | | | |
| (194) | | (94) | | 1,082 | | US$m | Basic earnings | Rm | 17,745 | | (1,580) | | (3,591) | |
| 292 | | 94 | | 1,036 | | US$m | Headline earnings | Rm | 17,002 | | 1,540 | | 5,372 | |
| 818 | | 1,297 | | 1,941 | | US$m | Adjusted EBITDA1 | Rm | 31,843 | | 22,727 | | 15,073 | |
| (211) | | (53) | | 1,147 | | US$m | Profit/(loss) for the period | Rm | 18,807 | | (833) | | (3,906) | |
| 18.39 | | 17.38 | | 16.41 | | R/US$ | Average exchange rate using daily closing rate | | | | |
| | | | | | | | | | |
| | | | | | | | | | | | | | |
TABLE OF CONTENTS | Page | | Share data for the Six months ended 30 June 2026 |
| | | | |
| | | Number of shares in issue | |
| | | - at 30 June 2026 | 2,830,567,264 |
Detailed safety and operational information | | | | |
| | | - weighted average | 2,830,567,264 |
| | | Free Float | 100 | % |
| | | Bloomberg/Reuters | SSWSJ/SSWJ.J |
| | | | |
| | | JSE Limited - (SSW) | |
| | | Price range per ordinary share (high/low) | R82.23 to R34.82 |
| | | Average daily volume | 14,348,151 |
| | | | |
| | | NYSE - (SBSW); one ADR represents four ordinary shares | |
| | | Price range per ADR (high/low) | US$21.12 to US$8.49 |
| | | Average daily volume | 6,492,708 |
| | | | |
| | | | |
Sibanye-Stillwater Operating and financial results | Six months ended 30 June 2026 1
| | | | | | | | | | | | | | | | | | | | | | | | | | | | | | | | |
| US dollar | | | | | | SA rand |
| Six months ended | | | | | | Six months ended |
| Jun 2025 | Dec 2025 | Jun 2026 | | KEY STATISTICS | | Jun 2026 | Dec 2025 | Jun 2025 |
| | | | SOUTHERN AFRICA (SA) OPERATIONS | | | | |
| | | | SA PGM operations | | | | |
| 804,252 | | 920,526 | | 789,647 | | oz | 4E PGM production2,3 | kg | 24,561 | | 28,632 | | 25,015 | |
| 1,429 | | 2,009 | | 2,681 | | US$/4Eoz | Average basket price | R/4Eoz | 43,996 | | 34,914 | | 26,283 | |
| 260 | | 673 | | 1,170 | | US$m | Adjusted EBITDA1 | Rm | 19,207 | | 11,904 | | 4,778 | |
| 1,299 | | 1,407 | | 1,600 | | US$/4Eoz | All-in sustaining cost1,4 | R/4Eoz | 26,252 | | 24,457 | | 23,892 | |
| | | | SA gold operations | | | | |
| 300,191 | | 332,149 | | 293,665 | | oz | Gold produced | kg | 9,134 | | 10,331 | | 9,337 | |
| 3,049 | | 3,706 | | 4,597 | | US$/oz | Average gold price | R/kg | 2,425,219 | | 2,070,774 | | 1,802,580 | |
| 260 | | 440 | | 549 | | US$m | Adjusted EBITDA1 | Rm | 8,995 | | 7,696 | | 4,809 | |
| 2,430 | | 2,589 | | 3,105 | | US$/oz | All-in sustaining cost1,4 | R/kg | 1,638,089 | | 1,446,794 | | 1,436,817 | |
| | | | INTERNATIONAL OPERATIONS | | | | |
| | | | US PGM underground operations | | | | |
| 141,124 | | 142,945 | | 137,930 | | oz | 2E PGM production2,5 | kg | 4,290 | | 4,446 | | 4,389 | |
| 985 | | 1,380 | | 1,672 | | US$/2Eoz | Average basket price | R/2Eoz | 27,438 | | 23,978 | | 18,114 | |
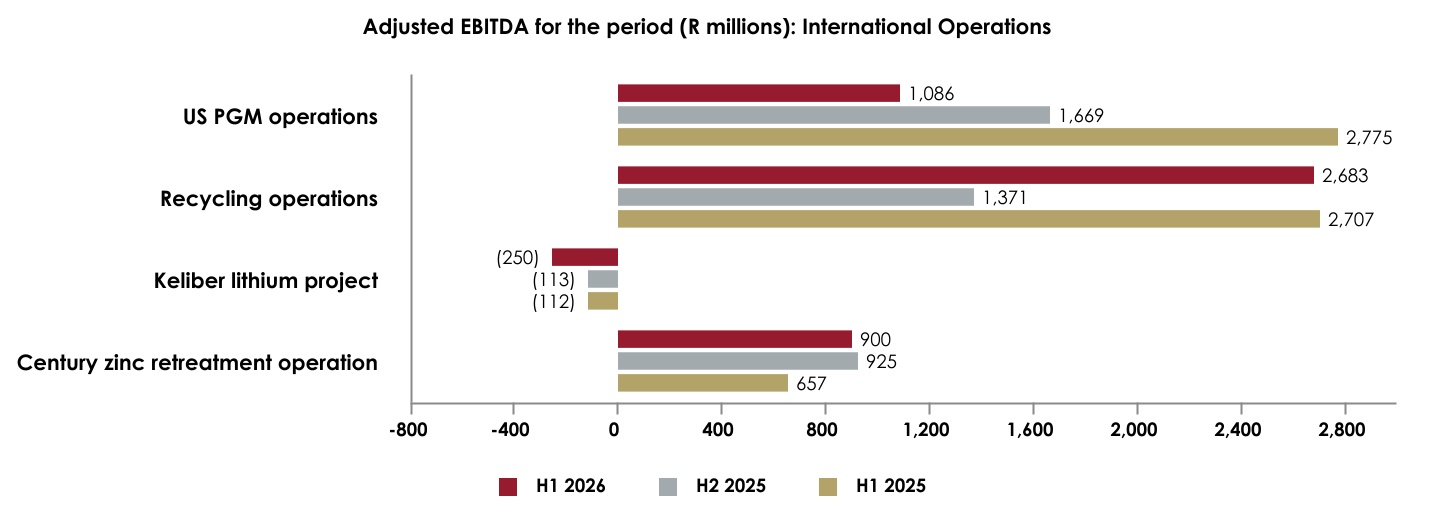
| 151 | | 98 | | 66 | | US$m | Adjusted EBITDA1 | Rm | 1,086 | | 1,669 | | 2,775 | |
| 1,207 | | 1,198 | | 1,347 | | US$/2Eoz | All-in sustaining cost1,4,6 | R/2Eoz | 22,105 | | 20,819 | | 22,200 | |
| | | | Recycling operations7 | | | | |
| 147 | | 81 | | 164 | | US$m | Adjusted EBITDA1 | Rm | 2,683 | | 1,371 | | 2,707 | |
| | | | Keliber lithium project | | | | |
| (6) | | (7) | | (15) | | US$m | Adjusted EBITDA1 | Rm | (250) | | (113) | | (112) | |
| | | | Century zinc retreatment operation | | | | |
| 51 | | 49 | | 45 | | ktZn | Payable zinc production8 | ktZn | 45 | | 49 | | 51 | |
| 2,626 | | 2,812 | | 3,294 | | US$/tZn | Average equivalent zinc concentrate price9 | R/tZn | 54,047 | | 48,878 | | 48,294 | |
| 36 | | 52 | | 55 | | US$m | Adjusted EBITDA1 | Rm | 900 | | 925 | | 657 | |
| 1,762 | | 2,094 | | 2,162 | | US$/tZn | All-in sustaining cost1,4 | R/tZn | 35,477 | | 36,399 | | 32,411 | |
1The Group reports adjusted earnings before interest, taxes, depreciation and amortisation (EBITDA) based on the formula included in the facility agreements for compliance with the debt covenant formula. The Group also reports All-in sustaining costs (AISC) for comparison to similar industry metrics used in the mining industry. See "Non-IFRS measures" for more information on these metrics presented by Sibanye-Stillwater. Adjusted EBITDA may not be comparable to similarly titled measures of other companies. Adjusted EBITDA and AISC are not measures of performance under IFRS Accounting Standards and should be considered in addition to and not as a substitute for any other measure of financial performance and liquidity. For a reconciliation of profit/(loss) before royalties and tax to adjusted EBITDA, see note 19 of the condensed consolidated financial statements. The adjusted EBITDA amount in US$m for the six months ended 31 December 2025 is calculated using the adjusted EBITDA amount in US$m for the year ended 31 December 2025 less the adjusted EBITDA amount in US$m for the six months ended 30 June 2025 2The Platinum Group Metals (PGM) production in the SA operations is principally platinum, palladium, rhodium and gold, referred to as 4E (3PGM+Au) and measured at the concentrator, and the US underground operations is principally platinum and palladium, referred to as 2E (2PGM)
3The SA PGM production excludes the production associated with the purchase of concentrate (PoC) from third parties. For a reconciliation of the production and third party PoC, refer to the "Reconciliation of operating cost excluding third party PoC for Total SA PGM operations and Marikana - Six months"
4See "Salient features and cost benchmarks - Six months" for the definition of All-in sustaining cost (AISC). The SA PGM All-in sustaining cost excludes the production and costs associated with third party PoC
5The US PGM operations’ underground production is converted to metric tonnes and kilograms, and financial performance is translated to SA rand (rand)
6During the six months ended 30 June 2025 the US PGM operations recognised R2,466 million (US$139 million) which relates to Section 45X Advance Manufacturing Production Credits applicable to the 2023 and 2024 financial reporting years and presented as a reduction to mining costs. The US PGM operations’ All-in sustaining cost for the six months ended 30 June 2025 were adjusted to exclude the Section 45X Advance Manufacturing Production Credits applicable to the 2023 and 2024 financial reporting years
7Recycling includes Reldan Pennsylvania (PA), Metallix North Carolina (NC) and Montana recycling sites. The acquisition of the NC site was concluded on 4 September 2025. The six months ended 31 December 2025 only includes the results of the NC site since acquisition
8Payable zinc production is the payable quantity of zinc metal produced after applying smelter content deductions
9Average equivalent zinc concentrate price is the total zinc sales revenue recognised at the price expected to be received excluding the fair value adjustments divided by the payable zinc sales
10Based on the closing share price of R50.28 on 28 August 2026. The 6.6% trailing 12-month dividend yield is calculated using combined dividends of 332 SA cents per ordinary share, comprising the H1 2026 interim dividend of 201 SA cents and the FY2025 final dividend of 131 SA cents. The 8.0% implied yield is calculated by annualising the H1 2026 interim dividend of 201 SA cents per ordinary share and the same reference share price
Sibanye-Stillwater Operating and financial results | Six months ended 30 June 2026 2
OVERVIEW BY RICHARD STEWART, CHIEF EXECUTIVE OFFICER OF SIBANYE-STILLWATER In January 2026, we shared a refreshed Group strategy that prioritises our business fundamentals. This strategy outlined a focus on optimising profitability, which, combined with disciplined capital allocation, would create flexibility to deliver long term value accretive growth. During the period under review, we have continued to drive profitability through our strategic priorities including increasing operating margins through performance excellence, improving cost efficiencies through simplification of our operating model, enhancing capital returns through simplifying our portfolio and improving cash conversion.
A solid operational performance during H1 2026, combined with strong commodity prices, have generated significant earnings and cash. This has not only demonstrated the value and earnings potential of our unique portfolio, but also allowed the company to materially advance our short term strategic objective of strengthening the business fundamentals.
The Group delivered record revenue of R90bn (US$5.5bn), a 111% increase in adjusted EBITDA to R31.8bn (US$1.9bn), record net cash from operating activities of R19.6bn (US$1.2bn) and a net profit of R18.8bn (US$1.1bn), compared to a net loss of R3.9bn (US$211m) for H1 2025. The quality of this result is reflected in the conversion of 45% of adjusted EBITDA into notional free cash flow of R14.5bn (US$881m).
The stronger financial position enabled the Group to deliver against its capital-allocation priorities. This includes declaring an interim dividend of R5.7bn (US$352m), strengthening the balance sheet, with gross debt declining by 20% to R32.1 billion (US$1.99bn) and net debt more than halving to R9.7bn (US$593m), reducing net debt to adjusted EBITDA to 0.18x, as well as continuing to invest in value-accretive organic growth through commodity cycles.
Safe production
Safety remains our foremost priority and the foundation of performance excellence. The Group achieved its best-ever H1 total recordable injury frequency rate (TRIFR) and serious injury frequency rate (SIFR), with both improving by 8%, while high-potential incidents reduced by 31%, reflecting real risk reduction in our operations.
These improvements were overshadowed by the tragic loss of Khanyile Magwebelele from our Marikana K3 shaft, and Thekololo Nkoe and Xolisa Mtshutshwana from our Kloof Masimthembe shaft, in two separate incidents during Q2 2026, following a fatality-free first quarter. We extend our deepest condolences to their families, friends and colleagues.
The sustained fatal free achievements across the majority of our operations, demonstrates our ability to eliminate fatal incidents and serious harm, and achieving this consistently across the entire group remains our highest priority. To achieve this our focus prioritises visible safety leadership, disciplined verification and application of critical controls, empowered teams, effective management routines and sustained implementation of lessons learned across all operations. Detailed safety information is provided from page 6. Operating performance
The SA PGM operations continued to deliver consistent production of 831,307 4Eoz (including third party purchase of concentrate), reflecting a year on year decline of 1%, largely driven by lower surface production and lower attributable production from Mimosa. Steady production output combined with disciplined cost management and significantly stronger 4E PGM basket prices (a 67% increase), delivered strong earnings and cash generation for the Group. The SA PGM operations delivered an industry competitive 44% AISC margin, while adjusted EBITDA increased by 302% to R19.2 billion (US$1.2 billion) and Notional free cash flow of R10.4 billion (US$631m) was generated.
Production across the SA gold operations declined by 2% to 9,134kg (293,665oz), associated with a 9% decrease in underground production, primarily due to the rebasing of the Kloof operations in H2 2025, offset by a 13% increase in surface production, reflecting the transition towards a shallower, higher margin, longer-life portfolio. Higher sales volumes of 9,588kg (308,261oz), combined with a 35% increase in the average gold price, resulted in the SA gold operations delivering record adjusted EBITDA of R9.0bn (US$549m), and Notional free cash flow of R4.0bn (US$241m). Despite cost pressures, with AISC increasing by 14% to R1.64 million/kg (US$3,105/oz), due to inflationary cost increases, higher royalties associated with increased profitability, higher pumping costs at Driefontein and higher third-party aggregate purchase costs (due to higher gold prices) at Cooke, the SA gold operations delivered a robust 32% AISC margin. The supportive gold-price environment provides an opportunity to assess the potential economic extraction of additional reserves at Kloof beyond 2026, including through the support of appropriately priced hedging mechanisms.
The US PGM operations continued to advance their mechanisation strategy during H1 2026. Production decreased by 2% primarily due to lower grades at East Boulder, while AISC increased by 12%, as planned investment, development activity and sustaining capital expenditure increased in support of the transition to full mechanisation. Despite these near-term investments, AISC of US$1,347/2Eoz (R22,105/2Eoz) remained below the lower end of annual guidance, supporting a 12% AISC margin. A 70% increase in the average 2E PGM basket price, stronger by-product credits and Section 45X credits further supported profitability. The mechanisation strategy to reduce AISC to approximately US$1,000/2Eoz by the end of 2028 progressed during the period under review, with progress across critical mine development and successful testing of mechanised bolting equipment. In addition, engagements with organised labour and employees has been progressing to secure a labour agreement supportive of the required transition to mechanisation and associated changes to a team-based incentive scheme.
The Recycling operations delivered a standout H1 2026 performance, with increased scale, successful integration and feed optimisation driving higher volumes, margin expansion and strong cash generation from the integrated recycling platform. Adjusted EBITDA increased by 11% to US$164 million (R2.7 billion), and excluding the impact of Section 45X credits, the EBITDA margin improved to 13% from 5% in H1 2025. Normalising for S45X credits in both periods, underlying adjusted EBITDA increased by 536% year-on-year to US$137 million (R2.2 billion). This performance reflects the addition and successful integration of North Carolina, significantly higher Pennsylvania production, operational and commercial synergies across the Recycling operations, favourable precious-metal prices and the optimisation of higher-margin feed streams. The improved performance was further supported by disciplined working capital management, with precious metal ounces recycled and sold increasing by 142% to 2.8 million precious metal ounces. Equivalent gold ounces recycled and sold amounted to 244koz for H1 2026 (H1 2025: 165koz). The recycling business is a strategic contributor to Group earnings and cash generation, while providing diversified exposure to precious metals through a scalable, capital-light processing platform.
The Century operation remained profitable and cash generative as the current tailings-retreatment operation approaches the end of its life. The operation delivered a 54% increase in adjusted EBITDA to US$55 million (R900 million), with higher zinc concentrate prices and lower treatment charges offsetting lower production as operational flexibility reduced towards the end of its current mine life. AISC increased by 23% to US$2,162/tZn (R35,477/tZn) due to lower production volumes and inflationary cost pressures.
The Keliber lithium project achieved important milestones during H1 2026 as it progressed from construction towards commissioning and operational readiness. Mining commenced at the Syväjärvi mine, with 217.5kt of ore mined and a strategic stockpile of 185.5kt
Sibanye-Stillwater Operating and financial results | Six months ended 30 June 2026 3
established. Hot commissioning of the concentrator commenced in April 2026, with continuous operating runs of up to 142 hours demonstrating successful throughput performance. The current focus is on optimising spodumene concentrate grade and achieving stable, consistent concentrate production. The project remains within its approved capital forecast, with cumulative construction expenditure of €719m at 30 June 2026. In response to lithium-market volatility, the staged commissioning approach prioritises stable mining and concentrator performance before refinery start-up, reducing integrated ramp-up risk and preserving capital flexibility. Jacques van Rensburg has assumed acting responsibility for Keliber from 1 August 2026, following the departure of Hannu Hautala. Jacques' engineering and operational leadership experience will support the next phase of commissioning, ramp-up and the production of saleable lithium products.
Disciplined capital allocation and organic growth for sustainability
Our approach to sustainability is broader than just environmental and social performance. It starts with sustaining a safe, competitive and financially resilient business, supported by operational excellence and disciplined investment in longer-life, higher-quality assets. This strengthens our ability to manage resources responsibly, deliver returns and economic value, and create enduring shared value for our shareholders, employees, communities and all other stakeholders.
The Board declared an interim dividend of R5.7bn (US$352m), equivalent to 201 SA cents per ordinary share or 49.73 US cents per ADR. This represents 35% of normalised earnings1, at the upper end of the Group’s dividend policy, and reflects an H1 2026 annualised interim dividend yield* of 8.0%. Including the H2 2025 final dividend, the trailing 12-month dividend yield* is 6.6%, among the highest in our peer group.
Record cash generation materially strengthened the balance sheet and expanded financial flexibility. Gross debt declined by 20% year-on-year and 18% from 31 December 2025 to R32.1bn (US$2.0bn), while net debt more than halved to R9.7bn (US$593m), reducing net debt to adjusted EBITDA to 0.18x.
The Group continued to unlock embedded value through disciplined investment in organic growth. This has primarily considered the SA PGM brownfield project portfolio that benefits from existing infrastructure, established resources and extensive operating knowledge, all reducing execution risk and avoiding acquisition premiums. SA PGM brownfield projects provide a possible pathway to sustain an approximate 1.5Moz annual production profile, increase exposure to UG2 ore and support a greater contribution from mechanised mining. Please refer to our SA Capital markets day presentation for more information about these projects, available at www.sibanyestillwater.com/features/2026/capital-markets-day-2026-sa-operations/.
In addition, we are pleased that Burnstone and Mt Lyell have recently received a positive investment decision by the Board to proceed, marking a further step in unlocking unrealised value from the Group’s organic project portfolio.
Burnstone supports the transition of the SA gold portfolio towards shallower, lower-risk and longer-life production. The project is expected to produce approximately 130,000oz of gold annually at steady state, strengthening future reserve replacement and portfolio sustainability. Refer to page 7 for more information. Mt Lyell, the long-life, copper-gold project located near Queenstown, Tasmania, benefits from substantial existing infrastructure and is expected to produce approximately 26kt of copper, 16koz of gold and 116koz of silver annually at steady state, with first production targeted for early 2029. Approximately US$4.1m (R68m) of capital expenditure is planned for H2 2026, as the project moves into execution. More information is available on page 10 of this report and in the H1 2026 results presentation available at www.sibanyestillwater.com/news-investors/reports/. Projects in the Group's portfolio will continue to be evaluated and sequenced according to returns, affordability, readiness and strategic fit, balancing shareholder returns and balance-sheet strength with investment in future production and portfolio quality.
1 Normalised earnings, as defined and reconciled in note 11 of the consolidated interim results, is not a measure of performance under IFRS Accounting Standards and should not be considered in isolation or as alternatives to any other measure of financial performance presented in accordance with IFRS Accounting Standards
*Based on closing share prices on 28 August 2026. The 8.0% yield relates to the annualised H1 2026 interim dividend of 201 SA cents per share; the 6.6% trailing 12-month yield includes the H1 2026 interim dividend and H2 2025 final dividend, totalling 332 SA cents per share. Peers: Valterra, Northam, Implats, Gold Fields and Harmony.
Navigating a volatile market environment
Commodity markets remained volatile during H1 2026, reflecting geopolitical tensions, evolving and uncertain trade policies, inflation risks and downward revisions for global economic growth. Global growth expectations for 2026 were revised lower to 2.5%, with the US economy remaining relatively resilient, while growth in China, emerging markets and the Eurozone were revised lower.
Precious metals markets consolidated following strong gains and record price levels during Q1 2026. Gold and platinum prices were supported by strong investment demand and continued central bank gold purchases, although higher US interest rates and a stronger US dollar created headwinds for precious metal prices. Market liquidity improved as gold and platinum ETF holdings declined during H1 2026, resulting in platinum lease rates moderating. While weaker global automotive sales may weigh on palladium and rhodium demand, platinum and palladium markets are expected to remain in deficit over the next 18 months, with rhodium remaining broadly in balance. Medium-term PGM fundamentals continue to be supported by constrained primary supply, muted recovery in autocatalyst recycling and policy underpins for catalysed vehicles.
Lithium prices remained well above 2025 levels despite increased volatility during the period. Prices rose sharply to near three-year highs during Q2 2026, supported by robust battery electric vehicle (BEV) and battery energy storage system (BESS) demand, supply constraints and customer restocking. Prices subsequently moderated following the resumption of concentrate exports from Zimbabwe and announcements of new and returning supply from China, Australia and the Democratic Republic of Congo. While lithium prices are expected to ease further during H2 2026 as supply increases, they are expected to remain above 2025 levels. Longer term, the market outlook remains constructive, supported by sustained demand growth and the expectation that new mine supply will lag demand growth from the end of the decade.
This volatile macro environment reinforces the relevance of our strategy. A simplified portfolio, clear operational accountability, flexible and disciplined project sequencing and execution, and a stronger balance sheet are essential to maintaining agility and resilience through commodity cycles while retaining flexibility to capture longer-term value.
The H1 2026 result demonstrates the earnings potential within our portfolio, but also confirms the importance of stable production, cost discipline and capital allocation in converting supportive prices into sustainable cash flow and value.
Sibanye-Stillwater Operating and financial results | Six months ended 30 June 2026 4
Operating guidance for 2026*
Following a stable H1 2026 operational delivery, annual production, cost and capital guidance is maintained except where specifically indicated below:
•The SA gold operation's cost guidance and the inclusion of the 2026 capital guidance for Burnstone and Mt Lyell
| | | | | | | | | | | | | | |
| 2026 Annual guidance | Production | All-in sustaining cost | Total capital |
SA
operations | SA PGM operations (4E PGMs) | 1.65 - 1.75Moz3,4 | R26,500 - 27,500/4Eoz
(US$1,453 - 1,508/4Eoz)² | R8bn (US$439m)²
(incl. R1.79bn (US$98m) for project capital) |
SA gold operations (excl. DRDGOLD) | 13,700 - 14,700kg
(440 - 473koz) | R1,750k - 1,840k/kg
(US$2,984 - 3,138/oz)² | R3bn (US$164m)² (incl. R98m (US$5m) for Burnstone project capital) |
SA gold operations (incl. DRDGOLD)7 | 19,100 - 19,750kg
(614 - 635koz) | R1,565k - R1,685k/kg (US$2,670 - 2,870/oz)2 | R6.6bn (US$364m)2 (incl. R3.1bn (US$172m) for DRDGOLD project capital) |
International
operations | US PGM operations (2E mined) | 280 - 300koz | US$1,520 - 1,580/2Eoz¹
Including Section 45X:
US$1,360 - 1,420/2Eoz | US$125m - US$135m (incl. US$6m growth)
(R2.3bn - R2.5bn incl. R109m growth)² |
Recycling operations (Columbus, PA and NC) (PGM autocats, industrial and e-waste precious metals bearing waste) | Total 400 - 420koz gold equivalent ounces5 | n/a | US$12.2m (R223m)² |
| Keliber lithium project | 15k - 20k
tonnes of spodumene concentrate | n/a | €180m - €190m6 (R3.7bn – R3.9bn)² (incl. €90m (R1.8bn) for project capital) |
| Century zinc operations | 86.3k - 98.3k
tonnes (payable) | A$3,400 – 3,800/t (R42,160 – 47,120/t)² (US$2,311 - 2,583/t)² | A$5m - A$5.5m
(US$3.4m – US$3.7m, R62m - R68.2m)² |
| Mt Lyell | n/a | n/a | A$11m
(US$7.5m, R136m)² |
Source: Company forecasts, Note: Guidance does not take into account the impact of unplanned events
*As at 1 September 2026
1US PGM AISC is impacted by tax and royalties paid based on PGM prices, current guidance was based on spot 2E PGM prices of US$1,180/oz; By product credit assumptions of Rh US$4,800/oz and gold US$2,500/oz
2Estimates are converted at an exchange rate of R18.24/US$, R20.43/€ and R12.40/A$
3SA PGM operations production guidance includes third party PoC and 50% attributable production from Mimosa
4SA PGM operations AISC excludes the purchase cost of third party PoC and Mimosa costs and capital (equity accounted)
5Gold equivalent ounce production calculated using the following metal pricing: Au US$2,506/oz, Ag US$38/oz, Pt US$1,150/oz, Pd US$1,050, Ir US$4,000/oz, Rh US$4,800/oz, Ru US$500/oz and Cu US$4.4/lb
62026 guided capital includes construction phase start-up capital, sustaining cost and capitalised cost. The current production profile includes the Syväjärvi and Rapasaari open pit mining areas
7DRDGOLD included at 100%
RICHARD STEWART
CHIEF EXECUTIVE OFFICER
Sibanye-Stillwater Operating and financial results | Six months ended 30 June 2026 5
DETAILED SAFETY AND OPERATIONAL COMMENTARY SAFE PRODUCTION — UNWAVERING FOCUS ON ELIMINATING FATALITIES
The safety and health of our workforce remain our foremost priority and the foundation of safe operational performance. Tragically, three colleagues lost their lives in two operational incidents at the SA operations during H1 2026. We extend our deepest condolences to their families, friends and colleagues. These losses reinforce our resolve to eliminate fatalities and serious harm.
In remembrance
Khanyile Magwebelele
•Winch operator, K3 shaft, SA PGM operations
•Fatally injured during night-shift cleaning on 16 April 2026
Thekololo Nkoe and Xolisa Mtshutshwana
• Kloof Masimthembe shaft, SA gold operations
• Lost their lives in a shaft-related incident on 3 May 2026
We honour their memory and remain resolute in our commitment to preventing fatalities and serious harm.
H1 2026 safety performance
The Group achieved its best-ever H1 performance for key injury-frequency measures. The serious injury frequency rate (SIFR) improved by 8% to 2.09, from 2.28 for H1 2025, while the total recordable injury frequency rate (TRIFR) improved by 8% to 3.60, from 3.90. High-potential incidents reduced by 31%, while the fatality injury frequency rate (FIFR) (per one million hours worked) remained unchanged at 0.038.
Safety performance across the operations was mixed. The combined SA operations (SA PGM and SA gold) recorded a 4% improvement in SIFR and a 5% improvement in TRIFR. The SA gold operations delivered a notable improvement, with SIFR decreasing by 31% and TRIFR improving by 30%, together with a 32% improvement in the Lost day injury frequency rate (LDIFR). This was partly offset by a deterioration at the SA PGM operations, where LDIFR increased by 15%, TRIFR by 14% and SIFR by 21% compared with H1 2025. The US operations recorded a significant improvement, with TRIFR decreasing by 41%, SIFR improving by 89% and LDIFR improving by 56%. At the Keliber project, TRIFR improved by 53%, with no serious injuries recorded during H1 2026. The Australian operations had two recordable injuries, including one serious injury, compared with zero recordable injuries in H1 2025.
The safety culture uplift programme, launched across the SA operations in 2025, continues to progress. The programme is focused on driving sustainable behavioural change through leadership mindset coaching and systems thinking, with implementation being extended to Mine managers, Functional managers and key Plant managers. The programme is aligned with the Group’s broader leadership development initiatives, iCARES values and existing culture programmes to ensure a consistent and integrated approach to safety leadership.
Critical control management remains a core risk-reduction priority, supported by mature verification and auditing processes and continued emphasis on the consistent and sustained execution of critical controls. A formal Group-wide process has also been implemented to monitor the effective and sustainable implementation of lessons learned from prior high-potential incidents, ensuring that corrective actions are applied, verified and maintained over time.
OPERATIONAL REVIEW
Southern Africa (SA) operations
SA PGM operations — Consistent delivery and cost discipline generates substantial margins, earnings and cash
The SA PGM operations delivered a strong H1 2026 result, with stable underground production and disciplined cost management maximising the benefit of significantly stronger PGM prices. The AISC at the managed SA PGM operations remained below the lower end of annual guidance, achieving a 44% AISC margin while adjusted EBITDA increased by 302% to R19.2 billion (US$1.2 billion) and notional free cash flow increased to R10.4 billion (US$631 million).
Total 4E PGM production (including third party purchase of concentrate (PoC)) decreased by 1% to 831,307 4Eoz, primarily due to lower surface production and lower attributable production from Mimosa, partly offset by higher total recovery grades, stable underground production and higher purchase of concentrate (PoC) purchases. Total managed and attributable 4E PGM production, excluding third-party PoC, decreased by 2% to 789,647 4Eoz. Underground production excluding Mimosa increased by 1%, supported by a 24% increase (10,557 4Eoz) at Marikana K4, which offset lower Rustenburg production following planned plant maintenance. Approximately 15,000 4Eoz remained on stockpile at period end for processing during H2 2026.
Surface production (excluding PoC) declined by 26% year-on-year to 40,034 4Eoz, primarily due to the transition to a new feed source at Marikana, the depletion of surface reserves at Rustenburg and lower feed availability at Platinum Mile. Marikana surface production (excluding PoC) decreased by 67%, reflecting lower grade and recoveries from the new feed source, while Rustenburg surface production decreased by 14% as available surface reserves declined. Platinum Mile production also decreased by 14% after one of the two feed streams from the E-Feed dam was stopped. A study is underway to determine the optimal treatment route for the remaining E-Feed dam material.
Third-party purchase of concentrate increased by 16% to 41,660 4Eoz, partially offsetting the reduction in surface production and supporting total SA PGM production.
AISC at the managed SA PGM operations, excluding third-party PoC, increased by 10% year-on-year to R26,252/4Eoz (US$1,600/4Eoz), however remained below the lower end of annual guidance of R26,500/4Eoz.
The R2,360/4Eoz (US$301/4Eoz) increase in AISC unit cost was primarily driven by the R1.1 billion (US$66 million) increase in royalties linked to the higher PGM basket price, together with annual inflationary increases in input costs and supply-chain pressures affecting consumables, including fuel, lubricants and steel products. The royalty increase equated indicatively to approximately R1,383/4Eoz (US$85/4Eoz), representing about 59% of the net AISC increase.
Inflationary cost pressures and the increase in royalties were partly offset by higher by-product credits, including improved chrome margins, which reduced AISC (including PoC) by R7,480/4Eoz (US$456/4Eoz), a 33% improvement from the approximately R5,643/4Eoz (US$307/4Eoz) benefit in H1 2025. The improvement was supported by stronger prices for iridium, ruthenium and base metals, together with the continued contribution from chrome by-products.
Chrome production decreased by 18% year-on-year to 951kt, while chrome sales declined by 17% to 888kt. The reduction was predominantly due to the cessation of the Marikana bulk tailings treatment (BTT) chrome plant in H2 2025, which accounted for
Sibanye-Stillwater Operating and financial results | Six months ended 30 June 2026 6
approximately 175kt, or 83%, of the 211kt year-on-year production decline. Excluding BTT, chrome production decreased by approximately 36kt (3%), reflecting lower production from the Marikana, Rustenburg and Platinum Mile operations.
Chrome operating profit was R1.1 billion (US$65 million), 18% lower year-on-year, mainly on lower sales volumes following the planned closure of the BTT plant in H2 2025 when remining of the ETD1 tailings storage facility was completed. Higher chrome prices and a 5% increase in operating profit at the Rustenburg operations to R761 million (US$46 million) partly mitigated the impact of lower volumes, offset by weaker contributions from Marikana and Platinum Mile.
Third-party PoC purchase cost increased by 85% to R2.0 billion (US$120 million), reflecting the 16% increase in purchased volumes and an indicative 59% increase in purchase cost per ounce, primarily associated with stronger metal prices. Third-party PoC purchase costs are excluded from the managed SA PGM AISC and related guidance.
AISC is expected to increase during H2 2026 in line with the annual guidance range, reflecting the planned increase in ore-reserve development and sustaining capital. Total capital expenditure increased by 4% to R2.6 billion (US$161 million), with ore-reserve development increasing by 8% to R1.2 billion (US$72 million) and sustaining capital increasing by 2% to R1.1 billion (US$69 million), partly offset by a 3% decrease in project capital to R321 million (US$20 million). H1 2026 expenditure represented approximately 33% of full-year capital guidance of R8.0 billion (US$439 million), indicating a higher planned capital run-rate during H2 2026. Sustaining investment was directed towards operational flexibility, infrastructure refurbishment and approved extension initiatives, including the Thembelani extension project and refurbishment work at the Precious metal refinery. Lower project capital reflected Marikana K4 moving closer to steady-state production, while the Siphumelele UG2 project commenced its build-up at Rustenburg.
4E PGM sales (excluding Mimosa which is equity accounted) increased by 11% while the average PGM basket price increased by 67% to R43,996/4Eoz (US$2,681/4Eoz), lifting SA PGM operations revenue by 73% to R43.1 billion (US$2.6 billion). Adjusted EBITDA increased by 302% to R19.2 billion (US$1.2 billion), reflecting significant operational leverage from higher PGM commodity prices and sales volumes.
At Mimosa, attributable PGM production decreased by 7% to 55,002 4Eoz due to lower feed volumes and grade, which also affected recoveries. AISC increased by 23% to US$1,465/4Eoz (R24,035/4Eoz), primarily due to inflationary increases in input costs, lower production volumes, higher royalties associated with the stronger average PGM basket price and a 72% increase in sustaining capital to US$15 million (R245 million). These adverse impacts were partly offset by by-product-credit movements. Concentrate sales increased by 32%, with the comparative period affected by the suspension of exports from Zimbabwe during April and May 2025.
Please refer to page 16 and 18 for further operational results statistics. SA gold operations — Higher gold prices and a growing surface contribution delivered record earnings and cash generation
The SA gold operations delivered record adjusted EBITDA and substantially higher cash generation, supported by the stronger gold price and a growing surface contribution.
The SA gold operations (including DRDGOLD) delivered record adjusted EBITDA and substantially higher cash generation in H1 2026. Adjusted EBITDA increased from R4.8 billion (US$260 million) to R9.0 billion (US$549 million), supported by higher gold sales and a significantly higher average gold price received. Gold sold increased by 5% to 9,588kg (308,261oz), while the average gold price received increased by 35% to R2,425,219/kg (US$4,597/oz). This more than offset a 2% decline in gold production to 9,134kg (293,665oz), with a 9% (or 568kg, 18,262oz) decrease in underground production partly offset by 13% higher surface production.
Gold production decreased by 2% to 9,134kg (293,665oz), largely reflecting the planned rebasing of Kloof during H2 2025. Higher surface production, driven by a 237kg (7,620oz) increase from DRDGOLD and increased third-party toll treatment at Cooke, partly offset this lower underground production. Driefontein production remained broadly stable while Beatrix production was impacted by constrained access to higher-grade areas following seismic damage to infrastructure and lower-than-expected plant recoveries.
AISC increased by 14% to R1,638,089/kg (US$3,105/oz). Higher gold sold year-on-year of 5% was offset by higher royalties associated with higher gold average price (added 2% year-on-year), higher pumping costs at Driefontein (added 1% year-on-year), higher third-party aggregate purchase costs at Cooke (added 2% year-on-year), inflationary cost increases and 19% lower production at Kloof.
Capital expenditure increased by 15% to R3.4 billion (US$206 million), primarily due to DRDGOLD where total capital expenditure increased by 56% to R2.0 billion (US$123 million) as project capital expenditure on Vision 2028 infrastructure projects for Ergo and FWGR progressed well in H1 2026 and as highlighted in the capital projects update presentation held by DRDGOLD management on 15 July 2026.
Please refer to page 16 and 18 for further operational results statistics. The Burnstone project
In line with the Group’s strategy to unlock value from internal organic opportunities and its disciplined capital-allocation framework, the Burnstone gold project received a positive investment decision by the Board following completion of a restated feasibility study and internal assurance review. An initial R98 million budget for 2026 has been approved and project setup has commenced.
Burnstone is a high-value, near-term gold growth project located near Balfour in Mpumalanga, approximately 80km south-east of Johannesburg. The project will mine the Kimberley Reef at an average depth of approximately 550 metres, with a maximum planned depth of approximately 1,050 metres. Its shallower mining profile and substantial existing infrastructure support the transition of the SA gold portfolio towards safer, lower cost, more efficient and longer-life production.
At 31 December 2025, Burnstone contained surface and underground gold Mineral Reserves of 2.7Moz and Mineral Resources of 8.9Moz. The approved project is expected to establish future gold Mineral Reserves for the Group and partially offset depletion from the mature conventional SA gold operations.
Key operating and economic metrics in 2026 real terms:
•Average annual steady-state gold production of approximately 130,000oz
•Average AISC of approximately R872,000/kg at steady state
•Net present value (NPV) of approximately R19.2 billion at a 10% discount rate
•Internal rate of return (IRR) of approximately 36.1%
•Project infrastructure capital of approximately R3.5 billion over six years
•Pre-production capital of approximately R2.5 billion through 2028
•Approved project budget of R98 million for 2026
•Build-up to approximately 2,500 employees during steady-state operations
Sibanye-Stillwater Operating and financial results | Six months ended 30 June 2026 7
The current development plan provides for pre-production capital during 2027 and 2028, with the processing plant expected to commence operating in 2029. Gold production is expected to build progressively towards steady-state output rather than reaching full capacity immediately.
Burnstone strengthens the Group’s precious-metals underpin through a high-return project already owned within the portfolio, avoiding an acquisition premium. Existing infrastructure and extensive pre-development reduce the remaining execution requirements and capital intensity relative to a comparable greenfield project. Burnstone will be advanced through disciplined execution, with capital deployed in line with project readiness, affordability and the Group’s capital-allocation framework.
For more information about the Burnstone project, please refer to www.sibanyestillwater.com/business/southern-africa/gold-operations/projects/.
International and recycling operations
US PGM operations — Resilient operating delivery while investing for mechanised, lower-cost production
The US PGM operations delivered production in line with annual guidance while continuing to invest in development, mechanisation and enabling infrastructure for higher productivity, increased production and structurally lower costs.
The 2E PGM production from the US PGM operations decreased by 2% year-on-year to 137,930 2Eoz in H1 2026, primarily due to lower production from the East Boulder mine. East Boulder production declined by 6% to 61,595 2Eoz, mainly reflecting lower concentrator grade associated with quality constraints highlighted in the Q1 2026 operating update, as well as shortages of sublevel extraction (SLE) labour. The quality constraints improved during Q2 2026, although the SLE labour shortages remain a constraint. Production from the Stillwater East mine was broadly stable, increasing marginally to 76,334 2Eoz. Across the US PGM operations, plant head grade declined by 10% to 12.02g/t, partly offset by an 8% increase in tonnes milled to 394kt.
2E PGM ounces sold decreased by 5% year-on-year to 126,695 2Eoz from 133,106 2Eoz in H1 2025, mainly due to a planned concentrate inventory build-up at the smelter. This inventory is expected to unwind during H2 2026.
As outlined at the International and Recycling operations Capital Markets Day, AISC was expected to increase during 2026 as the US PGM operations increased development and capital expenditure in preparation for the phased implementation of their mechanisation strategy. AISC increased by 12% year-on-year to US$1,347/2Eoz (R22,105/2Eoz) from US$1,207/2Eoz (R22,200/2Eoz) in H1 2025, but remained marginally below the lower end of 2026 annual guidance of US$1,360/2Eoz to US$1,420/2Eoz (R24,800/2Eoz to R25,900/2Eoz). Excluding Section 45X credits, AISC was US1,528/2Eoz (R25,082/2Eoz). The H1 2026 Section 45X credit was US$25 million (R411 million), or US$181/2Eoz (R2,977/2Eoz), compared with the US$20 million, or US$144/2Eoz (R2,551/2Eoz), credit recognised for H1 2025. The AISC increase was primarily driven by the planned higher ore reserve development and sustaining capital. In terms of the expected payout of the Section 45X credits, the US Internal Revenue Service (IRS) has selected the US PGM operations’ 2023 tax year, which includes the first Section 45X credit claim, for examination, which is expected to delay the timing of related cash receipts. The Group remains confident in the basis of its claims and will work constructively with the IRS through the examination process.
The higher ore reserve development and sustaining capital expenditure was the largest contributor to the year-on-year AISC increase and was aligned with the planned optimisation and mechanisation programme. Ore reserve development increased by 26% to US$42 million (R689 million) from US$33 million (R614 million) in H1 2025, mainly due to contractor-led vertical development at Stillwater East. Sustaining capital more than doubled to US$14 million (R227 million) from US$7 million (R121 million), reflecting investment into the planned transition to full mechanisation. Total capital expenditure on an AIC basis increased by 32% to US$60 million (R977 million) from US$45 million (R829 million) in H1 2025.
The average 2E PGM basket price increased by 70% to US$1,672/2Eoz (R27,438/2Eoz), compared with US$985/2Eoz (R18,114/2Eoz) in H1 2025. Despite the higher basket price, adjusted EBITDA decreased by US$85 million (R1.7 billion) or 56%, to US$66 million (R1.1 billion), compared with US$151 million (R2.8 billion) in H1 2025. The year-on-year decrease was primarily due to the timing of Section 45X government grant income recognition rather than underlying operating performance. H1 2025 included a once-off US$139 million (R2.5 billion) recognition relating to 2023 and 2024 Section 45X credits, which did not recur in H1 2026. Excluding this once-off benefit, H1 2026 adjusted EBITDA improved materially, supported by the higher basket price.
The US PGM operations have a clear, sustainable and deliverable mechanisation strategy, centred on complete in stope mechanisation, which enables higher productivity, thereby reducing unit costs and improving through‑cycle resilience. The plan targets a structurally lower AISC of ~US$1,000/2Eoz (2026 real) from the end of 2028, supported by an estimated ~45% increase in steady‑state production to ~410k 2Eoz as the mechanisation programme is phased through to completion by H2 2028. This pathway strengthens operating efficiencies and competitiveness, while preserving longer‑term optionality and value from the world‑class, long‑life US PGM asset base.
Capital expenditure remains aligned with this plan, with the required infrastructure upgrades being executed. Most of the Stillwater East bolting fleet, together with other key fleet items, is expected to be delivered in H2 2026, supporting the transition of Stillwater to a fully mechanised mining model by the end of 2027. Additional enabling workstreams, including work management, organisational effectiveness, frontline leadership, technical capability upliftment and digital systems support, are being rolled out during H2 2026.
In support of the mechanisation strategy of the US PGM operations, the total rewards model has been redesigned and forms part of the hourly wage contract negotiations with the United Steel Workers Union (USW). The contract negotiations are ongoing. One of the proposed changes includes a new incentive model which intends to align team and target-based performance with that of a mechanised mining operation.
Please refer to page 16 for further operational results statistics. Recycling operations
The Recycling operations delivered a standout H1 2026 performance, with increased scale, successful integration and feed optimisation driving higher volumes, margin expansion and strong cash generation.
The Recycling operations, comprising the Pennsylvania (PA), North Carolina (NC) and Montana sites, generated adjusted EBITDA of US$164 million (R2.7 billion) inclusive of the Section 45X credits of US$27 million (R447 million) for H1 2026, compared with US$147 million (R2.7 billion) in H1 2025 (inclusive of S45X credits of US$126 million (R2.2 billion)), contributing 8% of the Group's adjusted EBITDA. Excluding the impact of Section 45X credits in both periods, underlying adjusted EBITDA increased by 536% year-on-year to US$137 million (R2.2 billion), with the adjusted EBITDA margin improving to 13% from 5% in H1 2025. This reflects the addition and successful integration of North Carolina, significantly higher Pennsylvania production, the gold equivalent ounces of which increased by 43% from 90koz to 129koz,
Sibanye-Stillwater Operating and financial results | Six months ended 30 June 2026 8
operational and commercial synergies across the Recycling operations, favourable precious-metal prices and the optimisation of higher-margin feed streams. The improved performance was further supported by disciplined working capital management, with precious metal ounces recycled and sold increasing by 142%.
Equivalent gold ounces recycled and sold amounted to 244koz for H1 2026. Total precious metals (gold, silver and PGMs) recycled and sold increased from 1.152 million ounces in H1 2025 to 2.788 million ounces in H1 2026. The increase was driven by a significant improvement in production at the Pennsylvania operation, where precious metals sold increased from 1.017 million ounces to 2.163 million ounces, together with the contribution of 0.502 million ounces from the North Carolina operation following its acquisition.
| | | | | | | | | | | | | | |
| Total oz/lbs sold excluding mixed scrap | | H1 2025 | H1 2026 | Variance |
| Gold | oz | 63,992 | 95,188 | 49 | % |
| 5E PGMs* | oz | 155,375 | 194,926 | 25 | % |
| Silver | oz | 932,712 | 2,498,226 | 168 | % |
| Total precious metals | oz | 1,152,079 | 2,788,340 | 142 | % |
| Copper | lbs | 1,499,184 | 1,427,789 | (5) | % |
* 5E PGMs: Platinum, palladium, rhodium, iridium and ruthenium*
Key areas of management remain safety, production stability, improving on-time delivery, disciplined cost management, strengthening integration synergies including culture alignment, and upgrading a metal consignment facility to further enhance liquidity and support future growth.
Keliber lithium project — Transitioned from construction, with mining underway and concentrator commissioning progressing
Mining at the Syväjärvi mine commenced in February 2026, with 217.5kt of ore extracted and an ore stockpile of 185.5kt available at 30 June 2026. Hot commissioning of the Keliber concentrator commenced in April 2026, operating continuously for up to 142 hours during commissioning, and targeting stable concentrate production during H2 2026.
Keliber project capital expenditure for H1 2026 was €58.5 million, or R1.1 billion, including capitalised interest and expenditure outside the project’s initial forecast scope. Cumulative construction-phase capital expenditure at 30 June 2026 was €719 million (R13.8 billion), excluding capitalised interest and exploration. The project remains within the approved capital forecast of €783 million (R15.0 billion), in 2024 real terms.
As part of the approved capital, work on the refinery will continue, which includes procuring critical spares, remediation of issues identified during cold commissioning and testing, and selected improvements arising from commissioning experience and benchmarking. The additional work is intended to strengthen refinery readiness and reliability ahead of its future ramp-up.
The lithium market conditions are being monitored closely as the Group progresses Keliber through a staged commissioning process.
The staged approach prioritises stable mining and concentrator operations before the refinery is commissioned, reducing integrated ramp-up risk and allowing lessons from upstream commissioning to be incorporated into refinery readiness. It also preserves financial flexibility by enabling the timing of remaining refinery capital and ramp-up expenditure to be aligned with operational readiness and lithium-market conditions.
* The figures have been translated where relevant at an average exchange rate of R19.15/€
Sandouville nickel refinery and the GalliCam project
Sandouville remains on care and maintenance, with site activities focused on asset integrity and regulatory compliance.
A consultation process regarding the future of the Sandouville refinery will be initiated with employee representatives, in accordance with applicable French labour law requirements. The Company is also actively working with the French government to find the best possible solution that is in the interest of all stakeholders. No final decisions have been taken and the consultation process will inform the assessment of available options.
Century zinc retreatment operation — Higher zinc prices supported strong cash generation as Century approaches end-of-life
The Century operation remains focused on production optimisation and cost efficiency as operational flexibility reduces with the limited remaining life of the tailings dam.
Payable zinc production decreased by 13% to 45kt in H1 2026 from 51kt in H1 2025, primarily due to lower grade, weather-related impacts from above-average rainfall during the wet season and a planned maintenance shutdown in H1 2026.
All-in sustaining costs (AISC) increased by 23% to US$2,162/tZn (R35,477/tZn) from US$1,762/tZn (R32,411/tZn) in H1 2025 mainly due to lower production volumes and inflationary cost pressures, including higher fuel and reagent costs linked to geopolitical events.
Sales of payable zinc metal decreased to 41kt in H1 2026 from 46kt in H1 2025 and was 4kt lower than production, primarily due to shipment timing.
Higher zinc prices and lower treatment charges more than offset the impact of lower production and higher unit costs, with adjusted EBITDA increasing to US$55 million (R900 million) from US$36 million (R657 million) in H1 2025.
Sustaining capital expenditure decreased to US$0.4 million (R6 million) from US$1.1 million (R21 million) in H1 2025, which included pipeline remediation following the 2024 bushfires. Capital expenditure remained focused on maintaining the reliability and integrity of critical infrastructure as the operation approaches end-of-mine-life.
We continue to assess options to realise value from the existing Century and Karumba infrastructure, including potential life-extension options beyond the current zinc retreatment operations. The phosphate feasibility study, prepared to an AACE Class 2 estimate level, has been completed and is under evaluation.
Amounts are translated at average exchange rates of R11.66/A$ and R16.41/US$ for H1 2026 (average exchange rates of R12.33/A$ and R18.39/US$ for H1 2025).
Please refer to page 19 for further operational results statistics.
Sibanye-Stillwater Operating and financial results | Six months ended 30 June 2026 9
Mt Lyell copper project — Approval of Mt Lyell in line with capital allocation, unlocks value through copper in a Tier 1 jurisdiction
In line with the Group’s strategy to unlock value from internal organic opportunities and its capital-allocation framework, the Mt Lyell copper-gold project received a positive investment decision by the Board* following completion of an AACE Class 2 feasibility study and an internal assurance review in Q1 2026. The approval unlocks a long-life brownfield copper-gold asset with significant existing infrastructure, established operating knowledge and attractive returns. Existing infrastructure reduces execution complexity and upfront capital relative to a comparable greenfield development.
Mt Lyell is a near-term restart project located near Queenstown, Tasmania, with an initial 23-year mine life and anticipated second-quartile C1 costs. Project execution is planned to commence in H1 2027, with first metal production expected in early 2029. Key operating and economic metrics stated in Real 2026 terms include:
•Average annual steady state production (expected by 2032) of ~26kt copper with ~16koz gold and ~116koz silver
•Average all-in sustaining cost of US$2.56 per pound
•NPV (WACC of 7.4%) ~US$550m (~A$790m) and IRR of ~20% (post tax)
•Total project capital** of approximately US$340 million (A$490 million)
•Maximum cash draw of approximately US$370 million (A$530 million)
Total capital expenditure guidance for 2026 is A$11 million (US$7.5 million or R136 million).
Mt Lyell expands the Group’s exposure to copper through a long-life brownfield asset, located in a Tier 1 jurisdiction, that uses existing infrastructure, proven mining and processing methods, multiple production areas and renewable hydropower. The project supports the Group’s future-focused metals strategy while avoiding an acquisition premium and will be advanced through disciplined, stage-gated execution.
*Subject to conclusion or waiver of agreement with previous owner
**Total initial project capital excludes shaft refurbishment of US$74m (A$106m), which is planned to commence after practical completion
For more information about the Mt Lyell project, please refer to www.sibanyestillwater.com/business/australia/mt-lyell/.
----------------------------------------------------------------------------------------------------------------------------------------------------------------------------------------------
Sibanye-Stillwater Operating and financial results | Six months ended 30 June 2026 10
FINANCIAL REVIEW OF THE SIBANYE-STILLWATER GROUP
Group financial performance
Group revenue for H1 2026 increased by 64% compared to H1 2025. Group cost of sales before amortisation and depreciation increased by 47% largely due to once-off items discussed below. The Group realised a profit of R18,807 million for H1 2026, an improvement of 581%. The loss for H1 2025 was mainly due to a significant impairment of R9,666 million. Group adjusted EBITDA for H1 2026 increased by 111% or R16,770 million to R31,843 million.
Revenue
Group revenue for H1 2026 increased by 64% or R35,210 million to R89,977 million. Consolidated group revenue increased due to higher PGM and gold commodity prices that started during H2 2025 and continued into H1 2026. Additionally, the North Carolina recycling operation performance is included for full six months of H1 2026 since its acquisition on 4 September 2025.
Cost of sales, before amortisation and depreciation
Group cost of sales before amortisation and depreciation for H1 2026 increased by 47% or R17,960 million to R56,234 million, mainly due to the 2023 and 2024 Section 45X advanced manufacturing production credits recognised during H1 2025 of R4,403 million (US$249 million) and the inclusion of the North Carolina recycling operation for H1 2026. The Section 45X advanced manufacturing production credits recognised during H1 2026 amounted to R411 million (US$25 million) and R447million (US$27 million) at the US PGM and Montana recycling operations, respectively. Cost of sales at the recycling operations were also higher due to the direct link of higher commodity prices.
Profit for the period
Profit for H1 2026 increased by 581% from a loss incurred during H1 2025 of R3,906 million to a profit realised of R18,807 million. In addition to the increase in revenue discussed above, the higher profit realised for H1 2026 was also attributable to:
•a significant reduction in impairment charges recognised of R9,648 million,
•share of results of equity accounted investees of R2,073 million, mainly related to a higher profit from Mimosa and includes an impairment reversal (see section below),
•movement in net gain on financial instruments of R449 million; and
•net share-based payment expenses credit of R119 million, which is, a function of the share price movement.
The profit for H1 2026 was also partially offset by higher other expenses and lower other income of R526 million and R315 million, respectively. The increase in other expenses was mainly due to higher care and maintenance costs, employee and community trust costs and changes in estimates of environmental rehabilitation obligations. Care and maintenance costs for H1 2026 were R862 million. See note 7.1 of the condensed consolidated interim financial statements for additional information on other expenses. The decrease in other income was mainly due to a combination of lower insurance proceeds received, sundry income, no onerous supply contract provision utilisation/change in estimate and changes in estimates of environmental rehabilitation obligations raised. See note 7.2 of the condensed consolidated interim financial statements for additional information on other income.
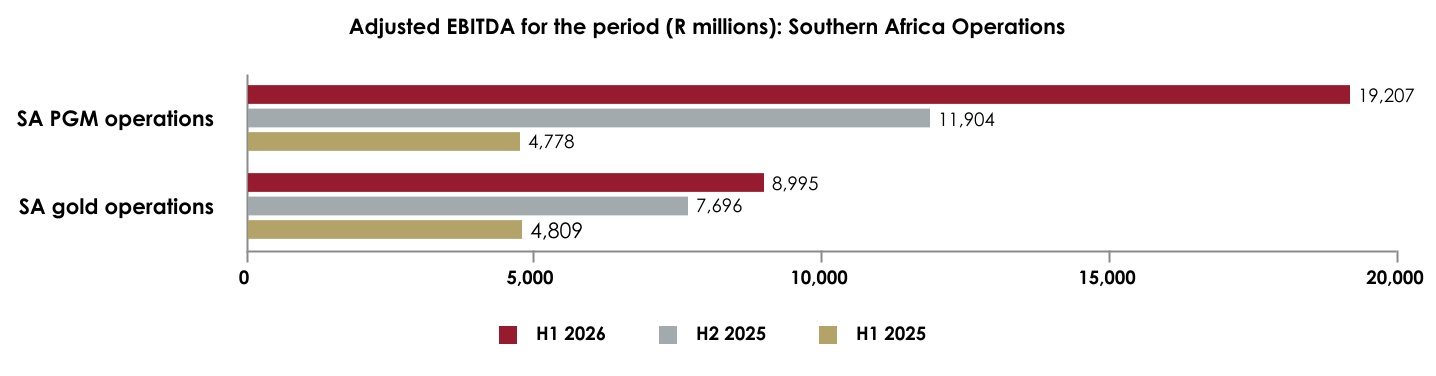
Adjusted EBITDA
Adjusted EBITDA includes other cash costs, care and maintenance costs, lease payments, strike costs (where applicable) and corporate social investment costs (see note 19 of the consolidated interim financial statements for a reconciliation of profit before royalties, carbon tax and tax to adjusted EBITDA).
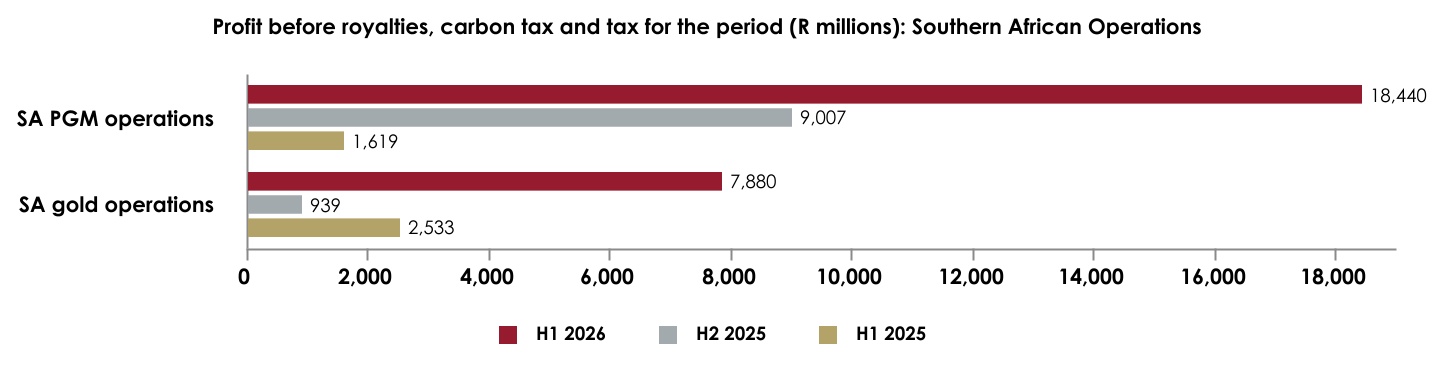
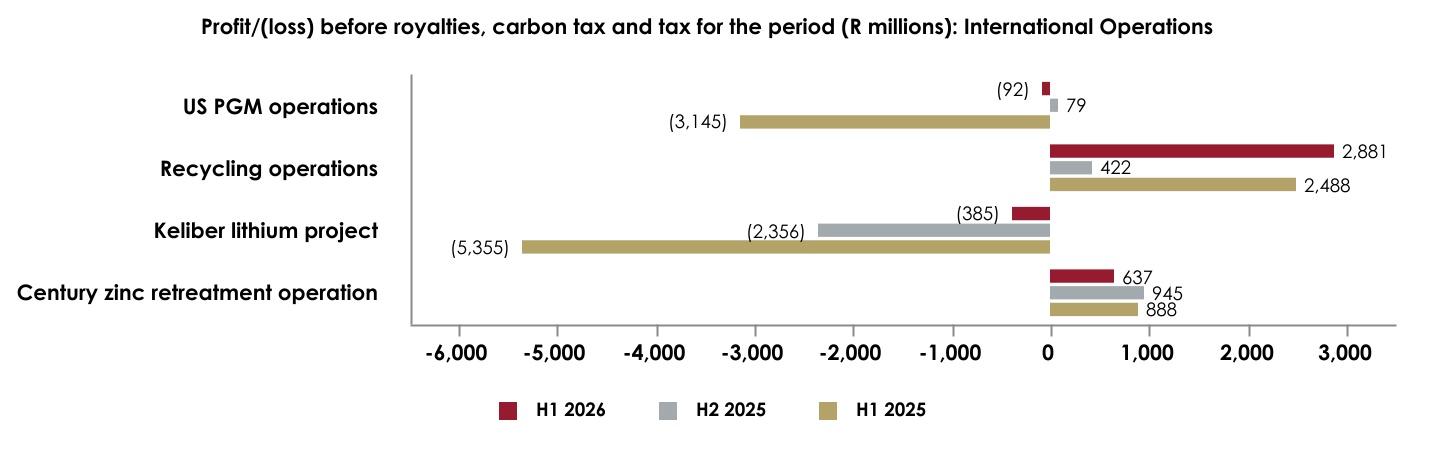
The Profit/(loss) before royalties, carbon tax and tax, and Adjusted EBITDA for the reporting periods are shown in the graphs below:
Sibanye-Stillwater Operating and financial results | Six months ended 30 June 2026 11
Interest income increased by R86 million to R772 million mainly due to Section 45X interest accrued at the US PGM and Columbus recycling operations of R39 million and R49 million respectively and R154 million higher interest received on average cash balances, partially offset by lower interest received from revenue authorities of R131 million.
Finance expense
Finance expense decreased by R289 million to R2,264 million mainly due to a R249 million decrease in interest on borrowings. See note 5 of the condensed consolidated interim financial statements for further detail of finance expenses.
Gain on financial instruments
The gain on financial instruments of R58 million for H1 2026 compared with the loss of R391 million for H1 2025, represents a period-on-period net gain of R449 million. The net gain for H1 2026 is mainly attributable to investments of R84 million and gains of R297 million mainly related to unrealised gains on open hedges/future contracts at Reldan of R231 million and realised/unrealised gains on the metal consignment facility of R62 million. These gains were partially offset by fair value losses on hedge contracts for zinc of R110 million, a change in estimated cash flows/fair value loss on the Burnstone project debt of R31 million and revised cash flows of the Marikana dividend obligation of R98 million. See note 6 of the consolidated interim financial statements for a breakdown of the loss on financial instruments.
Impairments
At 30 June 2026, other than the impairment reversal of Mimosa, no further significant impairment losses or reversals of previously recognised impairment losses were identified for any of the Group's other cash generating units (CGU) for which impairment indicators were present. During H1 2025, the Group recognised impairment losses relating to the Keliber project and the US PGM operations totalling R9,666 million.
See note 8 of the condensed consolidated interim financial statements for additional information on impairments.
•Mimosa's updated life-of-mine indicated an increase in the expected future net cash flows due to increased commodity prices since 31 December 2025. The higher recoverable amount led to an after tax equity-accounted impairment reversal of property, plant and equipment amounting to R783 million, before the impact of deferred tax (net an impairment reversal of R581 million).
See note 12 of the condensed consolidated interim financial statements for additional information.
Sibanye-Stillwater Operating and financial results | Six months ended 30 June 2026 12
Cash and liquidity
The Group’s cash balance increased by 31% from R17,178 million at 31 December 2025 to R22,434 million at 30 June 2026 even after reducing and refinancing certain debt instruments. The issue of US$500 million senior notes due 2031 (2031 Notes), generated proceeds of R8,075 million which were received on 15 May 2026. The Group used this cash proceeds as well as existing cash reserves to redeem all the US$675 million 2026 Notes and US$75 million of the 2029 Notes issued, in line with the Group's strategy to reduce gross debt by 50% over two to three years. Group liquidity was R47,637 million1 (31 December 2025: R40,057 million), comprising R22,386 million of cash and cash equivalents (31 December 2025: R17,129 million) and R25,250 million of undrawn facilities (31 December 2025: R22,928 million).
Borrowings and net debt
The Group's refreshed strategy aims to decrease gross debt by 50% over two to three years. The graph below illustrates the decrease in the Group's gross debt / net debt for H1 2026 , H2 2025, and H1 2025:
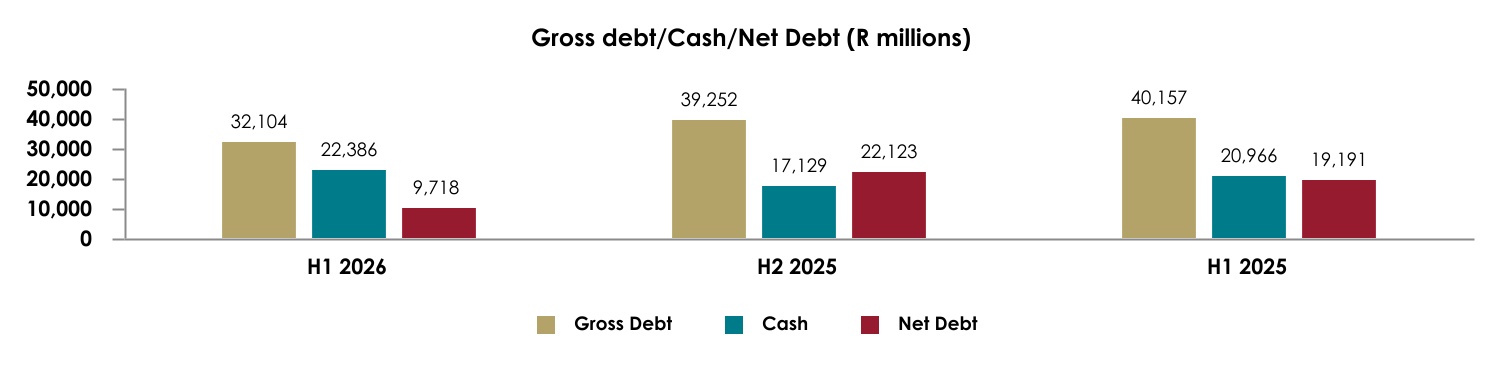
Gross debt1 decreased by 20% from R40,157 million at June 2025 and 18% from R39,252 million at 31 December 2025 to R32,104 million at 30 June 2026. Burnstone debt amounted to R4,156 million (31 December 2025: R4,005 million). The decrease in gross debt was due to the net redemption of US$250 million (R4,239 million) of the 2026 and 2029 notes, settlement of R2,500 million on the R6.5 billion RCF, a decrease in Keliber euro denominated debt (R368 million) and a net decrease of R314 million on US dollar denominated debt due to a 1% stronger rand since 31 December 2025. Net debt was R9,718 million at 30 June 2026 (31 December 2025: R22,123 million) and decreased by R11,888 million due to the decrease in gross debt and cash generated from operations during the six months ended 30 June 2026. See note 16 of the condensed consolidated interim financial statements for a roll forward of the gross debt for the six months ended 30 June 2026.
1The Burnstone debt is securitised and therefore has no recourse to Sibanye-Stillwater and as such Sibanye-Stillwater reports Gross debt, Net debt and Cash excluding the amounts that relates to Burnstone, as well as excluding subsidiary subordinated debt from minority shareholders
Cash flow analysis
Cash generated by operations
| | | | | | | | | | | | | | |
| | | | |
Figures in million - SA rand | | Six months ended |
| | Jun 2026 | Dec 2025 | Jun 2025 |
| Cash generated by operations | | 20,684 | 10,415 | 3,277 |
| | | | |
The Group cash generated by operations increased by R17,407 million to R20,684 million at 30 June 2026 (H1 2026), mainly due to the higher commodity prices during the six months ended 31 December 2025 (H2 2025) and H1 2026.
Cash generated by operating activities
| | | | | | | | | | | | | | |
| | | | |
Figures in million - SA rand | | Six months ended |
| | Jun 2026 | Dec 2025 | Jun 2025 |
| Net cash from operating activities | | 19,614 | 8,230 | 13,177 |
| | | | |
The Group net cash from operating activities increased by R6,437 million to R19,614 million at H1 2026. Cash generated from operating activities increased mainly due to higher cash generated by operations of R17,407 million (discussed above) and a positive working capital movement of R9,361 million, mainly related to trade and other payables. See note 20.2 of the condensed consolidated interim financial statements for more information on change in working capital. These increases in cash from operating activities were partially offset by higher royalties and taxes paid of R1,204 million and R3,893 million, respectively. The H2 2025 dividend paid of R3,708 million and a reduction in deferred revenue advance received of R9,933 million, mainly related to R9,215 million cash received on 28 February 2025 from the US$500 million streaming agreement with Franco-Nevada, also partially offset the increase in Group cash from operating activities.
Notional free cash flow
Sibanye-Stillwater defines notional free cash flow as adjusted EBITDA, less non cash revenue relating to streaming transactions and deferred prepayments, non cash government grants and accrued taxes and royalties, and includes other non-routine cash items such as legal dispute settlements and realised hedges, net cash additions to property, plant and equipment.
The following table shows a calculation of notional free cash flow:
Sibanye-Stillwater Operating and financial results | Six months ended 30 June 2026 13
| | | | | | | | | | | | | | |
| | | | |
Figures in million - SA rand | | Six months ended |
| | Jun 2026 | Dec 2025 | Jun 2025 |
| Adjusted EBITDA | | 31,843 | 22,727 | 15,073 |
| Adjusted for non-cash items: | | | | |
| Deferred revenue released - Streaming | | (488) | (473) | (659) |
Deferred revenue released - Prepay arrangements1 | | (468) | (467) | (1,201) |
| Section 45X grant not yet received in cash | | (858) | (832) | (5,053) |
| Tax and royalties (accrued) | | (6,804) | (3,035) | (527) |
| Other non-routine cash items: | | | | |
| Legal settlement payment | | — | (3,565) | — |
| Early settlement payment on onerous contract | | (13) | (29) | (16) |
Realised hedges2 | | (456) | (1,274) | (333) |
| | 22,756 | 13,052 | 7,284 |
| Property. plant and equipment additions | | (8,306) | (10,769) | (9,538) |
| Notional free cash flow | | 14,450 | 2,283 | (2,254) |
| | | | |
Notional free cash flow, defined and reconciled above, is not a measure of performance under IFRS Accounting Standards, and because of its nature, notional free cash flow should not be considered in isolation or as a substitute for measures of financial performance and cash flows prepared in accordance with IFRS Accounting Standards, namely net cash from operating activities1 This relates to a gold prepay arrangement whereby the Group received a cash prepayment of R1,793 million in exchange for delivery of 1,497 kilograms of gold in equal monthly tranches 1,851 ounces per month from October 2024 to November 2026. Deferred revenue recognised for H1 2025 also includes R733 million related to a chrome prepay, which matured by end April 2025
2 Included under realised hedges was a loss of R445 million related to the gold hedge contracts which were closed out in December 2025 and settled on 6 January 2026 and a loss of R11 million related to Zinc hedges entered into by Century relating to the 2026 year.
For a reconciliation between notional free cash flow and net cash from operating activities, see page 53.
The following table shows the notional free cash flow for each operating segment: | | | | | | | | | | | | | | |
| | | | |
Figures in million - SA rand | | Six months ended |
| | Jun 2026 | Dec 2025 | Jun 2025 |
| | | | |
| SOUTHERN AFRICA OPERATIONS |
| SA PGM operations | | 10,361 | 5,405 | 441 |
| SA gold operations | | 3,956 | 2,146 | 1,078 |
| Total Southern Africa operations | | 14,317 | 7,551 | 1,519 |
| INTERNATIONAL OPERATIONS |
| US PGM operations including Montana recycling | | (459) | 232 | (1,063) |
US PA & NC recycling operations | | 1,683 | 739 | 273 |
| European operations | | (1,742) | (3,242) | (3,330) |
| Australian operation | | 667 | 587 | 409 |
| Total International operations | | 149 | (1,684) | (3,711) |
| Total Operations | | 14,466 | 5,867 | (2,192) |
| Group corporate | | (16) | (3,584) | (62) |
| Group Notional free cash flow | | 14,450 | 2,283 | (2,254) |
The SA PGM operations generated notional free cash flow of R10,361 million compared to negative notional free cash flow for H1 2025 of R441 million, due to 11% higher sales volumes and 67% higher 4E PGM basket price received during H1 2026 which resulted in R18,218 million higher revenue. This increase was partially offset by higher cost of sales of R3,560 million, higher taxes and royalties accrued of R4,840.
The SA gold operations generated notional free cash flow of R3,956 million compared to notional free cash flow of R1,078 million in H1 2025, mainly due to the 35% higher gold price received during H1 2026 which resulted in R6,763 million higher revenue. This increase was partially offset by higher cost of sales of R2,545 million, higher taxes and royalties accrued of R1,935 and higher cash additions to property, plant and equipment of R319 million.
The US PGM operations incurred negative notional free cash flow for H1 2026 of R459 million compared to negative notional free cash flow for H1 2025 of R1,063 million. The improvement in notional free cash flow for H1 2026 was mainly due to R2,388 million higher revenue as a result of 70% higher average 2E basket price received, partially offset by higher cost of sales of R1,626 million, of which R1,091 million related to the Montana recycling operations where operating costs increased due to higher PGM prices.
The US PA & NC recycling operations generated notional free cash flow of R1,683 million compared to notional free cash flow for H1 2025 of R273 million, mainly due to the addition of the NC recycling site (Metallix) and the impact of higher gold and silver prices which increased by approximately 35% and 138% respectively, despite of higher cost of sales relating to material procured.
The European operations generated negative notional free cash flow of R1,742 million compared to negative notional free cash flow for H1 2025 of R3,330 million, mainly attributable to a reduction in the capital expenditure on the Keliber lithium project of R1,120 million (H1 2025: R3,021 million) an a negative adjusted EBITDA of R250 million as Keliber continued to transition from project execution to operations.
At the Australian operation, the Century zinc retreatment operation generated notional free cash flow of R667 million compared to notional free cash flow for H1 2025 of R409 million, mainly due to the impact of a 12% higher zinc concentrate price, partially offset by 11% lower sales volumes.
Sibanye-Stillwater Operating and financial results | Six months ended 30 June 2026 14
Interim Dividend
The Sibanye-Stillwater board of directors declared and approved a cash dividend of 201 SA cents per ordinary share (US 12.43 cents* per share or US 49.73 cents* per ADR) or approximately R5,685 million (US$352 million*) in respect of the six months ended 30 June 2026 (Interim dividend).
The interim dividend declared of 201 SA cents equates to 35% of normalised earnings for the period ended June 2026. See note 11 of the consolidated interim financial statements for more detail on dividends.
The interim dividend will be subject to the Dividends Withholding Tax. In accordance with paragraph 7.23 of the JSE Listings Requirements the following additional information is disclosed:
•The dividend has been declared out of income reserves
•The local (South African) Dividends Withholding Tax rate is 20% (twenty per centum)
•The gross South African dividend amount is 201.0000 SA cents per ordinary share for shareholders exempt from the Dividends Tax
•The net South African dividend amount is 160.8000 SA cents (80% of 201 SA cents) per ordinary share for shareholders liable to pay the Dividends Withholding Tax
•Sibanye-Stillwater currently has 2,830,567,264 ordinary shares in issue
•Sibanye-Stillwater’s income tax reference number is 9723 182 169
Shareholders are advised of the following dates in respect of the interim dividend:
Interim dividend: 201 SA cents per share
Declaration date: Tuesday, 1 September 2026
Last date to trade cum dividend: Tuesday, 15 September 2026
Shares commence trading ex-dividend: Wednesday, 16 September 2026
Record date: Friday, 18 September 2026
Payment of dividend: Monday, 21 September 2026
Please note that share certificates may not be dematerialised or rematerialised between Wednesday, 16 September 2026 and Friday, 18 September 2026 both dates inclusive.
To holders of American Depositary Receipts (ADRs):
•Each ADR represents 4 ordinary shares;
•ADRs trade ex-dividend on the New York Stock Exchange (NYSE): Friday, 18 September 2026;
•ADR Record Friday, 18 September 2026;
•Approximate date of currency conversion: Monday, 21 September 2026;
•ADR payment date of dividend: Wednesday, 6 October 2026
Assuming an exchange rate of R16.17/US$1*, the dividend payable on an ADR is equivalent to 39.78 United States cents per ADR, net of the 20% South African withholding tax. However, the actual rate of payment will depend on the exchange rate on the date for currency conversion.
* Based on an exchange rate of R16.1687/US$ at 28 August 2026 from Equity RT. However, the actual rate of payment will depend on the exchange rate on the date for currency conversion
Mineral resources and mineral reserves
There were no material changes to the Mineral Resources and Mineral Reserves from what was previously reported by the Group at 31 December 2025. As previously communicated in the June 2022 operating and financial results, Sibanye-Stillwater through its subsidiary Akanani Mining Proprietary Limited (Akanani), held a prospecting right over the Akanani Project area which contains an attributable Mineral Resource of 252.4Mt at 3.9g/t 4E PGM’s for a total of 31.6Moz 4E PGM. Akanani submitted an application for a mining right in 2021 in terms of the Mineral and Petroleum Resources Development Act, 2002 which was rejected on the basis that a third party by the name of BCR Projects Proprietary Limited (BCR Projects) had submitted a valid and prior-ranking application for prospecting right over the Akanani area. After exhaustion of all internal DMPR appeal procedures, Akanani launched a review application in the High Court which was heard in January 2026. On 26 June 2026, the High Court delivered its judgement in favour of BCR Projects, meaning that Sibanye-Stillwater has no rights in respect of the Akanani Project area and that BCR Projects holds a prospecting right over this area. Sibanye-Stillwater has applied for leave to appeal the High Court judgement. Should leave to appeal be granted, the appeal is likely to be heard in the Supreme Court of Appeal (SCA) in approximately mid-2027. The Group has been advised that it has reasonable prospects of a successful appeal, although no assurance can be given as to the outcome.
Change in Board of directors
During the six month period ended 30 June 2026, Mr Timothy Cumming retired as non-executive director at the AGM, held on 28 May 2026.
Sibanye-Stillwater Operating and financial results | Six months ended 30 June 2026 15
SALIENT FEATURES AND COST BENCHMARKS – SIX MONTHS
US and SA PGM operations | | | | | | | | | | | | | | | | | | | | | | | | | | | | | | | | | | | | | | |
| | | | |
| | | US PGM operations | Total SA PGM operations2 | Rustenburg including Kroondal | Marikana2 | Plat Mile | Mimosa |
| | | Under- ground1 | Total | Under-
ground | Surface | Under-
ground | Surface | Under-
ground | Surface | Surface | Attribu-table |
| Production |
| Tonnes milled/treated | kt | Jun 2026 | 394 | | 15,217 | | 8,566 | | 6,651 | | 4,930 | | 1,886 | | 2,935 | | 1,609 | | 3,155 | | 701 | |
| | Dec 2025 | 395 | | 19,185 | | 9,858 | | 9,327 | | 5,861 | | 2,614 | | 3,262 | | 1,746 | | 4,967 | | 735 | |
| | Jun 2025 | 365 | | 17,311 | | 8,702 | | 8,609 | | 5,139 | | 2,591 | | 2,840 | | 1,569 | | 4,449 | | 723 | |
| Plant head grade | g/t | Jun 2026 | 12.02 | | 2.22 | | 3.23 | | 0.92 | | 2.93 | | 1.24 | | 3.72 | | 0.92 | | 0.73 | | 3.28 | |
| | Dec 2025 | 12.36 | | 2.12 | | 3.23 | | 0.94 | | 2.95 | | 1.17 | | 3.69 | | 1.22 | | 0.72 | | 3.38 | |
| | Jun 2025 | 13.32 | | 2.04 | | 3.18 | | 0.89 | | 2.87 | | 1.03 | | 3.70 | | 1.16 | | 0.72 | | 3.39 | |
| Plant recoveries | % | Jun 2026 | 90.79 | | 72.70 | | 84.26 | | 20.35 | | 83.88 | | 30.75 | | 86.91 | | 8.39 | | 17.45 | | 74.37 | |
| | Dec 2025 | 91.02 | | 70.73 | | 84.63 | | 19.20 | | 84.93 | | 25.15 | | 86.90 | | 17.74 | | 15.00 | | 72.60 | |
| | Jun 2025 | 90.68 | | 70.84 | | 84.32 | | 21.96 | | 84.10 | | 31.42 | | 86.51 | | 20.65 | | 14.63 | | 74.98 | |
| Yield | g/t | Jun 2026 | 10.91 | | 1.61 | | 2.72 | | 0.19 | | 2.46 | | 0.38 | | 3.23 | | 0.08 | | 0.13 | | 2.44 | |
| | Dec 2025 | 11.25 | | 1.49 | | 2.73 | | 0.18 | | 2.51 | | 0.29 | | 3.21 | | 0.22 | | 0.11 | | 2.45 | |
| | Jun 2025 | 12.08 | | 1.45 | | 2.68 | | 0.20 | | 2.41 | | 0.32 | | 3.20 | | 0.24 | | 0.11 | | 2.54 | |
PGM production3 | 4Eoz - 2Eoz | Jun 2026 | 137,930 | | 789,647 | | 749,613 | | 40,034 | | 389,570 | | 23,120 | | 305,041 | | 3,993 | | 12,921 | | 55,002 | |
| | Dec 2025 | 142,945 | | 920,526 | | 866,395 | | 54,131 | | 472,090 | | 24,736 | | 336,340 | | 12,154 | | 17,241 | | 57,965 | |
| | Jun 2025 | 141,124 | | 804,252 | | 750,150 | | 54,102 | | 398,791 | | 26,956 | | 292,305 | | 12,084 | | 15,062 | | 59,054 | |
PGM sold4 | 4Eoz - 2Eoz | Jun 2026 | 126,695 | | 892,951 | | | | 410,552 | | 25,615 | | 392,403 | 12,922 | | 51,459 | |
| | Dec 2025 | 150,516 | | 930,549 | | | | 426,568 | | 24,105 | | 392,690 | 17,241 | | 69,945 | |
| | Jun 2025 | 133,106 | | 797,039 | | | | 375,792 | | 26,863 | | 340,367 | 15,062 | | 38,955 | |
Price and costs5 |
Average PGM basket price6 | R/4Eoz - R/2Eoz | Jun 2026 | 27,438 | | 43,996 | | | | 44,364 | | 39,556 | | 44,013 | 40,142 | | 39,262 | |
| | Dec 2025 | 23,978 | | 34,914 | | | | 35,231 | | 32,339 | | 34,807 | 32,872 | | 31,831 | |
| | Jun 2025 | 18,114 | | 26,283 | | | | 26,548 | | 24,133 | | 26,245 | 24,239 | | 24,227 | |
| US$/4Eoz - US$/2Eoz | Jun 2026 | 1,672 | | 2,681 | | | | 2,703 | | 2,410 | | 2,682 | 2,446 | | 2,393 | |
| | Dec 2025 | 1,380 | | 2,009 | | | | 2,027 | | 1,861 | | 2,003 | 1,891 | | 1,831 | |
| | Jun 2025 | 985 | | 1,429 | | | | 1,444 | | 1,312 | | 1,427 | 1,318 | | 1,317 | |
Operating cost7,9 | R/t | Jun 2026 | 6,327 | | 1,435 | | | | 2,227 | | 333 | 1,955 | 110 | | 1,723 | |
| | Dec 2025 | 6,193 | | 1,203 | | | | 2,006 | | 259 | | 1,870 | 80 | | 1,801 | |
| | Jun 2025 | 7,453 | | 1,164 | | | | 2,011 | | 257 | | 1,812 | 72 | | 1,733 | |
| US$/t | Jun 2026 | 386 | | 87 | | | | 136 | | 20 | | 119 | 7 | | 105 | |
| | Dec 2025 | 356 | | 69 | | | | 115 | | 15 | | 108 | 5 | | 104 | |
| | Jun 2025 | 405 | | 63 | | | | 109 | | 14 | | 99 | 4 | | 94 | |
| R/4Eoz - R/2Eoz | Jun 2026 | 18,060 | | 28,363 | | | | 28,182 | | 27,163 | | 28,744 | 26,856 | | 21,963 | |
| | Dec 2025 | 17,125 | | 25,733 | | | | 24,902 | | 27,329 | | 26,873 | 23,143 | | 22,824 | |
| | Jun 2025 | 19,281 | | 25,915 | | | | 25,916 | | 24,670 | | 26,253 | 21,312 | | 21,201 | |
| US$/4Eoz - US$/2Eoz | Jun 2026 | 1,101 | | 1,728 | | | | 1,717 | | 1,655 | | 1,752 | 1,637 | | 1,338 | |
| | Dec 2025 | 985 | | 1,481 | | | | 1,433 | | 1,572 | | 1,546 | 1,332 | | 1,313 | |
| | Jun 2025 | 1,048 | | 1,409 | | | | 1,409 | | 1,341 | | 1,428 | 1,159 | | 1,153 | |
All-in sustaining cost7,8,9 | R/4Eoz - R/2Eoz | Jun 2026 | 22,105 | | 26,252 | | | | 26,531 | 26,120 | 20,509 | | 24,035 | |
| | Dec 2025 | 20,819 | | 24,457 | | | | 24,071 | 25,280 | 19,024 | | 23,859 | |
| | Jun 2025 | 22,200 | | 23,892 | | | | 24,308 | 23,700 | 15,934 | | 21,946 | |
| US$/4Eoz - US$/2Eoz | Jun 2026 | 1,347 | | 1,600 | | | | 1,617 | 1,592 | 1,250 | | 1,465 | |
| | Dec 2025 | 1,198 | | 1,407 | | | | 1,385 | 1,455 | 1,095 | | 1,373 | |
| | Jun 2025 | 1,207 | | 1,299 | | | | 1,322 | 1,289 | 866 | | 1,193 | |
All-in cost7,8,9 | R/4Eoz - R/2Eoz | Jun 2026 | 22,627 | | 26,686 | | | | 26,780 | 26,819 | 20,509 | | 24,035 | |
| | Dec 2025 | 21,449 | | 24,849 | | | | 24,139 | 26,170 | 19,024 | | 23,859 | |
| | Jun 2025 | 22,895 | | 24,338 | | | | 24,362 | 24,718 | 15,934 | | 21,946 | |
| US$/4Eoz - US$/2Eoz | Jun 2026 | 1,379 | | 1,626 | | | | 1,632 | 1,634 | 1,250 | | 1,465 | |
| | Dec 2025 | 1,234 | | 1,430 | | | | 1,389 | 1,506 | 1,095 | | 1,373 | |
| | Jun 2025 | 1,245 | | 1,323 | | | | 1,325 | 1,344 | 866 | | 1,193 | |
Capital expenditure5 |
| Ore reserve development | Rm | Jun 2026 | 689 | | 1,180 | | | | 387 | 793 | — | | — | |
| | Dec 2025 | 598 | | 1,248 | | | | 397 | 851 | — | | — | |
| | Jun 2025 | 614 | | 1,095 | | | | 349 | 746 | — | | — | |
| Sustaining capital | Rm | Jun 2026 | 227 | | 1,140 | | | | 647 | 491 | 2 | | 245 | |
| | Dec 2025 | 242 | | 1,746 | | | | 930 | 792 | 24 | | 198 | |
| | Jun 2025 | 121 | | 1,120 | | | | 549 | 561 | 10 | | 160 | |
| Project capital | Rm | Jun 2026 | 61 | | 321 | | | | 103 | 216 | — | | — | |
| | Dec 2025 | 41 | | 343 | | | | 34 | 309 | — | | — | |
| | Jun 2025 | 94 | | 332 | | | | 103 | 309 | — | | — | |
| Total capital expenditure | Rm | Jun 2026 | 977 | | 2,641 | | | | 1,137 | 1,500 | 2 | | 245 | |
| | Dec 2025 | 881 | | 3,337 | | | | 1,361 | 1,952 | 24 | | 198 | |
| | Jun 2025 | 829 | | 2,547 | | | | 1,001 | 1,616 | 10 | | 160 | |
| US$m | Jun 2026 | 60 | | 161 | | | | 69 | 91 | — | | 15 | |
| | Dec 2025 | 51 | | 192 | | | | 78 | 112 | 1 | | 11 | |
| | Jun 2025 | 45 | | 138 | | | | 54 | 88 | 1 | | 9 | |
Average exchange rate for the six months ended 30 June 2026, 31 December 2025 and 30 June 2025 was R16.41/US$, R17.38/US$ and R18.39/US$, respectively
Figures may not add as they are rounded independently
Sibanye-Stillwater Operating and financial results | Six months ended 30 June 2026 16
1The US PGM operations’ underground production is converted to metric tonnes and kilograms, and financial performance is translated into rand
2Total SA PGM operations and Marikana excludes the production and costs associated with the purchase of concentrate (PoC) from third parties. For a reconciliation of the Operating cost, AISC and AIC excluding third party PoC, refer to “Reconciliation of operating cost excluding third party PoC for Total SA PGM operations and Marikana - Six Months” and “Reconciliation of AISC and AIC excluding third party PoC for Total SA PGM operations and Marikana – Six Months”
3The Platinum Group Metals (PGM) production in the SA operations is principally platinum, palladium, rhodium and gold, referred to as 4E (3PGM+Au) and measured at the concentrator, and in the US underground operations is principally platinum and palladium, referred to as 2E (2PGM)
4PGM sold includes the third party PoC ounces sold
5Total SA PGM operations’ unit cost benchmarks and capital expenditure exclude the financial results of Mimosa, which is equity accounted and excluded from revenue and cost of sales
6The average PGM basket price is the PGM revenue per 4E/2E ounce, prior to a purchase of concentrate adjustment
7Operating cost, All-in sustaining costs and All-in costs are not measures of performance under IFRS Accounting Standards and should not be considered in isolation or as substitutes for measures of financial performance prepared in accordance with IFRS Accounting Standards. See "Non-IFRS measures" for more information on the metrics presented by Sibanye-Stillwater. Because of its nature, All-in sustaining costs and All-in costs should not be considered as a representation of financial performance 8All-in cost excludes income tax, costs associated with merger and acquisition activities, working capital, impairments, financing costs, one-time severance charges and items needed to normalise earnings. For a reconciliation of cost of sales, before amortisation and depreciation to All-in cost, see “All-in costs - Six months”
9During the six months ended 30 June 2025 the US PGM operations recognised R2,466 million (US$139 million) which relates to Section 45X Advance Manufacturing Production Credits applicable to the 2023 and 2024 financial reporting years and presented as a reduction to mining costs. The US PGM operations’ Operating cost, All-in sustaining cost and All-in cost for the six months ended 30 June 2025 were adjusted to exclude the Section 45X Advance Manufacturing Production Credits applicable to the 2023 and 2024 financial reporting years
Sibanye-Stillwater Operating and financial results | Six months ended 30 June 2026 17
SALIENT FEATURES AND COST BENCHMARKS – SIX MONTHS (continued)SA gold operations | | | | | | | | | | | | | | | | | | | | | | | | | | | | | | | | | | | | | | | | | |
| | | |
| | | Total SA gold operations | Driefontein | Kloof | Beatrix | Cooke | DRDGOLD |
| | | Total | Under-
ground | Surface | Under-
ground | Surface | Under-
ground | Surface | Under-
ground | Surface | Surface | Surface |
| Production | | | | | | | | | | | | | |
| Tonnes milled/treated | kt | Jun 2026 | 16,523 | | 1,466 | | 15,057 | | 506 | | 62 | | 325 | | 322 | | 635 | | 2 | | 2,057 | | 12,614 | |
| | Dec 2025 | 16,135 | | 1,693 | | 14,442 | | 538 | | — | | 451 | | 134 | | 704 | | — | | 1,852 | | 12,456 | |
| | Jun 2025 | 16,680 | | 1,515 | | 15,164 | | 522 | | 1 | | 389 | | 334 | | 604 | | 1 | | 2,132 | | 12,698 | |
| Yield | g/t | Jun 2026 | 0.55 | | 4.01 | | 0.22 | | 6.14 | | 0.26 | | 3.75 | | 0.62 | | 2.46 | | — | | 0.26 | | 0.20 | |
| | Dec 2025 | 0.64 | | 4.39 | | 0.20 | | 7.48 | | — | | 3.30 | | 1.04 | | 2.73 | | — | | 0.22 | | 0.19 | |
| | Jun 2025 | 0.56 | | 4.26 | | 0.19 | | 6.11 | | — | | 4.12 | | 0.42 | | 2.74 | | — | | 0.22 | | 0.18 | |
| Gold produced | kg | Jun 2026 | 9,134 | | 5,885 | | 3,249 | | 3,105 | | 16 | | 1,220 | | 199 | | 1,560 | | — | | 532 | | 2,502 | |
| | Dec 2025 | 10,331 | | 7,440 | | 2,891 | | 4,024 | | — | | 1,490 | | 139 | | 1,926 | | — | | 415 | | 2,337 | |
| | Jun 2025 | 9,337 | | 6,453 | | 2,884 | | 3,192 | | — | | 1,605 | | 140 | | 1,656 | | — | | 479 | | 2,265 | |
| oz | Jun 2026 | 293,665 | | 189,207 | | 104,458 | | 99,828 | | 514 | | 39,224 | | 6,398 | | 50,155 | | — | | 17,104 | | 80,441 | |
| | Dec 2025 | 332,149 | | 239,202 | | 92,948 | | 129,375 | | — | | 47,905 | | 4,469 | | 61,922 | | — | | 13,343 | | 75,136 | |
| | Jun 2025 | 300,191 | | 207,469 | | 92,723 | | 102,625 | | — | | 51,602 | | 4,501 | | 53,242 | | — | | 15,400 | | 72,821 | |
| Gold sold | kg | Jun 2026 | 9,588 | | 6,349 | | 3,239 | | 3,323 | | 10 | | 1,290 | | 244 | | 1,736 | | — | | 508 | | 2,477 | |
| | Dec 2025 | 9,933 | | 7,035 | | 2,898 | | 3,848 | | — | | 1,439 | | 84 | | 1,748 | | — | | 426 | | 2,388 | |
| | Jun 2025 | 9,148 | | 6,279 | | 2,869 | | 3,024 | | 4 | | 1,579 | | 155 | | 1,676 | | — | | 459 | | 2,251 | |
| oz | Jun 2026 | 308,261 | | 204,125 | | 104,136 | | 106,837 | | 322 | | 41,474 | | 7,845 | | 55,814 | | — | | 16,333 | | 79,637 | |
| | Dec 2025 | 319,353 | | 226,180 | | 93,173 | | 123,716 | | — | | 46,265 | | 2,701 | | 56,199 | | — | | 13,696 | | 76,776 | |
| | Jun 2025 | 294,115 | | 201,874 | | 92,240 | | 97,224 | | 129 | | 50,766 | | 4,983 | | 53,885 | | — | | 14,757 | | 72,371 | |
| Price and costs | | | | | | | | | | | | | |
| Gold price received | R/kg | Jun 2026 | 2,425,219 | | | | 2,418,542 | 2,355,280 | 2,440,668 | 2,433,071 | 2,465,079 | |
| | Dec 2025 | 2,070,774 | | | | 1,884,875 | 1,610,637 | 1,914,760 | 2,044,601 | 2,115,997 | |
| | Jun 2025 | 1,802,580 | | | | 1,769,155 | 1,737,601 | 1,748,807 | 1,779,956 | 1,810,751 | |
| Gold price received | US$/oz | Jun 2026 | 4,597 | | | | 4,584 | 4,464 | 4,626 | 4,612 | 4,672 | |
| | Dec 2025 | 3,706 | | | | 3,373 | 2,882 | 3,427 | 3,659 | 3,787 | |
| | Jun 2025 | 3,049 | | | | 2,992 | 2,939 | 2,958 | 3,010 | 3,063 | |
Operating cost1,4 | R/t | Jun 2026 | 792 | | 6,228 | | 262 | | 7,421 | | 1,345 | | 9,055 | | 996 | | 3,827 | | — | | 502 | | 199 | |
| | Dec 2025 | 778 | | 5,464 | | 229 | | 7,273 | | — | | 6,463 | | 262 | | 3,442 | | — | | 477 | | 191 | |
| | Jun 2025 | 698 | | 5,618 | | 206 | | 6,758 | | — | | 7,284 | | 447 | | 3,556 | | — | | 344 | | 177 | |
| US$/t | Jun 2026 | 48 | | 380 | | 16 | | 452 | | 82 | | 552 | | 61 | | 233 | | — | | 31 | | 12 | |
| | Dec 2025 | 45 | | 314 | | 13 | | 418 | | — | | 372 | | 15 | | 198 | | — | | 27 | | 11 | |
| | Jun 2025 | 38 | | 305 | | 11 | | 367 | | — | | 396 | | 24 | | 193 | | — | | 19 | | 10 | |
| R/kg | Jun 2026 | 1,432,231 | | 1,551,402 | | 1,216,374 | | 1,209,018 | | 5,250,000 | | 2,415,574 | | 1,613,065 | | 1,557,051 | | — | | 1,941,729 | | 1,004,796 |
| | Dec 2025 | 1,215,178 | | 1,243,414 | | 1,142,511 | | 972,167 | | — | | 1,956,376 | | 251,799 | | 1,258,567 | | — | | 2,127,711 | | 1,020,539 | |
| | Jun 2025 | 1,246,653 | | 1,319,231 | | 1,084,258 | | 1,105,890 | | — | | 1,766,978 | | 1,064,286 | | 1,296,498 | | — | | 1,532,359 | | 990,728 | |
| US$/oz | Jun 2026 | 2,715 | | 2,941 | | 2,306 | | 2,292 | | 9,951 | | 4,578 | | 3,057 | | 2,951 | | — | | 3,680 | | 1,904 | |
| | Dec 2025 | 2,175 | | 2,225 | | 2,045 | | 1,740 | | — | | 3,501 | | 451 | | 2,252 | | — | | 3,808 | | 1,826 | |
| | Jun 2025 | 2,108 | | 2,231 | | 1,834 | | 1,870 | | — | | 2,989 | | 1,800 | | 2,193 | | — | | 2,592 | | 1,676 | |
All-in sustaining cost1,2 | R/kg | Jun 2026 | 1,638,089 | | | | 1,659,766 | 2,277,053 | 1,705,645 | 2,177,165 | 1,069,439 | |
| | Dec 2025 | 1,446,794 | | | | 1,316,788 | 2,279,711 | 1,461,670 | 2,133,803 | 1,075,377 | |
| | Jun 2025 | 1,436,817 | | | | 1,406,209 | 1,980,969 | 1,372,912 | 1,677,560 | 1,075,966 | |
| All-in sustaining cost2 | US$/oz | Jun 2026 | 3,105 | | | | 3,146 | 4,316 | 3,233 | 4,127 | 2,027 | |
| | Dec 2025 | 2,589 | | | | 2,357 | 4,080 | 2,616 | 3,819 | 1,925 | |
| | Jun 2025 | 2,430 | | | | 2,378 | 3,350 | 2,322 | 2,837 | 1,820 | |
All-in cost1,2 | R/kg | Jun 2026 | 1,835,106 | | | | 1,659,766 | 2,277,053 | 1,705,645 | 2,177,165 | 1,817,521 | |
| | Dec 2025 | 1,607,772 | | | | 1,316,788 | 2,279,711 | 1,461,670 | 2,133,803 | 1,732,831 | |
| | Jun 2025 | 1,552,908 | | | | 1,406,209 | 1,980,969 | 1,372,912 | 1,677,560 | 1,565,971 | |
| All-in cost2 | US$/oz | Jun 2026 | 3,478 | | | | 3,146 | 4,316 | 3,233 | 4,127 | 3,445 | |
| | Dec 2025 | 2,877 | | | | 2,357 | 4,080 | 2,616 | 3,819 | 3,101 | |
| | Jun 2025 | 2,626 | | | | 2,378 | 3,350 | 2,322 | 2,837 | 2,649 | |
| Capital expenditure | | | | | | | | | | | | | |
| Ore reserve development | Rm | Jun 2026 | 1,132 | | | | 994 | — | 138 | — | | — | |
| | Dec 2025 | 1,571 | | | | 877 | 548 | 146 | — | | — | |
| | Jun 2025 | 1,361 | | | | 822 | 433 | 106 | — | | — | |
| Sustaining capital | Rm | Jun 2026 | 378 | | | | 178 | — | 40 | — | | 160 | |
| | Dec 2025 | 598 | | | | 265 | 143 | 71 | — | | 119 | |
| | Jun 2025 | 481 | | | | 149 | 108 | 40 | — | | 184 | |
Project capital3 | Rm | Jun 2026 | 1,870 | | | | — | — | — | — | | 1,853 | |
| | Dec 2025 | 1,583 | | | | — | — | — | — | | 1,570 | |
| | Jun 2025 | 1,103 | | | | — | — | — | — | | 1,103 | |
Total capital expenditure4 | Rm | Jun 2026 | 3,379 | | | | 1,172 | — | 178 | — | | 2,013 | |
| | Dec 2025 | 3,752 | | | | 1,142 | 691 | 217 | — | | 1,689 | |
| | Jun 2025 | 2,944 | | | | 971 | 541 | 146 | — | | 1,287 | |
| Total capital expenditure | US$m | Jun 2026 | 206 | | | | 71 | — | 11 | — | | 123 | |
| | Dec 2025 | 216 | | | | 66 | 40 | 12 | — | | 97 | |
| | Jun 2025 | 160 | | | | 53 | 29 | 8 | — | | 70 | |
Average exchange rate for the six months ended 30 June 2026, 31 December 2025 and 30 June 2025 was R16.41/US$, R17.38/US$ and R18.39/US$, respectively
Figures may not add as they are rounded independently
1Operating cost, All-in sustaining costs and All-in costs are not measures of performance under IFRS and should not be considered in isolation or as substitutes for measures of financial performance prepared in accordance with IFRS. See "Non-IFRS measures" for more information on the metrics presented by Sibanye-Stillwater. Because of its nature All-in sustaining costs and All-in costs should not be considered as a representation of financial performance 2All-in cost excludes income tax, costs associated with merger and acquisition activities, working capital, impairments, financing costs, one-time severance charges and items needed to normalise earnings. For a reconciliation of cost of sales before amortisation and depreciation to All-in cost, see “All-in costs – Six months”
3Project capital expenditure for the six months ended 30 June 2026 includes corporate capital expenditure of R17 million (US$1 million) (31 December 2025 R13 million (US$1 million) and 30 June 2025 zero) mainly related to various security capital requirements and the Burnstone project
4Due to the Kloof operations having a life of mine of 1 year as of 31 December 2025, all capital expenditure is expensed
Sibanye-Stillwater Operating and financial results | Six months ended 30 June 2026 18
SALIENT FEATURES AND COST BENCHMARKS – SIX MONTHS (continued)Australian operations | | | | | | | | | | | |
Century zinc retreatment operation |
| Production | | | |
| Ore mined and processed | kt | Jun 2026 | 3,996 | |
| | Dec 2025 | 4,123 | |
| | Jun 2025 | 4,087 | |
| Zinc ore grade processed | % | Jun 2026 | 2.78 | |
| | Dec 2025 | 2.86 | |
| | Jun 2025 | 2.99 | |
| Plant recoveries | % | Jun 2026 | 48.68 | |
| | Dec 2025 | 50.65 | |
| | Jun 2025 | 50.62 | |
Concentrate produced1 | kt | Jun 2026 | 119 | |
| | Dec 2025 | 130 | |
| | Jun 2025 | 132 | |
Concentrate zinc grade2 | % | Jun 2026 | 45.32 | |
| | Dec 2025 | 45.98 | |
| | Jun 2025 | 46.86 | |
Zinc in concentrate produced3 | kt | Jun 2026 | 54 | |
| | Dec 2025 | 60 | |
| | Jun 2025 | 62 | |
Payable zinc production4 | kt | Jun 2026 | 45 | |
| | Dec 2025 | 49 | |
| | Jun 2025 | 51 | |
Payable zinc sales5 | kt | Jun 2026 | 41 | |
| | Dec 2025 | 45 | |
| | Jun 2025 | 46 | |
| Price and costs | | | |
Average equivalent zinc concentrate price6 | R/tZn | Jun 2026 | 54,047 | |
| | Dec 2025 | 48,878 | |
| | Jun 2025 | 48,294 | |
| US$/tZn | Jun 2026 | 3,294 | |
| | Dec 2025 | 2,812 | |
| | Jun 2025 | 2,626 | |
All-in sustaining cost7,8 | R/tZn | Jun 2026 | 35,477 | |
| | Dec 2025 | 36,399 | |
| | Jun 2025 | 32,411 | |
| US$/tZn | Jun 2026 | 2,162 | |
| | Dec 2025 | 2,094 | |
| | Jun 2025 | 1,762 | |
All-in cost7,8 | R/tZn | Jun 2026 | 35,971 | |
| | Dec 2025 | 37,291 | |
| | Jun 2025 | 32,665 | |
| US$/tZn | Jun 2026 | 2,192 | |
| | Dec 2025 | 2,146 | |
| | Jun 2025 | 1,776 | |
| Capital expenditure | | | |
| Sustaining capital | Rm | Jun 2026 | 6 | |
| | Dec 2025 | 38 | |
| | Jun 2025 | 21 | |
| Project capital | Rm | Jun 2026 | 21 | |
| | Dec 2025 | 43 | |
| | Jun 2025 | 12 | |
| Total capital expenditure | Rm | Jun 2026 | 27 | |
| | Dec 2025 | 81 | |
| | Jun 2025 | 33 | |
| US$m | Jun 2026 | 2 | |
| | Dec 2025 | 5 | |
| | Jun 2025 | 2 | |
Sibanye-Stillwater Operating and financial results | Six months ended 30 June 2026 19
Average exchange rate for the six months ended 30 June 2026, 31 December 2025 and 30 June 2025 was R16.41/US$, R17.38/US$ and R18.39/US$, respectively
Figures may not add as they are rounded independently
1Concentrate produced contains zinc, lead, silver and waste material, which is exported as a relatively dry product
2Concentrate zinc grade is the percentage of zinc contained in the concentrate produced
3Zinc in concentrate produced is the zinc metal contained in the concentrate produced
4Payable zinc production is the payable quantity of zinc metal produced after applying smelter content deductions
5Payable zinc sales is the payable quantity of zinc metal sold after applying smelter content deductions
6Average equivalent zinc concentrate price is the total zinc sales revenue recognised at the price expected to be received excluding the fair value adjustments divided by the payable zinc sales
7All-in sustaining costs and all-in costs are not measures of performance under IFRS and should not be considered in isolation or as substitutes for measures of financial performance prepared in accordance with IFRS. See "Non-IFRS measures" for more information on the metrics presented by Sibanye-Stillwater. Because of its nature All-in sustaining costs and All-in costs should not be considered as a representation of financial performance 8All-in cost excludes income tax, costs associated with merger and acquisition activities, working capital, impairments, financing costs, one-time severance charges and items needed to normalise earnings. For a reconciliation of cost of sales, before amortisation and depreciation to All-in cost, see “All-in costs - Six months”
Sibanye-Stillwater Operating and financial results | Six months ended 30 June 2026 20
CONSOLIDATED INTERIM RESULTS Condensed consolidated interim income statement
Figures are in millions unless otherwise stated
| | | | | | | | | | | | | | | | | | | | | | | |
| US dollar | | | SA rand |
| Six months ended | | | Six months ended |
| Unaudited | Unaudited | Unaudited | | | Unaudited | Unaudited | Unaudited |
| Jun 2025 | Dec 2025 | Jun 2026 | | Notes | Jun 2026 | Dec 2025 | Jun 2025 |
| 2,978 | 4,275 | 5,483 | Revenue | 3 | 89,977 | 74,910 | 54,767 |
| (2,310) | (3,160) | (3,684) | Cost of sales | 4 | (60,453) | (55,314) | (42,492) |
| (2,081) | (2,865) | (3,427) | Cost of sales, before amortisation and depreciation | | (56,234) | (50,165) | (38,274) |
| (229) | (295) | (257) | Amortisation and depreciation | | (4,219) | (5,149) | (4,218) |
| | | | | | | |
| 668 | 1,115 | 1,799 | | | 29,524 | 19,596 | 12,275 |
| 37 | 51 | 47 | Interest income | | 772 | 882 | 686 |
| (139) | (141) | (138) | Finance expense | 5 | (2,264) | (2,447) | (2,553) |
| (33) | (85) | 7 | Share-based payment expenses | | 119 | (1,499) | (615) |
| (21) | (191) | 4 | Gain/(loss) on financial instruments | 6 | 58 | (3,403) | (391) |
| 9 | — | 4 | Gain/(loss) on foreign exchange differences | | 63 | (6) | 161 |
| (23) | 42 | 100 | Share of results of equity-accounted investees after tax | | 1,641 | 769 | (432) |
| (90) | (179) | (133) | Other costs | 7.1 | (2,185) | (3,150) | (1,659) |
| 35 | 42 | 20 | Other income | 7.2 | 324 | 741 | 639 |
| 1 | (2) | 3 | Gain/(loss) on disposal of property, plant and equipment | | 51 | (30) | 16 |
| (526) | (257) | (1) | Impairments | 8 | (18) | (4,341) | (9,666) |
| (13) | (1) | (9) | Restructuring costs | | (153) | (5) | (242) |
| (23) | (231) | (9) | Transaction and project costs | | (150) | (4,125) | (418) |
| — | (3) | — | Occupational healthcare loss | | — | (46) | (3) |
| (118) | 160 | 1,694 | Profit/(loss) before royalties, carbon tax and tax | | 27,782 | 2,936 | (2,202) |
| (12) | (52) | (102) | Royalties | 9.2 | (1,668) | (928) | (217) |
| — | — | — | Carbon tax | | (2) | 2 | (2) |
| (130) | 108 | 1,592 | Profit/(loss) before tax | | 26,112 | 2,010 | (2,421) |
| (81) | (161) | (445) | Mining and income tax | 9.1 | (7,305) | (2,843) | (1,485) |
| (17) | (118) | (313) | - Current tax | | (5,136) | (2,109) | (309) |
| (64) | (43) | (132) | - Deferred tax | | (2,169) | (734) | (1,176) |
| | | | | | | |
| (211) | (53) | 1,147 | Profit/(loss) for the period | | 18,807 | (833) | (3,906) |
| | | Profit/(loss) for the period attributable to: | | | | |
| (194) | (94) | 1,082 | - Owners of Sibanye-Stillwater | | 17,745 | (1,580) | (3,591) |
| (17) | 41 | 65 | - Non-controlling interests (NCI) | | 1,062 | 747 | (315) |
| | | Earnings per ordinary share (cents) | | | | |
| (7) | (3) | 38 | Basic earnings per share | 10.1 | 627 | (56) | (127) |
| (7) | (3) | 34 | Diluted earnings per share | 10.2 | 561 | (56) | (127) |
| 18.39 | 17.38 | 16.41 | Average R/US$ rate | | | | |
| | |
The consolidated interim financial statements for the six months ended 30 June 2026 were prepared by Sibanye-Stillwater's Group financial reporting team headed by Henning Opperman (CA (SA)). This process was supervised by the Group's Chief Financial Officer, Charl Keyter and approved by the Sibanye-Stillwater Board of Directors. |
Condensed consolidated interim statement of other comprehensive income
Figures are in millions unless otherwise stated
| | | | | | | | | | | | | | | | | | | | | | | |
| US dollar | | | SA rand |
| Six months ended | | | Six months ended |
| Unaudited | Unaudited | Unaudited | | | Unaudited | Unaudited | Unaudited |
| Jun 2025 | Dec 2025 | Jun 2026 | | | Jun 2026 | Dec 2025 | Jun 2025 |
| (211) | (53) | 1,147 | Profit/(loss) for the period | | 18,807 | (833) | (3,906) |
| 140 | 233 | 38 | Other comprehensive income, net of tax | | 151 | 839 | 67 |
| — | — | — | Foreign currency translation adjustments1 | | (15) | 17 | (6) |
| 4 | 46 | 10 | Fair value adjustment on other investments2 | | 166 | 822 | 73 |
| | | | | | | |
| 136 | 187 | 28 | Currency translation adjustments3 | | — | — | — |
| | | | | | | |
| (71) | 180 | 1,185 | Total comprehensive income | | 18,958 | 6 | (3,839) |
| | | Total comprehensive income attributable to: | | | | |
| (59) | 137 | 1,120 | - Owners of Sibanye-Stillwater | | 17,888 | (769) | (3,619) |
| (12) | 43 | 65 | - Non-controlling interests | | 1,070 | 775 | (220) |
| 18.39 | 17.38 | 16.41 | Average R/US$ rate | | | | |
1These gains and losses will be reclassified to profit or loss upon disposal of the underlying operations
2These gains and losses will never be reclassified to profit or loss
3These gains and losses relate to the convenience translation of the SA rand amounts to US dollar and will never be reclassified to profit or loss
Sibanye-Stillwater Operating and financial results | Six months ended 30 June 2026 21
Condensed consolidated interim statement of financial position
Figures are in millions unless otherwise stated
| | | | | | | | | | | | | | | | | | | | | | | |
| US dollar | | | SA rand |
| Unaudited | Unaudited | Unaudited | | | Unaudited | Unaudited | Unaudited |
| Jun 2025 | Dec 2025 | Jun 2026 | | Notes | Jun 2026 | Dec 2025 | Jun 2025 |
| 4,745 | 5,370 | 5,826 | Non-current assets | | 95,495 | 88,984 | 84,325 |
| 3,512 | 3,882 | 4,143 | Property, plant and equipment | | 67,901 | 64,320 | 62,416 |
| 16 | 32 | 29 | Right-of-use assets | | 470 | 532 | 283 |
| 112 | 119 | 113 | Goodwill and other intangibles | | 1,859 | 1,973 | 1,994 |
| 357 | 396 | 473 | Equity-accounted investments | 12 | 7,754 | 6,560 | 6,341 |
| 184 | 258 | 267 | Other investments | | 4,381 | 4,271 | 3,275 |
| 388 | 441 | 464 | Environmental rehabilitation obligation funds | | 7,607 | 7,307 | 6,887 |
| 51 | 116 | 286 | Other receivables | 13 | 4,685 | 1,928 | 904 |
| 125 | 126 | 51 | Deferred tax assets | | 838 | 2,093 | 2,225 |
| | | | | | | |
| 3,397 | 3,667 | 3,901 | Current assets | | 63,938 | 60,753 | 60,374 |
| 1,595 | 1,900 | 1,942 | Inventories | 14 | 31,831 | 31,480 | 28,335 |
| 319 | 411 | 397 | Trade and other receivables | | 6,515 | 6,811 | 5,668 |
| 274 | 291 | 164 | Other receivables | 13 | 2,683 | 4,816 | 4,876 |
| 10 | 26 | 12 | Tax receivable | | 191 | 438 | 178 |
| 1,182 | 1,037 | 1,369 | Cash and cash equivalents | | 22,434 | 17,178 | 21,012 |
| 17 | 2 | 17 | Assets held for sale | 15 | 284 | 30 | 305 |
| | | | | | | |
| 8,142 | 9,037 | 9,727 | Total assets | | 159,433 | 149,737 | 144,699 |
| | | | | | | |
| 2,497 | 2,667 | 3,611 | Total equity | | 59,174 | 44,167 | 44,345 |
| | | | | | | |
| 4,471 | 4,309 | 4,683 | Non-current liabilities | | 76,750 | 71,412 | 79,456 |
| 2,371 | 1,922 | 2,228 | Borrowings | 16 | 36,514 | 31,855 | 42,136 |
| 15 | 29 | 25 | Lease liabilities | | 413 | 481 | 262 |
| 684 | 852 | 885 | Environmental rehabilitation obligation and other provisions | | 14,501 | 14,117 | 12,151 |
| 17 | 13 | 11 | Occupational healthcare obligation | | 180 | 211 | 305 |
| 112 | 163 | 121 | Cash-settled share-based payment obligations | | 1,991 | 2,704 | 1,999 |
| 97 | 85 | 89 | Other payables | 17 | 1,454 | 1,402 | 1,729 |
| 853 | 854 | 865 | Deferred revenue | | 14,180 | 14,158 | 15,166 |
| 1 | 1 | 3 | Tax and royalties payable | | 43 | 14 | 12 |
| 321 | 390 | 456 | Deferred tax liabilities | | 7,474 | 6,470 | 5,696 |
| | | | | | | |
| 1,174 | 2,061 | 1,433 | Current liabilities | | 23,509 | 34,158 | 20,898 |
| 15 | 688 | 16 | Borrowings | 16 | 263 | 11,402 | 275 |
| 10 | 10 | 9 | Lease liabilities | | 151 | 166 | 185 |
| 11 | 10 | 15 | Environmental rehabilitation obligation and other provisions | | 248 | 161 | 203 |
| 2 | 10 | 7 | Occupational healthcare obligation | | 122 | 173 | 31 |
| 26 | 56 | 40 | Cash-settled share-based payment obligations | | 659 | 935 | 457 |
| 875 | 1,011 | 1,114 | Trade and other payables | | 18,260 | 16,756 | 15,557 |
| 128 | 138 | 81 | Other payables | 17 | 1,329 | 2,279 | 2,274 |
| 63 | 73 | 35 | Deferred revenue | | 576 | 1,204 | 1,119 |
| 18 | 36 | 86 | Tax and royalties payable | | 1,406 | 602 | 327 |
| 26 | 29 | 30 | Liabilities associated with assets held for sale | 15 | 495 | 480 | 470 |
| | | | | | | |
| 8,142 | 9,037 | 9,727 | Total equity and liabilities | | 159,433 | 149,737 | 144,699 |
| 17.77 | 16.57 | 16.39 | Closing R/US$ rate | | | | |
Sibanye-Stillwater Operating and financial results | Six months ended 30 June 2026 22
Condensed consolidated interim statement of cash flows
Figures are in millions unless otherwise stated
| | | | | | | | | | | | | | | | | | | | | | | |
| US dollar | | | SA rand |
| Six months ended | | | Six months ended |
| Unaudited | Unaudited | Unaudited | | | Unaudited | Unaudited | Unaudited |
| Jun 2025 | Dec 2025 | Jun 2026 | | Notes | Jun 2026 | Dec 2025 | Jun 2025 |
| | | Cash flows from operating activities | 20.1 | | | |
| 178 | 588 | 1,260 | Cash generated by operations | | 20,684 | 10,415 | 3,277 |
| 548 | 53 | 9 | Deferred revenue advance received | | 144 | 668 | 10,077 |
| (4) | (32) | (52) | Cash-settled share-based payments paid | | (847) | (567) | (82) |
| — | — | (10) | Payment of Marikana dividend obligation | | (164) | — | — |
| 28 | 99 | 602 | Change in working capital | 20.2 | 9,883 | 1,751 | 522 |
| 750 | 708 | 1,809 | | | 29,700 | 12,267 | 13,794 |
| 26 | 21 | 30 | Interest received | | 498 | 377 | 472 |
| (64) | (67) | (58) | Interest paid | | (950) | (1,160) | (1,177) |
| (21) | (53) | (97) | Royalties paid | | (1,591) | (933) | (387) |
| 22 | 2 | — | Royalties refunded | | — | 33 | 398 |
| (13) | (125) | (251) | Tax paid | | (4,124) | (2,233) | (231) |
| 24 | 3 | — | Tax refunded | | 6 | 52 | 437 |
| (7) | (10) | (239) | Dividends paid | | (3,925) | (173) | (129) |
| 717 | 479 | 1,194 | Net cash from operating activities | | 19,614 | 8,230 | 13,177 |
| | | Cash flow from investing activities | | | | |
| (519) | (617) | (506) | Additions to property, plant and equipment | | (8,306) | (10,769) | (9,538) |
| 5 | 4 | 4 | Proceeds on disposal of property, plant and equipment | | 60 | 69 | 94 |
| (5) | (106) | — | Acquisition of subsidiaries, net of cash acquired | | — | (1,894) | (96) |
| 15 | 8 | 32 | Dividends received | | 528 | 144 | 274 |
| (18) | (30) | (22) | Additions to other investments | | (356) | (527) | (323) |
| 28 | 15 | 16 | Disposals of other investments | | 264 | 259 | 506 |
| — | 18 | — | Proceeds on sale of assets held for sale | | — | 318 | — |
| 1 | — | — | Repayment of loan from investee | | — | — | 21 |
| (5) | — | (9) | Acquisition of equity-accounted investment | | (147) | — | (91) |
| — | (9) | — | Contributions to environmental rehabilitation funds | | (6) | (154) | (4) |
| — | 1 | — | Proceeds from environmental rehabilitation funds | | 2 | 18 | 1 |
| (498) | (716) | (485) | Net cash used in investing activities | | (7,961) | (12,536) | (9,156) |
| | | Cash flow from financing activities | | | | |
| 168 | 275 | 32 | Loans raised | 16 | 526 | 4,828 | 3,084 |
| (83) | (190) | (411) | Loans repaid | 16 | (6,747) | (3,355) | (1,528) |
| (6) | (7) | (5) | Lease payments | | (90) | (125) | (103) |
| — | (3) | — | Acquisition of NCI | | — | (45) | — |
| 79 | 75 | (384) | Net cash (used in)/from financing activities | | (6,311) | 1,303 | 1,453 |
| 298 | (162) | 325 | Net increase/(decrease) in cash and cash equivalents | | 5,342 | (3,003) | 5,474 |
| 29 | 17 | 7 | Effect of exchange rate fluctuations on cash held | | (86) | (831) | (511) |
| 855 | 1,182 | 1,037 | Cash and cash equivalents at beginning of the period | | 17,178 | 21,012 | 16,049 |
| 1,182 | 1,037 | 1,369 | Cash and cash equivalents at end of the period | | 22,434 | 17,178 | 21,012 |
| 18.39 | 17.38 | 16.41 | Average R/US$ rate | | | | |
| 17.77 | 16.57 | 16.39 | Closing R/US$ rate | | | | |
Sibanye-Stillwater Operating and financial results | Six months ended 30 June 2026 23
Condensed consolidated interim statement of changes in equity
Figures are in millions unless otherwise stated
| | | | | | | | | | | | | | | | | | | | | | | | | | | | | | | | | | | | | | | | | |
| US dollar | | | SA rand |
| Stated capital | Re- organisation reserve | Other reserves | Accum-
ulated loss | Non-
controlling interests | Total
equity | | | Total
equity | Non-
controlling interests | Accum-
ulated loss | Other reserves | Re- organisation reserve | Stated capital |
| 1,361 | 2,599 | (56) | (1,595) | 264 | 2,573 | Balance at 31 December 2024 (Unaudited) | | 48,289 | 4,310 | (13,817) | 13,148 | 23,001 | 21,647 |
| — | — | 135 | (194) | (12) | (71) | Total comprehensive income for the period | | (3,839) | (220) | (3,591) | (28) | — | — |
| — | — | — | (194) | (17) | (211) | Loss for the period | | (3,906) | (315) | (3,591) | — | — | — |
| — | — | 135 | — | 5 | 140 | Other comprehensive income, net of tax | | 67 | 95 | — | (28) | — | — |
| — | — | — | — | (7) | (7) | Dividends paid | | (129) | (129) | — | — | — | — |
| — | — | 1 | — | 1 | 2 | Equity-settled share-based payments | | 24 | 12 | — | 12 | — | — |
| 1,361 | 2,599 | 80 | (1,789) | 246 | 2,497 | Balance at 30 June 2025 (Unaudited) | | 44,345 | 3,973 | (17,408) | 13,132 | 23,001 | 21,647 |
| — | — | 231 | (94) | 43 | 180 | Total comprehensive income for the period | | 6 | 775 | (1,580) | 811 | — | — |
| — | — | — | (94) | 41 | (53) | (Loss)/profit for the period | | (833) | 747 | (1,580) | — | — | — |
| — | — | 231 | — | 2 | 233 | Other comprehensive income, net of tax | | 839 | 28 | — | 811 | — | — |
| — | — | — | — | (10) | (10) | Dividends paid | | (173) | (173) | — | — | — | — |
| — | — | 1 | — | 1 | 2 | Equity-settled share-based payments | | 34 | 17 | — | 17 | — | — |
| — | — | — | (5) | 3 | (2) | Transactions with DRDGOLD shareholders | | (45) | 49 | (94) | — | — | — |
| 1,361 | 2,599 | 312 | (1,888) | 283 | 2,667 | Balance at 31 December 2025 (Unaudited) | | 44,167 | 4,641 | (19,082) | 13,960 | 23,001 | 21,647 |
| — | — | 38 | 1,082 | 65 | 1,185 | Total comprehensive income for the period | | 18,958 | 1,068 | 17,745 | 145 | — | — |
| — | — | — | 1,082 | 65 | 1,147 | Profit for the period | | 18,807 | 1,062 | 17,745 | — | — | — |
| — | — | 38 | — | — | 38 | Other comprehensive income, net of tax | | 151 | 6 | — | 145 | — | — |
| — | — | — | (226) | (13) | (239) | Dividends paid | | (3,925) | (217) | (3,708) | — | — | — |
| — | — | (1) | — | (1) | (2) | Equity-settled share-based payments | | (26) | (13) | — | (13) | — | — |
| 1,361 | 2,599 | 349 | (1,032) | 334 | 3,611 | Balance at 30 June 2026 (Unaudited) | | 59,174 | 5,479 | (5,045) | 14,092 | 23,001 | 21,647 |
Sibanye-Stillwater Operating and financial results | Six months ended 30 June 2026 24
Notes to the consolidated interim financial statements
1. Basis of accounting and preparation
The consolidated interim financial statements are prepared in accordance with the requirements of the JSE Listings Requirements for interim results and the requirements of the Companies Act of South Africa. The JSE Listings Requirements require interim results to be prepared in accordance with framework concepts, and the measurement and recognition requirements of International Financial Reporting Standards Accounting Standards (IFRS Accounting Standards), as issued by the International Accounting Standards Board (IASB), the South African Institute of Chartered Accountants Financial Reporting Guides as issued by the Accounting Practices Committee and Financial Pronouncements as issued by the Financial Reporting Standards Council and to also, as a minimum, contain information required by IAS 34 Interim Financial Reporting. The accounting policies applied in the preparation of these consolidated interim financial statements are in terms of IFRS Accounting Standards and are consistent with those applied in the previous consolidated annual financial statements, included in the 31 December 2025 annual financial report.
The condensed consolidated interim income statement, and statements of other comprehensive income and cash flows for the six months ended 31 December 2025 were prepared by subtracting the condensed consolidated interim financial statements for the six months ended 30 June 2025 from the consolidated financial statements for the year ended 31 December 2025.
The convenience translation of the primary statements into US dollar is based on the average exchange rate for the period for the condensed consolidated income statements, statements of other comprehensive income and cash flows, and the period-end closing exchange rate for the condensed consolidated statements of financial position. Exchange differences on translation are accounted for in the condensed consolidated statement of other comprehensive income. This information is provided as supplementary information only.
Sibanye-Stillwater Operating and financial results | Six months ended 30 June 2026 25
2. Segment reporting
During H2 2025, management updated the internal financial reporting to the chief operating decision maker by reporting adjusted EBITDA (previously net profit/loss) as the main and only measure of financial performance for operating segments. The Group therefore updated the structure of the segment reporting, including representation of all comparative information, to reflect this change in internal reporting.
Figures are in millions
| | | | | | | | | | | | | | | | | | | | | | | | | | | | | | | | | | | | | | | | | | | | | | | | | | | | | | | | | | | | | | | | | | | | | | | | | | | | | | | | | | | |
| For the six months ended 30 Jun 2026 (Unaudited) | For the six months ended 31 Dec 2025 (Unaudited) | For the six months ended 30 Jun 2025 (Unaudited) |
| GROUP | SOUTHERN AFRICA | | AMERICAS | EUROPE | AUSTRALIA | GROUP | GROUP | SOUTHERN AFRICA | | AMERICAS | EUROPE | Australia | GROUP | GROUP | SOUTHERN AFRICA | | AMERICAS | EUROPE | Australia | GROUP |
| SA rand | Total | Total SA
operations | Total
SA PGM | Total
SA gold | Total international operations | Total US operations | Total EU
operations | Total AUS operations | Cor- porate1 | Total | Total SA
operations | Total
SA PGM | Total
SA gold | Total international operations | Total US operations | Total EU
operations | Total AUS operations | Cor- porate1 | Total | Total SA
operations | Total
SA PGM | Total
SA gold | Total international operations | Total US operations | Total EU
operations | Total AUS operations | Cor- porate1 |
| Revenue | 89,977 | 66,380 | 43,127 | 23,253 | 24,256 | 21,775 | 5 | 2,476 | (659) | 74,910 | 56,543 | 35,974 | 20,569 | 18,843 | 16,287 | 28 | 2,528 | (476) | 54,767 | 41,399 | 24,909 | 16,490 | 13,461 | 10,827 | 490 | 2,144 | (93) |
| Underground | 60,276 | 56,920 | 41,583 | 15,337 | 3,880 | 3,880 | — | — | (524) | 52,581 | 49,037 | 34,567 | 14,470 | 3,971 | 3,971 | — | — | (427) | 37,783 | 35,129 | 23,814 | 11,315 | 2,747 | 2,747 | — | — | (93) |
| Surface | 11,936 | 9,460 | 1,544 | 7,916 | 2,476 | — | — | 2,476 | — | 10,034 | 7,506 | 1,407 | 6,099 | 2,528 | — | — | 2,528 | — | 8,414 | 6,270 | 1,095 | 5,175 | 2,144 | — | — | 2,144 | — |
| Recycling/processing | 17,765 | — | — | — | 17,900 | 17,895 | 5 | — | (135) | 12,295 | — | — | — | 12,344 | 12,316 | 28 | — | (49) | 8,570 | — | — | — | 8,570 | 8,080 | 490 | — | — |
| Cost of sales, before amortisation and depreciation | (56,234) | (36,888) | (23,210) | (13,678) | (19,496) | (17,921) | (20) | (1,555) | 150 | (50,165) | (35,419) | (23,564) | (11,855) | (14,777) | (13,153) | (20) | (1,604) | 31 | (38,274) | (30,783) | (19,650) | (11,133) | (7,491) | (5,287) | (747) | (1,457) | — |
| Underground | (34,666) | (31,945) | (22,192) | (9,753) | (2,721) | (2,721) | — | — | — | (33,227) | (31,008) | (22,455) | (8,553) | (2,219) | (2,219) | — | — | — | (26,672) | (26,742) | (18,682) | (8,060) | 70 | 70 | — | — | — |
| Surface | (6,514) | (4,943) | (1,018) | (3,925) | (1,571) | — | (16) | (1,555) | — | (6,015) | (4,411) | (1,109) | (3,302) | (1,604) | — | — | (1,604) | — | (5,498) | (4,041) | (968) | (3,073) | (1,457) | — | — | (1,457) | — |
| Recycling/processing | (15,054) | — | — | — | (15,204) | (15,200) | (4) | — | 150 | (10,923) | — | — | — | (10,954) | (10,934) | (20) | — | 31 | (6,104) | — | — | — | (6,104) | (5,357) | (747) | — | — |
| | | | | | | | | | | | | | | | | | | | | | | | | | | |
Adjusted EBITDA2 | 31,843 | 28,202 | 19,207 | 8,995 | 4,164 | 3,769 | (443) | 838 | (523) | 22,727 | 19,600 | 11,904 | 7,696 | 3,563 | 3,040 | (346) | 869 | (436) | 15,073 | 9,587 | 4,778 | 4,809 | 5,635 | 5,482 | (430) | 583 | (149) |
| | see note 2.1 | see note 2.2 | | | see note 2.1 | see note 2.2 | | | see note 2.1 | see note 2.2 | |
1Group corporate includes the Wheaton stream and the Franco-Nevada stream and mainly includes corporate transaction costs, finance costs and other
2See note 19 for a reconciliation of the Group's profit before royalties, carbon tax and tax to adjusted EBITDA
2.1 SA operations
Figures are in millions
| | | | | | | | | | | | | | | | | | | | | | | | | | | | | | | | | | | | | | | | | |
| For the six months ended 30 Jun 2026 (Unaudited) |
| SOUTHERN AFRICA |
| SA rand | Total SA
operations | Total
SA PGM | Rusten-
burg | Marikana | Platinum
Mile | Mimosa | Corporate and re- conciling items1 | Total
SA gold | Drie-
fontein | Kloof | Beatrix | DRD-
GOLD | Corporate and re- conciling items1 |
| Revenue | 66,380 | 43,127 | 22,429 | 20,151 | 547 | 2,471 | (2,471) | 23,253 | 8,061 | 3,613 | 4,237 | 6,106 | 1,236 |
| Underground | 56,920 | 41,583 | 21,335 | 20,151 | 97 | 2,471 | (2,471) | 15,337 | 8,061 | 3,039 | 4,237 | — | — |
| Surface | 9,460 | 1,544 | 1,094 | — | 450 | — | — | 7,916 | — | 574 | — | 6,106 | 1,236 |
| Recycling/processing | — | — | — | — | — | — | — | — | — | — | — | — | — |
| Cost of sales, before amortisation and depreciation | (36,888) | (23,210) | (12,496) | (10,322) | (392) | (1,157) | 1,157 | (13,678) | (4,087) | (3,466) | (2,610) | (2,462) | (1,053) |
| Underground | (31,945) | (22,192) | (11,825) | (10,322) | (45) | (1,157) | 1,157 | (9,753) | (4,003) | (3,140) | (2,610) | — | — |
| Surface | (4,943) | (1,018) | (671) | — | (347) | — | — | (3,925) | (84) | (326) | — | (2,462) | (1,053) |
| Recycling/processing | — | — | — | — | — | — | — | — | — | — | — | — | — |
| | | | | | | | | | | | | |
| Adjusted EBITDA | 28,202 | 19,207 | 9,907 | 9,385 | 86 | 1,317 | (1,488) | 8,995 | 3,950 | 141 | 1,591 | 3,632 | (319) |
| | | | | | | | | | | | | |
| Capital expenditure | | | | | | | | | | | | | |
| Sustaining capital expenditure | (1,518) | (1,140) | (647) | (491) | (2) | (245) | 245 | (378) | (178) | — | (40) | (160) | — |
| Ore reserve development | (2,312) | (1,180) | (387) | (793) | — | — | — | (1,132) | (994) | — | (138) | — | — |
| Project capital | (2,179) | (319) | (103) | (216) | — | — | — | (1,860) | — | — | — | (1,853) | (7) |
| Total capital expenditure | (6,009) | (2,639) | (1,137) | (1,500) | (2) | (245) | 245 | (3,370) | (1,172) | — | (178) | (2,013) | (7) |
| | | | | | | | | | | | | |
| The following items are disclosed per segment in accordance with IFRS Accounting Standards | | | | | | | | | | | | | |
| Cost of sales before amortisation and depreciation consists of the following: | | | | | | | | | | | | | |
| Salaries and wages | (13,547) | (9,088) | (4,690) | (4,367) | (31) | (11) | 11 | (4,459) | (1,820) | (980) | (1,108) | (385) | (166) |
| Consumable stores | (10,038) | (7,112) | (2,906) | (4,120) | (86) | — | — | (2,926) | (731) | (428) | (551) | (780) | (436) |
| Utilities | (5,761) | (2,675) | (1,523) | (1,151) | (1) | (132) | 132 | (3,086) | (1,379) | (747) | (297) | (277) | (386) |
| Mine contracts | (4,125) | (2,399) | (1,301) | (979) | (119) | — | — | (1,726) | (307) | (313) | (237) | (537) | (332) |
| Recycling costs | — | — | — | — | — | — | — | — | — | — | — | — | — |
| Other | (3,417) | (1,936) | (2,076) | 295 | (155) | (1,014) | 1,014 | (1,481) | 150 | (998) | (417) | (483) | 267 |
| Total cost of sales before amortisation and depreciation | (36,888) | (23,210) | (12,496) | (10,322) | (392) | (1,157) | 1,157 | (13,678) | (4,087) | (3,466) | (2,610) | (2,462) | (1,053) |
| | | | | | | | | | | | | |
| Amortisation and depreciation | (3,524) | (2,152) | (947) | (1,095) | (80) | (187) | 157 | (1,372) | (871) | — | (208) | (210) | (83) |
| Finance expense | (761) | (304) | (941) | (170) | — | (40) | 847 | (457) | (55) | (62) | (50) | (30) | (260) |
| Impairments | (17) | (17) | (17) | — | — | 783 | (783) | — | — | — | — | — | — |
1Corporate and reconciling items represent the items to reconcile segment data to consolidated financial statement totals, such as intercompany eliminations and share of results of equity-accounted investees after tax. This does not represent a separate segment as it does not generate revenue
Sibanye-Stillwater Operating and financial results | Six months ended 30 June 2026 26
Figures are in millions
| | | | | | | | | | | | | | | | | | | | | | | | | | | | | | | | | | | | | | | | | |
| For the six months ended 31 Dec 2025 (Unaudited) |
| SOUTHERN AFRICA |
| SA rand | Total SA
operations | Total
SA PGM | Rusten-
burg | Marikana | Platinum
Mile | Mimosa | Corporate and re- conciling items1 | Total
SA gold | Drie-
fontein | Kloof | Beatrix | DRD-
GOLD | Corporate and re- conciling items1 |
| Revenue | 56,543 | 35,974 | 18,759 | 16,497 | 718 | 2,604 | (2,604) | 20,569 | 7,253 | 2,453 | 3,347 | 5,053 | 2,463 |
| Underground | 49,037 | 34,567 | 17,920 | 16,497 | 150 | 2,604 | (2,604) | 14,470 | 7,253 | 2,277 | 3,347 | — | 1,593 |
| Surface | 7,506 | 1,407 | 839 | — | 568 | — | — | 6,099 | — | 176 | — | 5,053 | 870 |
| Recycling/processing | — | — | — | — | — | — | — | — | — | — | — | — | — |
| Cost of sales, before amortisation and depreciation | (35,419) | (23,564) | (11,690) | (11,388) | (487) | (1,618) | 1,619 | (11,855) | (3,676) | (2,734) | (2,164) | (2,432) | (849) |
| Underground | (31,008) | (22,455) | (10,980) | (11,388) | (88) | (1,618) | 1,619 | (8,553) | (3,676) | (2,713) | (2,164) | — | — |
| Surface | (4,411) | (1,109) | (710) | — | (399) | — | — | (3,302) | — | (21) | — | (2,432) | (849) |
| Recycling/processing | — | — | — | — | — | — | — | — | — | — | — | — | — |
| | | | | | | | | | | | | |
| Adjusted EBITDA | 19,600 | 11,904 | 7,052 | 4,900 | 126 | 988 | (1,162) | 7,696 | 3,562 | (309) | 1,162 | 2,597 | 684 |
| | | | | | | | | | | | | |
Capital expenditure | | | | | | | | | | | | | |
| Sustaining capital expenditure | (2,345) | (1,747) | (930) | (792) | (25) | (198) | 198 | (598) | (265) | (143) | (71) | (119) | — |
| Ore reserve development | (2,819) | (1,249) | (398) | (851) | — | — | — | (1,570) | (877) | (548) | (145) | — | — |
| Project capital | (1,927) | (343) | (34) | (309) | — | — | — | (1,584) | — | — | — | (1,570) | (14) |
| Total capital expenditure | (7,091) | (3,339) | (1,362) | (1,952) | (25) | (198) | 198 | (3,752) | (1,142) | (691) | (216) | (1,689) | (14) |
| | | | | | | | | | | | | |
The following items are disclosed per segment in accordance with IFRS Accounting Standards | | | | | | | | | | | | | |
| Cost of sales before amortisation and depreciation consists of the following: | | | | | | | | | | | | | |
| Salaries and wages | (13,695) | (9,121) | (4,681) | (4,416) | (24) | (12) | 12 | (4,574) | (1,795) | (1,165) | (1,065) | (383) | (166) |
| Consumable stores | (9,408) | (6,338) | (3,089) | (3,117) | (132) | — | — | (3,070) | (774) | (556) | (596) | (733) | (411) |
| Utilities | (6,157) | (3,042) | (1,738) | (1,302) | (2) | (137) | 137 | (3,115) | (1,331) | (818) | (298) | (282) | (386) |
| Mine contracts | (4,128) | (2,377) | (1,243) | (1,012) | (122) | — | — | (1,751) | (322) | (361) | (249) | (484) | (335) |
| Recycling costs | — | — | — | — | — | — | — | — | — | — | — | — | — |
| Other | (2,031) | (2,686) | (939) | (1,541) | (207) | (1,469) | 1,470 | 655 | 546 | 166 | 44 | (550) | 449 |
| Total cost of sales before amortisation and depreciation | (35,419) | (23,564) | (11,690) | (11,388) | (487) | (1,618) | 1,619 | (11,855) | (3,676) | (2,734) | (2,164) | (2,432) | (849) |
| | | | | | | | | | | | | |
| Amortisation and depreciation | (4,318) | (2,270) | (1,087) | (1,131) | (24) | (180) | 152 | (2,048) | (1,127) | (343) | (201) | (206) | (171) |
| Finance expense | (855) | (364) | (1,103) | (226) | — | (41) | 1,006 | (491) | (66) | (86) | (60) | (34) | (245) |
| Impairments | (1,855) | 1 | — | — | — | — | 1 | (1,856) | 166 | (3,779) | 449 | — | 1,308 |
1Corporate and reconciling items represent the items to reconcile segment data to consolidated financial statement totals, such as intercompany eliminations and share of results of equity-accounted investees after tax. This does not represent a separate segment as it does not generate revenue
Figures are in millions
| | | | | | | | | | | | | | | | | | | | | | | | | | | | | | | | | | | | | | | | | |
| For the six months ended 30 Jun 2025 (Unaudited) |
| SOUTHERN AFRICA |
| SA rand | Total SA
operations | Total
SA PGM | Rusten-
burg | Marikana | Platinum
Mile | Mimosa | Corporate and re- conciling items1 | Total
SA gold | Drie-
fontein | Kloof | Beatrix | DRD-
GOLD | Corporate and re- conciling items1 |
| Revenue | 41,399 | 24,909 | 12,533 | 11,845 | 531 | 1,009 | (1,009) | 16,490 | 5,357 | 3,013 | 2,931 | 4,076 | 1,113 |
| Underground | 35,129 | 23,814 | 11,785 | 11,845 | 184 | 1,009 | (1,009) | 11,315 | 5,350 | 2,738 | 2,931 | — | 296 |
| Surface | 6,270 | 1,095 | 748 | — | 347 | — | — | 5,175 | 7 | 275 | — | 4,076 | 817 |
| Recycling/processing | — | — | — | — | — | — | — | — | — | — | — | — | — |
| Cost of sales, before amortisation and depreciation | (30,783) | (19,650) | (10,231) | (8,981) | (437) | (913) | 912 | (11,133) | (3,285) | (2,860) | (2,065) | (2,217) | (706) |
| Underground | (26,742) | (18,682) | (9,584) | (8,981) | (116) | (913) | 912 | (8,060) | (3,285) | (2,710) | (2,065) | — | — |
| Surface | (4,041) | (968) | (647) | — | (321) | — | — | (3,073) | — | (150) | — | (2,217) | (706) |
| Recycling/processing | — | — | — | — | — | — | — | — | — | — | — | — | — |
| | | | | | | | | | | | | |
| Adjusted EBITDA | 9,587 | 4,778 | 2,213 | 2,552 | 53 | 97 | (137) | 4,809 | 2,045 | 119 | 850 | 1,841 | (46) |
| | | | | | | | | | | | | |
Capital expenditure | | | | | | | | | | | | | |
| Sustaining capital expenditure | (1,601) | (1,120) | (549) | (561) | (10) | (160) | 160 | (481) | (149) | (108) | (40) | (184) | — |
| Ore reserve development | (2,456) | (1,095) | (349) | (746) | — | — | — | (1,361) | (822) | (433) | (106) | — | — |
| Project capital | (1,435) | (332) | (23) | (309) | — | — | — | (1,103) | — | — | — | (1,103) | — |
| Total capital expenditure | (5,492) | (2,547) | (921) | (1,616) | (10) | (160) | 160 | (2,945) | (971) | (541) | (146) | (1,287) | — |
| | | | | | | | | | | | | |
The following items are disclosed per segment in accordance with IFRS Accounting Standards | | | | | | | | | | | | | |
| Cost of sales before amortisation and depreciation consists of the following: | | | | | | | | | | | | | |
| Salaries and wages | (12,794) | (8,324) | (4,232) | (4,071) | (21) | (12) | 12 | (4,470) | (1,745) | (1,155) | (1,048) | (368) | (154) |
| Consumable stores | (8,344) | (5,686) | (2,757) | (2,829) | (100) | — | — | (2,658) | (653) | (482) | (520) | (686) | (317) |
| Utilities | (5,177) | (2,374) | (1,424) | (949) | (1) | (68) | 68 | (2,803) | (1,181) | (772) | (259) | (261) | (330) |
| Mine contracts | (3,669) | (2,162) | (1,151) | (917) | (94) | — | — | (1,507) | (296) | (290) | (243) | (444) | (234) |
| Recycling costs | — | — | — | — | — | — | — | — | — | — | — | — | — |
| Other | (799) | (1,104) | (667) | (215) | (221) | (833) | 832 | 305 | 590 | (161) | 5 | (458) | 329 |
| Total cost of sales before amortisation and depreciation | (30,783) | (19,650) | (10,231) | (8,981) | (437) | (913) | 912 | (11,133) | (3,285) | (2,860) | (2,065) | (2,217) | (706) |
| | | | | | | | | | | | | |
| Amortisation and depreciation | (3,537) | (1,933) | (920) | (969) | (23) | (232) | 211 | (1,604) | (867) | (374) | (162) | (186) | (15) |
| Finance expense | (1,011) | (408) | (1,181) | (198) | — | (17) | 988 | (603) | (74) | (100) | (62) | (35) | (332) |
| Impairments | (64) | (64) | — | — | — | (599) | 535 | — | — | — | — | — | — |
1Corporate and reconciling items represent the items to reconcile segment data to consolidated financial statement totals, such as intercompany eliminations and share of results of equity-accounted investees after tax. This does not represent a separate segment as it does not generate revenue
Sibanye-Stillwater Operating and financial results | Six months ended 30 June 2026 27
2.2 International and recycling operations
Figures are in millions
| | | | | | | | | | | | | | | | | | | | | | | | | | | | | | | | | | | | | | | | | |
| For the six months ended 30 Jun 2026 (Unaudited) |
| AMERICAS | EUROPE | AUSTRALIA |
| | | | PRIMARY MINING | | RECYCLING | | | | | SECONDARY MINING | |
| SA rand | Total international operations | Total US operations | Total US PGM | US PGM | Total US recycling | Montana | Pennsylvania site and North Carolina site | Total EU
operations | Keliber Oy | Corporate and re- conciling items1 | Total AUS operations | Century zinc retreatment operation | Corporate and re- conciling items1 |
| Revenue | 24,256 | 21,775 | 8,426 | 3,880 | 17,895 | 4,546 | 13,349 | 5 | — | 5 | 2,476 | 2,476 | — |
| Underground | 3,880 | 3,880 | 3,880 | 3,880 | — | — | — | — | — | — | — | — | — |
| Surface | 2,476 | — | — | — | — | — | — | — | — | — | 2,476 | 2,476 | — |
| Recycling/processing | 17,900 | 17,895 | 4,546 | — | 17,895 | 4,546 | 13,349 | 5 | — | 5 | — | — | — |
| Cost of sales, before amortisation and depreciation | (19,496) | (17,921) | (6,664) | (2,721) | (15,200) | (3,943) | (11,257) | (20) | (16) | (4) | (1,555) | (1,555) | — |
| Underground | (2,721) | (2,721) | (2,721) | (2,721) | — | — | — | — | — | — | — | — | — |
| Surface | (1,571) | — | — | — | — | — | — | (16) | (16) | — | (1,555) | (1,555) | — |
| Recycling/processing | (15,204) | (15,200) | (3,943) | — | (15,200) | (3,943) | (11,257) | (4) | — | (4) | — | — | — |
| | | | | | | | | | | | | |
| Adjusted EBITDA | 4,164 | 3,769 | 1,689 | 1,086 | 2,683 | 603 | 2,080 | (443) | (250) | (193) | 838 | 900 | (62) |
| | | | | | | | | | | | | |
Capital expenditure | | | | | | | | | | | | | |
| Sustaining capital expenditure | (246) | (235) | (235) | (227) | (8) | (8) | — | — | — | — | (11) | (6) | (5) |
| Ore reserve development | (689) | (689) | (689) | (689) | — | — | — | — | — | — | — | — | — |
| Project capital | (1,213) | (61) | (61) | (61) | — | — | — | (1,120) | (1,120) | — | (32) | (21) | (11) |
| Total capital expenditure | (2,148) | (985) | (985) | (977) | (8) | (8) | — | (1,120) | (1,120) | — | (43) | (27) | (16) |
| | | | | | | | | | | | | |
The following items are disclosed per segment in accordance with IFRS Accounting Standards | | |
| Cost of sales before amortisation and depreciation consists of the following: | | | | | | | | | | | | | |
| Salaries and wages | (2,177) | (1,864) | (1,578) | (1,578) | (286) | — | (286) | — | — | — | (313) | (313) | — |
| Consumable stores | (1,482) | (1,024) | (935) | (935) | (89) | — | (89) | (17) | (17) | — | (441) | (441) | — |
| Utilities | (455) | (163) | (144) | (144) | (19) | — | (19) | — | — | — | (292) | (292) | — |
| Mine contracts | (491) | (267) | (267) | (267) | — | — | — | (45) | (45) | — | (179) | (179) | — |
| Recycling costs | (14,806) | (14,806) | (3,943) | — | (14,806) | (3,943) | (10,863) | — | — | — | — | — | — |
| Other | (85) | 203 | 203 | 203 | — | — | — | 42 | 46 | (4) | (330) | (330) | — |
| Total cost of sales before amortisation and depreciation | (19,496) | (17,921) | (6,664) | (2,721) | (15,200) | (3,943) | (11,257) | (20) | (16) | (4) | (1,555) | (1,555) | — |
| | | | | | | | | | | | | |
| Amortisation and depreciation | (695) | (676) | (496) | (494) | (182) | (2) | (180) | (12) | (12) | — | (7) | (6) | (1) |
| Finance expense | (915) | (816) | (788) | (788) | (28) | — | (28) | (33) | (19) | (14) | (66) | (60) | (6) |
| Impairments | (1) | — | — | — | — | — | — | (1) | (1) | — | — | — | — |
1Corporate and reconciling items represent the items to reconcile segment data to consolidated financial statement totals, such as intercompany eliminations and share of results of equity-accounted investees after tax. This does not represent a separate segment as it does not generate revenue. Corporate and reconciling items for total EU operations includes Sandouville. During H1 2026, the Group's segment reporting was updated (including comparative periods) to report Keliber Oy separately and consequently report Sandouville as part of corporate and reconciling items
2Included in cost of sales, before amortisation and depreciation is total write-down of inventory to net realisable value amounting to R871 million. This write-down mainly relates to PGM in process and PGM finished goods of R700 million and R171 million, respectively, all relating to the US PGM operations
Figures are in millions
| | | | | | | | | | | | | | | | | | | | | | | | | | | | | | | | | | | | | | | | | |
| For the six months ended 31 Dec 2025 (Unaudited) |
| AMERICAS | EUROPE | AUSTRALIA |
| | | | PRIMARY MINING | RECYCLING | | | | | SECONDARY MINING | |
| SA rand | Total international operations | Total US operations | Total US PGM | US PGM | Total US recycling | Montana | Pennsylvania site and North Carolina site | Total EU
operations | Keliber Oy | Corporate and re- conciling items1 | Total AUS operations | Century zinc retreatment operation | Corporate and re- conciling items1 |
| Revenue | 18,843 | 16,287 | 7,947 | 3,971 | 12,316 | 3,976 | 8,340 | 28 | — | 28 | 2,528 | 2,528 | — |
| Underground | 3,971 | 3,971 | 3,971 | 3,971 | — | — | — | — | — | — | — | — | — |
| Surface | 2,528 | — | — | — | — | — | — | — | — | — | 2,528 | 2,528 | — |
| Recycling/processing | 12,344 | 12,316 | 3,976 | — | 12,316 | 3,976 | 8,340 | 28 | — | 28 | — | — | — |
Cost of sales, before amortisation and depreciation2 | (14,777) | (13,153) | (5,663) | (2,219) | (10,934) | (3,444) | (7,490) | (20) | — | (20) | (1,604) | (1,604) | — |
| Underground | (2,219) | (2,219) | (2,219) | (2,219) | — | — | — | — | — | — | — | — | — |
| Surface | (1,604) | — | — | — | — | — | — | — | — | — | (1,604) | (1,604) | — |
| Recycling/processing | (10,954) | (10,934) | (3,444) | — | (10,934) | (3,444) | (7,490) | (20) | — | (20) | — | — | — |
| | | | | | | | | | | | | |
Adjusted EBITDA | 3,563 | 3,040 | 2,201 | 1,669 | 1,371 | 532 | 839 | (346) | (113) | (233) | 869 | 925 | (56) |
| | | | | | | | | | | | | |
Capital expenditure | | | | | | | | | | | | | |
| Sustaining capital expenditure | (329) | (289) | (243) | (242) | (47) | (1) | (46) | — | — | — | (40) | (38) | (2) |
| Ore reserve development | (598) | (598) | (598) | (598) | — | — | — | — | — | — | — | — | — |
| Project capital | (2,853) | (41) | (41) | (41) | — | — | — | (2,735) | (2,735) | — | (77) | (43) | (34) |
| Total capital expenditure | (3,780) | (928) | (882) | (881) | (47) | (1) | (46) | (2,735) | (2,735) | — | (117) | (81) | (36) |
| | | | | | | | | | | | | |
The following items are disclosed per segment in accordance with IFRS Accounting Standards | | | | | | | | | | | |
| Cost of sales before amortisation and depreciation consists of the following: | | | | | | | | | | | | | |
| Salaries and wages | (2,164) | (1,835) | (1,594) | (1,594) | (241) | — | (241) | — | — | — | (329) | (329) | — |
| Consumable stores | (1,412) | (967) | (905) | (905) | (62) | — | (62) | — | — | — | (445) | (445) | — |
| Utilities | (453) | (170) | (156) | (156) | (14) | — | (14) | — | — | — | (283) | (283) | — |
| Mine contracts | (455) | (275) | (275) | (275) | — | — | — | — | — | — | (180) | (180) | — |
| Recycling costs | (10,617) | (10,617) | (3,444) | — | (10,617) | (3,444) | (7,173) | — | — | — | — | — | — |
| Other | 324 | 711 | 711 | 711 | — | — | — | (20) | — | (20) | (367) | (367) | — |
| Total cost of sales before amortisation and depreciation | (14,777) | (13,153) | (5,663) | (2,219) | (10,934) | (3,444) | (7,490) | (20) | — | (20) | (1,604) | (1,604) | — |
| | | | | | | | | | | | | |
| Amortisation and depreciation | (828) | (815) | (680) | (677) | (138) | (3) | (135) | (12) | (12) | — | (1) | — | (1) |
| Finance expense | (1,036) | (891) | (862) | (862) | (29) | — | (29) | (56) | (49) | (7) | (89) | (82) | (7) |
| Impairments | (2,460) | — | — | — | — | — | — | (2,460) | (2,460) | — | — | — | — |
1Corporate and reconciling items represent the items to reconcile segment data to consolidated financial statement totals, such as intercompany eliminations and share of results of equity-accounted investees after tax. This does not represent a separate segment as it does not generate revenue. Corporate and reconciling items for total EU operations includes Sandouville
2Included in cost of sales, before amortisation and depreciation is total write-down of inventory to net realisable value amounting to R278 million. This write-down mainly relates to PGM in process and PGM finished goods of R222 million and R56 million, respectively, all relating to the US PGM operations
Sibanye-Stillwater Operating and financial results | Six months ended 30 June 2026 28
Figures are in millions
| | | | | | | | | | | | | | | | | | | | | | | | | | | | | | | | | | | | | | | | | |
| For the six months ended 30 Jun 2025 (Unaudited) |
| AMERICAS | EUROPE | Australia |
| | | | PRIMARY MINING | RECYCLING | | | | | SECONDARY MINING | |
| SA rand | Total international operations | Total US operations | Total US PGM | US PGM | Total US recycling | Montana | Pennsylvania site and North Carolina site | Total EU
operations | Keliber Oy | Corporate and re- conciling items1 | Total AUS operations | Century zinc retreatment operation2 | Corporate and re- conciling items1 |
| Revenue | 13,461 | 10,827 | 6,038 | 2,747 | 8,080 | 3,291 | 4,789 | 490 | — | 490 | 2,144 | 2,144 | — |
| Underground | 2,747 | 2,747 | 2,747 | 2,747 | — | — | — | — | — | — | — | — | — |
| Surface | 2,144 | — | — | — | — | — | — | — | — | — | 2,144 | 2,144 | — |
| Recycling/processing | 8,570 | 8,080 | 3,291 | — | 8,080 | 3,291 | 4,789 | 490 | — | 490 | — | — | — |
Cost of sales, before amortisation and depreciation2 | (7,491) | (5,287) | (844) | 70 | (5,357) | (914) | (4,443) | (747) | — | (747) | (1,457) | (1,457) | — |
| Underground | 70 | 70 | 70 | 70 | — | — | — | — | — | — | — | — | — |
| Surface | (1,457) | — | — | — | — | — | — | — | — | — | (1,457) | (1,457) | — |
| Recycling/processing | (6,104) | (5,357) | (914) | — | (5,357) | (914) | (4,443) | (747) | — | (747) | — | — | — |
| | | | | | | | | | | | | |
Adjusted EBITDA | 5,635 | 5,482 | 5,152 | 2,775 | 2,707 | 2,377 | 330 | (430) | (112) | (318) | 583 | 657 | (74) |
| | | | | | | | | | | | | |
Capital expenditure | | | | | | | | | | | | | |
| Sustaining capital expenditure | (176) | (123) | (123) | (121) | (2) | (2) | — | (28) | — | (28) | (25) | (21) | (4) |
| Ore reserve development | (614) | (614) | (614) | (614) | — | — | — | — | — | — | — | — | — |
| Project capital | (3,159) | (94) | (94) | (94) | — | — | — | (3,021) | (3,021) | — | (44) | (12) | (32) |
| Total capital expenditure | (3,949) | (831) | (831) | (829) | (2) | (2) | — | (3,049) | (3,021) | (28) | (69) | (33) | (36) |
| | | | | | | | | | | | | |
The following items are disclosed per segment in accordance with IFRS Accounting Standards | | | | | | | | | | | | | |
| Cost of sales before amortisation and depreciation consists of the following: | | | | | | | | | | | | | |
| Salaries and wages | (2,311) | (1,812) | (1,636) | (1,636) | (176) | — | (176) | (193) | — | (193) | (306) | (306) | — |
| Consumable stores | (1,608) | (966) | (947) | (947) | (19) | — | (19) | (193) | — | (193) | (449) | (449) | — |
| Utilities | (617) | (268) | (258) | (258) | (10) | — | (10) | (50) | — | (50) | (299) | (299) | — |
| Mine contracts | (442) | (219) | (219) | (219) | — | — | — | (88) | — | (88) | (135) | (135) | — |
| Recycling costs | (5,152) | (5,152) | (914) | — | (5,152) | (914) | (4,238) | — | — | — | — | — | — |
| Other | 2,639 | 3,130 | 3,130 | 3,130 | — | — | — | (223) | — | (223) | (268) | (268) | — |
| Total cost of sales before amortisation and depreciation | (7,491) | (5,287) | (844) | 70 | (5,357) | (914) | (4,443) | (747) | — | (747) | (1,457) | (1,457) | — |
| | | | | | | | | | | | | |
| Amortisation and depreciation | (681) | (674) | (572) | (569) | (105) | (3) | (102) | (7) | (5) | (2) | — | — | — |
| Finance expense | (1,055) | (922) | (900) | (900) | (22) | — | (22) | (37) | (24) | (13) | (96) | (90) | (6) |
| Impairments | (9,602) | (4,230) | (4,230) | (4,230) | — | — | — | (5,372) | (5,344) | (28) | — | — | — |
1Corporate and reconciling items represent the items to reconcile segment data to consolidated financial statement totals, such as intercompany eliminations and share of results of equity-accounted investees after tax. This does not represent a separate segment as it does not generate revenue. Corporate and reconciling items for total EU operations includes Sandouville
2Included in cost of sales, before amortisation and depreciation is total write-down of inventory to net realisable value amounting to R1,199 million. This write-down mainly relates to PGM in process and PGM finished goods of R949 million and R250 million, respectively, all relating to the US PGM operations
Sibanye-Stillwater Operating and financial results | Six months ended 30 June 2026 29
3. Revenue
The Group’s sources of revenue are:
| | | | | | | | | | | | | | |
Figures in million - SA rand | | Six months ended |
| | Unaudited | Unaudited | Unaudited |
| | Jun 2026 | Dec 2025 | Jun 2025 |
Primary mining: | | | | |
| Gold mining activities | | 17,147 | 15,516 | 12,414 |
PGM mining activities1 | | 45,920 | 38,787 | 26,781 |
| Nickel refining activities | | 5 | 28 | 490 |
Secondary mining: | | | | |
Zinc retreatment operation2 | | 2,462 | 2,406 | 2,357 |
| Gold tailings retreatment | | 6,106 | 5,053 | 4,076 |
Recycling: | | | | |
| Columbus site recycling activities | | 4,411 | 3,927 | 3,291 |
| Pennsylvania site and North Carolina site recycling activities | | 13,349 | 8,340 | 4,789 |
Other: | | | | |
Stream1 | | 587 | 562 | 737 |
| Total revenue from contracts with customers | | 89,987 | 74,619 | 54,935 |
| Adjustments relating to sales of SA PGM concentrate provisional pricing | | (24) | 169 | 45 |
| Adjustments relating to zinc operation provisional pricing | | 14 | 122 | (213) |
| Total revenue | | 89,977 | 74,910 | 54,767 |
1 The difference between revenue from PGM mining activities above and total revenue from PGM mining activities as disclosed on the segment report relates to the separate disclosure of revenue from the gold and palladium streaming arrangement with Wheaton Precious Metals International (Wheaton International)(Wheaton stream) and the gold and platinum streaming arrangement with Franco-Nevada (Franco-Nevada stream) in the above. Revenue relating to the Wheaton stream and Franco-Nevada stream is incorporated in the Group corporate segment as described in the segment report (see note 2)
2 The difference between revenue from zinc retreatment operations above and total revenue from zinc retreatment operations as disclosed in the segment report relates to the separate disclosure of revenue related to adjustments on the provisional pricing on zinc sales
Revenue recognised per geographical region of the relevant operations:
| | | | | | | | | | | | | | |
Figures in million - SA rand | | Six months ended |
| | Unaudited | Unaudited | Unaudited |
| | Jun 2026 | Dec 2025 | Jun 2025 |
| Southern Africa (SA) | | 66,380 | 56,543 | 41,399 |
| United States (US) | | 21,116 | 15,811 | 10,734 |
| Europe (EU) | | 5 | 28 | 490 |
| Australia (AUS) | | 2,476 | 2,528 | 2,144 |
| Total revenue | | 89,977 | 74,910 | 54,767 |
Percentage of revenue per segment based on the geographical location of customers purchasing from the Group:
| | | | | | | | | | | |
| Six months ended |
| Unaudited | Unaudited | Unaudited |
| Jun 2026 | Dec 2025 | Jun 2025 |
Sibanye-Stillwater Operating and financial results | Six months ended 30 June 2026 30
| | | | | | | | | | | |
| Six months ended |
| Unaudited | Unaudited | Unaudited |
| Jun 2026 | Dec 2025 | Jun 2025 |
| | |
Zinc retreatment (Australia) |
| | |
Pennsylvania site and North Carolina site recycling (US) |
Sibanye-Stillwater Operating and financial results | Six months ended 30 June 2026 31
Revenue generated per product:
| | | | | | | | | | | | | | |
Figures in million - SA rand | | Six months ended |
| | Unaudited | Unaudited | Unaudited |
| | Jun 2026 | Dec 2025 | Jun 2025 |
| Gold | | 31,558 | 26,855 | 20,836 |
| PGMs | | 50,930 | 41,081 | 27,864 |
| Platinum | | 19,871 | 16,085 | 9,744 |
| Palladium | | 11,836 | 11,279 | 7,835 |
| Rhodium | | 14,890 | 10,292 | 7,681 |
| Iridium | | 2,393 | 2,025 | 1,756 |
| Ruthenium | | 1,940 | 1,400 | 848 |
| Chrome | | 1,365 | 2,666 | 2,158 |
| Nickel | | 432 | 491 | 841 |
| Zinc | | 2,223 | 2,328 | 1,998 |
| Silver | | 3,503 | 1,421 | 725 |
Other1 | | (34) | 68 | 345 |
| Total revenue | | 89,977 | 74,910 | 54,767 |
1 Other primarily includes revenue from cobalt sales, copper sales and net streaming revenue
4. Cost of sales
| | | | | | | | | | | | | | |
Figures in million - SA rand | | Six months ended |
| | Unaudited | Unaudited | Unaudited |
| | Jun 2026 | Dec 2025 | Jun 2025 |
| Salaries and wages | | (15,723) | (15,858) | (15,106) |
| Consumable stores | | (11,521) | (10,820) | (9,952) |
| Utilities | | (6,216) | (6,609) | (5,795) |
| Mine contracts | | (4,619) | (4,582) | (4,112) |
| Section 45X credit (relating to 2023 and 2024) | | — | — | 4,403 |
| Section 45X credit (relating to current period primary mining) | | 411 | 441 | 360 |
| Section 45X credit (relating to current period recycling) | | 447 | 392 | 289 |
| Recycling costs | | (15,104) | (10,978) | (7,379) |
| Other | | (6,911) | (5,569) | (4,052) |
| Ore reserve development costs capitalised | | 3,002 | 3,418 | 3,070 |
| Cost of sales, before amortisation and depreciation | | (56,234) | (50,165) | (38,274) |
| Amortisation and depreciation | | (4,219) | (5,149) | (4,218) |
| Total cost of sales | | (60,453) | (55,314) | (42,492) |
5. Finance expense
| | | | | | | | | | | | | | |
Figures in million - SA rand | | Six months ended |
| | Unaudited | Unaudited | Unaudited |
| Note | Jun 2026 | Dec 2025 | Jun 2025 |
| Interest charge on: | | | | |
| Borrowings — interest | 16 | (673) | (871) | (922) |
| - US$1 billion revolving credit facility (RCF) | | (39) | (128) | (105) |
| - R6.5 billion RCF | | (35) | (110) | (138) |
| - 2026 and 2029 Notes | | (354) | (442) | (463) |
| - 2031 Notes | | (64) | — | — |
| - US$ Convertible Bond | | (174) | (185) | (195) |
| - Other borrowings | | (7) | (6) | (21) |
| Borrowings — unwinding of amortised cost | 16 | (398) | (304) | (336) |
| - 2026 and 2029 Notes | | (76) | (42) | (59) |
| - 2031 Notes | | (3) | — | — |
| - US$ Convertible Bond | | (156) | (158) | (160) |
| - Burnstone debt | | (163) | (104) | (117) |
| Lease liabilities | | (21) | (23) | (16) |
| Environmental rehabilitation obligation | | (492) | (491) | (493) |
| Occupational healthcare obligation | | (14) | (17) | (17) |
| Marikana dividend obligation | | (47) | (43) | (42) |
| Deferred revenue | | (531) | (580) | (541) |
| Other | | (88) | (118) | (186) |
| Total finance expense | | (2,264) | (2,447) | (2,553) |
Sibanye-Stillwater Operating and financial results | Six months ended 30 June 2026 32
6. Gain/(loss) on financial instruments
| | | | | | | | | | | | | | |
Figures in million - SA rand | | Six months ended |
| | Unaudited | Unaudited | Unaudited |
| Note | Jun 2026 | Dec 2025 | Jun 2025 |
Fair value loss on gold hedge contracts1 | | — | (958) | (778) |
Fair value (loss)/gain on zinc hedge contracts | | (110) | (66) | 222 |
| Fair value gain/(loss) on share-based payment obligations | | 1 | (289) | (131) |
| Loss on the revised cash flow of the Burnstone debt | 16 | (31) | (1,805) | — |
| (Loss)/gain on revised cash flow of the Marikana dividend obligation | | (98) | (1) | 6 |
| (Loss)/gain on the revised cash flow of the Keliber dividend obligation | | (85) | 290 | 137 |
| Fair value gain on other investments | | 84 | 20 | 165 |
| Other | | 297 | (594) | (12) |
| Total gain/(loss) on financial instruments | | 58 | (3,403) | (391) |
1 On 4 November 2024, SGL concluded a gold hedge agreement, which commenced on 2 December 2024. The agreement was structured at monthly average prices, comprising the delivery of 182,000 ounces of gold over 12 months (14,000 ounces per month) with a zero cost collar which established a floor and cap of R45,000 and R58,500 per ounce, respectively. On 9 December 2024, SGL concluded an additional gold hedge agreement, which commenced on 2 January 2025. The agreement was structured at monthly average prices, comprising the delivery of 168,000 ounces of gold over 12 months (14,000 ounces per month) with a zero cost collar which established a floor and cap of R45,000 and R54,400 per ounce, respectively. As hedge accounting is not applied, resulting gains or losses are accounted for as gains or losses on financial instruments in profit or loss. The fair value loss is included in the corporate and reconciling items of the SA gold section of the segment report
7. Other costs and other income
7.1 Other costs
| | | | | | | | | | | | | | |
Figures in million - SA rand | | Six months ended |
| | Unaudited | Unaudited | Unaudited |
| | Jun 2026 | Dec 2025 | Jun 2025 |
Care and maintenance1 | | (862) | (1,099) | (662) |
| Corporate and social investment costs | | (104) | (190) | (162) |
| Cost incurred on employee and community trusts | | (310) | (256) | (108) |
| Exploration costs | | (1) | (2) | (2) |
| Non-mining royalties | | (15) | 8 | (28) |
| Change in estimate of environmental rehabilitation obligation | | (65) | (798) | — |
| Service entity costs | | — | (205) | (165) |
| Other | | (828) | (608) | (532) |
| Total other costs | | (2,185) | (3,150) | (1,659) |
1 Care and maintenance costs mainly includes Cooke (included in the gold corporate and reconciling segment) amounting to R527 million, R652 million and R480 million for the six months ended 30 June 2026, 31 December 2025 and 30 June 2025, respectively, Burnstone (included in the gold corporate and reconciling segment) amounting to R107 million, R117 million and R89 million for the six months ended 30 June 2026, 31 December 2025 and 30 June 2025, respectively, and Sandouville amounting to R128 million and R194 million for the six months ended 30 June 2026 and 31 December 2025, respectively
7.2 Other income
| | | | | | | | | | | | | | |
Figures in million - SA rand | | Six months ended |
| | Unaudited | Unaudited | Unaudited |
| | Jun 2026 | Dec 2025 | Jun 2025 |
| Change in estimate of environmental rehabilitation obligation | | — | 205 | 98 |
| Service entity income | | 159 | 168 | 154 |
| Sundry income | | 87 | 161 | 175 |
| Insurance proceeds | | 24 | 186 | 88 |
| Onerous contract provision utilisation/change in estimate | | — | — | 124 |
| Gain on early settlement of 2026 and 2029 Notes | | 46 | — | — |
| Gain on assets held for sale | | — | 16 | — |
| Gain/increase in equity-accounted investment | | 8 | 5 | — |
| Total other income | | 324 | 741 | 639 |
8. Impairments
The Group performed impairment testing for cash-generating units (CGUs) where indicators of impairment were present during the period ended 30 June 2026. The following impairments were recognised:
| | | | | | | | | | | | | | |
Figures in million - SA rand | | Six months ended |
| | Unaudited | Unaudited | Unaudited |
| | Jun 2026 | Dec 2025 | Jun 2025 |
Impairment of mining assets and goodwill | | (18) | (6,223) | (9,602) |
| Impairment of right-of-use assets - mining assets | | — | (16) | — |
| Impairment reversal of mining assets and goodwill | | — | 1,924 | — |
| Impairment of investment in equity-accounted investee | | — | — | (64) |
Other impairment | | — | (26) | — |
Total impairments | | (18) | (4,341) | (9,666) |
Results of impairment assessments for the Group's CGUs
Other than the impairment reversal to Mimosa described in note 12, no further significant impairment losses or reversals of previously recognised impairment losses were identified for any of the Group's other CGUs for which impairment indicators were present. However, a review of the carrying value of the US PGM operations (Stillwater CGU) was performed for the period ended 30 June 2026, based on the medium-term structural decline in palladium demand and the removal of the Stillwater West operation from the 5-year mining plan. The revised mining methodology involves a change to more mechanised mining which is expected to be completed by the second half of 2028. This methodology is expected to
Sibanye-Stillwater Operating and financial results | Six months ended 30 June 2026 33
deliver increased productivity levels resulting in a reduction in unit costs and deferral of capital expenditure. The assumptions of the revised methodology will be monitored for possible reversal of previous recognised impairment losses or further impairment losses, as applicable.
A review of the carrying value of the Keliber project was also performed for the period ended 30 June 2026. This review was based on the increase in the lithium prices over the short- and medium term, commencement of the start and staged ramp-up of operations with the mining operations commencing during the first quarter and the concentrator operations during the second quarter. A decision to advance the refinery ramp-up, or pause this ramp-up and continue selling spodumene for a period of time, is expected during the last quarter of 2026. Progress with the ramp-up of the operations, certain targeted optimisation opportunities to achieve a reduction of US$1,000/t in operating costs and the lithium market will be monitored for possible reversal of previous recognised impairment losses, or the need for further impairment losses, if applicable.
9. Mining and income tax and royalties
9.1 Mining and income tax
| | | | | | | | | | | | | | |
Figures in million - SA rand | | Six months ended |
| | Unaudited | Unaudited | Unaudited |
| | Jun 2026 | Dec 2025 | Jun 2025 |
| Tax on profit before tax at maximum South African statutory company tax rate (27%) | | (7,050) | (543) | 654 |
| South African gold mining tax formula rate adjustment | | (204) | (155) | (14) |
| US statutory tax rate adjustment | | 131 | (21) | (6) |
| US state tax adjustment | | (61) | 41 | (17) |
Non-taxable Section 45X credit | | 245 | 306 | 1,364 |
| Non-taxable dividend received | | — | 4 | 2 |
Non-deductible finance expense | | (31) | (34) | (67) |
| Non-deductible share-based payments | | (5) | (7) | (4) |
| Non-taxable gain on fair value of financial instruments | | (18) | 8 | 32 |
| Non-taxable gain/(non-deductible loss) on foreign exchange differences | | 37 | (7) | (6) |
| Non-taxable/(non-deductible) share of results of equity-accounted investees | | 443 | 208 | (114) |
| Non-deductible impairments | | — | 5 | (18) |
| Non-deductible transaction costs | | — | (1,001) | (47) |
| Tax adjustment in respect of prior periods | | — | (30) | (16) |
| Net other non-taxable income and non-deductible expenditure | | (87) | 462 | 130 |
| Change in estimated deferred tax rate | | (9) | (88) | (15) |
Deferred tax assets unrecognised or derecognised1 | | (696) | (1,991) | (3,343) |
| Mining and income tax | | (7,305) | (2,843) | (1,485) |
| Effective tax rate | | 28 | % | 141 | % | (61 | %) |
1 The amount for the six months ended 30 June 2026 relates mainly to unrecognised deferred tax assets at the US PGM operations, Sandouville, Burnstone, Keliber and Cooke amounting to R571 million. The amount for the six months ended 30 June 2025 related mainly to unrecognised deferred tax assets at the US PGM operations, Keliber and Cooke amounting to R1,632 million, R1,478 million and R118 million, respectively
9.2 Royalties
| | | | | | | | | | | | | | |
Figures in million - SA rand | | Six months ended |
| | Unaudited | Unaudited | Unaudited |
| | Jun 2026 | Dec 2025 | Jun 2025 |
Current charge | | (1,668) | (931) | (288) |
| SA gold royalties | | (366) | (142) | (60) |
| SA PGM royalties | | (1,184) | (656) | (129) |
| Australian royalties | | (118) | (133) | (99) |
| Prior year royalty tax adjustment | | — | 3 | 71 |
Total royalties | | (1,668) | (928) | (217) |
10. Earnings per share
10.1 Basic earnings per share
| | | | | | | | | | | | | | |
| | Six months ended |
| | Unaudited | Unaudited | Unaudited |
| | Jun 2026 | Dec 2025 | Jun 2025 |
| Ordinary shares in issue (’000) | | 2,830,567 | 2,830,567 | 2,830,567 |
| | | | |
| Adjusted weighted average number of shares (’000) | | 2,830,567 | 2,830,567 | 2,830,567 |
| Profit/(loss) attributable to owners of Sibanye-Stillwater (SA rand million) | | 17,745 | (1,580) | (3,591) |
| Basic earnings per share (EPS) (cents) | | 627 | (56) | (127) |
Sibanye-Stillwater Operating and financial results | Six months ended 30 June 2026 34
10.2 Diluted earnings per share
The assumed conversion of the US$ Convertible bond was dilutive in respect of basic earnings per share for the six months ended 30 June 2026, however the convertible bonds were anti-dilutive for all other periods presented.
| | | | | | | | | | | | | | |
Figures in million - SA rand unless otherwise stated | | Six months ended |
| | Unaudited | Unaudited | Unaudited |
| | Jun 2026 | Dec 2025 | Jun 2025 |
| Diluted earnings | | | | |
| Profit/(loss) attributable to owners of Sibanye-Stillwater (SA rand million) | | 17,745 | (1,580) | (3,591) |
| Adjusted for impact of US$ Convertible bond: | | 291 | — | — |
| - Interest charge and unwinding of amortised cost | | 330 | — | — |
| - Tax effect | | (39) | — | — |
| Diluted earnings | | 18,036 | (1,580) | (3,591) |
| | | | |
| Weighted average number of shares | | | | |
| Adjusted weighted average number of shares (’000) | | 2,830,567 | 2,830,567 | 2,830,567 |
| Potential ordinary shares - US$ Convertible bond (’000) | | 383,024 | — | — |
| Diluted weighted average number of shares (’000) | | 3,213,591 | 2,830,567 | 2,830,567 |
| Diluted earnings per share (DEPS) (cents) | | 561 | (56) | (127) |
10.3 Headline earnings per share
| | | | | | | | | | | | | | |
Figures in million - SA rand unless otherwise stated | | Six months ended |
| | Unaudited | Unaudited | Unaudited |
| | Jun 2026 | Dec 2025 | Jun 2025 |
| Profit/(loss) attributable to owners of Sibanye-Stillwater | | 17,745 | (1,580) | (3,591) |
| (Gain)/loss on disposal of property, plant and equipment | | (51) | 30 | (16) |
| Impairments of mining assets and goodwill | | 18 | 4,341 | 9,666 |
| (Impairment reversal)/impairment recognised by equity-accounted investee, net of tax | | (581) | — | 461 |
| Gain on assets held for sale | | — | (16) | — |
| Foreign exchange movement recycled through profit or loss | | (138) | 13 | 4 |
| Compensation for losses incurred | | (9) | (75) | (67) |
| Tax effect of the items adjusted above | | 15 | (675) | (4) |
| NCI effect of the items listed above | | 3 | (498) | (1,081) |
| Headline earnings | | 17,002 | 1,540 | 5,372 |
| Adjusted weighted average number of shares (’000) | | 2,830,567 | 2,830,567 | 2,830,567 |
| Headline EPS (cents) | | 601 | 54 | 190 |
10.4 Diluted headline earnings per share
The assumed conversion of the US$ Convertible bond was dilutive in respect of headline earnings per share for the six months ended 30 June 2026 and six months ended 30 June 2025, however the convertible bonds were anti-dilutive for the six months ended 31 December 2025.
| | | | | | | | | | | | | | |
Figures in million - SA rand unless otherwise stated | | Six months ended |
| | Unaudited | Unaudited | Unaudited |
| | Jun 2026 | Dec 2025 | Jun 2025 |
| Headline earnings | | 17,002 | 1,540 | 5,372 |
| Adjusted for impact of the US$ Convertible bond: | | 291 | — | 311 |
| - Interest charge and unwinding of amortised cost | | 330 | — | 355 |
| - Tax effect | | (39) | — | (44) |
| Diluted headline earnings | | 17,293 | 1,540 | 5,683 |
| | | | |
| Adjusted weighted average number of shares (’000) | | 2,830,567 | 2,830,567 | 2,830,567 |
| Potential ordinary shares - US$ Convertible Bond ('000) | | 383,024 | — | 374,056 |
| Diluted weighted average number of shares (’000) | | 3,213,591 | 2,830,567 | 3,204,623 |
| Diluted headline EPS (cents) | | 538 | 54 | 177 |
11. Dividends
Dividend policy
The Group’s dividend policy is to return between 25% to 35% of normalised earnings to shareholders and after due consideration of future requirements the Board may declare a higher or lower dividend than determined according to this range. Normalised earnings is defined as earnings attributable to the owners of Sibanye-Stillwater, excluding gains and losses on financial instruments and foreign exchange differences, impairments and related compensation, impairment reversals, gain/loss on disposal of property, plant and equipment, occupational healthcare expenses, restructuring costs, transactions costs, share-based payment expenses on B-BBEE transactions, gains on acquisitions, net other business development costs, share of results of equity-accounted investees, all after tax and after the impact of non-controlling interest, and changes in the estimated deferred tax rates.
In line with Sibanye-Stillwater’s dividend policy and its Capital Allocation Framework, the Board of Directors resolved to declare an interim dividend of 201 SA cents per share. The dividend amounts to a payout of 35% of normalised earnings for the six months ended 30 June 2026.
Sibanye-Stillwater Operating and financial results | Six months ended 30 June 2026 35
| | | | | | | | | | | | | | |
Figures in million - SA rand | | Six months ended |
| | Unaudited | Unaudited | Unaudited |
| | Jun 2026 | Dec 2025 | Jun 2025 |
| Profit/(loss) attributable to the owners of Sibanye-Stillwater | | 17,745 | (1,580) | (3,591) |
| Adjusted for: | | | | |
| (Gain)/loss on financial instruments | | (58) | 3,403 | 391 |
| (Gain)/loss on foreign exchange differences | | (63) | 6 | (161) |
| (Gain)/loss on disposal of property, plant and equipment | | (51) | 30 | (16) |
| Impairments | | 18 | 4,341 | 9,666 |
Restructuring costs | | 153 | 5 | 242 |
| Transaction and project costs | | 150 | 4,125 | 418 |
| Occupational healthcare loss | | — | 46 | 3 |
| Gain/increase in equity-accounted investment | | (8) | (5) | — |
| Gain on assets held for sale | | — | (16) | — |
| Change in estimated deferred tax rate | | 9 | 88 | 15 |
| Gain on early settlement of 2026 and 2029 Notes | | (46) | — | — |
| Share of results of equity-accounted investees after tax | | (1,641) | (769) | 432 |
| Corporate strategy and leadership costs | | 55 | 41 | 9 |
| Compensation for losses incurred | | (9) | (75) | (67) |
| Section 45X credits recognised for 2023 and 2024 | | — | — | (4,403) |
| Tax effect of the items adjusted above | | 98 | (707) | (168) |
| NCI effect of the items listed above | | (109) | (202) | (938) |
Normalised earnings1 | | 16,243 | 8,731 | 1,832 |
1 Normalised earnings, as defined and reconciled above, is not a measure of performance under IFRS Accounting Standards, may not be comparable to similarly titled measures of other companies, and should not be considered in isolation or as alternatives to profit before tax, profit for the year, cash from operating activities or any other measure of financial performance presented in accordance with IFRS Accounting Standards
12. Equity-accounted investments
| | | | | | | | | | | | | | |
Figures in million - SA rand | | Six months ended |
| | Unaudited | Unaudited | Unaudited |
| | Jun 2026 | Dec 2025 | Jun 2025 |
| Rand Refinery | | 1,708 | 1,282 | 1,008 |
Mimosa1 | | 4,424 | 3,784 | 3,700 |
| Peregrine | | 1,312 | 1,191 | 1,285 |
| Other equity-accounted investments | | 310 | 303 | 348 |
| Total equity-accounted investments | | 7,754 | 6,560 | 6,341 |
1 Mimosa's updated life-of-mine indicated an increase in the expected future net cash flows due to increased commodity prices since 31 December 2025. The higher recoverable amount led to an after tax equity-accounted impairment reversal of property, plant and equipment amounting to R783 million, before the impact of deferred tax (net an impairment reversal of R581 million) (included in SA PGM on the segment report — see note 2). The assumptions applied in the fair value less cost to sell impairment calculation as well as the recoverable amount for Mimosa are set out below:
| | | | | | | | |
| | Unaudited |
Average PGM (4E) basket price1 | R/4Eoz | 29,934 |
Nominal discount rate2 | % | 22.32 |
Life-of-mine3 | years | 7 |
| Recoverable amount | R' million | 2,468 |
1 The weighted average commodity prices and exchange rate were derived by considering various bank and commodity broker consensus forecasts
2 The nominal discount rate is calculated as the weighted average cost of capital of the CGU
3 Periods longer than five years for inclusion in the impairment test are considered appropriate based on the nature of the operations since a formally approved life-of-mine plan is used to determine cash flows over the life of the mine based on the available reserves
13. Other receivables
| | | | | | | | | | | | | | |
Figures in million - SA rand | | Six months ended |
| | Unaudited | Unaudited | Unaudited |
| | Jun 2026 | Dec 2025 | Jun 2025 |
| Rates and taxes receivable | | 55 | 93 | 94 |
| Pre-paid royalties | | 275 | 282 | 289 |
| Section 45X credit receivable | | 6,739 | 5,858 | 5,139 |
| Other | | 299 | 511 | 258 |
| Total other receivables | | 7,368 | 6,744 | 5,780 |
| Reconciliation of the non-current and current portion of the other receivables: | | | | |
| Current portion of other receivables | | (2,683) | (4,816) | (4,876) |
| Non-current portion of other receivables | | 4,685 | 1,928 | 904 |
14. Inventories
| | | | | | | | | | | | | | |
Figures in million - SA rand | | Six months ended |
| | Unaudited | Unaudited | Unaudited |
| | Jun 2026 | Dec 2025 | Jun 2025 |
| PGM in process | | 19,572 | 17,748 | 17,518 |
| Gold in process | | 734 | 730 | 1,494 |
| PGM finished goods | | 6,327 | 7,028 | 5,202 |
| Other | | 5,198 | 5,974 | 4,121 |
| Total inventories | | 31,831 | 31,480 | 28,335 |
Sibanye-Stillwater Operating and financial results | Six months ended 30 June 2026 36
15. Assets and associated liabilities classified as held for sale
As part of the Group's refreshed strategy, which includes portfolio simplification, management are pursuing the disposal of certain non-core investments. Considering the requirements of IFRS 5 Non-current Assets Held for Sale and Discontinued Operations (IFRS 5), equity investments with a fair value of R254 million previously included in “other investments”, were classified as held for sale during the period ended 30 June 2026. The sales prices are subject to prevailing market conditions and customary requirements associated with such disposals and the sales are expected to be completed within one year following the reporting date.
The transaction to sell the Beatrix 4 shaft, which forms part of the Beatrix gold operations and includes the Beisa uranium project, to Neo Energy Metals Plc. (Neo Energy) for a total transaction consideration of R500 million, comprising R250 million in cash and R250 million in newly issued shares in Neo Energy is still subject to certain outstanding conditions precedent. As a result of delays in obtaining certain regulatory approvals, the Group and Neo Energy agreed to extend the timeline up to 6 June 2027 for final approvals to be obtained. The assets and liabilities associated with the transaction remain classified as held for sale in accordance with the requirements of IFRS 5. Neo Energy will assume responsibility for all Beatrix 4 shaft rehabilitation and environmental liabilities, which amounts to a carrying value of R495 million (2025: R480 million). Property, plant and equipment of R30 million relating to the Beatrix 4 shaft disposal is included in assets held for sale at 30 June 2026.
The assets presented as assets held for sale were measured at the lower of the carrying values and fair value less cost to sell, where applicable.
16. Borrowings
| | | | | | | | | | | | | | |
Figures in million - SA rand | | Six months ended |
| | Unaudited | Unaudited | Unaudited |
| Notes | Jun 2026 | Dec 2025 | Jun 2025 |
| Balance at beginning of the period | | 43,257 | 42,411 | 41,687 |
| Loans raised | | 8,601 | 4,828 | 3,084 |
| R6.5 billion RCF | | — | 2,500 | 500 |
| Keliber facility | | — | 1,983 | 1,868 |
| 2031 Notes | | 8,075 | — | — |
| Other borrowings | | 526 | 345 | 716 |
| Loans repaid | | (14,822) | (3,355) | (1,528) |
| R6.5 billion RCF | | (2,500) | (3,000) | (500) |
| 2026 and 2029 Notes | | (12,314) | — | — |
| Other borrowings | | (8) | (355) | (1,028) |
| Unwinding of loans recognised at amortised cost | 5 | 398 | 304 | 336 |
| Accrued interest | 5 | 673 | 871 | 922 |
| Accrued interest paid | | (855) | (1,036) | (1,050) |
Gain on early settlement of 2029 Notes | | (46) | — | — |
| Loss on the revised cash flow of the Burnstone debt | 6 | 31 | 1,805 | — |
| Keliber borrowing costs capitalised | | 222 | 226 | 183 |
| Gain on foreign exchange differences and foreign currency translation | | (682) | (2,797) | (1,223) |
| Balance at end of the period | | 36,777 | 43,257 | 42,411 |
Borrowings consist of:
| | | | | | | | | | | | | | |
Figures in million - SA rand | | Six months ended |
| | Unaudited | Unaudited | Unaudited |
| | Jun 2026 | Dec 2025 | Jun 2025 |
US$1 billion RCF | | — | — | — |
R6.5 billion RCF1 | | — | 2,500 | 3,000 |
| 2026 and 2029 Notes | | 7,329 | 19,824 | 21,214 |
| 2031 Notes | | 8,098 | — | — |
| US$ Convertible bond | | 7,367 | 7,291 | 7,657 |
Burnstone debt | | 4,156 | 4,005 | 2,254 |
| Keliber facility | | 9,229 | 9,547 | 8,173 |
Other borrowings2 | | 598 | 90 | 113 |
| Borrowings | | 36,777 | 43,257 | 42,411 |
| Current portion of borrowings | | (263) | (11,402) | (275) |
| Non-current borrowings | | 36,514 | 31,855 | 42,136 |
1 The R6.5 billion RCF is affected by the IBOR reform amendments to IFRS Accounting Standards, which came into effect on 1 January 2021. The R6.5 billion RCF is linked to the JIBAR for the foreseeable future and will transition to a new interest rate prior to the date on which the JIBAR will no longer be available for use. At 30 June 2026, there is no significant impact on the Group as a result of IBOR reform in respect of the R6.5 billion RCF and the Group will assess any potential impact when the facility is transitioned to a new rate in the future
2 Other borrowings consist mainly of overnight facilities, working capital and overdraft borrowings facilities at Keliber, Century and Reldan
US$500 million Senior Notes offering and cash tender offers for the 2026 and 2029 Notes
On 15 May 2026, Sibanye-Stillwater, through its wholly-owned subsidiary, Sibanye-Stillwater UK Financing Plc (Sibanye UK Financing), issued new US$500 million senior notes due 2031 (2031 Notes). The 2031 Notes were issued as a single tranche of US$500 million, maturing five and a half years from issue date and a coupon of 6.25% per annum. At the same time, the Group commenced two tender offers to purchase for cash, any and all of the outstanding 2026 Notes (Any and All Tender Offer) and up to a maximum capped amount of US$75 million of the 2029 Notes (Capped Tender Offer). The tender offers were funded from existing cash of the Group, including through Sibanye UK Financing's new US$500 million senior notes issued.
The following table sets forth the outcome of these tender offers:
| | | | | | | | | | | |
Title of security | Aggregate principal amount outstanding before the tender offers | Aggregate principal amount of 2026 and 2029 Notes validly tendered | Aggregate principal amount of 2026 and 2029 Notes accepted for purchase |
2026 Notes | US$675 million | US$613.9 million | US$613.9 million |
2029 Notes | US$525 million | US$175.6 million | US$75 million |
Sibanye-Stillwater Operating and financial results | Six months ended 30 June 2026 37
As more than 90% of the 2026 Notes were initially validly tendered at or prior to the Any and All Tender Offer expiration date and not validly withdrawn, the Group also commenced to redeem all remaining outstanding 2026 Notes (US$61.1 million principal amount), together with accrued and unpaid interest, which concluded during H1 2026.
The Group's net cash payments resulting from the above amounted to R4,239 million. The cash proceeds from the 2031 Notes amounting to R8,075 million and the cash payments for the tender offers amounting to R12,314 million were settled on a net basis.
16.1 Capital management
The following are contractually due, undiscounted cash flows resulting from maturities of borrowings, including interest payments:
| | | | | | | | | | | | | | | | | | | | | | | |
Figures in million - SA rand | | | | | | | |
| | Total | Within one year | Between one and two years | Between two and three years | Between three and five years | After five years |
| 30 June 2026 (Unaudited) | | | | | | | |
| - Capital | | | | | | | |
| 2029 Notes | | 7,376 | — | — | — | 7,376 | — |
| US$ Convertible bond (2028) | | 8,195 | — | — | 8,195 | — | — |
| 2031 Notes | | 8,195 | — | — | — | — | 8,195 |
| Burnstone debt | | 2,915 | — | — | 111 | 16 | 2,788 |
| Keliber facility | | 9,360 | — | 1,413 | 1,930 | 4,214 | 1,803 |
| Other borrowings | | 605 | 13 | 12 | 12 | 21 | 547 |
| - Interest | | 15,234 | 1,569 | 1,555 | 1,301 | 1,705 | 9,104 |
| Total | | 51,880 | 1,582 | 2,980 | 11,549 | 13,332 | 22,437 |
Net debt to adjusted EBITDA
| | | | | | | | | | | | | | |
Figures in million - SA rand | | Rolling 12 months |
| | Unaudited | Unaudited | Unaudited |
| | Jun 2026 | Dec 2025 | Jun 2025 |
Adjusted borrowings1 | | 32,104 | 39,252 | 40,157 |
Adjusted cash and cash equivalents2 | | 22,386 | 17,129 | 20,966 |
Net debt3 | | 9,718 | 22,123 | 19,191 |
Adjusted EBITDA4 (12 months) | | 54,570 | 37,800 | 21,513 |
Net debt to adjusted EBITDA (ratio)5 | | 0.18 | 0.59 | 0.89 |
1Adjusted borrowings are only those borrowings that have recourse to Sibanye-Stillwater. Borrowings are therefore adjusted to exclude the Burnstone debt and the Finnish Minerals Group (FMG) shareholder loan
2Cash and cash equivalents exclude cash of Burnstone
3Net debt represents borrowings and bank overdraft less cash and cash equivalents. Borrowings are only those borrowings that have recourse to Sibanye-Stillwater and, therefore, excludes the Burnstone debt and subsidiary subordinated debt funding from minority shareholders. Net debt excludes cash of Burnstone
4See note 19
5Net debt to adjusted EBITDA ratio is defined as net debt at the end of a reporting period divided by adjusted EBITDA of the 12 months ended on the same reporting date. This measure is not a measure of performance under IFRS Accounting Standards. As a result, it may not be comparable to similarly titled measures of other companies, and should not be considered in isolation or as alternatives to any other measure of financial performance presented in accordance with IFRS Accounting Standards
17. Other payables
| | | | | | | | | | | | | | |
Figures in million - SA rand | | |
| | Unaudited | Unaudited | Unaudited |
| | Jun 2026 | Dec 2025 | Jun 2025 |
| Marikana dividend obligation | | 791 | 810 | 766 |
| Keliber dividend obligation | | 85 | — | 298 |
| Metal consignment facility | | 983 | 1,667 | 1,092 |
| NCI put liability | | 95 | 96 | 103 |
| Hedge derivative liability | | 113 | 468 | 729 |
| Other | | 716 | 640 | 1,015 |
| Other payables | | 2,783 | 3,681 | 4,003 |
| Current portion of other payables | | (1,329) | (2,279) | (2,274) |
| Non-current other payables | | 1,454 | 1,402 | 1,729 |
Metal consignment facility
To fund supplier payments and mitigate commodity-price exposure throughout the processing period, the Recycling operations utilise a metal consignment facility. Upon agreeing with a supplier the quantity and value of metals to be purchased based on prevailing metal prices and negotiated commercial terms, the operations borrow an equivalent quantity of metal from a financial institution under this facility and immediately sell it at prevailing market prices to fund the supplier settlement. In certain circumstances, the borrowed metal may instead be transferred directly to the supplier as settlement. The underlying material purchased from the suppliers are subsequently processed internally or through third-party service providers, and the equivalent of the borrowed metal is returned to the financial institution upon completion and in settlement of the borrowed metals. By matching the quantity of metal borrowed with the quantity purchased and ultimately returned, the consignment facility serves as both a working-capital financing mechanism and a means of mitigating commodity-price exposure during the period between supplier settlement and final metal recovery. The metal consignment facility does not establish or alter the commercial margin earned on the underlying transaction. The Recycling operations retain the risks associated with recovery, processing efficiency, timing, and differences between estimated and actual metal recovered. The physical metal in the process serves as collateral for the outstanding borrowings.
This liability is measured at fair value based on the quantity of metal borrowed and prevailing commodity prices at each reporting date, with changes in fair value recognised in profit or loss. These fair value movements are economically offset by corresponding changes in the value of the underlying metal position, with the related effects ultimately realised as the processed metal is sold.
The movement in the metal consignment facility is presented below:
Sibanye-Stillwater Operating and financial results | Six months ended 30 June 2026 38
| | | | | | | | | | | | | | |
Figures in million - SA rand | | Six months ended |
| | Unaudited | Unaudited | Unaudited |
| | Jun 2026 | Dec 2025 | Jun 2025 |
| Balance at the beginning of the period | | 1,667 | 1,092 | 855 |
| Non-cash advances received | | 735 | 854 | 368 |
| Cash advances received | | 7,399 | 4,532 | 3,453 |
| Settlements (cash) | | (620) | (654) | (475) |
| Settlements through delivery of metals (non-cash) | | (8,123) | (4,519) | (3,126) |
| (Gain)/loss on commodity price movements | | (62) | 461 | 73 |
| Foreign currency translation reserve | | (12) | (99) | (56) |
| Balance at end of the period | | 984 | 1,667 | 1,092 |
18. Fair value of financial assets and financial liabilities, and risk management
18.1 Measurement of fair value
The Group uses the following hierarchy for determining and disclosing the fair value of financial instruments:
•Level 1: unadjusted quoted prices in active markets for identical assets or liabilities
•Level 2: inputs other than quoted prices in level 1 that are observable for the asset or liability, either directly (as prices) or indirectly (derived from prices)
•Level 3: inputs for the asset or liability that are not based on observable market data (unobservable inputs)
The following table sets out the Group’s significant financial instruments measured at fair value by level within the fair value hierarchy:
| | | | | | | | | | | | | | | | | | | | | | | | | | | | | |
Figures in million - SA rand | | | | | | | | | |
| Unaudited | Unaudited | Unaudited |
| Jun 2026 | Dec 2025 | Jun 2025 |
| Level 1 | Level 2 | Level 3 | Level 1 | Level 2 | Level 3 | Level 1 | Level 2 | Level 3 |
| Financial assets measured at fair value | | | | | | | | | |
Environmental rehabilitation obligation funds1 | — | 4,032 | — | — | 3,915 | — | — | 3,878 | — |
Trade receivables - PGM concentrate sales2 | — | 1,419 | — | — | 1,286 | — | — | 1,029 | — |
Trade receivables - Zinc provisional price sales2 | — | 265 | — | — | 84 | — | — | 241 | — |
Other investments3 | 1,783 | 955 | 1,334 | 1,968 | 752 | 1,287 | 1,307 | 630 | 1,223 |
Zinc hedge contracts4 | — | — | — | — | — | — | — | 19 | — |
Financial liabilities measured at fair value | | | | | | | | | |
Gold hedge contracts4 | — | — | — | — | 453 | — | — | 729 | — |
Zinc hedge contracts4 | — | 113 | — | — | 15 | — | — | — | — |
Other hedge contracts5 | — | — | — | — | 80 | — | — | — | — |
Metal consignment facility6 | 983 | — | — | 1,667 | — | — | 1,092 | — | — |
1 Environmental rehabilitation obligation funds presented in the condensed consolidated statement of financial position, comprise a fixed income portfolio of bonds, rehabilitation policies, investment in a cell captive as well as fixed and notice deposits. The environmental rehabilitation obligation funds, not measured at amortised cost, are stated at fair value based on the nature of the fund’s investments. For investments measured at fair value classified as level 2, the fair value is determined through valuation techniques that include inputs other than quoted prices in level 1 that are observable for the asset, either directly or indirectly. The valuation techniques applied make reference to the net asset value of the underlying assets in the relevant policy or cell captive, adjusted for any entity-specific risk. These underlying assets comprise predominantly money-market and similar highly liquid investments for which the carrying values approximate fair value
2 The fair value for trade receivables measured at fair value through profit or loss are determined based on ruling market prices, volatilities and interest rates
3 The fair values of listed investments are based on the quoted prices available from the relevant stock exchanges. The carrying amounts of other short-term investment products with short maturity dates approximate fair value. The fair values of non-listed investments are determined through valuation techniques that include inputs that are not based on observable market data. These inputs include price/book ratios as well as marketability and minority shareholding discounts which are impacted by the size of the shareholding. The level 3 balance consists primarily of an investment in Verkor, the value of which is supported by a range of values determined through multi-criteria valuation analysis which includes valuation techniques such as an income valuation approach which indicates the value of Verkor based on its expected future cash flows and trading multiples. These valuation techniques use several key assumptions, including discount rate (8.8%), growth rate (2.5%) and EV multiples. The fair value estimate of Verkor is sensitive to changes in the key assumptions, for example, increases in the market related discount rate and decreases in the growth rate and EV multiples would decrease the fair value if all other inputs remain unchanged. The extent of the fair value changes would depend on how inputs change in relation to each other. The difference between other investments in the statement of financial position and the table above, relates to investments measured at amortised cost, with carrying amounts that approximate fair values
4 The fair value of the gold hedges are determined using a Monte Carlo simulation model based on market forward prices, volatilities and interest rates. The fair value of the zinc hedge is determined by using a Monte Carlo simulation model based on historical zinc market spot and forward prices, volatilities and interest rates and the relevant foreign exchange forward curve data
5 Consists of platinum, palladium and silver hedge contracts and the fair value is determined using a Monte Carlo simulation model based on market forward prices, volatilities and interest rates
6 The fair value of the metal consignment facility at the reporting date was calculated based on the spot prices of the relevant metals owed to the financial institution
The table below summarises the movement in financial assets and financial liabilities classified as level 3 in the table above:
| | | | | | | | | | | | | | |
Figures in million - SA rand | | Six months ended |
| | Unaudited | Unaudited | Unaudited |
| | Jun 2026 | Dec 2025 | Jun 2025 |
| Financial assets measured at fair value | | | | |
| Balance at the beginning of the period | | 1,287 | 1,223 | 1,151 |
| Fair value movement recognised in profit or loss | | (45) | (34) | 39 |
| Fair value movement recognised in other comprehensive income | | 92 | 98 | 33 |
| Balance at the end of the period | | 1,334 | 1,287 | 1,223 |
| | | | |
Sibanye-Stillwater Operating and financial results | Six months ended 30 June 2026 39
Fair value of financial instruments
The table below shows the fair value and carrying amount of financial instruments where the carrying amount does not approximate fair value:
| | | | | | | | | | | | | | |
Figures in million - SA rand | | | | |
| Carrying value | Fair Value |
| Level 1 | Level 2 | Level 3 |
| 30 June 2026 (Unaudited) | | | | |
2029 Notes1 | 7,329 | 7,062 | — | — |
2031 Notes1 | 8,098 | 8,137 | — | — |
Burnstone debt2 | 4,156 | — | — | 4,688 |
US$ Convertible Bond3 | 7,367 | 13,786 | — | — |
Marikana dividend obligation4 | 791 | — | — | 708 |
Keliber dividend obligation4 | 85 | — | — | 120 |
| Total | 27,826 | 28,985 | — | 5,516 |
| 31 December 2025 (Unaudited) | | | | |
2026 and 2029 Notes1 | 19,824 | 19,367 | — | — |
Burnstone debt2 | 4,005 | — | — | 4,395 |
US$ Convertible Bond3 | 7,291 | 23,003 | — | — |
Marikana dividend obligation4 | 810 | — | — | 777 |
Keliber dividend obligation4 | — | — | — | — |
| Total | 31,930 | 42,370 | — | 5,172 |
| 30 June 2025 (Unaudited) | | | | |
2026 and 2029 Notes1 | 21,214 | 20,062 | — | — |
Burnstone debt2 | 2,254 | — | — | 2,162 |
US$ Convertible Bond3 | 7,657 | 13,559 | — | — |
Marikana dividend obligation4 | 766 | — | — | 704 |
Keliber dividend obligation4 | 298 | — | — | 341 |
| Total | 32,189 | 33,621 | — | 3,207 |
1 The fair value is based on the quoted market prices of the notes
2 The fair value of the Burnstone Debt has been derived from discounted cash flow models. These models use several key assumptions, including estimates of future sales volumes, gold prices, operating costs, capital expenditure and discount rate. The Burnstone long-term gold price at 30 June 2026 and 31 December 2025 was R1,670,512/kg (30 June 2025: R1,189,493/kg) and the discount rate applied was 8.36% (31 December 2025: 8.69%, 30 June 2025: 9.77%). The fair value estimate is sensitive to changes in the key assumptions, for example, increases in the market related discount rate would decrease the fair value if all other inputs remain unchanged. The extent of the fair value changes would depend on how inputs change in relation to each other
3 The fair value represents the quoted price of the US$ Convertible Bond
4 The fair value was calculated by applying a market-related discount rate to expected future cash flows available for dividends
18.2 Risk management activities
Liquidity risk: working capital and going concern assessment
For the six months ended 30 June 2026, the Group realised a profit of R18,807 million (for the six months ended 31 December 2025: incurred a loss of R833 million and 30 June 2025: incurred a loss of R3,906 million). As at 30 June 2026 the Group’s current assets exceeded its current liabilities by R40,429 million (31 December 2025: R26,595 million,30 June 2025: R39,476 million) and the Group’s total assets exceeded its total liabilities by R59,174 million (31 December 2025: R44,167 million, 30 June 2025: R44,345 million). During the six months ended 30 June 2026 the Group generated cash from operating activities of R19,614 million (31 December 2025: R8,230 million and 30 June 2025: R13,177 million). The Group has committed undrawn debt facilities of R23,575 million at 30 June 2026 (31 December 2025: R21,255 million, 30 June 2025: R24,202 million) and cash balances of R22,434 million (31 December 2025: R17,178 million, 30 June 2025: R21,012 million).
Management believes that the cash forecasted to be generated by operations, cash on hand and the committed unutilised debt facilities will enable the Group to continue to meet its obligations as they fall due for a period of at least eighteen months after the reporting date. Accordingly, the consolidated interim financial statements for the six months ended 30 June 2026 have been prepared on a going concern basis.
Sibanye-Stillwater Operating and financial results | Six months ended 30 June 2026 40
19. Reconciliation of profit before royalties, carbon tax and tax to adjusted EBITDA
Reconciliation of profit before royalties, carbon tax and tax to adjusted EBITDA
| | | | | | | | | | | | | | |
Figures in million - SA rand | | Six months ended |
| | Unaudited | Unaudited | Unaudited |
| | Jun 2026 | Dec 2025 | Jun 2025 |
Profit/(loss) before royalties, carbon tax and tax | | 27,782 | 2,936 | (2,202) |
Adjusted for: | | | | |
Amortisation and depreciation | | 4,219 | 5,149 | 4,218 |
Interest income | | (772) | (882) | (686) |
| Finance expense | | 2,264 | 2,447 | 2,553 |
Share-based payments | | (119) | 1,499 | 615 |
(Gain)/loss on financial instruments | | (58) | 3,403 | 391 |
(Gain)/loss on foreign exchange differences | | (63) | 6 | (161) |
Share of results of equity-accounted investees after tax | | (1,641) | (769) | 432 |
Change in estimate of environmental rehabilitation obligation | | 65 | 593 | (98) |
(Gain)/loss on disposal of property, plant and equipment | | (51) | 30 | (16) |
Impairments | | 18 | 4,341 | 9,666 |
| Gain on assets held for sale | | — | (16) | — |
Restructuring costs | | 153 | 5 | 242 |
Transaction and project costs | | 150 | 4,125 | 418 |
IFRS 16 lease payments | | (111) | (147) | (120) |
Occupational healthcare loss | | — | 46 | 3 |
| Onerous contract provision | | — | — | (124) |
| Compensation for losses incurred | | (9) | (75) | (67) |
| Sandouville plant retirement costs | | 15 | — | — |
| Gain on early settlement of 2029 Notes | | (46) | — | — |
| Corporate strategy and leadership costs | | 55 | 41 | 9 |
| Gain/increase in equity-accounted investment | | (8) | (5) | — |
Adjusted EBITDA | | 31,843 | 22,727 | 15,073 |
1The adjusted earnings before interest, taxes, depreciation and amortisation (EBITDA) calculation is based on the definitions included in the facility agreements for compliance with the debt covenant formula, except for impact of new accounting standards, project finance subsidiaries (Burnstone) and acquisitions, where the facility agreements allow the results from the acquired operations to be annualised. Adjusted EBITDA is not a measure of performance under IFRS Accounting Standards. As a result, it may not be comparable to similarly titled measures of other companies and should be considered in addition to, and should not be considered in isolation or as alternatives to any other measure of financial performance and liquidity presented in accordance with IFRS Accounting Standards
20. Cash flows from operating activities
20.1 Cash generated by operations
Cash generated by operations includes the following major non-cash adjusting items:
| | | | | | | | | | | | | | |
Figures in million - SA rand | | Six months ended |
| | Unaudited | Unaudited | Unaudited |
| Notes | Jun 2026 | Dec 2025 | Jun 2025 |
| Amortisation and depreciation | | 4,219 | 5,149 | 4,218 |
| Impairments | 8 | 18 | 4,341 | 9,666 |
| Deferred revenue recognised | | (1,196) | (1,571) | (2,650) |
| Section 45X credits recognised | 4 | (858) | (832) | (5,053) |
| Settlements through delivery of metals on metal consignment facility | 17 | (8,123) | (4,519) | (3,126) |
20.2 Change in working capital
| | | | | | | | | | | | | | |
Figures in million - SA rand | | Six months ended |
| | Unaudited | Unaudited | Unaudited |
| | Jun 2026 | Dec 2025 | Jun 2025 |
| Inventories | | (233) | (2,692) | (2,931) |
| Trade and other receivables | | 835 | (1,423) | (73) |
| Trade and other payables | | 9,281 | 5,866 | 3,526 |
| Total change in working capital | | 9,883 | 1,751 | 522 |
21. Events after the reporting period
There were no significant events which occurred after 30 June 2026 and up to the date on which these consolidated interim financial statements for the six months ended 30 June 2026 was authorised for issue, and which requires disclosure in these interim financial statements.
Sibanye-Stillwater Operating and financial results | Six months ended 30 June 2026 41
ALL-IN COSTS – SIX MONTHS US and SA PGM operations Figures are in rand millions unless otherwise stated
| | | | | | | | | | | | | | | | | | | | | | | | | | | | | |
|
| | | US PGM operations1 | Total SA PGM operations2 | Rustenburg including Kroondal | Marikana2 | Plat Mile | Mimosa | Corporate |
Cost of sales, before amortisation and depreciation3 | | Jun 2026 | 2,719 | | 23,210 | | 12,496 | | 10,322 | | 392 | | 1,157 | | (1,157) | |
| | Dec 2025 | 2,217 | | 23,565 | | 11,690 | | 11,387 | | 488 | | 1,618 | | (1,618) | |
| | Jun 2025 | (70) | | 19,650 | | 10,232 | | 8,981 | | 437 | | 913 | | (913) | |
Section 45X credit adjustment7 | | Jun 2026 | — | | — | | — | | — | | — | | — | | — | |
| | Dec 2025 | — | | — | | — | | — | | — | | — | | — | |
| | Jun 2025 | 2,466 | | — | | — | | — | | — | | — | | — | |
| Royalties | | Jun 2026 | — | | 1,183 | | 799 | | 384 | | — | | 123 | | (123) | |
| | Dec 2025 | — | | 656 | | 578 | | 78 | | — | | 110 | | (110) | |
| | Jun 2025 | — | | 110 | | 79 | | 31 | | — | | 45 | | (45) | |
| Carbon tax | | Jun 2026 | — | | 2 | | — | | 2 | | — | | — | | — | |
| | Dec 2025 | — | | 2 | | — | | 2 | | — | | — | | — | |
| | Jun 2025 | — | | 1 | | — | | 1 | | — | | — | | — | |
| Community costs | | Jun 2026 | — | | 68 | | 4 | | 64 | | — | | — | | — | |
| | Dec 2025 | — | | 145 | | 47 | | 99 | | — | | — | | — | |
| | Jun 2025 | — | | 119 | | 41 | | 78 | | — | | — | | — | |
| Inventory change | | Jun 2026 | (228) | | (109) | | (698) | | 589 | | — | | 51 | | (51) | |
| | Dec 2025 | 231 | | 1,138 | | 1,378 | | (240) | | — | | (295) | | 295 | |
| | Jun 2025 | 325 | | 1,574 | | 1,314 | | 260 | | — | | 339 | | (339) | |
Share-based payments4 | | Jun 2026 | 23 | | 95 | | 52 | | 42 | | 1 | | — | | — | |
| | Dec 2025 | 53 | | 126 | | 65 | | 61 | | — | | — | | — | |
| | Jun 2025 | (14) | | 30 | | 14 | | 14 | | 1 | | — | | — | |
Rehabilitation interest and amortisation5 | | Jun 2026 | 29 | | 148 | | 95 | | 53 | | — | | 4 | | (4) | |
| | Dec 2025 | 16 | | 102 | | 84 | | 18 | | — | | 4 | | (4) | |
| | Jun 2025 | 17 | | 104 | | 75 | | 29 | | — | | 4 | | (4) | |
| Leases | | Jun 2026 | — | | 23 | | 7 | | 15 | | 1 | | — | | — | |
| | Dec 2025 | — | | 25 | | 10 | | 14 | | 1 | | — | | — | |
| | Jun 2025 | 1 | | 25 | | 9 | | 15 | | 1 | | — | | — | |
| Ore reserve development | | Jun 2026 | 689 | | 1,180 | | 387 | | 793 | | — | | — | | — | |
| | Dec 2025 | 598 | | 1,248 | | 397 | | 851 | | — | | — | | — | |
| | Jun 2025 | 614 | | 1,095 | | 349 | | 746 | | — | | — | | — | |
| Sustaining capital expenditure | | Jun 2026 | 227 | | 1,140 | | 647 | | 491 | | 2 | | 245 | | (245) | |
| | Dec 2025 | 242 | | 1,746 | | 930 | | 792 | | 24 | | 198 | | (198) | |
| | Jun 2025 | 121 | | 1,120 | | 549 | | 561 | | 10 | | 160 | | (160) | |
| Less: By-product credit | | Jun 2026 | (410) | | (6,105) | | (2,840) | | (3,134) | | (131) | | (258) | | 258 | |
| | Dec 2025 | (381) | | (6,454) | | (3,220) | | (3,049) | | (185) | | (252) | | 252 | |
| | Jun 2025 | (327) | | (5,258) | | (2,313) | | (2,736) | | (209) | | (165) | | 165 | |
Total All-in-sustaining costs6 | | Jun 2026 | 3,049 | | 20,835 | | 10,949 | | 9,621 | | 265 | | 1,322 | | (1,322) | |
| | Dec 2025 | 2,976 | | 22,299 | | 11,959 | | 10,013 | | 328 | | 1,383 | | (1,383) | |
| | Jun 2025 | 3,133 | | 18,570 | | 10,349 | | 7,980 | | 240 | | 1,296 | | (1,296) | |
| Plus: Corporate cost, growth and capital expenditure | | Jun 2026 | 72 | | 319 | | 103 | | 216 | | — | | — | | — | |
| | Dec 2025 | 90 | | 338 | | 34 | | 310 | | — | | — | | (6) | |
| | Jun 2025 | 98 | | 333 | | 23 | | 310 | | — | | — | | — | |
Total All-in-costs6 | | Jun 2026 | 3,121 | | 21,154 | | 11,052 | | 9,837 | | 265 | | 1,322 | | (1,322) | |
| | Dec 2025 | 3,066 | | 22,637 | | 11,993 | | 10,323 | | 328 | | 1,383 | | (1,389) | |
| | Jun 2025 | 3,231 | | 18,903 | | 10,372 | | 8,290 | | 240 | | 1,296 | | (1,296) | |
| PGM production | 4Eoz - 2Eoz | Jun 2026 | 137,930 | | 831,307 | | 412,690 | | 350,694 | | 12,921 | | 55,002 | | — | |
| | Dec 2025 | 142,945 | | 957,882 | | 496,826 | | 385,850 | | 17,241 | | 57,965 | | — | |
| | Jun 2025 | 141,124 | | 840,046 | | 425,747 | | 340,183 | | 15,062 | | 59,054 | | — | |
| kg | Jun 2026 | 4,290 | | 25,857 | | 12,836 | | 10,908 | | 402 | | 1,711 | | — | |
| | Dec 2025 | 4,446 | | 29,793 | | 15,453 | | 12,001 | | 536 | | 1,803 | | — | |
| | Jun 2025 | 4,389 | | 26,128 | | 13,242 | | 10,581 | | 468 | | 1,837 | | — | |
All-in-sustaining cost6 | R/4Eoz - R/2Eoz | Jun 2026 | 22,105 | | 26,839 | | 26,531 | | 27,434 | | 20,509 | | 24,035 | | — | |
| | Dec 2025 | 20,819 | | 24,779 | | 24,071 | | 25,950 | | 19,024 | | 23,859 | | — | |
| | Jun 2025 | 22,200 | | 23,777 | | 24,308 | | 23,458 | | 15,934 | | 21,946 | | — | |
| US$/4Eoz - US$/2Eoz | Jun 2026 | 1,347 | | 1,636 | | 1,617 | | 1,672 | | 1,250 | | 1,465 | | — | |
| | Dec 2025 | 1,198 | | 1,426 | | 1,385 | | 1,493 | | 1,095 | | 1,373 | | — | |
| | Jun 2025 | 1,207 | | 1,293 | | 1,322 | | 1,276 | | 866 | | 1,193 | | — | |
All-in-cost6 | R/4Eoz - R/2Eoz | Jun 2026 | 22,627 | | 27,250 | | 26,780 | | 28,050 | | 20,509 | | 24,035 | | — | |
| | Dec 2025 | 21,449 | | 25,155 | | 24,139 | | 26,754 | | 19,024 | | 23,859 | | — | |
| | Jun 2025 | 22,895 | | 24,204 | | 24,362 | | 24,369 | | 15,934 | | 21,946 | | — | |
| US$/4Eoz - US$/2Eoz | Jun 2026 | 1,379 | | 1,661 | | 1,632 | | 1,709 | | 1,250 | | 1,465 | | — | |
| | Dec 2025 | 1,234 | | 1,447 | | 1,389 | | 1,539 | | 1,095 | | 1,373 | | — | |
| | Jun 2025 | 1,245 | | 1,316 | | 1,325 | | 1,325 | | 866 | | 1,193 | | — | |
Average exchange rate for the six months ended 30 June 2026, 31 December 2025 and 30 June 2025 was R16.41/US$, R17.38/US$ and R18.39/US$, respectively
Figures may not add as they are rounded independently
1The US PGM operations’ underground production is converted to metric tonnes and kilograms, and financial performance is translated into SA rand
2The Total SA PGM operations and Marikana includes the production and costs associated with the purchase of concentrate (PoC) from third parties. For a reconciliation of the Operating cost, AISC and AIC excluding third party PoC, refer to “Reconciliation of operating cost excluding third party PoC for Total SA PGM operations and Marikana - Six Months” and “Reconciliation of AISC and AIC excluding third party PoC for Total SA PGM operations and Marikana – Six Months”
3Cost of sales, before amortisation and depreciation includes all mining and processing costs, third party refining costs, corporate general and administrative costs, and permitting costs
4Share-based payments are calculated based on the fair value at initial recognition and do not include the adjustment of the cash-settled share-based payment obligation to the reporting date fair value
5Rehabilitation includes the interest charge related to the environmental rehabilitation obligation and the amortisation of the related capitalised rehabilitation costs. The interest charge related to the environmental rehabilitation obligation and the amortisation of the capitalised rehabilitation costs reflect the periodic costs of rehabilitation associated with current PGM production
6All-in cost is calculated in accordance with the World Gold Council guidance. All-in cost excludes income tax, costs associated with merger and acquisition activities, working capital, impairments, financing costs, one-time severance charges and items needed to normalise earnings. All-in cost is made up of All-in sustaining cost, being the cost to sustain current operations,
Sibanye-Stillwater Operating and financial results | Six months ended 30 June 2026 42
given as a sub-total in the All-in cost calculation, together with corporate and major capital expenditure associated with growth. All-in sustaining cost per ounce and All-in cost per ounce are calculated by dividing the All-in sustaining cost and All-in cost, respectively, in a period by the total 4E/2E PGM produced (excluding Mimosa) in the same period
7During the six months ended 30 June 2025 the US PGM operations recognised R2,466 million (US$139 million) which relates to Section 45X Advance Manufacturing Production Credits applicable to the 2023 and 2024 financial reporting years and presented as a reduction to mining costs. The US PGM operations’ All-in sustaining cost and All-in cost for the six months ended 30 June 2025 were adjusted to exclude the Section 45X Advance Manufacturing Production Credits applicable to the 2023 and 2024 financial reporting years
| | | | | | | | | | | | | | | | | | | | | | | |
Reconciliation of operating cost excluding third party PoC for Total SA PGM operations and Marikana - Six Months |
| | Total SA PGM operations | Marikana |
| Rm | Jun 2026 | Dec 2025 | Jun 2025 | Jun 2026 | Dec 2025 | Jun 2025 |
| Cost of sales, before amortisation and depreciation as reported per table above | | 23,210 | | 23,565 | | 19,650 | | 10,322 | | 11,387 | | 8,981 | |
| Inventory change as reported per table above | | (109) | | 1,138 | | 1,574 | | 589 | | (240) | | 260 | |
| Less: Chrome cost of sales | | (298) | | (1,018) | | (851) | | (62) | | (293) | | (189) | |
| Total operating cost including third party PoC | | 22,803 | | 23,685 | | 20,373 | | 10,849 | | 10,854 | | 9,052 | |
| Less: Purchase cost of PoC | | (1,966) | | (1,489) | | (1,061) | | (1,966) | | (1,489) | | (1,061) | |
| Total operating cost excluding third party PoC | | 20,837 | | 22,196 | | 19,312 | | 8,883 | | 9,365 | | 7,991 | |
| | | | | | | |
| PGM production as reported per table above | 4Eoz- 2Eoz | 831,307 | | 957,882 | | 840,046 | | 350,694 | | 385,850 | | 340,183 | |
| Less: Mimosa production | | (55,002) | | (57,965) | | (59,054) | | — | | — | | — | |
| PGM production excluding Mimosa | | 776,305 | | 899,917 | | 780,992 | | 350,694 | | 385,850 | | 340,183 | |
| Less: PoC production | | (41,660) | | (37,356) | | (35,794) | | (41,660) | | (37,356) | | (35,794) | |
| PGM production excluding Mimosa and third party PoC | | 734,645 | | 862,561 | | 745,198 | | 309,034 | | 348,494 | | 304,389 | |
| | | | | | | |
| PGM production including Mimosa and excluding third party PoC | | 789,647 | | 920,526 | | 804,252 | | 309,034 | | 348,494 | | 304,389 | |
| | | | | | | |
| Tonnes milled/treated | kt | 15,217 | | 19,185 | | 17,311 | | 4,544 | | 5,009 | | 4,409 | |
| Less: Mimosa tonnes | | (701) | | (735) | | (723) | | — | | — | | — | |
| PGM tonnes excluding Mimosa | | 14,516 | | 18,451 | | 16,588 | | 4,544 | | 5,009 | | 4,409 | |
| Operating cost including third party PoC | R/4Eoz-R/2Eoz | 29,374 | | 26,319 | | 26,086 | | 30,936 | | 28,130 | | 26,609 | |
| US$/4Eoz-US$/2Eoz | 1,790 | | 1,514 | | 1,418 | | 1,885 | | 1,619 | | 1,447 | |
| R/t | 1,571 | | 1,284 | | 1,228 | | 2,387 | | 2,167 | | 2,053 | |
| US$/t | 96 | | 74 | | 67 | | 145 | | 125 | | 112 | |
| Operating cost excluding third party PoC | R/4Eoz-R/2Eoz | 28,363 | | 25,733 | | 25,915 | | 28,744 | | 26,873 | | 26,253 | |
| US$/4Eoz-US$/2Eoz | 1,728 | | 1,481 | | 1,409 | | 1,752 | | 1,546 | | 1,428 | |
| R/t | 1,435 | | 1,203 | | 1,164 | | 1,955 | | 1,870 | | 1,812 | |
| US$/t | 87 | | 69 | | 63 | | 119 | | 108 | | 99 | |
| | | | | | | | | | | | | | | | | | | | | | | |
Reconciliation of AISC and AIC excluding third party PoC for Total SA PGM operations and Marikana - Six Months |
| | Total SA PGM operations | Marikana |
| Rm | Jun 2026 | Dec 2025 | Jun 2025 | Jun 2026 | Dec 2025 | Jun 2025 |
| Total All-in-sustaining cost as reported per table above | | 20,835 | | 22,299 | | 18,570 | | 9,621 | | 10,013 | | 7,980 | |
| Less: Purchase cost of PoC | | (1,966) | | (1,489) | | (1,061) | | (1,966) | | (1,489) | | (1,061) | |
| Add: By-product credit of PoC | | 417 | | 286 | | 295 | | 417 | | 286 | | 295 | |
| Total All-in-sustaining cost excluding third party PoC | | 19,286 | | 21,096 | | 17,804 | | 8,072 | | 8,810 | | 7,214 | |
| Plus: Corporate cost, growth and capital expenditure | | 319 | | 338 | | 333 | | 216 | | 310 | | 310 | |
| Total All-in-cost excluding third party PoC | | 19,605 | | 21,434 | | 18,137 | | 8,288 | | 9,120 | | 7,524 | |
| | | | | | | |
| PGM production excluding Mimosa and third party PoC | 4Eoz- 2Eoz | 734,645 | | 862,561 | | 745,198 | | 309,034 | | 348,494 | | 304,389 | |
| | | | | | | |
| All-in-sustaining cost excluding third party PoC | R/4Eoz-R/2Eoz | 26,252 | | 24,457 | | 23,892 | | 26,120 | | 25,280 | | 23,700 | |
| US$/4Eoz-US$/2Eoz | 1,600 | | 1,407 | | 1,299 | | 1,592 | | 1,455 | | 1,289 | |
| | | | | | | |
| All-in-cost excluding third party PoC | R/4Eoz-R/2Eoz | 26,686 | | 24,849 | | 24,338 | | 26,819 | | 26,170 | | 24,718 | |
| US$/4Eoz-US$/2Eoz | 1,626 | | 1,430 | | 1,323 | | 1,634 | | 1,506 | | 1,344 | |
Sibanye-Stillwater Operating and financial results | Six months ended 30 June 2026 43
ALL-IN COSTS – SIX MONTHS (continued) SA gold operations Figures are in rand millions unless otherwise stated
| | | | | | | | | | | | | | | | | | | | | | | | | | | | | |
|
| | | Total SA gold operations | Driefontein | Kloof | Beatrix | Cooke | DRDGOLD | Corporate |
Cost of sales, before amortisation and depreciation1 | | Jun 2026 | 13,678 | | 4,087 | | 3,466 | | 2,610 | | 1,053 | | 2,462 | | — | |
| | Dec 2025 | 11,854 | | 3,676 | | 2,734 | | 2,164 | | 849 | | 2,431 | | — | |
| | Jun 2025 | 11,133 | | 3,285 | | 2,860 | | 2,065 | | 706 | | 2,217 | | — | |
| Royalties | | Jun 2026 | 366 | | 252 | | 18 | | 130 | | 5 | | — | | (39) | |
| | Dec 2025 | 139 | | 221 | | 12 | | 111 | | — | | — | | (205) | |
| | Jun 2025 | 9 | | (7) | | 16 | | 41 | | 4 | | — | | (45) | |
| Carbon tax | | Jun 2026 | — | | — | | — | | — | | — | | — | | — | |
| | Dec 2025 | (3) | | — | | — | | (4) | | — | | 1 | | — | |
| | Jun 2025 | — | | — | | — | | — | | — | | — | | — | |
| Community costs | | Jun 2026 | 8 | | — | | — | | — | | — | | 8 | | — | |
| | Dec 2025 | 15 | | — | | — | | — | | — | | 15 | | — | |
| | Jun 2025 | 9 | | — | | — | | — | | — | | 9 | | — | |
Share-based payments2 | | Jun 2026 | 48 | | 17 | | 8 | | 7 | | (1) | | 18 | | (1) | |
| | Dec 2025 | 77 | | 21 | | 17 | | 13 | | 1 | | 24 | | 1 | |
| | Jun 2025 | 16 | | 1 | | (2) | | 1 | | 1 | | 16 | | (1) | |
Rehabilitation interest and amortisation3 | | Jun 2026 | 95 | | 11 | | 4 | | 30 | | 49 | | (4) | | 5 | |
| | Dec 2025 | 115 | | 11 | | 17 | | 46 | | 59 | | (22) | | 4 | |
| | Jun 2025 | 132 | | 12 | | 18 | | 45 | | 59 | | (6) | | 4 | |
| Leases | | Jun 2026 | 19 | | 3 | | 1 | | 10 | | — | | 5 | | — | |
| | Dec 2025 | 19 | | 2 | | 3 | | 9 | | — | | 5 | | — | |
| | Jun 2025 | 16 | | — | | 5 | | 5 | | — | | 6 | | — | |
| Ore reserve development | | Jun 2026 | 1,132 | | 994 | | — | | 138 | | — | | — | | — | |
| | Dec 2025 | 1,571 | | 877 | | 548 | | 146 | | — | | — | | — | |
| | Jun 2025 | 1,361 | | 822 | | 433 | | 106 | | — | | — | | — | |
| Sustaining capital expenditure | | Jun 2026 | 378 | | 178 | | — | | 40 | | — | | 160 | | — | |
| | Dec 2025 | 598 | | 265 | | 143 | | 71 | | — | | 119 | | — | |
| | Jun 2025 | 481 | | 149 | | 108 | | 40 | | — | | 184 | | — | |
| Less: By-product credit | | Jun 2026 | (18) | | (10) | | (4) | | (4) | | — | | — | | — | |
| | Dec 2025 | (14) | | (6) | | (2) | | (1) | | — | | (5) | | — | |
| | Jun 2025 | (13) | | (4) | | (3) | | (2) | | — | | (4) | | — | |
Total All-in-sustaining costs4 | | Jun 2026 | 15,706 | | 5,532 | | 3,493 | | 2,961 | | 1,106 | | 2,649 | | (35) | |
| | Dec 2025 | 14,371 | | 5,067 | | 3,472 | | 2,555 | | 909 | | 2,568 | | (200) | |
| | Jun 2025 | 13,144 | | 4,258 | | 3,435 | | 2,301 | | 770 | | 2,422 | | (42) | |
| Plus: Corporate cost, growth and capital expenditure | | Jun 2026 | 1,889 | | — | | — | | — | | — | | 1,853 | | 36 | |
| | Dec 2025 | 1,599 | | — | | — | | — | | — | | 1,570 | | 29 | |
| | Jun 2025 | 1,062 | | — | | — | | — | | — | | 1,103 | | (41) | |
Total All-in-costs4 | | Jun 2026 | 17,595 | | 5,532 | | 3,493 | | 2,961 | | 1,106 | | 4,502 | | 1 | |
| | Dec 2025 | 15,970 | | 5,067 | | 3,472 | | 2,555 | | 909 | | 4,138 | | (171) | |
| | Jun 2025 | 14,206 | | 4,258 | | 3,435 | | 2,301 | | 770 | | 3,525 | | (83) | |
| Gold sold | kg | Jun 2026 | 9,588 | | 3,333 | | 1,534 | | 1,736 | | 508 | | 2,477 | | — | |
| | Dec 2025 | 9,933 | | 3,848 | | 1,523 | | 1,748 | | 426 | | 2,388 | | — | |
| | Jun 2025 | 9,148 | | 3,028 | | 1,734 | | 1,676 | | 459 | | 2,251 | | — | |
| oz | Jun 2026 | 308,261 | | 107,158 | | 49,319 | | 55,814 | | 16,333 | | 79,637 | | — | |
| | Dec 2025 | 319,353 | | 123,716 | | 48,966 | | 56,199 | | 13,696 | | 76,776 | | — | |
| | Jun 2025 | 294,115 | | 97,352 | | 55,749 | | 53,885 | | 14,757 | | 72,371 | | — | |
All-in-sustaining cost4 | R/kg | Jun 2026 | 1,638,089 | | 1,659,766 | | 2,277,053 | | 1,705,645 | | 2,177,165 | | 1,069,439 | | — | |
| | Dec 2025 | 1,446,794 | | 1,316,788 | | 2,279,711 | | 1,461,670 | | 2,133,803 | | 1,075,377 | | — | |
| | Jun 2025 | 1,436,817 | | 1,406,209 | | 1,980,969 | | 1,372,912 | | 1,677,560 | | 1,075,966 | | — | |
| All-in-sustaining cost | US$/oz | Jun 2026 | 3,105 | | 3,146 | | 4,316 | | 3,233 | | 4,127 | | 2,027 | | — | |
| | Dec 2025 | 2,589 | | 2,357 | | 4,080 | | 2,616 | | 3,819 | | 1,925 | | — | |
| | Jun 2025 | 2,430 | | 2,378 | | 3,350 | | 2,322 | | 2,837 | | 1,820 | | — | |
All-in-cost4 | R/kg | Jun 2026 | 1,835,106 | | 1,659,766 | | 2,277,053 | | 1,705,645 | | 2,177,165 | | 1,817,521 | | — | |
| | Dec 2025 | 1,607,772 | | 1,316,788 | | 2,279,711 | | 1,461,670 | | 2,133,803 | | 1,732,831 | | — | |
| | Jun 2025 | 1,552,908 | | 1,406,209 | | 1,980,969 | | 1,372,912 | | 1,677,560 | | 1,565,971 | | — | |
| All-in-cost | US$/oz | Jun 2026 | 3,478 | | 3,146 | | 4,316 | | 3,233 | | 4,127 | | 3,445 | | — | |
| | Dec 2025 | 2,877 | | 2,357 | | 4,080 | | 2,616 | | 3,819 | | 3,101 | | — | |
| | Jun 2025 | 2,626 | | 2,378 | | 3,350 | | 2,322 | | 2,837 | | 2,649 | | — | |
Average exchange rate for the six months ended 30 June 2026, 31 December 2025 and 30 June 2025 was R16.41/US$, R17.38/US$ and R18.39/US$, respectively
Figures may not add as they are rounded independently
1Cost of sales, before amortisation and depreciation includes all mining and processing costs, third party refining costs, corporate general and administrative costs, and permitting costs
2Share-based payments are calculated based on the fair value at grant date and do not include the adjustment of the cash-settled share-based payment obligation to the reporting date fair value
3Rehabilitation includes the interest charge related to the environmental rehabilitation obligation and the amortisation of the related capitalised rehabilitation costs. The interest charge related to the environmental rehabilitation obligation and the amortisation of the capitalised rehabilitation costs reflect the periodic costs of rehabilitation associated with current gold production
4All-in cost is calculated in accordance with the World Gold Council guidance. All-in cost excludes income tax, costs associated with merger and acquisition activities, working capital, impairments, financing costs, one time severance charges and items needed to normalise earnings. All-in cost is made up of All-in sustaining cost, being the cost to sustain current operations, given as a sub-total in the All-in cost calculation, together with corporate and major capital expenditure associated with growth. All-in sustaining cost per kilogram (and ounce) and All-in cost per kilogram (and ounce) are calculated by dividing the All-in sustaining cost and All-in cost, respectively, in a period by the total gold sold over the same period
Sibanye-Stillwater Operating and financial results | Six months ended 30 June 2026 44
ALL-IN COSTS – SIX MONTHS (continued) Australian operations Figures are in rand millions unless otherwise stated
| | | | | | | | | | | |
Century zinc retreatment operation |
| | | |
Cost of sales, before amortisation and depreciation1 | | Jun 2026 | 1,555 | |
| | Dec 2025 | 1,604 | |
| | Jun 2025 | 1,457 | |
| Royalties | | Jun 2026 | 118 | |
| | Dec 2025 | 133 | |
| | Jun 2025 | 99 | |
| Community costs | | Jun 2026 | 28 | |
| | Dec 2025 | 29 | |
| | Jun 2025 | 33 | |
| Inventory change | | Jun 2026 | 57 | |
| | Dec 2025 | 90 | |
| | Jun 2025 | 108 | |
Share-based payments2 | | Jun 2026 | 16 | |
| | Dec 2025 | 11 | |
| | Jun 2025 | 6 | |
Rehabilitation interest and amortisation3 | | Jun 2026 | 36 | |
| | Dec 2025 | 36 | |
| | Jun 2025 | 37 | |
| Leases | | Jun 2026 | 19 | |
| | Dec 2025 | 55 | |
| | Jun 2025 | 50 | |
| Sustaining capital expenditure | | Jun 2026 | 6 | |
| | Dec 2025 | 38 | |
| | Jun 2025 | 21 | |
| Less: By-product credit | | Jun 2026 | (253) | |
| | Dec 2025 | (199) | |
| | Jun 2025 | (147) | |
Total All-in-sustaining costs4 | | Jun 2026 | 1,582 | |
| | Dec 2025 | 1,797 | |
| | Jun 2025 | 1,664 | |
| Plus: Corporate cost, growth and capital expenditure | | Jun 2026 | 22 | |
| | Dec 2025 | 44 | |
| | Jun 2025 | 13 | |
Total All-in-costs4 | | Jun 2026 | 1,604 | |
| | Dec 2025 | 1,841 | |
| | Jun 2025 | 1,677 | |
| Payable zinc production | kt | Jun 2026 | 45 | |
| | Dec 2025 | 49 | |
| | Jun 2025 | 51 | |
All-in-sustaining cost4 | R/tZn | Jun 2026 | 35,477 | |
| | Dec 2025 | 36,399 | |
| | Jun 2025 | 32,411 | |
| US$/tZn | Jun 2026 | 2,162 | |
| | Dec 2025 | 2,094 | |
| | Jun 2025 | 1,762 | |
All-in-cost4 | R/tZn | Jun 2026 | 35,971 | |
| | Dec 2025 | 37,291 | |
| | Jun 2025 | 32,665 | |
| US$/tZn | Jun 2026 | 2,192 | |
| | Dec 2025 | 2,146 | |
| | Jun 2025 | 1,776 | |
Average exchange rate for the six months ended 30 June 2026, 31 December 2025 and 30 June 2025 was R16.41/US$, R17.38/US$ and R18.39/US$, respectively
Figures may not add as they are rounded independently
1Cost of sales, before amortisation and depreciation includes all mining and processing costs, corporate general and administrative costs, and permitting costs
2Share-based payments are calculated based on the fair value at grant date and do not include the adjustment of the cash-settled share-based payment obligation to the reporting date fair value
3Rehabilitation includes the interest charge related to the environmental rehabilitation obligation and the amortisation of the related capitalised rehabilitation costs. The interest charge related to the environmental rehabilitation obligation and the amortisation of the capitalised rehabilitation costs reflect the periodic costs of rehabilitation associated with current zinc production
Sibanye-Stillwater Operating and financial results | Six months ended 30 June 2026 45
4All-in cost is calculated in accordance with the World Gold Council guidance. All-in cost excludes income tax, costs associated with merger and acquisition activities, working capital, impairments, financing costs, one-time severance charges and items needed to normalise earnings. All-in cost is made up of All-in sustaining cost, being the cost to sustain current operations, given as a sub-total in the All-in cost calculation, together with corporate and major capital expenditure associated with growth. All-in sustaining cost per tonne and All-in cost per tonne are calculated by dividing the All-in sustaining cost and All-in cost, respectively, in a period by the total tonnes of payable zinc production in the same period
Sibanye-Stillwater Operating and financial results | Six months ended 30 June 2026 46
UNIT OPERATING COST – SIX MONTHS US and SA PGM operations Figures are in rand millions unless otherwise stated
| | | | | | | | | | | | | | | | | | | | | | | | | | | | | | | | |
|
| | | US PGM operations | Total SA PGM operations2,3 | Rustenburg including Kroondal3 | Marikana3 | Plat Mile3 | Mimosa |
| | | Under- ground1 | Total | Under-
ground | Surface | Under-
ground | Surface | Surface | Attribu-table |
| | | | | | | | | | |
| Cost of sales, before amortisation and depreciation | | Jun 2026 | 2,719 | | 23,210 | 11,825 | | 671 | | 10,322 | 392 | | 1,157 | |
| | Dec 2025 | 2,217 | | 23,565 | | 10,980 | | 710 | | 11,387 | 488 | | 1,618 | |
| | Jun 2025 | (70) | | 19,650 | | 9,585 | | 647 | | 8,981 | 437 | | 913 | |
Section 45X credit adjustment6 | | Jun 2026 | — | | — | | — | | — | | — | — | | — | |
| | Dec 2025 | — | | — | | — | | — | | — | — | | — | |
| | Jun 2025 | 2,466 | | — | | — | | — | | — | — | | — | |
| Inventory change | | Jun 2026 | (228) | | (109) | | (655) | | (43) | | 589 | — | | 51 | |
| | Dec 2025 | 231 | | 1,138 | | 1,412 | | (34) | | (240) | — | | (295) | |
| | Jun 2025 | 325 | | 1,574 | | 1,296 | | 18 | | 260 | — | | 339 | |
| Less: Chrome cost of sales | | Jun 2026 | — | | (298) | | (191) | | — | | (62) | (45) | | — | |
| | Dec 2025 | — | | (1,018) | | (636) | | — | | (293) | (89) | | — | |
| | Jun 2025 | — | | (851) | | (546) | | — | | (189) | (116) | | — | |
| Less: Purchase cost of PoC | | Jun 2026 | — | | (1,966) | | — | | — | | (1,966) | — | | — | |
| | Dec 2025 | — | | (1,489) | | — | | — | | (1,489) | — | | — | |
| | Jun 2025 | — | | (1,061) | | — | | — | | (1,061) | — | | — | |
| Total operating cost excluding third party PoC | | Jun 2026 | 2,491 | | 20,837 | 10,979 | | 628 | | 8,883 | 347 | | 1,208 | |
| | Dec 2025 | 2,448 | | 22,196 | | 11,756 | | 676 | | 9,365 | 399 | | 1,323 | |
| | Jun 2025 | 2,721 | | 19,312 | | 10,335 | | 665 | | 7,991 | 321 | | 1,252 | |
| Tonnes milled/treated | kt | Jun 2026 | 394 | | 14,516 | | 4,930 | | 1,886 | | 2,935 | | 1,609 | | 3,155 | | 701 | |
| | Dec 2025 | 395 | | 18,451 | | 5,861 | | 2,614 | | 3,262 | | 1,746 | | 4,967 | | 735 | |
| | Jun 2025 | 365 | | 16,588 | | 5,139 | | 2,591 | | 2,840 | | 1,569 | | 4,449 | | 723 | |
PGM production excluding third party PoC4 | 4Eoz | Jun 2026 | 137,930 | | 734,645 | 389,570 | | 23,120 | | 309,034 | 12,921 | | 55,002 | |
| | Dec 2025 | 142,945 | | 862,561 | | 472,090 | | 24,736 | | 348,494 | 17,241 | | 57,965 | |
| | Jun 2025 | 141,124 | | 745,198 | | 398,791 | | 26,956 | | 304,389 | 15,062 | | 59,054 | |
Operating cost5 | R/t | Jun 2026 | 6,327 | | 1,435 | | 2,227 | | 333 | | 1,955 | 110 | | 1,723 | |
| | Dec 2025 | 6,193 | | 1,203 | | 2,006 | | 259 | | 1,870 | 80 | | 1,801 | |
| | Jun 2025 | 7,453 | | 1,164 | | 2,011 | | 257 | | 1,812 | 72 | | 1,733 | |
| US$/t | Jun 2026 | 386 | | 87 | | 136 | | 20 | | 119 | 7 | | 105 | |
| | Dec 2025 | 356 | | 69 | | 115 | | 15 | | 108 | 5 | | 104 |
| | Jun 2025 | 405 | | 63 | | 109 | | 14 | | 99 | 4 | | 94 |
| R/4Eoz - R/2Eoz | Jun 2026 | 18,060 | | 28,363 | | 28,182 | | 27,163 | | 28,744 | 26,856 | | 21,963 | |
| | Dec 2025 | 17,125 | | 25,733 | | 24,902 | | 27,329 | | 26,873 | 23,143 | | 22,824 | |
| | Jun 2025 | 19,281 | | 25,915 | | 25,916 | | 24,670 | | 26,253 | 21,312 | | 21,201 | |
| US$/4Eoz - US$/2Eoz | Jun 2026 | 1,101 | | 1,728 | | 1,717 | | 1,655 | | 1,752 | 1,637 | | 1,338 | |
| | Dec 2025 | 985 | | 1,481 | | 1,433 | | 1,572 | | 1,546 | 1,332 | | 1,313 | |
| | Jun 2025 | 1,048 | | 1,409 | | 1,409 | | 1,341 | | 1,428 | 1,159 | | 1,153 | |
Average exchange rate for the six months ended 30 June 2026, 31 December 2025 and 30 June 2025 was R16.41/US$, R17.38/US$ and R18.39, respectively
Figures may not add as they are rounded independently
1 The US PGM operations’ underground production is converted to metric tonnes and kilograms, and performance is translated into rand. In addition to the US PGM operations’
underground production, the operation treats various recycling material which is excluded from the statistics shown above. The US Reldan operations cost and performance are also excluded from the above table
2 Total SA PGM operations exclude the results of Mimosa (financial and production results), which is equity accounted
3 Cost of sales, before amortisation and depreciation for Total SA PGM operations, Rustenburg (including Kroondal), Marikana and Platinum Mile includes the Chrome cost of sales which is excluded for operating unit cost calculation purposes as Chrome production is excluded from the concentrate production
4 For a reconciliation of the production excluding Mimosa and third party PoC, refer to “Reconciliation of operating cost excluding third party PoC for Total SA PGM operations and Marikana - Six months”
5 Operating cost is the average cost of production and operating cost per tonne is calculated by dividing the cost of sales, before amortisation and depreciation, adjusted for change in inventory, less chrome- and PoC cost of sales in a period by the tonnes milled/treated in the same period, and operating cost per ounce is calculated by dividing the cost of sales, before amortisation and depreciation, adjusted for change in inventory, less chrome- and PoC cost of sales in a period, by the PGM produced in the same period
6 During the six months ended 30 June 2025 the US PGM operations recognised R2,466 million (US$139 million) which relates to Section 45X Advance Manufacturing Production Credits applicable to the 2023 and 2024 financial reporting years and presented as a reduction to mining costs. The US PGM operations’ operating cost for the six months ended 30 June 2025 were adjusted to exclude the Section 45X Advance Manufacturing Production Credits applicable to the 2023 and 2024 financial reporting years
Sibanye-Stillwater Operating and financial results | Six months ended 30 June 2026 47
UNIT OPERATING COST – SIX MONTHS (continued) SA gold operations Figures are in rand millions unless otherwise stated
| | | | | | | | | | | | | | | | | | | | | | | | | | | | | | | | | | | | | | | | | |
|
| | | Total SA gold operations | Driefontein | Kloof | Beatrix | Cooke | DRDGOLD |
| | | Total | Under-
ground | Surface | Under-
ground | Surface | Under-
ground | Surface | Under-
ground | Surface | Surface | Surface |
| | | | | | | | | | | | | |
| Cost of sales, before amortisation and depreciation | | Jun 2026 | 13,678 | | 9,753 | | 3,925 | | 4,003 | | 84 | | 3,140 | | 326 | | 2,610 | | — | | 1,053 | | 2,462 | |
| | Dec 2025 | 11,854 | | 8,553 | | 3,301 | | 3,676 | | — | | 2,713 | | 21 | | 2,164 | | — | | 849 | | 2,431 | |
| | Jun 2025 | 11,133 | | 8,060 | | 3,073 | | 3,285 | | — | | 2,710 | | 150 | | 2,065 | | — | | 706 | | 2,217 | |
| Inventory change | | Jun 2026 | (596) | | (623) | | 27 | | (249) | | — | | (193) | | (5) | | (181) | | — | | (20) | | 52 | |
| | Dec 2025 | 700 | | 698 | | 2 | | 236 | | — | | 202 | | 14 | | 260 | | — | | 34 | | (46) | |
| | Jun 2025 | 507 | | 453 | | 54 | | 245 | | — | | 126 | | (1) | | 82 | | — | | 28 | | 27 | |
| Total operating cost | | Jun 2026 | 13,082 | | 9,130 | | 3,952 | | 3,754 | | 84 | | 2,947 | | 321 | | 2,429 | | — | | 1,033 | | 2,514 | |
| | Dec 2025 | 12,554 | | 9,251 | | 3,303 | | 3,912 | | — | | 2,915 | | 35 | | 2,424 | | — | | 883 | | 2,385 | |
| | Jun 2025 | 11,640 | | 8,513 | | 3,127 | | 3,530 | | — | | 2,836 | | 149 | | 2,147 | | — | | 734 | | 2,244 | |
| Tonnes milled/treated | kt | Jun 2026 | 16,523 | | 1,466 | | 15,057 | | 506 | | 62 | | 325 | | 322 | | 635 | | 2 | | 2,057 | | 12,614 | |
| | Dec 2025 | 16,135 | | 1,693 | | 14,442 | | 538 | | — | | 451 | | 134 | | 704 | | — | | 1,852 | | 12,456 | |
| | Jun 2025 | 16,680 | | 1,515 | | 15,164 | | 522 | | 1 | | 389 | | 334 | | 604 | | 1 | | 2,132 | | 12,698 | |
| Gold produced | kg | Jun 2026 | 9,134 | | 5,885 | | 3,249 | | 3,105 | | 16 | | 1,220 | | 199 | | 1,560 | | — | | 532 | | 2,502 | |
| | Dec 2025 | 10,331 | | 7,440 | | 2,891 | | 4,024 | | — | | 1,490 | | 139 | | 1,926 | | — | | 415 | | 2,337 | |
| | Jun 2025 | 9,337 | | 6,453 | | 2,884 | | 3,192 | | — | | 1,605 | | 140 | | 1,656 | | — | | 479 | | 2,265 | |
| oz | Jun 2026 | 293,665 | | 189,207 | | 104,458 | | 99,828 | | 514 | | 39,224 | | 6,398 | | 50,155 | | — | | 17,104 | | 80,441 | |
| | Dec 2025 | 332,149 | | 239,202 | | 92,948 | | 129,375 | | — | | 47,905 | | 4,469 | | 61,922 | | — | | 13,343 | | 75,136 | |
| | Jun 2025 | 300,191 | | 207,469 | | 92,723 | | 102,625 | | — | | 51,602 | | 4,501 | | 53,242 | | — | | 15,400 | | 72,821 | |
Operating cost1,2 | R/t | Jun 2026 | 792 | | 6,228 | | 262 | | 7,421 | | 1,345 | | 9,055 | | 996 | | 3,827 | | — | | 502 | | 199 | |
| | Dec 2025 | 778 | | 5,464 | | 229 | | 7,273 | | — | | 6,463 | | 262 | | 3,442 | | — | | 477 | | 191 | |
| | Jun 2025 | 698 | | 5,618 | | 206 | | 6,758 | | — | | 7,284 | | 447 | | 3,556 | | — | | 344 | | 177 | |
| US$/t | Jun 2026 | 48 | | 380 | | 16 | | 452 | | 82 | | 552 | | 61 | | 233 | | — | | 31 | | 12 | |
| | Dec 2025 | 45 | | 314 | | 13 | | 418 | | — | | 372 | | 15 | | 198 | | — | | 27 | | 11 | |
| | Jun 2025 | 38 | | 305 | | 11 | | 367 | | — | | 396 | | 24 | | 193 | | — | | 19 | | 10 | |
| R/kg | Jun 2026 | 1,432,231 | | 1,551,402 | | 1,216,374 | | 1,209,018 | | 5,250,000 | | 2,415,574 | | 1,613,065 | | 1,557,051 | | — | | 1,941,729 | | 1,004,796 |
| | Dec 2025 | 1,215,178 | | 1,243,414 | | 1,142,511 | | 972,167 | | — | | 1,956,376 | | 251,799 | | 1,258,567 | | — | | 2,127,711 | | 1,020,539 | |
| | Jun 2025 | 1,246,653 | | 1,319,231 | | 1,084,258 | | 1,105,890 | | — | | 1,766,978 | | 1,064,286 | | 1,296,498 | | — | | 1,532,359 | | 990,728 | |
| US$/oz | Jun 2026 | 2,715 | | 2,941 | | 2,306 | | 2,292 | | 9,951 | | 4,578 | | 3,057 | | 2,951 | | — | | 3,680 | | 1,904 | |
| | Dec 2025 | 2,175 | | 2,225 | | 2,045 | | 1,740 | | — | | 3,501 | | 451 | | 2,252 | | — | | 3,808 | | 1,826 | |
| | Jun 2025 | 2,108 | | 2,231 | | 1,834 | | 1,870 | | — | | 2,989 | | 1,800 | | 2,193 | | — | | 2,592 | | 1,676 | |
Average exchange rate for the six months ended 30 June 2026, 31 December 2025 and 30 June 2025 was R16.41/US$, R17.38/US$ and R18.39, respectively
Figures may not add as they are rounded independently
1 Operating cost is the average cost of production and operating cost per tonne is calculated by dividing the cost of sales, before amortisation and depreciation and change in inventory in a period by the tonnes milled/treated in the same period, and operating cost per kilogram (and ounce) is calculated by dividing the cost of sales, before amortisation and depreciation and change in inventory in a period by the gold produced in the same period
2 Due to the Kloof operations having a life of 1 year as of 31 December 2025, all capital expenditure is expensed
Sibanye-Stillwater Operating and financial results | Six months ended 30 June 2026 48
Non-IFRS measures
Sibanye-Stillwater presents certain non-IFRS figures to provide readers with additional financial information that is regularly reviewed by management to assess the operational performance of the Group. These non-IFRS measures should not be considered as alternatives to IFRS Accounting Standards measures, including cost of sales, net operating profit, profit before taxation, cash from operating activities or any other measure of financial performance presented in accordance with IFRS Accounting Standards, and may not be comparable to similarly titled measures of other companies.
The non-IFRS financial measures discussed in this document are listed below:
| | | | | | | | | | | |
Non-IFRS measure | Definition | Purpose why these non-IFRS measures are reported | Reconciled on page |
| | | |
Adjusted EBITDA | Adjusted earnings before interest, tax, depreciation and amortisation, and is reported based on the formula included in Sibanye-Stillwater’s facility agreements for compliance with the debt covenant formula and involves eliminating the effects of various one-time, irregular, and non-recurring items from the standard EBITDA calculation | Used in the calculation of the debt covenant ratio: net debt/(cash) to adjusted EBITDA | 51,52 |
Notional free cash flow (FCF) | Sibanye-Stillwater defines notional free cash flow as adjusted EBITDA, less non cash revenue relating to streaming transactions and deferred prepayments, non cash government grants and accrued taxes and royalties, and includes other non-routine cash items such as legal dispute settlements and realised hedges, net cash additions to property, plant and equipment. | Report one of the drivers considered by management to illustrate cash available for dividends and other investing activities | 14,53 |
All-in sustaining costs (AISC) | Cost of sales before amortisation and depreciation plus additional costs which include community costs, inventory change (PGM operations only), share-based payments, royalties, carbon tax, rehabilitation, leases, ore reserve development (ORD), sustaining capital expenditure and deducting the by-product credit | Developed by the World Gold council for the purpose of the gold mining industry, AISC provides metrics and aims to reflect the full cost to sustain the production and sale of our commodities, and reporting this metric allows for a meaningful comparisons across our operations and different mining companies | 42,43,44,45,46 |
All-in costs (AIC) | AISC plus additional costs relating to corporate and major capital expenditure associated with growth | Developed by the World Gold council for the purpose of the gold mining industry, AIC provides metrics and aims to reflect the full cost to sustain the production and sale of our commodities, after including growth capital, and reporting this metric allows for a meaningful comparisons across our operations and different mining companies | 42,43,44,45,46 |
AISC/AIC per unit | AISC/AIC divided by the total PGM produced/gold sold/payable zinc produced | Developed by the World Gold council for the purpose of the gold mining industry, AISC/AIC per unit provides a metric that aims to reflect the full cost to sustain the production and sale, after including growth capital (AIC), of an ounce/kilogram/tonne of commodity and reporting this metric allows for a meaningful comparisons across our operations and different mining companies | 42,43,44,45,46 |
Headline earnings | Calculated based on the requirements set out in SAICA Circular 1/2023 | Reported in compliance with the Johannesburg Stock Exchange (JSE) Listings Requirements | 35 |
Headline earnings per share (HEPS) | Headline earnings divided by the weighted average number of ordinary shares in issue during the year | Reported in compliance with the JSE Listings Requirements | 35 |
Diluted headline earnings per share | Headline earnings divided by the diluted weighted average number of ordinary shares in issue during the year | Reported in compliance with the JSE Listings Requirements | 35 |
| | | |
Net debt/(cash) | Borrowings and bank overdraft less cash and cash equivalents, excluding Burnstone debt, bank overdraft and cash | Used in the calculation of the debt covenant ratio: net debt/(cash) to adjusted EBITDA | 38 |
Net debt/(cash) to adjusted EBITDA (ratio) | Net debt/(cash) as of the end of a reporting period divided by adjusted EBITDA of the last 12 months ended on the same reporting date | Report compliance with the debt covenant: net debt/(cash) to adjusted EBITDA ratio | 38 |
Normalised earnings | Earnings attributable to the owners of Sibanye-Stillwater excluding gains and losses on financial instruments and foreign exchange differences, impairments, gain/loss on disposal of PPE, occupational healthcare expense, restructuring costs, transactions costs, share-based payment on BEE transactions, gain on acquisition, net other business development costs, share of results of equity-accounted investees, all after tax and the impact of NCI, and changes in estimated deferred tax rate | Report the measure used by the Group to determine dividend payments in line with our dividend policy | 36 |
Sibanye-Stillwater Operating and financial results | Six months ended 30 June 2026 49
| | | | | | | | | | | |
Non-IFRS measure | Definition | Purpose why these non-IFRS measures are reported | Reconciled on page |
| | | |
Operating costs | The average cost of production, and operating cost per tonne is calculated by dividing the cost of sales, before amortisation and depreciation, adjusted for change in inventory, less chrome- and PoC cost of sales (if applicable) in a period by the tonnes milled/treated in the same period, and operating cost per ounce (and kilograms) is calculated by dividing the cost of sales, before amortisation and depreciation, adjusted for change in inventory, less chrome- and PoC cost of sales (if applicable) in a period by the gold kilograms produced or PGM 2E and 4E ounces produced in the same period | Report a measure that aims to reflect the operating cost to produce our commodities, and reporting this metric allows for a meaningful comparisons across our operations and different mining companies | 47,48 |
Sibanye-Stillwater Operating and financial results | Six months ended 30 June 2026 50
ADJUSTED EBITDA RECONCILIATION – SIX MONTHS | | | | | | | | | | | | | | | | | | | | | | | | | | | | | | | | | | | | | | | | | | | | | | | | | | | | | | | | | | | | | | | | | | | | | | | | | | | | | | | | | | | | | | |
| For the six months ended 30 June 2026 (Unaudited) |
| | SA OPERATIONS | | AMERICAS | | | | | | EUROPE | | | AUSTRALIA | | | |
| GROUP | PRIMARY MINING | SECONDARY MINING | | | | | PRIMARY MINING | RECYCLING | | | | | | | SECONDARY MINING | | GROUP |
| SA rand | Total | Total SA
Operations | Total
SA PGM | Rusten-
burg | Marikana | Platinum
Mile | Mimosa | Corporate
and re-
conciling
items | Total
SA gold | Drie-
fontein | Kloof | Beatrix | DRD-
GOLD | Corporate
and re-
conciling
items | Total international operations | Total US operations | Total US PGM | US PGM | Total US recycling | Montana | Pennsylvania site and North Carolina site | Total
EU operations | Keliber Oy | Corporate
and re-
conciling
items | Total AUS operations | Century zinc retreatment operation | Corporate
and re-
conciling
items | Cor-
porate |
Reconciliation of profit/(loss) before royalties, carbon tax and tax to adjusted EBITDA1 | | | | | | | | | | | | | | | | | | | | | | | | | | | | |
(Loss)/profit before royalties, carbon tax and tax1 | 27,782 | 26,320 | 18,440 | 8,805 | 8,254 | 13 | 1,869 | (501) | 7,880 | 3,060 | 107 | 1,368 | 3,492 | (147) | 2,531 | 2,789 | 548 | (92) | 2,881 | 640 | 2,241 | (833) | (385) | (448) | 575 | 637 | (62) | (1,069) |
| Adjusted for: | | | | | | | | | | | | | | | | | | | | | | | | | | | | |
| Amortisation and depreciation | 4,219 | 3,524 | 2,152 | 947 | 1,095 | 80 | 187 | (157) | 1,372 | 871 | — | 208 | 210 | 83 | 695 | 676 | 496 | 494 | 182 | 2 | 180 | 12 | 12 | — | 7 | 6 | 1 | — |
| Interest income | (772) | (597) | (287) | (133) | (123) | (10) | (5) | (16) | (310) | (42) | (41) | (23) | (118) | (86) | (145) | (97) | (93) | (54) | (43) | (39) | (4) | (39) | (39) | — | (9) | (8) | (1) | (30) |
| Finance expense | 2,264 | 761 | 304 | 941 | 170 | — | 40 | (847) | 457 | 55 | 62 | 50 | 30 | 260 | 915 | 816 | 788 | 788 | 28 | — | 28 | 33 | 19 | 14 | 66 | 60 | 6 | 588 |
| Share-based payments | (119) | (60) | (33) | (14) | (19) | — | — | — | (27) | (7) | (4) | (9) | 18 | (25) | (58) | (27) | (25) | (25) | (2) | — | (2) | (19) | (8) | (11) | (12) | (12) | — | (1) |
| (Gain)/loss on financial instruments | (58) | 93 | 86 | (537) | 119 | — | (2) | 506 | 7 | (11) | (8) | (6) | 27 | 5 | (163) | (392) | — | — | (392) | — | (392) | 119 | 85 | 34 | 110 | 110 | — | 12 |
| Loss/(gain) on foreign exchange movements | (63) | (221) | (181) | (84) | (95) | 4 | 12 | (18) | (40) | — | — | — | (1) | (39) | 178 | 12 | 9 | 9 | 3 | — | 3 | 124 | 77 | 47 | 42 | 45 | (3) | (20) |
| Share of results of equity-accounted investees after tax | (1,641) | (1,645) | (1,219) | — | — | — | — | (1,219) | (426) | — | — | — | — | (426) | — | — | 10 | 10 | (10) | — | (10) | — | — | — | — | — | — | 4 |
| Change in estimate of environmental rehabilitation obligation | 65 | (13) | — | — | — | — | — | — | (13) | — | — | — | (13) | — | 78 | — | — | — | — | — | — | — | — | — | 78 | 82 | (4) | — |
| (Gain)/loss on disposal of property, plant and equipment | (51) | (54) | (32) | (29) | (3) | — | (1) | 1 | (22) | (8) | (13) | (1) | — | — | 3 | 3 | (1) | (1) | 4 | — | 4 | — | — | — | — | — | — | — |
| Impairments | 18 | 17 | 17 | 17 | — | — | (783) | 783 | — | — | — | — | — | — | 1 | — | — | — | — | — | — | 1 | 1 | — | — | — | — | — |
| Restructuring costs | 153 | 101 | 3 | — | 2 | — | — | 1 | 98 | 35 | 40 | 14 | — | 9 | 52 | 3 | 3 | 3 | — | — | — | 49 | — | 49 | — | — | — | — |
| Transaction and project costs | 150 | — | — | — | — | — | — | — | — | — | — | — | — | — | 149 | 36 | — | — | 36 | — | 36 | 113 | — | 113 | — | — | — | 1 |
| Gain on early settlement of 2026 and 2029 Notes | (46) | — | — | — | — | — | — | — | — | — | — | — | — | — | (46) | (46) | (46) | (46) | — | — | — | — | — | — | — | — | — | — |
| Compensation for losses incurred | (9) | (9) | — | — | — | — | — | — | (9) | — | — | — | (9) | — | — | — | — | — | — | — | — | — | — | — | — | — | — | — |
| Corporate leadership costs | 55 | 55 | — | — | — | — | — | — | 55 | — | — | — | — | 55 | — | — | — | — | — | — | — | — | — | — | — | — | — | — |
| Lease payments | (111) | (70) | (43) | (6) | (15) | (1) | — | (21) | (27) | (3) | (2) | (10) | (4) | (8) | (41) | (4) | — | — | (4) | — | (4) | (18) | (12) | (6) | (19) | (20) | 1 | — |
| Sandouville plant retirement costs | 15 | — | — | — | — | — | — | — | — | — | — | — | — | — | 15 | — | — | — | — | — | — | 15 | — | 15 | — | — | — | — |
| Gain/increase in equity-accounted investment | (8) | — | — | — | — | — | — | — | — | — | — | — | — | — | — | — | — | — | — | — | — | — | — | — | — | — | — | (8) |
Adjusted EBITDA1 | 31,843 | 28,202 | 19,207 | 9,907 | 9,385 | 86 | 1,317 | (1,488) | 8,995 | 3,950 | 141 | 1,591 | 3,632 | (319) | 4,164 | 3,769 | 1,689 | 1,086 | 2,683 | 603 | 2,080 | (443) | (250) | (193) | 838 | 900 | (62) | (523) |
1 The SA rand amounts can be translated to US dollar at an average exchange rate of R16.41/US$ which amounts to a profit before royalties, carbon tax and tax of US$1,694 million (R27,782 million) and adjusted EBITDA of US$1,941 million (R31,843 million)
| | | | | | | | | | | | | | | | | | | | | | | | | | | | | | | | | | | | | | | | | | | | | | | | | | | | | | | | | | | | | | | | | | | | | | | | | | | | | | | | | | | | | | |
| For the six months ended 31 December 2025 (Unaudited) |
| | SA OPERATIONS | | AMERICAS | | | | | | EUROPE | | | AUSTRALIA | | | |
| GROUP | PRIMARY MINING | SECONDARY MINING | | | | | PRIMARY MINING | RECYCLING | | | | | | | SECONDARY MINING | | GROUP |
| SA rand | Total | Total SA
Operations | Total
SA PGM | Rusten-
burg | Marikana | Platinum
Mile | Mimosa | Corporate
and re-
conciling
items | Total
SA gold | Drie-
fontein | Kloof | Beatrix | DRD-
GOLD | Corporate
and re-
conciling
items | Total international operations | Total US operations | Total US PGM | US PGM | Total US recycling | Montana | Pennsylvania site and North Carolina site | Total
EU operations | Keliber Oy | Corporate
and re-
conciling
items | Total AUS operations | Century zinc retreatment operation | Corporate
and re-
conciling
items | Cor-
porate |
Reconciliation of profit/(loss) before royalties, carbon tax and tax to adjusted EBITDA1 | | | | | | | | | | | | | | | | | | | | | | | | | | | | |
Profit/(loss) before royalties, carbon tax and tax1 | 2,936 | 9,946 | 9,007 | 7,997 | 3,147 | 79 | 772 | (2,988) | 939 | 2,510 | (4,502) | 1,352 | 2,449 | (870) | (2,324) | 501 | 735 | 79 | 422 | 656 | (234) | (3,708) | (2,356) | (1,352) | 883 | 945 | (62) | (4,686) |
| Adjusted for: | | | | | | | | | | | | | | | — | — | | | — | | | | | | | | | |
| Amortisation and depreciation | 5,149 | 4,318 | 2,270 | 1,087 | 1,131 | 24 | 180 | (152) | 2,048 | 1,127 | 343 | 201 | 206 | 171 | 828 | 815 | 680 | 677 | 138 | 3 | 135 | 12 | 12 | — | 1 | — | 1 | 3 |
| Interest income | (882) | (451) | (188) | (50) | (106) | (8) | (8) | (16) | (263) | (42) | (40) | (23) | (105) | (53) | (314) | (291) | (287) | (160) | (131) | (127) | (4) | (19) | (19) | — | (4) | (4) | — | (117) |
| Finance expense | 2,447 | 855 | 364 | 1,103 | 226 | — | 41 | (1,006) | 491 | 66 | 86 | 60 | 34 | 245 | 1,036 | 891 | 862 | 862 | 29 | — | 29 | 56 | 49 | 7 | 89 | 82 | 7 | 556 |
| Share-based payments | 1,499 | 908 | 522 | 276 | 252 | 3 | — | (9) | 386 | 98 | 76 | 58 | 24 | 130 | 580 | 355 | 333 | 333 | 22 | — | 22 | 169 | 48 | 121 | 56 | 56 | — | 11 |
| (Gain)/loss on financial instruments | 3,403 | 2,891 | 255 | (3,450) | 209 | — | (2) | 3,498 | 2,636 | (15) | (13) | (9) | (11) | 2,684 | 511 | 706 | — | — | 706 | — | 706 | (258) | (290) | 32 | 63 | 63 | — | 1 |
| Loss/(gain) on foreign exchange movements | 6 | 13 | 145 | 57 | 61 | 28 | 5 | (6) | (132) | — | — | — | — | (132) | 38 | 31 | 13 | 13 | 18 | — | 18 | (19) | (7) | (12) | 26 | 21 | 5 | (45) |
| Share of results of equity-accounted investees after tax | (769) | (786) | (513) | — | — | — | — | (513) | (273) | — | — | — | — | (273) | — | — | 7 | 7 | (7) | — | (7) | — | — | — | — | — | — | 17 |
| Change in estimate of environmental rehabilitation obligation, and right of recovery liability and asset | 593 | 58 | 50 | 53 | (4) | — | — | 1 | 8 | — | — | (8) | — | 16 | 535 | — | — | — | — | — | — | 729 | — | 729 | (194) | (184) | (10) | — |
| (Gain)/loss on disposal of property, plant and equipment | 30 | 5 | 38 | (12) | (2) | — | — | 52 | (33) | (14) | (9) | (9) | — | (1) | 25 | 25 | 25 | 25 | — | — | — | — | — | — | — | — | — | — |
| Impairments | 4,341 | 1,855 | (1) | — | — | — | — | (1) | 1,856 | (166) | 3,779 | (449) | — | (1,308) | 2,460 | — | — | — | — | — | — | 2,460 | 2,460 | — | — | — | — | 26 |
| Occupational healthcare gain | 46 | 46 | — | — | — | — | — | — | 46 | — | — | — | — | 46 | — | — | — | — | — | — | — | — | — | — | — | — | — | — |
| Restructuring costs | 5 | 5 | — | 1 | — | — | — | (1) | 5 | — | 1 | — | — | 4 | — | — | — | — | — | — | — | — | — | — | — | — | — | — |
| Transaction and project costs | 4,125 | (1) | (1) | — | — | — | — | (1) | — | — | — | — | — | — | 323 | 45 | (130) | (130) | 175 | — | 175 | 274 | — | 274 | 4 | — | 4 | 3,803 |
| Lease payments | (147) | (72) | (44) | (10) | (14) | — | — | (20) | (28) | (2) | (3) | (10) | (7) | (6) | (75) | — | 1 | 1 | (1) | — | (1) | (20) | (10) | (10) | (55) | (54) | (1) | — |
| Corporate leadership costs | 41 | 41 | — | — | — | — | — | — | 41 | — | — | — | — | 41 | — | — | — | — | — | — | — | — | — | — | — | — | — | — |
| Compensation for losses incurred | (75) | (38) | — | — | — | — | — | — | (38) | — | (27) | (1) | — | (10) | (37) | (37) | (37) | (37) | — | — | — | — | — | — | — | — | — | — |
| Gain on increase in equity-accounted investment | (5) | — | — | — | — | — | — | — | — | — | — | — | — | — | — | — | — | — | — | — | — | — | — | — | — | — | — | (5) |
| Gain on assets held for sale | (16) | 7 | — | — | — | — | — | — | 7 | — | — | — | 7 | — | (23) | (1) | (1) | (1) | — | — | — | (22) | — | (22) | — | — | — | — |
| Adjusted EBITDA | 22,727 | 19,600 | 11,904 | 7,052 | 4,900 | 126 | 988 | (1,162) | 7,696 | 3,562 | (309) | 1,162 | 2,597 | 684 | 3,563 | 3,040 | 2,201 | 1,669 | 1,371 | 532 | 839 | (346) | (113) | (233) | 869 | 925 | (56) | (436) |
Sibanye-Stillwater Operating and financial results | Six months ended 30 June 2026 51
| | | | | | | | | | | | | | | | | | | | | | | | | | | | | | | | | | | | | | | | | | | | | | | | | | | | | | | | | | | | | | | | | | | | | | | | | | | | | | | | | | | | | | |
| For the six months ended 30 June 2025 (Unaudited) |
| | SA OPERATIONS | | AMERICAS | | | | | | EUROPE | | | AUSTRALIA | | | |
| GROUP | PRIMARY MINING | SECONDARY MINING | | | | | PRIMARY MINING | RECYCLING | | | | | | | SECONDARY MINING | | GROUP |
| SA rand | Total | Total SA
Operations | Total
SA PGM | Rusten-
burg | Marikana | Platinum
Mile | Mimosa | Corporate
and re-
conciling
items | Total
SA gold | Drie-
fontein | Kloof | Beatrix | DRD-
GOLD | Corporate
and re-
conciling
items | Total international operations | Total US operations | Total US PGM | US PGM | Total US recycling | Montana | Pennsylvania site recycling | Total
EU operations | Keliber Oy | Corporate
and re-
conciling
items | Total AUS operations | Century zinc retreatment operation | Corporate and re- conciling items1 | Cor-
porate |
| Reconciliation of profit before royalties, carbon tax and tax to adjusted EBITDA: | | | | | | | | | | | | | | | | | | | | | | | | | | | | |
(Loss)/profit before royalties, carbon tax and tax1 | (2,202) | 4,152 | 1,619 | (931) | 1,416 | 23 | (780) | 1,891 | 2,533 | 1,140 | (341) | 624 | 1,793 | (683) | (5,546) | (657) | (771) | (3,145) | 2,488 | 2,374 | 114 | (5,695) | (5,355) | (340) | 806 | 888 | (82) | (808) |
| Adjusted for: | | | | | | | | | | | | | | | — | — | | | — | | | | | | | | | |
| Amortisation and depreciation | 4,218 | 3,537 | 1,933 | 920 | 969 | 23 | 232 | (211) | 1,604 | 867 | 374 | 162 | 186 | 15 | 681 | 674 | 572 | 569 | 105 | 3 | 102 | 7 | 5 | 2 | — | — | — | — |
| Interest income | (686) | (577) | (293) | (82) | (181) | (10) | (6) | (14) | (284) | (57) | (40) | (24) | (77) | (86) | (75) | (70) | (64) | (64) | (6) | — | (6) | (2) | (2) | — | (3) | (2) | (1) | (34) |
| Finance expense | 2,553 | 1,011 | 408 | 1,181 | 198 | — | 17 | (988) | 603 | 74 | 100 | 62 | 35 | 332 | 1,055 | 922 | 900 | 900 | 22 | — | 22 | 37 | 24 | 13 | 96 | 90 | 6 | 487 |
| Share-based payments | 615 | 394 | 239 | 122 | 109 | 2 | — | 6 | 155 | 44 | 35 | 25 | 16 | 35 | 218 | 125 | 120 | 120 | 5 | — | 5 | 76 | 15 | 61 | 17 | 17 | — | 3 |
| (Gain)/loss on financial instruments | 391 | 730 | 111 | 987 | 24 | — | 25 | (925) | 619 | (10) | (8) | (5) | (14) | 656 | (360) | 73 | — | — | 73 | — | 73 | (193) | (137) | (56) | (240) | (240) | — | 21 |
| Loss/(gain) on foreign exchange movements | (161) | (28) | 83 | 27 | 33 | 16 | 9 | (2) | (111) | — | — | — | — | (111) | (136) | 13 | 3 | 3 | 10 | — | 10 | (164) | (3) | (161) | 15 | 13 | 2 | 3 |
| Share of results of equity-accounted investees after tax | 432 | 417 | 660 | — | — | — | — | 660 | (243) | — | — | — | — | (243) | 11 | 11 | — | — | 11 | — | 11 | — | — | — | — | — | — | 4 |
| Change in estimate of environmental rehabilitation obligation, and right of recovery liability and asset | (98) | (98) | — | — | — | — | — | — | (98) | — | — | — | (98) | — | — | — | — | — | — | — | — | — | — | — | — | — | — | — |
| (Gain)/loss on disposal of property, plant and equipment | (16) | (43) | (19) | (14) | (5) | — | 1 | (1) | (24) | (19) | (4) | (5) | 4 | — | 27 | 27 | 27 | 27 | — | — | — | — | — | — | — | — | — | — |
| Impairments | 9,666 | 64 | 64 | — | — | — | 599 | (535) | — | — | — | — | — | — | 9,602 | 4,230 | 4,230 | 4,230 | — | — | — | 5,372 | 5,344 | 28 | — | — | — | — |
| Occupational healthcare gain | 3 | 3 | — | — | — | — | — | — | 3 | — | — | — | — | 3 | — | — | — | — | — | — | — | — | — | — | — | — | — | — |
| Restructuring costs | 242 | 70 | 9 | 3 | 4 | — | — | 2 | 61 | 6 | 8 | 15 | — | 32 | 172 | 2 | 2 | 2 | — | — | — | 170 | — | 170 | — | — | — | — |
| Transaction and project costs | 418 | — | — | — | — | — | — | — | — | — | — | — | — | — | 243 | 144 | 144 | 144 | — | — | — | 99 | — | 99 | — | — | — | 175 |
| Lease payments | (120) | (54) | (36) | (9) | (15) | (1) | — | (11) | (18) | — | (5) | (4) | (4) | (5) | (66) | (3) | (2) | (2) | (1) | — | (1) | (13) | (3) | (10) | (50) | (51) | 1 | — |
| Onerous contract provision | (124) | — | — | — | — | — | — | — | — | — | — | — | — | — | (124) | — | — | — | — | — | — | (124) | — | (124) | — | — | — | — |
| Corporate leadership costs | 9 | 9 | — | — | — | — | — | — | 9 | — | — | — | — | 9 | — | — | — | — | — | — | — | — | — | — | — | — | — | — |
| Compensation for losses incurred | (67) | | — | | | | | | — | | | | | | (67) | (9) | (9) | (9) | — | | | — | | | (58) | (58) | | |
| Other | — | — | — | 9 | — | — | — | (9) | — | — | — | — | — | — | — | — | — | — | — | — | — | — | — | — | — | — | — | — |
Adjusted EBITDA1 | 15,073 | 9,587 | 4,778 | 2,213 | 2,552 | 53 | 97 | (137) | 4,809 | 2,045 | 119 | 850 | 1,841 | (46) | 5,635 | 5,482 | 5,152 | 2,775 | 2,707 | 2,377 | 330 | (430) | (112) | (318) | 583 | 657 | (74) | (149) |
1 The SA rand amounts can be translated to US dollar at an average exchange rate of R18.39/US$ which amounts to a loss before royalties, carbon tax and tax of US$118 million (R2,202 million) and adjusted EBITDA of US$818 million (R15,073 million)
Sibanye-Stillwater Operating and financial results | Six months ended 30 June 2026 52
RECONCILIATION OF NOTIONAL FREE CASH FLOW TO NET CASH FROM OPERATING ACTIVITIES
| | | | | | | | | | | | | | | | | | | | | | | | | | | | | | | | | | | |
| Figures in million - SA rand | For the six months ended 30 June 2026 (Unaudited) |
| Group | Total of operations | Southern Africa Operations | Total SA PGM | Total SA gold | International Operations | Total US PGM (including Montana recycling) | Pennsylvania site and North Carolina site | Total EU operations | Total AUS operations | Corporate |
| Notional free cash flow | 14,450 | | 14,466 | | 14,317 | | 10,361 | | 3,956 | | 149 | | (459) | | 1,683 | | (1,742) | | 667 | | (16) | |
| Adjusted for: | | | | | | | | | | | |
| Property, plant and equipment additions | 8,306 | | 8,302 | | 5,988 | | 2,730 | | 3,258 | | 2,314 | | 963 | | 24 | | 1,285 | | 42 | | 4 | |
| Net royalties, carbon tax and tax paid | (5,709) | | (5,700) | | (5,316) | | (4,699) | | (617) | | (384) | | (34) | | (208) | | — | | (142) | | (9) | |
| Add back of accrued tax and royalties | 6,804 | | 6,797 | | 6,259 | | 5,388 | | 871 | | 538 | | 47 | | 373 | | — | | 118 | | 7 | |
| Cash-settled share-based payments made | (847) | | (845) | | (586) | | (393) | | (193) | | (259) | | (182) | | (1) | | (76) | | — | | (2) | |
| Dividends paid | (3,925) | | (5,351) | | (5,351) | | (5,135) | | (216) | | — | | — | | — | | — | | — | | 1,426 | |
| Net interest (including intercompany) | (452) | | (699) | | 321 | | 185 | | 136 | | (1,020) | | (589) | | (135) | | (281) | | (15) | | 247 | |
| Net working capital (including intercompany) | 9,883 | | 9,869 | | 2,552 | | 247 | | 2,305 | | 7,317 | | 811 | | 6,910 | | 132 | | (536) | | 14 | |
| Movement on metals consignment line | (8,123) | | (8,123) | | — | | — | | — | | (8,123) | | — | | (8,123) | | — | | — | | — | |
| Deferred revenue recognised | (241) | | (241) | | — | | — | | — | | (241) | | — | | (136) | | — | | (105) | | — | |
| Deferred revenue received in advance | 144 | | 144 | | — | | — | | — | | 144 | | — | | 144 | | — | | — | | — | |
| Re-allocation of stream revenue and costs | — | | 1,012 | | 730 | | 730 | | — | | 282 | | 282 | | — | | — | | — | | (1,012) | |
| Other items | (676) | | (666) | | (480) | | (178) | | (302) | | (186) | | (87) | | 38 | | (87) | | (50) | | (10) | |
| Net cash from operating activities | 19,614 | | 18,965 | | 18,434 | | 9,236 | | 9,198 | | 531 | | 752 | | 569 | | (769) | | (21) | | 649 | |
| | | | | | | | | | | | | | | | | | | | | | | | | | | | | | | | | | | |
| Figures in million - SA rand | For the six months ended 31 December 2025 (Unaudited) |
| Group | Total of operations | Southern Africa Operations | Total SA PGM | Total SA gold | International Operations | Total US PGM (including Montana recycling) | Pennsylvania site and North Carolina site | Total EU operations | Total AUS operations | Corporate |
| Notional free cash flow | 2,283 | | 5,867 | | 7,551 | | 5,405 | | 2,146 | | (1,684) | | 232 | | 739 | | (3,242) | | 587 | | (3,584) | |
| Adjusted for: | | | | | | | | | | | |
| Property, plant and equipment additions | 10,769 | | 10,768 | | 6,876 | | 3,194 | | 3,682 | | 3,892 | | 869 | | 35 | | 2,871 | | 117 | | 1 | |
| Net royalties, carbon tax and tax paid | (3,081) | | (3,075) | | (2,896) | | (2,488) | | (408) | | (179) | | 12 | | (50) | | 1 | | (142) | | (6) | |
| Add back of accrued tax and royalties | 3,035 | | 3,026 | | 2,811 | | 2,653 | | 158 | | 215 | | 19 | | 67 | | (4) | | 133 | | 9 | |
| Cash-settled share-based payments made | (567) | | (561) | | (373) | | (279) | | (94) | | (188) | | (89) | | (8) | | (71) | | (20) | | (6) | |
| Dividends paid | (173) | | (263) | | (172) | | — | | (172) | | (91) | | — | | — | | (91) | | — | | 90 | |
| Net interest (including intercompany) | (783) | | (926) | | (6) | | (29) | | 23 | | (920) | | (509) | | (130) | | (250) | | (31) | | 143 | |
| Net working capital (including intercompany) | 1,751 | | 1,687 | | (1,794) | | (1,222) | | (572) | | 3,481 | | (767) | | 4,222 | | 155 | | (129) | | 64 | |
| Movement on metals consignment line | (4,519) | | (4,519) | | — | | — | | — | | (4,519) | | — | | (4,519) | | — | | — | | — | |
| Deferred revenue recognised | (631) | | (631) | | — | | — | | — | | (631) | | — | | (255) | | — | | (376) | | — | |
| Deferred revenue received in advance | 668 | | 668 | | — | | — | | — | | 668 | | — | | 189 | | — | | 479 | | — | |
| Re-allocation of stream revenue and costs | — | | 900 | | 649 | | 649 | | — | | 251 | | 251 | | — | | — | | — | | (900) | |
| Other items | (522) | | (182) | | (210) | | (90) | | (120) | | 28 | | (162) | | 156 | | (49) | | 83 | | (340) | |
| Net cash from operating activities | 8,230 | | 12,759 | | 12,436 | | 7,793 | | 4,643 | | 323 | | (144) | | 446 | | (680) | | 701 | | (4,529) | |
| | | | | | | | | | | | | | | | | | | | | | | | | | | | | | | | | | | |
| Figures in million - SA rand | For the six months ended 30 June 2025 (Unaudited) |
| Group | Total of operations | Southern Africa Operations | Total SA PGM | Total SA gold | International Operations | Total US PGM (including Montana recycling) | Pennsylvania site and North Carolina site | Total EU operations | Total AUS operations | Corporate |
| Notional free cash flow | (2,254) | | (2,192) | | 1,519 | | 441 | | 1,078 | | (3,711) | | (1,063) | | 273 | | (3,330) | | 409 | | (62) | |
| Adjusted for: | | | | | | | | | | | |
| Property, plant and equipment additions | 9,538 | | 9,536 | | 5,655 | | 2,716 | | 2,939 | | 3,881 | | 910 | | 11 | | 2,891 | | 69 | | 2 | |
| Net royalties, carbon tax and tax paid | 216 | | 220 | | 221 | | 203 | | 18 | | (1) | | 274 | | (80) | | 11 | | (206) | | (4) | |
| Add back of accrued tax and royalties | 527 | | 524 | | 356 | | 362 | | (6) | | 168 | | 27 | | 45 | | (3) | | 99 | | 3 | |
| Cash-settled share-based payments made | (82) | | (82) | | (60) | | — | | (60) | | (22) | | (22) | | — | | — | | — | | — | |
| Dividends paid | (129) | | (4,497) | | (4,497) | | (3,289) | | (1,208) | | — | | — | | — | | — | | — | | 4,368 | |
| Net interest (including intercompany) | (705) | | (718) | | 42 | | 46 | | (4) | | (760) | | (499) | | (74) | | (163) | | (24) | | 13 | |
| Net working capital (including intercompany) | 522 | | 589 | | (2,440) | | (4,093) | | 1,653 | | 3,029 | | (526) | | 3,195 | | 423 | | (63) | | (67) | |
| Movement on metals consignment line | (3,126) | | (3,126) | | — | | — | | — | | (3,126) | | — | | (3,126) | | — | | — | | — | |
| Deferred revenue recognised | (790) | | (790) | | — | | — | | — | | (790) | | — | | (165) | | — | | (625) | | — | |
| Deferred revenue received in advance | 10,077 | | 862 | | — | | — | | — | | 862 | | — | | 244 | | — | | 618 | | 9,215 | |
| Re-allocation of stream revenue and costs | — | | 752 | | 528 | | 528 | | — | | 224 | | 224 | | — | | — | | — | | (752) | |
| Other items | (617) | | (469) | | (225) | | (106) | | (119) | | (244) | | (459) | | 150 | | (29) | | 94 | | (148) | |
| Net cash from operating activities | 13,177 | | 609 | | 1,099 | | (3,192) | | 4,291 | | (490) | | (1,134) | | 473 | | (200) | | 371 | | 12,568 | |
Sibanye-Stillwater Operating and financial results | Six months ended 30 June 2026 53
ADMINISTRATION AND CORPORATE INFORMATION
| | | | | |
SIBANYE STILLWATER LIMITED (SIBANYE-STILLWATER) Incorporated in the Republic of South Africa Registration number 2014/243852/06 Share code: SSW and SBSW Issuer code: SSW ISIN: ZAE000259701 LISTINGS JSE: SSW NYSE: SBSW WEBSITE www.sibanyestillwater.com REGISTERED AND CORPORATE OFFICE Constantia Office Park Bridgeview House, Building 11, Ground floor Cnr 14th Avenue & Hendrik Potgieter Road Weltevreden Park 1709 South Africa Private Bag X5 Westonaria 1780 South Africa Tel: +27 11 278 9600 Fax: +27 11 278 9863 COMPANY SECRETARY Lerato Matlosa Email: lerato.matlosa@sibanyestillwater.com DIRECTORS Dr Vincent Maphai* (Chairman) Dr Richard Stewart (CEO) Charl Keyter (CFO) Dr Elaine Dorward-King* Harry Kenyon-Slaney* ^ Prof Jeremiah Vilakazi# Dr Lindiwe Mthimunye* Keith Rayner# Dr Peter Hancock* Philippe Boisseau* Richard Menell# Sindiswa Zilwa* Terence Nombembe* * Independent non-executive # Non-executive ^ Lead independent director INVESTOR ENQUIRIES Please send any Investor Relations enquiries to: ir@sibanyestillwater.com
JSE SPONSOR J.P. Morgan Equities South Africa Proprietary Limited Registration number 1995/011815/07 1 Fricker Road, Illovo Johannesburg 2196 South Africa Private Bag X9936 Sandton 2146 South Africa | AUDITORS BDO SOUTH AFRICA INC. Wanderers Office Park 52 Corlett Drive Illovo, 2196 South Africa Private Bag X60500 Houghton 2041 Tel: +27 011 488 1700 AMERICAN DEPOSITARY RECEIPTS TRANSFER AGENT BNY Mellon Shareowner Correspondence (ADSs) Mailing address of agent: BNY Shareowner Services PO Box 43006 Providence, RI 02940 United States of America US toll free: + 1 888 269 2377 Tel: +1 201 680 6825 Email: shrrelations@cpushareownerservices.com BNY Depositary Receipts Client Service Management Tel: +1 212 815 4836 Email: drclientserviceny@bny.com TRANSFER SECRETARIES SOUTH AFRICA Computershare Investor Services Proprietary Limited Rosebank Towers 15 Biermann Avenue Rosebank 2196 PO Box 61051 Marshalltown 2107 South Africa Tel: +27 11 370 5000 Fax: +27 11 688 5248
|
Sibanye-Stillwater Operating and financial results | Six months ended 30 June 2026 54
DISCLAIMER
Forward-looking statements
The information in this report may contain forward-looking statements within the meaning of the “safe harbour” provisions of the United States Private Securities Litigation Reform Act of 1995. These forward-looking statements, including, among others, those relating to Sibanye Stillwater Limited’s (Sibanye-Stillwater or the Group) financial positions, business strategies, business prospects, industry forecasts, production and operational guidance, climate and ESG-related targets and metrics, plans and objectives of management for future operations, are necessarily estimates reflecting the best judgment of the senior management and directors of Sibanye-Stillwater and involve a number of risks and uncertainties that could cause actual results to differ materially from those suggested by the forward-looking statements. As a consequence, these forward-looking statements should be considered in light of various important factors, including those set forth in this report.
All statements other than statements of historical facts included in this report may be forward-looking statements. Forward-looking statements also often use words such as “will”, “would”, “expect”, “forecast”, “potential”, “may”, “could”, “believe”, “aim”, “anticipate”, “target”, “estimate” and words of similar meaning. By their nature, forward-looking statements involve risk and uncertainty because they relate to future events and circumstances and should be considered in light of various important factors, including those set forth in this disclaimer. Readers are cautioned not to place undue reliance on such statements.
The important factors that could cause Sibanye-Stillwater’s actual results, performance or achievements to differ materially from estimates or projections contained in the forward-looking statements include, without limitation, Sibanye-Stillwater’s future financial position, plans, strategies, objectives, capital expenditures, projected costs and anticipated cost savings, financing plans, debt position and ability to reduce debt leverage; economic, business, political and social conditions in South Africa, Zimbabwe, the United States, Europe and elsewhere; plans and objectives of management for future operations; Sibanye-Stillwater’s ability to obtain the benefits of any streaming arrangements or pipeline financing; the ability of Sibanye-Stillwater to comply with loan and other covenants and restrictions and difficulties in obtaining additional financing or refinancing; Sibanye-Stillwater’s ability to service its bond instruments; changes in assumptions underlying Sibanye-Stillwater’s estimation of its Mineral Resources and Mineral Reserves; any failure of a tailings storage facility; the ability to achieve anticipated efficiencies and other cost savings in connection with, and the ability to successfully integrate, past, ongoing and future acquisitions (including Metallix), as well as at existing operations; the ability of Sibanye-Stillwater to complete any ongoing or future acquisitions; the success of Sibanye-Stillwater’s business strategy and exploration and development activities, including any proposed, anticipated or planned expansions into the battery metals or adjacent sectors and estimations or expectations of enterprise value; the ability of Sibanye-Stillwater to comply with requirements that it operate in ways that provide progressive benefits to affected communities; changes in the market price of gold, silver, PGMs, battery metals (e.g., nickel, lithium, copper and zinc) and the cost of power, petroleum fuels, and oil, among other commodities and supply requirements; the occurrence of hazards associated with underground and surface mining; any downgrade of South Africa’s credit rating; a challenge regarding the title to any of Sibanye-Stillwater’s properties by claimants to land under restitution and other legislation; Sibanye-Stillwater’s ability to implement its strategy and any changes thereto; the outcome of legal challenges to the Group’s mining or other land use rights; the occurrence of labour disputes, disruptions and industrial actions; the availability, terms and deployment of capital or credit; changes in the imposition of industry standards, regulatory costs and relevant government regulations, particularly environmental, sustainability, tax, health and safety regulations and new legislation affecting water, mining, mineral rights and business ownership, including any interpretation thereof which may be subject to dispute; the outcome and consequence of any potential or pending litigation or regulatory proceedings, including in relation to any environmental, health or safety issues; failure to meet ethical standards, including actual or alleged instances of fraud, bribery or corruption; the effect of climate change or other extreme weather events on Sibanye-Stillwater’s business; the concentration of all final refining activity and a large portion of Sibanye-Stillwater’s PGM sales from mine production in the United States with one entity; the identification of a material weakness in disclosure and internal controls over financial reporting; the effect of US tax reform legislation on Sibanye-Stillwater and its subsidiaries; the effect of South African Exchange Control Regulations on Sibanye-Stillwater’s financial flexibility; operating in new geographies and regulatory environments where Sibanye-Stillwater has no previous experience; power disruptions, constraints and cost increases; supply chain disruptions and shortages and increases in the price of production inputs; the regional concentration of Sibanye-Stillwater’s operations; fluctuations in exchange rates, currency devaluations, inflation and other macro-economic monetary policies; the occurrence of temporary stoppages or precautionary suspension of operations at its mines for safety or environmental incidents (including natural disasters) and unplanned maintenance; Sibanye-Stillwater’s ability to hire and retain senior management and employees with sufficient technical and/or production skills across its global operations necessary to meet its labour recruitment and retention goals, as well as its ability to achieve sufficient representation of historically disadvantaged South Africans in its management positions, or maintain required board gender diversity; failure of Sibanye-Stillwater’s information technology, communications and systems, evolving cyber threats to Sibanye-Stillwater's operations and the impact of cybersecurity incidents or breaches; the adequacy of Sibanye-Stillwater’s insurance coverage; social unrest, sickness or natural or man-made disaster in surrounding mining communities, including informal settlements in the vicinity of some of Sibanye-Stillwater’s South African-based operations; and the impact of contagious diseases, including global pandemics.
Further details of potential risks and uncertainties affecting Sibanye-Stillwater are described in Sibanye-Stillwater’s filings with the Johannesburg Stock Exchange and the United States Securities and Exchange Commission, including the 2025 Integrated Report and the Annual Financial Report for the fiscal year ended 31 December 2025 on Form 20-F filed with the United States Securities and Exchange Commission on 24 April 2026 (SEC File no. 333-234096).
These forward-looking statements speak only as of the date of the content. Sibanye-Stillwater expressly disclaims any obligation or undertaking to update or revise any forward-looking statement (except to the extent legally required). These forward-looking statements have not been reviewed or reported on by the Group’s external auditors.
Non-IFRS1 measures
The information contained in this report may contain certain non-IFRS measures, including, among others, adjusted EBITDA, notional free cash flow, AISC, AIC, net debt/(cash), net debt/(cash) to adjusted EBITDA (ratio), headline earnings and normalised earnings. These measures may not be comparable to similarly-titled measures used by other companies and are not measures of Sibanye-Stillwater’s financial performance under IFRS Accounting Standards. These measures should not be considered in isolation or as a substitute for measures of performance prepared in accordance with IFRS Accounting Standards. Sibanye-Stillwater is not providing a reconciliation of the forecast non-IFRS financial information presented in this report because it is unable to provide this reconciliation without unreasonable effort. These forecast non-IFRS financial information measures presented have not been reviewed or reported on by the Group’s external auditors.
1 IFRS refers to International Financial Reporting Standards Accounting Standards (IFRS Accounting Standards) as issued by the International Accounting Standards Board (IASB)
Websites
References in this document to information on websites (and/or social media sites) are included as an aid to their location and such information is not incorporated in, and does not form part of, this report.
Sibanye-Stillwater Operating and financial results | Six months ended 30 June 2026 55