
| |
&bsp;
|
XP Inc. Reports First Quarter 2026 Results
São Paulo, Brazil, May 18, 2026 – XP Inc. (NASDAQ: XP) (“XP” or the “Company”), a leading tech-enabled platform and a trusted pioneer in providing low-fee financial products and services in Brazil, reported today its financial results for the first quarter of 2026.
Summary1
| Operating Metrics (unaudited) | 1Q26 | 1Q25 | YoY | 4Q25 | QoQ |
| Total Client Assets (in R$ bn) | 1,529 | 1,328 | 15% | 1,491 | 3% |
| Total Net Inflow (in R$ bn) | 14 | 24 | -39% | 32 | -55% |
| Annualized Retail Take Rate | 1.18% | 1.25% | -7 bps | 1.25% | -7 bps |
| Active Clients (in '000s) | 4,790 | 4,693 | 2% | 4,762 | 1% |
| Headcount (EoP) | 8,280 | 7,356 | 13% | 8,093 | 2% |
| Total Advisors (in '000s) | 18.3 | 18.1 | 1% | 18.0 | 2% |
| Retail DATs (in mn) | 2.7 | 2.2 | 23% | 2.2 | 21% |
| Retirement Plans Client Assets (in R$ bn) | 98 | 83 | 17% | 95 | 3% |
| Cards TPV (in R$ bn) | 13.3 | 12.1 | 10% | 14.6 | -9% |
| Expanded Loan Portfolio (in R$ bn) | 74.3 | 64.2 | 16% | 78.0 | -5% |
| Gross Written Premiums (in R$ mn) | 405 | 348 | 16% | 502 | -19% |
| Financial Metrics (in R$ mn)1 | 1Q26 | 1Q25 | YoY | 4Q25 | QoQ |
| Gross revenue | 4,919 | 4,557 | 8% | 5,279 | -7% |
| Retail | 3,773 | 3,441 | 10% | 3,862 | -2% |
| Wholesale Bank | 1,146 | 906 | 26% | 1,241 | -8% |
| Other | - | 210 | -100% | 175 | -100% |
| Net Revenue | 4,733 | 4,392 | 8% | 5,017 | -6% |
| Gross Profit | 3,179 | 2,963 | 7% | 3,481 | -9% |
| Gross Margin | 67.2% | 67.5% | -29 bps | 69.4% | -222 bps |
| EBT | 1,418 | 1,314 | 8% | 1,640 | -14% |
| EBT Margin | 30.0% | 29.9% | 5 bps | 32.7% | -273 bps |
| Adjusted Net Income | 1,318 | 1,236 | 7% | 1,331 | -1% |
| Adjusted Net Margin | 27.8% | 28.1% | -30 bps | 26.5% | 132 bps |
| Adjusted Diluted EPS (in R$) | 2.49 | 2.29 | 9% | 2.56 | -3% |
| Adjusted ROAE2 | 21.7% | 24.1% | -235 bps | 22.8% | -108 bps |
| Adjusted ROTE3 | 26.2% | 30.2% | -391 bps | 27.7% | -145 bps |
| Capital Ratio | 20.7% | 19.0% | 169 bps | 20.4% | 27 bps |
1 – Please refer to the Non-GAAP Financial Reconciliation.
2 – Annualized Return on Average Equity.
3 – Annualized Return on Average Tangible Equity. Tangible Equity excludes Intangibles and Goodwill
&bsp;
|
Operating KPIs
| 1. | INVESTMENTS |
Client Assets and Net Inflow (in R$ billion)
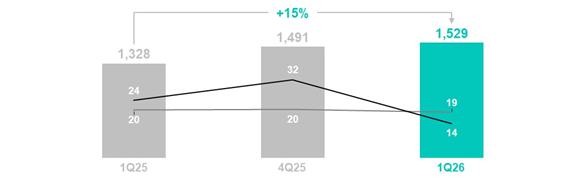

Client Assets totaled R$1.5 trillion in 1Q26, up 15%YoY and 3% QoQ. Year-over-year growth was driven by R$85 billion net inflow and R$116 billion of market appreciation.
In 1Q26, Net Inflow was R$14 billion, and Retail Net Inflow was R$19 billion, in line with both year-on-year and quarter-on-quarter levels.
Active Clients (in ‘000s)
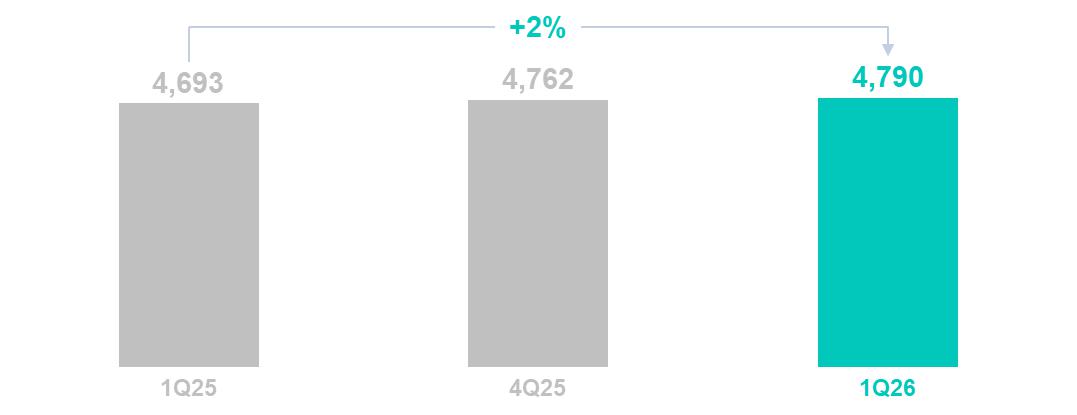
Active clients grew 2% YoY and 1% QoQ, totaling 4.8 million in 1Q26.
&bsp;
|
Total Advisors (in ‘000s)
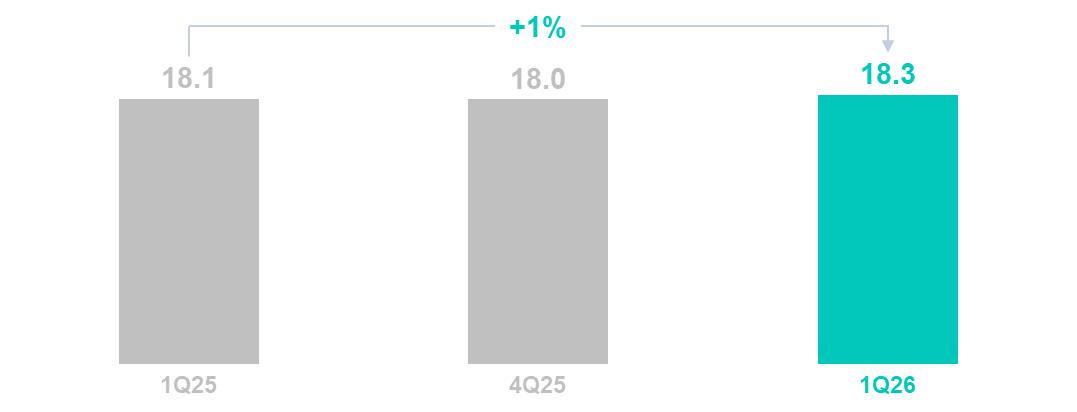
Total Advisors connected to XP, including (1) IFAs, (2) XP employees who offer advisory services, (3) Registered Investment Advisors, consultants and wealth managers, among others. As of 1Q26, we had 18.3 thousand Total Advisors, an increase of approximately 1% YoY.
Retail Daily Average Trades (in million)
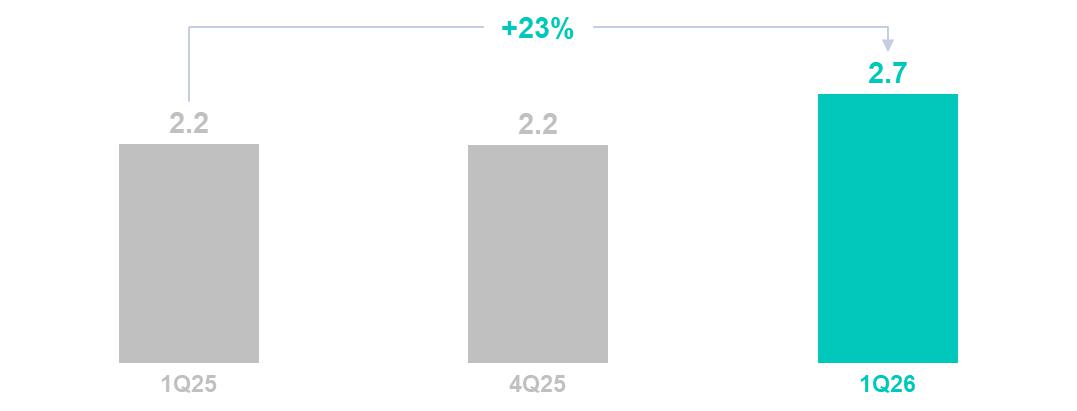
Retail DATs totaled 2.7 million in 1Q26, up 23% YoY and 21% QoQ.
NPS
Our NPS, a widely known survey methodology used to measure customer satisfaction, was 61 in 1Q26. The NPS calculation as of a given date reflects the average scores in the prior six months.
&bsp;
|
| 2. | RETIREMENT PLANS |
Retirement Plans Client Assets (in R$ billion)
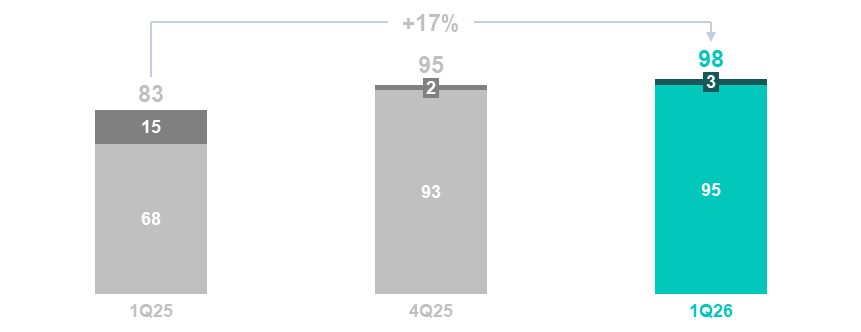

As per public data published by Susep, XPV&P’s individual’s market share (PGBL and VGBL) was stable at 5%. Total Client Assets were R$98 billion in 1Q26, up 17% YoY. Assets from XPV&P, our proprietary insurer, grew 39% YoY, reaching R$95 billion.
| 3. | CARDS |
Cards TPV (in R$ billion)
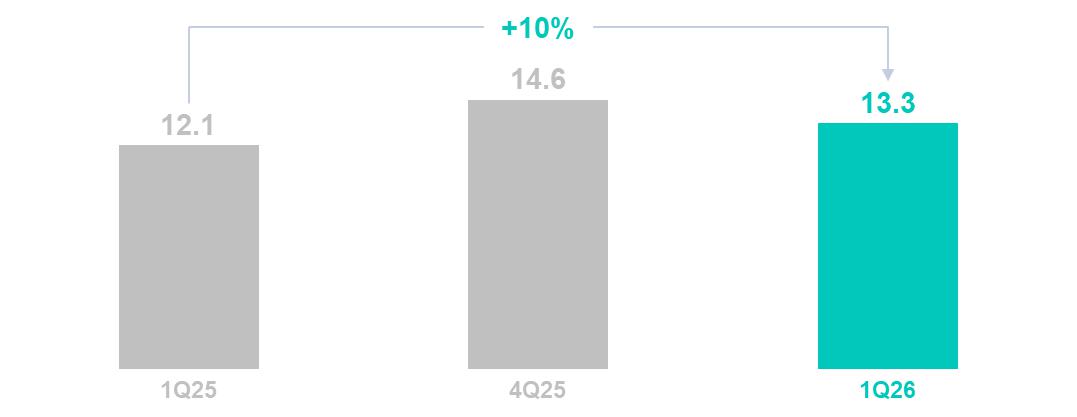
In 1Q26, Total TPV was R$13.3 billion, a 10% growth YoY and 9% decrease QoQ, given the year-end seasonality in 4Q25.
&bsp;
|
Active Cards (in ‘000s)
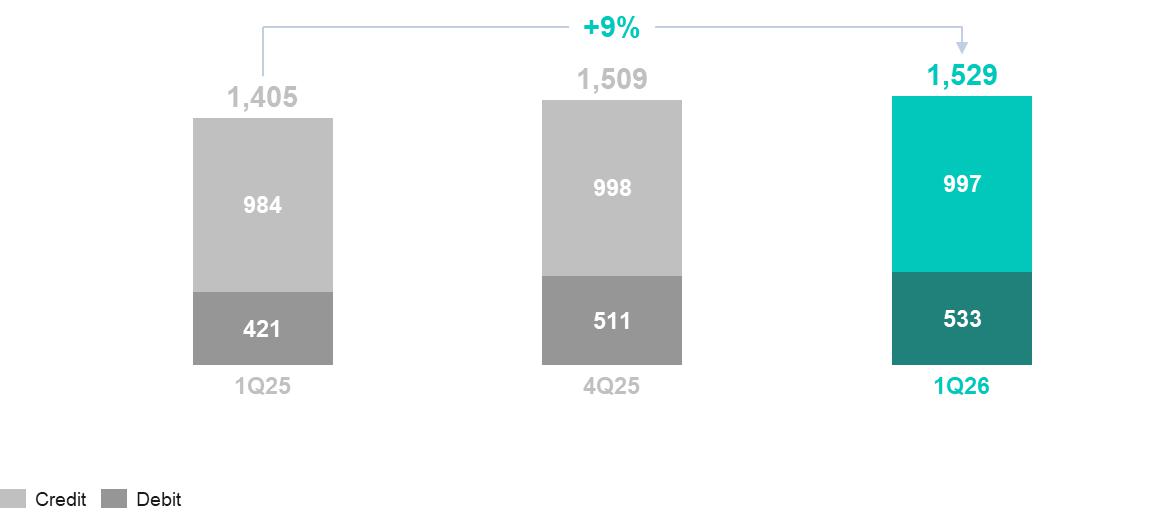
Total Active Cards were 1.5 million in 1Q26, representing a 9% growth YoY and 1% up QoQ, being close to 1.0 million Credit Cards and 0.5 million Active Debit Cards.
| 4. | CREDIT |
Expanded Loan Portfolio (in R$ billion)
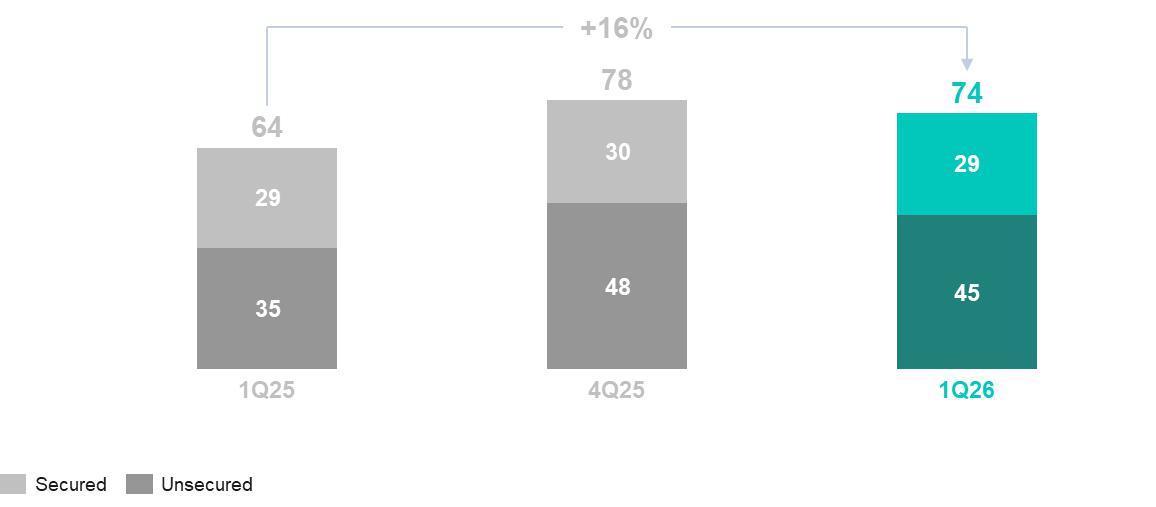
Expanded Loan Portfolio reached R$74 billion as of 1Q26, expanding 16% YoY and 5% lower QoQ.
&bsp;
|
| 5. | INSURANCE |
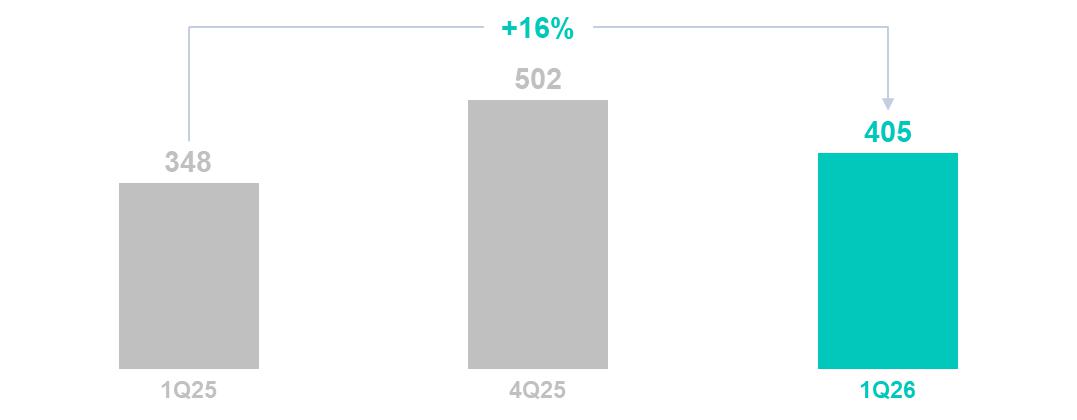
Gross Written Premiums (in R$ million)
Gross written premiums (GWP) refer to the total amount of premium income that XPs has written or sold during a particular reporting period before deductions for provisions, reinsurance and other expenses. This figure represents the total premiums that customers have agreed to pay for life insurance policies issued by the company or sold by the company and issued by third-party insurers, including both new policies and renewals. It is a crucial metric for assessing the total business volume of an insurance company or insurance broker within that period.
In 1Q26, Gross Written Premiums grew 16% YoY and decreased 19% QoQ.
&bsp;
|
Discussion of Financial Results
Total Gross Revenue1
Gross revenue reached R$4.9 billion in 1Q26, reflecting an increase of 8% year-over-year and 7% lower quarter-over-quarter.
The year-over-year growth was driven by equities, retail new verticals, and other retail, with new ventures and floating expanding at a rapid pace. The Wholesale bank division also delivered year-over-year growth.
Retail Revenue
| (in R$ mn) | 1Q26 | 1Q25 | YoY | 4Q25 | QoQ |
| Retail Revenue | 3.773 | 3.441 | 10% | 3.862 | -2% |
| Equities | 1.167 | 959 | 22% | 1.035 | 13% |
| Fixed Income | 756 | 1.015 | -25% | 934 | -19% |
| Funds Platform | 392 | 322 | 22% | 412 | -5% |
| Retirement Plans | 118 | 107 | 11% | 131 | -9% |
| Cards | 356 | 319 | 12% | 398 | -11% |
| Credit | 90 | 82 | 10% | 83 | 9% |
| Insurance | 59 | 53 | 11% | 123 | -52% |
| Other Retail | 834 | 584 | 43% | 747 | 12% |
| Annualized Retail Take Rate | 1,18% | 1,25% | -7 bps | 1,25% | -7 bps |
Retail revenue reached R$3,773 million in 1Q26, representing a 2% decrease quarter-over-quarter and a 10% increase year-over-year.
Retail revenue growth in 1Q26 was supported by increase in equity volumes, driven by higher ADTV in equities and futures. Consequently, Equities revenues increased 13% quarter-over-quarter and 22% when compared to the same period of last year, reaching almost R$1.2 billion. Retail Revenue performance also benefited from strong contributions from float and new verticals, which are reported in the Other Retail line and gained representativeness during the quarter.
Take Rate
Annualized Retail Take Rate was 1.18% in 1Q26, 7bps lower QoQ and YoY.
&bsp;
|
Wholesale Banking
We now include our Institutional business in the Wholesale segment. Taken together, Corporate, Issuer Services and Institutional grew 26% year-over-year, with revenues totaling R$1,146 million in 1Q26. The YoY performance was driven by a robust Corporate activity, with revenues reaching R$498 million, a 78% increase YoY. Due to high volatility, we were able to serve our clients with more derivatives, foreign exchange and trading solutions, boosting this segment’s revenues.
Other Revenue
Accompanying the final phase of our restructuring, the Other revenue line has become less relevant over the years and ceased to exist, being incorporated in the net interest margin across our business lines.
Costs of Goods Sold and Gross Margin
Gross Margin was 67.2% in 1Q26 versus 69.4% in 4Q25 and 67.5% in 1Q25.
SG&A Expenses
| (in R$ mn) | 1Q26 | 1Q25 | YoY | 4Q25 | QoQ |
| Total SG&A | (1,610) | (1,416) | 14% | (1,722) | -6% |
| People | (1,096) | (970) | 13% | (1,140) | -4% |
| Salary and Taxes | (480) | (439) | 9% | (450) | 7% |
| Bonuses | (505) | (383) | 32% | (565) | -11% |
| Share Based Compensation | (111) | (148) | -25% | (124) | -11% |
| Non-people | (514) | (447) | 15% | (582) | -12% |
| LTM Compensation Ratio4 | -23.2% | -22.8% | -39 bps | -22.9% | -26 bps |
| LTM Efficiency Ratio5 | -34.6% | -33.6% | -102 bps | -34.2% | -41 bps |
| Headcount (EoP) | 8,280 | 7,356 | 13% | 8,093 | 2% |
SG&A expenses totaled R$1.6 billion in 1Q26, 6% lower QoQ, and 14% higher YoY.
Our last twelve months (LTM) compensation ratio43in 1Q26 was 23.2%. Also, our LTM efficiency ratio54reached 34.6% in 1Q26.
4 - Compensation ratio is calculated as People SG&A (Salary and Taxes, Bonuses and Share Based Compensation) divided by Net Revenue.
5 - Efficiency ratio is calculated as SG&A ex-revenue from incentives from Tesouro Direto, B3, and others divided by Net Revenue.
&bsp;
|
Earnings Before Taxes
EBT was R$1,418 million in 1Q26, down 14% QoQ and up 8% YoY. The EBT margin was 30.0%, slightly up versus the prior year and lower quarter-over-quarter.
Adjusted Net Income and Adjusted EPS1
In 1Q26, Adjusted Net Income reached R$1.3 billion, roughly stable QoQ and increasing 7% on a year-over-year comparison. Adjusted Basic EPS was R$2.53, 2% lower QoQ growth and 9% higher YoY. Adjusted Diluted EPS was R$2.49 for the quarter, 3% lower QoQ and 9% higher YoY.
Adjusted ROTE1,6 and Adjusted ROAE1,7
In 1Q26 our Adjusted Return on Equity (ROAE) reached 21.7%, while return on tangible equity (ROTE) was 26.2%. Both metrics were down this quarter as we maintained a higher BIS ratio.
Capital Management8
In 1Q26 our BIS Ratio was 20.7%, 27 bps higher QoQ and 169 bps higher YoY, while our total RWA was R$122.2 billion, with a 3% increase QoQ and 20% increase YoY. Our CET1 ratio remains at a comfortable level of 17.5%. During 1Q26, we executed share repurchases of approximately R$200 million. In addition, we are announcing a new buyback program of R$1 billion and new dividends in the amount of R$500 million, to be paid on June 18th, 2026. We are comfortable with getting our BIS ratio to our target range of 16% to 19% toward the end of the year, through capital distributions, while still maintaining a comfortable capital buffer.
6 – Annualized Return on Tangible Common Equity, calculated as Annualized Net Income over Tangible Common Equity, which excludes Intangibles and Goodwill, net of deferred taxes.
7 – Annualized Return on Average Equity.
8 – Managerial BIS Ratio is calculated using the same methodology as the BIS Ratio for our Prudential Conglomerate. However, it is based on the total assets and equity of the entire group.
&bsp;
|
Other Information
Webcast and Conference Call Information
The Company will host a webcast to discuss its fourth quarter financial results on Monday, May 18th, 2026, at 5:00 pm ET (6:00 pm BRT). To participate in the earnings webcast please subscribe at 1Q26 Earnings Web Meeting. The replay will be available on XP’s investor relations website at https://investors.xpinc.com/
Investor Relations Contact
ir@xpi.com.br
Important Disclosure
In reviewing the information contained in this release, you are agreeing to abide by the terms of this disclaimer. This information is being made available to each recipient solely for its information and is subject to amendment. This release is prepared by XP Inc. (the “Company,” “we” or “our”), is solely for informational purposes. This release does not constitute a prospectus and does not constitute an offer to sell or the solicitation of an offer to buy any securities. In addition, this document and any materials distributed in connection with this release are not directed to, or intended for distribution to or use by, any person or entity that is a citizen or resident or located in any locality, state, country or other jurisdiction where such distribution, publication, availability or use would be contrary to law or regulation or which would require any registration or licensing within such jurisdiction.
This release was prepared by the Company. Neither the Company nor any of its affiliates, officers, employees or agents, make any representation or warranty, express or implied, in relation to the fairness, reasonableness, adequacy, accuracy or completeness of the information, statements or opinions, whichever their source, contained in this release or any oral information provided in connection herewith, or any data it generates and accept no responsibility, obligation or liability (whether direct or indirect, in contract, tort or otherwise) in relation to any of such information. The information and opinions contained in this release are provided as at the date of this release, are subject to change without notice and do not purport to contain all information that may be required to evaluate the Company. The information in this release is in draft form and has not been independently verified. The Company and its affiliates, officers, employees and agents expressly disclaim any and all liability which may be based on this release and any errors therein or omissions therefrom. Neither the Company nor any of its affiliates, officers, employees or agents makes any representation or warranty, express or implied, as to the achievement or reasonableness of future projections, management targets, estimates, prospects or returns, if any.
The information contained in this release does not purport to be comprehensive and has not been subject to any independent audit or review. Certain of the financial information as of and for the periods ended of December 31, 2021 and December 31, 2020, 2019, 2018 and 2017 has been derived from audited financial statements and all other financial information has been derived from unaudited interim financial statements. A significant portion of the information contained in this release is based on estimates or expectations of the Company, and there can be no assurance that these estimates or expectations are or will prove to be accurate. The Company’s internal estimates have not been verified by an external expert, and the Company cannot guarantee that a third party using different methods to assemble, analyze or compute market information and data would obtain or generate the same results.
Statements in the release, including those regarding the possible or assumed future or other performance of the Company or its industry or other trend projections, constitute forward-looking statements. These statements are generally identified by the use of words such as “anticipate,” “believe,” “could,” “expect,” “should,” “plan,” “intend,” “estimate” and “potential,” among others. By their nature, forward-looking statements are necessarily subject to a high degree of uncertainty and involve known and unknown risks, uncertainties, assumptions and other factors because they relate to events and depend on circumstances that will occur in the future whether or not outside the control of the Company. Such factors may cause actual results, performance or developments to differ materially from those expressed or implied by such forward-looking statements and there can be no assurance that such forward-looking statements will prove to be correct. These risks and uncertainties include factors relating to: (1) general economic, financial, political, demographic and business conditions in Brazil, as well as any other countries we may serve in the future and their impact on our business; (2) fluctuations in interest, inflation and exchange rates in Brazil and any other countries we may serve in the future; (3) competition in the financial services industry; (4) our ability to implement our business strategy; (5) our ability to adapt to the rapid pace of technological changes in the financial services industry; (6) the reliability, performance, functionality and quality of our products and services and the investment performance of investment funds managed by third parties or by our asset managers; (7) the availability of government authorizations on terms and conditions and within periods acceptable to us; (8) our ability to continue attracting and retaining new appropriately-skilled employees; (9) our capitalization and level of indebtedness; (10) the interests of our controlling shareholders; (11) changes in government regulations applicable to the financial services industry in Brazil and elsewhere; (12) our ability to compete and conduct our business in the future; (13) the success of operating initiatives, including advertising and promotional efforts and new product, service and concept development by us and our competitors; (14) changes in consumer demands regarding financial products,
&bsp;
|
customer experience related to investments and technological advances, and our ability to innovate to respond to such changes; (15) changes in labor, distribution and other operating costs; (16) our compliance with, and changes to, government laws, regulations and tax matters that currently apply to us; (17) other factors that may affect our financial condition, liquidity and results of operations. Accordingly, you should not place undue reliance on forward-looking statements. The forward-looking statements included herein speak only as at the date of this release and the Company does not undertake any obligation to update these forward-looking statements. Past performance does not guarantee or predict future performance. Moreover, the Company and its affiliates, officers, employees and agents do not undertake any obligation to review, update or confirm expectations or estimates or to release any revisions to any forward-looking statements to reflect events that occur or circumstances that arise in relation to the content of the release. You are cautioned not to unduly rely on such forward-looking statements when evaluating the information presented and we do not intend to update any of these forward-looking statements.
Market data and industry information used throughout this release are based on management’s knowledge of the industry and the good faith estimates of management. The Company also relied, to the extent available, upon management’s review of industry surveys and publications and other publicly available information prepared by a number of third-party sources. All of the market data and industry information used in this release involves a number of assumptions and limitations, and you are cautioned not to give undue weight to such estimates. Although the Company believes that these sources are reliable, there can be no assurance as to the accuracy or completeness of this information, and the Company has not independently verified this information.
The contents hereof should not be construed as investment, legal, tax or other advice and you should consult your own advisers as to legal, business, tax and other related matters concerning an investment in the Company. The Company is not acting on your behalf and does not regard you as a customer or a client. It will not be responsible to you for providing protections afforded to clients or for advising you on the relevant transaction.
This release includes Adjustments to Reported Net Income, which is non-GAAP financial information. We believe that such information is meaningful and useful in understanding the activities and business metrics of the Company’s operations. We also believe that these non-GAAP financial measures reflect an additional way of viewing aspects of the Company’s business that, when viewed with our International Financial Reporting Standards (“IFRS”) results, as issued by the International Accounting Standards Board, provide a more complete understanding of factors and trends affecting the Company’s business. Further, investors regularly rely on non-GAAP financial measures to assess operating performance and such measures may highlight trends in the Company’s business that may not otherwise be apparent when relying on financial measures calculated in accordance with IFRS. We also believe that certain non-GAAP financial measures are frequently used by securities analysts, investors and other interested parties in the evaluation of public companies in the Company’s industry, many of which present these measures when reporting their results. The non-GAAP financial information is presented for informational purposes and to enhance understanding of the IFRS financial statements. The non-GAAP measures should be considered in addition to results prepared in accordance with IFRS, but not as a substitute for, or superior to, IFRS results. As other companies may determine or calculate this non-GAAP financial information differently, the usefulness of these measures for comparative purposes is limited. A reconciliation of such non-GAAP financial measures to the nearest GAAP measure is included in this release.
For purposes of this release:
“Active Clients” means the total number of retail clients served through our XP Investimentos, Rico, Clear, XP Investments and XP Private (Europe) brands, with Client Assets above R$100.00 or that have transacted at least once in the last thirty days. For purposes of calculating this metric, if a client holds an account in more than one of the aforementioned entities, such client will be counted as one “active client” for each such account. For example, if a client holds an account in each of XP Investimentos and Rico, such client will count as two “active clients” for purposes of this metric.
“Client Assets” means the market value of all client assets invested through XP’s platform and that is related to reported Retail Revenue, including equities, fixed income securities, mutual funds (including those managed by XP Gestão de Recursos Ltda., XP Advisory Gestão de Recursos Ltda. and XP Vista Asset Management Ltda., as well as by third-party asset managers), pension funds (including those from XP Vida e Previdência S.A., as well as by third-party insurance companies), exchange traded funds, COEs (Structured Notes), REITs, and uninvested cash balances (Float Balances), among others. Although Client Assets includes custody from Corporate Clients that generate Retail Revenue, it does not include custody from institutional clients (asset managers, pension funds and insurance companies).
Rounding
We have made rounding adjustments to some of the figures included in this release. Accordingly, numerical figures shown as totals in some tables may not be an arithmetic aggregation of the figures that preceded them.
&bsp;
|
Unaudited Managerial Income Statement (in R$ mn)
| Managerial Income Statement | 1Q26 | 1Q25 | YoY | 4Q25 | QoQ |
| Total Gross Revenue | 4.919 | 4.557 | 8% | 5.279 | -7% |
| Retail | 3.773 | 3.441 | 10% | 3.862 | -2% |
| Equities | 1.167 | 959 | 22% | 1.035 | 13% |
| Fixed Income | 756 | 1.015 | -25% | 934 | -19% |
| Funds Platform | 392 | 322 | 22% | 412 | -5% |
| Retirement Plans | 118 | 107 | 11% | 131 | -9% |
| Cards | 356 | 319 | 12% | 398 | -11% |
| Credit | 90 | 82 | 10% | 83 | 9% |
| Insurance | 59 | 53 | 11% | 123 | -52% |
| Other Retail | 834 | 584 | 43% | 747 | 12% |
| Wholesale | 1.146 | 906 | 26% | 1.241 | -8% |
| Issuer Services | 269 | 282 | -5% | 404 | -33% |
| Corporate | 498 | 280 | 78% | 491 | 1% |
| Institutional | 379 | 344 | 10% | 346 | 9% |
| Other | - | 210 | -100% | 175 | -100% |
| Net Revenue | 4.733 | 4.392 | 8% | 5.017 | -6% |
| COGS | (1.554) | (1.429) | 9% | (1.536) | 1% |
| Gross Profit | 3.179 | 2.963 | 7% | 3.481 | -9% |
| Gross Margin | 67,2% | 67,5% | -29 bps | 69,4% | -222 bps |
| SG&A | (1.609) | (1.408) | 14% | (1.703) | -6% |
| People | (1.096) | (970) | 13% | (1.140) | -4% |
| Non-People | (512) | (438) | 17% | (563) | -9% |
| D&A | (68) | (72) | -5% | (63) | 9% |
| Interest expense on debt | (103) | (177) | -42% | (130) | -21% |
| Share of profit in joint ventures and associates | 19 | 7 | 150% | 55 | -66% |
| EBT | 1.418 | 1.314 | 8% | 1.640 | -14% |
| EBT Margin | 30,0% | 29,9% | 5 bps | 32,7% | -273 bps |
| Tax Expense | (100) | (77) | 29% | (309) | -68% |
| Tax expense (Tax Witholding in Funds) | (30) | (177) | -83% | (45) | -33% |
| Effective Tax Rate | -9.0% | -17.1% | 0 bps | -21.0% | -1 bps |
| Adjusted Net Income | 1.318 | 1.236 | 7% | 1.331 | -1% |
| Adjusted Net Margin | 27,8% | 28,1% | -30 bps | 26,5% | 132 bps |
&bsp;
|
Accounting Income Statement (in R$ mn)
| Accounting Income Statement | 1Q26 | 1Q25 | YoY | 4Q25 | QoQ |
| Net revenue from services rendered | 1,932 | 1,650 | 17% | 2,432 | -21% |
| Brokerage commission | 582 | 473 | 23% | 522 | 12% |
| Securities placement | 477 | 477 | 0% | 883 | -46% |
| Management fees | 532 | 413 | 29% | 547 | -3% |
| Insurance brokerage fee | 58 | 58 | 1% | 58 | -1% |
| Commission Fees | 268 | 241 | 11% | 359 | -25% |
| Other services | 202 | 152 | 32% | 326 | -38% |
| Sales Tax and contributions on Services | (186) | (165) | 13% | (262) | -29% |
| Net income from financial instruments at amortized cost and at fair value through other comprehensive income | (1,170) | (902) | 30% | (2,434) | -52% |
| Net income from financial instruments at fair value through profit or loss | 3,912 | 3.596 | 9% | 4,940 | -21% |
| Total revenue and income | 4,674 | 4,345 | 8% | 4,938 | -5% |
| Operating costs | (1,442) | (1,283) | 12% | (1,470) | -2% |
| Selling expenses | (70) | (57) | 24% | (80) | -12% |
| Administrative expenses | (1,641) | (1,448) | 13% | (1,712) | -4% |
| Other operating revenues (expenses), net | 18 | 23 | -18% | 3 | 464% |
| Expected credit losses | (112) | (146) | -24% | (66) | 68% |
| Interest expense on debt | (103) | (177) | -42% | (130) | -21% |
| Share of profit or (loss) in joint ventures and associates | 19 | 7 | 150% | 55 | -66% |
| Income before income tax | 1,343 | 1,263 | 6% | 1,537 | -13% |
| Income tax expense | (26) | (27) | -3% | (256) | -90% |
| Net income for the period | 1,318 | 1,236 | 7% | 1,282 | 3% |
&bsp;
|
Balance Sheet (in R$ mn)
| Assets | 1Q26 | 4Q25 | |||
| Cash | 8,791 | 10,357 | |||
| Financial assets | 383,856 | 365,169 | |||
| Fair value through profit or loss | 266,127 | 239,755 | |||
| Securities | 210,523 | 198,834 | |||
| Derivative financial instruments | 55,603 | 40,921 | |||
| Fair value through other comprehensive income | 30,263 | 42,223 | |||
| Securities | 30,263 | 42,223 | |||
| Evaluated at amortized cost | 87,467 | 83,191 | |||
| Securities | 5,740 | 7,407 | |||
| Securities purchased under agreements to resell | 15,823 | 17,063 | |||
| Securities trading and intermediation | 9,265 | 6,299 | |||
| Accounts receivable | 1,161 | 1,366 | |||
| Loan Operations | 32,328 | 34,142 | |||
| Other financial assets | 23,150 | 16,913 | |||
| Other assets | 11,099 | 10,770 | |||
| Recoverable taxes | 520 | 443 | |||
| Rights-of-use assets | 347 | 341 | |||
| Prepaid expenses | 4,530 | 4,063 | |||
| Other | 5,702 | 5,923 | |||
| Deferred tax assets | 3,497 | 3,371 | |||
| Investments in associates and joint ventures | 3,691 | 3,635 | |||
| Property and equipment | 468 | 464 | |||
| Goodwill & Intangible assets | 2,908 | 2,763 | |||
| Total Assets | 414,311 | 396,528 |
|
| Liabilities | 1Q26 | 4Q25 | |||
| Financial liabilities | 291,959 | 276,497 | |||
| Fair value through profit or loss | 73,527 | 58,590 | |||
| Securities | 23,202 | 21,043 | |||
| Derivative financial instruments | 50,325 | 37,547 | |||
| Evaluated at amortized cost | 218,432 | 217,907 | |||
| Securities sold under repurchase agreements | 61,809 | 58,714 | |||
| Securities trading and intermediation | 26,271 | 22,421 | |||
| Financing instruments payable | 117,047 | 123,404 | |||
| Accounts payables | 890 | 810 | |||
| Borrowings | 478 | 238 | |||
| Other financial liabilities | 11,938 | 12,321 | |||
| Other liabilities | 97,127 | 95,994 | |||
| Social and statutory obligations | 736 | 1,365 | |||
| Taxes and social security obligations | 625 | 853 | |||
| Retirement plans liabilities | 95,171 | 93,023 | |||
| Provisions and contingent liabilities | 218 | 192 | |||
| Other | 377 | 560 | |||
| Deferred tax liabilities | 498 | 489 | |||
| Total Liabilities | 389,585 | 372,981 | |||
| Equity attributable to owners of the Parent company | 24,717 | 23,547 | |||
| Issued capital | 0 | 0 | |||
| Capital reserve | 24,118 | 24,009 | |||
| Other comprehensive income | (387) | (337) | |||
| Treasury | (323) | (125) | |||
| Retained earnings | 1,310 | - | |||
| Non-controlling interest | 8 | 1 | |||
| Total equity | 24,726 | 23,548 | |||
| Total liabilities and equity | 414,311 | 396,528 |
&bsp;
|
Non-GAAP Reconciliation
Bridge from Accounting P&L to Managerial P&L – 1Q26
| In R$mm | Accounting P&L | Reclassifications and Adjustments | Managerial P&L | ||
| Gross Revenues | 4,919 | - | 4,919 | ||
| Sales Taxes & Deductions | (245) | 59 | (186) | ||
| Net Revenues | 4,674 | 59 | 4,733 | ||
| COGS | (1,554) | - | (1,554) | ||
| Gross Profit | 3,120 | 59 | 3,179 | ||
| Total SG&A | (1,609) | 1 | (1,609) | ||
| People | (1,096) | - | (1,096) | ||
| Non-People | (513) | 1 | (512) | ||
| Depreciation & Amortization | (83) | 15 | (68) | ||
| Interest expense on debt | (103) | - | (103) | ||
| Share of profit in joint ventures and associates | 19 | - | 19 | ||
| EBT | 1,343 | 74 | 1,418 | ||
| Tax expense | (26) | (74) | (100) | ||
| Net Income | 1,318 | - | 1,318 |
&bsp;
|
Non-GAAP Reconciliation of Adjusted Net Income
Adjusted Net Income is a financial measure that reflects the company’s net income, excluding certain non-recurring or non-cash items that management believes do not reflect the company’s core operating performance. In the current period, this includes adjustments related to social charges and deferred tax assets associated with Performance Stock Units (PSUs) that expired unvested.
These adjustments exclude accounting charges that neither impact cash flow nor reflect recurring earnings volatility. By removing these effects, Adjusted Net Income provides a more accurate view of the company’s underlying profitability.
Additionally, in 4Q25, Adjusted Revenue (+R$13mm) and Adjusted SG&A (-R$3mm) also resulted in an Adjusted EBT. These financial measures exclude certain items that management believes are not indicative of the company’s core operating performance. These adjustments relate to one-off impacts from hedging social charges associated with share-based compensation expenses.
By excluding these items, Adjusted Revenue and Adjusted Expenses offer a more accurate representation of the company’s recurring operating results, facilitating comparability across reporting periods.
| (in R$ mn) | 1Q26 | 1Q25 | YoY | 4Q25 | QoQ |
| Net Income | 1,318 | 1,236 | 7% | 1,282 | 3% |
| Hedge of Social Charges | - | - | - | 13 | - |
| Social Charges / Hedge of Social Charges | - | - | - | (3) | - |
| Tax Expenses | - | - | - | 39 | - |
| Adjusted Net Income | 1,318 | 1,236 | 7% | 1,331 | -1% |
&bsp;
|