UNITED STATES
SECURITIES AND EXCHANGE COMMISSION
Washington, D.C. 20549
FORM
CERTIFIED SHAREHOLDER REPORT OF REGISTERED MANAGEMENT
INVESTMENT COMPANIES
Investment Company Act file number 811-23480
-----------------------
--------------------------------------------------------------
(Exact name of registrant as specified in charter)
128 S Tryon St., Suite 1600
Charlotte, NC 28202
--------------------------------------------------------------
(Address of principal executive offices) (Zip code)
Robert W. Long
Chief Executive Officer
StepStone Group Private Wealth LLC
128 S Tryon St., Suite 1600
Charlotte, NC 28202
--------------------------------------------------------------
(Name and address of agent for service)
Registrant’s telephone number, including area code: (704) 215-4300
---------------
Date of fiscal year end: March 31
---------
Date of reporting period:
ITEM 1. REPORTS TO STOCKHOLDERS.
(a) The Report to Shareholders is attached herewith.
StepStone Private Markets
Consolidated Financial Statements
For the Year Ended March 31, 2026
Annual Report
StepStone Private Markets
Table of Contents
For the Year Ended March 31, 2026
1
StepStone Private Markets
Management’s Discussion of Fund Performance (unaudited)
March 31, 2026
Introduction
StepStone Private Markets (“SPRIM” or the “Fund”) is a private market asset solution that seeks to generate long-term capital appreciation. The Fund launched in October 2020 and maintains a strategy of investing in private equity, real assets and private debt assets via co-investments, secondary investments and primary investments. SPRIM offers access to the major private market asset classes with exposure that varies across sectors, markets and investment partners with a focus on managing risk and targeting attractive risk-adjusted returns.
Designed specifically for individual investors and small institutions, SPRIM’s investor-centric structure emphasizes convenience, efficiency and transparency. As an evergreen fund, SPRIM raises capital daily while providing liquidity through quarterly repurchase offers, subject to approval by the Board of Trustees. There are no ongoing capital calls. Investors will receive dividend distributions, and tax reporting is provided via Form 1099.
Investment Activity, Performance1 and Benchmark
As of March 31, 2026, the Fund invested in 533 positions and reached total net assets of $5,828.9 million. We are pleased to report that SPRIM (Class I) generated a total return of 10.47% for the fiscal year ended March 31, 2026 (referred to as “fiscal year 2026”), compared to the MSCI World Index,2 SPRIM’s primary benchmark, which reported gains of 19.39% during the same period.
The Fund deploys capital in a diversified pool of secondaries, co-investments and primaries with investment managers believed to deliver above-average returns. Unrealized gains on investments total approximately $369.5 million for fiscal year 2026, and were the primary driver of the Fund's total return.
Contributions to the Fund's performance were led by exposure to assets with compelling valuation profiles and strong market positioning. There were no material detractors from the Fund's performance over the period.
Liquidity
We believe SPRIM has ample liquidity to meet its obligations and is well-positioned to execute on investment opportunities in the upcoming year. As of March 31, 2026, SPRIM held $247.3 million of cash and had $300.0 million available to be drawn under its credit facility3.
Investment Approach
SPRIM seeks to offer investors access to a broadly diversified private market asset strategy focused on investments that vary across industry sectors and geographies, whereby the adviser utilizes a variety of investment partners to source investment opportunities for the Fund.
This commentary reflects the viewpoints of StepStone Group Private Wealth LLC as of March 31, 2026 and is not intended as a forecast or guarantee of future results.
Average Annual Total Returns as of March 31, 20261,4
| 1 Year | 5 Year | Since Inception | ||||
| StepStone Private Markets, Class I | 10.47% | 12.92% | 19.19% | |||
| StepStone Private Markets, Class D | 10.19% | 12.72% | 18.96% | |||
| StepStone Private Markets, Class S | 9.57% | 12.24% | 18.47% | |||
| StepStone Private Markets, Class R | N/A | N/A | 0.62% | |||
| MSCI World Index2 | 19.39% | 9.75% | 13.31% |
2
StepStone Private Markets
Management's Discussion of Fund Performance (unaudited) (continued)
March 31, 2026
Performance of a $1,000,000 Investment (as of March 31, 2026)
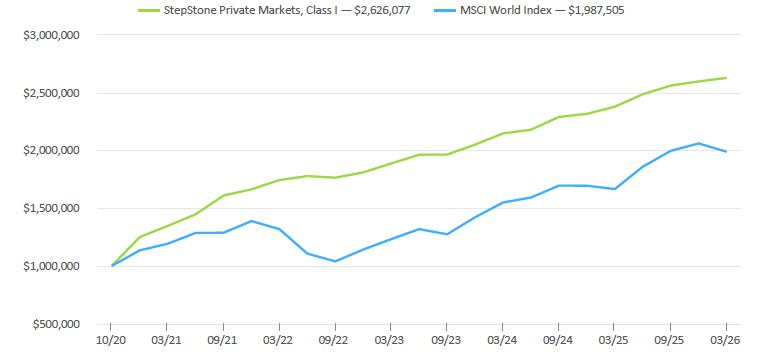
The chart above represents the hypothetical growth of a $1,000,000 investment in Class I shares. Returns for the Fund's other classes will vary from what is seen above due to differences in fee structures, specifically the distribution and shareholder servicing fees associated with brokers, dealers and certain registered investment advisers and other financial intermediaries.
The performance data quoted herein represents past performance, and the return and value of an investment in the Fund will fluctuate so that, when redeemed, it may be worth less than its original cost. Past performance does not predict future performance.
The Fund’s performance assumes the reinvestment of dividends. Index returns assume reinvestment of dividends and, unlike a portfolio’s returns, do not reflect any fees or expenses. If such fees and expenses were included in the index returns, the performance would have been lower. Please note that one cannot invest directly in an unmanaged index.
There are no assurances that the Fund will meet its stated objectives. The Fund’s holdings and allocations are subject to change because it is actively managed and should not be considered recommendations to buy individual securities.
Returns shown do not reflect the deduction of taxes that a shareholder would pay on Fund distributions or the redemption of Fund shares.
1 Performance is cumulative and represents the percent change in NAV and assumes reinvestment of all distributions pursuant to the Fund’s distribution reinvestment plan.
2 The MSCI World Index is a free float-adjusted market capitalization weighted index that is designed to measure the equity market performance of developed markets. The MSCI World Index consists of the following 23 developed market country indices: Australia, Austria, Belgium, Canada, Denmark, Finland, France, Germany, Hong Kong, Ireland, Israel, Italy, Japan, Netherlands, New Zealand, Norway, Portugal, Singapore, Spain, Sweden, Switzerland, the United Kingdom and the United States. The MSCI World Index is a total return index and SPRIM’s primary benchmark.
3 See Note 8 to the consolidated financial statements for further details on the credit facility.
4 The date of inception for Class I, D and S is October 1, 2020 and Class R is January 2, 2026.
3
 |
||
| Ernst & Young LLP | Tel: +1 212 773 3000 | |
| One Manhattan West | ey.com | |
| New York, NY 10001-8604 |
Report of Independent Registered Public Accounting Firm
To the Shareholders and the Board of Trustees of
StepStone
Private Markets
Opinion on the Financial Statements
We have audited the accompanying consolidated statement of assets and liabilities of StepStone Private Markets (the “Fund”), including the consolidated schedule of investments, as of March 31, 2026, and the related consolidated statements of operations and cash flows for the year then ended, the consolidated statements of changes in net assets for each of the two years in the period then ended, the consolidated financial highlights for each of the five years in the period then ended, and the related notes (collectively referred to as the “financial statements”). In our opinion, the financial statements present fairly, in all material respects, the consolidated financial position of the Fund at March 31, 2026, the consolidated results of its operations and its cash flows for the year then ended, the consolidated changes in its net assets for each of the two years in the period then ended, and its consolidated financial highlights for each of the five years in the period then ended, in conformity with U.S. generally accepted accounting principles.
Basis for Opinion
These financial statements are the responsibility of the Fund’s management. Our responsibility is to express an opinion on the Fund’s financial statements based on our audits. We are a public accounting firm registered with the Public Company Accounting Oversight Board (United States) ("PCAOB") and are required to be independent with respect to the Fund in accordance with the U.S. federal securities laws and the applicable rules and regulations of the Securities and Exchange Commission and the PCAOB.
We conducted our audits in accordance with the standards of the PCAOB. Those standards require that we plan and perform the audit to obtain reasonable assurance about whether the financial statements are free of material misstatement, whether due to error or fraud. The Fund is not required to have, nor were we engaged to perform, an audit of the Fund’s internal control over financial reporting. As part of our audits, we are required to obtain an understanding of internal control over financial reporting but not for the purpose of expressing an opinion on the effectiveness of the Fund’s internal control over financial reporting. Accordingly, we express no such opinion.
Our audits included performing procedures to assess the risks of material misstatement of the financial statements, whether due to error or fraud, and performing procedures that respond to those risks. Such procedures included examining, on a test basis, evidence regarding the amounts and disclosures in the financial statements. Our procedures included confirmation of securities owned as of March 31, 2026, by correspondence with the custodians, investment funds and portfolio company investees; when replies were not received from investment funds, we performed other auditing procedures. Our audits also included evaluating the accounting principles used and significant estimates made by management, as well as evaluating the overall presentation of the financial statements. We believe that our audits provide a reasonable basis for our opinion.
 |
We have served as the auditor of one or more of the StepStone Group LP investment companies since 2020.
New York, New York
May 30, 2026
A member firm of Ernst & Young Global Limited
4
StepStone Private Markets
Consolidated Schedule of Investments
March 31, 2026
| Investments | Asset Class | Acquisition Date | Cost | Fair Value | Footnotes | |||||||||
| Co-Investments - Non-Controlled/Non-Affiliated - 20.9% of NAV | 1,2,3,4 | |||||||||||||
| Europe - 2.7% of NAV | ||||||||||||||
| Athora Holding Ltd. | Private Equity | 03/20/2026 | $ | 22,810,776 | $ | 22,758,044 | *,⁺,9 | |||||||
| BC Partners Defender Co-Investment L.P. | Private Equity | 09/10/2021 | 3,569,447 | 6,349,570 | * | |||||||||
| Blackstone Infrastructure Hogan Co-Invest 2 (CYM) L.P. | Real Assets | 08/30/2023 | 11,971,412 | 16,597,331 | ⁺ | |||||||||
| Blackstone Infrastructure Miro Co-Invest (CYM) L.P. | Real Assets | 04/25/2022 | 9,971,174 | 14,377,784 | *,⁺ | |||||||||
| CCP Hermes LP | Private Equity | 11/01/2024 | 21,570,222 | 21,162,701 | *,⁺ | |||||||||
| Cinven Pegasus Limited Partnership | Private Equity | 10/02/2024 | 7,124,058 | 10,280,148 | * | |||||||||
| Enak Aggregator Limited Partnership | Private Equity | 01/18/2022 | 2,875,802 | 4,583,291 | * | |||||||||
| Everest Co-Investment LP | Private Equity | 03/19/2025 | 4,866,936 | 6,236,509 | * | |||||||||
| Kindred Capital Co-Invest I LP | Private Equity | 04/26/2022 | 15,125,016 | 11,116,465 | * | |||||||||
| KKR Cretaceous Co-Invest L.P. | Real Assets | 12/08/2022 | 14,300,000 | 20,703,813 | * | |||||||||
| Palace Co-Invest, SLP | Real Assets | 08/07/2021 | 6,373,441 | 15,719,482 | * | |||||||||
| Triton C Investment A L.P. | Private Equity | 03/29/2022 | 4,912,115 | 6,487,043 | * | |||||||||
| Total Europe | $ | 125,470,399 | $ | 156,372,181 | ||||||||||
| North America - 17.8% of NAV | ||||||||||||||
| ActiveProspect Five Elms, L.P. | Private Equity | 12/30/2025 | $ | 27,915,333 | $ | 29,146,859 | *,9 | |||||||
| AMP-20 Sterling Limited Partnership | Private Equity | 08/02/2023 | 5,049,153 | 3,301,631 | *,⁺ | |||||||||
| Ares CARS Co-Invest, L.P. | Real Assets | 05/26/2022 | 21,517,786 | 28,901,719 | ⁺ | |||||||||
| Ares Insurance Partners, L.P. | Private Equity | 10/17/2024 | 18,470,960 | 20,295,025 | *,⁺ | |||||||||
| Ares SH Partners LP | Real Assets | 11/14/2025 | 8,309,575 | 9,279,087 | ⁺,9 | |||||||||
| Ascend SMG Co-Invest 1, L.P. | Private Equity | 09/25/2023 | 2,562,567 | 3,953,825 | * | |||||||||
| Birch Grove CLO Ltd. ($17,158,750 principal amount, 07/17/2037, subordinated note) | Private Debt | 10/15/2024 | 11,694,543 | 9,833,387 | 5,6 | |||||||||
| Birch Grove CLO 10 Ltd. ($18,500,000 principal amount, 1/22/2038, subordinated note) | Private Debt | 11/26/2024 | 18,430,125 | 14,919,869 | 5,6 | |||||||||
| Birch Grove CLO 12 Ltd. ($18,500,000 principal amount, 4/22/2038, subordinated note) | Private Debt | 01/02/2025 | 18,523,935 | 17,018,932 | 5,6 | |||||||||
| BPCP Speedstar Acquisition, LLC (1,900 common shares) | Private Equity | 01/20/2021 | 1,367,940 | 2,054,256 | *,5,8 | |||||||||
| Buckeye Co-Invest II, LP | Real Assets | 07/26/2024 | 7,462,377 | 8,685,830 | ||||||||||
| Carlyle US CLO 2025-2, Ltd. ($16,741,375 principal amount, 07/25/2038, subordinated note) | Private Debt | 06/11/2025 | 14,641,829 | 13,109,834 | 5,6,9 | |||||||||
| Castlelake Consumer Receivables Opportunity III, L.P. | Private Debt | 06/26/2024 | 8,281,079 | 14,774,202 | *,⁺ | |||||||||
| Cendyn Group Holdings LLC (675 units) | Private Equity | 10/05/2023 | 36,495,260 | 36,485,830 | 5 | |||||||||
| CIFC Funding 2024-V, Ltd. ($22,896,900 principal amount, 01/22/2038, subordinated note) | Private Debt | 12/20/2024 | 19,456,623 | 17,243,440 | 5,6 | |||||||||
| CIFC Funding 2025-IX Investor, Ltd. ($23,772,822 principal amount, 01/21/2038, subordinated note) | Private Debt | 01/21/2026 | 20,857,656 | 20,397,799 | 5,6,9 | |||||||||
| Cinven Discovery Limited Partnership | Private Equity | 09/22/2022 | 2,400,645 | 6,000,043 | * | |||||||||
| Columbia Spectrum Partners VI-A, L.P. | Private Equity | 09/10/2024 | 45,000,000 | 62,551,629 | * | |||||||||
| Columbia XIG Co-Invest L.P. | Private Equity | 11/25/2025 | 1,507,750 | 1,522,338 | *,⁺,9 | |||||||||
| Decisions, LLC (1,718,769 common units) | Private Equity | 12/28/2020 | 2,700,000 | 6,453,000 | *,5,10 | |||||||||
| ECP V (California Co-Invest), LP | Real Assets | 08/19/2024 | 26,218,153 | 28,460,643 | *,⁺ | |||||||||
| Elk 2 Coinvest I, L.P. | Private Equity | 07/29/2024 | 45,191,832 | 51,063,368 | * | |||||||||
The accompanying notes are an integral part of these consolidated financial statements
5
StepStone Private Markets
Consolidated Schedule of Investments (continued)
March 31, 2026
| Investments | Asset Class | Acquisition Date | Cost | Fair Value | Footnotes | |||||||||
| Co-Investments - Non-Controlled/Non-Affiliated (continued) | ||||||||||||||
| North America (continued) | ||||||||||||||
| EQT X Co-Investment (F) SCSp | Private Equity | 02/09/2024 | $ | 4,938,839 | $ | 4,711,394 | * | |||||||
| FH Sunrise Co-Investment I, LP | Private Equity | 05/01/2023 | 4,365,458 | 6,385,510 | * | |||||||||
| FTV – FA, L.P. | Private Equity | 07/16/2025 | 7,487,590 | 7,462,509 | ⁺ | |||||||||
| HP Prestige Co-Invest Blocker Aggregator, LP | Private Equity | 07/18/2025 | 11,148,418 | 11,144,882 | *,9 | |||||||||
| HS Gamma-1 LLC | Private Equity | 10/13/2025 | 800,000 | 3,057,089 | *,⁺,9 | |||||||||
| HS Lotus LLC | Private Equity | 09/25/2025 | 53,453,101 | 52,350,956 | *,9 | |||||||||
| HS Ruby LLC | Private Equity | 07/25/2024 | 511,182 | 70,897 | *,⁺ | |||||||||
| HS Sky LLC | Private Equity | 12/22/2025 | 51,478,898 | 60,321,296 | *,9 | |||||||||
| Ilumed Parent LLC ($7,021,277 principal amount, 17.50%, 07/23/2027) | Private Equity | 01/23/2026 | 7,021,277 | 7,021,273 | 5,8 | |||||||||
| Ilumed Parent LLC (3,825 preferred units) | Private Equity | 08/19/2024 | 22,006,789 | 29,700,000 | *,5,8 | |||||||||
| IPEX Co-Invest, L.P. | Private Equity | 02/28/2024 | 5,006,667 | 4,244,380 | * | |||||||||
| Jefferies Credit Partners Direct Lending CLO 2025-2 Ltd. ($23,218,800 principal amount, 01/21/2038, subordinated note) | Private Debt | 01/21/2026 | 21,477,390 | 22,194,147 | 5,6,9 | |||||||||
| JFL-Rand Co-Invest US Partners, L.P. | Private Equity | 03/10/2023 | 3,501,204 | 18,894,828 | *,⁺ | |||||||||
| JFL-Tiger Co-Invest Partners, L.P. | Private Equity | 10/12/2023 | 4,171,578 | 8,959,783 | *,⁺ | |||||||||
| KKR Apple Co-Invest L.P. | Real Assets | 09/20/2021 | 5,173,770 | 8,290,512 | * | |||||||||
| KKR Gameday Co-Invest L.P. | Private Equity | 08/22/2024 | 25,891,890 | 36,228,300 | * | |||||||||
| LJ Perimeter Co-Invest, L.P. | Private Equity | 10/28/2022 | 4,834,380 | 4,826,244 | *,⁺ | |||||||||
| LJ Shield Co-Invest, L.P. | Private Equity | 07/11/2024 | 17,372,707 | 22,684,361 | *,⁺ | |||||||||
| MDCP Co-Investors (Chicago-C), L.P. | Private Equity | 10/28/2025 | 14,684,385 | 17,181,060 | *,9 | |||||||||
| MH Fund II Co-Invest, LP | Real Assets | 03/23/2021 | 3,866,967 | 7,141,306 | 8 | |||||||||
| Mosyle Corporation - Series B-2 (45,010 preferred shares) | Private Equity | 04/21/2022 | 1,083,980 | 1,625,970 | *,5 | |||||||||
| MPP KKC Holdings, LLC (3,000,000 common units) | Private Equity | 11/10/2021 | 3,000,000 | 6,315,463 | *,5,8 | |||||||||
| MTS Belmont Holdings, L.P. | Private Equity | 06/03/2025 | 12,411,350 | 12,411,350 | *,5 | |||||||||
| Novacap TMT VI Co-Investment (Cadenza), L.P. | Private Equity | 08/22/2023 | 3,293,566 | 3,964,246 | * | |||||||||
| NXT Capital CLO 2026-2, Ltd., (Warehouse) ($2,518,989 principal amount, 03/09/2031) | Private Debt | 03/11/2026 | 2,518,989 | 2,518,988 | ⁺,5,7,9 | |||||||||
| OSP Co-Invest II, LP - MB series | Private Equity | 01/02/2024 | 10,010,000 | 22,041,145 | *,8 | |||||||||
| Palms Co-Investment Partners, L.P. | Private Equity | 06/03/2022 | 4,676,598 | 5,289,954 | * | |||||||||
| Peak Topco, Inc. (20,833 common shares) | Private Equity | 08/23/2024 | 17,565,545 | 24,374,304 | *,⁺,5 | |||||||||
| Pegasus Coinvestors, L.P. | Real Assets | 10/05/2021 | 3,686,738 | 4,905,964 | ⁺,10 | |||||||||
| Peggy Aggregator, LLC | Real Assets | 12/02/2025 | 30,150,649 | 32,750,657 | *,8 | |||||||||
| POWWR Five Elms, L.P. | Private Equity | 09/24/2025 | 22,097,229 | 28,604,869 | *,12 | |||||||||
| Providence VIII Tetris Co-Investment-A L.P. | Private Equity | 11/18/2022 | 3,972,179 | 6,935,131 | ⁺ | |||||||||
| RB Tentpole Co-Invest UB, LP | Private Equity | 08/04/2025 | 5,693,181 | 5,542,651 | *,9 | |||||||||
| Ridgewood Journey LLC | Real Estate | 03/27/2026 | 27,966,456 | 27,961,477 | *,10 | |||||||||
| RPIII FB Co-Invest LLC | Private Equity | 03/02/2023 | 5,032,105 | 5,900,000 | *,10 | |||||||||
| Sidewalk Infrastructure Partners, LLC (1,286,008 Series C preferred units) | Real Assets | 03/16/2026 | 25,000,000 | 47,900,000 | *,⁺,5,14 | |||||||||
| Starlight Co-Invest LP | Private Equity | 10/30/2024 | 20,070,739 | 21,906,271 | * | |||||||||
| Stripes VI Rainier Co-Invest, LP | Private Equity | 10/31/2024 | 25,094,189 | 24,979,397 | * | |||||||||
| THL Fund IX Investors (BV), L.P. | Private Equity | 05/05/2021 | 2,489,602 | 4,973,276 | * | |||||||||
The accompanying notes are an integral part of these consolidated financial statements
6
StepStone Private Markets
Consolidated Schedule of Investments (continued)
March 31, 2026
| Investments | Asset Class | Acquisition Date | Cost | Fair Value | Footnotes | |||||||||
| Co-Investments - Non-Controlled/Non-Affiliated (continued) | ||||||||||||||
| North America (continued) | ||||||||||||||
| TPG VIII Merlin CI II, L.P | Private Equity | 07/30/2021 | $ | 319,788 | $ | 2,371,536 | ⁺ | |||||||
| WP Irving Co-Invest, L.P | Private Equity | 04/11/2022 | 426,492 | 4,869,009 | ||||||||||
| Total North America | $ | 859,806,986 | $ | 1,036,464,931 | ||||||||||
| Rest of the World - 0.4% of NAV | ||||||||||||||
| BGO Asia III Blossoms Co-Investment LP | Real Assets | 10/10/2023 | $ | 10,323,378 | $ | 13,305,704 | ⁺,11 | |||||||
| MC Accelerate Co-Invest Feeder LP | Private Equity | 09/26/2025 | 10,065,799 | 10,000,000 | *,9 | |||||||||
| Total Rest of the World | $ | 20,389,177 | $ | 23,305,704 | ||||||||||
| Total Non-Controlled/Non-Affiliated Co-Investments | $ | 1,005,666,562 | $ | 1,216,142,816 | ||||||||||
| Primary Investments - Non-Controlled/Non-Affiliated - 1.1% of NAV | 1,2,3,4 | |||||||||||||
| Europe - 0.0% of NAV | ||||||||||||||
| Nyver Fund I Coöperatief U.A | Private Equity | 09/30/2025 | $ | 1,147,590 | $ | 973,354 | *,⁺,9 | |||||||
| Total Europe | $ | 1,147,590 | $ | 973,354 | ||||||||||
| North America - 1.1% of NAV | ||||||||||||||
| Carlyle Santiago Aggregator, L.P. | Private Debt | 08/23/2024 | $ | 30,708,461 | $ | 32,457,529 | ||||||||
| GC BSL CLO Fund, L.P. | Private Debt | 10/20/2025 | 8,525,000 | 8,525,000 | *,⁺,9 | |||||||||
| PennantPark Capital Liquidity Solutions, LP | Private Debt | 08/04/2023 | 17,500,000 | 21,713,082 | *,⁺ | |||||||||
| Total North America | $ | 56,733,461 | $ | 62,695,611 | ||||||||||
| Total Non-Controlled/Non-Affiliated Primary Investments | $ | 57,881,051 | $ | 63,668,965 | ||||||||||
| Secondary Investments - Non-Controlled/Non-Affiliated - 79.0% of NAV | 1,2,3,4 | |||||||||||||
| Europe - 14.6% of NAV | ||||||||||||||
| Advent International GPE IX Limited Partnership | Private Equity | 09/30/2024 | $ | 8,268,682 | $ | 8,087,611 | *,⁺,9,11 | |||||||
| Advent International GPE IX-A SCSp | Private Equity | 09/30/2024 | 1,718,916 | 1,705,562 | *,⁺ | |||||||||
| Advent International GPE IX-F Limited Partnership | Private Equity | 12/31/2024 | 2,038,884 | 2,179,420 | *,⁺,12 | |||||||||
| Advent International GPE VII-E Limited Partnership | Private Equity | 12/31/2021 | 695,079 | 151,998 | *,⁺,11 | |||||||||
| Advent International GPE VIII Limited Partnership | Private Equity | 09/30/2024 | 976,571 | 840,903 | * | |||||||||
| Advent International GPE VIII-B Limited Partnership | Private Equity | 12/31/2024 | 2,942,685 | 2,312,202 | *,⁺,12 | |||||||||
| Advent International GPE VIII-B-3 Limited Partnership | Private Equity | 12/31/2025 | 1,178,301 | 1,149,088 | *,9 | |||||||||
| Advent International GPE VIII-C Limited Partnership | Private Equity | 12/31/2025 | 1,064,982 | 1,140,586 | *,9 | |||||||||
| Advent International GPE VIII-H Limited Partnership | Private Equity | 12/31/2021 | 2,986,938 | 1,828,524 | 11 | |||||||||
| Advent International GPE X-A SCSp | Private Equity | 09/30/2024 | 1,100,909 | 1,343,157 | *,⁺ | |||||||||
| Advent International GPE X-C Limited Partnership | Private Equity | 03/31/2026 | 2,543,918 | 2,751,646 | *,⁺,9 | |||||||||
| Albea Co-Invest SCSp | Private Equity | 03/31/2026 | 317,914 | 488,441 | *,⁺,9 | |||||||||
| Altor Fund IV (No. 1) AB | Private Equity | 12/30/2022 | 9,342,981 | 9,008,896 | ⁺ | |||||||||
| Altor Fund V (No. 1) AB | Private Equity | 12/30/2022 | 18,751,322 | 24,792,806 | ⁺ | |||||||||
| Altor Fund V (No. 2) AB | Private Equity | 06/30/2023 | 2,076,174 | 2,700,960 | ⁺ | |||||||||
| Ambienta Water Pumps, SCSp | Private Equity | 12/06/2024 | 27,435,138 | 31,500,552 | *,⁺ | |||||||||
| Apax IX USD L.P. | Private Equity | 09/30/2024 | 2,363,905 | 1,778,133 | ⁺,11 | |||||||||
| Apax X USD L.P. | Private Equity | 09/30/2024 | 3,198,120 | 3,405,391 | ⁺,11 | |||||||||
| ARDIAN Infrastructure Fund IV S.C.A., SICAR | Real Assets | 10/04/2024 | 11,045,155 | 11,282,322 | ⁺ | |||||||||
| ARDIAN Infrastructure Fund V S.C.A., SICAR | Real Assets | 10/04/2024 | 32,197,373 | 35,888,432 | ⁺,9 | |||||||||
| Astorg IQ-EQ Fund | Private Equity | 12/31/2021 | 517,283 | 1,399,528 | *,⁺ | |||||||||
| Astorg V Fund | Private Equity | 01/11/2021 | — | 5,157 | * | |||||||||
The accompanying notes are an integral part of these consolidated financial statements
7
StepStone Private Markets
Consolidated Schedule of Investments (continued)
March 31, 2026
| Investments | Asset Class | Acquisition Date | Cost | Fair Value | Footnotes | |||||||||
| Secondary Investment - Non-Controlled/Non-Affiliated (continued) | ||||||||||||||
| Europe (continued) | ||||||||||||||
| Bain Capital Europe Fund V, SCSp | Private Equity | 03/31/2026 | $ | 1,666,733 | $ | 2,083,330 | *,⁺,9 | |||||||
| BE VI 'B' LP | Private Equity | 09/30/2024 | 1,441,475 | 1,258,922 | ⁺ | |||||||||
| BID Equity Continuation Fund I SCSp | Private Equity | 05/27/2025 | 9,795,241 | 10,482,912 | *,⁺,9 | |||||||||
| Bridgepoint Europe V 'A3' LP | Private Equity | 09/30/2024 | 555,881 | 750,837 | *,⁺ | |||||||||
| Carlyle Europe Technology Partners III, L.P. | Private Equity | 09/30/2024 | 691,873 | 243,516 | *,⁺ | |||||||||
| Cevine Capital Management VI (No.1) Feeder Limited Partnership Incorporated | Private Equity | 09/30/2024 | 428,947 | 372,694 | *,⁺ | |||||||||
| CF24XB SCSp | Private Equity | 04/16/2025 | 360,150 | 372,649 | *,⁺,12 | |||||||||
| CVC Capital Partners VIII (A) L.P. | Private Equity | 09/30/2024 | 5,468,170 | 6,876,491 | ⁺,11 | |||||||||
| DFI European Value-Add Fund II | Real Assets | 07/12/2021 | 1,731,071 | 1,477,666 | *,⁺,12 | |||||||||
| DIF Core Infrastructure Fund II SCSp | Real Assets | 09/30/2024 | 10,806,926 | 12,444,404 | ⁺ | |||||||||
| DIF Infrastructure VI SCSp | Real Assets | 09/30/2024 | 10,466,107 | 12,137,403 | ||||||||||
| Digital Infrastructure Vehicle II SCSp | Real Assets | 03/23/2026 | 7,382,005 | 9,055,991 | *,⁺,9 | |||||||||
| Elysium Acquisition LP | Private Equity | 12/09/2024 | 14,365,763 | 21,838,529 | ⁺ | |||||||||
| EMK Capital Partners II LP | Private Equity | 12/31/2025 | 10,593,635 | 11,718,939 | ⁺,9 | |||||||||
| Epiris Fund II (B) L.P. | Private Equity | 09/30/2025 | 9,432,719 | 12,568,117 | *,⁺,9 | |||||||||
| EQT Infrastructure IV (No.2) EUR SCSp | Real Assets | 09/29/2023 | 7,349,829 | 9,446,338 | *,⁺,12 | |||||||||
| EQT Infrastructure IV (No.2) USD SCSp | Real Assets | 10/10/2023 | 56,057,720 | 73,219,766 | *,⁺,12 | |||||||||
| EQT Infrastructure V (No.1) EUR SCSp | Real Assets | 07/12/2024 | 35,034,178 | 42,113,197 | *,⁺ | |||||||||
| EQT VIII (No.2) SCSp | Private Equity | 07/06/2022 | 4,940,842 | 2,281,786 | ⁺,11 | |||||||||
| EQT IX (No.2) EUR SCSp | Private Equity | 07/06/2022 | 12,536,230 | 14,204,149 | ⁺,11 | |||||||||
| Equistone Partners Europe Fund IV | Private Equity | 12/31/2020 | 231,365 | 65,404 | ||||||||||
| Exponent Private Equity Partners III, LP | Private Equity | 09/30/2025 | 6,529,127 | 6,607,705 | *,⁺,9 | |||||||||
| F3 Presto HVD CV Fund AB | Private Equity | 04/12/2024 | 5,222,281 | 6,077,508 | *,⁺ | |||||||||
| Fifth Cinven Fund (No. 1) Limited Partnership | Private Equity | 10/30/2020 | 807,009 | 1,096,742 | 12 | |||||||||
| Generali Lion River Fund XV SCSp | Private Equity | 11/20/2025 | 152,487 | 152,080 | *,⁺,9 | |||||||||
| Generali Lion River Secondary Fund I SCSp | Private Equity | 11/20/2025 | 23,335,292 | 26,565,625 | *,⁺,9 | |||||||||
| GIP Pegasus Fund, L.P. | Real Assets | 08/20/2024 | 19,890,519 | 21,019,366 | ||||||||||
| Growth Capital Partners Fund V LP | Private Equity | 04/14/2022 | 7,568,609 | 6,162,343 | ⁺,12 | |||||||||
| Gyrus 1 LP | Private Equity | 12/09/2024 | 7,153,578 | 8,317,225 | *,⁺ | |||||||||
| Harbert European Real Estate Fund III, L.P. | Real Assets | 07/12/2021 | — | 4,886 | *,⁺,12 | |||||||||
| IK Small Cap II Fund No.1 SCSp | Private Equity | 12/31/2024 | 240,310 | 296,225 | * | |||||||||
| Inflexion Buyout Fund V (No.1) Limited Partnership | Private Equity | 01/07/2025 | 1,259,420 | 857,026 | ⁺ | |||||||||
| Inflexion Continuation Fund I (No. 1) Limited | Private Equity | 05/20/2025 | 5,936,965 | 6,696,556 | *,⁺,9 | |||||||||
| InfraRed Infrastructure V (1) LP | Real Assets | 06/29/2022 | 5,086,346 | 6,293,127 | *,⁺ | |||||||||
| InfraVia European Fund IV FPCI | Real Assets | 10/02/2024 | 9,196,191 | 10,939,509 | ⁺ | |||||||||
| InfraVia European Fund V FPCI | Real Assets | 10/02/2024 | 14,843,305 | 17,755,385 | ⁺ | |||||||||
| InfraVia European Fund V SCSp | Real Assets | 12/31/2025 | 24,524,555 | 26,165,480 | *,⁺,9 | |||||||||
| Kitty Hawk Capital Partners IV L.P. | Real Assets | 07/12/2021 | 377,237 | 546,086 | *,⁺,12 | |||||||||
| LQG JV Landmark Portfolio GmbH & Co. KG | Real Assets | 07/12/2021 | 932,694 | 518,381 | *,12 | |||||||||
| Macquarie European Infrastructure Fund 4 FPCI | Real Assets | 04/25/2023 | — | 1,073,359 | *,⁺ | |||||||||
| LEA Strategic Opportunities Fund I GmbH & Co. | Private Equity | 02/05/2024 | 15,887,233 | 26,266,522 | *,⁺ | |||||||||
The accompanying notes are an integral part of these consolidated financial statements
8
StepStone Private Markets
Consolidated Schedule of Investments (continued)
March 31, 2026
| Investments | Asset Class | Acquisition Date | Cost | Fair Value | Footnotes | |||||||||
| Secondary Investment - Non-Controlled/Non-Affiliated (continued) | ||||||||||||||
| Europe (continued) | ||||||||||||||
| Macquarie European Infrastructure Fund 5 SCSp | Real Assets | 04/25/2023 | $ | 17,308,713 | $ | 21,937,995 | *,⁺ | |||||||
| Macquarie European Infrastructure Fund 6 SCSp | Real Assets | 10/01/2024 | 58,176,901 | 64,143,377 | ⁺,9 | |||||||||
| MCP Continuation Fund I Coöperatief U.A | Private Equity | 06/04/2025 | 9,454,270 | 10,732,928 | *,⁺,9 | |||||||||
| MI Continuation Fund A | Private Equity | 02/23/2024 | 11,162,022 | 10,528,427 | *,⁺ | |||||||||
| MML Dorchester SCSp | Private Equity | 12/17/2025 | 8,133,690 | 10,224,617 | *,⁺,9 | |||||||||
| NIC Battery Acquisition LP | Real Assets | 10/16/2024 | 17,051,091 | 27,412,616 | *,⁺ | |||||||||
| Nordea Private Equity II - European Middle Market Buyout K/S | Private Equity | 09/30/2024 | 34,259 | 49,358 | *,⁺,13 | |||||||||
| Nordic Capital IX Beta, L.P. | Private Equity | 03/31/2026 | 1,789,013 | 2,019,627 | *,⁺,9 | |||||||||
| Oakley Capital Guinness B2 SCSp | Private Equity | 06/08/2023 | 7,427,494 | 11,817,384 | *,⁺ | |||||||||
| PAI Europe VII-1 | Private Equity | 09/30/2024 | 3,021,205 | 3,614,841 | *,⁺,11,9 | |||||||||
| Pan-European Infrastructure II, S.C.S. | Real Assets | 10/03/2024 | 3,443,758 | 5,555,200 | ⁺ | |||||||||
| Pan-European Infrastructure III, SCSp | Real Assets | 10/03/2024 | 10,417,331 | 12,221,757 | ⁺ | |||||||||
| Permira VI L.P.1 | Private Equity | 09/30/2024 | 4,389,712 | 3,104,809 | ⁺,11 | |||||||||
| Permira VII L.P.1 | Private Equity | 09/30/2024 | 13,630,440 | 15,061,705 | *,⁺,11 | |||||||||
| PSC Accelerator II (A), LP | Private Equity | 11/23/2023 | 5,387,876 | 8,701,196 | *,⁺ | |||||||||
| Red Garden Invest (E) AB | Private Equity | 03/31/2026 | 9,993,960 | 10,104,531 | *,⁺,9 | |||||||||
| Seventh Cinven Fund (No.1) Limited Partnership | Private Equity | 09/30/2024 | 3,994,999 | 4,708,961 | ⁺,11 | |||||||||
| Sixth Cinven Fund Limited Partnership | Private Equity | 10/30/2020 | 2,293,156 | 3,097,829 | *,⁺,12,9 | |||||||||
| Ufenau Continuation 3, SLP | Private Equity | 04/14/2022 | 22,097,578 | 22,821,407 | *,⁺ | |||||||||
| Verdane Capital IX (D) AB | Private Equity | 03/31/2026 | 759,512 | 744,677 | *,⁺,9 | |||||||||
| Verdane Capital X (D) AB | Private Equity | 03/31/2026 | 3,204,816 | 3,763,723 | *,⁺,9 | |||||||||
| Verdane Edda II (D) AB | Private Equity | 09/30/2024 | 614,373 | 941,161 | *,⁺ | |||||||||
| Verdane Freya XI (D2) AB | Private Equity | 03/31/2026 | 2,095,717 | 2,872,104 | *,⁺,9 | |||||||||
| Verdane Freya XII (D2) AB | Private Equity | 03/31/2026 | — | — | *,9 | |||||||||
| Verdane Idun I (D) AB | Private Equity | 09/30/2024 | 1,006,757 | 743,021 | * | |||||||||
| VIP SIV I LP | Private Equity | 05/06/2022 | 11,377,245 | 22,674,197 | *,⁺ | |||||||||
| VVI I S.C.Sp. | Private Equity | 02/27/2026 | 2,317,892 | 3,017,177 | *,⁺,9 | |||||||||
| VVI SIV I S.C.Sp. | Private Equity | 02/27/2026 | 1,160,862 | 1,465,726 | *,⁺,9 | |||||||||
| WPEF VII Feeder 2 ILP | Private Equity | 01/07/2025 | 2,155,729 | 3,369,842 | *,⁺ | |||||||||
| WREP#2 Luxco S.à r.l. | Real Assets | 07/12/2021 | 132,673 | 460,120 | *,12 | |||||||||
| Total Europe | $ | 717,074,292 | $ | 852,075,804 | ||||||||||
| North America - 63.0% of NAV | ||||||||||||||
| ABRY Partners IX, L.P. | Private Equity | 01/01/2025 | $ | 2,260,196 | $ | 2,403,282 | ⁺,12 | |||||||
| Accel-KKR Capital Partners V, LP | Private Equity | 03/31/2026 | 1,552,696 | 1,329,283 | *,⁺,9 | |||||||||
| Accordion DC Holdings, LP | Private Equity | 12/08/2022 | 5,262,461 | 7,970,435 | ||||||||||
| AE Industrial Partners Fund II, LP | Private Equity | 12/31/2024 | 1,837,285 | 2,822,382 | *,⁺ | |||||||||
| AEA Investors Fund V LP | Private Equity | 12/31/2021 | 1,226 | 127,745 | *,⁺,11 | |||||||||
| AHP Fund I PV Feeder L.P. | Private Equity | 12/28/2020 | 2,740,880 | 2,097,653 | ⁺ | |||||||||
| AHP Fund II PV Feeder L.P. | Private Equity | 12/28/2020 | 9,429,068 | 10,987,047 | ⁺ | |||||||||
| AKKR Isosceles CV LP | Private Equity | 06/26/2025 | 8,669,685 | 8,821,078 | *,⁺,9 | |||||||||
| AKKR Strategic Capital LP | Private Equity | 10/24/2024 | 15,310,846 | 20,691,524 | *,⁺ | |||||||||
| Album Ventures MSL-C, LP | Private Equity | 04/21/2022 | 3,927,756 | 5,867,485 | * | |||||||||
The accompanying notes are an integral part of these consolidated financial statements
9
StepStone Private Markets
Consolidated Schedule of Investments (continued)
March 31, 2026
| Investments | Asset Class | Acquisition Date | Cost | Fair Value | Footnotes | |||||||||
| Secondary Investment - Non-Controlled/Non-Affiliated (continued) | ||||||||||||||
| North America (continued) | ||||||||||||||
| Amaranth DC Holdings, LP | Private Equity | 02/23/2024 | $ | 29,030,847 | $ | 36,158,818 | ||||||||
| American Industrial Partners Capital Fund V, L.P. | Private Equity | 03/31/2026 | 266,022 | 257,172 | *,⁺,9 | |||||||||
| American Industrial Partners Capital Fund VI, L.P. | Private Equity | 03/31/2026 | 1,271,936 | 1,091,706 | *,⁺,9 | |||||||||
| Ampersand CF Limited Partnership | Private Equity | 11/13/2020 | 798,017 | 1,622,808 | * | |||||||||
| Apollo Investment Fund IX, L.P. | Private Equity | 10/01/2024 | 15,373,702 | 14,633,584 | ⁺,11 | |||||||||
| Apollo Natural Resources Partners II, L.P. | Real Assets | 04/01/2021 | 369,316 | 451,579 | ⁺,11 | |||||||||
| Apollo Overseas Partners (Delaware 892) VIII, L.P. | Private Equity | 04/01/2021 | 1,410,712 | 949,480 | ⁺,11 | |||||||||
| Apollo Overseas Partners (Lux) IX, SCSp | Private Equity | 10/01/2024 | 1,830,572 | 1,485,183 | ⁺ | |||||||||
| Apollo Overseas Partners IX, L.P. | Private Equity | 01/01/2022 | 2,295,595 | 2,709,855 | ⁺,11 | |||||||||
| Aquiline Financial Services Continuation Fund L.P. | Private Equity | 05/30/2024 | 17,348,854 | 22,022,669 | ⁺ | |||||||||
| Aquiline Financial Services Fund IV L.P. | Private Equity | 10/01/2025 | 4,333,722 | 5,693,169 | ⁺,9 | |||||||||
| Aquiline Financial Services Fund V L.P. | Private Equity | 05/22/2024 | 767,404 | 847,994 | *,⁺ | |||||||||
| Arbor Investments V-A, L.P. | Private Equity | 03/31/2026 | 1,513,715 | 1,733,573 | *,⁺,9 | |||||||||
| ArcLight Infrastructure Partners Feeder-B, L.P. | Private Equity | 10/16/2025 | 8,904,188 | 10,341,239 | ⁺,9 | |||||||||
| Ares Pathfinder Fund (Offshore), L.P. | Private Debt | 04/01/2023 | 32,708,008 | 30,621,105 | ⁺ | |||||||||
| Audax Private Equity Beacon CF, L.P. | Private Equity | 08/08/2025 | 1,554,388 | 1,628,719 | *,⁺,11 | |||||||||
| Audax Private Equity Fund IV CF, L.P. | Private Equity | 12/24/2020 | 4,891,365 | 3,796,622 | ⁺ | |||||||||
| Audax Private Equity Fund V-B, L.P. | Private Equity | 06/28/2024 | 11,331,823 | 6,956,101 | ⁺,11 | |||||||||
| Audax Private Equity Fund VI-A, L.P. | Private Equity | 06/28/2024 | 35,225,210 | 33,748,139 | 11 | |||||||||
| Audax Private Equity Fund VI-B, L.P. | Private Equity | 12/31/2025 | 1,234,047 | 1,411,945 | *,9 | |||||||||
| Audax Private Equity Solutions Fund, L.P. | Private Equity | 06/28/2024 | 3,117,319 | 3,332,884 | ⁺ | |||||||||
| Azimuth Energy Partners III LP | Private Equity | 09/30/2024 | 207,399 | 211,919 | *,13 | |||||||||
| Bain Capital Beacon Holdings, L.P. | Private Equity | 03/24/2025 | 13,365,364 | 15,828,534 | *,⁺ | |||||||||
| Bain Capital Fund XI, L.P. | Private Equity | 03/31/2026 | 405,521 | 406,351 | *,⁺,9 | |||||||||
| Bain Capital Fund XII, L.P. | Private Equity | 03/31/2026 | 892,234 | 1,629,614 | *,⁺,9 | |||||||||
| Bain Capital Fund XIII, L.P. | Private Equity | 03/31/2026 | 2,360,881 | 3,031,797 | *,⁺,9 | |||||||||
| Bay Ridge Journey, LLC | Real Assets | 07/31/2025 | 17,754,917 | 19,032,957 | ⁺,10 | |||||||||
| Berkshire Fund VIII, L.P. | Private Equity | 09/04/2021 | 2,182,747 | 305,035 | *,⁺,8 | |||||||||
| Berkshire Fund IX Coinvestment Fund, L.P. | Private Equity | 06/28/2024 | 14,054,141 | 19,636,520 | *,⁺,12 | |||||||||
| Berkshire Fund IX, L.P. | Private Equity | 09/04/2021 | 3,000,109 | 3,469,398 | ⁺,8 | |||||||||
| Berkshire Fund IX-A, L.P. | Private Equity | 01/02/2026 | 1,631,387 | 1,702,157 | *,⁺,9 | |||||||||
| Berkshire Fund X, L.P. | Private Equity | 09/04/2021 | 10,751,918 | 12,408,710 | ⁺,8 | |||||||||
| Blackstone Capital Partners VI L.P. | Private Equity | 01/01/2021 | 434,504 | 330,137 | ⁺,11 | |||||||||
| Blue Owl GP Stakes IV Offshore Investors LP | Private Equity | 01/02/2026 | 4,835,676 | 6,257,019 | *,⁺,9 | |||||||||
| Blue Owl Opportunistic Lending Fund (Offshore) LP | Private Debt | 10/01/2025 | 10,833,837 | 12,990,598 | ⁺,9 | |||||||||
| Blue Point Capital Partners III, L.P. | Private Equity | 06/30/2022 | 1,875,012 | 1,383,582 | *,⁺,12 | |||||||||
| Blue Point Capital Partners IV, L.P. | Private Equity | 06/30/2022 | 9,079,682 | 7,964,335 | *,⁺,12 | |||||||||
| Blue Point Capital Partners V (A), L.P. | Private Equity | 06/30/2022 | 3,639,321 | 3,217,058 | *,⁺ | |||||||||
| Blue Road Capital PV II, L.P. | Real Assets | 08/27/2024 | 20,018,878 | 25,641,625 | *,⁺ | |||||||||
| Brookfield Capital Partners IV (ER) L.P. | Private Equity | 09/30/2024 | 749,544 | 780,786 | ⁺ | |||||||||
| Brookfield Infrastructure Fund IV (ER) SCSp | Real Assets | 01/30/2024 | 3,450,564 | 3,909,462 | ⁺,11 | |||||||||
| BV RN Continuation Fund, L.P. | Private Equity | 10/10/2023 | 3,645,900 | 8,050,043 | *,⁺ | |||||||||
The accompanying notes are an integral part of these consolidated financial statements
10
StepStone Private Markets
Consolidated Schedule of Investments (continued)
March 31, 2026
| Investments | Asset Class | Acquisition Date | Cost | Fair Value | Footnotes | |||||||||
| Secondary Investment - Non-Controlled/Non-Affiliated (continued) | ||||||||||||||
| North America (continued) | ||||||||||||||
| Catterton Partners VII, L.P. | Private Equity | 12/31/2021 | $ | 5,260,059 | $ | 2,258,953 | *,⁺ | |||||||
| CD&R Value Building Partners I, L.P. | Private Equity | 12/17/2021 | 8,175,738 | 12,157,503 | ||||||||||
| Centerbridge Falcon Acquisition Fund, L.P. | Private Equity | 08/21/2025 | 13,984,444 | 18,656,976 | *,⁺ | |||||||||
| Centre Lane Partners V, L.P. | Private Equity | 01/02/2026 | 3,387,359 | 3,311,503 | *,⁺,9 | |||||||||
| Charlesbank Equity Fund IX, Limited Partnership | Private Equity | 06/28/2024 | 31,816,612 | 29,504,161 | ⁺,12 | |||||||||
| Charlesbank Equity Fund X, Limited Partnership | Private Equity | 06/28/2024 | 23,797,706 | 26,919,440 | ⁺,12 | |||||||||
| Charlesbank Equity Overage Fund X, Limited Partnership | Private Equity | 06/28/2024 | 3,441,656 | 2,756,458 | ⁺,12 | |||||||||
| Chicago Pacific Founders Fund, L.P. | Private Equity | 06/28/2024 | 3,544,206 | 3,114,999 | *,⁺,12 | |||||||||
| Chicago Pacific Founders Fund II-A, L.P. | Private Equity | 06/28/2024 | 3,065,116 | 4,447,268 | *,⁺ | |||||||||
| CIVC Partners Fund VI, L.P. | Private Equity | 12/31/2025 | 4,641,694 | 5,352,438 | *,⁺,8 | |||||||||
| CIVC Partners Fund VI-A, L.P. | Private Equity | 12/31/2025 | 535,116 | 603,186 | *,⁺,9 | |||||||||
| Clayton, Dubilier & Rice Fund IX, L.P. | Private Equity | 03/31/2026 | 799,220 | 1,029,976 | *,⁺,9 | |||||||||
| Clayton, Dubilier & Rice Fund X, L.P. | Private Equity | 12/31/2021 | 7,406,511 | 6,615,652 | ⁺,9,11,12 | |||||||||
| Clearlake Capital Partners VI (Offshore), L.P. | Private Equity | 09/29/2022 | 14,467,510 | 14,406,633 | ⁺ | |||||||||
| Clearlake Capital Partners VI, L.P. | Private Equity | 12/30/2022 | 7,539,853 | 7,832,249 | ⁺ | |||||||||
| Consonance Concord CF PV, L.P. | Private Equity | 11/19/2025 | 34,733,495 | 52,087,578 | *,⁺,9 | |||||||||
| Cortec Group Fund VII, L.P. | Private Equity | 12/31/2024 | 2,475,693 | 2,985,811 | ⁺,12 | |||||||||
| Cortland Growth and Income, L.P. | Real Assets | 04/01/2022 | 27,723,376 | 16,909,151 | 15 | |||||||||
| Court Square Capital Partners (Offshore) III, L.P. | Private Equity | 03/07/2024 | 11,651,290 | 11,781,170 | ⁺ | |||||||||
| Court Square Capital Partners III, L.P. | Private Equity | 03/07/2024 | 13,734,673 | 13,906,344 | ⁺,11 | |||||||||
| Court Square Capital Partners V, L.P. | Private Equity | 03/07/2024 | 1,499,694 | 914,251 | ⁺ | |||||||||
| DC Front Range Holdings I, LP | Real Assets | 10/03/2025 | 6,325,271 | 8,378,307 | *,9 | |||||||||
| DC Trident Holdings I, LP | Real Assets | 10/03/2025 | 7,944,476 | 8,770,615 | *,9 | |||||||||
| DigitalBridge Partners, LP | Real Assets | 10/03/2025 | 10,713,536 | 10,788,984 | *,⁺,12 | |||||||||
| DigitalBridge Valhalla Partners I-B, L.P. | Real Assets | 10/03/2025 | 8,632,400 | 9,849,615 | *,9 | |||||||||
| Dunes Point Capital Fund III-A, L.P. | Private Equity | 10/12/2023 | 28,876,438 | 33,774,400 | *,⁺ | |||||||||
| Encore Consumer Capital Fund III, LP | Private Equity | 06/30/2022 | 9,931,442 | 18,848,839 | ⁺,11 | |||||||||
| Encore Consumer Capital Fund (PV) IV, LP | Private Equity | 06/30/2022 | 3,673,452 | 3,648,008 | *,⁺ | |||||||||
| Encore Consumer Capital Lion CF, LP | Private Equity | 12/09/2025 | 6,813,789 | 6,739,495 | *,⁺,11 | |||||||||
| ERA Blade Continuation Fund Parallel LP | Real Assets | 08/11/2025 | 22,925,783 | 22,009,468 | ⁺,9 | |||||||||
| Excellere Capital Fund II, L.P. | Private Equity | 04/01/2021 | 6,015,778 | 4,002,585 | *,⁺,9 | |||||||||
| Excellere Capital Fund III, L.P. | Private Equity | 09/30/2025 | 10,653,355 | 10,565,533 | *,⁺,9 | |||||||||
| FFL Parallel Fund IV, L.P. | Private Equity | 01/01/2021 | 437,596 | 402,637 | ⁺,11 | |||||||||
| FS Equity Partners VIII, L.P. | Private Equity | 12/31/2025 | 13,784,050 | 15,145,406 | *,⁺,12 | |||||||||
| FS Equity Partners IX, L.P. | Private Equity | 12/31/2025 | 2,698,803 | 2,490,053 | *,⁺,9 | |||||||||
| FineLine CV LP | Private Equity | 11/18/2024 | 13,182,063 | 16,290,468 | *,⁺ | |||||||||
| First-Party Time VI LLC | Private Equity | 07/02/2024 | 3,537,030 | 5,169,084 | * | |||||||||
| Francisco Partners V, L.P. | Private Equity | 10/01/2024 | 10,052,256 | 10,415,381 | ⁺,11 | |||||||||
| Francisco Partners VI, L.P. | Private Equity | 10/01/2024 | 4,036,032 | 4,675,354 | *,⁺,11 | |||||||||
| Franklin BSP Capital Corporation (2,276,656 common shares) | Private Debt | 03/31/2022 | 31,000,000 | 30,916,990 | 16 | |||||||||
| Frontier Continuation Fund V, L.P. | Private Equity | 11/20/2025 | 27,220,446 | 30,292,508 | *,⁺,9 | |||||||||
| Fulcrum Capital Partners V, LP | Private Equity | 12/31/2021 | 1,830,253 | 1,566,789 | ⁺ | |||||||||
The accompanying notes are an integral part of these consolidated financial statements
11
StepStone Private Markets
Consolidated Schedule of Investments (continued)
March 31, 2026
| Investments | Asset Class | Acquisition Date | Cost | Fair Value | Footnotes | |||||||||
| Secondary Investment - Non-Controlled/Non-Affiliated (continued) | ||||||||||||||
| North America (continued) | ||||||||||||||
| GA Continuity Fund II, L.P. | Private Equity | 03/14/2025 | $ | 14,477,208 | $ | 18,070,784 | ⁺ | |||||||
| Genstar Capital Partners IX, L.P. | Private Equity | 09/30/2024 | 5,718,051 | 6,313,268 | ⁺,11,12 | |||||||||
| Genstar Capital Partners X, L.P. | Private Equity | 09/30/2024 | 2,870,300 | 3,315,217 | ⁺,11 | |||||||||
| Genstar IX Opportunities Fund I, L.P. | Private Equity | 09/30/2024 | 1,008,735 | 969,598 | *,⁺,11 | |||||||||
| Genstar X Opportunities Fund I, L.P. | Private Equity | 09/30/2024 | 707,504 | 972,055 | *,⁺,11 | |||||||||
| Global Infrastructure Partners II-C, L.P. | Real Assets | 06/30/2021 | 8,041,450 | 1,486,078 | ⁺ | |||||||||
| Global Infrastructure Partners III-B Feeder Fund, L.P. | Real Assets | 03/31/2026 | 1,650,847 | 2,120,483 | *,⁺,9 | |||||||||
| Global Infrastructure Partners IV-C, L.P. | Real Assets | 06/30/2025 | 65,556,237 | 69,282,581 | ⁺,9 | |||||||||
| Golden Gate Capital Fund VII-A, L.P. | Private Equity | 12/31/2025 | 1,416,824 | 896,218 | ⁺,9 | |||||||||
| Golden Gate Capital Opportunity Fund-A, L.P. | Private Equity | 12/31/2025 | 7,831,181 | 10,928,477 | *,⁺,9 | |||||||||
| Gores Capital Partners III, L.P. | Private Equity | 01/01/2021 | 2,701 | 73,421 | *,⁺,11 | |||||||||
| GrandBanks Capital Venture Fund II LP | Private Equity | 09/30/2025 | 2,240,085 | 2,700,666 | *,⁺,9 | |||||||||
| Great Hill Equity Partners VI, L.P. | Private Equity | 12/31/2025 | 3,511,927 | 4,295,242 | ⁺,9,12 | |||||||||
| Great Hill Equity Partners VI-A, L.P. | Private Equity | 12/31/2025 | — | 99 | *,9,12 | |||||||||
| Great Hill Equity Partners VII, L.P. | Private Equity | 12/31/2025 | 3,562,438 | 3,861,389 | *,⁺,9,12 | |||||||||
| Great Hill Equity Partners VII-A, L.P. | Private Equity | 12/31/2025 | 528,618 | 570,979 | *,9,12 | |||||||||
| Great Hill Equity Partners VIII, L.P. | Private Equity | 12/31/2025 | 7,493,821 | 7,886,345 | *,⁺,9 | |||||||||
| Green Equity Investors CF III-B, L.P. | Private Equity | 12/21/2023 | 862,065 | 585,144 | *,⁺,11 | |||||||||
| Green Equity Investors CF IV-B, L.P. | Private Equity | 04/17/2025 | 247,211 | 242,968 | *,⁺ | |||||||||
| Green Equity Investors CF IV-C, L.P. | Private Equity | 04/15/2025 | 3,386,171 | 3,558,992 | *,⁺,9 | |||||||||
| Green Equity Investors IX, L.P. | Private Equity | 06/30/2022 | 4,627,767 | 5,477,194 | *,⁺ | |||||||||
| Green Equity Investors Offshore Fund VII, L.P. | Private Equity | 09/30/2022 | 4,695,926 | 2,851,986 | *,⁺ | |||||||||
| Green Equity Investors Offshore Fund VIII, L.P. | Private Equity | 09/30/2022 | 2,696,877 | 3,857,509 | *,⁺ | |||||||||
| Green Equity Investors Side CF III-B, L.P. | Private Equity | 12/21/2023 | 4,598,073 | 3,140,066 | *,⁺ | |||||||||
| Green Equity Investors Side VII, L.P. | Private Equity | 06/30/2023 | 33,571,736 | 25,472,655 | *,⁺ | |||||||||
| Green Equity Investors VII, L.P. | Private Equity | 06/30/2022 | 9,097,472 | 5,315,529 | *,⁺,11 | |||||||||
| Green Equity Investors VIII, L.P. | Private Equity | 06/30/2022 | 3,070,714 | 4,482,754 | *,⁺,11 | |||||||||
| Gridiron Capital Fund II, L.P. | Private Equity | 04/01/2021 | 538,422 | 7,332 | *,⁺,12 | |||||||||
| Gryphon Partners IV, L.P. | Private Equity | 12/31/2021 | 1,292,533 | 1,382,165 | *,⁺ | |||||||||
| GTCR Fund XII LP | Private Equity | 12/31/2024 | 3,648,153 | 3,509,757 | ⁺,12 | |||||||||
| GTCR Oak Fund LP | Private Equity | 12/16/2025 | 23,141,939 | 25,688,226 | *,⁺,9,12 | |||||||||
| H.I.G. Advantage Buyout Fund, L.P. | Private Equity | 01/02/2026 | 8,108,244 | 8,326,302 | ⁺,12 | |||||||||
| H.I.G. Advantage Buyout Fund II, L.P. | Private Equity | 01/02/2026 | 2,665,304 | 3,112,137 | ⁺,12 | |||||||||
| H.I.G. Middle Market LBO Fund III, L.P. | Private Equity | 01/02/2026 | 10,631,311 | 11,493,007 | *,⁺,12 | |||||||||
| H.I.G. Middle Market LBO Fund IV, L.P. | Private Equity | 01/02/2026 | 7,187,696 | 7,806,196 | *,⁺,12 | |||||||||
| H.I.G. Realty Credit SRE Non-REIT Feeder Fund, L.P. | Real Assets | 10/01/2021 | 6,213,510 | 3,783,062 | ⁺ | |||||||||
| H.I.G. Small-Cap & Growth Buyout Fund IV, L.P. | Private Equity | 12/31/2025 | 193,073 | 152,960 | *,⁺,9 | |||||||||
| Halifax Capital Partners IV, L.P. | Private Equity | 06/30/2023 | 11,533,142 | 16,556,743 | *,⁺,11 | |||||||||
| Halifax Capital Partners V, L.P. | Private Equity | 06/30/2023 | 324,958 | 540,815 | *,⁺ | |||||||||
| Harvest Partners VI, L.P. | Private Equity | 03/31/2021 | 1,667,265 | 240,505 | *,⁺,10 | |||||||||
| Harvest Partners VII (Parallel), L.P. | Private Equity | 11/01/2022 | 9,154,028 | 8,372,476 | ⁺ | |||||||||
| Harvest Partners VII, L.P. | Private Equity | 11/01/2022 | 17,399,433 | 15,851,053 | ⁺ | |||||||||
The accompanying notes are an integral part of these consolidated financial statements
12
StepStone Private Markets
Consolidated Schedule of Investments (continued)
March 31, 2026
| Investments | Asset Class | Acquisition Date | Cost | Fair Value | Footnotes | |||||||||
| Secondary Investment - Non-Controlled/Non-Affiliated (continued) | ||||||||||||||
| North America (continued) | ||||||||||||||
| Harvest Partners IX (Parallel), L.P. | Private Equity | 11/01/2022 | $ | 6,232,662 | $ | 6,502,301 | ⁺ | |||||||
| Hellman & Friedman Capital Partners VIII, L.P. | Private Equity | 09/30/2024 | 4,567,650 | 4,083,359 | ⁺,11,12,9 | |||||||||
| Hellman & Friedman Capital Partners IX, L.P. | Private Equity | 06/30/2022 | 18,698,765 | 23,921,151 | ⁺,11,12 | |||||||||
| Hellman & Friedman Capital Partners X, L.P. | Private Equity | 09/30/2024 | 5,424,718 | 6,337,090 | ⁺,11 | |||||||||
| Hellman & Friedman Capital Partners X (Parallel), L.P. | Private Equity | 03/31/2026 | 2,049,360 | 2,624,064 | ||||||||||
| Hellman & Friedman Capital Partners XI (Parallel), L.P. | Private Equity | 03/31/2026 | — | — | *,⁺,9 | |||||||||
| Heritage Healthcare Innovation Fund II, LP | Private Equity | 10/17/2024 | 12,732,443 | 13,594,390 | * | |||||||||
| Heritage Healthcare Innovation Fund IV, LP | Private Equity | 10/17/2024 | 1,113,331 | 973,661 | ⁺ | |||||||||
| HPH II International FF, LP | Private Equity | 07/12/2021 | 4,591,520 | 5,498,282 | *,⁺ | |||||||||
| HPH III Investments Parallel Fund, LP | Private Equity | 07/16/2024 | 15,456,253 | 19,333,385 | ⁺ | |||||||||
| HS Mohawk Fund I LP | Private Equity | 03/28/2024 | 11,288,484 | 19,050,131 | ⁺ | |||||||||
| Imaginary I Opportunity, L.P. | Private Equity | 04/21/2022 | 3,000,000 | 1,647,355 | * | |||||||||
| Insight Partners Continuation Fund II, L.P. | Private Equity | 03/31/2023 | 37,554,460 | 49,418,166 | *,⁺ | |||||||||
| Insight Partners Continuation Fund III, L.P. | Private Equity | 10/08/2024 | 16,932,077 | 21,735,739 | ⁺ | |||||||||
| InstarAGF Essential Infrastructure Fund II (LUX-USD), SCSp | Real Assets | 07/01/2025 | 12,356,044 | 15,471,724 | ⁺,12 | |||||||||
| Integrity Growth Partners Fund II, L.P. | Private Equity | 07/31/2024 | 1,779,624 | 2,252,426 | ⁺ | |||||||||
| Jade Equity Investors II, L.P. | Private Equity | 07/10/2025 | 1,952,755 | 2,228,781 | *,⁺,8 | |||||||||
| Jade Equity Investors Offshore Fund, L.P. | Private Equity | 09/30/2022 | 1,435,051 | 1,677,428 | *,⁺ | |||||||||
| JFL Equity Investors VI, L.P. | Private Equity | 07/31/2024 | 18,772,556 | 26,641,933 | *,⁺ | |||||||||
| JFL-NG Continuation Fund, L.P. | Private Equity | 10/27/2021 | 2,412,062 | 4,933,585 | *,⁺ | |||||||||
| K1 Special Opportunities Fund, L.P. | Private Equity | 03/31/2026 | 4,644,542 | 5,808,105 | *,⁺,9 | |||||||||
| Kelso Breathe Investor (DE), L.P. | Private Equity | 02/11/2021 | 3,482,939 | 6,762,181 | ⁺ | |||||||||
| KIA Teton, L.P. | Private Equity | 01/20/2026 | 23,035,748 | 39,080,075 | *,⁺,9 | |||||||||
| Kinderhook Capital Waste CV, L.P. | Private Equity | 10/21/2025 | 13,952,221 | 15,187,258 | *,⁺,9 | |||||||||
| KKR Global Infrastructure Investors III EEA (EUR) SCSp | Real Assets | 04/01/2024 | 14,799,438 | 14,300,961 | ⁺,11 | |||||||||
| KKR Global Infrastructure Investors IV (EUR) SCSp | Real Assets | 10/01/2024 | 22,529,944 | 26,683,215 | ⁺ | |||||||||
| KKR Global Infrastructure Investors IV (USD) SCSp | Real Assets | 07/01/2024 | 44,576,695 | 53,644,098 | ⁺ | |||||||||
| KKR Health Care Strategic Growth Fund L.P. | Private Equity | 10/01/2025 | 3,607,223 | 3,710,541 | ⁺,9 | |||||||||
| KPS Special Situations Fund IV, LP | Private Equity | 09/30/2025 | 259,516 | 856,031 | ⁺,11 | |||||||||
| KPS Special Situations Fund V, LP | Private Equity | 09/30/2025 | 627,277 | 1,662,955 | ⁺,11 | |||||||||
| KPS Special Situations Fund V (A), LP | Private Equity | 09/30/2025 | 2,452,902 | 2,936,815 | ⁺,9 | |||||||||
| KPS Special Situations Fund VI, LP | Private Equity | 09/30/2025 | 61,452 | 165,753 | *,⁺,11 | |||||||||
| KPS Special Situations Fund VI (A), LP | Private Equity | 09/30/2025 | 347,111 | 404,713 | *,⁺,9 | |||||||||
| KPS Special Situations Mid-Cap Fund, LP | Private Equity | 09/30/2025 | 327,897 | 1,223,628 | ⁺,11 | |||||||||
| KPS Special Situations Mid-Cap Fund II, LP | Private Equity | 09/30/2025 | 222,900 | 219,522 | *,⁺,11 | |||||||||
| L Catterton VIII Offshore, L.P. | Private Equity | 12/31/2021 | 1,085,002 | 939,802 | *,⁺ | |||||||||
| Linden Capital Partners IV-A LP | Private Equity | 09/30/2025 | 2,742,131 | 2,972,494 | ⁺,9 | |||||||||
| LLR Equity Partners III, L.P. | Private Equity | 04/02/2021 | 301,587 | 4,212 | *,⁺,12 | |||||||||
| LSCP BTX CV-B LP | Private Equity | 03/27/2026 | 4,570,280 | 4,500,000 | *,⁺,9 | |||||||||
| Madison Dearborn Capital Partners VIII-C, L.P. | Private Equity | 03/12/2021 | 764,227 | 784,701 | ⁺ | |||||||||
| MAF Investments IV LLC | Private Debt | 08/01/2024 | 9,942,829 | 10,595,784 | ||||||||||
| Marlin Equity Partners IV, L.P. | Private Equity | 12/29/2023 | 2,997,167 | 1,523,053 | *,⁺ | |||||||||
The accompanying notes are an integral part of these consolidated financial statements
13
StepStone Private Markets
Consolidated Schedule of Investments (continued)
March 31, 2026
| Investments | Asset Class | Acquisition Date | Cost | Fair Value | Footnotes | |||||||||
| Secondary Investment - Non-Controlled/Non-Affiliated (continued) | ||||||||||||||
| North America (continued) | ||||||||||||||
| Marlin Heritage, L.P. | Private Equity | 12/31/2025 | $ | 1,154,379 | $ | 1,089,847 | *,⁺,9 | |||||||
| Marlin Heritage II, L.P. | Private Equity | 12/31/2025 | 2,596,623 | 2,292,947 | *,12 | |||||||||
| Marlin Heritage II-A, L.P | Private Equity | 12/31/2025 | 652,902 | 572,907 | *,9 | |||||||||
| Maroon Investors, LP | Private Equity | 07/13/2023 | 4,108,640 | 5,708,598 | *,⁺ | |||||||||
| Mason Wells Buyout Fund IV, LP | Private Equity | 03/31/2026 | 928,996 | 982,990 | *,⁺,9 | |||||||||
| MetLife Investment Private Equity Partners II (Feeder), LP | Private Equity | 06/28/2024 | 67,296,714 | 82,321,198 | ⁺ | |||||||||
| MiddleGround Partners II, L.P. | Private Equity | 12/31/2025 | 7,770,518 | 7,620,947 | *,⁺,9 | |||||||||
| MLC Private Equity Partners Feeder, L.P. | Private Equity | 03/25/2024 | 206,895,392 | 276,397,889 | ⁺ | |||||||||
| Monogram Capital Partners I, L.P. | Private Equity | 09/30/2025 | 3,732,972 | 3,067,223 | *,⁺,8 | |||||||||
| Monogram Capital Partners II, L.P. | Private Equity | 09/30/2025 | 2,635,587 | 2,251,655 | *,⁺,9,8 | |||||||||
| Monogram Capital Partners III PV, L.P. | Private Equity | 09/30/2025 | 9,674,043 | 9,021,298 | *,⁺,9 | |||||||||
| Nautic Partners IX, L.P. | Private Equity | 12/31/2025 | 5,676,639 | 7,185,259 | ⁺,12 | |||||||||
| Nautic Partners X, L.P. | Private Equity | 12/31/2025 | 18,934,558 | 22,663,624 | *,⁺,12 | |||||||||
| Nautic Partners XI, L.P. | Private Equity | 12/31/2025 | 3,769,741 | 4,368,266 | *,⁺,12 | |||||||||
| North Haven Infrastructure Partners III SCSp | Real Assets | 03/31/2026 | 21,562,298 | 23,186,259 | *,⁺,9 | |||||||||
| Novacap Financial Services I, L.P. | Private Equity | 09/30/2024 | 226,545 | 152,009 | ⁺,13 | |||||||||
| Novacap II, Limited Partnership | Private Equity | 09/30/2024 | 75,537 | 94,055 | *,⁺,13 | |||||||||
| Novacap Industries III, L.P. | Private Equity | 09/30/2024 | 70,953 | 164,796 | ⁺,13 | |||||||||
| Novacap Industries IV, L.P. | Private Equity | 09/30/2024 | 33,618 | 16,550 | ⁺,13 | |||||||||
| Novacap Industries V, L.P. | Private Equity | 09/30/2024 | 338,093 | 437,891 | *,⁺,13 | |||||||||
| Novacap International Industries V, L.P. | Private Equity | 03/31/2026 | 2,242,475 | 2,653,182 | *,⁺,9 | |||||||||
| Novacap Technologies III, L.P. | Private Equity | 09/30/2024 | — | — | *,13 | |||||||||
| Oak Hill Capital Partners V (Offshore 892), L.P. | Private Equity | 01/29/2021 | 2,091,441 | 2,976,082 | *,⁺ | |||||||||
| Oak Hill Capital Partners V (Offshore), L.P. | Private Equity | 07/06/2023 | 25,395,737 | 33,425,903 | *,⁺ | |||||||||
| Oak Hill Capital Partners VI (TE 892), L.P. | Private Equity | 07/06/2023 | 8,626,213 | 10,545,315 | *,⁺ | |||||||||
| Oak Hill Digital Opportunities Partners (TE 892), L.P. | Real Assets | 07/19/2024 | 36,740,159 | 46,321,634 | *,⁺ | |||||||||
| OceanSound Partners Fund, LP | Private Equity | 02/28/2022 | 8,626,903 | 13,386,472 | *,⁺,12 | |||||||||
| OCP North Fund Offshore LP | Private Equity | 09/30/2025 | 37,500,000 | 46,812,738 | *,9 | |||||||||
| Odyssey Investment Partners Fund IV, LP | Private Equity | 04/01/2021 | 4,114 | — | *,⁺ | |||||||||
| Odyssey Investment Partners Fund V, LP | Private Equity | 12/31/2025 | 830,114 | 993,776 | *,⁺,9 | |||||||||
| Odyssey Investment Partners Fund VI, LP | Private Equity | 12/31/2025 | 17,092,519 | 21,433,433 | *,⁺,12 | |||||||||
| Odyssey Investment Partners Fund VI-A, LP | Private Equity | 12/31/2025 | 564,845 | 724,410 | *,⁺,12 | |||||||||
| OHCP V GA COI, L.P. | Private Equity | 12/16/2020 | 2,473,362 | 4,574,471 | * | |||||||||
| Olympus Growth Fund VII, L.P. | Private Equity | 07/31/2024 | 33,652,303 | 36,669,206 | ⁺,11 | |||||||||
| Onex Partners Leaf CV LP | Private Equity | 03/26/2026 | 11,946,516 | 14,809,851 | *,⁺,9 | |||||||||
| Paddington Partners, L.P. | Private Equity | 01/10/2024 | 91,365,830 | 84,368,469 | *,⁺ | |||||||||
| Pamlico Capital IV, L.P. | Private Equity | 12/31/2024 | 4,090,835 | 3,821,531 | *,⁺,12 | |||||||||
| Parallaxes Capital Opportunity Feeder Fund VI, L.P. | Private Equity | 03/27/2024 | 5,173,244 | 7,090,186 | *,⁺ | |||||||||
| Parallaxes Capital Opportunity Feeder Fund VII, L.P. | Private Equity | 07/23/2025 | 1,688,477 | 1,956,267 | *,⁺,9 | |||||||||
| Peak Rock Capital Fund III LP | Private Equity | 01/02/2026 | 6,468,483 | 8,521,918 | *,⁺,9 | |||||||||
| Peak Rock Capital Fund III-A LP | Private Equity | 01/02/2026 | 837,866 | 1,084,650 | *,⁺,9 | |||||||||
| Pegasus WSJLL Fund, L.P. | Private Equity | 12/14/2021 | 13,239,188 | 15,274,487 | *,⁺ | |||||||||
The accompanying notes are an integral part of these consolidated financial statements
14
StepStone Private Markets
Consolidated Schedule of Investments (continued)
March 31, 2026
| Investments | Asset Class | Acquisition Date | Cost | Fair Value | Footnotes | |||||||||
| Secondary Investment - Non-Controlled/Non-Affiliated (continued) | ||||||||||||||
| North America (continued) | ||||||||||||||
| Pine Brook Capital Partners II, L.P. | Private Equity | 12/31/2020 | $ | 950,995 | $ | 1,409,918 | *,⁺,11 | |||||||
| Platinum Equity Capital Partners IV, L.P. | Private Equity | 09/30/2024 | 14,984,632 | 11,636,159 | *,⁺,11 | |||||||||
| Platinum Equity Capital Partners V, L.P. | Private Equity | 09/30/2024 | 22,543,122 | 19,227,345 | ⁺,11 | |||||||||
| PlayCore CV, L.P. | Private Equity | 11/21/2024 | 7,614,317 | 10,763,294 | ⁺ | |||||||||
| Poplar DC Holdings, LP | Private Equity | 07/01/2024 | 23,617,051 | 22,828,315 | ||||||||||
| Providence Cameron (ATG) Co-Investment L.P. | Private Equity | 09/11/2024 | 19,115,229 | 27,160,009 | *,⁺ | |||||||||
| Providence Cameron (MO) Co-Investment L.P. | Private Equity | 09/11/2024 | 15,871,809 | 26,354,334 | *,⁺ | |||||||||
| Providence Cameron (W) Co-Investment L.P. | Private Equity | 09/11/2024 | 43,088,250 | 60,134,378 | ||||||||||
| Providence Equity Partners IX-A S.C.Sp. | Private Equity | 09/11/2024 | 30,772,935 | 34,338,440 | ⁺ | |||||||||
| PSG Sequel-A L.P. | Private Equity | 01/31/2025 | 41,486,173 | 47,056,217 | ⁺ | |||||||||
| PTEV, L.P. | Private Equity | 12/30/2021 | 1,559,649 | 1,824,688 | *,⁺,8 | |||||||||
| PWP Growth Equity Fund I (B) LP | Private Equity | 09/30/2025 | 2,781,655 | 3,550,520 | *,⁺,9 | |||||||||
| PWP Growth Equity Fund II B LP | Private Equity | 09/30/2025 | 3,191,618 | 4,431,943 | *,⁺,9 | |||||||||
| Redpoint Omega III, L.P. | Private Equity | 12/31/2024 | 2,685,087 | 2,369,580 | * | |||||||||
| Rembrandt Venture Partners Fund Two, L.P. | Private Equity | 09/30/2025 | 2,346,796 | 2,830,349 | *,12 | |||||||||
| Riverside Capital Appreciation Fund VI, L.P. | Private Equity | 12/31/2021 | 1,948,567 | 1,475,120 | *,⁺ | |||||||||
| Riverside Micro-Cap Fund IV B A, L.P. | Private Equity | 12/31/2021 | 1,208,554 | 418,361 | *,⁺ | |||||||||
| Riverside Micro-Cap Fund IV-A, L.P. | Private Equity | 12/31/2021 | 9,698,083 | 6,584,220 | *,⁺ | |||||||||
| Roark Capital Partners CF LP | Private Equity | 08/26/2022 | 16,850,560 | 27,866,977 | ⁺ | |||||||||
| Roark Capital Partners II Sidecar LP | Private Equity | 12/31/2025 | 1,857,149 | 1,929,998 | *,⁺,9 | |||||||||
| Roark Capital Partners V (TE) LP | Private Equity | 12/31/2025 | 2,967,152 | 3,148,648 | *,⁺,9 | |||||||||
| Roark Capital Partners VII (OS) LP | Private Equity | 01/02/2026 | — | — | *,⁺,12 | |||||||||
| Rocket Fuel III LLC | Private Equity | 07/02/2024 | 3,534,299 | 4,259,093 | * | |||||||||
| Saw Mill Capital Investors, L.P. | Private Equity | 04/09/2021 | — | 13,722 | *,⁺,10 | |||||||||
| SBJ Fund, LP | Private Equity | 07/31/2023 | 1,328,784 | 1,052,694 | *,⁺,12 | |||||||||
| Sea Change IV LLC | Private Equity | 07/02/2024 | 479,708 | 812,885 | * | |||||||||
| Searchlight Capital II, L.P. | Private Equity | 03/31/2026 | 69,590 | 241,090 | *,⁺,9,12 | |||||||||
| Searchlight Capital II PV, L.P. | Private Equity | 03/31/2026 | 142,527 | 557,776 | *,⁺,9 | |||||||||
| Sentinel Capital Partners VI, L.P. | Private Equity | 01/07/2025 | 2,501,387 | 2,403,317 | *,⁺,12 | |||||||||
| Sentinel MCA AV, L.P. | Private Equity | 10/13/2023 | 7,627,875 | 9,051,193 | *,⁺ | |||||||||
| SK Capital Partners V-A, L.P. | Private Equity | 01/01/2025 | 2,178,014 | 1,593,996 | ⁺ | |||||||||
| SkyKnight Capital II CV B, L.P. | Private Equity | 10/29/2024 | 77,650,403 | 93,614,053 | ⁺ | |||||||||
| SkyKnight TG Holdings, L.P. | Private Equity | 08/01/2025 | 8,749,896 | 8,719,237 | *,⁺,9 | |||||||||
| SL SPV-4 - A, L.P. | Private Equity | 03/19/2025 | 4,500,000 | 8,253,545 | *,⁺ | |||||||||
| SPC Partners IV, L.P. | Private Equity | 03/31/2021 | 983,817 | 168,304 | ⁺,12 | |||||||||
| SPC Partners V, L.P. | Private Equity | 12/31/2020 | 166,961 | 133,929 | *,⁺,11 | |||||||||
| Stellex Capital Partners LP | Private Equity | 03/31/2026 | 1,206,651 | 1,170,181 | *,⁺,9 | |||||||||
| Stellex Capital Partners II-A LP | Private Equity | 03/31/2026 | 3,488,183 | 3,862,512 | *,⁺,9 | |||||||||
| Sterling Investment Partners III, L.P. | Private Equity | 01/01/2021 | 683,753 | 472,400 | ⁺,11 | |||||||||
| Sterling Investment Partners XK Opportunities Fund-A, L.P. | Private Equity | 10/23/2025 | 15,769,753 | 16,982,733 | *,⁺,9 | |||||||||
| Stone Point CV, L.P. | Private Equity | 10/29/2025 | 25,379,667 | 27,672,695 | *,⁺,9 | |||||||||
| Stonepeak Infrastructure Fund III LP | Real Assets | 09/29/2023 | 6,347,631 | 6,663,134 | ⁺,12 | |||||||||
The accompanying notes are an integral part of these consolidated financial statements
15
StepStone Private Markets
Consolidated Schedule of Investments (continued)
March 31, 2026
| Investments | Asset Class | Acquisition Date | Cost | Fair Value | Footnotes | |||||||||
| Secondary Investment - Non-Controlled/Non-Affiliated (continued) | ||||||||||||||
| North America (continued) | ||||||||||||||
| Strategic Value Spurs A, L.P. | Real Assets | 12/13/2024 | $ | 24,891,316 | $ | 30,654,740 | *,⁺ | |||||||
| Stripes Continuation Feeder Fund, LP | Private Equity | 10/29/2021 | 3,183,746 | 1,727,544 | *,⁺ | |||||||||
| Summit Partners Growth Equity Fund IX-B, L.P. | Private Equity | 09/30/2024 | 1,955,533 | 1,686,701 | *,⁺ | |||||||||
| Summit Partners Growth Equity Fund X-A, L.P. | Private Equity | 09/30/2025 | 20,244,964 | 22,561,241 | *,⁺,8,12 | |||||||||
| Summit Partners Growth Equity Fund X-B, L.P. | Private Equity | 09/30/2024 | 4,684,442 | 5,324,770 | *,⁺,9 | |||||||||
| Summit Partners Growth Equity Fund XI-A, L.P. | Private Equity | 09/30/2025 | 14,055,665 | 15,712,164 | *,⁺,8,12 | |||||||||
| Summit Partners Growth Equity Fund XI-B, L.P. | Private Equity | 09/30/2024 | 3,254,134 | 3,640,774 | *,⁺,9 | |||||||||
| TA Atlantic and Pacific VI L.P. | Private Equity | 03/31/2026 | 104,520 | 151,105 | *,⁺,9 | |||||||||
| TA Atlantic and Pacific VII-B L.P. | Private Equity | 12/31/2020 | 1,398,433 | 2,361,291 | ⁺,9,11 | |||||||||
| TA XII-A, L.P. | Private Equity | 12/31/2025 | 2,320,592 | 2,267,393 | *,⁺,12 | |||||||||
| TA XII-B, L.P. | Private Equity | 12/31/2025 | 772,766 | 752,366 | *,⁺,9 | |||||||||
| TA XIII-A, L.P. | Private Equity | 12/31/2025 | 4,053,118 | 4,152,530 | *,⁺,12 | |||||||||
| TA XIII-B, L.P. | Private Equity | 12/31/2025 | 3,825,966 | 4,079,612 | *,⁺,9 | |||||||||
| TA XIV-B, L.P. | Private Equity | 03/31/2026 | 2,726,423 | 2,928,908 | *,⁺,9 | |||||||||
| TA XV-B, L.P. | Private Equity | 03/31/2026 | 910,046 | 935,506 | *,⁺,9 | |||||||||
| Tailwind Capital Partners II (Cayman) L.P. | Private Equity | 12/31/2020 | 747,554 | 4,442 | ⁺ | |||||||||
| The Resolute III Continuation Fund, L.P. | Private Equity | 09/27/2024 | 106,583,274 | 112,857,009 | ⁺ | |||||||||
| THL HT Parallel SPV, L.P. | Private Equity | 11/30/2020 | 2,379,691 | 5,266,175 | ⁺ | |||||||||
| Thoma Bravo Discover Fund III, L.P. | Private Equity | 01/01/2025 | 3,157,779 | 3,956,708 | ⁺,12 | |||||||||
| Thoma Bravo Fund XI-A, L.P. | Private Equity | 01/01/2022 | 3,703,148 | 1,449,505 | *,⁺ | |||||||||
| Thoma Bravo Fund XIII, L.P. | Private Equity | 09/30/2024 | 11,694,320 | 10,598,020 | ⁺,11,12 | |||||||||
| Thoma Bravo Fund XIII-A, L.P. | Private Equity | 01/02/2026 | 903,230 | 846,893 | *,⁺,9 | |||||||||
| Thoma Bravo Fund XIV, L.P. | Private Equity | 09/30/2024 | 28,680,015 | 27,293,806 | ⁺,11,12 | |||||||||
| Thoma Bravo Fund XIV-A, L.P. | Private Equity | 01/02/2026 | 2,188,410 | 2,099,702 | *,⁺,9 | |||||||||
| Thoma Bravo Fund XV, L.P. | Private Equity | 09/30/2024 | 4,810,146 | 5,228,846 | ⁺,11 | |||||||||
| Thoma Bravo Special Opportunities Fund II-A, L.P. | Private Equity | 01/01/2022 | 1,404,367 | 1,211,625 | ⁺ | |||||||||
| Thomas H. Lee Equity Fund VIII, L.P. | Private Equity | 01/02/2026 | 6,696,405 | 8,564,973 | *,⁺,12 | |||||||||
| Thomas H. Lee Equity Fund IX, L.P. | Private Equity | 01/02/2026 | 13,377,125 | 15,869,325 | ⁺,12 | |||||||||
| Thomas H. Lee Parallel Fund VIII, L.P. | Private Equity | 01/02/2026 | 1,342,061 | 1,713,596 | *,⁺,9 | |||||||||
| Thomas H. Lee Parallel Fund IX, L.P. | Private Equity | 01/02/2026 | 1,239,739 | 1,467,024 | ⁺,9 | |||||||||
| Tiger Global Private Investment Partners XV Feeder, L.P. | Private Equity | 03/23/2022 | 9,833,794 | 8,304,070 | *,⁺ | |||||||||
| TowerBrook Investors III Trust | Private Equity | 12/31/2020 | 107,310 | 11,584 | * | |||||||||
| TPG Growth II, L.P. | Private Equity | 04/09/2021 | 154,383 | 110,907 | *,⁺,12 | |||||||||
| TPG Partners VII, L.P. | Private Equity | 01/05/2023 | 13,267,356 | 8,647,858 | *,⁺ | |||||||||
| TPG Partners VIII, L.P. | Private Equity | 06/30/2022 | 58,935,866 | 70,073,415 | ⁺,10,11,12 | |||||||||
| Trident VIII, L.P. | Private Equity | 12/30/2022 | 10,992,485 | 13,494,934 | ⁺,9 | |||||||||
| Trident IX, L.P. | Private Equity | 01/02/2026 | 6,565,061 | 7,633,940 | ⁺,12 | |||||||||
| Trinitas Capital Management, LLC | Private Debt | 03/15/2024 | 33,800,000 | 29,671,332 | 11 | |||||||||
| Trinity Hunt Partners CF, L.P. | Private Equity | 10/14/2022 | 24,417,077 | 31,377,589 | *,⁺ | |||||||||
| Trinity Hunt Partners V, L.P. | Private Equity | 09/30/2024 | 707,531 | 461,050 | *,⁺ | |||||||||
| Trive Capital Fund I (Offshore) LP | Private Equity | 12/31/2021 | 696,890 | 868,477 | *,⁺,9 | |||||||||
| Trive Capital Fund II (Offshore) LP | Private Equity | 12/31/2021 | 4,078,522 | 6,435,035 | ⁺,9 | |||||||||
The accompanying notes are an integral part of these consolidated financial statements
16
StepStone Private Markets
Consolidated Schedule of Investments (continued)
March 31, 2026
| Investments | Asset Class | Acquisition Date | Cost | Fair Value | Footnotes | |||||||||
| Secondary Investment - Non-Controlled/Non-Affiliated (continued) | ||||||||||||||
| North America (continued) | ||||||||||||||
| Trive Capital Fund III LP | Private Equity | 12/31/2021 | $ | 6,172,958 | $ | 4,443,961 | *,⁺,10 | |||||||
| Trive Capital Fund III-A LP | Private Equity | 12/31/2021 | 4,447,051 | 8,620,969 | *,⁺,9 | |||||||||
| Trive Capital Fund IV-A LP | Private Equity | 12/31/2021 | 702,304 | 1,020,863 | *,⁺ | |||||||||
| Trive Structured Capital Fund I-A LP | Private Equity | 12/31/2021 | 3,517,164 | 3,965,775 | ⁺ | |||||||||
| Trivest Discovery Fund, L.P. | Private Equity | 10/01/2024 | 268,891 | 320,424 | *,⁺ | |||||||||
| Trivest Discovery Fund II-A, L.P. | Private Equity | 10/01/2024 | 863,895 | 951,078 | *,⁺ | |||||||||
| Trivest Fund V, L.P. | Private Equity | 10/01/2024 | 142,711 | 150,464 | *,⁺ | |||||||||
| Trivest Fund VI, L.P. | Private Equity | 10/01/2024 | 496,891 | 662,432 | *,⁺ | |||||||||
| Trivest Fund VII-A, L.P. | Private Equity | 10/01/2024 | 1,088,539 | 1,016,340 | *,⁺ | |||||||||
| Trivest Growth Investment Fund, L.P. | Private Equity | 10/01/2024 | 382,640 | 360,015 | ⁺ | |||||||||
| Trivest Growth Investment Fund II, L.P. | Private Equity | 10/01/2024 | 796,744 | 1,001,413 | ⁺ | |||||||||
| Trivest Recognition Fund-A, L.P. | Private Equity | 10/01/2024 | 618,477 | 677,297 | ⁺ | |||||||||
| TriWest Capital Partners III, L.P. | Private Equity | 09/30/2024 | 16 | — | ⁺,13 | |||||||||
| TriWest Capital Partners IV, L.P. | Private Equity | 09/30/2024 | 103,870 | 72,142 | ⁺,13 | |||||||||
| TriWest Capital Partners V, L.P. | Private Equity | 09/30/2024 | 547,095 | 382,946 | ⁺,13 | |||||||||
| Truelink Capital I-A, L.P. | Private Equity | 04/30/2024 | 32,128,501 | 41,392,586 | ⁺ | |||||||||
| TSCP CV II, L.P. | Private Equity | 09/08/2024 | 33,311,720 | 51,704,998 | *,⁺ | |||||||||
| TSG9 L.P. | Private Equity | 12/31/2025 | 7,204,303 | 7,437,844 | ⁺,12 | |||||||||
| TSG9 Parallel L.P. | Private Equity | 12/31/2025 | 799,457 | 808,762 | ⁺,9 | |||||||||
| Vector Capital V, L.P. | Private Equity | 12/31/2021 | 4,794,923 | 4,907,594 | *,⁺ | |||||||||
| Vestar Capital Partners Rainforest, L.P. | Private Equity | 04/09/2024 | 15,465,456 | 16,961,791 | ⁺ | |||||||||
| Vista Equity Endeavor Fund I-A, L.P. | Private Equity | 01/01/2022 | 787,968 | 1,144,109 | *,⁺ | |||||||||
| Vista Equity Endeavor Fund III-A, L.P. | Private Equity | 04/23/2025 | 2,556,280 | 2,699,979 | *,⁺,9 | |||||||||
| Vista Equity Partners Fund V, L.P. | Private Equity | 12/31/2025 | 8,350,994 | 6,706,601 | *,⁺,12 | |||||||||
| Vista Equity Partners Fund VIII, L.P. | Private Equity | 04/23/2025 | 8,187,858 | 8,963,844 | *,⁺,12 | |||||||||
| Vista Equity Partners Hubble, L.P. | Private Equity | 06/23/2025 | 17,810,499 | 30,171,688 | *,⁺,9 | |||||||||
| Vista Equity Partners Meadowbrook, L.P. | Private Equity | 04/23/2025 | 22,642,497 | 23,122,947 | *,⁺,12 | |||||||||
| Vista Foundation Fund V-A, L.P. | Private Equity | 04/23/2025 | 1,245,060 | 1,155,672 | ⁺,9 | |||||||||
| Warburg Pincus Financial Sector, L.P. | Private Equity | 09/30/2025 | 1,983,089 | 2,220,988 | *,⁺,9 | |||||||||
| Warburg Pincus Global Growth-E, L.P. | Private Equity | 09/30/2024 | 1,611,796 | 2,303,732 | *,⁺ | |||||||||
| Warburg Pincus Jovian GG, L.P. | Private Equity | 12/17/2024 | 112,986 | 237,194 | ⁺ | |||||||||
| Warburg Pincus Private Equity XII-D, L.P. | Private Equity | 09/30/2024 | 1,219,222 | 1,353,983 | *,11 | |||||||||
| Water Street Healthcare Partners II, L.P. | Private Equity | 04/01/2021 | 553,537 | 19,355 | *,⁺ | |||||||||
| Webster Equity Partners III-A, L.P. | Private Equity | 04/29/2021 | 4,365,500 | 2,660,634 | *,⁺ | |||||||||
| Webster Equity Partners III-B, L.P. | Private Equity | 01/17/2024 | 573,368 | 1,142,442 | * | |||||||||
| WEP Terra Fund, L.P. | Private Equity | 10/23/2024 | 6,018,018 | 9,588,000 | *,⁺ | |||||||||
| West Street Real Estate Secondary Partners B, L.P. | Real Assets | 12/10/2021 | 5,070,499 | 3,535,793 | *,⁺,8 | |||||||||
| West Street Strategic Solutions Offshore Fund I, L.P. | Private Debt | 10/01/2025 | 10,090,071 | 10,596,609 | *,⁺,9 | |||||||||
| WestCap Strategic Operator Offshore Feeder, L.P. | Private Equity | 04/13/2022 | 6,499,003 | 4,208,136 | * | |||||||||
| WestCap Strategic Operator US Feeder Fund, L.P. | Private Equity | 04/13/2022 | 15,011,856 | 9,731,326 | ⁺,12 | |||||||||
| Westview Capital Partners III, L.P. | Private Equity | 12/31/2021 | 2,308,266 | 1,741,723 | *,⁺,11 | |||||||||
The accompanying notes are an integral part of these consolidated financial statements
17
StepStone Private Markets
Consolidated Schedule of Investments (continued)
March 31, 2026
| Investments | Asset Class | Acquisition Date | Cost | Fair Value | Footnotes | |||||||||
| Secondary Investment - Non-Controlled/Non-Affiliated (continued) | ||||||||||||||
| North America (continued) | ||||||||||||||
| XPV Water Extended Value Fund LP | Private Equity | 10/03/2022 | $ | 9,652,422 | $ | 10,727,093 | *,⁺ | |||||||
| Total North America | $ | 3,218,618,712 | $ | 3,669,956,913 | ||||||||||
| Rest of World - 1.4% of NAV | ||||||||||||||
| Bain Capital Asia Fund III, L.P. | Private Equity | 03/31/2026 | $ | 252,919 | $ | 1,588,205 | *,⁺,9 | |||||||
| Bain Capital Asia Fund IV, L.P. | Private Equity | 12/31/2024 | 1,471,022 | 1,559,399 | ⁺,12,9 | |||||||||
| Carlyle MENA Partners, L.P. and Parallel Vehicles | Private Equity | 01/01/2021 | 62,224 | 268,772 | ⁺,11 | |||||||||
| Carlyle South America Buyout Fund, L.P. and Parallel Vehicles | Private Equity | 01/01/2021 | 229,532 | 3,299 | *,⁺,11 | |||||||||
| Coatue CT 162 LP | Real Assets | 01/06/2026 | 25,125,000 | 25,051,287 | *,9 | |||||||||
| Eve One Fund II L.P. | Private Equity | 03/11/2022 | 9,750,000 | 12,278,151 | *,⁺ | |||||||||
| MC Brazil Special Opportunities Fund STP, LP | Private Equity | 03/30/2026 | 24,451,294 | 26,225,904 | *,⁺,9 | |||||||||
| NewQuest Asia Fund IV HH, L.P. | Private Equity | 04/25/2022 | 8,653,355 | 11,939,211 | *,⁺ | |||||||||
| Pacific Equity Partners Fund VI, L.P. | Private Equity | 12/31/2024 | 1,576,079 | 1,801,237 | *,⁺ | |||||||||
| Vertex IV CF L.P. | Private Equity | 01/04/2022 | 2,279,510 | 1,762,905 | *,⁺ | |||||||||
| Total Rest of World | $ | 73,850,935 | $ | 82,478,370 | ||||||||||
| Total Non-Controlled/Non-Affiliated Secondary Investments | $ | 4,009,543,939 | $ | 4,604,511,087 | ||||||||||
| Public Securities - Non-Controlled/Non-Affiliated - 1.0% of NAV | 1,2 | |||||||||||||
| North America - 1.0% of NAV | ||||||||||||||
| Karman Holdings Inc (707,452 common shares) | Public Securities | 07/28/2025 | $ | 18,059,800 | $ | 56,631,533 | *,17 | |||||||
| Total North America | $ | 18,059,800 | $ | 56,631,533 | ||||||||||
| Total Non-Controlled/Non-Affiliated Public Securities | $ | 18,059,800 | $ | 56,631,533 | ||||||||||
| Total Non-Controlled/Non-Affiliated Investments - 102.0% of NAV | $ | 5,091,151,352 | $ | 5,940,954,401 | ||||||||||
| Secondary Investments - Controlled/Affiliated - 0.8% of NAV | 1,2,3,4 | |||||||||||||
| North America - 0.8% of NAV | ||||||||||||||
| Gemspring Capital Goliath Fund, LP | Private Equity | 10/30/2024 | $ | 37,763,085 | $ | 44,265,101 | *,⁺ | |||||||
| Total North America | $ | 37,763,085 | $ | 44,265,101 | ||||||||||
| Total Controlled/Affiliated Secondary Investments | $ | 37,763,085 | $ | 44,265,101 | ||||||||||
| Total Controlled/Affiliated Investments - 0.8% of NAV | $ | 37,763,085 | $ | 44,265,101 | ||||||||||
| Total Investments - 102.8% of NAV | $ | 5,128,914,437 | $ | 5,985,219,502 | ||||||||||
| Liabilities in excess of other assets - (2.8)% of NAV | $ | (156,339,685 | ) | |||||||||||
| Net Assets - 100.0% of NAV | $ | 5,828,879,817 | ||||||||||||
| * | Investment is non-income producing. |
| ⁺ | Investment has been committed to but has not been fully funded. |
| 1 | Geographic region generally reflects the location of the investment manager or company. |
| 2 | Investments do not issue shares or hold outstanding principal, except where noted. The terms "shares" and "units" are used interchangeably. |
| 3 | Private investments typically do not permit redemptions or withdrawals, except at the discretion of their general partner, manager, or advisor. Final distribution dates are generally unknown unless specified. These investments are fair valued using net asset value as the practical expedient, unless otherwise noted, and are usually acquired through private placements with contractual resale restrictions that do not lapse. Each investment may have been purchased on different dates and for varying amounts. The acquisition date of the first purchase is listed in the Consolidated Schedule of Investments. |
| 4 | The fair value of any Secondary Investment, Primary Investment, or Co-Investment has not been calculated, reviewed, verified or in any way approved by any general partner, manager or advisor of such investments (including any of its affiliates). |
| 5 | The fair value of the investment was determined using significant unobservable inputs. |
The accompanying notes are an integral part of these consolidated financial statements
18
StepStone Private Markets
Consolidated Schedule of Investments (continued)
March 31, 2026
| 6 | A Collateralized Loan Obligation ("CLO") is structured by pooling certain private loans, other lender assets, and their associated collateral. A sponsoring organization establishes a special purpose vehicle to hold the assets/collateral and issue securities; interests in these pools are sold as individual securities. Payments of principal and interest are passed through to investors and are typically supported by credit enhancements, such as a letter of credit, surety bond, limited guaranty or senior/subordination structures. These payments are divided into multiple tranches of debt securities, offering distinct maturity and credit risk profiles. Some tranches receive regular principal and interest installments, while others receive only interest, with principal due at maturity or upon specified call dates. Certain tranches are entitled to principal and accrued interest only at maturity or upon specified call dates. Each tranche carries a different interest rate, which may be fixed or floating. |
| 7 | A Collateralized Loan Obligation Warehouse ("CLO Warehouse") is an entity organized for the purpose of holding syndicated bank loans, also known as leveraged loans, prior to the issuance of securities from that same vehicle. During the warehouse period, a CLO Warehouse will secure investments and build a portfolio of primarily leveraged loans and other debt obligations. The warehouse period terminates when the CLO vehicle issues various tranches of securities to the market. At this time, financing through the issuance of debt and equity securities is used to repay bank financing. |
| 8 | All or a portion of this security is held by SPRIM LLC - Series A. |
| 9 | All or a portion of this security is held by SPRIM Subsidiary LLC. |
| 10 | All or a portion of this security is held by SPRIM LLC - Series B. |
| 11 | All or a portion of this security is held by SPRIM Cayman II LLC. |
| 12 | All or a portion of this security is held by SPRIM Cayman LLC. |
| 13 | All or a portion of this security is held by SPRIM Blue Jay Investco ULC. |
| 14 | All or a portion of this security is held by SPRIM Sidewalk LLC. |
| 15 | Investment offers quarterly redemptions with a one quarter notice period. |
| 16 | Investment offers annual redemptions. |
| 17 | Investment is subject to contractual resale restrictions and may not be sold or transferred until the lock-up period expires on July 20, 2026. |
The accompanying notes are an integral part of these consolidated financial statements
19
StepStone Private Markets
Consolidated Schedule of Investments (continued)
March 31, 2026
| Summary of Investments by Strategy (as a percentage of total investments) | ||||
| Co-Investments | 20.4 | % | ||
| Investment Funds | 15.7 | % | ||
| Equity | 2.6 | % | ||
| Debt | 2.1 | % | ||
| Primary Investments | 1.1 | % | ||
| Investment Funds | 1.1 | % | ||
| Secondary Investments | 77.7 | % | ||
| Investment Funds | 77.7 | % | ||
| Public Securities | 0.8 | % | ||
| Total Investments | 100.0 | % | ||
The accompanying notes are an integral part of these consolidated financial statements
20
StepStone Private Markets
Consolidated Statement of Assets and Liabilities
March 31, 2026
| Assets | ||||
| Non-controlled/non-affiliated investments, at fair value (cost $5,091,151,352) | $ | 5,940,954,401 | ||
| Controlled/affiliated investments, at fair value (cost $37,763,085) | 44,265,101 | |||
| Total investments, at fair value (cost $5,128,914,437) | 5,985,219,502 | |||
| Cash | 245,692,344 | |||
| Cash denominated in foreign currency (cost $1,598,582) | 1,629,613 | |||
| Receivable for Fund shares sold | 42,599,106 | |||
| Investments paid in advance | 12,612,694 | |||
| Distributions receivable from investments | 2,844,199 | |||
| Dividend and interest receivable | 1,159,517 | |||
| Receivable for investments sold | 900,540 | |||
| Prepaid expenses | 468,295 | |||
| Total Assets | 6,293,125,810 | |||
| Liabilities | ||||
| Revolving credit facility | 200,000,000 | |||
| Less deferred debt issuance costs | (1,335,082 | ) | ||
| Revolving credit facility less deferred debt issuance costs | 198,664,918 | |||
| Payable for investments purchased | 231,862,597 | |||
| Deferred tax liability | 22,916,136 | |||
| Management fees payable | 6,889,212 | |||
| Professional fees payable | 1,427,550 | |||
| Transfer agent fees payable | 425,689 | |||
| Administration fees payable | 318,183 | |||
| Trustees' fees payable | 53,394 | |||
| Revolving credit facility interest and fees payable | 38,515 | |||
| Due to Adviser | 19,970 | |||
| Distribution and shareholder servicing fees payable | 994,238 | |||
| Other accrued expenses | 635,591 | |||
| Total Liabilities | 464,245,993 | |||
| Commitments and contingencies (see Note 9) | ||||
| Net Assets | $ | 5,828,879,817 | ||
| Composition of Net Assets: | ||||
| Paid-in capital | $ | 4,776,621,154 | ||
| Total distributable earnings (accumulated loss) | 1,052,258,663 | |||
| Net Assets | $ | 5,828,879,817 | ||
| Net Assets | $ | 4,370,857,226 | ||
| Outstanding shares (unlimited number of shares authorized) | ||||
| Net Asset Value Per Share | $ | |||
| Net Assets | $ | 98,484,878 | ||
| Outstanding shares (unlimited number of shares authorized) | ||||
| Net Asset Value Per Share | $ |
The accompanying notes are an integral part of these consolidated financial statements
21
StepStone Private Markets
Consolidated Statement of Assets and Liabilities (continued)
March 31, 2026
| Net Assets | $ | 1,356,082,339 | ||
| Outstanding shares (unlimited number of shares authorized) | ||||
| Net Asset Value Per Share | $ | |||
| Net Assets | $ | 3,455,374 | ||
| Outstanding shares (unlimited number of shares authorized) | ||||
| Net Asset Value Per Share | $ |
The accompanying notes are an integral part of these consolidated financial statements
22
StepStone Private Markets
Consolidated Statement of Operations
For the Year Ended March 31, 2026
| Investment Income | ||||
| Non-controlled/non-affiliated investments dividend income (net of taxes withheld of $1,478,988) | $ | 62,386,705 | ||
| Bank deposits interest income | 18,681,646 | |||
| Non-controlled/non-affiliated investments interest income | 10,122,883 | |||
| Total Investment Income | 91,191,234 | |||
| Expenses | ||||
| Management fees | 73,229,244 | |||
| Revolving credit facility interest and fees | 7,228,951 | |||
| Amortization of deferred investment costs | 5,905,595 | |||
| Professional fees | 3,963,758 | |||
| Administration fees | 3,419,907 | |||
| Transfer agent fees | 2,660,505 | |||
| Income tax expense | 873,150 | |||
| Trustees' fees | 205,000 | |||
| Chief compliance officer fees | 60,000 | |||
| Distribution and shareholder servicing fees (Class S) | 9,943,026 | |||
| Shareholder servicing fees (Class D) | 211,858 | |||
| Distribution and shareholder servicing fees (Class R) | 4,009 | |||
| Other expenses | 2,852,708 | |||
| Total Expenses | 110,557,711 | |||
| Net Investment Income (Loss) | (19,366,477 | ) | ||
| Net Realized Gain (Loss) | ||||
| Distributions from non-controlled/non-affiliated investments | 139,936,944 | |||
| Distributions from controlled/affiliated investments | 18,632,384 | |||
| Foreign currency transactions | (549,791 | ) | ||
| Deferred tax | (7,148,059 | ) | ||
| Total Net Realized Gain (Loss) | 150,871,478 | |||
| Net Change in Unrealized Appreciation (Depreciation) | ||||
| Non-controlled/non-affiliated investments | 377,819,291 | |||
| Controlled/affiliated investments | (8,321,237 | ) | ||
| Foreign currency translations | 132,393 | |||
| Deferred tax | (3,949,292 | ) | ||
| Total Net Change in Unrealized Appreciation (Depreciation) | 365,681,155 | |||
| Net Increase (Decrease) in Net Assets from Operations | $ | 497,186,156 |
The accompanying notes are an integral part of these consolidated financial statements
23
StepStone Private Markets
Consolidated Statements of Changes in Net Assets
| For the Year Ended | For the Year Ended | |||||||
| March 31, 2026 | March 31, 2025 | |||||||
| Change in Net Assets Resulting from Operations: | ||||||||
| Net investment income (loss) | $ | (19,366,477 | ) | $ | 8,920,655 | |||
| Net realized gain (loss) | 150,871,478 | 109,804,558 | ||||||
| Net change in unrealized appreciation (depreciation) | 365,681,155 | 210,936,019 | ||||||
| Net Increase (Decrease) in Net Assets Resulting from Operations | 497,186,156 | 329,661,232 | ||||||
| Distributions from Distributable Earnings: | ||||||||
| Class I | (46,602,157 | ) | (34,519,535 | ) | ||||
| Class D | (1,023,421 | ) | (718,718 | ) | ||||
| Class S | (14,268,403 | ) | (7,053,405 | ) | ||||
| Class T¹ | — | (226,929 | ) | |||||
| Total Distributions from Distributable Earnings | (61,893,981 | ) | (42,518,587 | ) | ||||
| Change in Net Assets Resulting from Capital Share Transactions: | ||||||||
| Class I | ||||||||
| Proceeds from shares issued | 1,355,451,229 | 1,322,288,380 | ||||||
| Reinvestment of distributions | 26,992,849 | 20,393,881 | ||||||
| Repurchase of shares | (736,233,657 | ) | (162,697,044 | ) | ||||
| Exchange of shares | 4,981,165 | 21,661,710 | ||||||
| Total Class I Transactions | 651,191,586 | 1,201,646,927 | ||||||
| Class D | ||||||||
| Proceeds from shares issued | 28,011,694 | 28,814,009 | ||||||
| Reinvestment of distributions | 903,908 | 578,505 | ||||||
| Repurchase of shares | (4,907,885 | ) | (1,798,826 | ) | ||||
| Exchange of shares | (79,101 | ) | (9,327,478 | ) | ||||
| Total Class D Transactions | 23,928,616 | 18,266,210 | ||||||
| Class S | ||||||||
| Proceeds from shares issued | 407,208,116 | 531,817,713 | ||||||
| Reinvestment of distributions | 12,025,491 | 6,220,270 | ||||||
| Repurchase of shares | (53,498,367 | ) | (11,454,322 | ) | ||||
| Exchange of shares | (4,902,064 | ) | 13,445,867 | |||||
| Total Class S Transactions | 360,833,176 | 540,029,528 | ||||||
| Class R2 | ||||||||
| Proceeds from shares issued | 3,448,247 | — | ||||||
| Reinvestment of distributions | — | — | ||||||
| Repurchase of shares | — | — | ||||||
| Exchange of shares | — | — | ||||||
| Total Class R2 Transactions | 3,448,247 | — | ||||||
The accompanying notes are an integral part of these consolidated financial statements
24
StepStone Private Markets
Consolidated Statements of Changes in Net Assets (continued)
| For the Year Ended | For the Year Ended | |||||||
| March 31, 2026 | March 31, 2025 | |||||||
| Class T1 | ||||||||
| Proceeds from shares issued | — | 9,003,754 | ||||||
| Reinvestment of distributions | — | 159,080 | ||||||
| Repurchase of shares | — | (768,519 | ) | |||||
| Exchange of shares | — | (25,780,099 | ) | |||||
| Total Class T1 Transactions | — | (17,385,784 | ) | |||||
| Change in Net Assets Resulting from Capital Share Transactions | 1,039,401,625 | 1,742,556,881 | ||||||
| Total Increase (Decrease) in Net Assets | 1,474,693,800 | 2,029,699,526 | ||||||
| Net Assets | ||||||||
| Beginning of period | 4,354,186,017 | 2,324,486,491 | ||||||
| End of period | $ | 5,828,879,817 | $ | 4,354,186,017 | ||||
| 1 | On January 17, 2025, the Fund converted Class T shares into Class S shares and ceased offering Class T Shares. |
| 2 | Class R commenced operations on January 2, 2026 at a net asset value per share of $59.58. |
The accompanying notes are an integral part of these consolidated financial statements
25
StepStone Private Markets
Consolidated Statement of Cash Flows
For the Year Ended March 31, 2026
| Cash Flows From Operating Activities | ||||
| Net increase (decrease) in net assets from operations | $ | 497,186,156 | ||
| Adjustments to reconcile net increase (decrease) in net assets resulting from operations to net cash provided by (used in) operating activities: | ||||
| Purchases of investments, net of payable for investments purchased | (1,719,898,320 | ) | ||
| (Purchases) sales of short-term investments, net | 138,466,707 | |||
| Proceeds from sales of investments, net of receivable for investments sold | 915,723 | |||
| Distributions received from investments, net of distributions receivable from investments | 426,439,162 | |||
| Net realized (gain) loss on distributions from investments | (158,569,328 | ) | ||
| Net change in unrealized (appreciation) depreciation on investments | (369,498,054 | ) | ||
| Net change in deferred tax liability | 11,097,351 | |||
| Amortization of debt issuance costs | 1,273,236 | |||
| (Increase) Decrease in Assets | ||||
| Investments paid in advance | (12,612,694 | ) | ||
| Dividend and interest receivable | 748,633 | |||
| Prepaid expenses | (68,390 | ) | ||
| Increase (Decrease) in Liabilities | ||||
| Management fees payable | 1,911,085 | |||
| Professional fees payable | 377,284 | |||
| Revolving credit facility interest and fees payable | (416,265 | ) | ||
| Administration fees payable | 70,494 | |||
| Transfer agent fees payable | 133,720 | |||
| Due to Adviser | (18,508 | ) | ||
| Distribution and shareholder servicing fees payable | 994,238 | |||
| Other accrued expenses | (217,771 | ) | ||
| Net Cash Provided by (Used in) Operating Activities | (1,181,685,541 | ) | ||
| Cash Flows from Financing Activities | ||||
| Proceeds from issuance of shares, net of receivable for fund shares sold | 1,835,453,402 | |||
| Repurchase of shares | (794,639,909 | ) | ||
| Distributions paid in cash | (21,971,733 | ) | ||
| Proceeds from revolving credit facility | 202,191,959 | |||
| Repayments of revolving credit facility | (2,191,959 | ) | ||
| Debt issuance costs paid | (2,583,318 | ) | ||
| Net Cash Provided by (Used in) Financing Activities | 1,216,258,442 | |||
| Net Increase (Decrease) in Cash and Cash Denominated in Foreign Currency | 34,572,901 | |||
| Cash and Cash Denominated in Foreign Currency | ||||
| Beginning of period | 212,749,056 | |||
| End of period | $ | 247,321,957 | ||
| End of Period Balances | ||||
| Cash | $ | 245,692,344 | ||
| Cash denominated in foreign currency | 1,629,613 | |||
| End of Period Balance | $ | 247,321,957 |
The accompanying notes are an integral part of these consolidated financial statements
26
StepStone Private Markets
Consolidated Statement of Cash Flows (continued)
For the Year Ended March 31, 2026
| Supplemental Disclosure of Cash Flow Information | ||||
| Reinvestment of shareholder distributions | $ | 39,922,248 | ||
| Cash paid during the period for interest expense and commitment fees | $ | 6,371,980 | ||
| Cash paid during the period for taxes | $ | 889,027 | ||
| In-kind stock distributions received from investments | $ | 19,332,862 |
The accompanying notes are an integral part of these consolidated financial statements
27
StepStone Private Markets
Consolidated Financial Highlights
Class I
Per share operating performance for a capital share outstanding throughout each period
| For the Year Ended March 31, | ||||||||||||||||||||
| 2026 | 2025 | 2024 | 2023 | 2022 | ||||||||||||||||
| Per Share Operating Performance: | ||||||||||||||||||||
| Net Asset Value per share, beginning of period | $ | 56.54 | $ | 51.73 | $ | 45.61 | $ | 43.07 | $ | 33.65 | ||||||||||
| Activity from investment operations: | ||||||||||||||||||||
| Net investment income (loss)1 | (0.10 | ) | 0.24 | 0.30 | (0.07 | ) | (0.54 | ) | ||||||||||||
| Net realized gain (loss) and change in unrealized appreciation (depreciation) on investments2 | 6.00 | 5.29 | 5.98 | 3.57 | 10.44 | |||||||||||||||
| Total from investment operations | 5.90 | 5.53 | 6.28 | 3.50 | 9.90 | |||||||||||||||
| Less distributions: | ||||||||||||||||||||
| From net investment income | (0.01 | ) | (0.18 | ) | — | (0.40 | ) | (0.23 | ) | |||||||||||
| From net realized gains | (0.69 | ) | (0.54 | ) | (0.16 | ) | (0.56 | ) | (0.25 | ) | ||||||||||
| Total distributions | (0.70 | ) | (0.72 | ) | (0.16 | ) | (0.96 | ) | (0.48 | ) | ||||||||||
| Net Asset Value per share, end of period3 | $ | 61.74 | $ | 56.54 | $ | 51.73 | $ | 45.61 | $ | 43.07 | ||||||||||
| Net Assets, end of period (in thousands)3 | $ | 4,370,857 | $ | 3,378,914 | $ | 1,947,596 | $ | 963,316 | $ | 445,249 | ||||||||||
| Ratios to average net assets4 | ||||||||||||||||||||
| Net investment income (loss)5 | (0.17 | )% | 0.44 | % | 0.63 | % | (0.16 | )% | (1.36 | )% | ||||||||||
| Expenses before adviser expense recoupment (reimbursement)5 | 1.91 | % | 1.88 | % | 2.09 | % | 2.32 | % | 3.38 | % | ||||||||||
| Expenses after adviser expense recoupment(reimbursement)5 | 1.91 | % | 1.88 | % | 2.09 | % | 2.45 | % | 3.56 | % | ||||||||||
| Total return3 6 7 | 10.47 | % | 10.76 | % | 13.79 | % | 8.23 | % | 29.43 | % | ||||||||||
| Portfolio turnover rate8 | 0.04 | % | 0.28 | % | 0.01 | % | 4.35 | % | 25.31 | % | ||||||||||
| As of | As of | As of | As of | As of | ||||||||||||||||
| March 31, | March 31, | March 31, | March 31, | March 31, | ||||||||||||||||
| Senior Securities: | 2026 | 2025 | 2024 | 2023 | 2022 | |||||||||||||||
| Total borrowings (in thousands) | $ | $ | $ | $ | $ | |||||||||||||||
| Asset coverage per $1,000 unit of senior indebtedness9 | ||||||||||||||||||||
| 1 | Per share data calculated using average shares method. |
| 2 | Includes balancing amounts necessary to reconcile the change in net asset value per share for the period. |
| 3 | The net asset values and total returns have been calculated on net assets which include adjustments made in accordance with U.S. generally accepted accounting principles required at period end for financial reporting purposes. |
| 4 | Ratios do not reflect the proportionate share of income and expenses originating from the Fund's underlying Investments. |
| 5 | Ratios exclude deferred tax provisions (See Note 13). Taxes, if any, are disclosed separately in the Statement of Operations. |
| 6 | Total return is calculated assuming an initial investment made at the net asset value at the beginning of the period, reinvestment of all dividends and distributions at net asset value during the period and repurchase on the last day of the period at net asset value. |
| 7 | Total return would have been higher or lower had certain expenses not been recouped or waived by the Adviser during the periods of recoupment or reimbursement, respectively. |
The accompanying notes are an integral part of these consolidated financial statements
28
StepStone Private Markets
Consolidated Financial Highlights (continued)
Class I
| 8 | Excluding short-term investments, the portfolio turnover rate represents the lesser of the Fund's purchases or sales of investments for the period divided by the average monthly fair value of the Fund's investments during the period. |
| 9 |
The accompanying notes are an integral part of these consolidated financial statements
29
StepStone Private Markets
Consolidated Financial Highlights (continued)
Class D
Per share operating performance for a capital share outstanding throughout each period
| For the Year Ended March 31, | ||||||||||||||||||||
| 2026 | 2025 | 2024 | 2023 | 2022 | ||||||||||||||||
| Per Share Operating Performance: | ||||||||||||||||||||
| Net Asset Value per share, beginning of period | $ | 56.21 | $ | 51.51 | $ | 45.53 | $ | 43.03 | $ | 33.62 | ||||||||||
| Activity from investment operations: | ||||||||||||||||||||
| Net investment income (loss)1 | (0.26 | ) | 0.10 | 0.14 | (0.15 | ) | (0.46 | ) | ||||||||||||
| Net realized gain (loss) and change in unrealized appreciation (depreciation) on investments2 | 5.97 | 5.29 | 6.00 | 3.57 | 10.31 | |||||||||||||||
| Total from investment operations | 5.71 | 5.39 | 6.14 | 3.42 | 9.85 | |||||||||||||||
| Less distributions: | ||||||||||||||||||||
| From net investment income | (0.01 | ) | (0.15 | ) | 0.00 | (0.36 | ) | (0.19 | ) | |||||||||||
| From net realized gains | (0.69 | ) | (0.54 | ) | (0.16 | ) | (0.56 | ) | (0.25 | ) | ||||||||||
| Total distributions | (0.70 | ) | (0.69 | ) | (0.16 | ) | (0.92 | ) | (0.44 | ) | ||||||||||
| Net Asset Value per share, end of period3 | $ | 61.22 | $ | 56.21 | $ | 51.51 | $ | 45.53 | $ | 43.03 | ||||||||||
| Net Assets, end of period (in thousands)3 | $ | 98,485 | $ | 67,717 | $ | 44,397 | $ | 31,668 | $ | 14,908 | ||||||||||
| Ratios to average net assets4 | ||||||||||||||||||||
| Net investment income (loss)5 | (0.44 | )% | 0.19 | % | 0.29 | % | (0.34 | )% | (1.17 | )% | ||||||||||
| Expenses before adviser expense recoupment (reimbursement)5 | 2.17 | % | 2.13 | % | 2.37 | % | 2.49 | % | 3.44 | % | ||||||||||
| Expenses after adviser expense recoupment (reimbursement)5 | 2.17 | % | 2.13 | % | 2.37 | % | 2.62 | % | 3.52 | % | ||||||||||
| Total return3 6 7 | 10.19 | % | 10.52 | % | 13.51 | % | 8.04 | % | 29.32 | % | ||||||||||
| Portfolio turnover rate8 | 0.04 | % | 0.28 | % | 0.01 | % | 4.35 | % | 25.31 | % | ||||||||||
| As of | As of | As of | As of | As of | ||||||||||||||||
| Senior Securities: | March 31, 2026 | March 31, 2025 | March 31, 2024 | March 31, 2023 | March 31, 2022 | |||||||||||||||
| Total borrowings (in thousands).. | $ | $ | $ | $ | $ | |||||||||||||||
| Asset coverage per $1,000 unit of senior indebtedness9 | ||||||||||||||||||||
| 1 | Per share data calculated using average shares method. |
| 2 | Includes balancing amounts necessary to reconcile the change in net asset value per share for the period. |
| 3 | The net asset values and total returns have been calculated on net assets which include adjustments made in accordance with U.S. generally accepted accounting principles required at period end for financial reporting purposes. |
| 4 | Ratios do not reflect the proportionate share of income and expenses originating from the Fund's underlying Investments. |
| 5 | Ratios exclude deferred tax provisions (See Note 13). Taxes, if any, are disclosed separately in the Statement of Operations. |
| 6 | Total return is calculated assuming an initial investment made at the net asset value at the beginning of the period, reinvestment of all dividends and distributions at net asset value during the period and repurchase on the last day of the period at net asset value. |
| 7 | Total return would have been higher or lower had certain expenses not been recouped or waived by the Adviser during the periods of recoupment or reimbursement, respectively. |
The accompanying notes are an integral part of these consolidated financial statements
30
StepStone Private Markets
Consolidated Financial Highlights (continued)
Class D
| 8 | Excluding short-term investments, the portfolio turnover rate represents the lesser of the Fund's purchases or sales of investments for the period divided by the average monthly fair value of the Fund's investments during the period. |
| 9 | Calculated by subtracting the Fund’s total liabilities (excluding borrowings) from the Fund’s total assets and dividing this by the total number of senior indebtedness units, where one unit equals $1,000 of senior indebtedness. |
The accompanying notes are an integral part of these consolidated financial statements
31
StepStone Private Markets
Consolidated Financial Highlights (continued)
Class S
Per share operating performance for a capital share outstanding throughout each period
| For the Year Ended March 31, | ||||||||||||||||||||
| 2026 | 2025 | 2024 | 2023 | 2022 | ||||||||||||||||
| Per Share Operating Performance: | ||||||||||||||||||||
| Net Asset Value per share, beginning of period | $ | 55.35 | $ | 50.97 | $ | 45.38 | $ | 43.07 | $ | 33.65 | ||||||||||
| Activity from investment operations: | ||||||||||||||||||||
| Net investment income (loss)1 | (0.61 | ) | (0.22 | ) | 0.07 | (0.30 | ) | (0.31 | ) | |||||||||||
| Net realized gain (loss) and change in unrealized appreciation (depreciation) on investments2 | 5.89 | 5.19 | 5.68 | 3.48 | 10.21 | |||||||||||||||
| Total from investment operations | 5.28 | 4.97 | 5.75 | 3.18 | 9.90 | |||||||||||||||
| Less distributions: | ||||||||||||||||||||
| From net investment income | 0.00 | (0.05 | ) | 0.00 | (0.31 | ) | (0.23 | ) | ||||||||||||
| From net realized gains | (0.69 | ) | (0.54 | ) | (0.16 | ) | (0.56 | ) | (0.25 | ) | ||||||||||
| Total distributions | (0.69 | ) | (0.59 | ) | (0.16 | ) | (0.87 | ) | (0.48 | ) | ||||||||||
| Net Asset Value per share, end of period3 | $ | 59.94 | $ | 55.35 | $ | 50.97 | $ | 45.38 | $ | 43.07 | ||||||||||
| Net Assets, end of period (in thousands)3 | $ | 1,356,082 | $ | 907,554 | $ | 316,271 | $ | 51,019 | $ | 87 | ||||||||||
| Ratios to average net assets⁴ | ||||||||||||||||||||
| Net investment income (loss)5 | (1.05 | )% | (0.41 | )% | 0.14 | % | (0.67 | )% | (0.81 | )% | ||||||||||
| Expenses before adviser expense recoupment (reimbursement)5 | 2.77 | % | 2.73 | % | 2.79 | % | 3.40 | % | 3.45 | % | ||||||||||
| Expenses after adviser expense recoupment (reimbursement)5 | 2.77 | % | 2.73 | % | 2.79 | % | 3.41 | % | 3.43 | % | ||||||||||
| Total return3 6 7 | 9.57 | % | 9.79 | % | 12.70 | % | 7.48 | % | 29.43 | % | ||||||||||
| Portfolio turnover rate8 | 0.04 | % | 0.28 | % | 0.01 | % | 4.35 | % | 25.31 | % | ||||||||||
| As of | As of | As of | As of | As of | ||||||||||||||||
| March 31, | March 31, | March 31, | March 31, | March 31, | ||||||||||||||||
| Senior Securities: | 2026 | 2025 | 2024 | 2023 | 2022 | |||||||||||||||
| Total borrowings (in thousands) | $ | $ | $ | $ | $ | |||||||||||||||
| Asset coverage per $1,000 unit of senior indebtedness9 | ||||||||||||||||||||
| 1 | Per share data calculated using average shares method. |
| 2 | Includes balancing amounts necessary to reconcile the change in net asset value per share for the period. |
| 3 | The net asset values and total returns have been calculated on net assets which include adjustments made in accordance with U.S. generally accepted accounting principles required at period end for financial reporting purposes. |
| 4 | Ratios do not reflect the proportionate share of income and expenses originating from the Fund's underlying Investments. |
| 5 | Ratios exclude deferred tax provisions (See Note 13). Taxes, if any, are disclosed separately in the Statement of Operations. |
| 6 | Total return is calculated assuming an initial investment made at the net asset value at the beginning of the period, reinvestment of all dividends and distributions at net asset value during the period and repurchase on the last day of the period at net asset value. Total return shown excludes the effect of applicable sales charges. |
| 7 | Total return would have been higher or lower had certain expenses not been recouped or waived by the Adviser during the periods of recoupment or reimbursement, respectively. |
The accompanying notes are an integral part of these consolidated financial statements
32
StepStone Private Markets
Consolidated Financial Highlights (continued)
Class S
| 8 | Excluding short-term investments, the portfolio turnover rate represents the lesser of the Fund's purchases or sales of investments for the period divided by the average monthly fair value of the Fund's investments during the period. |
| 9 | Calculated by subtracting the Fund’s total liabilities (excluding borrowings) from the Fund’s total assets and dividing this by the total number of senior indebtedness units, where one unit equals $1,000 of senior indebtedness. |
The accompanying notes are an integral part of these consolidated financial statements
33
StepStone Private Markets
Consolidated Financial Highlights (continued)
Class R
Per share operating performance for a capital share outstanding throughout each period
| For the Period Ended March 31, 2026* | ||||
| Per Share Operating Performance: | ||||
| Net Asset Value per share, beginning of period | $ | 59.58 | ||
| Activity from investment operations: | ||||
| Net investment income (loss)1 | (0.31 | ) | ||
| Net realized gain (loss) and change in unrealized appreciation (depreciation) on investments2 | 0.68 | |||
| Total from investment operations | 0.37 | |||
| Net Asset Value per share, end of period3 | $ | 59.95 | ||
| Net Assets, end of period (in thousands)3 | $ | 3,455 | ||
| Ratios to average net assets4 | ||||
| Net investment income (loss)5 | (2.10 | )% | ||
| Expenses6 | 2.78 | % | ||
| Total return3 7 | 0.62 | % | ||
| Portfolio turnover rate8 | 0.04 | % | ||
| Senior Securities: | As of March 31, 2026 | |||
| Total borrowings (in thousands) | $ | |||
| Asset coverage per $1,000 unit of senior indebtedness9 | ||||
| * | The Class commenced operations on January 2, 2026 at a net asset value per share of $59.58. |
| 1 | Per share data calculated using average shares method. |
| 2 | Includes balancing amounts necessary to reconcile the change in net asset value per share for the period. |
| 3 | The net asset values and total returns have been calculated on net assets which include adjustments made in accordance with U.S. generally accepted accounting principles required at period end for financial reporting purposes. |
| 4 | Ratios do not reflect the proportionate share of income and expenses originating from the Fund's underlying Investments. |
| 5 | Net investment income (loss) ratios have been annualized for periods of less than twelve months, and exclude deferred tax provisions (Note 13). Taxes, if any, are disclosed separately in the Statement of Operations. |
| 6 | Expense ratios have been annualized for periods of less than twelve months, and exclude deferred tax provisions (See Note 13). Taxes, if any, are disclosed separately in the Statement of Operations. |
| 7 | Total return is calculated assuming an initial investment made at the net asset value at the beginning of the period, reinvestment of all dividends at net asset value during the period and repurchase on the last day of the period at net asset value. Total return calculated for a period of less than one year is not annualized. |
| 8 | Excluding short-term investments, the portfolio turnover rate represents the lesser of the Fund's purchases or sales of investments for the period divided by the average monthly fair value of the Fund's investments during the period. Results for periods of less than one year are not annualized. |
| 9 | Calculated by subtracting the Fund’s total liabilities (excluding borrowings) from the Fund’s total assets and dividing this by the total number of senior indebtedness units, where one unit equals $1,000 of senior indebtedness. |
The accompanying notes are an integral part of these consolidated financial statements
34
StepStone Private Markets
Notes to Consolidated Financial Statements
March
31, 2026
1. Organization
StepStone Private Markets (“Fund”) was organized as a Delaware statutory trust under the Delaware Statutory Trust Act on September 6, 2019 and is registered under the Investment Company Act of 1940, as amended, ("1940 Act") as a diversified, closed-end management investment company. The Fund commenced operations on October 1, 2020.
The Fund offers four separate classes of shares of beneficial interest designated as Class I Shares, Class D Shares, Class S Shares and Class R Shares (collectively, “Shares”) to eligible investors (“Shareholders”). The Shares are offered in a continuous registered public offering with subscriptions accepted daily at the then-current-daily net asset value (“NAV”) per share, adjusted for sales load, if applicable. The Fund may, from time to time, offer to repurchase Shares pursuant to written repurchase offers. Repurchases will be made at such times, in such amounts and on such terms as determined by the Fund’s Board of Trustees (“Board”) (see Note 10).
The Board provides broad oversight over the Fund’s investment program, management and operations and has the right to delegate management responsibilities. StepStone Group Private Wealth LLC serves as the Fund's investment adviser ("Adviser") and is a registered investment adviser under the Investment Advisers Act of 1940, as amended. The Adviser is a wholly-owned subsidiary of StepStone Group LP. The Adviser oversees the management of the Fund’s day-to-day activities including structuring, governance, distribution, reporting and oversight. StepStone Group LP serves as the Fund’s investment sub-adviser (“Sub-Adviser”) and is responsible for the day-to-day management of the Fund’s assets.
The Fund’s investment objectives are to invest, directly and indirectly, in a broad cross section of private market assets ("Private Market Assets") across private equity, private debt and real assets that will enable it to, over time, achieve long-term capital appreciation and offer an investment alternative for investors seeking to allocate a portion of their longer-term portfolio to private markets through a single investment that provides substantial diversification and access to historically top-tier managers.
Master-Feeder Structure
The Fund and StepStone Private Markets Feeder Ltd. (“Feeder Fund”) are part of a “master-feeder” structure. The Feeder Fund invests substantially all of its assets in the Class I Shares of the Fund. As of March 31, 2026, the Feeder Fund owns 10.40% of the Fund’s net assets.
2. Summary of Significant Accounting Policies
The accompanying consolidated financial statements have been prepared in conformity with accounting principles generally accepted in the United States of America (“U.S. GAAP”) and are presented in U.S. dollars which is the functional currency of the Fund. The Fund is an investment company and therefore applies the accounting and reporting guidance issued by the Financial Accounting Standards Board (“FASB”) in Accounting Standards Codification (“ASC”) 946, Financial Services — Investment Companies. The following are significant accounting policies which are consistently followed in the preparation of the consolidated financial statements.
Basis of Consolidation
As provided under ASC Topic 946 and Regulation S-X, the Fund will generally not consolidate its investment in a company other than a wholly-owned or substantially wholly-owned investment company subsidiary whose design and purpose is to act as an extension of the Fund’s investment operations and facilitate the execution of the Fund’s investment strategy. Accordingly, the Fund has consolidated the results of the Fund’s direct wholly-owned subsidiaries, SPRIM Holdings LLC and SPRIM Sidewalk LLC, each formed as a Delaware limited liability company, along with its indirect wholly-owned subsidiaries: SPRIM Intermediate LLC, SPRIM Subsidiary LLC and SPRIM LLC (Series A and Series B), each formed as a Delaware limited liability company, SPRIM Cayman LLC, SPRIM Cayman II LLC and SPRIM Cayman III LLC (together, "SPRIM Cayman"), each formed as a Cayman Islands limited liability company, and SPRIM Blue Jay Investco ULC, an unlimited liability corporation registered in Canada (collectively, "Wholly-Owned Subsidiaries"). The effects of all intercompany transactions between the Fund and its Wholly-Owned Subsidiaries have been eliminated in consolidation.
Use of Estimates
The preparation of consolidated financial statements in conformity with U.S. GAAP requires management to make estimates and assumptions that affect the reported amounts of assets and liabilities and disclosures of contingent assets and liabilities at the date of the consolidated financial statements and the reported amounts of income and expenses during the reporting period. Changes in
35
StepStone Private Markets
Notes to Consolidated Financial Statements (continued)
March 31, 2026
the economic environment, financial markets and any other factors or parameters used in determining these estimates could cause actual results to differ materially.
Net Asset Value Determination
The NAV of the Fund is determined as of the close of the regular trading session on the New York Stock Exchange (“NYSE”) (normally 4:00 p.m. Eastern Time) on each business day that the NYSE is open for trading, or as may be determined from time to time in accordance with policies approved by the Board (each, a “Determination Date”). In determining NAV, the Fund’s investments are valued as of the relevant Determination Date. The NAV of the Fund will equal, unless otherwise noted, the value of the total assets of the Fund, less all of its liabilities, including accrued fees and expenses allocated to Shares based on the relative net assets of each class and class-specific expenses to the total net assets of the Fund, each determined as of the relevant Determination Date.
Valuation of Investments
The Fund’s investments are valued as of each Determination Date at fair value consistent with the principles of ASC Topic 820, Fair Value Measurements (“ASC 820”). Pursuant to Rule 2a-5 under the 1940 Act, the Board has designated the Adviser as the valuation designee for the Fund to perform fair value determinations of the Fund’s investments. The Board has approved the Adviser’s valuation policy (“Valuation Policy”). The Adviser utilizes the resources and personnel of the Sub-Adviser and the Fund’s sub-administrator (as defined herein) in carrying out its responsibilities. The Board has ultimate oversight responsibility for valuing all investments held by the Fund.
Purchases of investments are recorded as of the first day of legal ownership of an investment and redemptions from investments are recorded as of the last day of legal ownership. Investments held by the Fund in Private Market Assets may include (i) (a) secondary purchases of existing investments in individual operating companies, projects or properties and private investment funds from other investors, sponsored by unaffiliated managers and/or strategic acquirers ("Investment Managers"), (b) investments in open-ended funds, which are often substantially invested, with evergreen or long duration structures which may not have an explicit termination date, (c) investments in continuation vehicles created to acquire private portfolio companies primarily from private investment funds managed by the same Investment Manager, (d) investments in private investment funds that are actively fundraising, but have already invested a portion of their capital commitments in Private Market Assets and (e) stapled primary investments contingent to a secondary investment purchase (together with the investments described in (a) - (e), “Secondary Investments”), (ii) investments in private funds that are actively fundraising that have not yet invested any portion of their capital commitments in Private Market Assets (“Primary Investments”) and (iii) equity and/or debt investments directly in operating companies, projects or properties, generally alongside Investment Managers that lead or participate in the transaction (“Co-Investments”). These types of debt or equity investments normally do not have readily available market prices and therefore will be valued according to the Valuation Policy at each Determination Date. The Valuation Policy requires evaluation of all relevant information reasonably available to the Adviser at the time the Fund’s investments are valued.
Ordinarily, the fair value of the Fund’s investment in a Secondary Investment or a Primary Investment is based on the net asset value of the investment reported by its Investment Manager. In determining fair value, the Fund may incorporate public benchmark returns or other information that are relevant to the investment funds under consideration to adjust fair values as of the relevant Determination Date. The public benchmark returns are adjusted for long-term, historical correlations between public and private investment returns and other relevant factors. If the Adviser determines that the Investment Manager has not reported a net asset value to the Fund, the Adviser will establish a fair value in accordance with the Fund’s Valuation Policy. In doing so, the Adviser will evaluate whether it is appropriate, considering all relevant circumstances, to use the last reported net asset value from the Investment Manager with adjustments made in accordance with the Fund’s Valuation Policy. The net asset values or adjusted net asset values are net of management fees and performance-based fees payable pursuant to the respective organizational documents of each investment fund.
Collateralized Loan Obligations (“CLO”), included as a Co-Investment in the Consolidated Schedule of Investments, if any, are not traded on a national securities exchange and instead are valued using a market yield approach with daily valuations provided by a third-party valuation expert. The assumed yield used in the valuation reflects factors including, but not limited to, prevailing market conditions, credit risk, liquidity considerations, structural subordination, and the expected volatility of cash flows. Because the valuation incorporates significant unobservable inputs, the fair value of the Fund’s CLO investments is classified as Level 3 within the fair value hierarchy.
The fair value of a Collateralized Loan Obligation Warehouse (“CLO Warehouse”), included as a Co-Investment in the Consolidated Schedule of Investments, if any, reflects the Fund’s pro rata interest in the residual economics of the structure. These investments are typically leveraged and are therefore sensitive to changes in the value and performance of the underlying assets. Valuation is influenced by factors including distributions, defaults, recoveries, prepayments, and the reinvestment environment. Interest is accrued daily based on an effective yield. Because the valuation incorporates significant unobservable inputs, the fair value of the Fund’s CLO Warehouse investments is classified as Level 3 within the fair value hierarchy.
36
StepStone Private Markets
Notes to Consolidated Financial Statements (continued)
March 31, 2026
Due to the inherent uncertainty of valuations, however, estimated fair values may differ from the values that would have been used had a readily available market for the investments existed and the differences could be material.
In assessing the fair value of the Fund’s Co-Investments in accordance with the Valuation Policy, on a case by case basis, the Adviser either applies the net asset value reported by the Investment Manager or a variety of methods such as earnings and market multiple analysis based on comparables, discounted cash flow analysis and market data from third party pricing services. The Adviser takes into account the following factors in determining the fair value of a Co-Investment: the latest round of financing, company operating performance, market-based multiples, discounted cash flows, potential merger and acquisition activity and any other material information that may impact investment fair value.
In certain circumstances, the Adviser may determine that cost best approximates the fair value of a particular Private Market Asset. The Fund will generally value its investments that are traded or dealt in upon one or more securities exchanges and for which market quotations are readily available at the last quoted sales price on the primary exchange, or at the mean between the current bid and ask prices on the primary exchange, as of the Determination Date.
The Sub-Adviser and one or more of its affiliates acts as investment adviser to clients other than the Fund. However, the value attributed to a Private Market Asset held by the Fund and the value attributed to the same Private Market Asset held by another client of the Sub-Adviser or one of its affiliates might differ as a result of differences in accounting, regulatory, timing and other factors applicable to the Fund when compared to such other client.
Short-term investments are highly liquid instruments with low risk of loss and recorded at NAV per share, which approximates fair value.
Debt Issuance Costs
Debt issuance costs consist of fees and expenses paid in connection with the closing of and amendments to the Fund’s revolving credit facility. The aforementioned costs are amortized over the instrument’s term. Unamortized debt issuance costs are presented net against the outstanding revolving credit facility balance on the Consolidated Statement of Assets and Liabilities.
Foreign Currency Translation
The books and records of the Fund are maintained in U.S. dollars. The value of investments, assets and liabilities denominated in currencies other than U.S. dollars are translated into U.S. dollars based upon current foreign exchange rates on the Determination Date. Purchases and sales of foreign investments, income and expenses are converted into U.S. dollars based on currency exchange rates prevailing on the date of the relevant transaction. Net realized gain (loss) on foreign currency transactions and net change in unrealized appreciation (depreciation) on foreign currency translations represents foreign exchange: (1) gains and losses from the holding and sales of foreign currencies; (2) gains and losses between trade date and settlement date on investment securities transactions; and (3) gains and losses from the difference between amounts of interest and dividends recorded as receivable and the amounts actually received. The Fund does not separately isolate the impact of changes in exchange rates from other changes in the fair value of investments within the net realized gain (loss) and the change in unrealized appreciation (depreciation) of investments as presented on the Consolidated Statement of Operations. The Fund presents net realized gain (loss) on foreign currency transactions, as well as changes in unrealized appreciation (depreciation) on foreign currency translations related to foreign cash and receivable balances, as separate line items on the Consolidated Statement of Operations.
Realized Gains on Investments, Interest Income and Dividend Income
Distributions received from Secondary Investments, Primary Investments and Co-Investments occur at irregular intervals and the exact timing of the distributions is not known. The classification and timing of distributions received in cash or in-kind, including return of capital, realized gains, interest income and dividend income, are based on information received from the Investment Manager of the Secondary Investment, Primary Investment or Co-Investment. To the extent a distribution exceeds the remaining cost basis of an investment, based on information provided by the Investment Manager, the excess amount is recognized as a realized gain distribution from investments. Realized gains and losses from investment transactions are determined using the specific identification method. Dividend income and interest income are recorded on an ex-dividend date and accrual basis, respectively. Dividend income earned on short-term money market investments is accrued daily.
Income is accrued daily on CLO equity based on an estimated yield to maturity utilizing assumed cash flows in accordance with FASB ASC 325-40, Beneficial Interests in Securitized Financial Assets. Estimated yields for CLO positions are updated upon receipt of payments quarterly, as needed, or upon a transaction, such as an add-on purchase, refinancing or reset. When payments are received, any amount above or below the expected yield is treated as an adjustment to interest income or cost basis. The expected yield and investment cost may ultimately not be realized.
37
StepStone Private Markets
Notes to Consolidated Financial Statements (continued)
March 31, 2026
Fund Expenses
The Fund bears all expenses incurred in the course of its operations including, but not limited to, the following: all fees and expenses of the Private Market Assets in which the Fund invests, including the underlying fees of the Private Market Assets (“Acquired Fund Fees”), management fees, expenses associated with the credit facility, legal fees, administrator fees, audit and tax preparation fees, custodial fees, transfer agency fees, registration expenses, expenses of the Board and other administrative expenses.
Expenses are recorded on an accrual basis and expenses other than class-specific expenses are allocated pro-rata to Shares based upon prior day net assets at each Determination Date. Class-specific expenses are allocated only to their respective share class (see Note 6). Closing costs associated with the purchase of Secondary Investments, Primary Investments and Co-Investments are included in the cost of the investment.
Federal Income Taxes
For U.S. federal income tax purposes, the Fund has elected to be treated, and intends to qualify annually, as a Regulated Investment Company (“RIC”) under Subchapter M of the Internal Revenue Code of 1986, as amended, by distributing substantially all of its taxable net investment income and net realized capital gains to Shareholders each year and by meeting certain diversification and income requirements with respect to investments. If the Fund were to fail to meet the requirements to qualify as a RIC, and if the Fund were ineligible to or otherwise unable to cure such failure, the Fund would be subject to tax on its taxable income at corporate rates, whether or not distributed to Shareholders, and all distributions of earnings and profits would be taxable to Shareholders as ordinary income.
Additionally, the Fund is subject to a 4% federal excise tax on any undistributed income, including net capital gains, if it does not distribute at least 98% of its taxable income and 98.2% of its capital gains each year. The Fund endeavors to meet these distribution requirements to avoid such excise tax, and any excise tax liability, if incurred, will be reflected in the consolidated financial statements.
The Fund’s tax year is the 12-month period ending September 30. The Fund files tax returns as prescribed by the tax laws of the jurisdictions in which it operates. In the normal course of business, the Fund is subject to examination by federal, state, local and foreign jurisdictions, where applicable. As of March 31, 2026, the tax years from the year 2022 forward remain subject to examination by the major tax jurisdictions under the statute of limitations.
Distributions are determined in accordance with federal income tax regulations, which may differ from net investment income and net realized capital gains for financial statement purposes under U.S. GAAP. Differences may be permanent or temporary. Permanent differences, including book/tax differences relating to Shareholder distributions, are reclassified among capital accounts in the consolidated financial statements to reflect the applicable tax characterization. Temporary differences arise when certain items of income, expense, gain or loss are recognized in different periods for financial statement and tax purposes; these differences will reverse in the future. The tax basis components of distributable earnings differ from the amounts reflected in the Consolidated Statement of Assets and Liabilities and Consolidated Statement of Operations due to temporary book/tax differences. These amounts will be finalized before filing the Fund’s federal tax return.
In accounting for income taxes, the Fund follows the guidance in FASB ASC Codification 740, Income Taxes ("ASC 740"). ASC 740 prescribes the minimum recognition threshold a tax position must meet in connection with accounting for uncertainties in income tax positions taken or expected to be taken by an entity before being measured and recognized in the consolidated financial statements. Management evaluates the tax positions taken or expected to be taken in the course of preparing the Fund's tax returns to determine whether the tax positions will "more-likely-than-not" be sustained upon examination by the applicable tax authority. Tax positions deemed to meet the more-likely-than-not threshold that would result in a tax benefit or expense to the Fund would be recorded as a tax benefit or expense in the current year.
In preparing the consolidated financial statements, SPRIM LLC (Series A and Series B), SPRIM Cayman and SPRIM Blue Jay Investco ULC are required to recognize their estimate of income taxes for purposes of determining deferred tax assets or liabilities. SPRIM LLC (Series A and Series B) is subject to U.S. federal and state income taxes while SPRIM Cayman and SPRIM Blue Jay Investco ULC are subject to U.S. federal withholding tax, state taxes, and branch profits tax on effectively connected income with a U.S. trade or business. The Fund recognizes deferred income taxes for temporary differences in the basis of assets and liabilities for financial and income tax purposes. Deferred tax assets are recognized for deductible temporary differences, tax credit carryforwards or net operating loss carryforwards and deferred tax liabilities are recognized for taxable temporary differences. To the extent the Wholly-Owned Subsidiaries have a deferred tax asset, consideration is given to whether a valuation allowance is required.
38
StepStone Private Markets
Notes to Consolidated Financial Statements (continued)
March 31, 2026
Cash
Cash includes monies on deposit in interest-bearing accounts with UMB Bank, N.A. who serves as the Fund’s custodian (“Custodian”). Deposits, at times, may exceed the insurance limit guaranteed by the Federal Deposit Insurance Corporation. The Fund has not experienced any losses on deposits and does not believe it is exposed to significant credit risk on such deposits. There are no restrictions on cash held by the Custodian on the Fund’s behalf.
Deferred Investment Costs Relating to Purchases of Secondary Investments
Deferred costs associated with the acquisition of Secondary Investments are amortized daily over the deferral period until the payment due date. On the due date, the payment amount, included in payable for investments purchased, corresponds to the notional amount owed to the respective counterparty. Payable for investments purchased is reported in the Consolidated Statement of Assets and Liabilities with amortization of deferred investment costs reported in the Consolidated Statement of Operations.
Segment Reporting
An operating segment is defined in ASC Topic 280, Segment Reporting, as a component of a public entity that engages in business activities from which it may recognize revenues and incur expenses, has operating results that are regularly reviewed by the public entity’s Chief Operating Decision Maker (“CODM”) to make decisions about resources to be allocated to the segment and assess its performance, and has discrete financial information available. A management committee of the Fund’s Adviser acts as the Fund’s CODM. The Fund represents a single operating segment, as the CODM monitors the operating results of the Fund as a whole. The Fund’s long-term strategic asset allocation is pre-determined in accordance with the terms of a defined investment strategy which is executed by the Fund’s portfolio managers as described in Note 1. The financial information in the form of the Fund’s portfolio composition, total returns, expense ratios, changes in net assets resulting from operations, and subscriptions and redemptions activity is used by the CODM to assess the Fund’s performance versus comparative benchmarks and to make resource allocation decisions for the Fund’s single segment, and is consistent with that presented within the Fund’s consolidated financial statements. Segment assets are reflected on the accompanying Consolidated Statement of Assets and Liabilities as “total assets” and significant segment expenses are listed on the accompanying Consolidated Statement of Operations.
New Accounting Pronouncements
In December 2023, the FASB issued ASU 2023-09, Income Taxes (Topic 740): Improvements to Income Tax Disclosures, which enhances income tax disclosure requirements related to the rate reconciliation and income taxes paid disclosures. The Fund adopted this guidance for the annual reporting period ended March 31, 2026 on a prospective basis. The adoption of ASU 2023-09 had no material impact on the Fund's financial statement presentation or disclosures.
3. Fair Value Measurements
U.S. GAAP, ASC 820, defines fair value as the value that the Fund would receive to sell an investment or pay to transfer a liability in an orderly transaction with an independent buyer in the principal market, or in the absence of a principal market, the most advantageous market for the asset or liability. ASC 820 establishes a three-level hierarchy for fair value measurements based upon the transparency of inputs to the valuation of an asset or liability. Observable inputs reflect the assumptions market participants would use in pricing the asset or liability based on market data obtained from sources independent of the Fund. Unobservable inputs reflect the Fund’s own assumptions about the assumptions that market participants would use in valuing the asset or liability developed based on the best information available in the circumstances. Each investment is assigned a level based upon the observation of the inputs which are significant to the overall valuation. The three-level hierarchy of inputs is summarized below:
Level 1: Quoted prices are available in active markets for identical investments as of the reporting date. The types of investments which would generally be included in Level 1 include listed equities, registered money market funds and short-term investment vehicles.
Level 2: Pricing inputs are other than quoted prices in active markets, which are either directly or indirectly observable as of the reporting date, and fair value is determined through the use of models or other valuation methodologies. The types of investments which would generally be included in Level 2 include corporate bonds and loans and less liquid and restricted equity securities.
Level 3: Pricing inputs are unobservable for the investment and include situations where there is little, if any, market activity for the investment. The inputs into the determination of fair value require significant management judgment and/or estimation. Those unobservable inputs, that are not corroborated by market data, generally reflect the reporting entity’s own assumptions about the assumptions market participants would use in determining the fair value of the investment.
39
StepStone Private Markets
Notes to Consolidated Financial Statements (continued)
March 31, 2026
The types of investments which would generally be included in Level 3 are equity and/or debt securities issued by private entities.
In accordance with ASC 820, certain portfolio investments are excluded from the fair value hierarchy as they are valued using NAV as a practical expedient. These investments are valued using NAV or by adjusting the most recently available NAV for cash flows, public benchmark returns and/or other relevant information. As such, investments in securities with a fair value of $5,637.0 million are excluded from the fair value hierarchy as of March 31, 2026.
The following is a summary of the Fund's investments classified by fair value hierarchy as of March 31, 2026:
| Level 1 | Level 2 | Level 3 | Investments Valued at NAV | Total | ||||||||||||||||
| Co-Investments | $ | — | $ | — | $ | 291,577,842 | $ | 924,564,974 | $ | 1,216,142,816 | ||||||||||
| Primary Investments | — | — | — | 63,668,965 | 63,668,965 | |||||||||||||||
| Secondary Investments | — | — | — | 4,648,776,188 | 4,648,776,188 | |||||||||||||||
| Public Securities | 56,631,533 | — | — | — | 56,631,533 | |||||||||||||||
| Total Investments | $ | 56,631,533 | $ | — | $ | 291,577,842 | $ | 5,637,010,127 | $ | 5,985,219,502 | ||||||||||
The following is a reconciliation of assets in which significant unobservable inputs (Level 3) were used in determining fair value:
| Co-Investments | ||||
| Balance as of March 31, 2025 | $ | 159,033,769 | ||
| Transfers into Level 3 | — | |||
| Purchases | 109,755,639 | |||
| Distributions from Investments | (4,888,711 | ) | ||
| Net Realized Gain (Loss) | 336,455 | |||
| Net Change in Unrealized Appreciation (Depreciation) | 27,340,690 | |||
| Transfers out of Level 3 | — | |||
| Balance as of March 31, 2026 | $ | 291,577,842 | ||
| Net Change in Unrealized Appreciation (Depreciation) on Level 3 Investments Held at the End of the Reporting Period | $ | 27,340,690 | ||
Changes in inputs or methodologies used for valuing investments may result in transfers in or out of levels within the fair value hierarchy. The inputs or methodologies used for valuing investments may not necessarily be indicative of the risk associated with investing in those investments. Transfers between levels of the fair value hierarchy are reported at the beginning of the reporting period in which they occur.
40
StepStone Private Markets
Notes to Consolidated Financial Statements (continued)
March 31, 2026
The following table presents additional quantitative information about valuation methodologies and inputs used for investments that are measured at fair value and categorized within Level 3 as of March 31, 2026:
| Impact to | ||||||||||||||||
| Weighted | Valuation from | |||||||||||||||
| Fair Value as of | Valuation | Unobservable | Single Input or | Average of | an Increase in | |||||||||||
| Investment Type | March 31, 2026 | Technique(s) | Input | Range of Inputs | Input(1) | Input(2) | ||||||||||
| Co-Investments | $ | 8,369,719 | Market comparable companies | Enterprise value to EBITDA multiple | 9.61x - 14.40x | 13.23x | Increase | |||||||||
| Co-Investments | $ | 36,485,830 | Exit price | Recent transaction price | N/A | N/A | Increase | |||||||||
| Co-Investments | $ | 47,900,000 | Discounted cash flow | Discount rate | 19.50% - 26.75% | 22.43% | Decrease | |||||||||
| Co-Investments | $ | 8,647,243 | Recent transaction | Recent transaction price | N/A | N/A | Increase | |||||||||
| Co-Investments | $ | 72,938,654 | Market comparable companies | Enterprise value to revenue multiple | 0.50x - 8.50x | 4.27x | Increase | |||||||||
| Co-Investments | $ | 2,518,988 | Yield | Market yield discount speard | 14.00% | 14.00% | Decrease | |||||||||
| Co-Investments | $ | 114,717,408 | Discounted cash flow | Annual default rate | 1.75% - 2.04% | 1.94% | Decrease | |||||||||
| Annual Prepayment rate | 20.00% | 20.00% | Increase | |||||||||||||
| Reinvestment spread | 3.30% - 4.99% | 3.74% | Increase | |||||||||||||
| Reinvestment price | $99.50 | $99.50 | Decrease | |||||||||||||
| Recovery rate | 65.00% - 70.28% | 68.74% | Increase | |||||||||||||
| Expected yield | 13.50% - 16.75% | 15.00% | Decrease | |||||||||||||
| (1) | Weighted average is calculated by weighing the significant unobservable input by the relative fair value of each investment in the category. |
| (2) | This column represents the directional change in the fair value of the Level 3 investments that would result from an increase to the corresponding unobservable input. |
41
StepStone Private Markets
Notes to Consolidated Financial Statements (continued)
March 31, 2026
A listing of the Private Market Asset types held by the Fund and the related attributes, as of March 31, 2026, are shown in the table below:
| Unfunded | ||||||||||
| Investment Type | Investment Strategy | Fair Value | Commitments | |||||||
| Co-Investments | Investments
in the equity and/or debt of operating companies, projects or properties generally alongside an Investment Manager | $ | 1,216,142,816 | $ | 187,005,243 | |||||
| Primary Investment Funds | Investments in private funds actively fundraising with no capital commitments invested | $ | 63,668,965 | $ | 49,661,373 | |||||
| Secondary Investment Funds | Investments in individual companies and private funds purchased from other investors, open-ended funds, continuation vehicles, private funds actively fundraising with a portion of capital commitments invested and stapled primary investments | $ | 4,648,776,188 | $ | 1,244,302,210 | |||||
4. Controlled/Affiliated Investments
Per Section 2(a)(9) of the 1940 Act, an investment is deemed a control affiliate if the Sub-Adviser owns 25% or more of the investment's outstanding voting securities. As of March 31, 2026, the Fund held investments in the following control affiliates:
| Change in | ||||||||||||||||||||||||||||
| Proceeds | Unrealized | Balance as of | ||||||||||||||||||||||||||
| Balance as of | from | Realized | Appreciation | March 31, | Affiliated | |||||||||||||||||||||||
| Controlled/Affiliated Investment | March 31, 2025 | Purchases at Cost | Distributions | Gain (Loss) | (Depreciation) | 2026 | Income | |||||||||||||||||||||
| Gemspring Capital Goliath Fund, LP | 37,678,661 | 36,800 | — | — | 6,549,640 | 44,265,101 | — | |||||||||||||||||||||
| Octagon StepStone CLO Fund, LTD. | 64,870,877 | — | 68,632,384 | 18,632,384 | (14,870,877 | ) | — | — | ||||||||||||||||||||
| $ | 102,549,538 | $ | 36,800 | $ | 68,632,384 | $ | 18,632,384 | $ | (8,321,237 | ) | $ | 44,265,101 | $ | — | ||||||||||||||
5. Investment Adviser and Transactions with Affiliates
In consideration of its services to the Fund, the Adviser is entitled to a management fee (“Management Fee”) equal to 1.40% on an annualized basis of the Fund’s daily net assets, provided that the Management Fee shall in no instance be greater than a Management Fee computed based on the value of the net assets of the Fund as of the close of business on the last business day of the relevant month (including any assets in respect of Shares that would be repurchased by the Fund on such date). The Management Fee is accrued daily and payable monthly in arrears. The Adviser pays the Sub-Adviser 50% of the Management Fee. For the year ended March 31, 2026, the Adviser earned $73.2 million in Management Fees of which $6.9 million was payable as of March 31, 2026.
The Adviser serves as the Fund’s administrator (“Administrator”) pursuant to an administration agreement (“Administration Agreement”) under which the Administrator provides administrative, accounting and other services to the Fund. Pursuant to the Administration Agreement, which became effective April 27, 2023, the Fund pays the Administrator an administration fee ( “Administration Fee”) in an amount up to 0.12% on an annualized basis of the Fund’s net assets. The Administration Fee is accrued daily based on the value of the prior day net assets of the Fund as of the close of business on each business day (including any assets in respect of Shares that will be repurchased by the Fund on such date), and is payable monthly in arrears. For the year ended March 31, 2026, the Administrator earned $3.4 million in Administration Fees of which $0.3 million was payable as of March 31, 2026.
6. Sub-Administrator, Custodian and Transfer Agent
From the proceeds of the Administration Fee, the Administrator pays UMB Fund Services, Inc. (“Sub-Administrator”) a sub-administration fee to perform certain administrative and accounting services for the Fund on behalf of the Administrator. The sub-administration fee, pursuant to a sub-administration agreement and a fund accounting agreement, is paid monthly by the Administrator and is based on the value of the net assets of the Fund as of the close of business on each business day, subject to an annual minimum.
42
StepStone Private Markets
Notes to Consolidated Financial Statements (continued)
March 31, 2026
UMB Bank, N.A. serves as the Fund’s Custodian pursuant to a custody agreement. As the Custodian, UMB Bank, N.A. holds the Fund’s U.S. assets. Foreign assets, if any, including foreign currency holdings, are held by a designated sub-custodian appointed by the Custodian in accordance with the terms of the custody agreement. For the year ended March 31, 2026, the Custodian earned $0.4 million in custody fees, recorded in other expenses on the Consolidated Statement of Operations, of which $0.1 million was payable as of March 31, 2026 and recorded in other accrued expenses on the Consolidated Statement of Assets and Liabilities.
The Sub-Administrator also serves as the Fund’s transfer agent (“Transfer Agent”) pursuant to a transfer agency agreement. The Transfer Agent, among other things, receives and processes purchase orders, effects issuance of Shares, prepares and transmits payments for distributions, receives and processes repurchase offers and maintains records of account. For the year ended March 31, 2026, the Transfer Agent earned $2.7 million in transfer agent fees of which $0.4 million was payable as of March 31, 2026.
7. Distribution and Shareholder Servicing Plan
Distribution Services, LLC serves as the Fund’s distributor (“Distributor”) pursuant to a distribution agreement. The Distributor distributes the Shares of the Fund. The Distributor is authorized to enter into Sub-Distribution Agreements with brokers, dealers, certain registered investment advisers and other financial intermediaries to effect the distribution of Shares of the Fund. To operate in a manner consistent with Rule 12b-1 under the 1940 Act, the Fund pays a distribution and shareholder servicing fee out of the net assets of Class S Shares and Class R Shares at the annual rate of 0.85% of the aggregate NAV of Class S Shares and Class R Shares, respectively. To operate in a manner consistent with Rule 12b-1 under the 1940 Act, the Fund pays a shareholder servicing fee out of the net assets of Class D Shares at the annual rate of 0.25% of the aggregate NAV of Class D Shares. Distribution and shareholder servicing fees are determined and accrued daily based on the net assets of the share class as of the close of business on each business day (including net assets in respect of Shares that will be repurchased by the Fund on such date). Class I Shares are not subject to a distribution and shareholder servicing fee. For the year ended March 31, 2026, distribution and shareholder servicing fees incurred are disclosed on the Consolidated Statement of Operations.
8. Revolving Credit Facility
Effective November 23, 2021, the Fund entered into a revolving credit agreement, as amended from time to time, with Cadence Bank, N.A. allowing the Fund to borrow up to $350.0 million. The credit agreement was terminated effective April 22, 2025.
Effective April 22, 2025, SPRIM Holdings LLC entered into a senior secured credit agreement with UBS AG, Stamford Bank ("UBS"), as the administrative agent, and the lenders party thereto, to provide the Fund with a revolving credit facility ("Credit Facility"). Borrowings under the Credit Facility are secured by certain assets held by SPRIM Holdings LLC. As of March 31, 2026, the aggregate fair value of assets pledged as collateral under the Credit Facility was $2,665.7 million. The Credit Facility carries a commitment (“Commitment”) of $500.0 million. The purpose of the Credit Facility is to provide short-term working capital, primarily to bridge the timing of the Fund’s acquisition of Private Market Assets in advance of the receipt of investor subscriptions. The stated maturity date of the Credit Facility is April 22, 2027, subject to extensions or termination events described in the credit agreement.
The Credit Facility has an interest rate of the secured overnight financing rate ("Term SOFR") plus an applicable margin ("Applicable Margin") of 2.80% per annum. The Credit Facility has a commitment fee of 0.55% per annum and a minimum utilization fee equal to the Applicable Margin. The minimum utilization fee is calculated based on a minimum borrowing requirement equal to 25.00% of the Commitment. For the year ended March 31, 2026, expenses incurred by the Fund related to the Credit Facility were $7.2 million.
As of March 31, 2026, the Fund had outstanding borrowings of $200.0 million. The carrying value of the outstanding borrowings approximates fair value due to the variable interest rate and would be categorized in Level 3 of the fair value hierarchy. During the year ended March 31, 2026, the Credit Facility bore interest at a weighted average interest rate of 6.98% and the daily average amount of outstanding borrowings under the Credit Facility was $3.9 million.
9. Commitments and Contingencies
As of March 31, 2026, the Fund has contractual unfunded commitments to provide additional funding of $1,481.0 million to certain investments.
ASC 460-10, Guarantees - Overall, requires entities to provide disclosure and, in certain circumstances, recognition of guarantees and indemnifications. In the normal course of business, the Fund enters into contracts that contain a variety of indemnification arrangements. The Fund’s exposure under these arrangements, if any, cannot be quantified. However, the Fund has not had claims or losses pursuant to these indemnification arrangements and expects the potential for a material loss to be remote. The Fund may, from time to time, be party to various legal matters arising in the ordinary course of business, including claims and litigation proceedings. Although the ultimate outcome of the foregoing matters, if any, cannot be ascertained at this time, the
43
StepStone Private Markets
Notes to Consolidated Financial Statements (continued)
March 31, 2026
Adviser believes, after consultation with counsel, that the resolution of such matters would not have a material adverse effect on the Fund’s consolidated financial statements.
10. Capital Share Transactions
The Fund offers four separate classes of shares of beneficial
interest designated as
The minimum initial investment in Class I Shares by an investor in the Fund is $1.0 million. The minimum initial investment in Class D Shares, Class S Shares and Class R Shares by an investor is $5,000. The minimum initial investment in any share class may be reduced at the Adviser's discretion. Investors purchasing Class S Shares may be charged a sales load up to a maximum of 3.50%. Investors purchasing Class I Shares, Class D Shares and Class R Shares are not charged a sales load. The Fund accepts initial and additional purchases of Shares daily at the Fund’s then-current NAV per share.
Subject to certain conditions, Shareholders may exchange shares from one class to another for an equivalent NAV amount of that share class.
44
StepStone Private Markets
Notes to Consolidated Financial Statements (continued)
March 31, 2026
The following table summarizes the capital share transactions for the year ended March 31, 2026 and the year ended March 31, 2025:
| For the Year Ended March 31, 2026 | For the Year Ended March 31, 2025 | |||||||||||||||
| Shares | Dollar Amounts | Shares | Dollar Amounts | |||||||||||||
| Class I | ||||||||||||||||
| Proceeds from shares issued | 22,704,083 | $ | 1,355,451,229 | 24,320,638 | $ | 1,322,288,380 | ||||||||||
| Reinvestment of distributions | 447,458 | 26,992,849 | 377,421 | 20,393,881 | ||||||||||||
| Repurchase of shares | (12,205,958 | ) | (736,233,657 | ) | (2,981,121 | ) | (162,697,044 | ) | ||||||||
| Exchange of shares | 82,011 | 4,981,165 | 396,609 | 21,661,710 | ||||||||||||
| Net increase (decrease) | 11,027,595 | $ | 651,191,586 | 22,113,547 | $ | 1,201,646,927 | ||||||||||
| Class D | ||||||||||||||||
| Proceeds from shares issued | 472,284 | $ | 28,011,694 | 535,218 | $ | 28,814,009 | ||||||||||
| Reinvestment of distributions | 15,084 | 903,908 | 10,752 | 578,505 | ||||||||||||
| Repurchase of shares | (82,199 | ) | (4,907,885 | ) | (32,822 | ) | (1,798,826 | ) | ||||||||
| Exchange of shares | (1,088 | ) | (79,101 | ) | (170,378 | ) | (9,327,478 | ) | ||||||||
| Net increase (decrease) | 404,081 | $ | 23,928,616 | 342,770 | $ | 18,266,210 | ||||||||||
| Class S | ||||||||||||||||
| Proceeds from shares issued | 7,012,342 | $ | 407,208,116 | 10,040,921 | $ | 531,817,713 | ||||||||||
| Reinvestment of distributions | 204,439 | 12,025,491 | 116,410 | 6,220,270 | ||||||||||||
| Repurchase of shares | (906,901 | ) | (53,498,367 | ) | (213,803 | ) | (11,454,322 | ) | ||||||||
| Exchange of shares | (83,096 | ) | (4,902,064 | ) | 247,061 | 13,445,867 | ||||||||||
| Net increase (decrease) | 6,226,783 | $ | 360,833,176 | 10,190,589 | $ | 540,029,528 | ||||||||||
| Class R2 | ||||||||||||||||
| Proceeds from shares issued | 57,639 | $ | 3,448,247 | — | $ | — | ||||||||||
| Reinvestment of distributions | — | — | — | — | ||||||||||||
| Repurchase of shares | — | — | — | — | ||||||||||||
| Exchange of shares | — | — | — | — | ||||||||||||
| Net increase (decrease) | 57,639 | $ | 3,448,247 | — | $ | — | ||||||||||
| Class T1 | ||||||||||||||||
| Proceeds from shares issued | — | $ | — | 171,870 | $ | 9,003,754 | ||||||||||
| Reinvestment of distributions | — | — | 2,991 | 159,080 | ||||||||||||
| Repurchase of shares | — | — | (14,657 | ) | (768,519 | ) | ||||||||||
| Exchange of shares | — | — | (478,756 | ) | (25,780,099 | ) | ||||||||||
| Net increase (decrease) | — | $ | — | (318,552 | ) | $ | (17,385,784 | ) | ||||||||
| 1 | On January 17, 2025, the Fund converted Class T shares into Class S shares and ceased offering Class T Shares. |
| 2 | Class R commenced operations on January 2, 2026 at a net asset value per share of $59.58. |
Subject to the Board’s discretion, the Fund offers a quarterly share repurchase program where the total aggregate amount of Share repurchases will be up to 5.00% of the Fund’s outstanding Shares each quarter. It is expected that the Adviser will recommend to the Board that the Fund offer to repurchase Shares from Shareholders quarterly, with such repurchases to typically occur on March 15, June 15, September 15 and December 15 of each year, although the Adviser may not recommend, and the Board may not authorize, a repurchase offer for any quarter in which the Adviser believes that it would be detrimental to the Fund for liquidity or other reasons. In the event that Shareholders, in the aggregate, submit for repurchase more than the number of Shares that the Fund will offer to repurchase, the Fund will repurchase the Shares on a pro rata basis, which may result in the Fund not honoring the full
45
StepStone Private Markets
Notes to Consolidated Financial Statements (continued)
March 31, 2026
amount of a Share repurchase requested by a Shareholder. The Fund has no obligation to repurchase Shares at any time; any such repurchases will only be made at such times, in such amounts and on such terms as may be determined by the Board, in its sole discretion. For the September 15, 2025 repurchase, the Adviser recommended and the Board elected to increase the repurchase offer up to 10.00% of the Fund's outstanding Shares. For the year ended March 31, 2026 and the year ended March 31, 2025, 13,195,058 and 3,242,403 Shares were repurchased by the Fund, respectively.
11. Dividend Reinvestment Plan
Pursuant to the dividend reinvestment plan ("DRIP") established by the Fund, each Shareholder whose Shares are registered in its own name will automatically be a participant under the DRIP and all income and/or capital gain dividend distributions will automatically be reinvested in additional Shares unless such Shareholder specifically elects to receive all income and/or capital gain dividends in cash. A Shareholder is free to change this election at any time. If, however, a Shareholder requests to change its election within 45 days prior to a distribution, the request will be effective only with respect to distributions after the 45-day period.
12. Investment Transactions
For the year ended March 31, 2026, total purchases of investments, excluding short-term investments, were $1,920.2 million. For the year ended March 31, 2026, total distributions received from investments, excluding short-term investments, were $427.3 million. For the year ended March 31, 2026, total proceeds from the Fund's sale or other disposition of investments, excluding short-term investments, amounted to $1.8 million.
13. Tax Information
The Fund has temporary differences primarily due to timing differences between book and tax treatment of partnership interests and passive foreign investment company investments held by the Fund, qualified late-year loss deferrals, as well as activity related to the Fund's Wholly-Owned Subsidiaries.
U.S. GAAP requires that certain components of net assets be reclassified between financial and tax reporting. For the tax year ended September 30, 2025, the Fund recognized a permanent book to tax difference of $31,296 resulting primarily from distributions in excess. This permanent book to tax difference has been reclassified to paid-in capital and has no effect on the net assets or net asset value per share of the Fund.
For the tax year ended September 30, 2025, the Fund’s tax components of distributable earnings on a tax basis are as follows:
| Current year late-year loss deferral | $ | (11,680,988 | ) | |
| Net tax appreciation (depreciation) | 974,944,408 | |||
| Other temporary differences | (748,080 | ) | ||
| Total distributable earnings (accumulated loss) | $ | 962,515,340 |
The tax character of Subchapter M distributions declared for the fiscal years ended March 31, 2026 and March 31, 2025 were as follows:
| Ordinary | Long-Term | |||||||
| Income | Capital Gains | |||||||
| 2026 | $ | 4,514,958 | $ | 57,379,023 | ||||
| 2025 | $ | 8,643,271 | $ | 33,875,316 | ||||
The tax character of Subchapter M distributions for the tax year ended September 30, 2025 was as follows:
| Ordinary | Long-Term | |||||||
| Income | Capital Gains | |||||||
| 2025 | $ | 13,354,952 | $ | 31,152,714 | ||||
The Fund is designating a portion of its distributions as long-term capital gain dividends, pursuant to Internal Revenue Code Section 852(b)(3), for the tax year ending September 30, 2025.
46
StepStone Private Markets
Notes to Consolidated Financial Statements (continued)
March 31, 2026
For the tax year ended September 30, 2025, the Fund's deferred, on a tax basis, qualified late year losses are as follows:
| Ordinary income | $ | 10,239,513 | ||
| Net capital gains | $ | 1,441,475 |
As of March 31, 2026, the federal tax cost of investments and unrealized appreciation (depreciation) are as follows:
| Gross unrealized appreciation | $ | 1,233,335,917 | ||
| Gross unrealized depreciation | (162,890,327 | ) | ||
| Net unrealized appreciation (depreciation) on investments | $ | 1,070,445,590 | ||
| Tax cost of investments | $ | 4,914,773,912 |
The difference between cost amounts for financial statement and federal income tax purposes is due primarily to timing differences in recognizing certain gains and losses on partnership investments.
The Fund recorded a provision for current income tax expense of $873,150 for the year ended March 31, 2026.
The deferred income tax is computed by applying the federal statutory income tax rate of 21.0% to net investment income, realized and unrealized gains (losses) on investments before taxes. As of March 31, 2026, the Fund has a deferred tax liability of $22.9 million.
As of March 31, 2026, the Fund had no uncertain tax positions for federal, state or local income tax purposes. The Fund recognizes interest and penalties, if any, related to unrecognized tax benefits as a component of income tax expense in the Consolidated Statement of Operations. For the year ended March 31, 2026, the Fund did not incur any interest or penalties.
| 14. | Risk Factors |
An investment in the Fund involves material risks, including performance risk, liquidity risk, business and financial risk, risks associated with the use of leverage, valuation risk, tax risk and other risks that should be carefully considered prior to investing and investing should only be considered by persons financially able to maintain their investment and who can afford a loss of a substantial part or all of such investment.
| 15. | Subsequent Events |
On May 12, 2026, the Fund commenced a repurchase offer in an amount up to 5.00% of outstanding shares with a valuation date of June 16, 2026.
On April 22, 2026, SPRIM Holdings LLC extended the maturity of the Credit Facility through April 22, 2028 and the commitment fee was increased to 0.70% per annum.
The Fund has adopted financial reporting rules regarding subsequent events which require an entity to recognize in the financial statements the effects of all subsequent events that provide additional evidence about conditions that existed at the date of the balance sheet or may be of such a nature that disclosure will keep the financial statements from being misleading. The Adviser has evaluated the Fund’s related events and transactions that occurred through the date of issuance of the Fund’s financial statements. There were no other events or transactions that occurred during this period that materially impacted the amounts or disclosures in the Fund’s consolidated financial statements or the accompanying notes.
47
StepStone Private Markets
Trustees and Officers (unaudited)
March 31, 2026
The identity of the Trustees and executive officers of the Fund and brief biographical information regarding each such person during the past five years is set forth below. The Fund’s Statement of Additional Information includes additional information about the membership of the Board and is available, without charge, upon request, by calling the Fund toll-free at (704) 215-4300.
Independent Trustees
| Name, Address and Birth Year1 | Position(s)
Held with Registrant |
Length
of Time Served2 |
Principal
Occupation(s) During Past Five Years |
Number of
Portfolios Overseen in Fund Complex |
Other Trusteeships/ Directorships Held Outside the Fund Complex3 |
| Terry
Prather Birth Year: 1955 |
Trustee | Indefinite Length - Since May 2024 |
Chief Operating Officer, LIFT Orlando (community development organization) (2016-2023) | 5 | None |
| Tracy
Schmidt Birth Year: 1957 |
Trustee | Indefinite Length - Since Inception |
Founder, Morning Star Advisory, LLC (consulting and advisory services) (since 2018) | 5 | None |
| Ron
Sturzenegger Birth Year: 1960 |
Trustee | Indefinite Length - Since Inception |
None | 5 | Director of KBS Real Estate Investment Trust II, Inc. (since 2019), and KBS Real Estate Investment Trust III, Inc. (since 2019) |
Interested Trustees
| Name, Address and Birth Year1 | Position(s)
Held with Registrant |
Length
of Time Served2 |
Principal
Occupation(s) During Past Five Years |
Number of
Portfolios Overseen in Fund Complex |
Other Trusteeships/
Directorships Held Outside the Fund Complex3 |
| Tom
Sittema Birth Year: 1958 |
Chairperson of the Board of Trustees | Indefinite Length - Since Inception |
Executive Chairman, StepStone Group Private Wealth LLC (Since 2020) Managing Director, RiverBridge Capital (Since 2018) | 5 | None |
| Bob
Long Birth Year: 1962 |
Trustee | Indefinite Length - Since Inception |
CEO, StepStone Group Private Wealth LLC (Since 2019) | 5 | None |
48
StepStone Private Markets
Trustees and Officers (unaudited) (continued)
March 31, 2026
Executive Officers
| Name, Address and Birth Year1 | Position(s) Held with Registrant |
Length of Time Served2 | Principal Occupation(s) During Past Five Years |
| Bob Long Birth Year: 1962 |
President and Principal Executive Officer | Indefinite Length – Since Inception | See above |
| Kimberly Zeitvogel Birth Year: 1971 |
Treasurer and Principal Financial Officer | Indefinite Length – Since January 2023 |
Partner, StepStone Group Private Wealth LLC (Since 2020) |
| Tim Smith Birth Year: 1968 |
Vice President | Indefinite Length – Since November 2023 |
CFO and COO, StepStone Group Private Wealth LLC (Since 2019) |
| Dean Caruvana Birth Year: 1988 |
Secretary and Chief Compliance Officer | Indefinite Length — Since August 2023 |
General Counsel, StepStone Group Private Wealth LLC (Since 2023); Principal, Blue Owl Capital (2022-2023); Vice President, BlackRock (2018-2022) |
1 The address of each Trustee and Officer is c/o StepStone Group Private Wealth LLC, 128 S Tryon St., Suite 1600, Charlotte, NC 28202.
2 Each Trustee or Officer serves an indefinite term, until his or her successor is elected.
3 This includes any directorships at public companies and registered investment companies held by the Trustee over the past five years.
49
StepStone Private Markets
Approval of Investment Advisory and Sub-Advisory Agreements (unaudited)
March 31, 2026
At an in-person meeting of the Board of Trustees (the “Board”) of StepStone Private Markets (the “Fund”) held on February 11, 2026 (the “Meeting”), the Board, including a majority of the Trustees who are not considered to be “interested persons” of the Fund (the “Independent Trustees”) under the Investment Company Act of 1940, as amended (the “1940 Act”), unanimously voted to approve the continuation of each of the following: (i) an investment advisory agreement by and between StepStone Group Private Wealth LLC (the “Adviser”) and the Fund (the “Advisory Agreement”); and (ii) a separate sub-advisory agreement by and among StepStone Group LP (the “Sub-Adviser” and collectively with the Adviser, the “Advisers”), the Adviser and the Fund (the “Sub-Advisory Agreement” and together with the Advisory Agreement, the “Agreements”).
In connection with their consideration of whether to approve the continuation of the Agreements, the Board received and reviewed information provided by the Advisers relating to the Fund, the Agreements and the Advisers, including comparative fee and expense information and other information regarding the respective nature, extent and quality of services to be provided by each Adviser under the Agreements. The materials provided to the Board generally included, among other items: (i) information on the Fund’s management fees and other expenses, including information comparing the management fees to be paid by the Fund to those of a peer group of funds; (ii) information about each Adviser’s profitability with respect to the Agreements; (iii) a memorandum prepared by each Adviser in response to a request submitted by legal counsel to the Funds (each, a “Response Memorandum”), including a description of each Adviser’s business, a copy of each Adviser’s Form ADV, and certain other information about each Adviser to be considered in connection with the review by the members of the Board; and (iv) a memorandum from legal counsel to the Funds on the responsibilities of the Board in considering for approval investment advisory and investment sub-advisory arrangements under the 1940 Act. The Board, including the Fund’s Independent Trustees, also considered other matters such as: (i) the Fund’s investment objective and strategies; (ii) the Fund's investment performance over relevant time periods; (iii) the Advisers’ investment personnel and operations, including the personnel and other resources devoted to the Fund; (iv) the Advisers’ financial results and financial condition; (v) the resources to be devoted to the Fund’s investment policies and restrictions, policies on personal securities transactions and other compliance policies and procedures; (vi) the Advisers’ policies with respect to allocation of investments and seeking best execution; and (vii) possible conflicts of interest. Throughout the process, the Board had the opportunity to ask questions of and request additional materials from the Advisers.
In determining whether to approve the continuation of the Agreements for the Fund, the members of the Board reviewed and evaluated information and factors they believed to be relevant and appropriate through the exercise of their reasonable business judgment. The Board, including the Independent Trustees, did not identify any single factor as determinative. Individual members of the Board may have evaluated the information presented differently from one another, giving different weights to various factors in considering whether to approve the continuation of the Agreements. The Board was also furnished with an analysis of its fiduciary obligations in connection with its evaluation of the Agreements and, throughout the evaluation process, the Board was assisted by counsel for the Fund. A more detailed summary of the important, but not necessarily all, factors the Board considered with respect to its approval of the continuation of the Agreements is provided below.
Advisory Agreement
Matters considered by the Board, including the Independent Trustees, in connection with its approval of the continuation of the Advisory Agreement included the factors listed below.
The nature, extent and quality of the services to be provided to the Fund under the Advisory Agreement. The Board considered the responsibilities of the Adviser under the Advisory Agreement, and the services provided by the Adviser to the Fund, including, without limitation, the management, oversight, operational, and governance services that the Adviser and its employees provide to the Fund, the Adviser’s coordination of services for the Fund by its service providers, its compliance procedures and practices, and its efforts to promote the Fund. The Board also considered the background and experience of the Adviser’s senior management personnel. The Board noted that certain of the Fund’s officers are employees of the Adviser or its affiliates and serve the Fund without additional compensation from the Fund. The Board further considered information regarding the Adviser’s program designed to ensure compliance with federal securities and other applicable laws and the Adviser’s risk management processes. After reviewing the foregoing information and further information in the Adviser’s Response Memorandum (which included, among other information, descriptions of the Adviser’s business and the Adviser’s Form ADV) and discussing the Adviser’s proposed services to the Fund, the Board concluded that the quality, extent, and nature of the services provided by the Adviser are satisfactory and appropriate for the Fund.
Investment management capabilities and experiences of the Adviser. The Board considered the quality of the services provided and the quality of the Adviser’s resources that are available to the Fund. The Board evaluated the Adviser’s advisory, operational, governance, distribution, legal, compliance, and risk management services, among other services, and information the Board received regarding the experience and professional qualifications of the Adviser’s key personnel and the size and functions of its staff. The Board noted that the Adviser is a wholly owned subsidiary of the Sub-Adviser and leverages the infrastructure of the Sub-Adviser to support its operations, which includes working closely with key personnel of the Sub-Adviser. After consideration of these factors, the Board determined that the Adviser is an appropriate investment adviser for the Fund.
50
StepStone Private Markets
Approval of Investment Advisory and Sub-Advisory Agreements (unaudited) (continued)
March 31, 2026
Performance. The Board considered the investment performance of the Fund, which is provided to the Board on a regular basis, the investment performance of the Peer Group and other information and materials provided to the Board by the Advisers concerning Fund performance, including information as of December 31, 2025 regarding the performance of all discretionary funds and discretionary separate accounts (across private equity, real estate and private debt) managed by the Advisers, restated to reflect the Fund's expected fees and expenses. Based on these considerations, the Board concluded that it had continued confidence in the Adviser’s and the Sub-Adviser’s overall capabilities to manage the Fund.
Cost of the services to be provided and profits to be realized by the Adviser from the relationship with the Fund. The Board examined and evaluated the fee arrangement between the Adviser and the Fund under the Advisory Agreement, including as compared with the fees and expenses of certain unaffiliated closed-end funds operated as tender offer funds considered by the Adviser to have similar investment objectives and strategies to the Fund (the “Peer Group”). The Board considered information about the Adviser’s profitability with respect to the Fund, as well as the costs of services provided by the Adviser to the Fund. The Board received and reviewed information relating to the financial condition of the Adviser and its affiliates. The Board also considered potential benefits for the Adviser in managing the Fund, including promotion of the Adviser’s name and enhancement of its reputation in the industry. Upon further consideration and discussion of the foregoing, the Board concluded that the fees paid to the Adviser by the Fund are appropriate and representative of arm’s-length negotiations.
Economies of Scale. The Board considered the size and growth prospects of the Fund and how it relates to the structure of the Fund’s management fee schedule, which does not include breakpoints. After considering all of the information available to it, the Board concluded that it was satisfied with the extent to which economies of scale would be shared for the benefit of the Fund’s shareholders based on currently available information. The Board noted, however, that it would continue to monitor any future growth in the Fund’s assets and the appropriateness of management fee breakpoints or other methods to share benefits from economies of scale as part of its future review of the Advisory Agreement.
Comparison of fees to be paid to those under other investment advisory contracts. In evaluating the management fees and expenses, the Board considered the Fund’s management fees in absolute terms and as compared with the fees and expenses of the Peer Group. Based upon the comparative fee information provided, the Board noted that the Fund’s management fees were below the Peer Group’s average.
Benefits derived or to be derived by the Adviser from its relationship with the Fund. The Board considered “fall out” or ancillary benefits that would accrue to the Adviser as a result of its relationship with the Fund (other than the advisory fee), including non-quantifiable reputational benefits. The Board noted in this regard that the Adviser continues to evaluate and pursue opportunities to provide advisory services to additional funds or other vehicles with overlapping investment strategies, and that the track record of the Fund may enhance the Adviser’s ability to market its services and win such mandates.
Sub-Advisory Agreement
Matters considered by the Board, including the Independent Trustees, in connection with its approval of the Sub-Advisory Agreement included the factors listed below.
The nature, extent, and quality of the services to be provided to the Fund under the Sub-Advisory Agreement. The Board considered the responsibilities of the Sub-Adviser under the Sub-Advisory Agreement and the services provided by the Sub-Adviser including, without limitation, the investment advisory services and the Sub-Adviser’s compliance procedures and practices. The Board also considered the background, and experience of the Sub-Adviser’s senior management personnel and the qualifications, background, and responsibilities of the portfolio managers primarily responsible for the day-to-day portfolio management services for the Fund. After reviewing the foregoing information and further information in the materials, including the Sub-Adviser’s Response Memorandum (which included, among other information, descriptions of the Sub-Adviser’s business and the Sub-Adviser’s Form ADV), the Board concluded that the quality, extent, and nature of the services provided by the Sub-Adviser are satisfactory and appropriate for the Fund.
The investment management capabilities and experience of the Sub-Adviser. The Board evaluated the investment management experience of the Sub-Adviser, noting that the Sub-Adviser currently manages accounts that use an investment strategy similar to that proposed for the Fund (although none of the accounts are registered investment companies). The Board also considered that the Fund will benefit from the scale and resources of the Sub-Adviser and its affiliates. It was noted that the Sub-Adviser was a global private markets specialist overseeing (together with its related advisers) approximately $771 billion of private capital allocations, including approximately $209 billion of assets under management as of September 30, 2025. The Board discussed with the Sub-Adviser the investment objective and strategies of the Fund and the Sub-Adviser’s plans for implementing the Fund’s strategies. After considering these factors, the Board determined that the Sub-Adviser is an appropriate Sub-Adviser to the Fund.
Performance. The Board considered the investment performance of the Fund, which is provided to the Board on a regular basis, the investment performance of the Peer Group and other information and materials provided to the Board by the Advisers concerning Fund performance, including information as of December 31, 2025 regarding the performance of all discretionary funds and
51
StepStone Private Markets
Approval of Investment Advisory and Sub-Advisory Agreements (unaudited) (continued)
March 31, 2026
discretionary separate accounts (across private equity, real estate and private debt) managed by the Advisers, restated to reflect the Fund's expected fees and expenses. Based on these considerations, the Board concluded that it had continued confidence in the Adviser’s and the Sub-Adviser’s overall capabilities to manage the Fund.
The costs of the services to be provided and profits to be realized by the Sub-Adviser from its relationship with the Fund. The Board reviewed the fees paid under the Sub-Advisory Agreement, which the Board noted are paid by the Adviser, not by the Fund. The Board considered information about the Sub-Adviser’s profitability with respect to the Fund, as well as the costs of services provided by the Sub-Adviser to the Fund. The Board received and reviewed information relating to the financial condition of the Sub-Adviser and its affiliates. Upon further consideration and discussion of the foregoing, the Board concluded that the fees paid to the Sub-Adviser by the Adviser under the Sub-Advisory Agreement are appropriate and representative of arm’s-length negotiations.
Economies of Scale. The Board considered the size and growth prospects of the Fund and how it relates to the structure of the Fund’s management fee schedule. After considering all of the information available to it, the Board concluded that it was satisfied with the extent to which economies of scale would be shared for the benefit of the Fund’s shareholders based on currently available information, noting that the Adviser is responsible for the payment of sub-advisory fees to the Sub-Adviser.
Other benefits to be derived by the Sub-Adviser from its relationship with the Fund. The Board considered “fall-out” or ancillary benefits that would accrue to the Sub-Adviser as a result of its relationship with the Fund (other than the sub-advisory fee), including non-quantifiable reputational benefits. The Board noted in this regard that the Sub-Adviser continues to evaluate and pursue opportunities to provide advisory services to additional funds or other vehicles with overlapping investment strategies, and that the track record of the Fund may enhance the Sub-Adviser’s ability to market its services and win such mandates.
At the conclusion of these discussions, the Board agreed that it had been furnished with sufficient information to make an informed business decision on the approval of the continuation of the Agreements. In reaching this conclusion, the Board did not assign relative weights to the factors discussed above or deem any one or group of them to be controlling in and of themselves. Based on the discussions and considerations at the Meeting, the Board, including the Independent Trustees, voted to approve the continuation of the Agreements.
52
StepStone Private Markets
Other Information
March 31, 2026 (unaudited)
Proxy Voting Policies and Procedures
A description of the Fund’s proxy voting policies and procedures related to portfolio securities is available without charge, upon request, by calling the Fund at (704) 215-4300 or on the U.S. Securities and Exchange Commission’s (“SEC”) website at sec.gov.
Proxy Voting Record
Information regarding how the Fund voted proxies for portfolio securities, if applicable, during the most recent 12-month period ended June 30, is also available, without charge and upon request by calling the Fund at (877) 772-7724 or by accessing the Fund’s Form N-PX on the SEC’s website at sec.gov.
Availability of Quarterly Portfolio Schedules
The Fund files its complete schedule of portfolio holdings with the SEC for the first and third quarters of each fiscal year on Form N-PORT. The Fund’s Form N-PORT is available on the SEC website at sec.gov, or without charge and upon request by calling the Fund at (704) 215-4300.
53
StepStone Private Markets
Privacy Notice (unaudited)
March 31, 2026
STEPSTONE GROUP PRIVATE WEALTH LLC PRIVACY POLICY
Data privacy is a primary concern for each of StepStone Group LP (“SSG”), StepStone Group Private Wealth LLC (“SPW”), StepStone Group Real Assets LP (“SIRA”), StepStone Group Real Estate LP (“SRE”), StepStone Group Private Debt LLC (“SPD”), and StepStone Group Private Debt AG (“SPD AG”) together with their affiliates and related entities (collectively, “StepStone”). This data privacy notice (the “Notice”) details StepStone’s practices for collecting, using, and disclosing the personal information of clients and others, to both affiliates of SSG, SPW, SIRA, SRE, SPD, and SPD AG as applicable, and nonaffiliated third parties. Recipients of this Notice include, among others, current clients and investors, prospective clients, visitors to our websites, former clients, employees of managers with whom StepStone has conducted business, customers, as defined by Regulation S-P, and employees of StepStone or any of StepStone’s affiliates (each a “Notice Recipient”). For purposes of this Notice, an affiliate is an entity that (i) controls SSG, SPW, SIRA, SRE, SPD, or SPD AG, (ii) is controlled by SSG, SPW, SIRA, SRE, SPD, or SPD AG, or (iii) is under common control with SSG, SPW, SIRA, SRE, SPD, or SPD AG. Nonaffiliated third parties are parties who are not affiliates of any of SSG, SPW, SIRA, SRE, SPD, or SPD AG.
Confidentiality of Personal Information
StepStone maintains reasonable physical, electronic and procedural safeguards to guard a Notice Recipient’s personal information. StepStone endeavors to procure that third parties that handle information agree to abide by confidentiality obligations, and use personal information only in accordance with the purpose for which it is shared. In addition, StepStone employees are trained to handle a Notice Recipient’s information properly in order to maintain its security, and only employees who reasonably need to know personal information about a Notice Recipient to provide services to such Notice Recipient are designed to have access to such information.
Categories of Personal information that StepStone Collects
StepStone collects personal information about Notice Recipients from the following sources: (i) information it receives from Notice Recipients on applications or other forms, including contact forms and application forms; (ii) information about Notice Recipients’ transactions with StepStone, its affiliates, or others; and (iii) information collected automatically from website visitors.
StepStone is a data controller within the meaning the General Data Protection Regulation (“GDPR”), the Swiss Federal Act on Data Protection (“FADP”) and other applicable data protection legislation in force in the European Economic Area (“EEA”), and a business within the meaning of the California Consumer Privacy Act of 2018 (“CCPA”) and undertakes to hold any personal information provided in accordance with EEA data protection legislation, the CCPA, the Australian Privacy Act 1988, or any other applicable privacy law.
Use of Your Personal Information
Personal information will be used by StepStone for the following purposes:
| • | to respond to and communicate with you; |
| • | to provide the services you request and manage our relationship with you; |
| • | to manage and administer holdings in StepStone managed or advised funds, separately managed accounts, advisory engagements and any related business relationships (and, in each case, the investments made pursuant thereto) on an ongoing basis in accordance with the terms agreed between a Notice Recipient and SSG, SPW, SIRA, SRE, SPD, or SPD AG, as applicable; |
| • | to provide user and technical support; |
| • | to carry out statistical analysis and market research; and |
| • | to comply with legal and regulatory obligations applicable to the Notice Recipient, StepStone or its managed or advised funds, separately managed accounts, advisory engagements or any related business relationship with the Notice Recipient from time to time, including applicable anti-money laundering and counter terrorist financing legislation, investor qualification legislation and tax legislation. |
To understand our practices regarding information that is collected automatically from visitors to our website, please review our Cookie Consent Policy.
We only use personal information in connection with StepStone’s legitimate business interests and accordingly Notice Recipients’ specific consent is not required.
Job Applicants
54
StepStone Private Markets
Privacy Notice (unaudited) (continued)
March 31, 2026
If you apply for a job with us, we will collect additional information in connection with your application. This may include:
| • | Name and contact information; |
| • | Username and password; |
| • | Work authorization status; |
| • | Resume, CV, cover letter, work experience, and education information; |
| • | Skills; |
| • | Professional and work-related licenses, permits, and certifications held; |
| • | Reference-related information; and |
| • | Any other information that is publicly available or that you elect to provide to us. |
Such information may be collected from you directly, from your references, from your prior employers, or from your places of education. We will only use this information to evaluate your candidacy, including by processing your application, assessing your qualifications, corresponding with you, and complying with legal obligations.
Disclosure of Personal information to Affiliates
StepStone generally may share all of a Notice Recipient’s personal information with StepStone’s affiliates, provided that such affiliates will be obligated to keep such personal information confidential to the same extent as StepStone. StepStone shares information with its affiliates in order to serve its Notice Recipients better, including for business continuity purposes. If a Notice Recipient prefers that StepStone not disclose personal information about such Notice Recipient to its affiliates, such Notice Recipient may opt out of those general disclosures; that is, such Notice Recipient may direct StepStone not to make such disclosures (other than disclosures permitted or required by applicable law or otherwise permitted by StepStone’s privacy policy). However, notwithstanding any such opt-out, StepStone will be permitted to disclose personal information to its affiliates to the extent necessary or appropriate for such affiliates to perform services for the benefit of the Notice Recipient.
Disclosure of Personal information to Non-Affiliates
StepStone does not sell, share, or market a Notice Recipient’s personal information to nonaffiliated third parties. StepStone’s intent is to respect the Notice Recipients’ expectations that their personal information will be kept confidential. However, in order to serve the Notice Recipients better, StepStone will disclose personal information to nonaffiliated third parties (including service providers to StepStone) to the extent necessary or appropriate for such third parties to perform services for the benefit of the Notice Recipient. In addition, StepStone only shares personal information with unaffiliated third parties if StepStone believes that such personal information will be kept confidential by such third parties after such disclosure, and that the third parties will use the personal information only for the purposes identified by contract between StepStone and the nonaffiliated third party.
StepStone may also disclose information:
| • | In connection with any merger, sale of stock or assets, financing, acquisition, divestiture, or dissolution of all or a portion of our business; and |
| • | If we believe that disclosure is reasonably necessary to: (a) comply with any applicable law, regulation, legal process or governmental request; (b) enforce or comply with our Terms of Use or other applicable agreements or policies, (c) protect our rights or property, or the security or integrity of our services, or (d) protect us, users of our services or the public from harm or potentially prohibited or illegal activities. |
Except as required by applicable law and described in this privacy notice, StepStone will not share any other personal information about a Notice Recipient with its affiliates or nonaffiliated third parties.
Personal information of Former Investors and Prospective Clients
This Notice and StepStone’s policy regarding treatment of personal information of Notice Recipients also apply to former clients, business prospects, potential clients and current and former employees.
Disclosure of Personal information outside the EEA (excluding Switzerland)
Personal information may be transferred to countries which may not have the same or equivalent data protection laws as that required under EEA data protection legislation. Any such transfer will be made in compliance with applicable data protection legislation, and appropriate measures are in place to facilitate this, such as entering into Model Contractual Clauses (as published by the European Commission). For more information on the means of transfer of data or a copy of the relevant safeguards, please contact us at privacy@stepstonegroup.com.
55
StepStone Private Markets
Privacy Notice (unaudited) (continued)
March 31, 2026
Pursuant to EEA data protection legislation, investors have the right to object to processing of personal information and a number of other rights which may be exercised in certain circumstances, i.e.:
| • | the right of access to personal information held; |
| • | the right to amend and rectify any inaccuracies in personal information held; |
| • | the right to erase personal information held; |
| • | the right to data portability of personal information held; and |
| • | the right to request restriction of the processing of personal information. |
These rights will be exercisable, subject to limitations as provided for in EEA data protection legislation. Any Notice Recipient may make a request to StepStone to exercise these rights by contacting us at privacy@stepstonegroup.com.
Rights for California Residents
The California Consumer Privacy Act of 2018, California Civil Code Sections 1798.100 et seq. (CCPA) additionally affords data protection rights to persons who are California residents. California residents, please see our California Consumer Privacy Act Disclosures here.
Rights for Swiss and Australian Residents
Personal information may be transmitted to StepStone’s affiliates and non-affiliates outside of Switzerland or Australia (as described in the sections on disclosure above). The countries in which personal information may be transmitted are the following: Australia; Brazil; Canada; Chile; China; Germany; Ireland; Italy; Japan; Kingdom of Saudi Arabia; Korea; Luxembourg; Malaysia; Mexico; Netherlands; Singapore; Spain; Switzerland; the United States; United Arab Emirates; and the United Kingdom. Any such transfers will be made in compliance with applicable data protection legislation, and appropriate measures are in place to facilitate this, such as entering into a data transfer agreement or Model Contractual Clauses (as published by the European Commission and for Switzerland with the Swiss Addendum).
Pursuant to Australian privacy legislation, a Notice Recipient has the right of access to personal information held and the right to amend and rectify any inaccuracies in personal information held.
These rights will be exercisable, subject to limitations as provided for in Australian privacy legislation. Any Notice Recipient may make a request to StepStone to exercise these rights by contacting us at privacy@stepstonegroup.com.
Retention of Personal Information
Please note that personal information may be retained by StepStone for the duration of a Notice Recipient’s investment or engagement with StepStone, and afterwards in accordance with StepStone’s legal and regulatory obligations and policies.
Links to Other Sites
Our websites may contain links to other sites. Please be aware that we are not responsible for the content or privacy practices of such other sites. We encourage our users to be aware when they leave our site and to read the privacy statements of any other linked sites that collect personal information.
Contact Us
For queries, requests, complaints or comments in respect of this Notice, or the way in which StepStone uses personal information, or if you need to access the policy in an alternative format due to a disability, please contact us at privacy@stepstonegroup.com, fill out our Contact Us form available on our website, or call +1-888-995-0350. StepStone will verify your identity using at least two data points and try to respond to you as soon as possible. You may also authorize an agent to submit a request on your behalf, so long as you provide the authorized agent written permission to request on your behalf, and your authorized agent is able to verify their identity with us.
Note that Notice Recipients have the right to lodge a complaint with the appropriate regulator.
Changes to Privacy Policy
StepStone may modify its privacy policy at any time. If we make any changes to this Privacy Policy, we will provide notice of such changes, as appropriate (e.g., on our website or by an email notification to the address you have provided).
56
Investment Adviser and Administrator
StepStone Group Private Wealth LLC
128 S Tryon St., Suite 1600
Charlotte, North Carolina 28202
www.stepstonepw.com
Investment Sub-Adviser
StepStone
Group LP
4225 Executive Square, Suite 1600
La Jolla, California 92037
Custodian
UMB Bank, N.A.
928 Grand Boulevard, 5th Floor
Kansas City, Missouri 64106
Sub-Administrator, Transfer Agent and Sub-Accountant
UMB Fund Services, Inc.
235 W. Galena Street
Milwaukee, Wisconsin 53212-3949
Phone: (414) 299-2200
Distributor
Distribution Services, LLC
3 Canal Plaza, Suite 100
Portland, Maine 04101
Independent Registered Public Accounting Firm
Ernst & Young LLP
One Manhattan West
New York, New York 10001
57
(b) Not applicable.
ITEM 2. CODE OF ETHICS.
(a) StepStone Private Markets (the “Fund” or the “Registrant”), as of the end of the period covered by this report, has adopted a code of ethics that applies to the Registrant’s principal executive officer, principal financial officer, principal accounting officer or controller, or persons performing similar functions, regardless of whether these individuals are employed by the Registrant or a third party.
(b) Not applicable.
(c) There have been no amendments, during the period covered by this report, to a provision of the code of ethics that applies to the Registrant’s principal executive officer, principal financial officer, principal accounting officer or controller, or persons performing similar functions, regardless of whether these individuals are employed by the Registrant or a third party, and that relates to any element of the code of ethics description.
(d) The Registrant has not granted any waivers, during the period covered by this report, including an implicit waiver, from a provision of the code of ethics that applies to the Registrant’s principal executive officer, principal financial officer, principal accounting officer or controller, or persons performing similar functions, regardless of whether these individuals are employed by the Registrant or a third party, that relates to one or more of the items set forth in paragraph (b) of this item’s instructions.
(e) Not applicable.
(f) The Registrant’s code of ethics is attached as Exhibit (a)(1) to this Form N-CSR.
ITEM 3. AUDIT COMMITTEE FINANCIAL EXPERT.
(a)(1) The Registrant’s board of trustees has determined that the Registrant has at least one audit committee financial expert serving on the audit committee.
(a)(2) The audit committee financial expert is Mr. Tracy Schmidt who is independent as defined in Form N-CSR Item 3 (a)(2).
ITEM 4. PRINCIPAL ACCOUNTANT FEES AND SERVICES.
Audit Fees
(a) The aggregate fees billed for the years ended March 31, 2026 and March 31, 2025 for professional services rendered by the principal accountant for the audit of the Registrant’s annual financial statements or services that are normally provided by the accountant in connection with statutory and regulatory filings or engagements for each year or period are $0.60 million and $0.49 million, respectively.
Audit-Related Fees
(b) The aggregate fees billed for the years ended March 31, 2026 and March 31, 2025 for assurance and related services by the principal accountant that are reasonably related to the performance of the audit of the Registrant’s financial statements and are not reported under paragraph (a) of this Item are $0.03 million and $0.02 million, respectively. Audit-related fees principally include fees associated with reviewing and providing comments on semi-annual reports and issuing consents.
Tax Fees
(c) The aggregate fees billed for the years ended March 31, 2026 and March 31, 2025 for professional services rendered by the principal accountant for tax compliance, tax advice and tax planning are $0.53 million and $0.25 million, respectively. Tax-related fees principally include fees associated with the preparation of taxable income calculations and federal income tax forms.
All Other Fees
(d) The aggregate fees billed for the years ended March 31, 2026 and March 31, 2025 for products and services provided by the principal accountant other than the services reported in paragraphs (a) through (c) of this Item are $0 and $0, respectively.
(e)(1) During its regularly scheduled periodic meetings, the Registrant’s audit committee will pre-approve all audit, audit-related, tax and other services to be provided by the principal accountants of the Registrant.
The audit committee may, from time to time, delegate to one or more of its members who are “independent trustees” (as defined in Section 2(a)(19) of the Investment Company Act of 1940 (the “1940 Act”)) pre-approval authority for any subsequent new engagements that arise between regularly scheduled meeting dates provided that any fees that are pre-approved are presented to the audit committee at its next regularly scheduled meeting.
Under applicable laws, pre-approval of non-audit services may be waived provided that: (i) the aggregate amount of all such services provided constitutes no more than five percent of the total amount of fees paid by the Registrant to its principal accountant during the fiscal year in which services are provided; (ii) such services were not recognized by the Registrant at the time of engagement as non-audit services; and (iii) such services are promptly brought to the attention of the audit committee of the Registrant, approved prior to the completion of the audit, and approved based upon a determination that the service is eligible for waiver.
(e)(2) The percentage of services described in each of paragraphs (b) through (d) of this Item that were approved by the audit committee pursuant to paragraph (c)(7)(i)(C) of Rule 2-01 of Regulation S-X are as follows:
(b) Not applicable.
(c) 0%
(d) Not applicable.
(f) Not applicable.
(g) The aggregate non-audit fees billed by the Registrant’s accountant for services rendered to the Registrant, and rendered to the Registrant’s investment adviser (not including any sub-adviser whose role is primarily portfolio management and is subcontracted with or overseen by another investment adviser), and any entity controlling, controlled by, or under common control with the adviser that provides ongoing services to the Registrant for the years ended March 31, 2026 and March 31, 2025 were $0.73 million and $3.06 million, respectively.
(h) The Registrant’s audit committee of the board of trustees has considered whether the provision of non-audit services that were rendered to the Registrant's investment adviser (not including any sub-adviser whose role is primarily portfolio management and is subcontracted with or overseen by another investment adviser), and any entity controlling, controlled by, or under common control with the investment adviser that provides ongoing services to the Registrant that were not pre-approved pursuant to paragraph (c)(7)(ii) of Rule 2-01 of Regulation S-X is compatible with maintaining the principal accountant’s independence. No such services were rendered.
(i) Not applicable.
(j) Not applicable.
ITEM 5. AUDIT COMMITTEE OF LISTED REGISTRANTS.
Not applicable.
ITEM 6. INVESTMENTS.
(a) Schedule of Investments in securities of unaffiliated issuers as of the close of the reporting period is included as part of the Report to Shareholders filed under Item 1(a) of this Form.
(b) Not applicable.
ITEM 7. FINANCIAL STATEMENTS AND FINANCIAL HIGHLIGHTS FOR OPEN-END MANAGEMENT INVESTMENT COMPANIES.
Not applicable.
ITEM 8. CHANGES IN AND DISAGREEMENTS WITH ACCOUNTANTS FOR OPEN-END MANAGEMENT INVESTMENT COMPANIES.
Not applicable.
ITEM 9. PROXY DISCLOSURES FOR OPEN-END MANAGEMENT INVESTMENT COMPANIES.
Not applicable.
ITEM 10. REMUNERATION PAID TO DIRECTORS, OFFICERS, AND OTHERS OF OPEN-END MANAGEMENT INVESTMENT COMPANIES.
Not applicable.
ITEM 11. STATEMENT REGARDING BASIS FOR APPROVAL OF INVESTMENT ADVISORY CONTRACT.
The Registrant’s statement regarding the basis for approval of the investment advisory contract is included as part of the Report to Shareholders filed under Item 1(a) of this Form.
ITEM 12. DISCLOSURE OF PROXY VOTING POLICIES AND PROCEDURES FOR CLOSED-END MANAGEMENT INVESTMENT COMPANIES.
The Fund’s investment adviser, StepStone Group Private Wealth LLC (the “Adviser”), has delegated proxy voting responsibility to StepStone Group LP (the “Sub-Adviser”). The Sub-Adviser’s exercise of this delegated proxy voting authority on behalf of the Fund is subject to the oversight of the Adviser.
The policies and procedures used by the Sub-Adviser to determine how to vote proxies relating to portfolio securities is set forth below:
PROXY VOTING POLICY
Pursuant to Rule 206(4)-6 and Rule 204-2 under the Investment Advisers Act of 1940 (the “Advisers Act”), it is a fraudulent, deceptive, or manipulative act, practice or course of business, within the meaning of Section 206(4) of the Advisers Act, for an investment adviser to exercise voting authority with respect to client securities, unless (A) the adviser has adopted and implemented written policies and procedures that are reasonably designed to ensure that the adviser votes proxies in the best interests of its clients, (B) the adviser describes its proxy voting procedures to its clients and provides copies on request, and (C) the adviser discloses to clients how they may obtain information on how the adviser voted their proxies.
Voting Proxies
The Sub-Adviser is responsible for voting proxies on behalf of the Fund. The Sub-Adviser must vote proxies in a way that is consistent with the Sub-Adviser’s fiduciary duty to the Fund, and any investment policy of the Fund and maintain records of proxies voted, together with a brief explanation why votes were cast in a particular way.
The Sub-Adviser, as a matter of policy and as a fiduciary to the Fund, has responsibility for voting proxies for portfolio securities consistent with the best economic interest of the Fund. The Sub-Adviser’s policy and practice includes the responsibility to monitor corporate actions, receive and vote client proxies and disclose any potential conflicts of interest as well as make information available to clients about the voting of proxies for their portfolio securities and maintaining relevant and required records.
The Sub-Adviser has adopted the following procedures to implement the Sub-Adviser’s policy in regard to the Fund.
Voting Procedures
All investment professionals will forward any proxy materials received on behalf of the Fund to the Sub-Adviser’s Chief Compliance Officer, as applicable.
The Sub-Adviser’s Chief Compliance Officer, as applicable, will verify the Fund holds the security to which the proxy relates.
Absent material conflicts, the investment professionals responsible for the investment to which the proxy materials relate, in consultation with Sub-Adviser’s Chief Compliance Officer will determine how the Sub-Adviser should vote the proxy in accordance with applicable voting guidelines, complete the proxy, and vote the proxy in a timely and appropriate manner.
Voting Guidelines
The Sub-Adviser will vote proxies in the best interests of the Fund. The Sub-Adviser’s policy is to vote all proxies from a specific issuer the same way for each client absent qualifying restrictions from a client or as documented in the file by the Sub-Adviser’s Chief Compliance Officer, as applicable. Clients of the Sub-Adviser, outside of the Fund, are permitted to place reasonable restrictions on the Sub-Adviser’s voting authority in the same manner that they may place such restrictions on the actual selection of account securities.
The Sub-Adviser will generally vote in favor of routine corporate housekeeping proposals such as to change capitalization (e.g., increase the authorized number of common or preferred shares of stock (to the extent there are not disproportionate voting rights per preferred share)), the election of directors, setting the time and place of the annual meeting, change of fiscal year, change of name, and selection of auditors absent conflicts of interest raised by an auditor’s non-audit services.
In the case of non-routine matters, voting decisions will generally be made in support of management, unless it is believed that such recommendation is not in the best interests of the Fund. On a case by case basis, the Sub-Adviser will decide non-routine matters, taking into account the opinion of management and the effect on management, and the effect on shareholder value and the issuer’s business practices. These matters include, but are not limited to, change of domicile, change in preemptive rights or cumulative voting rights, compensation plans, investment restrictions for social policy goals, precatory proposals, classification of the board of directors, poison pill proposals or amendments, recapitalizations, and super-majority voting.
The Sub-Adviser will abstain from voting if it is determined to be in the best interests of the Fund. In making such a determination, various factors will be considered, including, but not limited to, the costs associated with exercising the proxy (e.g., travel or translation costs) and any legal restrictions on trading resulting from the exercise of the proxy. In consultation with the Sub-Adviser’s Chief Compliance Officer, as applicable, the Sub-Adviser may also consider any special regulatory implications applicable to the client or the Sub-Adviser resulting from the exercise of the proxy.
Conflicts of Interest
The Sub-Adviser will identify any conflicts that exist between the interests of the Sub-Adviser and the client by reviewing the relationship of the Sub-Adviser with the issuer of each security to determine if the Sub-Adviser or any of its employees has any financial, business or personal relationship with the issuer.
If a material conflict of interest exists, the Sub-Adviser’s Chief Compliance Officer, as applicable, will determine whether it is appropriate to disclose the conflict to the affected clients, to give the clients an opportunity to vote the proxies themselves, or to address the voting issue through other objective means such as voting in a manner consistent with a predetermined voting policy or receiving an independent third party voting recommendation.
The Sub-Adviser will maintain a record of the resolution of any conflict of interest.
Recordkeeping
The Sub-Adviser’s Chief Compliance Officer, as applicable, shall retain the following proxy records in accordance with the SEC’s five-year retention requirement.
| ● | These policies and procedures and any amendments. |
| ● | Each proxy statement that the Sub-Adviser receives. |
| ● | A record of each vote that the Sub-Adviser casts. |
| ● | Any document the Sub-Adviser created that was material to making a decision how to vote proxies, or that memorializes that decision including periodic reports to the Sub-Adviser’s Chief Compliance Officer or proxy committee, if applicable. |
| ● | A copy of each written request from the Board for information on how the Sub-Adviser voted the Fund’s proxies, and a copy of any written response. |
Private Markets Investments
Investments in private markets are often subject to contractual agreements among the investors in the fund or company. If the Sub-Adviser has the authority to vote with respect to the interests, it will exercise its rights in accord with its contractual obligations and, if its vote is not constrained by contract, the Sub-Adviser will determine how to vote based on the principles described above. Records relating to the vote will be kept for the five-year retention period.
ITEM 13. PORTFOLIO MANAGERS OF CLOSED-END MANAGEMENT INVESTMENT COMPANIES.
(a)(1) Fund Management
The following provides biographical information about the individuals who are primarily responsible for the day-to-day management of the Registrant’s portfolio (the “Portfolio Managers” and each, a “Portfolio Manager”) as of the date of this filing:
Thomas Keck
Mr. Keck leads the Sub-Adviser’s global research activities and the development of SPITM, the Sub-Adviser’s proprietary research database. He is also involved in the Sub-Adviser’s environmental, social and governance and risk management initiatives.
Prior to co-founding the Sub-Adviser, Mr. Keck was a managing director at Pacific Corporate Group, a private equity investment firm that oversaw over $15 billion of private equity commitments for institutional investors. Before that he was a principal with Blue Capital, a middle market buyout firm.
Mr. Keck graduated cum laude with a BA from the George Washington University and received his MBA with high honors from the University of Chicago Booth School of Business. He served in the US Navy as a Naval Flight Officer, receiving numerous decorations flying EA-6Bs off the USS Nimitz (CVN-68).
Michael Elio
Mr. Elio is a member of the Sub-Adviser’s private equity team, focusing on middle-market buyouts and secondary funds. He is also involved in advisory and portfolio management activities.
Prior to joining the Sub-Adviser in 2014, Mr. Elio was a managing director at ILPA, where he led programs around research, standards and industry strategic priorities. Before that he was a partner and managing director at LP Capital Advisors where he led the firm’s Boston office and served as the lead consultant to North American and European institutional investors. Mr. Elio was the primary consultant for many of the firm’s largest clients including public and private pension plans committing more than $5 billion annually.
John Kettnich
Mr. Kettnich is a member of the private equity team, focusing on secondary investments. He is also involved in various portfolio management activities.
Since the Sub-Adviser’s inception, Mr. Kettnich has helped to build the Firm’s primary diligence and research platform, as well as its secondary investment business. He also spent time living in Beijing and London, where he focused on developing the Sub-Adviser’s international business. Before joining the Sub-Adviser in 2007, Mr. Kettnich was with PCG Capital Partners, the direct investment arm of Pacific Corporate Group, where he sourced and evaluated middle-market buyout and growth equity investments.
Mr. Kettnich graduated summa cum laude with a BBA from the University of San Diego and is a CFA charterholder.
(a)(2) Other Accounts Managed by Portfolio Manager(s) or Management Team Member and Potential Conflicts of Interest
Other Accounts Managed by the Portfolio Managers
(As of March 31, 2026)
Number of Other Accounts Managed and Total (in billions) | Number of Other Accounts and Total Value of Assets (in billions) | |||||||||||
| Name | Registered investment companies | Other pooled investment vehicles | Other accounts | Registered investment companies | Other pooled investment vehicles | Other accounts | ||||||
| Thomas Keck | One account, $1.7 | Zero accounts | One account, $2.3 | Zero accounts | Two accounts, $0.4 | Zero accounts | ||||||
| Michael Elio | One account, $1.7 | Two accounts, $0.04 | 14 accounts, $84.4 | Zero accounts | Nine accounts, $4.4 | Zero accounts | ||||||
| John Kettnich | One account, $1.7 | Zero accounts | Five accounts, $8.3 | Zero accounts | 13 accounts, $9.4 | Zero accounts | ||||||
Conflicts of Interest
A potential conflict of interest may arise as a result of a Portfolio Manager’s provision of advisory services to other investment companies, pooled investment vehicles, and/or other accounts (including institutional clients, pension plans and certain high net worth individuals) (“Other Accounts”). The Sub-Adviser may receive fees from Other Accounts that are higher than the fee it receives from the Fund, or it may receive a performance-based fee on certain accounts. In those instances, the Portfolio Managers may have an incentive to favor the higher and/or performance-based fee accounts over the Fund.
The Sub-Adviser has implemented procedures that are designed to ensure that investment opportunities are allocated in a manner that: (i) treats all of its clients fairly and equitably over time; (ii) prevents conflicts regarding allocation of investment opportunities among its clients; and (iii) complies with applicable regulatory requirements. For example, the Sub-Adviser uses an allocation methodology designed to allocate all investments ratably based on a defined allocation procedure. Notwithstanding the foregoing, an aggregated investment may be allocated on a different basis under certain circumstances depending on factors which include, but are not limited to, available cash, liquidity requirements, risk parameters and legal and/or regulatory requirements.
The Sub-Adviser and its investment personnel, including a Portfolio Manager, may hold investments in Other Accounts. This may create an incentive for the Sub-Adviser and its investment personnel to take investment actions based on those investment interests which might diverge, in some cases, from the interests of other clients or favor or disfavor certain funds over other funds. Any potential conflict that arises from these circumstances is mitigated by several factors, including: (i) the fact that the Sub-Adviser’s investment process is designed to achieve long-term capital appreciation as opposed to short-term profits and (ii) the fact that the allocation process is controlled by finance and compliance personnel for the Sub-Adviser.
(a)(3) Compensation Structure of Portfolio Managers
The Sub-Adviser’s philosophy on compensation is to provide senior professionals incentives that are tied to both short-term and long-term performance of the Sub-Adviser. All investment professionals are salaried. Further, all investment professionals are eligible for a short-term incentive bonus each year that is discretionary and based upon the professional’s performance, as well as the performance of the business.
As of March 31, 2026, compensation for the Portfolio Managers includes, a salary, a discretionary bonus and certain retirement benefits from the Sub-Adviser. Additionally, each Portfolio Manager has an equity interest in the Sub-Adviser and indirectly benefits from the success of the Fund based on his or her ownership interest.
(a)(4) Disclosure of Securities Ownership
Portfolio Manager Ownership of Securities in the Fund
| Name of Portfolio Manager | Dollar Range of Securities (As of March 31, 2026) | |||
| Thomas Keck | $10,001 - $50,000 | |||
| Michael Elio | $10,001 - $50,000 | |||
| John Kettnich | Over $1,000,000 |
(b) Not applicable.
ITEM 14. PURCHASES OF EQUITY SECURITIES BY CLOSED-END MANAGEMENT INVESTMENT COMPANY AND AFFILIATED PURCHASERS.
No purchases were made during the reporting period by or on behalf of the Fund or any “affiliated purchaser,” as defined in Rule 10b-18(a)(3) under the Exchange Act (17 CFR 240.10b-18(a)(3)), of shares or other units of any class of the Fund’s equity securities that is registered by the Registrant pursuant to Section 12 of the Exchange Act (15 U.S.C. 781).
ITEM 15. SUBMISSION OF MATTERS TO A VOTE OF SECURITY HOLDERS.
There have been no material changes to the procedures by which the shareholders may recommend nominees to the Registrant’s board of trustees during the period covered by this report.
ITEM 16. CONTROLS AND PROCEDURES.
(a) The Registrant’s principal executive and principal financial officers, or persons performing similar functions, have concluded that the Registrant’s disclosure controls and procedures (as defined in Rule 30a-3(c) under the 1940 Act (17 CFR 270.30a-3(c))) are effective, as of a date within 90 days of the filing date of the report that includes the disclosure required by this paragraph, based on their evaluation of these controls and procedures required by Rule 30a-3(b) under the 1940 Act (17 CFR 270.30a-3(b)) and Rules 13a-15(b) or 15d-15(b) under the Exchange Act (17 CFR 240.13a-15(b) or 240.15d-15(b)).
(b) There were no changes in the Registrant’s internal control over financial reporting (as defined in Rule 30a-3(d) under the 1940 Act (17 CFR 270.30a-3(d)) that occurred during the period covered by this report that has materially affected, or is reasonably likely to materially affect, the Registrant’s internal control over financial reporting.
ITEM 17. DISCLOSURE OF THE SECURITIES LENDING ACTIVITIES FOR CLOSED-END MANAGEMENT COMPANIES.
(a) Not applicable.
(b) Not applicable.
ITEM 18. RECOVERY OF ERRONEOUSLY AWARDED COMPENSATION.
(a) Not applicable.
(b) Not applicable.
ITEM 19. EXHIBITS.
(a)(2) Not applicable.
(a)(4) Not applicable.
(a)(5) Not applicable.
SIGNATURES
Pursuant to the requirements of the Securities Exchange Act of 1934 and the Investment Company Act of 1940, the Registrant has duly caused this report to be signed on its behalf by the undersigned, thereunto duly authorized.
| (Registrant) | StepStone Private Markets | |
| By (Signature and Title)* | /s/ Robert W. Long | |
| Robert
W. Long, President (Principal Executive Officer) | ||
| Date | June 9, 2026 |
Pursuant to the requirements of the Securities Exchange Act of 1934 and the Investment Company Act of 1940, this report has been signed below by the following persons on behalf of the Registrant and in the capacities and on the dates indicated.
| By (Signature and Title)* | /s/ Robert W. Long | |
| Robert W. Long, President (Principal Executive Officer) | ||
| Date | June 9, 2026 | |
| By (Signature and Title)* | /s/ Kimberly S. Zeitvogel | |
| Kimberly S. Zeitvogel, Treasurer (Principal Financial Officer) | ||
| Date | June 9, 2026 |
* Print the name and title of each signing officer under his or her signature.