
.3
JBS REPORTS THIRD QUARTER 2025 RESULTS
November 13, 2025 – JBS N.V. (NYSE: JBS; B3: JBSS32), announces today its 3Q25 results. The numbers reported herein are in US dollars, in accordance with International Financial Reporting Standards (IFRS), unless otherwise specified.
US Comparable (“US Comp”): Consolidated US Comp is a managerial number and considers adjustments in Seara and JBS Brazil for comparative purposes with American peers, in addition to the other Business Units already in US GAAP.
(in millions, except per share data)
| Third Quarter | Nine Months Ended | |||||||||||||||
| 2025 | 2024 | 2025 | 2024 | |||||||||||||
| Net Sales | $ | 22,597 | $ | 19,926 | $ | 63,121 | $ | 57,209 | ||||||||
| Adjusted EBITDA (IFRS)¹ ² | $ | 1,835 | $ | 2,153 | $ | 5,116 | $ | 5,345 | ||||||||
| Adjusted EBITDA (US COMP)¹ | $ | 1,624 | $ | 1,826 | $ | 4,305 | $ | 4,512 | ||||||||
| Adjusted Operating Income (IFRS)¹ ² | $ | 1,251 | $ | 1,610 | $ | 3,431 | $ | 3,712 | ||||||||
| Adjusted Operating Income (US COMP)¹ | $ | 1,276 | $ | 1,502 | $ | 3,309 | $ | 3,548 | ||||||||
| Net Income Attributable to JBS² | $ | 581 | $ | 693 | $ | 1,609 | $ | 1,354 | ||||||||
| Earnings Per Share Attributable to JBS² | $ | 0.52 | $ | 0.62 | $ | 1.45 | $ | 1.22 | ||||||||
| Leverage (Net Debt / Adjusted EBITDA LTM)¹ ² | 2.4 | x | 2.2 | x | 2.4 | x | 2.2 | x | ||||||||
| Interest Coverage (Adjusted EBITDA LTM / Net Interest Expenses LTM)¹ ² | 6.8 | x | 6.3 | x | 6.8 | x | 6.3 | x | ||||||||
| ROE LTM ¹ ² | 23.7 | % | 16.7 | % | 23.7 | % | 16.7 | % | ||||||||
| ROIC LTM ¹ ² | 16.7 | % | 14.9 | % | 16.7 | % | 14.9 | % | ||||||||
| (1) | Reconciliations for non-GAAP measures are provided in subsequent sections within this release. |
| (2) | IFRS |
Third Quarter Highlights
| ● | Net Sales of $22,597 million, up 13% from prior year |
| ● | IFRS Adjusted EBITDA of $1,835 million, down 15% from prior year |
| ● | US COMP Adjusted EBITDA of $1,624 million, down 11% from prior year |
| ● | IFRS Adjusted operating income of $1,251 million, down 22% from prior year |
| ● | US COMP Adjusted operating income of $1,276 million, down 15% from prior year |
| ● | EPS of $0.52, down 16% from prior year |
“In the third quarter of 2025, JBS reported record net sales, with sales growth across all business units, underscoring the strength and diversification of its global multiprotein platform. Net income in the quarter was US$581 million and the Return on Equity (ROE) reached 23.7% (LTM), reflecting solid results. Leverage ended the quarter at 2.39x, in line with the Company’s long-term target”, said Gilberto Tomazoni – Global CEO.
JBS Beef North America delivered record net sales, supported by robust demand in the United States. Despite cutout prices reaching all-time highs, domestic consumption remained resilient. The industry continues to navigate a challenging cattle cycle, with limited cattle availability for processing. With cattle supplies at historically low levels, live cattle prices have remained high, pressuring profitability.
Pilgrim’s Pride continued to strengthen Key Customer partnerships and invested across all regions to drive sales growth, enhance margins, and reduce volatility. Throughout the quarter, chicken demand remained robust given its strong value proposition. In the U.S., Fresh maintained solid performance supported by portfolio diversification, quality, and operational excellence, while Prepared Foods sales rose more than 25% yoy. In Europe, PPC focused on profitable growth through Key Customer partnerships, promotional activity, and new offerings. In Mexico, branded products in both Fresh and Prepared Foods continued to grow, supported by expanding Key Customer relationships across retail.
JBS Brazil reported strong net sales growth, driven mainly by exports, with increases in both volumes and prices, as well as by higher prices in the domestic market. In the international market, in addition to solid global demand, geographic diversification played a key role, boosting sales across several strategic regions. In the domestic market, higher prices partially offset the sharp increase in cattle costs during the period. The Friboi brand was once again voted Top of Mind, the most remembered and preferred brand by Brazilian consumers, winning the meat category for the sixth time and consolidating its position as the absolute leader in its sector.
Seara, achieved the highest export volume in the company’s history, supported by strong operational execution and commercial agility. Despite temporary restrictions in major markets such as China and Europe due to a single avian influenza case in Brasil in May, the team acted quickly to redirect production and strengthen its presence in new markets. In the domestic market, revenue growth was driven by both higher prices and volumes, reflecting strong demand and efficient commercial, operational, and innovation execution. This performance reinforces Seara’s commercial strategy and operational discipline.
JBS USA Pork also delivered record net sales, supported by strong domestic market performance driven by solid demand and JBS’ ongoing efforts to expand its value-added and branded product portfolio. During the quarter, the Company announced the expansion of its pre-cooked bacon and breakfast sausage production through the acquisition of a plant in Iowa, in addition to a new facility (organic expansion) announced in the second quarter in the same state.
JBS Australia, net sales growth was primarily driven by higher prices during the period, both in the domestic and export markets. The beef segment was the main driver of the yoy improvement in profitability. Strong commercial dynamics, with higher prices and increased volumes in both domestic sales and exports, combined with continued operational efficiency gains, more than offset the 26% increase in cattle costs in 3Q25 vs. 3Q24, according to Meat & Livestock Australia (MLA). In the other segments, profitability improved, especially in pork and fish, due to strong operational execution and higher productivity.
Free Cash Flow & Leverage
As anticipated, working capital consumption increased during the period due to higher inventories, reflecting both input cost inflation and the operational dynamics of our global businesses. Consequently, free cash flow was more constrained, and leverage ended the quarter at 2.39x, in line with our long-term financial target. As always, we maintained discipline and responsibility, ensuring sound capital allocation and a solid balance sheet.
2
SEGMENT RESULTS
| JBS Beef North America | ||||||||||||||||||||||||
| Third Quarter | Nine Months Ended | |||||||||||||||||||||||
| IFRS - US$ Million | 2025 | 2024 | Var % | 2025 | 2024 | Var % | ||||||||||||||||||
| Net Sales | $ | 7,248 | $ | 6,313 | 14.8 | % | $ | 20,475 | $ | 17,886 | 14.5 | % | ||||||||||||
| Cost of Sales | $ | (7,078 | ) | $ | (5,971 | ) | 18.5 | % | $ | (20,228 | ) | $ | (17,124 | ) | 18.1 | % | ||||||||
| Gross Profit | $ | 170 | $ | 341 | -50.2 | % | $ | 247 | $ | 762 | -67.5 | % | ||||||||||||
| Adjusted EBITDA | $ | (42 | ) | $ | 117 | - | $ | (375 | ) | $ | 137 | - | ||||||||||||
| Margin (%) | -0.6 | % | 1.9 | % | -2.5 | p.p. | -1.8 | % | 0.8 | % | -2.6 | p.p. | ||||||||||||
| Adjusted Operating Income | $ | (102 | ) | $ | 63 | - | $ | (554 | ) | $ | (26 | ) | - | |||||||||||
| Margin (%) | -1.4 | % | 1.0 | % | -2.4 | p.p. | -2.7 | % | -0.1 | % | -2.6 | p.p. | ||||||||||||
| Third Quarter | Nine Months Ended | |||||||||||||||||||||||
| USGAAP - US$ Million | 2025 | 2024 | Var % | 2025 | 2024 | Var % | ||||||||||||||||||
| Net Sales | $ | 7,248 | $ | 6,313 | 14.8 | % | $ | 20,475 | $ | 17,886 | 14.5 | % | ||||||||||||
| Cost of Sales | $ | (7,249 | ) | $ | (6,230 | ) | 16.4 | % | $ | (20,800 | ) | $ | (17,719 | ) | 17.4 | % | ||||||||
| Gross Profit | $ | (1 | ) | $ | 83 | - | $ | (325 | ) | $ | 167 | - | ||||||||||||
| Adjusted EBITDA | $ | (46 | ) | $ | 37 | - | $ | (424 | ) | $ | 64 | - | ||||||||||||
| Margin (%) | -0.6 | % | 0.6 | % | -1.2 | p.p. | -2.1 | % | 0.4 | % | -2.5 | p.p. | ||||||||||||
| Adjusted Operating Income | $ | (95 | ) | $ | (6 | ) | - | $ | (566 | ) | $ | (64 | ) | - | ||||||||||
| Margin (%) | -1.3 | % | -0.1 | % | -1.2 | p.p. | -2.8 | % | -0.4 | % | -2.4 | p.p. | ||||||||||||
| Pilgrim’s Pride | ||||||||||||||||||||||||
| Third Quarter | Nine Months Ended | |||||||||||||||||||||||
| IFRS - US$ Million | 2025 | 2024 | Var % | 2025 | 2024 | Var % | ||||||||||||||||||
| Net Sales | $ | 4,756 | $ | 4,581 | 3.8 | % | $ | 13,970 | $ | 13,495 | 3.5 | % | ||||||||||||
| Cost of Sales | $ | (3,858 | ) | $ | (3,671 | ) | 5.1 | % | $ | (11,339 | ) | $ | (11,052 | ) | 2.6 | % | ||||||||
| Gross Profit | $ | 898 | $ | 910 | -1.3 | % | $ | 2,631 | $ | 2,443 | 7.7 | % | ||||||||||||
| Adjusted EBITDA | $ | 770 | $ | 776 | -0.8 | % | $ | 2,248 | $ | 2,059 | 9.1 | % | ||||||||||||
| Margin (%) | 16.2 | % | 16.9 | % | -0.7 | p.p. | 16.1 | % | 15.3 | % | 0.8 | p.p. | ||||||||||||
| Adjusted Operating Income | $ | 519 | $ | 549 | -5.5 | % | $ | 1,525 | $ | 1,374 | 11.0 | % | ||||||||||||
| Margin (%) | 10.9 | % | 12.0 | % | -1.1 | p.p. | 10.9 | % | 10.2 | % | 0.7 | p.p. | ||||||||||||
| Third Quarter | Nine Months Ended | |||||||||||||||||||||||
| USGAAP - US$ Million | 2025 | 2024 | Var % | 2025 | 2024 | Var % | ||||||||||||||||||
| Net Sales | $ | 4,759 | $ | 4,585 | 3.8 | % | $ | 13,980 | $ | 13,506 | 3.5 | % | ||||||||||||
| Cost of Sales | $ | (4,100 | ) | $ | (3,901 | ) | 5.1 | % | $ | (12,050 | ) | $ | (11,747 | ) | 2.6 | % | ||||||||
| Gross Profit | $ | 659 | $ | 684 | -3.6 | % | $ | 1,930 | $ | 1,760 | 9.7 | % | ||||||||||||
| Adjusted EBITDA | $ | 633 | $ | 660 | -4.1 | % | $ | 1,853 | $ | 1,688 | 9.8 | % | ||||||||||||
| Margin (%) | 13.3 | % | 14.4 | % | -1.1 | p.p. | 13.3 | % | 12.5 | % | 0.8 | p.p. | ||||||||||||
| Adjusted Operating Income | $ | 517 | $ | 550 | -6.0 | % | $ | 1,519 | $ | 1,366 | 11.1 | % | ||||||||||||
| Margin (%) | 10.9 | % | 12.0 | % | -1.1 | p.p. | 10.9 | % | 10.1 | % | 0.8 | p.p. | ||||||||||||
| JBS Brazil | ||||||||||||||||||||||||
| Third Quarter | Nine Months Ended | |||||||||||||||||||||||
| IFRS - US$ Million | 2025 | 2024 | Var % | 2025 | 2024 | Var % | ||||||||||||||||||
| Net Sales | $ | 4,160 | $ | 3,256 | 27.7 | % | $ | 10,910 | $ | 9,110 | 19.8 | % | ||||||||||||
| Cost of Sales | $ | (3,497 | ) | $ | (2,535 | ) | 37.9 | % | $ | (9,230 | ) | $ | (7,423 | ) | 24.4 | % | ||||||||
| Gross Profit | $ | 662 | $ | 721 | -8.1 | % | $ | 1,680 | $ | 1,688 | -0.5 | % | ||||||||||||
| Adjusted EBITDA | $ | 307 | $ | 378 | -18.7 | % | $ | 667 | $ | 734 | -9.1 | % | ||||||||||||
| Margin (%) | 7.4 | % | 11.6 | % | -4.2 | p.p. | 6.1 | % | 8.1 | % | -2.0 | p.p. | ||||||||||||
| Adjusted Operating Income | $ | 253 | $ | 324 | -21.8 | % | $ | 506 | $ | 570 | -11.1 | % | ||||||||||||
| Margin (%) | 6.1 | % | 9.9 | % | -3.8 | p.p. | 4.6 | % | 6.3 | % | -1.7 | p.p. | ||||||||||||
| Third Quarter | Nine Months Ended | |||||||||||||||||||||||
| USCOMP - US$ Million | 2025 | 2024 | Var % | 2025 | 2024 | Var % | ||||||||||||||||||
| Net Sales | $ | 4,160 | $ | 3,256 | 27.7 | % | $ | 10,910 | $ | 9,110 | 19.8 | % | ||||||||||||
| Adjusted EBITDA | $ | 312 | $ | 369 | -15.6 | % | $ | 660 | $ | 720 | -8.3 | % | ||||||||||||
| Margin (%) | 7.5 | % | 11.3 | % | -3.8 | p.p. | 6.1 | % | 7.9 | % | -1.8 | p.p. | ||||||||||||
| Adjusted Operating Income | $ | 258 | $ | 318 | -18.9 | % | $ | 507 | $ | 565 | -10.2 | % | ||||||||||||
| Margin (%) | 6.2 | % | 9.8 | % | -3.6 | p.p. | 4.6 | % | 6.2 | % | -1.6 | p.p. | ||||||||||||
3
| Seara | ||||||||||||||||||||||||
| Third Quarter | Nine Months Ended | |||||||||||||||||||||||
| IFRS - US$ Million | 2025 | 2024 | Var % | 2025 | 2024 | Var % | ||||||||||||||||||
| Net Sales | $ | 2,361 | $ | 2,194 | 7.6 | % | $ | 6,678 | $ | 6,500 | 2.7 | % | ||||||||||||
| Cost of Sales | $ | (1,834 | ) | $ | (1,537 | ) | 19.3 | % | $ | (4,949 | ) | $ | (4,816 | ) | 2.8 | % | ||||||||
| Gross Profit | $ | 527 | $ | 657 | -19.7 | % | $ | 1,729 | $ | 1,684 | 2.7 | % | ||||||||||||
| Adjusted EBITDA | $ | 323 | $ | 461 | -30.0 | % | $ | 1,140 | $ | 1,089 | 4.7 | % | ||||||||||||
| Margin (%) | 13.7 | % | 21.0 | % | -7.3 | p.p. | 17.1 | % | 16.8 | % | 0.3 | p.p. | ||||||||||||
| Adjusted Operating Income | $ | 217 | $ | 369 | -41.1 | % | $ | 847 | $ | 805 | 5.2 | % | ||||||||||||
| Margin (%) | 9.2 | % | 16.8 | % | -7.6 | p.p. | 12.7 | % | 12.4 | % | 0.3 | p.p. | ||||||||||||
| Third Quarter | Nine Months Ended | |||||||||||||||||||||||
| USCOMP - US$ Million | 2025 | 2024 | Var % | 2025 | 2024 | Var % | ||||||||||||||||||
| Net Sales | $ | 2,361 | $ | 2,194 | 7.6 | % | $ | 6,678 | $ | 6,500 | 2.7 | % | ||||||||||||
| Adjusted EBITDA | $ | 262 | $ | 407 | -35.7 | % | $ | 967 | $ | 922 | 5.0 | % | ||||||||||||
| Margin (%) | 11.1 | % | 18.5 | % | -7.4 | p.p. | 14.5 | % | 14.2 | % | 0.3 | p.p. | ||||||||||||
| Adjusted Operating Income | $ | 214 | $ | 366 | -41.6 | % | $ | 835 | $ | 796 | 4.9 | % | ||||||||||||
| Margin (%) | 9.1 | % | 16.7 | % | -7.6 | p.p. | 12.5 | % | 12.2 | % | 0.3 | p.p. | ||||||||||||
| JBS USA Pork | ||||||||||||||||||||||||
| Third Quarter | Nine Months Ended | |||||||||||||||||||||||
| IFRS - US$ Million | 2025 | 2024 | Var % | 2025 | 2024 | Var % | ||||||||||||||||||
| Net Sales | $ | 2,220 | $ | 2,042 | 8.7 | % | $ | 6,281 | $ | 6,115 | 2.7 | % | ||||||||||||
| Cost of Sales | $ | (1,890 | ) | $ | (1,695 | ) | 11.5 | % | $ | (5,224 | ) | $ | (4,989 | ) | 4.7 | % | ||||||||
| Gross Profit | $ | 330 | $ | 347 | -5.0 | % | $ | 1,057 | $ | 1,125 | -6.1 | % | ||||||||||||
| Adjusted EBITDA | $ | 218 | $ | 247 | -11.5 | % | $ | 719 | $ | 800 | -10.1 | % | ||||||||||||
| Margin (%) | 9.8 | % | 12.1 | % | -2.3 | p.p. | 11.4 | % | 13.1 | % | -1.7 | p.p. | ||||||||||||
| Adjusted Operating Income | $ | 148 | $ | 175 | -15.1 | % | $ | 512 | $ | 586 | -12.6 | % | ||||||||||||
| Margin (%) | 6.7 | % | 8.6 | % | -1.9 | p.p. | 8.2 | % | 9.6 | % | -1.4 | p.p. | ||||||||||||
| Third Quarter | Nine Months Ended | |||||||||||||||||||||||
| USGAAP - US$ Million | 2025 | 2024 | Var % | 2025 | 2024 | Var % | ||||||||||||||||||
| Net Sales | $ | 2,220 | $ | 2,042 | 8.7 | % | $ | 6,281 | $ | 6,115 | 2.7 | % | ||||||||||||
| Cost of Sales | $ | (1,986 | ) | $ | (1,825 | ) | 8.8 | % | $ | (5,673 | ) | $ | (5,451 | ) | 4.1 | % | ||||||||
| Gross Profit | $ | 234 | $ | 217 | 7.8 | % | $ | 608 | $ | 664 | -8.5 | % | ||||||||||||
| Adjusted EBITDA | $ | 228 | $ | 210 | 8.2 | % | $ | 584 | $ | 639 | -8.6 | % | ||||||||||||
| Margin (%) | 10.2 | % | 10.3 | % | -0.1 | p.p. | 9.3 | % | 10.4 | % | -1.1 | p.p. | ||||||||||||
| Adjusted Operating Income | $ | 179 | $ | 164 | 9.2 | % | $ | 443 | $ | 500 | -11.4 | % | ||||||||||||
| Margin (%) | 8.0 | % | 8.0 | % | 0.0 | p.p. | 7.0 | % | 8.2 | % | -1.2 | p.p. | ||||||||||||
| JBS Australia | ||||||||||||||||||||||||
| Third Quarter | Nine Months Ended | |||||||||||||||||||||||
| IFRS - US$ Million | 2025 | 2024 | Var % | 2025 | 2024 | Var % | ||||||||||||||||||
| Net Sales | $ | 2,192 | $ | 1,785 | 22.9 | % | $ | 5,787 | $ | 4,883 | 18.5 | % | ||||||||||||
| Cost of Sales | $ | (1,835 | ) | $ | (1,501 | ) | 22.2 | % | $ | (4,778 | ) | $ | (4,075 | ) | 17.2 | % | ||||||||
| Gross Profit | $ | 357.3 | $ | 283 | 26.2 | % | $ | 1,009 | $ | 808 | 24.9 | % | ||||||||||||
| Adjusted EBITDA | $ | 249 | $ | 174 | 42.7 | % | $ | 699 | $ | 524 | 33.5 | % | ||||||||||||
| Margin (%) | 11.4 | % | 9.8 | % | 1.6 | p.p. | 12.1 | % | 10.7 | % | 1.4 | p.p. | ||||||||||||
| Adjusted Operating Income | $ | 217 | $ | 141 | 53.5 | % | $ | 608 | $ | 427 | 42.2 | % | ||||||||||||
| Margin (%) | 9.9 | % | 7.9 | % | 2.0 | p.p. | 10.5 | % | 8.7 | % | 1.8 | p.p. | ||||||||||||
| Third Quarter | Nine Months Ended | |||||||||||||||||||||||
| USGAAP - US$ Million | 2025 | 2024 | Var % | 2025 | 2024 | Var % | ||||||||||||||||||
| Net Sales | $ | 2,192 | $ | 1,785 | 22.9 | % | $ | 5,787 | $ | 4,883 | 18.5 | % | ||||||||||||
| Cost of Sales | $ | (1,940 | ) | $ | (1,610 | ) | 20.5 | % | $ | (5,061 | ) | $ | (4,334 | ) | 16.8 | % | ||||||||
| Gross Profit | $ | 253 | $ | 174 | 44.9 | % | $ | 726 | $ | 549 | 32.3 | % | ||||||||||||
| Adjusted EBITDA | $ | 227 | $ | 144 | 57.4 | % | $ | 647 | $ | 478 | 35.2 | % | ||||||||||||
| Margin (%) | 10.4 | % | 8.1 | % | 2.3 | p.p. | 11.2 | % | 9.8 | % | 1.4 | p.p. | ||||||||||||
| Adjusted Operating Income | $ | 206 | $ | 122 | 68.4 | % | $ | 586 | $ | 414 | 41.7 | % | ||||||||||||
| Margin (%) | 9.4 | % | 6.8 | % | 2.6 | p.p. | 10.1 | % | 8.5 | % | 1.6 | p.p. | ||||||||||||
4
CONSOLIDATED CONDENSED STATEMENTS OF INCOME
(In millions, except per share data)
(Unaudited)
| Third Quarter | Nine Months Ended | |||||||||||||||
| 2025 | 2024 | 2025 | 2024 | |||||||||||||
| Net Sales | $ | 22,597.0 | $ | 19,926.0 | $ | 63,121.2 | $ | 57,208.9 | ||||||||
| Cost of Sales | (19,624.5 | ) | (16,646.1 | ) | (54,691.6 | ) | (48,597.3 | ) | ||||||||
| Gross Profit | 2,972.4 | 3,279.9 | 8,429.5 | 8,611.6 | ||||||||||||
| Selling expenses | (1,256.0 | ) | (1,217.6 | ) | (3,650.7 | ) | (3,438.8 | ) | ||||||||
| General and administrative expenses | (513.7 | ) | (487.6 | ) | (1,592.4 | ) | (1,712.6 | ) | ||||||||
| Other income(expenses) | 16.3 | (20.4 | ) | 20.6 | (48.8 | ) | ||||||||||
| Net Operating Expenses | (1,753.4 | ) | (1,725.6 | ) | (5,222.5 | ) | (5,200.1 | ) | ||||||||
| Operating Income | 1,219.0 | 1,554.3 | 3,207.0 | 3,411.4 | ||||||||||||
| Finance Income | 202.9 | 153.5 | 508.0 | 517.6 | ||||||||||||
| Finance Expense | (611.1 | ) | (514.6 | ) | (1,484.1 | ) | (1,827.0 | ) | ||||||||
| Net Finance Expense | (408.1 | ) | (361.1 | ) | (976.1 | ) | (1,309.5 | ) | ||||||||
| Share of profit of equity-accounted investees, net of tax | 4.5 | 3.9 | 15.0 | (0.2 | ) | |||||||||||
| Profit Before Taxes | 815.3 | 1,197.1 | 2,245.9 | 2,101.7 | ||||||||||||
| Current Income Taxes | (185.9 | ) | (142.4 | ) | (576.4 | ) | (399.2 | ) | ||||||||
| Deferred Income Taxes | 14.7 | (298.1 | ) | 125.2 | (193.3 | ) | ||||||||||
| Total Income Taxes | (171.2 | ) | (440.5 | ) | (451.2 | ) | (592.5 | ) | ||||||||
| Effective Rate | (21.0 | )% | (36.8 | )% | (20.1 | )% | (28.2 | )% | ||||||||
| Net Income | 644.1 | 756.6 | 1,794.8 | 1,509.2 | ||||||||||||
| Attributable to: | ||||||||||||||||
| Company shareholders | 580.9 | 692.9 | 1,609.2 | 1,354.0 | ||||||||||||
| Non-controlling interest | 63.2 | 63.7 | 185.6 | 155.2 | ||||||||||||
| Earnings per Share (US$) | $ | 0.52 | $ | 0.62 | $ | 1.45 | $ | 1.22 | ||||||||
| Third Quarter | Nine Months Ended | |||||||||||||||||||||||
| IFRS - US$ Million | 2025 | 2024 | Var % | 2025 | 2024 | Var % | ||||||||||||||||||
| Adjusted EBITDA | $ | 1,835 | $ | 2,153 | -14.8 | % | $ | 5,116 | $ | 5,345 | -4.3 | % | ||||||||||||
| Margin (%) | 8.1 | % | 10.8 | % | -2.7 | p.p. | 8.1 | % | 9.3 | % | -1.2 | p.p. | ||||||||||||
| Adjusted Operating Income | $ | 1,251 | $ | 1,610 | -22.3 | % | $ | 3,431 | $ | 3,712 | -7.6 | % | ||||||||||||
| Margin (%) | 5.5 | % | 8.1 | % | -2.6 | p.p. | 5.4 | % | 6.5 | % | -1.1 | p.p. | ||||||||||||
| Third Quarter | Nine Months Ended | |||||||||||||||||||||||
| USCOMP - US$ Million | 2025 | 2024 | Var % | 2025 | 2024 | Var % | ||||||||||||||||||
| Adjusted EBITDA | $ | 1,624 | $ | 1,826 | -11.1 | % | $ | 4,305 | $ | 4,512 | -4.6 | % | ||||||||||||
| Margin (%) | 7.2 | % | 9.2 | % | -2.0 | p.p. | 6.8 | % | 7.9 | % | -1.1 | p.p. | ||||||||||||
| Adjusted Operating Income | $ | 1,276 | $ | 1,502 | -15.0 | % | $ | 3,309 | $ | 3,548 | -6.7 | % | ||||||||||||
| Margin (%) | 5.6 | % | 7.5 | % | -1.9 | p.p. | 5.2 | % | 6.2 | % | -1.0 | p.p. | ||||||||||||
5
CONSOLIDATED CONDENSED BALANCE SHEETS
(In millions)
(Unaudited)
| September 30, 2025 | December 31, 2024 | |||||||
| Assets | ||||||||
| Current Assets: | ||||||||
| Cash and cash equivalents | $ | 3,558.2 | $ | 5,613.7 | ||||
| Margin Cash | 553.8 | 136.6 | ||||||
| Trade accounts receivable | 3,847.8 | 3,735.5 | ||||||
| Inventories | 6,568.7 | 5,016.0 | ||||||
| Biological assets | 1,820.8 | 1,608.2 | ||||||
| Recoverable taxes | 670.1 | 637.7 | ||||||
| Derivative assets | 262.7 | 84.5 | ||||||
| Other current assets | 389.5 | 288.8 | ||||||
| Total Current Assets | 17,671.7 | 17,121.0 | ||||||
| Non Current Assets: | ||||||||
| Long-term Investments | 45.8 | - | ||||||
| Recoverable taxes | 1,914.1 | 1,412.5 | ||||||
| Biological assets | 602.2 | 518.2 | ||||||
| Related party receivables | - | 77.4 | ||||||
| Deferred income taxes | 511.5 | 651.2 | ||||||
| Other non-current assets | 558.6 | 268.7 | ||||||
| 3,632.1 | 2,928.0 | |||||||
| Investments in equity-accounted investees | 226.5 | 38.3 | ||||||
| Property, plant and equipment | 13,263.9 | 11,780.9 | ||||||
| Right of use assets | 1,644.8 | 1,596.9 | ||||||
| Intangible assets | 1,848.9 | 1,803.2 | ||||||
| Goodwill | 5,898.2 | 5,417.1 | ||||||
| Total Non Current Assets | 26,514.4 | 23,564.4 | ||||||
| Total Assets | $ | 44,186.1 | $ | 40,685.4 | ||||
6
| September 30, 2025 | December 31, 2024 | |||||||
| Liabilities and Equity | ||||||||
| Current Liabilities: | ||||||||
| Trade accounts payable | $ | 5,447.4 | $ | 5,465.5 | ||||
| Supply chain finance | 1,141.2 | 728.7 | ||||||
| Loans and financing | 999.4 | 2,084.2 | ||||||
| Income taxes | 242.6 | 233.0 | ||||||
| Other taxes payable | 123.7 | 113.7 | ||||||
| Payroll and social charges | 1,489.5 | 1,435.8 | ||||||
| Lease liabilities | 356.4 | 335.7 | ||||||
| Dividends payable | 0.2 | 358.6 | ||||||
| Provisions for legal proceedings | 100.9 | 280.8 | ||||||
| Derivative liabilities | 455.0 | 166.0 | ||||||
| Other current liabilities | 677.1 | 455.0 | ||||||
| Total Current Liabilities | 11,033.4 | 11,657.1 | ||||||
| Non Current Liabilities: | ||||||||
| Loans and financings | 19,769.2 | 17,242.6 | ||||||
| Income and other taxes payable | 416.0 | 406.7 | ||||||
| Payroll and social charges | 276.1 | 352.7 | ||||||
| Lease liabilities | 1,441.3 | 1,398.3 | ||||||
| Deferred income taxes | 1,073.1 | 1,095.3 | ||||||
| Provisions for legal proceedings | 224.7 | 216.7 | ||||||
| Debt with related parties | 213.0 | - | ||||||
| Derivative liabilities | 116.7 | 100.1 | ||||||
| Other non current liabilities | 113.5 | 81.6 | ||||||
| Total Non Current Liabilities | 23,643.6 | 20,893.9 | ||||||
| Equity: | ||||||||
| Share capital - common shares | 35.1 | 13,177.8 | ||||||
| Capital reserve | 7,299.4 | (180.6 | ) | |||||
| Other reserves | - | (37.5 | ) | |||||
| Profit reserves | (360.9 | ) | 4,211.9 | |||||
| Accumulated other comprehensive income/loss | 73.0 | (10,077.3 | ) | |||||
| Retained earnings/ loss | 1,670.6 | - | ||||||
| Attributable to company shareholders | 8,717.3 | 7,094.5 | ||||||
| Attributable to non-controlling interest | 791.8 | 1,039.9 | ||||||
| Total Equity | 9,509.2 | 8,134.4 | ||||||
| Total Liabilities and Equity | $ | 44,186.1 | $ | 40,685.4 | ||||
7
CONSOLIDATED CONDENSED STATEMENTS OF CASH FLOWS
(In millions)
(Unaudited)
| Third Quarter | Nine Months Ended | |||||||||||||||
| 2025 | 2024 | 2025 | 2024 | |||||||||||||
| Net income | $ | 644.1 | $ | 756.6 | $ | 1,794.8 | $ | 1,509.2 | ||||||||
| Adjustments for: | ||||||||||||||||
| Depreciation and amortization | 584.0 | 542.8 | 1,684.9 | 1,633.6 | ||||||||||||
| Expected credit losses | 9.6 | 2.9 | 22.9 | 9.1 | ||||||||||||
| Share of profit of equity-accounted investees | (4.5 | ) | (3.9 | ) | (15.0 | ) | 0.2 | |||||||||
| (Gain) loss on assets sales | (6.4 | ) | 0.1 | (15.3 | ) | (4.6 | ) | |||||||||
| Taxes expense | 171.2 | 440.5 | 451.2 | 592.5 | ||||||||||||
| Finance expense (income), net | 408.1 | 361.1 | 976.1 | 1,309.5 | ||||||||||||
| Share-based compensation | 5.7 | 2.7 | 19.8 | 10.1 | ||||||||||||
| Provisions | 44.9 | 9.5 | 60.4 | 31.2 | ||||||||||||
| Impairment of goodwill and property, plant and equipment | (0.8 | ) | 13.2 | 12.8 | 26.6 | |||||||||||
| Net realizable value inventory adjustments | (0.2 | ) | 22.3 | 20.2 | 8.8 | |||||||||||
| Fair value (market to market) of biological assets | 19.4 | (26.1 | ) | (67.0 | ) | (56.0 | ) | |||||||||
| SEC and DOJ agreements (Antitrust) | 10.1 | 0.7 | 143.7 | 81.0 | ||||||||||||
| Avian Influenza | 7.5 | - | 13.1 | - | ||||||||||||
| 1,892.8 | 2,122.5 | 5,102.5 | 5,151.3 | |||||||||||||
| Changes in assets and liabilities: | ||||||||||||||||
| Trade accounts receivable | (178.8 | ) | (61.0 | ) | (18.8 | ) | 53.4 | |||||||||
| Inventories | (248.0 | ) | (282.3 | ) | (1,203.3 | ) | (574.4 | ) | ||||||||
| Recoverable taxes | (50.6 | ) | (6.1 | ) | 43.2 | 13.0 | ||||||||||
| Other current and non-current assets | (194.7 | ) | 10.3 | (556.9 | ) | (93.2 | ) | |||||||||
| Biological assets | (174.7 | ) | (154.0 | ) | (572.7 | ) | (355.1 | ) | ||||||||
| Trade accounts payable and supply chain finance | 485.2 | 285.9 | (90.2 | ) | (303.2 | ) | ||||||||||
| Tax payable in installments | (2.6 | ) | (13.4 | ) | (54.5 | ) | (48.1 | ) | ||||||||
| Other current and non-current liabilities | (27.8 | ) | 106.8 | 151.6 | 116.3 | |||||||||||
| Payments of DOJ and Antitrust agreements | (77.9 | ) | (56.5 | ) | (339.1 | ) | (56.6 | ) | ||||||||
| Income taxes paid | (101.3 | ) | (101.4 | ) | (652.2 | ) | (188.8 | ) | ||||||||
| Changes in operating assets and liabilities | (571.2 | ) | (271.7 | ) | (3,292.8 | ) | (1,436.7 | ) | ||||||||
| Cash provided by (used in) operating activities | 1,321.6 | 1,850.9 | 1,809.7 | 3,714.6 | ||||||||||||
| Interest paid | (343.2 | ) | (487.3 | ) | (948.2 | ) | (1,176.6 | ) | ||||||||
| Interest received | 61.2 | 54.6 | 134.9 | 151.7 | ||||||||||||
| Cash net of interest provided by (used in) operating activities | 1,039.5 | 1,418.2 | 996.4 | 2,689.7 | ||||||||||||
| Cash flow from investing activities: | ||||||||||||||||
| Purchases of property, plant and equipment | (546.9 | ) | (320.9 | ) | (1,261.0 | ) | (950.6 | ) | ||||||||
| Purchases of intangible assets | (2.2 | ) | (1.6 | ) | (4.7 | ) | (6.1 | ) | ||||||||
| Proceeds from sale of property, plant and equipment | 21.3 | 10.2 | 56.9 | 26.0 | ||||||||||||
| Additional investments in joint-ventures and subsidiaries | (21.2 | ) | - | (186.5 | ) | - | ||||||||||
| Acquisitions, net of cash acquired | - | (1.3 | ) | - | (4.2 | ) | ||||||||||
| Dividends received | 2.1 | 2.3 | 6.2 | 8.7 | ||||||||||||
| Acquisition of investments funds | (45.8 | ) | - | (45.8 | ) | - | ||||||||||
| Related party transactions | (27.6 | ) | 0.2 | (22.9 | ) | 0.7 | ||||||||||
| Cash provided by (used in) investing activities | (620.3 | ) | (311.1 | ) | (1,457.8 | ) | (925.5 | ) | ||||||||
| Cash flow from financing activities: | ||||||||||||||||
| Proceeds from loans and financings | 4,961.1 | 1,346.1 | 9,455.3 | 2,034.8 | ||||||||||||
| Payments of loans and financings | (3,788.8 | ) | (902.9 | ) | (8,465.1 | ) | (2,637.8 | ) | ||||||||
| Derivatives instruments received/settled | (38.8 | ) | (31.7 | ) | (91.6 | ) | (172.5 | ) | ||||||||
| Dividends Payment | - | - | (1,573.9 | ) | - | |||||||||||
| Dividends paid to non-controlling interest | (89.3 | ) | 0.3 | (355.7 | ) | (3.1 | ) | |||||||||
| Margin Cash | 52.9 | (3.0 | ) | 8.5 | (1.2 | ) | ||||||||||
| Payments of lease | (110.0 | ) | (103.0 | ) | (325.0 | ) | (314.0 | ) | ||||||||
| Share Buyback | (362.5 | ) | - | (362.5 | ) | - | ||||||||||
| Acquisition of non-controlling interests in the subsidiary PPC | (1.3 | ) | - | (1.3 | ) | - | ||||||||||
| Others | (22.6 | ) | - | (22.6 | ) | - | ||||||||||
| Cash used in financing activities | 600.8 | 305.8 | (1,733.9 | ) | (1,093.8 | ) | ||||||||||
| Effect of exchange rate changes on cash and cash equivalents | 19.4 | (33.1 | ) | 140.0 | (169.8 | ) | ||||||||||
| Net change in cash and cash equivalents | 1,039.5 | 1,379.8 | (2,055.4 | ) | 500.5 | |||||||||||
| Cash and cash equivalents at the beggining of period | 2,518.8 | 3,690.3 | 5,613.7 | 4,569.5 | ||||||||||||
| Cash and cash equivalents at the end of period | $ | 3,558.2 | $ | 5,070.1 | $ | 3,558.2 | $ | 5,070.1 | ||||||||
8
Adjusted EBITDA IFRS to US COMP Reconciliations
(In millions)
(Unaudited)
| Adjusted EBITDA 3Q25 | ||||||||||||||||||||||||||||||||
| JBS Beef North America | PPC | JBS Brazil | Seara | JBS USA Pork | Australia | Others and Eliminations | Total | |||||||||||||||||||||||||
| Adjusted EBITDA IFRS | $ | (41.7 | ) | $ | 769.7 | $ | 307.2 | $ | 322.7 | $ | 218.2 | $ | 248.9 | $ | 9.5 | $ | 1,834.6 | |||||||||||||||
| Leasing adjustments | (13.8 | ) | (20.7 | ) | (2.6 | ) | (14.5 | ) | (24.0 | ) | (12.9 | ) | (0.6 | ) | (89.1 | ) | ||||||||||||||||
| Inventory adjustments at market value | 9.2 | - | - | - | 1.9 | - | - | 11.1 | ||||||||||||||||||||||||
| Biological assets adjustments | - | (116.3 | ) | 6.9 | (46.7 | ) | 31.4 | (8.8 | ) | - | (133.5 | ) | ||||||||||||||||||||
| Other adjustments | 0.1 | 0.3 | - | - | - | - | 0.2 | 0.7 | ||||||||||||||||||||||||
| Adjusted EBITDA US COMP | $ | (46.2 | ) | $ | 633.1 | $ | 311.5 | $ | 261.5 | $ | 227.5 | $ | 227.1 | $ | 9.2 | $ | 1,623.8 | |||||||||||||||
| Adjusted EBITDA 3Q24 | ||||||||||||||||||||||||||||||||
| JBS Beef North America | PPC | JBS Brazil | Seara | JBS USA Pork | Australia | Others and Eliminations | Total | |||||||||||||||||||||||||
| Adjusted EBITDA IFRS | $ | 117.3 | $ | 775.9 | $ | 377.7 | $ | 461.2 | $ | 246.7 | $ | 174.3 | $ | (0.1 | ) | $ | 2,153.1 | |||||||||||||||
| Leasing adjustments | (13.0 | ) | (19.6 | ) | (3.8 | ) | (13.7 | ) | (29.2 | ) | (13.4 | ) | (1.6 | ) | (94.3 | ) | ||||||||||||||||
| Inventory adjustments at market value | (67.5 | ) | - | - | - | (2.4 | ) | - | - | (69.9 | ) | |||||||||||||||||||||
| Biological assets adjustments | - | (96.7 | ) | (4.7 | ) | (41.0 | ) | (4.8 | ) | (16.7 | ) | - | (163.9 | ) | ||||||||||||||||||
| Other adjustments | (0.2 | ) | 0.8 | - | - | - | - | 0.3 | 0.9 | |||||||||||||||||||||||
| Adjusted EBITDA US COMP | $ | 36.7 | 660.4 | $ | 369.1 | $ | 406.6 | $ | 210.3 | $ | 144.2 | $ | (1.4 | ) | $ | 1,825.9 | ||||||||||||||||
| Adjusted EBITDA 9M25 | ||||||||||||||||||||||||||||||||
| JBS Beef North America | PPC | JBS Brazil | Seara | JBS USA Pork | Australia | Others and Eliminations | Total | |||||||||||||||||||||||||
| Adjusted EBITDA IFRS | $ | (375.1 | ) | $ | 2,247.7 | $ | 666.9 | $ | 1,140.1 | $ | 719.1 | $ | 699.4 | $ | 17.8 | $ | 5,115.9 | |||||||||||||||
| Leasing adjustments | (43.0 | ) | (60.2 | ) | (10.5 | ) | (43.9 | ) | (75.7 | ) | (38.1 | ) | (1.9 | ) | (273.5 | ) | ||||||||||||||||
| Inventory adjustments at market value | (5.4 | ) | - | - | - | (21.9 | ) | - | - | (27.4 | ) | |||||||||||||||||||||
| Biological assets adjustments | - | (335.2 | ) | 3.8 | (128.8 | ) | (37.6 | ) | (14.8 | ) | - | (512.5 | ) | |||||||||||||||||||
| Other adjustments | 0.1 | 0.9 | - | - | - | - | 1.0 | 2.0 | ||||||||||||||||||||||||
| Adjusted EBITDA US COMP | $ | (423.5 | ) | 1,853.2 | $ | 660.1 | $ | 967.5 | $ | 583.8 | $ | 646.5 | $ | 16.9 | $ | 4,304.5 | ||||||||||||||||
| Adjusted EBITDA 9M24 | ||||||||||||||||||||||||||||||||
| JBS Beef North America | PPC | JBS Brazil | Seara | JBS USA Pork | Australia | Others and Eliminations | Total | |||||||||||||||||||||||||
| Adjusted EBITDA IFRS | $ | 136.5 | $ | 2,059.3 | $ | 733.9 | $ | 1,089.0 | $ | 800.2 | $ | 524.1 | $ | 2.3 | $ | 5,345.3 | ||||||||||||||||
| Leasing adjustments | (38.0 | ) | (65.6 | ) | (10.3 | ) | (43.2 | ) | (85.9 | ) | (39.2 | ) | (2.4 | ) | (284.6 | ) | ||||||||||||||||
| Inventory adjustments at market value | (34.2 | ) | - | - | - | (32.3 | ) | - | - | (66.5 | ) | |||||||||||||||||||||
| Biological assets adjustments | - | (306.0 | ) | (3.3 | ) | (124.0 | ) | (43.5 | ) | (6.7 | ) | - | (483.5 | ) | ||||||||||||||||||
| Other adjustments | (0.1 | ) | 0.5 | - | - | - | - | 0.949 | 1.4 | |||||||||||||||||||||||
| Adjusted EBITDA US COMP | $ | 64.2 | $ | 1,688.2 | $ | 720.2 | $ | 921.8 | $ | 638.6 | $ | 478.2 | $ | 0.9 | $ | 4,512.1 | ||||||||||||||||
9
Adjusted Operating Income IFRS to US COMP Reconciliations
(In millions)
(Unaudited)
| Adjusted Operating Income (Loss) 3Q25 | ||||||||||||||||||||||||||||||||
| JBS Beef North America | PPC | JBS Brazil | Seara | JBS USA Pork | Australia | Others and Eliminations | Total | |||||||||||||||||||||||||
| Adjusted Operating Income IFRS | $ | (102.4 | ) | $ | 518.9 | $ | 253.1 | $ | 217.1 | $ | 148.3 | $ | 216.9 | $ | (1.3 | ) | $ | 1,250.6 | ||||||||||||||
| Leasing adjustments | (2.3 | ) | (3.1 | ) | (1.9 | ) | (3.3 | ) | (3.0 | ) | (2.2 | ) | (0.0 | ) | (15.8 | ) | ||||||||||||||||
| Inventory adjustments at market value | 9.2 | - | - | - | 1.9 | - | - | 11.1 | ||||||||||||||||||||||||
| Biological assets adjustments | - | - | 6.9 | - | 31.4 | (8.8 | ) | - | 29.5 | |||||||||||||||||||||||
| Other adjustments | 0.4 | 0.8 | - | - | - | - | (0.2 | ) | 1.0 | |||||||||||||||||||||||
| Adjusted Operating Income US COMP | $ | (95.1 | ) | $ | 516.7 | $ | 258.1 | $ | 213.8 | $ | 178.7 | $ | 205.8 | $ | (1.6 | ) | $ | 1,276.3 | ||||||||||||||
| Adjusted Operating Income (Loss) 3Q24 | ||||||||||||||||||||||||||||||||
| JBS Beef North America | PPC | JBS Brazil | Seara | JBS USA Pork | Australia | Others and Eliminations | Total | |||||||||||||||||||||||||
| Adjusted Operating Income IFRS | $ | 62.8 | $ | 549.4 | $ | 323.6 | $ | 368.9 | $ | 174.6 | $ | 141.3 | $ | (10.3 | ) | $ | 1,610.3 | |||||||||||||||
| Leasing adjustments | (1.8 | ) | (2.0 | ) | (0.6 | ) | (2.9 | ) | (3.7 | ) | (2.5 | ) | - | (13.6 | ) | |||||||||||||||||
| Inventory adjustments at market value | (67.5 | ) | - | - | - | (2.4 | ) | - | - | (69.9 | ) | |||||||||||||||||||||
| Biological assets adjustments | - | - | (4.7 | ) | - | (4.8 | ) | (16.7 | ) | - | (26.2 | ) | ||||||||||||||||||||
| Other adjustments | 0.1 | 2.5 | - | - | - | - | (1 | ) | 1.2 | |||||||||||||||||||||||
| Adjusted Operating Income US COMP | $ | (6.4 | ) | $ | 549.9 | $ | 318.3 | $ | 365.9 | $ | 163.8 | $ | 122.1 | $ | (11.8 | ) | $ | 1,501.8 | ||||||||||||||
| Adjusted Operating Income (Loss) 9M25 | ||||||||||||||||||||||||||||||||
| JBS Beef North America | PPC | JBS Brazil | Seara | JBS USA Pork | Australia | Others and Eliminations | Total | |||||||||||||||||||||||||
| Adjusted Operating Income IFRS | $ | (553.6 | ) | $ | 1,525.4 | $ | 506.4 | $ | 846.9 | $ | 512.1 | $ | 607.5 | $ | (13.7 | ) | $ | 3,431.1 | ||||||||||||||
| Leasing adjustments | (7.7 | ) | (8.9 | ) | (2.9 | ) | (12.0 | ) | (10.1 | ) | (7.0 | ) | (0.0 | ) | (48.7 | ) | ||||||||||||||||
| Inventory adjustments at market value | (5.4 | ) | - | - | - | (21.9 | ) | - | - | (27.4 | ) | |||||||||||||||||||||
| Biological assets adjustments | - | - | 3.8 | - | (37.6 | ) | (14.8 | ) | - | (48.6 | ) | |||||||||||||||||||||
| Other adjustments | 0.9 | 2.3 | - | - | - | - | $ | (0.4 | ) | 2.8 | ||||||||||||||||||||||
| Adjusted Operating Income US COMP | $ | (565.8 | ) | $ | 1,518.8 | $ | 507.3 | $ | 834.9 | $ | 442.5 | $ | 585.7 | $ | (14.2 | ) | $ | 3,309.2 | ||||||||||||||
| Adjusted Operating Income (Loss) 9M24 | ||||||||||||||||||||||||||||||||
| JBS Beef North America | PPC | JBS Brazil | Seara | JBS USA Pork | Australia | Others and Eliminations | Total | |||||||||||||||||||||||||
| Adjusted Operating Income IFRS | $ | (25.8 | ) | $ | 1,373.8 | $ | 569.5 | $ | 804.9 | $ | 586.3 | $ | 427.1 | $ | (24.2 | ) | $ | 3,711.7 | ||||||||||||||
| Leasing adjustments | (5.0 | ) | (13.1 | ) | (1.2 | ) | (9.3 | ) | (10.8 | ) | (7.0 | ) | - | (46.4 | ) | |||||||||||||||||
| Inventory adjustments at market value | (34.2 | ) | - | - | - | (32.3 | ) | - | - | (66.5 | ) | |||||||||||||||||||||
| Biological assets adjustments | - | - | (3.3 | ) | - | (43.5 | ) | (6.7 | ) | - | (53.5 | ) | ||||||||||||||||||||
| Other adjustments | 0.8 | 5.8 | - | - | - | - | (4.3 | ) | 2.2 | |||||||||||||||||||||||
| Adjusted Operating Income US COMP | $ | (64.2 | ) | 1,366.4 | $ | 565.0 | $ | 795.6 | $ | 499.7 | $ | 413.5 | $ | (28.5 | ) | $ | 3,547.5 | |||||||||||||||
10
EBITDA to Adjusted EBITDA and Free Cash Flow Reconciliation
(In millions)
(Unaudited)
| Third Quarter | Nine Months Ended | Twelve Months Ended | ||||||||||||||||||||||
| 2025 | 2024 | 2025 | 2024 | 3Q25 | 3Q24 | |||||||||||||||||||
| Profit before Taxes | $ | 815.3 | $ | 1,197.1 | $ | 2,245.9 | $ | 2,101.7 | $ | 2,855.2 | $ | 2,119.5 | ||||||||||||
| Share of profit of equity-accounted investees, net of tax | (4.5 | ) | (3.9 | ) | (15.0 | ) | 0.2 | (18.2 | ) | 0.5 | ||||||||||||||
| Net finance results | 408.1 | 361.1 | 976.1 | 1,309.5 | 1,336.4 | 1,650.0 | ||||||||||||||||||
| (+) Depreciation and amortization | 584.0 | 542.8 | 1,684.9 | 1,633.6 | 2,240.8 | 2,210.9 | ||||||||||||||||||
| EBITDA | $ | 1,803.1 | $ | 2,097.2 | $ | 4,891.9 | $ | 5,045.0 | $ | 6,414.2 | $ | 5,980.9 | ||||||||||||
| Adjustments to EBITDA: | ||||||||||||||||||||||||
| Other income / expenses | $ | 11.1 | $ | 7.7 | $ | 26.6 | $ | 17.0 | $ | 41.5 | $ | 31.4 | ||||||||||||
| Reestructuring | 2.2 | 30.8 | 23.8 | 83.0 | 36.3 | 90.4 | ||||||||||||||||||
| Asset Impairment | - | - | 12.8 | - | 12.8 | 5.4 | ||||||||||||||||||
| Antitrust agreements | 10.1 | 0.7 | 143.7 | 81.0 | 316.5 | 141.3 | ||||||||||||||||||
| Donationsand Social Programs | 0.6 | 3.6 | 1.7 | 18.2 | 6.0 | 25.3 | ||||||||||||||||||
| Rio Grande do Sul Floods | - | 13.1 | - | 19.3 | - | 19.3 | ||||||||||||||||||
| Fiscal payments and installments | - | - | 2.4 | 81.8 | 2.4 | 81.8 | ||||||||||||||||||
| Extemporaneous litigation | - | - | - | - | 61.0 | - | ||||||||||||||||||
| Reversal of tax credits | - | - | - | - | 58.7 | - | ||||||||||||||||||
| Avian Flu | 7.5 | - | 13.1 | - | 13.1 | - | ||||||||||||||||||
| Total Adjusted EBITDA | $ | 1,834.6 | $ | 2,153.1 | $ | 5,115.9 | $ | 5,345.3 | $ | 6,962.5 | $ | 6,375.8 | ||||||||||||
| (-) Depreciation and amortization | 584.0 | 542.8 | 1,684.9 | 1,633.6 | 2,240.8 | 2,210.9 | ||||||||||||||||||
| Adjusted Operating Income (IFRS) | $ | 1,250.6 | $ | 1,610.3 | $ | 3,431.1 | $ | 3,711.7 | $ | 4,721.7 | $ | 4,164.9 | ||||||||||||
| Total Gross Debt | 20,768.6 | 18,958.0 | 20,768.6 | 18,958.0 | 20,768.6 | 18,958.0 | ||||||||||||||||||
| (-)Cash and Equivalents | 3,558.2 | 5,070.1 | 3,558.2 | 5,070.1 | 3,558.2 | 5,070.1 | ||||||||||||||||||
| (-) Cash Margin | 553.8 | 167.5 | 553.8 | 167.5 | 553.8 | 167.5 | ||||||||||||||||||
| (-) Financial Investments | 45.8 | - | 45.8 | - | 45.8 | - | ||||||||||||||||||
| Total Net Debt | $ | 16,610.8 | $ | 13,720.5 | $ | 16,610.8 | $ | 13,720.5 | $ | 16,610.8 | $ | 13,720.5 | ||||||||||||
| Ratio Calculations: | ||||||||||||||||||||||||
| Gross Debt/Adjusted EBITDA | 2.98 | x | 2.97 | x | ||||||||||||||||||||
| Net Debt/Adjusted EBITDA | 2.39 | x | 2.15 | x | ||||||||||||||||||||
| Third Quarter | Nine Months Ended | Twelve Months Ended | ||||||||||||||||||||||
| 2025 | 2024 | 2025 | 2024 | 3Q25 | 3Q24 | |||||||||||||||||||
| Cash provided by (used in) operating activities | $ | 1,321.6 | $ | 1,850.9 | $ | 1,809.7 | $ | 3,714.6 | $ | 3,619.4 | $ | 5,424.2 | ||||||||||||
| Interest paid and received | (282.1 | ) | (432.7 | ) | (813.3 | ) | (1,024.9 | ) | (1,083.1 | ) | (1,347.3 | ) | ||||||||||||
| Purchases of property, plant and equipment | (546.9 | ) | (320.9 | ) | (1,261.0 | ) | (950.6 | ) | (1,790.8 | ) | (1,352.5 | ) | ||||||||||||
| Payments of lease | (110.0 | ) | (103.0 | ) | (325.0 | ) | (314.0 | ) | (428.7 | ) | (424.4 | ) | ||||||||||||
| Free Cash Flow | $ | 382.7 | $ | 994.3 | $ | (589.6 | ) | $ | 1,425.1 | $ | 316.8 | $ | 2,300.0 | |||||||||||
11
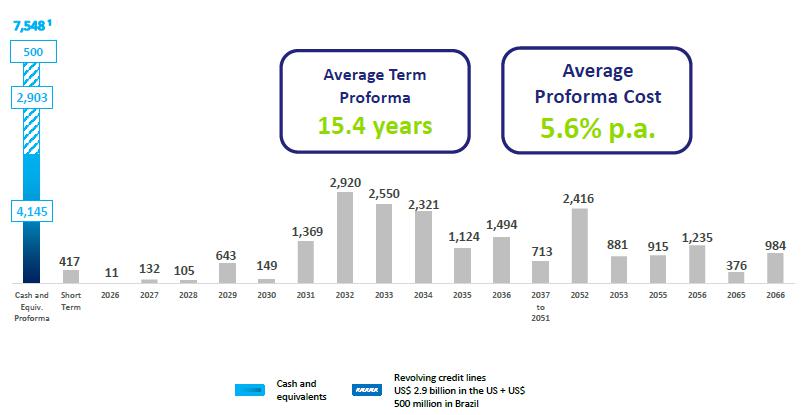
Net Debt Bridge and Proforma Debt Amortization Schedule¹
(In millions)
(Unaudited)
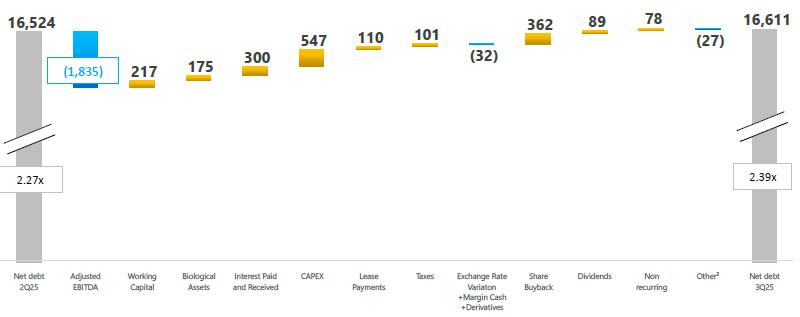
| (1) | Including US$570 million in CRA issuance, the repurchase program and short term debt payment. |
| (2) | Considering acquisitions, non-cash items and Others. |
12
ROE, ROIC and Interest Coverage Reconciliation
(In millions)
(Unaudited)
| Last twelve months ended in September 30, | ||||||||
| 2025 | 2024 | |||||||
| Net Income LTM (A) | $ | 2,253.1 | $ | 1,551.2 | ||||
| Average Shareholder Equity (B) | $ | 9,494.8 | $ | 9,285.1 | ||||
| Current Shareholder Equity | $ | 9,509.2 | $ | 9,480.4 | ||||
| Previous Year Shareholder Equity | $ | 9,480.4 | $ | 9,089.8 | ||||
| ROE (A/B) | 23.7 | % | 16.7 | % | ||||
| Last twelve months ended in September 30, | ||||||||
| 2025 | 2024 | |||||||
| NOPAT (A) | $ | 4,119.7 | $ | 3,596.6 | ||||
| Adjusted Operating Income (IFRS) | $ | 4,721.7 | $ | 4,164.9 | ||||
| Taxes | $ | -602.1 | $ | -568.3 | ||||
| Average Net Debt (B) | $ | 15,165.6 | $ | 14,886.9 | ||||
| Current Net Debt | $ | 16,610.8 | $ | 13,720.5 | ||||
| Previous Year Net Debt | $ | 13,720.5 | $ | 16,053.3 | ||||
| Average Shareholder Equity (C) | $ | 9,494.8 | $ | 9,285.1 | ||||
| Current Shareholder Equity | $ | 9,509.2 | $ | 9,480.4 | ||||
| Previous Year Shareholder Equity | $ | 9,480.4 | $ | 9,089.8 | ||||
| Invested Capital (B+C) | $ | 24,660.4 | $ | 24,172.0 | ||||
| ROIC [A/(B+C)] | 16.7 | % | 14.9 | % | ||||
| Last twelve months ended in September 30, | ||||||||
| 2025 | 2024 | |||||||
| Total Adjusted EBITDA | $ | 6,962.5 | $ | 6,375.8 | ||||
| Net Financial Expense | $ | 1,018.6 | $ | 1,012.7 | ||||
| Interest Coverage | 6.84 | x | 6.30 | x | ||||
13
Conference Call Information and Other Selected Data
A conference call to discuss the Company’s financial results will be held at 9 a.m. Eastern time on Friday, November 14, 2025. A link for the webcast of the conference call is available on the JBS Investor Relations website at https://ir.jbsglobal.com/. The webcast also can be accessed by the following direct link: Click here to access. For those who cannot participate at the scheduled time, a replay of the live webcast and the accompanying slides will be available at https://ir.jbsglobal.com/. Financial information, such as this press release, as well as other supplemental data, can be accessed from the Company’s web site at https://ir.jbsglobal.com/
This press release is being made in respect of JBS N.V. and its subsidiaries (collectively, the “JBS Group”).
Forward-Looking Statements
We make statements about future events that are subject to risks and uncertainties. Such statements are based on the beliefs and assumptions of our Management and information to which the Company currently has access. Statements about future events include information about our current intentions, beliefs or expectations, as well as those of the members of the Company’s Board of Directors and Officers.
Forward-looking statements may include information on possible or presumed operating results, as well as statements that are preceded, followed or that include the words “believe,” “may,” “will,” “continue,” “expects,” “predicts,” “intends,” “plans,” “estimates,” or similar expressions.
Forward-looking statements and information are not guarantees of performance. They involve risks, uncertainties and assumptions because they refer to future events, depending, therefore, on circumstances that may or may not occur. Future results and shareholder value creation may differ materially from those expressed or implied by the forward-looking statements. Many of the factors that will determine these results and values are beyond our ability to control or predict.
IFRS and Non-GAAP Financial Measures
This release is prepared under IFRS and also includes certain non-GAAP financial measures. These measures are not calculated in accordance with any generally accepted accounting principles (GAAP) or International Financial Reporting Standards (IFRS) and should not be viewed as substitutes for IFRS metrics such as net income, operating cash flow, or other measures of operating performance or liquidity.
We present non-GAAP financial measures to provide additional information that we believe is useful and meaningful to investors. However, such measures do not have standardized definitions and may therefore not be comparable to similarly titled measures presented by other companies. Non-GAAP financial measures should always be considered together with, and not as alternatives to, the financial results reported in accordance with IFRS as issued by the International Accounting Standards Board.
Additionally, this release contains certain “US Comparable” (“US Comp”) metrics. The consolidated US Comp figure includes managerial accounting GAAP adjustments in Seara and JBS Brazil for comparability purposes with USGAAP and American peers, in addition to the Business Units that already report under US GAAP.
Investor Contact: ir@jbs.com.br
Guilherme Cavalcanti (Global CFO)
Christiane Assis (IRO)
Pedro Bueno
Felipe Brindo
Vítor Figueira
Amanda Harumi
14